User login
Infective endocarditis: Beyond the usual tests
Prompt diagnois of infective endocarditis is critical. Potential consequences of missed or delayed diagnosis, including heart failure, stroke, intracardiac abscess, conduction delays, prosthesis dysfunction, and cerebral emboli, are often catastrophic. Echocardiography is the test used most frequently to evaluate for infective endocarditis, but it misses the diagnosis in almost one-third of cases, and even more often if the patient has a prosthetic valve.

But now, several sophisticated imaging tests are available that complement echocardiography in diagnosing and assessing infective endocarditis; these include 4-dimensional computed tomography (4D CT), fluorodeoxyglucose positron emission tomography (FDG-PET), and leukocyte scintigraphy. These tests have greatly improved our ability not only to diagnose infective endocarditis, but also to determine the extent and spread of infection, and they aid in perioperative assessment. Abnormal findings on these tests have been incorporated into the European Society of Cardiology’s 2015 modified diagnostic criteria for infective endocarditis.1
This article details the indications, advantages, and limitations of the various imaging tests for diagnosing and evaluating infective endocarditis (Table 1).
INFECTIVE ENDOCARDITIS IS DIFFICULT TO DIAGNOSE AND TREAT
Infective endocarditis is difficult to diagnose and treat. Clinical and imaging clues can be subtle, and the diagnosis requires a high level of suspicion and visualization of cardiac structures.
Further, the incidence of infective endocarditis is on the rise in the United States, particularly in women and young adults, likely due to intravenous drug use.2,3
ECHOCARDIOGRAPHY HAS AN IMPORTANT ROLE, BUT IS LIMITED
Echocardiography remains the most commonly performed study for diagnosing infective endocarditis, as it is fast, widely accessible, and less expensive than other imaging tests.
Transthoracic echocardiography (TTE) is often the first choice for testing. However, its sensitivity is only about 70% for detecting vegetations on native valves and 50% for detecting vegetations on prosthetic valves.1 It is inherently constrained by the limited number of views by which a comprehensive external evaluation of the heart can be achieved. Using a 2-dimensional instrument to view a 3-dimensional object is difficult, and depending on several factors, it can be hard to see vegetations and abscesses that are associated with infective endocarditis. Further, TTE is impeded by obesity and by hyperinflated lungs from obstructive pulmonary disease or mechanical ventilation. It has poor sensitivity for detecting small vegetations and for detecting vegetations and paravalvular complications in patients who have a prosthetic valve or a cardiac implanted electronic device.
Transesophageal echocardiography (TEE) is the recommended first-line imaging test for patients with prosthetic valves and no contraindications to the test. Otherwise, it should be done after TTE if the results of TTE are negative but clinical suspicion for infective endocarditis remains high (eg, because the patient uses intravenous drugs). But although TEE has a higher sensitivity than TTE (up to 96% for vegetations on native valves and 92% for those on prosthetic valves, if performed by an experienced sonographer), it can still miss infective endocarditis. Also, TEE does not provide a significant advantage over TTE in patients who have a cardiac implanted electronic device.1,4,5
Regardless of whether TTE or TEE is used, they are estimated to miss up to 30% of cases of infective endocarditis and its sequelae.4 False-negative findings are likelier in patients who have preexisting severe valvular lesions, prosthetic valves, cardiac implanted electronic devices, small vegetations, or abscesses, or if a vegetation has already broken free and embolized. Furthermore, distinguishing between vegetations and thrombi, cardiac tumors, and myxomatous changes using echocardiography is difficult.
CARDIAC CT
For patients who have inconclusive results on echocardiography, contraindications to TEE, or poor sonic windows, cardiac CT can be an excellent alternative. It is especially useful in the setting of a prosthetic valve.
Synchronized (“gated”) with the patient’s heart rate and rhythm, CT machines can acquire images during diastole, reducing motion artifact, and can create 3D images of the heart. In addition, newer machines can acquire several images at different points in the heart cycle to add a fourth dimension—time. The resulting 4D images play like short video loops of the beating heart and allow noninvasive assessment of cardiac anatomy with remarkable detail and resolution.
4D CT is increasingly being used in infective endocarditis, and growing evidence indicates that its accuracy is similar to that of TEE in the preoperative evaluation of patients with aortic prosthetic valve endocarditis.6 In a study of 28 patients, complementary use of CT angiography led to a change in treatment strategy in 7 (25%) compared with routine clinical workup.7 Several studies have found no difference between 4D CT and preoperative TEE in detecting pseudoaneurysm, abscess, or valve dehiscence. TEE and 4D CT also have similar sensitivities for detecting infective endocarditis in native and prosthetic valves.8,9

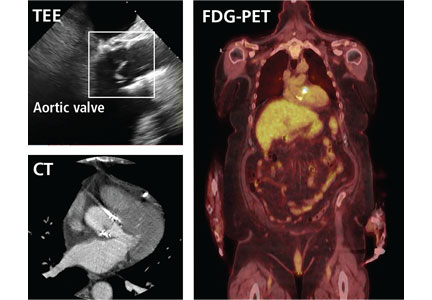
 angiography with iodinated contrast, including 4D reconstruc-tion, in the same patient, however, shows an 11-mm vegetation on the bioprosthetic aortic valve leaflets (arrow).")
 in the same patient confirms the diagnosis, showing a 13-mm hypermetabolic focus on the prosthetic valve (arrow), yielding the diagnosis of infectious endocarditis.")
Coupled with CT angiography, 4D CT is also an excellent noninvasive way to perioperatively evaluate the coronary arteries without the risks associated with catheterization in those requiring nonemergency surgery (Figure 1A, B, and C).
4D CT performs well for detecting abscess and pseudoaneurysm but has slightly lower sensitivity for vegetations than TEE (91% vs 99%).9
Gated CT, PET, or both may be useful in cases of suspected prosthetic aortic valve endocarditis when TEE is negative. Pseudoaneurysms are not well visualized with TEE, and the atrial mitral curtain area is often thickened on TEE in cases of aortic prosthetic valve infective endocarditis that do not definitely involve abscesses. Gated CT and PET show this area better.8 This information is important in cases in which a surgeon may be unconvinced that the patient has prosthetic valve endocarditis.
Limitations of 4D cardiac CT
4D CT with or without angiography has limitations. It requires a wide-volume scanner and an experienced reader.
Patients with irregular heart rhythms or uncontrolled tachycardia pose technical problems for image acquisition. Cardiac CT is typically gated (ie, images are obtained within a defined time period) to acquire images during diastole. Ideally, images are acquired when the heart is in mid to late diastole, a time of minimal cardiac motion, so that motion artifact is minimized. To estimate the timing of image acquisition, the cardiac cycle must be predictable, and its duration should be as long as possible. Tachycardia or irregular rhythms such as frequent ectopic beats or atrial fibrillation make acquisition timing difficult, and thus make it nearly impossible to accurately obtain images when the heart is at minimum motion, limiting assessment of cardiac structures or the coronary tree.4,10
Extensive coronary calcification can hinder assessment of the coronary tree by CT coronary angiography.
Contrast exposure may limit the use of CT in some patients (eg, those with contrast allergies or renal dysfunction). However, modern scanners allow for much smaller contrast boluses without decreasing sensitivity.
4D CT involves radiation exposure, especially when done with angiography, although modern scanners have greatly reduced exposure. The average radiation dose in CT coronary angiography is 2.9 to 5.9 mSv11 compared with 7 mSv in diagnostic cardiac catheterization (without angioplasty or stenting) or 16 mSv in routine CT of the abdomen and pelvis with contrast.12,13 In view of the morbidity and mortality risks associated with infective endocarditis, especially if the diagnosis is delayed, this small radiation exposure may be justifiable.
Bottom line for cardiac CT
4D CT is an excellent alternative to echocardiography for select patients. Clinicians should strongly consider this study in the following situations:
- Patients with a prosthetic valve
- Patients who are strongly suspected of having infective endocarditis but who have a poor sonic window on TTE or TEE, as can occur with chronic obstructive lung disease, morbid obesity, or previous thoracic or cardiovascular surgery
- Patients who meet clinical indications for TEE, such as having a prosthetic valve or a high suspicion for native valve infective endocarditis with negative TTE, but who have contraindications to TEE
- As an alternative to TEE for preoperative evaluation in patients with known infective endocarditis.
Patients with tachycardia or irregular heart rhythms are not good candidates for this test.
FDG-PET AND LEUKOCYTE SCINTIGRAPHY
FDG-PET and leukocyte scintigraphy are other options for diagnosing infective endocarditis and determining the presence and extent of intra- and extracardiac infection. They are more sensitive than echocardiography for detecting infection of cardiac implanted electronic devices such as ventricular assist devices, pacemakers, implanted cardiac defibrillators, and cardiac resynchronization therapy devices.14–16
The utility of FDG-PET is founded on the uptake of 18F-fluorodeoxyglucose by cells, with higher uptake taking place in cells with higher metabolic activity (such as in areas of inflammation). Similarly, leukocyte scintigraphy relies on the use of radiolabeled leukocytes (ie, leukocytes previously extracted from the patient, labelled, and re-introduced into the patient) to allow for localization of inflamed tissue.
The most significant contribution of FDG-PET may be the ability to detect infective endocarditis early, when echocardiography is initially negative. When abnormal FDG uptake was included in the modified Duke criteria, it increased the sensitivity to 97% for detecting infective endocarditis on admission, leading some to propose its incorporation as a major criterion.17 In patients with prosthetic valves and suspected infective endocarditis, FDG-PET was found in one study to have a sensitivity of up to 91% and a specificity of up to 95%.18
Both FDG-PET and leukocyte scintigraphy have a high sensitivity, specificity, and negative predictive value for cardiac implanted electronic device infection, and should be strongly considered in patients in whom it is suspected but who have negative or inconclusive findings on echocardiography.14,15
In addition, a common conundrum faced by clinicians with use of echocardiography is the difficulty of differentiating thrombus from infected vegetation on valves or device lead wires. Some evidence indicates that FDG-PET may help to discriminate between vegetation and thrombus, although more rigorous studies are needed before its use for that purpose can be recommended.19
Limitations of nuclear studies
Both FDG-PET and leukocyte scintigraphy perform poorly for detecting native-valve infective endocarditis. In a study in which 90% of the patients had native-valve infective endocarditis according to the Duke criteria, FDG-PET had a specificity of 93% but a sensitivity of only 39%.20
Both studies can be cumbersome, laborious, and time-consuming for patients. FDG-PET requires a fasting or glucose-restricted diet before testing, and the test itself can be complicated by development of hyperglycemia, although this is rare.
While FDG-PET is most effective in detecting infections of prosthetic valves and cardiac implanted electronic devices, the results can be falsely positive in patients with a history of recent cardiac surgery (due to ongoing tissue healing), as well as maladies other than infective endocarditis that lead to inflammation, such as vasculitis or malignancy. Similarly, for unclear reasons, leukocyte scintigraphy can yield false-negative results in patients with enterococcal or candidal infective endocarditis.21
FDG-PET and leukocyte scintigraphy are more expensive than TEE and cardiac CT22 and are not widely available.
Both tests entail radiation exposure, with the average dose ranging from 7 to 14 mSv. However, this is less than the average amount acquired during percutaneous coronary intervention (16 mSv), and overlaps with the amount in chest CT with contrast when assessing for pulmonary embolism (7 to 9 mSv). Lower doses are possible with optimized protocols.12,13,15,23
Bottom line for nuclear studies

FDG-PET and leukocyte scintigraphy are especially useful for patients with a prosthetic valve or cardiac implanted electronic device. However, limitations must be kept in mind.
A suggested algorithm for testing with nuclear imaging is shown in Figure 2.1,4
CEREBRAL MAGNETIC RESONANCE IMAGING
Cerebral magnetic resonance imaging (MRI) is more sensitive than cerebral CT for detecting emboli in the brain. According to American Heart Association guidelines, cerebral MRI should be done in patients with known or suspected infective endocarditis and neurologic impairment, defined as headaches, meningeal symptoms, or neurologic deficits. It is also often used in neurologically asymptomatic patients with infective endocarditis who have indications for valve surgery to assess for mycotic aneurysms, which are associated with increased intracranial bleeding during surgery.
MRI use in other asymptomatic patients remains controversial.24 In cases with high clinical suspicion for infective endocarditis and no findings on echocardiography, cerebral MRI can increase the sensitivity of the Duke criteria by adding a minor criterion. Some have argued that, in patients with definite infective endocarditis, detecting silent cerebral complications can lead to management changes. However, more studies are needed to determine if there is indeed a group of neurologically asymptomatic infective endocarditis patients for whom cerebral MRI leads to improved outcomes.
Limitations of cerebral MRI
Cerebral MRI cannot be used in patients with non-MRI-compatible implanted hardware.
Gadolinium, the contrast agent typically used, can cause nephrogenic systemic fibrosis in patients who have poor renal function. This rare but serious adverse effect is characterized by irreversible systemic fibrosis affecting skin, muscles, and even visceral tissue such as lungs. The American College of Radiology allows for gadolinium use in patients without acute kidney injury and patients with stable chronic kidney disease with a glomerular filtration rate of at least 30 mL/min/1.73 m2. Its use should be avoided in patients with renal failure on replacement therapy, with advanced chronic kidney disease (glomerular filtration rate < 30 mL/min/1.73 m2), or with acute kidney injury, even if they do not need renal replacement therapy.25
Concerns have also been raised about gadolinium retention in the brain, even in patients with normal renal function.26–28 Thus far, no conclusive clinical adverse effects of retention have been found, although more study is warranted. Nevertheless, the US Food and Drug Administration now requires a black-box warning about this possibility and advises clinicians to counsel patients appropriately.
Bottom line on cerebral MRI
Cerebral MRI should be obtained when a patient presents with definite or possible infective endocarditis with neurologic impairment, such as new headaches, meningismus, or focal neurologic deficits. Routine brain MRI in patients with confirmed infective endocarditis without neurologic symptoms, or those without definite infective endocarditis, is discouraged.
CARDIAC MRI
Cardiac MRI, typically obtained with gadolinium contrast, allows for better 3D assessment of cardiac structures and morphology than echocardiography or CT, and can detect infiltrative cardiac disease, myopericarditis, and much more. It is increasingly used in the field of structural cardiology, but its role for evaluating infective endocarditis remains unclear.
Cardiac MRI does not appear to be better than echocardiography for diagnosing infective endocarditis. However, it may prove helpful in the evaluation of patients known to have infective endocarditis but who cannot be properly evaluated for disease extent because of poor image quality on echocardiography and contraindications to CT.1,29 Its role is limited in patients with cardiac implanted electronic devices, as most devices are incompatible with MRI use, although newer devices obviate this concern. But even for devices that are MRI-compatible, results are diminished due to an eclipsing effect, wherein the device parts can make it hard to see structures clearly because the “brightness” basically eclipses the surrounding area.4
Concerns regarding use of gadolinium as described above need also be considered.
The role of cardiac MRI in diagnosing and managing infective endocarditis may evolve, but at present, the 2017 American College of Cardiology and American Heart Association appropriate-use criteria discourage its use for these purposes.16
Bottom line for cardiac MRI
Cardiac MRI to evaluate a patient for suspected infective endocarditis is not recommended due to lack of superiority compared with echocardiography or CT, and the risk of nephrogenic systemic fibrosis from gadolinium in patients with renal compromise.
- Habib G, Lancellotti P, Antunes MJ, et al; ESC Scientific Document Group. 2015 ESC guidelines for the management of infective endocarditis: the Task Force for the Management of Infective Endocarditis of the European Society of Cardiology (ESC). Endorsed by: European Association for Cardio-Thoracic Surgery (EACTS), the European Association of Nuclear Medicine (EANM). Eur Heart J 2015; 36(44):3075–3128. doi:10.1093/eurheartj/ehv319
- Durante-Mangoni E, Bradley S, Selton-Suty C, et al; International Collaboration on Endocarditis Prospective Cohort Study Group. Current features of infective endocarditis in elderly patients: results of the International Collaboration on Endocarditis Prospective Cohort Study. Arch Intern Med 2008; 168(19):2095–2103. doi:10.1001/archinte.168.19.2095
- Wurcel AG, Anderson JE, Chui KK, et al. Increasing infectious endocarditis admissions among young people who inject drugs. Open Forum Infect Dis 2016; 3(3):ofw157. doi:10.1093/ofid/ofw157
- Gomes A, Glaudemans AW, Touw DJ, et al. Diagnostic value of imaging in infective endocarditis: a systematic review. Lancet Infect Dis 2017; 17(1):e1–e14. doi:10.1016/S1473-3099(16)30141-4
- Cahill TJ, Baddour LM, Habib G, et al. Challenges in infective endocarditis. J Am Coll Cardiol 2017; 69(3):325–344. doi:10.1016/j.jacc.2016.10.066
- Fagman E, Perrotta S, Bech-Hanssen O, et al. ECG-gated computed tomography: a new role for patients with suspected aortic prosthetic valve endocarditis. Eur Radiol 2012; 22(11):2407–2414. doi:10.1007/s00330-012-2491-5
- Habets J, Tanis W, van Herwerden LA, et al. Cardiac computed tomography angiography results in diagnostic and therapeutic change in prosthetic heart valve endocarditis. Int J Cardiovasc Imaging 2014; 30(2):377–387. doi:10.1007/s10554-013-0335-2
- Koneru S, Huang SS, Oldan J, et al. Role of preoperative cardiac CT in the evaluation of infective endocarditis: comparison with transesophageal echocardiography and surgical findings. Cardiovasc Diagn Ther 2018; 8(4):439–449. doi:10.21037/cdt.2018.07.07
- Koo HJ, Yang DH, Kang J, et al. Demonstration of infective endocarditis by cardiac CT and transoesophageal echocardiography: comparison with intra-operative findings. Eur Heart J Cardiovasc Imaging 2018; 19(2):199–207. doi:10.1093/ehjci/jex010
- Feuchtner GM, Stolzmann P, Dichtl W, et al. Multislice computed tomography in infective endocarditis: comparison with transesophageal echocardiography and intraoperative findings. J Am Coll Cardiol 2009; 53(5):436–444. doi:10.1016/j.jacc.2008.01.077
- Castellano IA, Nicol ED, Bull RK, Roobottom CA, Williams MC, Harden SP. A prospective national survey of coronary CT angiography radiation doses in the United Kingdom. J Cardiovasc Comput Tomogr 2017; 11(4):268–273. doi:10.1016/j.jcct.2017.05.002
- Mettler FA Jr, Huda W, Yoshizumi TT, Mahesh M. Effective doses in radiology and diagnostic nuclear medicine: a catalog. Radiology 2008; 248(1):254–263. doi:10.1148/radiol.2481071451
- Smith-Bindman R, Lipson J, Marcus R, et al. Radiation dose associated with common computed tomography examinations and the associated lifetime attributable risk of cancer. Arch Intern Med 2009; 169(22):2078–2086. doi:10.1001/archinternmed.2009.427
- Ploux S, Riviere A, Amraoui S, et al. Positron emission tomography in patients with suspected pacing system infections may play a critical role in difficult cases. Heart Rhythm 2011; 8(9):1478–1481. doi:10.1016/j.hrthm.2011.03.062
- Sarrazin J, Philippon F, Tessier M, et al. Usefulness of fluorine-18 positron emission tomography/computed tomography for identification of cardiovascular implantable electronic device infections. J Am Coll Cardiol 2012; 59(18):1616–1625. doi:10.1016/j.jacc.2011.11.059
- Doherty JU, Kort S, Mehran R, Schoenhagen P, Soman P; Rating Panel Members; Appropriate Use Criteria Task Force. ACC/AATS/AHA/ASE/ASNC/HRS/SCAI/SCCT/SCMR/STS 2017 Appropriate use criteria for multimodality imaging in valvular heart disease: a report of the American College of Cardiology Appropriate Use Criteria Task Force, American Association for Thoracic Surgery, American Heart Association, American Society of Echocardiography, American Society of Nuclear Cardiology, Heart Rhythm Society, Society for Cardiovascular Angiography and Interventions, Society of Cardiovascular Computed Tomography, Society for Cardiovascular Magnetic Resonance, and Society of Thoracic Surgeons. J Nucl Cardiol 2017; 24(6):2043–2063. doi:10.1007/s12350-017-1070-1
- Saby L, Laas O, Habib G, et al. Positron emission tomography/computed tomography for diagnosis of prosthetic valve endocarditis: increased valvular 18F-fluorodeoxyglucose uptake as a novel major criterion. J Am Coll Cardiol 2013; 61(23):2374–2382. doi:10.1016/j.jacc.2013.01.092
- Swart LE, Gomes A, Scholtens AM, et al. Improving the diagnostic performance of 18F-fluorodeoxyglucose positron-emission tomography/computed tomography in prosthetic heart valve endocarditis. Circulation 2018; 138(14):1412–1427. doi:10.1161/CIRCULATIONAHA.118.035032
- Graziosi M, Nanni C, Lorenzini M, et al. Role of 18F-FDG PET/CT in the diagnosis of infective endocarditis in patients with an implanted cardiac device: a prospective study. Eur J Nucl Med Mol Imaging 2014; 41(8):1617–1623. doi:10.1007/s00259-014-2773-z
- Kouijzer IJ, Vos FJ, Janssen MJ, van Dijk AP, Oyen WJ, Bleeker-Rovers CP. The value of 18F-FDG PET/CT in diagnosing infectious endocarditis. Eur J Nucl Med Mol Imaging 2013; 40(7):1102–1107. doi:10.1007/s00259-013-2376-0
- Wong D, Rubinshtein R, Keynan Y. Alternative cardiac imaging modalities to echocardiography for the diagnosis of infective endocarditis. Am J Cardiol 2016; 118(9):1410–1418. doi:10.1016/j.amjcard.2016.07.053
- Vos FJ, Bleeker-Rovers CP, Kullberg BJ, Adang EM, Oyen WJ. Cost-effectiveness of routine (18)F-FDG PET/CT in high-risk patients with gram-positive bacteremia. J Nucl Med 2011; 52(11):1673–1678. doi:10.2967/jnumed.111.089714
- McCollough CH, Bushberg JT, Fletcher JG, Eckel LJ. Answers to common questions about the use and safety of CT scans. Mayo Clin Proc 2015; 90(10):1380–1392. doi:10.1016/j.mayocp.2015.07.011
- Duval X, Iung B, Klein I, et al; IMAGE (Resonance Magnetic Imaging at the Acute Phase of Endocarditis) Study Group. Effect of early cerebral magnetic resonance imaging on clinical decisions in infective endocarditis: a prospective study. Ann Intern Med 2010; 152(8):497–504, W175. doi:10.7326/0003-4819-152-8-201004200-00006
- ACR Committee on Drugs and Contrast Media. ACR Manual on Contrast Media: 2018. www.acr.org/-/media/ACR/Files/Clinical-Resources/Contrast_Media.pdf. Accessed July 19, 2019.
- Kanda T, Fukusato T, Matsuda M, et al. Gadolinium-based contrast agent accumulates in the brain even in subjects without severe renal dysfunction: evaluation of autopsy brain specimens with inductively coupled plasma mass spectroscopy. Radiology 2015; 276(1):228–232. doi:10.1148/radiol.2015142690
- McDonald RJ, McDonald JS, Kallmes DF, et al. Intracranial gadolinium deposition after contrast-enhanced MR imaging. Radiology 2015; 275(3):772–782. doi:10.1148/radiol.15150025
- Kanda T, Ishii K, Kawaguchi H, Kitajima K, Takenaka D. High signal intensity in the dentate nucleus and globus pallidus on unenhanced T1-weighted MR images: relationship with increasing cumulative dose of a gadolinium-based contrast material. Radiology 2014; 270(3):834–841. doi:10.1148/radiol.13131669
- Expert Panel on Pediatric Imaging; Hayes LL, Palasis S, Bartel TB, et al. ACR appropriateness criteria headache-child. J Am Coll Radiol 2018; 15(5S):S78–S90. doi:10.1016/j.jacr.2018.03.017
Prompt diagnois of infective endocarditis is critical. Potential consequences of missed or delayed diagnosis, including heart failure, stroke, intracardiac abscess, conduction delays, prosthesis dysfunction, and cerebral emboli, are often catastrophic. Echocardiography is the test used most frequently to evaluate for infective endocarditis, but it misses the diagnosis in almost one-third of cases, and even more often if the patient has a prosthetic valve.
But now, several sophisticated imaging tests are available that complement echocardiography in diagnosing and assessing infective endocarditis; these include 4-dimensional computed tomography (4D CT), fluorodeoxyglucose positron emission tomography (FDG-PET), and leukocyte scintigraphy. These tests have greatly improved our ability not only to diagnose infective endocarditis, but also to determine the extent and spread of infection, and they aid in perioperative assessment. Abnormal findings on these tests have been incorporated into the European Society of Cardiology’s 2015 modified diagnostic criteria for infective endocarditis.1
This article details the indications, advantages, and limitations of the various imaging tests for diagnosing and evaluating infective endocarditis (Table 1).
INFECTIVE ENDOCARDITIS IS DIFFICULT TO DIAGNOSE AND TREAT
Infective endocarditis is difficult to diagnose and treat. Clinical and imaging clues can be subtle, and the diagnosis requires a high level of suspicion and visualization of cardiac structures.
Further, the incidence of infective endocarditis is on the rise in the United States, particularly in women and young adults, likely due to intravenous drug use.2,3
ECHOCARDIOGRAPHY HAS AN IMPORTANT ROLE, BUT IS LIMITED
Echocardiography remains the most commonly performed study for diagnosing infective endocarditis, as it is fast, widely accessible, and less expensive than other imaging tests.
Transthoracic echocardiography (TTE) is often the first choice for testing. However, its sensitivity is only about 70% for detecting vegetations on native valves and 50% for detecting vegetations on prosthetic valves.1 It is inherently constrained by the limited number of views by which a comprehensive external evaluation of the heart can be achieved. Using a 2-dimensional instrument to view a 3-dimensional object is difficult, and depending on several factors, it can be hard to see vegetations and abscesses that are associated with infective endocarditis. Further, TTE is impeded by obesity and by hyperinflated lungs from obstructive pulmonary disease or mechanical ventilation. It has poor sensitivity for detecting small vegetations and for detecting vegetations and paravalvular complications in patients who have a prosthetic valve or a cardiac implanted electronic device.
Transesophageal echocardiography (TEE) is the recommended first-line imaging test for patients with prosthetic valves and no contraindications to the test. Otherwise, it should be done after TTE if the results of TTE are negative but clinical suspicion for infective endocarditis remains high (eg, because the patient uses intravenous drugs). But although TEE has a higher sensitivity than TTE (up to 96% for vegetations on native valves and 92% for those on prosthetic valves, if performed by an experienced sonographer), it can still miss infective endocarditis. Also, TEE does not provide a significant advantage over TTE in patients who have a cardiac implanted electronic device.1,4,5
Regardless of whether TTE or TEE is used, they are estimated to miss up to 30% of cases of infective endocarditis and its sequelae.4 False-negative findings are likelier in patients who have preexisting severe valvular lesions, prosthetic valves, cardiac implanted electronic devices, small vegetations, or abscesses, or if a vegetation has already broken free and embolized. Furthermore, distinguishing between vegetations and thrombi, cardiac tumors, and myxomatous changes using echocardiography is difficult.
CARDIAC CT
For patients who have inconclusive results on echocardiography, contraindications to TEE, or poor sonic windows, cardiac CT can be an excellent alternative. It is especially useful in the setting of a prosthetic valve.
Synchronized (“gated”) with the patient’s heart rate and rhythm, CT machines can acquire images during diastole, reducing motion artifact, and can create 3D images of the heart. In addition, newer machines can acquire several images at different points in the heart cycle to add a fourth dimension—time. The resulting 4D images play like short video loops of the beating heart and allow noninvasive assessment of cardiac anatomy with remarkable detail and resolution.
4D CT is increasingly being used in infective endocarditis, and growing evidence indicates that its accuracy is similar to that of TEE in the preoperative evaluation of patients with aortic prosthetic valve endocarditis.6 In a study of 28 patients, complementary use of CT angiography led to a change in treatment strategy in 7 (25%) compared with routine clinical workup.7 Several studies have found no difference between 4D CT and preoperative TEE in detecting pseudoaneurysm, abscess, or valve dehiscence. TEE and 4D CT also have similar sensitivities for detecting infective endocarditis in native and prosthetic valves.8,9
Coupled with CT angiography, 4D CT is also an excellent noninvasive way to perioperatively evaluate the coronary arteries without the risks associated with catheterization in those requiring nonemergency surgery (Figure 1A, B, and C).
4D CT performs well for detecting abscess and pseudoaneurysm but has slightly lower sensitivity for vegetations than TEE (91% vs 99%).9
Gated CT, PET, or both may be useful in cases of suspected prosthetic aortic valve endocarditis when TEE is negative. Pseudoaneurysms are not well visualized with TEE, and the atrial mitral curtain area is often thickened on TEE in cases of aortic prosthetic valve infective endocarditis that do not definitely involve abscesses. Gated CT and PET show this area better.8 This information is important in cases in which a surgeon may be unconvinced that the patient has prosthetic valve endocarditis.
Limitations of 4D cardiac CT
4D CT with or without angiography has limitations. It requires a wide-volume scanner and an experienced reader.
Patients with irregular heart rhythms or uncontrolled tachycardia pose technical problems for image acquisition. Cardiac CT is typically gated (ie, images are obtained within a defined time period) to acquire images during diastole. Ideally, images are acquired when the heart is in mid to late diastole, a time of minimal cardiac motion, so that motion artifact is minimized. To estimate the timing of image acquisition, the cardiac cycle must be predictable, and its duration should be as long as possible. Tachycardia or irregular rhythms such as frequent ectopic beats or atrial fibrillation make acquisition timing difficult, and thus make it nearly impossible to accurately obtain images when the heart is at minimum motion, limiting assessment of cardiac structures or the coronary tree.4,10
Extensive coronary calcification can hinder assessment of the coronary tree by CT coronary angiography.
Contrast exposure may limit the use of CT in some patients (eg, those with contrast allergies or renal dysfunction). However, modern scanners allow for much smaller contrast boluses without decreasing sensitivity.
4D CT involves radiation exposure, especially when done with angiography, although modern scanners have greatly reduced exposure. The average radiation dose in CT coronary angiography is 2.9 to 5.9 mSv11 compared with 7 mSv in diagnostic cardiac catheterization (without angioplasty or stenting) or 16 mSv in routine CT of the abdomen and pelvis with contrast.12,13 In view of the morbidity and mortality risks associated with infective endocarditis, especially if the diagnosis is delayed, this small radiation exposure may be justifiable.
Bottom line for cardiac CT
4D CT is an excellent alternative to echocardiography for select patients. Clinicians should strongly consider this study in the following situations:
- Patients with a prosthetic valve
- Patients who are strongly suspected of having infective endocarditis but who have a poor sonic window on TTE or TEE, as can occur with chronic obstructive lung disease, morbid obesity, or previous thoracic or cardiovascular surgery
- Patients who meet clinical indications for TEE, such as having a prosthetic valve or a high suspicion for native valve infective endocarditis with negative TTE, but who have contraindications to TEE
- As an alternative to TEE for preoperative evaluation in patients with known infective endocarditis.
Patients with tachycardia or irregular heart rhythms are not good candidates for this test.
FDG-PET AND LEUKOCYTE SCINTIGRAPHY
FDG-PET and leukocyte scintigraphy are other options for diagnosing infective endocarditis and determining the presence and extent of intra- and extracardiac infection. They are more sensitive than echocardiography for detecting infection of cardiac implanted electronic devices such as ventricular assist devices, pacemakers, implanted cardiac defibrillators, and cardiac resynchronization therapy devices.14–16
The utility of FDG-PET is founded on the uptake of 18F-fluorodeoxyglucose by cells, with higher uptake taking place in cells with higher metabolic activity (such as in areas of inflammation). Similarly, leukocyte scintigraphy relies on the use of radiolabeled leukocytes (ie, leukocytes previously extracted from the patient, labelled, and re-introduced into the patient) to allow for localization of inflamed tissue.
The most significant contribution of FDG-PET may be the ability to detect infective endocarditis early, when echocardiography is initially negative. When abnormal FDG uptake was included in the modified Duke criteria, it increased the sensitivity to 97% for detecting infective endocarditis on admission, leading some to propose its incorporation as a major criterion.17 In patients with prosthetic valves and suspected infective endocarditis, FDG-PET was found in one study to have a sensitivity of up to 91% and a specificity of up to 95%.18
Both FDG-PET and leukocyte scintigraphy have a high sensitivity, specificity, and negative predictive value for cardiac implanted electronic device infection, and should be strongly considered in patients in whom it is suspected but who have negative or inconclusive findings on echocardiography.14,15
In addition, a common conundrum faced by clinicians with use of echocardiography is the difficulty of differentiating thrombus from infected vegetation on valves or device lead wires. Some evidence indicates that FDG-PET may help to discriminate between vegetation and thrombus, although more rigorous studies are needed before its use for that purpose can be recommended.19
Limitations of nuclear studies
Both FDG-PET and leukocyte scintigraphy perform poorly for detecting native-valve infective endocarditis. In a study in which 90% of the patients had native-valve infective endocarditis according to the Duke criteria, FDG-PET had a specificity of 93% but a sensitivity of only 39%.20
Both studies can be cumbersome, laborious, and time-consuming for patients. FDG-PET requires a fasting or glucose-restricted diet before testing, and the test itself can be complicated by development of hyperglycemia, although this is rare.
While FDG-PET is most effective in detecting infections of prosthetic valves and cardiac implanted electronic devices, the results can be falsely positive in patients with a history of recent cardiac surgery (due to ongoing tissue healing), as well as maladies other than infective endocarditis that lead to inflammation, such as vasculitis or malignancy. Similarly, for unclear reasons, leukocyte scintigraphy can yield false-negative results in patients with enterococcal or candidal infective endocarditis.21
FDG-PET and leukocyte scintigraphy are more expensive than TEE and cardiac CT22 and are not widely available.
Both tests entail radiation exposure, with the average dose ranging from 7 to 14 mSv. However, this is less than the average amount acquired during percutaneous coronary intervention (16 mSv), and overlaps with the amount in chest CT with contrast when assessing for pulmonary embolism (7 to 9 mSv). Lower doses are possible with optimized protocols.12,13,15,23
Bottom line for nuclear studies
FDG-PET and leukocyte scintigraphy are especially useful for patients with a prosthetic valve or cardiac implanted electronic device. However, limitations must be kept in mind.
A suggested algorithm for testing with nuclear imaging is shown in Figure 2.1,4
CEREBRAL MAGNETIC RESONANCE IMAGING
Cerebral magnetic resonance imaging (MRI) is more sensitive than cerebral CT for detecting emboli in the brain. According to American Heart Association guidelines, cerebral MRI should be done in patients with known or suspected infective endocarditis and neurologic impairment, defined as headaches, meningeal symptoms, or neurologic deficits. It is also often used in neurologically asymptomatic patients with infective endocarditis who have indications for valve surgery to assess for mycotic aneurysms, which are associated with increased intracranial bleeding during surgery.
MRI use in other asymptomatic patients remains controversial.24 In cases with high clinical suspicion for infective endocarditis and no findings on echocardiography, cerebral MRI can increase the sensitivity of the Duke criteria by adding a minor criterion. Some have argued that, in patients with definite infective endocarditis, detecting silent cerebral complications can lead to management changes. However, more studies are needed to determine if there is indeed a group of neurologically asymptomatic infective endocarditis patients for whom cerebral MRI leads to improved outcomes.
Limitations of cerebral MRI
Cerebral MRI cannot be used in patients with non-MRI-compatible implanted hardware.
Gadolinium, the contrast agent typically used, can cause nephrogenic systemic fibrosis in patients who have poor renal function. This rare but serious adverse effect is characterized by irreversible systemic fibrosis affecting skin, muscles, and even visceral tissue such as lungs. The American College of Radiology allows for gadolinium use in patients without acute kidney injury and patients with stable chronic kidney disease with a glomerular filtration rate of at least 30 mL/min/1.73 m2. Its use should be avoided in patients with renal failure on replacement therapy, with advanced chronic kidney disease (glomerular filtration rate < 30 mL/min/1.73 m2), or with acute kidney injury, even if they do not need renal replacement therapy.25
Concerns have also been raised about gadolinium retention in the brain, even in patients with normal renal function.26–28 Thus far, no conclusive clinical adverse effects of retention have been found, although more study is warranted. Nevertheless, the US Food and Drug Administration now requires a black-box warning about this possibility and advises clinicians to counsel patients appropriately.
Bottom line on cerebral MRI
Cerebral MRI should be obtained when a patient presents with definite or possible infective endocarditis with neurologic impairment, such as new headaches, meningismus, or focal neurologic deficits. Routine brain MRI in patients with confirmed infective endocarditis without neurologic symptoms, or those without definite infective endocarditis, is discouraged.
CARDIAC MRI
Cardiac MRI, typically obtained with gadolinium contrast, allows for better 3D assessment of cardiac structures and morphology than echocardiography or CT, and can detect infiltrative cardiac disease, myopericarditis, and much more. It is increasingly used in the field of structural cardiology, but its role for evaluating infective endocarditis remains unclear.
Cardiac MRI does not appear to be better than echocardiography for diagnosing infective endocarditis. However, it may prove helpful in the evaluation of patients known to have infective endocarditis but who cannot be properly evaluated for disease extent because of poor image quality on echocardiography and contraindications to CT.1,29 Its role is limited in patients with cardiac implanted electronic devices, as most devices are incompatible with MRI use, although newer devices obviate this concern. But even for devices that are MRI-compatible, results are diminished due to an eclipsing effect, wherein the device parts can make it hard to see structures clearly because the “brightness” basically eclipses the surrounding area.4
Concerns regarding use of gadolinium as described above need also be considered.
The role of cardiac MRI in diagnosing and managing infective endocarditis may evolve, but at present, the 2017 American College of Cardiology and American Heart Association appropriate-use criteria discourage its use for these purposes.16
Bottom line for cardiac MRI
Cardiac MRI to evaluate a patient for suspected infective endocarditis is not recommended due to lack of superiority compared with echocardiography or CT, and the risk of nephrogenic systemic fibrosis from gadolinium in patients with renal compromise.
- Habib G, Lancellotti P, Antunes MJ, et al; ESC Scientific Document Group. 2015 ESC guidelines for the management of infective endocarditis: the Task Force for the Management of Infective Endocarditis of the European Society of Cardiology (ESC). Endorsed by: European Association for Cardio-Thoracic Surgery (EACTS), the European Association of Nuclear Medicine (EANM). Eur Heart J 2015; 36(44):3075–3128. doi:10.1093/eurheartj/ehv319
- Durante-Mangoni E, Bradley S, Selton-Suty C, et al; International Collaboration on Endocarditis Prospective Cohort Study Group. Current features of infective endocarditis in elderly patients: results of the International Collaboration on Endocarditis Prospective Cohort Study. Arch Intern Med 2008; 168(19):2095–2103. doi:10.1001/archinte.168.19.2095
- Wurcel AG, Anderson JE, Chui KK, et al. Increasing infectious endocarditis admissions among young people who inject drugs. Open Forum Infect Dis 2016; 3(3):ofw157. doi:10.1093/ofid/ofw157
- Gomes A, Glaudemans AW, Touw DJ, et al. Diagnostic value of imaging in infective endocarditis: a systematic review. Lancet Infect Dis 2017; 17(1):e1–e14. doi:10.1016/S1473-3099(16)30141-4
- Cahill TJ, Baddour LM, Habib G, et al. Challenges in infective endocarditis. J Am Coll Cardiol 2017; 69(3):325–344. doi:10.1016/j.jacc.2016.10.066
- Fagman E, Perrotta S, Bech-Hanssen O, et al. ECG-gated computed tomography: a new role for patients with suspected aortic prosthetic valve endocarditis. Eur Radiol 2012; 22(11):2407–2414. doi:10.1007/s00330-012-2491-5
- Habets J, Tanis W, van Herwerden LA, et al. Cardiac computed tomography angiography results in diagnostic and therapeutic change in prosthetic heart valve endocarditis. Int J Cardiovasc Imaging 2014; 30(2):377–387. doi:10.1007/s10554-013-0335-2
- Koneru S, Huang SS, Oldan J, et al. Role of preoperative cardiac CT in the evaluation of infective endocarditis: comparison with transesophageal echocardiography and surgical findings. Cardiovasc Diagn Ther 2018; 8(4):439–449. doi:10.21037/cdt.2018.07.07
- Koo HJ, Yang DH, Kang J, et al. Demonstration of infective endocarditis by cardiac CT and transoesophageal echocardiography: comparison with intra-operative findings. Eur Heart J Cardiovasc Imaging 2018; 19(2):199–207. doi:10.1093/ehjci/jex010
- Feuchtner GM, Stolzmann P, Dichtl W, et al. Multislice computed tomography in infective endocarditis: comparison with transesophageal echocardiography and intraoperative findings. J Am Coll Cardiol 2009; 53(5):436–444. doi:10.1016/j.jacc.2008.01.077
- Castellano IA, Nicol ED, Bull RK, Roobottom CA, Williams MC, Harden SP. A prospective national survey of coronary CT angiography radiation doses in the United Kingdom. J Cardiovasc Comput Tomogr 2017; 11(4):268–273. doi:10.1016/j.jcct.2017.05.002
- Mettler FA Jr, Huda W, Yoshizumi TT, Mahesh M. Effective doses in radiology and diagnostic nuclear medicine: a catalog. Radiology 2008; 248(1):254–263. doi:10.1148/radiol.2481071451
- Smith-Bindman R, Lipson J, Marcus R, et al. Radiation dose associated with common computed tomography examinations and the associated lifetime attributable risk of cancer. Arch Intern Med 2009; 169(22):2078–2086. doi:10.1001/archinternmed.2009.427
- Ploux S, Riviere A, Amraoui S, et al. Positron emission tomography in patients with suspected pacing system infections may play a critical role in difficult cases. Heart Rhythm 2011; 8(9):1478–1481. doi:10.1016/j.hrthm.2011.03.062
- Sarrazin J, Philippon F, Tessier M, et al. Usefulness of fluorine-18 positron emission tomography/computed tomography for identification of cardiovascular implantable electronic device infections. J Am Coll Cardiol 2012; 59(18):1616–1625. doi:10.1016/j.jacc.2011.11.059
- Doherty JU, Kort S, Mehran R, Schoenhagen P, Soman P; Rating Panel Members; Appropriate Use Criteria Task Force. ACC/AATS/AHA/ASE/ASNC/HRS/SCAI/SCCT/SCMR/STS 2017 Appropriate use criteria for multimodality imaging in valvular heart disease: a report of the American College of Cardiology Appropriate Use Criteria Task Force, American Association for Thoracic Surgery, American Heart Association, American Society of Echocardiography, American Society of Nuclear Cardiology, Heart Rhythm Society, Society for Cardiovascular Angiography and Interventions, Society of Cardiovascular Computed Tomography, Society for Cardiovascular Magnetic Resonance, and Society of Thoracic Surgeons. J Nucl Cardiol 2017; 24(6):2043–2063. doi:10.1007/s12350-017-1070-1
- Saby L, Laas O, Habib G, et al. Positron emission tomography/computed tomography for diagnosis of prosthetic valve endocarditis: increased valvular 18F-fluorodeoxyglucose uptake as a novel major criterion. J Am Coll Cardiol 2013; 61(23):2374–2382. doi:10.1016/j.jacc.2013.01.092
- Swart LE, Gomes A, Scholtens AM, et al. Improving the diagnostic performance of 18F-fluorodeoxyglucose positron-emission tomography/computed tomography in prosthetic heart valve endocarditis. Circulation 2018; 138(14):1412–1427. doi:10.1161/CIRCULATIONAHA.118.035032
- Graziosi M, Nanni C, Lorenzini M, et al. Role of 18F-FDG PET/CT in the diagnosis of infective endocarditis in patients with an implanted cardiac device: a prospective study. Eur J Nucl Med Mol Imaging 2014; 41(8):1617–1623. doi:10.1007/s00259-014-2773-z
- Kouijzer IJ, Vos FJ, Janssen MJ, van Dijk AP, Oyen WJ, Bleeker-Rovers CP. The value of 18F-FDG PET/CT in diagnosing infectious endocarditis. Eur J Nucl Med Mol Imaging 2013; 40(7):1102–1107. doi:10.1007/s00259-013-2376-0
- Wong D, Rubinshtein R, Keynan Y. Alternative cardiac imaging modalities to echocardiography for the diagnosis of infective endocarditis. Am J Cardiol 2016; 118(9):1410–1418. doi:10.1016/j.amjcard.2016.07.053
- Vos FJ, Bleeker-Rovers CP, Kullberg BJ, Adang EM, Oyen WJ. Cost-effectiveness of routine (18)F-FDG PET/CT in high-risk patients with gram-positive bacteremia. J Nucl Med 2011; 52(11):1673–1678. doi:10.2967/jnumed.111.089714
- McCollough CH, Bushberg JT, Fletcher JG, Eckel LJ. Answers to common questions about the use and safety of CT scans. Mayo Clin Proc 2015; 90(10):1380–1392. doi:10.1016/j.mayocp.2015.07.011
- Duval X, Iung B, Klein I, et al; IMAGE (Resonance Magnetic Imaging at the Acute Phase of Endocarditis) Study Group. Effect of early cerebral magnetic resonance imaging on clinical decisions in infective endocarditis: a prospective study. Ann Intern Med 2010; 152(8):497–504, W175. doi:10.7326/0003-4819-152-8-201004200-00006
- ACR Committee on Drugs and Contrast Media. ACR Manual on Contrast Media: 2018. www.acr.org/-/media/ACR/Files/Clinical-Resources/Contrast_Media.pdf. Accessed July 19, 2019.
- Kanda T, Fukusato T, Matsuda M, et al. Gadolinium-based contrast agent accumulates in the brain even in subjects without severe renal dysfunction: evaluation of autopsy brain specimens with inductively coupled plasma mass spectroscopy. Radiology 2015; 276(1):228–232. doi:10.1148/radiol.2015142690
- McDonald RJ, McDonald JS, Kallmes DF, et al. Intracranial gadolinium deposition after contrast-enhanced MR imaging. Radiology 2015; 275(3):772–782. doi:10.1148/radiol.15150025
- Kanda T, Ishii K, Kawaguchi H, Kitajima K, Takenaka D. High signal intensity in the dentate nucleus and globus pallidus on unenhanced T1-weighted MR images: relationship with increasing cumulative dose of a gadolinium-based contrast material. Radiology 2014; 270(3):834–841. doi:10.1148/radiol.13131669
- Expert Panel on Pediatric Imaging; Hayes LL, Palasis S, Bartel TB, et al. ACR appropriateness criteria headache-child. J Am Coll Radiol 2018; 15(5S):S78–S90. doi:10.1016/j.jacr.2018.03.017
KEY POINTS
- Echocardiography can produce false-negative results in native-valve infective endocarditis and is even less sensitive in patients with a prosthetic valve or cardiac implanted electronic device.
- 4D CT is a reasonable alternative to transesophageal echocardiography. It can also be used as a second test if echocardiography is inconclusive. Coupled with angiography, it also provides a noninvasive method to evaluate coronary arteries perioperatively.
- Nuclear imaging tests—FDG-PET and leukocyte scintigraphy—increase the sensitivity of the Duke criteria for diagnosing infective endocarditis. They should be considered for evaluating suspected infective endocarditis in all patients who have a prosthetic valve or cardiac implanted electronic device, and whenever echocardiography is inconclusive and clinical suspicion remains high.
Heart failure guidelines: What you need to know about the 2017 focused update
In 2017, the American College of Cardiology (ACC), American Heart Association (AHA), and Heart Failure Society of America (HFSA) jointly released a focused update1 of the 2013 ACC/AHA guideline for managing heart failure.2 This is the second focused update of the 2013 guidelines; the first update,3 in 2016, covered 2 new drugs (sacubitril-valsartan and ivabradine) for chronic stage C heart failure with reduced ejection fraction (HFrEF).
Rather than focus on new medication classes, this second update provides recommendations regarding:
- Preventing the progression to left ventricular dysfunction or heart failure in patients at high risk (stage A) through screening with B-type natriuretic peptide (BNP) and aiming for more aggressive blood pressure control
- Inpatient biomarker use
- Medications in heart failure with preserved ejection fraction (HFpEF, or diastolic heart failure)
- Blood pressure targets in stage C heart failure
- Managing important comorbidities such as iron deficiency and sleep-disordered breathing to decrease morbidity, improve functional capacity, and enhance quality of life.
These guidelines and the data that underlie them are explored below. We also discuss potential applications to the management of hospitalization for acute decompensated heart failure (ADHF).
COMMON, COSTLY, AND DEBILITATING
Heart failure—defined by the ACC/AHA as the complex clinical syndrome that results from any structural or functional impairment of ventricular filling or ejection of blood—remains one of the most common, costly, and debilitating diseases in the United States.2 Based on National Health and Nutrition Examination Survey data from 2011 to 2014, an estimated 6.5 million US adults have it, with projections of more than 8 million by 2030.4,5 More than 960,000 new cases are thought to occur annually, with a lifetime risk of developing it of roughly 20% to 45%.6
Despite ever-growing familiarity and some significant strides in management, the death rate in this syndrome is substantial. After admissions for heart failure (which number 1 million per year), the mortality rate is roughly 10% at 1 year and 40% at 5 years.6 Also staggering are the associated costs, with $30.7 billion attributed to heart failure in 2012 and a projected $69.7 billion annually by 2030.5 Thus, we must direct efforts not only to treatment, but also to prevention.

Preventive efforts would target patients with ACC/AHA stage A heart failure—those at high risk for developing but currently without evidence of structural heart disease or heart failure symptoms (Table 1).7 This group may represent up to one-third of the US adult population, or 75 million people, when including the well-recognized risk factors of coronary artery disease, hypertension, diabetes mellitus, and chronic kidney disease in those without left ventricular dysfunction or heart failure.8
BIOMARKERS FOR PREVENTION
Past ACC/AHA heart failure guidelines2 have included recommendations on the use of biomarkers to aid in diagnosis and prognosis and, to a lesser degree, to guide treatment of heart failure. Largely based on 2 trials (see below), the 2017 guidelines go further, issuing a recommendation on the use of natriuretic peptide biomarkers in a screening strategy to prompt early intervention and prevent the progression to clinical heart failure in high-risk patients (stage A heart failure).
The PONTIAC trial
The NT-proBNP Selected Prevention of Cardiac Events in a Population of Diabetic Patients Without a History of Cardiac Disease (PONTIAC) trial9 randomized 300 outpatients with type 2 diabetes mellitus and an elevated N-terminal proBNP (NT-proBNP) level (> 125 pg/mL) to standard medical care vs standard care plus intensive up-titration of renin-angiotensin system antagonists and beta-blockers in a cardiac clinic over 2 years.
Earlier studies10 had shown NT-proBNP levels to have predictive value for cardiac events in diabetic patients, while the neurohormonal treatments were thought to have an established record of preventing primary and secondary cardiovascular events. In PONTIAC, a significant reduction was seen in the primary end point of hospitalization or death due to cardiac disease (hazard ratio [HR] 0.351, P = .044), as well as in the secondary end point of hospitalization due to heart failure (P < .05), in the aggressive-intervention group. These results laid the foundation for the larger St. Vincent’s Screening to Prevent Heart Failure (STOP-HF) trial.11
The STOP-HF trial
The STOP-HF trial randomized 1,235 outpatients who were at high risk but without left ventricular dysfunction or heart failure symptoms (stage A) to annual screening alone vs annual screening plus BNP testing, in which a BNP level higher than 50 pg/mL triggered echocardiography and evaluation by a cardiologist who would then assist with medications.11
Eligible patients were over age 40 and had 1 or more of the following risk factors:
- Diabetes mellitus
- Hypertension
- Hypercholesterolemia
- Obesity (body mass index > 30 kg/m2)
- Vascular disease (coronary, cerebral, or peripheral arterial disease)
- Arrhythmia requiring treatment
- Moderate to severe valvular disease.
After a mean follow-up of 4.3 years, the primary end point, ie, asymptomatic left ventricular dysfunction with or without newly diagnosed heart failure, was found in 9.7% of the control group and in only 5.9% of the intervention group with BNP screening, a 42% relative risk reduction (P = .013).
Similarly, the incidence of secondary end points of emergency hospitalization for a cardiovascular event (arrhythmia, transient ischemic attack, stroke, myocardial infarction, peripheral or pulmonary thrombosis or embolization, or heart failure) was also lower at 45.2 vs 24.4 per 1,000 patient-years, a 46% relative risk reduction.
An important difference in medications between the 2 groups was an increase in subsequently prescribed renin-angiotensin-aldosterone system therapy, mainly consisting of angiotensin II receptor blockers (ARBs), in those with elevated BNP in the intervention group. Notably, blood pressure was about the same in the 2 groups.11
Although these findings are encouraging, larger studies are needed, as the lack of blinding, low event rates, and small absolute risk reduction make the results difficult to generalize.
New or modified recommendations for screening

Employing this novel prevention strategy in the extremely large number of patients with stage A heart failure, thought to be up to one-third of the US adult population, may serve as a way to best direct and utilize limited medical resources.8
BIOMARKERS FOR PROGNOSIS OR ADDED RISK STRATIFICATION
The 2013 guidelines2 recognized that a significant body of work had accumulated showing that natriuretic peptide levels can predict outcomes in both chronic and acute heart failure. Thus, in both conditions, the guidelines contained separate class Ia recommendations to obtain a natriuretic peptide level, troponin level, or both to establish prognosis or disease severity.
The 2017 update1 underscores the importance of timing in measuring natriuretic peptide levels during admission for ADHF, with emphasis on obtaining them at admission and at discharge for acute and postdischarge prognosis. The completely new class IIa recommendation to obtain a predischarge natriuretic peptide level for postdischarge prognosis was based on a number of observational studies, some of which we explore below.
The ELAN-HF meta-analysis
The European Collaboration on Acute Decompensated Heart Failure (ELAN-HF)12 performed a meta-analysis to develop a discharge prognostication score for ADHF that included both absolute level and percent change in natriuretic peptide levels at the time of discharge.
Using data from 7 prospective cohorts totaling 1,301 patients, the authors found that incorporation of these values into a subsequently validated risk model led to significant improvements in the ability to predict the end points of all-cause mortality and the combined end point of all-cause mortality or first readmission for a cardiovascular reason within 180 days.
The OPTIMIZE-HF retrospective analysis
Data from the Organized Program to Initiate Lifesaving Treatment in Hospitalized Patients With Heart Failure (OPTIMIZE-HF) were retrospectively analyzed13 to determine whether postdischarge outcomes were best predicted by natriuretic peptide levels at admission or discharge or by the relative change in natriuretic peptide level. More than 7,000 patients age 65 or older, in 220 hospitals, were included, and Cox prediction models were compared using clinical variables alone or in combination with the natriuretic peptide levels.
The model that included the discharge natriuretic peptide level was found to be the most predictive, with a c-index of 0.693 for predicting mortality and a c-index of 0.606 for mortality or rehospitalization at 1 year.
New or modified recommendations on biomarkers for prognosis
The 2017 update1 modified the earlier recommendation to obtain a natriuretic peptide or troponin level or both at admission for ADHF to establish prognosis. This now has a class Ia recommendation, emphasizing that such levels be obtained on admission. In addition, a new class IIa recommendation is made to obtain a predischarge natriuretic peptide level for postdischarge prognosis. The former class Ia recommendation to obtain a natriuretic peptide level in chronic heart failure to establish prognosis or disease severity remains unchanged.
Also worth noting is what the 2017 update does not recommend in regard to obtaining biomarker levels. It emphasizes that many patients, particularly those with advanced (stage D) heart failure, have a poor prognosis that is well established with or without biomarker levels. Additionally, there are many cardiac and noncardiac causes of natriuretic peptide elevation; thus, clinical judgment remains paramount.
The 2017 update1 also cautions against setting targets of percent change in or absolute levels of natriuretic peptide at discharge despite observational and retrospective studies demonstrating better outcomes when levels are reduced, as treating for any specific target has never been studied in a large prospective study. Thus, doing so may result in unintended harm. Rather, clinical judgment and optimization of guideline-directed management and therapy are encouraged (Table 2).
PHARMACOLOGIC TREATMENT FOR STAGE C HFpEF
Although the 2013 guidelines2 contain many class I recommendations for various medications in chronic HFrEF, not a single such recommendation is found for chronic HFpEF. A review by Okwuosa et al7 covered HFrEF, including the most recent additions on which the 2016 update was based, sacubitril-valsartan and ivabradine. The 2016 update was similarly devoid of recommendations regarding specific medications in HFpEF, leaving only the 2013 class IIb recommendation to consider using an ARB to decrease hospitalizations in HFpEF.
Evidence behind this recommendation came from the Candesartan in Heart Failure Assessment of Reduction in Mortality and Morbidity program’s randomized controlled trial in 3,025 patients with New York Heart Association (NYHA) class II to IV heart failure and left ventricular ejection fraction over 40%, who were treated with candesartan or placebo.14 Over a median follow-up of 36.6 months, there was no significant difference in the primary composite outcome of cardiovascular death or admission for heart failure, but significantly fewer patients in the candesartan arm were admitted (230 vs 270, P = .017). Thus the recommendation.
Although this finding was encouraging, it was clear that no blockbuster drug for HFpEF had been identified. Considering that roughly half of all heart failure patients have preserved ejection fraction, the discovery of such a drug for HFpEF would be met with much excitement.15 Subsequently, other medication classes have been evaluated in the hope of benefit, allowing the 2017 update to provide specific recommendations for aldosterone antagonists, nitrates, and phosphodiesterase-5 inhibitors in HFpEF.
ALDOSTERONE ANTAGONISTS FOR HFpEF
Mineralocorticoid receptor antagonists had previously been shown to significantly reduce morbidity and mortality rates in patients with HFrEF.16 In addition to aldosterone’s effects on sodium retention and many other pathophysiologic mechanisms relating to heart failure, this hormone is also known to play a role in promoting myocardial fibrosis.17 Accordingly, some have wondered whether aldosterone antagonists could improve diastolic dysfunction, and perhaps outcomes, in HFpEF.
The Aldo-DHF trial
The Aldosterone Receptor Blockade in Diastolic Heart Failure (Aldo-DHF) trial investigated whether the aldosterone antagonist spironolactone would improve diastolic function or maximal exercise capacity in chronic HFpEF.18 It randomized 422 ambulatory patients with NYHA stage II or III heart failure, preserved left ventricular ejection fraction (≥ 50%), and echocardiographic evidence of diastolic dysfunction to receive spironolactone 25 mg daily or placebo.
Although no significant difference was seen in maximal exercise capacity, follow-up over 1 year nevertheless showed significant improvement in echocardiographic diastolic dysfunction (E/e') and perhaps reverse remodeling (decreased left ventricular mass index). These improvements spurred larger trials powered to detect whether clinical outcomes could also be improved.
The TOPCAT trial
The Treatment of Preserved Cardiac Function Heart Failure With an Aldosterone Antagonist (TOPCAT) trial19 was a large, multicenter, international, double-blind, placebo-controlled trial that investigated whether spironolactone could improve clinical outcomes in HFpEF. It randomized 3,445 patients with symptomatic heart failure and left ventricular ejection fraction of 45% or more to spironolactone 15 to 45 mg daily or placebo.
The effect on a composite primary outcome of death from cardiovascular cause, aborted cardiac arrest, or hospitalization for heart failure was evaluated over a mean follow-up of 3.3 years, with only a small (HR 0.89), nonclinically significant reduction evident. Those in the spironolactone group did have a significantly lower incidence of hospitalization for heart failure (12.0% vs 14.2%, P = .04).
Although the results were disappointing in this essentially negative trial, significant regional variations evident on post hoc analysis prompted further investigation and much controversy since the trial’s publication in 2014.
Participants came in roughly equal proportions from the Americas (United States, Canada, Brazil, and Argentina—51%) and from Russia and Georgia (49%), but outcomes between the two groups were markedly different. Concern was first raised when immediate review discovered a 4-fold lower rate of the primary outcome in the placebo groups from Russia and Georgia (8.4%), a rate in fact similar to that in patients without heart failure.19 This led to further exploration that identified other red flags that called into question the data integrity from the non-American sites.20
Not only did patients receiving spironolactone in Russia and Georgia not experience the reduction in clinical outcomes seen in their American counterparts, they also did not manifest the expected elevations in potassium and creatinine, and spironolactone metabolites were undetectable in almost one-third of patients.21
These findings prompted a post hoc analysis that included only the 51% (1,767 patients) of the study population coming from the Americas; in this subgroup, treatment with spironolactone was associated with a statistically significant 18% relative risk reduction in the primary composite outcome, a 26% reduction in cardiovascular mortality, and an 18% reduction in hospitalization for heart failure.20
New or modified recommendations on aldosterone receptor antagonists

Nitrates and phosphodiesterase-5 inhibitors
Earlier studies indicated that long-acting nitrates are prescribed in 15% to 50% of patients with HFpEF, perhaps based on extrapolation from studies in HFrEF suggesting that they might improve exercise intolerance.22 Some have speculated that the hemodynamic effects of nitrates, such as decreasing pulmonary congestion, might improve exercise intolerance in those with the stiff ventricles of HFpEF as well, prompting further study.
The NEAT-HFpEF trial
The Nitrate’s Effect on Activity Tolerance in Heart Failure With Preserved Ejection Fraction (NEAT-HFpEF) trial22 investigated whether extended-release isosorbide mononitrate would increase daily activity levels in patients with HFpEF. This double-blind, crossover study randomized 110 patients with HFpEF (ejection fraction ≥ 50%) and persistent dyspnea to escalating doses of isosorbide mononitrate or placebo over 6 weeks, then to the other arm for another 6 weeks. Daily activity levels during the 120-mg phase were measured with a continuously worn accelerometer.
No beneficial effect of nitrates was evident, with a nonsignificant trend towards decreased activity levels, a significant decrease in hours of activity per day (–0.30 hours, P = .02), and no change in the other secondary end points such as quality-of-life score, 6-minute walk distance, or natriuretic peptide level.
Suggested explanations for these negative findings include the possibility of rapid dose escalation leading to increased subtle side effects (headache, dizziness, fatigue) that, in turn, decreased activity. Additionally, given the imprecise diagnostic criteria for HFpEF, difficulties with patient selection may have led to inclusion of a large number of patients without elevated left-sided filling pressures.23
The RELAX trial
The Phosphodiesterase-5 Inhibition to Improve Clinical Status and Exercise Capacity in Heart Failure With Preserved Ejection Fraction (RELAX) trial24 investigated whether the phosphodiesterase-5 inhibitor sildenafil would improve exercise capacity in HFpEF. Improvements in both exercise capacity and clinical outcomes had already been seen in earlier trials in patients with pulmonary hypertension, as well as in those with HFrEF.25 A smaller study in HFpEF patients with pulmonary hypertension was also encouraging.26
Thus, it was disappointing that, after randomizing 216 outpatients with HFpEF to sildenafil or placebo for 24 weeks, no benefit was seen in the primary end point of change in peak oxygen consumption or in secondary end points of change in 6-minute walk distance or composite clinical score. Unlike in NEAT-HFpEF, patients here were required to have elevated natriuretic peptide levels or elevated invasively measured filling pressures.
The study authors speculated that pulmonary arterial hypertension and right ventricular systolic failure might need to be significant for patients with HFpEF to benefit from phosphodiesterase-5 inhibitors, with their known effects of dilation of pulmonary vasculature and increasing contractility of the right ventricle.24
New or modified recommendations on nitrates or phosphodiesterase-5 drugs
Given these disappointing results, the 2017 update provides a class III (no benefit) recommendation against the routine use of nitrates or phosphodiesterase-5 inhibitors to improve exercise tolerance or quality of life in HFpEF, citing them as ineffective (Table 3).1
IRON DEFICIENCY IN HEART FAILURE
Not only is iron deficiency present in roughly 50% of patients with symptomatic heart failure (stage C and D HFrEF),27 it is also associated with increased heart failure symptoms such as fatigue and exercise intolerance,28 reduced functional capacity, decreased quality of life, and increased mortality.
Notably, this association exists regardless of the hemoglobin level.29 In fact, even in those without heart failure or anemia, iron deficiency alone results in worsened aerobic performance, exercise intolerance, and increased fatigue.30 Conversely, improvement in symptoms, exercise tolerance, and cognition have been shown with repletion of iron stores in such patients.31
At the time of the 2013 guidelines, only a single large trial of intravenous iron in HFrEF and iron deficiency had been carried out (see below), and although the results were promising, it was felt that the evidence base on which to make recommendations was inadequate. Thus, recommendations were deferred until more data could be obtained.
Of note, in all the trials discussed below, iron deficiency was diagnosed in the setting of heart failure as ferritin less than 100 mg/mL (absolute iron deficiency) or as ferritin 100 to 300 mg/mL with transferrin saturation less than 20% (relative deficiency).32
The CONFIRM-HF trial
As in the Ferinject Assessment in Patients With Iron Deficiency and Chronic Heart Failure (FAIR-HF) trial,33 the subsequent Ferric Carboxymaltose Evaluation on Performance in Patients With Iron Deficiency in Combination With Chronic Heart Failure (CONFIRM-HF) trial34 involved the intravenous infusion of iron (ferric carboxymaltose) in outpatients with symptomatic HFrEF and iron deficiency. It showed that benefits remained evident with a more objective primary end point (change in 6-minute walk test distance at 24 weeks), and that such benefits were sustained, as seen in numerous secondary end points related to functional capacity at 52 weeks. Benefits in CONFIRM-HF were evident independently from anemia, specifically whether hemoglobin was under or over 12 g/dL.
Although these results were promising, it remained unclear whether such improvements could be obtained with a much easier to administer, more readily available, and less expensive oral iron formulation.
The IRONOUT-HF trial
The Iron Repletion Effects on Oxygen Uptake in Heart Failure (IRONOUT-HF) trial35 investigated whether oral, rather than intravenous, iron supplementation could improve peak exercise capacity in patients with HFrEF and iron deficiency. This double-blind, placebo-controlled trial randomized 225 patients with NYHA class II to IV HFrEF and iron deficiency to treatment with oral iron polysaccharide (150 mg twice daily) or placebo for 16 weeks.
Contrary to the supportive findings above, no significant change was seen in the primary end point of change in peak oxygen uptake or in any of the secondary end points (change in 6-minute walk, quality of life). Also, despite a 15-fold increase in the amount of iron administered in oral form compared with intravenously, little change was evident in the indices of iron stores over the course of the study, with only a 3% increase in transferrin saturation and an 11 ng/mL increase in ferritin. The intravenous trials resulted in a 4-fold greater increase in transferrin saturation and a 20-fold greater increase in ferritin.36
What keeps heart failure patients from absorbing oral iron? It is unclear why oral iron administration in HFrEF, such as in IRONOUT-HF, seems to be so ineffective, but hepcidin—a protein hormone made by the liver that shuts down intestinal iron absorption and iron release from macrophages—may play a central role.37 When iron stores are adequate, hepcidin is upregulated to prevent iron overload. However, hepcidin is also increased in inflammatory states, and chronic heart failure is often associated with inflammation.
With this in mind, the IRONOUT-HF investigators measured baseline hepcidin levels at the beginning and at the end of the 16 weeks and found that high baseline hepcidin levels predicted poorer response to oral iron. Other inflammatory mediators, such as interleukin 6, may also play a role.38,39 Unlike oral iron formulations such as iron polysaccharide, intravenous iron (ferric carboxymaltose) bypasses these regulatory mechanisms, which may partly explain its much more significant effect on the indices of iron stores and outcomes.
New or modified recommendations on iron
The 2017 update1 makes recommendations regarding iron deficiency and anemia in heart failure for the first time.
A class IIb recommendation states that it might be reasonable to treat NYHA class II and III heart failure patients with iron deficiency with intravenous iron to improve functional status and quality of life. A strong recommendation has been deferred until more is known about morbidity and mortality effects from adequately powered trials, some of which are under way and explored further below.
The 2017 update also withholds any recommendations regarding oral iron supplementation in heart failure, citing an uncertain evidence base. Certainly, the subsequent IRONOUT-HF trial does not lend enthusiasm for this approach.
Lastly, given the lack of benefit coupled with the increased risk of thromboembolic events evident in a trial of darbepoetin alfa vs placebo in non-iron deficiency-related anemia in HFrEF,40,41 the 2017 update provides a class III (no benefit) recommendation against using erythropoietin-stimulating agents in heart failure and anemia.
HYPERTENSION IN HEART FAILURE
The 2013 guidelines for the management of heart failure simply provided a class I recommendation to control hypertension and lipid disorders in accordance with contemporary guidelines to lower the risk of heart failure.1
SPRINT
The Systolic Blood Pressure Intervention Trial (SPRINT)42 sought to determine whether a lower systolic blood pressure target (120 vs 140 mm Hg) would reduce clinical events in patients at high risk for cardiovascular events but without diabetes mellitus. Patients at high risk were defined as over age 75, or with known vascular disease, chronic kidney disease, or a Framingham Risk Score higher than 15%. This multicenter, open-label controlled trial randomized 9,361 patients to intensive treatment (goal systolic blood pressure < 120 mm Hg) or standard treatment (goal systolic blood pressure < 140 mm Hg).
SPRINT was stopped early at a median follow-up of 3.26 years when a 25% relative risk reduction in the primary composite outcome of myocardial infarction, other acute coronary syndromes, stroke, heart failure, or death from cardiovascular causes became evident in the intensive-treatment group (1.65% vs 2.19% per year, HR 0.75, P < .0001).
All-cause mortality was also lower in the intensive-treatment group (HR 0.73, P = .003), while the incidence of serious adverse events (hypotension, syncope, electrolyte abnormalities, acute kidney injury, and noninjurious falls) was only slightly higher (38.3% vs 37.1%, P = .25). Most pertinent, a significant 38% relative risk reduction in heart failure and a 43% relative risk reduction in cardiovascular events were also evident.
Of note, blood pressure measurements were taken as the average of 3 measurements obtained by an automated cuff taken after the patient had been sitting quietly alone in a room for 5 minutes.
New or modified recommendations on hypertension in heart failure
Given the impressive 25% relative risk reduction in myocardial infarction, other acute coronary syndromes, stroke, heart failure, or death from cardiovascular causes in SPRINT,42 the 2017 update1 incorporated the intensive targets of SPRINT into its recommendations. However, to compensate for what are expected to be higher blood pressures obtained in real-world clinical practice as opposed to the near-perfect conditions used in SPRINT, a slightly higher blood pressure goal of less than 130/80 mm Hg was set.

Although not specifically included in SPRINT, given the lack of trial data on specific blood pressure targets in HFrEF and the decreased cardiovascular events noted above, a class I (level of evidence C, expert opinion) recommendation to target a goal systolic blood pressure less than 130 mm Hg in stage C HFrEF with hypertension is also given. Standard guideline-directed medications in the treatment of HFrEF are to be used (Table 4).
Similarly, a new class I (level of evidence C, expert opinion) recommendation is given for hypertension in HFpEF to target a systolic blood pressure of less than 130 mm Hg, with special mention to first manage any element of volume overload with diuretics. Other than avoiding nitrates (unless used for angina) and phosphodiesterase inhibitors, it is noted that few data exist to guide the choice of antihypertensive further, although perhaps renin-angiotensin-aldosterone system inhibition, especially aldosterone antagonists, may be considered. These recommendations are fully in line with the 2017 ACC/AHA high blood pressure clinical practice guidelines,43 ie, that renin-angiotensin-aldosterone system inhibition with an angiotensin-converting enzyme (ACE) inhibitor or ARB and especially mineralocorticoid receptor antagonists would be the preferred choice (Table 4).
SLEEP-DISORDERED BREATHING IN HEART FAILURE
Sleep-disordered breathing, either obstructive sleep apnea (OSA) or central sleep apnea, is quite commonly associated with symptomatic HFrEF.44 Whereas OSA is found in roughly 18% and central sleep apnea in 1% of the general population, sleep-disordered breathing is found in nearly 60% of patients with HFrEF, with some studies showing a nearly equal proportion of OSA and central sleep apnea.45 A similar prevalence is seen in HFpEF, although with a much higher proportion of OSA.46 Central sleep apnea tends to be a marker of more severe heart failure, as it is strongly associated with severe cardiac systolic dysfunction and worse functional capacity.47
Not surprisingly, the underlying mechanism of central sleep apnea is quite different from that of OSA. Whereas OSA predominantly occurs because of repeated obstruction of the pharynx due to nocturnal pharyngeal muscle relaxation, no such airway patency issues or strained breathing patterns exist in central sleep apnea. Central sleep apnea, which can manifest as Cheyne-Stokes respirations, is thought to occur due to an abnormal ventilatory control system with complex pathophysiology such as altered sensitivity of central chemoreceptors to carbon dioxide, interplay of pulmonary congestion, subsequent hyperventilation, and prolonged circulation times due to reduced cardiac output.48
What the two types of sleep-disordered breathing have in common is an association with negative health outcomes. Both appear to induce inflammation and sympathetic nervous system activity via oxidative stress from intermittent nocturnal hypoxemia and hypercapnea.49 OSA was already known to be associated with significant morbidity and mortality rates in the general population,50 and central sleep apnea had been identified as an independent predictor of mortality in HFrEF.51

At the time of the 2013 guidelines, only small or observational studies with limited results had been done evaluating treatment effects of continuous positive airway pressure therapy (CPAP) on OSA and central sleep apnea. Given the relative paucity of data, only a single class IIa recommendation stating that CPAP could be beneficial to increase left ventricular ejection fraction and functional status in concomitant sleep apnea and heart failure was given in 2013. However, many larger trials were under way,52–59 some with surprising results such as a significant increase in cardiovascular and all-cause mortality (Table 5).54
New or modified recommendations on sleep-disordered breathing

Given the common association with heart failure (60%)45 and the marked variation in response to treatment, including potential for harm with adaptive servo-ventilation and central sleep apnea, a class IIa recommendation is made stating that it is reasonable to obtain a formal sleep study in any patient with symptomatic (NYHA class II–IV) heart failure.1
Due to the potential for harm with adaptive servo-ventilation in patients with central sleep apnea and NYHA class II to IV HFrEF, a class III (harm) recommendation is made against its use.
Largely based on the results of the Sleep Apnea Cardiovascular Endpoints (SAVE) trial,56 a class IIb, level of evidence B-R (moderate, based on randomized trials) recommendation is given, stating that the use of CPAP in those with OSA and known cardiovascular disease may be reasonable to improve sleep quality and reduce daytime sleepiness.
POTENTIAL APPLICATIONS IN ACUTE DECOMPENSATED HEART FAILURE
Although the 2017 update1 is directed mostly toward managing chronic heart failure, it is worth considering how it might apply to the management of ADHF.
SHOULD WE USE BIOMARFER TARGETS TO GUIDE THERAPY IN ADHF?
The 2017 update1 does offer direct recommendations regarding the use of biomarker levels during admissions for ADHF. Mainly, they emphasize that the admission biomarker levels provide valuable information regarding acute prognosis and risk stratification (class I recommendation), while natriuretic peptide levels just before discharge provide the same for the postdischarge timeframe (class IIa recommendation).
The update also explicitly cautions against using a natriuretic peptide level-guided treatment strategy, such as setting targets for predischarge absolute level or percent change in level of natriuretic peptides during admissions for ADHF. Although observational and retrospective studies have shown better outcomes when levels are reduced at discharge, treating for any specific inpatient target has never been tested in any large, prospective study; thus, doing so could result in unintended harm.
So what do we know?
McQuade et al systematic review
McQuade et al57 performed a systematic review of more than 40 ADHF trials, which showed that, indeed, patients who achieved a target absolute natriuretic peptide level (BNP ≤ 250 pg/mL) or percent reduction (≥ 30%) at time of discharge had significantly improved outcomes such as reduced postdischarge all-cause mortality and rehospitalization rates. However, these were mostly prospective cohort studies that did not use any type of natriuretic peptide level-guided treatment protocol, leaving it unclear whether such a strategy could positively influence outcomes.
For this reason, both McQuade et al57 and, in an accompanying editorial, Felker et al58 called for properly designed, randomized controlled trials to investigate such a strategy. Felker noted that only 2 such phase II trials in ADHF have been completed,59,60 with unconvincing results.
PRIMA II
The Multicenter, Randomized Clinical Trial to Study the Impact of In-hospital Guidance for Acute Decompensated Heart Failure Treatment by a Predefined NT-ProBNP Target on the Reduction of Readmission and Mortality Rates (PRIMA II)60 randomized patients to natriuretic peptide level-guided treatment or standard care during admission for ADHF.
Many participants (60%) reached the predetermined target of 30% reduction in natriuretic peptide levels at the time of clinical stabilization and randomization; 405 patients were randomized. Patients in the natriuretic peptide level-guided treatment group underwent a prespecified treatment algorithm, with repeat natriuretic peptide levels measured again after the protocol.
Natriuretic peptide-guided therapy failed to show any significant benefit in any clinical outcomes, including the primary composite end point of mortality or heart failure readmissions at 180 days (36% vs 38%, HR 0.99, 95% confidence interval 0.72–1.36). Consistent with the review by McQuade et al,57 achieving the 30% reduction in natriuretic peptide at discharge, in either arm, was associated with a better prognosis, with significantly lower mortality and readmission rates at 180 days (HR 0.39 for rehospitalization or death, 95% confidence interval 0.27–0.55).
As in the observational studies, those who achieved the target natriuretic peptide level at the time of discharge had a better prognosis than those who did not, but neither study showed an improvement in clinical outcomes using a natriuretic peptide level-targeting treatment strategy.
No larger randomized controlled trial results are available for guided therapy in ADHF. However, additional insight may be gained from a subsequent trial61 that evaluated biomarker-guided titration of guideline-directed medical therapy in outpatients with chronic HFrEF.
The GUIDE-IT trial
That trial, the Guiding Evidence Based Therapy Using Biomarker Intensified Treatment in Heart Failure (GUIDE-IT)61 trial, was a large multicenter attempt to determine whether a natriuretic peptide-guided treatment strategy was more effective than standard care in the management of 894 high-risk outpatients with chronic HFrEF. Earlier, promising results had been obtained in a meta-analysis62 of more than 11 similar trials in 2,000 outpatients, with a decreased mortality rate (HR 0.62) seen in the biomarker-guided arm. However, the results had not been definitive due to being underpowered.62
Unfortunately, the results of GUIDE-IT were disappointing, with no significant difference in either the combined primary end point of mortality or hospitalization for heart failure, or the secondary end points evident at 15 months, prompting early termination for futility.61 Among other factors, the study authors postulated that this may have partly resulted from a patient population with more severe heart failure and resultant azotemia, limiting the ability to titrate neurohormonal medications to the desired dosage.
The question of whether patients who cannot achieve such biomarker targets need more intensive therapy or whether their heart failure is too severe to respond adequately echoes the question often raised in discussions of inpatient biomarker-guided therapy.58 Thus, only limited insight is gained, and it remains unclear whether a natriuretic peptide-guided treatment strategy can improve outpatient or inpatient outcomes. Until this is clarified, clinical judgment and optimization of guideline-directed management and therapy should remain the bedrock of treatment.
SHOULD ALDOSTERONE ANTAGONISTS BE USED IN ACUTE HFpEF?
Given the encouraging results in chronic HFpEF from post hoc analyses of TOPCAT, are there any additional recent data suggesting a role for aldosterone antagonists such as spironolactone in acute HFpEF?
The ATHENA-HF trial
The Aldosterone Targeted Neurohormonal Combined With Natriuresis Therapy in Heart Failure (ATHENA-HF) trial63 compared treatment with high-dose spironolactone (100 mg) for 96 hours vs usual care in 360 patients with ADHF. The patient population included those with HFrEF and HFpEF, and usual care included low-dose spironolactone (12.5–25 mg) in roughly 15% of patients. High-dose mineralocorticoid receptor antagonists have been shown to overcome diuretic resistance, improve pulmonary vascular congestion, and partially combat the adverse neurohormonal activation seen in ADHF.
Unfortunately, the trial was completely neutral in regard to the primary end point of reduction in natriuretic peptide levels as well as to the secondary end points of 30-day mortality rate, heart failure readmission, clinical congestion scores, urine output, and change in weight. No suggestion of additional benefit was seen in subgroup analysis of patients with acute HFpEF (ejection fraction > 45%), which yielded similar results.63
Given these lackluster findings, routine use of high-dose spironolactone in ADHF is not recommended.64 However, the treatment was well tolerated, without significant adverse effects of hyperkalemia or kidney injury, leaving the door open as to whether it may have utility in selected patients with diuretic resistance.
Should ARNIs and ivabradine be started during ADHF admissions?
The first half of the focused update3 of the 2013 guidelines,2 reviewed by Okwuosa et al,7 provided recommendations for the use of sacubitril-valsartan, an angiotensin-neprilysin inhibitor (ARNI), and ivabradine, a selective sinoatrial node If channel inhibitor, in chronic HFrEF.
Sacubitril-valsartan was given a class I recommendation for use in patients with NYHA class II or III chronic HFrEF who tolerate an ACE inhibitor or an ARB. This recommendation was given largely based on the benefits in mortality and heart failure hospitalizations seen in PARADIGM-HF (the Prospective Comparison of ARNI With ACEI to Determine Impact on Global Mortality and Morbidity in Heart Failure)65 compared with enalapril (HR 0.80, 95% CI 0.73–0.87, P < .001).
There is currently no recommendation on initiation or use of ARNIs during admissions for ADHF, but a recent trial may lend some insight.66
THE PIONEER-HF trial
The Comparison of Sacubitril/Valsartan vs Enalapril on Effect on NT-proBNP in Patients Stabilized From an Acute Heart Failure Episode (PIONEER-HF) trial66 randomized patients admitted for acute HFrEF, once stabilized, to sacubitril-valsartan or enalapril. Encouragingly, the percentage change of natriuretic peptide levels from the time of inpatient initiation to 4 and 8 weeks thereafter, the primary efficacy end point, was 46.7% with sacubitril-valsartan versus 25.3% with enalapril alone (ratio of change 0.71, 95% CI 0.63–0.81, P < .001). Although not powered for such, a prespecified analysis of a composite of clinical outcomes was also favorable for sacubitril-valsartan, largely driven by a 44% decreased rate of rehospitalization. More definitive, and quite reassuring, was that no significant difference was seen in the key safety outcomes of worsening renal function, hyperkalemia, symptomatic hypotension, and angioedema. These results were also applicable to the one-third of study participants who had no former diagnosis of heart failure, the one-third identifying as African American, and the one-third who had not been taking an ACE inhibitor or ARB. These results, taken together with the notion that at study completion the patients become similar to those included in PARADIGM-HF, have led some to assert that PIONEER-HF has the potential to change clinical practice.
Ivabradine was given a class IIa recommendation for use in patients with NYHA class II or III chronic HFrEF with a resting heart rate of at least 70 bpm, in sinus rhythm, despite being on optimal medical therapy including a beta-blocker at a maximum tolerated dose.
This recommendation was largely based on SHIFT (Systolic Heart Failure Treatment With the If Inhibitor Ivabradine Trial), which randomized patients to ivabradine or placebo to evaluate the effects of isolated lowering of the heart rate on the composite primary outcome of cardiovascular death or hospitalization. A significant reduction was seen in the ivabradine arm (HR 0.82, 95% CI 0.75–0.90, P < .0001), mainly driven by decreased hospitalizations.67
Subsequently, a small unblinded single-center study was undertaken to evaluate the efficacy and safety of initiating ivabradine during admissions for ADHF.68
THE ETHIC-AHF trial
The Effect of Early Treatment With Ivabradine Combined With Beta-Blockers vs Beta-Blockers Alone in Patients Hospitalized With Heart Failure and Reduced Left Ventricular Ejection Fraction (ETHIC-AHF) trial68 sought to determine the safety and effectiveness of early coadministration of ivabradine with beta-blockers in patients with acute HFrEF.
This single-center, unblinded study randomized 71 patients to ivabradine and beta-blockade or beta-blockade alone upon clinical stabilization (24–48 hours) after admission for acute decompensated HFrEF.
The primary end point was heart rate at 28 days, with the ivabradine group showing a statistically significant decrease (64 vs 70 bpm, P = .01), which persisted at 4 months. There was no significant difference in the secondary end points of adverse drug effects or the composite of clinical event outcomes (all-cause mortality, admission for heart failure or cardiovascular cause), but a number of surrogate end points including left ventricular ejection fraction, BNP level, and NYHA functional class at 4 months showed mild improvement.
Although this study provided evidence that the coadministration of ivabradine and a beta-blocker is safe and was positive in regard to clinical outcomes, the significant limitations due to its size and study design (single-center, unblinded, 4-month follow-up) simply serve to support the pursuit of larger studies with more stringent design and longer follow-up in order to determine the clinical efficacy.
The PRIME-HF trial
The Predischarge Initiation of Ivabradine in the Management of Heart Failure (PRIME-HF) trial69 is a randomized, open-label, multicenter trial comparing standard care vs the initiation of ivabradine before discharge, but after clinical stabilization, during admissions for ADHF in patients with chronic HFrEF (left ventricular ejection fraction ≤ 35%). At subsequent outpatient visits, the dosage can be modified in the ivabradine group, or ivabradine can be initiated at the provider’s discretion in the usual-care group.
PRIME-HF is attempting to determine whether initiating ivabradine before discharge will result in more patients taking ivabradine at 180 days, its primary end point, as well as in changes in secondary end points including heart rate and patient-centered outcomes. The study is active, with reporting expected in 2019.
As these trials all come to completion, it will not be long before we have further guidance regarding the inpatient initiation of these new and exciting therapeutic agents.
SHOULD INTRAVENOUS IRON BE GIVEN DURING ADHF ADMISSIONS?
Given the high prevalence of iron deficiency in symptomatic HFrEF, its independent association with mortality, improvements in quality of life and functional capacity suggested by repleting with intravenous iron (in FAIR-HF and CONFIRM-HF), the seeming inefficacy of oral iron in IRONOUT, and the logistical challenges of intravenous administration during standard clinic visits, could giving intravenous iron soon be incorporated into admissions for ADHF?
Caution has been advised for several reasons. As discussed above, larger randomized controlled trials powered to detect more definitive clinical end points such as death and the rate of hospitalization are still needed before a stronger recommendation can be made for intravenous iron in HFrEF. Also, without such data, it seems unwise to add the considerable economic burden of routinely assessing for iron deficiency and providing intravenous iron during ADHF admissions to the already staggering costs of heart failure.

The effects seen on morbidity and mortality that become evident in these trials over the next 5 years will help determine future guidelines and whether intravenous iron is routinely administered in bridge clinics, during inpatient admissions for ADHF, or not at all in patients with HFrEF and iron deficiency.
INTERNISTS ARE KEY
Heart failure remains one of the most common, morbid, complex, and costly diseases in the United States, and its prevalence is expected only to increase.4,5 The 2017 update1 of the 2013 guideline2 for the management of heart failure provides recommendations aimed not only at management of heart failure, but also at its comorbidities and, for the first time ever, at its prevention.
Internists provide care for the majority of heart failure patients, as well as for their comorbidities, and are most often the first to come into contact with patients at high risk of developing heart failure. Thus, a thorough understanding of these guidelines and how to apply them to the management of acute decompensated heart failure is of critical importance.
- Yancy CW, Jessup M, Bozkurt B, et al. 2017 ACC/AHA/HFSA focused update of the 2013 ACCF/AHA Guideline for the Management of Heart Failure: a report of the American College of Cardiology/American Heart Association Task Force on Clinical Practice Guidelines and the Heart Failure Society of America. J Am Coll Cardiol 2017; 70(6):776–803. doi:10.1016/j.jacc.2017.04.025
- Yancy CW, Jessup M, Bozkurt B, et al; American College of Cardiology Foundation/American Heart Association Task Force on Practice Guidelines. 2013 ACCF/AHA guideline for the management of heart failure: a report of the American College of Cardiology Foundation/American Heart Association Task Force on Practice Guidelines. Circulation 2013; 128(16):e240–e327. doi:10.1161/CIR.0b013e31829e8776
- Yancy CW, Jessup M, Bozkurt B, et al. 2016 ACC/AHA/HFSA focused update on new pharmacological therapy for heart failure: an update of the 2013 ACCF/AHA Guideline for the Management of Heart Failure: a report of the American College of Cardiology/American Heart Association Task Force on Clinical Practice Guidelines and the Heart Failure Society of America. Circulation 2016; 134(13):e282–e293. doi:10.1161/CIR.0000000000000435
- Benjamin EJ, Blaha MJ, Chiuve SE, et al; American Heart Association Statistics Committee and Stroke Statistics Subcommittee. Heart disease and stroke statistics—2017 update: a report from the American Heart Association. Circulation 2017; 135(10):e146–e603. doi:10.1161/CIR.0000000000000485
- Heidenreich PA, Albert NM, Allen LA, et al; American Heart Association Advocacy Coordinating Committee; Council on Arteriosclerosis, Thrombosis and Vascular Biology; Council on Cardiovascular Radiology and Intervention; Council on Clinical Cardiology; Council on Epidemiology and Prevention; Stroke Council. Forecasting the impact of heart failure in the United States: a policy statement from the American Heart Association. Circ Heart Fail 2013; 6(3):606–619. doi:10.1161/HHF.0b013e318291329a
- Huffman MD, Berry JD, Ning H, et al. Lifetime risk for heart failure among white and black Americans: cardiovascular lifetime risk pooling project. J Am Coll Cardiol 2013; 61(14):1510–1517. doi:10.1016/j.jacc.2013.01.022
- Okwuosa IS, Princewill O, Nwabueze C, et al. The ABCs of managing systolic heart failure: past, present, and future. Cleve Clin J Med 2016; 83(10):753–765. doi:10.3949/ccjm.83a.16006
- Kovell LC, Juraschek SP, Russell SD. Stage A heart failure is not adequately recognized in US adults: analysis of the National Health and Nutrition Examination Surveys, 2007–2010. PLoS One 2015; 10(7):e0132228. doi:10.1371/journal.pone.0132228
- Huelsmann M, Neuhold S, Resl M, et al. PONTIAC (NT-proBNP selected prevention of cardiac events in a population of diabetic patients without a history of cardiac disease): a prospective randomized controlled trial. J Am Coll Cardiol 2013; 62(15):1365–1372. doi:10.1016/j.jacc.2013.05.069
- Clodi M, Resl M, Neuhold S, et al. A comparison of NT-proBNP and albuminuria for predicting cardiac events in patients with diabetes mellitus. Eur J Prev Cardiol 2012; 19(5):944–951. doi:10.1177/1741826711420015
- Ledwidge M, Gallagher J, Conlon C, et al. Natriuretic peptide-based screening and collaborative care for heart failure: the STOP-HF randomized trial. JAMA 2013; 310(1):66–74. doi:10.1001/jama.2013.7588
- Salah K, Kok WE, Eurlings LW, et al. A novel discharge risk model for patients hospitalised for acute decompensated heart failure incorporating N-terminal pro-B-type natriuretic peptide levels: a European coLlaboration on Acute decompeNsated Heart Failure: ELAN-HF Score. Heart 2014; 100(2):115–125. doi:10.1136/heartjnl-2013-303632
- Kociol RD, Horton JR, Fonarow GC, et al. Admission, discharge, or change in B-type natriuretic peptide and long-term outcomes: data from Organized Program to Initiate Lifesaving Treatment in Hospitalized Patients with Heart Failure (OPTIMIZE-HF) linked to Medicare claims. Circ Heart Fail 2011; 4(5):628–636. doi:10.1161/CIRCHEARTFAILURE.111.962290
- Yusuf S, Pfeffer MA, Swedberg K, et al; CHARM Investigators and Committees. Effects of candesartan in patients with chronic heart failure and preserved left-ventricular ejection fraction: the CHARM-Preserved Trial. Lancet 2003; 362(9386):777–781. doi:10.1016/S0140-6736(03)14285-7
- Owan TE, Hodge DO, Herges RM, Jacobsen SJ, Roger VL, Redfield MM. Trends in prevalence and outcome of heart failure with preserved ejection fraction. N Engl J Med 2006; 355(3):251–259. doi:10.1056/NEJMoa052256
- Pitt B, Zannad F, Remme WJ, et al. The effect of spironolactone on morbidity and mortality in patients with severe heart failure. Randomized Aldactone Evaluation Study Investigators. N Engl J Med 1999; 341(10):709–717. doi:10.1056/NEJM199909023411001
- MacFadyen RJ, Barr CS, Struthers AD. Aldosterone blockade reduces vascular collagen turnover, improves heart rate variability and reduces early morning rise in heart rate in heart failure patients. Cardiovasc Res 1997; 35(1):30–34. pmid:9302344
- Edelmann F, Wachter R, Schmidt AG, et al; Aldo-DHF Investigators. Effect of spironolactone on diastolic function and exercise capacity in patients with heart failure with preserved ejection fraction: the Aldo-DHF randomized controlled trial. JAMA 2013; 309(8):781–791. doi:10.1001/jama.2013.905
- Pitt B, Pfeffer MA, Assmann SF, et al; TOPCAT Investigators. Spironolactone for heart failure with preserved ejection fraction. N Engl J Med 2014; 370(15):1383–1392. doi:10.1056/NEJMoa1313731
- Pfeffer MA, Claggett B, Assmann SF, et al. Regional variation in patients and outcomes in the Treatment of Preserved Cardiac Function Heart Failure With an Aldosterone Antagonist (TOPCAT) trial. Circulation 2015; 31(1):34–42. doi:10.1161/CIRCULATIONAHA.114.013255
- de Denus S, O’Meara E, Desai AS, et al. Spironolactone metabolites in TOPCAT—new insights into regional variation. N Engl J Med 2017; 376(17):1690–1692. doi:10.1056/NEJMc1612601
- Redfield MM, Anstrom KJ, Levine JA, et al; NHLBI Heart Failure Clinical Research Network. Isosorbide mononitrate in heart failure with preserved ejection fraction. N Engl J Med 2015; 373(24):2314–2324. doi:10.1056/NEJMoa1510774
- Walton-Shirley M. Succinct thoughts on NEAT-HFpEF: true, true, and unrelated? Medscape 2015. https://www.medscape.com/viewarticle/854116. Accessed January 17, 2019.
- Redfield MM, Chen HH, Borlaug BA, et al. Effect of phosphodiesterase-5 inhibition on exercise capacity and clinical status in heart failure with preserved ejection fraction: a randomized clinical trial. JAMA 2013; 309(12):1268–1277. doi:10.1001/jama.2013.2024
- Guazzi M, Vicenzi M, Arena R, Guazzi MD. PDE5 inhibition with sildenafil improves left ventricular diastolic function, cardiac geometry, and clinical status in patients with stable systolic heart failure: results of a 1-year, prospective, randomized, placebo controlled study. Circ Heart Fail 2011; 4(1):8–17. doi:10.1161/CIRCHEARTFAILURE.110.944694
- Guazzi M, Vicenzi M, Arena R, Guazzi MD. Pulmonary hypertension in heart failure with preserved ejection fraction: a target of phosphodiesterase-5 inhibition in a 1-year study. Circulation 2011; 124(2):164–174. doi:10.1161/CIRCULATIONAHA.110.983866
- Klip IT, Comin-Colet J, Voors AA, et al. Iron deficiency in chronic heart failure: an international pooled analysis. Am Heart J 2013; 165(4):575–582.e3. doi:10.1016/j.ahj.2013.01.017
- Jankowska EA, von Haehling S, Anker SD, Macdougall IC, Ponikowski P. Iron deficiency and heart failure: diagnostic dilemmas and therapeutic perspectives. Eur Heart J 2013; 34(11):816–829. doi:10.1093/eurheartj/ehs224
- Jankowska EA, Rozentryt P, Witkowska A, et al. Iron deficiency predicts impaired exercise capacity in patients with systolic chronic heart failure. J Card Fail 2011; 17(11):899–906. doi:10.1016/j.cardfail.2011.08.003
- Haas JD, Brownlie T 4th. Iron deficiency and reduced work capacity: a critical review of the research to determine a causal relationship. J Nutr 2001; 131(2S–2):676S-690S. doi:10.1093/jn/131.2.676S
- Davies KJ, Maguire JJ, Brooks GA, Dallman PR, Packer L. Muscle mitochondrial bioenergetics, oxygen supply, and work capacity during dietary iron deficiency and repletion. Am J Physiol 1982; 242(6):E418–E427. doi:10.1152/ajpendo.1982.242.6.E418
- Drozd M, Jankowska EA, Banasiak W, Ponikowski P. Iron therapy in patients with heart failure and iron deficiency: review of iron preparations for practitioners. Am J Cardiovasc Drugs 2017; 17(3):183–201. doi:10.1007/s40256-016-0211-2
- Anker SD, Comin Colet J, Filippatos G, et al; FAIR-HF Trial Investigators. Ferric carboxymaltose in patients with heart failure and iron deficiency. N Engl J Med 2009; 361(25):2436–2448. doi:10.1056/NEJMoa0908355
- Ponikowski P, van Veldhuisen DJ, Comin-Colet J, et al; CONFIRM-HF Investigators. Beneficial effects of long-term intravenous iron therapy with ferric carboxymaltose in patients with symptomatic heart failure and iron deficiency. Eur Heart J 2015; 36(11):657–668. doi:10.1093/eurheartj/ehu385
- Lewis GD, Malhotra R, Hernandez AF, et al; NHLBI Heart Failure Clinical Research Network. Effect of Oral Iron Repletion on Exercise Capacity in Patients With Heart Failure With Reduced Ejection Fraction and Iron Deficiency: The IRONOUT HF randomized clinical trial. JAMA 2017; 317(19):1958–1966. doi:10.1001/jama.2017.5427
- Wendling P. Iron supplementation in HF: trials support IV but not oral. Medscape 2016. https://www.medscape.com/viewarticle/872088. Accessed January 17, 2019.
- Ganz T. Hepcidin and iron regulation, 10 years later. Blood 2011; 117(17):4425–4433. doi:10.1182/blood-2011-01-258467
- Jankowska EA, Kasztura M, Sokolski M, et al. Iron deficiency defined as depleted iron stores accompanied by unmet cellular iron requirements identifies patients at the highest risk of death after an episode of acute heart failure. Eur Heart J 2014; 35(36):2468–2476. doi:10.1093/eurheartj/ehu235
- Jankowska EA, Malyszko J, Ardehali H, et al. Iron status in patients with chronic heart failure. Eur Heart J 2013; 34(11):827–834. doi:10.1093/eurheartj/ehs377
- Swedberg K, Young JB, Anand IS, et al. Treatment of anemia with darbepoetin alfa in systolic heart failure. N Engl J Med 2013; 368(13):1210–1219. doi:10.1056/NEJMoa1214865
- Ghali JK, Anand IS, Abraham WT, et al; Study of Anemia in Heart Failure Trial (STAMINA-HeFT) Group. Randomized double-blind trial of darbepoetin alfa in patients with symptomatic heart failure and anemia. Circulation 2008; 117(4):526–535. doi:10.1161/CIRCULATIONAHA.107.698514
- SPRINT Research Group; Wright JT Jr, Williamson JD, Whelton PK, et al. A randomized trial of intensive versus standard blood pressure control. N Engl J Med 2015; 373(22):2103–2116. doi:10.1056/NEJMoa1511939
- Whelton PK, Carey RM, Arnow WS, et al. 2017 ACC/AHA/AAPA/ABC/ACPM/AGS/APhA/ASH/ASPC/NMA/PCNA guideline for the prevention, detection, evaluation, and management of high blood pressure in adults: a report of the American College of Cardiology/American Heart Association Task Force on Clinical Practice Guidelines. J Am Coll Cardiol 2018; 71(19):e127–e248. doi:10.1016/j.jacc.2017.11.006
- Young T, Shahar E, Nieto FJ, et al; Sleep Heart Health Study Research Group. Predictors of sleep-disordered breathing in community dwelling adults: the Sleep Heart Health Study. Arch Intern Med 2002; 162(8):893–900. pmid:11966340
- MacDonald M, Fang J, Pittman SD, White DP, Malhotra A.The current prevalence of sleep disordered breathing in congestive heart failure patients treated with beta-blockers. J Clin Sleep Med 2008; 4(1):38-42. pmid:18350960
- Bitter T, Faber L, Hering D, Langer C, Horstkotte D, Oldenburg O. Sleep-disordered breathing in heart failure with normal left ventricular ejection fraction. Eur J Heart Fail 2009; 11(6):602–608. doi:10.1093/eurjhf/hfp057
- Sin DD, Fitzgerald F, Parker JD, Newton G, Floras JS, Bradley TD. Risk factors for central and obstructive sleep apnea in 450 men and women with congestive heart failure. Am J Respir Crit Care Med 1999; 160(4):1101–1106. doi:10.1164/ajrccm.160.4.9903020
- Ng AC, Freedman SB. Sleep disordered breathing in chronic heart failure. Heart Fail Rev 2009; 14(2):89–99. doi:10.1007/s10741-008-9096-8
- Kasai T, Bradley TD. Obstructive sleep apnea and heart failure: pathophysiologic and therapeutic implications. J Am Coll Cardiol 2011; 57(2):119–127. doi:10.1016/j.jacc.2010.08.627
- Marin JM, Carrizo SJ, Vicente E, Agusti AG. Long-term cardiovascular outcomes in men with obstructive sleep apnoea-hypopnoea with or without treatment with continuous positive airway pressure: an observational study. Lancet 2005; 365(9464):1046–1053. doi:10.1016/S0140-6736(05)71141-7
- Javaheri S, Shukla R, Zeigler H, Wexler L. Central sleep apnea, right ventricular dysfunction, and low diastolic blood pressure are predictors of mortality in systolic heart failure. J Am Coll Cardiol 2007; 49(20):2028–2034. doi:10.1016/j.jacc.2007.01.084
- Bradley TD, Logan AG, Kimoff RJ, et al; CANPAP Investigators. Continuous positive airway pressure for central sleep apnea and heart failure. N Engl J Med 2005; 353(19):2025–2033. doi:10.1056/NEJMoa051001
- Arzt M, Floras JS, Logan AG, et al; CANPAP Investigators. Suppression of central sleep apnea by continuous positive airway pressure and transplant-free survival in heart failure: a post hoc analysis of the Canadian Continuous Positive Airway Pressure for Patients with Central Sleep Apnea and Heart Failure Trial (CANPAP). Circulation 2007; 115(25):3173–3180. doi:10.1161/CIRCULATIONAHA.106.683482
- Cowie MR, Woehrle H, Wegscheider K, et al. Adaptive servo-ventilation for central sleep apnea in systolic heart failure. N Engl J Med 2015; 373(12):1095–1105. doi:10.1056/NEJMoa1506459
- O’Connor CM, Whellan DJ, Fiuzat M, et al. Cardiovascular outcomes with minute ventilation-targeted adaptive servo-ventilation therapy in heart failure: the CAT-HF Trial. J Am Coll Cardiol 2017; 69(12):1577–1587. doi:10.1016/j.jacc.2017.01.041
- McEvoy RD, Antic NA, Heeley E, et al; SAVE Investigators and Coordinators. CPAP for prevention of cardiovascular events in obstructive sleep apnea. N Engl J Med 2016; 375(10):919–931. doi:10.1056/NEJMoa1606599
- McQuade CN, Mizus M, Wald JW, Goldberg L, Jessup M, Umscheid CA. Brain-type natriuretic peptide and amino-terminal pro-brain-type natriuretic peptide discharge thresholds for acute decompensated heart failure: a systematic review. Ann Intern Med 2017; 166(3):180–190. doi:10.7326/M16-1468
- Felker GM, Whellan DJ. Inpatient management of heart failure: are we shooting at the right target? Ann Intern Med 2017; 166(3):223–224. doi:10.7326/M16-2667
- Carubelli V, Lombardi C, Lazzarini V, et al. N-terminal pro-B-type natriuretic peptide-guided therapy in patients hospitalized for acute heart failure. J Cardiovasc Med (Hagerstown) 2016; 17(11):828–839. doi:10.2459/JCM.0000000000000419
- Stienen S, Salah K, Moons AH, et al. Rationale and design of PRIMA II: a multicenter, randomized clinical trial to study the impact of in-hospital guidance for acute decompensated heart failure treatment by a predefined NT-PRoBNP target on the reduction of readmIssion and mortality rates. Am Heart J 2014; 168(1):30–36. doi:10.1016/j.ahj.2014.04.008
- Felker GM, Anstrom KJ, Adams KF, et al. Effect of natriuretic peptide-guided therapy on hospitalization or cardiovascular mortality in high-risk patients with heart failure and reduced ejection fraction: a randomized clinical trial. JAMA 2017; 318(8):713–720. doi:10.1001/jama.2017.10565
- Troughton RW, Frampton CM, Brunner-La Rocca HP, et al. Effect of B-type natriuretic peptide-guided treatment of chronic heart failure on total mortality and hospitalization: an individual patient meta-analysis. Eur Heart J 2014; 35(23):1559–1567. doi:10.1093/eurheartj/ehu090
- van Vliet AA, Donker AJ, Nauta JJ, Verheugt FW. Spironolactone in congestive heart failure refractory to high-dose loop diuretic and low-dose angiotensin-converting enzyme inhibitor. Am J Cardiol 1993; 71(3):21A–28A. pmid:8422000
- Butler J, Anstrom KJ, Felker GM, et al; National Heart Lung and Blood Institute Heart Failure Clinical Research Network. Efficacy and safety of spironolactone in acute heart failure. The ATHENA-HF randomized clinical trial. JAMA Cardiol 2017; 2(9):950–958. doi:10.1001/jamacardio.2017.2198
- McMurray JJ, Packer M, Desai AS, et al; PARADIGM-HF Investigators and Committees. Angiotensin-neprilysin inhibition versus enalapril in heart failure. N Engl J Med 2014; 371(11):993–1004. doi:10.1056/NEJMoa1409077
- ClinicalTrials.gov. ComParIson Of Sacubitril/valsartaN Versus Enalapril on Effect on NTpRo-BNP in patients stabilized from an acute Heart Failure episode (PIONEER-HF). https://clinicaltrials.gov/ct2/show/NCT02554890. Accessed January 17, 2019.
- Swedberg K, Komajda M, Böhm M, et al; SHIFT Investigators. Ivabradine and outcomes in chronic heart failure (SHIFT): a randomised placebo-controlled study. Lancet 2010; 376(9744):875–885. doi:10.1016/S0140-6736(10)61198-1
- Hidalgo FJ, Anguita M, Castillo JC, et al. Effect of early treatment with ivabradine combined with beta-blockers versus beta-blockers alone in patients hospitalised with heart failure and reduced left ventricular ejection fraction (ETHIC-AHF): a randomised study. Int J Cardiol 2016; 217:7–11. doi:10.1016/j.ijcard.2016.04.136
- ClinicalTrials.gov. Predischarge Initiation of Ivabradine in the Management of Heart Failure (PRIME-HF). https://clinicaltrials.gov/ct2/show/NCT02827500. Accessed January 17, 2019.
- Anker SD, Kirwan BA, van Veldhuisen DJ, et al. Effects of ferric carboxymaltose on hospitalisations and mortality rates in iron-deficient heart failure patients: an individual patient data meta-analysis. Eur J Heart Fail 2018; 20(1):125–133. doi:10.1002/ejhf.823
- ClinicalTrials.gov. Intravenous Iron in Patients With Systolic Heart Failure and Iron Deficiency to Improve Morbidity and Mortality (FAIR-HF2). https://clinicaltrials.gov/ct2/show/NCT03036462. Accessed January 17, 2019.
- ClinicalTrials.gov. Study to Compare Ferric Carboxymaltose With Placebo in Patients With Acute Heart Failure and Iron Deficiency (AFFIRM-AHF). https://clinicaltrials.gov/ct2/show/record/NCT02937454. Accessed January 17, 2019.
- ClinicalTrials.gov. Randomized Placebo-controlled Trial of Ferric Carboxymaltose as Treatment for Heart Failure With Iron Deficiency (HEART-FID). https://clinicaltrials.gov/ct2/show/NCT03037931. Accessed January 17, 2019.
- ClinicalTrials.gov. Intravenous Iron Treatment in Patients With Heart Failure and Iron Deficiency (IRONMAN). https://clinicaltrials.gov/ct2/show/NCT02642562. Accessed January 17, 2019.
In 2017, the American College of Cardiology (ACC), American Heart Association (AHA), and Heart Failure Society of America (HFSA) jointly released a focused update1 of the 2013 ACC/AHA guideline for managing heart failure.2 This is the second focused update of the 2013 guidelines; the first update,3 in 2016, covered 2 new drugs (sacubitril-valsartan and ivabradine) for chronic stage C heart failure with reduced ejection fraction (HFrEF).
Rather than focus on new medication classes, this second update provides recommendations regarding:
- Preventing the progression to left ventricular dysfunction or heart failure in patients at high risk (stage A) through screening with B-type natriuretic peptide (BNP) and aiming for more aggressive blood pressure control
- Inpatient biomarker use
- Medications in heart failure with preserved ejection fraction (HFpEF, or diastolic heart failure)
- Blood pressure targets in stage C heart failure
- Managing important comorbidities such as iron deficiency and sleep-disordered breathing to decrease morbidity, improve functional capacity, and enhance quality of life.
These guidelines and the data that underlie them are explored below. We also discuss potential applications to the management of hospitalization for acute decompensated heart failure (ADHF).
COMMON, COSTLY, AND DEBILITATING
Heart failure—defined by the ACC/AHA as the complex clinical syndrome that results from any structural or functional impairment of ventricular filling or ejection of blood—remains one of the most common, costly, and debilitating diseases in the United States.2 Based on National Health and Nutrition Examination Survey data from 2011 to 2014, an estimated 6.5 million US adults have it, with projections of more than 8 million by 2030.4,5 More than 960,000 new cases are thought to occur annually, with a lifetime risk of developing it of roughly 20% to 45%.6
Despite ever-growing familiarity and some significant strides in management, the death rate in this syndrome is substantial. After admissions for heart failure (which number 1 million per year), the mortality rate is roughly 10% at 1 year and 40% at 5 years.6 Also staggering are the associated costs, with $30.7 billion attributed to heart failure in 2012 and a projected $69.7 billion annually by 2030.5 Thus, we must direct efforts not only to treatment, but also to prevention.
Preventive efforts would target patients with ACC/AHA stage A heart failure—those at high risk for developing but currently without evidence of structural heart disease or heart failure symptoms (Table 1).7 This group may represent up to one-third of the US adult population, or 75 million people, when including the well-recognized risk factors of coronary artery disease, hypertension, diabetes mellitus, and chronic kidney disease in those without left ventricular dysfunction or heart failure.8
BIOMARKERS FOR PREVENTION
Past ACC/AHA heart failure guidelines2 have included recommendations on the use of biomarkers to aid in diagnosis and prognosis and, to a lesser degree, to guide treatment of heart failure. Largely based on 2 trials (see below), the 2017 guidelines go further, issuing a recommendation on the use of natriuretic peptide biomarkers in a screening strategy to prompt early intervention and prevent the progression to clinical heart failure in high-risk patients (stage A heart failure).
The PONTIAC trial
The NT-proBNP Selected Prevention of Cardiac Events in a Population of Diabetic Patients Without a History of Cardiac Disease (PONTIAC) trial9 randomized 300 outpatients with type 2 diabetes mellitus and an elevated N-terminal proBNP (NT-proBNP) level (> 125 pg/mL) to standard medical care vs standard care plus intensive up-titration of renin-angiotensin system antagonists and beta-blockers in a cardiac clinic over 2 years.
Earlier studies10 had shown NT-proBNP levels to have predictive value for cardiac events in diabetic patients, while the neurohormonal treatments were thought to have an established record of preventing primary and secondary cardiovascular events. In PONTIAC, a significant reduction was seen in the primary end point of hospitalization or death due to cardiac disease (hazard ratio [HR] 0.351, P = .044), as well as in the secondary end point of hospitalization due to heart failure (P < .05), in the aggressive-intervention group. These results laid the foundation for the larger St. Vincent’s Screening to Prevent Heart Failure (STOP-HF) trial.11
The STOP-HF trial
The STOP-HF trial randomized 1,235 outpatients who were at high risk but without left ventricular dysfunction or heart failure symptoms (stage A) to annual screening alone vs annual screening plus BNP testing, in which a BNP level higher than 50 pg/mL triggered echocardiography and evaluation by a cardiologist who would then assist with medications.11
Eligible patients were over age 40 and had 1 or more of the following risk factors:
- Diabetes mellitus
- Hypertension
- Hypercholesterolemia
- Obesity (body mass index > 30 kg/m2)
- Vascular disease (coronary, cerebral, or peripheral arterial disease)
- Arrhythmia requiring treatment
- Moderate to severe valvular disease.
After a mean follow-up of 4.3 years, the primary end point, ie, asymptomatic left ventricular dysfunction with or without newly diagnosed heart failure, was found in 9.7% of the control group and in only 5.9% of the intervention group with BNP screening, a 42% relative risk reduction (P = .013).
Similarly, the incidence of secondary end points of emergency hospitalization for a cardiovascular event (arrhythmia, transient ischemic attack, stroke, myocardial infarction, peripheral or pulmonary thrombosis or embolization, or heart failure) was also lower at 45.2 vs 24.4 per 1,000 patient-years, a 46% relative risk reduction.
An important difference in medications between the 2 groups was an increase in subsequently prescribed renin-angiotensin-aldosterone system therapy, mainly consisting of angiotensin II receptor blockers (ARBs), in those with elevated BNP in the intervention group. Notably, blood pressure was about the same in the 2 groups.11
Although these findings are encouraging, larger studies are needed, as the lack of blinding, low event rates, and small absolute risk reduction make the results difficult to generalize.
New or modified recommendations for screening
Employing this novel prevention strategy in the extremely large number of patients with stage A heart failure, thought to be up to one-third of the US adult population, may serve as a way to best direct and utilize limited medical resources.8
BIOMARKERS FOR PROGNOSIS OR ADDED RISK STRATIFICATION
The 2013 guidelines2 recognized that a significant body of work had accumulated showing that natriuretic peptide levels can predict outcomes in both chronic and acute heart failure. Thus, in both conditions, the guidelines contained separate class Ia recommendations to obtain a natriuretic peptide level, troponin level, or both to establish prognosis or disease severity.
The 2017 update1 underscores the importance of timing in measuring natriuretic peptide levels during admission for ADHF, with emphasis on obtaining them at admission and at discharge for acute and postdischarge prognosis. The completely new class IIa recommendation to obtain a predischarge natriuretic peptide level for postdischarge prognosis was based on a number of observational studies, some of which we explore below.
The ELAN-HF meta-analysis
The European Collaboration on Acute Decompensated Heart Failure (ELAN-HF)12 performed a meta-analysis to develop a discharge prognostication score for ADHF that included both absolute level and percent change in natriuretic peptide levels at the time of discharge.
Using data from 7 prospective cohorts totaling 1,301 patients, the authors found that incorporation of these values into a subsequently validated risk model led to significant improvements in the ability to predict the end points of all-cause mortality and the combined end point of all-cause mortality or first readmission for a cardiovascular reason within 180 days.
The OPTIMIZE-HF retrospective analysis
Data from the Organized Program to Initiate Lifesaving Treatment in Hospitalized Patients With Heart Failure (OPTIMIZE-HF) were retrospectively analyzed13 to determine whether postdischarge outcomes were best predicted by natriuretic peptide levels at admission or discharge or by the relative change in natriuretic peptide level. More than 7,000 patients age 65 or older, in 220 hospitals, were included, and Cox prediction models were compared using clinical variables alone or in combination with the natriuretic peptide levels.
The model that included the discharge natriuretic peptide level was found to be the most predictive, with a c-index of 0.693 for predicting mortality and a c-index of 0.606 for mortality or rehospitalization at 1 year.
New or modified recommendations on biomarkers for prognosis
The 2017 update1 modified the earlier recommendation to obtain a natriuretic peptide or troponin level or both at admission for ADHF to establish prognosis. This now has a class Ia recommendation, emphasizing that such levels be obtained on admission. In addition, a new class IIa recommendation is made to obtain a predischarge natriuretic peptide level for postdischarge prognosis. The former class Ia recommendation to obtain a natriuretic peptide level in chronic heart failure to establish prognosis or disease severity remains unchanged.
Also worth noting is what the 2017 update does not recommend in regard to obtaining biomarker levels. It emphasizes that many patients, particularly those with advanced (stage D) heart failure, have a poor prognosis that is well established with or without biomarker levels. Additionally, there are many cardiac and noncardiac causes of natriuretic peptide elevation; thus, clinical judgment remains paramount.
The 2017 update1 also cautions against setting targets of percent change in or absolute levels of natriuretic peptide at discharge despite observational and retrospective studies demonstrating better outcomes when levels are reduced, as treating for any specific target has never been studied in a large prospective study. Thus, doing so may result in unintended harm. Rather, clinical judgment and optimization of guideline-directed management and therapy are encouraged (Table 2).
PHARMACOLOGIC TREATMENT FOR STAGE C HFpEF
Although the 2013 guidelines2 contain many class I recommendations for various medications in chronic HFrEF, not a single such recommendation is found for chronic HFpEF. A review by Okwuosa et al7 covered HFrEF, including the most recent additions on which the 2016 update was based, sacubitril-valsartan and ivabradine. The 2016 update was similarly devoid of recommendations regarding specific medications in HFpEF, leaving only the 2013 class IIb recommendation to consider using an ARB to decrease hospitalizations in HFpEF.
Evidence behind this recommendation came from the Candesartan in Heart Failure Assessment of Reduction in Mortality and Morbidity program’s randomized controlled trial in 3,025 patients with New York Heart Association (NYHA) class II to IV heart failure and left ventricular ejection fraction over 40%, who were treated with candesartan or placebo.14 Over a median follow-up of 36.6 months, there was no significant difference in the primary composite outcome of cardiovascular death or admission for heart failure, but significantly fewer patients in the candesartan arm were admitted (230 vs 270, P = .017). Thus the recommendation.
Although this finding was encouraging, it was clear that no blockbuster drug for HFpEF had been identified. Considering that roughly half of all heart failure patients have preserved ejection fraction, the discovery of such a drug for HFpEF would be met with much excitement.15 Subsequently, other medication classes have been evaluated in the hope of benefit, allowing the 2017 update to provide specific recommendations for aldosterone antagonists, nitrates, and phosphodiesterase-5 inhibitors in HFpEF.
ALDOSTERONE ANTAGONISTS FOR HFpEF
Mineralocorticoid receptor antagonists had previously been shown to significantly reduce morbidity and mortality rates in patients with HFrEF.16 In addition to aldosterone’s effects on sodium retention and many other pathophysiologic mechanisms relating to heart failure, this hormone is also known to play a role in promoting myocardial fibrosis.17 Accordingly, some have wondered whether aldosterone antagonists could improve diastolic dysfunction, and perhaps outcomes, in HFpEF.
The Aldo-DHF trial
The Aldosterone Receptor Blockade in Diastolic Heart Failure (Aldo-DHF) trial investigated whether the aldosterone antagonist spironolactone would improve diastolic function or maximal exercise capacity in chronic HFpEF.18 It randomized 422 ambulatory patients with NYHA stage II or III heart failure, preserved left ventricular ejection fraction (≥ 50%), and echocardiographic evidence of diastolic dysfunction to receive spironolactone 25 mg daily or placebo.
Although no significant difference was seen in maximal exercise capacity, follow-up over 1 year nevertheless showed significant improvement in echocardiographic diastolic dysfunction (E/e') and perhaps reverse remodeling (decreased left ventricular mass index). These improvements spurred larger trials powered to detect whether clinical outcomes could also be improved.
The TOPCAT trial
The Treatment of Preserved Cardiac Function Heart Failure With an Aldosterone Antagonist (TOPCAT) trial19 was a large, multicenter, international, double-blind, placebo-controlled trial that investigated whether spironolactone could improve clinical outcomes in HFpEF. It randomized 3,445 patients with symptomatic heart failure and left ventricular ejection fraction of 45% or more to spironolactone 15 to 45 mg daily or placebo.
The effect on a composite primary outcome of death from cardiovascular cause, aborted cardiac arrest, or hospitalization for heart failure was evaluated over a mean follow-up of 3.3 years, with only a small (HR 0.89), nonclinically significant reduction evident. Those in the spironolactone group did have a significantly lower incidence of hospitalization for heart failure (12.0% vs 14.2%, P = .04).
Although the results were disappointing in this essentially negative trial, significant regional variations evident on post hoc analysis prompted further investigation and much controversy since the trial’s publication in 2014.
Participants came in roughly equal proportions from the Americas (United States, Canada, Brazil, and Argentina—51%) and from Russia and Georgia (49%), but outcomes between the two groups were markedly different. Concern was first raised when immediate review discovered a 4-fold lower rate of the primary outcome in the placebo groups from Russia and Georgia (8.4%), a rate in fact similar to that in patients without heart failure.19 This led to further exploration that identified other red flags that called into question the data integrity from the non-American sites.20
Not only did patients receiving spironolactone in Russia and Georgia not experience the reduction in clinical outcomes seen in their American counterparts, they also did not manifest the expected elevations in potassium and creatinine, and spironolactone metabolites were undetectable in almost one-third of patients.21
These findings prompted a post hoc analysis that included only the 51% (1,767 patients) of the study population coming from the Americas; in this subgroup, treatment with spironolactone was associated with a statistically significant 18% relative risk reduction in the primary composite outcome, a 26% reduction in cardiovascular mortality, and an 18% reduction in hospitalization for heart failure.20
New or modified recommendations on aldosterone receptor antagonists
Nitrates and phosphodiesterase-5 inhibitors
Earlier studies indicated that long-acting nitrates are prescribed in 15% to 50% of patients with HFpEF, perhaps based on extrapolation from studies in HFrEF suggesting that they might improve exercise intolerance.22 Some have speculated that the hemodynamic effects of nitrates, such as decreasing pulmonary congestion, might improve exercise intolerance in those with the stiff ventricles of HFpEF as well, prompting further study.
The NEAT-HFpEF trial
The Nitrate’s Effect on Activity Tolerance in Heart Failure With Preserved Ejection Fraction (NEAT-HFpEF) trial22 investigated whether extended-release isosorbide mononitrate would increase daily activity levels in patients with HFpEF. This double-blind, crossover study randomized 110 patients with HFpEF (ejection fraction ≥ 50%) and persistent dyspnea to escalating doses of isosorbide mononitrate or placebo over 6 weeks, then to the other arm for another 6 weeks. Daily activity levels during the 120-mg phase were measured with a continuously worn accelerometer.
No beneficial effect of nitrates was evident, with a nonsignificant trend towards decreased activity levels, a significant decrease in hours of activity per day (–0.30 hours, P = .02), and no change in the other secondary end points such as quality-of-life score, 6-minute walk distance, or natriuretic peptide level.
Suggested explanations for these negative findings include the possibility of rapid dose escalation leading to increased subtle side effects (headache, dizziness, fatigue) that, in turn, decreased activity. Additionally, given the imprecise diagnostic criteria for HFpEF, difficulties with patient selection may have led to inclusion of a large number of patients without elevated left-sided filling pressures.23
The RELAX trial
The Phosphodiesterase-5 Inhibition to Improve Clinical Status and Exercise Capacity in Heart Failure With Preserved Ejection Fraction (RELAX) trial24 investigated whether the phosphodiesterase-5 inhibitor sildenafil would improve exercise capacity in HFpEF. Improvements in both exercise capacity and clinical outcomes had already been seen in earlier trials in patients with pulmonary hypertension, as well as in those with HFrEF.25 A smaller study in HFpEF patients with pulmonary hypertension was also encouraging.26
Thus, it was disappointing that, after randomizing 216 outpatients with HFpEF to sildenafil or placebo for 24 weeks, no benefit was seen in the primary end point of change in peak oxygen consumption or in secondary end points of change in 6-minute walk distance or composite clinical score. Unlike in NEAT-HFpEF, patients here were required to have elevated natriuretic peptide levels or elevated invasively measured filling pressures.
The study authors speculated that pulmonary arterial hypertension and right ventricular systolic failure might need to be significant for patients with HFpEF to benefit from phosphodiesterase-5 inhibitors, with their known effects of dilation of pulmonary vasculature and increasing contractility of the right ventricle.24
New or modified recommendations on nitrates or phosphodiesterase-5 drugs
Given these disappointing results, the 2017 update provides a class III (no benefit) recommendation against the routine use of nitrates or phosphodiesterase-5 inhibitors to improve exercise tolerance or quality of life in HFpEF, citing them as ineffective (Table 3).1
IRON DEFICIENCY IN HEART FAILURE
Not only is iron deficiency present in roughly 50% of patients with symptomatic heart failure (stage C and D HFrEF),27 it is also associated with increased heart failure symptoms such as fatigue and exercise intolerance,28 reduced functional capacity, decreased quality of life, and increased mortality.
Notably, this association exists regardless of the hemoglobin level.29 In fact, even in those without heart failure or anemia, iron deficiency alone results in worsened aerobic performance, exercise intolerance, and increased fatigue.30 Conversely, improvement in symptoms, exercise tolerance, and cognition have been shown with repletion of iron stores in such patients.31
At the time of the 2013 guidelines, only a single large trial of intravenous iron in HFrEF and iron deficiency had been carried out (see below), and although the results were promising, it was felt that the evidence base on which to make recommendations was inadequate. Thus, recommendations were deferred until more data could be obtained.
Of note, in all the trials discussed below, iron deficiency was diagnosed in the setting of heart failure as ferritin less than 100 mg/mL (absolute iron deficiency) or as ferritin 100 to 300 mg/mL with transferrin saturation less than 20% (relative deficiency).32
The CONFIRM-HF trial
As in the Ferinject Assessment in Patients With Iron Deficiency and Chronic Heart Failure (FAIR-HF) trial,33 the subsequent Ferric Carboxymaltose Evaluation on Performance in Patients With Iron Deficiency in Combination With Chronic Heart Failure (CONFIRM-HF) trial34 involved the intravenous infusion of iron (ferric carboxymaltose) in outpatients with symptomatic HFrEF and iron deficiency. It showed that benefits remained evident with a more objective primary end point (change in 6-minute walk test distance at 24 weeks), and that such benefits were sustained, as seen in numerous secondary end points related to functional capacity at 52 weeks. Benefits in CONFIRM-HF were evident independently from anemia, specifically whether hemoglobin was under or over 12 g/dL.
Although these results were promising, it remained unclear whether such improvements could be obtained with a much easier to administer, more readily available, and less expensive oral iron formulation.
The IRONOUT-HF trial
The Iron Repletion Effects on Oxygen Uptake in Heart Failure (IRONOUT-HF) trial35 investigated whether oral, rather than intravenous, iron supplementation could improve peak exercise capacity in patients with HFrEF and iron deficiency. This double-blind, placebo-controlled trial randomized 225 patients with NYHA class II to IV HFrEF and iron deficiency to treatment with oral iron polysaccharide (150 mg twice daily) or placebo for 16 weeks.
Contrary to the supportive findings above, no significant change was seen in the primary end point of change in peak oxygen uptake or in any of the secondary end points (change in 6-minute walk, quality of life). Also, despite a 15-fold increase in the amount of iron administered in oral form compared with intravenously, little change was evident in the indices of iron stores over the course of the study, with only a 3% increase in transferrin saturation and an 11 ng/mL increase in ferritin. The intravenous trials resulted in a 4-fold greater increase in transferrin saturation and a 20-fold greater increase in ferritin.36
What keeps heart failure patients from absorbing oral iron? It is unclear why oral iron administration in HFrEF, such as in IRONOUT-HF, seems to be so ineffective, but hepcidin—a protein hormone made by the liver that shuts down intestinal iron absorption and iron release from macrophages—may play a central role.37 When iron stores are adequate, hepcidin is upregulated to prevent iron overload. However, hepcidin is also increased in inflammatory states, and chronic heart failure is often associated with inflammation.
With this in mind, the IRONOUT-HF investigators measured baseline hepcidin levels at the beginning and at the end of the 16 weeks and found that high baseline hepcidin levels predicted poorer response to oral iron. Other inflammatory mediators, such as interleukin 6, may also play a role.38,39 Unlike oral iron formulations such as iron polysaccharide, intravenous iron (ferric carboxymaltose) bypasses these regulatory mechanisms, which may partly explain its much more significant effect on the indices of iron stores and outcomes.
New or modified recommendations on iron
The 2017 update1 makes recommendations regarding iron deficiency and anemia in heart failure for the first time.
A class IIb recommendation states that it might be reasonable to treat NYHA class II and III heart failure patients with iron deficiency with intravenous iron to improve functional status and quality of life. A strong recommendation has been deferred until more is known about morbidity and mortality effects from adequately powered trials, some of which are under way and explored further below.
The 2017 update also withholds any recommendations regarding oral iron supplementation in heart failure, citing an uncertain evidence base. Certainly, the subsequent IRONOUT-HF trial does not lend enthusiasm for this approach.
Lastly, given the lack of benefit coupled with the increased risk of thromboembolic events evident in a trial of darbepoetin alfa vs placebo in non-iron deficiency-related anemia in HFrEF,40,41 the 2017 update provides a class III (no benefit) recommendation against using erythropoietin-stimulating agents in heart failure and anemia.
HYPERTENSION IN HEART FAILURE
The 2013 guidelines for the management of heart failure simply provided a class I recommendation to control hypertension and lipid disorders in accordance with contemporary guidelines to lower the risk of heart failure.1
SPRINT
The Systolic Blood Pressure Intervention Trial (SPRINT)42 sought to determine whether a lower systolic blood pressure target (120 vs 140 mm Hg) would reduce clinical events in patients at high risk for cardiovascular events but without diabetes mellitus. Patients at high risk were defined as over age 75, or with known vascular disease, chronic kidney disease, or a Framingham Risk Score higher than 15%. This multicenter, open-label controlled trial randomized 9,361 patients to intensive treatment (goal systolic blood pressure < 120 mm Hg) or standard treatment (goal systolic blood pressure < 140 mm Hg).
SPRINT was stopped early at a median follow-up of 3.26 years when a 25% relative risk reduction in the primary composite outcome of myocardial infarction, other acute coronary syndromes, stroke, heart failure, or death from cardiovascular causes became evident in the intensive-treatment group (1.65% vs 2.19% per year, HR 0.75, P < .0001).
All-cause mortality was also lower in the intensive-treatment group (HR 0.73, P = .003), while the incidence of serious adverse events (hypotension, syncope, electrolyte abnormalities, acute kidney injury, and noninjurious falls) was only slightly higher (38.3% vs 37.1%, P = .25). Most pertinent, a significant 38% relative risk reduction in heart failure and a 43% relative risk reduction in cardiovascular events were also evident.
Of note, blood pressure measurements were taken as the average of 3 measurements obtained by an automated cuff taken after the patient had been sitting quietly alone in a room for 5 minutes.
New or modified recommendations on hypertension in heart failure
Given the impressive 25% relative risk reduction in myocardial infarction, other acute coronary syndromes, stroke, heart failure, or death from cardiovascular causes in SPRINT,42 the 2017 update1 incorporated the intensive targets of SPRINT into its recommendations. However, to compensate for what are expected to be higher blood pressures obtained in real-world clinical practice as opposed to the near-perfect conditions used in SPRINT, a slightly higher blood pressure goal of less than 130/80 mm Hg was set.
Although not specifically included in SPRINT, given the lack of trial data on specific blood pressure targets in HFrEF and the decreased cardiovascular events noted above, a class I (level of evidence C, expert opinion) recommendation to target a goal systolic blood pressure less than 130 mm Hg in stage C HFrEF with hypertension is also given. Standard guideline-directed medications in the treatment of HFrEF are to be used (Table 4).
Similarly, a new class I (level of evidence C, expert opinion) recommendation is given for hypertension in HFpEF to target a systolic blood pressure of less than 130 mm Hg, with special mention to first manage any element of volume overload with diuretics. Other than avoiding nitrates (unless used for angina) and phosphodiesterase inhibitors, it is noted that few data exist to guide the choice of antihypertensive further, although perhaps renin-angiotensin-aldosterone system inhibition, especially aldosterone antagonists, may be considered. These recommendations are fully in line with the 2017 ACC/AHA high blood pressure clinical practice guidelines,43 ie, that renin-angiotensin-aldosterone system inhibition with an angiotensin-converting enzyme (ACE) inhibitor or ARB and especially mineralocorticoid receptor antagonists would be the preferred choice (Table 4).
SLEEP-DISORDERED BREATHING IN HEART FAILURE
Sleep-disordered breathing, either obstructive sleep apnea (OSA) or central sleep apnea, is quite commonly associated with symptomatic HFrEF.44 Whereas OSA is found in roughly 18% and central sleep apnea in 1% of the general population, sleep-disordered breathing is found in nearly 60% of patients with HFrEF, with some studies showing a nearly equal proportion of OSA and central sleep apnea.45 A similar prevalence is seen in HFpEF, although with a much higher proportion of OSA.46 Central sleep apnea tends to be a marker of more severe heart failure, as it is strongly associated with severe cardiac systolic dysfunction and worse functional capacity.47
Not surprisingly, the underlying mechanism of central sleep apnea is quite different from that of OSA. Whereas OSA predominantly occurs because of repeated obstruction of the pharynx due to nocturnal pharyngeal muscle relaxation, no such airway patency issues or strained breathing patterns exist in central sleep apnea. Central sleep apnea, which can manifest as Cheyne-Stokes respirations, is thought to occur due to an abnormal ventilatory control system with complex pathophysiology such as altered sensitivity of central chemoreceptors to carbon dioxide, interplay of pulmonary congestion, subsequent hyperventilation, and prolonged circulation times due to reduced cardiac output.48
What the two types of sleep-disordered breathing have in common is an association with negative health outcomes. Both appear to induce inflammation and sympathetic nervous system activity via oxidative stress from intermittent nocturnal hypoxemia and hypercapnea.49 OSA was already known to be associated with significant morbidity and mortality rates in the general population,50 and central sleep apnea had been identified as an independent predictor of mortality in HFrEF.51
At the time of the 2013 guidelines, only small or observational studies with limited results had been done evaluating treatment effects of continuous positive airway pressure therapy (CPAP) on OSA and central sleep apnea. Given the relative paucity of data, only a single class IIa recommendation stating that CPAP could be beneficial to increase left ventricular ejection fraction and functional status in concomitant sleep apnea and heart failure was given in 2013. However, many larger trials were under way,52–59 some with surprising results such as a significant increase in cardiovascular and all-cause mortality (Table 5).54
New or modified recommendations on sleep-disordered breathing
Given the common association with heart failure (60%)45 and the marked variation in response to treatment, including potential for harm with adaptive servo-ventilation and central sleep apnea, a class IIa recommendation is made stating that it is reasonable to obtain a formal sleep study in any patient with symptomatic (NYHA class II–IV) heart failure.1
Due to the potential for harm with adaptive servo-ventilation in patients with central sleep apnea and NYHA class II to IV HFrEF, a class III (harm) recommendation is made against its use.
Largely based on the results of the Sleep Apnea Cardiovascular Endpoints (SAVE) trial,56 a class IIb, level of evidence B-R (moderate, based on randomized trials) recommendation is given, stating that the use of CPAP in those with OSA and known cardiovascular disease may be reasonable to improve sleep quality and reduce daytime sleepiness.
POTENTIAL APPLICATIONS IN ACUTE DECOMPENSATED HEART FAILURE
Although the 2017 update1 is directed mostly toward managing chronic heart failure, it is worth considering how it might apply to the management of ADHF.
SHOULD WE USE BIOMARFER TARGETS TO GUIDE THERAPY IN ADHF?
The 2017 update1 does offer direct recommendations regarding the use of biomarker levels during admissions for ADHF. Mainly, they emphasize that the admission biomarker levels provide valuable information regarding acute prognosis and risk stratification (class I recommendation), while natriuretic peptide levels just before discharge provide the same for the postdischarge timeframe (class IIa recommendation).
The update also explicitly cautions against using a natriuretic peptide level-guided treatment strategy, such as setting targets for predischarge absolute level or percent change in level of natriuretic peptides during admissions for ADHF. Although observational and retrospective studies have shown better outcomes when levels are reduced at discharge, treating for any specific inpatient target has never been tested in any large, prospective study; thus, doing so could result in unintended harm.
So what do we know?
McQuade et al systematic review
McQuade et al57 performed a systematic review of more than 40 ADHF trials, which showed that, indeed, patients who achieved a target absolute natriuretic peptide level (BNP ≤ 250 pg/mL) or percent reduction (≥ 30%) at time of discharge had significantly improved outcomes such as reduced postdischarge all-cause mortality and rehospitalization rates. However, these were mostly prospective cohort studies that did not use any type of natriuretic peptide level-guided treatment protocol, leaving it unclear whether such a strategy could positively influence outcomes.
For this reason, both McQuade et al57 and, in an accompanying editorial, Felker et al58 called for properly designed, randomized controlled trials to investigate such a strategy. Felker noted that only 2 such phase II trials in ADHF have been completed,59,60 with unconvincing results.
PRIMA II
The Multicenter, Randomized Clinical Trial to Study the Impact of In-hospital Guidance for Acute Decompensated Heart Failure Treatment by a Predefined NT-ProBNP Target on the Reduction of Readmission and Mortality Rates (PRIMA II)60 randomized patients to natriuretic peptide level-guided treatment or standard care during admission for ADHF.
Many participants (60%) reached the predetermined target of 30% reduction in natriuretic peptide levels at the time of clinical stabilization and randomization; 405 patients were randomized. Patients in the natriuretic peptide level-guided treatment group underwent a prespecified treatment algorithm, with repeat natriuretic peptide levels measured again after the protocol.
Natriuretic peptide-guided therapy failed to show any significant benefit in any clinical outcomes, including the primary composite end point of mortality or heart failure readmissions at 180 days (36% vs 38%, HR 0.99, 95% confidence interval 0.72–1.36). Consistent with the review by McQuade et al,57 achieving the 30% reduction in natriuretic peptide at discharge, in either arm, was associated with a better prognosis, with significantly lower mortality and readmission rates at 180 days (HR 0.39 for rehospitalization or death, 95% confidence interval 0.27–0.55).
As in the observational studies, those who achieved the target natriuretic peptide level at the time of discharge had a better prognosis than those who did not, but neither study showed an improvement in clinical outcomes using a natriuretic peptide level-targeting treatment strategy.
No larger randomized controlled trial results are available for guided therapy in ADHF. However, additional insight may be gained from a subsequent trial61 that evaluated biomarker-guided titration of guideline-directed medical therapy in outpatients with chronic HFrEF.
The GUIDE-IT trial
That trial, the Guiding Evidence Based Therapy Using Biomarker Intensified Treatment in Heart Failure (GUIDE-IT)61 trial, was a large multicenter attempt to determine whether a natriuretic peptide-guided treatment strategy was more effective than standard care in the management of 894 high-risk outpatients with chronic HFrEF. Earlier, promising results had been obtained in a meta-analysis62 of more than 11 similar trials in 2,000 outpatients, with a decreased mortality rate (HR 0.62) seen in the biomarker-guided arm. However, the results had not been definitive due to being underpowered.62
Unfortunately, the results of GUIDE-IT were disappointing, with no significant difference in either the combined primary end point of mortality or hospitalization for heart failure, or the secondary end points evident at 15 months, prompting early termination for futility.61 Among other factors, the study authors postulated that this may have partly resulted from a patient population with more severe heart failure and resultant azotemia, limiting the ability to titrate neurohormonal medications to the desired dosage.
The question of whether patients who cannot achieve such biomarker targets need more intensive therapy or whether their heart failure is too severe to respond adequately echoes the question often raised in discussions of inpatient biomarker-guided therapy.58 Thus, only limited insight is gained, and it remains unclear whether a natriuretic peptide-guided treatment strategy can improve outpatient or inpatient outcomes. Until this is clarified, clinical judgment and optimization of guideline-directed management and therapy should remain the bedrock of treatment.
SHOULD ALDOSTERONE ANTAGONISTS BE USED IN ACUTE HFpEF?
Given the encouraging results in chronic HFpEF from post hoc analyses of TOPCAT, are there any additional recent data suggesting a role for aldosterone antagonists such as spironolactone in acute HFpEF?
The ATHENA-HF trial
The Aldosterone Targeted Neurohormonal Combined With Natriuresis Therapy in Heart Failure (ATHENA-HF) trial63 compared treatment with high-dose spironolactone (100 mg) for 96 hours vs usual care in 360 patients with ADHF. The patient population included those with HFrEF and HFpEF, and usual care included low-dose spironolactone (12.5–25 mg) in roughly 15% of patients. High-dose mineralocorticoid receptor antagonists have been shown to overcome diuretic resistance, improve pulmonary vascular congestion, and partially combat the adverse neurohormonal activation seen in ADHF.
Unfortunately, the trial was completely neutral in regard to the primary end point of reduction in natriuretic peptide levels as well as to the secondary end points of 30-day mortality rate, heart failure readmission, clinical congestion scores, urine output, and change in weight. No suggestion of additional benefit was seen in subgroup analysis of patients with acute HFpEF (ejection fraction > 45%), which yielded similar results.63
Given these lackluster findings, routine use of high-dose spironolactone in ADHF is not recommended.64 However, the treatment was well tolerated, without significant adverse effects of hyperkalemia or kidney injury, leaving the door open as to whether it may have utility in selected patients with diuretic resistance.
Should ARNIs and ivabradine be started during ADHF admissions?
The first half of the focused update3 of the 2013 guidelines,2 reviewed by Okwuosa et al,7 provided recommendations for the use of sacubitril-valsartan, an angiotensin-neprilysin inhibitor (ARNI), and ivabradine, a selective sinoatrial node If channel inhibitor, in chronic HFrEF.
Sacubitril-valsartan was given a class I recommendation for use in patients with NYHA class II or III chronic HFrEF who tolerate an ACE inhibitor or an ARB. This recommendation was given largely based on the benefits in mortality and heart failure hospitalizations seen in PARADIGM-HF (the Prospective Comparison of ARNI With ACEI to Determine Impact on Global Mortality and Morbidity in Heart Failure)65 compared with enalapril (HR 0.80, 95% CI 0.73–0.87, P < .001).
There is currently no recommendation on initiation or use of ARNIs during admissions for ADHF, but a recent trial may lend some insight.66
THE PIONEER-HF trial
The Comparison of Sacubitril/Valsartan vs Enalapril on Effect on NT-proBNP in Patients Stabilized From an Acute Heart Failure Episode (PIONEER-HF) trial66 randomized patients admitted for acute HFrEF, once stabilized, to sacubitril-valsartan or enalapril. Encouragingly, the percentage change of natriuretic peptide levels from the time of inpatient initiation to 4 and 8 weeks thereafter, the primary efficacy end point, was 46.7% with sacubitril-valsartan versus 25.3% with enalapril alone (ratio of change 0.71, 95% CI 0.63–0.81, P < .001). Although not powered for such, a prespecified analysis of a composite of clinical outcomes was also favorable for sacubitril-valsartan, largely driven by a 44% decreased rate of rehospitalization. More definitive, and quite reassuring, was that no significant difference was seen in the key safety outcomes of worsening renal function, hyperkalemia, symptomatic hypotension, and angioedema. These results were also applicable to the one-third of study participants who had no former diagnosis of heart failure, the one-third identifying as African American, and the one-third who had not been taking an ACE inhibitor or ARB. These results, taken together with the notion that at study completion the patients become similar to those included in PARADIGM-HF, have led some to assert that PIONEER-HF has the potential to change clinical practice.
Ivabradine was given a class IIa recommendation for use in patients with NYHA class II or III chronic HFrEF with a resting heart rate of at least 70 bpm, in sinus rhythm, despite being on optimal medical therapy including a beta-blocker at a maximum tolerated dose.
This recommendation was largely based on SHIFT (Systolic Heart Failure Treatment With the If Inhibitor Ivabradine Trial), which randomized patients to ivabradine or placebo to evaluate the effects of isolated lowering of the heart rate on the composite primary outcome of cardiovascular death or hospitalization. A significant reduction was seen in the ivabradine arm (HR 0.82, 95% CI 0.75–0.90, P < .0001), mainly driven by decreased hospitalizations.67
Subsequently, a small unblinded single-center study was undertaken to evaluate the efficacy and safety of initiating ivabradine during admissions for ADHF.68
THE ETHIC-AHF trial
The Effect of Early Treatment With Ivabradine Combined With Beta-Blockers vs Beta-Blockers Alone in Patients Hospitalized With Heart Failure and Reduced Left Ventricular Ejection Fraction (ETHIC-AHF) trial68 sought to determine the safety and effectiveness of early coadministration of ivabradine with beta-blockers in patients with acute HFrEF.
This single-center, unblinded study randomized 71 patients to ivabradine and beta-blockade or beta-blockade alone upon clinical stabilization (24–48 hours) after admission for acute decompensated HFrEF.
The primary end point was heart rate at 28 days, with the ivabradine group showing a statistically significant decrease (64 vs 70 bpm, P = .01), which persisted at 4 months. There was no significant difference in the secondary end points of adverse drug effects or the composite of clinical event outcomes (all-cause mortality, admission for heart failure or cardiovascular cause), but a number of surrogate end points including left ventricular ejection fraction, BNP level, and NYHA functional class at 4 months showed mild improvement.
Although this study provided evidence that the coadministration of ivabradine and a beta-blocker is safe and was positive in regard to clinical outcomes, the significant limitations due to its size and study design (single-center, unblinded, 4-month follow-up) simply serve to support the pursuit of larger studies with more stringent design and longer follow-up in order to determine the clinical efficacy.
The PRIME-HF trial
The Predischarge Initiation of Ivabradine in the Management of Heart Failure (PRIME-HF) trial69 is a randomized, open-label, multicenter trial comparing standard care vs the initiation of ivabradine before discharge, but after clinical stabilization, during admissions for ADHF in patients with chronic HFrEF (left ventricular ejection fraction ≤ 35%). At subsequent outpatient visits, the dosage can be modified in the ivabradine group, or ivabradine can be initiated at the provider’s discretion in the usual-care group.
PRIME-HF is attempting to determine whether initiating ivabradine before discharge will result in more patients taking ivabradine at 180 days, its primary end point, as well as in changes in secondary end points including heart rate and patient-centered outcomes. The study is active, with reporting expected in 2019.
As these trials all come to completion, it will not be long before we have further guidance regarding the inpatient initiation of these new and exciting therapeutic agents.
SHOULD INTRAVENOUS IRON BE GIVEN DURING ADHF ADMISSIONS?
Given the high prevalence of iron deficiency in symptomatic HFrEF, its independent association with mortality, improvements in quality of life and functional capacity suggested by repleting with intravenous iron (in FAIR-HF and CONFIRM-HF), the seeming inefficacy of oral iron in IRONOUT, and the logistical challenges of intravenous administration during standard clinic visits, could giving intravenous iron soon be incorporated into admissions for ADHF?
Caution has been advised for several reasons. As discussed above, larger randomized controlled trials powered to detect more definitive clinical end points such as death and the rate of hospitalization are still needed before a stronger recommendation can be made for intravenous iron in HFrEF. Also, without such data, it seems unwise to add the considerable economic burden of routinely assessing for iron deficiency and providing intravenous iron during ADHF admissions to the already staggering costs of heart failure.
The effects seen on morbidity and mortality that become evident in these trials over the next 5 years will help determine future guidelines and whether intravenous iron is routinely administered in bridge clinics, during inpatient admissions for ADHF, or not at all in patients with HFrEF and iron deficiency.
INTERNISTS ARE KEY
Heart failure remains one of the most common, morbid, complex, and costly diseases in the United States, and its prevalence is expected only to increase.4,5 The 2017 update1 of the 2013 guideline2 for the management of heart failure provides recommendations aimed not only at management of heart failure, but also at its comorbidities and, for the first time ever, at its prevention.
Internists provide care for the majority of heart failure patients, as well as for their comorbidities, and are most often the first to come into contact with patients at high risk of developing heart failure. Thus, a thorough understanding of these guidelines and how to apply them to the management of acute decompensated heart failure is of critical importance.
- Yancy CW, Jessup M, Bozkurt B, et al. 2017 ACC/AHA/HFSA focused update of the 2013 ACCF/AHA Guideline for the Management of Heart Failure: a report of the American College of Cardiology/American Heart Association Task Force on Clinical Practice Guidelines and the Heart Failure Society of America. J Am Coll Cardiol 2017; 70(6):776–803. doi:10.1016/j.jacc.2017.04.025
- Yancy CW, Jessup M, Bozkurt B, et al; American College of Cardiology Foundation/American Heart Association Task Force on Practice Guidelines. 2013 ACCF/AHA guideline for the management of heart failure: a report of the American College of Cardiology Foundation/American Heart Association Task Force on Practice Guidelines. Circulation 2013; 128(16):e240–e327. doi:10.1161/CIR.0b013e31829e8776
- Yancy CW, Jessup M, Bozkurt B, et al. 2016 ACC/AHA/HFSA focused update on new pharmacological therapy for heart failure: an update of the 2013 ACCF/AHA Guideline for the Management of Heart Failure: a report of the American College of Cardiology/American Heart Association Task Force on Clinical Practice Guidelines and the Heart Failure Society of America. Circulation 2016; 134(13):e282–e293. doi:10.1161/CIR.0000000000000435
- Benjamin EJ, Blaha MJ, Chiuve SE, et al; American Heart Association Statistics Committee and Stroke Statistics Subcommittee. Heart disease and stroke statistics—2017 update: a report from the American Heart Association. Circulation 2017; 135(10):e146–e603. doi:10.1161/CIR.0000000000000485
- Heidenreich PA, Albert NM, Allen LA, et al; American Heart Association Advocacy Coordinating Committee; Council on Arteriosclerosis, Thrombosis and Vascular Biology; Council on Cardiovascular Radiology and Intervention; Council on Clinical Cardiology; Council on Epidemiology and Prevention; Stroke Council. Forecasting the impact of heart failure in the United States: a policy statement from the American Heart Association. Circ Heart Fail 2013; 6(3):606–619. doi:10.1161/HHF.0b013e318291329a
- Huffman MD, Berry JD, Ning H, et al. Lifetime risk for heart failure among white and black Americans: cardiovascular lifetime risk pooling project. J Am Coll Cardiol 2013; 61(14):1510–1517. doi:10.1016/j.jacc.2013.01.022
- Okwuosa IS, Princewill O, Nwabueze C, et al. The ABCs of managing systolic heart failure: past, present, and future. Cleve Clin J Med 2016; 83(10):753–765. doi:10.3949/ccjm.83a.16006
- Kovell LC, Juraschek SP, Russell SD. Stage A heart failure is not adequately recognized in US adults: analysis of the National Health and Nutrition Examination Surveys, 2007–2010. PLoS One 2015; 10(7):e0132228. doi:10.1371/journal.pone.0132228
- Huelsmann M, Neuhold S, Resl M, et al. PONTIAC (NT-proBNP selected prevention of cardiac events in a population of diabetic patients without a history of cardiac disease): a prospective randomized controlled trial. J Am Coll Cardiol 2013; 62(15):1365–1372. doi:10.1016/j.jacc.2013.05.069
- Clodi M, Resl M, Neuhold S, et al. A comparison of NT-proBNP and albuminuria for predicting cardiac events in patients with diabetes mellitus. Eur J Prev Cardiol 2012; 19(5):944–951. doi:10.1177/1741826711420015
- Ledwidge M, Gallagher J, Conlon C, et al. Natriuretic peptide-based screening and collaborative care for heart failure: the STOP-HF randomized trial. JAMA 2013; 310(1):66–74. doi:10.1001/jama.2013.7588
- Salah K, Kok WE, Eurlings LW, et al. A novel discharge risk model for patients hospitalised for acute decompensated heart failure incorporating N-terminal pro-B-type natriuretic peptide levels: a European coLlaboration on Acute decompeNsated Heart Failure: ELAN-HF Score. Heart 2014; 100(2):115–125. doi:10.1136/heartjnl-2013-303632
- Kociol RD, Horton JR, Fonarow GC, et al. Admission, discharge, or change in B-type natriuretic peptide and long-term outcomes: data from Organized Program to Initiate Lifesaving Treatment in Hospitalized Patients with Heart Failure (OPTIMIZE-HF) linked to Medicare claims. Circ Heart Fail 2011; 4(5):628–636. doi:10.1161/CIRCHEARTFAILURE.111.962290
- Yusuf S, Pfeffer MA, Swedberg K, et al; CHARM Investigators and Committees. Effects of candesartan in patients with chronic heart failure and preserved left-ventricular ejection fraction: the CHARM-Preserved Trial. Lancet 2003; 362(9386):777–781. doi:10.1016/S0140-6736(03)14285-7
- Owan TE, Hodge DO, Herges RM, Jacobsen SJ, Roger VL, Redfield MM. Trends in prevalence and outcome of heart failure with preserved ejection fraction. N Engl J Med 2006; 355(3):251–259. doi:10.1056/NEJMoa052256
- Pitt B, Zannad F, Remme WJ, et al. The effect of spironolactone on morbidity and mortality in patients with severe heart failure. Randomized Aldactone Evaluation Study Investigators. N Engl J Med 1999; 341(10):709–717. doi:10.1056/NEJM199909023411001
- MacFadyen RJ, Barr CS, Struthers AD. Aldosterone blockade reduces vascular collagen turnover, improves heart rate variability and reduces early morning rise in heart rate in heart failure patients. Cardiovasc Res 1997; 35(1):30–34. pmid:9302344
- Edelmann F, Wachter R, Schmidt AG, et al; Aldo-DHF Investigators. Effect of spironolactone on diastolic function and exercise capacity in patients with heart failure with preserved ejection fraction: the Aldo-DHF randomized controlled trial. JAMA 2013; 309(8):781–791. doi:10.1001/jama.2013.905
- Pitt B, Pfeffer MA, Assmann SF, et al; TOPCAT Investigators. Spironolactone for heart failure with preserved ejection fraction. N Engl J Med 2014; 370(15):1383–1392. doi:10.1056/NEJMoa1313731
- Pfeffer MA, Claggett B, Assmann SF, et al. Regional variation in patients and outcomes in the Treatment of Preserved Cardiac Function Heart Failure With an Aldosterone Antagonist (TOPCAT) trial. Circulation 2015; 31(1):34–42. doi:10.1161/CIRCULATIONAHA.114.013255
- de Denus S, O’Meara E, Desai AS, et al. Spironolactone metabolites in TOPCAT—new insights into regional variation. N Engl J Med 2017; 376(17):1690–1692. doi:10.1056/NEJMc1612601
- Redfield MM, Anstrom KJ, Levine JA, et al; NHLBI Heart Failure Clinical Research Network. Isosorbide mononitrate in heart failure with preserved ejection fraction. N Engl J Med 2015; 373(24):2314–2324. doi:10.1056/NEJMoa1510774
- Walton-Shirley M. Succinct thoughts on NEAT-HFpEF: true, true, and unrelated? Medscape 2015. https://www.medscape.com/viewarticle/854116. Accessed January 17, 2019.
- Redfield MM, Chen HH, Borlaug BA, et al. Effect of phosphodiesterase-5 inhibition on exercise capacity and clinical status in heart failure with preserved ejection fraction: a randomized clinical trial. JAMA 2013; 309(12):1268–1277. doi:10.1001/jama.2013.2024
- Guazzi M, Vicenzi M, Arena R, Guazzi MD. PDE5 inhibition with sildenafil improves left ventricular diastolic function, cardiac geometry, and clinical status in patients with stable systolic heart failure: results of a 1-year, prospective, randomized, placebo controlled study. Circ Heart Fail 2011; 4(1):8–17. doi:10.1161/CIRCHEARTFAILURE.110.944694
- Guazzi M, Vicenzi M, Arena R, Guazzi MD. Pulmonary hypertension in heart failure with preserved ejection fraction: a target of phosphodiesterase-5 inhibition in a 1-year study. Circulation 2011; 124(2):164–174. doi:10.1161/CIRCULATIONAHA.110.983866
- Klip IT, Comin-Colet J, Voors AA, et al. Iron deficiency in chronic heart failure: an international pooled analysis. Am Heart J 2013; 165(4):575–582.e3. doi:10.1016/j.ahj.2013.01.017
- Jankowska EA, von Haehling S, Anker SD, Macdougall IC, Ponikowski P. Iron deficiency and heart failure: diagnostic dilemmas and therapeutic perspectives. Eur Heart J 2013; 34(11):816–829. doi:10.1093/eurheartj/ehs224
- Jankowska EA, Rozentryt P, Witkowska A, et al. Iron deficiency predicts impaired exercise capacity in patients with systolic chronic heart failure. J Card Fail 2011; 17(11):899–906. doi:10.1016/j.cardfail.2011.08.003
- Haas JD, Brownlie T 4th. Iron deficiency and reduced work capacity: a critical review of the research to determine a causal relationship. J Nutr 2001; 131(2S–2):676S-690S. doi:10.1093/jn/131.2.676S
- Davies KJ, Maguire JJ, Brooks GA, Dallman PR, Packer L. Muscle mitochondrial bioenergetics, oxygen supply, and work capacity during dietary iron deficiency and repletion. Am J Physiol 1982; 242(6):E418–E427. doi:10.1152/ajpendo.1982.242.6.E418
- Drozd M, Jankowska EA, Banasiak W, Ponikowski P. Iron therapy in patients with heart failure and iron deficiency: review of iron preparations for practitioners. Am J Cardiovasc Drugs 2017; 17(3):183–201. doi:10.1007/s40256-016-0211-2
- Anker SD, Comin Colet J, Filippatos G, et al; FAIR-HF Trial Investigators. Ferric carboxymaltose in patients with heart failure and iron deficiency. N Engl J Med 2009; 361(25):2436–2448. doi:10.1056/NEJMoa0908355
- Ponikowski P, van Veldhuisen DJ, Comin-Colet J, et al; CONFIRM-HF Investigators. Beneficial effects of long-term intravenous iron therapy with ferric carboxymaltose in patients with symptomatic heart failure and iron deficiency. Eur Heart J 2015; 36(11):657–668. doi:10.1093/eurheartj/ehu385
- Lewis GD, Malhotra R, Hernandez AF, et al; NHLBI Heart Failure Clinical Research Network. Effect of Oral Iron Repletion on Exercise Capacity in Patients With Heart Failure With Reduced Ejection Fraction and Iron Deficiency: The IRONOUT HF randomized clinical trial. JAMA 2017; 317(19):1958–1966. doi:10.1001/jama.2017.5427
- Wendling P. Iron supplementation in HF: trials support IV but not oral. Medscape 2016. https://www.medscape.com/viewarticle/872088. Accessed January 17, 2019.
- Ganz T. Hepcidin and iron regulation, 10 years later. Blood 2011; 117(17):4425–4433. doi:10.1182/blood-2011-01-258467
- Jankowska EA, Kasztura M, Sokolski M, et al. Iron deficiency defined as depleted iron stores accompanied by unmet cellular iron requirements identifies patients at the highest risk of death after an episode of acute heart failure. Eur Heart J 2014; 35(36):2468–2476. doi:10.1093/eurheartj/ehu235
- Jankowska EA, Malyszko J, Ardehali H, et al. Iron status in patients with chronic heart failure. Eur Heart J 2013; 34(11):827–834. doi:10.1093/eurheartj/ehs377
- Swedberg K, Young JB, Anand IS, et al. Treatment of anemia with darbepoetin alfa in systolic heart failure. N Engl J Med 2013; 368(13):1210–1219. doi:10.1056/NEJMoa1214865
- Ghali JK, Anand IS, Abraham WT, et al; Study of Anemia in Heart Failure Trial (STAMINA-HeFT) Group. Randomized double-blind trial of darbepoetin alfa in patients with symptomatic heart failure and anemia. Circulation 2008; 117(4):526–535. doi:10.1161/CIRCULATIONAHA.107.698514
- SPRINT Research Group; Wright JT Jr, Williamson JD, Whelton PK, et al. A randomized trial of intensive versus standard blood pressure control. N Engl J Med 2015; 373(22):2103–2116. doi:10.1056/NEJMoa1511939
- Whelton PK, Carey RM, Arnow WS, et al. 2017 ACC/AHA/AAPA/ABC/ACPM/AGS/APhA/ASH/ASPC/NMA/PCNA guideline for the prevention, detection, evaluation, and management of high blood pressure in adults: a report of the American College of Cardiology/American Heart Association Task Force on Clinical Practice Guidelines. J Am Coll Cardiol 2018; 71(19):e127–e248. doi:10.1016/j.jacc.2017.11.006
- Young T, Shahar E, Nieto FJ, et al; Sleep Heart Health Study Research Group. Predictors of sleep-disordered breathing in community dwelling adults: the Sleep Heart Health Study. Arch Intern Med 2002; 162(8):893–900. pmid:11966340
- MacDonald M, Fang J, Pittman SD, White DP, Malhotra A.The current prevalence of sleep disordered breathing in congestive heart failure patients treated with beta-blockers. J Clin Sleep Med 2008; 4(1):38-42. pmid:18350960
- Bitter T, Faber L, Hering D, Langer C, Horstkotte D, Oldenburg O. Sleep-disordered breathing in heart failure with normal left ventricular ejection fraction. Eur J Heart Fail 2009; 11(6):602–608. doi:10.1093/eurjhf/hfp057
- Sin DD, Fitzgerald F, Parker JD, Newton G, Floras JS, Bradley TD. Risk factors for central and obstructive sleep apnea in 450 men and women with congestive heart failure. Am J Respir Crit Care Med 1999; 160(4):1101–1106. doi:10.1164/ajrccm.160.4.9903020
- Ng AC, Freedman SB. Sleep disordered breathing in chronic heart failure. Heart Fail Rev 2009; 14(2):89–99. doi:10.1007/s10741-008-9096-8
- Kasai T, Bradley TD. Obstructive sleep apnea and heart failure: pathophysiologic and therapeutic implications. J Am Coll Cardiol 2011; 57(2):119–127. doi:10.1016/j.jacc.2010.08.627
- Marin JM, Carrizo SJ, Vicente E, Agusti AG. Long-term cardiovascular outcomes in men with obstructive sleep apnoea-hypopnoea with or without treatment with continuous positive airway pressure: an observational study. Lancet 2005; 365(9464):1046–1053. doi:10.1016/S0140-6736(05)71141-7
- Javaheri S, Shukla R, Zeigler H, Wexler L. Central sleep apnea, right ventricular dysfunction, and low diastolic blood pressure are predictors of mortality in systolic heart failure. J Am Coll Cardiol 2007; 49(20):2028–2034. doi:10.1016/j.jacc.2007.01.084
- Bradley TD, Logan AG, Kimoff RJ, et al; CANPAP Investigators. Continuous positive airway pressure for central sleep apnea and heart failure. N Engl J Med 2005; 353(19):2025–2033. doi:10.1056/NEJMoa051001
- Arzt M, Floras JS, Logan AG, et al; CANPAP Investigators. Suppression of central sleep apnea by continuous positive airway pressure and transplant-free survival in heart failure: a post hoc analysis of the Canadian Continuous Positive Airway Pressure for Patients with Central Sleep Apnea and Heart Failure Trial (CANPAP). Circulation 2007; 115(25):3173–3180. doi:10.1161/CIRCULATIONAHA.106.683482
- Cowie MR, Woehrle H, Wegscheider K, et al. Adaptive servo-ventilation for central sleep apnea in systolic heart failure. N Engl J Med 2015; 373(12):1095–1105. doi:10.1056/NEJMoa1506459
- O’Connor CM, Whellan DJ, Fiuzat M, et al. Cardiovascular outcomes with minute ventilation-targeted adaptive servo-ventilation therapy in heart failure: the CAT-HF Trial. J Am Coll Cardiol 2017; 69(12):1577–1587. doi:10.1016/j.jacc.2017.01.041
- McEvoy RD, Antic NA, Heeley E, et al; SAVE Investigators and Coordinators. CPAP for prevention of cardiovascular events in obstructive sleep apnea. N Engl J Med 2016; 375(10):919–931. doi:10.1056/NEJMoa1606599
- McQuade CN, Mizus M, Wald JW, Goldberg L, Jessup M, Umscheid CA. Brain-type natriuretic peptide and amino-terminal pro-brain-type natriuretic peptide discharge thresholds for acute decompensated heart failure: a systematic review. Ann Intern Med 2017; 166(3):180–190. doi:10.7326/M16-1468
- Felker GM, Whellan DJ. Inpatient management of heart failure: are we shooting at the right target? Ann Intern Med 2017; 166(3):223–224. doi:10.7326/M16-2667
- Carubelli V, Lombardi C, Lazzarini V, et al. N-terminal pro-B-type natriuretic peptide-guided therapy in patients hospitalized for acute heart failure. J Cardiovasc Med (Hagerstown) 2016; 17(11):828–839. doi:10.2459/JCM.0000000000000419
- Stienen S, Salah K, Moons AH, et al. Rationale and design of PRIMA II: a multicenter, randomized clinical trial to study the impact of in-hospital guidance for acute decompensated heart failure treatment by a predefined NT-PRoBNP target on the reduction of readmIssion and mortality rates. Am Heart J 2014; 168(1):30–36. doi:10.1016/j.ahj.2014.04.008
- Felker GM, Anstrom KJ, Adams KF, et al. Effect of natriuretic peptide-guided therapy on hospitalization or cardiovascular mortality in high-risk patients with heart failure and reduced ejection fraction: a randomized clinical trial. JAMA 2017; 318(8):713–720. doi:10.1001/jama.2017.10565
- Troughton RW, Frampton CM, Brunner-La Rocca HP, et al. Effect of B-type natriuretic peptide-guided treatment of chronic heart failure on total mortality and hospitalization: an individual patient meta-analysis. Eur Heart J 2014; 35(23):1559–1567. doi:10.1093/eurheartj/ehu090
- van Vliet AA, Donker AJ, Nauta JJ, Verheugt FW. Spironolactone in congestive heart failure refractory to high-dose loop diuretic and low-dose angiotensin-converting enzyme inhibitor. Am J Cardiol 1993; 71(3):21A–28A. pmid:8422000
- Butler J, Anstrom KJ, Felker GM, et al; National Heart Lung and Blood Institute Heart Failure Clinical Research Network. Efficacy and safety of spironolactone in acute heart failure. The ATHENA-HF randomized clinical trial. JAMA Cardiol 2017; 2(9):950–958. doi:10.1001/jamacardio.2017.2198
- McMurray JJ, Packer M, Desai AS, et al; PARADIGM-HF Investigators and Committees. Angiotensin-neprilysin inhibition versus enalapril in heart failure. N Engl J Med 2014; 371(11):993–1004. doi:10.1056/NEJMoa1409077
- ClinicalTrials.gov. ComParIson Of Sacubitril/valsartaN Versus Enalapril on Effect on NTpRo-BNP in patients stabilized from an acute Heart Failure episode (PIONEER-HF). https://clinicaltrials.gov/ct2/show/NCT02554890. Accessed January 17, 2019.
- Swedberg K, Komajda M, Böhm M, et al; SHIFT Investigators. Ivabradine and outcomes in chronic heart failure (SHIFT): a randomised placebo-controlled study. Lancet 2010; 376(9744):875–885. doi:10.1016/S0140-6736(10)61198-1
- Hidalgo FJ, Anguita M, Castillo JC, et al. Effect of early treatment with ivabradine combined with beta-blockers versus beta-blockers alone in patients hospitalised with heart failure and reduced left ventricular ejection fraction (ETHIC-AHF): a randomised study. Int J Cardiol 2016; 217:7–11. doi:10.1016/j.ijcard.2016.04.136
- ClinicalTrials.gov. Predischarge Initiation of Ivabradine in the Management of Heart Failure (PRIME-HF). https://clinicaltrials.gov/ct2/show/NCT02827500. Accessed January 17, 2019.
- Anker SD, Kirwan BA, van Veldhuisen DJ, et al. Effects of ferric carboxymaltose on hospitalisations and mortality rates in iron-deficient heart failure patients: an individual patient data meta-analysis. Eur J Heart Fail 2018; 20(1):125–133. doi:10.1002/ejhf.823
- ClinicalTrials.gov. Intravenous Iron in Patients With Systolic Heart Failure and Iron Deficiency to Improve Morbidity and Mortality (FAIR-HF2). https://clinicaltrials.gov/ct2/show/NCT03036462. Accessed January 17, 2019.
- ClinicalTrials.gov. Study to Compare Ferric Carboxymaltose With Placebo in Patients With Acute Heart Failure and Iron Deficiency (AFFIRM-AHF). https://clinicaltrials.gov/ct2/show/record/NCT02937454. Accessed January 17, 2019.
- ClinicalTrials.gov. Randomized Placebo-controlled Trial of Ferric Carboxymaltose as Treatment for Heart Failure With Iron Deficiency (HEART-FID). https://clinicaltrials.gov/ct2/show/NCT03037931. Accessed January 17, 2019.
- ClinicalTrials.gov. Intravenous Iron Treatment in Patients With Heart Failure and Iron Deficiency (IRONMAN). https://clinicaltrials.gov/ct2/show/NCT02642562. Accessed January 17, 2019.
KEY POINTS
- Despite advances in treatment, heart failure remains highly morbid, common, and costly. Prevention is key.
- Strategies to prevent progression to clinical heart failure in high-risk patients include new blood pressure targets (< 130/80 mm Hg) and B-type natriuretic peptide screening to prompt referral to a cardiovascular specialist.
- An aldosterone receptor antagonist might be considered to decrease hospitalizations in appropriately selected stage C HFpEF patients. Routine use of nitrates or phosphodiesterase-5 inhibitors in such patients is not recommended.
- Outpatient intravenous iron infusions are reasonable in persistently symptomatic New York Heart Association stage II to III heart failure with reduced ejection fraction (HFrEF) to improve functional capacity and quality of life.
- The new systolic blood pressure target is less than 130 mm Hg for stage A heart failure, stage C HFrEF, and stage C HFpEF.

The Virtual Hospitalist: The Future is Now
Compared with other industries, medicine has been slow to embrace the digital age. Electronic health records have only recently become ubiquitous, and that was only realized after governmental prodding through Meaningful Use legislation. Other digital tools, such as video or remote sensor technologies, have been available for decades but had not been introduced into routine medical care until recently for various reasons, ranging from costs to security to reimbursement rules. However, we are currently in the midst of a paradigm shift in medicine toward virtual care, as exemplified by the Kaiser Permanente CEO’s proclamation in 2017 that this capitated care system had moved over half of its 100 million annual patient encounters to the virtual environment.1
Regulation – both at the state and federal levels – has been the largest barrier to the adoption of virtual care. State licensure regulations for practicing medicine hamper virtual visits, which can otherwise be easily achieved without regard to geography. Although the Centers for Medicare & Medicaid Services (CMS) has had provisions for telehealth billing, these have been largely limited to rural areas. However, regulations are constantly evolving as the Interstate Medical Licensure Compact list is not CMS. The Interstate Medical Licensure Compact (www.imlcc.org) is an agreement involving 24 states that permits licensed physicians to practice medicine across state lines. CMS has recently proposed to add payments for virtual check-in visits, which will not be subject to the prior limitations on Medicare telehealth services.2 These and future changes in regulation will likely spur the rapid adoption and evolution of virtual services.
In this context, the article by Kuperman et al.3 provides a welcoming view of the future of hospital medicine. The authors demonstrated the feasibility of using a “virtual hospitalist” to manage patients admitted to a small rural hospital that lacked the patient volumes and resources to justify on-site hospitalist staffing. The patients benefited from the clinical expertise of an experienced inpatient provider while staying near their homes. This article adds to the growing literature on the use of these technologies in the hospital settings, which range from the management of patients in the intensive care unit4 to stroke patients in the ED5 and to inpatient psychiatric consultation.6
What are the implications for hospitalists? We need to prepare the current and future generations of hospitalists for practice in an evolving digital environment. “Choosing Wisely®: Things We Do For No Reason” is one of the most popular segments of JHM for a good reason: there are many things in the field of medicine because “that’s the way we always did it.” The capabilities unleashed by digital technologies will require hospitalists to rethink how we manage patients in acute and subacute settings and after discharge. Although these tools show a substantial promise to help us achieve the Triple Aim, we will need considerably more research to understand the costs and effectiveness of these new digital technologies and approaches.7,8 We also need new payment models that recognize their value. Finally, we also need to be aware that doctoring elements, such as human touch, physical presence, and emotional connection, can be encumbered and not enhanced by digital technologies.9
Disclosures
Dr. Ong and Dr. Brotman have nothing to disclose.
1. Why Digital Transformations Are Hard. Wall Street Journal. March 7, 2017, 2017.
2. Medicare Program: Revisions to Payment Policies under the Physician Fee Schedule and Other Revisions to Part B for CY 2019; Medicare Shared Savings Program Requirements; etc. In: Centers for Medicare & Medicaid Services, ed: Federal Register; 2018:1472.
3. Kuperman EF, Linson EL, Klefstad K, Perry E, Glenn K. The virtual hospitalist: a single-site implementation bringing hospitalist coverage to critical access hospitals. J Hosp Med. 2018. In Press. PubMed
4. Lilly CM, Cody S, Zhao H, et al. Hospital mortality, length of stay, and preventable complications among critically ill patients before and after tele-ICU reengineering of critical care processes. JAMA. 2011;305(21):2175-2183. doi: 10.1001/jama.2011.697. PubMed
5. Meyer BC, Raman R, Hemmen T, et al. Efficacy of site-independent telemedicine in the STRokE DOC trial: a randomised, blinded, prospective study. Lancet Neurol. 2008;7(9):787-795. doi: 10.1016/S1474-4422(08)70171-6. PubMed
6. Arevian AC, Jeffrey J, Young AS, Ong MK. Opportunities for flexible, on-demand care delivery through telemedicine. Psychiatr Serv. 2018;69(1):5-8. doi: 10.1176/appi.ps.201600589. PubMed
7. Ashwood JS, Mehrotra A, Cowling D, Uscher-Pines L. Direct-to-consumer telehealth may increase access to care but does not decrease spending. Health Aff (Millwood). 2017;36(3):485-491. doi: 10.1377/hlthaff.2016.1130. PubMed
8. Ong MK, Romano PS, Edgington S, et al. Effectiveness of remote patient monitoring after discharge of hospitalized patients with heart failure: the better effectiveness after transition -- Heart Failure (BEAT-HF) Randomized Clinical Trial. JAMA Intern Med. 2016;176(3):310-318. doi: 10.1001/jamainternmed.2015.7712. PubMed
9. Verghese A. Culture shock--patient as icon, icon as patient. N Engl J Med. 2008;359(26):2748-2751. doi: 10.1056/NEJMp0807461. PubMed
Compared with other industries, medicine has been slow to embrace the digital age. Electronic health records have only recently become ubiquitous, and that was only realized after governmental prodding through Meaningful Use legislation. Other digital tools, such as video or remote sensor technologies, have been available for decades but had not been introduced into routine medical care until recently for various reasons, ranging from costs to security to reimbursement rules. However, we are currently in the midst of a paradigm shift in medicine toward virtual care, as exemplified by the Kaiser Permanente CEO’s proclamation in 2017 that this capitated care system had moved over half of its 100 million annual patient encounters to the virtual environment.1
Regulation – both at the state and federal levels – has been the largest barrier to the adoption of virtual care. State licensure regulations for practicing medicine hamper virtual visits, which can otherwise be easily achieved without regard to geography. Although the Centers for Medicare & Medicaid Services (CMS) has had provisions for telehealth billing, these have been largely limited to rural areas. However, regulations are constantly evolving as the Interstate Medical Licensure Compact list is not CMS. The Interstate Medical Licensure Compact (www.imlcc.org) is an agreement involving 24 states that permits licensed physicians to practice medicine across state lines. CMS has recently proposed to add payments for virtual check-in visits, which will not be subject to the prior limitations on Medicare telehealth services.2 These and future changes in regulation will likely spur the rapid adoption and evolution of virtual services.
In this context, the article by Kuperman et al.3 provides a welcoming view of the future of hospital medicine. The authors demonstrated the feasibility of using a “virtual hospitalist” to manage patients admitted to a small rural hospital that lacked the patient volumes and resources to justify on-site hospitalist staffing. The patients benefited from the clinical expertise of an experienced inpatient provider while staying near their homes. This article adds to the growing literature on the use of these technologies in the hospital settings, which range from the management of patients in the intensive care unit4 to stroke patients in the ED5 and to inpatient psychiatric consultation.6
What are the implications for hospitalists? We need to prepare the current and future generations of hospitalists for practice in an evolving digital environment. “Choosing Wisely®: Things We Do For No Reason” is one of the most popular segments of JHM for a good reason: there are many things in the field of medicine because “that’s the way we always did it.” The capabilities unleashed by digital technologies will require hospitalists to rethink how we manage patients in acute and subacute settings and after discharge. Although these tools show a substantial promise to help us achieve the Triple Aim, we will need considerably more research to understand the costs and effectiveness of these new digital technologies and approaches.7,8 We also need new payment models that recognize their value. Finally, we also need to be aware that doctoring elements, such as human touch, physical presence, and emotional connection, can be encumbered and not enhanced by digital technologies.9
Disclosures
Dr. Ong and Dr. Brotman have nothing to disclose.
1. Why Digital Transformations Are Hard. Wall Street Journal. March 7, 2017, 2017.
2. Medicare Program: Revisions to Payment Policies under the Physician Fee Schedule and Other Revisions to Part B for CY 2019; Medicare Shared Savings Program Requirements; etc. In: Centers for Medicare & Medicaid Services, ed: Federal Register; 2018:1472.
3. Kuperman EF, Linson EL, Klefstad K, Perry E, Glenn K. The virtual hospitalist: a single-site implementation bringing hospitalist coverage to critical access hospitals. J Hosp Med. 2018. In Press. PubMed
4. Lilly CM, Cody S, Zhao H, et al. Hospital mortality, length of stay, and preventable complications among critically ill patients before and after tele-ICU reengineering of critical care processes. JAMA. 2011;305(21):2175-2183. doi: 10.1001/jama.2011.697. PubMed
5. Meyer BC, Raman R, Hemmen T, et al. Efficacy of site-independent telemedicine in the STRokE DOC trial: a randomised, blinded, prospective study. Lancet Neurol. 2008;7(9):787-795. doi: 10.1016/S1474-4422(08)70171-6. PubMed
6. Arevian AC, Jeffrey J, Young AS, Ong MK. Opportunities for flexible, on-demand care delivery through telemedicine. Psychiatr Serv. 2018;69(1):5-8. doi: 10.1176/appi.ps.201600589. PubMed
7. Ashwood JS, Mehrotra A, Cowling D, Uscher-Pines L. Direct-to-consumer telehealth may increase access to care but does not decrease spending. Health Aff (Millwood). 2017;36(3):485-491. doi: 10.1377/hlthaff.2016.1130. PubMed
8. Ong MK, Romano PS, Edgington S, et al. Effectiveness of remote patient monitoring after discharge of hospitalized patients with heart failure: the better effectiveness after transition -- Heart Failure (BEAT-HF) Randomized Clinical Trial. JAMA Intern Med. 2016;176(3):310-318. doi: 10.1001/jamainternmed.2015.7712. PubMed
9. Verghese A. Culture shock--patient as icon, icon as patient. N Engl J Med. 2008;359(26):2748-2751. doi: 10.1056/NEJMp0807461. PubMed
© 2018 Society of Hospital Medicine
Patient Perceptions of Readmission Risk: An Exploratory Survey
Recent years have seen a proliferation of programs designed to prevent readmissions, including patient education initiatives, financial assistance programs, postdischarge services, and clinical personnel assigned to help patients navigate their posthospitalization clinical care. Although some strategies do not require direct patient participation (such as timely and effective handoffs between inpatient and outpatient care teams), many rely upon a commitment by the patient to participate in the postdischarge care plan. At our hospital, we have found that only about 2/3 of patients who are offered transitional interventions (such as postdischarge phone calls by nurses or home nursing through a “transition guide” program) receive the intended interventions, and those who do not receive them are more likely to be readmitted.1 While limited patient uptake may relate, in part, to factors that are difficult to overcome, such as inadequate housing or phone service, we have also encountered patients whose values, beliefs, or preferences about their care do not align with those of the care team. The purposes of this exploratory study were to (1) assess patient attitudes surrounding readmission, (2) ascertain whether these attitudes are associated with actual readmission, and (3) determine whether patients can estimate their own risk of readmission.
METHODS
From January 2014 to September 2016, we circulated surveys to patients on internal medicine nursing units who were being discharged home within 24 hours. Blank surveys were distributed to nursing units by the researchers. Unit clerks and support staff were educated on the purpose of the project and asked to distribute surveys to patients who were identified by unit case managers or nurses as slated for discharge. Staff members were not asked to help with or supervise survey completion. Surveys were generally filled out by patients, but we allowed family members to assist patients if needed, and to indicate so with a checkbox. There were no exclusion criteria. Because surveys were distributed by clinical staff, the received surveys can be considered a convenience sample. Patients were asked 5 questions with 4- or 5-point Likert scale responses:
(1) “How likely is it that you will be admitted to the hospital (have to stay in the hospital overnight) again within the next 30 days after you leave the hospital this time?” [answers ranging from “Very Unlikely (<5% chance)” to “Very Likely (>50% chance)”];
(2) “How would you feel about being rehospitalized in the next month?” [answers ranging from “Very sad, frustrated, or disappointed” to “Very happy or relieved”];
(3) “How much do you think that you personally can control whether or not you will be rehospitalized (based on what you do to take care of your body, take your medicines, and follow-up with your healthcare team)?” [answers ranging from “I have no control over whether I will be rehospitalized” to “I have complete control over whether I will be rehospitalized”];
(4) “Which of the options below best describes how you plan to follow the medical instructions after you leave the hospital?” [answers ranging from “I do NOT plan to do very much of what I am being asked to do by the doctors, nurses, therapists, and other members of the care team” to “I plan to do EVERYTHING I am being asked to do by the doctors, nurses, therapists and other members of the care team”]; and
(5) “Pick the item below that best describes YOUR OWN VIEW of the care team’s recommendations:” [answers ranging from “I DO NOT AGREE AT ALL that the best way to be healthy is to do exactly what I am being asked to do by the doctors, nurses, therapists, and other members of the care team” to “I FULLY AGREE that the best way to be healthy is to do exactly what I am being asked to do by the doctors, nurses, therapists, and other members of the care team”].
Responses were linked, based on discharge date and medical record number, to administrative data, including age, sex, race, payer, and clinical data. Subsequent hospitalizations to our hospital were ascertained from administrative data. We estimated expected risk of readmission using the all payer refined diagnosis related group coupled with the associated severity-of-illness (SOI) score, as we have reported previously.2-5 We restricted our analysis to patients who answered the question related to the likelihood of readmission. Logistic regression models were constructed using actual 30-day readmission as the dependent variable to determine whether patients could predict their own readmissions and whether patient attitudes and beliefs about their care were predictive of subsequent readmission. Patient survey responses were entered as continuous independent variables (ranging from 1-4 or 1-5, as appropriate). Multivariable logistic regression was used to determine whether patients could predict their readmissions independent of demographic variables and expected readmission rate (modeled continuously); we repeated this model after dichotomizing the patient’s estimate of the likelihood of readmission as either “unlikely” or “likely.” Patients with missing survey responses were excluded from individual models without imputation. The study was approved by the Johns Hopkins institutional review board.
RESULTS
Responses were obtained from 895 patients. Their median age was 56 years [interquartile range, 43-67], 51.4% were female, and 41.7% were white. Mean SOI was 2.53 (on a 1-4 scale), and median length-of-stay was representative for our medical service at 5.2 days (range, 1-66 days). Family members reported filling out the survey in 57 cases. The primary payer was Medicare in 40.7%, Medicaid in 24.9%, and other in 34.4%. A total of 138 patients (15.4%) were readmitted within 30 days. The Table shows survey responses and associated readmission rates. None of the attitudes related to readmission were predictive of actual readmission. However, patients were able to predict their own readmissions (P = .002 for linear trend). After adjustment for expected readmission rate, race, sex, age, and payer, the trend remained significant (P = .005). Other significant predictors of readmissions in this model included expected readmission rate (P = .002), age (P = .02), and payer (P = .002). After dichotomizing the patient estimate of readmission rate as “unlikely” (N = 581) or “likely” (N = 314), the unadjusted odds ratio associating a patient-estimated risk of readmission as “likely” with actual readmission was 1.8 (95% confidence interval, 1.2-2.5). The adjusted odds ratio (including the variables above) was 1.6 (1.1-2.4).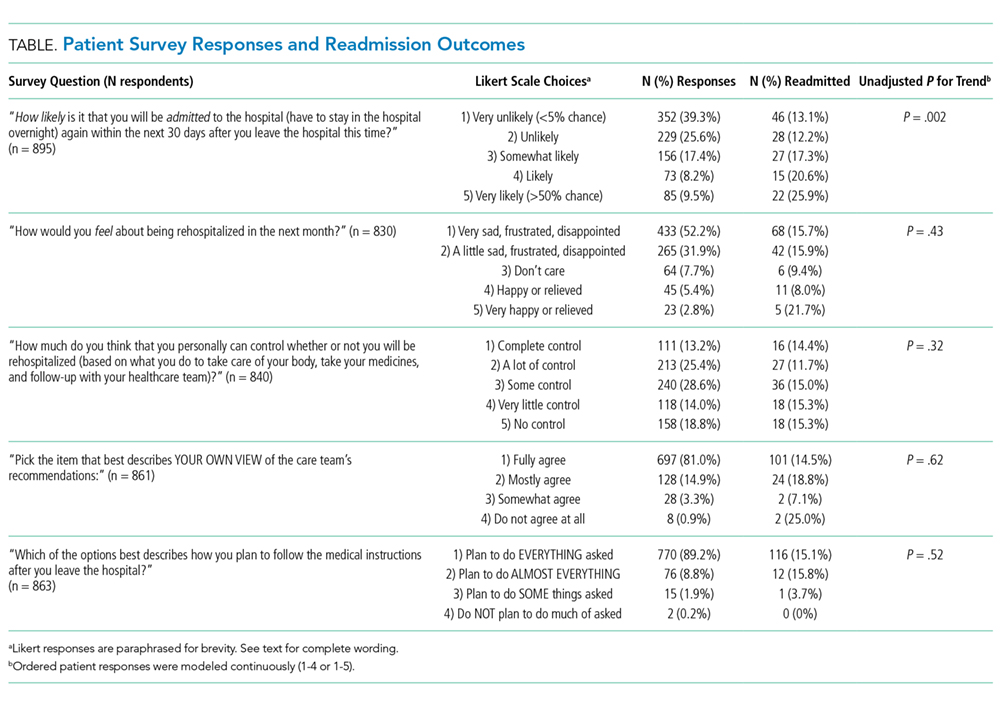
DISCUSSION
Our findings demonstrate that patients are able to quantify their own readmission risk. This was true even after adjustment for expected readmission rate, age, sex, race, and payer. However, we did not identify any patient attitudes, beliefs, or preferences related to readmission or discharge instructions that were associated with subsequent rehospitalization. Reassuringly, more than 80% of patients who responded to the survey indicated that they would be sad, frustrated, or disappointed should readmission occur. This suggests that most patients are invested in preventing rehospitalization. Also reassuring was that patients indicated that they agreed with the discharge care plan and intended to follow their discharge instructions.
The major limitation of this study is that it was a convenience sample. Surveys were distributed inconsistently by nursing unit staff, preventing us from calculating a response rate. Further, it is possible, if not likely, that those patients with higher levels of engagement were more likely to take the time to respond, enriching our sample with activated patients. Although we allowed family members to fill out surveys on behalf of patients, this was done in fewer than 10% of instances; as such, our data may have limited applicability to patients who are physically or cognitively unable to participate in the discharge process. Finally, in this study, we did not capture readmissions to other facilities.
We conclude that patients are able to predict their own readmissions, even after accounting for other potential predictors of readmission. However, we found no evidence to support the possibility that low levels of engagement, limited trust in the healthcare team, or nonchalance about being readmitted are associated with subsequent rehospitalization. Whether asking patients about their perceived risk of readmission might help target readmission prevention programs deserves further study.
Acknowledgments
Dr. Daniel J. Brotman had full access to the data in the study and takes responsibility for the integrity of the study data and the accuracy of the data analysis. The authors also thank the following individuals for their contributions: Drafting the manuscript (Brotman); revising the manuscript for important intellectual content (Brotman, Shihab, Tieu, Cheng, Bertram, Hoyer, Deutschendorf); acquiring the data (Brotman, Shihab, Tieu, Cheng, Bertram, Deutschendorf); interpreting the data (Brotman, Shihab, Tieu, Cheng, Bertram, Hoyer, Deutschendorf); and analyzing the data (Brotman). The authors thank nursing leadership and nursing unit staff for their assistance in distributing surveys.
Funding support: Johns Hopkins Hospitalist Scholars Program
Disclosures: The authors have declared no conflicts of interest.
1. Hoyer EH, Brotman DJ, Apfel A, et al. Improving outcomes after hospitalization: a prospective observational multi-center evaluation of care-coordination strategies on 30-day readmissions to Maryland hospitals. J Gen Int Med. 2017 (in press). PubMed
2. Oduyebo I, Lehmann CU, Pollack CE, et al. Association of self-reported hospital discharge handoffs with 30-day readmissions. JAMA Intern Med. 2013;173(8):624-629. PubMed
3. Hoyer EH, Needham DM, Atanelov L, Knox B, Friedman M, Brotman DJ. Association of impaired functional status at hospital discharge and subsequent rehospitalization. J Hosp Med. 2014;9(5):277-282. PubMed
4. Hoyer EH, Needham DM, Miller J, Deutschendorf A, Friedman M, Brotman DJ. Functional status impairment is associated with unplanned readmissions. Arch Phys Med Rehabil. 2013;94(10):1951-1958. PubMed
5. Hoyer EH, Odonkor CA, Bhatia SN, Leung C, Deutschendorf A, Brotman DJ. Association between days to complete inpatient discharge summaries with all-payer hospital readmissions in Maryland. J Hosp Med. 2016;11(6):393-400. PubMed
Recent years have seen a proliferation of programs designed to prevent readmissions, including patient education initiatives, financial assistance programs, postdischarge services, and clinical personnel assigned to help patients navigate their posthospitalization clinical care. Although some strategies do not require direct patient participation (such as timely and effective handoffs between inpatient and outpatient care teams), many rely upon a commitment by the patient to participate in the postdischarge care plan. At our hospital, we have found that only about 2/3 of patients who are offered transitional interventions (such as postdischarge phone calls by nurses or home nursing through a “transition guide” program) receive the intended interventions, and those who do not receive them are more likely to be readmitted.1 While limited patient uptake may relate, in part, to factors that are difficult to overcome, such as inadequate housing or phone service, we have also encountered patients whose values, beliefs, or preferences about their care do not align with those of the care team. The purposes of this exploratory study were to (1) assess patient attitudes surrounding readmission, (2) ascertain whether these attitudes are associated with actual readmission, and (3) determine whether patients can estimate their own risk of readmission.
METHODS
From January 2014 to September 2016, we circulated surveys to patients on internal medicine nursing units who were being discharged home within 24 hours. Blank surveys were distributed to nursing units by the researchers. Unit clerks and support staff were educated on the purpose of the project and asked to distribute surveys to patients who were identified by unit case managers or nurses as slated for discharge. Staff members were not asked to help with or supervise survey completion. Surveys were generally filled out by patients, but we allowed family members to assist patients if needed, and to indicate so with a checkbox. There were no exclusion criteria. Because surveys were distributed by clinical staff, the received surveys can be considered a convenience sample. Patients were asked 5 questions with 4- or 5-point Likert scale responses:
(1) “How likely is it that you will be admitted to the hospital (have to stay in the hospital overnight) again within the next 30 days after you leave the hospital this time?” [answers ranging from “Very Unlikely (<5% chance)” to “Very Likely (>50% chance)”];
(2) “How would you feel about being rehospitalized in the next month?” [answers ranging from “Very sad, frustrated, or disappointed” to “Very happy or relieved”];
(3) “How much do you think that you personally can control whether or not you will be rehospitalized (based on what you do to take care of your body, take your medicines, and follow-up with your healthcare team)?” [answers ranging from “I have no control over whether I will be rehospitalized” to “I have complete control over whether I will be rehospitalized”];
(4) “Which of the options below best describes how you plan to follow the medical instructions after you leave the hospital?” [answers ranging from “I do NOT plan to do very much of what I am being asked to do by the doctors, nurses, therapists, and other members of the care team” to “I plan to do EVERYTHING I am being asked to do by the doctors, nurses, therapists and other members of the care team”]; and
(5) “Pick the item below that best describes YOUR OWN VIEW of the care team’s recommendations:” [answers ranging from “I DO NOT AGREE AT ALL that the best way to be healthy is to do exactly what I am being asked to do by the doctors, nurses, therapists, and other members of the care team” to “I FULLY AGREE that the best way to be healthy is to do exactly what I am being asked to do by the doctors, nurses, therapists, and other members of the care team”].
Responses were linked, based on discharge date and medical record number, to administrative data, including age, sex, race, payer, and clinical data. Subsequent hospitalizations to our hospital were ascertained from administrative data. We estimated expected risk of readmission using the all payer refined diagnosis related group coupled with the associated severity-of-illness (SOI) score, as we have reported previously.2-5 We restricted our analysis to patients who answered the question related to the likelihood of readmission. Logistic regression models were constructed using actual 30-day readmission as the dependent variable to determine whether patients could predict their own readmissions and whether patient attitudes and beliefs about their care were predictive of subsequent readmission. Patient survey responses were entered as continuous independent variables (ranging from 1-4 or 1-5, as appropriate). Multivariable logistic regression was used to determine whether patients could predict their readmissions independent of demographic variables and expected readmission rate (modeled continuously); we repeated this model after dichotomizing the patient’s estimate of the likelihood of readmission as either “unlikely” or “likely.” Patients with missing survey responses were excluded from individual models without imputation. The study was approved by the Johns Hopkins institutional review board.
RESULTS
Responses were obtained from 895 patients. Their median age was 56 years [interquartile range, 43-67], 51.4% were female, and 41.7% were white. Mean SOI was 2.53 (on a 1-4 scale), and median length-of-stay was representative for our medical service at 5.2 days (range, 1-66 days). Family members reported filling out the survey in 57 cases. The primary payer was Medicare in 40.7%, Medicaid in 24.9%, and other in 34.4%. A total of 138 patients (15.4%) were readmitted within 30 days. The Table shows survey responses and associated readmission rates. None of the attitudes related to readmission were predictive of actual readmission. However, patients were able to predict their own readmissions (P = .002 for linear trend). After adjustment for expected readmission rate, race, sex, age, and payer, the trend remained significant (P = .005). Other significant predictors of readmissions in this model included expected readmission rate (P = .002), age (P = .02), and payer (P = .002). After dichotomizing the patient estimate of readmission rate as “unlikely” (N = 581) or “likely” (N = 314), the unadjusted odds ratio associating a patient-estimated risk of readmission as “likely” with actual readmission was 1.8 (95% confidence interval, 1.2-2.5). The adjusted odds ratio (including the variables above) was 1.6 (1.1-2.4).
DISCUSSION
Our findings demonstrate that patients are able to quantify their own readmission risk. This was true even after adjustment for expected readmission rate, age, sex, race, and payer. However, we did not identify any patient attitudes, beliefs, or preferences related to readmission or discharge instructions that were associated with subsequent rehospitalization. Reassuringly, more than 80% of patients who responded to the survey indicated that they would be sad, frustrated, or disappointed should readmission occur. This suggests that most patients are invested in preventing rehospitalization. Also reassuring was that patients indicated that they agreed with the discharge care plan and intended to follow their discharge instructions.
The major limitation of this study is that it was a convenience sample. Surveys were distributed inconsistently by nursing unit staff, preventing us from calculating a response rate. Further, it is possible, if not likely, that those patients with higher levels of engagement were more likely to take the time to respond, enriching our sample with activated patients. Although we allowed family members to fill out surveys on behalf of patients, this was done in fewer than 10% of instances; as such, our data may have limited applicability to patients who are physically or cognitively unable to participate in the discharge process. Finally, in this study, we did not capture readmissions to other facilities.
We conclude that patients are able to predict their own readmissions, even after accounting for other potential predictors of readmission. However, we found no evidence to support the possibility that low levels of engagement, limited trust in the healthcare team, or nonchalance about being readmitted are associated with subsequent rehospitalization. Whether asking patients about their perceived risk of readmission might help target readmission prevention programs deserves further study.
Acknowledgments
Dr. Daniel J. Brotman had full access to the data in the study and takes responsibility for the integrity of the study data and the accuracy of the data analysis. The authors also thank the following individuals for their contributions: Drafting the manuscript (Brotman); revising the manuscript for important intellectual content (Brotman, Shihab, Tieu, Cheng, Bertram, Hoyer, Deutschendorf); acquiring the data (Brotman, Shihab, Tieu, Cheng, Bertram, Deutschendorf); interpreting the data (Brotman, Shihab, Tieu, Cheng, Bertram, Hoyer, Deutschendorf); and analyzing the data (Brotman). The authors thank nursing leadership and nursing unit staff for their assistance in distributing surveys.
Funding support: Johns Hopkins Hospitalist Scholars Program
Disclosures: The authors have declared no conflicts of interest.
1. Hoyer EH, Brotman DJ, Apfel A, et al. Improving outcomes after hospitalization: a prospective observational multi-center evaluation of care-coordination strategies on 30-day readmissions to Maryland hospitals. J Gen Int Med. 2017 (in press). PubMed
2. Oduyebo I, Lehmann CU, Pollack CE, et al. Association of self-reported hospital discharge handoffs with 30-day readmissions. JAMA Intern Med. 2013;173(8):624-629. PubMed
3. Hoyer EH, Needham DM, Atanelov L, Knox B, Friedman M, Brotman DJ. Association of impaired functional status at hospital discharge and subsequent rehospitalization. J Hosp Med. 2014;9(5):277-282. PubMed
4. Hoyer EH, Needham DM, Miller J, Deutschendorf A, Friedman M, Brotman DJ. Functional status impairment is associated with unplanned readmissions. Arch Phys Med Rehabil. 2013;94(10):1951-1958. PubMed
5. Hoyer EH, Odonkor CA, Bhatia SN, Leung C, Deutschendorf A, Brotman DJ. Association between days to complete inpatient discharge summaries with all-payer hospital readmissions in Maryland. J Hosp Med. 2016;11(6):393-400. PubMed
© 2018 Society of Hospital Medicine
A Method for Attributing Patient-Level Metrics to Rotating Providers in an Inpatient Setting
Hospitalists’ performance is routinely evaluated by third-party payers, employers, and patients. As hospitalist programs mature, there is a need to develop processes to identify, internally measure, and report on individual and group performance. We know from Society of Hospital Medicine (SHM) data that a significant amount of hospitalists’ total compensation is at least partially based on performance. Often this is based at least in part on quality data. In 2006, SHM issued a white paper detailing the key elements of a successful performance monitoring and reporting process.1,2 Recommendations included the identification of meaningful operational and clinical performance metrics, and the ability to monitor and report both group and individual metrics was highlighted as an essential component. There is evidence that comparison of individual provider performance with that of their peers is a necessary element of successful provider dashboards.3 Additionally, regular feedback and a clear, visual presentation of the data are important components of successful provider feedback dashboards.3-6
Much of the literature regarding provider feedback dashboards has been based in the outpatient setting. The majority of these dashboards focus on the management of chronic illnesses (eg, diabetes and hypertension), rates of preventative care services (eg, colonoscopy or mammogram), or avoidance of unnecessary care (eg, antibiotics for sinusitis).4,5 Unlike in the outpatient setting, in which 1 provider often provides a majority of the care for a given episode of care, hospitalized patients are often cared for by multiple providers, challenging the appropriate attribution of patient-level metrics to specific providers. Under the standard approach, an entire hospitalization is attributed to 1 physician, generally the attending of record for the hospitalization, which may be the admitting provider or the discharging provider, depending on the approach used by the hospital. However, assigning responsibility for an entire hospitalization to a provider who may have only seen the patient for a small percentage of a hospitalization may jeopardize the validity of metrics. As provider metrics are increasingly being used for compensation, it is important to ensure that the method for attribution correctly identifies the providers caring for patients. To our knowledge there is no gold standard approach for attributing metrics to providers when patients are cared for by multiple providers, and the standard attending of record–based approach may lack face validity in many cases.
We aimed to develop and operationalize a system to more fairly attribute patient-level data to individual providers across a single hospitalization even when multiple providers cared for the patient. We then compared our methodology to the standard approach, in which the attending of record receives full attribution for each metric, to determine the difference on a provider level between the 2 models.
METHODS
Clinical Setting
The Johns Hopkins Hospital is a 1145-bed, tertiary-care hospital. Over the years of this project, the Johns Hopkins Hospitalist Program was an approximately 20-physician group providing care in a variety of settings, including a dedicated hospitalist floor, where this metrics program was initiated. Hospitalists in this setting work Monday through Friday, with 1 hospitalist and a moonlighter covering on the weekends. Admissions are performed by an admitter, and overnight care is provided by a nocturnist. Initially 17 beds, this unit expanded to 24 beds in June 2012. For the purposes of this article, we included all general medicine patients admitted to this floor between July 1, 2010, and June 30, 2014, who were cared for by hospitalists. During this period, all patients were inpatients; no patients were admitted under observation status. All of these patients were cared for by hospitalists without housestaff or advanced practitioners. Since 2014, the metrics program has been expanded to other hospitalist-run services in the hospital, but for simplicity, we have not presented these more recent data.
Individual Provider Metrics
Metrics were chosen to reflect institutional quality and efficiency priorities. Our choice of metrics was restricted to those that (1) plausibly reflect provider performance, at least in part, and (2) could be accessed in electronic form (without any manual chart review). Whenever possible, we chose metrics with objective data. Additionally, because funding for this effort was provided by the hospital, we sought to ensure that enough of the metrics were related to cost to justify ongoing hospital support of the project. SAS 9.2 (SAS Institute Inc, Cary, NC) was used to calculate metric weights. Specific metrics included American College of Chest Physicians (ACCP)–compliant venous thromboembolism (VTE) prophylaxis,7 observed-to-expected length of stay (LOS) ratio, percentage of discharges per day, discharges before 3 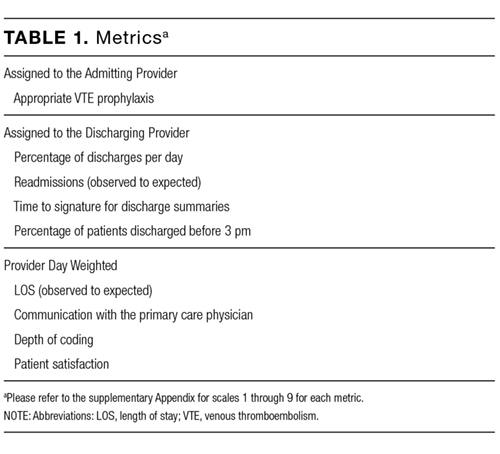
Appropriate prophylaxis for VTE was calculated by using an algorithm embedded within the computerized provider order entry system, which assessed the prescription of ACCP-compliant VTE prophylaxis within 24 hours following admission. This included a risk assessment, and credit was given for no prophylaxis and/or mechanical and/or pharmacologic prophylaxis per the ACCP guidelines.7
Observed-to-expected LOS was defined by using the University HealthSystem Consortium (UHC; now Vizient Inc) expected LOS for the given calendar year. This approach incorporates patient diagnoses, demographics, and other administrative variables to define an expected LOS for each patient.
The percent of patients discharged per day was defined from billing data as the percentage of a provider’s evaluation and management charges that were the final charge of a patient’s stay (regardless of whether a discharge day service was coded).
Discharge prior to 3
Depth of coding was defined as the number of coded diagnoses submitted to the Maryland Health Services Cost Review Commission for determining payment and was viewed as an indicator of the thoroughness of provider documentation.
Patient satisfaction was defined at the patient level (for those patients who turned in patient satisfaction surveys) as the pooled value of the 5 provider questions on the hospital’s patient satisfaction survey administered by Press Ganey: “time the physician spent with you,” “did the physician show concern for your questions/worries,” “did the physician keep you informed,” “friendliness/courtesy of the physician,” and “skill of the physician.”8
Readmission rates were defined as same-hospital readmissions divided by the total number of patients discharged by a given provider, with exclusions based on the Centers for Medicare and Medicaid Services hospital-wide, all-cause readmission measure.1 The expected same-hospital readmission rate was defined for each patient as the observed readmission rate in the entire UHC (Vizient) data set for all patients with the same All Patient Refined Diagnosis Related Group and severity of illness, as we have described previously.9
Communication with the primary care provider was the only self-reported metric used. It was based on a mandatory prompt on the discharge worksheet in the electronic medical record (EMR). Successful communication with the outpatient provider was defined as verbal or electronic communication by the hospitalist with the outpatient provider. Partial (50%) credit was given for providers who attempted but were unsuccessful in communicating with the outpatient provider, for patients for whom the provider had access to the Johns Hopkins EMR system, and for planned admissions without new or important information to convey. No credit was given for providers who indicated that communication was not indicated, who indicated that a patient and/or family would update the provider, or who indicated that the discharge summary would be sufficient.9 Because the discharge worksheet could be initiated at any time during the hospitalization, providers could document communication with the outpatient provider at any point during hospitalization.
Discharge summary turnaround was defined as the average number of days elapsed between the day of discharge and the signing of the discharge summary in the EMR.
Assigning Ownership of Patients to Individual Providers
Using billing data, we assigned ownership of patient care based on the type, timing, and number of charges that occurred during each hospitalization (Figure 1). Eligible charges included all history and physical (codes 99221, 99222, and 99223), subsequent care (codes 99231, 99232, and 99233), and discharge charges (codes 99238 and 99239).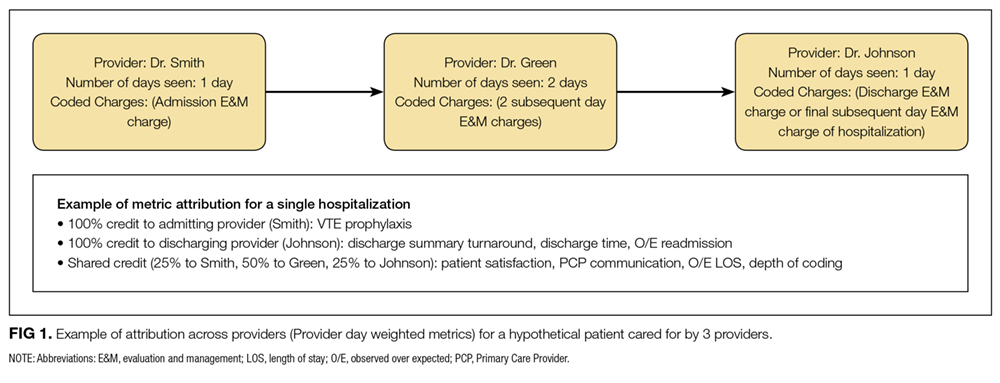
By using a unique identifier assigned for each hospitalization, professional fees submitted by providers were used to identify which provider saw the patient on the admission day, discharge day, as well as subsequent care days. Providers’ productivity, bonus supplements, and policy compliance were determined by using billing data, which encouraged the prompt submittal of charges.
The provider who billed the admission history and physical (codes 99221, 99222, and 99223) within 1 calendar date of the patient’s initial admission was defined as the admitting provider. Patients transferred to the hospitalist service from other services were not assigned an admitting hospitalist. The sole metric assigned to the admitting hospitalist was ACCP-compliant VTE prophylaxis.
The provider who billed the final subsequent care or discharge code (codes 99231, 99232, 99233, 99238, and 99239) within 1 calendar date of discharge was defined as the discharging provider. For hospitalizations characterized by a single provider charge (eg, for patients admitted and discharged on the same day), the provider billing this charge was assigned as both the admitting and discharging physician. Patients upgraded to the intensive care unit (ICU) were not counted as a discharge unless the patient was downgraded and discharged from the hospitalist service. The discharging provider was assigned responsibility for the time of discharge, the percent of patients discharged per day, the discharge summary turnaround time, and hospital readmissions.
Metrics that were assigned to multiple providers for a single hospitalization were termed “provider day–weighted” metrics. The formula for calculating the weight for each provider day–weighted metric was as follows: weight for provider A = [number of daily charges billed by provider A] divided by [LOS +1]. The initial hospital day was counted as day 0. LOS plus 1 was used to recognize that a typical hospitalization will have a charge on the day of admission (day 0) and a charge on the day of discharge such that an LOS of 2 days (eg, a patient admitted on Monday and discharged on Wednesday) will have 3 daily charges. Provider day–weighted metrics included patient satisfaction, communication with the outpatient provider, depth of coding, and observed-to-expected LOS.
Our billing software prevented providers from the same group from billing multiple daily charges, thus ensuring that there were no duplicated charges submitted for a given day.
Presenting Results
Providers were only shown data from the day-weighted approach. For ease of visual interpretation, scores for each metric were scaled ordinally from 1 (worst performance) to 9 (best performance; Table 1). Data were displayed in a dashboard format on a password-protected website for each provider to view his or her own data relative to that of the hospitalist peer group. The dashboard was implemented in this format on July 1, 2011. Data were updated quarterly (Figure 2).
Results were displayed in a polyhedral or spider-web graph (Figure 2). Provider and group metrics were scaled according to predefined benchmarks established for each metric and standardized to a scale ranging from 1 to 9. The scale for each metric was set based on examining historical data and group median performance on the metrics to ensure that there was a range of performance (ie, to avoid having most hospitalists scoring a 1 or 9). Scaling thresholds were periodically adjusted as appropriate to maintain good visual discrimination. Higher scores (creating a larger-volume polygon) are desirable even for metrics such as LOS, for which a low value is desirable. Both a spider-web graph and trends over time were available to the provider (Figure 2). These graphs display a comparison of the individual provider scores for each metric to the hospitalist group average for that metric.
Comparison with the Standard (Attending of Record) Method of Attribution
For the purposes of this report, we sought to determine whether there were meaningful differences between our day-weighted approach versus the standard method of attribution, in which the attending of record is assigned responsibility for each metric that would not have been attributed to the discharging attending under both methods. Our goal was to determine where and whether there was a meaningful difference between the 2 methodologies, recognizing that the degree of difference between these 2 methodologies might vary in other institutions and settings. In our hospital, the attending of record is generally the discharging attending. In order to compare the 2 methodologies, we arbitrarily picked 2015 to retrospectively evaluate the differences between these 2 methods of attribution. We did not display or provide data using the standard methodology to providers at any point; this approach was used only for the purposes of this report. Because these metrics are intended to evaluate relative provider performance, we assigned a percentile to each provider for his or her performance on the given metric using our attribution methodology and then, similarly, assigned a percentile to each provider using the standard methodology. This yielded 2 percentile scores for each provider and each metric. We then compared these percentile ranks for providers in 2 ways: (1) we determined how often providers who scored in the top half of the group for a given metric (above the 50th percentile) also scored in the top half of the group for that metric by using the other calculation method, and (2) we calculated the absolute value of the difference in percentiles between the 2 methods to characterize the impact on a provider’s ranking for that metric that might result from switching to the other method. For instance, if a provider scored at the 20th percentile for the group in patient satisfaction with 1 attribution method and scored at the 40th percentile for the group in patient satisfaction using the other method, the absolute change in percentile would be 20 percentile points. But, this provider would still be below the 50th percentile by both methods (concordant bottom half performance). We did not perform this comparison for metrics assigned to the discharging provider (such as discharge summary turnaround time or readmissions) because the attending of record designation is assigned to the discharging provider at our hospital.
RESULTS
The dashboard was successfully operationalized on July 1, 2011, with displays visible to providers as shown in Figure 2. Consistent with the principles of providing effective performance feedback to providers, the display simultaneously showed providers their individual performance as well as the performance of their peers. Providers were able to view their spider-web plot for prior quarters. Not shown are additional views that allowed providers to see quarterly trends in their data versus their peers across several fiscal years. Also available to providers was their ranking relative to their peers for each metric; specific peers were deidentified in the display.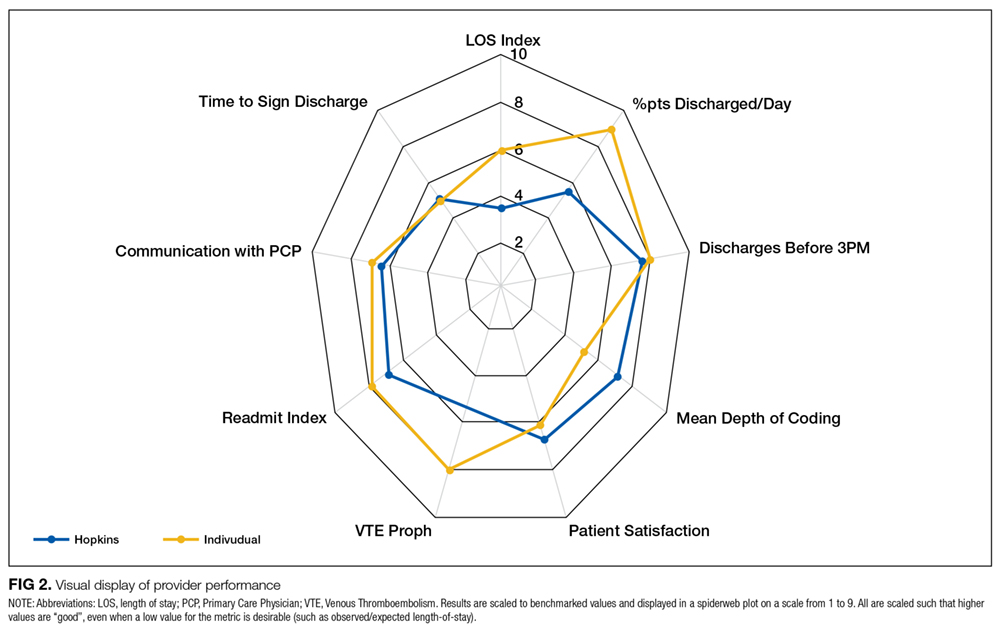
There was notable discordance between provider rankings between the 2 methodologies, as shown in Table 2. Provider performance above or below the median was concordant 56% to 75% of the time (depending on the particular metric), indicating substantial discordance because top-half or bottom-half concordance would be expected to occur by chance 50% of the time. Although the provider percentile differences between the 2 methods tended to be modest for most providers (the median difference between the methods was 13 to 22 percentile points for the various metrics), there were some providers for whom the method of calculation dramatically impacted their rankings. For 5 of the 6 metrics we examined, at least 1 provider had a 50-percentile or greater change in his or her ranking based on the method used. This indicates that at least some providers would have had markedly different scores relative to their peers had we used the alternative methodology (Table 2). In VTE prophylaxis, for example, at least 1 provider had a 94-percentile change in his or her ranking; similarly, a provider had an 88-perentile change in his or her LOS ranking between the 2 methodologies.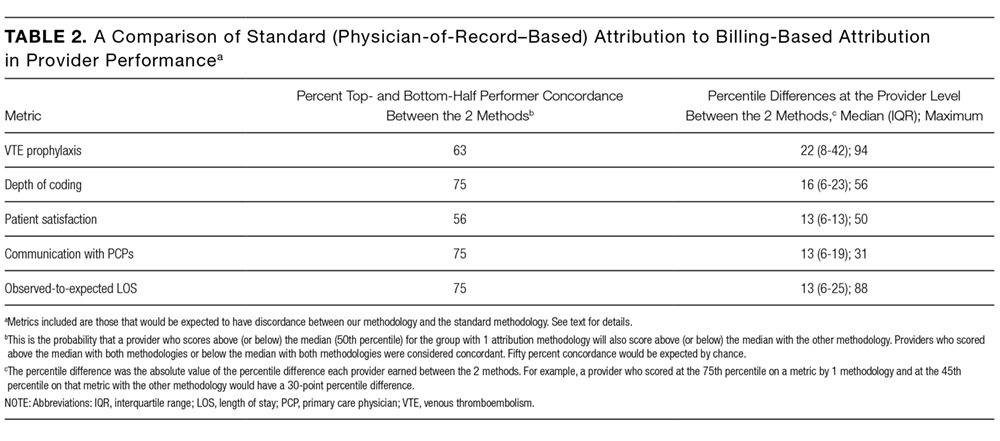
DISCUSSION
We found that it is possible to assign metrics across 1 hospital stay to multiple providers by using billing data. We also found a meaningful discrepancy in how well providers scored (relative to their peers) based on the method used for attribution. These results imply that hospitals should consider attributing performance metrics based on ascribed ownership from billing data and not just from attending of record status.
As hospitalist programs and providers in general are increasingly being asked to develop dashboards to monitor individual and group performance, correctly attributing care to providers is likely to become increasingly important. Experts agree that principles of effective provider performance dashboards include ranking individual provider performance relative to peers, clearly displaying data in an easily accessible format, and ensuring that data can be credibly attributed to the individual provider.3,4,6 However, there appears to be no gold standard method for attribution, especially in the inpatient setting. Our results imply that hospitals should consider attributing performance metrics based on ascribed ownership from billing data and not just from attending of record status.
Several limitations of our findings are important to consider. First, our program is a relatively small, academic group with handoffs that typically occur every 1 to 2 weeks and sometimes with additional handoffs on weekends. Different care patterns and settings might impact the utility of our attribution methodology relative to the standard methodology. Additionally, it is important to note that the relative merits of the different methodologies cannot be ascertained from our comparison. We can demonstrate discordance between the attribution methodologies, but we cannot say that 1 method is correct and the other is flawed. Although we believe that our day-weighted approach feels fairer to providers based on group input and feedback, we did not conduct a formal survey to examine providers’ preferences for the standard versus day-weighted approaches. The appropriateness of a particular attribution method needs to be assessed locally and may vary based on the clinical setting. For instance, on a service in which patients are admitted for procedures, it may make more sense to attribute the outcome of the case to the proceduralist even if that provider did not bill for the patient’s care on a daily basis. Finally, the computational requirements of our methodology are not trivial and require linking billing data with administrative patient-level data, which may be challenging to operationalize in some institutions.
These limitations aside, we believe that our attribution methodology has face validity. For example, a provider might be justifiably frustrated if, using the standard methodology, he or she is charged with the LOS of a patient who had been hospitalized for months, particularly if that patient is discharged shortly after the provider assumes care. Our method addresses this type of misattribution. Particularly when individual provider compensation is based on performance on metrics (as is the case at our institution), optimizing provider attribution to particular patients may be important, and face validity may be required for group buy-in.
In summary, we have demonstrated that it is possible to use billing data to assign ownership of patients to multiple providers over 1 hospital stay. This could be applied to other hospitalist programs as well as other healthcare settings in which multiple providers care for patients during 1 healthcare encounter (eg, ICUs).
Disclosure
The authors declare they have no relevant conflicts of interest.
1. Horwitz L, Partovian C, Lin Z, et al. Hospital-Wide (All-Condition) 30‐Day Risk-Standardized Readmission Measure. https://www.cms.gov/Medicare/Quality-Initiatives-Patient-Assessment-Instruments/MMS/downloads/MMSHospital-WideAll-ConditionReadmissionRate.pdf. Accessed March 6, 2015.
2. Medicine SoH. Measuring Hospitalist Performance: Metrics, Reports, and Dashboards. 2007; https://www.hospitalmedicine.org/Web/Practice_Management/Products_and_Programs/measure_hosp_perf_metrics_reports_dashboards.aspx. Accessed May 12, 2013.
3. Teleki SS, Shaw R, Damberg CL, McGlynn EA. Providing performance feedback to individual physicians: current practice and emerging lessons. Santa Monica, CA: RAND Corporation; 2006. 1-47. https://www.rand.org/content/dam/rand/pubs/working_papers/2006/RAND_WR381.pdf. Accessed August, 2017.
4. Brehaut JC, Colquhoun HL, Eva KW, et al. Practice Feedback Interventions: 15 Suggestions for Optimizing Effectiveness Practice Feedback Interventions. Ann Intern Med. 2016;164(6):435-441. PubMed
5. Dowding D, Randell R, Gardner P, et al. Dashboards for improving patient care: review of the literature. Int J Med Inform. 2015;84(2):87-100. PubMed
6. Landon BE, Normand S-LT, Blumenthal D, Daley J. Physician clinical performance assessment: prospects and barriers. JAMA. 2003;290(9):1183-1189. PubMed
7. Guyatt GH, Akl EA, Crowther M, Gutterman DD, Schuünemann HJ. Executive summary: Antit hrombotic therapy and prevention of thrombosis, 9th ed: American College of Chest Physicians evidence-based clinical practice guidelines. Ann Intern Med. 2012;141(2 suppl):7S-47S. PubMed
8. Siddiqui Z, Qayyum R, Bertram A, et al. Does Provider Self-reporting of Etiquette Behaviors Improve Patient Experience? A Randomized Controlled Trial. J Hosp Med. 2017;12(6):402-406. PubMed
9. Oduyebo I, Lehmann CU, Pollack CE, et al. Association of self-reported hospital discharge handoffs with 30-day readmissions. JAMA Intern Med. 2013;173(8):624-629. PubMed
Hospitalists’ performance is routinely evaluated by third-party payers, employers, and patients. As hospitalist programs mature, there is a need to develop processes to identify, internally measure, and report on individual and group performance. We know from Society of Hospital Medicine (SHM) data that a significant amount of hospitalists’ total compensation is at least partially based on performance. Often this is based at least in part on quality data. In 2006, SHM issued a white paper detailing the key elements of a successful performance monitoring and reporting process.1,2 Recommendations included the identification of meaningful operational and clinical performance metrics, and the ability to monitor and report both group and individual metrics was highlighted as an essential component. There is evidence that comparison of individual provider performance with that of their peers is a necessary element of successful provider dashboards.3 Additionally, regular feedback and a clear, visual presentation of the data are important components of successful provider feedback dashboards.3-6
Much of the literature regarding provider feedback dashboards has been based in the outpatient setting. The majority of these dashboards focus on the management of chronic illnesses (eg, diabetes and hypertension), rates of preventative care services (eg, colonoscopy or mammogram), or avoidance of unnecessary care (eg, antibiotics for sinusitis).4,5 Unlike in the outpatient setting, in which 1 provider often provides a majority of the care for a given episode of care, hospitalized patients are often cared for by multiple providers, challenging the appropriate attribution of patient-level metrics to specific providers. Under the standard approach, an entire hospitalization is attributed to 1 physician, generally the attending of record for the hospitalization, which may be the admitting provider or the discharging provider, depending on the approach used by the hospital. However, assigning responsibility for an entire hospitalization to a provider who may have only seen the patient for a small percentage of a hospitalization may jeopardize the validity of metrics. As provider metrics are increasingly being used for compensation, it is important to ensure that the method for attribution correctly identifies the providers caring for patients. To our knowledge there is no gold standard approach for attributing metrics to providers when patients are cared for by multiple providers, and the standard attending of record–based approach may lack face validity in many cases.
We aimed to develop and operationalize a system to more fairly attribute patient-level data to individual providers across a single hospitalization even when multiple providers cared for the patient. We then compared our methodology to the standard approach, in which the attending of record receives full attribution for each metric, to determine the difference on a provider level between the 2 models.
METHODS
Clinical Setting
The Johns Hopkins Hospital is a 1145-bed, tertiary-care hospital. Over the years of this project, the Johns Hopkins Hospitalist Program was an approximately 20-physician group providing care in a variety of settings, including a dedicated hospitalist floor, where this metrics program was initiated. Hospitalists in this setting work Monday through Friday, with 1 hospitalist and a moonlighter covering on the weekends. Admissions are performed by an admitter, and overnight care is provided by a nocturnist. Initially 17 beds, this unit expanded to 24 beds in June 2012. For the purposes of this article, we included all general medicine patients admitted to this floor between July 1, 2010, and June 30, 2014, who were cared for by hospitalists. During this period, all patients were inpatients; no patients were admitted under observation status. All of these patients were cared for by hospitalists without housestaff or advanced practitioners. Since 2014, the metrics program has been expanded to other hospitalist-run services in the hospital, but for simplicity, we have not presented these more recent data.
Individual Provider Metrics
Metrics were chosen to reflect institutional quality and efficiency priorities. Our choice of metrics was restricted to those that (1) plausibly reflect provider performance, at least in part, and (2) could be accessed in electronic form (without any manual chart review). Whenever possible, we chose metrics with objective data. Additionally, because funding for this effort was provided by the hospital, we sought to ensure that enough of the metrics were related to cost to justify ongoing hospital support of the project. SAS 9.2 (SAS Institute Inc, Cary, NC) was used to calculate metric weights. Specific metrics included American College of Chest Physicians (ACCP)–compliant venous thromboembolism (VTE) prophylaxis,7 observed-to-expected length of stay (LOS) ratio, percentage of discharges per day, discharges before 3
Appropriate prophylaxis for VTE was calculated by using an algorithm embedded within the computerized provider order entry system, which assessed the prescription of ACCP-compliant VTE prophylaxis within 24 hours following admission. This included a risk assessment, and credit was given for no prophylaxis and/or mechanical and/or pharmacologic prophylaxis per the ACCP guidelines.7
Observed-to-expected LOS was defined by using the University HealthSystem Consortium (UHC; now Vizient Inc) expected LOS for the given calendar year. This approach incorporates patient diagnoses, demographics, and other administrative variables to define an expected LOS for each patient.
The percent of patients discharged per day was defined from billing data as the percentage of a provider’s evaluation and management charges that were the final charge of a patient’s stay (regardless of whether a discharge day service was coded).
Discharge prior to 3
Depth of coding was defined as the number of coded diagnoses submitted to the Maryland Health Services Cost Review Commission for determining payment and was viewed as an indicator of the thoroughness of provider documentation.
Patient satisfaction was defined at the patient level (for those patients who turned in patient satisfaction surveys) as the pooled value of the 5 provider questions on the hospital’s patient satisfaction survey administered by Press Ganey: “time the physician spent with you,” “did the physician show concern for your questions/worries,” “did the physician keep you informed,” “friendliness/courtesy of the physician,” and “skill of the physician.”8
Readmission rates were defined as same-hospital readmissions divided by the total number of patients discharged by a given provider, with exclusions based on the Centers for Medicare and Medicaid Services hospital-wide, all-cause readmission measure.1 The expected same-hospital readmission rate was defined for each patient as the observed readmission rate in the entire UHC (Vizient) data set for all patients with the same All Patient Refined Diagnosis Related Group and severity of illness, as we have described previously.9
Communication with the primary care provider was the only self-reported metric used. It was based on a mandatory prompt on the discharge worksheet in the electronic medical record (EMR). Successful communication with the outpatient provider was defined as verbal or electronic communication by the hospitalist with the outpatient provider. Partial (50%) credit was given for providers who attempted but were unsuccessful in communicating with the outpatient provider, for patients for whom the provider had access to the Johns Hopkins EMR system, and for planned admissions without new or important information to convey. No credit was given for providers who indicated that communication was not indicated, who indicated that a patient and/or family would update the provider, or who indicated that the discharge summary would be sufficient.9 Because the discharge worksheet could be initiated at any time during the hospitalization, providers could document communication with the outpatient provider at any point during hospitalization.
Discharge summary turnaround was defined as the average number of days elapsed between the day of discharge and the signing of the discharge summary in the EMR.
Assigning Ownership of Patients to Individual Providers
Using billing data, we assigned ownership of patient care based on the type, timing, and number of charges that occurred during each hospitalization (Figure 1). Eligible charges included all history and physical (codes 99221, 99222, and 99223), subsequent care (codes 99231, 99232, and 99233), and discharge charges (codes 99238 and 99239).
By using a unique identifier assigned for each hospitalization, professional fees submitted by providers were used to identify which provider saw the patient on the admission day, discharge day, as well as subsequent care days. Providers’ productivity, bonus supplements, and policy compliance were determined by using billing data, which encouraged the prompt submittal of charges.
The provider who billed the admission history and physical (codes 99221, 99222, and 99223) within 1 calendar date of the patient’s initial admission was defined as the admitting provider. Patients transferred to the hospitalist service from other services were not assigned an admitting hospitalist. The sole metric assigned to the admitting hospitalist was ACCP-compliant VTE prophylaxis.
The provider who billed the final subsequent care or discharge code (codes 99231, 99232, 99233, 99238, and 99239) within 1 calendar date of discharge was defined as the discharging provider. For hospitalizations characterized by a single provider charge (eg, for patients admitted and discharged on the same day), the provider billing this charge was assigned as both the admitting and discharging physician. Patients upgraded to the intensive care unit (ICU) were not counted as a discharge unless the patient was downgraded and discharged from the hospitalist service. The discharging provider was assigned responsibility for the time of discharge, the percent of patients discharged per day, the discharge summary turnaround time, and hospital readmissions.
Metrics that were assigned to multiple providers for a single hospitalization were termed “provider day–weighted” metrics. The formula for calculating the weight for each provider day–weighted metric was as follows: weight for provider A = [number of daily charges billed by provider A] divided by [LOS +1]. The initial hospital day was counted as day 0. LOS plus 1 was used to recognize that a typical hospitalization will have a charge on the day of admission (day 0) and a charge on the day of discharge such that an LOS of 2 days (eg, a patient admitted on Monday and discharged on Wednesday) will have 3 daily charges. Provider day–weighted metrics included patient satisfaction, communication with the outpatient provider, depth of coding, and observed-to-expected LOS.
Our billing software prevented providers from the same group from billing multiple daily charges, thus ensuring that there were no duplicated charges submitted for a given day.
Presenting Results
Providers were only shown data from the day-weighted approach. For ease of visual interpretation, scores for each metric were scaled ordinally from 1 (worst performance) to 9 (best performance; Table 1). Data were displayed in a dashboard format on a password-protected website for each provider to view his or her own data relative to that of the hospitalist peer group. The dashboard was implemented in this format on July 1, 2011. Data were updated quarterly (Figure 2).
Results were displayed in a polyhedral or spider-web graph (Figure 2). Provider and group metrics were scaled according to predefined benchmarks established for each metric and standardized to a scale ranging from 1 to 9. The scale for each metric was set based on examining historical data and group median performance on the metrics to ensure that there was a range of performance (ie, to avoid having most hospitalists scoring a 1 or 9). Scaling thresholds were periodically adjusted as appropriate to maintain good visual discrimination. Higher scores (creating a larger-volume polygon) are desirable even for metrics such as LOS, for which a low value is desirable. Both a spider-web graph and trends over time were available to the provider (Figure 2). These graphs display a comparison of the individual provider scores for each metric to the hospitalist group average for that metric.
Comparison with the Standard (Attending of Record) Method of Attribution
For the purposes of this report, we sought to determine whether there were meaningful differences between our day-weighted approach versus the standard method of attribution, in which the attending of record is assigned responsibility for each metric that would not have been attributed to the discharging attending under both methods. Our goal was to determine where and whether there was a meaningful difference between the 2 methodologies, recognizing that the degree of difference between these 2 methodologies might vary in other institutions and settings. In our hospital, the attending of record is generally the discharging attending. In order to compare the 2 methodologies, we arbitrarily picked 2015 to retrospectively evaluate the differences between these 2 methods of attribution. We did not display or provide data using the standard methodology to providers at any point; this approach was used only for the purposes of this report. Because these metrics are intended to evaluate relative provider performance, we assigned a percentile to each provider for his or her performance on the given metric using our attribution methodology and then, similarly, assigned a percentile to each provider using the standard methodology. This yielded 2 percentile scores for each provider and each metric. We then compared these percentile ranks for providers in 2 ways: (1) we determined how often providers who scored in the top half of the group for a given metric (above the 50th percentile) also scored in the top half of the group for that metric by using the other calculation method, and (2) we calculated the absolute value of the difference in percentiles between the 2 methods to characterize the impact on a provider’s ranking for that metric that might result from switching to the other method. For instance, if a provider scored at the 20th percentile for the group in patient satisfaction with 1 attribution method and scored at the 40th percentile for the group in patient satisfaction using the other method, the absolute change in percentile would be 20 percentile points. But, this provider would still be below the 50th percentile by both methods (concordant bottom half performance). We did not perform this comparison for metrics assigned to the discharging provider (such as discharge summary turnaround time or readmissions) because the attending of record designation is assigned to the discharging provider at our hospital.
RESULTS
The dashboard was successfully operationalized on July 1, 2011, with displays visible to providers as shown in Figure 2. Consistent with the principles of providing effective performance feedback to providers, the display simultaneously showed providers their individual performance as well as the performance of their peers. Providers were able to view their spider-web plot for prior quarters. Not shown are additional views that allowed providers to see quarterly trends in their data versus their peers across several fiscal years. Also available to providers was their ranking relative to their peers for each metric; specific peers were deidentified in the display.
There was notable discordance between provider rankings between the 2 methodologies, as shown in Table 2. Provider performance above or below the median was concordant 56% to 75% of the time (depending on the particular metric), indicating substantial discordance because top-half or bottom-half concordance would be expected to occur by chance 50% of the time. Although the provider percentile differences between the 2 methods tended to be modest for most providers (the median difference between the methods was 13 to 22 percentile points for the various metrics), there were some providers for whom the method of calculation dramatically impacted their rankings. For 5 of the 6 metrics we examined, at least 1 provider had a 50-percentile or greater change in his or her ranking based on the method used. This indicates that at least some providers would have had markedly different scores relative to their peers had we used the alternative methodology (Table 2). In VTE prophylaxis, for example, at least 1 provider had a 94-percentile change in his or her ranking; similarly, a provider had an 88-perentile change in his or her LOS ranking between the 2 methodologies.
DISCUSSION
We found that it is possible to assign metrics across 1 hospital stay to multiple providers by using billing data. We also found a meaningful discrepancy in how well providers scored (relative to their peers) based on the method used for attribution. These results imply that hospitals should consider attributing performance metrics based on ascribed ownership from billing data and not just from attending of record status.
As hospitalist programs and providers in general are increasingly being asked to develop dashboards to monitor individual and group performance, correctly attributing care to providers is likely to become increasingly important. Experts agree that principles of effective provider performance dashboards include ranking individual provider performance relative to peers, clearly displaying data in an easily accessible format, and ensuring that data can be credibly attributed to the individual provider.3,4,6 However, there appears to be no gold standard method for attribution, especially in the inpatient setting. Our results imply that hospitals should consider attributing performance metrics based on ascribed ownership from billing data and not just from attending of record status.
Several limitations of our findings are important to consider. First, our program is a relatively small, academic group with handoffs that typically occur every 1 to 2 weeks and sometimes with additional handoffs on weekends. Different care patterns and settings might impact the utility of our attribution methodology relative to the standard methodology. Additionally, it is important to note that the relative merits of the different methodologies cannot be ascertained from our comparison. We can demonstrate discordance between the attribution methodologies, but we cannot say that 1 method is correct and the other is flawed. Although we believe that our day-weighted approach feels fairer to providers based on group input and feedback, we did not conduct a formal survey to examine providers’ preferences for the standard versus day-weighted approaches. The appropriateness of a particular attribution method needs to be assessed locally and may vary based on the clinical setting. For instance, on a service in which patients are admitted for procedures, it may make more sense to attribute the outcome of the case to the proceduralist even if that provider did not bill for the patient’s care on a daily basis. Finally, the computational requirements of our methodology are not trivial and require linking billing data with administrative patient-level data, which may be challenging to operationalize in some institutions.
These limitations aside, we believe that our attribution methodology has face validity. For example, a provider might be justifiably frustrated if, using the standard methodology, he or she is charged with the LOS of a patient who had been hospitalized for months, particularly if that patient is discharged shortly after the provider assumes care. Our method addresses this type of misattribution. Particularly when individual provider compensation is based on performance on metrics (as is the case at our institution), optimizing provider attribution to particular patients may be important, and face validity may be required for group buy-in.
In summary, we have demonstrated that it is possible to use billing data to assign ownership of patients to multiple providers over 1 hospital stay. This could be applied to other hospitalist programs as well as other healthcare settings in which multiple providers care for patients during 1 healthcare encounter (eg, ICUs).
Disclosure
The authors declare they have no relevant conflicts of interest.
1. Horwitz L, Partovian C, Lin Z, et al. Hospital-Wide (All-Condition) 30‐Day Risk-Standardized Readmission Measure. https://www.cms.gov/Medicare/Quality-Initiatives-Patient-Assessment-Instruments/MMS/downloads/MMSHospital-WideAll-ConditionReadmissionRate.pdf. Accessed March 6, 2015.
2. Medicine SoH. Measuring Hospitalist Performance: Metrics, Reports, and Dashboards. 2007; https://www.hospitalmedicine.org/Web/Practice_Management/Products_and_Programs/measure_hosp_perf_metrics_reports_dashboards.aspx. Accessed May 12, 2013.
3. Teleki SS, Shaw R, Damberg CL, McGlynn EA. Providing performance feedback to individual physicians: current practice and emerging lessons. Santa Monica, CA: RAND Corporation; 2006. 1-47. https://www.rand.org/content/dam/rand/pubs/working_papers/2006/RAND_WR381.pdf. Accessed August, 2017.
4. Brehaut JC, Colquhoun HL, Eva KW, et al. Practice Feedback Interventions: 15 Suggestions for Optimizing Effectiveness Practice Feedback Interventions. Ann Intern Med. 2016;164(6):435-441. PubMed
5. Dowding D, Randell R, Gardner P, et al. Dashboards for improving patient care: review of the literature. Int J Med Inform. 2015;84(2):87-100. PubMed
6. Landon BE, Normand S-LT, Blumenthal D, Daley J. Physician clinical performance assessment: prospects and barriers. JAMA. 2003;290(9):1183-1189. PubMed
7. Guyatt GH, Akl EA, Crowther M, Gutterman DD, Schuünemann HJ. Executive summary: Antit hrombotic therapy and prevention of thrombosis, 9th ed: American College of Chest Physicians evidence-based clinical practice guidelines. Ann Intern Med. 2012;141(2 suppl):7S-47S. PubMed
8. Siddiqui Z, Qayyum R, Bertram A, et al. Does Provider Self-reporting of Etiquette Behaviors Improve Patient Experience? A Randomized Controlled Trial. J Hosp Med. 2017;12(6):402-406. PubMed
9. Oduyebo I, Lehmann CU, Pollack CE, et al. Association of self-reported hospital discharge handoffs with 30-day readmissions. JAMA Intern Med. 2013;173(8):624-629. PubMed
© 2017 Society of Hospital Medicine
Reconsidering Hospital Readmission Measures
Hospital readmission rates are a consequential and contentious measure of hospital quality. Readmissions within 30 days of hospital discharge are part of the Centers for Medicare & Medicaid Services (CMS) Value-Based Purchasing Program and are publicly reported. Hospital-wide readmissions and condition-specific readmissions are heavily weighted by US News & World Report in its hospital rankings and in the new CMS Five-Star Quality Rating System.1 However, clinicians and researchers question the construct validity of current readmission measures.2,3
The focus on readmissions began in 2009 when Jencks et al.4 reported that 20% of Medicare patients were readmitted within 30 days after hospital discharge. Policy makers embraced readmission reduction, assuming that a hospital readmission so soon after discharge reflected poor quality of hospital care and that, with focused efforts, hospitals could reduce readmissions and save CMS money. In 2010, the Affordable Care Act introduced an initiative to reduce readmissions and, in 2012, the Hospital Readmission Reduction Program was implemented, financially penalizing hospitals with higher-than-expected readmission rates for patients hospitalized with principal diagnoses of heart failure, myocardial infarction, and pneumonia.5 Readmission measures have since proliferated and now include pay-for-performance metrics for hospitalizations for chronic obstructive pulmonary disease (COPD), coronary artery bypass grafting, and total hip or knee arthroplasty. Measures are also reported for stroke patients and for “hospital-wide readmissions,” a catch-all measure intended to capture readmission rates across most diagnoses, with various exclusions intended to prevent counting planned readmissions (eg, hospitalization for cholecystectomy following a hospitalization for cholecystitis). These measures use claims data to construct hierarchical regression models at the patient and hospital levels, assuming that variation among readmission rates are due to hospital quality effects. The goal of this approach is to level the playing field to avoid penalizing hospitals for caring for sicker patients who are at higher risk for readmission for reasons unrelated to hospital care. Yet hospital readmissions are influenced by a complex set of variables that go well beyond hospital care, some of which may be better captured by existing models than others. Below we review several potential biases in the hospital readmission measures and offer policy recommendations to improve the accuracy of these measures.
Variation in a quality measure is influenced by the quality of the underlying data, the mix of patients served, bias in the performance measure, and the degree of systemic or random error.6 Hospital readmission rates are subject to multiple sources of variation, and true differences in the quality of care are often a much smaller source of this variation. A recent analysis of patient readmissions following general surgery found that the majority were unrelated to suboptimal medical care.7 Consider 3 scenarios in which a patient with COPD is readmitted 22 days after discharge. In hospital 1, the patient was discharged without a prescription for a steroid inhaler. In hospital 2, the patient was discharged on a steroid inhaler, filled the prescription, and elected not to use it. In hospital 3, the patient was discharged on a steroid inhaler and was provided medical assistance to fill the prescription but still could not afford the $15 copay. In all 3 scenarios, the hospital would be equally culpable under the current readmission measures, suffering financial and reputational penalties.
Yet the hospitals in these scenarios are not equally culpable. Variation in the mix of patients and bias in the measure impacted performance. Hospital 1 should clearly be held accountable for the readmission. In the cases of hospitals 2 and 3, the situations are more nuanced. More education about COPD, financial investment by the hospital to cover a copay, or a different transitional care approach may have increased the likelihood of patient compliance, but, ultimately, hospitals 2 and 3 were impacted by personal health behaviors and access to public health services and financial assistance, and the readmissions were less within their control.8
To be valid, hospital readmission measures would need to ensure that all hospitals are similar in patient characteristics and in the need for an availability of public health services. Yet these factors vary among hospitals and cannot be accounted for by models that rely exclusively on patient-level variables, such as the nature and severity of illness. As a result, the existing readmission measures are biased against certain types of hospitals. Hospitals that treat a greater proportion of patients who are socioeconomically disadvantaged; who lack access to primary care, medical assistance, or public health programs; and who have substance abuse and mental health issues will have higher readmission rates. Hospitals that care for patients who fail initial treatments and require referral for complex care will also have higher readmission rates. These types of patients are not randomly distributed throughout our healthcare system. They are clustered at rural hospitals in underserved areas, certain urban health systems, safety net hospitals, and academic health centers. It is not surprising that readmission penalties have most severely impacted large academic hospitals that care for disadvantaged populations.2 These penalties may have unintended consequences, reducing a hospital’s willingness to care for disadvantaged populations.
While these biases may unfairly harm hospitals caring for disadvantaged patients, the readmission measures may also indirectly harm patients. Low hospital readmission rates are not associated with reduced mortality and, in some instances, track with higher mortality.9-11 This may result from measurement factors (patients who die cannot be readmitted), from neighborhood socioeconomic status (SES) factors that may impact readmissions more,12 or from actual patient harm (some patients need acute care following discharge and may have worse outcomes if that care is delayed).11 Doctors have long recognized this potential risk; empiric evidence now supports them. While mortality measures may also be impacted by sociodemographic variables,13 whether to adjust for SES should be defined by the purpose of the measure. If the measure is meant to evaluate hospital quality (or utilization in the case of readmissions), adjusting for SES is appropriate because it is unrealistic to expect a health system to reduce income inequality and provide safe housing. Failure to adjust for SES, which has a large impact on outcomes, may mask a quality of care issue. Conversely, if the purpose of a measure is for a community to improve population health, then it should not be adjusted for SES because the community could adjust for income inequality.
Despite the complex ethical challenges created by the efforts to reduce readmissions, there has been virtually no public dialogue with patients, physicians, and policy makers regarding how to balance the trade-offs between reducing readmission and maintaining safety. Patients would likely value increased survival more than reduced readmissions, yet the current CMS Five-Star Rating System for hospital quality weighs readmissions equally with mortality in its hospital rankings, potentially misinforming patients. For example, many well-known academic medical centers score well (4 or 5 stars) on mortality and poorly (1 or 2 stars) on readmissions, resulting in a low or average overall score, calling into question face validity and confounding consumers struggling to make decisions about where to seek care. The Medicare Payment Advisory Commission’s Report to the Congress14 highlights the multiple significant systematic and random errors with the hospital readmission data.
Revisiting the Hospital Readmission Measures
Given significant bias in the hospital readmission measures and the ethical challenges imposed by reducing readmissions, potentially at the expense of survival, we believe CMS needs to take action to remedy the problem. First, CMS should drop hospital readmissions as a quality measure from its hospital rankings. Other hospital-rating groups and insurers should do the same. When included in payment schemes, readmissions should not be construed as a quality measure but as a utilization measure, like length of stay.
Second, the Department of Health & Human Services (HHS) should invest in maturing the hospital readmission measures to ensure construct, content, and criterion validity and reliability. No doubt the risk adjustment is complex and may be inherently limited using Medicare claims data. In the case of SES adjustment, for example, limited numbers of SES measures can be constructed from current data sources.8,13 There are other approaches to address this recommendation. For example, HHS could define a preventable readmission as one linked to some process or outcome of hospital care, such as whether the patient was discharged on an inhaler. The National Quality Forum used this approach to define a preventable venous thromboembolic event as one occurring when a patient did not receive appropriate prophylaxis. In this way, only hospital 1 in the 3 scenarios for the patient with COPD would be penalized. However, we recognize that it is not always simple to define specific process measures (eg, prescribing an inhaler) that link to readmission outcomes and that there may be other important yet hard-to-measure interventions (eg, patient and family education) that are important components of patient-centered care and readmission prevention. This is why readmissions are so challenging as a quality measure. If experts cannot define clinician behaviors that have a strong theory of change or are causally related to reduced readmissions, it is hard to call readmissions a modifiable quality measure. Another potential strategy to level the playing field would be to compare readmission rates across peer institutions only. For instance, tertiary-care safety net hospitals would be compared to one another and rural community hospitals would be compared to one another.14 Lastly, new data sources could be added to account for the social, community-level, public health, and personal health factors that heavily influence a patient’s risk for readmission, in addition to hospital-level factors. Appropriate methods will be needed to develop statistical models for risk adjustment; however, this is a complex topic and beyond the scope of the current paper.
Third, HHS could continue to use the current readmission measures as population health measures while supporting multistakeholder teams to better understand how people and their communities, public health agencies, insurers, and healthcare providers can collaborate to help patients thrive and avoid readmissions by addressing true defects in care and care coordination.
While it is understandable why policy makers chose to focus on hospital readmissions, and while we recognize that concerns about the measures were unknown when they were created, emerging evidence demonstrates that the current readmission measures (particularly when used as a quality metric) lack construct validity, contain significant bias and systematic errors, and create ethical tension by rewarding hospitals both financially and reputationally for turning away sick and socially disadvantaged patients who may, consequently, have adverse outcomes. Current readmission measures need to be reconsidered.
Acknowledgments
The authors thank Christine G. Holzmueller, BLA, with the Armstrong Institute for Patient Safety and Quality, Johns Hopkins Medicine, for her assistance in editing the manuscript and preparing it for journal submission.
Disclosure
Dr. Pronovost errs on the side of full disclosure and reports receiving grant or contract support from the Agency for Healthcare Research and Quality, the Gordon and Betty Moore Foundation (research related to patient safety and quality of care), the National Institutes of Health (acute lung injury research), and the American Medical Association Inc. (improve blood pressure control); honoraria from various healthcare organizations for speaking on patient safety and quality (the Leigh Bureau manages engagements); book royalties from the Penguin Group for his book Safe Patients, Smart Hospitals; and was receiving stock and fees to serve as a director for Cantel Medical up until 24 months ago. Dr. Pronovost is a founder of Patient Doctor Technologies, a startup company that seeks to enhance the partnership between patients and clinicians with an application called Doctella. Dr. Brotman, Dr. Hoyer, and Ms. Deutschendorf report no relevant conflicts of interest.
1. Centers for Medicare & Medicaid Services. Five-star quality rating system. https://www.cms.gov/medicare/provider-enrollment-and-certification/certificationandcomplianc/fsqrs.html. Accessed October 11, 2016.
2. Joynt KE, Jha AK. Characteristics of hospitals receiving penalties under the Hospital Readmissions Reduction Program. JAMA. 2013;309(4):342-343. PubMed
3. Boozary AS, Manchin J, 3rd, Wicker RF. The Medicare Hospital Readmissions Reduction Program: time for reform. JAMA. 2015;314(4):347-348. PubMed
4. Jencks SF, Williams MV, Coleman EA. Rehospitalizations among patients in the Medicare fee-for-service program. N Engl J Med. 2009;360(14):1418-1428. PubMed
5. Centers for Medicare & Medicaid Services. Readmissions Reduction Program (HRRP). https://www.cms.gov/medicare/medicare-fee-for-service-payment/acuteinpatientpps/readmissions-reduction-program.html. Accessed April 12, 2017.
6. Parker C, Schwamm LH, Fonarow GC, Smith EE, Reeves MJ. Stroke quality metrics: systematic reviews of the relationships to patient-centered outcomes and impact of public reporting. Stroke. 2012;43(1):155-162. PubMed
7. McIntyre LK, Arbabi S, Robinson EF, Maier RV. Analysis of risk factors for patient readmission 30 days following discharge from general surgery. JAMA Surg. 2016;151(9):855-861. PubMed
8. Sheingold SH, Zuckerman R, Shartzer A. Understanding Medicare hospital readmission rates and differing penalties between safety-net and other hospitals. Health Aff (Millwood). 2016;35(1):124-131. PubMed
9. Brotman DJ, Hoyer EH, Leung C, Lepley D, Deutschendorf A. Associations between hospital-wide readmission rates and mortality measures at the hospital level: are hospital-wide readmissions a measure of quality? J Hosp Med. 2016;11(9):650-651. PubMed
10. Krumholz HM, Lin Z, Keenan PS, et al. Relationship between hospital readmission and mortality rates for patients hospitalized with acute myocardial infarction, heart failure, or pneumonia. JAMA. 2013;309(6):587-593. PubMed
11. Fan VS, Gaziano JM, Lew R, et al. A comprehensive care management program to prevent chronic obstructive pulmonary disease hospitalizations: a randomized, controlled trial. Ann Intern Med. 2012;156(10):673-683. PubMed
12. Bikdeli B, Wayda B, Bao H, et al. Place of residence and outcomes of patients with heart failure: analysis from the Telemonitoring to Improve Heart Failure Outcomes Trial. Circ Cardiovasc Qual Outcomes. 2014;7(5):749-756. PubMed
13. Bernheim SM, Parzynski CS, Horwitz L, et al. Accounting for patients’ socioeconomic status does not change hospital readmission rates. Health Aff (Millwood). 2016;35(8):1461-1470. PubMed
14. Medicare Payment Advisory Commission. Refining the Hospital Readmissions Reduction Program. In: Report to the Congress: Medicare and the Health Care Delivery System, Chapter 4. June 2013. PubMed
Hospital readmission rates are a consequential and contentious measure of hospital quality. Readmissions within 30 days of hospital discharge are part of the Centers for Medicare & Medicaid Services (CMS) Value-Based Purchasing Program and are publicly reported. Hospital-wide readmissions and condition-specific readmissions are heavily weighted by US News & World Report in its hospital rankings and in the new CMS Five-Star Quality Rating System.1 However, clinicians and researchers question the construct validity of current readmission measures.2,3
The focus on readmissions began in 2009 when Jencks et al.4 reported that 20% of Medicare patients were readmitted within 30 days after hospital discharge. Policy makers embraced readmission reduction, assuming that a hospital readmission so soon after discharge reflected poor quality of hospital care and that, with focused efforts, hospitals could reduce readmissions and save CMS money. In 2010, the Affordable Care Act introduced an initiative to reduce readmissions and, in 2012, the Hospital Readmission Reduction Program was implemented, financially penalizing hospitals with higher-than-expected readmission rates for patients hospitalized with principal diagnoses of heart failure, myocardial infarction, and pneumonia.5 Readmission measures have since proliferated and now include pay-for-performance metrics for hospitalizations for chronic obstructive pulmonary disease (COPD), coronary artery bypass grafting, and total hip or knee arthroplasty. Measures are also reported for stroke patients and for “hospital-wide readmissions,” a catch-all measure intended to capture readmission rates across most diagnoses, with various exclusions intended to prevent counting planned readmissions (eg, hospitalization for cholecystectomy following a hospitalization for cholecystitis). These measures use claims data to construct hierarchical regression models at the patient and hospital levels, assuming that variation among readmission rates are due to hospital quality effects. The goal of this approach is to level the playing field to avoid penalizing hospitals for caring for sicker patients who are at higher risk for readmission for reasons unrelated to hospital care. Yet hospital readmissions are influenced by a complex set of variables that go well beyond hospital care, some of which may be better captured by existing models than others. Below we review several potential biases in the hospital readmission measures and offer policy recommendations to improve the accuracy of these measures.
Variation in a quality measure is influenced by the quality of the underlying data, the mix of patients served, bias in the performance measure, and the degree of systemic or random error.6 Hospital readmission rates are subject to multiple sources of variation, and true differences in the quality of care are often a much smaller source of this variation. A recent analysis of patient readmissions following general surgery found that the majority were unrelated to suboptimal medical care.7 Consider 3 scenarios in which a patient with COPD is readmitted 22 days after discharge. In hospital 1, the patient was discharged without a prescription for a steroid inhaler. In hospital 2, the patient was discharged on a steroid inhaler, filled the prescription, and elected not to use it. In hospital 3, the patient was discharged on a steroid inhaler and was provided medical assistance to fill the prescription but still could not afford the $15 copay. In all 3 scenarios, the hospital would be equally culpable under the current readmission measures, suffering financial and reputational penalties.
Yet the hospitals in these scenarios are not equally culpable. Variation in the mix of patients and bias in the measure impacted performance. Hospital 1 should clearly be held accountable for the readmission. In the cases of hospitals 2 and 3, the situations are more nuanced. More education about COPD, financial investment by the hospital to cover a copay, or a different transitional care approach may have increased the likelihood of patient compliance, but, ultimately, hospitals 2 and 3 were impacted by personal health behaviors and access to public health services and financial assistance, and the readmissions were less within their control.8
To be valid, hospital readmission measures would need to ensure that all hospitals are similar in patient characteristics and in the need for an availability of public health services. Yet these factors vary among hospitals and cannot be accounted for by models that rely exclusively on patient-level variables, such as the nature and severity of illness. As a result, the existing readmission measures are biased against certain types of hospitals. Hospitals that treat a greater proportion of patients who are socioeconomically disadvantaged; who lack access to primary care, medical assistance, or public health programs; and who have substance abuse and mental health issues will have higher readmission rates. Hospitals that care for patients who fail initial treatments and require referral for complex care will also have higher readmission rates. These types of patients are not randomly distributed throughout our healthcare system. They are clustered at rural hospitals in underserved areas, certain urban health systems, safety net hospitals, and academic health centers. It is not surprising that readmission penalties have most severely impacted large academic hospitals that care for disadvantaged populations.2 These penalties may have unintended consequences, reducing a hospital’s willingness to care for disadvantaged populations.
While these biases may unfairly harm hospitals caring for disadvantaged patients, the readmission measures may also indirectly harm patients. Low hospital readmission rates are not associated with reduced mortality and, in some instances, track with higher mortality.9-11 This may result from measurement factors (patients who die cannot be readmitted), from neighborhood socioeconomic status (SES) factors that may impact readmissions more,12 or from actual patient harm (some patients need acute care following discharge and may have worse outcomes if that care is delayed).11 Doctors have long recognized this potential risk; empiric evidence now supports them. While mortality measures may also be impacted by sociodemographic variables,13 whether to adjust for SES should be defined by the purpose of the measure. If the measure is meant to evaluate hospital quality (or utilization in the case of readmissions), adjusting for SES is appropriate because it is unrealistic to expect a health system to reduce income inequality and provide safe housing. Failure to adjust for SES, which has a large impact on outcomes, may mask a quality of care issue. Conversely, if the purpose of a measure is for a community to improve population health, then it should not be adjusted for SES because the community could adjust for income inequality.
Despite the complex ethical challenges created by the efforts to reduce readmissions, there has been virtually no public dialogue with patients, physicians, and policy makers regarding how to balance the trade-offs between reducing readmission and maintaining safety. Patients would likely value increased survival more than reduced readmissions, yet the current CMS Five-Star Rating System for hospital quality weighs readmissions equally with mortality in its hospital rankings, potentially misinforming patients. For example, many well-known academic medical centers score well (4 or 5 stars) on mortality and poorly (1 or 2 stars) on readmissions, resulting in a low or average overall score, calling into question face validity and confounding consumers struggling to make decisions about where to seek care. The Medicare Payment Advisory Commission’s Report to the Congress14 highlights the multiple significant systematic and random errors with the hospital readmission data.
Revisiting the Hospital Readmission Measures
Given significant bias in the hospital readmission measures and the ethical challenges imposed by reducing readmissions, potentially at the expense of survival, we believe CMS needs to take action to remedy the problem. First, CMS should drop hospital readmissions as a quality measure from its hospital rankings. Other hospital-rating groups and insurers should do the same. When included in payment schemes, readmissions should not be construed as a quality measure but as a utilization measure, like length of stay.
Second, the Department of Health & Human Services (HHS) should invest in maturing the hospital readmission measures to ensure construct, content, and criterion validity and reliability. No doubt the risk adjustment is complex and may be inherently limited using Medicare claims data. In the case of SES adjustment, for example, limited numbers of SES measures can be constructed from current data sources.8,13 There are other approaches to address this recommendation. For example, HHS could define a preventable readmission as one linked to some process or outcome of hospital care, such as whether the patient was discharged on an inhaler. The National Quality Forum used this approach to define a preventable venous thromboembolic event as one occurring when a patient did not receive appropriate prophylaxis. In this way, only hospital 1 in the 3 scenarios for the patient with COPD would be penalized. However, we recognize that it is not always simple to define specific process measures (eg, prescribing an inhaler) that link to readmission outcomes and that there may be other important yet hard-to-measure interventions (eg, patient and family education) that are important components of patient-centered care and readmission prevention. This is why readmissions are so challenging as a quality measure. If experts cannot define clinician behaviors that have a strong theory of change or are causally related to reduced readmissions, it is hard to call readmissions a modifiable quality measure. Another potential strategy to level the playing field would be to compare readmission rates across peer institutions only. For instance, tertiary-care safety net hospitals would be compared to one another and rural community hospitals would be compared to one another.14 Lastly, new data sources could be added to account for the social, community-level, public health, and personal health factors that heavily influence a patient’s risk for readmission, in addition to hospital-level factors. Appropriate methods will be needed to develop statistical models for risk adjustment; however, this is a complex topic and beyond the scope of the current paper.
Third, HHS could continue to use the current readmission measures as population health measures while supporting multistakeholder teams to better understand how people and their communities, public health agencies, insurers, and healthcare providers can collaborate to help patients thrive and avoid readmissions by addressing true defects in care and care coordination.
While it is understandable why policy makers chose to focus on hospital readmissions, and while we recognize that concerns about the measures were unknown when they were created, emerging evidence demonstrates that the current readmission measures (particularly when used as a quality metric) lack construct validity, contain significant bias and systematic errors, and create ethical tension by rewarding hospitals both financially and reputationally for turning away sick and socially disadvantaged patients who may, consequently, have adverse outcomes. Current readmission measures need to be reconsidered.
Acknowledgments
The authors thank Christine G. Holzmueller, BLA, with the Armstrong Institute for Patient Safety and Quality, Johns Hopkins Medicine, for her assistance in editing the manuscript and preparing it for journal submission.
Disclosure
Dr. Pronovost errs on the side of full disclosure and reports receiving grant or contract support from the Agency for Healthcare Research and Quality, the Gordon and Betty Moore Foundation (research related to patient safety and quality of care), the National Institutes of Health (acute lung injury research), and the American Medical Association Inc. (improve blood pressure control); honoraria from various healthcare organizations for speaking on patient safety and quality (the Leigh Bureau manages engagements); book royalties from the Penguin Group for his book Safe Patients, Smart Hospitals; and was receiving stock and fees to serve as a director for Cantel Medical up until 24 months ago. Dr. Pronovost is a founder of Patient Doctor Technologies, a startup company that seeks to enhance the partnership between patients and clinicians with an application called Doctella. Dr. Brotman, Dr. Hoyer, and Ms. Deutschendorf report no relevant conflicts of interest.
1. Centers for Medicare & Medicaid Services. Five-star quality rating system. https://www.cms.gov/medicare/provider-enrollment-and-certification/certificationandcomplianc/fsqrs.html. Accessed October 11, 2016.
2. Joynt KE, Jha AK. Characteristics of hospitals receiving penalties under the Hospital Readmissions Reduction Program. JAMA. 2013;309(4):342-343. PubMed
3. Boozary AS, Manchin J, 3rd, Wicker RF. The Medicare Hospital Readmissions Reduction Program: time for reform. JAMA. 2015;314(4):347-348. PubMed
4. Jencks SF, Williams MV, Coleman EA. Rehospitalizations among patients in the Medicare fee-for-service program. N Engl J Med. 2009;360(14):1418-1428. PubMed
5. Centers for Medicare & Medicaid Services. Readmissions Reduction Program (HRRP). https://www.cms.gov/medicare/medicare-fee-for-service-payment/acuteinpatientpps/readmissions-reduction-program.html. Accessed April 12, 2017.
6. Parker C, Schwamm LH, Fonarow GC, Smith EE, Reeves MJ. Stroke quality metrics: systematic reviews of the relationships to patient-centered outcomes and impact of public reporting. Stroke. 2012;43(1):155-162. PubMed
7. McIntyre LK, Arbabi S, Robinson EF, Maier RV. Analysis of risk factors for patient readmission 30 days following discharge from general surgery. JAMA Surg. 2016;151(9):855-861. PubMed
8. Sheingold SH, Zuckerman R, Shartzer A. Understanding Medicare hospital readmission rates and differing penalties between safety-net and other hospitals. Health Aff (Millwood). 2016;35(1):124-131. PubMed
9. Brotman DJ, Hoyer EH, Leung C, Lepley D, Deutschendorf A. Associations between hospital-wide readmission rates and mortality measures at the hospital level: are hospital-wide readmissions a measure of quality? J Hosp Med. 2016;11(9):650-651. PubMed
10. Krumholz HM, Lin Z, Keenan PS, et al. Relationship between hospital readmission and mortality rates for patients hospitalized with acute myocardial infarction, heart failure, or pneumonia. JAMA. 2013;309(6):587-593. PubMed
11. Fan VS, Gaziano JM, Lew R, et al. A comprehensive care management program to prevent chronic obstructive pulmonary disease hospitalizations: a randomized, controlled trial. Ann Intern Med. 2012;156(10):673-683. PubMed
12. Bikdeli B, Wayda B, Bao H, et al. Place of residence and outcomes of patients with heart failure: analysis from the Telemonitoring to Improve Heart Failure Outcomes Trial. Circ Cardiovasc Qual Outcomes. 2014;7(5):749-756. PubMed
13. Bernheim SM, Parzynski CS, Horwitz L, et al. Accounting for patients’ socioeconomic status does not change hospital readmission rates. Health Aff (Millwood). 2016;35(8):1461-1470. PubMed
14. Medicare Payment Advisory Commission. Refining the Hospital Readmissions Reduction Program. In: Report to the Congress: Medicare and the Health Care Delivery System, Chapter 4. June 2013. PubMed
© 2017 Society of Hospital Medicine
Primary Care Provider Preferences for Communication with Inpatient Teams: One Size Does Not Fit All
As the hospitalist’s role in medicine grows, the transition of care from inpatient to primary care providers (PCPs, including primary care physicians, nurse practitioners, or physician assistants), becomes increasingly important. Inadequate communication at this transition is associated with preventable adverse events leading to rehospitalization, disability, and death.1-
Providing PCPs access to the inpatient electronic health record (EHR) may reduce the need for active communication. However, a recent survey of PCPs in the general internal medicine division of an academic hospital found a strong preference for additional communication with inpatient providers, despite a shared EHR.5
We examined communication preferences of general internal medicine PCPs at a different academic institution and extended our study to include community-based PCPs who were both affiliated and unaffiliated with the institution.
METHODS
Between October 2015 and June 2016, we surveyed PCPs from 3 practice groups with institutional affiliation or proximity to The Johns Hopkins Hospital: all general internal medicine faculty with outpatient practices (“academic,” 2 practice sites, n = 35), all community-based PCPs affiliated with the health system (“community,” 36 practice sites, n = 220), and all PCPs from an unaffiliated managed care organization (“unaffiliated,” 5 practice sites ranging from 0.3 to 4 miles from The Johns Hopkins Hospital, n = 29).
All groups have work-sponsored e-mail services. At the time of the survey, both the academic and community groups used an EHR that allowed access to inpatient laboratory and radiology data and discharge summaries. The unaffiliated group used paper health records. The hospital faxes discharge summaries to all PCPs who are identified by patients.
The investigators and representatives from each practice group collaborated to develop 15 questions with mutually exclusive answers to evaluate PCP experiences with and preferences for communication with inpatient teams. The survey was constructed and administered through Qualtrics’ online platform (Qualtrics, Provo, UT) and distributed via e-mail. The study was reviewed and acknowledged by the Johns Hopkins institutional review board as quality improvement activity.
The survey contained branching logic. Only respondents who indicated preference for communication received questions regarding preferred mode of communication. We used the preferred mode of communication for initial contact from the inpatient team in our analysis. χ2 and Fischer’s exact tests were performed with JMP 12 software (SAS Institute Inc, Cary, NC).
RESULTS
Fourteen (40%) academic, 43 (14%) community, and 16 (55%) unaffiliated PCPs completed the survey, for 73 total responses from 284 surveys distributed (26%).
Among the 73 responding PCPs, 31 (42%) reported receiving notification of admission during “every” or “almost every” hospitalization, with no significant variation across practice groups (P = 0.5).
Across all groups, 64 PCPs (88%) preferred communication at 1 or more points during hospitalizations (panel A of Figure). “Both upon admission and prior to discharge” was selected most frequently, and there were no differences between practice groups (P = 0.2).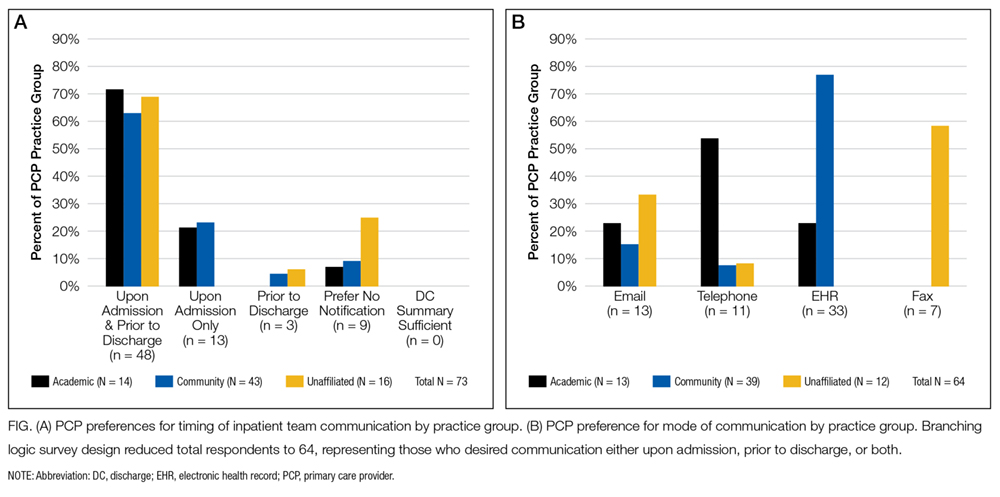
Preferred mode of communication, however, differed significantly between groups (panel B of Figure). The academic group had a greater preference for telephone (54%) than the community (8%; P < 0.001) and unaffiliated groups (8%; P < 0.001), the community group a greater preference for EHR (77%) than the academic (23%; P = 0.002) and unaffiliated groups (0%; P < 0.001), and the unaffiliated group a greater preference for fax (58%) than the other groups (both 0%; P < 0.001).
DISCUSSION
Our findings add to previous evidence of low rates of communication between inpatient providers and PCPs6 and a preference from PCPs for communication during hospitalizations despite shared EHRs.5 We extend previous work by demonstrating that PCP preferences for mode of communication vary by practice setting. Our findings lead us to hypothesize that identifying and incorporating PCP preferences may improve communication, though at the potential expense of standardization and efficiency.
There may be several reasons for the differing communication preferences observed. Most academic PCPs are located near or have admitting privileges to the hospital and are not in clinic full time. Their preference for the telephone may thus result from interpersonal relationships born from proximity and greater availability for telephone calls, or reduced fluency with the EHR compared to full-time community clinicians.
The unaffiliated group’s preference for fax may reflect a desire for communication that integrates easily with paper charts and is least disruptive to workflow, or concerns about health information confidentiality in e-mails.
Our study’s generalizability is limited by a low response rate, though it is comparable to prior studies.7 The unaffiliated group was accessed by convenience (acquaintance with the medical director); however, we note it had the highest response rate (55%).
In summary, we found low rates of communication between inpatient providers and PCPs, despite a strong preference from most PCPs for such communication during hospitalizations. PCPs’ preferred mode of communication differed based on practice setting. Addressing PCP communication preferences may be important to future care transition interventions.
Disclosure
The authors report no conflicts of interest.
1. Forster AJ, Murff HJ, Peterson JF, Gandhi TK, Bates DW. The incidence and severity of adverse events affecting patients after discharge from the hospital. Ann Intern Med. 2003;138(3):161-174. PubMed
2. Moore C, Wisnivesky J, Williams S, McGinn T. Medical errors related to discontinuity of care from an inpatient to an outpatient setting. J Gen Intern Med. 2003;18(8):646-651. PubMed
3. van Walraven C, Mamdani M, Fang J, Austin PC. Continuity of care and patient outcomes after hospital discharge. J Gen Intern Med. 2004;19(6):624-631. PubMed
4. Snow V, Beck D, Budnitz T, et al. Transitions of Care Consensus policy statement: American College of Physicians, Society of General Internal Medicine, Society of Hospital Medicine, American Geriatrics Society, American College Of Emergency Physicians, and Society for Academic Emergency M. J Hosp Med. 2009;4(6):364-370. PubMed
5. Sheu L, Fung K, Mourad M, Ranji S, Wu E. We need to talk: Primary care provider communication at discharge in the era of a shared electronic medical record. J Hosp Med. 2015;10(5):307-310. PubMed
6. Kripalani S, LeFevre F, Phillips CO, Williams MV, Basaviah P, Baker DW. Deficits in communication and information transfer between hospital-based and primary care physicians. JAMA. 2007;297(8):831-841. PubMed
7. Pantilat SZ, Lindenauer PK, Katz PP, Wachter RM. Primary care physician attitudes regarding communication with hospitalists. Am J Med. 2001(9B);111:15-20. PubMed
As the hospitalist’s role in medicine grows, the transition of care from inpatient to primary care providers (PCPs, including primary care physicians, nurse practitioners, or physician assistants), becomes increasingly important. Inadequate communication at this transition is associated with preventable adverse events leading to rehospitalization, disability, and death.1-
Providing PCPs access to the inpatient electronic health record (EHR) may reduce the need for active communication. However, a recent survey of PCPs in the general internal medicine division of an academic hospital found a strong preference for additional communication with inpatient providers, despite a shared EHR.5
We examined communication preferences of general internal medicine PCPs at a different academic institution and extended our study to include community-based PCPs who were both affiliated and unaffiliated with the institution.
METHODS
Between October 2015 and June 2016, we surveyed PCPs from 3 practice groups with institutional affiliation or proximity to The Johns Hopkins Hospital: all general internal medicine faculty with outpatient practices (“academic,” 2 practice sites, n = 35), all community-based PCPs affiliated with the health system (“community,” 36 practice sites, n = 220), and all PCPs from an unaffiliated managed care organization (“unaffiliated,” 5 practice sites ranging from 0.3 to 4 miles from The Johns Hopkins Hospital, n = 29).
All groups have work-sponsored e-mail services. At the time of the survey, both the academic and community groups used an EHR that allowed access to inpatient laboratory and radiology data and discharge summaries. The unaffiliated group used paper health records. The hospital faxes discharge summaries to all PCPs who are identified by patients.
The investigators and representatives from each practice group collaborated to develop 15 questions with mutually exclusive answers to evaluate PCP experiences with and preferences for communication with inpatient teams. The survey was constructed and administered through Qualtrics’ online platform (Qualtrics, Provo, UT) and distributed via e-mail. The study was reviewed and acknowledged by the Johns Hopkins institutional review board as quality improvement activity.
The survey contained branching logic. Only respondents who indicated preference for communication received questions regarding preferred mode of communication. We used the preferred mode of communication for initial contact from the inpatient team in our analysis. χ2 and Fischer’s exact tests were performed with JMP 12 software (SAS Institute Inc, Cary, NC).
RESULTS
Fourteen (40%) academic, 43 (14%) community, and 16 (55%) unaffiliated PCPs completed the survey, for 73 total responses from 284 surveys distributed (26%).
Among the 73 responding PCPs, 31 (42%) reported receiving notification of admission during “every” or “almost every” hospitalization, with no significant variation across practice groups (P = 0.5).
Across all groups, 64 PCPs (88%) preferred communication at 1 or more points during hospitalizations (panel A of Figure). “Both upon admission and prior to discharge” was selected most frequently, and there were no differences between practice groups (P = 0.2).
Preferred mode of communication, however, differed significantly between groups (panel B of Figure). The academic group had a greater preference for telephone (54%) than the community (8%; P < 0.001) and unaffiliated groups (8%; P < 0.001), the community group a greater preference for EHR (77%) than the academic (23%; P = 0.002) and unaffiliated groups (0%; P < 0.001), and the unaffiliated group a greater preference for fax (58%) than the other groups (both 0%; P < 0.001).
DISCUSSION
Our findings add to previous evidence of low rates of communication between inpatient providers and PCPs6 and a preference from PCPs for communication during hospitalizations despite shared EHRs.5 We extend previous work by demonstrating that PCP preferences for mode of communication vary by practice setting. Our findings lead us to hypothesize that identifying and incorporating PCP preferences may improve communication, though at the potential expense of standardization and efficiency.
There may be several reasons for the differing communication preferences observed. Most academic PCPs are located near or have admitting privileges to the hospital and are not in clinic full time. Their preference for the telephone may thus result from interpersonal relationships born from proximity and greater availability for telephone calls, or reduced fluency with the EHR compared to full-time community clinicians.
The unaffiliated group’s preference for fax may reflect a desire for communication that integrates easily with paper charts and is least disruptive to workflow, or concerns about health information confidentiality in e-mails.
Our study’s generalizability is limited by a low response rate, though it is comparable to prior studies.7 The unaffiliated group was accessed by convenience (acquaintance with the medical director); however, we note it had the highest response rate (55%).
In summary, we found low rates of communication between inpatient providers and PCPs, despite a strong preference from most PCPs for such communication during hospitalizations. PCPs’ preferred mode of communication differed based on practice setting. Addressing PCP communication preferences may be important to future care transition interventions.
Disclosure
The authors report no conflicts of interest.
1. Forster AJ, Murff HJ, Peterson JF, Gandhi TK, Bates DW. The incidence and severity of adverse events affecting patients after discharge from the hospital. Ann Intern Med. 2003;138(3):161-174. PubMed
2. Moore C, Wisnivesky J, Williams S, McGinn T. Medical errors related to discontinuity of care from an inpatient to an outpatient setting. J Gen Intern Med. 2003;18(8):646-651. PubMed
3. van Walraven C, Mamdani M, Fang J, Austin PC. Continuity of care and patient outcomes after hospital discharge. J Gen Intern Med. 2004;19(6):624-631. PubMed
4. Snow V, Beck D, Budnitz T, et al. Transitions of Care Consensus policy statement: American College of Physicians, Society of General Internal Medicine, Society of Hospital Medicine, American Geriatrics Society, American College Of Emergency Physicians, and Society for Academic Emergency M. J Hosp Med. 2009;4(6):364-370. PubMed
5. Sheu L, Fung K, Mourad M, Ranji S, Wu E. We need to talk: Primary care provider communication at discharge in the era of a shared electronic medical record. J Hosp Med. 2015;10(5):307-310. PubMed
6. Kripalani S, LeFevre F, Phillips CO, Williams MV, Basaviah P, Baker DW. Deficits in communication and information transfer between hospital-based and primary care physicians. JAMA. 2007;297(8):831-841. PubMed
7. Pantilat SZ, Lindenauer PK, Katz PP, Wachter RM. Primary care physician attitudes regarding communication with hospitalists. Am J Med. 2001(9B);111:15-20. PubMed
© 2017 Society of Hospital Medicine
sberry8@jhmi.edu
A Concise Tool for Measuring Care Coordination from the Provider’s Perspective in the Hospital Setting
Care Coordination has been defined as “…the deliberate organization of patient care activities between two or more participants (including the patient) involved in a patient’s care to facilitate the appropriate delivery of healthcare services.”1 The Institute of Medicine identified care coordination as a key strategy to improve the American healthcare system,2 and evidence has been building that well-coordinated care improves patient outcomes and reduces healthcare costs associated with chronic conditions.3-5 In 2012, Johns Hopkins Medicine was awarded a Healthcare Innovation Award by the Centers for Medicare & Medicaid Services to improve coordination of care across the continuum of care for adult patients admitted to Johns Hopkins Hospital (JHH) and Johns Hopkins Bayview Medical Center (JHBMC), and for high-risk low-income Medicare and Medicaid beneficiaries receiving ambulatory care in targeted zip codes. The purpose of this project, known as the Johns Hopkins Community Health Partnership (J-CHiP), was to improve health and healthcare and to reduce healthcare costs. The acute care component of the program consisted of a bundle of interventions focused on improving coordination of care for all patients, including a “bridge to home” discharge process, as they transitioned back to the community from inpatient admission. The bundle included the following: early screening for discharge planning to predict needed postdischarge services; discussion in daily multidisciplinary rounds about goals and priorities of the hospitalization and potential postdischarge needs; patient and family self-care management; education enhanced medication management, including the option of “medications in hand” at the time of discharge; postdischarge telephone follow-up by nurses; and, for patients identified as high-risk, a “transition guide” (a nurse who works with the patient via home visits and by phone to optimize compliance with care for 30 days postdischarge).6 While the primary endpoints of the J-CHiP program were to improve clinical outcomes and reduce healthcare costs, we were also interested in the impact of the program on care coordination processes in the acute care setting. This created the need for an instrument to measure healthcare professionals’ views of care coordination in their immediate work environments.
We began our search for existing measures by reviewing the Coordination Measures Atlas published in 2014.7 Although this report evaluates over 80 different measures of care coordination, most of them focus on the perspective of the patient and/or family members, on specific conditions, and on primary care or outpatient settings.7,8 We were unable to identify an existing measure from the provider perspective, designed for the inpatient setting, that was both brief but comprehensive enough to cover a range of care coordination domains.8
Consequently, our first aim was to develop a brief, comprehensive tool to measure care coordination from the perspective of hospital inpatient staff that could be used to compare different units or types of providers, or to conduct longitudinal assessment. The second aim was to conduct a preliminary evaluation of the tool in our healthcare setting, including to assess its psychometric properties, to describe provider perceptions of care coordination after the implementation of J-CHiP, and to explore potential differences among departments, types of professionals, and between the 2 hospitals.
METHODS
Development of the Care Coordination Questionnaire
The survey was developed in collaboration with leaders of the J-CHiP Acute Care Team. We met at the outset and on multiple subsequent occasions to align survey domains with the main components of the J-CHiP acute care intervention and to assure that the survey would be relevant and understandable to a variety of multidisciplinary professionals, including physicians, nurses, social workers, physical therapists, and other health professionals. Care was taken to avoid redundancy with existing evaluation efforts and to minimize respondent burden. This process helped to ensure the content validity of the items, the usefulness of the results, and the future usability of the tool.
We modeled the Care Coordination Questionnaire (CCQ) after the Safety Attitudes Questionnaire (SAQ),9 a widely used survey that is deployed approximately annually at JHH and JHBMC. While the SAQ focuses on healthcare provider attitudes about issues relevant to patient safety (often referred to as safety climate or safety culture), this new tool was designed to focus on healthcare professionals’ attitudes about care coordination. Similar to the way that the SAQ “elicits a snapshot of the safety climate through surveys of frontline worker perceptions,” we sought to elicit a picture of our care coordination climate through a survey of frontline hospital staff.
The CCQ was built upon the domains and approaches to care coordination described in the Agency for Healthcare Research and Quality Care Coordination Atlas.3 This report identifies 9 mechanisms for achieving care coordination, including the following: Establish Accountability or Negotiate Responsibility; Communicate; Facilitate Transitions; Assess Needs and Goals; Create a Proactive Plan of Care; Monitor, Follow Up, and Respond to Change; Support Self-Management Goals; Link to Community Resources; and Align Resources with Patient and Population Needs; as well as 5 broad approaches commonly used to improve the delivery of healthcare, including Teamwork Focused on Coordination, Healthcare Home, Care Management, Medication Management, and Health IT-Enabled Coordination.7 We generated at least 1 item to represent 8 of the 9 domains, as well as the broad approach described as Teamwork Focused on Coordination. After developing an initial set of items, we sought input from 3 senior leaders of the J-CHiP Acute Care Team to determine if the items covered the care coordination domains of interest, and to provide feedback on content validity. To test the interpretability of survey items and consistency across professional groups, we sent an initial version of the survey questions to at least 1 person from each of the following professional groups: hospitalist, social worker, case manager, clinical pharmacist, and nurse. We asked them to review all of our survey questions and to provide us with feedback on all aspects of the questions, such as whether they believed the questions were relevant and understandable to the members of their professional discipline, the appropriateness of the wording of the questions, and other comments. Modifications were made to the content and wording of the questions based on the feedback received. The final draft of the questionnaire was reviewed by the leadership team of the J-CHiP Acute Care Team to ensure its usefulness in providing actionable information.
The resulting 12-item questionnaire used a 5-point Likert response scale ranging from 1 = “disagree strongly” to 5 = “agree strongly,” and an additional option of “not applicable (N/A).” To help assess construct validity, a global question was added at the end of the questionnaire asking, “Overall, how would you rate the care coordination at the hospital of your primary work setting?” The response was measured on a 10-point Likert-type scale ranging from 1 = “totally uncoordinated care” to 10 = “perfectly coordinated care” (see Appendix). In addition, the questionnaire requested information about the respondents’ gender, position, and their primary unit, department, and hospital affiliation.
Data Collection Procedures
An invitation to complete an anonymous questionnaire was sent to the following inpatient care professionals: all nursing staff working on care coordination units in the departments of medicine, surgery, and neurology/neurosurgery, as well as physicians, pharmacists, acute care therapists (eg, occupational and physical therapists), and other frontline staff. All healthcare staff fitting these criteria was sent an e-mail with a request to fill out the survey online using QualtricsTM (Qualtrics Labs Inc., Provo, UT), as well as multiple follow-up reminders. The participants worked either at the JHH (a 1194-bed tertiary academic medical center in Baltimore, MD) or the JHBMC (a 440-bed academic community hospital located nearby). Data were collected from October 2015 through January 2016.
Analysis
Means and standard deviations were calculated by treating the responses as continuous variables. We tried 3 different methods to handle missing data: (1) without imputation, (2) imputing the mean value of each item, and (3) substituting a neutral score. Because all 3 methods produced very similar results, we treated the N/A responses as missing values without imputation for simplicity of analysis. We used STATA 13.1 (Stata Corporation, College Station, Texas) to analyze the data.
To identify subscales, we performed exploratory factor analysis on responses to the 12 specific items. Promax rotation was selected based on the simple structure. Subscale scores for each respondent were generated by computing the mean of responses to the items in the subscale. Internal consistency reliability of the subscales was estimated using Cronbach’s alpha. We calculated Pearson correlation coefficients for the items in each subscale, and examined Cronbach’s alpha deleting each item in turn. For each of the subscales identified and the global scale, we calculated the mean, standard deviation, median and interquartile range. Although distributions of scores tended to be non-normal, this was done to increase interpretability. We also calculated percent scoring at the ceiling (highest possible score).
We analyzed the data with 3 research questions in mind: Was there a difference in perceptions of care coordination between (1) staff affiliated with the 2 different hospitals, (2) staff affiliated with different clinical departments, or (3) staff with different professional roles? For comparisons based on hospital and department, and type of professional, nonparametric tests (Wilcoxon rank-sum and Kruskal-Wallis test) were used with a level of statistical significance set at 0.05. The comparison between hospitals and departments was made only among nurses to minimize the confounding effect of different distribution of professionals. We tested the distribution of “years in specialty” between hospitals and departments for this comparison using Pearson’s χ2 test. The difference was not statistically significant (P = 0.167 for hospitals, and P = 0.518 for departments), so we assumed that the potential confounding effect of this variable was negligible in this analysis. The comparison of scores within each professional group used the Friedman test. Pearson’s χ2 test was used to compare the baseline characteristics between 2 hospitals.
RESULTS
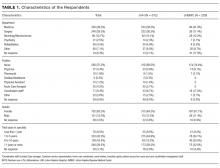
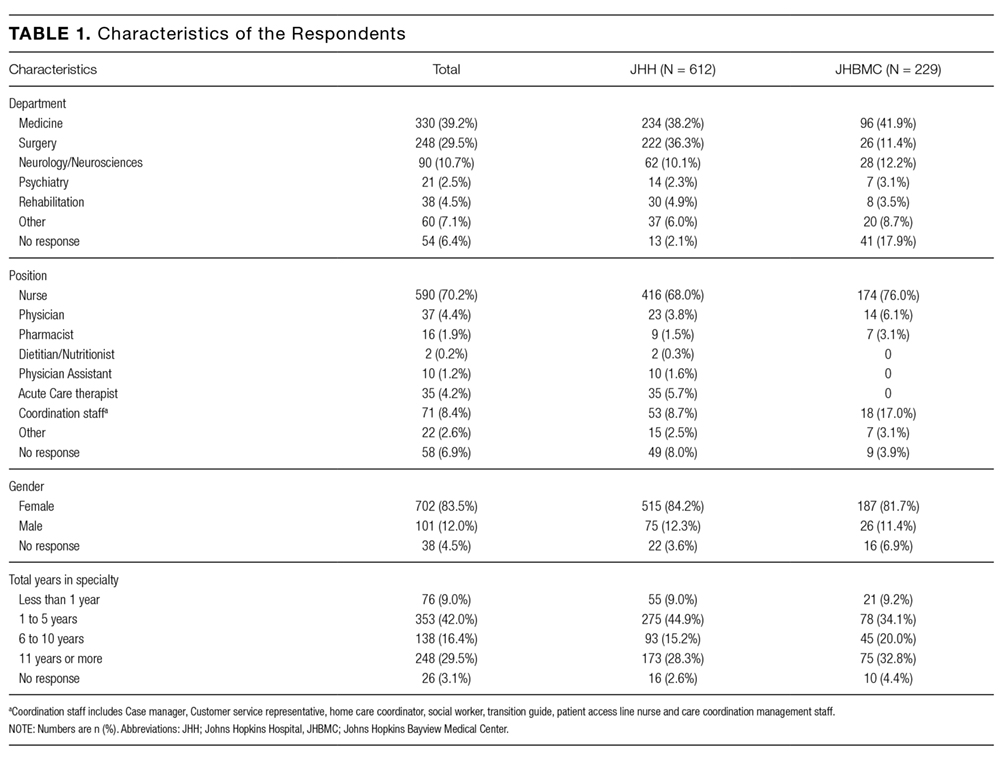
Among the 1486 acute care professionals asked to participate in the survey, 841 completed the questionnaire (response rate 56.6%). Table 1 shows the characteristics of the participants from each hospital. Table 2 summarizes the item response rates, proportion scoring at the ceiling, and weighting from the factor analysis. All items had completion rates of 99.2% or higher, with N/A responses ranging from 0% (item 2) to 3.1% (item 7). The percent scoring at the ceiling was 1.7% for the global item and ranged from 18.3% up to 63.3% for other individual items.
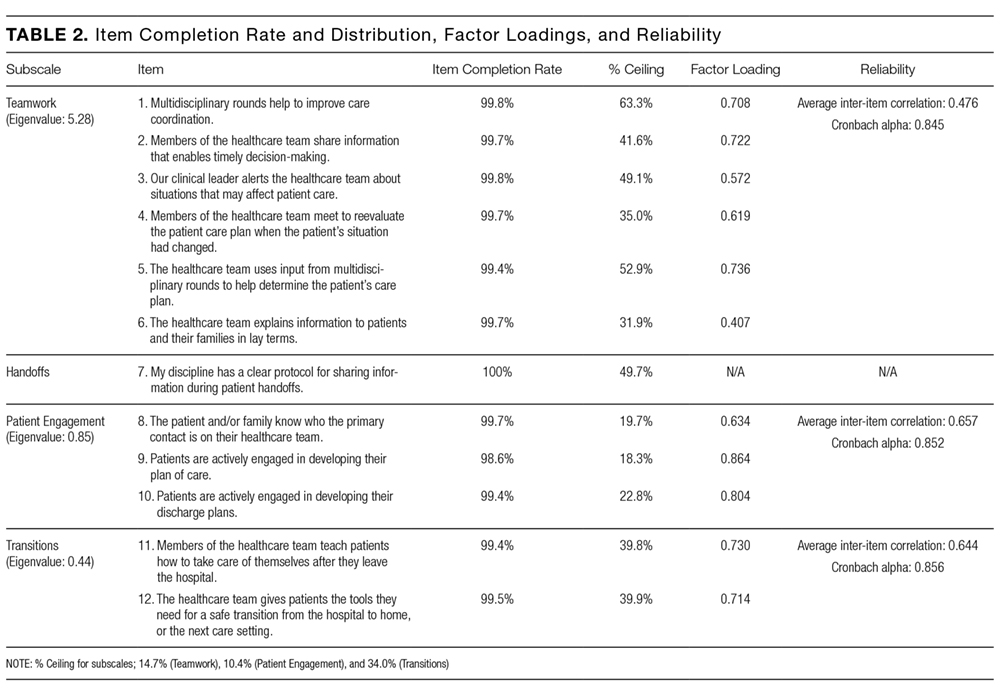
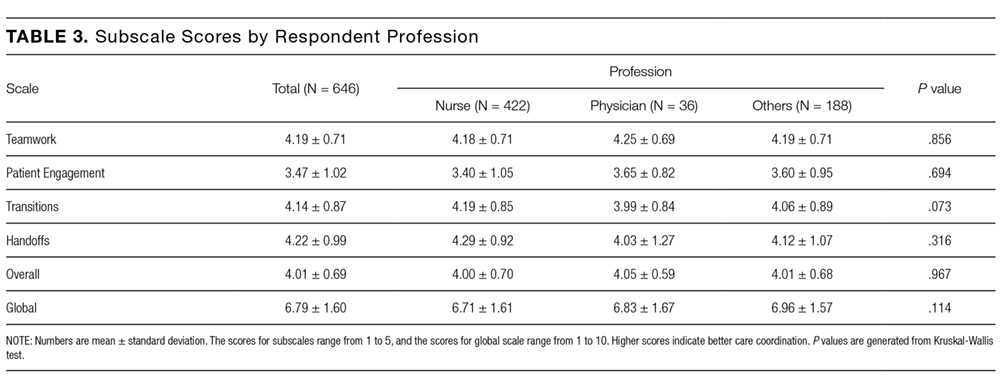

We also examined differences in perceptions of care coordination among nursing units to illustrate the tool’s ability to detect variation in Patient Engagement subscale scores for JHH nurses (see Appendix).
DISCUSSION
This study resulted in one of the first measurement tools to succinctly measure multiple aspects of care coordination in the hospital from the perspective of healthcare professionals. Given the hectic work environment of healthcare professionals, and the increasing emphasis on collecting data for evaluation and improvement, it is important to minimize respondent burden. This effort was catalyzed by a multifaceted initiative to redesign acute care delivery and promote seamless transitions of care, supported by the Center for Medicare & Medicaid Innovation. In initial testing, this questionnaire has evidence for reliability and validity. It was encouraging to find that the preliminary psychometric performance of the measure was very similar in 2 different settings of a tertiary academic hospital and a community hospital.
Our analysis of the survey data explored potential differences between the 2 hospitals, among different types of healthcare professionals and across different departments. Although we expected differences, we had no specific hypotheses about what those differences might be, and, in fact, did not observe any substantial differences. This could be taken to indicate that the intervention was uniformly and successfully implemented in both hospitals, and engaged various professionals in different departments. The ability to detect differences in care coordination at the nursing unit level could also prove to be beneficial for more precisely targeting where process improvement is needed. Further data collection and analyses should be conducted to more systematically compare units and to help identify those where practice is most advanced and those where improvements may be needed. It would also be informative to link differences in care coordination scores with patient outcomes. In addition, differences identified on specific domains between professional groups could be helpful to identify where greater efforts are needed to improve interdisciplinary practice. Sampling strategies stratified by provider type would need to be targeted to make this kind of analysis informative.
The consistently lower scores observed for patient engagement, from the perspective of care professionals in all groups, suggest that this is an area where improvement is needed. These findings are consistent with published reports on the common failure by hospitals to include patients as a member of their own care team. In addition to measuring care processes from the perspective of frontline healthcare workers, future evaluations within the healthcare system would also benefit from including data collected from the perspective of the patient and family.
This study had some limitations. First, there may be more than 4 domains of care coordination that are important and can be measured in the acute care setting from provider perspective. However, the addition of more domains should be balanced against practicality and respondent burden. It may be possible to further clarify priority domains in hospital settings as opposed to the primary care setting. Future research should be directed to find these areas and to develop a more comprehensive, yet still concise measurement instrument. Second, the tool was developed to measure the impact of a large-scale intervention, and to fit into the specific context of 2 hospitals. Therefore, it should be tested in different settings of hospital care to see how it performs. However, virtually all hospitals in the United States today are adapting to changes in both financing and healthcare delivery. A tool such as the one described in this paper could be helpful to many organizations. Third, the scoring system for the overall scale score is not weighted and therefore reflects teamwork more than other components of care coordination, which are represented by fewer items. In general, we believe that use of the subscale scores may be more informative. Alternative scoring systems might also be proposed, including item weighting based on factor scores.
For the purposes of evaluation in this specific instance, we only collected data at a single point in time, after the intervention had been deployed. Thus, we were not able to evaluate the effectiveness of the J-CHiP intervention. We also did not intend to focus too much on the differences between units, given the limited number of respondents from individual units. It would be useful to collect more data at future time points, both to test the responsiveness of the scales and to evaluate the impact of future interventions at both the hospital and unit level.
The preliminary data from this study have generated insights about gaps in current practice, such as in engaging patients in the inpatient care process. It has also increased awareness by hospital leaders about the need to achieve high reliability in the adoption of new procedures and interdisciplinary practice. This tool might be used to find areas in need of improvement, to evaluate the effect of initiatives to improve care coordination, to monitor the change over time in the perception of care coordination among healthcare professionals, and to develop better intervention strategies for coordination activities in acute care settings. Additional research is needed to provide further evidence for the reliability and validity of this measure in diverse settings.
Disclosure
The project described was supported by Grant Number 1C1CMS331053-01-00 from the US Department of Health and Human Services, Centers for Medicare & Medicaid Services. The contents of this publication are solely the responsibility of the authors and do not necessarily represent the official views of the US Department of Health and Human Services or any of its agencies. The research presented was conducted by the awardee. Results may or may not be consistent with or confirmed by the findings of the independent evaluation contractor.
The authors have no other disclosures.
1. McDonald KM, Sundaram V, Bravata DM, et al. Closing the Quality Gap: A Critical Analysis of Quality Improvement Strategies (Vol. 7: Care Coordination). Technical Reviews, No. 9.7. Rockville (MD): Agency for Healthcare Research and Quality (US); 2007. PubMed
2. Adams K, Corrigan J. Priority areas for national action: transforming health care quality. Washington, DC: National Academies Press; 2003. PubMed
3. Renders CM, Valk GD, Griffin S, Wagner EH, Eijk JT, Assendelft WJ. Interventions to improve the management of diabetes mellitus in primary care, outpatient and community settings. Cochrane Database Syst Rev. 2001(1):CD001481. PubMed
4. McAlister FA, Lawson FM, Teo KK, Armstrong PW. A systematic review of randomized trials of disease management programs in heart failure. Am J Med. 2001;110(5):378-384. PubMed
5. Bruce ML, Raue PJ, Reilly CF, et al. Clinical effectiveness of integrating depression care management into medicare home health: the Depression CAREPATH Randomized trial. JAMA Intern Med. 2015;175(1):55-64. PubMed
6. Berkowitz SA, Brown P, Brotman DJ, et al. Case Study: Johns Hopkins Community Health Partnership: A model for transformation. Healthc (Amst). 2016;4(4):264-270. PubMed
7. McDonald. KM, Schultz. E, Albin. L, et al. Care Coordination Measures Atlas Version 4. Rockville, MD: Agency for Healthcare Research and Quality; 2014.
8 Schultz EM, Pineda N, Lonhart J, Davies SM, McDonald KM. A systematic review of the care coordination measurement landscape. BMC Health Serv Res. 2013;13:119. PubMed
9. Sexton JB, Helmreich RL, Neilands TB, et al. The Safety Attitudes Questionnaire: psychometric properties, benchmarking data, and emerging research. BMC Health Serv Res. 2006;6:44. PubMed
Care Coordination has been defined as “…the deliberate organization of patient care activities between two or more participants (including the patient) involved in a patient’s care to facilitate the appropriate delivery of healthcare services.”1 The Institute of Medicine identified care coordination as a key strategy to improve the American healthcare system,2 and evidence has been building that well-coordinated care improves patient outcomes and reduces healthcare costs associated with chronic conditions.3-5 In 2012, Johns Hopkins Medicine was awarded a Healthcare Innovation Award by the Centers for Medicare & Medicaid Services to improve coordination of care across the continuum of care for adult patients admitted to Johns Hopkins Hospital (JHH) and Johns Hopkins Bayview Medical Center (JHBMC), and for high-risk low-income Medicare and Medicaid beneficiaries receiving ambulatory care in targeted zip codes. The purpose of this project, known as the Johns Hopkins Community Health Partnership (J-CHiP), was to improve health and healthcare and to reduce healthcare costs. The acute care component of the program consisted of a bundle of interventions focused on improving coordination of care for all patients, including a “bridge to home” discharge process, as they transitioned back to the community from inpatient admission. The bundle included the following: early screening for discharge planning to predict needed postdischarge services; discussion in daily multidisciplinary rounds about goals and priorities of the hospitalization and potential postdischarge needs; patient and family self-care management; education enhanced medication management, including the option of “medications in hand” at the time of discharge; postdischarge telephone follow-up by nurses; and, for patients identified as high-risk, a “transition guide” (a nurse who works with the patient via home visits and by phone to optimize compliance with care for 30 days postdischarge).6 While the primary endpoints of the J-CHiP program were to improve clinical outcomes and reduce healthcare costs, we were also interested in the impact of the program on care coordination processes in the acute care setting. This created the need for an instrument to measure healthcare professionals’ views of care coordination in their immediate work environments.
We began our search for existing measures by reviewing the Coordination Measures Atlas published in 2014.7 Although this report evaluates over 80 different measures of care coordination, most of them focus on the perspective of the patient and/or family members, on specific conditions, and on primary care or outpatient settings.7,8 We were unable to identify an existing measure from the provider perspective, designed for the inpatient setting, that was both brief but comprehensive enough to cover a range of care coordination domains.8
Consequently, our first aim was to develop a brief, comprehensive tool to measure care coordination from the perspective of hospital inpatient staff that could be used to compare different units or types of providers, or to conduct longitudinal assessment. The second aim was to conduct a preliminary evaluation of the tool in our healthcare setting, including to assess its psychometric properties, to describe provider perceptions of care coordination after the implementation of J-CHiP, and to explore potential differences among departments, types of professionals, and between the 2 hospitals.
METHODS
Development of the Care Coordination Questionnaire
The survey was developed in collaboration with leaders of the J-CHiP Acute Care Team. We met at the outset and on multiple subsequent occasions to align survey domains with the main components of the J-CHiP acute care intervention and to assure that the survey would be relevant and understandable to a variety of multidisciplinary professionals, including physicians, nurses, social workers, physical therapists, and other health professionals. Care was taken to avoid redundancy with existing evaluation efforts and to minimize respondent burden. This process helped to ensure the content validity of the items, the usefulness of the results, and the future usability of the tool.
We modeled the Care Coordination Questionnaire (CCQ) after the Safety Attitudes Questionnaire (SAQ),9 a widely used survey that is deployed approximately annually at JHH and JHBMC. While the SAQ focuses on healthcare provider attitudes about issues relevant to patient safety (often referred to as safety climate or safety culture), this new tool was designed to focus on healthcare professionals’ attitudes about care coordination. Similar to the way that the SAQ “elicits a snapshot of the safety climate through surveys of frontline worker perceptions,” we sought to elicit a picture of our care coordination climate through a survey of frontline hospital staff.
The CCQ was built upon the domains and approaches to care coordination described in the Agency for Healthcare Research and Quality Care Coordination Atlas.3 This report identifies 9 mechanisms for achieving care coordination, including the following: Establish Accountability or Negotiate Responsibility; Communicate; Facilitate Transitions; Assess Needs and Goals; Create a Proactive Plan of Care; Monitor, Follow Up, and Respond to Change; Support Self-Management Goals; Link to Community Resources; and Align Resources with Patient and Population Needs; as well as 5 broad approaches commonly used to improve the delivery of healthcare, including Teamwork Focused on Coordination, Healthcare Home, Care Management, Medication Management, and Health IT-Enabled Coordination.7 We generated at least 1 item to represent 8 of the 9 domains, as well as the broad approach described as Teamwork Focused on Coordination. After developing an initial set of items, we sought input from 3 senior leaders of the J-CHiP Acute Care Team to determine if the items covered the care coordination domains of interest, and to provide feedback on content validity. To test the interpretability of survey items and consistency across professional groups, we sent an initial version of the survey questions to at least 1 person from each of the following professional groups: hospitalist, social worker, case manager, clinical pharmacist, and nurse. We asked them to review all of our survey questions and to provide us with feedback on all aspects of the questions, such as whether they believed the questions were relevant and understandable to the members of their professional discipline, the appropriateness of the wording of the questions, and other comments. Modifications were made to the content and wording of the questions based on the feedback received. The final draft of the questionnaire was reviewed by the leadership team of the J-CHiP Acute Care Team to ensure its usefulness in providing actionable information.
The resulting 12-item questionnaire used a 5-point Likert response scale ranging from 1 = “disagree strongly” to 5 = “agree strongly,” and an additional option of “not applicable (N/A).” To help assess construct validity, a global question was added at the end of the questionnaire asking, “Overall, how would you rate the care coordination at the hospital of your primary work setting?” The response was measured on a 10-point Likert-type scale ranging from 1 = “totally uncoordinated care” to 10 = “perfectly coordinated care” (see Appendix). In addition, the questionnaire requested information about the respondents’ gender, position, and their primary unit, department, and hospital affiliation.
Data Collection Procedures
An invitation to complete an anonymous questionnaire was sent to the following inpatient care professionals: all nursing staff working on care coordination units in the departments of medicine, surgery, and neurology/neurosurgery, as well as physicians, pharmacists, acute care therapists (eg, occupational and physical therapists), and other frontline staff. All healthcare staff fitting these criteria was sent an e-mail with a request to fill out the survey online using QualtricsTM (Qualtrics Labs Inc., Provo, UT), as well as multiple follow-up reminders. The participants worked either at the JHH (a 1194-bed tertiary academic medical center in Baltimore, MD) or the JHBMC (a 440-bed academic community hospital located nearby). Data were collected from October 2015 through January 2016.
Analysis
Means and standard deviations were calculated by treating the responses as continuous variables. We tried 3 different methods to handle missing data: (1) without imputation, (2) imputing the mean value of each item, and (3) substituting a neutral score. Because all 3 methods produced very similar results, we treated the N/A responses as missing values without imputation for simplicity of analysis. We used STATA 13.1 (Stata Corporation, College Station, Texas) to analyze the data.
To identify subscales, we performed exploratory factor analysis on responses to the 12 specific items. Promax rotation was selected based on the simple structure. Subscale scores for each respondent were generated by computing the mean of responses to the items in the subscale. Internal consistency reliability of the subscales was estimated using Cronbach’s alpha. We calculated Pearson correlation coefficients for the items in each subscale, and examined Cronbach’s alpha deleting each item in turn. For each of the subscales identified and the global scale, we calculated the mean, standard deviation, median and interquartile range. Although distributions of scores tended to be non-normal, this was done to increase interpretability. We also calculated percent scoring at the ceiling (highest possible score).
We analyzed the data with 3 research questions in mind: Was there a difference in perceptions of care coordination between (1) staff affiliated with the 2 different hospitals, (2) staff affiliated with different clinical departments, or (3) staff with different professional roles? For comparisons based on hospital and department, and type of professional, nonparametric tests (Wilcoxon rank-sum and Kruskal-Wallis test) were used with a level of statistical significance set at 0.05. The comparison between hospitals and departments was made only among nurses to minimize the confounding effect of different distribution of professionals. We tested the distribution of “years in specialty” between hospitals and departments for this comparison using Pearson’s χ2 test. The difference was not statistically significant (P = 0.167 for hospitals, and P = 0.518 for departments), so we assumed that the potential confounding effect of this variable was negligible in this analysis. The comparison of scores within each professional group used the Friedman test. Pearson’s χ2 test was used to compare the baseline characteristics between 2 hospitals.
RESULTS
Among the 1486 acute care professionals asked to participate in the survey, 841 completed the questionnaire (response rate 56.6%). Table 1 shows the characteristics of the participants from each hospital. Table 2 summarizes the item response rates, proportion scoring at the ceiling, and weighting from the factor analysis. All items had completion rates of 99.2% or higher, with N/A responses ranging from 0% (item 2) to 3.1% (item 7). The percent scoring at the ceiling was 1.7% for the global item and ranged from 18.3% up to 63.3% for other individual items.
We also examined differences in perceptions of care coordination among nursing units to illustrate the tool’s ability to detect variation in Patient Engagement subscale scores for JHH nurses (see Appendix).
DISCUSSION
This study resulted in one of the first measurement tools to succinctly measure multiple aspects of care coordination in the hospital from the perspective of healthcare professionals. Given the hectic work environment of healthcare professionals, and the increasing emphasis on collecting data for evaluation and improvement, it is important to minimize respondent burden. This effort was catalyzed by a multifaceted initiative to redesign acute care delivery and promote seamless transitions of care, supported by the Center for Medicare & Medicaid Innovation. In initial testing, this questionnaire has evidence for reliability and validity. It was encouraging to find that the preliminary psychometric performance of the measure was very similar in 2 different settings of a tertiary academic hospital and a community hospital.
Our analysis of the survey data explored potential differences between the 2 hospitals, among different types of healthcare professionals and across different departments. Although we expected differences, we had no specific hypotheses about what those differences might be, and, in fact, did not observe any substantial differences. This could be taken to indicate that the intervention was uniformly and successfully implemented in both hospitals, and engaged various professionals in different departments. The ability to detect differences in care coordination at the nursing unit level could also prove to be beneficial for more precisely targeting where process improvement is needed. Further data collection and analyses should be conducted to more systematically compare units and to help identify those where practice is most advanced and those where improvements may be needed. It would also be informative to link differences in care coordination scores with patient outcomes. In addition, differences identified on specific domains between professional groups could be helpful to identify where greater efforts are needed to improve interdisciplinary practice. Sampling strategies stratified by provider type would need to be targeted to make this kind of analysis informative.
The consistently lower scores observed for patient engagement, from the perspective of care professionals in all groups, suggest that this is an area where improvement is needed. These findings are consistent with published reports on the common failure by hospitals to include patients as a member of their own care team. In addition to measuring care processes from the perspective of frontline healthcare workers, future evaluations within the healthcare system would also benefit from including data collected from the perspective of the patient and family.
This study had some limitations. First, there may be more than 4 domains of care coordination that are important and can be measured in the acute care setting from provider perspective. However, the addition of more domains should be balanced against practicality and respondent burden. It may be possible to further clarify priority domains in hospital settings as opposed to the primary care setting. Future research should be directed to find these areas and to develop a more comprehensive, yet still concise measurement instrument. Second, the tool was developed to measure the impact of a large-scale intervention, and to fit into the specific context of 2 hospitals. Therefore, it should be tested in different settings of hospital care to see how it performs. However, virtually all hospitals in the United States today are adapting to changes in both financing and healthcare delivery. A tool such as the one described in this paper could be helpful to many organizations. Third, the scoring system for the overall scale score is not weighted and therefore reflects teamwork more than other components of care coordination, which are represented by fewer items. In general, we believe that use of the subscale scores may be more informative. Alternative scoring systems might also be proposed, including item weighting based on factor scores.
For the purposes of evaluation in this specific instance, we only collected data at a single point in time, after the intervention had been deployed. Thus, we were not able to evaluate the effectiveness of the J-CHiP intervention. We also did not intend to focus too much on the differences between units, given the limited number of respondents from individual units. It would be useful to collect more data at future time points, both to test the responsiveness of the scales and to evaluate the impact of future interventions at both the hospital and unit level.
The preliminary data from this study have generated insights about gaps in current practice, such as in engaging patients in the inpatient care process. It has also increased awareness by hospital leaders about the need to achieve high reliability in the adoption of new procedures and interdisciplinary practice. This tool might be used to find areas in need of improvement, to evaluate the effect of initiatives to improve care coordination, to monitor the change over time in the perception of care coordination among healthcare professionals, and to develop better intervention strategies for coordination activities in acute care settings. Additional research is needed to provide further evidence for the reliability and validity of this measure in diverse settings.
Disclosure
The project described was supported by Grant Number 1C1CMS331053-01-00 from the US Department of Health and Human Services, Centers for Medicare & Medicaid Services. The contents of this publication are solely the responsibility of the authors and do not necessarily represent the official views of the US Department of Health and Human Services or any of its agencies. The research presented was conducted by the awardee. Results may or may not be consistent with or confirmed by the findings of the independent evaluation contractor.
The authors have no other disclosures.
1. McDonald KM, Sundaram V, Bravata DM, et al. Closing the Quality Gap: A Critical Analysis of Quality Improvement Strategies (Vol. 7: Care Coordination). Technical Reviews, No. 9.7. Rockville (MD): Agency for Healthcare Research and Quality (US); 2007. PubMed
2. Adams K, Corrigan J. Priority areas for national action: transforming health care quality. Washington, DC: National Academies Press; 2003. PubMed
3. Renders CM, Valk GD, Griffin S, Wagner EH, Eijk JT, Assendelft WJ. Interventions to improve the management of diabetes mellitus in primary care, outpatient and community settings. Cochrane Database Syst Rev. 2001(1):CD001481. PubMed
4. McAlister FA, Lawson FM, Teo KK, Armstrong PW. A systematic review of randomized trials of disease management programs in heart failure. Am J Med. 2001;110(5):378-384. PubMed
5. Bruce ML, Raue PJ, Reilly CF, et al. Clinical effectiveness of integrating depression care management into medicare home health: the Depression CAREPATH Randomized trial. JAMA Intern Med. 2015;175(1):55-64. PubMed
6. Berkowitz SA, Brown P, Brotman DJ, et al. Case Study: Johns Hopkins Community Health Partnership: A model for transformation. Healthc (Amst). 2016;4(4):264-270. PubMed
7. McDonald. KM, Schultz. E, Albin. L, et al. Care Coordination Measures Atlas Version 4. Rockville, MD: Agency for Healthcare Research and Quality; 2014.
8 Schultz EM, Pineda N, Lonhart J, Davies SM, McDonald KM. A systematic review of the care coordination measurement landscape. BMC Health Serv Res. 2013;13:119. PubMed
9. Sexton JB, Helmreich RL, Neilands TB, et al. The Safety Attitudes Questionnaire: psychometric properties, benchmarking data, and emerging research. BMC Health Serv Res. 2006;6:44. PubMed
© 2017 Society of Hospital Medicine
Impact of Displaying Inpatient Pharmaceutical Costs at the Time of Order Entry: Lessons From a Tertiary Care Center
Secondary to rising healthcare costs in the United States, broad efforts are underway to identify and reduce waste in the health system.1,2 A recent systematic review exhibited that many physicians inaccurately estimate the cost of medications.3 Raising awareness of medication costs among prescribers is one potential way to promote high-value care.
Some evidence suggests that cost transparency may help prescribers understand how medication orders drive costs. In a previous study carried out at the Johns Hopkins Hospital, fee data were displayed to providers for diagnostic laboratory tests.4 An 8.6% decrease (95% confidence interval [CI], –8.99% to –8.19%) in test ordering was observed when costs were displayed vs a 5.6% increase (95% CI, 4.90% to 6.39%) in ordering when costs were not displayed during a 6-month intervention period (P < 0.001). Conversely, a similar study that investigated the impact of cost transparency on inpatient imaging utilization did not demonstrate a significant influence of cost display.5 This suggests that cost transparency may work in some areas of care but not in others. A systematic review that investigated price-display interventions for imaging, laboratory studies, and medications reported 10 studies that demonstrated a statistically significant decrease in expenditures without an effect on patient safety.6
Informing prescribers of institution-specific medication costs within and between drug classes may enable the selection of less expensive, therapeutically equivalent drugs. Prior studies investigating the effect of medication cost display were conducted in a variety of patient care settings, including ambulatory clinics,7 urgent care centers,8 and operating rooms,9,10 with some yielding positive results in terms of ordering and cost11,12 and others having no impact.13,14 Currently, there is little evidence specifically addressing the effect of cost display for medications in the inpatient setting.
As part of an institutional initiative to control pharmaceutical expenditures, informational messaging for several high-cost drugs was initiated at our tertiary care hospital in April 2015. The goal of our study was to assess the effect of these medication cost messages on ordering practices. We hypothesized that the display of inpatient pharmaceutical costs at the time of order entry would result in a reduction in ordering.
METHODS
Setting, Intervention, and Participants
As part of an effort to educate prescribers about the high cost of medications, 9 intravenous (IV) medications were selected by the Johns Hopkins Hospital Pharmacy and Therapeutics Committee as targets for drug cost messaging. The intention of the committee was to implement a rapid, low-cost, proof-of-concept, quality-improvement project that was not designed as prospective research. Representatives from the pharmacy and clinicians from relevant clinical areas participated in preimplementation discussions to help identify medications that were subjectively felt to be overused at our institution and potentially modifiable through provider education. The criteria for selecting drug targets included a variety of factors, such as medications infrequently ordered but representing a significant cost per dose (eg, eculizumab and ribavirin), frequently ordered medications with less expensive substitutes (eg, linezolid and voriconazole), and high-cost medications without direct therapeutic alternatives (eg, calcitonin). From April 10, 2015, to October 5, 2015, the computerized Provider Order Entry System (cPOE), Sunrise Clinical Manager (Allscripts Corporation, Chicago, IL), displayed the cost for targeted medications. Seven of the medication alerts also included a reasonable therapeutic alternative and its cost. There were no restrictions placed on ordering; prescribers were able to choose the high-cost medications at their discretion.
Despite the fact that this initiative was not designed as a research project, we felt it was important to formally evaluate the impact of the drug cost messaging effort to inform future quality-improvement interventions. Each medication was compared to its preintervention baseline utilization dating back to January 1, 2013. For the 7 medications with alternatives offered, we also analyzed use of the suggested alternative during these time periods.
Data Sources and Measurement
Our study utilized data obtained from the pharmacy order verification system and the cPOE database. Data were collected over a period of 143 weeks from January 1, 2013, to October 5, 2015, to allow for a baseline period (January 1, 2013, to April 9, 2015) and an intervention period (April 10, 2015, to October 5, 2015). Data elements extracted included drug characteristics (dosage form, route, cost, strength, name, and quantity), patient characteristics (race, gender, and age), clinical setting (facility location, inpatient or outpatient), and billing information (provider name, doses dispensed from pharmacy, order number, revenue or procedure code, record number, date of service, and unique billing number) for each admission. Using these elements, we generated the following 8 variables to use in our analyses: week, month, period identifier, drug name, dosage form, weekly orders, weekly patient days, and number of weekly orders per 10,000 patient days. Average wholesale price (AWP), referred to as medication cost in this manuscript, was used to report all drug costs in all associated cost calculations. While the actual cost of acquisition and price charged to the patient may vary based on several factors, including manufacturer and payer, we chose to use AWP as a generalizable estimate of the cost of acquisition of the drug for the hospital.
Variables
“Week” and “month” were defined as the week and month of our study, respectively. The “period identifier” was a binary variable that identified the time period before and after the intervention. “Weekly orders” was defined as the total number of new orders placed per week for each specified drug included in our study. For example, if a patient received 2 discrete, new orders for a medication in a given week, 2 orders would be counted toward the “weekly orders” variable. “Patient days,” defined as the total number of patients treated at our facility, was summated for each week of our study to yield “weekly patient days.” To derive the “number of weekly orders per 10,000 patient days,” we divided weekly orders by weekly patient days and multiplied the resultant figure by 10,000.
Statistical Analysis

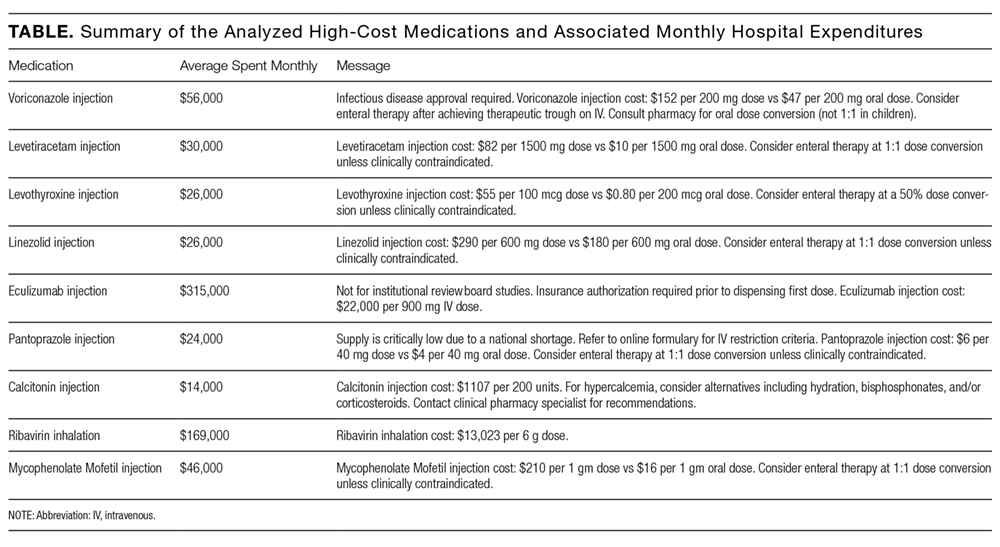
Segmented regression, a form of interrupted time series analysis, is a quasi-experimental design that was used to determine the immediate and sustained effects of the drug cost messages on the rate of medication ordering.15-17 The model enabled the use of comparison groups (alternative medications, as described above) to enhance internal validity.
In time series data, outcomes may not be independent over time. Autocorrelation of the error terms can arise when outcomes are more similar at time points closer together than outcomes at time points further apart. Failure to account for autocorrelation of the error terms may lead to underestimated standard errors. The presence of autocorrelation, assessed by calculating the Durbin-Watson statistic, was significant among our data. To adjust for this, we employed a Prais-Winsten estimation to adjust the error term (εt) calculated in our models.
Two segmented linear regression models were used to estimate trends in ordering before and after the intervention. The presence or absence of a comparator drug determined which model was to be used. When only single medications were under study, as in the case of eculizumab and calcitonin, our regression model was as follows:
Yt = (β0) + (β1)(Timet) + (β2)(Interventiont) + (β3)(Post-Intervention Timet) + (εt)
In our single-drug model, Yt denoted the number of orders per 10,000 patient days at week “t”; Timet was a continuous variable that indicated the number of weeks prior to or after the study intervention (April 10, 2015) and ranged from –116 to 27 weeks. Post-Intervention Timet was a continuous variable that denoted the number of weeks since the start of the intervention and is coded as zero for all time periods prior to the intervention. β0 was the estimated baseline number of orders per 10,000 patient days at the beginning of the study. β1 is the trend of orders per 10,000 patient days per week during the preintervention period; β2 represents an estimate of the change in the number of orders per 10,000 patient days immediately after the intervention; β3 denotes the difference between preintervention and postintervention slopes; and εt is the “error term,” which represents autocorrelation and random variability of the data.
As mentioned previously, alternative dosage forms of 7 medications included in our study were utilized as comparison groups. In these instances (when multiple drugs were included in our analyses), the following regression model was applied:
Y t = ( β 0 ) + ( β 1 )(Time t ) + ( β 2 )(Intervention t ) + ( β 3 )(Post-Intervention Time t ) + ( β 4 )(Cohort) + ( β 5 )(Cohort)(Time t ) + ( β 6 )(Cohort)(Intervention t ) + ( β 7 )(Cohort)(Post-Intervention Time t ) + ( ε t )
Here, 3 coefficients were added (β4-β7) to describe an additional cohort of orders. Cohort, a binary indicator variable, held a value of either 0 or 1 when the model was used to describe the treatment or comparison group, respectively. The coefficients β4-β7 described the treatment group, and β0-β3 described the comparison group. β4 was the difference in the number of baseline orders per 10,000 patient days between treatment and comparison groups; Β5 represented the difference between the estimated ordering trends of treatment and comparison groups; and Β6 indicated the difference in immediate changes in the number of orders per 10,000 patient days in the 2 groups following the intervention.
The number of orders per week was recorded for each medicine, which enabled a large number of data points to be included in our analyses. This allowed for more accurate and stable estimates to be made in our regression model. A total of 143 data points were collected for each study group, 116 before and 27 following each intervention.
All analyses were conducted by using STATA version 13.1 (StataCorp LP, College Station, TX).
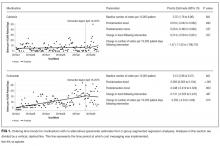
RESULTS

Initial results pertaining to 9 IV medications were examined (Table). Following the implementation of cost messaging, no significant changes were observed in order frequency or trend for IV formulations of eculizumab, calcitonin, levetiracetam, linezolid, mycophenolate, ribavirin, voriconazole, and levothyroxine (Figures 1 and 2). However, a significant decrease in the number of oral ribavirin orders (Figure 2), the control group for the IV form, was observed (–16.3 orders per 10,000 patient days; P = .004; 95% CI, –27.2 to –5.31).
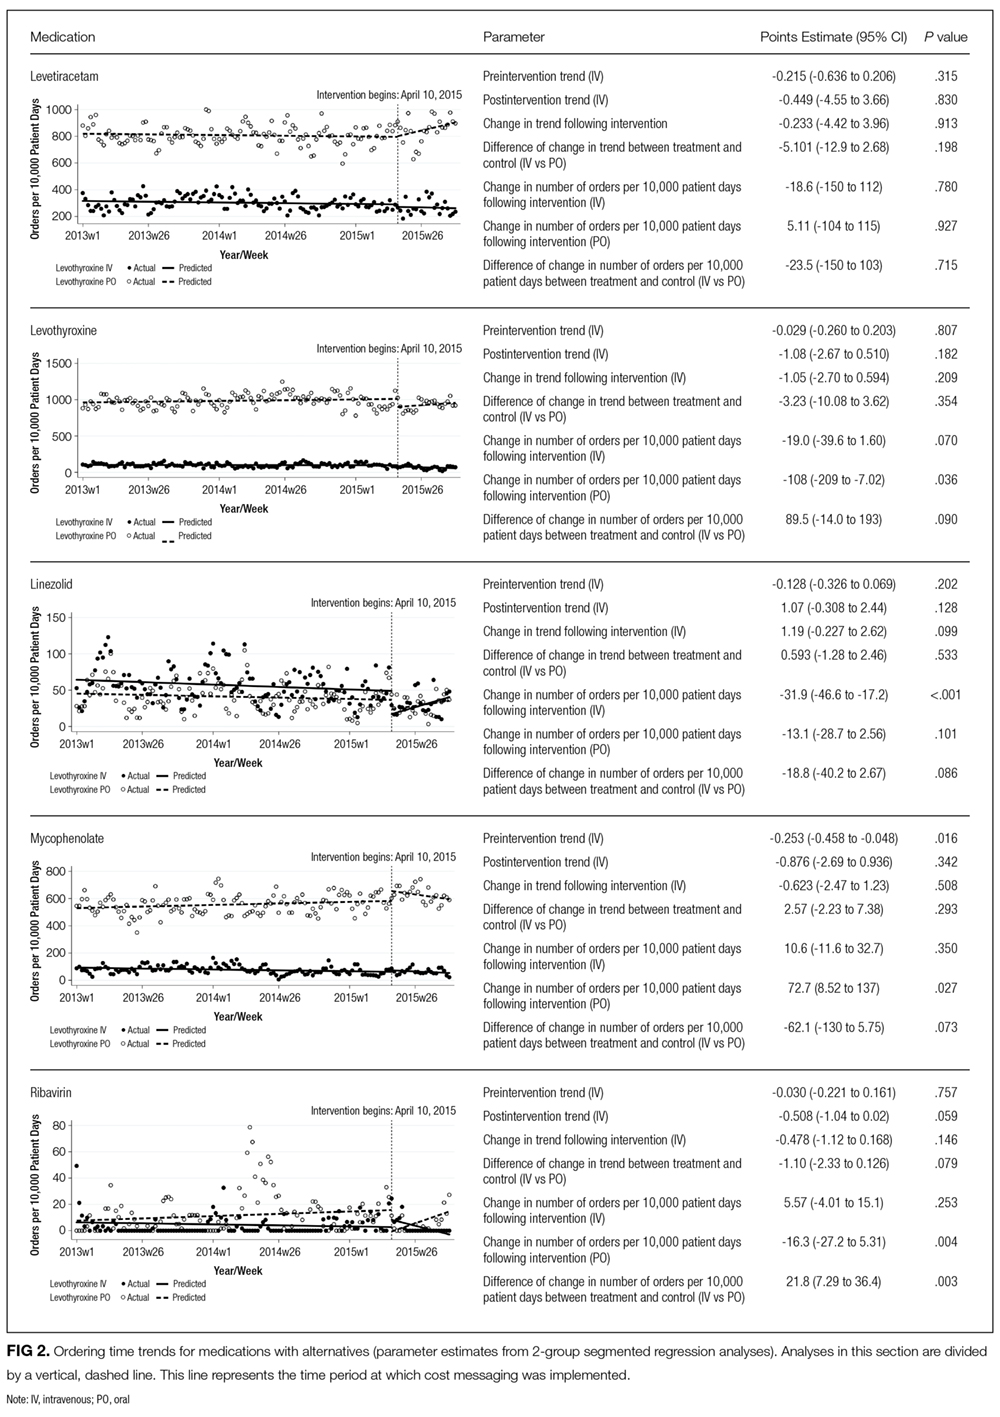
DISCUSSION
Our results suggest that the passive strategy of displaying cost alone was not effective in altering prescriber ordering patterns for the selected medications. This may be due to a lack of awareness regarding direct financial impact on the patient, importance of costs in medical decision-making, or a perceived lack of alternatives or suitability of recommended alternatives. These results may prove valuable to hospital and pharmacy leadership as they develop strategies to curb medication expense.
Changes observed in IV pantoprazole ordering are instructive. Due to a national shortage, the IV form of this medication underwent a restriction, which required approval by the pharmacy prior to dispensing. This restriction was instituted independently of our study and led to a 73% decrease from usage rates prior to policy implementation (Figure 3). Ordering was restricted according to defined criteria for IV use. The restriction did not apply to oral pantoprazole, and no significant change in ordering of the oral formulation was noted during the evaluated period (Figure 3).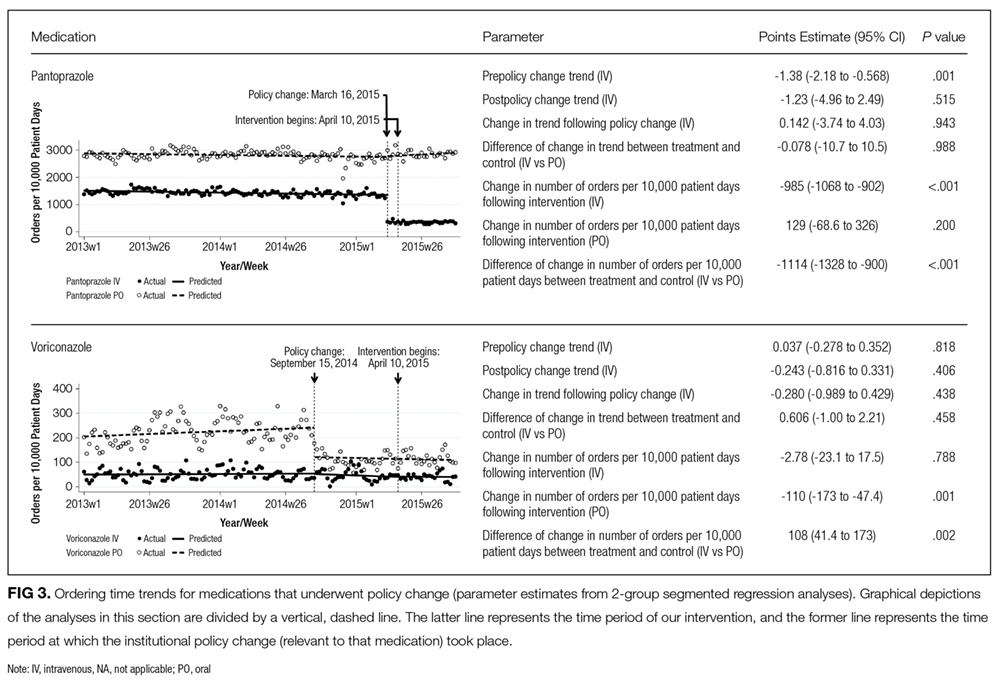
The dramatic effect of policy changes, as observed with pantoprazole and voriconazole, suggests that a more active strategy may have a greater impact on prescriber behavior when it comes to medication ordering in the inpatient setting. It also highlights several potential sources of confounding that may introduce bias to cost-transparency studies.
This study has multiple limitations. First, as with all observational study designs, causation cannot be drawn with certainty from our results. While we were able to compare medications to their preintervention baselines, the data could have been impacted by longitudinal or seasonal trends in medication ordering, which may have been impacted by seasonal variability in disease prevalence, changes in resistance patterns, and annual cycling of house staff in an academic medical center. While there appear to be potential seasonal patterns regarding prescribing patterns for some of the medications included in this analysis, we also believe the linear regressions capture the overall trends in prescribing adequately. Nonstationarity, or trends in the mean and variance of the outcome that are not related to the intervention, may introduce bias in the interpretation of our findings. However, we believe the parameters included in our models, namely the immediate change in the intercept following the intervention and the change in the trend of the rate of prescribing over time from pre- to postintervention, provide substantial protections from faulty interpretation. Our models are limited to the extent that these parameters do not account for nonstationarity. Additionally, we did not collect data on dosing frequency or duration of treatment, which would have been dependent on factors that are not readily quantified, such as indication, clinical rationale, or patient response. Thus, we were not able to evaluate the impact of the intervention on these factors.
Although intended to enhance internal validity, comparison groups were also subject to external influence. For example, we observed a significant, short-lived rise in oral ribavirin (a control medication) ordering during the preintervention baseline period that appeared to be independent of our intervention and may speak to the unaccounted-for longitudinal variability detailed above.
Finally, the clinical indication and setting may be important. Previous studies performed at the same hospital with price displays showed a reduction in laboratory ordering but no change in imaging.18,19 One might speculate that ordering fewer laboratory tests is viewed by providers as eliminating waste rather than choosing a less expensive option to accomplish the same diagnostic task at hand. Therapeutics may be more similar to radiology tests, because patients presumably need the treatment and often do not have the option of simply not ordering without a concerted effort to reevaluate the treatment plan. Additionally, in a tertiary care teaching center such as ours, a junior clinician, oftentimes at the behest of a more senior colleague, enters most orders. In an environment in which the ordering prescriber has more autonomy or when the order is driven by a junior practitioner rather than an attending (such as daily laboratories), results may be different. Additionally, institutions that incentivize prescribers directly to practice cost-conscious care may experience different results from similar interventions.
We conclude that, in the case of medication cost messaging, a strategy of displaying cost information alone was insufficient to affect prescriber ordering behavior. Coupling cost transparency with educational interventions and active stewardship to impact clinical practice is worthy of further study.
Disclosures: The authors state that there were no external sponsors for this work. The Johns Hopkins Hospital and University “funded” this work by paying the salaries of the authors. The author team maintained independence and made all decisions regarding the study design, data collection, data analysis, interpretation of results, writing of the research report, and decision to submit it for publication. Dr. Shermock had full access to all the study data and takes responsibility for the integrity of the data and accuracy of the data analysis.
1. Berwick DM, Hackbarth AD. Eliminating Waste in US Health Care. JAMA. 2012;307(14):1513-1516. PubMed
2. PricewaterhouseCoopers’ Health Research Institute. The Price of Excess: Identifying Waste in Healthcare Spending. http://www.pwc.com/us/en/healthcare/publications/the-price-of-excess.html. Accessed June 17, 2015.
3. Allan GM, Lexchin J, Wiebe N. Physician awareness of drug cost: a systematic review. PLoS Med. 2007;4(9):e283. PubMed
4. Feldman LS, Shihab HM, Thiemann D, et al. Impact of providing fee data on laboratory test ordering: a controlled clinical trial. JAMA Intern Med. 2013;173(10):903-908. PubMed
5. Durand DJ, Feldman LS, Lewin JS, Brotman DJ. Provider cost transparency alone has no impact on inpatient imaging utilization. J Am Coll Radiol. 2013;10(2):108-113. PubMed
6. Silvestri MT, Bongiovanni TR, Glover JG, Gross CP. Impact of price display on provider ordering: A systematic review. J Hosp Med. 2016;11(1):65-76. PubMed
7. Ornstein SM, MacFarlane LL, Jenkins RG, Pan Q, Wager KA. Medication cost information in a computer-based patient record system. Impact on prescribing in a family medicine clinical practice. Arch Fam Med. 1999;8(2):118-121. PubMed
8. Guterman JJ, Chernof BA, Mares B, Gross-Schulman SG, Gan PG, Thomas D. Modifying provider behavior: A low-tech approach to pharmaceutical ordering. J Gen Intern Med. 2002;17(10):792-796. PubMed
9. McNitt JD, Bode ET, Nelson RE. Long-term pharmaceutical cost reduction using a data management system. Anesth Analg. 1998;87(4):837-842. PubMed
10. Horrow JC, Rosenberg H. Price stickers do not alter drug usage. Can J Anaesth. 1994;41(11):1047-1052. PubMed
11. Guterman JJ, Chernof BA, Mares B, Gross-Schulman SG, Gan PG, Thomas D. Modifying provider behavior: A low-tech approach to pharmaceutical ordering. J Gen Intern Med. 2002;17(10):792-796. PubMed
12. McNitt JD, Bode ET, Nelson RE. Long-term pharmaceutical cost reduction using a data management system. Anesth Analg. 1998;87(4):837-842. PubMed
13. Ornstein SM, MacFarlane LL, Jenkins RG, Pan Q, Wager KA. Medication cost information in a computer-based patient record system. Impact on prescribing in a family medicine clinical practice. Arch Fam Med. 1999;8(2):118-121. PubMed
14. Horrow JC, Rosenberg H. Price stickers do not alter drug usage. Can J Anaesth. 1994;41(11):1047-1052. PubMed
15. Jandoc R, Burden AM, Mamdani M, Levesque LE, Cadarette SM. Interrupted time series analysis in drug utilization research is increasing: Systematic review and recommendations. J Clin Epidemiol. 2015;68(8):950-56. PubMed
16. Linden A. Conducting interrupted time-series analysis for single- and multiple-group comparisons. Stata J. 2015;15(2):480-500.
17. Linden A, Adams JL. Applying a propensity score-based weighting model to interrupted time series data: improving causal inference in programme evaluation. J Eval Clin Pract. 2011;17(6):1231-1238. PubMed
18. Feldman LS, Shihab HM, Thiemann D, et al. Impact of providing fee data on laboratory test ordering: a controlled clinical trial. JAMA Intern Med. 2013;173(10):903-908. PubMed
19. Durand DJ, Feldman LS, Lewin JS, Brotman DJ. Provider cost transparency alone has no impact on inpatient imaging utilization. J Am Coll Radiol. 2013;10(2):108-113. PubMed
Secondary to rising healthcare costs in the United States, broad efforts are underway to identify and reduce waste in the health system.1,2 A recent systematic review exhibited that many physicians inaccurately estimate the cost of medications.3 Raising awareness of medication costs among prescribers is one potential way to promote high-value care.
Some evidence suggests that cost transparency may help prescribers understand how medication orders drive costs. In a previous study carried out at the Johns Hopkins Hospital, fee data were displayed to providers for diagnostic laboratory tests.4 An 8.6% decrease (95% confidence interval [CI], –8.99% to –8.19%) in test ordering was observed when costs were displayed vs a 5.6% increase (95% CI, 4.90% to 6.39%) in ordering when costs were not displayed during a 6-month intervention period (P < 0.001). Conversely, a similar study that investigated the impact of cost transparency on inpatient imaging utilization did not demonstrate a significant influence of cost display.5 This suggests that cost transparency may work in some areas of care but not in others. A systematic review that investigated price-display interventions for imaging, laboratory studies, and medications reported 10 studies that demonstrated a statistically significant decrease in expenditures without an effect on patient safety.6
Informing prescribers of institution-specific medication costs within and between drug classes may enable the selection of less expensive, therapeutically equivalent drugs. Prior studies investigating the effect of medication cost display were conducted in a variety of patient care settings, including ambulatory clinics,7 urgent care centers,8 and operating rooms,9,10 with some yielding positive results in terms of ordering and cost11,12 and others having no impact.13,14 Currently, there is little evidence specifically addressing the effect of cost display for medications in the inpatient setting.
As part of an institutional initiative to control pharmaceutical expenditures, informational messaging for several high-cost drugs was initiated at our tertiary care hospital in April 2015. The goal of our study was to assess the effect of these medication cost messages on ordering practices. We hypothesized that the display of inpatient pharmaceutical costs at the time of order entry would result in a reduction in ordering.
METHODS
Setting, Intervention, and Participants
As part of an effort to educate prescribers about the high cost of medications, 9 intravenous (IV) medications were selected by the Johns Hopkins Hospital Pharmacy and Therapeutics Committee as targets for drug cost messaging. The intention of the committee was to implement a rapid, low-cost, proof-of-concept, quality-improvement project that was not designed as prospective research. Representatives from the pharmacy and clinicians from relevant clinical areas participated in preimplementation discussions to help identify medications that were subjectively felt to be overused at our institution and potentially modifiable through provider education. The criteria for selecting drug targets included a variety of factors, such as medications infrequently ordered but representing a significant cost per dose (eg, eculizumab and ribavirin), frequently ordered medications with less expensive substitutes (eg, linezolid and voriconazole), and high-cost medications without direct therapeutic alternatives (eg, calcitonin). From April 10, 2015, to October 5, 2015, the computerized Provider Order Entry System (cPOE), Sunrise Clinical Manager (Allscripts Corporation, Chicago, IL), displayed the cost for targeted medications. Seven of the medication alerts also included a reasonable therapeutic alternative and its cost. There were no restrictions placed on ordering; prescribers were able to choose the high-cost medications at their discretion.
Despite the fact that this initiative was not designed as a research project, we felt it was important to formally evaluate the impact of the drug cost messaging effort to inform future quality-improvement interventions. Each medication was compared to its preintervention baseline utilization dating back to January 1, 2013. For the 7 medications with alternatives offered, we also analyzed use of the suggested alternative during these time periods.
Data Sources and Measurement
Our study utilized data obtained from the pharmacy order verification system and the cPOE database. Data were collected over a period of 143 weeks from January 1, 2013, to October 5, 2015, to allow for a baseline period (January 1, 2013, to April 9, 2015) and an intervention period (April 10, 2015, to October 5, 2015). Data elements extracted included drug characteristics (dosage form, route, cost, strength, name, and quantity), patient characteristics (race, gender, and age), clinical setting (facility location, inpatient or outpatient), and billing information (provider name, doses dispensed from pharmacy, order number, revenue or procedure code, record number, date of service, and unique billing number) for each admission. Using these elements, we generated the following 8 variables to use in our analyses: week, month, period identifier, drug name, dosage form, weekly orders, weekly patient days, and number of weekly orders per 10,000 patient days. Average wholesale price (AWP), referred to as medication cost in this manuscript, was used to report all drug costs in all associated cost calculations. While the actual cost of acquisition and price charged to the patient may vary based on several factors, including manufacturer and payer, we chose to use AWP as a generalizable estimate of the cost of acquisition of the drug for the hospital.
Variables
“Week” and “month” were defined as the week and month of our study, respectively. The “period identifier” was a binary variable that identified the time period before and after the intervention. “Weekly orders” was defined as the total number of new orders placed per week for each specified drug included in our study. For example, if a patient received 2 discrete, new orders for a medication in a given week, 2 orders would be counted toward the “weekly orders” variable. “Patient days,” defined as the total number of patients treated at our facility, was summated for each week of our study to yield “weekly patient days.” To derive the “number of weekly orders per 10,000 patient days,” we divided weekly orders by weekly patient days and multiplied the resultant figure by 10,000.
Statistical Analysis
Segmented regression, a form of interrupted time series analysis, is a quasi-experimental design that was used to determine the immediate and sustained effects of the drug cost messages on the rate of medication ordering.15-17 The model enabled the use of comparison groups (alternative medications, as described above) to enhance internal validity.
In time series data, outcomes may not be independent over time. Autocorrelation of the error terms can arise when outcomes are more similar at time points closer together than outcomes at time points further apart. Failure to account for autocorrelation of the error terms may lead to underestimated standard errors. The presence of autocorrelation, assessed by calculating the Durbin-Watson statistic, was significant among our data. To adjust for this, we employed a Prais-Winsten estimation to adjust the error term (εt) calculated in our models.
Two segmented linear regression models were used to estimate trends in ordering before and after the intervention. The presence or absence of a comparator drug determined which model was to be used. When only single medications were under study, as in the case of eculizumab and calcitonin, our regression model was as follows:
Yt = (β0) + (β1)(Timet) + (β2)(Interventiont) + (β3)(Post-Intervention Timet) + (εt)
In our single-drug model, Yt denoted the number of orders per 10,000 patient days at week “t”; Timet was a continuous variable that indicated the number of weeks prior to or after the study intervention (April 10, 2015) and ranged from –116 to 27 weeks. Post-Intervention Timet was a continuous variable that denoted the number of weeks since the start of the intervention and is coded as zero for all time periods prior to the intervention. β0 was the estimated baseline number of orders per 10,000 patient days at the beginning of the study. β1 is the trend of orders per 10,000 patient days per week during the preintervention period; β2 represents an estimate of the change in the number of orders per 10,000 patient days immediately after the intervention; β3 denotes the difference between preintervention and postintervention slopes; and εt is the “error term,” which represents autocorrelation and random variability of the data.
As mentioned previously, alternative dosage forms of 7 medications included in our study were utilized as comparison groups. In these instances (when multiple drugs were included in our analyses), the following regression model was applied:
Y t = ( β 0 ) + ( β 1 )(Time t ) + ( β 2 )(Intervention t ) + ( β 3 )(Post-Intervention Time t ) + ( β 4 )(Cohort) + ( β 5 )(Cohort)(Time t ) + ( β 6 )(Cohort)(Intervention t ) + ( β 7 )(Cohort)(Post-Intervention Time t ) + ( ε t )
Here, 3 coefficients were added (β4-β7) to describe an additional cohort of orders. Cohort, a binary indicator variable, held a value of either 0 or 1 when the model was used to describe the treatment or comparison group, respectively. The coefficients β4-β7 described the treatment group, and β0-β3 described the comparison group. β4 was the difference in the number of baseline orders per 10,000 patient days between treatment and comparison groups; Β5 represented the difference between the estimated ordering trends of treatment and comparison groups; and Β6 indicated the difference in immediate changes in the number of orders per 10,000 patient days in the 2 groups following the intervention.
The number of orders per week was recorded for each medicine, which enabled a large number of data points to be included in our analyses. This allowed for more accurate and stable estimates to be made in our regression model. A total of 143 data points were collected for each study group, 116 before and 27 following each intervention.
All analyses were conducted by using STATA version 13.1 (StataCorp LP, College Station, TX).
RESULTS
Initial results pertaining to 9 IV medications were examined (Table). Following the implementation of cost messaging, no significant changes were observed in order frequency or trend for IV formulations of eculizumab, calcitonin, levetiracetam, linezolid, mycophenolate, ribavirin, voriconazole, and levothyroxine (Figures 1 and 2). However, a significant decrease in the number of oral ribavirin orders (Figure 2), the control group for the IV form, was observed (–16.3 orders per 10,000 patient days; P = .004; 95% CI, –27.2 to –5.31).
DISCUSSION
Our results suggest that the passive strategy of displaying cost alone was not effective in altering prescriber ordering patterns for the selected medications. This may be due to a lack of awareness regarding direct financial impact on the patient, importance of costs in medical decision-making, or a perceived lack of alternatives or suitability of recommended alternatives. These results may prove valuable to hospital and pharmacy leadership as they develop strategies to curb medication expense.
Changes observed in IV pantoprazole ordering are instructive. Due to a national shortage, the IV form of this medication underwent a restriction, which required approval by the pharmacy prior to dispensing. This restriction was instituted independently of our study and led to a 73% decrease from usage rates prior to policy implementation (Figure 3). Ordering was restricted according to defined criteria for IV use. The restriction did not apply to oral pantoprazole, and no significant change in ordering of the oral formulation was noted during the evaluated period (Figure 3).
The dramatic effect of policy changes, as observed with pantoprazole and voriconazole, suggests that a more active strategy may have a greater impact on prescriber behavior when it comes to medication ordering in the inpatient setting. It also highlights several potential sources of confounding that may introduce bias to cost-transparency studies.
This study has multiple limitations. First, as with all observational study designs, causation cannot be drawn with certainty from our results. While we were able to compare medications to their preintervention baselines, the data could have been impacted by longitudinal or seasonal trends in medication ordering, which may have been impacted by seasonal variability in disease prevalence, changes in resistance patterns, and annual cycling of house staff in an academic medical center. While there appear to be potential seasonal patterns regarding prescribing patterns for some of the medications included in this analysis, we also believe the linear regressions capture the overall trends in prescribing adequately. Nonstationarity, or trends in the mean and variance of the outcome that are not related to the intervention, may introduce bias in the interpretation of our findings. However, we believe the parameters included in our models, namely the immediate change in the intercept following the intervention and the change in the trend of the rate of prescribing over time from pre- to postintervention, provide substantial protections from faulty interpretation. Our models are limited to the extent that these parameters do not account for nonstationarity. Additionally, we did not collect data on dosing frequency or duration of treatment, which would have been dependent on factors that are not readily quantified, such as indication, clinical rationale, or patient response. Thus, we were not able to evaluate the impact of the intervention on these factors.
Although intended to enhance internal validity, comparison groups were also subject to external influence. For example, we observed a significant, short-lived rise in oral ribavirin (a control medication) ordering during the preintervention baseline period that appeared to be independent of our intervention and may speak to the unaccounted-for longitudinal variability detailed above.
Finally, the clinical indication and setting may be important. Previous studies performed at the same hospital with price displays showed a reduction in laboratory ordering but no change in imaging.18,19 One might speculate that ordering fewer laboratory tests is viewed by providers as eliminating waste rather than choosing a less expensive option to accomplish the same diagnostic task at hand. Therapeutics may be more similar to radiology tests, because patients presumably need the treatment and often do not have the option of simply not ordering without a concerted effort to reevaluate the treatment plan. Additionally, in a tertiary care teaching center such as ours, a junior clinician, oftentimes at the behest of a more senior colleague, enters most orders. In an environment in which the ordering prescriber has more autonomy or when the order is driven by a junior practitioner rather than an attending (such as daily laboratories), results may be different. Additionally, institutions that incentivize prescribers directly to practice cost-conscious care may experience different results from similar interventions.
We conclude that, in the case of medication cost messaging, a strategy of displaying cost information alone was insufficient to affect prescriber ordering behavior. Coupling cost transparency with educational interventions and active stewardship to impact clinical practice is worthy of further study.
Disclosures: The authors state that there were no external sponsors for this work. The Johns Hopkins Hospital and University “funded” this work by paying the salaries of the authors. The author team maintained independence and made all decisions regarding the study design, data collection, data analysis, interpretation of results, writing of the research report, and decision to submit it for publication. Dr. Shermock had full access to all the study data and takes responsibility for the integrity of the data and accuracy of the data analysis.
1. Berwick DM, Hackbarth AD. Eliminating Waste in US Health Care. JAMA. 2012;307(14):1513-1516. PubMed
2. PricewaterhouseCoopers’ Health Research Institute. The Price of Excess: Identifying Waste in Healthcare Spending. http://www.pwc.com/us/en/healthcare/publications/the-price-of-excess.html. Accessed June 17, 2015.
3. Allan GM, Lexchin J, Wiebe N. Physician awareness of drug cost: a systematic review. PLoS Med. 2007;4(9):e283. PubMed
4. Feldman LS, Shihab HM, Thiemann D, et al. Impact of providing fee data on laboratory test ordering: a controlled clinical trial. JAMA Intern Med. 2013;173(10):903-908. PubMed
5. Durand DJ, Feldman LS, Lewin JS, Brotman DJ. Provider cost transparency alone has no impact on inpatient imaging utilization. J Am Coll Radiol. 2013;10(2):108-113. PubMed
6. Silvestri MT, Bongiovanni TR, Glover JG, Gross CP. Impact of price display on provider ordering: A systematic review. J Hosp Med. 2016;11(1):65-76. PubMed
7. Ornstein SM, MacFarlane LL, Jenkins RG, Pan Q, Wager KA. Medication cost information in a computer-based patient record system. Impact on prescribing in a family medicine clinical practice. Arch Fam Med. 1999;8(2):118-121. PubMed
8. Guterman JJ, Chernof BA, Mares B, Gross-Schulman SG, Gan PG, Thomas D. Modifying provider behavior: A low-tech approach to pharmaceutical ordering. J Gen Intern Med. 2002;17(10):792-796. PubMed
9. McNitt JD, Bode ET, Nelson RE. Long-term pharmaceutical cost reduction using a data management system. Anesth Analg. 1998;87(4):837-842. PubMed
10. Horrow JC, Rosenberg H. Price stickers do not alter drug usage. Can J Anaesth. 1994;41(11):1047-1052. PubMed
11. Guterman JJ, Chernof BA, Mares B, Gross-Schulman SG, Gan PG, Thomas D. Modifying provider behavior: A low-tech approach to pharmaceutical ordering. J Gen Intern Med. 2002;17(10):792-796. PubMed
12. McNitt JD, Bode ET, Nelson RE. Long-term pharmaceutical cost reduction using a data management system. Anesth Analg. 1998;87(4):837-842. PubMed
13. Ornstein SM, MacFarlane LL, Jenkins RG, Pan Q, Wager KA. Medication cost information in a computer-based patient record system. Impact on prescribing in a family medicine clinical practice. Arch Fam Med. 1999;8(2):118-121. PubMed
14. Horrow JC, Rosenberg H. Price stickers do not alter drug usage. Can J Anaesth. 1994;41(11):1047-1052. PubMed
15. Jandoc R, Burden AM, Mamdani M, Levesque LE, Cadarette SM. Interrupted time series analysis in drug utilization research is increasing: Systematic review and recommendations. J Clin Epidemiol. 2015;68(8):950-56. PubMed
16. Linden A. Conducting interrupted time-series analysis for single- and multiple-group comparisons. Stata J. 2015;15(2):480-500.
17. Linden A, Adams JL. Applying a propensity score-based weighting model to interrupted time series data: improving causal inference in programme evaluation. J Eval Clin Pract. 2011;17(6):1231-1238. PubMed
18. Feldman LS, Shihab HM, Thiemann D, et al. Impact of providing fee data on laboratory test ordering: a controlled clinical trial. JAMA Intern Med. 2013;173(10):903-908. PubMed
19. Durand DJ, Feldman LS, Lewin JS, Brotman DJ. Provider cost transparency alone has no impact on inpatient imaging utilization. J Am Coll Radiol. 2013;10(2):108-113. PubMed
© 2017 Society of Hospital Medicine
Does provider self-reporting of etiquette behaviors improve patient experience? A randomized controlled trial
Physicians have historically had limited adoption of strategies to improve patient experience and often cite suboptimal data and lack of evidence-driven strategies. 1,2 However, public reporting of hospital-level physician domain Hospital Consumer Assessment of Healthcare Providers and Systems (HCAHPS) experience scores, and more recent linking of payments to performance on patient experience metrics, have been associated with significant increases in physician domain scores for most of the hospitals. 3 Hospitals and healthcare organizations have deployed a broad range of strategies to engage physicians. These include emphasizing the relationship between patient experience and patient compliance, complaints, and malpractice lawsuits; appealing to physicians’ sense of competitiveness by publishing individual provider experience scores; educating physicians on HCAHPS and providing them with regularly updated data; and development of specific techniques for improving patient-physician interaction. 4-8
Studies show that educational curricula on improving etiquette and communication skills for physicians lead to improvement in patient experience, and many such training programs are available to hospitals for a significant cost.9-15 Other studies that have focused on providing timely and individual feedback to physicians using tools other than HCAHPS have shown improvement in experience in some instances. 16,17 However, these strategies are resource intensive, require the presence of an independent observer in each patient room, and may not be practical in many settings. Further, long-term sustainability may be problematic.
Since the goal of any educational intervention targeting physicians is routinizing best practices, and since resource-intensive strategies of continuous assessment and feedback may not be practical, we sought to test the impact of periodic physician self-reporting of their etiquette-based behavior on their patient experience scores.
METHODS
Subjects
Hospitalists from 4 hospitals (2 community and 2 academic) that are part of the same healthcare system were the study subjects. Hospitalists who had at least 15 unique patients responding to the routinely administered Press Ganey experience survey during the baseline period were considered eligible. Eligible hospitalists were invited to enroll in the study if their site director confirmed that the provider was likely to stay with the group for the subsequent 12-month study period.

Randomization, Intervention and Control Group
Hospitalists were randomized to the study arm or control arm (1:1 randomization). Study arm participants received biweekly etiquette behavior (EB) surveys and were asked to report how frequently they performed 7 best-practice bedside etiquette behaviors during the previous 2-week period (Table 1). These behaviors were pre-defined by a consensus group of investigators as being amenable to self-report and commonly considered best practice as described in detail below. Control-arm participants received similarly worded survey on quality improvement behaviors (QIB) that would not be expected to impact patient experience (such as reviewing medications to ensure that antithrombotic prophylaxis was prescribed, Table 1).
Baseline and Study Periods
A 12-month period prior to the enrollment of each hospitalist was considered the baseline period for that individual. Hospitalist eligibility was assessed based on number of unique patients for each hospitalist who responded to the survey during this baseline period. Once enrolled, baseline provider-level patient experience scores were calculated based on the survey responses during this 12-month baseline period. Baseline etiquette behavior performance of the study was calculated from the first survey. After the initial survey, hospitalists received biweekly surveys (EB or QIB) for the 12-month study period for a total of 26 surveys (including the initial survey).
Survey Development, Nature of Survey, Survey Distribution Methods
The EB and QIB physician self-report surveys were developed through an iterative process by the study team. The EB survey included elements from an etiquette-based medicine checklist for hospitalized patients described by Kahn et al. 18 We conducted a review of literature to identify evidence-based practices.19-22 Research team members contributed items on best practices in etiquette-based medicine from their experience. Specifically, behaviors were selected if they met the following 4 criteria: 1) performing the behavior did not lead to significant increase in workload and was relatively easy to incorporate in the work flow; 2) occurrence of the behavior would be easy to note for any outside observer or the providers themselves; 3) the practice was considered to be either an evidence-based or consensus-based best-practice; 4) there was consensus among study team members on including the item. The survey was tested for understandability by hospitalists who were not eligible for the study.
The EB survey contained 7 items related to behaviors that were expected to impact patient experience. The QIB survey contained 4 items related to behaviors that were expected to improve quality (Table 1). The initial survey also included questions about demographic characteristics of the participants.
Survey questionnaires were sent via email every 2 weeks for a period of 12 months. The survey questionnaire became available every other week, between Friday morning and Tuesday midnight, during the study period. Hospitalists received daily email reminders on each of these days with a link to the survey website if they did not complete the survey. They had the opportunity to report that they were not on service in the prior week and opt out of the survey for the specific 2-week period. The survey questions were available online as well as on a mobile device format.
Provider Level Patient Experience Scores
Provider-level patient experience scores were calculated from the physician domain Press Ganey survey items, which included the time that the physician spent with patients, the physician addressed questions/worries, the physician kept patients informed, the friendliness/courtesy of physician, and the skill of physician. Press Ganey responses were scored from 1 to 5 based on the Likert scale responses on the survey such that a response “very good” was scored 5 and a response “very poor” was scored 1. Additionally, physician domain HCAHPS item (doctors treat with courtesy/respect, doctors listen carefully, doctors explain in way patients understand) responses were utilized to calculate another set of HCAHPS provider level experience scores. The responses were scored as 1 for “always” response and “0” for any other response, consistent with CMS dichotomization of these results for public reporting. Weighted scores were calculated for individual hospitalists based on the proportion of days each hospitalist billed for the hospitalization so that experience scores of patients who were cared for by multiple providers were assigned to each provider in proportion to the percent of care delivered.23 Separate composite physician scores were generated from the 5 Press Ganey and for the 3 HCAHPS physician items. Each item was weighted equally, with the maximum possible for Press Ganey composite score of 25 (sum of the maximum possible score of 5 on each of the 5 Press Ganey items) and the HCAHPS possible total was 3 (sum of the maximum possible score of 1 on each of the 3 HCAHPS items).
ANALYSIS AND STATISTICAL METHODS
We analyzed the data to assess for changes in frequency of self-reported behavior over the study period, changes in provider-level patient experience between baseline and study period, and the association between the these 2 outcomes. The self-reported etiquette-based behavior responses were scored as 1 for the lowest response (never) to 4 as the highest (always). With 7 questions, the maximum attainable score was 28. The maximum score was normalized to 100 for ease of interpretation (corresponding to percentage of time etiquette behaviors were employed, by self-report). Similarly, the maximum attainable self-reported QIB-related behavior score on the 4 questions was 16. This was also converted to 0-100 scale for ease of comparison.
Two additional sets of analyses were performed to evaluate changes in patient experience during the study period. First, the mean 12-month provider level patient experience composite score in the baseline period was compared with the 12-month composite score during the 12-month study period for the study group and the control group. These were assessed with and without adjusting for age, sex, race, and U.S. medical school graduate (USMG) status. In the second set of unadjusted and adjusted analyses, changes in biweekly composite scores during the study period were compared between the intervention and the control groups while accounting for correlation between observations from the same physician using mixed linear models. Linear mixed models were used to accommodate correlations among multiple observations made on the same physician by including random effects within each regression model. Furthermore, these models allowed us to account for unbalanced design in our data when not all physicians had an equal number of observations and data elements were collected asynchronously.24 Analyses were performed in R version 3.2.2 (The R Project for Statistical Computing, Vienna, Austria); linear mixed models were performed using the ‘nlme’ package.25
We hypothesized that self-reporting on biweekly surveys would result in increases in the frequency of the reported behavior in each arm. We also hypothesized that, because of biweekly reflection and self-reporting on etiquette-based bedside behavior, patient experience scores would increase in the study arm.
RESULTS
Of the 80 hospitalists approached to participate in the study, 64 elected to participate (80% participation rate). The mean response rate to the survey was 57.4% for the intervention arm and 85.7% for the control arm. Higher response rates were not associated with improved patient experience scores. Of the respondents, 43.1% were younger than 35 years of age, 51.5% practiced in academic settings, and 53.1% were female. There was no statistical difference between hospitalists’ baseline composite experience scores based on gender, age, academic hospitalist status, USMG status, and English as a second language status. Similarly, there were no differences in poststudy composite experience scores based on physician characteristics.
Physicians reported high rates of etiquette-based behavior at baseline (mean score, 83.9+/-3.3), and this showed moderate improvement over the study period (5.6 % [3.9%-7.3%, P < 0.0001]). Similarly, there was a moderate increase in frequency of self-reported behavior in the control arm (6.8% [3.5%-10.1%, P < 0.0001]). Hospitalists reported on 80.7% (77.6%-83.4%) of the biweekly surveys that they “almost always” wrapped up by asking, “Do you have any other questions or concerns” or something similar. In contrast, hospitalists reported on only 27.9% (24.7%-31.3%) of the biweekly survey that they “almost always” sat down in the patient room.
The composite physician domain Press Ganey experience scores were no different for the intervention arm and the control arm during the 12-month baseline period (21.8 vs. 21.7; P = 0.90) and the 12-month intervention period (21.6 vs. 21.5; P = 0.75). Baseline self-reported behaviors were not associated with baseline experience scores. Similarly, there were no differences between the arms on composite physician domain HCAHPS experience scores during baseline (2.1 vs. 2.3; P = 0.13) and intervention periods (2.2 vs. 2.1; P = 0.33).
The difference in difference analysis of the baseline and postintervention composite between the intervention arm and the control arm was not statistically significant for Press Ganey composite physician experience scores (-0.163 vs. -0.322; P = 0.71) or HCAHPS composite physician scores (-0.162 vs. -0.071; P = 0.06). The results did not change when controlled for survey response rate (percentage biweekly surveys completed by the hospitalist), age, gender, USMG status, English as a second language status, or percent clinical effort. The difference in difference analysis of the individual Press Ganey and HCAHPS physician domain items that were used to calculate the composite score was also not statistically significant (Table 2).

Changes in self-reported etiquette-based behavior were not associated with any changes in composite Press Ganey and HCAHPS experience score or individual items of the composite experience scores between baseline and intervention period. Similarly, biweekly self-reported etiquette behaviors were not associated with composite and individual item experience scores derived from responses of the patients discharged during the same 2-week reporting period. The intra-class correlation between observations from the same physician was only 0.02%, suggesting that most of the variation in scores was likely due to patient factors and did not result from differences between physicians.
DISCUSSION
This 12-month randomized multicenter study of hospitalists showed that repeated self-reporting of etiquette-based behavior results in modest reported increases in performance of these behaviors. However, there was no associated increase in provider level patient experience scores at the end of the study period when compared to baseline scores of the same physicians or when compared to the scores of the control group. The study demonstrated feasibility of self-reporting of behaviors by physicians with high participation when provided modest incentives.
Educational and feedback strategies used to improve patient experience are very resource intensive. Training sessions provided at some hospitals may take hours, and sustained effects are unproved. The presence of an independent observer in patient rooms to generate feedback for providers is not scalable and sustainable outside of a research study environment.9-11,15,17,26-29 We attempted to use physician repeated self-reporting to reinforce the important and easy to adopt components of etiquette-based behavior to develop a more easily sustainable strategy. This may have failed for several reasons.
When combining “always” and “usually” responses, the physicians in our study reported a high level of etiquette behavior at baseline. If physicians believe that they are performing well at baseline, they would not consider this to be an area in need of improvement. Bigger changes in behavior may have been possible had the physicians rated themselves less favorably at baseline. Inflated or high baseline self-assessment of performance might also have led to limited success of other types of educational interventions had they been employed.
Studies published since the rollout of our study have shown that physicians significantly overestimate how frequently they perform these etiquette behaviors.30,31 It is likely that was the case in our study subjects. This may, at best, indicate that a much higher change in the level of self-reported performance would be needed to result in meaningful actual changes, or worse, may render self-reported etiquette behavior entirely unreliable. Interventions designed to improve etiquette-based behavior might need to provide feedback about performance.
A program that provides education on the importance of etiquette-based behaviors, obtains objective measures of performance of these behaviors, and offers individualized feedback may be more likely to increase the desired behaviors. This is a limitation of our study. However, we aimed to test a method that required limited resources. Additionally, our method for attributing HCAHPS scores to an individual physician, based on weighted scores that were calculated according to the proportion of days each hospitalist billed for the hospitalization, may be inaccurate. It is possible that each interaction does not contribute equally to the overall score. A team-based intervention and experience measurements could overcome this limitation.
CONCLUSION
This randomized trial demonstrated the feasibility of self-assessment of bedside etiquette behaviors by hospitalists but failed to demonstrate a meaningful impact on patient experience through self-report. These findings suggest that more intensive interventions, perhaps involving direct observation, peer-to-peer mentoring, or other techniques may be required to impact significantly physician etiquette behaviors.
Disclosure
Johns Hopkins Hospitalist Scholars Program provided funding support. Dr. Qayyum is a consultant for Sunovion. The other authors have nothing to report.
1. Blumenthal D, Kilo CM. A report card on continuous quality improvement. Milbank Q. 1998;76(4):625-648. PubMed
2. Shortell SM, Bennett CL, Byck GR. Assessing the impact of continuous quality improvement on clinical practice: What it will take to accelerate progress. Milbank Q. 1998;76(4):593-624. PubMed
3. Mann RK, Siddiqui Z, Kurbanova N, Qayyum R. Effect of HCAHPS reporting on patient satisfaction with physician communication. J Hosp Med. 2015;11(2):105-110. PubMed
4. Rivers PA, Glover SH. Health care competition, strategic mission, and patient satisfaction: research model and propositions. J Health Organ Manag. 2008;22(6):627-641. PubMed
5. Kim SS, Kaplowitz S, Johnston MV. The effects of physician empathy on patient satisfaction and compliance. Eval Health Prof. 2004;27(3):237-251. PubMed
6. Stelfox HT, Gandhi TK, Orav EJ, Gustafson ML. The relation of patient satisfaction with complaints against physicians and malpractice lawsuits. Am J Med. 2005;118(10):1126-1133. PubMed
7. Rodriguez HP, Rodday AM, Marshall RE, Nelson KL, Rogers WH, Safran DG. Relation of patients’ experiences with individual physicians to malpractice risk. Int J Qual Health Care. 2008;20(1):5-12. PubMed
8. Cydulka RK, Tamayo-Sarver J, Gage A, Bagnoli D. Association of patient satisfaction with complaints and risk management among emergency physicians. J Emerg Med. 2011;41(4):405-411. PubMed
9. Windover AK, Boissy A, Rice TW, Gilligan T, Velez VJ, Merlino J. The REDE model of healthcare communication: Optimizing relationship as a therapeutic agent. Journal of Patient Experience. 2014;1(1):8-13.
10. Chou CL, Hirschmann K, Fortin AH 6th, Lichstein PR. The impact of a faculty learning community on professional and personal development: the facilitator training program of the American Academy on Communication in Healthcare. Acad Med. 2014;89(7):1051-1056. PubMed
11. Kennedy M, Denise M, Fasolino M, John P, Gullen M, David J. Improving the patient experience through provider communication skills building. Patient Experience Journal. 2014;1(1):56-60.
12. Braverman AM, Kunkel EJ, Katz L, et al. Do I buy it? How AIDET™ training changes residents’ values about patient care. Journal of Patient Experience. 2015;2(1):13-20.
13. Riess H, Kelley JM, Bailey RW, Dunn EJ, Phillips M. Empathy training for resident physicians: a randomized controlled trial of a neuroscience-informed curriculum. J Gen Intern Med. 2012;27(10):1280-1286. PubMed
14. Rothberg MB, Steele JR, Wheeler J, Arora A, Priya A, Lindenauer PK. The relationship between time spent communicating and communication outcomes on a hospital medicine service. J Gen Internl Med. 2012;27(2):185-189. PubMed
15. O’Leary KJ, Cyrus RM. Improving patient satisfaction: timely feedback to specific physicians is essential for success. J Hosp Med. 2015;10(8):555-556. PubMed
16. Indovina K, Keniston A, Reid M, et al. Real‐time patient experience surveys of hospitalized medical patients. J Hosp Med. 2016;10(8):497-502. PubMed
17. Banka G, Edgington S, Kyulo N, et al. Improving patient satisfaction through physician education, feedback, and incentives. J Hosp Med. 2015;10(8):497-502. PubMed
18. Kahn MW. Etiquette-based medicine. N Engl J Med. 2008;358(19):1988-1989. PubMed
19. Arora V, Gangireddy S, Mehrotra A, Ginde R, Tormey M, Meltzer D. Ability of hospitalized patients to identify their in-hospital physicians. Arch Intern Med. 2009;169(2):199-201. PubMed
20. Francis JJ, Pankratz VS, Huddleston JM. Patient satisfaction associated with correct identification of physicians’ photographs. Mayo Clin Proc. 2001;76(6):604-608. PubMed
21. Strasser F, Palmer JL, Willey J, et al. Impact of physician sitting versus standing during inpatient oncology consultations: patients’ preference and perception of compassion and duration. A randomized controlled trial. J Pain Symptom Manage. 2005;29(5):489-497. PubMed
22. Dudas RA, Lemerman H, Barone M, Serwint JR. PHACES (Photographs of Academic Clinicians and Their Educational Status): a tool to improve delivery of family-centered care. Acad Pediatr. 2010;10(2):138-145. PubMed
23. Herzke C, Michtalik H, Durkin N, et al. A method for attributing patient-level metrics to rotating providers in an inpatient setting. J Hosp Med. Under revision.
24. Holden JE, Kelley K, Agarwal R. Analyzing change: a primer on multilevel models with applications to nephrology. Am J Nephrol. 2008;28(5):792-801. PubMed
25. Pinheiro J, Bates D, DebRoy S, Sarkar D. Linear and nonlinear mixed effects models. R package version. 2007;3:57.
26. Braverman AM, Kunkel EJ, Katz L, et al. Do I buy it? How AIDET™ training changes residents’ values about patient care. Journal of Patient Experience. 2015;2(1):13-20.
27. Riess H, Kelley JM, Bailey RW, Dunn EJ, Phillips M. Empathy training for resident physicians: A randomized controlled trial of a neuroscience-informed curriculum. J Gen Intern Med. 2012;27(10):1280-1286. PubMed
28. Raper SE, Gupta M, Okusanya O, Morris JB. Improving communication skills: A course for academic medical center surgery residents and faculty. J Surg Educ. 2015;72(6):e202-e211. PubMed
29. Indovina K, Keniston A, Reid M, et al. Real‐time patient experience surveys of hospitalized medical patients. J Hosp Med. 2016;11(4):251-256. PubMed
30. Block L, Hutzler L, Habicht R, et al. Do internal medicine interns practice etiquette‐based communication? A critical look at the inpatient encounter. J Hosp Med. 2013;8(11):631-634. PubMed
31. Tackett S, Tad-y D, Rios R, Kisuule F, Wright S. Appraising the practice of etiquette-based medicine in the inpatient setting. J Gen Intern Med. 2013;28(7):908-913. PubMed
Physicians have historically had limited adoption of strategies to improve patient experience and often cite suboptimal data and lack of evidence-driven strategies. 1,2 However, public reporting of hospital-level physician domain Hospital Consumer Assessment of Healthcare Providers and Systems (HCAHPS) experience scores, and more recent linking of payments to performance on patient experience metrics, have been associated with significant increases in physician domain scores for most of the hospitals. 3 Hospitals and healthcare organizations have deployed a broad range of strategies to engage physicians. These include emphasizing the relationship between patient experience and patient compliance, complaints, and malpractice lawsuits; appealing to physicians’ sense of competitiveness by publishing individual provider experience scores; educating physicians on HCAHPS and providing them with regularly updated data; and development of specific techniques for improving patient-physician interaction. 4-8
Studies show that educational curricula on improving etiquette and communication skills for physicians lead to improvement in patient experience, and many such training programs are available to hospitals for a significant cost.9-15 Other studies that have focused on providing timely and individual feedback to physicians using tools other than HCAHPS have shown improvement in experience in some instances. 16,17 However, these strategies are resource intensive, require the presence of an independent observer in each patient room, and may not be practical in many settings. Further, long-term sustainability may be problematic.
Since the goal of any educational intervention targeting physicians is routinizing best practices, and since resource-intensive strategies of continuous assessment and feedback may not be practical, we sought to test the impact of periodic physician self-reporting of their etiquette-based behavior on their patient experience scores.
METHODS
Subjects
Hospitalists from 4 hospitals (2 community and 2 academic) that are part of the same healthcare system were the study subjects. Hospitalists who had at least 15 unique patients responding to the routinely administered Press Ganey experience survey during the baseline period were considered eligible. Eligible hospitalists were invited to enroll in the study if their site director confirmed that the provider was likely to stay with the group for the subsequent 12-month study period.
Randomization, Intervention and Control Group
Hospitalists were randomized to the study arm or control arm (1:1 randomization). Study arm participants received biweekly etiquette behavior (EB) surveys and were asked to report how frequently they performed 7 best-practice bedside etiquette behaviors during the previous 2-week period (Table 1). These behaviors were pre-defined by a consensus group of investigators as being amenable to self-report and commonly considered best practice as described in detail below. Control-arm participants received similarly worded survey on quality improvement behaviors (QIB) that would not be expected to impact patient experience (such as reviewing medications to ensure that antithrombotic prophylaxis was prescribed, Table 1).
Baseline and Study Periods
A 12-month period prior to the enrollment of each hospitalist was considered the baseline period for that individual. Hospitalist eligibility was assessed based on number of unique patients for each hospitalist who responded to the survey during this baseline period. Once enrolled, baseline provider-level patient experience scores were calculated based on the survey responses during this 12-month baseline period. Baseline etiquette behavior performance of the study was calculated from the first survey. After the initial survey, hospitalists received biweekly surveys (EB or QIB) for the 12-month study period for a total of 26 surveys (including the initial survey).
Survey Development, Nature of Survey, Survey Distribution Methods
The EB and QIB physician self-report surveys were developed through an iterative process by the study team. The EB survey included elements from an etiquette-based medicine checklist for hospitalized patients described by Kahn et al. 18 We conducted a review of literature to identify evidence-based practices.19-22 Research team members contributed items on best practices in etiquette-based medicine from their experience. Specifically, behaviors were selected if they met the following 4 criteria: 1) performing the behavior did not lead to significant increase in workload and was relatively easy to incorporate in the work flow; 2) occurrence of the behavior would be easy to note for any outside observer or the providers themselves; 3) the practice was considered to be either an evidence-based or consensus-based best-practice; 4) there was consensus among study team members on including the item. The survey was tested for understandability by hospitalists who were not eligible for the study.
The EB survey contained 7 items related to behaviors that were expected to impact patient experience. The QIB survey contained 4 items related to behaviors that were expected to improve quality (Table 1). The initial survey also included questions about demographic characteristics of the participants.
Survey questionnaires were sent via email every 2 weeks for a period of 12 months. The survey questionnaire became available every other week, between Friday morning and Tuesday midnight, during the study period. Hospitalists received daily email reminders on each of these days with a link to the survey website if they did not complete the survey. They had the opportunity to report that they were not on service in the prior week and opt out of the survey for the specific 2-week period. The survey questions were available online as well as on a mobile device format.
Provider Level Patient Experience Scores
Provider-level patient experience scores were calculated from the physician domain Press Ganey survey items, which included the time that the physician spent with patients, the physician addressed questions/worries, the physician kept patients informed, the friendliness/courtesy of physician, and the skill of physician. Press Ganey responses were scored from 1 to 5 based on the Likert scale responses on the survey such that a response “very good” was scored 5 and a response “very poor” was scored 1. Additionally, physician domain HCAHPS item (doctors treat with courtesy/respect, doctors listen carefully, doctors explain in way patients understand) responses were utilized to calculate another set of HCAHPS provider level experience scores. The responses were scored as 1 for “always” response and “0” for any other response, consistent with CMS dichotomization of these results for public reporting. Weighted scores were calculated for individual hospitalists based on the proportion of days each hospitalist billed for the hospitalization so that experience scores of patients who were cared for by multiple providers were assigned to each provider in proportion to the percent of care delivered.23 Separate composite physician scores were generated from the 5 Press Ganey and for the 3 HCAHPS physician items. Each item was weighted equally, with the maximum possible for Press Ganey composite score of 25 (sum of the maximum possible score of 5 on each of the 5 Press Ganey items) and the HCAHPS possible total was 3 (sum of the maximum possible score of 1 on each of the 3 HCAHPS items).
ANALYSIS AND STATISTICAL METHODS
We analyzed the data to assess for changes in frequency of self-reported behavior over the study period, changes in provider-level patient experience between baseline and study period, and the association between the these 2 outcomes. The self-reported etiquette-based behavior responses were scored as 1 for the lowest response (never) to 4 as the highest (always). With 7 questions, the maximum attainable score was 28. The maximum score was normalized to 100 for ease of interpretation (corresponding to percentage of time etiquette behaviors were employed, by self-report). Similarly, the maximum attainable self-reported QIB-related behavior score on the 4 questions was 16. This was also converted to 0-100 scale for ease of comparison.
Two additional sets of analyses were performed to evaluate changes in patient experience during the study period. First, the mean 12-month provider level patient experience composite score in the baseline period was compared with the 12-month composite score during the 12-month study period for the study group and the control group. These were assessed with and without adjusting for age, sex, race, and U.S. medical school graduate (USMG) status. In the second set of unadjusted and adjusted analyses, changes in biweekly composite scores during the study period were compared between the intervention and the control groups while accounting for correlation between observations from the same physician using mixed linear models. Linear mixed models were used to accommodate correlations among multiple observations made on the same physician by including random effects within each regression model. Furthermore, these models allowed us to account for unbalanced design in our data when not all physicians had an equal number of observations and data elements were collected asynchronously.24 Analyses were performed in R version 3.2.2 (The R Project for Statistical Computing, Vienna, Austria); linear mixed models were performed using the ‘nlme’ package.25
We hypothesized that self-reporting on biweekly surveys would result in increases in the frequency of the reported behavior in each arm. We also hypothesized that, because of biweekly reflection and self-reporting on etiquette-based bedside behavior, patient experience scores would increase in the study arm.
RESULTS
Of the 80 hospitalists approached to participate in the study, 64 elected to participate (80% participation rate). The mean response rate to the survey was 57.4% for the intervention arm and 85.7% for the control arm. Higher response rates were not associated with improved patient experience scores. Of the respondents, 43.1% were younger than 35 years of age, 51.5% practiced in academic settings, and 53.1% were female. There was no statistical difference between hospitalists’ baseline composite experience scores based on gender, age, academic hospitalist status, USMG status, and English as a second language status. Similarly, there were no differences in poststudy composite experience scores based on physician characteristics.
Physicians reported high rates of etiquette-based behavior at baseline (mean score, 83.9+/-3.3), and this showed moderate improvement over the study period (5.6 % [3.9%-7.3%, P < 0.0001]). Similarly, there was a moderate increase in frequency of self-reported behavior in the control arm (6.8% [3.5%-10.1%, P < 0.0001]). Hospitalists reported on 80.7% (77.6%-83.4%) of the biweekly surveys that they “almost always” wrapped up by asking, “Do you have any other questions or concerns” or something similar. In contrast, hospitalists reported on only 27.9% (24.7%-31.3%) of the biweekly survey that they “almost always” sat down in the patient room.
The composite physician domain Press Ganey experience scores were no different for the intervention arm and the control arm during the 12-month baseline period (21.8 vs. 21.7; P = 0.90) and the 12-month intervention period (21.6 vs. 21.5; P = 0.75). Baseline self-reported behaviors were not associated with baseline experience scores. Similarly, there were no differences between the arms on composite physician domain HCAHPS experience scores during baseline (2.1 vs. 2.3; P = 0.13) and intervention periods (2.2 vs. 2.1; P = 0.33).
The difference in difference analysis of the baseline and postintervention composite between the intervention arm and the control arm was not statistically significant for Press Ganey composite physician experience scores (-0.163 vs. -0.322; P = 0.71) or HCAHPS composite physician scores (-0.162 vs. -0.071; P = 0.06). The results did not change when controlled for survey response rate (percentage biweekly surveys completed by the hospitalist), age, gender, USMG status, English as a second language status, or percent clinical effort. The difference in difference analysis of the individual Press Ganey and HCAHPS physician domain items that were used to calculate the composite score was also not statistically significant (Table 2).
Changes in self-reported etiquette-based behavior were not associated with any changes in composite Press Ganey and HCAHPS experience score or individual items of the composite experience scores between baseline and intervention period. Similarly, biweekly self-reported etiquette behaviors were not associated with composite and individual item experience scores derived from responses of the patients discharged during the same 2-week reporting period. The intra-class correlation between observations from the same physician was only 0.02%, suggesting that most of the variation in scores was likely due to patient factors and did not result from differences between physicians.
DISCUSSION
This 12-month randomized multicenter study of hospitalists showed that repeated self-reporting of etiquette-based behavior results in modest reported increases in performance of these behaviors. However, there was no associated increase in provider level patient experience scores at the end of the study period when compared to baseline scores of the same physicians or when compared to the scores of the control group. The study demonstrated feasibility of self-reporting of behaviors by physicians with high participation when provided modest incentives.
Educational and feedback strategies used to improve patient experience are very resource intensive. Training sessions provided at some hospitals may take hours, and sustained effects are unproved. The presence of an independent observer in patient rooms to generate feedback for providers is not scalable and sustainable outside of a research study environment.9-11,15,17,26-29 We attempted to use physician repeated self-reporting to reinforce the important and easy to adopt components of etiquette-based behavior to develop a more easily sustainable strategy. This may have failed for several reasons.
When combining “always” and “usually” responses, the physicians in our study reported a high level of etiquette behavior at baseline. If physicians believe that they are performing well at baseline, they would not consider this to be an area in need of improvement. Bigger changes in behavior may have been possible had the physicians rated themselves less favorably at baseline. Inflated or high baseline self-assessment of performance might also have led to limited success of other types of educational interventions had they been employed.
Studies published since the rollout of our study have shown that physicians significantly overestimate how frequently they perform these etiquette behaviors.30,31 It is likely that was the case in our study subjects. This may, at best, indicate that a much higher change in the level of self-reported performance would be needed to result in meaningful actual changes, or worse, may render self-reported etiquette behavior entirely unreliable. Interventions designed to improve etiquette-based behavior might need to provide feedback about performance.
A program that provides education on the importance of etiquette-based behaviors, obtains objective measures of performance of these behaviors, and offers individualized feedback may be more likely to increase the desired behaviors. This is a limitation of our study. However, we aimed to test a method that required limited resources. Additionally, our method for attributing HCAHPS scores to an individual physician, based on weighted scores that were calculated according to the proportion of days each hospitalist billed for the hospitalization, may be inaccurate. It is possible that each interaction does not contribute equally to the overall score. A team-based intervention and experience measurements could overcome this limitation.
CONCLUSION
This randomized trial demonstrated the feasibility of self-assessment of bedside etiquette behaviors by hospitalists but failed to demonstrate a meaningful impact on patient experience through self-report. These findings suggest that more intensive interventions, perhaps involving direct observation, peer-to-peer mentoring, or other techniques may be required to impact significantly physician etiquette behaviors.
Disclosure
Johns Hopkins Hospitalist Scholars Program provided funding support. Dr. Qayyum is a consultant for Sunovion. The other authors have nothing to report.
1. Blumenthal D, Kilo CM. A report card on continuous quality improvement. Milbank Q. 1998;76(4):625-648. PubMed
2. Shortell SM, Bennett CL, Byck GR. Assessing the impact of continuous quality improvement on clinical practice: What it will take to accelerate progress. Milbank Q. 1998;76(4):593-624. PubMed
3. Mann RK, Siddiqui Z, Kurbanova N, Qayyum R. Effect of HCAHPS reporting on patient satisfaction with physician communication. J Hosp Med. 2015;11(2):105-110. PubMed
4. Rivers PA, Glover SH. Health care competition, strategic mission, and patient satisfaction: research model and propositions. J Health Organ Manag. 2008;22(6):627-641. PubMed
5. Kim SS, Kaplowitz S, Johnston MV. The effects of physician empathy on patient satisfaction and compliance. Eval Health Prof. 2004;27(3):237-251. PubMed
6. Stelfox HT, Gandhi TK, Orav EJ, Gustafson ML. The relation of patient satisfaction with complaints against physicians and malpractice lawsuits. Am J Med. 2005;118(10):1126-1133. PubMed
7. Rodriguez HP, Rodday AM, Marshall RE, Nelson KL, Rogers WH, Safran DG. Relation of patients’ experiences with individual physicians to malpractice risk. Int J Qual Health Care. 2008;20(1):5-12. PubMed
8. Cydulka RK, Tamayo-Sarver J, Gage A, Bagnoli D. Association of patient satisfaction with complaints and risk management among emergency physicians. J Emerg Med. 2011;41(4):405-411. PubMed
9. Windover AK, Boissy A, Rice TW, Gilligan T, Velez VJ, Merlino J. The REDE model of healthcare communication: Optimizing relationship as a therapeutic agent. Journal of Patient Experience. 2014;1(1):8-13.
10. Chou CL, Hirschmann K, Fortin AH 6th, Lichstein PR. The impact of a faculty learning community on professional and personal development: the facilitator training program of the American Academy on Communication in Healthcare. Acad Med. 2014;89(7):1051-1056. PubMed
11. Kennedy M, Denise M, Fasolino M, John P, Gullen M, David J. Improving the patient experience through provider communication skills building. Patient Experience Journal. 2014;1(1):56-60.
12. Braverman AM, Kunkel EJ, Katz L, et al. Do I buy it? How AIDET™ training changes residents’ values about patient care. Journal of Patient Experience. 2015;2(1):13-20.
13. Riess H, Kelley JM, Bailey RW, Dunn EJ, Phillips M. Empathy training for resident physicians: a randomized controlled trial of a neuroscience-informed curriculum. J Gen Intern Med. 2012;27(10):1280-1286. PubMed
14. Rothberg MB, Steele JR, Wheeler J, Arora A, Priya A, Lindenauer PK. The relationship between time spent communicating and communication outcomes on a hospital medicine service. J Gen Internl Med. 2012;27(2):185-189. PubMed
15. O’Leary KJ, Cyrus RM. Improving patient satisfaction: timely feedback to specific physicians is essential for success. J Hosp Med. 2015;10(8):555-556. PubMed
16. Indovina K, Keniston A, Reid M, et al. Real‐time patient experience surveys of hospitalized medical patients. J Hosp Med. 2016;10(8):497-502. PubMed
17. Banka G, Edgington S, Kyulo N, et al. Improving patient satisfaction through physician education, feedback, and incentives. J Hosp Med. 2015;10(8):497-502. PubMed
18. Kahn MW. Etiquette-based medicine. N Engl J Med. 2008;358(19):1988-1989. PubMed
19. Arora V, Gangireddy S, Mehrotra A, Ginde R, Tormey M, Meltzer D. Ability of hospitalized patients to identify their in-hospital physicians. Arch Intern Med. 2009;169(2):199-201. PubMed
20. Francis JJ, Pankratz VS, Huddleston JM. Patient satisfaction associated with correct identification of physicians’ photographs. Mayo Clin Proc. 2001;76(6):604-608. PubMed
21. Strasser F, Palmer JL, Willey J, et al. Impact of physician sitting versus standing during inpatient oncology consultations: patients’ preference and perception of compassion and duration. A randomized controlled trial. J Pain Symptom Manage. 2005;29(5):489-497. PubMed
22. Dudas RA, Lemerman H, Barone M, Serwint JR. PHACES (Photographs of Academic Clinicians and Their Educational Status): a tool to improve delivery of family-centered care. Acad Pediatr. 2010;10(2):138-145. PubMed
23. Herzke C, Michtalik H, Durkin N, et al. A method for attributing patient-level metrics to rotating providers in an inpatient setting. J Hosp Med. Under revision.
24. Holden JE, Kelley K, Agarwal R. Analyzing change: a primer on multilevel models with applications to nephrology. Am J Nephrol. 2008;28(5):792-801. PubMed
25. Pinheiro J, Bates D, DebRoy S, Sarkar D. Linear and nonlinear mixed effects models. R package version. 2007;3:57.
26. Braverman AM, Kunkel EJ, Katz L, et al. Do I buy it? How AIDET™ training changes residents’ values about patient care. Journal of Patient Experience. 2015;2(1):13-20.
27. Riess H, Kelley JM, Bailey RW, Dunn EJ, Phillips M. Empathy training for resident physicians: A randomized controlled trial of a neuroscience-informed curriculum. J Gen Intern Med. 2012;27(10):1280-1286. PubMed
28. Raper SE, Gupta M, Okusanya O, Morris JB. Improving communication skills: A course for academic medical center surgery residents and faculty. J Surg Educ. 2015;72(6):e202-e211. PubMed
29. Indovina K, Keniston A, Reid M, et al. Real‐time patient experience surveys of hospitalized medical patients. J Hosp Med. 2016;11(4):251-256. PubMed
30. Block L, Hutzler L, Habicht R, et al. Do internal medicine interns practice etiquette‐based communication? A critical look at the inpatient encounter. J Hosp Med. 2013;8(11):631-634. PubMed
31. Tackett S, Tad-y D, Rios R, Kisuule F, Wright S. Appraising the practice of etiquette-based medicine in the inpatient setting. J Gen Intern Med. 2013;28(7):908-913. PubMed
© 2017 Society of Hospital Medicine