User login
Days of Therapy Avoided: A Novel Method for Measuring the Impact of an Antimicrobial Stewardship Program to Stop Antibiotics
A proposed metric to quantify the impact of an antimicrobial stewardship program (ASP) is using changes in the antibiotic days of therapy (DOT) per 1000 patient-days, which is the total number of days any dose of an antibiotic is administered during a specified time period, standardized by the number of patient-days.1 Although DOT is useful for comparing antibiotic use among hospitals or time periods, this metric is a composite result of an ASP’s often multifaceted approach to improving antibiotic use. Thus, DOT provides a loose estimate of the direct impact of specific ASP activities and does not quantify the amount of antibiotics directly avoided or direct cost savings on the patient level. To ameliorate this, we reviewed our institution’s ASP prospective audit and feedback (PAF) and applied a novel metric, days of therapy avoided (DOTA), to calculate the number of antibiotic days avoided that directly result from our ASP’s actions targeting antibiotic stoppage. From DOTA, we also calculate attributable cost savings.
METHODS
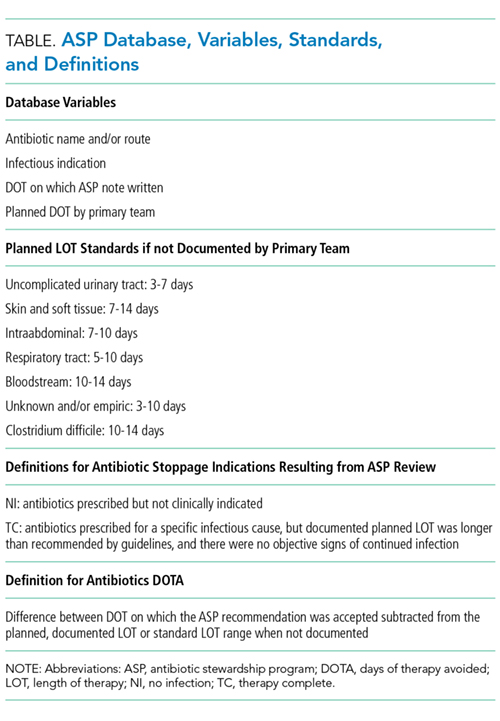
To quantify the direct impact of PAF, DOTA (Table) was calculated. Antibiotic costs avoided were calculated by multiplying the average wholesale price (AWP) per day (range: $0.44-$534; mean: $67.85) by DOTA. This calculation was done twice under 2 assumptions: that PAF led to the prevention of (1) 1 more day of antibiotic prescription and (2) the remainder of the documented or assumed LOT.
RESULTS
Over 4 years, the ASP made 1594 interventions to stop antibiotics. Accepted interventions totaled 1151 (72%): 513 (44.5%) for NI and 638 (55.4%) for TC, involving 431 and 575 unique patients, respectively. Nearly half (45.8%) of the NI interventions targeted asymptomatic bacteriuria, whereas respiratory tract infections were the most common (42.2%) indication for the TC intervention.
Under the most conservative assumption that each accepted PAF recommendation avoided 1 day of unnecessary antibiotics, we estimated a total of 1151 DOTA; 690 (59.9%) were intravenous antibiotics. The average DOT on which the PAF note was written was 3.07 ± 1.69 for NI and 6.38 ± 2.73 for TC. A planned LOT was documented for only 36.7% of the courses. On the basis of documented or assumed LOT, we estimate that the NI and TC interventions led to between 1077 and 2826 DOTA and between 397 and 1598 DOTA, respectively. Potential fluoroquinolone DOTA ranged from 300 to 1126; for third- and fourth-generation cephalosporins, there were 314 to 1017 DOTA.
Using the conservative estimate of 1151 DOTA, the costs avoided totaled $16,700, which includes $10,700 for intravenous antibiotics. When the AWP per day of each antibiotic was applied to the remaining LOTs avoided, the maximum potential cost savings was $67,100. Additional cost savings may have been realized if indirect expenses, such as pharmacy preparation and nursing administration time or costs of medical supplies, were evaluated.
CONCLUSION
We investigated DOTA as a measure of the direct patient-level and intervention-specific impact of an ASP’s PAF. DOTA may be useful for ASPs with limited access to an electronic record or electronically generated DOT reports because DOTA and cost savings can be tracked manually and prospectively with each accepted intervention. DOTA can also help ASPs identify which clinical conditions are responsible for the most antibiotic overuse, and thus may benefit from the development of clinical treatment guidelines. We found that the highest yield areas for DOTA were targeting asymptomatic bacteriuria (NI) and respiratory infections (TC). In doing so, these have also succeeded in reducing high-risk, broad-spectrum antimicrobials, such as fluoroquinolones and advanced-generation cephalosporins. Further research is needed to assess if DOTA correlates with other ASP metrics and clinical outcomes; however, current evidence supports that reducing unnecessary antibiotic use is fundamental to reducing antibiotic resistance and adverse events.10
The limitations of measuring DOTA include time consumption, particularly if not collected prospectively. However, we make several conclusions. ASP PAF stopping antibiotics was well accepted and reduced antibiotic use. Second, calculating DOTA requires little technology and only knowledge of the planned LOT and drug costs. DOTA also identifies which infectious indications to focus PAF efforts on and gain the greatest impact. Overall, DOTA is a simple, useful, and promising measurement of the direct antibiotic and economic impacts of specific ASP PAF and warrants further investigation as an ASP metric.
Acknowledgments
The authors thank the patients and RGH staff, particularly the departments of infectious diseases, pharmacy, and internal medicine, for their support.
Disclosure
The authors declare no conflicts of interest. This study was previously presented in poster form at the Society for Healthcare Epidemiology of America Spring Conference in St. Louis, Missouri (March 29-31, 2017).
1. Moehring RW, Anderson DJ, Cochran RL, Hicks LA, Srinivasan A, Dodds-Ashley ES. Structured Taskforce of Experts Working at Reliable Standards for Stewardship Panel. Expert consensus on metrics to assess the impact of patient-level antimicrobial stewardship interventions in acute-care settings. Clin Infect Dis. 2016;64(3):377-383. PubMed
2. Gupta K, Hooton TM, Naber KG, et al. International clinical practice guidelines for the treatment of acute uncomplicated cystitis and pyelonephritis in women: a 2010 update by the Infectious Diseases Society of America and the European Society for Microbiology and Infectious Diseases. Clin Infect Dis. 2011;52(5):e103-e120. PubMed
3. Stevens DL, Bisno AL, Chambers HF, et al. Practice guidelines for the diagnosis and management of skin and soft tissue infections: 2014 update by the Infectious Diseases Society of America. Clin Infect Dis. 2014;59(2):e10-e52. PubMed
4. Lipsky BA, Berendt AR, Cornia PB, et al. 2012 Infectious Diseases Society of America clinical practice guideline for the diagnosis and treatment of diabetic foot infections. Clin Infect Dis. 2012;54(12):e132-e173. PubMed
5. Solomkin JS, Mazuski JE, Bradley JS, et al. Diagnosis and management of complicated intraabdominal infection in adults and children: guidelines by the Surgical Infection Society and the Infectious Diseases Society of America. Clin Infect Dis. 2010;50(2):133-164. PubMed
6. Mandell LA, Wunderink RG, Anzueto A, et al. Infectious Diseases Society of America/American Thoracic Society consensus guidelines on the management of community-acquired pneumonia in adults. Clin Infect Dis. 2007;44(Supplement 2):S27-S72. PubMed
7. American Thoracic Society; Infectious Diseases Society of America. Guidelines for the management of adults with hospital-acquired, ventilator-associated, and healthcare-associated pneumonia. Am J Respir Crit Care Med. 2005;171(4):388-416. PubMed
8. Havey TC, Fowler RA, Daneman N. Duration of antibiotic therapy for bacteremia: a systematic review and meta-analysis. Crit Care. 2011;15(6):R267. PubMed
9. Cohen SH, Gerding DN, Johnson S, Kelly CP. Clinical practice guidelines for Clostridium difficile infection in adults: 2010 update by the society for healthcare epidemiology of America (SHEA) and the Infectious Diseases Society of America (IDSA). Infect Control Hosp Epidemiol. 2010;31(5):431-455. PubMed
10. Llewelyn MJ, Fitzpatrick JM, Darwin E, et al. The antibiotic course has had its day. BMJ 2017;358:j3418. PubMed
A proposed metric to quantify the impact of an antimicrobial stewardship program (ASP) is using changes in the antibiotic days of therapy (DOT) per 1000 patient-days, which is the total number of days any dose of an antibiotic is administered during a specified time period, standardized by the number of patient-days.1 Although DOT is useful for comparing antibiotic use among hospitals or time periods, this metric is a composite result of an ASP’s often multifaceted approach to improving antibiotic use. Thus, DOT provides a loose estimate of the direct impact of specific ASP activities and does not quantify the amount of antibiotics directly avoided or direct cost savings on the patient level. To ameliorate this, we reviewed our institution’s ASP prospective audit and feedback (PAF) and applied a novel metric, days of therapy avoided (DOTA), to calculate the number of antibiotic days avoided that directly result from our ASP’s actions targeting antibiotic stoppage. From DOTA, we also calculate attributable cost savings.
METHODS
To quantify the direct impact of PAF, DOTA (Table) was calculated. Antibiotic costs avoided were calculated by multiplying the average wholesale price (AWP) per day (range: $0.44-$534; mean: $67.85) by DOTA. This calculation was done twice under 2 assumptions: that PAF led to the prevention of (1) 1 more day of antibiotic prescription and (2) the remainder of the documented or assumed LOT.
RESULTS
Over 4 years, the ASP made 1594 interventions to stop antibiotics. Accepted interventions totaled 1151 (72%): 513 (44.5%) for NI and 638 (55.4%) for TC, involving 431 and 575 unique patients, respectively. Nearly half (45.8%) of the NI interventions targeted asymptomatic bacteriuria, whereas respiratory tract infections were the most common (42.2%) indication for the TC intervention.
Under the most conservative assumption that each accepted PAF recommendation avoided 1 day of unnecessary antibiotics, we estimated a total of 1151 DOTA; 690 (59.9%) were intravenous antibiotics. The average DOT on which the PAF note was written was 3.07 ± 1.69 for NI and 6.38 ± 2.73 for TC. A planned LOT was documented for only 36.7% of the courses. On the basis of documented or assumed LOT, we estimate that the NI and TC interventions led to between 1077 and 2826 DOTA and between 397 and 1598 DOTA, respectively. Potential fluoroquinolone DOTA ranged from 300 to 1126; for third- and fourth-generation cephalosporins, there were 314 to 1017 DOTA.
Using the conservative estimate of 1151 DOTA, the costs avoided totaled $16,700, which includes $10,700 for intravenous antibiotics. When the AWP per day of each antibiotic was applied to the remaining LOTs avoided, the maximum potential cost savings was $67,100. Additional cost savings may have been realized if indirect expenses, such as pharmacy preparation and nursing administration time or costs of medical supplies, were evaluated.
CONCLUSION
We investigated DOTA as a measure of the direct patient-level and intervention-specific impact of an ASP’s PAF. DOTA may be useful for ASPs with limited access to an electronic record or electronically generated DOT reports because DOTA and cost savings can be tracked manually and prospectively with each accepted intervention. DOTA can also help ASPs identify which clinical conditions are responsible for the most antibiotic overuse, and thus may benefit from the development of clinical treatment guidelines. We found that the highest yield areas for DOTA were targeting asymptomatic bacteriuria (NI) and respiratory infections (TC). In doing so, these have also succeeded in reducing high-risk, broad-spectrum antimicrobials, such as fluoroquinolones and advanced-generation cephalosporins. Further research is needed to assess if DOTA correlates with other ASP metrics and clinical outcomes; however, current evidence supports that reducing unnecessary antibiotic use is fundamental to reducing antibiotic resistance and adverse events.10
The limitations of measuring DOTA include time consumption, particularly if not collected prospectively. However, we make several conclusions. ASP PAF stopping antibiotics was well accepted and reduced antibiotic use. Second, calculating DOTA requires little technology and only knowledge of the planned LOT and drug costs. DOTA also identifies which infectious indications to focus PAF efforts on and gain the greatest impact. Overall, DOTA is a simple, useful, and promising measurement of the direct antibiotic and economic impacts of specific ASP PAF and warrants further investigation as an ASP metric.
Acknowledgments
The authors thank the patients and RGH staff, particularly the departments of infectious diseases, pharmacy, and internal medicine, for their support.
Disclosure
The authors declare no conflicts of interest. This study was previously presented in poster form at the Society for Healthcare Epidemiology of America Spring Conference in St. Louis, Missouri (March 29-31, 2017).
1. Moehring RW, Anderson DJ, Cochran RL, Hicks LA, Srinivasan A, Dodds-Ashley ES. Structured Taskforce of Experts Working at Reliable Standards for Stewardship Panel. Expert consensus on metrics to assess the impact of patient-level antimicrobial stewardship interventions in acute-care settings. Clin Infect Dis. 2016;64(3):377-383. PubMed
2. Gupta K, Hooton TM, Naber KG, et al. International clinical practice guidelines for the treatment of acute uncomplicated cystitis and pyelonephritis in women: a 2010 update by the Infectious Diseases Society of America and the European Society for Microbiology and Infectious Diseases. Clin Infect Dis. 2011;52(5):e103-e120. PubMed
3. Stevens DL, Bisno AL, Chambers HF, et al. Practice guidelines for the diagnosis and management of skin and soft tissue infections: 2014 update by the Infectious Diseases Society of America. Clin Infect Dis. 2014;59(2):e10-e52. PubMed
4. Lipsky BA, Berendt AR, Cornia PB, et al. 2012 Infectious Diseases Society of America clinical practice guideline for the diagnosis and treatment of diabetic foot infections. Clin Infect Dis. 2012;54(12):e132-e173. PubMed
5. Solomkin JS, Mazuski JE, Bradley JS, et al. Diagnosis and management of complicated intraabdominal infection in adults and children: guidelines by the Surgical Infection Society and the Infectious Diseases Society of America. Clin Infect Dis. 2010;50(2):133-164. PubMed
6. Mandell LA, Wunderink RG, Anzueto A, et al. Infectious Diseases Society of America/American Thoracic Society consensus guidelines on the management of community-acquired pneumonia in adults. Clin Infect Dis. 2007;44(Supplement 2):S27-S72. PubMed
7. American Thoracic Society; Infectious Diseases Society of America. Guidelines for the management of adults with hospital-acquired, ventilator-associated, and healthcare-associated pneumonia. Am J Respir Crit Care Med. 2005;171(4):388-416. PubMed
8. Havey TC, Fowler RA, Daneman N. Duration of antibiotic therapy for bacteremia: a systematic review and meta-analysis. Crit Care. 2011;15(6):R267. PubMed
9. Cohen SH, Gerding DN, Johnson S, Kelly CP. Clinical practice guidelines for Clostridium difficile infection in adults: 2010 update by the society for healthcare epidemiology of America (SHEA) and the Infectious Diseases Society of America (IDSA). Infect Control Hosp Epidemiol. 2010;31(5):431-455. PubMed
10. Llewelyn MJ, Fitzpatrick JM, Darwin E, et al. The antibiotic course has had its day. BMJ 2017;358:j3418. PubMed
© 2018 Society of Hospital Medicine
Poor Adherence to Risk Stratification Guidelines Results in Overuse of Venous Thromboembolism Prophylaxis in Hospitalized Older Adults
Venous thromboembolism (VTE) prophylaxis is an important consideration for every older adult admitted to the hospital1 but should not be prescribed to all patients. Use of anticoagulants (specifically low-molecular-weight heparin, low-dose unfractionated heparin, and fondaparinux) when not medically indicated may be harmful, especially for older adults who on average have more chronic conditions,1 take more potentially interacting medications,2 and have higher risks of bleeding.3 The American College of Chest Physicians (ACCP) Ninth Edition Guidelines for Antithrombotic Therapy and Prevention of Thrombosis explicitly recommend a risk-stratification approach using the Padua Prediction Score (PPS) to select those patients most likely to benefit from VTE prophylaxis.4,5 This study aimed to describe the use of risk stratification and pharmacologic VTE prophylaxis use in a population of medically ill, hospitalized older patients.
METHODS
We conducted a retrospective cohort study using data from patients aged 70 years or older admitted to Duke University Hospital general medicine services between January 1, 2014, to December 31, 2014. The PPS variables, 11 in total, are each weighed and sum to a score that stratifies patients into either high or low risk for VTE occurrence.5 Manual chart abstraction was performed using the electronic health record (EHR) to determine each patient’s PPS, inpatient pharmacologic VTE prophylaxis use, and contraindications to VTE prophylaxis. Descriptive statistics are presented for the important confounders/covariates, VTE risk, and VTE prophylaxis use.
RESULTS
Of the total eligible cohort (N = 1399), 400 patients were randomly selected for manual chart review; 89 of these patients were not eligible because they were on anticoagulation upon admission, leaving n = 311 patients in the analytic sample. Mean age for the sample was 80.6 years (standard deviation [SD]: 7.3); 42% were male and 34% were African American, and median length of stay was 4.0 days. The overall mean PPS for the sample was 3.6 (SD 1.8), resulting in 59% (n = 182) defined as “low risk.” Reasons for admission, median length of stay, and aspirin use did not differ between the risk groups.
Pharmacological VTE prophylaxis was present in 74% (134 out of 182) of low-risk patients and 71% (92 out of 129) of high-risk patients (Figure). In both low- and high-risk patients who received pharmacological VTE prophylaxis, over 90% had the therapy initiated within 24 hours of admission, and it was continued for over 60% of their hospital days.
DISCUSSION
We found no association between PPS and use of anticoagulants for VTE prophylaxis, suggesting that risk stratification is not being used to guide clinical decision-making. There are several barriers to implementing guideline directed use of VTE risk stratification. First, there is a lack of consensus on which VTE risk assessment tool is best to use with medically ill, hospitalized patients. While the ACCP Ninth Edition Guidelines support the use of the PPS, the American College of Physicians does not recommend a specific tool for VTE risk assessment.5,6 Although other risk stratification tools exist, concordance between these tools has not been well studied.7 Second, manual calculation of the PPS can be cumbersome, error prone, and disruptive to the clinical workflow. Automated data extraction leveraging existing structured data elements in the EHR may be particularly attractive to many health systems striving to use EHRs to improve care. Designing and testing automatically populated VTE risk stratification tools may facilitate translation of evidence-based guidelines into routine clinical practice. Lastly, a key barrier is clinician education and awareness about these tools. Adding risk stratification tools to admission order sets is one way to increase clinician awareness and has been shown to decrease inappropriate VTE prophylaxis use.8 High-quality studies that use implementation science to promote uptake and efficacy of risk stratification tools into clinical practice are urgently needed.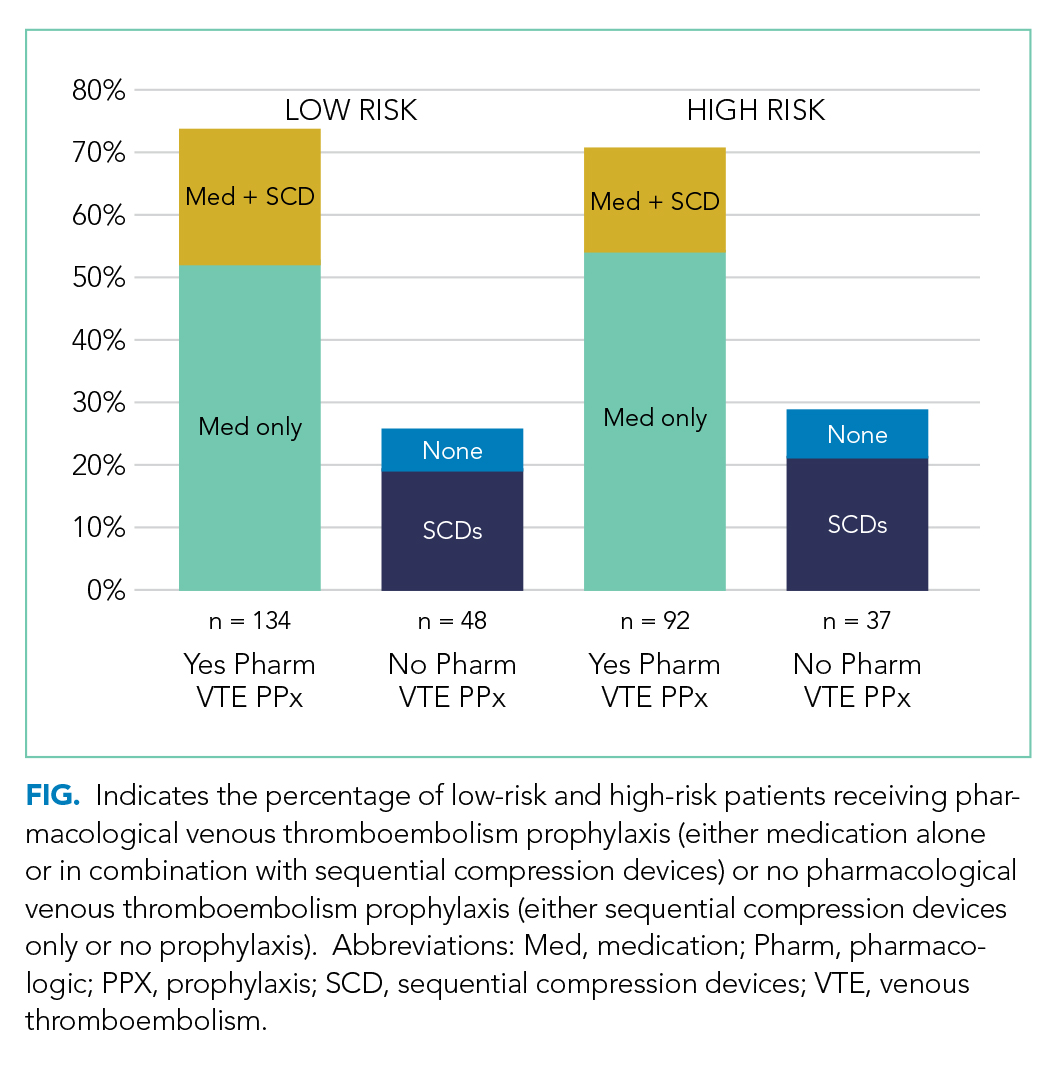
Our study has several limitations. First, this was a single-site study at an academic center, which may limit generalizability of the findings. However, our design enabled us to look at other specific patient-level data that is typically not available in larger databases. Second, determination of PPS is limited to data available in the EHR, resulting in measurement error and possibly the underreporting of risk factors. Finally, due to feasibility and the low probability of VTE, we did not collect data on long-term VTE outcome and were unable to determine the impact that inappropriate VTE prophylaxis use has in low-risk hospitalized older adults.
In summary, we found poor adherence to risk stratification guidelines among medically ill, hospitalized older adults, resulting in overuse of anticoagulants for VTE prophylaxis. Automating risk stratification tools and incorporating results into order sets may ensure that adequate prophylaxis is used for patients who need it, while minimizing excess prophylaxis in those who do not.
Acknowledgments
The authors would like to thank Shenglan Li from Research Triangle Institute for her assistance in the data programming and database creation.
Disclosure
The authors have no conflicts of interest to report. This study was funded by the National Institute on Aging (NIA) GEMSSTAR Award (NIA R03AG048007) and the Duke Older Americans Independence Center (NIA P30 AG028716–01). This work was also supported by the Duke University Internal Medicine Chair’s Award, the Duke University Hartford Center of Excellence, and the Center of Innovation for Health Services Research in Primary Care (CIN 13-410) at the Durham VA Health Care System. This work was conducted while Dr. Pavon was supported by the T. Franklin Williams Scholars Program. Dr. Colón-Emeric is supported by K24 AG049077-01A1. The funding sources had no role in the design and conduct of the study; analysis or interpretation of the data; preparation or final approval of the manuscript before publication, and decision to submit the manuscript for publication. Disclaimer: The views expressed in this article are those of the authors and do not necessarily reflect the position or policy of Duke University or the Department of Veterans Affairs.
1. Kniffin WD, Baron JA, Barrett J, Birkmeyer JD, Anderson FA. The epidemiology of diagnosed pulmonary embolism and deep venous thrombosis in the elderly. Arch Intern Med. 1994;154(8):861-866. PubMed
2. Pasina L, Djade CD, Nobili A, et al. Drug-drug interactions in a cohort of hospitalized elderly patients. Pharmacoepidemiol Drug Saf. 2013; 22(10):1054-1060. PubMed
3. Campbell NR, Hull RD, Brant R, Hogan DB, Pineo GF, Raskob GE. Aging and heparin-related bleeding. Arch Intern Med. 1996;156(8):857-860. PubMed
4. Gould MK, Garcia DA, Wren SM, et al. Prevention of VTE in nonorthopedic surgical patients: Antithrombotic Therapy and Prevention of Thrombosis, 9th ed: American College of Chest Physicians Evidence-Based Clinical Practice Guidelines. Chest. 2012;141(2 Suppl):e227S-e277S. PubMed
5. Barbar S, Noventa F, Rossetto V, et al. A risk assessment model for the identification of hospitalized medical patients at risk for venous thromboembolism: the Padua Prediction Score. J Thromb Haemost. 2010;8(11):2450-2457. PubMed
6. Qaseem A, Chou R, Humphrey LL, Starkey M, Shekelle P. Venous thromboembolism prophylaxis in hospitalized patients: a clinical practice guideline from the American College of Physicians. Ann Intern Med. 2011;155(9):625-632. PubMed
7. Stuck AK, Spirk D, Schaudt J, Kucher N. Risk assessment models for venous thromboembolism in acutely ill medical patients. A systematic review. Thromb Haemost. 2017;117(4):801-808. PubMed
8. Khanna R, Vittinghoff E, Maselli J, Auerbach A. Unintended consequences of a standard admission order set on venous thromboembolism prophylaxis and patient outcomes. J Gen Intern Med. 2012;27(3):318-324. PubMed
Venous thromboembolism (VTE) prophylaxis is an important consideration for every older adult admitted to the hospital1 but should not be prescribed to all patients. Use of anticoagulants (specifically low-molecular-weight heparin, low-dose unfractionated heparin, and fondaparinux) when not medically indicated may be harmful, especially for older adults who on average have more chronic conditions,1 take more potentially interacting medications,2 and have higher risks of bleeding.3 The American College of Chest Physicians (ACCP) Ninth Edition Guidelines for Antithrombotic Therapy and Prevention of Thrombosis explicitly recommend a risk-stratification approach using the Padua Prediction Score (PPS) to select those patients most likely to benefit from VTE prophylaxis.4,5 This study aimed to describe the use of risk stratification and pharmacologic VTE prophylaxis use in a population of medically ill, hospitalized older patients.
METHODS
We conducted a retrospective cohort study using data from patients aged 70 years or older admitted to Duke University Hospital general medicine services between January 1, 2014, to December 31, 2014. The PPS variables, 11 in total, are each weighed and sum to a score that stratifies patients into either high or low risk for VTE occurrence.5 Manual chart abstraction was performed using the electronic health record (EHR) to determine each patient’s PPS, inpatient pharmacologic VTE prophylaxis use, and contraindications to VTE prophylaxis. Descriptive statistics are presented for the important confounders/covariates, VTE risk, and VTE prophylaxis use.
RESULTS
Of the total eligible cohort (N = 1399), 400 patients were randomly selected for manual chart review; 89 of these patients were not eligible because they were on anticoagulation upon admission, leaving n = 311 patients in the analytic sample. Mean age for the sample was 80.6 years (standard deviation [SD]: 7.3); 42% were male and 34% were African American, and median length of stay was 4.0 days. The overall mean PPS for the sample was 3.6 (SD 1.8), resulting in 59% (n = 182) defined as “low risk.” Reasons for admission, median length of stay, and aspirin use did not differ between the risk groups.
Pharmacological VTE prophylaxis was present in 74% (134 out of 182) of low-risk patients and 71% (92 out of 129) of high-risk patients (Figure). In both low- and high-risk patients who received pharmacological VTE prophylaxis, over 90% had the therapy initiated within 24 hours of admission, and it was continued for over 60% of their hospital days.
DISCUSSION
We found no association between PPS and use of anticoagulants for VTE prophylaxis, suggesting that risk stratification is not being used to guide clinical decision-making. There are several barriers to implementing guideline directed use of VTE risk stratification. First, there is a lack of consensus on which VTE risk assessment tool is best to use with medically ill, hospitalized patients. While the ACCP Ninth Edition Guidelines support the use of the PPS, the American College of Physicians does not recommend a specific tool for VTE risk assessment.5,6 Although other risk stratification tools exist, concordance between these tools has not been well studied.7 Second, manual calculation of the PPS can be cumbersome, error prone, and disruptive to the clinical workflow. Automated data extraction leveraging existing structured data elements in the EHR may be particularly attractive to many health systems striving to use EHRs to improve care. Designing and testing automatically populated VTE risk stratification tools may facilitate translation of evidence-based guidelines into routine clinical practice. Lastly, a key barrier is clinician education and awareness about these tools. Adding risk stratification tools to admission order sets is one way to increase clinician awareness and has been shown to decrease inappropriate VTE prophylaxis use.8 High-quality studies that use implementation science to promote uptake and efficacy of risk stratification tools into clinical practice are urgently needed.
Our study has several limitations. First, this was a single-site study at an academic center, which may limit generalizability of the findings. However, our design enabled us to look at other specific patient-level data that is typically not available in larger databases. Second, determination of PPS is limited to data available in the EHR, resulting in measurement error and possibly the underreporting of risk factors. Finally, due to feasibility and the low probability of VTE, we did not collect data on long-term VTE outcome and were unable to determine the impact that inappropriate VTE prophylaxis use has in low-risk hospitalized older adults.
In summary, we found poor adherence to risk stratification guidelines among medically ill, hospitalized older adults, resulting in overuse of anticoagulants for VTE prophylaxis. Automating risk stratification tools and incorporating results into order sets may ensure that adequate prophylaxis is used for patients who need it, while minimizing excess prophylaxis in those who do not.
Acknowledgments
The authors would like to thank Shenglan Li from Research Triangle Institute for her assistance in the data programming and database creation.
Disclosure
The authors have no conflicts of interest to report. This study was funded by the National Institute on Aging (NIA) GEMSSTAR Award (NIA R03AG048007) and the Duke Older Americans Independence Center (NIA P30 AG028716–01). This work was also supported by the Duke University Internal Medicine Chair’s Award, the Duke University Hartford Center of Excellence, and the Center of Innovation for Health Services Research in Primary Care (CIN 13-410) at the Durham VA Health Care System. This work was conducted while Dr. Pavon was supported by the T. Franklin Williams Scholars Program. Dr. Colón-Emeric is supported by K24 AG049077-01A1. The funding sources had no role in the design and conduct of the study; analysis or interpretation of the data; preparation or final approval of the manuscript before publication, and decision to submit the manuscript for publication. Disclaimer: The views expressed in this article are those of the authors and do not necessarily reflect the position or policy of Duke University or the Department of Veterans Affairs.
1. Kniffin WD, Baron JA, Barrett J, Birkmeyer JD, Anderson FA. The epidemiology of diagnosed pulmonary embolism and deep venous thrombosis in the elderly. Arch Intern Med. 1994;154(8):861-866. PubMed
2. Pasina L, Djade CD, Nobili A, et al. Drug-drug interactions in a cohort of hospitalized elderly patients. Pharmacoepidemiol Drug Saf. 2013; 22(10):1054-1060. PubMed
3. Campbell NR, Hull RD, Brant R, Hogan DB, Pineo GF, Raskob GE. Aging and heparin-related bleeding. Arch Intern Med. 1996;156(8):857-860. PubMed
4. Gould MK, Garcia DA, Wren SM, et al. Prevention of VTE in nonorthopedic surgical patients: Antithrombotic Therapy and Prevention of Thrombosis, 9th ed: American College of Chest Physicians Evidence-Based Clinical Practice Guidelines. Chest. 2012;141(2 Suppl):e227S-e277S. PubMed
5. Barbar S, Noventa F, Rossetto V, et al. A risk assessment model for the identification of hospitalized medical patients at risk for venous thromboembolism: the Padua Prediction Score. J Thromb Haemost. 2010;8(11):2450-2457. PubMed
6. Qaseem A, Chou R, Humphrey LL, Starkey M, Shekelle P. Venous thromboembolism prophylaxis in hospitalized patients: a clinical practice guideline from the American College of Physicians. Ann Intern Med. 2011;155(9):625-632. PubMed
7. Stuck AK, Spirk D, Schaudt J, Kucher N. Risk assessment models for venous thromboembolism in acutely ill medical patients. A systematic review. Thromb Haemost. 2017;117(4):801-808. PubMed
8. Khanna R, Vittinghoff E, Maselli J, Auerbach A. Unintended consequences of a standard admission order set on venous thromboembolism prophylaxis and patient outcomes. J Gen Intern Med. 2012;27(3):318-324. PubMed
© 2018 Society of Hospital Medicine
Accuracy Comparisons between Manual and Automated Respiratory Rate for Detecting Clinical Deterioration in Ward Patients
Respiratory rate is the most accurate vital sign for predicting adverse outcomes in ward patients.1,2 Though other vital signs are typically collected by using machines, respiratory rate is collected manually by caregivers counting the breathing rate. However, studies have shown significant discrepancies between a patient’s respiratory rate documented in the medical record, which is often 18 or 20, and the value measured by counting the rate over a full minute.3 Thus, despite the high accuracy of respiratory rate, it is possible that these values do not represent true patient physiology. It is unknown whether a valid automated measurement of respiratory rate would be more predictive than a manually collected respiratory rate for identifying patients who develop deterioration. The aim of this study was to compare the distribution and predictive accuracy of manually and automatically recorded respiratory rates.
METHODS
In this prospective cohort study, adult patients admitted to one oncology ward at the University of Chicago from April 2015 to May 2016 were approached for consent (Institutional Review Board #14-0682). Enrolled patients were fit with a cableless, FDA-approved respiratory pod device (Philips IntelliVue clResp Pod; Philips Healthcare, Andover, MA) that automatically recorded respiratory rate and heart rate every 15 minutes while they remained on the ward. Pod data were paired with vital sign data documented in the electronic health record (EHR) by taking the automated value closest, but prior to, the manual value up to a maximum of 4 hours. Automated and manual respiratory rate were compared by using the area under the receiver operating characteristic curve (AUC) for whether an intensive care unit (ICU) transfer occurred within 24 hours of each paired observation without accounting for patient-level clustering.
RESULTS

DISCUSSION
In this prospective cohort study, we found that manual respiratory rates were different than those collected from an automated system and, yet, were significantly more accurate for predicting ICU transfer. These results suggest that the predictive accuracy of respiratory rates documented in the EHR is due to more than just physiology. Our findings have important implications for the risk stratification of ward patients.
Though previous literature has suggested that respiratory rate is the most accurate predictor of deterioration, this may not be true.1 Respiratory rates manually recorded by clinical staff may contain information beyond pure physiology, such as a proxy of clinician concern, which may inflate the predictive value. Nursing staff may record standard respiratory rate values for patients that appear to be well (eg, 18) but count actual rates for those patients they suspect have a more severe disease, which is one possible explanation for our findings. In addition, automated assessments are likely to be more sensitive to intermittent fluctuations in respiratory rate associated with patient movement or emotion. This might explain the improved accuracy at higher rates for manually recorded vital signs.
Although limited by its small sample size, our results have important implications for patient monitoring and early warning scores designed to identify high-risk ward patients given that both simple scores and statistically derived models include respiratory rates as a predictor.4 As hospitals move to use newer technologies to automate vital sign monitoring and decrease nursing workload, our findings suggest that accuracy for identifying high-risk patients may be lost. Additional methods for capturing subjective assessments from clinical providers may be necessary and could be incorporated into risk scores.5 For example, the 7-point subjective Patient Acuity Rating has been shown to augment the Modified Early Warning Score for predicting ICU transfer, rapid response activation, or cardiac arrest within 24 hours.6
Manually recorded respiratory rate may include information beyond pure physiology, which inflates its predictive value. This has important implications for the use of automated monitoring technology in hospitals and the integration of these measurements into early warning scores.
Acknowledgments
The authors thank Pamela McCall, BSN, OCN for her assistance with study implementation, Kevin Ig-Izevbekhai and Shivraj Grewal for assistance with data collection, UCM Clinical Engineering for technical support, and Timothy Holper, MS, Julie Johnson, MPH, RN, and Thomas Sutton for assistance with data abstraction.
Disclosure
Dr. Churpek is supported by a career development award from the National Heart, Lung, and Blood Institute (K08 HL121080) and has received honoraria from Chest for invited speaking engagements. Dr. Churpek and Dr. Edelson have a patent pending (ARCD. P0535US.P2) for risk stratification algorithms for hospitalized patients. In addition, Dr. Edelson has received research support from Philips Healthcare (Andover, MA), research support from the American Heart Association (Dallas, TX) and Laerdal Medical (Stavanger, Norway), and research support from EarlySense (Tel Aviv, Israel). She has ownership interest in Quant HC (Chicago, IL), which is developing products for risk stratification of hospitalized patients. This study was supported by a grant from Philips Healthcare in Andover, MA. The sponsor had no role in data collection, interpretation of results, or drafting of the manuscript.
1. Churpek MM, Yuen TC, Huber MT, Park SY, Hall JB, Edelson DP. Predicting cardiac arrest on the wards: a nested case-control study. Chest. 2012;141(5):1170-1176. PubMed
2. Fieselmann JF, Hendryx MS, Helms CM, Wakefield DS. Respiratory rate predicts cardiopulmonary arrest for internal medicine inpatients. J Gen Intern Med. 1993;8(7):354-360. PubMed
3. Semler MW, Stover DG, Copland AP, et al. Flash mob research: a single-day, multicenter, resident-directed study of respiratory rate. Chest. 2013;143(6):1740-1744. PubMed
4. Churpek MM, Yuen TC, Edelson DP. Risk stratification of hospitalized patients on the wards. Chest. 2013;143(6):1758-1765. PubMed
5. Edelson DP, Retzer E, Weidman EK, et al. Patient acuity rating: quantifying clinical judgment regarding inpatient stability. J Hosp Med. 2011;6(8):475-479. PubMed
6. Patel AR, Zadravecz FJ, Young RS, Williams MV, Churpek MM, Edelson DP. The value of clinical judgment in the detection of clinical deterioration. JAMA Intern Med. 2015;175(3):456-458. PubMed
Respiratory rate is the most accurate vital sign for predicting adverse outcomes in ward patients.1,2 Though other vital signs are typically collected by using machines, respiratory rate is collected manually by caregivers counting the breathing rate. However, studies have shown significant discrepancies between a patient’s respiratory rate documented in the medical record, which is often 18 or 20, and the value measured by counting the rate over a full minute.3 Thus, despite the high accuracy of respiratory rate, it is possible that these values do not represent true patient physiology. It is unknown whether a valid automated measurement of respiratory rate would be more predictive than a manually collected respiratory rate for identifying patients who develop deterioration. The aim of this study was to compare the distribution and predictive accuracy of manually and automatically recorded respiratory rates.
METHODS
In this prospective cohort study, adult patients admitted to one oncology ward at the University of Chicago from April 2015 to May 2016 were approached for consent (Institutional Review Board #14-0682). Enrolled patients were fit with a cableless, FDA-approved respiratory pod device (Philips IntelliVue clResp Pod; Philips Healthcare, Andover, MA) that automatically recorded respiratory rate and heart rate every 15 minutes while they remained on the ward. Pod data were paired with vital sign data documented in the electronic health record (EHR) by taking the automated value closest, but prior to, the manual value up to a maximum of 4 hours. Automated and manual respiratory rate were compared by using the area under the receiver operating characteristic curve (AUC) for whether an intensive care unit (ICU) transfer occurred within 24 hours of each paired observation without accounting for patient-level clustering.
RESULTS
DISCUSSION
In this prospective cohort study, we found that manual respiratory rates were different than those collected from an automated system and, yet, were significantly more accurate for predicting ICU transfer. These results suggest that the predictive accuracy of respiratory rates documented in the EHR is due to more than just physiology. Our findings have important implications for the risk stratification of ward patients.
Though previous literature has suggested that respiratory rate is the most accurate predictor of deterioration, this may not be true.1 Respiratory rates manually recorded by clinical staff may contain information beyond pure physiology, such as a proxy of clinician concern, which may inflate the predictive value. Nursing staff may record standard respiratory rate values for patients that appear to be well (eg, 18) but count actual rates for those patients they suspect have a more severe disease, which is one possible explanation for our findings. In addition, automated assessments are likely to be more sensitive to intermittent fluctuations in respiratory rate associated with patient movement or emotion. This might explain the improved accuracy at higher rates for manually recorded vital signs.
Although limited by its small sample size, our results have important implications for patient monitoring and early warning scores designed to identify high-risk ward patients given that both simple scores and statistically derived models include respiratory rates as a predictor.4 As hospitals move to use newer technologies to automate vital sign monitoring and decrease nursing workload, our findings suggest that accuracy for identifying high-risk patients may be lost. Additional methods for capturing subjective assessments from clinical providers may be necessary and could be incorporated into risk scores.5 For example, the 7-point subjective Patient Acuity Rating has been shown to augment the Modified Early Warning Score for predicting ICU transfer, rapid response activation, or cardiac arrest within 24 hours.6
Manually recorded respiratory rate may include information beyond pure physiology, which inflates its predictive value. This has important implications for the use of automated monitoring technology in hospitals and the integration of these measurements into early warning scores.
Acknowledgments
The authors thank Pamela McCall, BSN, OCN for her assistance with study implementation, Kevin Ig-Izevbekhai and Shivraj Grewal for assistance with data collection, UCM Clinical Engineering for technical support, and Timothy Holper, MS, Julie Johnson, MPH, RN, and Thomas Sutton for assistance with data abstraction.
Disclosure
Dr. Churpek is supported by a career development award from the National Heart, Lung, and Blood Institute (K08 HL121080) and has received honoraria from Chest for invited speaking engagements. Dr. Churpek and Dr. Edelson have a patent pending (ARCD. P0535US.P2) for risk stratification algorithms for hospitalized patients. In addition, Dr. Edelson has received research support from Philips Healthcare (Andover, MA), research support from the American Heart Association (Dallas, TX) and Laerdal Medical (Stavanger, Norway), and research support from EarlySense (Tel Aviv, Israel). She has ownership interest in Quant HC (Chicago, IL), which is developing products for risk stratification of hospitalized patients. This study was supported by a grant from Philips Healthcare in Andover, MA. The sponsor had no role in data collection, interpretation of results, or drafting of the manuscript.
1. Churpek MM, Yuen TC, Huber MT, Park SY, Hall JB, Edelson DP. Predicting cardiac arrest on the wards: a nested case-control study. Chest. 2012;141(5):1170-1176. PubMed
2. Fieselmann JF, Hendryx MS, Helms CM, Wakefield DS. Respiratory rate predicts cardiopulmonary arrest for internal medicine inpatients. J Gen Intern Med. 1993;8(7):354-360. PubMed
3. Semler MW, Stover DG, Copland AP, et al. Flash mob research: a single-day, multicenter, resident-directed study of respiratory rate. Chest. 2013;143(6):1740-1744. PubMed
4. Churpek MM, Yuen TC, Edelson DP. Risk stratification of hospitalized patients on the wards. Chest. 2013;143(6):1758-1765. PubMed
5. Edelson DP, Retzer E, Weidman EK, et al. Patient acuity rating: quantifying clinical judgment regarding inpatient stability. J Hosp Med. 2011;6(8):475-479. PubMed
6. Patel AR, Zadravecz FJ, Young RS, Williams MV, Churpek MM, Edelson DP. The value of clinical judgment in the detection of clinical deterioration. JAMA Intern Med. 2015;175(3):456-458. PubMed
© 2018 Society of Hospital Medicine
TXT2STAYQUIT: Pilot Randomized Trial of Brief Automated Smoking Cessation Texting Intervention for Inpatient Smokers Discharged from the Hospital
Hospitalization requires smokers to quit temporarily and offers healthcare professionals an opportunity to provide cessation treatment.1 However, it is important that encouragement continues after the patient has been discharged from the hospital.2 Studies have shown that text messaging interventions for smoking cessation are efficacious in increasing biochemically confirmed cessation rates at 6-month follow-up.3-5 Utilizing technology such as automated voice calls postdischarge has been shown to increase smoking cessation rates; however, text messaging has not been applied to this population.6 This randomized controlled trial of automated smoking cessation support at discharge, coupled with brief advice among hospital inpatients, aimed to assess whether text messaging is a feasible method for providing smoking cessation support and monitoring smoking status postdischarge.
METHODS
Six hundred fifty-five inpatients accepted cessation counseling, 248 were eligible for study participation (including smoking ≥20 cigarettes in 30 days prior to admission and being willing to make a quit attempt and send and/or receive texts), 158 consented to the study, and 140 were included in the analysis (participant removal from analysis was due to technical difficulties prohibiting the participants from receiving the intervention). Participants received texts via an automated system maintained through the College of Information Sciences and Technology at Pennsylvania State University starting at discharge and continuing for 1 month. Control participants received weekly text message smoking status questions. Intervention participants received weekly smoking status questions in addition to daily smoking cessation tips and had the option to interact with the system for additional support. Quit status was based on self-reported, past-week abstinence 28 days after discharge with subsample biochemical verification via carbon monoxide (CO) reading. Intent-to-treat analysis was utilized, and those who did not complete the follow-up phone call were classified as smokers.7 Power was calculated based on the magnitude of change found in the largest published randomized controlled trial of texts for smoking cessation that reported results using a similar 28-day definition.4 This study had 63% power to detect a difference in 28-day abstinence (measured using past 7-day abstinence) of 28.7% in the intervention group compared with 12.1% in the control group.
RESULTS
DISCUSSION
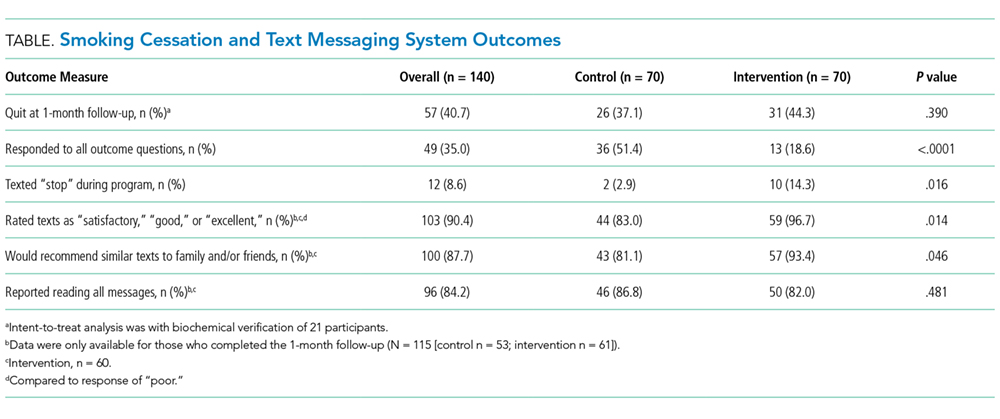
This study demonstrates that texting may be a feasible method for following up with hospitalized smokers postdischarge. A majority of participants responded to at least 4 of the 5 outcome questions. Additionally, participants in the intervention group who completed the 1-month follow-up were more likely than those in the control group to rate the texts favorably and to say that they would recommend similar texts to family or friends, indicating that those in the intervention group found the program helpful. However, a majority of participants in the control group also rated the texts favorably and reported they would recommend similar texts to friends or family. This implies that the limited texts provided to the control group may have provided more benefit than researchers previously anticipated.
This study also illustrates the importance of biochemical verification of quit status. Of participants who completed CO verification, 14% did not meet the requirement to be classified as nonsmokers. Other studies of text messaging interventions, including Abroms et al.3 and Free et al.,4 utilized biochemical verification via salivary cotinine and found that of participants who self-reported having quit at follow-up, 24.4% and 28% failed the verification, respectively. In the current study, 10 participants refused verification. It is possible that those who were unwilling to comply may not truly have quit.
While researchers have found that text messaging interventions are efficacious, they have not applied them to an inpatient setting. A limitation is that 62% (n = 407) of the patients counseled were ineligible, and 36% (n = 90) of those who were eligible were not interested in participating. This may indicate that the intervention format is of interest to a limited audience that is already familiar with text messaging. Another limitation is that this was a pilot study conducted with limited power. However, it does provide useful preliminary data for consideration in the development of future text-based smoking cessation interventions.
In conclusion, this study shows that automated text messaging may be a feasible way to monitor smoking status as well as provide smoking cessation support after smokers are discharged from the hospital.
Acknowledgments
The authors gratefully acknowledge those in the respiratory care department at Penn State Health Milton S. Hershey Medical Center for their assistance in the recruitment for this study and providing inpatient smoking cessation counseling.
Disclosure
Dr. Foulds has done paid consulting for pharmaceutical companies that are involved in producing smoking cessation medications, including GlaxoSmithKline, Pfizer, Novartis, Johnson and Johnson, and Cypress Bioscience Inc. All other authors declare that they have no potential conflicts of interest to disclose.
Funding
The project described was supported by the National Center for Advancing Translational Sciences, National Institutes of Health, through an internal pilot grant (PI: JF) as part of parent grant to Penn State CTSI: Grant UL1 TR000127 and TR002014. The content is solely the responsibility of the authors and does not necessarily represent the official views of the NIH.
1. Fiore MC, Jaén CR, Baker TB, et al. Treating Tobacco Use and Dependence: 2008 Update. Rockville, MD: U.S. Department of Health and Human Services; 2008. PubMed
2. Rigotti NA, Munafo MR, Stead LF. Smoking cessation interventions for hospitalized smokers: a systematic review. Arch Intern Med. 2008;168(18):1950-1960. PubMed
3. Abroms LC, Boal AL, Simmens SJ, Mendel JA, Windsor RA. A randomized trial of Text2Quit: a text messaging program for smoking cessation. Am J Prev Med. 2014;47(3):242-250. PubMed
4. Free C, Knight R, Robertson S, et al. Smoking cessation support delivered via mobile phone text messaging (txt2stop): a single-blind, randomised trial. Lancet. 2011;378(9785):49-55. PubMed
5. Spohr SA, Nandy R, Gandhiraj D, Vemulapalli A, Anne S, Walters ST. Efficacy of SMS text message interventions for smoking cessation: a meta-analysis. J Subst Abuse Treat. 2015;56:1-10. PubMed
6. Rigotti NA, Regan S, Levy DE, et al. Sustained care intervention and postdischarge smoking cessation among hospitalized adults: a randomized clinical trial. JAMA. 2014;312(7):719-728. PubMed
7. Gupta SK. Intention-to-treat concept: a review. Perspect Clin Res. 2011;2(3):109-112. PubMed
Hospitalization requires smokers to quit temporarily and offers healthcare professionals an opportunity to provide cessation treatment.1 However, it is important that encouragement continues after the patient has been discharged from the hospital.2 Studies have shown that text messaging interventions for smoking cessation are efficacious in increasing biochemically confirmed cessation rates at 6-month follow-up.3-5 Utilizing technology such as automated voice calls postdischarge has been shown to increase smoking cessation rates; however, text messaging has not been applied to this population.6 This randomized controlled trial of automated smoking cessation support at discharge, coupled with brief advice among hospital inpatients, aimed to assess whether text messaging is a feasible method for providing smoking cessation support and monitoring smoking status postdischarge.
METHODS
Six hundred fifty-five inpatients accepted cessation counseling, 248 were eligible for study participation (including smoking ≥20 cigarettes in 30 days prior to admission and being willing to make a quit attempt and send and/or receive texts), 158 consented to the study, and 140 were included in the analysis (participant removal from analysis was due to technical difficulties prohibiting the participants from receiving the intervention). Participants received texts via an automated system maintained through the College of Information Sciences and Technology at Pennsylvania State University starting at discharge and continuing for 1 month. Control participants received weekly text message smoking status questions. Intervention participants received weekly smoking status questions in addition to daily smoking cessation tips and had the option to interact with the system for additional support. Quit status was based on self-reported, past-week abstinence 28 days after discharge with subsample biochemical verification via carbon monoxide (CO) reading. Intent-to-treat analysis was utilized, and those who did not complete the follow-up phone call were classified as smokers.7 Power was calculated based on the magnitude of change found in the largest published randomized controlled trial of texts for smoking cessation that reported results using a similar 28-day definition.4 This study had 63% power to detect a difference in 28-day abstinence (measured using past 7-day abstinence) of 28.7% in the intervention group compared with 12.1% in the control group.
RESULTS
DISCUSSION
This study demonstrates that texting may be a feasible method for following up with hospitalized smokers postdischarge. A majority of participants responded to at least 4 of the 5 outcome questions. Additionally, participants in the intervention group who completed the 1-month follow-up were more likely than those in the control group to rate the texts favorably and to say that they would recommend similar texts to family or friends, indicating that those in the intervention group found the program helpful. However, a majority of participants in the control group also rated the texts favorably and reported they would recommend similar texts to friends or family. This implies that the limited texts provided to the control group may have provided more benefit than researchers previously anticipated.
This study also illustrates the importance of biochemical verification of quit status. Of participants who completed CO verification, 14% did not meet the requirement to be classified as nonsmokers. Other studies of text messaging interventions, including Abroms et al.3 and Free et al.,4 utilized biochemical verification via salivary cotinine and found that of participants who self-reported having quit at follow-up, 24.4% and 28% failed the verification, respectively. In the current study, 10 participants refused verification. It is possible that those who were unwilling to comply may not truly have quit.
While researchers have found that text messaging interventions are efficacious, they have not applied them to an inpatient setting. A limitation is that 62% (n = 407) of the patients counseled were ineligible, and 36% (n = 90) of those who were eligible were not interested in participating. This may indicate that the intervention format is of interest to a limited audience that is already familiar with text messaging. Another limitation is that this was a pilot study conducted with limited power. However, it does provide useful preliminary data for consideration in the development of future text-based smoking cessation interventions.
In conclusion, this study shows that automated text messaging may be a feasible way to monitor smoking status as well as provide smoking cessation support after smokers are discharged from the hospital.
Acknowledgments
The authors gratefully acknowledge those in the respiratory care department at Penn State Health Milton S. Hershey Medical Center for their assistance in the recruitment for this study and providing inpatient smoking cessation counseling.
Disclosure
Dr. Foulds has done paid consulting for pharmaceutical companies that are involved in producing smoking cessation medications, including GlaxoSmithKline, Pfizer, Novartis, Johnson and Johnson, and Cypress Bioscience Inc. All other authors declare that they have no potential conflicts of interest to disclose.
Funding
The project described was supported by the National Center for Advancing Translational Sciences, National Institutes of Health, through an internal pilot grant (PI: JF) as part of parent grant to Penn State CTSI: Grant UL1 TR000127 and TR002014. The content is solely the responsibility of the authors and does not necessarily represent the official views of the NIH.
1. Fiore MC, Jaén CR, Baker TB, et al. Treating Tobacco Use and Dependence: 2008 Update. Rockville, MD: U.S. Department of Health and Human Services; 2008. PubMed
2. Rigotti NA, Munafo MR, Stead LF. Smoking cessation interventions for hospitalized smokers: a systematic review. Arch Intern Med. 2008;168(18):1950-1960. PubMed
3. Abroms LC, Boal AL, Simmens SJ, Mendel JA, Windsor RA. A randomized trial of Text2Quit: a text messaging program for smoking cessation. Am J Prev Med. 2014;47(3):242-250. PubMed
4. Free C, Knight R, Robertson S, et al. Smoking cessation support delivered via mobile phone text messaging (txt2stop): a single-blind, randomised trial. Lancet. 2011;378(9785):49-55. PubMed
5. Spohr SA, Nandy R, Gandhiraj D, Vemulapalli A, Anne S, Walters ST. Efficacy of SMS text message interventions for smoking cessation: a meta-analysis. J Subst Abuse Treat. 2015;56:1-10. PubMed
6. Rigotti NA, Regan S, Levy DE, et al. Sustained care intervention and postdischarge smoking cessation among hospitalized adults: a randomized clinical trial. JAMA. 2014;312(7):719-728. PubMed
7. Gupta SK. Intention-to-treat concept: a review. Perspect Clin Res. 2011;2(3):109-112. PubMed
© 2018 Society of Hospital Medicine
The Association of Frailty with Discharge Disposition for Hospitalized Community Dwelling Elderly Patients
Frailty is a common geriatric syndrome characterized by decreased physiological reserves leading to increased vulnerability to stressors.1 Frail individuals are at increased risk of adverse health outcomes including falls, disability, hospitalization, and mortality.1 Discharge to skilled nursing facilities (SNFs) is also associated with adverse outcomes,2,3 but limited data exist on the utility of frailty in predicting discharge location in medical elders. We aimed to evaluate the association of frailty assessed by the Reported Edmonton Frailty Scale (REFS) with discharge disposition in hospitalized medical patients who were previously living in the community.
METHODS
We conducted a prospective study of community dwelling elders (≥65 years) hospitalized to the medical service from January 2014 to April 2016. Trained research assistants interviewed patients and/or caregivers on hospital day 1; the REFS was used to screen for frailty and the Mini-Cog assessment for cognitive impairment (supplementary Appendixes 1 and 2). The primary outcome was discharge disposition categorized as discharge to home (with or without home health services) or discharge to a postacute care (PAC) facility (SNF or inpatient rehabilitation). Multivariable Poisson regression analysis was used to estimate the relative risk of discharge to a PAC facility. Frailty was grouped into the following 3 categories: (1) not frail, (2) apparently vulnerable/mildly frail, and (3) moderately/severely frail.
RESULTS
Among the 775 patients screened, 272 declined to participate, were non-English speakers, were transferred from another facility, were admitted under observation status, had advanced dementia, or died during hospitalization. Five hundred and three medical patients were included: median age was 80 years (interquartile range 75-86 years); 54.1% were female and 82.9% were white. The most common comorbidities were hypertension (51.7%), diabetes (26.0%), and renal failure (26.0%). Of the included patients, 11.1% had a known diagnosis of dementia and 52.1% screened positive for cognitive impairment (Table).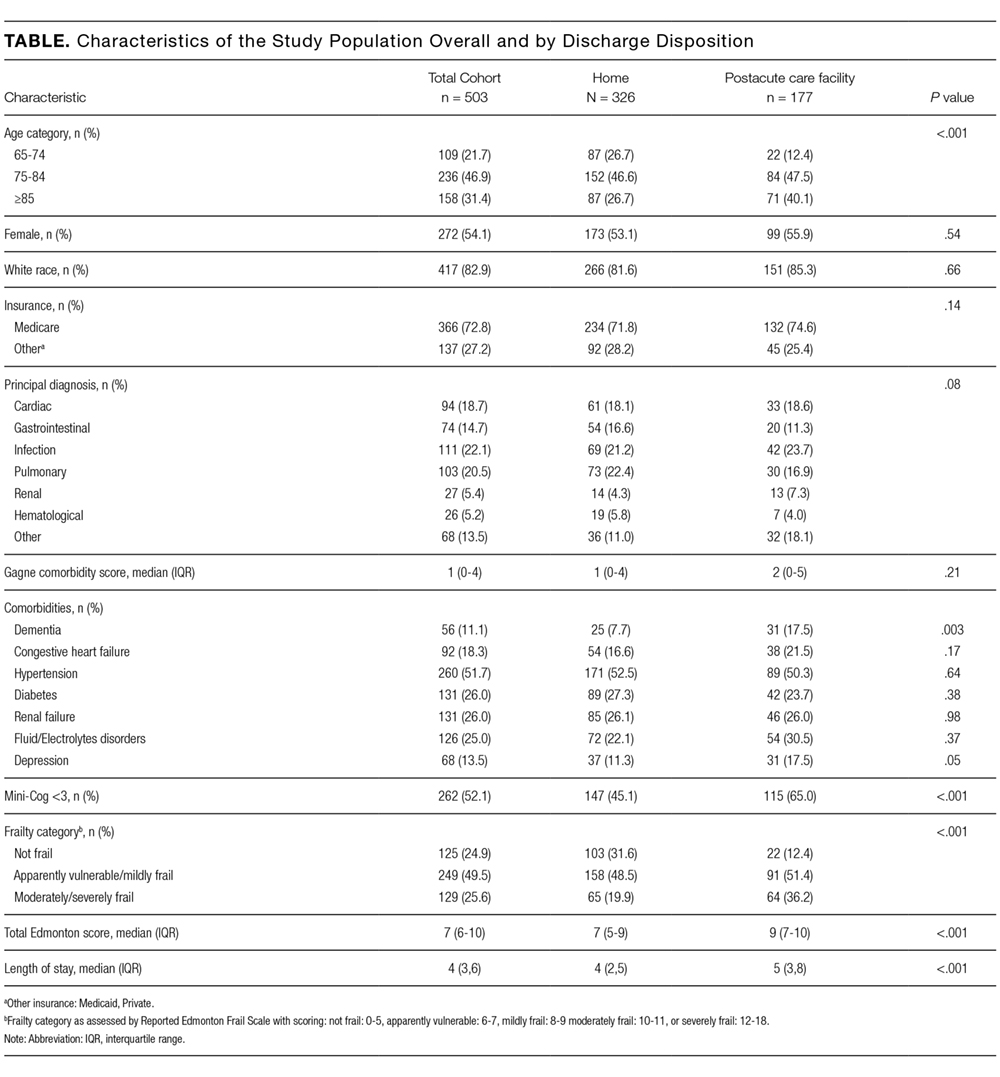
Overall, 24.9% were not frail, 49.5% were apparently vulnerable/mildly frail, and 25.6% were moderately/severely frail. About two-thirds (64.8%) returned home (40.0% with home healthcare) and 35% were discharged to a PAC facility (97.1% of them to SNF). Compared with patients who were discharged home, those discharged to a PAC facility were older (≥85 years; 26.7% vs 40.1%) and more likely to have dementia (7.7% vs 17.5%) and be frail (apparently vulnerable/mild frailty = 48.5% vs 51.4%%, moderate/severe frailty = 19.9% vs 36.2%; P < .001). Median length of hospital stay was shorter in those returning home (4 vs 5 days, P < .001).
In the multivariate analysis, which was adjusted for demographics, comorbidities, and principal diagnosis, frailty was strongly associated with discharge to PAC facility (apparently vulnerable/mild frailty vs no frailty, relative ratio [RR] = 2.00; 95% confidence interval [CI], 1.28-3.27, and moderate/severe frailty vs no frailty; RR = 2.66, 95% CI, 1.67-4.43). When the frailty score was included as a continuous variable, 1 unit increase in the score was associated with a 12% higher risk for discharge to a PAC facility (RR = 1.12; 95% CI, 1.07-1.17).
DISCUSSION
In this analysis of over 500 community-dwelling elderly medical patients hospitalized at one large tertiary center, we found that almost half of the patients were frail and over one-third had a new discharge to a PAC facility. Frailty, as assessed by REFS, was strongly associated with discharge to a PAC facility after adjusting for possible confounders.
Frailty is increasingly recognized as a useful tool to risk stratify the highly heterogeneous population of elderly people.4 Previous studies reported that frailty was predictive of discharge to PAC facilities in geriatric trauma and burn injury patients.5,6 We found similar results in a population of elderly medical patients. A recent study showed that the Hospital Admission Risk Profile
Our study has several limitations. First, it a single-center study and results may not be generalizable; however, we included a large sample of patients with a variety of medical diagnoses. Second, the REFS is self-reported posing the risks of recall, respondent bias, and interview bias. We chose the REFS to assess frailty due to its practicality and ease of administration but also its completeness of assessing multiple important geriatric domains. Lastly, we did not collect the reason for discharge to PAC and it may have been a potential confounder.
In conclusion, our study demonstrates that frailty assessed by a practical validated scale, the REFS, is a strong predictor of a new discharge to PAC facilities in older medical patients. Accurate identification of elders at risk for discharge to PAC facilities provides the potential to counsel patients and families and plan for complex post discharge needs. Future studies should identify potential interventions targeting frail patients in which PAC is not obligatory, aiming to increase their chance of being discharged home.
Disclosure
Drs. Stefan and Ramdass had full access to all the data in the study. They take responsibility for the integrity of the data and the accuracy of the analysis. Drs. Stefan, Starr, Brennan, and Ramdass conceived the study. Ms. Liu and Dr. Pekow analyzed the data. Dr. Ramdass prepared the manuscript. Drs. Stefan, Brennan, Lindenauer, and Starr critically reviewed the manuscript for important intellectual content. A subset of the patients included in this study was part of a Health Resources and Services Administration funded Geri-Pal Transformation through Learning and Collaboration project awarded to Baystate Medical Center, grant number U1QHP28702 (PI: Maura J. Brennan). The investigators retained full independence in the conduct of this research. The authors have no conflicts of interest.
1. Xue QL. The frailty syndrome: definition and natural history. Clin Geriatr Med. 2011;27(1):1-15. PubMed
2. Allen LA, Hernandez AF, Peterson ED, et al. Discharge to a skilled nursing facility and subsequent clinical outcomes among older patients hospitalized for heart failure. Circ Heart Fail. 2011;4(3):293-300. PubMed
3. Hakkarainen TW, Arbabi S, Willis M, et al. Outcomes of patients discharged to skilled nursing facilities after acute care hospitalizations. Ann Surg. 2016;263(2):280-285. PubMed
4. Rockwood K, Mitnitski A. Frailty in relation to the accumulation of deficits. J Gerontol A Biol Sci Med Sci. 2007;62(7):722-727. PubMed
5. Joseph B, Pandit V, Rhee Petal, et al. Predicting hospital discharge disposition in geriatric trauma patients: is frailty the answer? J Trauma Acute Care Surg. 2014;76(1):196-200. PubMed
6. Romanowski KS, Barsun, A, Pamlieri TL, Greenhalgh DG, Sen S. Frailty score on admission predicts outcomes in elderly burn injury. J Burn Care Res. 2015;36(1):1-6. PubMed
7. Liu SK, Montgomery J, Yan Y, et al. Association between hospital admission risk profile score and skilled nursing or acute rehabilitation facility discharges in hospitalized older adults. J Am Geriatr Soc. 2016;64(10):2095-2100. PubMed
Frailty is a common geriatric syndrome characterized by decreased physiological reserves leading to increased vulnerability to stressors.1 Frail individuals are at increased risk of adverse health outcomes including falls, disability, hospitalization, and mortality.1 Discharge to skilled nursing facilities (SNFs) is also associated with adverse outcomes,2,3 but limited data exist on the utility of frailty in predicting discharge location in medical elders. We aimed to evaluate the association of frailty assessed by the Reported Edmonton Frailty Scale (REFS) with discharge disposition in hospitalized medical patients who were previously living in the community.
METHODS
We conducted a prospective study of community dwelling elders (≥65 years) hospitalized to the medical service from January 2014 to April 2016. Trained research assistants interviewed patients and/or caregivers on hospital day 1; the REFS was used to screen for frailty and the Mini-Cog assessment for cognitive impairment (supplementary Appendixes 1 and 2). The primary outcome was discharge disposition categorized as discharge to home (with or without home health services) or discharge to a postacute care (PAC) facility (SNF or inpatient rehabilitation). Multivariable Poisson regression analysis was used to estimate the relative risk of discharge to a PAC facility. Frailty was grouped into the following 3 categories: (1) not frail, (2) apparently vulnerable/mildly frail, and (3) moderately/severely frail.
RESULTS
Among the 775 patients screened, 272 declined to participate, were non-English speakers, were transferred from another facility, were admitted under observation status, had advanced dementia, or died during hospitalization. Five hundred and three medical patients were included: median age was 80 years (interquartile range 75-86 years); 54.1% were female and 82.9% were white. The most common comorbidities were hypertension (51.7%), diabetes (26.0%), and renal failure (26.0%). Of the included patients, 11.1% had a known diagnosis of dementia and 52.1% screened positive for cognitive impairment (Table).
Overall, 24.9% were not frail, 49.5% were apparently vulnerable/mildly frail, and 25.6% were moderately/severely frail. About two-thirds (64.8%) returned home (40.0% with home healthcare) and 35% were discharged to a PAC facility (97.1% of them to SNF). Compared with patients who were discharged home, those discharged to a PAC facility were older (≥85 years; 26.7% vs 40.1%) and more likely to have dementia (7.7% vs 17.5%) and be frail (apparently vulnerable/mild frailty = 48.5% vs 51.4%%, moderate/severe frailty = 19.9% vs 36.2%; P < .001). Median length of hospital stay was shorter in those returning home (4 vs 5 days, P < .001).
In the multivariate analysis, which was adjusted for demographics, comorbidities, and principal diagnosis, frailty was strongly associated with discharge to PAC facility (apparently vulnerable/mild frailty vs no frailty, relative ratio [RR] = 2.00; 95% confidence interval [CI], 1.28-3.27, and moderate/severe frailty vs no frailty; RR = 2.66, 95% CI, 1.67-4.43). When the frailty score was included as a continuous variable, 1 unit increase in the score was associated with a 12% higher risk for discharge to a PAC facility (RR = 1.12; 95% CI, 1.07-1.17).
DISCUSSION
In this analysis of over 500 community-dwelling elderly medical patients hospitalized at one large tertiary center, we found that almost half of the patients were frail and over one-third had a new discharge to a PAC facility. Frailty, as assessed by REFS, was strongly associated with discharge to a PAC facility after adjusting for possible confounders.
Frailty is increasingly recognized as a useful tool to risk stratify the highly heterogeneous population of elderly people.4 Previous studies reported that frailty was predictive of discharge to PAC facilities in geriatric trauma and burn injury patients.5,6 We found similar results in a population of elderly medical patients. A recent study showed that the Hospital Admission Risk Profile
Our study has several limitations. First, it a single-center study and results may not be generalizable; however, we included a large sample of patients with a variety of medical diagnoses. Second, the REFS is self-reported posing the risks of recall, respondent bias, and interview bias. We chose the REFS to assess frailty due to its practicality and ease of administration but also its completeness of assessing multiple important geriatric domains. Lastly, we did not collect the reason for discharge to PAC and it may have been a potential confounder.
In conclusion, our study demonstrates that frailty assessed by a practical validated scale, the REFS, is a strong predictor of a new discharge to PAC facilities in older medical patients. Accurate identification of elders at risk for discharge to PAC facilities provides the potential to counsel patients and families and plan for complex post discharge needs. Future studies should identify potential interventions targeting frail patients in which PAC is not obligatory, aiming to increase their chance of being discharged home.
Disclosure
Drs. Stefan and Ramdass had full access to all the data in the study. They take responsibility for the integrity of the data and the accuracy of the analysis. Drs. Stefan, Starr, Brennan, and Ramdass conceived the study. Ms. Liu and Dr. Pekow analyzed the data. Dr. Ramdass prepared the manuscript. Drs. Stefan, Brennan, Lindenauer, and Starr critically reviewed the manuscript for important intellectual content. A subset of the patients included in this study was part of a Health Resources and Services Administration funded Geri-Pal Transformation through Learning and Collaboration project awarded to Baystate Medical Center, grant number U1QHP28702 (PI: Maura J. Brennan). The investigators retained full independence in the conduct of this research. The authors have no conflicts of interest.
1. Xue QL. The frailty syndrome: definition and natural history. Clin Geriatr Med. 2011;27(1):1-15. PubMed
2. Allen LA, Hernandez AF, Peterson ED, et al. Discharge to a skilled nursing facility and subsequent clinical outcomes among older patients hospitalized for heart failure. Circ Heart Fail. 2011;4(3):293-300. PubMed
3. Hakkarainen TW, Arbabi S, Willis M, et al. Outcomes of patients discharged to skilled nursing facilities after acute care hospitalizations. Ann Surg. 2016;263(2):280-285. PubMed
4. Rockwood K, Mitnitski A. Frailty in relation to the accumulation of deficits. J Gerontol A Biol Sci Med Sci. 2007;62(7):722-727. PubMed
5. Joseph B, Pandit V, Rhee Petal, et al. Predicting hospital discharge disposition in geriatric trauma patients: is frailty the answer? J Trauma Acute Care Surg. 2014;76(1):196-200. PubMed
6. Romanowski KS, Barsun, A, Pamlieri TL, Greenhalgh DG, Sen S. Frailty score on admission predicts outcomes in elderly burn injury. J Burn Care Res. 2015;36(1):1-6. PubMed
7. Liu SK, Montgomery J, Yan Y, et al. Association between hospital admission risk profile score and skilled nursing or acute rehabilitation facility discharges in hospitalized older adults. J Am Geriatr Soc. 2016;64(10):2095-2100. PubMed
© 2018 Society of Hospital Medicine
The Epidemiology and Clinical Associations of Portal Vein Thrombosis in Hospitalized Patients With Cirrhosis: A Nationwide Analysis From the National Inpatient Sample
Portal vein thrombosis (PVT) is thought to be rare in the general population and is most commonly found among patients with cirrhosis.1-3 The risk of developing PVT in patients with cirrhosis has been correlated with the severity of hepatic impairment.4,5 There is a lack of national-level data on the epidemiology of PVT and its related outcomes in the inpatient setting. The aim of our study was to describe the prevalence of PVT in hospitalized patients with cirrhosis in the United States. Using the National Inpatient Sample (NIS) database, we described the differences in hepatic decompensation, length of stay, in-hospital mortality, and total charges between patients with cirrhosis with PVT and those without.
METHODS
This study was performed using the 2012 NIS to assess the relationship between PVT and cirrhosis-related outcomes. The NIS has been used reliably to make national estimates of healthcare utilization and estimate disease burden, charges, and outcomes.6 All admissions with either a primary or secondary discharge diagnosis of an International Classification of Diseases, 9th Revision–Clinical Modification (ICD-9-CM) code for PVT (452) and cirrhosis (571.2, 571.5, and 571.6) were identified from the NIS and correlated with age, gender, inpatient length of stay, in-hospital mortality, total charges, and commonly associated diagnoses. Complications of cirrhosis, such as hepatic encephalopathy (572.2), abdominal ascites (789.5), and gastrointestinal bleeding (456 and 456.2), were also identified. Data were assessed using IBM Statistical Package for the Social Sciences Statistics version 19.0 (Chicago, IL). Statistical significance was defined as a P value < .05.
RESULTS
There were 7,296,968 total unweighted admissions in the 2012 NIS, which included 113,766 (1.6%) inpatient admissions for cirrhosis, with 61,867 for nonalcoholic cirrhosis, 49,698 for alcoholic cirrhosis, and 2202 for biliary cirrhosis. The prevalence of PVT among all inpatient admissions was 0.07% (n = 5046) and 1.8% (n = 2046) in patients with cirrhosis (P < .001). On univariate analysis, patients who had a diagnosis of both cirrhosis and PVT had higher proportions of hepatic encephalopathy (22.5% vs 17.7%; P < .00001) as well as gastrointestinal bleeding (11.6% vs 5.7%; P < .00001) as compared with patients with cirrhosis without PVT (Figure). 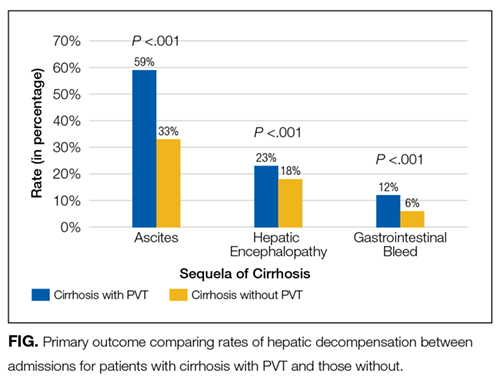
DISCUSSION
We found that hospitalized patients with concurrent diagnoses of cirrhosis and PVT had longer hospital length of stay, higher mean hospital charges, and a higher proportion of cirrhosis-related complications. Our study represents the largest examination of hospitalized patients with cirrhosis and PVT to date and contributes to the evolving understanding of PVT in end-stage liver disease. The relationship between cirrhotic complications and PVT may be independent, but the 2 have similar underlying etiologic processes. Thus, given our findings, intervening to address the underlying factors leading to microvascular and/or PVT or mitigating the propagation of PVT in patients with cirrhosis may be beneficial to reducing morbidity and mortality in these patients. In addition, the prevalence of PVT in the overall hospitalized patient population in our study (0.07%) was similar to the 0.05% to 0.5% previously described in a US autopsy series, which should decrease the likelihood that PVT was missed in the cirrhotic population, which is more likely to have inpatient ultrasound imaging.2 Our study is limited by its retrospective nature, dependency on ICD-9-CM codes for extracting data, and lack of clinical, physical exam, and laboratory results to allow for the calculation of a model for the end-stage liver disease and Child-Pugh score. Also, the study was not designed to evaluate causation, and it is possible that patients with more severe cirrhosis were more likely to be diagnosed with PVT. Further prospective studies directed not only toward the mechanism and treatment of both micro- and macrovascular thrombosis but also at examining the prevention of PVT and attendant benefits are greatly needed.
Disclosure
The authors have nothing to disclose. The contents of this work do not represent the views of the Department of Veterans Affairs or the United States Government.
1. Kumar A, Sharma P, Arora A. Review article: portal vein obstruction—epidemiology, pathogenesis, natural history, prognosis and treatment. Aliment Pharmacol Ther. 2015;41(3):276-292. PubMed
2. Ogren M, Bergqvist D, Björck M, et al. Portal vein thrombosis: prevalence, patient characteristics and lifetime risk: a population study based on 23,796 consecutive autopsies. World J Gastroenterol. 2006;12(13):2115-2119. PubMed
3. Ponziani FR, Zocco MA, Garcovich M, et al. What we should know about portal vein thrombosis in cirrhotic patients: a changing perspective. World J Gastroenterol. 2012;18(36):5014-5020. PubMed
4. Francoz C, Belghiti J, Vilgrain V, et al. Splanchnic vein thrombosis in candidates for liver transplantation: usefulness of screening and anticoagulation. Gut. 2005;54(5):691-697. PubMed
5. Okuda K, Ohnishi K, Kimura K, et al. Incidence of portal vein thrombosis in liver cirrhosis. An angiographic study in 708 patients. Gastroenterology. 1985;89(2):279-286. PubMed
6. Agency for Healthcare Research and Quality Introduction to the HCUP Nationwide Inpatient Sample 2011. Healthcare Cost and Utilization Project (HCUP) website. https://www.hcup-us.ahrq.gov/reports/methods/2014-04.pdf. Accessed January 30, 2017.
Portal vein thrombosis (PVT) is thought to be rare in the general population and is most commonly found among patients with cirrhosis.1-3 The risk of developing PVT in patients with cirrhosis has been correlated with the severity of hepatic impairment.4,5 There is a lack of national-level data on the epidemiology of PVT and its related outcomes in the inpatient setting. The aim of our study was to describe the prevalence of PVT in hospitalized patients with cirrhosis in the United States. Using the National Inpatient Sample (NIS) database, we described the differences in hepatic decompensation, length of stay, in-hospital mortality, and total charges between patients with cirrhosis with PVT and those without.
METHODS
This study was performed using the 2012 NIS to assess the relationship between PVT and cirrhosis-related outcomes. The NIS has been used reliably to make national estimates of healthcare utilization and estimate disease burden, charges, and outcomes.6 All admissions with either a primary or secondary discharge diagnosis of an International Classification of Diseases, 9th Revision–Clinical Modification (ICD-9-CM) code for PVT (452) and cirrhosis (571.2, 571.5, and 571.6) were identified from the NIS and correlated with age, gender, inpatient length of stay, in-hospital mortality, total charges, and commonly associated diagnoses. Complications of cirrhosis, such as hepatic encephalopathy (572.2), abdominal ascites (789.5), and gastrointestinal bleeding (456 and 456.2), were also identified. Data were assessed using IBM Statistical Package for the Social Sciences Statistics version 19.0 (Chicago, IL). Statistical significance was defined as a P value < .05.
RESULTS
There were 7,296,968 total unweighted admissions in the 2012 NIS, which included 113,766 (1.6%) inpatient admissions for cirrhosis, with 61,867 for nonalcoholic cirrhosis, 49,698 for alcoholic cirrhosis, and 2202 for biliary cirrhosis. The prevalence of PVT among all inpatient admissions was 0.07% (n = 5046) and 1.8% (n = 2046) in patients with cirrhosis (P < .001). On univariate analysis, patients who had a diagnosis of both cirrhosis and PVT had higher proportions of hepatic encephalopathy (22.5% vs 17.7%; P < .00001) as well as gastrointestinal bleeding (11.6% vs 5.7%; P < .00001) as compared with patients with cirrhosis without PVT (Figure).
DISCUSSION
We found that hospitalized patients with concurrent diagnoses of cirrhosis and PVT had longer hospital length of stay, higher mean hospital charges, and a higher proportion of cirrhosis-related complications. Our study represents the largest examination of hospitalized patients with cirrhosis and PVT to date and contributes to the evolving understanding of PVT in end-stage liver disease. The relationship between cirrhotic complications and PVT may be independent, but the 2 have similar underlying etiologic processes. Thus, given our findings, intervening to address the underlying factors leading to microvascular and/or PVT or mitigating the propagation of PVT in patients with cirrhosis may be beneficial to reducing morbidity and mortality in these patients. In addition, the prevalence of PVT in the overall hospitalized patient population in our study (0.07%) was similar to the 0.05% to 0.5% previously described in a US autopsy series, which should decrease the likelihood that PVT was missed in the cirrhotic population, which is more likely to have inpatient ultrasound imaging.2 Our study is limited by its retrospective nature, dependency on ICD-9-CM codes for extracting data, and lack of clinical, physical exam, and laboratory results to allow for the calculation of a model for the end-stage liver disease and Child-Pugh score. Also, the study was not designed to evaluate causation, and it is possible that patients with more severe cirrhosis were more likely to be diagnosed with PVT. Further prospective studies directed not only toward the mechanism and treatment of both micro- and macrovascular thrombosis but also at examining the prevention of PVT and attendant benefits are greatly needed.
Disclosure
The authors have nothing to disclose. The contents of this work do not represent the views of the Department of Veterans Affairs or the United States Government.
1. Kumar A, Sharma P, Arora A. Review article: portal vein obstruction—epidemiology, pathogenesis, natural history, prognosis and treatment. Aliment Pharmacol Ther. 2015;41(3):276-292. PubMed
2. Ogren M, Bergqvist D, Björck M, et al. Portal vein thrombosis: prevalence, patient characteristics and lifetime risk: a population study based on 23,796 consecutive autopsies. World J Gastroenterol. 2006;12(13):2115-2119. PubMed
3. Ponziani FR, Zocco MA, Garcovich M, et al. What we should know about portal vein thrombosis in cirrhotic patients: a changing perspective. World J Gastroenterol. 2012;18(36):5014-5020. PubMed
4. Francoz C, Belghiti J, Vilgrain V, et al. Splanchnic vein thrombosis in candidates for liver transplantation: usefulness of screening and anticoagulation. Gut. 2005;54(5):691-697. PubMed
5. Okuda K, Ohnishi K, Kimura K, et al. Incidence of portal vein thrombosis in liver cirrhosis. An angiographic study in 708 patients. Gastroenterology. 1985;89(2):279-286. PubMed
6. Agency for Healthcare Research and Quality Introduction to the HCUP Nationwide Inpatient Sample 2011. Healthcare Cost and Utilization Project (HCUP) website. https://www.hcup-us.ahrq.gov/reports/methods/2014-04.pdf. Accessed January 30, 2017.
© 2017 Society of Hospital Medicine
Hospital Administrators’ Perspectives on Physician Engagement: A Qualitative Study
Disengaged physicians perform worse on multiple quality metrics and are more likely to make clinical errors.1,2 A growing body of literature has examined factors contributing to rising physician burnout, yet limited research has explored elements of physician engagement.3 Although some have described engagement as the polar opposite of burnout, addressing factors that contribute to burnout may not necessarily build physician engagement.4 The National Health Service (NHS) in the United Kingdom defines physician engagement as “the degree to which an employee is satisfied in their work, motivated to perform well, able to suggest and implement ideas for improvement, and their willingness to act as an advocate for their organization by recommending it as a place to work or be treated.”5
Few studies have attempted to document and interpret the variety of approaches that healthcare organizations have taken to identify and address this problem.6 The purpose of this study was to understand hospital administrators’ perspectives on issues related to physician engagement, including determinants of physician engagement, organizational efforts to improve physician engagement, and barriers to improving physician engagement.
METHODS
We conducted a qualitative study of hospital administrators by using an online anonymous questionnaire to explore perspectives on physician engagement. We used a convenience sample of hospital administrators affiliated with Vizient Inc. member hospitals. Vizient is the largest member-owned healthcare services company in the United States; and at the time of the study, it was composed of 1519 hospitals. Eligible hospital administrators included 2 hospital executive positions: Chief Medical Officers (CMOs) and Chief Quality Officers (CQOs). We chose to focus on CMOs and CQOs because their leadership roles overseeing physician employees may require them to address challenges with physician engagement.
The questionnaire focused on administrators’ perspectives on physician engagement, which we defined using the NHS definition stated above. Questions addressed perceived determinants of engagement, effective organizational efforts to improve engagement, and perceived barriers to improving engagement (supplementary Appendix 1). We included 2 yes/no questions and 4 open-ended questions. In May and June of 2016, we sent an e-mail to 432 unique hospital administrators explaining the purpose of the study and requested their participation through a hyperlink to an online questionnaire.
We used summary statistics to report results of yes/no questions and qualitative methods to analyze open-ended responses according to the principles of conventional content analysis, which avoids using preconceived categories and instead relies on inductive methods to allow categories to emerge from the data.7 Team members (T.J.R., K.O., and S.T.R.) performed close readings of responses and coded segments representing important concepts. Through iterative discussion, members of the research team reached consensus on the final code structure.
RESULTS
Our analyses focused on responses from 39 administrators that contained the most substantial qualitative information to the 4 open-ended questions included in the questionnaire. Among these respondents, 31 (79%) indicated that their hospital had surveyed physicians to assess their level of engagement, and 32 (82%) indicated that their hospital had implemented organizational efforts to improve physician engagement within the previous 3 years. Content analysis of open-ended responses yielded 5 themes that summarized perceived contributing factors to physician engagement: (1) physician-administration alignment, (2) physician input in decision-making, (3) appreciation of physician contributions, (4) communication between physicians and administration, and (5) hospital systems and workflow. In the Table, we present exemplary quotations for each theme and the question that prompted the quote.
DISCUSSION
Results of this study provide insight into administrators’ perspectives on organizational factors affecting physician engagement in hospital settings. The majority of respondents believed physician engagement was sufficiently important to survey physicians to assess their level of engagement and implement interventions to improve engagement. We identified several overarching themes that transcend individual questions related to the determinants of engagement, organizational efforts to improve engagement, and barriers to improving engagement. Many responses focused on the relationship between administrators and physicians. Administrators in our study may also have backgrounds as physicians, providing them with a unique perspective on the importance of this relationship.
The evolution of healthcare over the past several decades has shifted power dynamics away from autonomous physician practices, particularly in hospital settings.8 Our study suggests that hospital administrators recognize the potential impact these changes have had on physician engagement and are attempting to address the detrimental effects. Furthermore, administrators acknowledged the importance of organization-directed solutions to address problems with physician morale. This finding represents a paradigm shift away from previous approaches that involved interventions directed at individual physicians.9
Our results represent a call to action for both physicians and administrators to work together to develop organizational solutions to improve physician engagement. Further research is needed to investigate the most effective ways to improve and sustain engagement. At a time when physicians are increasingly dissatisfied with their current work, understanding how to improve physician engagement is critical to maintaining a healthy and productive physician workforce.
Disclosure
Will Dardani is an employee of Vizient Inc. No other authors have conflicts of interest to declare.
1. West MA, Dawson JF. Employee engagement and NHS performance. https://www.kingsfund.org.uk/sites/default/files/employee-engagement-nhs-performance-west-dawson-leadership-review2012-paper.pdf. Accessed July 9, 2017
2. Prins JT, Hoekstra-Weebers JE, Gazendam-Donofrio SM, et al. Burnout and engagement among resident doctors in the Netherlands: a national study. Med Educ. 2010;44(3):236-247. PubMed
3. Ruotsalainen JH, Verbeek JH, Marine A, Serra C. Preventing occupational stress in healthcare workers. Cochrane Database Syst Rev. 2015(4):CD002892. PubMed
4. Gonzalez-Roma V, Schaufeli WB, Bakker AB, Lloret S. Burnout and work engagement: Independent factors or opposite poles. J Vocat Behav. 2006;60(1):165-174.
5. National Health Service. The staff engagement challenge–a factsheet for chief executives. http://www.nhsemployers.org/~/media/Employers/Documents/Retain%20and%20improve/23705%20Chief-executive%20Factsheet _WEB.pdf. Accessed July 9, 2017
6. Taitz JM, Lee TH, Sequist TD. A framework for engaging physicians in quality and safety. BMJ Qual Saf. 2012;21(9):722-728. PubMed
7. Hsieh HF, Shannon SE. Three approaches to qualitative content analysis. Qual Health Res. 2005;15(9):1277-1288. PubMed
8. Emanuel EJ, Pearson SD. Physician autonomy and health care reform. JAMA. 2012;307(4):367-368. PubMed
9. Panagioti M, Panagopoulou E, Bower P, et al. Controlled Interventions to Reduce Burnout in Physicians: A Systematic Review and Meta-analysis. JAMA Intern Med. 2017;177(2):195-205. PubMed
Disengaged physicians perform worse on multiple quality metrics and are more likely to make clinical errors.1,2 A growing body of literature has examined factors contributing to rising physician burnout, yet limited research has explored elements of physician engagement.3 Although some have described engagement as the polar opposite of burnout, addressing factors that contribute to burnout may not necessarily build physician engagement.4 The National Health Service (NHS) in the United Kingdom defines physician engagement as “the degree to which an employee is satisfied in their work, motivated to perform well, able to suggest and implement ideas for improvement, and their willingness to act as an advocate for their organization by recommending it as a place to work or be treated.”5
Few studies have attempted to document and interpret the variety of approaches that healthcare organizations have taken to identify and address this problem.6 The purpose of this study was to understand hospital administrators’ perspectives on issues related to physician engagement, including determinants of physician engagement, organizational efforts to improve physician engagement, and barriers to improving physician engagement.
METHODS
We conducted a qualitative study of hospital administrators by using an online anonymous questionnaire to explore perspectives on physician engagement. We used a convenience sample of hospital administrators affiliated with Vizient Inc. member hospitals. Vizient is the largest member-owned healthcare services company in the United States; and at the time of the study, it was composed of 1519 hospitals. Eligible hospital administrators included 2 hospital executive positions: Chief Medical Officers (CMOs) and Chief Quality Officers (CQOs). We chose to focus on CMOs and CQOs because their leadership roles overseeing physician employees may require them to address challenges with physician engagement.
The questionnaire focused on administrators’ perspectives on physician engagement, which we defined using the NHS definition stated above. Questions addressed perceived determinants of engagement, effective organizational efforts to improve engagement, and perceived barriers to improving engagement (supplementary Appendix 1). We included 2 yes/no questions and 4 open-ended questions. In May and June of 2016, we sent an e-mail to 432 unique hospital administrators explaining the purpose of the study and requested their participation through a hyperlink to an online questionnaire.
We used summary statistics to report results of yes/no questions and qualitative methods to analyze open-ended responses according to the principles of conventional content analysis, which avoids using preconceived categories and instead relies on inductive methods to allow categories to emerge from the data.7 Team members (T.J.R., K.O., and S.T.R.) performed close readings of responses and coded segments representing important concepts. Through iterative discussion, members of the research team reached consensus on the final code structure.
RESULTS
Our analyses focused on responses from 39 administrators that contained the most substantial qualitative information to the 4 open-ended questions included in the questionnaire. Among these respondents, 31 (79%) indicated that their hospital had surveyed physicians to assess their level of engagement, and 32 (82%) indicated that their hospital had implemented organizational efforts to improve physician engagement within the previous 3 years. Content analysis of open-ended responses yielded 5 themes that summarized perceived contributing factors to physician engagement: (1) physician-administration alignment, (2) physician input in decision-making, (3) appreciation of physician contributions, (4) communication between physicians and administration, and (5) hospital systems and workflow. In the Table, we present exemplary quotations for each theme and the question that prompted the quote.
DISCUSSION
Results of this study provide insight into administrators’ perspectives on organizational factors affecting physician engagement in hospital settings. The majority of respondents believed physician engagement was sufficiently important to survey physicians to assess their level of engagement and implement interventions to improve engagement. We identified several overarching themes that transcend individual questions related to the determinants of engagement, organizational efforts to improve engagement, and barriers to improving engagement. Many responses focused on the relationship between administrators and physicians. Administrators in our study may also have backgrounds as physicians, providing them with a unique perspective on the importance of this relationship.
The evolution of healthcare over the past several decades has shifted power dynamics away from autonomous physician practices, particularly in hospital settings.8 Our study suggests that hospital administrators recognize the potential impact these changes have had on physician engagement and are attempting to address the detrimental effects. Furthermore, administrators acknowledged the importance of organization-directed solutions to address problems with physician morale. This finding represents a paradigm shift away from previous approaches that involved interventions directed at individual physicians.9
Our results represent a call to action for both physicians and administrators to work together to develop organizational solutions to improve physician engagement. Further research is needed to investigate the most effective ways to improve and sustain engagement. At a time when physicians are increasingly dissatisfied with their current work, understanding how to improve physician engagement is critical to maintaining a healthy and productive physician workforce.
Disclosure
Will Dardani is an employee of Vizient Inc. No other authors have conflicts of interest to declare.
1. West MA, Dawson JF. Employee engagement and NHS performance. https://www.kingsfund.org.uk/sites/default/files/employee-engagement-nhs-performance-west-dawson-leadership-review2012-paper.pdf. Accessed July 9, 2017
2. Prins JT, Hoekstra-Weebers JE, Gazendam-Donofrio SM, et al. Burnout and engagement among resident doctors in the Netherlands: a national study. Med Educ. 2010;44(3):236-247. PubMed
3. Ruotsalainen JH, Verbeek JH, Marine A, Serra C. Preventing occupational stress in healthcare workers. Cochrane Database Syst Rev. 2015(4):CD002892. PubMed
4. Gonzalez-Roma V, Schaufeli WB, Bakker AB, Lloret S. Burnout and work engagement: Independent factors or opposite poles. J Vocat Behav. 2006;60(1):165-174.
5. National Health Service. The staff engagement challenge–a factsheet for chief executives. http://www.nhsemployers.org/~/media/Employers/Documents/Retain%20and%20improve/23705%20Chief-executive%20Factsheet _WEB.pdf. Accessed July 9, 2017
6. Taitz JM, Lee TH, Sequist TD. A framework for engaging physicians in quality and safety. BMJ Qual Saf. 2012;21(9):722-728. PubMed
7. Hsieh HF, Shannon SE. Three approaches to qualitative content analysis. Qual Health Res. 2005;15(9):1277-1288. PubMed
8. Emanuel EJ, Pearson SD. Physician autonomy and health care reform. JAMA. 2012;307(4):367-368. PubMed
9. Panagioti M, Panagopoulou E, Bower P, et al. Controlled Interventions to Reduce Burnout in Physicians: A Systematic Review and Meta-analysis. JAMA Intern Med. 2017;177(2):195-205. PubMed
© 2017 Society of Hospital Medicine
Primary Care Provider Preferences for Communication with Inpatient Teams: One Size Does Not Fit All
As the hospitalist’s role in medicine grows, the transition of care from inpatient to primary care providers (PCPs, including primary care physicians, nurse practitioners, or physician assistants), becomes increasingly important. Inadequate communication at this transition is associated with preventable adverse events leading to rehospitalization, disability, and death.1-
Providing PCPs access to the inpatient electronic health record (EHR) may reduce the need for active communication. However, a recent survey of PCPs in the general internal medicine division of an academic hospital found a strong preference for additional communication with inpatient providers, despite a shared EHR.5
We examined communication preferences of general internal medicine PCPs at a different academic institution and extended our study to include community-based PCPs who were both affiliated and unaffiliated with the institution.
METHODS
Between October 2015 and June 2016, we surveyed PCPs from 3 practice groups with institutional affiliation or proximity to The Johns Hopkins Hospital: all general internal medicine faculty with outpatient practices (“academic,” 2 practice sites, n = 35), all community-based PCPs affiliated with the health system (“community,” 36 practice sites, n = 220), and all PCPs from an unaffiliated managed care organization (“unaffiliated,” 5 practice sites ranging from 0.3 to 4 miles from The Johns Hopkins Hospital, n = 29).
All groups have work-sponsored e-mail services. At the time of the survey, both the academic and community groups used an EHR that allowed access to inpatient laboratory and radiology data and discharge summaries. The unaffiliated group used paper health records. The hospital faxes discharge summaries to all PCPs who are identified by patients.
The investigators and representatives from each practice group collaborated to develop 15 questions with mutually exclusive answers to evaluate PCP experiences with and preferences for communication with inpatient teams. The survey was constructed and administered through Qualtrics’ online platform (Qualtrics, Provo, UT) and distributed via e-mail. The study was reviewed and acknowledged by the Johns Hopkins institutional review board as quality improvement activity.
The survey contained branching logic. Only respondents who indicated preference for communication received questions regarding preferred mode of communication. We used the preferred mode of communication for initial contact from the inpatient team in our analysis. χ2 and Fischer’s exact tests were performed with JMP 12 software (SAS Institute Inc, Cary, NC).
RESULTS
Fourteen (40%) academic, 43 (14%) community, and 16 (55%) unaffiliated PCPs completed the survey, for 73 total responses from 284 surveys distributed (26%).
Among the 73 responding PCPs, 31 (42%) reported receiving notification of admission during “every” or “almost every” hospitalization, with no significant variation across practice groups (P = 0.5).
Across all groups, 64 PCPs (88%) preferred communication at 1 or more points during hospitalizations (panel A of Figure). “Both upon admission and prior to discharge” was selected most frequently, and there were no differences between practice groups (P = 0.2).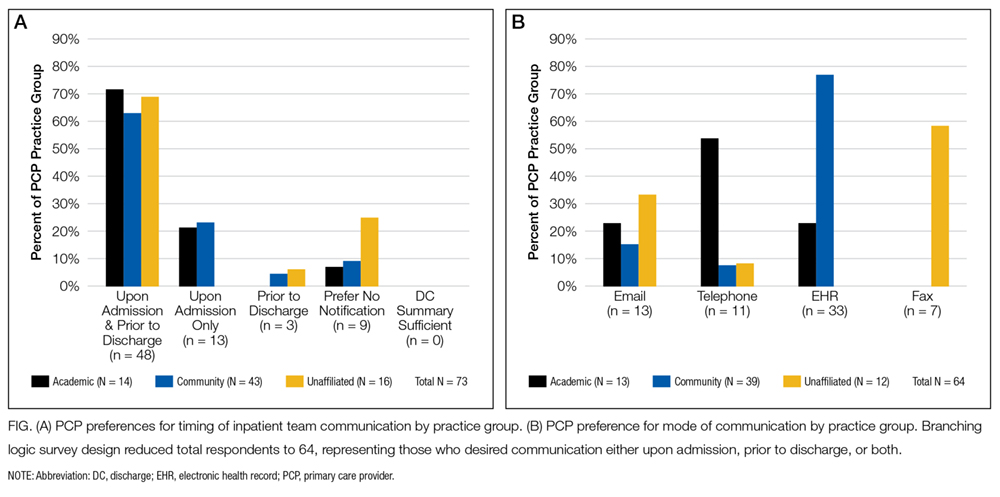
Preferred mode of communication, however, differed significantly between groups (panel B of Figure). The academic group had a greater preference for telephone (54%) than the community (8%; P < 0.001) and unaffiliated groups (8%; P < 0.001), the community group a greater preference for EHR (77%) than the academic (23%; P = 0.002) and unaffiliated groups (0%; P < 0.001), and the unaffiliated group a greater preference for fax (58%) than the other groups (both 0%; P < 0.001).
DISCUSSION
Our findings add to previous evidence of low rates of communication between inpatient providers and PCPs6 and a preference from PCPs for communication during hospitalizations despite shared EHRs.5 We extend previous work by demonstrating that PCP preferences for mode of communication vary by practice setting. Our findings lead us to hypothesize that identifying and incorporating PCP preferences may improve communication, though at the potential expense of standardization and efficiency.
There may be several reasons for the differing communication preferences observed. Most academic PCPs are located near or have admitting privileges to the hospital and are not in clinic full time. Their preference for the telephone may thus result from interpersonal relationships born from proximity and greater availability for telephone calls, or reduced fluency with the EHR compared to full-time community clinicians.
The unaffiliated group’s preference for fax may reflect a desire for communication that integrates easily with paper charts and is least disruptive to workflow, or concerns about health information confidentiality in e-mails.
Our study’s generalizability is limited by a low response rate, though it is comparable to prior studies.7 The unaffiliated group was accessed by convenience (acquaintance with the medical director); however, we note it had the highest response rate (55%).
In summary, we found low rates of communication between inpatient providers and PCPs, despite a strong preference from most PCPs for such communication during hospitalizations. PCPs’ preferred mode of communication differed based on practice setting. Addressing PCP communication preferences may be important to future care transition interventions.
Disclosure
The authors report no conflicts of interest.
1. Forster AJ, Murff HJ, Peterson JF, Gandhi TK, Bates DW. The incidence and severity of adverse events affecting patients after discharge from the hospital. Ann Intern Med. 2003;138(3):161-174. PubMed
2. Moore C, Wisnivesky J, Williams S, McGinn T. Medical errors related to discontinuity of care from an inpatient to an outpatient setting. J Gen Intern Med. 2003;18(8):646-651. PubMed
3. van Walraven C, Mamdani M, Fang J, Austin PC. Continuity of care and patient outcomes after hospital discharge. J Gen Intern Med. 2004;19(6):624-631. PubMed
4. Snow V, Beck D, Budnitz T, et al. Transitions of Care Consensus policy statement: American College of Physicians, Society of General Internal Medicine, Society of Hospital Medicine, American Geriatrics Society, American College Of Emergency Physicians, and Society for Academic Emergency M. J Hosp Med. 2009;4(6):364-370. PubMed
5. Sheu L, Fung K, Mourad M, Ranji S, Wu E. We need to talk: Primary care provider communication at discharge in the era of a shared electronic medical record. J Hosp Med. 2015;10(5):307-310. PubMed
6. Kripalani S, LeFevre F, Phillips CO, Williams MV, Basaviah P, Baker DW. Deficits in communication and information transfer between hospital-based and primary care physicians. JAMA. 2007;297(8):831-841. PubMed
7. Pantilat SZ, Lindenauer PK, Katz PP, Wachter RM. Primary care physician attitudes regarding communication with hospitalists. Am J Med. 2001(9B);111:15-20. PubMed
As the hospitalist’s role in medicine grows, the transition of care from inpatient to primary care providers (PCPs, including primary care physicians, nurse practitioners, or physician assistants), becomes increasingly important. Inadequate communication at this transition is associated with preventable adverse events leading to rehospitalization, disability, and death.1-
Providing PCPs access to the inpatient electronic health record (EHR) may reduce the need for active communication. However, a recent survey of PCPs in the general internal medicine division of an academic hospital found a strong preference for additional communication with inpatient providers, despite a shared EHR.5
We examined communication preferences of general internal medicine PCPs at a different academic institution and extended our study to include community-based PCPs who were both affiliated and unaffiliated with the institution.
METHODS
Between October 2015 and June 2016, we surveyed PCPs from 3 practice groups with institutional affiliation or proximity to The Johns Hopkins Hospital: all general internal medicine faculty with outpatient practices (“academic,” 2 practice sites, n = 35), all community-based PCPs affiliated with the health system (“community,” 36 practice sites, n = 220), and all PCPs from an unaffiliated managed care organization (“unaffiliated,” 5 practice sites ranging from 0.3 to 4 miles from The Johns Hopkins Hospital, n = 29).
All groups have work-sponsored e-mail services. At the time of the survey, both the academic and community groups used an EHR that allowed access to inpatient laboratory and radiology data and discharge summaries. The unaffiliated group used paper health records. The hospital faxes discharge summaries to all PCPs who are identified by patients.
The investigators and representatives from each practice group collaborated to develop 15 questions with mutually exclusive answers to evaluate PCP experiences with and preferences for communication with inpatient teams. The survey was constructed and administered through Qualtrics’ online platform (Qualtrics, Provo, UT) and distributed via e-mail. The study was reviewed and acknowledged by the Johns Hopkins institutional review board as quality improvement activity.
The survey contained branching logic. Only respondents who indicated preference for communication received questions regarding preferred mode of communication. We used the preferred mode of communication for initial contact from the inpatient team in our analysis. χ2 and Fischer’s exact tests were performed with JMP 12 software (SAS Institute Inc, Cary, NC).
RESULTS
Fourteen (40%) academic, 43 (14%) community, and 16 (55%) unaffiliated PCPs completed the survey, for 73 total responses from 284 surveys distributed (26%).
Among the 73 responding PCPs, 31 (42%) reported receiving notification of admission during “every” or “almost every” hospitalization, with no significant variation across practice groups (P = 0.5).
Across all groups, 64 PCPs (88%) preferred communication at 1 or more points during hospitalizations (panel A of Figure). “Both upon admission and prior to discharge” was selected most frequently, and there were no differences between practice groups (P = 0.2).
Preferred mode of communication, however, differed significantly between groups (panel B of Figure). The academic group had a greater preference for telephone (54%) than the community (8%; P < 0.001) and unaffiliated groups (8%; P < 0.001), the community group a greater preference for EHR (77%) than the academic (23%; P = 0.002) and unaffiliated groups (0%; P < 0.001), and the unaffiliated group a greater preference for fax (58%) than the other groups (both 0%; P < 0.001).
DISCUSSION
Our findings add to previous evidence of low rates of communication between inpatient providers and PCPs6 and a preference from PCPs for communication during hospitalizations despite shared EHRs.5 We extend previous work by demonstrating that PCP preferences for mode of communication vary by practice setting. Our findings lead us to hypothesize that identifying and incorporating PCP preferences may improve communication, though at the potential expense of standardization and efficiency.
There may be several reasons for the differing communication preferences observed. Most academic PCPs are located near or have admitting privileges to the hospital and are not in clinic full time. Their preference for the telephone may thus result from interpersonal relationships born from proximity and greater availability for telephone calls, or reduced fluency with the EHR compared to full-time community clinicians.
The unaffiliated group’s preference for fax may reflect a desire for communication that integrates easily with paper charts and is least disruptive to workflow, or concerns about health information confidentiality in e-mails.
Our study’s generalizability is limited by a low response rate, though it is comparable to prior studies.7 The unaffiliated group was accessed by convenience (acquaintance with the medical director); however, we note it had the highest response rate (55%).
In summary, we found low rates of communication between inpatient providers and PCPs, despite a strong preference from most PCPs for such communication during hospitalizations. PCPs’ preferred mode of communication differed based on practice setting. Addressing PCP communication preferences may be important to future care transition interventions.
Disclosure
The authors report no conflicts of interest.
1. Forster AJ, Murff HJ, Peterson JF, Gandhi TK, Bates DW. The incidence and severity of adverse events affecting patients after discharge from the hospital. Ann Intern Med. 2003;138(3):161-174. PubMed
2. Moore C, Wisnivesky J, Williams S, McGinn T. Medical errors related to discontinuity of care from an inpatient to an outpatient setting. J Gen Intern Med. 2003;18(8):646-651. PubMed
3. van Walraven C, Mamdani M, Fang J, Austin PC. Continuity of care and patient outcomes after hospital discharge. J Gen Intern Med. 2004;19(6):624-631. PubMed
4. Snow V, Beck D, Budnitz T, et al. Transitions of Care Consensus policy statement: American College of Physicians, Society of General Internal Medicine, Society of Hospital Medicine, American Geriatrics Society, American College Of Emergency Physicians, and Society for Academic Emergency M. J Hosp Med. 2009;4(6):364-370. PubMed
5. Sheu L, Fung K, Mourad M, Ranji S, Wu E. We need to talk: Primary care provider communication at discharge in the era of a shared electronic medical record. J Hosp Med. 2015;10(5):307-310. PubMed
6. Kripalani S, LeFevre F, Phillips CO, Williams MV, Basaviah P, Baker DW. Deficits in communication and information transfer between hospital-based and primary care physicians. JAMA. 2007;297(8):831-841. PubMed
7. Pantilat SZ, Lindenauer PK, Katz PP, Wachter RM. Primary care physician attitudes regarding communication with hospitalists. Am J Med. 2001(9B);111:15-20. PubMed
© 2017 Society of Hospital Medicine
sberry8@jhmi.edu
Student perceptions of high-value care education in internal medicine clerkships
During internal medicine (IM) clerkships, course directors are responsible for ensuring that medical students attain basic competency in patient management through use of risk–benefit, cost–benefit, and evidence-based considerations.1 However, the students’ primary teachers—IM residents and attendings—consistently role-model high-value care (HVC) perhaps only half the time.2 The inconsistency may have a few sources, including unawareness of the costs of tests and treatments ordered and little formal training in HVC.3-5 In addition, the environment at some academic institutions may reward learners for performing tests that may be unnecessary.6
We conducted a study to assess medical students’ perceptions of unnecessary testing and the adequacy–inadequacy of HVC instruction, as well as their observations of behavior that may hinder the practice of HVC during the IM clerkship.
METHODS
When students completed their third-year IM clerkships at The Johns Hopkins University School of Medicine, the Icahn School of Medicine at Mount Sinai, the University of Alabama at Birmingham School of Medicine, and the Tulane University School of Medicine, we sent them a recruitment email asking them to complete an anonymous survey regarding their clerkship experiences with HVC. The clerkships’ directors, who collaborated on survey development, searched the literature to quantify behavior thought to decrease the practice of HVC. The survey was tested several times with different learners and faculty to increase response process validity.
The SurveyMonkey online platform was used to administer the survey. Students were given 1 week after the end of their clerkship to complete the survey. Data were collected for the period October 2013 to December 2014. Each student was offered a $10 gift certificate for survey completion. Each institution received exempt approval from its institutional review board.
Survey respondents were divided into those who perceived HVC education as adequate and those who perceived it as inadequate. Chi-square tests were performed with Stata Version 12 (College Station, TX) to determine whether a student’s perception of HVC education being adequate or inadequate was significantly associated with the other survey questions.
RESULTS
Of 577 eligible students, 307 (53%) completed the survey. About 83% of the respondents reported noticing the ordering of laboratory or radiologic tests they considered unnecessary, and a majority (81%) of those students noticed this activity at least once a week. Overall, 51% of the respondents thought their HVC education was inadequate. Significantly more of the students who perceived their HVC education as inadequate were uncomfortable bringing an unnecessary test to the attention of the ward team, rarely discussed costs, and rarely observed team members being praised for forgoing unnecessary tests (Table). Two significant associations were found: between institution attended and perceived adequacy–inadequacy of HVC education and between institution and frequency of cost discussions.
Most (78.5%) students thought an HVC curriculum should be added to the IM clerkship, and 34.5% thought the HVC curriculum should be incorporated into daily rounds. In regards to additions to the clerkship curriculum, most students wanted to round with phlebotomy (29%) or discuss costs of testing on patients (26%).
Students attributed the ordering of unnecessary tests and treatments to several factors: residents investigating “interesting diagnoses” (46%), teams practicing defensive medicine (43%), consultants making requests (40%), attendings investigating “interesting diagnoses” (27%), and patients making requests (8%).

DISCUSSION
About 51% of the students thought their HVC education was inadequate, and about 83% noticed unnecessary testing. Our study findings reaffirm those of a single-site study in which 93% of students noted unnecessary testing.7
In this study, many students perceived HVC education as inadequate and reported wanting HVC principles added to their training and an HVC curriculum incorporated into daily rounds. Students who perceived HVC education as inadequate were significantly less comfortable bringing an unnecessary test to the attention of the ward team and noticed less discussion about costs and less praise for avoiding unnecessary tests. One institution had a significantly higher proportion of students perceiving their HVC education as adequate and noticing more discussions about test costs. This institution was the only one that incorporated discussions about test costs into its curriculum during the study period—which may account for its students’ perceptions.
This study had a few limitations. First, as the survey was administered after the IM clerkships, students’ responses may have been subject to recall bias. We minimized this bias by allowing 1 week for survey completion. Second, given the 53% response rate, there may have been response bias. However, one institution’s demographics showed no significant differences between responders and nonresponders with respect to age, sex, ethnicity, or type of degree. Third, students’ understanding of what tests and treatments are necessary and unnecessary may be relatively underdeveloped, given their training level. One study found that medical students with minimal clinical experience were able to identify unnecessary tests and treatments, but this study has not been validated at other institutions.7
Efforts to increase HVC education and practice have focused on residents and attendings, but our study findings reaffirm that HVC training is much needed and wanted in undergraduate medical education. Studies are needed to test the effectiveness of HVC curricula in medical school and the ability of these curricula to give students the tools they need to practice HVC.
Disclosures
Dr. Pahwa received support from the Johns Hopkins Hospitalist Scholars Fund, and Dr. Cayea is supported by the Daniel and Jeanette Hendin Schapiro Geriatric Medical Education Center. The sponsors had no role in study design, methods, subject recruitment, data collection, data analysis, or manuscript preparation. The authors have no conflicts of interest to disclose.
1. Clerkship Directors in Internal Medicine, Society of General Internal Medicine. CDIM-SGIM Core Medicine Clerkship Curriculum Guide: A Resource for Teachers and Learners. Version 3.0. http://connect.im.org/p/cm/ld/fid=385. Published 2006. Accessed May 12, 2015.
2. Patel MS, Reed DA, Smith C, Arora VM. Role-modeling cost-conscious care—a national evaluation of perceptions of faculty at teaching hospitals in the United States. J Gen Intern Med. 2015;30(9):1294-1298. PubMed
3. Tek Sehgal R, Gorman P. Internal medicine physicians’ knowledge of health care charges. J Grad Med Educ. 2011;3(2):182-187. PubMed
4. Patel MS, Reed DA, Loertscher L, McDonald FS, Arora VM. Teaching residents to provide cost-conscious care: a national survey of residency program directors. JAMA Intern Med. 2014;174(3):470-472. PubMed
5. Graham JD, Potyk D, Raimi E. Hospitalists’ awareness of patient charges associated with inpatient care. J Hosp Med. 2010;5(5):295-297. PubMed
6. Detsky AS, Verma AA. A new model for medical education: celebrating restraint. JAMA. 2012;308(13):1329-1330. PubMed
7. Tartaglia KM, Kman N, Ledford C. Medical student perceptions of cost-conscious care in an internal medicine clerkship: a thematic analysis. J Gen Intern Med. 2015;30(10):1491-1496. PubMed
During internal medicine (IM) clerkships, course directors are responsible for ensuring that medical students attain basic competency in patient management through use of risk–benefit, cost–benefit, and evidence-based considerations.1 However, the students’ primary teachers—IM residents and attendings—consistently role-model high-value care (HVC) perhaps only half the time.2 The inconsistency may have a few sources, including unawareness of the costs of tests and treatments ordered and little formal training in HVC.3-5 In addition, the environment at some academic institutions may reward learners for performing tests that may be unnecessary.6
We conducted a study to assess medical students’ perceptions of unnecessary testing and the adequacy–inadequacy of HVC instruction, as well as their observations of behavior that may hinder the practice of HVC during the IM clerkship.
METHODS
When students completed their third-year IM clerkships at The Johns Hopkins University School of Medicine, the Icahn School of Medicine at Mount Sinai, the University of Alabama at Birmingham School of Medicine, and the Tulane University School of Medicine, we sent them a recruitment email asking them to complete an anonymous survey regarding their clerkship experiences with HVC. The clerkships’ directors, who collaborated on survey development, searched the literature to quantify behavior thought to decrease the practice of HVC. The survey was tested several times with different learners and faculty to increase response process validity.
The SurveyMonkey online platform was used to administer the survey. Students were given 1 week after the end of their clerkship to complete the survey. Data were collected for the period October 2013 to December 2014. Each student was offered a $10 gift certificate for survey completion. Each institution received exempt approval from its institutional review board.
Survey respondents were divided into those who perceived HVC education as adequate and those who perceived it as inadequate. Chi-square tests were performed with Stata Version 12 (College Station, TX) to determine whether a student’s perception of HVC education being adequate or inadequate was significantly associated with the other survey questions.
RESULTS
Of 577 eligible students, 307 (53%) completed the survey. About 83% of the respondents reported noticing the ordering of laboratory or radiologic tests they considered unnecessary, and a majority (81%) of those students noticed this activity at least once a week. Overall, 51% of the respondents thought their HVC education was inadequate. Significantly more of the students who perceived their HVC education as inadequate were uncomfortable bringing an unnecessary test to the attention of the ward team, rarely discussed costs, and rarely observed team members being praised for forgoing unnecessary tests (Table). Two significant associations were found: between institution attended and perceived adequacy–inadequacy of HVC education and between institution and frequency of cost discussions.
Most (78.5%) students thought an HVC curriculum should be added to the IM clerkship, and 34.5% thought the HVC curriculum should be incorporated into daily rounds. In regards to additions to the clerkship curriculum, most students wanted to round with phlebotomy (29%) or discuss costs of testing on patients (26%).
Students attributed the ordering of unnecessary tests and treatments to several factors: residents investigating “interesting diagnoses” (46%), teams practicing defensive medicine (43%), consultants making requests (40%), attendings investigating “interesting diagnoses” (27%), and patients making requests (8%).
DISCUSSION
About 51% of the students thought their HVC education was inadequate, and about 83% noticed unnecessary testing. Our study findings reaffirm those of a single-site study in which 93% of students noted unnecessary testing.7
In this study, many students perceived HVC education as inadequate and reported wanting HVC principles added to their training and an HVC curriculum incorporated into daily rounds. Students who perceived HVC education as inadequate were significantly less comfortable bringing an unnecessary test to the attention of the ward team and noticed less discussion about costs and less praise for avoiding unnecessary tests. One institution had a significantly higher proportion of students perceiving their HVC education as adequate and noticing more discussions about test costs. This institution was the only one that incorporated discussions about test costs into its curriculum during the study period—which may account for its students’ perceptions.
This study had a few limitations. First, as the survey was administered after the IM clerkships, students’ responses may have been subject to recall bias. We minimized this bias by allowing 1 week for survey completion. Second, given the 53% response rate, there may have been response bias. However, one institution’s demographics showed no significant differences between responders and nonresponders with respect to age, sex, ethnicity, or type of degree. Third, students’ understanding of what tests and treatments are necessary and unnecessary may be relatively underdeveloped, given their training level. One study found that medical students with minimal clinical experience were able to identify unnecessary tests and treatments, but this study has not been validated at other institutions.7
Efforts to increase HVC education and practice have focused on residents and attendings, but our study findings reaffirm that HVC training is much needed and wanted in undergraduate medical education. Studies are needed to test the effectiveness of HVC curricula in medical school and the ability of these curricula to give students the tools they need to practice HVC.
Disclosures
Dr. Pahwa received support from the Johns Hopkins Hospitalist Scholars Fund, and Dr. Cayea is supported by the Daniel and Jeanette Hendin Schapiro Geriatric Medical Education Center. The sponsors had no role in study design, methods, subject recruitment, data collection, data analysis, or manuscript preparation. The authors have no conflicts of interest to disclose.
1. Clerkship Directors in Internal Medicine, Society of General Internal Medicine. CDIM-SGIM Core Medicine Clerkship Curriculum Guide: A Resource for Teachers and Learners. Version 3.0. http://connect.im.org/p/cm/ld/fid=385. Published 2006. Accessed May 12, 2015.
2. Patel MS, Reed DA, Smith C, Arora VM. Role-modeling cost-conscious care—a national evaluation of perceptions of faculty at teaching hospitals in the United States. J Gen Intern Med. 2015;30(9):1294-1298. PubMed
3. Tek Sehgal R, Gorman P. Internal medicine physicians’ knowledge of health care charges. J Grad Med Educ. 2011;3(2):182-187. PubMed
4. Patel MS, Reed DA, Loertscher L, McDonald FS, Arora VM. Teaching residents to provide cost-conscious care: a national survey of residency program directors. JAMA Intern Med. 2014;174(3):470-472. PubMed
5. Graham JD, Potyk D, Raimi E. Hospitalists’ awareness of patient charges associated with inpatient care. J Hosp Med. 2010;5(5):295-297. PubMed
6. Detsky AS, Verma AA. A new model for medical education: celebrating restraint. JAMA. 2012;308(13):1329-1330. PubMed
7. Tartaglia KM, Kman N, Ledford C. Medical student perceptions of cost-conscious care in an internal medicine clerkship: a thematic analysis. J Gen Intern Med. 2015;30(10):1491-1496. PubMed
© 2017 Society of Hospital Medicine
Incorrect About Telemetry Status
Cardiac telemetry is overused in hospitals and continues to be a source of healthcare waste.1-4 Its overuse is considered a leading issue in quality initiatives, as highlighted by its presence in the top 5 recommendations by the Society of Hospital Medicine to the Choosing Wisely Campaign.5 There have been multiple published studies on efforts to curb telemetry overuse, including educational campaigns, hard-wiring guidelines into the electronic health record (EHR), and discontinuation protocols.6-9
Less studied, however, are the causes of telemetry overuse. While lack of knowledge of guidelines may contribute to inappropriate initial ordering of telemetry,1,4 physicians may forget to discontinue it when the original indication is no longer present, ie, a form of “clinical inertia.” The authors aimed to study how often inpatient clinicians were aware (or unaware) of the telemetry status of their patients.
METHODS
The authors conducted a cross-sectional observational study at 2 academic medical centers within the same healthcare system (University of California, Los Angeles [UCLA] Health System) over a 10-week period, from December 12, 2014 to February 18, 2015. The survey included senior resident physicians (in years 2 or 3 of training), attending physicians on teaching services (“teaching attendings”), and attending physicians on nonteaching services (“direct-care attendings”) caring for hospitalized patients on general internal medicine (nonintensive care) units. First-year residents (“interns”) were not surveyed because their presence at interdisciplinary rounds, where surveying took place, was not mandatory. At both hospitals, telemetry is initiated by placing a “Continuous Cardiac Monitoring” order in the EHR, and is terminated by selecting “Discontinue” on that same order. Telemetry status of patients was determined through a daily review of the EHR at UCLA Ronald Reagan Hospital, where presence of telemetry was defined as an active order for telemetry as of 7 AM. At UCLA Santa Monica Hospital, telemetry status was determined by daily review of the morning telemetry technician logs, which reflected telemetry status as of 7 AM.
Once-weekly, prior to afternoon interdisciplinary rounds, members of the study team would give physicians a print-out of their patient list and ask them to mark whether or not their patients were on telemetry as of that morning. They were allowed to reference their own printed patient list, but were not allowed to reference the EHR. Since interdisciplinary rounds occurred in the afternoon, it was assumed that all clinicians had seen and examined their patients. The authors did not mandate that physicians respond to the survey, and we did not collect information on individual physician characteristics other than training status.
The primary outcome of interest was correct assessment of telemetry status. The authors first presented descriptive statistics for patient, provider, and telemetry status, and used χ2 tests and McNemar’s test to compare the type of physician (resident, teaching attending, or direct-care attending) with the binary outcome (correct or incorrect assessment). STATA/SE, 13.1 (StataCorp), was used for all statistical analysis, and P values < 0.05 were considered statistically significant. The study was submitted to the UCLA Office of Human Research Protection Program and exempted from Institutional Review Board review.
RESULTS
A total of 1,379 physician-assessments on 962 patients were obtained during the study period. During this time, 53.1% (511/962) of patients were on telemetry. Overall, physicians were incorrect in 26.5% (365/1379) of their assessments of telemetry status (Table). Of the 745 assessments of a patient on telemetry, clinicians erroneously reported that they were not 27.9% of the time (n = 208). Of the 634 assessments of a patient not on telemetry, clinicians erroneously reported that patients were on it 24.8% of the time (n = 157).
Assessments by direct-care attendings were more accurate than those done by teaching attendings (80.9% vs. 72.4%, P < 0.05) and resident physicians (80.9% vs. 71.8%, P < 0.05). There was no statistically significant difference in accuracy of resident physician assessments when compared to teaching attending assessments (71.8% vs. 72.4%, P = 0.81).
DISCUSSION
In this study, clinicians often inaccurately recalled the telemetry status of their hospitalized patients. These findings have implications for both patient safety as well as telemetry overuse, as ignorance of telemetry status may limit its discontinuation.
The authors also found that assessments done by direct-care attendings were more accurate than those done by teaching attendings. This discrepancy is likely related to different roles in patient care: teaching attendings provide supervisory roles, while direct-care attendings routinely review orders and perform detailed exams on their patients. Similarly, resident physician assessments were found to be less accurate than direct-care attending assessments, which may reflect less clinical experience as well as their supervisory role.
In light of these findings, interventions to reduce telemetry overuse should include efforts to increase real-time telemetry awareness as well as reduce inappropriate use, and should target all levels of training. Using research on urinary catheter removal10 as a model, strategies to increase telemetry awareness could include daily verbal or written reminders of telemetry status, requests to assess daily need, high visibility signs in charts or in patient rooms, or electronic reminders that telemetry is in place. Furthermore, efforts to promote and operationalize medical mindfulness, in which providers are trained to be aware of indications, timely removal, and the presence of monitoring devices could be incorporated into broader telemetry stewardship and high-value care efforts.11
There are limitations to this study. The authors did not collect information on the number of unique individual physicians represented by the study, and, thus, clinicians may have been surveyed multiple times throughout the study, potentially influencing their attention to the telemetry status of their patients. In addition, this study was conducted within a single healthcare system, limiting its generalizability.
In conclusion, the authors found that physicians were often incorrect when assessing the telemetry status of their patients. Interventions to help raise awareness of a patient’s telemetry status may help reduce telemetry overuse.
Disclosure: Nothing to report.
1. Henriques-Forsythe MN, Ivonye CC, Jamched U, Kamuguisha LKK, Olejeme KA, Onwuanyi AE. Is telemetry overused? Is it as helpful as thought? Cleve Clin J Med. 2009;76:368-372. PubMed
2. Kanwar M, Fares R, Minnick S, Rosman HS, Saravolatz L. Inpatient cardiac telemetry monitoring: are we overdoing it. JCOM. 2008;15(1):16-20.
3. Chong-Yik R, Bennett A, Milani R, Morin D. Telemetry overuse and its economic implications. J Am Coll Cardiol.2016;67(13_S):1993.
4. Najafi N, Auerbach A. Use and outcomes of telemetry monitoring on a medicine service. Arch Intern Med. 2012;172:1349-1350. PubMed
5. Bulger J, Nickel W, Messler J, et al. Choosing wisely in adult hospital medicine: five opportunities for improved healthcare value. J Hosp Med. 2013;8:486-492. PubMed
6. Leighton H, Kianfar H, Serynek S, Kerwin T. Effect of an electronic ordering system on adherence to the American College of Cardiology/American Heart Association guidelines for cardiac monitoring. Crit Pathw Cardiol. 2013;12:6-8. PubMed
7. Lee JC, Lamb P, Rand E, Ryan C, Rubal BJ. Optimizing telemetry utilization in an academic medical center. JCOM. 2008;15(9).
8. Boggan JC, Navar-Boggan AM, Patel V, Schulteis RD, Simel DL. Reductions in telemetry order duration do not reduce telemetry utilization. J Hosp Med. 2014;9:795-796. PubMed
9. Dressler R, Dryer MM, Coletti C, Mahoney D, Doorey AJ. Altering overuse of cardiac telemetry in non-intensive care unit settings by hardwiring the use of American Heart Association guidelines. JAMA Intern Med. 2014;174:1852-1854. PubMed
10. Meddings J, Krein SL, Fakih MG, Olmsted RN, Saint S. Reducing unnecessary urinary catheter use and other strategies to prevent catheter-associated urinary tract infections: brief update review. In: Making Health Care Safer II: An Updated Critical Analysis of the Evidence for Patient Safety Practices. (Evidence Reports/Technology Assessments, No. 211.) Chapter 9. Rockville (MD): Agency for Healthcare Research and Quality (US); 2013. Available from: http://www.ncbi.nlm.nih.gov/books/NBK133354/. May 15, 2016. PubMed
11. Kiyoshi-Teo H, Krein SL, Saint S. Applying mindful evidence-based practice at the bedside: using catheter-associated urinary tract infection as a model. Infect Control Hosp Epidemiol. 2013;34:1099-1001. PubMed
Cardiac telemetry is overused in hospitals and continues to be a source of healthcare waste.1-4 Its overuse is considered a leading issue in quality initiatives, as highlighted by its presence in the top 5 recommendations by the Society of Hospital Medicine to the Choosing Wisely Campaign.5 There have been multiple published studies on efforts to curb telemetry overuse, including educational campaigns, hard-wiring guidelines into the electronic health record (EHR), and discontinuation protocols.6-9
Less studied, however, are the causes of telemetry overuse. While lack of knowledge of guidelines may contribute to inappropriate initial ordering of telemetry,1,4 physicians may forget to discontinue it when the original indication is no longer present, ie, a form of “clinical inertia.” The authors aimed to study how often inpatient clinicians were aware (or unaware) of the telemetry status of their patients.
METHODS
The authors conducted a cross-sectional observational study at 2 academic medical centers within the same healthcare system (University of California, Los Angeles [UCLA] Health System) over a 10-week period, from December 12, 2014 to February 18, 2015. The survey included senior resident physicians (in years 2 or 3 of training), attending physicians on teaching services (“teaching attendings”), and attending physicians on nonteaching services (“direct-care attendings”) caring for hospitalized patients on general internal medicine (nonintensive care) units. First-year residents (“interns”) were not surveyed because their presence at interdisciplinary rounds, where surveying took place, was not mandatory. At both hospitals, telemetry is initiated by placing a “Continuous Cardiac Monitoring” order in the EHR, and is terminated by selecting “Discontinue” on that same order. Telemetry status of patients was determined through a daily review of the EHR at UCLA Ronald Reagan Hospital, where presence of telemetry was defined as an active order for telemetry as of 7 AM. At UCLA Santa Monica Hospital, telemetry status was determined by daily review of the morning telemetry technician logs, which reflected telemetry status as of 7 AM.
Once-weekly, prior to afternoon interdisciplinary rounds, members of the study team would give physicians a print-out of their patient list and ask them to mark whether or not their patients were on telemetry as of that morning. They were allowed to reference their own printed patient list, but were not allowed to reference the EHR. Since interdisciplinary rounds occurred in the afternoon, it was assumed that all clinicians had seen and examined their patients. The authors did not mandate that physicians respond to the survey, and we did not collect information on individual physician characteristics other than training status.
The primary outcome of interest was correct assessment of telemetry status. The authors first presented descriptive statistics for patient, provider, and telemetry status, and used χ2 tests and McNemar’s test to compare the type of physician (resident, teaching attending, or direct-care attending) with the binary outcome (correct or incorrect assessment). STATA/SE, 13.1 (StataCorp), was used for all statistical analysis, and P values < 0.05 were considered statistically significant. The study was submitted to the UCLA Office of Human Research Protection Program and exempted from Institutional Review Board review.
RESULTS
A total of 1,379 physician-assessments on 962 patients were obtained during the study period. During this time, 53.1% (511/962) of patients were on telemetry. Overall, physicians were incorrect in 26.5% (365/1379) of their assessments of telemetry status (Table). Of the 745 assessments of a patient on telemetry, clinicians erroneously reported that they were not 27.9% of the time (n = 208). Of the 634 assessments of a patient not on telemetry, clinicians erroneously reported that patients were on it 24.8% of the time (n = 157).
Assessments by direct-care attendings were more accurate than those done by teaching attendings (80.9% vs. 72.4%, P < 0.05) and resident physicians (80.9% vs. 71.8%, P < 0.05). There was no statistically significant difference in accuracy of resident physician assessments when compared to teaching attending assessments (71.8% vs. 72.4%, P = 0.81).
DISCUSSION
In this study, clinicians often inaccurately recalled the telemetry status of their hospitalized patients. These findings have implications for both patient safety as well as telemetry overuse, as ignorance of telemetry status may limit its discontinuation.
The authors also found that assessments done by direct-care attendings were more accurate than those done by teaching attendings. This discrepancy is likely related to different roles in patient care: teaching attendings provide supervisory roles, while direct-care attendings routinely review orders and perform detailed exams on their patients. Similarly, resident physician assessments were found to be less accurate than direct-care attending assessments, which may reflect less clinical experience as well as their supervisory role.
In light of these findings, interventions to reduce telemetry overuse should include efforts to increase real-time telemetry awareness as well as reduce inappropriate use, and should target all levels of training. Using research on urinary catheter removal10 as a model, strategies to increase telemetry awareness could include daily verbal or written reminders of telemetry status, requests to assess daily need, high visibility signs in charts or in patient rooms, or electronic reminders that telemetry is in place. Furthermore, efforts to promote and operationalize medical mindfulness, in which providers are trained to be aware of indications, timely removal, and the presence of monitoring devices could be incorporated into broader telemetry stewardship and high-value care efforts.11
There are limitations to this study. The authors did not collect information on the number of unique individual physicians represented by the study, and, thus, clinicians may have been surveyed multiple times throughout the study, potentially influencing their attention to the telemetry status of their patients. In addition, this study was conducted within a single healthcare system, limiting its generalizability.
In conclusion, the authors found that physicians were often incorrect when assessing the telemetry status of their patients. Interventions to help raise awareness of a patient’s telemetry status may help reduce telemetry overuse.
Disclosure: Nothing to report.
1. Henriques-Forsythe MN, Ivonye CC, Jamched U, Kamuguisha LKK, Olejeme KA, Onwuanyi AE. Is telemetry overused? Is it as helpful as thought? Cleve Clin J Med. 2009;76:368-372. PubMed
2. Kanwar M, Fares R, Minnick S, Rosman HS, Saravolatz L. Inpatient cardiac telemetry monitoring: are we overdoing it. JCOM. 2008;15(1):16-20.
3. Chong-Yik R, Bennett A, Milani R, Morin D. Telemetry overuse and its economic implications. J Am Coll Cardiol.2016;67(13_S):1993.
4. Najafi N, Auerbach A. Use and outcomes of telemetry monitoring on a medicine service. Arch Intern Med. 2012;172:1349-1350. PubMed
5. Bulger J, Nickel W, Messler J, et al. Choosing wisely in adult hospital medicine: five opportunities for improved healthcare value. J Hosp Med. 2013;8:486-492. PubMed
6. Leighton H, Kianfar H, Serynek S, Kerwin T. Effect of an electronic ordering system on adherence to the American College of Cardiology/American Heart Association guidelines for cardiac monitoring. Crit Pathw Cardiol. 2013;12:6-8. PubMed
7. Lee JC, Lamb P, Rand E, Ryan C, Rubal BJ. Optimizing telemetry utilization in an academic medical center. JCOM. 2008;15(9).
8. Boggan JC, Navar-Boggan AM, Patel V, Schulteis RD, Simel DL. Reductions in telemetry order duration do not reduce telemetry utilization. J Hosp Med. 2014;9:795-796. PubMed
9. Dressler R, Dryer MM, Coletti C, Mahoney D, Doorey AJ. Altering overuse of cardiac telemetry in non-intensive care unit settings by hardwiring the use of American Heart Association guidelines. JAMA Intern Med. 2014;174:1852-1854. PubMed
10. Meddings J, Krein SL, Fakih MG, Olmsted RN, Saint S. Reducing unnecessary urinary catheter use and other strategies to prevent catheter-associated urinary tract infections: brief update review. In: Making Health Care Safer II: An Updated Critical Analysis of the Evidence for Patient Safety Practices. (Evidence Reports/Technology Assessments, No. 211.) Chapter 9. Rockville (MD): Agency for Healthcare Research and Quality (US); 2013. Available from: http://www.ncbi.nlm.nih.gov/books/NBK133354/. May 15, 2016. PubMed
11. Kiyoshi-Teo H, Krein SL, Saint S. Applying mindful evidence-based practice at the bedside: using catheter-associated urinary tract infection as a model. Infect Control Hosp Epidemiol. 2013;34:1099-1001. PubMed
© 2017 Society of Hospital Medicine