User login
A Concise Tool for Measuring Care Coordination from the Provider’s Perspective in the Hospital Setting
Care Coordination has been defined as “…the deliberate organization of patient care activities between two or more participants (including the patient) involved in a patient’s care to facilitate the appropriate delivery of healthcare services.”1 The Institute of Medicine identified care coordination as a key strategy to improve the American healthcare system,2 and evidence has been building that well-coordinated care improves patient outcomes and reduces healthcare costs associated with chronic conditions.3-5 In 2012, Johns Hopkins Medicine was awarded a Healthcare Innovation Award by the Centers for Medicare & Medicaid Services to improve coordination of care across the continuum of care for adult patients admitted to Johns Hopkins Hospital (JHH) and Johns Hopkins Bayview Medical Center (JHBMC), and for high-risk low-income Medicare and Medicaid beneficiaries receiving ambulatory care in targeted zip codes. The purpose of this project, known as the Johns Hopkins Community Health Partnership (J-CHiP), was to improve health and healthcare and to reduce healthcare costs. The acute care component of the program consisted of a bundle of interventions focused on improving coordination of care for all patients, including a “bridge to home” discharge process, as they transitioned back to the community from inpatient admission. The bundle included the following: early screening for discharge planning to predict needed postdischarge services; discussion in daily multidisciplinary rounds about goals and priorities of the hospitalization and potential postdischarge needs; patient and family self-care management; education enhanced medication management, including the option of “medications in hand” at the time of discharge; postdischarge telephone follow-up by nurses; and, for patients identified as high-risk, a “transition guide” (a nurse who works with the patient via home visits and by phone to optimize compliance with care for 30 days postdischarge).6 While the primary endpoints of the J-CHiP program were to improve clinical outcomes and reduce healthcare costs, we were also interested in the impact of the program on care coordination processes in the acute care setting. This created the need for an instrument to measure healthcare professionals’ views of care coordination in their immediate work environments.
We began our search for existing measures by reviewing the Coordination Measures Atlas published in 2014.7 Although this report evaluates over 80 different measures of care coordination, most of them focus on the perspective of the patient and/or family members, on specific conditions, and on primary care or outpatient settings.7,8 We were unable to identify an existing measure from the provider perspective, designed for the inpatient setting, that was both brief but comprehensive enough to cover a range of care coordination domains.8
Consequently, our first aim was to develop a brief, comprehensive tool to measure care coordination from the perspective of hospital inpatient staff that could be used to compare different units or types of providers, or to conduct longitudinal assessment. The second aim was to conduct a preliminary evaluation of the tool in our healthcare setting, including to assess its psychometric properties, to describe provider perceptions of care coordination after the implementation of J-CHiP, and to explore potential differences among departments, types of professionals, and between the 2 hospitals.
METHODS
Development of the Care Coordination Questionnaire
The survey was developed in collaboration with leaders of the J-CHiP Acute Care Team. We met at the outset and on multiple subsequent occasions to align survey domains with the main components of the J-CHiP acute care intervention and to assure that the survey would be relevant and understandable to a variety of multidisciplinary professionals, including physicians, nurses, social workers, physical therapists, and other health professionals. Care was taken to avoid redundancy with existing evaluation efforts and to minimize respondent burden. This process helped to ensure the content validity of the items, the usefulness of the results, and the future usability of the tool.
We modeled the Care Coordination Questionnaire (CCQ) after the Safety Attitudes Questionnaire (SAQ),9 a widely used survey that is deployed approximately annually at JHH and JHBMC. While the SAQ focuses on healthcare provider attitudes about issues relevant to patient safety (often referred to as safety climate or safety culture), this new tool was designed to focus on healthcare professionals’ attitudes about care coordination. Similar to the way that the SAQ “elicits a snapshot of the safety climate through surveys of frontline worker perceptions,” we sought to elicit a picture of our care coordination climate through a survey of frontline hospital staff.
The CCQ was built upon the domains and approaches to care coordination described in the Agency for Healthcare Research and Quality Care Coordination Atlas.3 This report identifies 9 mechanisms for achieving care coordination, including the following: Establish Accountability or Negotiate Responsibility; Communicate; Facilitate Transitions; Assess Needs and Goals; Create a Proactive Plan of Care; Monitor, Follow Up, and Respond to Change; Support Self-Management Goals; Link to Community Resources; and Align Resources with Patient and Population Needs; as well as 5 broad approaches commonly used to improve the delivery of healthcare, including Teamwork Focused on Coordination, Healthcare Home, Care Management, Medication Management, and Health IT-Enabled Coordination.7 We generated at least 1 item to represent 8 of the 9 domains, as well as the broad approach described as Teamwork Focused on Coordination. After developing an initial set of items, we sought input from 3 senior leaders of the J-CHiP Acute Care Team to determine if the items covered the care coordination domains of interest, and to provide feedback on content validity. To test the interpretability of survey items and consistency across professional groups, we sent an initial version of the survey questions to at least 1 person from each of the following professional groups: hospitalist, social worker, case manager, clinical pharmacist, and nurse. We asked them to review all of our survey questions and to provide us with feedback on all aspects of the questions, such as whether they believed the questions were relevant and understandable to the members of their professional discipline, the appropriateness of the wording of the questions, and other comments. Modifications were made to the content and wording of the questions based on the feedback received. The final draft of the questionnaire was reviewed by the leadership team of the J-CHiP Acute Care Team to ensure its usefulness in providing actionable information.
The resulting 12-item questionnaire used a 5-point Likert response scale ranging from 1 = “disagree strongly” to 5 = “agree strongly,” and an additional option of “not applicable (N/A).” To help assess construct validity, a global question was added at the end of the questionnaire asking, “Overall, how would you rate the care coordination at the hospital of your primary work setting?” The response was measured on a 10-point Likert-type scale ranging from 1 = “totally uncoordinated care” to 10 = “perfectly coordinated care” (see Appendix). In addition, the questionnaire requested information about the respondents’ gender, position, and their primary unit, department, and hospital affiliation.
Data Collection Procedures
An invitation to complete an anonymous questionnaire was sent to the following inpatient care professionals: all nursing staff working on care coordination units in the departments of medicine, surgery, and neurology/neurosurgery, as well as physicians, pharmacists, acute care therapists (eg, occupational and physical therapists), and other frontline staff. All healthcare staff fitting these criteria was sent an e-mail with a request to fill out the survey online using QualtricsTM (Qualtrics Labs Inc., Provo, UT), as well as multiple follow-up reminders. The participants worked either at the JHH (a 1194-bed tertiary academic medical center in Baltimore, MD) or the JHBMC (a 440-bed academic community hospital located nearby). Data were collected from October 2015 through January 2016.
Analysis
Means and standard deviations were calculated by treating the responses as continuous variables. We tried 3 different methods to handle missing data: (1) without imputation, (2) imputing the mean value of each item, and (3) substituting a neutral score. Because all 3 methods produced very similar results, we treated the N/A responses as missing values without imputation for simplicity of analysis. We used STATA 13.1 (Stata Corporation, College Station, Texas) to analyze the data.
To identify subscales, we performed exploratory factor analysis on responses to the 12 specific items. Promax rotation was selected based on the simple structure. Subscale scores for each respondent were generated by computing the mean of responses to the items in the subscale. Internal consistency reliability of the subscales was estimated using Cronbach’s alpha. We calculated Pearson correlation coefficients for the items in each subscale, and examined Cronbach’s alpha deleting each item in turn. For each of the subscales identified and the global scale, we calculated the mean, standard deviation, median and interquartile range. Although distributions of scores tended to be non-normal, this was done to increase interpretability. We also calculated percent scoring at the ceiling (highest possible score).
We analyzed the data with 3 research questions in mind: Was there a difference in perceptions of care coordination between (1) staff affiliated with the 2 different hospitals, (2) staff affiliated with different clinical departments, or (3) staff with different professional roles? For comparisons based on hospital and department, and type of professional, nonparametric tests (Wilcoxon rank-sum and Kruskal-Wallis test) were used with a level of statistical significance set at 0.05. The comparison between hospitals and departments was made only among nurses to minimize the confounding effect of different distribution of professionals. We tested the distribution of “years in specialty” between hospitals and departments for this comparison using Pearson’s χ2 test. The difference was not statistically significant (P = 0.167 for hospitals, and P = 0.518 for departments), so we assumed that the potential confounding effect of this variable was negligible in this analysis. The comparison of scores within each professional group used the Friedman test. Pearson’s χ2 test was used to compare the baseline characteristics between 2 hospitals.
RESULTS
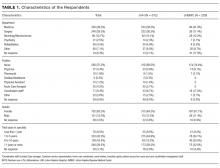
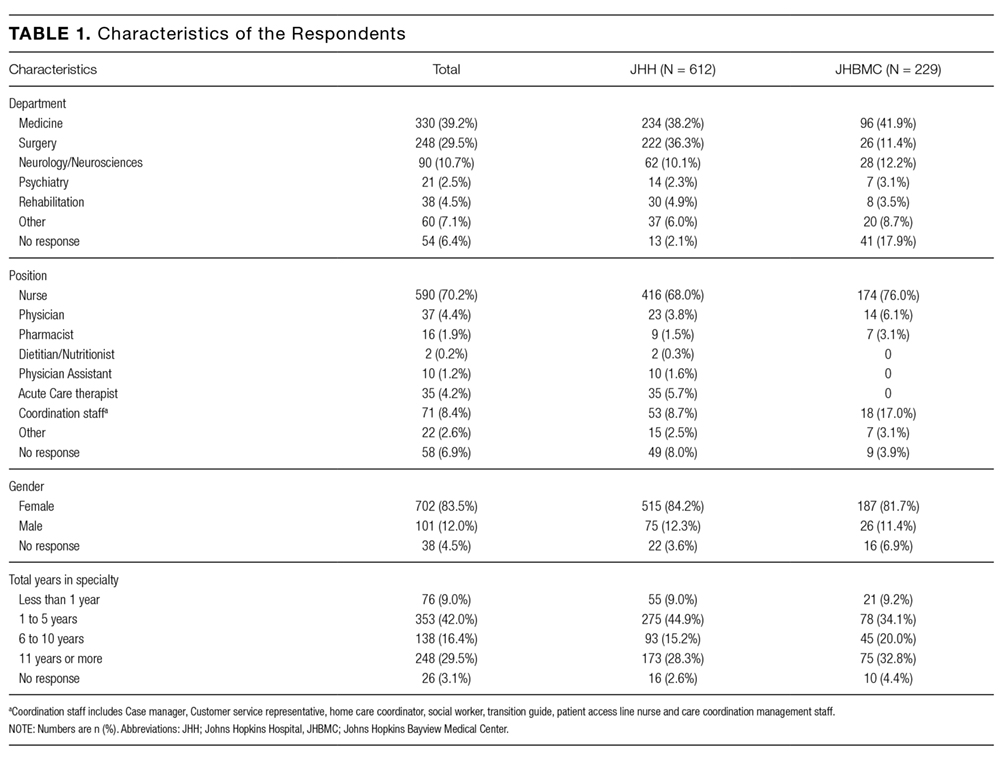
Among the 1486 acute care professionals asked to participate in the survey, 841 completed the questionnaire (response rate 56.6%). Table 1 shows the characteristics of the participants from each hospital. Table 2 summarizes the item response rates, proportion scoring at the ceiling, and weighting from the factor analysis. All items had completion rates of 99.2% or higher, with N/A responses ranging from 0% (item 2) to 3.1% (item 7). The percent scoring at the ceiling was 1.7% for the global item and ranged from 18.3% up to 63.3% for other individual items.

We also examined differences in perceptions of care coordination among nursing units to illustrate the tool’s ability to detect variation in Patient Engagement subscale scores for JHH nurses (see Appendix).
DISCUSSION
This study resulted in one of the first measurement tools to succinctly measure multiple aspects of care coordination in the hospital from the perspective of healthcare professionals. Given the hectic work environment of healthcare professionals, and the increasing emphasis on collecting data for evaluation and improvement, it is important to minimize respondent burden. This effort was catalyzed by a multifaceted initiative to redesign acute care delivery and promote seamless transitions of care, supported by the Center for Medicare & Medicaid Innovation. In initial testing, this questionnaire has evidence for reliability and validity. It was encouraging to find that the preliminary psychometric performance of the measure was very similar in 2 different settings of a tertiary academic hospital and a community hospital.
Our analysis of the survey data explored potential differences between the 2 hospitals, among different types of healthcare professionals and across different departments. Although we expected differences, we had no specific hypotheses about what those differences might be, and, in fact, did not observe any substantial differences. This could be taken to indicate that the intervention was uniformly and successfully implemented in both hospitals, and engaged various professionals in different departments. The ability to detect differences in care coordination at the nursing unit level could also prove to be beneficial for more precisely targeting where process improvement is needed. Further data collection and analyses should be conducted to more systematically compare units and to help identify those where practice is most advanced and those where improvements may be needed. It would also be informative to link differences in care coordination scores with patient outcomes. In addition, differences identified on specific domains between professional groups could be helpful to identify where greater efforts are needed to improve interdisciplinary practice. Sampling strategies stratified by provider type would need to be targeted to make this kind of analysis informative.
The consistently lower scores observed for patient engagement, from the perspective of care professionals in all groups, suggest that this is an area where improvement is needed. These findings are consistent with published reports on the common failure by hospitals to include patients as a member of their own care team. In addition to measuring care processes from the perspective of frontline healthcare workers, future evaluations within the healthcare system would also benefit from including data collected from the perspective of the patient and family.
This study had some limitations. First, there may be more than 4 domains of care coordination that are important and can be measured in the acute care setting from provider perspective. However, the addition of more domains should be balanced against practicality and respondent burden. It may be possible to further clarify priority domains in hospital settings as opposed to the primary care setting. Future research should be directed to find these areas and to develop a more comprehensive, yet still concise measurement instrument. Second, the tool was developed to measure the impact of a large-scale intervention, and to fit into the specific context of 2 hospitals. Therefore, it should be tested in different settings of hospital care to see how it performs. However, virtually all hospitals in the United States today are adapting to changes in both financing and healthcare delivery. A tool such as the one described in this paper could be helpful to many organizations. Third, the scoring system for the overall scale score is not weighted and therefore reflects teamwork more than other components of care coordination, which are represented by fewer items. In general, we believe that use of the subscale scores may be more informative. Alternative scoring systems might also be proposed, including item weighting based on factor scores.
For the purposes of evaluation in this specific instance, we only collected data at a single point in time, after the intervention had been deployed. Thus, we were not able to evaluate the effectiveness of the J-CHiP intervention. We also did not intend to focus too much on the differences between units, given the limited number of respondents from individual units. It would be useful to collect more data at future time points, both to test the responsiveness of the scales and to evaluate the impact of future interventions at both the hospital and unit level.
The preliminary data from this study have generated insights about gaps in current practice, such as in engaging patients in the inpatient care process. It has also increased awareness by hospital leaders about the need to achieve high reliability in the adoption of new procedures and interdisciplinary practice. This tool might be used to find areas in need of improvement, to evaluate the effect of initiatives to improve care coordination, to monitor the change over time in the perception of care coordination among healthcare professionals, and to develop better intervention strategies for coordination activities in acute care settings. Additional research is needed to provide further evidence for the reliability and validity of this measure in diverse settings.
Disclosure
The project described was supported by Grant Number 1C1CMS331053-01-00 from the US Department of Health and Human Services, Centers for Medicare & Medicaid Services. The contents of this publication are solely the responsibility of the authors and do not necessarily represent the official views of the US Department of Health and Human Services or any of its agencies. The research presented was conducted by the awardee. Results may or may not be consistent with or confirmed by the findings of the independent evaluation contractor.
The authors have no other disclosures.
1. McDonald KM, Sundaram V, Bravata DM, et al. Closing the Quality Gap: A Critical Analysis of Quality Improvement Strategies (Vol. 7: Care Coordination). Technical Reviews, No. 9.7. Rockville (MD): Agency for Healthcare Research and Quality (US); 2007. PubMed
2. Adams K, Corrigan J. Priority areas for national action: transforming health care quality. Washington, DC: National Academies Press; 2003. PubMed
3. Renders CM, Valk GD, Griffin S, Wagner EH, Eijk JT, Assendelft WJ. Interventions to improve the management of diabetes mellitus in primary care, outpatient and community settings. Cochrane Database Syst Rev. 2001(1):CD001481. PubMed
4. McAlister FA, Lawson FM, Teo KK, Armstrong PW. A systematic review of randomized trials of disease management programs in heart failure. Am J Med. 2001;110(5):378-384. PubMed
5. Bruce ML, Raue PJ, Reilly CF, et al. Clinical effectiveness of integrating depression care management into medicare home health: the Depression CAREPATH Randomized trial. JAMA Intern Med. 2015;175(1):55-64. PubMed
6. Berkowitz SA, Brown P, Brotman DJ, et al. Case Study: Johns Hopkins Community Health Partnership: A model for transformation. Healthc (Amst). 2016;4(4):264-270. PubMed
7. McDonald. KM, Schultz. E, Albin. L, et al. Care Coordination Measures Atlas Version 4. Rockville, MD: Agency for Healthcare Research and Quality; 2014.
8 Schultz EM, Pineda N, Lonhart J, Davies SM, McDonald KM. A systematic review of the care coordination measurement landscape. BMC Health Serv Res. 2013;13:119. PubMed
9. Sexton JB, Helmreich RL, Neilands TB, et al. The Safety Attitudes Questionnaire: psychometric properties, benchmarking data, and emerging research. BMC Health Serv Res. 2006;6:44. PubMed
Care Coordination has been defined as “…the deliberate organization of patient care activities between two or more participants (including the patient) involved in a patient’s care to facilitate the appropriate delivery of healthcare services.”1 The Institute of Medicine identified care coordination as a key strategy to improve the American healthcare system,2 and evidence has been building that well-coordinated care improves patient outcomes and reduces healthcare costs associated with chronic conditions.3-5 In 2012, Johns Hopkins Medicine was awarded a Healthcare Innovation Award by the Centers for Medicare & Medicaid Services to improve coordination of care across the continuum of care for adult patients admitted to Johns Hopkins Hospital (JHH) and Johns Hopkins Bayview Medical Center (JHBMC), and for high-risk low-income Medicare and Medicaid beneficiaries receiving ambulatory care in targeted zip codes. The purpose of this project, known as the Johns Hopkins Community Health Partnership (J-CHiP), was to improve health and healthcare and to reduce healthcare costs. The acute care component of the program consisted of a bundle of interventions focused on improving coordination of care for all patients, including a “bridge to home” discharge process, as they transitioned back to the community from inpatient admission. The bundle included the following: early screening for discharge planning to predict needed postdischarge services; discussion in daily multidisciplinary rounds about goals and priorities of the hospitalization and potential postdischarge needs; patient and family self-care management; education enhanced medication management, including the option of “medications in hand” at the time of discharge; postdischarge telephone follow-up by nurses; and, for patients identified as high-risk, a “transition guide” (a nurse who works with the patient via home visits and by phone to optimize compliance with care for 30 days postdischarge).6 While the primary endpoints of the J-CHiP program were to improve clinical outcomes and reduce healthcare costs, we were also interested in the impact of the program on care coordination processes in the acute care setting. This created the need for an instrument to measure healthcare professionals’ views of care coordination in their immediate work environments.
We began our search for existing measures by reviewing the Coordination Measures Atlas published in 2014.7 Although this report evaluates over 80 different measures of care coordination, most of them focus on the perspective of the patient and/or family members, on specific conditions, and on primary care or outpatient settings.7,8 We were unable to identify an existing measure from the provider perspective, designed for the inpatient setting, that was both brief but comprehensive enough to cover a range of care coordination domains.8
Consequently, our first aim was to develop a brief, comprehensive tool to measure care coordination from the perspective of hospital inpatient staff that could be used to compare different units or types of providers, or to conduct longitudinal assessment. The second aim was to conduct a preliminary evaluation of the tool in our healthcare setting, including to assess its psychometric properties, to describe provider perceptions of care coordination after the implementation of J-CHiP, and to explore potential differences among departments, types of professionals, and between the 2 hospitals.
METHODS
Development of the Care Coordination Questionnaire
The survey was developed in collaboration with leaders of the J-CHiP Acute Care Team. We met at the outset and on multiple subsequent occasions to align survey domains with the main components of the J-CHiP acute care intervention and to assure that the survey would be relevant and understandable to a variety of multidisciplinary professionals, including physicians, nurses, social workers, physical therapists, and other health professionals. Care was taken to avoid redundancy with existing evaluation efforts and to minimize respondent burden. This process helped to ensure the content validity of the items, the usefulness of the results, and the future usability of the tool.
We modeled the Care Coordination Questionnaire (CCQ) after the Safety Attitudes Questionnaire (SAQ),9 a widely used survey that is deployed approximately annually at JHH and JHBMC. While the SAQ focuses on healthcare provider attitudes about issues relevant to patient safety (often referred to as safety climate or safety culture), this new tool was designed to focus on healthcare professionals’ attitudes about care coordination. Similar to the way that the SAQ “elicits a snapshot of the safety climate through surveys of frontline worker perceptions,” we sought to elicit a picture of our care coordination climate through a survey of frontline hospital staff.
The CCQ was built upon the domains and approaches to care coordination described in the Agency for Healthcare Research and Quality Care Coordination Atlas.3 This report identifies 9 mechanisms for achieving care coordination, including the following: Establish Accountability or Negotiate Responsibility; Communicate; Facilitate Transitions; Assess Needs and Goals; Create a Proactive Plan of Care; Monitor, Follow Up, and Respond to Change; Support Self-Management Goals; Link to Community Resources; and Align Resources with Patient and Population Needs; as well as 5 broad approaches commonly used to improve the delivery of healthcare, including Teamwork Focused on Coordination, Healthcare Home, Care Management, Medication Management, and Health IT-Enabled Coordination.7 We generated at least 1 item to represent 8 of the 9 domains, as well as the broad approach described as Teamwork Focused on Coordination. After developing an initial set of items, we sought input from 3 senior leaders of the J-CHiP Acute Care Team to determine if the items covered the care coordination domains of interest, and to provide feedback on content validity. To test the interpretability of survey items and consistency across professional groups, we sent an initial version of the survey questions to at least 1 person from each of the following professional groups: hospitalist, social worker, case manager, clinical pharmacist, and nurse. We asked them to review all of our survey questions and to provide us with feedback on all aspects of the questions, such as whether they believed the questions were relevant and understandable to the members of their professional discipline, the appropriateness of the wording of the questions, and other comments. Modifications were made to the content and wording of the questions based on the feedback received. The final draft of the questionnaire was reviewed by the leadership team of the J-CHiP Acute Care Team to ensure its usefulness in providing actionable information.
The resulting 12-item questionnaire used a 5-point Likert response scale ranging from 1 = “disagree strongly” to 5 = “agree strongly,” and an additional option of “not applicable (N/A).” To help assess construct validity, a global question was added at the end of the questionnaire asking, “Overall, how would you rate the care coordination at the hospital of your primary work setting?” The response was measured on a 10-point Likert-type scale ranging from 1 = “totally uncoordinated care” to 10 = “perfectly coordinated care” (see Appendix). In addition, the questionnaire requested information about the respondents’ gender, position, and their primary unit, department, and hospital affiliation.
Data Collection Procedures
An invitation to complete an anonymous questionnaire was sent to the following inpatient care professionals: all nursing staff working on care coordination units in the departments of medicine, surgery, and neurology/neurosurgery, as well as physicians, pharmacists, acute care therapists (eg, occupational and physical therapists), and other frontline staff. All healthcare staff fitting these criteria was sent an e-mail with a request to fill out the survey online using QualtricsTM (Qualtrics Labs Inc., Provo, UT), as well as multiple follow-up reminders. The participants worked either at the JHH (a 1194-bed tertiary academic medical center in Baltimore, MD) or the JHBMC (a 440-bed academic community hospital located nearby). Data were collected from October 2015 through January 2016.
Analysis
Means and standard deviations were calculated by treating the responses as continuous variables. We tried 3 different methods to handle missing data: (1) without imputation, (2) imputing the mean value of each item, and (3) substituting a neutral score. Because all 3 methods produced very similar results, we treated the N/A responses as missing values without imputation for simplicity of analysis. We used STATA 13.1 (Stata Corporation, College Station, Texas) to analyze the data.
To identify subscales, we performed exploratory factor analysis on responses to the 12 specific items. Promax rotation was selected based on the simple structure. Subscale scores for each respondent were generated by computing the mean of responses to the items in the subscale. Internal consistency reliability of the subscales was estimated using Cronbach’s alpha. We calculated Pearson correlation coefficients for the items in each subscale, and examined Cronbach’s alpha deleting each item in turn. For each of the subscales identified and the global scale, we calculated the mean, standard deviation, median and interquartile range. Although distributions of scores tended to be non-normal, this was done to increase interpretability. We also calculated percent scoring at the ceiling (highest possible score).
We analyzed the data with 3 research questions in mind: Was there a difference in perceptions of care coordination between (1) staff affiliated with the 2 different hospitals, (2) staff affiliated with different clinical departments, or (3) staff with different professional roles? For comparisons based on hospital and department, and type of professional, nonparametric tests (Wilcoxon rank-sum and Kruskal-Wallis test) were used with a level of statistical significance set at 0.05. The comparison between hospitals and departments was made only among nurses to minimize the confounding effect of different distribution of professionals. We tested the distribution of “years in specialty” between hospitals and departments for this comparison using Pearson’s χ2 test. The difference was not statistically significant (P = 0.167 for hospitals, and P = 0.518 for departments), so we assumed that the potential confounding effect of this variable was negligible in this analysis. The comparison of scores within each professional group used the Friedman test. Pearson’s χ2 test was used to compare the baseline characteristics between 2 hospitals.
RESULTS
Among the 1486 acute care professionals asked to participate in the survey, 841 completed the questionnaire (response rate 56.6%). Table 1 shows the characteristics of the participants from each hospital. Table 2 summarizes the item response rates, proportion scoring at the ceiling, and weighting from the factor analysis. All items had completion rates of 99.2% or higher, with N/A responses ranging from 0% (item 2) to 3.1% (item 7). The percent scoring at the ceiling was 1.7% for the global item and ranged from 18.3% up to 63.3% for other individual items.
We also examined differences in perceptions of care coordination among nursing units to illustrate the tool’s ability to detect variation in Patient Engagement subscale scores for JHH nurses (see Appendix).
DISCUSSION
This study resulted in one of the first measurement tools to succinctly measure multiple aspects of care coordination in the hospital from the perspective of healthcare professionals. Given the hectic work environment of healthcare professionals, and the increasing emphasis on collecting data for evaluation and improvement, it is important to minimize respondent burden. This effort was catalyzed by a multifaceted initiative to redesign acute care delivery and promote seamless transitions of care, supported by the Center for Medicare & Medicaid Innovation. In initial testing, this questionnaire has evidence for reliability and validity. It was encouraging to find that the preliminary psychometric performance of the measure was very similar in 2 different settings of a tertiary academic hospital and a community hospital.
Our analysis of the survey data explored potential differences between the 2 hospitals, among different types of healthcare professionals and across different departments. Although we expected differences, we had no specific hypotheses about what those differences might be, and, in fact, did not observe any substantial differences. This could be taken to indicate that the intervention was uniformly and successfully implemented in both hospitals, and engaged various professionals in different departments. The ability to detect differences in care coordination at the nursing unit level could also prove to be beneficial for more precisely targeting where process improvement is needed. Further data collection and analyses should be conducted to more systematically compare units and to help identify those where practice is most advanced and those where improvements may be needed. It would also be informative to link differences in care coordination scores with patient outcomes. In addition, differences identified on specific domains between professional groups could be helpful to identify where greater efforts are needed to improve interdisciplinary practice. Sampling strategies stratified by provider type would need to be targeted to make this kind of analysis informative.
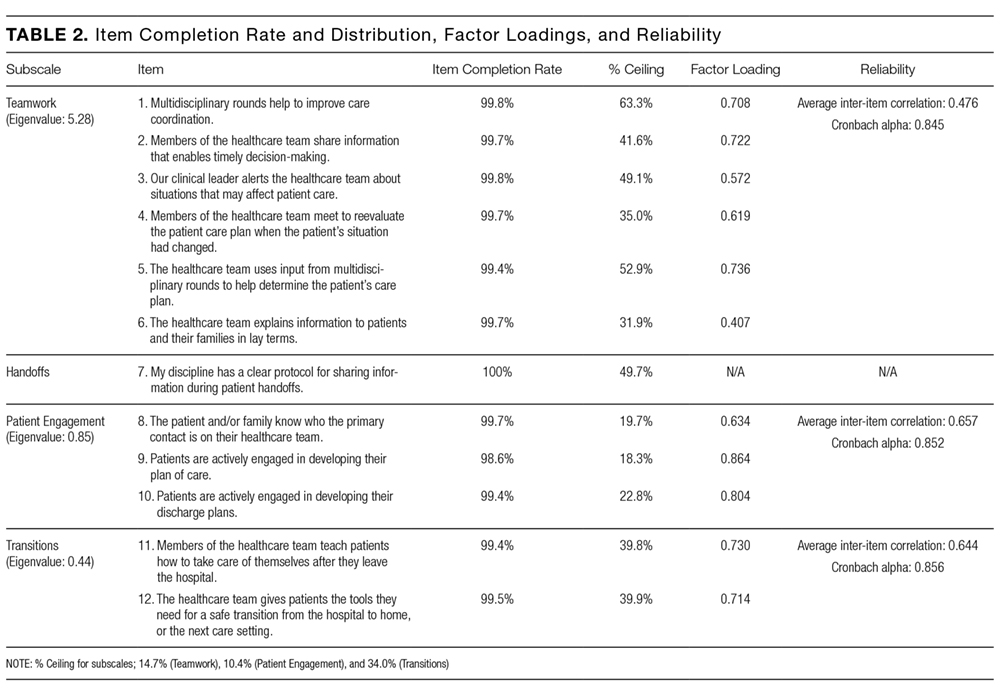
The consistently lower scores observed for patient engagement, from the perspective of care professionals in all groups, suggest that this is an area where improvement is needed. These findings are consistent with published reports on the common failure by hospitals to include patients as a member of their own care team. In addition to measuring care processes from the perspective of frontline healthcare workers, future evaluations within the healthcare system would also benefit from including data collected from the perspective of the patient and family.
This study had some limitations. First, there may be more than 4 domains of care coordination that are important and can be measured in the acute care setting from provider perspective. However, the addition of more domains should be balanced against practicality and respondent burden. It may be possible to further clarify priority domains in hospital settings as opposed to the primary care setting. Future research should be directed to find these areas and to develop a more comprehensive, yet still concise measurement instrument. Second, the tool was developed to measure the impact of a large-scale intervention, and to fit into the specific context of 2 hospitals. Therefore, it should be tested in different settings of hospital care to see how it performs. However, virtually all hospitals in the United States today are adapting to changes in both financing and healthcare delivery. A tool such as the one described in this paper could be helpful to many organizations. Third, the scoring system for the overall scale score is not weighted and therefore reflects teamwork more than other components of care coordination, which are represented by fewer items. In general, we believe that use of the subscale scores may be more informative. Alternative scoring systems might also be proposed, including item weighting based on factor scores.
For the purposes of evaluation in this specific instance, we only collected data at a single point in time, after the intervention had been deployed. Thus, we were not able to evaluate the effectiveness of the J-CHiP intervention. We also did not intend to focus too much on the differences between units, given the limited number of respondents from individual units. It would be useful to collect more data at future time points, both to test the responsiveness of the scales and to evaluate the impact of future interventions at both the hospital and unit level.
The preliminary data from this study have generated insights about gaps in current practice, such as in engaging patients in the inpatient care process. It has also increased awareness by hospital leaders about the need to achieve high reliability in the adoption of new procedures and interdisciplinary practice. This tool might be used to find areas in need of improvement, to evaluate the effect of initiatives to improve care coordination, to monitor the change over time in the perception of care coordination among healthcare professionals, and to develop better intervention strategies for coordination activities in acute care settings. Additional research is needed to provide further evidence for the reliability and validity of this measure in diverse settings.
Disclosure
The project described was supported by Grant Number 1C1CMS331053-01-00 from the US Department of Health and Human Services, Centers for Medicare & Medicaid Services. The contents of this publication are solely the responsibility of the authors and do not necessarily represent the official views of the US Department of Health and Human Services or any of its agencies. The research presented was conducted by the awardee. Results may or may not be consistent with or confirmed by the findings of the independent evaluation contractor.
The authors have no other disclosures.
Care Coordination has been defined as “…the deliberate organization of patient care activities between two or more participants (including the patient) involved in a patient’s care to facilitate the appropriate delivery of healthcare services.”1 The Institute of Medicine identified care coordination as a key strategy to improve the American healthcare system,2 and evidence has been building that well-coordinated care improves patient outcomes and reduces healthcare costs associated with chronic conditions.3-5 In 2012, Johns Hopkins Medicine was awarded a Healthcare Innovation Award by the Centers for Medicare & Medicaid Services to improve coordination of care across the continuum of care for adult patients admitted to Johns Hopkins Hospital (JHH) and Johns Hopkins Bayview Medical Center (JHBMC), and for high-risk low-income Medicare and Medicaid beneficiaries receiving ambulatory care in targeted zip codes. The purpose of this project, known as the Johns Hopkins Community Health Partnership (J-CHiP), was to improve health and healthcare and to reduce healthcare costs. The acute care component of the program consisted of a bundle of interventions focused on improving coordination of care for all patients, including a “bridge to home” discharge process, as they transitioned back to the community from inpatient admission. The bundle included the following: early screening for discharge planning to predict needed postdischarge services; discussion in daily multidisciplinary rounds about goals and priorities of the hospitalization and potential postdischarge needs; patient and family self-care management; education enhanced medication management, including the option of “medications in hand” at the time of discharge; postdischarge telephone follow-up by nurses; and, for patients identified as high-risk, a “transition guide” (a nurse who works with the patient via home visits and by phone to optimize compliance with care for 30 days postdischarge).6 While the primary endpoints of the J-CHiP program were to improve clinical outcomes and reduce healthcare costs, we were also interested in the impact of the program on care coordination processes in the acute care setting. This created the need for an instrument to measure healthcare professionals’ views of care coordination in their immediate work environments.
We began our search for existing measures by reviewing the Coordination Measures Atlas published in 2014.7 Although this report evaluates over 80 different measures of care coordination, most of them focus on the perspective of the patient and/or family members, on specific conditions, and on primary care or outpatient settings.7,8 We were unable to identify an existing measure from the provider perspective, designed for the inpatient setting, that was both brief but comprehensive enough to cover a range of care coordination domains.8
Consequently, our first aim was to develop a brief, comprehensive tool to measure care coordination from the perspective of hospital inpatient staff that could be used to compare different units or types of providers, or to conduct longitudinal assessment. The second aim was to conduct a preliminary evaluation of the tool in our healthcare setting, including to assess its psychometric properties, to describe provider perceptions of care coordination after the implementation of J-CHiP, and to explore potential differences among departments, types of professionals, and between the 2 hospitals.
METHODS
Development of the Care Coordination Questionnaire
The survey was developed in collaboration with leaders of the J-CHiP Acute Care Team. We met at the outset and on multiple subsequent occasions to align survey domains with the main components of the J-CHiP acute care intervention and to assure that the survey would be relevant and understandable to a variety of multidisciplinary professionals, including physicians, nurses, social workers, physical therapists, and other health professionals. Care was taken to avoid redundancy with existing evaluation efforts and to minimize respondent burden. This process helped to ensure the content validity of the items, the usefulness of the results, and the future usability of the tool.
We modeled the Care Coordination Questionnaire (CCQ) after the Safety Attitudes Questionnaire (SAQ),9 a widely used survey that is deployed approximately annually at JHH and JHBMC. While the SAQ focuses on healthcare provider attitudes about issues relevant to patient safety (often referred to as safety climate or safety culture), this new tool was designed to focus on healthcare professionals’ attitudes about care coordination. Similar to the way that the SAQ “elicits a snapshot of the safety climate through surveys of frontline worker perceptions,” we sought to elicit a picture of our care coordination climate through a survey of frontline hospital staff.
The CCQ was built upon the domains and approaches to care coordination described in the Agency for Healthcare Research and Quality Care Coordination Atlas.3 This report identifies 9 mechanisms for achieving care coordination, including the following: Establish Accountability or Negotiate Responsibility; Communicate; Facilitate Transitions; Assess Needs and Goals; Create a Proactive Plan of Care; Monitor, Follow Up, and Respond to Change; Support Self-Management Goals; Link to Community Resources; and Align Resources with Patient and Population Needs; as well as 5 broad approaches commonly used to improve the delivery of healthcare, including Teamwork Focused on Coordination, Healthcare Home, Care Management, Medication Management, and Health IT-Enabled Coordination.7 We generated at least 1 item to represent 8 of the 9 domains, as well as the broad approach described as Teamwork Focused on Coordination. After developing an initial set of items, we sought input from 3 senior leaders of the J-CHiP Acute Care Team to determine if the items covered the care coordination domains of interest, and to provide feedback on content validity. To test the interpretability of survey items and consistency across professional groups, we sent an initial version of the survey questions to at least 1 person from each of the following professional groups: hospitalist, social worker, case manager, clinical pharmacist, and nurse. We asked them to review all of our survey questions and to provide us with feedback on all aspects of the questions, such as whether they believed the questions were relevant and understandable to the members of their professional discipline, the appropriateness of the wording of the questions, and other comments. Modifications were made to the content and wording of the questions based on the feedback received. The final draft of the questionnaire was reviewed by the leadership team of the J-CHiP Acute Care Team to ensure its usefulness in providing actionable information.
The resulting 12-item questionnaire used a 5-point Likert response scale ranging from 1 = “disagree strongly” to 5 = “agree strongly,” and an additional option of “not applicable (N/A).” To help assess construct validity, a global question was added at the end of the questionnaire asking, “Overall, how would you rate the care coordination at the hospital of your primary work setting?” The response was measured on a 10-point Likert-type scale ranging from 1 = “totally uncoordinated care” to 10 = “perfectly coordinated care” (see Appendix). In addition, the questionnaire requested information about the respondents’ gender, position, and their primary unit, department, and hospital affiliation.
Data Collection Procedures
An invitation to complete an anonymous questionnaire was sent to the following inpatient care professionals: all nursing staff working on care coordination units in the departments of medicine, surgery, and neurology/neurosurgery, as well as physicians, pharmacists, acute care therapists (eg, occupational and physical therapists), and other frontline staff. All healthcare staff fitting these criteria was sent an e-mail with a request to fill out the survey online using QualtricsTM (Qualtrics Labs Inc., Provo, UT), as well as multiple follow-up reminders. The participants worked either at the JHH (a 1194-bed tertiary academic medical center in Baltimore, MD) or the JHBMC (a 440-bed academic community hospital located nearby). Data were collected from October 2015 through January 2016.
Analysis
Means and standard deviations were calculated by treating the responses as continuous variables. We tried 3 different methods to handle missing data: (1) without imputation, (2) imputing the mean value of each item, and (3) substituting a neutral score. Because all 3 methods produced very similar results, we treated the N/A responses as missing values without imputation for simplicity of analysis. We used STATA 13.1 (Stata Corporation, College Station, Texas) to analyze the data.
To identify subscales, we performed exploratory factor analysis on responses to the 12 specific items. Promax rotation was selected based on the simple structure. Subscale scores for each respondent were generated by computing the mean of responses to the items in the subscale. Internal consistency reliability of the subscales was estimated using Cronbach’s alpha. We calculated Pearson correlation coefficients for the items in each subscale, and examined Cronbach’s alpha deleting each item in turn. For each of the subscales identified and the global scale, we calculated the mean, standard deviation, median and interquartile range. Although distributions of scores tended to be non-normal, this was done to increase interpretability. We also calculated percent scoring at the ceiling (highest possible score).
We analyzed the data with 3 research questions in mind: Was there a difference in perceptions of care coordination between (1) staff affiliated with the 2 different hospitals, (2) staff affiliated with different clinical departments, or (3) staff with different professional roles? For comparisons based on hospital and department, and type of professional, nonparametric tests (Wilcoxon rank-sum and Kruskal-Wallis test) were used with a level of statistical significance set at 0.05. The comparison between hospitals and departments was made only among nurses to minimize the confounding effect of different distribution of professionals. We tested the distribution of “years in specialty” between hospitals and departments for this comparison using Pearson’s χ2 test. The difference was not statistically significant (P = 0.167 for hospitals, and P = 0.518 for departments), so we assumed that the potential confounding effect of this variable was negligible in this analysis. The comparison of scores within each professional group used the Friedman test. Pearson’s χ2 test was used to compare the baseline characteristics between 2 hospitals.
RESULTS
Among the 1486 acute care professionals asked to participate in the survey, 841 completed the questionnaire (response rate 56.6%). Table 1 shows the characteristics of the participants from each hospital. Table 2 summarizes the item response rates, proportion scoring at the ceiling, and weighting from the factor analysis. All items had completion rates of 99.2% or higher, with N/A responses ranging from 0% (item 2) to 3.1% (item 7). The percent scoring at the ceiling was 1.7% for the global item and ranged from 18.3% up to 63.3% for other individual items.
We also examined differences in perceptions of care coordination among nursing units to illustrate the tool’s ability to detect variation in Patient Engagement subscale scores for JHH nurses (see Appendix).
DISCUSSION
This study resulted in one of the first measurement tools to succinctly measure multiple aspects of care coordination in the hospital from the perspective of healthcare professionals. Given the hectic work environment of healthcare professionals, and the increasing emphasis on collecting data for evaluation and improvement, it is important to minimize respondent burden. This effort was catalyzed by a multifaceted initiative to redesign acute care delivery and promote seamless transitions of care, supported by the Center for Medicare & Medicaid Innovation. In initial testing, this questionnaire has evidence for reliability and validity. It was encouraging to find that the preliminary psychometric performance of the measure was very similar in 2 different settings of a tertiary academic hospital and a community hospital.
Our analysis of the survey data explored potential differences between the 2 hospitals, among different types of healthcare professionals and across different departments. Although we expected differences, we had no specific hypotheses about what those differences might be, and, in fact, did not observe any substantial differences. This could be taken to indicate that the intervention was uniformly and successfully implemented in both hospitals, and engaged various professionals in different departments. The ability to detect differences in care coordination at the nursing unit level could also prove to be beneficial for more precisely targeting where process improvement is needed. Further data collection and analyses should be conducted to more systematically compare units and to help identify those where practice is most advanced and those where improvements may be needed. It would also be informative to link differences in care coordination scores with patient outcomes. In addition, differences identified on specific domains between professional groups could be helpful to identify where greater efforts are needed to improve interdisciplinary practice. Sampling strategies stratified by provider type would need to be targeted to make this kind of analysis informative.
The consistently lower scores observed for patient engagement, from the perspective of care professionals in all groups, suggest that this is an area where improvement is needed. These findings are consistent with published reports on the common failure by hospitals to include patients as a member of their own care team. In addition to measuring care processes from the perspective of frontline healthcare workers, future evaluations within the healthcare system would also benefit from including data collected from the perspective of the patient and family.
This study had some limitations. First, there may be more than 4 domains of care coordination that are important and can be measured in the acute care setting from provider perspective. However, the addition of more domains should be balanced against practicality and respondent burden. It may be possible to further clarify priority domains in hospital settings as opposed to the primary care setting. Future research should be directed to find these areas and to develop a more comprehensive, yet still concise measurement instrument. Second, the tool was developed to measure the impact of a large-scale intervention, and to fit into the specific context of 2 hospitals. Therefore, it should be tested in different settings of hospital care to see how it performs. However, virtually all hospitals in the United States today are adapting to changes in both financing and healthcare delivery. A tool such as the one described in this paper could be helpful to many organizations. Third, the scoring system for the overall scale score is not weighted and therefore reflects teamwork more than other components of care coordination, which are represented by fewer items. In general, we believe that use of the subscale scores may be more informative. Alternative scoring systems might also be proposed, including item weighting based on factor scores.
For the purposes of evaluation in this specific instance, we only collected data at a single point in time, after the intervention had been deployed. Thus, we were not able to evaluate the effectiveness of the J-CHiP intervention. We also did not intend to focus too much on the differences between units, given the limited number of respondents from individual units. It would be useful to collect more data at future time points, both to test the responsiveness of the scales and to evaluate the impact of future interventions at both the hospital and unit level.
The preliminary data from this study have generated insights about gaps in current practice, such as in engaging patients in the inpatient care process. It has also increased awareness by hospital leaders about the need to achieve high reliability in the adoption of new procedures and interdisciplinary practice. This tool might be used to find areas in need of improvement, to evaluate the effect of initiatives to improve care coordination, to monitor the change over time in the perception of care coordination among healthcare professionals, and to develop better intervention strategies for coordination activities in acute care settings. Additional research is needed to provide further evidence for the reliability and validity of this measure in diverse settings.
Disclosure
The project described was supported by Grant Number 1C1CMS331053-01-00 from the US Department of Health and Human Services, Centers for Medicare & Medicaid Services. The contents of this publication are solely the responsibility of the authors and do not necessarily represent the official views of the US Department of Health and Human Services or any of its agencies. The research presented was conducted by the awardee. Results may or may not be consistent with or confirmed by the findings of the independent evaluation contractor.
The authors have no other disclosures.
1. McDonald KM, Sundaram V, Bravata DM, et al. Closing the Quality Gap: A Critical Analysis of Quality Improvement Strategies (Vol. 7: Care Coordination). Technical Reviews, No. 9.7. Rockville (MD): Agency for Healthcare Research and Quality (US); 2007. PubMed
2. Adams K, Corrigan J. Priority areas for national action: transforming health care quality. Washington, DC: National Academies Press; 2003. PubMed
3. Renders CM, Valk GD, Griffin S, Wagner EH, Eijk JT, Assendelft WJ. Interventions to improve the management of diabetes mellitus in primary care, outpatient and community settings. Cochrane Database Syst Rev. 2001(1):CD001481. PubMed
4. McAlister FA, Lawson FM, Teo KK, Armstrong PW. A systematic review of randomized trials of disease management programs in heart failure. Am J Med. 2001;110(5):378-384. PubMed
5. Bruce ML, Raue PJ, Reilly CF, et al. Clinical effectiveness of integrating depression care management into medicare home health: the Depression CAREPATH Randomized trial. JAMA Intern Med. 2015;175(1):55-64. PubMed
6. Berkowitz SA, Brown P, Brotman DJ, et al. Case Study: Johns Hopkins Community Health Partnership: A model for transformation. Healthc (Amst). 2016;4(4):264-270. PubMed
7. McDonald. KM, Schultz. E, Albin. L, et al. Care Coordination Measures Atlas Version 4. Rockville, MD: Agency for Healthcare Research and Quality; 2014.
8 Schultz EM, Pineda N, Lonhart J, Davies SM, McDonald KM. A systematic review of the care coordination measurement landscape. BMC Health Serv Res. 2013;13:119. PubMed
9. Sexton JB, Helmreich RL, Neilands TB, et al. The Safety Attitudes Questionnaire: psychometric properties, benchmarking data, and emerging research. BMC Health Serv Res. 2006;6:44. PubMed
© 2017 Society of Hospital Medicine
Medicare Beneficiaries Likely Readmitted
For at least 25 years, approximately 20% of Medicare fee‐for‐service discharges have been followed by a hospital readmission within 30 days.[1, 2] Section 3025 of the Patient Protection and Affordable Care Act (ACA)[3] created escalating penalties for hospitals with higher than expected 30‐day readmission rates, and the Congressional Budget Office estimated this will reduce Medicare spending by over $7 billion between 2010 and 2019.[4]
Hospitals and physicians have begun developing strategies to identify which Medicare beneficiaries are most likely to be readmitted and use this information to design programs to reduce their readmission rate. Initially, penalties will be based on readmission rates after an index discharge with heart failure, myocardial infarction, and pneumonia.[5] Recently, the Centers for Medicare and Medicaid Services (CMS) released the Inpatient Prospective Payment System FY2014 proposed rule, which proposes to add 2 new readmission penalties beginning in FY2015: readmissions for hip/knee arthroplasty and chronic obstructive pulmonary disease.[6] Other countries are already penalizing hospitals with high readmission rates; for example, Germany is penalizing all readmissions that occur within a 30‐day period following admission.[7] In this brief report, we examine the characteristics of Medicare beneficiaries most likely to be readmitted within 30 days. We focus on readmission rates for all discharge conditions and all patient readmission rates, because we believe the language in the ACA ultimately points to an all‐inclusive approach.
METHODS
We used a nationally random 5% sample of all Medicare beneficiaries for the period between January 1, 2008 and September 30, 2008. To be included, beneficiaries must have both Part A and B coverage and live within the United States. Medicare Advantage patients were excluded because Medicare Advantage plans do not report the data in the same way as fee for service. We calculated the readmission rate as the number of admissions that were preceded by an at‐risk discharge within 30 days divided by the total number of at‐risk discharges. This definition included admissions to and discharges from sole community providers, Medicare‐dependent small rural hospitals, and critical access hospitals. We counted as at risk all live discharges from short‐term acute care hospitals that were not discharged against medical advice, discharged to a rehabilitation unit within an acute care hospital, or readmitted on day 0 (due to inconsistency with use of transfer coding). We only included discharges and readmissions to acute care hospitals and excluded hospitalizations in long‐term care facilities, rehabilitation facilities, skilled nursing homes, and other non‐acute care hospital facilities from being an index hospitalization. However, if the beneficiary was discharged to 1 of these facilities and then readmitted to an acute care hospital, the readmission was counted.
Each discharge was recorded as an independent event and we reset the readmission clock for a fresh 30‐day count each time the beneficiary was discharged. We examined the admission and readmission rate to determine if the rates varied by age, gender, reason for entitlement, racial characteristics, region of the country, number of chronic conditions, and whether the beneficiary is also enrolled in Medicaid (dual eligibles). We calculated the mean readmission rate for each diagnosis‐related group (DRG) and then used the probability of having a readmission for each DRG to calculate a case mix adjustment for each hospital. To calculate the chronic illness burden, we used a previously developed methodology for counting the number of chronic disease categories reported for the patient in the preceding year (2007).[8, 9] The classification system is maintained by the Agency for Health Care Research and Quality. We then used logistic regression to calculate the odds ratio of a discharge being readmitted based on these factors. We preformed statistical analysis using SAS version 9.1.3 (SAS Institute Inc., Cary, NC).
RESULTS
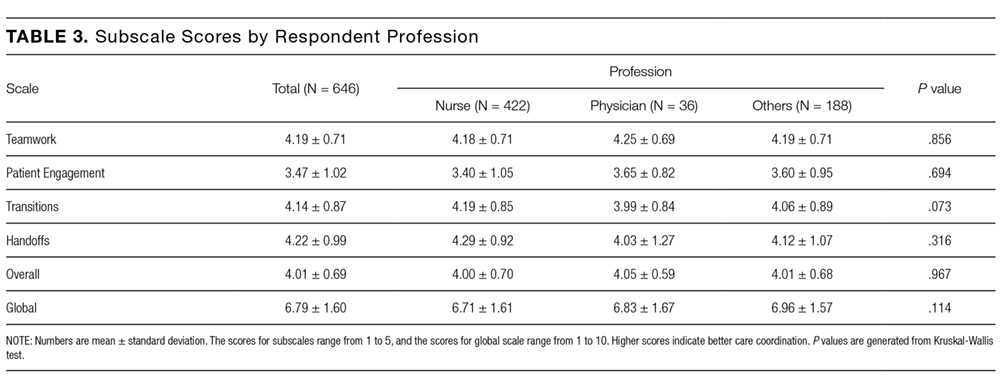
There were 434,999 hospital discharges that occurred in the first 9 months of 2008 in the 5% sample. There were 20.6% of Medicare beneficiaries hospitalized, and the overall readmission rate was 19.5%. Table 1 shows the odds ratios and 95% confidence intervals for the probability that a Medicare beneficiary will be readmitted within 30 days for variables including: age, sex, race, dual‐eligibility status, number of comorbid conditions, geographic region, and reason for entitlement. Of note, beneficiaries with 10 or more chronic conditions were more than 6 times more likely, and beneficiaries with 5 to 9 chronic conditions were more than 2.5 times more likely, to be readmitted than beneficiaries with 1 to 4 chronic conditions.
| Variable | Estimate | 95% Confidence Limits |
|---|---|---|
| ||
| Age 144 years | 1.634 | 1.5071.771 |
| Age 4564 years | 1.231 | 1.1421.327 |
| Age 7584 years | 1.048 | 1.0271.069 |
| Age 85+ years | 1.141 | 1.1151.168 |
| Age 6574 years | REF | |
| Male | 1.201 | 1.1831.220 |
| Black | 1.250 | 1.2211.280 |
| Other race | 1.071 | 1.0331.111 |
| White | REF | |
| Dual eligibles | 1.173 | 1.1511.195 |
| Northeast region | 1.146 | 1.1151.178 |
| Midwest region | 1.092 | 1.0631.122 |
| South region | 1.037 | 1.0111.063 |
| West region | REF | |
| 0 comorbidities | 0.255 | 0.1480.441 |
| 59 comorbidities | 2.533 | 2.4492.621 |
| 10+ comorbidities | 6.119 | 5.9136.332 |
| 14 comorbidities | REF | |
| Disabled | 0.817 | 0.7570.880 |
| ESRD | 1.327 | 1.2231.440 |
| Age >64 years | REF | |
DISCUSSION
The most interesting finding is that beneficiaries with 10 or more chronic conditions were more than 6 times more likely to be readmitted than beneficiaries with 1 to 4 chronic conditions. Beneficiaries with 10 or more chronic conditions represent only 8.9% of all Medicare beneficiaries (31.0% of all hospitalizations), but they were responsible for 50.2% of all readmissions. The 31.8% of beneficiaries with 5 to 9 chronic conditions (55.5% of all hospitalizations) had the second highest odds ratio (2.5) and were responsible for 45% of all readmissions. The 59.3% of beneficiaries with <5 comorbidities (13.6% of all hospitalizations) were associated with only 4.7% of all readmissions. This strongly suggests that hospitals focus their attention on beneficiaries with 10 or more comorbidities. These results were despite correction for DRG diagnosis in the model.
We recognize that the number of chronic conditions is a crude measure of health status because it weighs hundreds of different clinical conditions equally; however, it seems a good proxy for 3 closely allied concepts: (1) the overall burden of chronic illness carried by the patient, (2) the patient's level of engagement with the healthcare system (including number of unique providers), and (3) the number of conditions being treated. By providing a 1‐year window of a patient's health status, it is a more complete picture than any single hospital claim submission or indices based solely on hospital discharge data.
The other variables are less predictive of 30‐day readmissions. Beneficiaries over 85 years old are only 14% more likely, whereas disabled Medicare beneficiaries <44 years old are 63% more likely to be readmitted than beneficiaries between 65 and 74 years old. Men are 20% more likely to be readmitted than women. Black race and dual‐eligibility slightly increase rates of readmission. Beneficiaries located in the West have the lowest readmission rates. In comparison to those who are aged, those with end‐stage renal disease (ESRD) have a higher rate of readmission, and those with a disability have a lower rate of readmission. In considering the age and reason for entitlement findings, one would assume that ESRD was the driver of higher readmission rates in the younger Medicare population.
CMS will need to analyze which hospitals have higher than expected readmission rates, and this will require risk adjustment at each hospital. In addition to the number of chronic conditions and other variables shown in Table 1, other factors CMS might want to include when it starts doing readmissions for all discharges is the discharge diagnosis (because our results suggest there are significant differences in the probability of a readmission across DRGs). In addition, CMS will need to consider how to capture additional data not currently in the claims data, such as social factors like homelessness.
We recognize significant limitations to these findings. First, this analysis uses only information that is available from Medicare claims and administrative data. Claims give almost no information on how well the hospital planned the discharge, instructed the patient and family, or engaged follow‐up providers. Also, claims data tell us virtually nothing about a patient's health literacy or social situation. Second, the analysis relies on claims data, but this has little clinical detail. Third, these data are limited to persons enrolled in fee‐for‐service Medicare. Fourth, we included all readmissions, including some readmissions (such as chemotherapy and staged percutaneous coronary interventions) that were part of a planned treatment protocol.[10] Fifth, we were unable to distinguish same‐day readmissions versus transfers, and therefore excluded all same‐day readmissions from measurement.
As hospitals and physicians begin to plan for the regulations that will penalize hospitals with high readmission rates, they will need to strongly consider targeting beneficiaries with more than 10 chronic conditions.
Acknowledgments
The Commonwealth Fund provided a grant to Dr. Anderson to help support this work. The authors report no conflicts of interest.
- , . Hospital readmissions in the Medicare population. N Engl J Med. 1984;311:1349–1353.
- , , . Rehospitalizations among patients in the Medicare fee‐for‐service program. N Engl J Med. 2009;360:1418–1428.
- Patient Protection and Affordable Care Act. Section 3025. Available at: http://www.gpo.gov/fdsys/pkg/PLAW‐111publ148/pdf/PLAW‐111publ148.pdf. Accessed April 8, 2013.
- Congressional Budget Office.Patient Protection and Affordable Care Act. Available at: http://www.cbo.gov/doc.cfm?index=10868. Accessed April 8, 2013.
- , , , et al.2012 measures maintenance technical report: acute myocardial infarction, heart failure, and pneumonia 30‐day risk‐standardized readmission measures. Available at: http://www.qualitynet.org/dcs/ContentServer?c=Page78:27597–27599.
- , , , , . Hospital payment based on diagnosis‐related groups differs in Europe and holds lessons for the United States. Health Aff (Millwood). 2013;32:713–723.
- , , , . Out‐of‐pocket medical spending for care of chronic conditions. Health Aff (Millwood). 2001;20:267–278.
- MEPS data documentation HC‐006: 1996 medical conditions. Pub. no. 99‐DP06. Rockville, MD: AHRQ; 1999.
- , . Planned readmissions: a potential solution. Arch Intern Med. 2012;172:269–270.
For at least 25 years, approximately 20% of Medicare fee‐for‐service discharges have been followed by a hospital readmission within 30 days.[1, 2] Section 3025 of the Patient Protection and Affordable Care Act (ACA)[3] created escalating penalties for hospitals with higher than expected 30‐day readmission rates, and the Congressional Budget Office estimated this will reduce Medicare spending by over $7 billion between 2010 and 2019.[4]
Hospitals and physicians have begun developing strategies to identify which Medicare beneficiaries are most likely to be readmitted and use this information to design programs to reduce their readmission rate. Initially, penalties will be based on readmission rates after an index discharge with heart failure, myocardial infarction, and pneumonia.[5] Recently, the Centers for Medicare and Medicaid Services (CMS) released the Inpatient Prospective Payment System FY2014 proposed rule, which proposes to add 2 new readmission penalties beginning in FY2015: readmissions for hip/knee arthroplasty and chronic obstructive pulmonary disease.[6] Other countries are already penalizing hospitals with high readmission rates; for example, Germany is penalizing all readmissions that occur within a 30‐day period following admission.[7] In this brief report, we examine the characteristics of Medicare beneficiaries most likely to be readmitted within 30 days. We focus on readmission rates for all discharge conditions and all patient readmission rates, because we believe the language in the ACA ultimately points to an all‐inclusive approach.
METHODS
We used a nationally random 5% sample of all Medicare beneficiaries for the period between January 1, 2008 and September 30, 2008. To be included, beneficiaries must have both Part A and B coverage and live within the United States. Medicare Advantage patients were excluded because Medicare Advantage plans do not report the data in the same way as fee for service. We calculated the readmission rate as the number of admissions that were preceded by an at‐risk discharge within 30 days divided by the total number of at‐risk discharges. This definition included admissions to and discharges from sole community providers, Medicare‐dependent small rural hospitals, and critical access hospitals. We counted as at risk all live discharges from short‐term acute care hospitals that were not discharged against medical advice, discharged to a rehabilitation unit within an acute care hospital, or readmitted on day 0 (due to inconsistency with use of transfer coding). We only included discharges and readmissions to acute care hospitals and excluded hospitalizations in long‐term care facilities, rehabilitation facilities, skilled nursing homes, and other non‐acute care hospital facilities from being an index hospitalization. However, if the beneficiary was discharged to 1 of these facilities and then readmitted to an acute care hospital, the readmission was counted.
Each discharge was recorded as an independent event and we reset the readmission clock for a fresh 30‐day count each time the beneficiary was discharged. We examined the admission and readmission rate to determine if the rates varied by age, gender, reason for entitlement, racial characteristics, region of the country, number of chronic conditions, and whether the beneficiary is also enrolled in Medicaid (dual eligibles). We calculated the mean readmission rate for each diagnosis‐related group (DRG) and then used the probability of having a readmission for each DRG to calculate a case mix adjustment for each hospital. To calculate the chronic illness burden, we used a previously developed methodology for counting the number of chronic disease categories reported for the patient in the preceding year (2007).[8, 9] The classification system is maintained by the Agency for Health Care Research and Quality. We then used logistic regression to calculate the odds ratio of a discharge being readmitted based on these factors. We preformed statistical analysis using SAS version 9.1.3 (SAS Institute Inc., Cary, NC).
RESULTS
There were 434,999 hospital discharges that occurred in the first 9 months of 2008 in the 5% sample. There were 20.6% of Medicare beneficiaries hospitalized, and the overall readmission rate was 19.5%. Table 1 shows the odds ratios and 95% confidence intervals for the probability that a Medicare beneficiary will be readmitted within 30 days for variables including: age, sex, race, dual‐eligibility status, number of comorbid conditions, geographic region, and reason for entitlement. Of note, beneficiaries with 10 or more chronic conditions were more than 6 times more likely, and beneficiaries with 5 to 9 chronic conditions were more than 2.5 times more likely, to be readmitted than beneficiaries with 1 to 4 chronic conditions.
| Variable | Estimate | 95% Confidence Limits |
|---|---|---|
| ||
| Age 144 years | 1.634 | 1.5071.771 |
| Age 4564 years | 1.231 | 1.1421.327 |
| Age 7584 years | 1.048 | 1.0271.069 |
| Age 85+ years | 1.141 | 1.1151.168 |
| Age 6574 years | REF | |
| Male | 1.201 | 1.1831.220 |
| Black | 1.250 | 1.2211.280 |
| Other race | 1.071 | 1.0331.111 |
| White | REF | |
| Dual eligibles | 1.173 | 1.1511.195 |
| Northeast region | 1.146 | 1.1151.178 |
| Midwest region | 1.092 | 1.0631.122 |
| South region | 1.037 | 1.0111.063 |
| West region | REF | |
| 0 comorbidities | 0.255 | 0.1480.441 |
| 59 comorbidities | 2.533 | 2.4492.621 |
| 10+ comorbidities | 6.119 | 5.9136.332 |
| 14 comorbidities | REF | |
| Disabled | 0.817 | 0.7570.880 |
| ESRD | 1.327 | 1.2231.440 |
| Age >64 years | REF | |
DISCUSSION
The most interesting finding is that beneficiaries with 10 or more chronic conditions were more than 6 times more likely to be readmitted than beneficiaries with 1 to 4 chronic conditions. Beneficiaries with 10 or more chronic conditions represent only 8.9% of all Medicare beneficiaries (31.0% of all hospitalizations), but they were responsible for 50.2% of all readmissions. The 31.8% of beneficiaries with 5 to 9 chronic conditions (55.5% of all hospitalizations) had the second highest odds ratio (2.5) and were responsible for 45% of all readmissions. The 59.3% of beneficiaries with <5 comorbidities (13.6% of all hospitalizations) were associated with only 4.7% of all readmissions. This strongly suggests that hospitals focus their attention on beneficiaries with 10 or more comorbidities. These results were despite correction for DRG diagnosis in the model.
We recognize that the number of chronic conditions is a crude measure of health status because it weighs hundreds of different clinical conditions equally; however, it seems a good proxy for 3 closely allied concepts: (1) the overall burden of chronic illness carried by the patient, (2) the patient's level of engagement with the healthcare system (including number of unique providers), and (3) the number of conditions being treated. By providing a 1‐year window of a patient's health status, it is a more complete picture than any single hospital claim submission or indices based solely on hospital discharge data.
The other variables are less predictive of 30‐day readmissions. Beneficiaries over 85 years old are only 14% more likely, whereas disabled Medicare beneficiaries <44 years old are 63% more likely to be readmitted than beneficiaries between 65 and 74 years old. Men are 20% more likely to be readmitted than women. Black race and dual‐eligibility slightly increase rates of readmission. Beneficiaries located in the West have the lowest readmission rates. In comparison to those who are aged, those with end‐stage renal disease (ESRD) have a higher rate of readmission, and those with a disability have a lower rate of readmission. In considering the age and reason for entitlement findings, one would assume that ESRD was the driver of higher readmission rates in the younger Medicare population.
CMS will need to analyze which hospitals have higher than expected readmission rates, and this will require risk adjustment at each hospital. In addition to the number of chronic conditions and other variables shown in Table 1, other factors CMS might want to include when it starts doing readmissions for all discharges is the discharge diagnosis (because our results suggest there are significant differences in the probability of a readmission across DRGs). In addition, CMS will need to consider how to capture additional data not currently in the claims data, such as social factors like homelessness.
We recognize significant limitations to these findings. First, this analysis uses only information that is available from Medicare claims and administrative data. Claims give almost no information on how well the hospital planned the discharge, instructed the patient and family, or engaged follow‐up providers. Also, claims data tell us virtually nothing about a patient's health literacy or social situation. Second, the analysis relies on claims data, but this has little clinical detail. Third, these data are limited to persons enrolled in fee‐for‐service Medicare. Fourth, we included all readmissions, including some readmissions (such as chemotherapy and staged percutaneous coronary interventions) that were part of a planned treatment protocol.[10] Fifth, we were unable to distinguish same‐day readmissions versus transfers, and therefore excluded all same‐day readmissions from measurement.
As hospitals and physicians begin to plan for the regulations that will penalize hospitals with high readmission rates, they will need to strongly consider targeting beneficiaries with more than 10 chronic conditions.
Acknowledgments
The Commonwealth Fund provided a grant to Dr. Anderson to help support this work. The authors report no conflicts of interest.
- , . Hospital readmissions in the Medicare population. N Engl J Med. 1984;311:1349–1353.
- , , . Rehospitalizations among patients in the Medicare fee‐for‐service program. N Engl J Med. 2009;360:1418–1428.
- Patient Protection and Affordable Care Act. Section 3025. Available at: http://www.gpo.gov/fdsys/pkg/PLAW‐111publ148/pdf/PLAW‐111publ148.pdf. Accessed April 8, 2013.
- Congressional Budget Office.Patient Protection and Affordable Care Act. Available at: http://www.cbo.gov/doc.cfm?index=10868. Accessed April 8, 2013.
- , , , et al.2012 measures maintenance technical report: acute myocardial infarction, heart failure, and pneumonia 30‐day risk‐standardized readmission measures. Available at: http://www.qualitynet.org/dcs/ContentServer?c=Page78:27597–27599.
- , , , , . Hospital payment based on diagnosis‐related groups differs in Europe and holds lessons for the United States. Health Aff (Millwood). 2013;32:713–723.
- , , , . Out‐of‐pocket medical spending for care of chronic conditions. Health Aff (Millwood). 2001;20:267–278.
- MEPS data documentation HC‐006: 1996 medical conditions. Pub. no. 99‐DP06. Rockville, MD: AHRQ; 1999.
- , . Planned readmissions: a potential solution. Arch Intern Med. 2012;172:269–270.