User login
The Authors Reply, “The Weekend Effect in Hospitalized Patients”
We would like to thank Drs. Flansbaum and Sheehy for their interest in our article.1 We appreciate their mentioning the highly publicized disputes and additional manuscripts2,3 that were published after our literature review, which was conducted in 2013
Despite the uncertainty surrounding the exact composition and contributions of various elements to the weekend effect, it does appear to be a real phenomenon, as noted by the editorialists.4 We hope that our manuscript encourages future investigators to help elucidate the nature of the input contributing to the weekend effect.
1. Pauls LA, Johnson-Paben R, McGready J, Murphy JD, Pronovost PJ, Wu CL. The weekend effect in hospitalized patients: A meta-analysis. J Hosp Med. 2017;12(9):760-766. PubMed
2. Freemantle N, Ray D, McNulty D, et al. Increased mortality associated with weekend hospital admission: a case for expanded seven day service? BMJ. 2015;351:h4596. PubMed
3. Walker AS, Mason A, Phoung Quan TP, et al. Mortality risks associated with emergency admissions during weekends and public holidays: An analysis of electronic health records. Lancet. 2017;390(10089):62-72. PubMed
4. Quinn KL, Bell CM. Does the week-end justify the means? J Hosp Med. 2017;12(9):779-780. PubMed
We would like to thank Drs. Flansbaum and Sheehy for their interest in our article.1 We appreciate their mentioning the highly publicized disputes and additional manuscripts2,3 that were published after our literature review, which was conducted in 2013
Despite the uncertainty surrounding the exact composition and contributions of various elements to the weekend effect, it does appear to be a real phenomenon, as noted by the editorialists.4 We hope that our manuscript encourages future investigators to help elucidate the nature of the input contributing to the weekend effect.
1. Pauls LA, Johnson-Paben R, McGready J, Murphy JD, Pronovost PJ, Wu CL. The weekend effect in hospitalized patients: A meta-analysis. J Hosp Med. 2017;12(9):760-766. PubMed
2. Freemantle N, Ray D, McNulty D, et al. Increased mortality associated with weekend hospital admission: a case for expanded seven day service? BMJ. 2015;351:h4596. PubMed
3. Walker AS, Mason A, Phoung Quan TP, et al. Mortality risks associated with emergency admissions during weekends and public holidays: An analysis of electronic health records. Lancet. 2017;390(10089):62-72. PubMed
4. Quinn KL, Bell CM. Does the week-end justify the means? J Hosp Med. 2017;12(9):779-780. PubMed
© 2018 Society of Hospital Medicine
Reconsidering Hospital Readmission Measures
Hospital readmission rates are a consequential and contentious measure of hospital quality. Readmissions within 30 days of hospital discharge are part of the Centers for Medicare & Medicaid Services (CMS) Value-Based Purchasing Program and are publicly reported. Hospital-wide readmissions and condition-specific readmissions are heavily weighted by US News & World Report in its hospital rankings and in the new CMS Five-Star Quality Rating System.1 However, clinicians and researchers question the construct validity of current readmission measures.2,3
The focus on readmissions began in 2009 when Jencks et al.4 reported that 20% of Medicare patients were readmitted within 30 days after hospital discharge. Policy makers embraced readmission reduction, assuming that a hospital readmission so soon after discharge reflected poor quality of hospital care and that, with focused efforts, hospitals could reduce readmissions and save CMS money. In 2010, the Affordable Care Act introduced an initiative to reduce readmissions and, in 2012, the Hospital Readmission Reduction Program was implemented, financially penalizing hospitals with higher-than-expected readmission rates for patients hospitalized with principal diagnoses of heart failure, myocardial infarction, and pneumonia.5 Readmission measures have since proliferated and now include pay-for-performance metrics for hospitalizations for chronic obstructive pulmonary disease (COPD), coronary artery bypass grafting, and total hip or knee arthroplasty. Measures are also reported for stroke patients and for “hospital-wide readmissions,” a catch-all measure intended to capture readmission rates across most diagnoses, with various exclusions intended to prevent counting planned readmissions (eg, hospitalization for cholecystectomy following a hospitalization for cholecystitis). These measures use claims data to construct hierarchical regression models at the patient and hospital levels, assuming that variation among readmission rates are due to hospital quality effects. The goal of this approach is to level the playing field to avoid penalizing hospitals for caring for sicker patients who are at higher risk for readmission for reasons unrelated to hospital care. Yet hospital readmissions are influenced by a complex set of variables that go well beyond hospital care, some of which may be better captured by existing models than others. Below we review several potential biases in the hospital readmission measures and offer policy recommendations to improve the accuracy of these measures.
Variation in a quality measure is influenced by the quality of the underlying data, the mix of patients served, bias in the performance measure, and the degree of systemic or random error.6 Hospital readmission rates are subject to multiple sources of variation, and true differences in the quality of care are often a much smaller source of this variation. A recent analysis of patient readmissions following general surgery found that the majority were unrelated to suboptimal medical care.7 Consider 3 scenarios in which a patient with COPD is readmitted 22 days after discharge. In hospital 1, the patient was discharged without a prescription for a steroid inhaler. In hospital 2, the patient was discharged on a steroid inhaler, filled the prescription, and elected not to use it. In hospital 3, the patient was discharged on a steroid inhaler and was provided medical assistance to fill the prescription but still could not afford the $15 copay. In all 3 scenarios, the hospital would be equally culpable under the current readmission measures, suffering financial and reputational penalties.
Yet the hospitals in these scenarios are not equally culpable. Variation in the mix of patients and bias in the measure impacted performance. Hospital 1 should clearly be held accountable for the readmission. In the cases of hospitals 2 and 3, the situations are more nuanced. More education about COPD, financial investment by the hospital to cover a copay, or a different transitional care approach may have increased the likelihood of patient compliance, but, ultimately, hospitals 2 and 3 were impacted by personal health behaviors and access to public health services and financial assistance, and the readmissions were less within their control.8
To be valid, hospital readmission measures would need to ensure that all hospitals are similar in patient characteristics and in the need for an availability of public health services. Yet these factors vary among hospitals and cannot be accounted for by models that rely exclusively on patient-level variables, such as the nature and severity of illness. As a result, the existing readmission measures are biased against certain types of hospitals. Hospitals that treat a greater proportion of patients who are socioeconomically disadvantaged; who lack access to primary care, medical assistance, or public health programs; and who have substance abuse and mental health issues will have higher readmission rates. Hospitals that care for patients who fail initial treatments and require referral for complex care will also have higher readmission rates. These types of patients are not randomly distributed throughout our healthcare system. They are clustered at rural hospitals in underserved areas, certain urban health systems, safety net hospitals, and academic health centers. It is not surprising that readmission penalties have most severely impacted large academic hospitals that care for disadvantaged populations.2 These penalties may have unintended consequences, reducing a hospital’s willingness to care for disadvantaged populations.
While these biases may unfairly harm hospitals caring for disadvantaged patients, the readmission measures may also indirectly harm patients. Low hospital readmission rates are not associated with reduced mortality and, in some instances, track with higher mortality.9-11 This may result from measurement factors (patients who die cannot be readmitted), from neighborhood socioeconomic status (SES) factors that may impact readmissions more,12 or from actual patient harm (some patients need acute care following discharge and may have worse outcomes if that care is delayed).11 Doctors have long recognized this potential risk; empiric evidence now supports them. While mortality measures may also be impacted by sociodemographic variables,13 whether to adjust for SES should be defined by the purpose of the measure. If the measure is meant to evaluate hospital quality (or utilization in the case of readmissions), adjusting for SES is appropriate because it is unrealistic to expect a health system to reduce income inequality and provide safe housing. Failure to adjust for SES, which has a large impact on outcomes, may mask a quality of care issue. Conversely, if the purpose of a measure is for a community to improve population health, then it should not be adjusted for SES because the community could adjust for income inequality.
Despite the complex ethical challenges created by the efforts to reduce readmissions, there has been virtually no public dialogue with patients, physicians, and policy makers regarding how to balance the trade-offs between reducing readmission and maintaining safety. Patients would likely value increased survival more than reduced readmissions, yet the current CMS Five-Star Rating System for hospital quality weighs readmissions equally with mortality in its hospital rankings, potentially misinforming patients. For example, many well-known academic medical centers score well (4 or 5 stars) on mortality and poorly (1 or 2 stars) on readmissions, resulting in a low or average overall score, calling into question face validity and confounding consumers struggling to make decisions about where to seek care. The Medicare Payment Advisory Commission’s Report to the Congress14 highlights the multiple significant systematic and random errors with the hospital readmission data.
Revisiting the Hospital Readmission Measures
Given significant bias in the hospital readmission measures and the ethical challenges imposed by reducing readmissions, potentially at the expense of survival, we believe CMS needs to take action to remedy the problem. First, CMS should drop hospital readmissions as a quality measure from its hospital rankings. Other hospital-rating groups and insurers should do the same. When included in payment schemes, readmissions should not be construed as a quality measure but as a utilization measure, like length of stay.
Second, the Department of Health & Human Services (HHS) should invest in maturing the hospital readmission measures to ensure construct, content, and criterion validity and reliability. No doubt the risk adjustment is complex and may be inherently limited using Medicare claims data. In the case of SES adjustment, for example, limited numbers of SES measures can be constructed from current data sources.8,13 There are other approaches to address this recommendation. For example, HHS could define a preventable readmission as one linked to some process or outcome of hospital care, such as whether the patient was discharged on an inhaler. The National Quality Forum used this approach to define a preventable venous thromboembolic event as one occurring when a patient did not receive appropriate prophylaxis. In this way, only hospital 1 in the 3 scenarios for the patient with COPD would be penalized. However, we recognize that it is not always simple to define specific process measures (eg, prescribing an inhaler) that link to readmission outcomes and that there may be other important yet hard-to-measure interventions (eg, patient and family education) that are important components of patient-centered care and readmission prevention. This is why readmissions are so challenging as a quality measure. If experts cannot define clinician behaviors that have a strong theory of change or are causally related to reduced readmissions, it is hard to call readmissions a modifiable quality measure. Another potential strategy to level the playing field would be to compare readmission rates across peer institutions only. For instance, tertiary-care safety net hospitals would be compared to one another and rural community hospitals would be compared to one another.14 Lastly, new data sources could be added to account for the social, community-level, public health, and personal health factors that heavily influence a patient’s risk for readmission, in addition to hospital-level factors. Appropriate methods will be needed to develop statistical models for risk adjustment; however, this is a complex topic and beyond the scope of the current paper.
Third, HHS could continue to use the current readmission measures as population health measures while supporting multistakeholder teams to better understand how people and their communities, public health agencies, insurers, and healthcare providers can collaborate to help patients thrive and avoid readmissions by addressing true defects in care and care coordination.
While it is understandable why policy makers chose to focus on hospital readmissions, and while we recognize that concerns about the measures were unknown when they were created, emerging evidence demonstrates that the current readmission measures (particularly when used as a quality metric) lack construct validity, contain significant bias and systematic errors, and create ethical tension by rewarding hospitals both financially and reputationally for turning away sick and socially disadvantaged patients who may, consequently, have adverse outcomes. Current readmission measures need to be reconsidered.
Acknowledgments
The authors thank Christine G. Holzmueller, BLA, with the Armstrong Institute for Patient Safety and Quality, Johns Hopkins Medicine, for her assistance in editing the manuscript and preparing it for journal submission.
Disclosure
Dr. Pronovost errs on the side of full disclosure and reports receiving grant or contract support from the Agency for Healthcare Research and Quality, the Gordon and Betty Moore Foundation (research related to patient safety and quality of care), the National Institutes of Health (acute lung injury research), and the American Medical Association Inc. (improve blood pressure control); honoraria from various healthcare organizations for speaking on patient safety and quality (the Leigh Bureau manages engagements); book royalties from the Penguin Group for his book Safe Patients, Smart Hospitals; and was receiving stock and fees to serve as a director for Cantel Medical up until 24 months ago. Dr. Pronovost is a founder of Patient Doctor Technologies, a startup company that seeks to enhance the partnership between patients and clinicians with an application called Doctella. Dr. Brotman, Dr. Hoyer, and Ms. Deutschendorf report no relevant conflicts of interest.
1. Centers for Medicare & Medicaid Services. Five-star quality rating system. https://www.cms.gov/medicare/provider-enrollment-and-certification/certificationandcomplianc/fsqrs.html. Accessed October 11, 2016.
2. Joynt KE, Jha AK. Characteristics of hospitals receiving penalties under the Hospital Readmissions Reduction Program. JAMA. 2013;309(4):342-343. PubMed
3. Boozary AS, Manchin J, 3rd, Wicker RF. The Medicare Hospital Readmissions Reduction Program: time for reform. JAMA. 2015;314(4):347-348. PubMed
4. Jencks SF, Williams MV, Coleman EA. Rehospitalizations among patients in the Medicare fee-for-service program. N Engl J Med. 2009;360(14):1418-1428. PubMed
5. Centers for Medicare & Medicaid Services. Readmissions Reduction Program (HRRP). https://www.cms.gov/medicare/medicare-fee-for-service-payment/acuteinpatientpps/readmissions-reduction-program.html. Accessed April 12, 2017.
6. Parker C, Schwamm LH, Fonarow GC, Smith EE, Reeves MJ. Stroke quality metrics: systematic reviews of the relationships to patient-centered outcomes and impact of public reporting. Stroke. 2012;43(1):155-162. PubMed
7. McIntyre LK, Arbabi S, Robinson EF, Maier RV. Analysis of risk factors for patient readmission 30 days following discharge from general surgery. JAMA Surg. 2016;151(9):855-861. PubMed
8. Sheingold SH, Zuckerman R, Shartzer A. Understanding Medicare hospital readmission rates and differing penalties between safety-net and other hospitals. Health Aff (Millwood). 2016;35(1):124-131. PubMed
9. Brotman DJ, Hoyer EH, Leung C, Lepley D, Deutschendorf A. Associations between hospital-wide readmission rates and mortality measures at the hospital level: are hospital-wide readmissions a measure of quality? J Hosp Med. 2016;11(9):650-651. PubMed
10. Krumholz HM, Lin Z, Keenan PS, et al. Relationship between hospital readmission and mortality rates for patients hospitalized with acute myocardial infarction, heart failure, or pneumonia. JAMA. 2013;309(6):587-593. PubMed
11. Fan VS, Gaziano JM, Lew R, et al. A comprehensive care management program to prevent chronic obstructive pulmonary disease hospitalizations: a randomized, controlled trial. Ann Intern Med. 2012;156(10):673-683. PubMed
12. Bikdeli B, Wayda B, Bao H, et al. Place of residence and outcomes of patients with heart failure: analysis from the Telemonitoring to Improve Heart Failure Outcomes Trial. Circ Cardiovasc Qual Outcomes. 2014;7(5):749-756. PubMed
13. Bernheim SM, Parzynski CS, Horwitz L, et al. Accounting for patients’ socioeconomic status does not change hospital readmission rates. Health Aff (Millwood). 2016;35(8):1461-1470. PubMed
14. Medicare Payment Advisory Commission. Refining the Hospital Readmissions Reduction Program. In: Report to the Congress: Medicare and the Health Care Delivery System, Chapter 4. June 2013. PubMed
Hospital readmission rates are a consequential and contentious measure of hospital quality. Readmissions within 30 days of hospital discharge are part of the Centers for Medicare & Medicaid Services (CMS) Value-Based Purchasing Program and are publicly reported. Hospital-wide readmissions and condition-specific readmissions are heavily weighted by US News & World Report in its hospital rankings and in the new CMS Five-Star Quality Rating System.1 However, clinicians and researchers question the construct validity of current readmission measures.2,3
The focus on readmissions began in 2009 when Jencks et al.4 reported that 20% of Medicare patients were readmitted within 30 days after hospital discharge. Policy makers embraced readmission reduction, assuming that a hospital readmission so soon after discharge reflected poor quality of hospital care and that, with focused efforts, hospitals could reduce readmissions and save CMS money. In 2010, the Affordable Care Act introduced an initiative to reduce readmissions and, in 2012, the Hospital Readmission Reduction Program was implemented, financially penalizing hospitals with higher-than-expected readmission rates for patients hospitalized with principal diagnoses of heart failure, myocardial infarction, and pneumonia.5 Readmission measures have since proliferated and now include pay-for-performance metrics for hospitalizations for chronic obstructive pulmonary disease (COPD), coronary artery bypass grafting, and total hip or knee arthroplasty. Measures are also reported for stroke patients and for “hospital-wide readmissions,” a catch-all measure intended to capture readmission rates across most diagnoses, with various exclusions intended to prevent counting planned readmissions (eg, hospitalization for cholecystectomy following a hospitalization for cholecystitis). These measures use claims data to construct hierarchical regression models at the patient and hospital levels, assuming that variation among readmission rates are due to hospital quality effects. The goal of this approach is to level the playing field to avoid penalizing hospitals for caring for sicker patients who are at higher risk for readmission for reasons unrelated to hospital care. Yet hospital readmissions are influenced by a complex set of variables that go well beyond hospital care, some of which may be better captured by existing models than others. Below we review several potential biases in the hospital readmission measures and offer policy recommendations to improve the accuracy of these measures.
Variation in a quality measure is influenced by the quality of the underlying data, the mix of patients served, bias in the performance measure, and the degree of systemic or random error.6 Hospital readmission rates are subject to multiple sources of variation, and true differences in the quality of care are often a much smaller source of this variation. A recent analysis of patient readmissions following general surgery found that the majority were unrelated to suboptimal medical care.7 Consider 3 scenarios in which a patient with COPD is readmitted 22 days after discharge. In hospital 1, the patient was discharged without a prescription for a steroid inhaler. In hospital 2, the patient was discharged on a steroid inhaler, filled the prescription, and elected not to use it. In hospital 3, the patient was discharged on a steroid inhaler and was provided medical assistance to fill the prescription but still could not afford the $15 copay. In all 3 scenarios, the hospital would be equally culpable under the current readmission measures, suffering financial and reputational penalties.
Yet the hospitals in these scenarios are not equally culpable. Variation in the mix of patients and bias in the measure impacted performance. Hospital 1 should clearly be held accountable for the readmission. In the cases of hospitals 2 and 3, the situations are more nuanced. More education about COPD, financial investment by the hospital to cover a copay, or a different transitional care approach may have increased the likelihood of patient compliance, but, ultimately, hospitals 2 and 3 were impacted by personal health behaviors and access to public health services and financial assistance, and the readmissions were less within their control.8
To be valid, hospital readmission measures would need to ensure that all hospitals are similar in patient characteristics and in the need for an availability of public health services. Yet these factors vary among hospitals and cannot be accounted for by models that rely exclusively on patient-level variables, such as the nature and severity of illness. As a result, the existing readmission measures are biased against certain types of hospitals. Hospitals that treat a greater proportion of patients who are socioeconomically disadvantaged; who lack access to primary care, medical assistance, or public health programs; and who have substance abuse and mental health issues will have higher readmission rates. Hospitals that care for patients who fail initial treatments and require referral for complex care will also have higher readmission rates. These types of patients are not randomly distributed throughout our healthcare system. They are clustered at rural hospitals in underserved areas, certain urban health systems, safety net hospitals, and academic health centers. It is not surprising that readmission penalties have most severely impacted large academic hospitals that care for disadvantaged populations.2 These penalties may have unintended consequences, reducing a hospital’s willingness to care for disadvantaged populations.
While these biases may unfairly harm hospitals caring for disadvantaged patients, the readmission measures may also indirectly harm patients. Low hospital readmission rates are not associated with reduced mortality and, in some instances, track with higher mortality.9-11 This may result from measurement factors (patients who die cannot be readmitted), from neighborhood socioeconomic status (SES) factors that may impact readmissions more,12 or from actual patient harm (some patients need acute care following discharge and may have worse outcomes if that care is delayed).11 Doctors have long recognized this potential risk; empiric evidence now supports them. While mortality measures may also be impacted by sociodemographic variables,13 whether to adjust for SES should be defined by the purpose of the measure. If the measure is meant to evaluate hospital quality (or utilization in the case of readmissions), adjusting for SES is appropriate because it is unrealistic to expect a health system to reduce income inequality and provide safe housing. Failure to adjust for SES, which has a large impact on outcomes, may mask a quality of care issue. Conversely, if the purpose of a measure is for a community to improve population health, then it should not be adjusted for SES because the community could adjust for income inequality.
Despite the complex ethical challenges created by the efforts to reduce readmissions, there has been virtually no public dialogue with patients, physicians, and policy makers regarding how to balance the trade-offs between reducing readmission and maintaining safety. Patients would likely value increased survival more than reduced readmissions, yet the current CMS Five-Star Rating System for hospital quality weighs readmissions equally with mortality in its hospital rankings, potentially misinforming patients. For example, many well-known academic medical centers score well (4 or 5 stars) on mortality and poorly (1 or 2 stars) on readmissions, resulting in a low or average overall score, calling into question face validity and confounding consumers struggling to make decisions about where to seek care. The Medicare Payment Advisory Commission’s Report to the Congress14 highlights the multiple significant systematic and random errors with the hospital readmission data.
Revisiting the Hospital Readmission Measures
Given significant bias in the hospital readmission measures and the ethical challenges imposed by reducing readmissions, potentially at the expense of survival, we believe CMS needs to take action to remedy the problem. First, CMS should drop hospital readmissions as a quality measure from its hospital rankings. Other hospital-rating groups and insurers should do the same. When included in payment schemes, readmissions should not be construed as a quality measure but as a utilization measure, like length of stay.
Second, the Department of Health & Human Services (HHS) should invest in maturing the hospital readmission measures to ensure construct, content, and criterion validity and reliability. No doubt the risk adjustment is complex and may be inherently limited using Medicare claims data. In the case of SES adjustment, for example, limited numbers of SES measures can be constructed from current data sources.8,13 There are other approaches to address this recommendation. For example, HHS could define a preventable readmission as one linked to some process or outcome of hospital care, such as whether the patient was discharged on an inhaler. The National Quality Forum used this approach to define a preventable venous thromboembolic event as one occurring when a patient did not receive appropriate prophylaxis. In this way, only hospital 1 in the 3 scenarios for the patient with COPD would be penalized. However, we recognize that it is not always simple to define specific process measures (eg, prescribing an inhaler) that link to readmission outcomes and that there may be other important yet hard-to-measure interventions (eg, patient and family education) that are important components of patient-centered care and readmission prevention. This is why readmissions are so challenging as a quality measure. If experts cannot define clinician behaviors that have a strong theory of change or are causally related to reduced readmissions, it is hard to call readmissions a modifiable quality measure. Another potential strategy to level the playing field would be to compare readmission rates across peer institutions only. For instance, tertiary-care safety net hospitals would be compared to one another and rural community hospitals would be compared to one another.14 Lastly, new data sources could be added to account for the social, community-level, public health, and personal health factors that heavily influence a patient’s risk for readmission, in addition to hospital-level factors. Appropriate methods will be needed to develop statistical models for risk adjustment; however, this is a complex topic and beyond the scope of the current paper.
Third, HHS could continue to use the current readmission measures as population health measures while supporting multistakeholder teams to better understand how people and their communities, public health agencies, insurers, and healthcare providers can collaborate to help patients thrive and avoid readmissions by addressing true defects in care and care coordination.
While it is understandable why policy makers chose to focus on hospital readmissions, and while we recognize that concerns about the measures were unknown when they were created, emerging evidence demonstrates that the current readmission measures (particularly when used as a quality metric) lack construct validity, contain significant bias and systematic errors, and create ethical tension by rewarding hospitals both financially and reputationally for turning away sick and socially disadvantaged patients who may, consequently, have adverse outcomes. Current readmission measures need to be reconsidered.
Acknowledgments
The authors thank Christine G. Holzmueller, BLA, with the Armstrong Institute for Patient Safety and Quality, Johns Hopkins Medicine, for her assistance in editing the manuscript and preparing it for journal submission.
Disclosure
Dr. Pronovost errs on the side of full disclosure and reports receiving grant or contract support from the Agency for Healthcare Research and Quality, the Gordon and Betty Moore Foundation (research related to patient safety and quality of care), the National Institutes of Health (acute lung injury research), and the American Medical Association Inc. (improve blood pressure control); honoraria from various healthcare organizations for speaking on patient safety and quality (the Leigh Bureau manages engagements); book royalties from the Penguin Group for his book Safe Patients, Smart Hospitals; and was receiving stock and fees to serve as a director for Cantel Medical up until 24 months ago. Dr. Pronovost is a founder of Patient Doctor Technologies, a startup company that seeks to enhance the partnership between patients and clinicians with an application called Doctella. Dr. Brotman, Dr. Hoyer, and Ms. Deutschendorf report no relevant conflicts of interest.
1. Centers for Medicare & Medicaid Services. Five-star quality rating system. https://www.cms.gov/medicare/provider-enrollment-and-certification/certificationandcomplianc/fsqrs.html. Accessed October 11, 2016.
2. Joynt KE, Jha AK. Characteristics of hospitals receiving penalties under the Hospital Readmissions Reduction Program. JAMA. 2013;309(4):342-343. PubMed
3. Boozary AS, Manchin J, 3rd, Wicker RF. The Medicare Hospital Readmissions Reduction Program: time for reform. JAMA. 2015;314(4):347-348. PubMed
4. Jencks SF, Williams MV, Coleman EA. Rehospitalizations among patients in the Medicare fee-for-service program. N Engl J Med. 2009;360(14):1418-1428. PubMed
5. Centers for Medicare & Medicaid Services. Readmissions Reduction Program (HRRP). https://www.cms.gov/medicare/medicare-fee-for-service-payment/acuteinpatientpps/readmissions-reduction-program.html. Accessed April 12, 2017.
6. Parker C, Schwamm LH, Fonarow GC, Smith EE, Reeves MJ. Stroke quality metrics: systematic reviews of the relationships to patient-centered outcomes and impact of public reporting. Stroke. 2012;43(1):155-162. PubMed
7. McIntyre LK, Arbabi S, Robinson EF, Maier RV. Analysis of risk factors for patient readmission 30 days following discharge from general surgery. JAMA Surg. 2016;151(9):855-861. PubMed
8. Sheingold SH, Zuckerman R, Shartzer A. Understanding Medicare hospital readmission rates and differing penalties between safety-net and other hospitals. Health Aff (Millwood). 2016;35(1):124-131. PubMed
9. Brotman DJ, Hoyer EH, Leung C, Lepley D, Deutschendorf A. Associations between hospital-wide readmission rates and mortality measures at the hospital level: are hospital-wide readmissions a measure of quality? J Hosp Med. 2016;11(9):650-651. PubMed
10. Krumholz HM, Lin Z, Keenan PS, et al. Relationship between hospital readmission and mortality rates for patients hospitalized with acute myocardial infarction, heart failure, or pneumonia. JAMA. 2013;309(6):587-593. PubMed
11. Fan VS, Gaziano JM, Lew R, et al. A comprehensive care management program to prevent chronic obstructive pulmonary disease hospitalizations: a randomized, controlled trial. Ann Intern Med. 2012;156(10):673-683. PubMed
12. Bikdeli B, Wayda B, Bao H, et al. Place of residence and outcomes of patients with heart failure: analysis from the Telemonitoring to Improve Heart Failure Outcomes Trial. Circ Cardiovasc Qual Outcomes. 2014;7(5):749-756. PubMed
13. Bernheim SM, Parzynski CS, Horwitz L, et al. Accounting for patients’ socioeconomic status does not change hospital readmission rates. Health Aff (Millwood). 2016;35(8):1461-1470. PubMed
14. Medicare Payment Advisory Commission. Refining the Hospital Readmissions Reduction Program. In: Report to the Congress: Medicare and the Health Care Delivery System, Chapter 4. June 2013. PubMed
© 2017 Society of Hospital Medicine
The Weekend Effect in Hospitalized Patients: A Meta-Analysis
The presence of a “weekend effect” (increased mortality rate during Saturday and/or Sunday admissions) for hospitalized inpatients is uncertain. Several observational studies1-3 suggested a positive correlation between weekend admission and increased mortality, whereas other studies demonstrated no correlation4-6 or mixed results.7,8 The majority of studies have been published only within the last decade.
Several possible reasons are cited to explain the weekend effect. Decreased and presence of inexperienced staffing on weekends may contribute to a deficit in care.7,9,10 Patients admitted during the weekend may be less likely to undergo procedures or have significant delays before receiving needed intervention.11-13 Another possibility is that there may be differences in severity of illness or comorbidities in patients admitted during the weekend compared with those admitted during the remainder of the week. Due to inconsistency between studies regarding the existence of such an effect, we performed a meta-analysis in hospitalized inpatients to delineate whether or not there is a weekend effect on mortality.
METHODS
Data Sources and Searches
This study was exempt from institutional review board review, and we utilized the recommendations from the Meta-analysis of Observational Studies in Epidemiology statement. We examined the mortality rate for hospital inpatients admitted during the weekend (weekend death) compared with the mortality rate for those admitted during the workweek (workweek death). We performed a literature search (January 1966−April 2013) of multiple databases, including PubMed, EMBASE, SCOPUS, and the Cochrane library (see Appendix). Two reviewers (LP, RJP) independently evaluated the full article of each abstract. Any disputes were resolved by a third reviewer (CW). Bibliographic references were hand searched for additional literature.
Study Selection
To be included in the systematic review, the study had to provide discrete mortality data on the weekends (including holidays) versus weekdays, include patients who were admitted as inpatients over the weekend, and be published in the English language. We excluded studies that combined weekend with weekday “off hours” (eg, weekday night shift) data, which could not be extracted or analyzed separately.
Data Extraction and Quality Assessment
Once an article was accepted to be included for the systematic review, the authors extracted relevant data if available, including study location, number and type of patients studied, patient comorbidity data, procedure-related data (type of procedure, difference in rate of procedure and time to procedure performed for both weekday and weekends), any stated and/or implied differences in staffing patterns between weekend and weekdays, and definition of mortality. We used the Newcastle-Ottawa Quality Assessment Scale to assess the quality of methodological reporting of the study.14 The definition of weekend and extraction and classification of data (weekend versus weekday) was based on the original study definition. We made no attempt to impose a universal definition of “weekend” on all studies. Similarly, the definition of mortality (eg, 3-/7-/30-day) was based according to the original study definition. Death from a patient admitted on the weekend was defined as a “weekend death” (regardless of ultimate time of death) and similarly, death from a patient admitted on a weekday was defined as a “weekday death.” Although some articles provided specific information on healthcare worker staffing patterns between weekends and weekdays, differences in weekend versus weekday staffing were implied in many articles. In these studies, staffing paradigms were considered to be different between weekend and weekdays if there were specific descriptions of the type of hospitals (urban versus rural, teaching versus nonteaching, large versus small) in the database, which would imply a typical routine staffing pattern as currently occurs in most hospitals (ie, generally less healthcare worker staff on weekends). We only included data that provided times (mean minutes/hours) from admission to the specific intervention and that provided actual rates of intervention performed for both weekend and weekday patients. We only included data that provided an actual rate of intervention performed for both weekend and weekday patients. With regard to patient comorbidities or illness severity index, we used the original studies classification (defined by the original manuscripts), which might include widely accepted global indices or a listing of specific comorbidities and/or physiologic parameters present on admission.
Data Synthesis and Analysis
We used a random effects meta-analysis approach for estimating an overall relative risk (RR) and risk differences of mortality for weekends versus weekdays, as well as subgroup specific estimates, and for computing confidence limits. The DerSimonian and Laird approach was used to estimate the random effects. Within each of the 4 subgroups (weekend staffing, procedure rates and delays, illness severity), we grouped each qualified individual study by the presence of a difference (ie, difference, no difference, or mixed) and then pooled the mortality rates for all of the studies in that group. For instance, in the subgroup of staffing, we sorted available studies by whether weekend staffing was the same or decreased versus weekday staffing, then pooled the mortality rates for studies where staffing levels were the same (versus weekday) and also separately pooled studies where staffing levels were decreased (versus weekday). Data were managed with Stata 13 (Stata Statistical Software: Release 13; StataCorp. 2013, College Station, TX) and R, and all meta-analyses were performed with the metafor package in R.15 Pooled estimated are presented as RR (95% confidence intervals [CI]).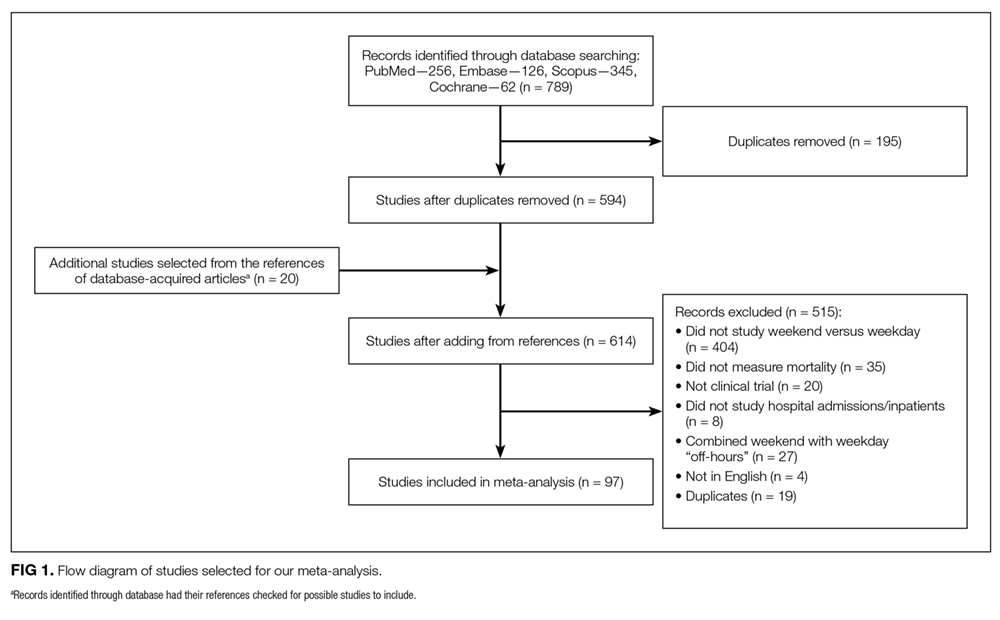
RESULTS
A literature search retrieved a total of 594 unique citations. A review of the bibliographic references yielded an additional 20 articles. Upon evaluation, 97 studies (N = 51,114,109 patients) met inclusion criteria (Figure 1). The articles were published between 2001–2012; the kappa statistic comparing interrater reliability in the selection of articles was 0.86. Supplementary Tables 1 and 2 present a summary of study characteristics and outcomes of the accepted articles. A summary of accepted studies is in Supplementary Table 1. When summing the total number of subjects across all 97 articles, 76% were classified as weekday and 24% were weekend patients.
Weekend Admission/Inpatient Status and Mortality
The definition of the weekend varied among the included studies. The weekend time period was delineated as Friday midnight to Sunday midnight in 66% (65/99) of the studies. The remaining studies typically defined the weekend to be between Friday evening and Monday morning although studies from the Middle East generally defined the weekend as Wednesday/Thursday through Saturday. The definition of mortality also varied among researchers with most studies describing death rate as hospital inpatient mortality although some studies also examined multiple definitions of mortality (eg, 30-day all-cause mortality and hospital inpatient mortality). Not all studies provided a specific timeframe for mortality.
Fifty studies did not report a specific time frame for deaths. When a specific time frame for death was reported, the most common reported time frame was 30 days (n = 15 studies) and risk of mortality at 30 days still was higher for weekends (RR = 1.07; 95% CI,1.03-1.12; I2 = 90%). When we restricted the analysis to the studies that specified any timeframe for mortality (n = 49 studies), the risk of mortality was still significantly higher for weekends (RR = 1.12; 95% CI,1.09-1.15; I2 = 95%).
Weekend Effect Factors
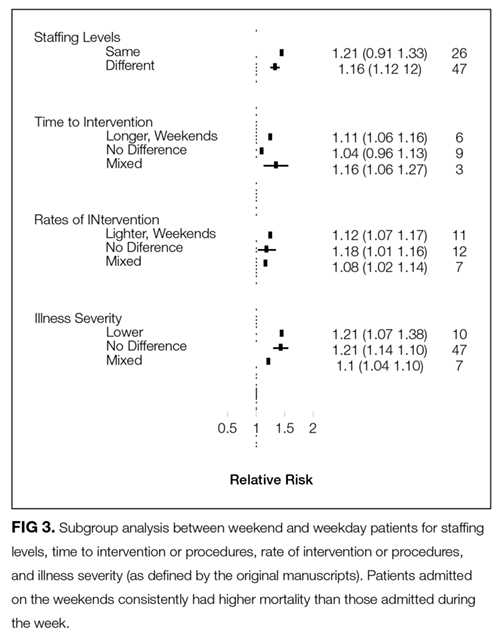
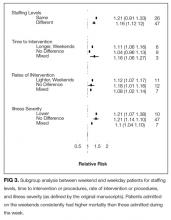
We also performed subgroup analyses to investigate the overall weekend effect by hospital level factors (weekend staffing, procedure rates and delays, illness severity). Complete data were not available for all studies (staffing levels = 73 studies, time to intervention = 18 studies, rate of intervention = 30 studies, illness severity = 64 studies). Patients admitted on the weekends consistently had higher mortality than those admitted during the week, regardless of the levels of weekend/weekday differences in staffing, procedure rates and delays, illness severity (Figure 3). Analysis of studies that included staffing data for weekends revealed that decreased staffing levels on the weekends was associated with a higher mortality for weekend patients (RR = 1.16; 95% CI, 1.12-1.20; I2 = 99%; Figure 3). There was no difference in mortality for weekend patients when staffing was similar to that for the weekdays (RR = 1.21; 95% CI, 0.91-1.63; I2 = 99%).
Analysis for weekend data revealed that longer times to interventions on weekends were associated with significantly higher mortality rates (RR = 1.11; 95% CI, 1.08-1.15; I2 = 0%; Figure 3). When there were no delays to weekend procedure/interventions, there was no difference in mortality between weekend and weekday procedures/interventions (RR = 1.04; 95% CI, 0.96-1.13; I2 = 55%; Figure 3). Some articles included several procedures with “mixed” results (some procedures were “positive,” while other were “negative” for increased mortality). In studies that showed a mixed result for time to intervention, there was a significant increase in mortality (RR = 1.16; 95% CI, 1.06-1.27; I2 = 42%) for weekend patients (Figure 3).
Analyses showed a higher mortality rate on the weekends regardless of whether the rate of intervention/procedures was lower (RR=1.12; 95% CI, 1.07-1.17; I2 = 79%) or the same between weekend and weekdays (RR = 1.08; 95% CI, 1.01-1.16; I2 = 90%; Figure 3). Analyses showed a higher mortality rate on the weekends regardless of whether the illness severity was higher on the weekends (RR = 1.21; 95% CI, 1.07-1.38; I2 = 99%) or the same (RR = 1.21; 95% CI, 1.14-1.28; I2 = 99%) versus that for weekday patients (Figure 3). An inverse funnel plot for publication bias is shown in Figure 4.
DISCUSSION
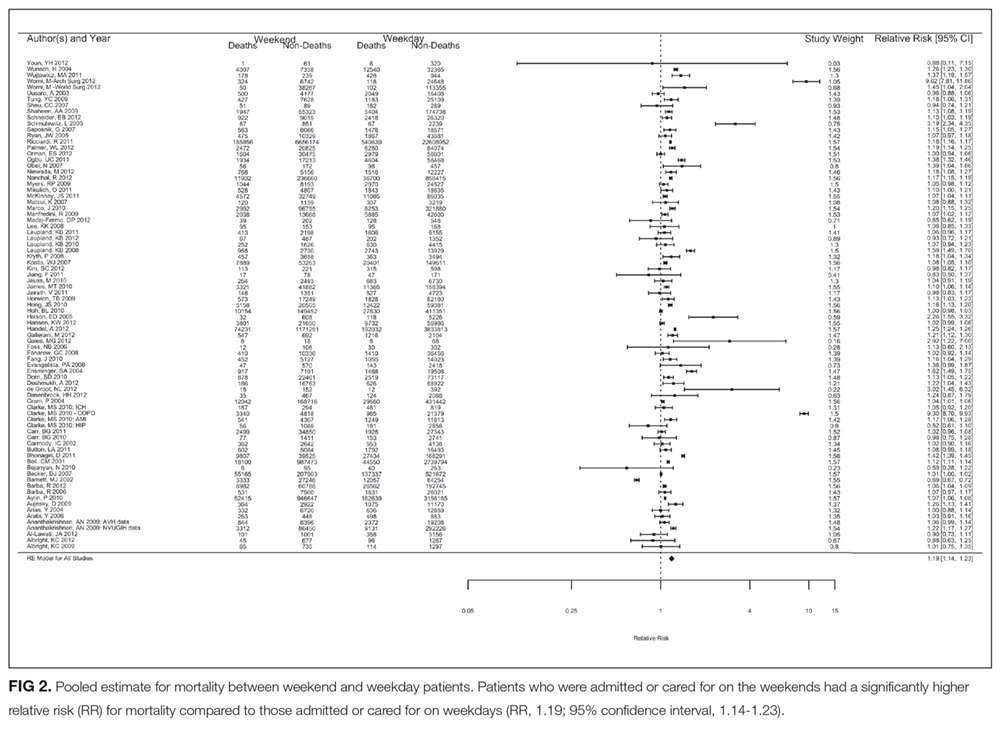
We have presented one of the first meta-analyses to examine the mortality rate for hospital inpatients admitted during the weekend compared with those admitted during the workweek. We found that patients admitted on the weekends had a significantly higher overall mortality (RR = 1.19; 95% CI, 1.14-1.23; risk difference = 0.014; 95% CI, 0.013-0.016). This association was not modified by differences in weekday and weekend staffing patterns, and other hospital characteristics. Previous systematic reviews have been exclusive to the intensive care unit setting16 or did not specifically examine weekend mortality, which was a component of “off-shift” and/or “after-hours” care.17
These findings should be placed in the context of the recently published literature.18,19 A meta-analysis of cohort studies found that off-hour admission was associated with increased mortality for 28 diseases although the associations varied considerably for different diseases.18 Likewise, a meta-analysis of 21 cohort studies noted that off-hour presentation for patients with acute ischemic stroke was associated with significantly higher short-term mortality.19 Our results of increased weekend mortality corroborate that found in these two meta-analyses. However, our study differs in that we specifically examined only weekend mortality and did not include after-hours care on weekdays, which was included in the off-hour mortality in the other meta-analyses.18,19
Differences in healthcare worker staffing between weekends and weekdays have been proposed to contribute to the observed increase in mortality.7,16,20 Data indicate that lower levels of nursing are associated with increased mortality.10,21-23 The presence of less experienced and/or fewer physician specialists may contribute to increases in mortality.24-26 Fewer or less experienced staff during weekends may contribute to inadequacies in patient handovers and/or handoffs, delays in patient assessment and/or interventions, and overall continuity of care for newly admitted patients.27-33
Our data show little conclusive evidence that the weekend mortality versus weekday mortality vary by staffing level differences. While the estimated RR of mortality differs in magnitude for facilities with no difference in weekend and weekday staffing versus those that have a difference in staffing levels, both estimate an increased mortality on weekends, and the difference in these effects is not statistically significant. It should be noted that there was no difference in mortality for weekend (versus weekday) patients where there was no difference between weekend and weekday staffing; these studies were typically in high acuity units or centers where the general expectation is for 24/7/365 uniform staffing coverage.
A decrease in the use of interventions and/or procedures on weekends has been suggested to contribute to increases in mortality for patients admitted on the weekends.34 Several studies have associated lower weekend rates to higher mortality for a variety of interventions,13,35-37 although some other studies have suggested that lower procedure rates on weekends have no effect on mortality.38-40 Lower diagnostic procedure weekend rates linked to higher mortality rates may exacerbate underlying healthcare disparities.41 Our results do not conclusively show that a decrease rate of intervention and/or procedures for weekends patients is associated with a higher risk of mortality for weekends compared to weekdays.
Delays in intervention and/or procedure on weekends have also been suggested to contribute to increases in mortality.34,42 Similar to that seen with lower rates of diagnostic or therapeutic intervention and/or procedure performed on weekends, delays in potentially critical intervention and/or procedures might ultimately manifest as an increase in mortality.43 Patients admitted to the hospital on weekends and requiring an early procedure were less likely to receive it within 2 days of admission.42 Several studies have shown an association between delays in diagnostic or therapeutic intervention and/or procedure on weekends to a higher hospital inpatient mortality35,42,44,45; however, some data suggested that a delay in time to procedure on weekends may not always be associated with increased mortality.46 Depending on the procedure, there may be a threshold below which the effect of reducing delay times will have no effect on mortality rates.47,48
Patients admitted on the weekends may be different (in the severity of illness and/or comorbidities) than those admitted during the workweek and these potential differences may be a factor for increases in mortality for weekend patients. Whether there is a selection bias for weekend versus weekday patients is not clear.34 This is a complex issue as there is significant heterogeneity in patient case mix depending on the specific disease or condition studied. For instance, one would expect that weekend trauma patients would be different than those seen during the regular workweek.49 Some large scale studies suggest that weekend patients may not be more sick than weekday patients and that any increase in weekend mortality is probably not due to factors such as severity of illness.1,7 Although we were unable to determine if there was an overall difference in illness severity between weekend and weekday patients due to the wide variety of assessments used for illness severity, our results showed statistically comparable higher mortality rate on the weekends regardless of whether the illness severity was higher, the same, or mixed between weekend and weekday patients, suggesting that general illness severity per se may not be as important as the weekend effect on mortality; however, illness severity may still have an important effect on mortality for more specific subgroups (eg, trauma).49
There are several implications of our results. We found a mean increased RR mortality of approximately 19% for patients admitted on the weekends, a number similar to one of the largest published observational studies containing almost 5 million subjects.2 Even if we took a more conservative estimate of 10% increased risk of weekend mortality, this would be equivalent to an excess of 25,000 preventable deaths per year. If the weekend effect were to be placed in context of a public health issue, the weekend effect would be the number 8 cause of death below the 29,000 deaths due to gun violence, but above the 20,000 deaths resulting from sexual behavior (sexual transmitted diseases) in 2000.3, 50,51 Although our data suggest that staffing shortfalls and decreases or delays for procedures on weekends may be associated with an increased mortality for patients admitted on the weekends, further large-scale studies are needed to confirm these findings. Increasing nurse and physician staffing levels and skill mix to cover any potential shortfall on weekends may be expensive, although theoretically, there may be savings accrued from reduced adverse events and shorter length of stay.26,52 Changes to weekend care might only benefit daytime hospitalizations because some studies have shown increased mortality during nighttime regardless of weekend or weekday admission.53
Several methodologic points in our study need to be clarified. We excluded many studies which examined the relationship of off-hours or after-hours admissions and mortality as off-hours studies typically combined weekend and after-hours weekday data. Some studies suggest that off-hour admission may be associated with increased mortality and delays in time for critical procedures during off-hours.18,19 This is a complex topic, but it is clear that the risks of hospitalization vary not just by the day of the week but also by time of the day.54 The use of meta-analyses of nonrandomized trials has been somewhat controversial,55,56 and there may be significant bias or confounding in the pooling of highly varied studies. It is important to keep in mind that there are very different definitions of weekends, populations studied, and measures of mortality rates, even as the pooled statistic suggests a homogeneity among the studies that does not exist.
There are several limitations to our study. Our systematic review may be seen as limited as we included only English language papers. In addition, we did not search nontraditional sources and abstracts. We accepted the definition of a weekend as defined by the original study, which resulted in varied definitions of weekend time period and mortality. There was a lack of specific data on staffing patterns and procedures in many studies, particularly those using databases. We were not able to further subdivide our analysis by admitting service. We were not able to undertake a subgroup analysis by country or continent, which may have implications on the effect of different healthcare systems on healthcare quality. It is unclear whether correlations in our study are a direct consequence of poorer weekend care or are the result of other unknown or unexamined differences between weekend and weekday patient populations.34,57 For instance, there may be other global factors (higher rates of medical errors, higher hospital volumes) which may not be specifically related to weekend care and therefore not been accounted for in many of the studies we examined.10,27,58-61 There may be potential bias of patient phenotypes (are weekend patients different than weekday patients?) admitted on the weekend. Holidays were included in the weekend data and it is not clear how this would affect our findings as some data suggest that there is a significantly higher mortality rate on holidays (versus weekends or weekdays),61 while other data do not.62 There was no universal definition for the timeframe for a weekend and as such, we had to rely on the original article for their determination and definition of weekend versus weekday death.
In summary, our meta-analysis suggests that hospital inpatients admitted during the weekend have a significantly increased mortality compared with those admitted on weekday. While none of our subgroup analyses showed strong evidence on effect modification, the interpretation of these results is hampered by the relatively small number of studies. Further research should be directed to determine the presence of causality between various factors purported to affect mortality and it is possible that we ultimately find that the weekend effect may exist for some but not all patients.
Acknowledgments
The authors would like to acknowledge Jaime Blanck, MLIS, MPA, AHIP, Clinical Informationist, Welch Medical Library, for her invaluable assistance in undertaking the literature searches for this manuscript.
Disclosure
This manuscript has been supported by the Department of Anesthesiology and Critical Care Medicine; The Johns Hopkins School of Medicine; Baltimore, Maryland. There are no relevant conflicts of interests.
1. Aylin P, Yunus A, Bottle A, Majeed A, Bell D. Weekend mortality for emergency
admissions. A large, multicentre study. Qual Saf Health Care. 2010;19(3):213-217. PubMed
2. Handel AE, Patel SV, Skingsley A, Bramley K, Sobieski R, Ramagopalan SV.
Weekend admissions as an independent predictor of mortality: an analysis of
Scottish hospital admissions. BMJ Open. 2012;2(6): pii: e001789. PubMed
3. Ricciardi R, Roberts PL, Read TE, Baxter NN, Marcello PW, Schoetz DJ. Mortality
rate after nonelective hospital admission. Arch Surg. 2011;146(5):545-551. PubMed
4. Fonarow GC, Abraham WT, Albert NM, et al. Day of admission and clinical
outcomes for patients hospitalized for heart failure: findings from the Organized
Program to Initiate Lifesaving Treatment in Hospitalized Patients With Heart
Failure (OPTIMIZE-HF). Circ Heart Fail. 2008;1(1):50-57. PubMed
5. Hoh BL, Chi YY, Waters MF, Mocco J, Barker FG 2nd. Effect of weekend compared
with weekday stroke admission on thrombolytic use, in-hospital mortality,
discharge disposition, hospital charges, and length of stay in the Nationwide Inpatient
Sample Database, 2002 to 2007. Stroke. 2010;41(10):2323-2328. PubMed
6. Koike S, Tanabe S, Ogawa T, et al. Effect of time and day of admission on 1-month
survival and neurologically favourable 1-month survival in out-of-hospital cardiopulmonary
arrest patients. Resuscitation. 2011;82(7):863-868. PubMed
7. Bell CM, Redelmeier DA. Mortality among patients admitted to hospitals on
weekends as compared with weekdays. N Engl J Med. 2001;345(9):663-668. PubMed
8. Freemantle N, Richardson M, Wood J, et al. Weekend hospitalization and additional
risk of death: an analysis of inpatient data. J R Soc Med. 2012;105(2):74-84. PubMed
9. Schilling PL, Campbell DA Jr, Englesbe MJ, Davis MM. A comparison of in-hospital
mortality risk conferred by high hospital occupancy, differences in nurse
staffing levels, weekend admission, and seasonal influenza. Med Care. 2010;48(3):
224-232. PubMed
10. Wong HJ, Morra D. Excellent hospital care for all: open and operating 24/7. J Gen
Intern Med. 2011;26(9):1050-1052. PubMed
11. Dorn SD, Shah ND, Berg BP, Naessens JM. Effect of weekend hospital admission
on gastrointestinal hemorrhage outcomes. Dig Dis Sci. 2010;55(6):1658-1666. PubMed
12. Kostis WJ, Demissie K, Marcella SW, et al. Weekend versus weekday admission
and mortality from myocardial infarction. N Engl J Med. 2007;356(11):1099-1109. PubMed
13. McKinney JS, Deng Y, Kasner SE, Kostis JB; Myocardial Infarction Data Acquisition
System (MIDAS 15) Study Group. Comprehensive stroke centers overcome
the weekend versus weekday gap in stroke treatment and mortality. Stroke.
2011;42(9):2403-2409. PubMed
14. Margulis AV, Pladevall M, Riera-Guardia N, et al. Quality assessment of observational
studies in a drug-safety systematic review, comparison of two tools: the
Newcastle-Ottawa Scale and the RTI item bank. Clin Epidemiol. 2014;6:359-368. PubMed
15. Viechtbauer W. Conducting meta-analyses in R with the metafor package. J Stat
Softw. 2010;36(3):1-48.
16. Cavallazzi R, Marik PE, Hirani A, Pachinburavan M, Vasu TS, Leiby BE. Association
between time of admission to the ICU and mortality: a systematic review and
metaanalysis. Chest. 2010;138(1):68-75. PubMed
17. de Cordova PB, Phibbs CS, Bartel AP, Stone PW. Twenty-four/seven: a
mixed-method systematic review of the off-shift literature. J Adv Nurs.
2012;68(7):1454-1468. PubMed
18. Zhou Y, Li W, Herath C, Xia J, Hu B, Song F, Cao S, Lu Z. Off-hour admission and
mortality risk for 28 specific diseases: a systematic review and meta-analysis of 251
cohorts. J Am Heart Assoc. 2016;5(3):e003102. PubMed
19. Sorita A, Ahmed A, Starr SR, et al. Off-hour presentation and outcomes in
patients with acute myocardial infarction: systematic review and meta-analysis.
BMJ. 2014;348:f7393. PubMed
20. Ricciardi R, Nelson J, Roberts PL, Marcello PW, Read TE, Schoetz DJ. Is the
presence of medical trainees associated with increased mortality with weekend
admission? BMC Med Educ. 2014;14(1):4. PubMed
21. Needleman J, Buerhaus P, Pankratz VS, Leibson CL, Stevens SR, Harris M. Nurse
staffing and inpatient hospital mortality. N Engl J Med. 2011;364(11):1037-1045. PubMed
22. Aiken LH, Clarke SP, Sloane DM, Sochalski J, Silber JH. Hospital nurse
staffing and patient mortality, nurse burnout, and job dissatisfaction. JAMA.
2002;288(16):1987-1993. PubMed
23. Hamilton KE, Redshaw ME, Tarnow-Mordi W. Nurse staffing in relation to
risk-adjusted mortality in neonatal care. Arch Dis Child Fetal Neonatal Ed.
2007;92(2):F99-F103. PubMed
766 An Official Publication of the Society of Hospital Medicine Journal of Hospital Medicine Vol 12 | No 9 | September 2017
Pauls et al | The Weekend Effect: A Meta-Analysis
24. Haut ER, Chang DC, Efron DT, Cornwell EE 3rd. Injured patients have lower
mortality when treated by “full-time” trauma surgeons vs. surgeons who cover
trauma “part-time”. J Trauma. 2006;61(2):272-278. PubMed
25. Wallace DJ, Angus DC, Barnato AE, Kramer AA, Kahn JM. Nighttime intensivist
staffing and mortality among critically ill patients. N Engl J Med.
2012;366(22):2093-2101. PubMed
26. Pronovost PJ, Angus DC, Dorman T, Robinson KA, Dremsizov TT, Young TL.
Physician staffing patterns and clinical outcomes in critically ill patients: a systematic
review. JAMA. 2002;288(17):2151-2162. PubMed
27. Weissman JS, Rothschild JM, Bendavid E, et al. Hospital workload and adverse
events. Med Care. 2007;45(5):448-455. PubMed
28. Hamilton P, Eschiti VS, Hernandez K, Neill D. Differences between weekend and
weekday nurse work environments and patient outcomes: a focus group approach
to model testing. J Perinat Neonatal Nurs. 2007;21(4):331-341. PubMed
29. Johner AM, Merchant S, Aslani N, et al Acute general surgery in Canada: a survey
of current handover practices. Can J Surg. 2013;56(3):E24-E28. PubMed
30. de Cordova PB, Phibbs CS, Stone PW. Perceptions and observations of off-shift
nursing. J Nurs Manag. 2013;21(2):283-292. PubMed
31. Pfeffer PE, Nazareth D, Main N, Hardoon S, Choudhury AB. Are weekend
handovers of adequate quality for the on-call general medical team? Clin Med.
2011;11(6):536-540. PubMed
32. Eschiti V, Hamilton P. Off-peak nurse staffing: critical-care nurses speak. Dimens
Crit Care Nurs. 2011;30(1):62-69. PubMed
33. Button LA, Roberts SE, Evans PA, et al. Hospitalized incidence and case fatality
for upper gastrointestinal bleeding from 1999 to 2007: a record linkage study. Aliment
Pharmacol Ther. 2011;33(1):64-76. PubMed
34. Becker DJ. Weekend hospitalization and mortality: a critical review. Expert Rev
Pharmacoecon Outcomes Res. 2008;8(1):23-26. PubMed
35. Deshmukh A, Pant S, Kumar G, Bursac Z, Paydak H, Mehta JL. Comparison of
outcomes of weekend versus weekday admissions for atrial fibrillation. Am J Cardiol.
2012;110(2):208-211. PubMed
36. Nanchal R, Kumar G, Taneja A, et al. Pulmonary embolism: the weekend effect.
Chest. 2012;142(3):690-696. PubMed
37. Palmer WL, Bottle A, Davie C, Vincent CA, Aylin P. Dying for the weekend: a
retrospective cohort study on the association between day of hospital presentation
and the quality and safety of stroke care. Arch Neurol. 2012;69(10):1296-1302. PubMed
38. Dasenbrock HH, Pradilla G, Witham TF, Gokaslan ZL, Bydon A. The impact
of weekend hospital admission on the timing of intervention and outcomes after
surgery for spinal metastases. Neurosurgery. 2012;70(3):586-593. PubMed
39. Jairath V, Kahan BC, Logan RF, et al. Mortality from acute upper gastrointestinal
bleeding in the United Kingdom: does it display a “weekend effect”? Am J Gastroenterol.
2011;106(9):1621-1628. PubMed
40. Myers RP, Kaplan GG, Shaheen AM. The effect of weekend versus weekday
admission on outcomes of esophageal variceal hemorrhage. Can J Gastroenterol.
2009;23(7):495-501. PubMed
41. Rudd AG, Hoffman A, Down C, Pearson M, Lowe D. Access to stroke care in
England, Wales and Northern Ireland: the effect of age, gender and weekend admission.
Age Ageing. 2007;36(3):247-255. PubMed
42. Lapointe-Shaw L, Abushomar H, Chen XK, et al. Care and outcomes of patients
with cancer admitted to the hospital on weekends and holidays: a retrospective
cohort study. J Natl Compr Canc Netw. 2016;14(7):867-874. PubMed
43. Chan PS, Krumholz HM, Nichol G, Nallamothu BK; American Heart Association
National Registry of Cardiopulmonary Resuscitation Investigators. Delayed time to
defibrillation after in-hospital cardiac arrest. N Engl J Med. 2008;358(1):9-17. PubMed
44. McGuire KJ, Bernstein J, Polsky D, Silber JH. The 2004 Marshall Urist Award:
Delays until surgery after hip fracture increases mortality. Clin Orthop Relat Res.
2004;(428):294-301. PubMed
45. Krüth P, Zeymer U, Gitt A, et al. Influence of presentation at the weekend on
treatment and outcome in ST-elevation myocardial infarction in hospitals with
catheterization laboratories. Clin Res Cardiol. 2008;97(10):742-747. PubMed
46. Jneid H, Fonarow GC, Cannon CP, et al. Impact of time of presentation on the care
and outcomes of acute myocardial infarction. Circulation. 2008;117(19):2502-2509. PubMed
47. Menees DS, Peterson ED, Wang Y, et al. Door-to-balloon time and mortality
among patients undergoing primary PCI. N Engl J Med. 2013;369(10):901-909. PubMed
48. Bates ER, Jacobs AK. Time to treatment in patients with STEMI. N Engl J Med.
2013;369(10):889-892. PubMed
49. Carmody IC, Romero J, Velmahos GC. Day for night: should we staff a trauma
center like a nightclub? Am Surg. 2002;68(12):1048-1051. PubMed
50. Mokdad AH, Marks JS, Stroup DF, Gerberding JL. Actual causes of death in the
United States, 2000. JAMA. 2004;291(10):1238-1245. PubMed
51. McCook A. More hospital deaths on weekends. http://www.reuters.com/article/
2011/05/20/us-more-hospital-deaths-weekends-idUSTRE74J5RM20110520.
Accessed March 7, 2017.
52. Mourad M, Adler J. Safe, high quality care around the clock: what will it take to
get us there? J Gen Intern Med. 2011;26(9):948-950. PubMed
53. Magid DJ, Wang Y, Herrin J, et al. Relationship between time of day, day of week,
timeliness of reperfusion, and in-hospital mortality for patients with acute ST-segment
elevation myocardial infarction. JAMA. 2005;294(7):803-812. PubMed
54. Coiera E, Wang Y, Magrabi F, Concha OP, Gallego B, Runciman W. Predicting
the cumulative risk of death during hospitalization by modeling weekend, weekday
and diurnal mortality risks. BMC Health Serv Res. 2014;14:226. PubMed
55. Greenland S. Can meta-analysis be salvaged? Am J Epidemiol. 1994;140(9):783-787. PubMed
56. Shapiro S. Meta-analysis/Shmeta-analysis. Am J Epidemiol. 1994;140(9):771-778. PubMed
57. Halm EA, Chassin MR. Why do hospital death rates vary? N Engl J Med.
2001;345(9):692-694. PubMed
58. Birkmeyer JD, Siewers AE, Finlayson EV, et al. Hospital volume and surgical mortality
in the United States. N Engl J Med. 2002;346(15):1128-1137. PubMed
59. Kaier K, Mutters NT, Frank U. Bed occupancy rates and hospital-acquired infections
– should beds be kept empty? Clin Microbiol Infect. 2012;18(10):941-945. PubMed
60. Chrusch CA, Olafson KP, McMillian PM, Roberts DE, Gray PR. High occupancy
increases the risk of early death or readmission after transfer from intensive care.
Crit Care Med. 2009;37(10):2753-2758. PubMed
61. Foss NB, Kehlet H. Short-term mortality in hip fracture patients admitted during
weekends and holidays. Br J Anaesth. 2006;96(4):450-454. PubMed
62. Daugaard CL, Jørgensen HL, Riis T, Lauritzen JB, Duus BR, van der Mark S. Is
mortality after hip fracture associated with surgical delay or admission during
weekends and public holidays? A retrospective study of 38,020 patients. Acta Orthop.
2012;83(6):609-613. PubMed
The presence of a “weekend effect” (increased mortality rate during Saturday and/or Sunday admissions) for hospitalized inpatients is uncertain. Several observational studies1-3 suggested a positive correlation between weekend admission and increased mortality, whereas other studies demonstrated no correlation4-6 or mixed results.7,8 The majority of studies have been published only within the last decade.
Several possible reasons are cited to explain the weekend effect. Decreased and presence of inexperienced staffing on weekends may contribute to a deficit in care.7,9,10 Patients admitted during the weekend may be less likely to undergo procedures or have significant delays before receiving needed intervention.11-13 Another possibility is that there may be differences in severity of illness or comorbidities in patients admitted during the weekend compared with those admitted during the remainder of the week. Due to inconsistency between studies regarding the existence of such an effect, we performed a meta-analysis in hospitalized inpatients to delineate whether or not there is a weekend effect on mortality.
METHODS
Data Sources and Searches
This study was exempt from institutional review board review, and we utilized the recommendations from the Meta-analysis of Observational Studies in Epidemiology statement. We examined the mortality rate for hospital inpatients admitted during the weekend (weekend death) compared with the mortality rate for those admitted during the workweek (workweek death). We performed a literature search (January 1966−April 2013) of multiple databases, including PubMed, EMBASE, SCOPUS, and the Cochrane library (see Appendix). Two reviewers (LP, RJP) independently evaluated the full article of each abstract. Any disputes were resolved by a third reviewer (CW). Bibliographic references were hand searched for additional literature.
Study Selection
To be included in the systematic review, the study had to provide discrete mortality data on the weekends (including holidays) versus weekdays, include patients who were admitted as inpatients over the weekend, and be published in the English language. We excluded studies that combined weekend with weekday “off hours” (eg, weekday night shift) data, which could not be extracted or analyzed separately.
Data Extraction and Quality Assessment
Once an article was accepted to be included for the systematic review, the authors extracted relevant data if available, including study location, number and type of patients studied, patient comorbidity data, procedure-related data (type of procedure, difference in rate of procedure and time to procedure performed for both weekday and weekends), any stated and/or implied differences in staffing patterns between weekend and weekdays, and definition of mortality. We used the Newcastle-Ottawa Quality Assessment Scale to assess the quality of methodological reporting of the study.14 The definition of weekend and extraction and classification of data (weekend versus weekday) was based on the original study definition. We made no attempt to impose a universal definition of “weekend” on all studies. Similarly, the definition of mortality (eg, 3-/7-/30-day) was based according to the original study definition. Death from a patient admitted on the weekend was defined as a “weekend death” (regardless of ultimate time of death) and similarly, death from a patient admitted on a weekday was defined as a “weekday death.” Although some articles provided specific information on healthcare worker staffing patterns between weekends and weekdays, differences in weekend versus weekday staffing were implied in many articles. In these studies, staffing paradigms were considered to be different between weekend and weekdays if there were specific descriptions of the type of hospitals (urban versus rural, teaching versus nonteaching, large versus small) in the database, which would imply a typical routine staffing pattern as currently occurs in most hospitals (ie, generally less healthcare worker staff on weekends). We only included data that provided times (mean minutes/hours) from admission to the specific intervention and that provided actual rates of intervention performed for both weekend and weekday patients. We only included data that provided an actual rate of intervention performed for both weekend and weekday patients. With regard to patient comorbidities or illness severity index, we used the original studies classification (defined by the original manuscripts), which might include widely accepted global indices or a listing of specific comorbidities and/or physiologic parameters present on admission.
Data Synthesis and Analysis
We used a random effects meta-analysis approach for estimating an overall relative risk (RR) and risk differences of mortality for weekends versus weekdays, as well as subgroup specific estimates, and for computing confidence limits. The DerSimonian and Laird approach was used to estimate the random effects. Within each of the 4 subgroups (weekend staffing, procedure rates and delays, illness severity), we grouped each qualified individual study by the presence of a difference (ie, difference, no difference, or mixed) and then pooled the mortality rates for all of the studies in that group. For instance, in the subgroup of staffing, we sorted available studies by whether weekend staffing was the same or decreased versus weekday staffing, then pooled the mortality rates for studies where staffing levels were the same (versus weekday) and also separately pooled studies where staffing levels were decreased (versus weekday). Data were managed with Stata 13 (Stata Statistical Software: Release 13; StataCorp. 2013, College Station, TX) and R, and all meta-analyses were performed with the metafor package in R.15 Pooled estimated are presented as RR (95% confidence intervals [CI]).
RESULTS
A literature search retrieved a total of 594 unique citations. A review of the bibliographic references yielded an additional 20 articles. Upon evaluation, 97 studies (N = 51,114,109 patients) met inclusion criteria (Figure 1). The articles were published between 2001–2012; the kappa statistic comparing interrater reliability in the selection of articles was 0.86. Supplementary Tables 1 and 2 present a summary of study characteristics and outcomes of the accepted articles. A summary of accepted studies is in Supplementary Table 1. When summing the total number of subjects across all 97 articles, 76% were classified as weekday and 24% were weekend patients.
Weekend Admission/Inpatient Status and Mortality
The definition of the weekend varied among the included studies. The weekend time period was delineated as Friday midnight to Sunday midnight in 66% (65/99) of the studies. The remaining studies typically defined the weekend to be between Friday evening and Monday morning although studies from the Middle East generally defined the weekend as Wednesday/Thursday through Saturday. The definition of mortality also varied among researchers with most studies describing death rate as hospital inpatient mortality although some studies also examined multiple definitions of mortality (eg, 30-day all-cause mortality and hospital inpatient mortality). Not all studies provided a specific timeframe for mortality.
Fifty studies did not report a specific time frame for deaths. When a specific time frame for death was reported, the most common reported time frame was 30 days (n = 15 studies) and risk of mortality at 30 days still was higher for weekends (RR = 1.07; 95% CI,1.03-1.12; I2 = 90%). When we restricted the analysis to the studies that specified any timeframe for mortality (n = 49 studies), the risk of mortality was still significantly higher for weekends (RR = 1.12; 95% CI,1.09-1.15; I2 = 95%).
Weekend Effect Factors
We also performed subgroup analyses to investigate the overall weekend effect by hospital level factors (weekend staffing, procedure rates and delays, illness severity). Complete data were not available for all studies (staffing levels = 73 studies, time to intervention = 18 studies, rate of intervention = 30 studies, illness severity = 64 studies). Patients admitted on the weekends consistently had higher mortality than those admitted during the week, regardless of the levels of weekend/weekday differences in staffing, procedure rates and delays, illness severity (Figure 3). Analysis of studies that included staffing data for weekends revealed that decreased staffing levels on the weekends was associated with a higher mortality for weekend patients (RR = 1.16; 95% CI, 1.12-1.20; I2 = 99%; Figure 3). There was no difference in mortality for weekend patients when staffing was similar to that for the weekdays (RR = 1.21; 95% CI, 0.91-1.63; I2 = 99%).
Analysis for weekend data revealed that longer times to interventions on weekends were associated with significantly higher mortality rates (RR = 1.11; 95% CI, 1.08-1.15; I2 = 0%; Figure 3). When there were no delays to weekend procedure/interventions, there was no difference in mortality between weekend and weekday procedures/interventions (RR = 1.04; 95% CI, 0.96-1.13; I2 = 55%; Figure 3). Some articles included several procedures with “mixed” results (some procedures were “positive,” while other were “negative” for increased mortality). In studies that showed a mixed result for time to intervention, there was a significant increase in mortality (RR = 1.16; 95% CI, 1.06-1.27; I2 = 42%) for weekend patients (Figure 3).
Analyses showed a higher mortality rate on the weekends regardless of whether the rate of intervention/procedures was lower (RR=1.12; 95% CI, 1.07-1.17; I2 = 79%) or the same between weekend and weekdays (RR = 1.08; 95% CI, 1.01-1.16; I2 = 90%; Figure 3). Analyses showed a higher mortality rate on the weekends regardless of whether the illness severity was higher on the weekends (RR = 1.21; 95% CI, 1.07-1.38; I2 = 99%) or the same (RR = 1.21; 95% CI, 1.14-1.28; I2 = 99%) versus that for weekday patients (Figure 3). An inverse funnel plot for publication bias is shown in Figure 4.
DISCUSSION
We have presented one of the first meta-analyses to examine the mortality rate for hospital inpatients admitted during the weekend compared with those admitted during the workweek. We found that patients admitted on the weekends had a significantly higher overall mortality (RR = 1.19; 95% CI, 1.14-1.23; risk difference = 0.014; 95% CI, 0.013-0.016). This association was not modified by differences in weekday and weekend staffing patterns, and other hospital characteristics. Previous systematic reviews have been exclusive to the intensive care unit setting16 or did not specifically examine weekend mortality, which was a component of “off-shift” and/or “after-hours” care.17
These findings should be placed in the context of the recently published literature.18,19 A meta-analysis of cohort studies found that off-hour admission was associated with increased mortality for 28 diseases although the associations varied considerably for different diseases.18 Likewise, a meta-analysis of 21 cohort studies noted that off-hour presentation for patients with acute ischemic stroke was associated with significantly higher short-term mortality.19 Our results of increased weekend mortality corroborate that found in these two meta-analyses. However, our study differs in that we specifically examined only weekend mortality and did not include after-hours care on weekdays, which was included in the off-hour mortality in the other meta-analyses.18,19
Differences in healthcare worker staffing between weekends and weekdays have been proposed to contribute to the observed increase in mortality.7,16,20 Data indicate that lower levels of nursing are associated with increased mortality.10,21-23 The presence of less experienced and/or fewer physician specialists may contribute to increases in mortality.24-26 Fewer or less experienced staff during weekends may contribute to inadequacies in patient handovers and/or handoffs, delays in patient assessment and/or interventions, and overall continuity of care for newly admitted patients.27-33
Our data show little conclusive evidence that the weekend mortality versus weekday mortality vary by staffing level differences. While the estimated RR of mortality differs in magnitude for facilities with no difference in weekend and weekday staffing versus those that have a difference in staffing levels, both estimate an increased mortality on weekends, and the difference in these effects is not statistically significant. It should be noted that there was no difference in mortality for weekend (versus weekday) patients where there was no difference between weekend and weekday staffing; these studies were typically in high acuity units or centers where the general expectation is for 24/7/365 uniform staffing coverage.
A decrease in the use of interventions and/or procedures on weekends has been suggested to contribute to increases in mortality for patients admitted on the weekends.34 Several studies have associated lower weekend rates to higher mortality for a variety of interventions,13,35-37 although some other studies have suggested that lower procedure rates on weekends have no effect on mortality.38-40 Lower diagnostic procedure weekend rates linked to higher mortality rates may exacerbate underlying healthcare disparities.41 Our results do not conclusively show that a decrease rate of intervention and/or procedures for weekends patients is associated with a higher risk of mortality for weekends compared to weekdays.
Delays in intervention and/or procedure on weekends have also been suggested to contribute to increases in mortality.34,42 Similar to that seen with lower rates of diagnostic or therapeutic intervention and/or procedure performed on weekends, delays in potentially critical intervention and/or procedures might ultimately manifest as an increase in mortality.43 Patients admitted to the hospital on weekends and requiring an early procedure were less likely to receive it within 2 days of admission.42 Several studies have shown an association between delays in diagnostic or therapeutic intervention and/or procedure on weekends to a higher hospital inpatient mortality35,42,44,45; however, some data suggested that a delay in time to procedure on weekends may not always be associated with increased mortality.46 Depending on the procedure, there may be a threshold below which the effect of reducing delay times will have no effect on mortality rates.47,48
Patients admitted on the weekends may be different (in the severity of illness and/or comorbidities) than those admitted during the workweek and these potential differences may be a factor for increases in mortality for weekend patients. Whether there is a selection bias for weekend versus weekday patients is not clear.34 This is a complex issue as there is significant heterogeneity in patient case mix depending on the specific disease or condition studied. For instance, one would expect that weekend trauma patients would be different than those seen during the regular workweek.49 Some large scale studies suggest that weekend patients may not be more sick than weekday patients and that any increase in weekend mortality is probably not due to factors such as severity of illness.1,7 Although we were unable to determine if there was an overall difference in illness severity between weekend and weekday patients due to the wide variety of assessments used for illness severity, our results showed statistically comparable higher mortality rate on the weekends regardless of whether the illness severity was higher, the same, or mixed between weekend and weekday patients, suggesting that general illness severity per se may not be as important as the weekend effect on mortality; however, illness severity may still have an important effect on mortality for more specific subgroups (eg, trauma).49
There are several implications of our results. We found a mean increased RR mortality of approximately 19% for patients admitted on the weekends, a number similar to one of the largest published observational studies containing almost 5 million subjects.2 Even if we took a more conservative estimate of 10% increased risk of weekend mortality, this would be equivalent to an excess of 25,000 preventable deaths per year. If the weekend effect were to be placed in context of a public health issue, the weekend effect would be the number 8 cause of death below the 29,000 deaths due to gun violence, but above the 20,000 deaths resulting from sexual behavior (sexual transmitted diseases) in 2000.3, 50,51 Although our data suggest that staffing shortfalls and decreases or delays for procedures on weekends may be associated with an increased mortality for patients admitted on the weekends, further large-scale studies are needed to confirm these findings. Increasing nurse and physician staffing levels and skill mix to cover any potential shortfall on weekends may be expensive, although theoretically, there may be savings accrued from reduced adverse events and shorter length of stay.26,52 Changes to weekend care might only benefit daytime hospitalizations because some studies have shown increased mortality during nighttime regardless of weekend or weekday admission.53
Several methodologic points in our study need to be clarified. We excluded many studies which examined the relationship of off-hours or after-hours admissions and mortality as off-hours studies typically combined weekend and after-hours weekday data. Some studies suggest that off-hour admission may be associated with increased mortality and delays in time for critical procedures during off-hours.18,19 This is a complex topic, but it is clear that the risks of hospitalization vary not just by the day of the week but also by time of the day.54 The use of meta-analyses of nonrandomized trials has been somewhat controversial,55,56 and there may be significant bias or confounding in the pooling of highly varied studies. It is important to keep in mind that there are very different definitions of weekends, populations studied, and measures of mortality rates, even as the pooled statistic suggests a homogeneity among the studies that does not exist.
There are several limitations to our study. Our systematic review may be seen as limited as we included only English language papers. In addition, we did not search nontraditional sources and abstracts. We accepted the definition of a weekend as defined by the original study, which resulted in varied definitions of weekend time period and mortality. There was a lack of specific data on staffing patterns and procedures in many studies, particularly those using databases. We were not able to further subdivide our analysis by admitting service. We were not able to undertake a subgroup analysis by country or continent, which may have implications on the effect of different healthcare systems on healthcare quality. It is unclear whether correlations in our study are a direct consequence of poorer weekend care or are the result of other unknown or unexamined differences between weekend and weekday patient populations.34,57 For instance, there may be other global factors (higher rates of medical errors, higher hospital volumes) which may not be specifically related to weekend care and therefore not been accounted for in many of the studies we examined.10,27,58-61 There may be potential bias of patient phenotypes (are weekend patients different than weekday patients?) admitted on the weekend. Holidays were included in the weekend data and it is not clear how this would affect our findings as some data suggest that there is a significantly higher mortality rate on holidays (versus weekends or weekdays),61 while other data do not.62 There was no universal definition for the timeframe for a weekend and as such, we had to rely on the original article for their determination and definition of weekend versus weekday death.
In summary, our meta-analysis suggests that hospital inpatients admitted during the weekend have a significantly increased mortality compared with those admitted on weekday. While none of our subgroup analyses showed strong evidence on effect modification, the interpretation of these results is hampered by the relatively small number of studies. Further research should be directed to determine the presence of causality between various factors purported to affect mortality and it is possible that we ultimately find that the weekend effect may exist for some but not all patients.
Acknowledgments
The authors would like to acknowledge Jaime Blanck, MLIS, MPA, AHIP, Clinical Informationist, Welch Medical Library, for her invaluable assistance in undertaking the literature searches for this manuscript.
Disclosure
This manuscript has been supported by the Department of Anesthesiology and Critical Care Medicine; The Johns Hopkins School of Medicine; Baltimore, Maryland. There are no relevant conflicts of interests.
1. Aylin P, Yunus A, Bottle A, Majeed A, Bell D. Weekend mortality for emergency
admissions. A large, multicentre study. Qual Saf Health Care. 2010;19(3):213-217. PubMed
2. Handel AE, Patel SV, Skingsley A, Bramley K, Sobieski R, Ramagopalan SV.
Weekend admissions as an independent predictor of mortality: an analysis of
Scottish hospital admissions. BMJ Open. 2012;2(6): pii: e001789. PubMed
3. Ricciardi R, Roberts PL, Read TE, Baxter NN, Marcello PW, Schoetz DJ. Mortality
rate after nonelective hospital admission. Arch Surg. 2011;146(5):545-551. PubMed
4. Fonarow GC, Abraham WT, Albert NM, et al. Day of admission and clinical
outcomes for patients hospitalized for heart failure: findings from the Organized
Program to Initiate Lifesaving Treatment in Hospitalized Patients With Heart
Failure (OPTIMIZE-HF). Circ Heart Fail. 2008;1(1):50-57. PubMed
5. Hoh BL, Chi YY, Waters MF, Mocco J, Barker FG 2nd. Effect of weekend compared
with weekday stroke admission on thrombolytic use, in-hospital mortality,
discharge disposition, hospital charges, and length of stay in the Nationwide Inpatient
Sample Database, 2002 to 2007. Stroke. 2010;41(10):2323-2328. PubMed
6. Koike S, Tanabe S, Ogawa T, et al. Effect of time and day of admission on 1-month
survival and neurologically favourable 1-month survival in out-of-hospital cardiopulmonary
arrest patients. Resuscitation. 2011;82(7):863-868. PubMed
7. Bell CM, Redelmeier DA. Mortality among patients admitted to hospitals on
weekends as compared with weekdays. N Engl J Med. 2001;345(9):663-668. PubMed
8. Freemantle N, Richardson M, Wood J, et al. Weekend hospitalization and additional
risk of death: an analysis of inpatient data. J R Soc Med. 2012;105(2):74-84. PubMed
9. Schilling PL, Campbell DA Jr, Englesbe MJ, Davis MM. A comparison of in-hospital
mortality risk conferred by high hospital occupancy, differences in nurse
staffing levels, weekend admission, and seasonal influenza. Med Care. 2010;48(3):
224-232. PubMed
10. Wong HJ, Morra D. Excellent hospital care for all: open and operating 24/7. J Gen
Intern Med. 2011;26(9):1050-1052. PubMed
11. Dorn SD, Shah ND, Berg BP, Naessens JM. Effect of weekend hospital admission
on gastrointestinal hemorrhage outcomes. Dig Dis Sci. 2010;55(6):1658-1666. PubMed
12. Kostis WJ, Demissie K, Marcella SW, et al. Weekend versus weekday admission
and mortality from myocardial infarction. N Engl J Med. 2007;356(11):1099-1109. PubMed
13. McKinney JS, Deng Y, Kasner SE, Kostis JB; Myocardial Infarction Data Acquisition
System (MIDAS 15) Study Group. Comprehensive stroke centers overcome
the weekend versus weekday gap in stroke treatment and mortality. Stroke.
2011;42(9):2403-2409. PubMed
14. Margulis AV, Pladevall M, Riera-Guardia N, et al. Quality assessment of observational
studies in a drug-safety systematic review, comparison of two tools: the
Newcastle-Ottawa Scale and the RTI item bank. Clin Epidemiol. 2014;6:359-368. PubMed
15. Viechtbauer W. Conducting meta-analyses in R with the metafor package. J Stat
Softw. 2010;36(3):1-48.
16. Cavallazzi R, Marik PE, Hirani A, Pachinburavan M, Vasu TS, Leiby BE. Association
between time of admission to the ICU and mortality: a systematic review and
metaanalysis. Chest. 2010;138(1):68-75. PubMed
17. de Cordova PB, Phibbs CS, Bartel AP, Stone PW. Twenty-four/seven: a
mixed-method systematic review of the off-shift literature. J Adv Nurs.
2012;68(7):1454-1468. PubMed
18. Zhou Y, Li W, Herath C, Xia J, Hu B, Song F, Cao S, Lu Z. Off-hour admission and
mortality risk for 28 specific diseases: a systematic review and meta-analysis of 251
cohorts. J Am Heart Assoc. 2016;5(3):e003102. PubMed
19. Sorita A, Ahmed A, Starr SR, et al. Off-hour presentation and outcomes in
patients with acute myocardial infarction: systematic review and meta-analysis.
BMJ. 2014;348:f7393. PubMed
20. Ricciardi R, Nelson J, Roberts PL, Marcello PW, Read TE, Schoetz DJ. Is the
presence of medical trainees associated with increased mortality with weekend
admission? BMC Med Educ. 2014;14(1):4. PubMed
21. Needleman J, Buerhaus P, Pankratz VS, Leibson CL, Stevens SR, Harris M. Nurse
staffing and inpatient hospital mortality. N Engl J Med. 2011;364(11):1037-1045. PubMed
22. Aiken LH, Clarke SP, Sloane DM, Sochalski J, Silber JH. Hospital nurse
staffing and patient mortality, nurse burnout, and job dissatisfaction. JAMA.
2002;288(16):1987-1993. PubMed
23. Hamilton KE, Redshaw ME, Tarnow-Mordi W. Nurse staffing in relation to
risk-adjusted mortality in neonatal care. Arch Dis Child Fetal Neonatal Ed.
2007;92(2):F99-F103. PubMed
766 An Official Publication of the Society of Hospital Medicine Journal of Hospital Medicine Vol 12 | No 9 | September 2017
Pauls et al | The Weekend Effect: A Meta-Analysis
24. Haut ER, Chang DC, Efron DT, Cornwell EE 3rd. Injured patients have lower
mortality when treated by “full-time” trauma surgeons vs. surgeons who cover
trauma “part-time”. J Trauma. 2006;61(2):272-278. PubMed
25. Wallace DJ, Angus DC, Barnato AE, Kramer AA, Kahn JM. Nighttime intensivist
staffing and mortality among critically ill patients. N Engl J Med.
2012;366(22):2093-2101. PubMed
26. Pronovost PJ, Angus DC, Dorman T, Robinson KA, Dremsizov TT, Young TL.
Physician staffing patterns and clinical outcomes in critically ill patients: a systematic
review. JAMA. 2002;288(17):2151-2162. PubMed
27. Weissman JS, Rothschild JM, Bendavid E, et al. Hospital workload and adverse
events. Med Care. 2007;45(5):448-455. PubMed
28. Hamilton P, Eschiti VS, Hernandez K, Neill D. Differences between weekend and
weekday nurse work environments and patient outcomes: a focus group approach
to model testing. J Perinat Neonatal Nurs. 2007;21(4):331-341. PubMed
29. Johner AM, Merchant S, Aslani N, et al Acute general surgery in Canada: a survey
of current handover practices. Can J Surg. 2013;56(3):E24-E28. PubMed
30. de Cordova PB, Phibbs CS, Stone PW. Perceptions and observations of off-shift
nursing. J Nurs Manag. 2013;21(2):283-292. PubMed
31. Pfeffer PE, Nazareth D, Main N, Hardoon S, Choudhury AB. Are weekend
handovers of adequate quality for the on-call general medical team? Clin Med.
2011;11(6):536-540. PubMed
32. Eschiti V, Hamilton P. Off-peak nurse staffing: critical-care nurses speak. Dimens
Crit Care Nurs. 2011;30(1):62-69. PubMed
33. Button LA, Roberts SE, Evans PA, et al. Hospitalized incidence and case fatality
for upper gastrointestinal bleeding from 1999 to 2007: a record linkage study. Aliment
Pharmacol Ther. 2011;33(1):64-76. PubMed
34. Becker DJ. Weekend hospitalization and mortality: a critical review. Expert Rev
Pharmacoecon Outcomes Res. 2008;8(1):23-26. PubMed
35. Deshmukh A, Pant S, Kumar G, Bursac Z, Paydak H, Mehta JL. Comparison of
outcomes of weekend versus weekday admissions for atrial fibrillation. Am J Cardiol.
2012;110(2):208-211. PubMed
36. Nanchal R, Kumar G, Taneja A, et al. Pulmonary embolism: the weekend effect.
Chest. 2012;142(3):690-696. PubMed
37. Palmer WL, Bottle A, Davie C, Vincent CA, Aylin P. Dying for the weekend: a
retrospective cohort study on the association between day of hospital presentation
and the quality and safety of stroke care. Arch Neurol. 2012;69(10):1296-1302. PubMed
38. Dasenbrock HH, Pradilla G, Witham TF, Gokaslan ZL, Bydon A. The impact
of weekend hospital admission on the timing of intervention and outcomes after
surgery for spinal metastases. Neurosurgery. 2012;70(3):586-593. PubMed
39. Jairath V, Kahan BC, Logan RF, et al. Mortality from acute upper gastrointestinal
bleeding in the United Kingdom: does it display a “weekend effect”? Am J Gastroenterol.
2011;106(9):1621-1628. PubMed
40. Myers RP, Kaplan GG, Shaheen AM. The effect of weekend versus weekday
admission on outcomes of esophageal variceal hemorrhage. Can J Gastroenterol.
2009;23(7):495-501. PubMed
41. Rudd AG, Hoffman A, Down C, Pearson M, Lowe D. Access to stroke care in
England, Wales and Northern Ireland: the effect of age, gender and weekend admission.
Age Ageing. 2007;36(3):247-255. PubMed
42. Lapointe-Shaw L, Abushomar H, Chen XK, et al. Care and outcomes of patients
with cancer admitted to the hospital on weekends and holidays: a retrospective
cohort study. J Natl Compr Canc Netw. 2016;14(7):867-874. PubMed
43. Chan PS, Krumholz HM, Nichol G, Nallamothu BK; American Heart Association
National Registry of Cardiopulmonary Resuscitation Investigators. Delayed time to
defibrillation after in-hospital cardiac arrest. N Engl J Med. 2008;358(1):9-17. PubMed
44. McGuire KJ, Bernstein J, Polsky D, Silber JH. The 2004 Marshall Urist Award:
Delays until surgery after hip fracture increases mortality. Clin Orthop Relat Res.
2004;(428):294-301. PubMed
45. Krüth P, Zeymer U, Gitt A, et al. Influence of presentation at the weekend on
treatment and outcome in ST-elevation myocardial infarction in hospitals with
catheterization laboratories. Clin Res Cardiol. 2008;97(10):742-747. PubMed
46. Jneid H, Fonarow GC, Cannon CP, et al. Impact of time of presentation on the care
and outcomes of acute myocardial infarction. Circulation. 2008;117(19):2502-2509. PubMed
47. Menees DS, Peterson ED, Wang Y, et al. Door-to-balloon time and mortality
among patients undergoing primary PCI. N Engl J Med. 2013;369(10):901-909. PubMed
48. Bates ER, Jacobs AK. Time to treatment in patients with STEMI. N Engl J Med.
2013;369(10):889-892. PubMed
49. Carmody IC, Romero J, Velmahos GC. Day for night: should we staff a trauma
center like a nightclub? Am Surg. 2002;68(12):1048-1051. PubMed
50. Mokdad AH, Marks JS, Stroup DF, Gerberding JL. Actual causes of death in the
United States, 2000. JAMA. 2004;291(10):1238-1245. PubMed
51. McCook A. More hospital deaths on weekends. http://www.reuters.com/article/
2011/05/20/us-more-hospital-deaths-weekends-idUSTRE74J5RM20110520.
Accessed March 7, 2017.
52. Mourad M, Adler J. Safe, high quality care around the clock: what will it take to
get us there? J Gen Intern Med. 2011;26(9):948-950. PubMed
53. Magid DJ, Wang Y, Herrin J, et al. Relationship between time of day, day of week,
timeliness of reperfusion, and in-hospital mortality for patients with acute ST-segment
elevation myocardial infarction. JAMA. 2005;294(7):803-812. PubMed
54. Coiera E, Wang Y, Magrabi F, Concha OP, Gallego B, Runciman W. Predicting
the cumulative risk of death during hospitalization by modeling weekend, weekday
and diurnal mortality risks. BMC Health Serv Res. 2014;14:226. PubMed
55. Greenland S. Can meta-analysis be salvaged? Am J Epidemiol. 1994;140(9):783-787. PubMed
56. Shapiro S. Meta-analysis/Shmeta-analysis. Am J Epidemiol. 1994;140(9):771-778. PubMed
57. Halm EA, Chassin MR. Why do hospital death rates vary? N Engl J Med.
2001;345(9):692-694. PubMed
58. Birkmeyer JD, Siewers AE, Finlayson EV, et al. Hospital volume and surgical mortality
in the United States. N Engl J Med. 2002;346(15):1128-1137. PubMed
59. Kaier K, Mutters NT, Frank U. Bed occupancy rates and hospital-acquired infections
– should beds be kept empty? Clin Microbiol Infect. 2012;18(10):941-945. PubMed
60. Chrusch CA, Olafson KP, McMillian PM, Roberts DE, Gray PR. High occupancy
increases the risk of early death or readmission after transfer from intensive care.
Crit Care Med. 2009;37(10):2753-2758. PubMed
61. Foss NB, Kehlet H. Short-term mortality in hip fracture patients admitted during
weekends and holidays. Br J Anaesth. 2006;96(4):450-454. PubMed
62. Daugaard CL, Jørgensen HL, Riis T, Lauritzen JB, Duus BR, van der Mark S. Is
mortality after hip fracture associated with surgical delay or admission during
weekends and public holidays? A retrospective study of 38,020 patients. Acta Orthop.
2012;83(6):609-613. PubMed
© 2017 Society of Hospital Medicine
Dashboards and P4P in VTE Prophylaxis
The Affordable Care Act explicitly outlines improving the value of healthcare by increasing quality and decreasing costs. It emphasizes value‐based purchasing, the transparency of performance metrics, and the use of payment incentives to reward quality.[1, 2] Venous thromboembolism (VTE) prophylaxis is one of these publicly reported performance measures. The National Quality Forum recommends that each patient be evaluated on hospital admission and during their hospitalization for VTE risk level and for appropriate thromboprophylaxis to be used, if required.[3] Similarly, the Joint Commission includes appropriate VTE prophylaxis in its Core Measures.[4] Patient experience and performance metrics, including VTE prophylaxis, constitute the hospital value‐based purchasing (VBP) component of healthcare reform.[5] For a hypothetical 327‐bed hospital, an estimated $1.7 million of a hospital's inpatient payments from Medicare will be at risk from VBP alone.[2]
VTE prophylaxis is a common target of quality improvement projects. Effective, safe, and cost‐effective measures to prevent VTE exist, including pharmacologic and mechanical prophylaxis.[6, 7] Despite these measures, compliance rates are often below 50%.[8] Different interventions have been pursued to ensure appropriate VTE prophylaxis, including computerized provider order entry (CPOE), electronic alerts, mandatory VTE risk assessment and prophylaxis, and provider education campaigns.[9] Recent studies show that CPOE systems with mandatory fields can increase VTE prophylaxis rates to above 80%, yet the goal of a high reliability health system is for 100% of patients to receive recommended therapy.[10, 11, 12, 13, 14, 15] Interventions to improve prophylaxis rates that have included multiple strategies, such as computerized order sets, feedback, and education, have been the most effective, increasing compliance to above 90%.[9, 11, 16] These systems can be enhanced with additional interventions such as providing individualized provider education and feedback, understanding of work flow, and ensuring patients receive the prescribed therapies.[12] For example, a physician dashboard could be employed to provide a snapshot and historical trend of key performance indicators using graphical displays and indicators.[17]
Dashboards and pay‐for‐performance programs have been increasingly used to increase the visibility of these metrics, provide feedback, visually display benchmarks and goals, and proactively monitor for achievements and setbacks.[18] Although these strategies are often addressed at departmental (or greater) levels, applying them at the level of the individual provider may assist hospitals in reducing preventable harm and achieving safety and quality goals, especially at higher benchmarks. With their expanding role, hospitalists provide a key opportunity to lead improvement efforts and to study the impact of dashboards and pay‐for performance at the provider level to achieve VTE prophylaxis performance targets. Hospitalists are often the front‐line provider for inpatients and deliver up to 70% of inpatient general medical services.[19] The objective of our study was to evaluate the impact of providing individual provider feedback and employing a pay‐for‐performance program on baseline performance of VTE prophylaxis among hospitalists. We hypothesized that performance feedback through the use of a dashboard would increase appropriate VTE prophylaxis, and this effect would be further augmented by incorporation of a pay‐for‐performance program.
METHODS
Hospitalist Dashboard
In 2010, hospitalist program leaders met with hospital administrators to create a hospitalist dashboard that would provide regularly updated summaries of performance measures for individual hospitalists. The final set of metrics identified included appropriate VTE prophylaxis, length of stay, patients discharged per day, discharges before 3 pm, depth of coding, patient satisfaction, readmissions, communication with the primary care provider, and time to signature for discharge summaries (Figure 1A). The dashboard was introduced at a general hospitalist meeting during which its purpose, methodology, and accessibility were described; it was subsequently implemented in January 2011.

Benchmarks were established for each metric, standardized to establish a scale ranging from 1 through 9, and incorporated into the dashboard (Figure 1A). Higher scores (creating a larger geometric shape) were desirable. For the VTE prophylaxis measure, scores of 1 through 9 corresponded to <60%, 60% to 64.9%, 65% to 69.9%, 70% to 74.9%, 75% to 79.9%, 80% to 84.9%, 85% to 89.9%, 90% to 94.9%, and 95% American College of Chest Physicians (ACCP)‐compliant VTE prophylaxis, respectively.[12, 20] Each provider was able to access the aggregated dashboard (showing the group mean) and his/her individualized dashboard using an individualized login and password for the institutional portal. This portal is used during the provider's workflow, including medical record review and order entry. Both a polygonal summary graphic (Figure 1A) and trend (Figure 1B) view of the dashboard were available to the provider. A comparison of the individual provider to the hospitalist group average was displayed (Figure 1A). At monthly program meetings, the dashboard, group results, and trends were discussed.
Venous Thromboembolism Prophylaxis Compliance
Our study was performed in a tertiary academic medical center with an approximately 20‐member hospitalist group (the precise membership varied over time), whose responsibilities include, among other clinical duties, staffing a 17‐bed general medicine unit with telemetry. The scope of diagnoses and acuity of patients admitted to the hospitalist service is similar to the housestaff services. Some hospitalist faculty serve both as hospitalist and nonhospitalist general medicine service team attendings, but the comparison groups were staffed by hospitalists for <20% of the time. For admissions, all hospitalists use a standardized general medicine admission order set that is integrated into the CPOE system (Sunrise Clinical Manager; Allscripts, Chicago, IL) and completed for all admitted patients. A mandatory VTE risk screen, which includes an assessment of VTE risk factors and pharmacological prophylaxis contraindications, must be completed by the ordering physician as part of this order set (Figure 2A). The system then prompts the provider with a risk‐appropriate VTE prophylaxis recommendation that the provider may subsequently order, including mechanical prophylaxis (Figure 2B). Based on ACCP VTE prevention guidelines, risk‐appropriate prophylaxis was determined using an electronic algorithm that categorized patients into risk categories based on the presence of major VTE risk factors (Figure 2A).[12, 15, 20] If none of these were present, the provider selected No major risk factors known. Both an assessment of current use of anticoagulation and a clinically high risk of bleeding were also included (Figure 2A). If none of these were present, the provider selected No contraindications known. This algorithm is published in detail elsewhere and has been shown to not increase major bleeding episodes.[12, 15] The VTE risk assessment, but not the VTE order itself, was a mandatory field. This allowed the physician discretion to choose among various pharmacological agents and mechanical mechanisms based on patient and physician preferences.
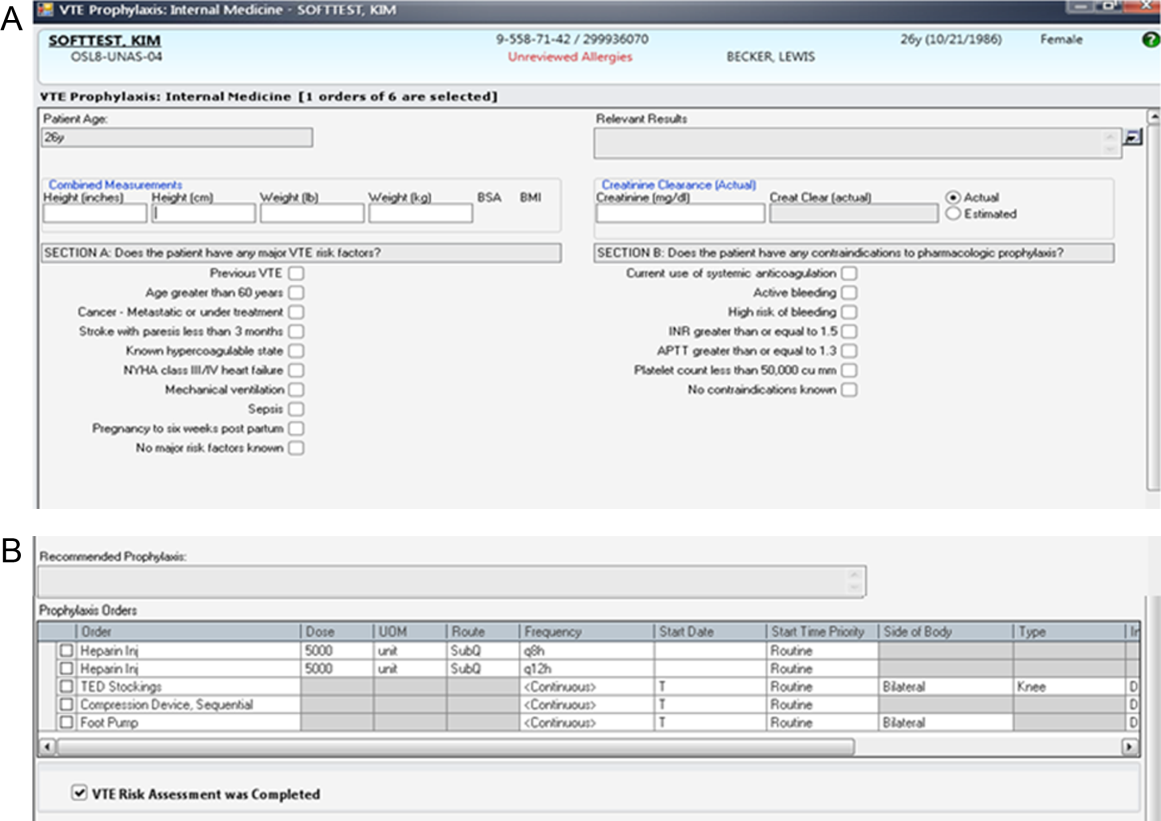
Compliance of risk‐appropriate VTE prophylaxis was determined 24 hours after the admission order set was completed using an automated electronic query of the CPOE system. Low molecular‐weight heparin prescription was included in the compliance algorithm as acceptable prophylaxis. Prescription of pharmacological VTE prophylaxis when a contraindication was present was considered noncompliant. The metric was assigned to the attending physician who billed for the first inpatient encounter.
Pay‐for‐Performance Program
In July 2011, a pay‐for‐performance program was added to the dashboard. All full‐time and part‐time hospitalists were eligible. The financial incentive was determined according to hospital priority and funds available. The VTE prophylaxis metric was prorated by clinical effort, with a maximum of $0.50 per work relative value unit (RVU). To optimize performance, a threshold of 80% compliance had to be surpassed before any payment was made. Progressively increasing percentages of the incentive were earned as compliance increased from 80% to 100%, corresponding to dashboard scores of 6, 7, 8, and 9: <80% (scores 1 to 5)=no payment; 80% to 84.9% (score 6)=$0.125 per RVU; 85% to 89.9% (score 7)=$0.25 per RVU; 90% to 94.9% (score 8)=$0.375 per RVU; and 95% (score 9)=$0.50 per RVU (maximum incentive). Payments were accrued quarterly and paid at the end of the fiscal year as a cumulative, separate performance supplement.
Individualized physician feedback through the dashboard was continued during the pay‐for‐performance period. Average hospitalist group compliance continued to be displayed on the electronic dashboard and was explicitly reviewed at monthly hospitalist meetings.
The VTE prophylaxis order set and data collection and analyses were approved by the Johns Hopkins Medicine Institutional Review Board. The dashboard and pay‐for‐performance program were initiated by the institution as part of a proof of concept quality improvement project.
Analysis
We examined all inpatient admissions to the hospitalist unit from 2008 to 2012. We included patients admitted to and discharged from the hospitalist unit and excluded patients transferred into/out of the unit and encounters with a length of stay <24 hours. VTE prophylaxis orders were queried from the CPOE system 24 hours after the patient was admitted to determine compliance.
After allowing for a run‐in period (2008), we analyzed the change in percent compliance for 3 periods: (1) CPOE‐based VTE order set alone (baseline [BASE], January 2009 to December 2010); (2) group and individual physician feedback using the dashboard (dashboard only [DASH], January to June 2011); and (3) dashboard tied to the pay‐for‐performance program (dashboard with pay‐for‐performance [P4P], July 2011 to December 2012). The CPOE‐based VTE order set was used during all 3 periods. We used the other medical services as a control to ensure that there were no temporal trends toward improved prophylaxis on a service without the intervention. VTE prophylaxis compliance was examined by calculating percent compliance using the same algorithm for the 4 resident‐staffed general medicine service teams at our institution, which utilized the same CPOE system but did not receive the dashboard or pay‐for‐performance interventions. We used locally weighted scatterplot smoothing, a locally weighted regression of percent compliance over time, to graphically display changes in group compliance over time.[21, 22]
We also performed linear regression to assess the rate of change in group compliance and included spline terms that allowed slope to vary for each of the 3 time periods.[23, 24] Clustered analysis accounted for potentially correlated serial measurements of compliance for an individual provider. A separate analysis examined the effect of provider turnover and individual provider improvement during each of the 3 periods. Tests of significance were 2‐sided, with an level of 0.05. Statistical analysis was performed using Stata 12.1 (StataCorp LP, College Station, TX).
RESULTS
Venous Thromboembolism Prophylaxis Compliance
We analyzed 3144 inpatient admissions by 38 hospitalists from 2009 to 2012. The 5 most frequent coded diagnoses were heart failure, acute kidney failure, syncope, pneumonia, and chest pain. Patients had a median length of stay of 3 days [interquartile range: 26]. During the dashboard‐only period, on average, providers improved in compliance by 4% (95% confidence interval [CI]: 35; P<0.001). With the addition of the pay‐for‐performance program, providers improved by an additional 4% (95% CI: 35; P<0.001). Group compliance significantly improved from 86% (95% CI: 8588) during the BASE period of the CPOE‐based VTE order set to 90% (95% CI: 8893) during the DASH period (P=0.01) and 94% (95% CI: 9396) during the subsequent P4P program (P=0.01) (Figure 3). Both inappropriate prophylaxis and lack of prophylaxis, when indicated, resulted in a non‐compliance rating. During the 3 periods, inappropriate prophylaxis decreased from 7.9% to 6.2% to 2.6% during the BASE, DASH, and subsequent P4P periods, respectively. Similarly, lack of prophylaxis when indicated decreased from 6.1% to 3.2% to 3.1% during the BASE, DASH, and subsequent P4P periods, respectively.
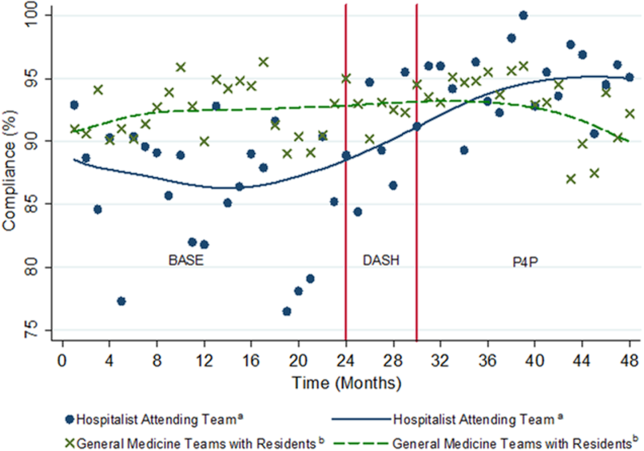
The average compliance of the 4 non‐hospitalist general medicine service teams was initially higher than that of the hospitalist service during the CPOE‐based VTE order set (90%) and DASH (92%) periods, but subsequently plateaued and was exceeded by the hospitalist service during the combined P4P (92%) period (Figure 3). However, there was no statistically significant difference between the general medicine service teams and hospitalist service during the DASH (P=0.15) and subsequent P4P (P=0.76) periods.
We also analyzed the rate of VTE prophylaxis compliance improvement (slope) with cut points at each time period transition (Figure 3). Risk‐appropriate VTE prophylaxis during the BASE period did not exhibit significant improvement as indicated by the slope (P=0.23) (Figure 3). In contrast, during the DASH period, VTE prophylaxis compliance significantly increased by 1.58% per month (95% CI: 0.41‐2.76; P=0.01). The addition of the P4P program, however, did not further significantly increase the rate of compliance (P=0.78).
A subgroup analysis restricted to the 19 providers present during all 3 periods was performed to assess for potential confounding from physician turnover. The percent compliance increased in a similar fashion: BASE period of CPOE‐based VTE order set, 85% (95% CI: 8386); DASH, 90% (95% CI: 8893); and P4P, 94% (95% CI: 9296).
Pay‐for‐Performance Program
Nineteen providers met the threshold for pay‐for‐performance (80% appropriate VTE prophylaxis), with 9 providers in the intermediate categories (80%94.9%) and 10 in the full incentive category (95%). The mean individual payout for the incentive was $633 (standard deviation 350), with a total disbursement of $12,029. The majority of payments (17 of 19) were under $1000.
DISCUSSION
A key component of healthcare reform has been value‐based purchasing, which emphasizes extrinsic motivation through the transparency of performance metrics and use of payment incentives to reward quality. Our study evaluates the impact of both extrinsic (payments) and intrinsic (professionalism and peer norms) motivation. It specifically attributed an individual performance metric, VTE prophylaxis, to an attending physician, provided both individualized and group feedback using an electronic dashboard, and incorporated a pay‐for‐performance program. Prescription of risk‐appropriate VTE prophylaxis significantly increased with the implementation of the dashboard and subsequent pay‐for performance program. The fastest rate of improvement occurred after the addition of the dashboard. Sensitivity analyses for provider turnover and comparisons to the general medicine services showed our results to be independent of a general trend of improvement, both at the provider and institutional levels.
Our prior studies demonstrated that order sets significantly improve performance, from a baseline compliance of risk‐appropriate VTE prophylaxis of 66% to 84%.[13, 15, 25] In the current study, compliance was relatively flat during the BASE period, which included these order sets. The greatest rate of continued improvement in compliance occurred during the DASH period, emphasizing both the importance of provider feedback and receptivity and adaptability in the prescribing behavior of hospitalists. Because the goal of a high‐reliability health system is for 100% of patients to receive recommended therapy, multiple approaches are necessary for success.
Nationally, benchmarks for performance measures continue to be raised, with the highest performers achieving above 95%.[26] Additional interventions, such as dashboards and pay‐for‐performance programs, supplement CPOE systems to achieve high reliability. In our study, the compliance rate during the baseline period, which included a CPOE‐based, clinical support‐enabled VTE order set, was 86%. Initially the compliance of the general medicine teams with residents exceeded that of the hospitalist attending teams, which may reflect a greater willingness of resident teams to comply with order sets and automated recommendations. This emphasizes the importance of continuous individual feedback and provider education at the attending physician level to enhance both guideline compliance and decrease provider care variation. Ultimately, with the addition of the dashboard and subsequent pay‐for‐performance program, compliance was increased to 90% and 94%, respectively. Although the major mechanism used by policymakers to improve quality of care is extrinsic motivation, this study demonstrates that intrinsic motivation through peer norms can enhance extrinsic efforts and may be more influential. Both of these programs, dashboards and pay‐for‐performance, may ultimately assist institutions in changing provider behavior and achieving these harder‐to‐achieve higher benchmarks.
We recognize that there are several limitations to our study. First, this is a single‐site program limited to an attending‐physician‐only service. There was strong data support and a defined CPOE algorithm for this initiative. Multi‐site studies will need to overcome the additional challenges of varying service structures and electronic medical record and provider order entry systems. Second, it is difficult to show actual changes in VTE events over time with appropriate prophylaxis. Although VTE prophylaxis is recommended for patients with VTE risk factors, there are conflicting findings about whether prophylaxis prevents VTE events in lower‐risk patients, and current studies suggest that most patients with VTE events are severely ill and develop VTE despite receiving prophylaxis.[27, 28, 29] Our study was underpowered to detect these potential differences in VTE rates, and although the algorithm has been shown to not increase bleeding rates, we did not measure bleeding rates during this study.[12, 15] Our institutional experience suggests that the majority of VTE events occur despite appropriate prophylaxis.[30] Also, VTE prophylaxis may be ordered, but intervening events, such as procedures and changes in risk status or patient refusal, may prevent patients from receiving appropriate prophylaxis.[31, 32] Similarly, hospitals with higher quality scores have higher VTE prophylaxis rates but worse risk‐adjusted VTE rates, which may result from increased surveillance for VTE, suggesting surveillance bias limits the usefulness of the VTE quality measure.[33, 34] Nevertheless, VTE prophylaxis remains a publicly reported Core Measure tied to financial incentives.[4, 5] Third, there may be an unmeasured factor specific to the hospitalist program, which could potentially account for an overall improvement in quality of care. Although the rate of increase in appropriate prophylaxis was not statistically significant during the baseline period, there did appear to be some improvement in prophylaxis toward the end of the period. However, there were no other VTE‐related provider feedback programs being simultaneously pursued during this study. VTE prophylaxis for the non‐hospitalist services showed a relatively stable, non‐increasing compliance rate for the general medical services. Although it was possible for successful residents to age into the hospitalist service, thereby improving rates of prophylaxis based on changes in group makeup, our subgroup analysis of the providers present throughout all phases of the study showed our results to be robust. Similarly, there may have been a cross‐contamination effect of hospitalist faculty who attended on both hospitalist and non‐hospitalist general medicine service teams. This, however, would attenuate any impact of the programs, and thus the effects may in fact be greater than reported. Fourth, establishment of both the dashboard and pay‐for‐performance program required significant institutional and program leadership and resources. To be successful, the dashboard must be in the provider's workflow, transparent, minimize reporter burden, use existing systems, and be actively fed back to providers, ideally those directly entering orders. Our greatest rate of improvement occurred during the feedback‐only phase of this study, emphasizing the importance of physician feedback, provider‐level accountability, and engagement. We suspect that the relatively modest pay‐for‐performance incentive served mainly as a means of engaging providers in self‐monitoring, rather than as a means to change behavior through true incentivization. Although we did not track individual physician views of the dashboard, we reinforced trends, deviations, and expectations at regularly scheduled meetings and provided feedback and patient‐level data to individual providers. Fifth, the design of the pay‐for‐performance program may have also influenced its effectiveness. These types of programs may be more effective when they provide frequent visible, small payments rather than one large payment, and when the payment is framed as a loss rather than a gain.[35] Finally, physician champions and consistent feedback through departmental meetings or visual displays may be required for program success. The initial resources to create the dashboard, continued maintenance and monitoring of performance, and payment of financial incentives all require institutional commitment. A partnership of physicians, program leaders, and institutional administrators is necessary for both initial and continued success.
To achieve performance goals and benchmarks, multiple strategies that combine extrinsic and intrinsic motivation are necessary. As shown by our study, the use of a dashboard and pay‐for‐performance can be tailored to an institution's goals, in line with national standards. The specific goal (risk‐appropriate VTE prophylaxis) and benchmarks (80%, 85%, 90%, 95%) can be individualized to a particular institution. For example, if readmission rates are above target, readmissions could be added as a dashboard metric. The specific benchmark would be determined by historical trends and administrative targets. Similarly, the overall financial incentives could be adjusted based on the financial resources available. Other process measures, such as influenza vaccination screening and administration, could also be targeted. For all of these objectives, continued provider feedback and engagement are critical for progressive success, especially to decrease variability in care at the attending physician level. Incorporating the value‐based purchasing philosophy from the Affordable Care Act, our study suggests that the combination of standardized order sets, real‐time dashboards, and physician‐level incentives may assist hospitals in achieving quality and safety benchmarks, especially at higher targets.
Acknowledgements
The authors thank Meir Gottlieb, BS, from Salar Inc. for data support; Murali Padmanaban, BS, from Johns Hopkins University for his assistance in linking the administrative billing data with real‐time physician orders; and Hsin‐Chieh Yeh, PhD, from the Bloomberg School of Public Health for her statistical advice and additional review. We also thank Mr. Ronald R. Peterson, President, Johns Hopkins Health System and Johns Hopkins Hospital, for providing funding support for the physician incentive payments.
Disclosures: Drs. Michtalik and Brotman had full access to all of the data in the study and take responsibility for the integrity of the data and accuracy of the data analysis. Study concept and design: Drs. Michtalik, Streiff, Finkelstein, Pronovost, and Brotman. Acquisition of data: Drs. Michtalik, Streiff, Brotman and Mr. Carolan, Mr. Lau, Mrs. Durkin. Analysis and interpretation of data: Drs. Michtalik, Haut, Streiff, Brotman and Mr. Carolan, Mr. Lau. Drafting of the manuscript: Drs. Michtalik and Brotman. Critical revision of the manuscript for important intellectual content: Drs. Michtalik, Haut, Streiff, Finkelstein, Pronovost, Brotman and Mr. Carolan, Mr. Lau, Mrs. Durkin. Statistical analysis and supervision: Drs. Michtalik and Brotman. Obtaining funding: Drs. Streiff and Brotman. Technical support: Dr. Streiff and Mr. Carolan, Mr. Lau, Mrs. Durkin
This study was supported by a National Institutes of Health grant T32 HP10025‐17‐00 (Dr. Michtalik), the National Institutes of Health/Johns Hopkins Institute for Clinical and Translational Research KL2 Award 5KL2RR025006 (Dr. Michtalik), the Agency for Healthcare Research and Quality Mentored Clinical Scientist Development K08 Awards 1K08HS017952‐01 (Dr. Haut) and 1K08HS022331‐01A1 (Dr. Michtalik), and the Johns Hopkins Hospitalist Scholars Fund. The funders had no role in the design and conduct of the study; collection, management, analysis, and interpretation of the data; preparation, review, or approval of the manuscript; and decision to submit the manuscript for publication.
Dr. Haut receives royalties from Lippincott, Williams & Wilkins. Dr. Streiff has received research funding from Portola and Bristol Myers Squibb, honoraria for CME lectures from Sanofi‐Aventis and Ortho‐McNeil, consulted for Eisai, Daiichi‐Sankyo, Boerhinger‐Ingelheim, Janssen Healthcare, and Pfizer. Mr. Lau, Drs. Haut, Streiff, and Pronovost are supported by a contract from the Patient‐Centered Outcomes Research Institute (PCORI) titled Preventing Venous Thromboembolism: Empowering Patients and Enabling Patient‐Centered Care via Health Information Technology (CE‐12‐11‐4489). Dr. Brotman has received research support from Siemens Healthcare Diagnostics, Bristol‐Myers Squibb, the Agency for Healthcare Research and Quality, Centers for Medicare & Medicaid Services, the Amerigroup Corporation, and the Guerrieri Family Foundation. He has received honoraria from the Gerson Lehrman Group, the Dunn Group, and from Quantia Communications, and received royalties from McGraw‐Hill.
- Medicare Program, Centers for Medicare 76(88):26490–26547.
- . Quality meets finance: payments at risk with value‐based purchasing, readmission, and hospital‐acquired conditions force hospitalists to focus. Hospitalist. 2013;17(1):31.
- National Quality Forum. March 2009. Safe practices for better healthcare—2009 update. Available at: http://www.qualityforum.org/Publications/2009/03/Safe_Practices_for_Better_Healthcare%E2%80%932009_Update.aspx. Accessed November 1, 2014.
- Joint Commission on Accreditation of Healthcare Organizations. Approved: more options for hospital core measures. Jt Comm Perspect. 2009;29(4):1–6.
- Centers for Medicare 208(2):227–240.
- , . Thromboprophylaxis in nonsurgical patients. Hematology Am Soc Hematol Educ Program. 2012;2012:631–637.
- , , , et al. Venous thromboembolism risk and prophylaxis in the acute hospital care setting (ENDORSE study): a multinational cross‐sectional study. Lancet. 2008;371(9610):387–394.
- , . Practices to prevent venous thromboembolism: a brief review. BMJ Qual Saf. 2014;23(3):187–195.
- , , , et al. Improving hospital venous thromboembolism prophylaxis with electronic decision support. J Hosp Med. 2013;8(3):115–120.
- , , . Innovative approaches to increase deep vein thrombosis prophylaxis rate resulting in a decrease in hospital‐acquired deep vein thrombosis at a tertiary‐care teaching hospital. J Hosp Med. 2008;3(2):148–155.
- , , , et al. Lessons from the Johns Hopkins Multi‐Disciplinary Venous Thromboembolism (VTE) Prevention Collaborative. BMJ. 2012;344:e3935.
- , , , et al. Improved prophylaxis and decreased rates of preventable harm with the use of a mandatory computerized clinical decision support tool for prophylaxis for venous thromboembolism in trauma. Arch Surg. 2012;147(10):901–907.
- , . Designing and implementing effective venous thromboembolism prevention protocols: lessons from collaborative efforts. J Thromb Thrombolysis. 2010;29(2):159–166.
- , , , et al. Impact of a venous thromboembolism prophylaxis "smart order set": improved compliance, fewer events. Am J Hematol. 2013;88(7):545–549.
- , . Improving adherence to venous thromoembolism prophylaxis using multiple interventions. BMJ. 2012;344:e3935.
- Health Resources and Services Administration of the U.S. Department of Health and Human Services. Managing data for performance improvement. Available at: http://www.hrsa.gov/quality/toolbox/methodology/performanceimprovement/part2.html. Accessed December 18, 2014.
- , . Improving patient safety by taking systems seriously. JAMA. 2008;299(4):445–447.
- , , , . Growth in the care of older patients by hospitalists in the United States. N Engl J Med. 2009;360(11):1102–1112.
- , , , et al. Prevention of venous thromboembolism: American College of Chest Physicians evidence‐based clinical practice guidelines (8th edition). Chest. 2008;133(6 suppl):381S–453S.
- . Robust locally weighted regression and smoothing scatterplots. J Am Stat Assoc. 1979;74(368):829–836.
- , . Locally weighted regression: An approach to regression analysis by local fitting. J Am Stat Assoc. 1988;83(403):596–610.
- , , , . Regression Methods in Biostatistics: Linear, Logistic, Survival, and Repeated Measures Models. 2nd ed. New York, NY: Springer; 2012.
- . Regression Modeling Strategies: With Applications to Linear Models, Logistic Regression, and Survival Analysis. New York, NY: Springer‐Verlag; 2001.
- , , , et al. Eliminating healthcare disparities via mandatory clinical decision support: the venous thromboembolism (VTE) example [published online ahead of print November 4, 2014]. Med Care. doi: 10.1097/MLR.0000000000000251.
- Joint Commission. Improving America's hospitals: the Joint Commission's annual report on quality and safety. 2012. Available at: http://www.jointcommission.org/assets/1/18/TJC_Annual_Report_2012.pdf. Accessed September 8, 2013.
- , , , et al. Hospital performance for pharmacologic venous thromboembolism prophylaxis and rate of venous thromboembolism: a cohort study. JAMA Intern Med. 2014;174(10):1577–1584.
- , , , et al. Incidence of hospital‐acquired venous thromboembolic codes in medical patients hospitalized in academic medical centers. J Hosp Med. 2014;9(4):221–225.
- , , , , . No association between hospital‐reported perioperative venous thromboembolism prophylaxis and outcome rates in publicly reported data. JAMA Surg. 2014;149(4):400–401.
- , , , , . Linking processes and outcomes: a key strategy to prevent and report harm from venous thromboembolism in surgical patients. JAMA Surg. 2013;148(3):299–300.
- , , , et al. Patterns of non‐administration of ordered doses of venous thromboembolism prophylaxis: implications for novel intervention strategies. PLoS One. 2013;8(6):e66311.
- , , , et al. Nonadministration of thromboprophylaxis in hospitalized patients with HIV: a missed opportunity for prevention? J Hosp Med. 2014;9(4):215–220.
- , , , et al. Evaluation of surveillance bias and the validity of the venous thromboembolism quality measure. JAMA. 2013;310(14):1482–1489.
- , . Surveillance bias in outcomes reporting. JAMA. 2011;305(23):2462–2463.
- . Pay for performance in health care: an international overview of initiatives. Med Care Res Rev. 2012;69(3):251–276.
The Affordable Care Act explicitly outlines improving the value of healthcare by increasing quality and decreasing costs. It emphasizes value‐based purchasing, the transparency of performance metrics, and the use of payment incentives to reward quality.[1, 2] Venous thromboembolism (VTE) prophylaxis is one of these publicly reported performance measures. The National Quality Forum recommends that each patient be evaluated on hospital admission and during their hospitalization for VTE risk level and for appropriate thromboprophylaxis to be used, if required.[3] Similarly, the Joint Commission includes appropriate VTE prophylaxis in its Core Measures.[4] Patient experience and performance metrics, including VTE prophylaxis, constitute the hospital value‐based purchasing (VBP) component of healthcare reform.[5] For a hypothetical 327‐bed hospital, an estimated $1.7 million of a hospital's inpatient payments from Medicare will be at risk from VBP alone.[2]
VTE prophylaxis is a common target of quality improvement projects. Effective, safe, and cost‐effective measures to prevent VTE exist, including pharmacologic and mechanical prophylaxis.[6, 7] Despite these measures, compliance rates are often below 50%.[8] Different interventions have been pursued to ensure appropriate VTE prophylaxis, including computerized provider order entry (CPOE), electronic alerts, mandatory VTE risk assessment and prophylaxis, and provider education campaigns.[9] Recent studies show that CPOE systems with mandatory fields can increase VTE prophylaxis rates to above 80%, yet the goal of a high reliability health system is for 100% of patients to receive recommended therapy.[10, 11, 12, 13, 14, 15] Interventions to improve prophylaxis rates that have included multiple strategies, such as computerized order sets, feedback, and education, have been the most effective, increasing compliance to above 90%.[9, 11, 16] These systems can be enhanced with additional interventions such as providing individualized provider education and feedback, understanding of work flow, and ensuring patients receive the prescribed therapies.[12] For example, a physician dashboard could be employed to provide a snapshot and historical trend of key performance indicators using graphical displays and indicators.[17]
Dashboards and pay‐for‐performance programs have been increasingly used to increase the visibility of these metrics, provide feedback, visually display benchmarks and goals, and proactively monitor for achievements and setbacks.[18] Although these strategies are often addressed at departmental (or greater) levels, applying them at the level of the individual provider may assist hospitals in reducing preventable harm and achieving safety and quality goals, especially at higher benchmarks. With their expanding role, hospitalists provide a key opportunity to lead improvement efforts and to study the impact of dashboards and pay‐for performance at the provider level to achieve VTE prophylaxis performance targets. Hospitalists are often the front‐line provider for inpatients and deliver up to 70% of inpatient general medical services.[19] The objective of our study was to evaluate the impact of providing individual provider feedback and employing a pay‐for‐performance program on baseline performance of VTE prophylaxis among hospitalists. We hypothesized that performance feedback through the use of a dashboard would increase appropriate VTE prophylaxis, and this effect would be further augmented by incorporation of a pay‐for‐performance program.
METHODS
Hospitalist Dashboard
In 2010, hospitalist program leaders met with hospital administrators to create a hospitalist dashboard that would provide regularly updated summaries of performance measures for individual hospitalists. The final set of metrics identified included appropriate VTE prophylaxis, length of stay, patients discharged per day, discharges before 3 pm, depth of coding, patient satisfaction, readmissions, communication with the primary care provider, and time to signature for discharge summaries (Figure 1A). The dashboard was introduced at a general hospitalist meeting during which its purpose, methodology, and accessibility were described; it was subsequently implemented in January 2011.
Benchmarks were established for each metric, standardized to establish a scale ranging from 1 through 9, and incorporated into the dashboard (Figure 1A). Higher scores (creating a larger geometric shape) were desirable. For the VTE prophylaxis measure, scores of 1 through 9 corresponded to <60%, 60% to 64.9%, 65% to 69.9%, 70% to 74.9%, 75% to 79.9%, 80% to 84.9%, 85% to 89.9%, 90% to 94.9%, and 95% American College of Chest Physicians (ACCP)‐compliant VTE prophylaxis, respectively.[12, 20] Each provider was able to access the aggregated dashboard (showing the group mean) and his/her individualized dashboard using an individualized login and password for the institutional portal. This portal is used during the provider's workflow, including medical record review and order entry. Both a polygonal summary graphic (Figure 1A) and trend (Figure 1B) view of the dashboard were available to the provider. A comparison of the individual provider to the hospitalist group average was displayed (Figure 1A). At monthly program meetings, the dashboard, group results, and trends were discussed.
Venous Thromboembolism Prophylaxis Compliance
Our study was performed in a tertiary academic medical center with an approximately 20‐member hospitalist group (the precise membership varied over time), whose responsibilities include, among other clinical duties, staffing a 17‐bed general medicine unit with telemetry. The scope of diagnoses and acuity of patients admitted to the hospitalist service is similar to the housestaff services. Some hospitalist faculty serve both as hospitalist and nonhospitalist general medicine service team attendings, but the comparison groups were staffed by hospitalists for <20% of the time. For admissions, all hospitalists use a standardized general medicine admission order set that is integrated into the CPOE system (Sunrise Clinical Manager; Allscripts, Chicago, IL) and completed for all admitted patients. A mandatory VTE risk screen, which includes an assessment of VTE risk factors and pharmacological prophylaxis contraindications, must be completed by the ordering physician as part of this order set (Figure 2A). The system then prompts the provider with a risk‐appropriate VTE prophylaxis recommendation that the provider may subsequently order, including mechanical prophylaxis (Figure 2B). Based on ACCP VTE prevention guidelines, risk‐appropriate prophylaxis was determined using an electronic algorithm that categorized patients into risk categories based on the presence of major VTE risk factors (Figure 2A).[12, 15, 20] If none of these were present, the provider selected No major risk factors known. Both an assessment of current use of anticoagulation and a clinically high risk of bleeding were also included (Figure 2A). If none of these were present, the provider selected No contraindications known. This algorithm is published in detail elsewhere and has been shown to not increase major bleeding episodes.[12, 15] The VTE risk assessment, but not the VTE order itself, was a mandatory field. This allowed the physician discretion to choose among various pharmacological agents and mechanical mechanisms based on patient and physician preferences.
Compliance of risk‐appropriate VTE prophylaxis was determined 24 hours after the admission order set was completed using an automated electronic query of the CPOE system. Low molecular‐weight heparin prescription was included in the compliance algorithm as acceptable prophylaxis. Prescription of pharmacological VTE prophylaxis when a contraindication was present was considered noncompliant. The metric was assigned to the attending physician who billed for the first inpatient encounter.
Pay‐for‐Performance Program
In July 2011, a pay‐for‐performance program was added to the dashboard. All full‐time and part‐time hospitalists were eligible. The financial incentive was determined according to hospital priority and funds available. The VTE prophylaxis metric was prorated by clinical effort, with a maximum of $0.50 per work relative value unit (RVU). To optimize performance, a threshold of 80% compliance had to be surpassed before any payment was made. Progressively increasing percentages of the incentive were earned as compliance increased from 80% to 100%, corresponding to dashboard scores of 6, 7, 8, and 9: <80% (scores 1 to 5)=no payment; 80% to 84.9% (score 6)=$0.125 per RVU; 85% to 89.9% (score 7)=$0.25 per RVU; 90% to 94.9% (score 8)=$0.375 per RVU; and 95% (score 9)=$0.50 per RVU (maximum incentive). Payments were accrued quarterly and paid at the end of the fiscal year as a cumulative, separate performance supplement.
Individualized physician feedback through the dashboard was continued during the pay‐for‐performance period. Average hospitalist group compliance continued to be displayed on the electronic dashboard and was explicitly reviewed at monthly hospitalist meetings.
The VTE prophylaxis order set and data collection and analyses were approved by the Johns Hopkins Medicine Institutional Review Board. The dashboard and pay‐for‐performance program were initiated by the institution as part of a proof of concept quality improvement project.
Analysis
We examined all inpatient admissions to the hospitalist unit from 2008 to 2012. We included patients admitted to and discharged from the hospitalist unit and excluded patients transferred into/out of the unit and encounters with a length of stay <24 hours. VTE prophylaxis orders were queried from the CPOE system 24 hours after the patient was admitted to determine compliance.
After allowing for a run‐in period (2008), we analyzed the change in percent compliance for 3 periods: (1) CPOE‐based VTE order set alone (baseline [BASE], January 2009 to December 2010); (2) group and individual physician feedback using the dashboard (dashboard only [DASH], January to June 2011); and (3) dashboard tied to the pay‐for‐performance program (dashboard with pay‐for‐performance [P4P], July 2011 to December 2012). The CPOE‐based VTE order set was used during all 3 periods. We used the other medical services as a control to ensure that there were no temporal trends toward improved prophylaxis on a service without the intervention. VTE prophylaxis compliance was examined by calculating percent compliance using the same algorithm for the 4 resident‐staffed general medicine service teams at our institution, which utilized the same CPOE system but did not receive the dashboard or pay‐for‐performance interventions. We used locally weighted scatterplot smoothing, a locally weighted regression of percent compliance over time, to graphically display changes in group compliance over time.[21, 22]
We also performed linear regression to assess the rate of change in group compliance and included spline terms that allowed slope to vary for each of the 3 time periods.[23, 24] Clustered analysis accounted for potentially correlated serial measurements of compliance for an individual provider. A separate analysis examined the effect of provider turnover and individual provider improvement during each of the 3 periods. Tests of significance were 2‐sided, with an level of 0.05. Statistical analysis was performed using Stata 12.1 (StataCorp LP, College Station, TX).
RESULTS
Venous Thromboembolism Prophylaxis Compliance
We analyzed 3144 inpatient admissions by 38 hospitalists from 2009 to 2012. The 5 most frequent coded diagnoses were heart failure, acute kidney failure, syncope, pneumonia, and chest pain. Patients had a median length of stay of 3 days [interquartile range: 26]. During the dashboard‐only period, on average, providers improved in compliance by 4% (95% confidence interval [CI]: 35; P<0.001). With the addition of the pay‐for‐performance program, providers improved by an additional 4% (95% CI: 35; P<0.001). Group compliance significantly improved from 86% (95% CI: 8588) during the BASE period of the CPOE‐based VTE order set to 90% (95% CI: 8893) during the DASH period (P=0.01) and 94% (95% CI: 9396) during the subsequent P4P program (P=0.01) (Figure 3). Both inappropriate prophylaxis and lack of prophylaxis, when indicated, resulted in a non‐compliance rating. During the 3 periods, inappropriate prophylaxis decreased from 7.9% to 6.2% to 2.6% during the BASE, DASH, and subsequent P4P periods, respectively. Similarly, lack of prophylaxis when indicated decreased from 6.1% to 3.2% to 3.1% during the BASE, DASH, and subsequent P4P periods, respectively.
The average compliance of the 4 non‐hospitalist general medicine service teams was initially higher than that of the hospitalist service during the CPOE‐based VTE order set (90%) and DASH (92%) periods, but subsequently plateaued and was exceeded by the hospitalist service during the combined P4P (92%) period (Figure 3). However, there was no statistically significant difference between the general medicine service teams and hospitalist service during the DASH (P=0.15) and subsequent P4P (P=0.76) periods.
We also analyzed the rate of VTE prophylaxis compliance improvement (slope) with cut points at each time period transition (Figure 3). Risk‐appropriate VTE prophylaxis during the BASE period did not exhibit significant improvement as indicated by the slope (P=0.23) (Figure 3). In contrast, during the DASH period, VTE prophylaxis compliance significantly increased by 1.58% per month (95% CI: 0.41‐2.76; P=0.01). The addition of the P4P program, however, did not further significantly increase the rate of compliance (P=0.78).
A subgroup analysis restricted to the 19 providers present during all 3 periods was performed to assess for potential confounding from physician turnover. The percent compliance increased in a similar fashion: BASE period of CPOE‐based VTE order set, 85% (95% CI: 8386); DASH, 90% (95% CI: 8893); and P4P, 94% (95% CI: 9296).
Pay‐for‐Performance Program
Nineteen providers met the threshold for pay‐for‐performance (80% appropriate VTE prophylaxis), with 9 providers in the intermediate categories (80%94.9%) and 10 in the full incentive category (95%). The mean individual payout for the incentive was $633 (standard deviation 350), with a total disbursement of $12,029. The majority of payments (17 of 19) were under $1000.
DISCUSSION
A key component of healthcare reform has been value‐based purchasing, which emphasizes extrinsic motivation through the transparency of performance metrics and use of payment incentives to reward quality. Our study evaluates the impact of both extrinsic (payments) and intrinsic (professionalism and peer norms) motivation. It specifically attributed an individual performance metric, VTE prophylaxis, to an attending physician, provided both individualized and group feedback using an electronic dashboard, and incorporated a pay‐for‐performance program. Prescription of risk‐appropriate VTE prophylaxis significantly increased with the implementation of the dashboard and subsequent pay‐for performance program. The fastest rate of improvement occurred after the addition of the dashboard. Sensitivity analyses for provider turnover and comparisons to the general medicine services showed our results to be independent of a general trend of improvement, both at the provider and institutional levels.
Our prior studies demonstrated that order sets significantly improve performance, from a baseline compliance of risk‐appropriate VTE prophylaxis of 66% to 84%.[13, 15, 25] In the current study, compliance was relatively flat during the BASE period, which included these order sets. The greatest rate of continued improvement in compliance occurred during the DASH period, emphasizing both the importance of provider feedback and receptivity and adaptability in the prescribing behavior of hospitalists. Because the goal of a high‐reliability health system is for 100% of patients to receive recommended therapy, multiple approaches are necessary for success.
Nationally, benchmarks for performance measures continue to be raised, with the highest performers achieving above 95%.[26] Additional interventions, such as dashboards and pay‐for‐performance programs, supplement CPOE systems to achieve high reliability. In our study, the compliance rate during the baseline period, which included a CPOE‐based, clinical support‐enabled VTE order set, was 86%. Initially the compliance of the general medicine teams with residents exceeded that of the hospitalist attending teams, which may reflect a greater willingness of resident teams to comply with order sets and automated recommendations. This emphasizes the importance of continuous individual feedback and provider education at the attending physician level to enhance both guideline compliance and decrease provider care variation. Ultimately, with the addition of the dashboard and subsequent pay‐for‐performance program, compliance was increased to 90% and 94%, respectively. Although the major mechanism used by policymakers to improve quality of care is extrinsic motivation, this study demonstrates that intrinsic motivation through peer norms can enhance extrinsic efforts and may be more influential. Both of these programs, dashboards and pay‐for‐performance, may ultimately assist institutions in changing provider behavior and achieving these harder‐to‐achieve higher benchmarks.
We recognize that there are several limitations to our study. First, this is a single‐site program limited to an attending‐physician‐only service. There was strong data support and a defined CPOE algorithm for this initiative. Multi‐site studies will need to overcome the additional challenges of varying service structures and electronic medical record and provider order entry systems. Second, it is difficult to show actual changes in VTE events over time with appropriate prophylaxis. Although VTE prophylaxis is recommended for patients with VTE risk factors, there are conflicting findings about whether prophylaxis prevents VTE events in lower‐risk patients, and current studies suggest that most patients with VTE events are severely ill and develop VTE despite receiving prophylaxis.[27, 28, 29] Our study was underpowered to detect these potential differences in VTE rates, and although the algorithm has been shown to not increase bleeding rates, we did not measure bleeding rates during this study.[12, 15] Our institutional experience suggests that the majority of VTE events occur despite appropriate prophylaxis.[30] Also, VTE prophylaxis may be ordered, but intervening events, such as procedures and changes in risk status or patient refusal, may prevent patients from receiving appropriate prophylaxis.[31, 32] Similarly, hospitals with higher quality scores have higher VTE prophylaxis rates but worse risk‐adjusted VTE rates, which may result from increased surveillance for VTE, suggesting surveillance bias limits the usefulness of the VTE quality measure.[33, 34] Nevertheless, VTE prophylaxis remains a publicly reported Core Measure tied to financial incentives.[4, 5] Third, there may be an unmeasured factor specific to the hospitalist program, which could potentially account for an overall improvement in quality of care. Although the rate of increase in appropriate prophylaxis was not statistically significant during the baseline period, there did appear to be some improvement in prophylaxis toward the end of the period. However, there were no other VTE‐related provider feedback programs being simultaneously pursued during this study. VTE prophylaxis for the non‐hospitalist services showed a relatively stable, non‐increasing compliance rate for the general medical services. Although it was possible for successful residents to age into the hospitalist service, thereby improving rates of prophylaxis based on changes in group makeup, our subgroup analysis of the providers present throughout all phases of the study showed our results to be robust. Similarly, there may have been a cross‐contamination effect of hospitalist faculty who attended on both hospitalist and non‐hospitalist general medicine service teams. This, however, would attenuate any impact of the programs, and thus the effects may in fact be greater than reported. Fourth, establishment of both the dashboard and pay‐for‐performance program required significant institutional and program leadership and resources. To be successful, the dashboard must be in the provider's workflow, transparent, minimize reporter burden, use existing systems, and be actively fed back to providers, ideally those directly entering orders. Our greatest rate of improvement occurred during the feedback‐only phase of this study, emphasizing the importance of physician feedback, provider‐level accountability, and engagement. We suspect that the relatively modest pay‐for‐performance incentive served mainly as a means of engaging providers in self‐monitoring, rather than as a means to change behavior through true incentivization. Although we did not track individual physician views of the dashboard, we reinforced trends, deviations, and expectations at regularly scheduled meetings and provided feedback and patient‐level data to individual providers. Fifth, the design of the pay‐for‐performance program may have also influenced its effectiveness. These types of programs may be more effective when they provide frequent visible, small payments rather than one large payment, and when the payment is framed as a loss rather than a gain.[35] Finally, physician champions and consistent feedback through departmental meetings or visual displays may be required for program success. The initial resources to create the dashboard, continued maintenance and monitoring of performance, and payment of financial incentives all require institutional commitment. A partnership of physicians, program leaders, and institutional administrators is necessary for both initial and continued success.
To achieve performance goals and benchmarks, multiple strategies that combine extrinsic and intrinsic motivation are necessary. As shown by our study, the use of a dashboard and pay‐for‐performance can be tailored to an institution's goals, in line with national standards. The specific goal (risk‐appropriate VTE prophylaxis) and benchmarks (80%, 85%, 90%, 95%) can be individualized to a particular institution. For example, if readmission rates are above target, readmissions could be added as a dashboard metric. The specific benchmark would be determined by historical trends and administrative targets. Similarly, the overall financial incentives could be adjusted based on the financial resources available. Other process measures, such as influenza vaccination screening and administration, could also be targeted. For all of these objectives, continued provider feedback and engagement are critical for progressive success, especially to decrease variability in care at the attending physician level. Incorporating the value‐based purchasing philosophy from the Affordable Care Act, our study suggests that the combination of standardized order sets, real‐time dashboards, and physician‐level incentives may assist hospitals in achieving quality and safety benchmarks, especially at higher targets.
Acknowledgements
The authors thank Meir Gottlieb, BS, from Salar Inc. for data support; Murali Padmanaban, BS, from Johns Hopkins University for his assistance in linking the administrative billing data with real‐time physician orders; and Hsin‐Chieh Yeh, PhD, from the Bloomberg School of Public Health for her statistical advice and additional review. We also thank Mr. Ronald R. Peterson, President, Johns Hopkins Health System and Johns Hopkins Hospital, for providing funding support for the physician incentive payments.
Disclosures: Drs. Michtalik and Brotman had full access to all of the data in the study and take responsibility for the integrity of the data and accuracy of the data analysis. Study concept and design: Drs. Michtalik, Streiff, Finkelstein, Pronovost, and Brotman. Acquisition of data: Drs. Michtalik, Streiff, Brotman and Mr. Carolan, Mr. Lau, Mrs. Durkin. Analysis and interpretation of data: Drs. Michtalik, Haut, Streiff, Brotman and Mr. Carolan, Mr. Lau. Drafting of the manuscript: Drs. Michtalik and Brotman. Critical revision of the manuscript for important intellectual content: Drs. Michtalik, Haut, Streiff, Finkelstein, Pronovost, Brotman and Mr. Carolan, Mr. Lau, Mrs. Durkin. Statistical analysis and supervision: Drs. Michtalik and Brotman. Obtaining funding: Drs. Streiff and Brotman. Technical support: Dr. Streiff and Mr. Carolan, Mr. Lau, Mrs. Durkin
This study was supported by a National Institutes of Health grant T32 HP10025‐17‐00 (Dr. Michtalik), the National Institutes of Health/Johns Hopkins Institute for Clinical and Translational Research KL2 Award 5KL2RR025006 (Dr. Michtalik), the Agency for Healthcare Research and Quality Mentored Clinical Scientist Development K08 Awards 1K08HS017952‐01 (Dr. Haut) and 1K08HS022331‐01A1 (Dr. Michtalik), and the Johns Hopkins Hospitalist Scholars Fund. The funders had no role in the design and conduct of the study; collection, management, analysis, and interpretation of the data; preparation, review, or approval of the manuscript; and decision to submit the manuscript for publication.
Dr. Haut receives royalties from Lippincott, Williams & Wilkins. Dr. Streiff has received research funding from Portola and Bristol Myers Squibb, honoraria for CME lectures from Sanofi‐Aventis and Ortho‐McNeil, consulted for Eisai, Daiichi‐Sankyo, Boerhinger‐Ingelheim, Janssen Healthcare, and Pfizer. Mr. Lau, Drs. Haut, Streiff, and Pronovost are supported by a contract from the Patient‐Centered Outcomes Research Institute (PCORI) titled Preventing Venous Thromboembolism: Empowering Patients and Enabling Patient‐Centered Care via Health Information Technology (CE‐12‐11‐4489). Dr. Brotman has received research support from Siemens Healthcare Diagnostics, Bristol‐Myers Squibb, the Agency for Healthcare Research and Quality, Centers for Medicare & Medicaid Services, the Amerigroup Corporation, and the Guerrieri Family Foundation. He has received honoraria from the Gerson Lehrman Group, the Dunn Group, and from Quantia Communications, and received royalties from McGraw‐Hill.
- Medicare Program, Centers for Medicare 76(88):26490–26547.
- . Quality meets finance: payments at risk with value‐based purchasing, readmission, and hospital‐acquired conditions force hospitalists to focus. Hospitalist. 2013;17(1):31.
- National Quality Forum. March 2009. Safe practices for better healthcare—2009 update. Available at: http://www.qualityforum.org/Publications/2009/03/Safe_Practices_for_Better_Healthcare%E2%80%932009_Update.aspx. Accessed November 1, 2014.
- Joint Commission on Accreditation of Healthcare Organizations. Approved: more options for hospital core measures. Jt Comm Perspect. 2009;29(4):1–6.
- Centers for Medicare 208(2):227–240.
- , . Thromboprophylaxis in nonsurgical patients. Hematology Am Soc Hematol Educ Program. 2012;2012:631–637.
- , , , et al. Venous thromboembolism risk and prophylaxis in the acute hospital care setting (ENDORSE study): a multinational cross‐sectional study. Lancet. 2008;371(9610):387–394.
- , . Practices to prevent venous thromboembolism: a brief review. BMJ Qual Saf. 2014;23(3):187–195.
- , , , et al. Improving hospital venous thromboembolism prophylaxis with electronic decision support. J Hosp Med. 2013;8(3):115–120.
- , , . Innovative approaches to increase deep vein thrombosis prophylaxis rate resulting in a decrease in hospital‐acquired deep vein thrombosis at a tertiary‐care teaching hospital. J Hosp Med. 2008;3(2):148–155.
- , , , et al. Lessons from the Johns Hopkins Multi‐Disciplinary Venous Thromboembolism (VTE) Prevention Collaborative. BMJ. 2012;344:e3935.
- , , , et al. Improved prophylaxis and decreased rates of preventable harm with the use of a mandatory computerized clinical decision support tool for prophylaxis for venous thromboembolism in trauma. Arch Surg. 2012;147(10):901–907.
- , . Designing and implementing effective venous thromboembolism prevention protocols: lessons from collaborative efforts. J Thromb Thrombolysis. 2010;29(2):159–166.
- , , , et al. Impact of a venous thromboembolism prophylaxis "smart order set": improved compliance, fewer events. Am J Hematol. 2013;88(7):545–549.
- , . Improving adherence to venous thromoembolism prophylaxis using multiple interventions. BMJ. 2012;344:e3935.
- Health Resources and Services Administration of the U.S. Department of Health and Human Services. Managing data for performance improvement. Available at: http://www.hrsa.gov/quality/toolbox/methodology/performanceimprovement/part2.html. Accessed December 18, 2014.
- , . Improving patient safety by taking systems seriously. JAMA. 2008;299(4):445–447.
- , , , . Growth in the care of older patients by hospitalists in the United States. N Engl J Med. 2009;360(11):1102–1112.
- , , , et al. Prevention of venous thromboembolism: American College of Chest Physicians evidence‐based clinical practice guidelines (8th edition). Chest. 2008;133(6 suppl):381S–453S.
- . Robust locally weighted regression and smoothing scatterplots. J Am Stat Assoc. 1979;74(368):829–836.
- , . Locally weighted regression: An approach to regression analysis by local fitting. J Am Stat Assoc. 1988;83(403):596–610.
- , , , . Regression Methods in Biostatistics: Linear, Logistic, Survival, and Repeated Measures Models. 2nd ed. New York, NY: Springer; 2012.
- . Regression Modeling Strategies: With Applications to Linear Models, Logistic Regression, and Survival Analysis. New York, NY: Springer‐Verlag; 2001.
- , , , et al. Eliminating healthcare disparities via mandatory clinical decision support: the venous thromboembolism (VTE) example [published online ahead of print November 4, 2014]. Med Care. doi: 10.1097/MLR.0000000000000251.
- Joint Commission. Improving America's hospitals: the Joint Commission's annual report on quality and safety. 2012. Available at: http://www.jointcommission.org/assets/1/18/TJC_Annual_Report_2012.pdf. Accessed September 8, 2013.
- , , , et al. Hospital performance for pharmacologic venous thromboembolism prophylaxis and rate of venous thromboembolism: a cohort study. JAMA Intern Med. 2014;174(10):1577–1584.
- , , , et al. Incidence of hospital‐acquired venous thromboembolic codes in medical patients hospitalized in academic medical centers. J Hosp Med. 2014;9(4):221–225.
- , , , , . No association between hospital‐reported perioperative venous thromboembolism prophylaxis and outcome rates in publicly reported data. JAMA Surg. 2014;149(4):400–401.
- , , , , . Linking processes and outcomes: a key strategy to prevent and report harm from venous thromboembolism in surgical patients. JAMA Surg. 2013;148(3):299–300.
- , , , et al. Patterns of non‐administration of ordered doses of venous thromboembolism prophylaxis: implications for novel intervention strategies. PLoS One. 2013;8(6):e66311.
- , , , et al. Nonadministration of thromboprophylaxis in hospitalized patients with HIV: a missed opportunity for prevention? J Hosp Med. 2014;9(4):215–220.
- , , , et al. Evaluation of surveillance bias and the validity of the venous thromboembolism quality measure. JAMA. 2013;310(14):1482–1489.
- , . Surveillance bias in outcomes reporting. JAMA. 2011;305(23):2462–2463.
- . Pay for performance in health care: an international overview of initiatives. Med Care Res Rev. 2012;69(3):251–276.
© 2014 Society of Hospital Medicine
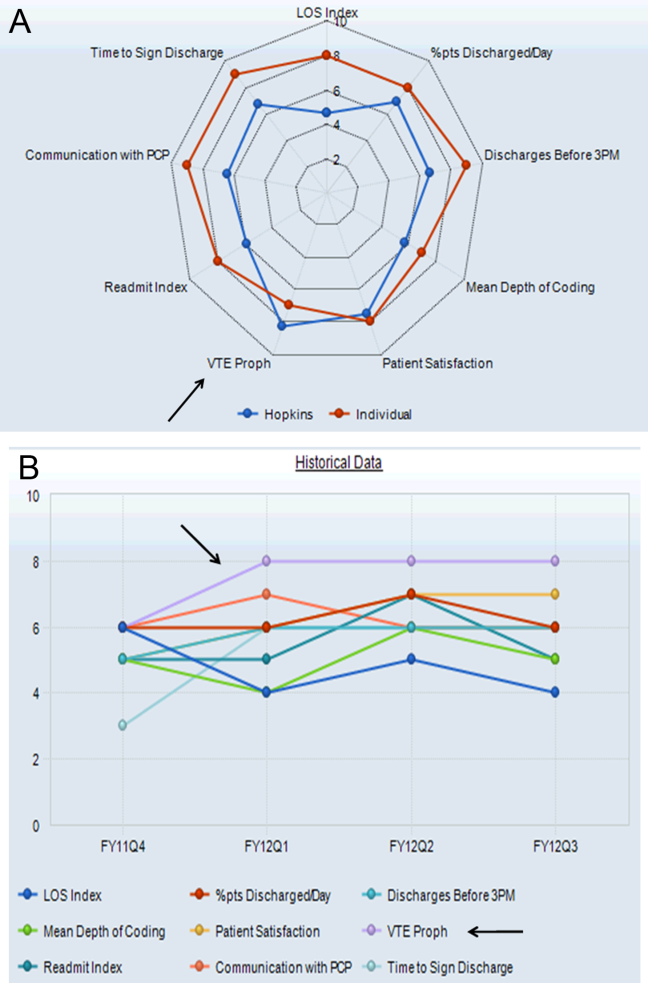
Predicting Safe Physician Workloads
Attending physician workload may be compromising patient safety and quality of care. Recent studies show hospitalists, intensivists, and surgeons report that excessive attending physician workload has a negative impact on patient care.[1, 2, 3] Because physician teams and hospitals differ in composition, function, and setting, it is difficult to directly compare one service to another within or between institutions. Identifying physician, team, and hospital characteristics associated with clinicians' impressions of unsafe workload provides physician leaders, hospital administrators, and policymakers with potential risk factors and specific targets for interventions.[4] In this study, we use a national survey of hospitalists to identify the physician, team, and hospital factors associated with physician report of an unsafe workload.
METHODS
We electronically surveyed 890 self‐identified hospitalists enrolled in
RESULTS
Of the 890 physicians contacted, 506 (57%) responded. Full characteristics of respondents are reported elsewhere.[1] Forty percent of physicians (n=202) indicated that their typical inpatient census exceeded safe levels at least monthly. A descriptive comparison of the lower and higher reporters of unsafe levels is provided (Table 1). Higher frequency of reporting an unsafe census was associated with higher percentages of clinical (P=0.004) and inpatient responsibilities (P<0.001) and more time seeing patients without midlevel or housestaff assistance (P=0.001) (Table 1). On the other hand, lower reported unsafe census was associated with more years in practice (P=0.02), greater percentage of personal time (P=0.02), and the presence of any system for census control (patient caps, fixed bed capacity, staffing augmentation plans) (P=0.007) (Table 1). Fixed census caps decreased the odds of reporting an unsafe census by 34% and was the only statistically significant workload control mechanism (odds ratio: 0.66; 95% confidence interval: 0.43‐0.99; P=0.04). There was no association between reported unsafe census and physician age (P=0.42), practice area (P=0.63), organization type (P=0.98), or compensation (salary [P=0.23], bonus [P=0.61], or total [P=0.54]).
| Characteristic | Report of Unsafe Workloada | Univariate Odds Ratio (95% CI) | Reported Effect on Unsafe Workload Frequency | |
|---|---|---|---|---|
| Lower | Higher | |||
| ||||
| Percentage of total work hours devoted to patient care, median [IQR] | 95 [80100] | 100 [90100] | 1.13b (1.041.23)c | Increased |
| Percentage of clinical care that is inpatient, median [IQR] | 75 [5085] | 80 [7090] | 1.21b (1.131.34)d | |
| Percentage of clinical work performed with no assistance from housestaff or midlevels, median [IQR] | 80 [25100] | 90 [50100] | 1.08b (1.031.14)c | |
| Years in practice, median [IQR] | 6 [311] | 5 [310] | 0.85e (0.750.98)f | Decreased |
| Percentage of workday allotted for personal time, median [IQR] | 5 [07] | 3 [05] | 0.50b (0.380.92)f | |
| Systems for increased patient volume, No. (%) | ||||
| Fixed census cap | 87 (30) | 45 (22) | 0.66 (0.430.99)f | |
| Fixed bed capacity | 36 (13) | 24 (12) | 0.94 (0.541.63) | |
| Staffing augmentation | 88 (31) | 58 (29) | 0.91 (0.611.35) | |
| Any system | 217 (76) | 130 (64) | 0.58 (0.390.86)g | |
| Primary practice area of hospital medicine, No. (%) | ||||
| Adult | 211 (73) | 173 (86) | 1 | Equivocal |
| Pediatric | 7 (2) | 1 (0.5) | 0.24 (0.032.10) | |
| Combined, adult and pediatric | 5 (2) | 3 (1) | 0.73 (0.173.10) | |
| Primary role, No. (%) | ||||
| Clinical | 242 (83) | 186 (92) | 1 | |
| Research | 5 (2) | 4 (2) | 1.04 (0.283.93) | |
| Administrative | 14 (5) | 6 (3) | 0.56 (0.211.48) | |
| Physician age, median [IQR], y | 36 [3242] | 37 [3342] | 0.96e (0.861.07) | |
| Compensation, median [IQR], thousands of dollars | ||||
| Salary only | 180 [130200] | 180 [150200] | 0.97h (0.981.05) | |
| Incentive pay only | 10 [025] | 10 [020] | 0.99h (0.941.04) | |
| Total | 190 [140220] | 196 [165220] | 0.99h (0.981.03) | |
| Practice area, No. (%) | ||||
| Urban | 128 (45) | 98 (49) | 1 | |
| Suburban | 126 (44) | 81 (41) | 0.84 (0.571.23) | |
| Rural | 33 (11) | 21 (10) | 0.83 (0.451.53) | |
| Practice location, No. (%) | ||||
| Academic | 82 (29) | 54 (27) | 1 | |
| Community | 153 (53) | 110 (55) | 1.09 (0.721.66) | |
| Veterans hospital | 7 (2) | 4 (2) | 0.87 (0.243.10) | |
| Group | 32 (11) | 25 (13) | 1.19 (0.632.21) | |
| Physician group size, median [IQR] | 12 [620] | 12 [822] | 0.99i (0.981.03) | |
| Localization of patients, No. (%) | ||||
| Multiple units | 179 (61) | 124 (61) | 1 | |
| Single or adjacent unit(s) | 87 (30) | 58 (29) | 0.96 (0.641.44) | |
| Multiple hospitals | 25 (9) | 20 (10) | 1.15 (0.612.17) | |
DISCUSSION
This is the first study to our knowledge to describe factors associated with provider reports of unsafe workload and identifies potential targets for intervention. By identifying modifiable factors affecting workload, such as different team structures with housestaff or midlevels, it may be possible to improve workload, efficiency, and perhaps safety.[5, 6] Less experience, decreased housestaff or midlevel assistance, higher percentages of inpatient and clinical responsibilities, and lack of systems for census control were strongly associated with reports of unsafe workload.
Having any system in place to address increased patient volumes reduced the odds of reporting an unsafe workload. However, only fixed patient census caps were statistically significant. A system that incorporates fixed service or admitting caps may provide greater control on workload but may also result in back‐ups and delays in the emergency room. Similarly, fixed caps may require overflow of patients to less experienced or willing services or increase the number of handoffs, which may adversely affect the quality of patient care. Use of separate admitting teams has the potential to increase efficiency, but is also subject to fluctuations in patient volume and increases the number of handoffs. Each institution should use a multidisciplinary systems approach to address patient throughput and enforce manageable workload such as through the creation of patient flow teams.[7]
Limitations of the study include the relatively small sample of hospitalists and self‐reporting of safety. Because of the diverse characteristics and structures of the individual programs, even if a predictor variable was not missing, if a particular value for that predictor occurred very infrequently, it generated very wide effect estimates. This limited our ability to effectively explore potential confounders and interactions. To our knowledge, this study is the first to explore potential predictors of unsafe attending physician workload. Large national surveys of physicians with greater statistical power can expand upon this initial work and further explore the association between, and interaction of, workload factors and varying perceptions of providers.[4] The most important limitation of this work is that we relied on self‐reporting to define a safe census. We do not have any measured clinical outcomes that can serve to validate the self‐reported impressions. We recognize, however, that adverse events in healthcare require multiple weaknesses to align, and typically, multiple barriers exist to prevent such events. This often makes it difficult to show direct causal links. Additionally, self‐reporting of safety may also be subject to recall bias, because adverse patient outcomes are often particularly memorable. However, high‐reliability organizations recognize the importance of front‐line provider input, such as on the sensitivity of operations (working conditions) and by deferring to expertise (insights and recommendations from providers most knowledgeable of conditions, regardless of seniority).[8]
We acknowledge that several workload factors, such as hospital setting, may not be readily modifiable. However, we also report factors that can be intervened upon, such as assistance[5, 6] or geographic localization of patients.[9, 10] An understanding of both modifiable and fixed factors in healthcare delivery is essential for improving patient care.
This study has significant research implications. It suggests that team structure and physician experience may be used to improve workload safety. Also, particularly if these self‐reported findings are verified using clinical outcomes, providing hospitalists with greater staffing assistance and systems responsive to census fluctuations may improve the safety, quality, and flow of patient care. Future research may identify the association of physician, team, and hospital factors with outcomes and objectively assess targeted interventions to improve both the efficiency and quality of care.
Acknowledgments
The authors thank the Johns Hopkins Clinical Research Network Hospitalists, General Internal Medicine Research in Progress Physicians, and Hospitalist Directors for the Maryland/District of Columbia region for sharing their models of care and comments on the survey content. They also thank Michael Paskavitz, BA (Editor‐in‐Chief) and Brian Driscoll, BA (Managing Editor) from Quantia Communications for all of their technical assistance in administering the survey.
Disclosures: Drs. Michtalik and Brotman had full access to all of the data in the study and take responsibility for the integrity of the data and accuracy of the data analysis. Study concept and design: Michtalik, Pronovost, Brotman. Analysis, interpretation of data: Michtalik, Pronovost, Marsteller, Spetz, Brotman. Drafting of the manuscript: Michtalik, Brotman. Critical revision of the manuscript for important intellectual content: Michtalik, Pronovost, Marsteller, Spetz, Brotman. Dr. Brotman has received compensation from Quantia Communications, not exceeding $10,000 annually, for developing educational content. Dr. Michtalik was supported by NIH grant T32 HP10025‐17‐00 and NIH/Johns Hopkins Institute for Clinical and Translational Research KL2 Award 5KL2RR025006. The Johns Hopkins Hospitalist Scholars Fund provided funding for survey implementation and data acquisition by Quantia Communications. The funders had no role in the design, analysis, and interpretation of the data, or the preparation, review, or approval of the manuscript. The authors report no conflicts of interest.
- , , , . Impact of attending physician workload on patient care: a survey of hospitalists. JAMA Intern Med. 2013;173(5):375–377.
- , , , et al. Does surgeon workload per day affect outcomes after pulmonary lobectomies? Ann Thorac Surg. 2012;94(3):966–972.
- , , , . Perceived effects of attending physician workload in academic medical intensive care units: a national survey of training program directors. Crit Care Med. 2012;40(2):400–405.
- , , , , . Developing a model for attending physician workload and outcomes. JAMA Intern Med. 2013;173(11):1026–1028.
- , , , et al. A comparison of outcomes of general medical inpatient care provided by a hospitalist‐physician assistant model vs a traditional resident‐based model. J Hosp Med. 2011;6(3):122–130.
- , , , et al. Implementation of a physician assistant/hospitalist service in an academic medical center: impact on efficiency and patient outcomes. J Hosp Med. 2008;3(5):361–368.
- , , , . Improving patient flow and reducing emergency department crowding: a guide for hospitals. AHRQ publication no. 11(12)−0094. Rockville, MD: Agency for Healthcare Research and Quality; 2011.
- , , , et al. Becoming a high reliability organization: operational advice for hospital leaders. AHRQ publication no. 08–0022. Rockville, MD: Agency for Healthcare Research and Quality; 2008.
- , , , et al. Impact of localizing general medical teams to a single nursing unit. J Hosp Med. 2012;7(7):551–556.
- , , , et al. Impact of localizing physicians to hospital units on nurse‐physician communication and agreement on the plan of care. J Gen Intern Med. 2009;24(11):1223–1227.
Attending physician workload may be compromising patient safety and quality of care. Recent studies show hospitalists, intensivists, and surgeons report that excessive attending physician workload has a negative impact on patient care.[1, 2, 3] Because physician teams and hospitals differ in composition, function, and setting, it is difficult to directly compare one service to another within or between institutions. Identifying physician, team, and hospital characteristics associated with clinicians' impressions of unsafe workload provides physician leaders, hospital administrators, and policymakers with potential risk factors and specific targets for interventions.[4] In this study, we use a national survey of hospitalists to identify the physician, team, and hospital factors associated with physician report of an unsafe workload.
METHODS
We electronically surveyed 890 self‐identified hospitalists enrolled in
RESULTS
Of the 890 physicians contacted, 506 (57%) responded. Full characteristics of respondents are reported elsewhere.[1] Forty percent of physicians (n=202) indicated that their typical inpatient census exceeded safe levels at least monthly. A descriptive comparison of the lower and higher reporters of unsafe levels is provided (Table 1). Higher frequency of reporting an unsafe census was associated with higher percentages of clinical (P=0.004) and inpatient responsibilities (P<0.001) and more time seeing patients without midlevel or housestaff assistance (P=0.001) (Table 1). On the other hand, lower reported unsafe census was associated with more years in practice (P=0.02), greater percentage of personal time (P=0.02), and the presence of any system for census control (patient caps, fixed bed capacity, staffing augmentation plans) (P=0.007) (Table 1). Fixed census caps decreased the odds of reporting an unsafe census by 34% and was the only statistically significant workload control mechanism (odds ratio: 0.66; 95% confidence interval: 0.43‐0.99; P=0.04). There was no association between reported unsafe census and physician age (P=0.42), practice area (P=0.63), organization type (P=0.98), or compensation (salary [P=0.23], bonus [P=0.61], or total [P=0.54]).
| Characteristic | Report of Unsafe Workloada | Univariate Odds Ratio (95% CI) | Reported Effect on Unsafe Workload Frequency | |
|---|---|---|---|---|
| Lower | Higher | |||
| ||||
| Percentage of total work hours devoted to patient care, median [IQR] | 95 [80100] | 100 [90100] | 1.13b (1.041.23)c | Increased |
| Percentage of clinical care that is inpatient, median [IQR] | 75 [5085] | 80 [7090] | 1.21b (1.131.34)d | |
| Percentage of clinical work performed with no assistance from housestaff or midlevels, median [IQR] | 80 [25100] | 90 [50100] | 1.08b (1.031.14)c | |
| Years in practice, median [IQR] | 6 [311] | 5 [310] | 0.85e (0.750.98)f | Decreased |
| Percentage of workday allotted for personal time, median [IQR] | 5 [07] | 3 [05] | 0.50b (0.380.92)f | |
| Systems for increased patient volume, No. (%) | ||||
| Fixed census cap | 87 (30) | 45 (22) | 0.66 (0.430.99)f | |
| Fixed bed capacity | 36 (13) | 24 (12) | 0.94 (0.541.63) | |
| Staffing augmentation | 88 (31) | 58 (29) | 0.91 (0.611.35) | |
| Any system | 217 (76) | 130 (64) | 0.58 (0.390.86)g | |
| Primary practice area of hospital medicine, No. (%) | ||||
| Adult | 211 (73) | 173 (86) | 1 | Equivocal |
| Pediatric | 7 (2) | 1 (0.5) | 0.24 (0.032.10) | |
| Combined, adult and pediatric | 5 (2) | 3 (1) | 0.73 (0.173.10) | |
| Primary role, No. (%) | ||||
| Clinical | 242 (83) | 186 (92) | 1 | |
| Research | 5 (2) | 4 (2) | 1.04 (0.283.93) | |
| Administrative | 14 (5) | 6 (3) | 0.56 (0.211.48) | |
| Physician age, median [IQR], y | 36 [3242] | 37 [3342] | 0.96e (0.861.07) | |
| Compensation, median [IQR], thousands of dollars | ||||
| Salary only | 180 [130200] | 180 [150200] | 0.97h (0.981.05) | |
| Incentive pay only | 10 [025] | 10 [020] | 0.99h (0.941.04) | |
| Total | 190 [140220] | 196 [165220] | 0.99h (0.981.03) | |
| Practice area, No. (%) | ||||
| Urban | 128 (45) | 98 (49) | 1 | |
| Suburban | 126 (44) | 81 (41) | 0.84 (0.571.23) | |
| Rural | 33 (11) | 21 (10) | 0.83 (0.451.53) | |
| Practice location, No. (%) | ||||
| Academic | 82 (29) | 54 (27) | 1 | |
| Community | 153 (53) | 110 (55) | 1.09 (0.721.66) | |
| Veterans hospital | 7 (2) | 4 (2) | 0.87 (0.243.10) | |
| Group | 32 (11) | 25 (13) | 1.19 (0.632.21) | |
| Physician group size, median [IQR] | 12 [620] | 12 [822] | 0.99i (0.981.03) | |
| Localization of patients, No. (%) | ||||
| Multiple units | 179 (61) | 124 (61) | 1 | |
| Single or adjacent unit(s) | 87 (30) | 58 (29) | 0.96 (0.641.44) | |
| Multiple hospitals | 25 (9) | 20 (10) | 1.15 (0.612.17) | |
DISCUSSION
This is the first study to our knowledge to describe factors associated with provider reports of unsafe workload and identifies potential targets for intervention. By identifying modifiable factors affecting workload, such as different team structures with housestaff or midlevels, it may be possible to improve workload, efficiency, and perhaps safety.[5, 6] Less experience, decreased housestaff or midlevel assistance, higher percentages of inpatient and clinical responsibilities, and lack of systems for census control were strongly associated with reports of unsafe workload.
Having any system in place to address increased patient volumes reduced the odds of reporting an unsafe workload. However, only fixed patient census caps were statistically significant. A system that incorporates fixed service or admitting caps may provide greater control on workload but may also result in back‐ups and delays in the emergency room. Similarly, fixed caps may require overflow of patients to less experienced or willing services or increase the number of handoffs, which may adversely affect the quality of patient care. Use of separate admitting teams has the potential to increase efficiency, but is also subject to fluctuations in patient volume and increases the number of handoffs. Each institution should use a multidisciplinary systems approach to address patient throughput and enforce manageable workload such as through the creation of patient flow teams.[7]
Limitations of the study include the relatively small sample of hospitalists and self‐reporting of safety. Because of the diverse characteristics and structures of the individual programs, even if a predictor variable was not missing, if a particular value for that predictor occurred very infrequently, it generated very wide effect estimates. This limited our ability to effectively explore potential confounders and interactions. To our knowledge, this study is the first to explore potential predictors of unsafe attending physician workload. Large national surveys of physicians with greater statistical power can expand upon this initial work and further explore the association between, and interaction of, workload factors and varying perceptions of providers.[4] The most important limitation of this work is that we relied on self‐reporting to define a safe census. We do not have any measured clinical outcomes that can serve to validate the self‐reported impressions. We recognize, however, that adverse events in healthcare require multiple weaknesses to align, and typically, multiple barriers exist to prevent such events. This often makes it difficult to show direct causal links. Additionally, self‐reporting of safety may also be subject to recall bias, because adverse patient outcomes are often particularly memorable. However, high‐reliability organizations recognize the importance of front‐line provider input, such as on the sensitivity of operations (working conditions) and by deferring to expertise (insights and recommendations from providers most knowledgeable of conditions, regardless of seniority).[8]
We acknowledge that several workload factors, such as hospital setting, may not be readily modifiable. However, we also report factors that can be intervened upon, such as assistance[5, 6] or geographic localization of patients.[9, 10] An understanding of both modifiable and fixed factors in healthcare delivery is essential for improving patient care.
This study has significant research implications. It suggests that team structure and physician experience may be used to improve workload safety. Also, particularly if these self‐reported findings are verified using clinical outcomes, providing hospitalists with greater staffing assistance and systems responsive to census fluctuations may improve the safety, quality, and flow of patient care. Future research may identify the association of physician, team, and hospital factors with outcomes and objectively assess targeted interventions to improve both the efficiency and quality of care.
Acknowledgments
The authors thank the Johns Hopkins Clinical Research Network Hospitalists, General Internal Medicine Research in Progress Physicians, and Hospitalist Directors for the Maryland/District of Columbia region for sharing their models of care and comments on the survey content. They also thank Michael Paskavitz, BA (Editor‐in‐Chief) and Brian Driscoll, BA (Managing Editor) from Quantia Communications for all of their technical assistance in administering the survey.
Disclosures: Drs. Michtalik and Brotman had full access to all of the data in the study and take responsibility for the integrity of the data and accuracy of the data analysis. Study concept and design: Michtalik, Pronovost, Brotman. Analysis, interpretation of data: Michtalik, Pronovost, Marsteller, Spetz, Brotman. Drafting of the manuscript: Michtalik, Brotman. Critical revision of the manuscript for important intellectual content: Michtalik, Pronovost, Marsteller, Spetz, Brotman. Dr. Brotman has received compensation from Quantia Communications, not exceeding $10,000 annually, for developing educational content. Dr. Michtalik was supported by NIH grant T32 HP10025‐17‐00 and NIH/Johns Hopkins Institute for Clinical and Translational Research KL2 Award 5KL2RR025006. The Johns Hopkins Hospitalist Scholars Fund provided funding for survey implementation and data acquisition by Quantia Communications. The funders had no role in the design, analysis, and interpretation of the data, or the preparation, review, or approval of the manuscript. The authors report no conflicts of interest.
- , , , . Impact of attending physician workload on patient care: a survey of hospitalists. JAMA Intern Med. 2013;173(5):375–377.
- , , , et al. Does surgeon workload per day affect outcomes after pulmonary lobectomies? Ann Thorac Surg. 2012;94(3):966–972.
- , , , . Perceived effects of attending physician workload in academic medical intensive care units: a national survey of training program directors. Crit Care Med. 2012;40(2):400–405.
- , , , , . Developing a model for attending physician workload and outcomes. JAMA Intern Med. 2013;173(11):1026–1028.
- , , , et al. A comparison of outcomes of general medical inpatient care provided by a hospitalist‐physician assistant model vs a traditional resident‐based model. J Hosp Med. 2011;6(3):122–130.
- , , , et al. Implementation of a physician assistant/hospitalist service in an academic medical center: impact on efficiency and patient outcomes. J Hosp Med. 2008;3(5):361–368.
- , , , . Improving patient flow and reducing emergency department crowding: a guide for hospitals. AHRQ publication no. 11(12)−0094. Rockville, MD: Agency for Healthcare Research and Quality; 2011.
- , , , et al. Becoming a high reliability organization: operational advice for hospital leaders. AHRQ publication no. 08–0022. Rockville, MD: Agency for Healthcare Research and Quality; 2008.
- , , , et al. Impact of localizing general medical teams to a single nursing unit. J Hosp Med. 2012;7(7):551–556.
- , , , et al. Impact of localizing physicians to hospital units on nurse‐physician communication and agreement on the plan of care. J Gen Intern Med. 2009;24(11):1223–1227.
Rapid Response Systems
In 2006,[1] we questioned whether rapid response systems (RRSs) were an effective strategy for detecting and managing deteriorating general ward patients. Since then, the implementation of RRSs has flourished, especially in the United States where accreditors (Joint Commission)[2] and patient‐safety organizations (Institute for Healthcare Improvement 100,000 Live Campaign)[3] have strongly supported RRSs. Decades of evidence show that general ward patients often experience unrecognized deterioration and cardiorespiratory arrest (CA). The low sensitivity and accuracy of periodic assessments by staff are thought to be a major reason for these lapses, as are imbalances between patient needs and clinician (primarily nursing) resources. Additionally, a medical culture that punishes speaking up or bypassing the chain of command are also likely contributors to the problem. A system that effectively recognizes the early signs of deterioration and quickly responds should catch problems before they become life threatening. Over the last decade, RRSs have been the primary intervention implemented to do this. The potential for RRSs to improve outcomes has strong face validity, but researchers have struggled to demonstrate consistent improvements in outcomes across institutions. Given this, are RRSs the best intervention to prevent this failure to rescue? In this editorial we examine the progress of RRSs, how they compare to other options, and we consider whether we should continue to question their implementation.
In our 2007 systematic review,[4] we concluded there was weak to moderate evidence supporting RRSs. Since then, 6 other systematic reviews of the effectiveness or implementation of RRSs have been published. One high‐quality review of effectiveness studies published through 2008 by Chan et al.[5] found that RRSs significantly reduced non‐intensive care unit (ICU) CA (relative risk [RR], 0.66; 95% confidence interval [CI], 0.54‐0.80), but not total hospital mortality (RR, 0.96; 95% CI, 0.84‐1.09) in adult inpatients. In pediatric inpatients, RRSs led to significant improvements in both non‐ICU CA (RR, 0.62; 95% CI, 0.46 to 0.84) and total hospital mortality (RR, 0.79; 95% CI, 0.63 to 0.98). Subsequent to 2008, a structured search[6] finds 26 additional studies.[7, 8, 9, 10, 11, 12, 13, 14, 15, 16, 17, 18, 19, 20, 21, 22, 23, 24, 25, 26, 27, 28, 29, 30] Although the benefit for CA in both adults and children has remained robust, even more so since Chan's review, mortality reductions in adult patients appear to have had the most notable shift. In aggregate, the point estimate (for those studies providing analyzable data), for adult mortality has strengthened to 0.88, with a confidence interval of 0.82‐0.96 in favor of the RRS strategy.
This change has occurred as the analyzable studies since 2008 have all had favorable point estimates, and 4 have had statistically significant confidence intervals. Prior to 2008, 5 had unfavorable point estimates, and only 2 had favorable confidence intervals. As RRSs expand, the benefits, although not universal (some hospitals still experience no improvement in outcomes), seem to be getting stronger and more consistent. This may be secondary to maturation of the intervention and implementation strategies, or it may be the result of secular trends outside of the RRS intervention, although studies controlling for this found it not to be the case.[10] The factors associated with successful implementation of the RRS or improved outcomes include knowledge of activation criteria, communication, teamwork, lack of criticism for activating the RRS, and better attitudes about the team's positive effect on nurses and patients. Many of these factors relate to an improved safety culture in general. Additionally, activation rates may have increased in more recent studies, as greater utilization is associated with improved outcomes.[31] Finally, RRSs, like other patient‐safety and quality interventions, mature with time, often taking several years before they have a full effect on outcomes.[31, 32]
Despite these more favorable results for RRSs, we still see a large discrepancy between the magnitude of benefit for CA and mortality. This may partly be because the exposure groups are different; most studies examined non‐ICU CA, yet studies reporting mortality used total hospital mortality (ICU and non‐ICU). Additionally, although RRSs may effectively prevent CA, this intervention may have a more limited effect in preventing the patient's ultimate demise (particularly in the ICU).
We also still see that effectiveness reports for RRSs continue to be of low to moderate quality. Many reports give no statistics or denominator data or have missing data. Few control for secular trends in providers, outcomes, and confounders. Outcome measures vary widely, and none conducted blinded outcome assessments. Most studies use a pre‐post design without concurrent controls, substantially increasing the risk of bias. The better‐designed studies that use concurrent controls or cluster randomization (Priestley,[33] Bristow,[34] and the MERIT trial[35]) tend to show lower treatment effects, although interestingly in the MERIT trial, while the cluster‐randomized data showed no benefit, the pre‐post data showed significant improvement in the RRS intervention hospitals. These results have been attributed to the control hospitals using their code teams for RRS activities,[36] negating a comparative improvement in the intervention hospitals.
Can we improve RRS research? Likely, yes. We can begin by being more careful about defining the exposure group. Ideally, studies should not include data from the ICU or the emergency department because these patient populations are not part of the exposure group. Although most studies removed ICU and emergency department data for CA, they did not do so for hospital mortality. ICU mortality is likely biased, because only a small proportion of ICU patients have been exposed to an RRS. Definitions also need to be stringent and uniform. For example, CA may be defined in a variety of ways such as calling the code team versus documented cardiopulmonary resuscitation. Unexpected hospital mortality is often defined as excluding patients with do not resuscitate (DNR) orders, but this may or may not accurately exclude expected deaths. We also need to better attempt to control for confounders and secular trends. Outcomes such as CA and mortality are strongly influenced by changes in patient case‐mix over time, the frequency of care limitation/DNR orders, or by poor triage decisions.[37] Outcomes such as unanticipated ICU admission are indirect and may be heavily influenced by local cultural factors. Finally, authors need to provide robust statistical data and clear numerators and denominators to support their conclusions.
Although we need to do our best to improve the quality of the RRS literature, the near ubiquitous presence of this patient‐safety intervention in North American hospitals raises a crucial question, Do we even need more effectiveness studies and if so what kind? Randomized controlled trials are not likely. It is hard to argue that we still sit at a position of equipoise, and randomizing patients who are deteriorating to standard care versus an RRS is neither practical nor ethical. Finding appropriate concurrent control hospitals that have not implemented some type of RRS would also be very difficult.
We should, however, continue to test the effectiveness of RRSs but in a more diverse manner. RRSs should be more directly compared to other interventions that can improve the problem of failure to rescue such as increased nurse staffing[38, 39, 40] and hospitalist staffing.[41] The low sensitivity and accuracy of monitoring vital signs on general wards by staff is also an area strongly deserving of investigation, as it is likely central to the problem. Researchers have sought to use various combinations of vital signs, including aggregated or weighted scoring systems, and recent data suggest some approaches may be superior to others.[42] Many have advocated for continuous monitoring of a limited set of vital signs similar to the ICU, and there are some recent data indicating that this might be effective.[43, 44] This work is in the early stages, and we do not yet know whether this strategy will affect outcomes. It is conceivable that if the false alarm rate can be kept very low and we can minimize the failure to recognize deteriorating patients (good sensitivity, specificity, and positive predictive value), the need for the RRS response team may be reduced or even eliminated. Additionally, as electronic medical records (EMRs) have expanded, there has been growing interest in leveraging these systems to improve the effectiveness of RRSs.[45] There is a tremendous amount of information within the EMRs that can be used to complement vital‐sign monitoring (manual or continuous), because baseline medical problems, laboratory values, and recent history may have a strong impact on the predictive value of changes in vital signs.
Research should also focus on the possible unintended consequences, costs, and the cost‐effectiveness of RRSs compared with other interventions that can or may reduce the rate of failure to rescue. Certainly, establishing RRSs has costs including staff time and the need to pull staff from other clinical duties to respond. Unintended harm, such as diversion of ICU staff from their usual care, are often mentioned but never rigorously evaluated. Increasing nurse staffing has very substantial costs, but how these costs compare to the costs of the RRS are unclear, although likely the comparison would be very favorable to the RRS, because staffing typically relies on existing employees with expertise in caring for the critically ill as opposed to workforce expansion. Given the current healthcare economic climate, any model that relies on additional employees is not likely to gain support. Establishing continuous monitoring systems have up‐front capital costs, although they may reduce other costs in the long run (eg, staff, medical liability). They also have intangible costs for provider workload if the false alarm rates are too high. Again, this strategy is too new to know the answers to these concerns. As we move forward, such evaluations are needed to guide policy decisions.
We also need more evaluation of RRS implementation science. The optimal way to organize, train, and staff RRSs is unknown. Most programs use physician‐led teams, although some use nurse‐led teams. Few studies have compared the various models, although 1 study that compared a resident‐led to an attending‐led team found no difference.[17] Education is ubiquitous, although actual staff training (simulation for example) is not commonly described. In addition, there is wide variation in the frequency of RRS activation. We know nurses and residents often feel pressured not to activate RRSs, and much of the success of the RRS relies on nurses identifying deteriorating patients and calling the response team. The use of continuous monitoring combined with automatic notification of staff may reduce the barriers to activating RRSs, increasing activation rates, but until then we need more understanding of how to break down these barriers. Family/patient access to activation has also gained ground (1 program demonstrated outcome improvement only after this was established[13]), but is not yet widespread.
The role of the RRS in improving processes of care, such as the appropriate institution of DNR orders, end of life/palliative care discussions, and early goal‐directed therapy for sepsis, have been presented in several studies[46, 47] but remain inadequately evaluated. Here too, there is much to learn about how we might realize the full effectiveness of this patient‐safety strategy beyond outcomes such as CA and hospital mortality. Ideally, if all appropriate patients had DNR orders and we stopped failing to recognize and respond to deteriorating ward patients, CAs on general hospital wards could be nearly eliminated.
RRSs have been described as a band‐aid for a failed model of general ward care.[37] What is clear is that many patients suffer preventable harm from unrecognized deterioration. This needs to be challenged, but are RRSs the best intervention? Despite the Joint Commission's Patient Safety Goal 16, should we still question their implementation? Should we (and the Joint Commission) reconsider our approach and prioritize our efforts elsewhere or should we feel comfortable with the investment that we have made in these systems? Even though there are many unknowns, and the quality of RRS studies needs improvement, the literature is accumulating that RRSs do reduce non‐ICU CA and improve hospital mortality. Without direct comparison studies demonstrating superiority of other expensive strategies, there is little reason to reconsider the RRS concept or question their implementation and our investment. We should instead invest further in this foundational patient‐safety strategy to make it as effective as it can be.
Disclosures: Dr. Pronovost reports the following potential conflicts of interest: grant or contract support from the Agency for Healthcare Research and Quality, and the Gordon and Betty Moore Foundation (research related to patient safety and quality of care), and the National Institutes of Health (acute lung injury research); consulting fees from the Association of Professionals in Infection Control and Epidemiology, Inc.; honoraria from various hospitals, health systems, and the Leigh Bureau to speak on quality and patient safety; book royalties from the Penguin Group; and board membership for the Cantel Medical Group. Dr. Winters reports the following potential conflicts of interest: contract or grant support from Masimo Corporation, honoraria from 3M Corporation and various hospitals and health systems, royalties from Lippincott Williams &Wilkins (UptoDate), and consulting fees from several legal firms for medical legal consulting.
- , , . Rapid response teams: walk, don't run. JAMA. 2006;296:1645–1647.
- Joint Commission requirement: The Joint Commission announces the 2008 National Patient Safety Goals and Requirements. Jt Comm Perspect. 2007;27(7):1–22.
- Institute for Healthcare Improvement. 5 million lives campaign: overview. Available at: http://www.ihi.org/offerings/Initiatives/PastStrategicInitiatives/5MillionLivesCampaign/Pages/default.aspx. Accessed November 28, 2012.
- , , , , , . Rapid response systems: a systematic review. Crit Care Med. 2007;35:1238–1243.
- , , , , . Rapid response teams: a systematic review and meta‐analysis. Arch Intern Med. 2010;170:18–26.
- , , , , , . Rapid‐response systems as a patient safety strategy: a systematic review. Ann Intern Med. 2013;158:417–425.
- , , , , , . Hospital‐wide code rates and mortality before and after implementation of a rapid response team. JAMA. 2008;300:2506–2513.
- , , , . Experience of pediatric rapid response team in a tertiary care hospital in Pakistan. Indian J Pediatr. 2010;77:273–276.
- , , , et al. Rescue me: saving the vulnerable non‐ICU patient population. Jt Comm J Qual Patient Saf. 2009;35:199–205.
- , , , , . Reduction in hospital‐wide mortality after implementation of a rapid response team: a long‐term cohort study. Crit Care. 2011;15:R269.
- , , , , . Using an advanced practice nursing model for a rapid response team. Jt Comm J Qual Patient Saf. 2008;34:743–747.
- , , , , , . Immediate and long‐term impact of medical emergency teams on cardiac arrest prevalence and mortality: a plea for periodic basic life‐support training programs. Crit Care Med. 2009;37:3054–3061.
- , , , , , . Successful implementation of a family and patient activated rapid response team in an adult level 1 trauma center. Resuscitation. 2010;81:1676–1681.
- , , , et al. A reduction in cardiac arrests and duration of clinical instability after implementation of a paediatric rapid response system. Qual Saf Health Care. 2009;18:500–504.
- , , , et al. Implementing a rapid response team to decrease emergencies outside the ICU: one hospital's experience. Medsurg Nurs. 2009;18:84–90, 126.
- , , , et al. Sustained effectiveness of a primary‐team‐based rapid response system. Crit Care Med. 2012;40:2562–2568.
- , , , . Association between implementation of an intensivist‐led medical emergency team and mortality. BMJ Qual Saf. 2012;21:152–159.
- , , , , , . Reducing in‐hospital cardiac arrests and hospital mortality by introducing a medical emergency team. Intensive Care Med. 2010;36:100–106.
- , , , et al. Implementation of a multicenter rapid response system in pediatric academic hospitals is effective. Pediatrics. 2011;128:72–78.
- , . The impact of medical emergency teams on ICU admission rates, cardiopulmonary arrests and mortality in a regional hospital. Resuscitation. 2011;82:707–712.
- , , , . Introduction of a rapid response system at a United States veterans affairs hospital reduced cardiac arrests. Anesth Analg. 2010;111:679–686.
- , , , . The effect of the medical emergency team on unexpected cardiac arrest and death at the VA Caribbean healthcare system: a retrospective study. Crit Care Shock. 2010;13:98–105.
- , , , , . Four years' experience with a hospitalist‐led medical emergency team: an interrupted time series. J Hosp Med. 2012;7:98–103.
- , , . Changing cardiac arrest and hospital mortality rates through a medical emergency team takes time and constant review. Crit Care Med. 2010;38:445–450.
- , , , et al. Clinical emergencies and outcomes in patients admitted to a surgical versus medical service. Resuscitation. 2011;82:415–418.
- , , , . Evaluating a new rapid response team: NP‐led versus intensivist‐led comparisons. AACN Adv Crit Care. 2012;23:32–42.
- , . Implementation of a rapid response team: a success story. Crit Care Nurse. 2009;29:66–75.
- , , , . Rapid response team in an academic institution: does it make a difference? Chest. 2011;139:1361–1367.
- , . Reduction of hospital mortality and of preventable cardiac arrest and death on introduction of a pediatric medical emergency team. Ped Crit Care Med. 2009;10:306–312.
- , . Medical emergency teams are associated with reduced mortality across a major metropolitan health network after two years service: a retrospective study using government administrative data. Crit Care. 2012;16:R210.
- , , , , et al. Long term effect of a medical emergency team on cardiac arrests in a teaching hospital. Crit Care. 2005;9:R808–R815.
- , , , . Six year audit of cardiac arrests and medical emergency team calls in an Australian outer metropolitan teaching hospital. BMJ. 2007;335:1210–1212.
- , , , et al. Introducing Critical Care Outreach: a ward‐randomised trial of phased introduction in a general hospital. Intensive Care Med. 2004;30:1398–1404.
- , , , et al. Rates of in‐hospital arrests, deaths, and intensive care admissions: the effect of a medical emergency team. Med J Aust. 2000;173:236–240.
- , , , et al. Introduction of the medical emergency team (MET) system: a cluster randomised controlled trial. Lancet. 2005;365:2091–2097.
- , , , , , . The effectiveness of implementation of the medical emergency team (MET) system and factors associated with use during the MERIT study. Crit Care Resusc. 2007;9:206–212.
- , . Rethinking rapid response teams. JAMA. 2010;304:1375–1376.
- , , . Lower mortality for abdominal aortic aneurysm repair in high‐volume hospitals is contingent upon nurse staffing [published online ahead of print October 22, 2012]. Health Serv Res. doi: 10.1111/1475–6773.12004.
- , , , , . Nurse‐staffing levels and the quality of care in hospitals. N Engl J Med. 2002;346:1715–1722.
- . The association of registered nurse staffing levels and patient outcomes: systematic review and meta‐analysis. Med Care. 2007;45:1195–1204.
- , , , , , . Outcomes of care by hospitalists, general internists, and family physicians. N Engl J Med. 2007;357:2589–2600.
- , , , , . The ability of the National Early Warning Score (NEWS) to discriminate patients at risk of early cardiac arrest, unanticipated intensive care unit admission, and death. Resuscitation. 2013;84:465–470.
- , , , . Impact of pulse oximetry surveillance on rescue events and intensive care unit transfers: a before‐and‐after concurrence study. Anesthesiology. 2010;112:282–287.
- , , , et al. A controlled trial of electronic automated advisory vital signs monitoring in general hospital wards. Crit Care Med. 2012;40:2349–2361.
- Agency for Healthcare Research and Quality. Early warning scoring system proactively identifies patients at risk of deterioration, leading to fewer cardiopulmonary emergencies and deaths. Available at: http://www.innovations.ahrq.gov/content.aspx?id=2607. Accessed March 26, 2013.
- , , , et al. Effect of a rapid response system for patients in shock on time to treatment and mortality during 5 years. Crit Care Med. 2007;35:2568–2575.
- , , , , , . The medical emergency team and end‐of‐life care: a pilot study. Crit Care Resusc. 2007;9:151–156.
In 2006,[1] we questioned whether rapid response systems (RRSs) were an effective strategy for detecting and managing deteriorating general ward patients. Since then, the implementation of RRSs has flourished, especially in the United States where accreditors (Joint Commission)[2] and patient‐safety organizations (Institute for Healthcare Improvement 100,000 Live Campaign)[3] have strongly supported RRSs. Decades of evidence show that general ward patients often experience unrecognized deterioration and cardiorespiratory arrest (CA). The low sensitivity and accuracy of periodic assessments by staff are thought to be a major reason for these lapses, as are imbalances between patient needs and clinician (primarily nursing) resources. Additionally, a medical culture that punishes speaking up or bypassing the chain of command are also likely contributors to the problem. A system that effectively recognizes the early signs of deterioration and quickly responds should catch problems before they become life threatening. Over the last decade, RRSs have been the primary intervention implemented to do this. The potential for RRSs to improve outcomes has strong face validity, but researchers have struggled to demonstrate consistent improvements in outcomes across institutions. Given this, are RRSs the best intervention to prevent this failure to rescue? In this editorial we examine the progress of RRSs, how they compare to other options, and we consider whether we should continue to question their implementation.
In our 2007 systematic review,[4] we concluded there was weak to moderate evidence supporting RRSs. Since then, 6 other systematic reviews of the effectiveness or implementation of RRSs have been published. One high‐quality review of effectiveness studies published through 2008 by Chan et al.[5] found that RRSs significantly reduced non‐intensive care unit (ICU) CA (relative risk [RR], 0.66; 95% confidence interval [CI], 0.54‐0.80), but not total hospital mortality (RR, 0.96; 95% CI, 0.84‐1.09) in adult inpatients. In pediatric inpatients, RRSs led to significant improvements in both non‐ICU CA (RR, 0.62; 95% CI, 0.46 to 0.84) and total hospital mortality (RR, 0.79; 95% CI, 0.63 to 0.98). Subsequent to 2008, a structured search[6] finds 26 additional studies.[7, 8, 9, 10, 11, 12, 13, 14, 15, 16, 17, 18, 19, 20, 21, 22, 23, 24, 25, 26, 27, 28, 29, 30] Although the benefit for CA in both adults and children has remained robust, even more so since Chan's review, mortality reductions in adult patients appear to have had the most notable shift. In aggregate, the point estimate (for those studies providing analyzable data), for adult mortality has strengthened to 0.88, with a confidence interval of 0.82‐0.96 in favor of the RRS strategy.
This change has occurred as the analyzable studies since 2008 have all had favorable point estimates, and 4 have had statistically significant confidence intervals. Prior to 2008, 5 had unfavorable point estimates, and only 2 had favorable confidence intervals. As RRSs expand, the benefits, although not universal (some hospitals still experience no improvement in outcomes), seem to be getting stronger and more consistent. This may be secondary to maturation of the intervention and implementation strategies, or it may be the result of secular trends outside of the RRS intervention, although studies controlling for this found it not to be the case.[10] The factors associated with successful implementation of the RRS or improved outcomes include knowledge of activation criteria, communication, teamwork, lack of criticism for activating the RRS, and better attitudes about the team's positive effect on nurses and patients. Many of these factors relate to an improved safety culture in general. Additionally, activation rates may have increased in more recent studies, as greater utilization is associated with improved outcomes.[31] Finally, RRSs, like other patient‐safety and quality interventions, mature with time, often taking several years before they have a full effect on outcomes.[31, 32]
Despite these more favorable results for RRSs, we still see a large discrepancy between the magnitude of benefit for CA and mortality. This may partly be because the exposure groups are different; most studies examined non‐ICU CA, yet studies reporting mortality used total hospital mortality (ICU and non‐ICU). Additionally, although RRSs may effectively prevent CA, this intervention may have a more limited effect in preventing the patient's ultimate demise (particularly in the ICU).
We also still see that effectiveness reports for RRSs continue to be of low to moderate quality. Many reports give no statistics or denominator data or have missing data. Few control for secular trends in providers, outcomes, and confounders. Outcome measures vary widely, and none conducted blinded outcome assessments. Most studies use a pre‐post design without concurrent controls, substantially increasing the risk of bias. The better‐designed studies that use concurrent controls or cluster randomization (Priestley,[33] Bristow,[34] and the MERIT trial[35]) tend to show lower treatment effects, although interestingly in the MERIT trial, while the cluster‐randomized data showed no benefit, the pre‐post data showed significant improvement in the RRS intervention hospitals. These results have been attributed to the control hospitals using their code teams for RRS activities,[36] negating a comparative improvement in the intervention hospitals.
Can we improve RRS research? Likely, yes. We can begin by being more careful about defining the exposure group. Ideally, studies should not include data from the ICU or the emergency department because these patient populations are not part of the exposure group. Although most studies removed ICU and emergency department data for CA, they did not do so for hospital mortality. ICU mortality is likely biased, because only a small proportion of ICU patients have been exposed to an RRS. Definitions also need to be stringent and uniform. For example, CA may be defined in a variety of ways such as calling the code team versus documented cardiopulmonary resuscitation. Unexpected hospital mortality is often defined as excluding patients with do not resuscitate (DNR) orders, but this may or may not accurately exclude expected deaths. We also need to better attempt to control for confounders and secular trends. Outcomes such as CA and mortality are strongly influenced by changes in patient case‐mix over time, the frequency of care limitation/DNR orders, or by poor triage decisions.[37] Outcomes such as unanticipated ICU admission are indirect and may be heavily influenced by local cultural factors. Finally, authors need to provide robust statistical data and clear numerators and denominators to support their conclusions.
Although we need to do our best to improve the quality of the RRS literature, the near ubiquitous presence of this patient‐safety intervention in North American hospitals raises a crucial question, Do we even need more effectiveness studies and if so what kind? Randomized controlled trials are not likely. It is hard to argue that we still sit at a position of equipoise, and randomizing patients who are deteriorating to standard care versus an RRS is neither practical nor ethical. Finding appropriate concurrent control hospitals that have not implemented some type of RRS would also be very difficult.
We should, however, continue to test the effectiveness of RRSs but in a more diverse manner. RRSs should be more directly compared to other interventions that can improve the problem of failure to rescue such as increased nurse staffing[38, 39, 40] and hospitalist staffing.[41] The low sensitivity and accuracy of monitoring vital signs on general wards by staff is also an area strongly deserving of investigation, as it is likely central to the problem. Researchers have sought to use various combinations of vital signs, including aggregated or weighted scoring systems, and recent data suggest some approaches may be superior to others.[42] Many have advocated for continuous monitoring of a limited set of vital signs similar to the ICU, and there are some recent data indicating that this might be effective.[43, 44] This work is in the early stages, and we do not yet know whether this strategy will affect outcomes. It is conceivable that if the false alarm rate can be kept very low and we can minimize the failure to recognize deteriorating patients (good sensitivity, specificity, and positive predictive value), the need for the RRS response team may be reduced or even eliminated. Additionally, as electronic medical records (EMRs) have expanded, there has been growing interest in leveraging these systems to improve the effectiveness of RRSs.[45] There is a tremendous amount of information within the EMRs that can be used to complement vital‐sign monitoring (manual or continuous), because baseline medical problems, laboratory values, and recent history may have a strong impact on the predictive value of changes in vital signs.
Research should also focus on the possible unintended consequences, costs, and the cost‐effectiveness of RRSs compared with other interventions that can or may reduce the rate of failure to rescue. Certainly, establishing RRSs has costs including staff time and the need to pull staff from other clinical duties to respond. Unintended harm, such as diversion of ICU staff from their usual care, are often mentioned but never rigorously evaluated. Increasing nurse staffing has very substantial costs, but how these costs compare to the costs of the RRS are unclear, although likely the comparison would be very favorable to the RRS, because staffing typically relies on existing employees with expertise in caring for the critically ill as opposed to workforce expansion. Given the current healthcare economic climate, any model that relies on additional employees is not likely to gain support. Establishing continuous monitoring systems have up‐front capital costs, although they may reduce other costs in the long run (eg, staff, medical liability). They also have intangible costs for provider workload if the false alarm rates are too high. Again, this strategy is too new to know the answers to these concerns. As we move forward, such evaluations are needed to guide policy decisions.
We also need more evaluation of RRS implementation science. The optimal way to organize, train, and staff RRSs is unknown. Most programs use physician‐led teams, although some use nurse‐led teams. Few studies have compared the various models, although 1 study that compared a resident‐led to an attending‐led team found no difference.[17] Education is ubiquitous, although actual staff training (simulation for example) is not commonly described. In addition, there is wide variation in the frequency of RRS activation. We know nurses and residents often feel pressured not to activate RRSs, and much of the success of the RRS relies on nurses identifying deteriorating patients and calling the response team. The use of continuous monitoring combined with automatic notification of staff may reduce the barriers to activating RRSs, increasing activation rates, but until then we need more understanding of how to break down these barriers. Family/patient access to activation has also gained ground (1 program demonstrated outcome improvement only after this was established[13]), but is not yet widespread.
The role of the RRS in improving processes of care, such as the appropriate institution of DNR orders, end of life/palliative care discussions, and early goal‐directed therapy for sepsis, have been presented in several studies[46, 47] but remain inadequately evaluated. Here too, there is much to learn about how we might realize the full effectiveness of this patient‐safety strategy beyond outcomes such as CA and hospital mortality. Ideally, if all appropriate patients had DNR orders and we stopped failing to recognize and respond to deteriorating ward patients, CAs on general hospital wards could be nearly eliminated.
RRSs have been described as a band‐aid for a failed model of general ward care.[37] What is clear is that many patients suffer preventable harm from unrecognized deterioration. This needs to be challenged, but are RRSs the best intervention? Despite the Joint Commission's Patient Safety Goal 16, should we still question their implementation? Should we (and the Joint Commission) reconsider our approach and prioritize our efforts elsewhere or should we feel comfortable with the investment that we have made in these systems? Even though there are many unknowns, and the quality of RRS studies needs improvement, the literature is accumulating that RRSs do reduce non‐ICU CA and improve hospital mortality. Without direct comparison studies demonstrating superiority of other expensive strategies, there is little reason to reconsider the RRS concept or question their implementation and our investment. We should instead invest further in this foundational patient‐safety strategy to make it as effective as it can be.
Disclosures: Dr. Pronovost reports the following potential conflicts of interest: grant or contract support from the Agency for Healthcare Research and Quality, and the Gordon and Betty Moore Foundation (research related to patient safety and quality of care), and the National Institutes of Health (acute lung injury research); consulting fees from the Association of Professionals in Infection Control and Epidemiology, Inc.; honoraria from various hospitals, health systems, and the Leigh Bureau to speak on quality and patient safety; book royalties from the Penguin Group; and board membership for the Cantel Medical Group. Dr. Winters reports the following potential conflicts of interest: contract or grant support from Masimo Corporation, honoraria from 3M Corporation and various hospitals and health systems, royalties from Lippincott Williams &Wilkins (UptoDate), and consulting fees from several legal firms for medical legal consulting.
- , , . Rapid response teams: walk, don't run. JAMA. 2006;296:1645–1647.
- Joint Commission requirement: The Joint Commission announces the 2008 National Patient Safety Goals and Requirements. Jt Comm Perspect. 2007;27(7):1–22.
- Institute for Healthcare Improvement. 5 million lives campaign: overview. Available at: http://www.ihi.org/offerings/Initiatives/PastStrategicInitiatives/5MillionLivesCampaign/Pages/default.aspx. Accessed November 28, 2012.
- , , , , , . Rapid response systems: a systematic review. Crit Care Med. 2007;35:1238–1243.
- , , , , . Rapid response teams: a systematic review and meta‐analysis. Arch Intern Med. 2010;170:18–26.
- , , , , , . Rapid‐response systems as a patient safety strategy: a systematic review. Ann Intern Med. 2013;158:417–425.
- , , , , , . Hospital‐wide code rates and mortality before and after implementation of a rapid response team. JAMA. 2008;300:2506–2513.
- , , , . Experience of pediatric rapid response team in a tertiary care hospital in Pakistan. Indian J Pediatr. 2010;77:273–276.
- , , , et al. Rescue me: saving the vulnerable non‐ICU patient population. Jt Comm J Qual Patient Saf. 2009;35:199–205.
- , , , , . Reduction in hospital‐wide mortality after implementation of a rapid response team: a long‐term cohort study. Crit Care. 2011;15:R269.
- , , , , . Using an advanced practice nursing model for a rapid response team. Jt Comm J Qual Patient Saf. 2008;34:743–747.
- , , , , , . Immediate and long‐term impact of medical emergency teams on cardiac arrest prevalence and mortality: a plea for periodic basic life‐support training programs. Crit Care Med. 2009;37:3054–3061.
- , , , , , . Successful implementation of a family and patient activated rapid response team in an adult level 1 trauma center. Resuscitation. 2010;81:1676–1681.
- , , , et al. A reduction in cardiac arrests and duration of clinical instability after implementation of a paediatric rapid response system. Qual Saf Health Care. 2009;18:500–504.
- , , , et al. Implementing a rapid response team to decrease emergencies outside the ICU: one hospital's experience. Medsurg Nurs. 2009;18:84–90, 126.
- , , , et al. Sustained effectiveness of a primary‐team‐based rapid response system. Crit Care Med. 2012;40:2562–2568.
- , , , . Association between implementation of an intensivist‐led medical emergency team and mortality. BMJ Qual Saf. 2012;21:152–159.
- , , , , , . Reducing in‐hospital cardiac arrests and hospital mortality by introducing a medical emergency team. Intensive Care Med. 2010;36:100–106.
- , , , et al. Implementation of a multicenter rapid response system in pediatric academic hospitals is effective. Pediatrics. 2011;128:72–78.
- , . The impact of medical emergency teams on ICU admission rates, cardiopulmonary arrests and mortality in a regional hospital. Resuscitation. 2011;82:707–712.
- , , , . Introduction of a rapid response system at a United States veterans affairs hospital reduced cardiac arrests. Anesth Analg. 2010;111:679–686.
- , , , . The effect of the medical emergency team on unexpected cardiac arrest and death at the VA Caribbean healthcare system: a retrospective study. Crit Care Shock. 2010;13:98–105.
- , , , , . Four years' experience with a hospitalist‐led medical emergency team: an interrupted time series. J Hosp Med. 2012;7:98–103.
- , , . Changing cardiac arrest and hospital mortality rates through a medical emergency team takes time and constant review. Crit Care Med. 2010;38:445–450.
- , , , et al. Clinical emergencies and outcomes in patients admitted to a surgical versus medical service. Resuscitation. 2011;82:415–418.
- , , , . Evaluating a new rapid response team: NP‐led versus intensivist‐led comparisons. AACN Adv Crit Care. 2012;23:32–42.
- , . Implementation of a rapid response team: a success story. Crit Care Nurse. 2009;29:66–75.
- , , , . Rapid response team in an academic institution: does it make a difference? Chest. 2011;139:1361–1367.
- , . Reduction of hospital mortality and of preventable cardiac arrest and death on introduction of a pediatric medical emergency team. Ped Crit Care Med. 2009;10:306–312.
- , . Medical emergency teams are associated with reduced mortality across a major metropolitan health network after two years service: a retrospective study using government administrative data. Crit Care. 2012;16:R210.
- , , , , et al. Long term effect of a medical emergency team on cardiac arrests in a teaching hospital. Crit Care. 2005;9:R808–R815.
- , , , . Six year audit of cardiac arrests and medical emergency team calls in an Australian outer metropolitan teaching hospital. BMJ. 2007;335:1210–1212.
- , , , et al. Introducing Critical Care Outreach: a ward‐randomised trial of phased introduction in a general hospital. Intensive Care Med. 2004;30:1398–1404.
- , , , et al. Rates of in‐hospital arrests, deaths, and intensive care admissions: the effect of a medical emergency team. Med J Aust. 2000;173:236–240.
- , , , et al. Introduction of the medical emergency team (MET) system: a cluster randomised controlled trial. Lancet. 2005;365:2091–2097.
- , , , , , . The effectiveness of implementation of the medical emergency team (MET) system and factors associated with use during the MERIT study. Crit Care Resusc. 2007;9:206–212.
- , . Rethinking rapid response teams. JAMA. 2010;304:1375–1376.
- , , . Lower mortality for abdominal aortic aneurysm repair in high‐volume hospitals is contingent upon nurse staffing [published online ahead of print October 22, 2012]. Health Serv Res. doi: 10.1111/1475–6773.12004.
- , , , , . Nurse‐staffing levels and the quality of care in hospitals. N Engl J Med. 2002;346:1715–1722.
- . The association of registered nurse staffing levels and patient outcomes: systematic review and meta‐analysis. Med Care. 2007;45:1195–1204.
- , , , , , . Outcomes of care by hospitalists, general internists, and family physicians. N Engl J Med. 2007;357:2589–2600.
- , , , , . The ability of the National Early Warning Score (NEWS) to discriminate patients at risk of early cardiac arrest, unanticipated intensive care unit admission, and death. Resuscitation. 2013;84:465–470.
- , , , . Impact of pulse oximetry surveillance on rescue events and intensive care unit transfers: a before‐and‐after concurrence study. Anesthesiology. 2010;112:282–287.
- , , , et al. A controlled trial of electronic automated advisory vital signs monitoring in general hospital wards. Crit Care Med. 2012;40:2349–2361.
- Agency for Healthcare Research and Quality. Early warning scoring system proactively identifies patients at risk of deterioration, leading to fewer cardiopulmonary emergencies and deaths. Available at: http://www.innovations.ahrq.gov/content.aspx?id=2607. Accessed March 26, 2013.
- , , , et al. Effect of a rapid response system for patients in shock on time to treatment and mortality during 5 years. Crit Care Med. 2007;35:2568–2575.
- , , , , , . The medical emergency team and end‐of‐life care: a pilot study. Crit Care Resusc. 2007;9:151–156.