User login
Developing essential skills at all career stages
SHM Leadership Academy continues to grow
This fall I attended the 2018 Society of Hospital Medicine Leadership Academy, held in Vancouver. Once again, this conference sold out weeks ahead of time, and 300 hospitalists took time out of their busy schedules for learning and fun. There have been about 18 Leadership Academies over the years, with approximately 3,000 total participants, but this one may have been the best to date.
Why was it so good? Here are my top four reasons that Leadership Academy 2018 was the best ever:
Setting: Vancouver is just beautiful. My family has a strong maritime background, and I am a water person with saltwater in my veins. My inner sailor was overjoyed with the hotel’s views of False Creek and Vancouver Harbor, and I loved the mix of yachts and working boats. I even saw a seaplane! The hotel was a great match for the 300 hospitalists who traveled to the JW Marriott for 4 days of learning and relaxing. It was the perfect blend, whether for work or play; the hotel and city did not disappoint.
Networking: What’s more fun than getting to know 300 like-minded, leadership-oriented hospitalists for a few days? I am always energized by seeing old friends and making new ones. I really enjoy hearing about the professional adventures hospitalists at all career points are going through. Plus, I get really good advice on my own career! I also appreciate that a number of hospital medicine leaders (and even giants) come to SHM’s Leadership Academy. Over half of the SHM Board of Directors were there, as were a number of current and previous SHM presidents (Mark Williams, Jeff Wiese, Burke Kealey, Bob Harrington, Nasim Afsar, Rusty Holman, Ron Greeno, Chris Frost, and John Nelson), as well as Larry Wellikson, the CEO who has led our society through its many successes. All of these hospitalist leaders are there, having fun and networking, alongside everyone else.
Faculty: The faculty for all four courses (yes, Leadership Academy junkies, we’ve added a fourth course!) are absolutely phenomenal. I think the faculty are just the right blend of expert hospitalists (Jeff Glasheen, Rusty Holman, Jeff Wiese, Mark Williams, John Nelson) and national experts outside of hospital medicine. For example, Lenny Marcus of Harvard T.H. Chan School of Public Health, Boston, brings his experience coaching the Department of Defense, the White House, the Department of Homeland Security, and many others to the Influential Management and Mastering Teamwork courses. Lenny’s experience working with national leaders through disasters like the Boston Marathon bombing, Hurricane Katrina, and the Ebola outbreak make for more than riveting stories; there are real, tangible lessons for hospitalist leaders trying to improve clinical care. Nancy Spector is a pediatrician, nationally recognized for her work in mentoring, and is the executive director of Drexel University’s Executive Leadership in Academic Medicine. We have been fortunate to have her join the Academies, and Nancy successfully led the first group of hospitalists through the launch of SHM’s fourth leadership course, which I will describe in more detail below.
High energy & continued growth: There continues to be an enormous amount of energy around the Leadership Academy. The Vancouver courses sold out months ahead of the actual meeting! Hospitalists across the country continue to take on leadership roles and have told us that they value the skills they have learned from the courses.
Hospitalist leaders want more
In addition to the current 4-day courses (Strategic Essentials, Influential Management, and Mastering Teamwork), hospitalists are looking for a course that continues skill building once they return home.
That’s why SHM has developed a fourth Leadership Academy course. This course, called the Capstone Course, was launched in Vancouver and consists of 2 days of on-site skill development and team building (during the first 2 days of the traditional Leadership Academy) and 6 months of a longitudinal learning collaborative. The six-month learning collaborative component consists of a learning “pod” of five or six fellow hospitalists and monthly virtual meetings around crucial leadership topics. They are facilitated by an experienced Leadership Academy facilitator.
Dr. Spector is the lead faculty; her expertise made the Capstone launch a huge success. She will work with SHM and the Capstone participants throughout the entire 6 months to ensure the Capstone course is as high-quality as the previous three Academy courses.
If you haven’t been, I invite you to attend our next Leadership Academy. Over the years, despite being course director, I have learned many take-home skills from colleagues and leaders in the field that I use often. Just to name a few:
- Flexing my communications style: Tim Keogh’s lecture opened my eyes to the fact that not everyone is a data-driven introvert. I now know that some people need a social warm up, while others just want the facts, and that there are “huggers and shakers.” (In summary, it’s fine to shake hands with a hugger, but be wary of hugging a shaker.)
- I send birthday emails after I heard Jeff Wiese’s talk.
- Lenny Marcus taught me to be aware when I am “in the basement” emotionally. I now know to wait to send emails or confront others until I can get out of the basement.
And that’s just scratching the surface!
In closing, the Vancouver Leadership Academy was fantastic. Good friends, great professional development, a setting that was amazing, and an Academy that remains relevant and dynamic to our specialty. I can’t wait to see how the 2019 Leadership Academy shapes up for its debut in Nashville. My inner sailor may have to give way to my inner musician! I hope to see you and 300 of my closest friends there.
Learn more about SHM’s Leadership Academy at shmleadershipacademy.org.
Dr. Howell is a professor of medicine at Johns Hopkins University, Baltimore, and chief of the division of hospital medicine at Johns Hopkins Bayview Medical Center. He is also chief operating officer at the Society of Hospital Medicine and course director of the SHM Leadership Academy.
SHM Leadership Academy continues to grow
SHM Leadership Academy continues to grow
This fall I attended the 2018 Society of Hospital Medicine Leadership Academy, held in Vancouver. Once again, this conference sold out weeks ahead of time, and 300 hospitalists took time out of their busy schedules for learning and fun. There have been about 18 Leadership Academies over the years, with approximately 3,000 total participants, but this one may have been the best to date.
Why was it so good? Here are my top four reasons that Leadership Academy 2018 was the best ever:
Setting: Vancouver is just beautiful. My family has a strong maritime background, and I am a water person with saltwater in my veins. My inner sailor was overjoyed with the hotel’s views of False Creek and Vancouver Harbor, and I loved the mix of yachts and working boats. I even saw a seaplane! The hotel was a great match for the 300 hospitalists who traveled to the JW Marriott for 4 days of learning and relaxing. It was the perfect blend, whether for work or play; the hotel and city did not disappoint.
Networking: What’s more fun than getting to know 300 like-minded, leadership-oriented hospitalists for a few days? I am always energized by seeing old friends and making new ones. I really enjoy hearing about the professional adventures hospitalists at all career points are going through. Plus, I get really good advice on my own career! I also appreciate that a number of hospital medicine leaders (and even giants) come to SHM’s Leadership Academy. Over half of the SHM Board of Directors were there, as were a number of current and previous SHM presidents (Mark Williams, Jeff Wiese, Burke Kealey, Bob Harrington, Nasim Afsar, Rusty Holman, Ron Greeno, Chris Frost, and John Nelson), as well as Larry Wellikson, the CEO who has led our society through its many successes. All of these hospitalist leaders are there, having fun and networking, alongside everyone else.
Faculty: The faculty for all four courses (yes, Leadership Academy junkies, we’ve added a fourth course!) are absolutely phenomenal. I think the faculty are just the right blend of expert hospitalists (Jeff Glasheen, Rusty Holman, Jeff Wiese, Mark Williams, John Nelson) and national experts outside of hospital medicine. For example, Lenny Marcus of Harvard T.H. Chan School of Public Health, Boston, brings his experience coaching the Department of Defense, the White House, the Department of Homeland Security, and many others to the Influential Management and Mastering Teamwork courses. Lenny’s experience working with national leaders through disasters like the Boston Marathon bombing, Hurricane Katrina, and the Ebola outbreak make for more than riveting stories; there are real, tangible lessons for hospitalist leaders trying to improve clinical care. Nancy Spector is a pediatrician, nationally recognized for her work in mentoring, and is the executive director of Drexel University’s Executive Leadership in Academic Medicine. We have been fortunate to have her join the Academies, and Nancy successfully led the first group of hospitalists through the launch of SHM’s fourth leadership course, which I will describe in more detail below.
High energy & continued growth: There continues to be an enormous amount of energy around the Leadership Academy. The Vancouver courses sold out months ahead of the actual meeting! Hospitalists across the country continue to take on leadership roles and have told us that they value the skills they have learned from the courses.
Hospitalist leaders want more
In addition to the current 4-day courses (Strategic Essentials, Influential Management, and Mastering Teamwork), hospitalists are looking for a course that continues skill building once they return home.
That’s why SHM has developed a fourth Leadership Academy course. This course, called the Capstone Course, was launched in Vancouver and consists of 2 days of on-site skill development and team building (during the first 2 days of the traditional Leadership Academy) and 6 months of a longitudinal learning collaborative. The six-month learning collaborative component consists of a learning “pod” of five or six fellow hospitalists and monthly virtual meetings around crucial leadership topics. They are facilitated by an experienced Leadership Academy facilitator.
Dr. Spector is the lead faculty; her expertise made the Capstone launch a huge success. She will work with SHM and the Capstone participants throughout the entire 6 months to ensure the Capstone course is as high-quality as the previous three Academy courses.
If you haven’t been, I invite you to attend our next Leadership Academy. Over the years, despite being course director, I have learned many take-home skills from colleagues and leaders in the field that I use often. Just to name a few:
- Flexing my communications style: Tim Keogh’s lecture opened my eyes to the fact that not everyone is a data-driven introvert. I now know that some people need a social warm up, while others just want the facts, and that there are “huggers and shakers.” (In summary, it’s fine to shake hands with a hugger, but be wary of hugging a shaker.)
- I send birthday emails after I heard Jeff Wiese’s talk.
- Lenny Marcus taught me to be aware when I am “in the basement” emotionally. I now know to wait to send emails or confront others until I can get out of the basement.
And that’s just scratching the surface!
In closing, the Vancouver Leadership Academy was fantastic. Good friends, great professional development, a setting that was amazing, and an Academy that remains relevant and dynamic to our specialty. I can’t wait to see how the 2019 Leadership Academy shapes up for its debut in Nashville. My inner sailor may have to give way to my inner musician! I hope to see you and 300 of my closest friends there.
Learn more about SHM’s Leadership Academy at shmleadershipacademy.org.
Dr. Howell is a professor of medicine at Johns Hopkins University, Baltimore, and chief of the division of hospital medicine at Johns Hopkins Bayview Medical Center. He is also chief operating officer at the Society of Hospital Medicine and course director of the SHM Leadership Academy.
A Concise Tool for Measuring Care Coordination from the Provider’s Perspective in the Hospital Setting
Care Coordination has been defined as “…the deliberate organization of patient care activities between two or more participants (including the patient) involved in a patient’s care to facilitate the appropriate delivery of healthcare services.”1 The Institute of Medicine identified care coordination as a key strategy to improve the American healthcare system,2 and evidence has been building that well-coordinated care improves patient outcomes and reduces healthcare costs associated with chronic conditions.3-5 In 2012, Johns Hopkins Medicine was awarded a Healthcare Innovation Award by the Centers for Medicare & Medicaid Services to improve coordination of care across the continuum of care for adult patients admitted to Johns Hopkins Hospital (JHH) and Johns Hopkins Bayview Medical Center (JHBMC), and for high-risk low-income Medicare and Medicaid beneficiaries receiving ambulatory care in targeted zip codes. The purpose of this project, known as the Johns Hopkins Community Health Partnership (J-CHiP), was to improve health and healthcare and to reduce healthcare costs. The acute care component of the program consisted of a bundle of interventions focused on improving coordination of care for all patients, including a “bridge to home” discharge process, as they transitioned back to the community from inpatient admission. The bundle included the following: early screening for discharge planning to predict needed postdischarge services; discussion in daily multidisciplinary rounds about goals and priorities of the hospitalization and potential postdischarge needs; patient and family self-care management; education enhanced medication management, including the option of “medications in hand” at the time of discharge; postdischarge telephone follow-up by nurses; and, for patients identified as high-risk, a “transition guide” (a nurse who works with the patient via home visits and by phone to optimize compliance with care for 30 days postdischarge).6 While the primary endpoints of the J-CHiP program were to improve clinical outcomes and reduce healthcare costs, we were also interested in the impact of the program on care coordination processes in the acute care setting. This created the need for an instrument to measure healthcare professionals’ views of care coordination in their immediate work environments.
We began our search for existing measures by reviewing the Coordination Measures Atlas published in 2014.7 Although this report evaluates over 80 different measures of care coordination, most of them focus on the perspective of the patient and/or family members, on specific conditions, and on primary care or outpatient settings.7,8 We were unable to identify an existing measure from the provider perspective, designed for the inpatient setting, that was both brief but comprehensive enough to cover a range of care coordination domains.8
Consequently, our first aim was to develop a brief, comprehensive tool to measure care coordination from the perspective of hospital inpatient staff that could be used to compare different units or types of providers, or to conduct longitudinal assessment. The second aim was to conduct a preliminary evaluation of the tool in our healthcare setting, including to assess its psychometric properties, to describe provider perceptions of care coordination after the implementation of J-CHiP, and to explore potential differences among departments, types of professionals, and between the 2 hospitals.
METHODS
Development of the Care Coordination Questionnaire
The survey was developed in collaboration with leaders of the J-CHiP Acute Care Team. We met at the outset and on multiple subsequent occasions to align survey domains with the main components of the J-CHiP acute care intervention and to assure that the survey would be relevant and understandable to a variety of multidisciplinary professionals, including physicians, nurses, social workers, physical therapists, and other health professionals. Care was taken to avoid redundancy with existing evaluation efforts and to minimize respondent burden. This process helped to ensure the content validity of the items, the usefulness of the results, and the future usability of the tool.
We modeled the Care Coordination Questionnaire (CCQ) after the Safety Attitudes Questionnaire (SAQ),9 a widely used survey that is deployed approximately annually at JHH and JHBMC. While the SAQ focuses on healthcare provider attitudes about issues relevant to patient safety (often referred to as safety climate or safety culture), this new tool was designed to focus on healthcare professionals’ attitudes about care coordination. Similar to the way that the SAQ “elicits a snapshot of the safety climate through surveys of frontline worker perceptions,” we sought to elicit a picture of our care coordination climate through a survey of frontline hospital staff.
The CCQ was built upon the domains and approaches to care coordination described in the Agency for Healthcare Research and Quality Care Coordination Atlas.3 This report identifies 9 mechanisms for achieving care coordination, including the following: Establish Accountability or Negotiate Responsibility; Communicate; Facilitate Transitions; Assess Needs and Goals; Create a Proactive Plan of Care; Monitor, Follow Up, and Respond to Change; Support Self-Management Goals; Link to Community Resources; and Align Resources with Patient and Population Needs; as well as 5 broad approaches commonly used to improve the delivery of healthcare, including Teamwork Focused on Coordination, Healthcare Home, Care Management, Medication Management, and Health IT-Enabled Coordination.7 We generated at least 1 item to represent 8 of the 9 domains, as well as the broad approach described as Teamwork Focused on Coordination. After developing an initial set of items, we sought input from 3 senior leaders of the J-CHiP Acute Care Team to determine if the items covered the care coordination domains of interest, and to provide feedback on content validity. To test the interpretability of survey items and consistency across professional groups, we sent an initial version of the survey questions to at least 1 person from each of the following professional groups: hospitalist, social worker, case manager, clinical pharmacist, and nurse. We asked them to review all of our survey questions and to provide us with feedback on all aspects of the questions, such as whether they believed the questions were relevant and understandable to the members of their professional discipline, the appropriateness of the wording of the questions, and other comments. Modifications were made to the content and wording of the questions based on the feedback received. The final draft of the questionnaire was reviewed by the leadership team of the J-CHiP Acute Care Team to ensure its usefulness in providing actionable information.
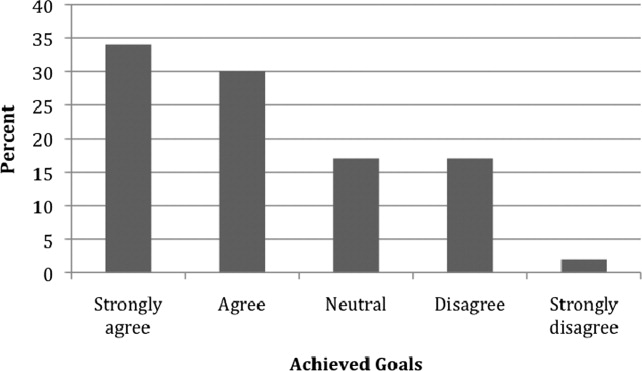
The resulting 12-item questionnaire used a 5-point Likert response scale ranging from 1 = “disagree strongly” to 5 = “agree strongly,” and an additional option of “not applicable (N/A).” To help assess construct validity, a global question was added at the end of the questionnaire asking, “Overall, how would you rate the care coordination at the hospital of your primary work setting?” The response was measured on a 10-point Likert-type scale ranging from 1 = “totally uncoordinated care” to 10 = “perfectly coordinated care” (see Appendix). In addition, the questionnaire requested information about the respondents’ gender, position, and their primary unit, department, and hospital affiliation.
Data Collection Procedures
An invitation to complete an anonymous questionnaire was sent to the following inpatient care professionals: all nursing staff working on care coordination units in the departments of medicine, surgery, and neurology/neurosurgery, as well as physicians, pharmacists, acute care therapists (eg, occupational and physical therapists), and other frontline staff. All healthcare staff fitting these criteria was sent an e-mail with a request to fill out the survey online using QualtricsTM (Qualtrics Labs Inc., Provo, UT), as well as multiple follow-up reminders. The participants worked either at the JHH (a 1194-bed tertiary academic medical center in Baltimore, MD) or the JHBMC (a 440-bed academic community hospital located nearby). Data were collected from October 2015 through January 2016.
Analysis
Means and standard deviations were calculated by treating the responses as continuous variables. We tried 3 different methods to handle missing data: (1) without imputation, (2) imputing the mean value of each item, and (3) substituting a neutral score. Because all 3 methods produced very similar results, we treated the N/A responses as missing values without imputation for simplicity of analysis. We used STATA 13.1 (Stata Corporation, College Station, Texas) to analyze the data.
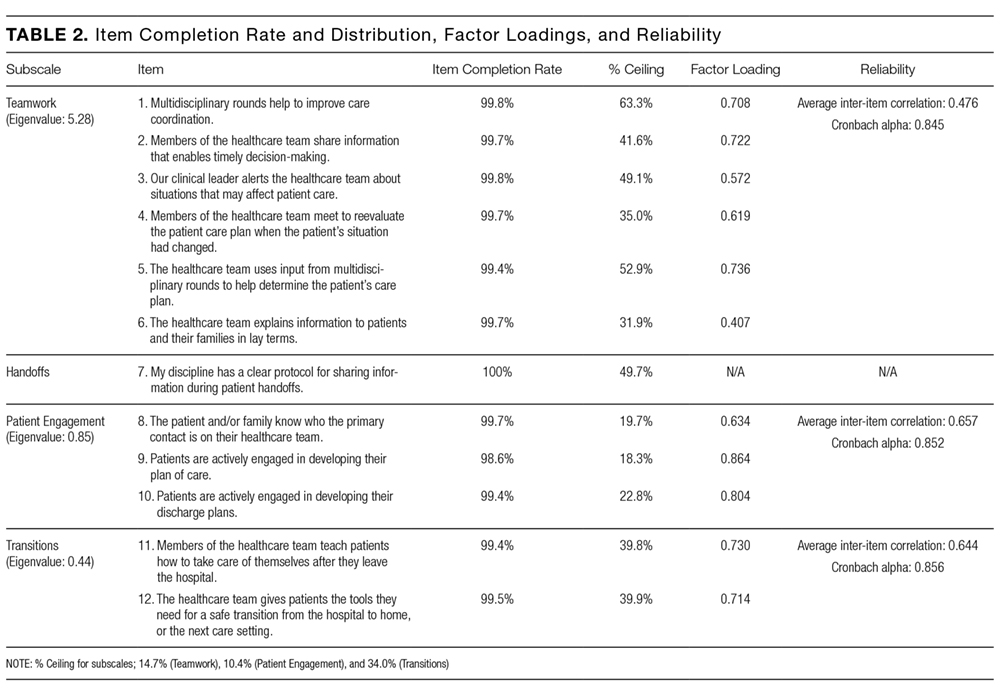
To identify subscales, we performed exploratory factor analysis on responses to the 12 specific items. Promax rotation was selected based on the simple structure. Subscale scores for each respondent were generated by computing the mean of responses to the items in the subscale. Internal consistency reliability of the subscales was estimated using Cronbach’s alpha. We calculated Pearson correlation coefficients for the items in each subscale, and examined Cronbach’s alpha deleting each item in turn. For each of the subscales identified and the global scale, we calculated the mean, standard deviation, median and interquartile range. Although distributions of scores tended to be non-normal, this was done to increase interpretability. We also calculated percent scoring at the ceiling (highest possible score).
We analyzed the data with 3 research questions in mind: Was there a difference in perceptions of care coordination between (1) staff affiliated with the 2 different hospitals, (2) staff affiliated with different clinical departments, or (3) staff with different professional roles? For comparisons based on hospital and department, and type of professional, nonparametric tests (Wilcoxon rank-sum and Kruskal-Wallis test) were used with a level of statistical significance set at 0.05. The comparison between hospitals and departments was made only among nurses to minimize the confounding effect of different distribution of professionals. We tested the distribution of “years in specialty” between hospitals and departments for this comparison using Pearson’s χ2 test. The difference was not statistically significant (P = 0.167 for hospitals, and P = 0.518 for departments), so we assumed that the potential confounding effect of this variable was negligible in this analysis. The comparison of scores within each professional group used the Friedman test. Pearson’s χ2 test was used to compare the baseline characteristics between 2 hospitals.
RESULTS
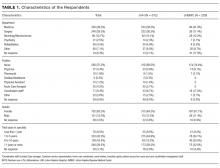
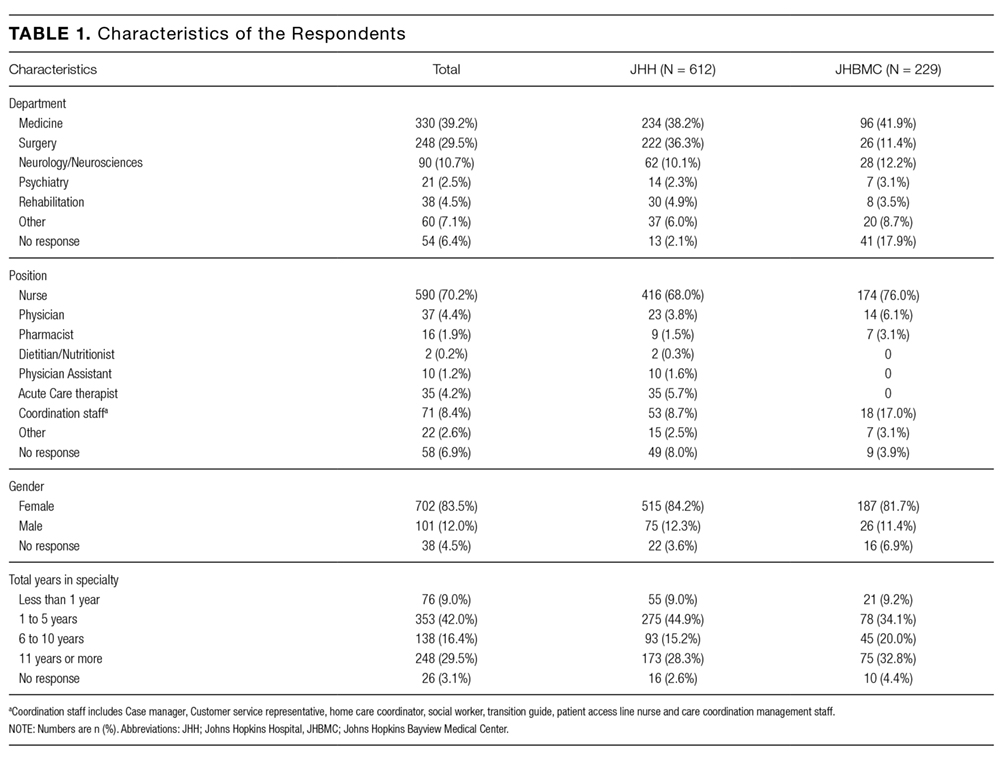
Among the 1486 acute care professionals asked to participate in the survey, 841 completed the questionnaire (response rate 56.6%). Table 1 shows the characteristics of the participants from each hospital. Table 2 summarizes the item response rates, proportion scoring at the ceiling, and weighting from the factor analysis. All items had completion rates of 99.2% or higher, with N/A responses ranging from 0% (item 2) to 3.1% (item 7). The percent scoring at the ceiling was 1.7% for the global item and ranged from 18.3% up to 63.3% for other individual items.
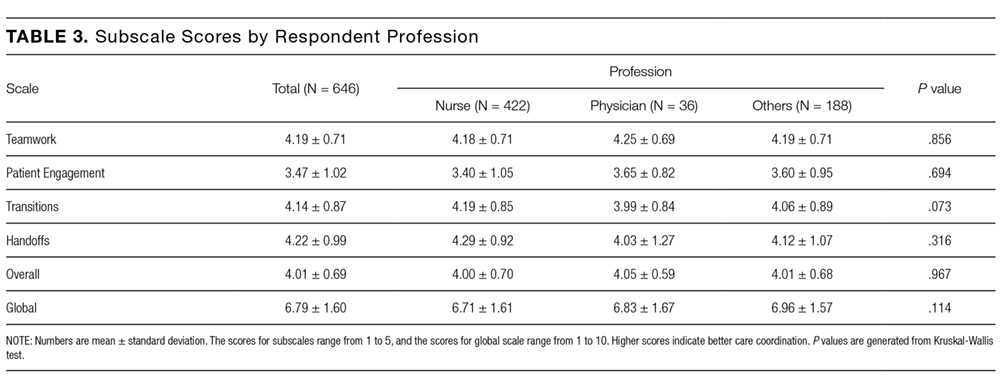

We also examined differences in perceptions of care coordination among nursing units to illustrate the tool’s ability to detect variation in Patient Engagement subscale scores for JHH nurses (see Appendix).
DISCUSSION
This study resulted in one of the first measurement tools to succinctly measure multiple aspects of care coordination in the hospital from the perspective of healthcare professionals. Given the hectic work environment of healthcare professionals, and the increasing emphasis on collecting data for evaluation and improvement, it is important to minimize respondent burden. This effort was catalyzed by a multifaceted initiative to redesign acute care delivery and promote seamless transitions of care, supported by the Center for Medicare & Medicaid Innovation. In initial testing, this questionnaire has evidence for reliability and validity. It was encouraging to find that the preliminary psychometric performance of the measure was very similar in 2 different settings of a tertiary academic hospital and a community hospital.
Our analysis of the survey data explored potential differences between the 2 hospitals, among different types of healthcare professionals and across different departments. Although we expected differences, we had no specific hypotheses about what those differences might be, and, in fact, did not observe any substantial differences. This could be taken to indicate that the intervention was uniformly and successfully implemented in both hospitals, and engaged various professionals in different departments. The ability to detect differences in care coordination at the nursing unit level could also prove to be beneficial for more precisely targeting where process improvement is needed. Further data collection and analyses should be conducted to more systematically compare units and to help identify those where practice is most advanced and those where improvements may be needed. It would also be informative to link differences in care coordination scores with patient outcomes. In addition, differences identified on specific domains between professional groups could be helpful to identify where greater efforts are needed to improve interdisciplinary practice. Sampling strategies stratified by provider type would need to be targeted to make this kind of analysis informative.
The consistently lower scores observed for patient engagement, from the perspective of care professionals in all groups, suggest that this is an area where improvement is needed. These findings are consistent with published reports on the common failure by hospitals to include patients as a member of their own care team. In addition to measuring care processes from the perspective of frontline healthcare workers, future evaluations within the healthcare system would also benefit from including data collected from the perspective of the patient and family.
This study had some limitations. First, there may be more than 4 domains of care coordination that are important and can be measured in the acute care setting from provider perspective. However, the addition of more domains should be balanced against practicality and respondent burden. It may be possible to further clarify priority domains in hospital settings as opposed to the primary care setting. Future research should be directed to find these areas and to develop a more comprehensive, yet still concise measurement instrument. Second, the tool was developed to measure the impact of a large-scale intervention, and to fit into the specific context of 2 hospitals. Therefore, it should be tested in different settings of hospital care to see how it performs. However, virtually all hospitals in the United States today are adapting to changes in both financing and healthcare delivery. A tool such as the one described in this paper could be helpful to many organizations. Third, the scoring system for the overall scale score is not weighted and therefore reflects teamwork more than other components of care coordination, which are represented by fewer items. In general, we believe that use of the subscale scores may be more informative. Alternative scoring systems might also be proposed, including item weighting based on factor scores.
For the purposes of evaluation in this specific instance, we only collected data at a single point in time, after the intervention had been deployed. Thus, we were not able to evaluate the effectiveness of the J-CHiP intervention. We also did not intend to focus too much on the differences between units, given the limited number of respondents from individual units. It would be useful to collect more data at future time points, both to test the responsiveness of the scales and to evaluate the impact of future interventions at both the hospital and unit level.
The preliminary data from this study have generated insights about gaps in current practice, such as in engaging patients in the inpatient care process. It has also increased awareness by hospital leaders about the need to achieve high reliability in the adoption of new procedures and interdisciplinary practice. This tool might be used to find areas in need of improvement, to evaluate the effect of initiatives to improve care coordination, to monitor the change over time in the perception of care coordination among healthcare professionals, and to develop better intervention strategies for coordination activities in acute care settings. Additional research is needed to provide further evidence for the reliability and validity of this measure in diverse settings.
Disclosure
The project described was supported by Grant Number 1C1CMS331053-01-00 from the US Department of Health and Human Services, Centers for Medicare & Medicaid Services. The contents of this publication are solely the responsibility of the authors and do not necessarily represent the official views of the US Department of Health and Human Services or any of its agencies. The research presented was conducted by the awardee. Results may or may not be consistent with or confirmed by the findings of the independent evaluation contractor.
The authors have no other disclosures.
1. McDonald KM, Sundaram V, Bravata DM, et al. Closing the Quality Gap: A Critical Analysis of Quality Improvement Strategies (Vol. 7: Care Coordination). Technical Reviews, No. 9.7. Rockville (MD): Agency for Healthcare Research and Quality (US); 2007. PubMed
2. Adams K, Corrigan J. Priority areas for national action: transforming health care quality. Washington, DC: National Academies Press; 2003. PubMed
3. Renders CM, Valk GD, Griffin S, Wagner EH, Eijk JT, Assendelft WJ. Interventions to improve the management of diabetes mellitus in primary care, outpatient and community settings. Cochrane Database Syst Rev. 2001(1):CD001481. PubMed
4. McAlister FA, Lawson FM, Teo KK, Armstrong PW. A systematic review of randomized trials of disease management programs in heart failure. Am J Med. 2001;110(5):378-384. PubMed
5. Bruce ML, Raue PJ, Reilly CF, et al. Clinical effectiveness of integrating depression care management into medicare home health: the Depression CAREPATH Randomized trial. JAMA Intern Med. 2015;175(1):55-64. PubMed
6. Berkowitz SA, Brown P, Brotman DJ, et al. Case Study: Johns Hopkins Community Health Partnership: A model for transformation. Healthc (Amst). 2016;4(4):264-270. PubMed
7. McDonald. KM, Schultz. E, Albin. L, et al. Care Coordination Measures Atlas Version 4. Rockville, MD: Agency for Healthcare Research and Quality; 2014.
8 Schultz EM, Pineda N, Lonhart J, Davies SM, McDonald KM. A systematic review of the care coordination measurement landscape. BMC Health Serv Res. 2013;13:119. PubMed
9. Sexton JB, Helmreich RL, Neilands TB, et al. The Safety Attitudes Questionnaire: psychometric properties, benchmarking data, and emerging research. BMC Health Serv Res. 2006;6:44. PubMed
Care Coordination has been defined as “…the deliberate organization of patient care activities between two or more participants (including the patient) involved in a patient’s care to facilitate the appropriate delivery of healthcare services.”1 The Institute of Medicine identified care coordination as a key strategy to improve the American healthcare system,2 and evidence has been building that well-coordinated care improves patient outcomes and reduces healthcare costs associated with chronic conditions.3-5 In 2012, Johns Hopkins Medicine was awarded a Healthcare Innovation Award by the Centers for Medicare & Medicaid Services to improve coordination of care across the continuum of care for adult patients admitted to Johns Hopkins Hospital (JHH) and Johns Hopkins Bayview Medical Center (JHBMC), and for high-risk low-income Medicare and Medicaid beneficiaries receiving ambulatory care in targeted zip codes. The purpose of this project, known as the Johns Hopkins Community Health Partnership (J-CHiP), was to improve health and healthcare and to reduce healthcare costs. The acute care component of the program consisted of a bundle of interventions focused on improving coordination of care for all patients, including a “bridge to home” discharge process, as they transitioned back to the community from inpatient admission. The bundle included the following: early screening for discharge planning to predict needed postdischarge services; discussion in daily multidisciplinary rounds about goals and priorities of the hospitalization and potential postdischarge needs; patient and family self-care management; education enhanced medication management, including the option of “medications in hand” at the time of discharge; postdischarge telephone follow-up by nurses; and, for patients identified as high-risk, a “transition guide” (a nurse who works with the patient via home visits and by phone to optimize compliance with care for 30 days postdischarge).6 While the primary endpoints of the J-CHiP program were to improve clinical outcomes and reduce healthcare costs, we were also interested in the impact of the program on care coordination processes in the acute care setting. This created the need for an instrument to measure healthcare professionals’ views of care coordination in their immediate work environments.
We began our search for existing measures by reviewing the Coordination Measures Atlas published in 2014.7 Although this report evaluates over 80 different measures of care coordination, most of them focus on the perspective of the patient and/or family members, on specific conditions, and on primary care or outpatient settings.7,8 We were unable to identify an existing measure from the provider perspective, designed for the inpatient setting, that was both brief but comprehensive enough to cover a range of care coordination domains.8
Consequently, our first aim was to develop a brief, comprehensive tool to measure care coordination from the perspective of hospital inpatient staff that could be used to compare different units or types of providers, or to conduct longitudinal assessment. The second aim was to conduct a preliminary evaluation of the tool in our healthcare setting, including to assess its psychometric properties, to describe provider perceptions of care coordination after the implementation of J-CHiP, and to explore potential differences among departments, types of professionals, and between the 2 hospitals.
METHODS
Development of the Care Coordination Questionnaire
The survey was developed in collaboration with leaders of the J-CHiP Acute Care Team. We met at the outset and on multiple subsequent occasions to align survey domains with the main components of the J-CHiP acute care intervention and to assure that the survey would be relevant and understandable to a variety of multidisciplinary professionals, including physicians, nurses, social workers, physical therapists, and other health professionals. Care was taken to avoid redundancy with existing evaluation efforts and to minimize respondent burden. This process helped to ensure the content validity of the items, the usefulness of the results, and the future usability of the tool.
We modeled the Care Coordination Questionnaire (CCQ) after the Safety Attitudes Questionnaire (SAQ),9 a widely used survey that is deployed approximately annually at JHH and JHBMC. While the SAQ focuses on healthcare provider attitudes about issues relevant to patient safety (often referred to as safety climate or safety culture), this new tool was designed to focus on healthcare professionals’ attitudes about care coordination. Similar to the way that the SAQ “elicits a snapshot of the safety climate through surveys of frontline worker perceptions,” we sought to elicit a picture of our care coordination climate through a survey of frontline hospital staff.
The CCQ was built upon the domains and approaches to care coordination described in the Agency for Healthcare Research and Quality Care Coordination Atlas.3 This report identifies 9 mechanisms for achieving care coordination, including the following: Establish Accountability or Negotiate Responsibility; Communicate; Facilitate Transitions; Assess Needs and Goals; Create a Proactive Plan of Care; Monitor, Follow Up, and Respond to Change; Support Self-Management Goals; Link to Community Resources; and Align Resources with Patient and Population Needs; as well as 5 broad approaches commonly used to improve the delivery of healthcare, including Teamwork Focused on Coordination, Healthcare Home, Care Management, Medication Management, and Health IT-Enabled Coordination.7 We generated at least 1 item to represent 8 of the 9 domains, as well as the broad approach described as Teamwork Focused on Coordination. After developing an initial set of items, we sought input from 3 senior leaders of the J-CHiP Acute Care Team to determine if the items covered the care coordination domains of interest, and to provide feedback on content validity. To test the interpretability of survey items and consistency across professional groups, we sent an initial version of the survey questions to at least 1 person from each of the following professional groups: hospitalist, social worker, case manager, clinical pharmacist, and nurse. We asked them to review all of our survey questions and to provide us with feedback on all aspects of the questions, such as whether they believed the questions were relevant and understandable to the members of their professional discipline, the appropriateness of the wording of the questions, and other comments. Modifications were made to the content and wording of the questions based on the feedback received. The final draft of the questionnaire was reviewed by the leadership team of the J-CHiP Acute Care Team to ensure its usefulness in providing actionable information.
The resulting 12-item questionnaire used a 5-point Likert response scale ranging from 1 = “disagree strongly” to 5 = “agree strongly,” and an additional option of “not applicable (N/A).” To help assess construct validity, a global question was added at the end of the questionnaire asking, “Overall, how would you rate the care coordination at the hospital of your primary work setting?” The response was measured on a 10-point Likert-type scale ranging from 1 = “totally uncoordinated care” to 10 = “perfectly coordinated care” (see Appendix). In addition, the questionnaire requested information about the respondents’ gender, position, and their primary unit, department, and hospital affiliation.
Data Collection Procedures
An invitation to complete an anonymous questionnaire was sent to the following inpatient care professionals: all nursing staff working on care coordination units in the departments of medicine, surgery, and neurology/neurosurgery, as well as physicians, pharmacists, acute care therapists (eg, occupational and physical therapists), and other frontline staff. All healthcare staff fitting these criteria was sent an e-mail with a request to fill out the survey online using QualtricsTM (Qualtrics Labs Inc., Provo, UT), as well as multiple follow-up reminders. The participants worked either at the JHH (a 1194-bed tertiary academic medical center in Baltimore, MD) or the JHBMC (a 440-bed academic community hospital located nearby). Data were collected from October 2015 through January 2016.
Analysis
Means and standard deviations were calculated by treating the responses as continuous variables. We tried 3 different methods to handle missing data: (1) without imputation, (2) imputing the mean value of each item, and (3) substituting a neutral score. Because all 3 methods produced very similar results, we treated the N/A responses as missing values without imputation for simplicity of analysis. We used STATA 13.1 (Stata Corporation, College Station, Texas) to analyze the data.
To identify subscales, we performed exploratory factor analysis on responses to the 12 specific items. Promax rotation was selected based on the simple structure. Subscale scores for each respondent were generated by computing the mean of responses to the items in the subscale. Internal consistency reliability of the subscales was estimated using Cronbach’s alpha. We calculated Pearson correlation coefficients for the items in each subscale, and examined Cronbach’s alpha deleting each item in turn. For each of the subscales identified and the global scale, we calculated the mean, standard deviation, median and interquartile range. Although distributions of scores tended to be non-normal, this was done to increase interpretability. We also calculated percent scoring at the ceiling (highest possible score).
We analyzed the data with 3 research questions in mind: Was there a difference in perceptions of care coordination between (1) staff affiliated with the 2 different hospitals, (2) staff affiliated with different clinical departments, or (3) staff with different professional roles? For comparisons based on hospital and department, and type of professional, nonparametric tests (Wilcoxon rank-sum and Kruskal-Wallis test) were used with a level of statistical significance set at 0.05. The comparison between hospitals and departments was made only among nurses to minimize the confounding effect of different distribution of professionals. We tested the distribution of “years in specialty” between hospitals and departments for this comparison using Pearson’s χ2 test. The difference was not statistically significant (P = 0.167 for hospitals, and P = 0.518 for departments), so we assumed that the potential confounding effect of this variable was negligible in this analysis. The comparison of scores within each professional group used the Friedman test. Pearson’s χ2 test was used to compare the baseline characteristics between 2 hospitals.
RESULTS
Among the 1486 acute care professionals asked to participate in the survey, 841 completed the questionnaire (response rate 56.6%). Table 1 shows the characteristics of the participants from each hospital. Table 2 summarizes the item response rates, proportion scoring at the ceiling, and weighting from the factor analysis. All items had completion rates of 99.2% or higher, with N/A responses ranging from 0% (item 2) to 3.1% (item 7). The percent scoring at the ceiling was 1.7% for the global item and ranged from 18.3% up to 63.3% for other individual items.
We also examined differences in perceptions of care coordination among nursing units to illustrate the tool’s ability to detect variation in Patient Engagement subscale scores for JHH nurses (see Appendix).
DISCUSSION
This study resulted in one of the first measurement tools to succinctly measure multiple aspects of care coordination in the hospital from the perspective of healthcare professionals. Given the hectic work environment of healthcare professionals, and the increasing emphasis on collecting data for evaluation and improvement, it is important to minimize respondent burden. This effort was catalyzed by a multifaceted initiative to redesign acute care delivery and promote seamless transitions of care, supported by the Center for Medicare & Medicaid Innovation. In initial testing, this questionnaire has evidence for reliability and validity. It was encouraging to find that the preliminary psychometric performance of the measure was very similar in 2 different settings of a tertiary academic hospital and a community hospital.
Our analysis of the survey data explored potential differences between the 2 hospitals, among different types of healthcare professionals and across different departments. Although we expected differences, we had no specific hypotheses about what those differences might be, and, in fact, did not observe any substantial differences. This could be taken to indicate that the intervention was uniformly and successfully implemented in both hospitals, and engaged various professionals in different departments. The ability to detect differences in care coordination at the nursing unit level could also prove to be beneficial for more precisely targeting where process improvement is needed. Further data collection and analyses should be conducted to more systematically compare units and to help identify those where practice is most advanced and those where improvements may be needed. It would also be informative to link differences in care coordination scores with patient outcomes. In addition, differences identified on specific domains between professional groups could be helpful to identify where greater efforts are needed to improve interdisciplinary practice. Sampling strategies stratified by provider type would need to be targeted to make this kind of analysis informative.
The consistently lower scores observed for patient engagement, from the perspective of care professionals in all groups, suggest that this is an area where improvement is needed. These findings are consistent with published reports on the common failure by hospitals to include patients as a member of their own care team. In addition to measuring care processes from the perspective of frontline healthcare workers, future evaluations within the healthcare system would also benefit from including data collected from the perspective of the patient and family.
This study had some limitations. First, there may be more than 4 domains of care coordination that are important and can be measured in the acute care setting from provider perspective. However, the addition of more domains should be balanced against practicality and respondent burden. It may be possible to further clarify priority domains in hospital settings as opposed to the primary care setting. Future research should be directed to find these areas and to develop a more comprehensive, yet still concise measurement instrument. Second, the tool was developed to measure the impact of a large-scale intervention, and to fit into the specific context of 2 hospitals. Therefore, it should be tested in different settings of hospital care to see how it performs. However, virtually all hospitals in the United States today are adapting to changes in both financing and healthcare delivery. A tool such as the one described in this paper could be helpful to many organizations. Third, the scoring system for the overall scale score is not weighted and therefore reflects teamwork more than other components of care coordination, which are represented by fewer items. In general, we believe that use of the subscale scores may be more informative. Alternative scoring systems might also be proposed, including item weighting based on factor scores.
For the purposes of evaluation in this specific instance, we only collected data at a single point in time, after the intervention had been deployed. Thus, we were not able to evaluate the effectiveness of the J-CHiP intervention. We also did not intend to focus too much on the differences between units, given the limited number of respondents from individual units. It would be useful to collect more data at future time points, both to test the responsiveness of the scales and to evaluate the impact of future interventions at both the hospital and unit level.
The preliminary data from this study have generated insights about gaps in current practice, such as in engaging patients in the inpatient care process. It has also increased awareness by hospital leaders about the need to achieve high reliability in the adoption of new procedures and interdisciplinary practice. This tool might be used to find areas in need of improvement, to evaluate the effect of initiatives to improve care coordination, to monitor the change over time in the perception of care coordination among healthcare professionals, and to develop better intervention strategies for coordination activities in acute care settings. Additional research is needed to provide further evidence for the reliability and validity of this measure in diverse settings.
Disclosure
The project described was supported by Grant Number 1C1CMS331053-01-00 from the US Department of Health and Human Services, Centers for Medicare & Medicaid Services. The contents of this publication are solely the responsibility of the authors and do not necessarily represent the official views of the US Department of Health and Human Services or any of its agencies. The research presented was conducted by the awardee. Results may or may not be consistent with or confirmed by the findings of the independent evaluation contractor.
The authors have no other disclosures.
1. McDonald KM, Sundaram V, Bravata DM, et al. Closing the Quality Gap: A Critical Analysis of Quality Improvement Strategies (Vol. 7: Care Coordination). Technical Reviews, No. 9.7. Rockville (MD): Agency for Healthcare Research and Quality (US); 2007. PubMed
2. Adams K, Corrigan J. Priority areas for national action: transforming health care quality. Washington, DC: National Academies Press; 2003. PubMed
3. Renders CM, Valk GD, Griffin S, Wagner EH, Eijk JT, Assendelft WJ. Interventions to improve the management of diabetes mellitus in primary care, outpatient and community settings. Cochrane Database Syst Rev. 2001(1):CD001481. PubMed
4. McAlister FA, Lawson FM, Teo KK, Armstrong PW. A systematic review of randomized trials of disease management programs in heart failure. Am J Med. 2001;110(5):378-384. PubMed
5. Bruce ML, Raue PJ, Reilly CF, et al. Clinical effectiveness of integrating depression care management into medicare home health: the Depression CAREPATH Randomized trial. JAMA Intern Med. 2015;175(1):55-64. PubMed
6. Berkowitz SA, Brown P, Brotman DJ, et al. Case Study: Johns Hopkins Community Health Partnership: A model for transformation. Healthc (Amst). 2016;4(4):264-270. PubMed
7. McDonald. KM, Schultz. E, Albin. L, et al. Care Coordination Measures Atlas Version 4. Rockville, MD: Agency for Healthcare Research and Quality; 2014.
8 Schultz EM, Pineda N, Lonhart J, Davies SM, McDonald KM. A systematic review of the care coordination measurement landscape. BMC Health Serv Res. 2013;13:119. PubMed
9. Sexton JB, Helmreich RL, Neilands TB, et al. The Safety Attitudes Questionnaire: psychometric properties, benchmarking data, and emerging research. BMC Health Serv Res. 2006;6:44. PubMed
© 2017 Society of Hospital Medicine
Introducing the Hospitalist Morale Index
Explosive growth in hospital medicine has led to hospitalists having the option to change jobs easily. Annual turnover for all physicians is 6.8%, whereas that of hospitalists exceeds 14.8%.[1] Losing a single physician has significant financial and operational implications, with estimates of $20,000 to $120,000 in recruiting costs, and up to $500,000 in lost revenue that may take years to recoup due to the time required for new physician assimilation.[2, 3] In 2006, the Society of Hospital Medicine (SHM) appointed a career task force to develop retention recommendations, 1 of which includes monitoring hospitalists' job satisfaction.[4]
Studies examining physician satisfaction have demonstrated that high physician job satisfaction is associated with lower physician turnover.[5] However, surveys of hospitalists, including SHM's Hospital Medicine Physician Worklife Survey (HMPWS), have reported high job satisfaction among hospitalists,[6, 7, 8, 9, 10] suggesting that high job satisfaction may not be enough to overcome forces that pull hospitalists toward other opportunities.
Morale, a more complex construct related to an individual's contentment and happiness, might provide insight into reducing hospitalist turnover. Morale has been defined as the emotional or mental condition with respect to cheerfulness, confidence, or zeal and is especially relevant in the face of opposition or hardship.[11] Job satisfaction is 1 element that contributes to morale, but alone does not equate morale.[12] Morale, more than satisfaction, relates to how people see themselves within the group and may be closely tied to the concept of esprit de corps. To illustrate, workers may feel satisfied with the content of their job, but frustration with the organization may result in low morale.[13] Efforts focused on assessing provider morale may provide deeper understanding of hospitalists' professional needs and garner insight for retention strategies.
The construct of hospitalist morale and its underlying drivers has not been explored in the literature. Using literature within and outside of healthcare,[1, 12, 14, 15, 16, 17, 18, 19, 20, 21, 22] and our own prior work,[23] we sought to characterize elements that contribute to hospitalist morale and develop a metric to measure it. The HMPWS found that job satisfaction factors vary across hospitalist groups.[9] We suspected that the same would hold true for factors important to morale at the individual level. This study describes the development and validation of the Hospitalist Morale Index (HMI), and explores the relationship between morale and intent to leave due to unhappiness.
METHODS
2009 Pilot Survey
To establish content validity, after reviewing employee morale literature, and examining qualitative comments from our 2007 and 2008 morale surveys, our expert panel, consisting of practicing hospitalists, hospitalist leaders, and administrative staff, identified 46 potential drivers of hospitalist morale. In May 2009, all hospitalists, including physicians, nurse practitioners (NPs), and physician assistants (PAs) from a single hospitalist group received invitations to complete the pilot survey. We asked hospitalists to assess on 5‐point Likert scales the importance of (not at all to tremendously) and contentment with (extremely discontent to extremely content) each of the 46 items as it relates to their work morale. Also included were demographic questions and general morale questions (including rating participants' own morale), investment, long‐term career plans, and intent to leave due to unhappiness.
Data Collection
To maintain anonymity and limit social desirability bias, a database manager, working outside the Division of Hospital Medicine and otherwise not associated with the research team, used Survey Monkey to coordinate survey distribution and data collection. Each respondent had a unique identifier code that was unrelated to the respondent's name and email address. Personal identifiers were maintained in a secure database accessible only to the database manager.
Establishing Internal Structure Validity Evidence
Response frequency to each question was examined for irregularities in distribution. For continuous variables, descriptive statistics were examined for evidence of skewness, outliers, and non‐normality to ensure appropriate use of parametric statistical tests. Upon ranking importance ratings by mode, 15 of 46 items were judged to be of low importance by almost all participants and removed from further consideration.
Stata 13.1 (StataCorp, College Station, TX) was used for exploratory factor analysis (EFA) of the importance responses for all 31 remaining items by principal components factoring. Eigenvalues >1 were designated as a cutoff point for inclusion in varimax rotation. Factor loading of 0.50 was the threshold for inclusion in a factor.
The 31 items loaded across 10 factors; however, 3 factors included 1 item each. After reviewing the scree plot and considering their face value, these items/factors were omitted. Repeating the factor analysis resulted in a 28‐item, 7‐factor solution that accounted for 75% variance. All items were considered informative as demonstrated by low uniqueness scores (0.050.38). Using standard validation procedures, all 7 factors were found to have acceptable factor loadings (0.460.98) and face validity. Cronbach's quantified internal reliability of the 7 factors with scores ranging from 0.68 to 0.92. We named the resultant solution the Hospitalist Morale Index (HMI).
Establishing Response Process Validity Evidence
In developing the HMI, we asked respondents to rate the importance of and their contentment with each variable as related to their work morale. From pilot testing, which included discussions with respondents immediately after completing the survey, we learned that the 2‐part consideration of each variable resulted in thoughtful reflection about their morale. Further, by multiplying the contentment score for each item (scaled from 15) by the corresponding importance score (scaled 01), we quantified the relative contribution and contentment of each item for each hospitalist. Scaling importance scores from 0 to 1 insured that items that were not considered important to the respondent did not affect the respondent's personal morale score. Averaging resultant item scores that were greater than 0 resulted in a personal morale score for each hospitalist. Averaging item scores >0 that constituted each factor resulted in factor scores.
May 2011 Survey
The refined survey was distributed in May 2011 to a convenience sample of 5 hospitalist programs at separate hospitals (3 community hospitals, 2 academic hospitals) encompassing 108 hospitalists in 3 different states. Responses to the 2011 survey were used to complete confirmatory factor analyses (CFA) and establish further validity and reliability evidence.
Based on the 28‐item, 7‐factor solution developed from the pilot study, we developed the theoretical model of factors constituting hospitalist morale. We used the structural equation modeling command in Stata 13 to perform CFA. Factor loading of 0.50 was the threshold for inclusion of an item in a factor. To measure internal consistency, we considered Cronbach's score of 0.60 acceptable. Iterative models were reviewed to find the optimal solution for the data. Four items did not fit into any of the 5 resulting factors and were evaluated in terms of mean importance score and face value. Three items were considered important enough to warrant being stand‐alone items, whereas 1 was omitted. Two additional items had borderline factor loadings (0.48, 0.49) and were included in the model as stand‐alone items due to their overall relevance. The resultant solution was a 5‐factor model with 5 additional stand‐alone items (Table 1).
| Factor | Cronbach's | |||||
|---|---|---|---|---|---|---|
| Clinical | Workload | Leadership | Appreciation and Acknowledgement | Material Rewards | ||
| How much does the following item contribute to your morale? | ||||||
| Paperwork | 0.72 | 0.89 | ||||
| Relationship with patients | 0.69 | 0.90 | ||||
| Electronic medical system | 0.60 | 0.90 | ||||
| Intellectual stimulation | 0.59 | 0.90 | ||||
| Variety of cases | 0.58 | 0.90 | ||||
| Relationship with consultants | 0.51 | 0.89 | ||||
| No. of night shifts | 0.74 | 0.89 | ||||
| Patient census | 0.61 | 0.90 | ||||
| No. of shifts | 0.52 | 0.90 | ||||
| Fairness of leadership | 0.82 | 0.89 | ||||
| Effectiveness of leadership | 0.82 | 0.89 | ||||
| Leadership's receptiveness to my thoughts and suggestions | 0.78 | 0.89 | ||||
| Leadership as advocate for my needs | 0.77 | 0.89 | ||||
| Approachability of leadership | 0.77 | 0.89 | ||||
| Accessibility of leadership | 0.69 | 0.89 | ||||
| Alignment of the group's goals with my goals | 0.50 | 0.89 | ||||
| Recognition within the group | 0.82 | 0.89 | ||||
| Feeling valued within the institution | 0.73 | 0.89 | ||||
| Feeling valued within the group | 0.73 | 0.89 | ||||
| Feedback | 0.52 | 0.89 | ||||
| Pay | 0.99 | 0.90 | ||||
| Benefits | 0.56 | 0.89 | ||||
| Cronbach's | 0.78 | 0.65 | 0.89 | 0.78 | 0.71 | |
| How much does the following item contribute to your morale? | Single item indicators | |||||
| Family time | 0.90 | |||||
| Job security | 0.90 | |||||
| Institutional climate | 0.89 | |||||
| Opportunities for professional growth | 0.90 | |||||
| Autonomy | 0.89 | |||||
| Cronbach's | 0.90 | |||||
Establishing Convergent, Concurrent, and Discriminant Validity Evidence
To establish convergent, concurrent, and discriminant validity, linear and logistic regression models were examined for continuous and categorical data accordingly.
Self‐perceived overall work morale and perceived group morale, as assessed by 6‐point Likert questions with response options from terrible to excellent, were modeled as predictors for personal morale as calculated by the HMI.
Personal morale scores were modeled as predictors of professional growth, stress, investment in the group, and intent to leave due to unhappiness. While completing the HMI, hospitalists simultaneously completed a validated professional growth scale[24] and Cohen stress scale.[25] We hypothesized that those with higher morale would have more professional growth. Stress, although an important issue in the workplace, is a distinct construct from morale, and we did not expect a significant relationship between personal morale and stress. We used Pearson's r to assess the strength of association between the HMI and these scales. Participants' level of investment in their group was assessed on a 5‐point Likert scale. To simplify presentation, highly invested represents those claiming to be very or tremendously invested in the success of their current hospitalist group. Intent to leave due to unhappiness was assessed on a 5‐point Likert scale, I have had serious thoughts about leaving my current hospitalist group because I am unhappy, with responses from strongly disagree (1) to strongly agree (5). To simplify presentation, responses higher than 2 are considered to be consistent with intending to leave due to unhappiness.
Our institutional review board approved the study.
RESULTS
Respondents
In May 2009, 30 of the 33 (91%) invited hospitalists completed the original pilot morale survey; 19 (63%) were women. Eleven hospitalists (37%) had been part of the group 1 year or less, whereas 4 (13%) had been with the group for more than 5 years.
In May 2011, 93 of the 108 (86%) hospitalists from 5 hospitals completed the demographic and global parts of the survey. Fifty (53%) were from community hospitals; 47 (51%) were women. Thirty‐seven (40%) physicians and 6 (60%) NPs/PAs were from academic hospitals. Thirty‐nine hospitalists (42%) had been with their current group 1 year or less. Ten hospitalists (11%) had been with their current group over 5 years. Sixty‐three respondents (68%) considered themselves career hospitalists, whereas 5 (5%) did not; the rest were undecided.
Internal Structure Validity Evidence
The final CFA from the 2011 survey resulted in a 5‐factor plus 5stand‐alone‐items HMI. The solution with item‐level and factor‐level Cronbach's scores (range, 0.890.90 and range, 0.650.89, respectively) are shown in Table 1.
Personal Morale Scores and Factor Scores
Personal morale scores were normally distributed (mean = 2.79; standard deviation [SD] = 0.58), ranging from 1.23 to 4.22, with a theoretical low of 0 and high of 5 (Figure 1). Mean personal morale scores across hospitalist groups ranged from 2.70 to 2.99 (P > 0.05). Personal morale scores, factor sores and item scores for NPs and PAs did not significantly differ from those of physicians (P > 0.05 for all analyses). Personal morale scores were lower for those in their first 3 years with their current group, compared to those with greater institutional longevity. For every categorical increase in a participant's response to seeing oneself as a career hospitalist, the personal morale score rose 0.23 points (P < 0.001).
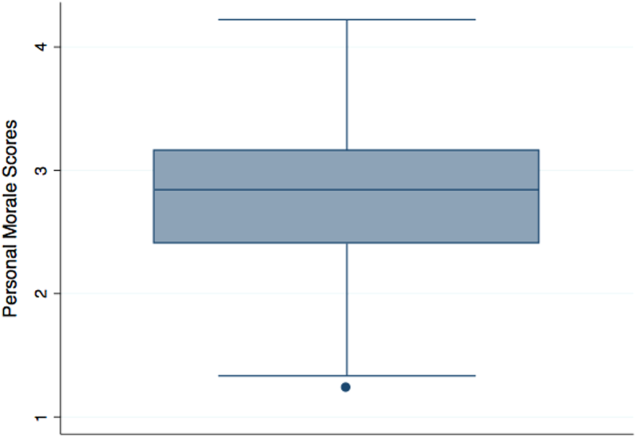
Factor scores for material reward and mean item scores for professional growth were significantly different across the 5 hospitalist groups (P = 0.03 and P < 0.001, respectively). Community hospitalists had significantly higher factor scores, despite having similar importance scores, for material rewards than academic hospitalists (diff. = 0.44, P = 0.02). Academic hospitalists had significantly higher scores for professional growth (diff. = 0.94, P < 0.001) (Table 2). Professional growth had the highest importance score for academic hospitalists (mean = 0.87, SD = 0.18) and the lowest importance score for community hospitalists (mean = 0.65, SD = 0.24, P < 0.001).
| Personal Morale Score | Factor 1 | Factor 2 | Factor 3 | Factor 4 | Factor 5 | Item 1 | Item 2 | Item 3 | Item 4 | Item 5 | ||
|---|---|---|---|---|---|---|---|---|---|---|---|---|
| Clinical | Workload | Leadership | Appreciation and Acknowledgement | Material Rewards | Family Time | Institutional Climate | Job Security | Autonomy | Professional Growth | |||
| ||||||||||||
| All participants | Mean | 2.79 | 2.54 | 2.78 | 3.18 | 2.58 | 2.48 | 3.05 | 2.67 | 2.92 | 3.00 | 2.76 |
| SD | 0.58 | 0.63 | 0.70 | 0.95 | 0.86 | 0.85 | 1.15 | 0.97 | 1.11 | 1.10 | 1.21 | |
| Academic A | Mean | 2.77 | 2.43 | 2.92 | 3.10 | 2.54 | 2.28 | 3.16 | 2.70 | 3.06 | 3.20 | 3.08 |
| SD | 0.57 | 0.62 | 0.64 | 0.92 | 0.84 | 0.77 | 1.19 | 0.95 | 1.08 | 1.12 | 1.24 | |
| Academic B | Mean | 2.99 | 2.58 | 2.99 | 3.88 | 2.69 | 2.00 | 2.58 | 2.13 | 1.65 | 3.29 | 4.33 |
| SD | 0.36 | 0.70 | 0.80 | 0.29 | 0.80 | 0.35 | 0.92 | 0.88 | 0.78 | 1.01 | 0.82 | |
| Community A | Mean | 2.86 | 2.61 | 2.51 | 3.23 | 2.73 | 3.03 | 2.88 | 2.84 | 2.95 | 3.23 | 2.66 |
| SD | 0.75 | 0.79 | 0.68 | 1.21 | 1.11 | 1.14 | 1.37 | 1.17 | 0.98 | 1.24 | 1.15 | |
| Community B | Mean | 2.86 | 2.74 | 2.97 | 3.37 | 2.67 | 2.44 | 3.28 | 2.35 | 2.70 | 2.50 | 2.25 |
| SD | 0.67 | 0.55 | 0.86 | 1.04 | 0.94 | 0.87 | 1.00 | 1.15 | 1.40 | 0.72 | 1.26 | |
| Community C | Mean | 2.70 | 2.56 | 2.64 | 2.99 | 2.47 | 2.53 | 3.03 | 2.79 | 3.07 | 2.68 | 2.15 |
| SD | 0.49 | 0.53 | 0.67 | 0.85 | 0.73 | 0.64 | 1.08 | 0.76 | 1.05 | 1.07 | 0.71 | |
| Academic combined | Mean | 2.80 | 2.45 | 2.93 | 3.22 | 2.56 | 2.24 | 3.07 | 2.62 | 2.88 | 3.21 | 3.28 |
| SD | 0.54 | 0.63 | 0.66 | 0.89 | 0.82 | 0.72 | 1.16 | 0.95 | 1.14 | 1.10 | 1.26 | |
| Community combined | Mean | 2.79 | 2.61 | 2.66 | 3.14 | 2.60 | 2.68 | 3.03 | 2.72 | 2.95 | 2.82 | 2.34 |
| SD | 0.62 | 0.62 | 0.72 | 1.01 | 0.90 | 0.90 | 1.15 | 0.99 | 1.09 | 1.09 | 1.00 | |
| P value | >0.05 | >0.05 | >0.05 | >0.05 | >0.05 | 0.02 | >0.05 | >0.05 | >0.05 | >0.05 | <0.001 | |
Convergent, Concurrent, and Discriminant Validity Evidence
For every categorical increase on the question assessing overall morale, the personal morale score was 0.23 points higher (P < 0.001). For every categorical increase in a participant's perception of the group's morale, the personal morale score was 0.29 points higher (P < 0.001).
For every 1‐point increase in personal morale score, the odds of being highly invested in the group increased by 5 times (odds ratio [OR]: 5.23, 95% confidence interval [CI]: 1.91‐14.35, P = 0.001). The mean personal morale score for highly invested hospitalists was 2.92, whereas that of those less invested was 2.43 (diff. = 0.49, P < 0.001) (Table 3). Highly invested hospitalists had significantly higher importance factor scores for leadership (diff. = 0.08, P = 0.03) as well as appreciation and acknowledgement (diff. = 0.08, P = 0.02).
| Personal Morale Score | Factor 1 | Factor 2 | Factor 3 | Factor 4 | Factor 5 | Item 1 | Item 2 | Item 3 | Item 4 | Item 5 | |
|---|---|---|---|---|---|---|---|---|---|---|---|
| Clinical | Workload | Leadership | Appreciation and Acknowledgement | Material Rewards | Family Time | Institutional Climate | Job Security | Autonomy | Professional Growth | ||
| |||||||||||
| Highly invested in success of current hospitalist group | |||||||||||
| Mean | 2.92 | 2.61 | 2.89 | 3.38 | 2.78 | 2.45 | 3.21 | 2.78 | 2.86 | 3.10 | 2.95 |
| SD | 0.55 | 0.59 | 0.68 | 0.92 | 0.88 | 0.77 | 1.11 | 1.00 | 1.09 | 1.06 | 1.25 |
| Less invested in success of current hospitalist group | |||||||||||
| Mean | 2.43 | 2.34 | 2.48 | 2.60 | 2.02 | 2.57 | 2.60 | 2.38 | 3.08 | 2.69 | 2.24 |
| SD | 0.52 | 0.69 | 0.69 | 0.81 | 0.49 | 1.04 | 1.17 | 0.83 | 1.18 | 1.19 | 0.94 |
| P value | <0.001 | >0.05 | 0.02 | 0.001 | <0.001 | >0.05 | 0.03 | >0.05 | >0.05 | >0.05 | 0.02 |
| Not intending to leave because unhappy | |||||||||||
| Mean | 2.97 | 2.67 | 2.89 | 3.48 | 2.77 | 2.52 | 3.24 | 2.85 | 3.05 | 3.06 | 3.01 |
| SD | 0.51 | 0.54 | 0.61 | 0.91 | 0.89 | 0.78 | 1.03 | 0.99 | 1.10 | 1.07 | 1.25 |
| Intending to leave current group because unhappy | |||||||||||
| Mean | 2.45 | 2.30 | 2.59 | 2.59 | 2.21 | 2.40 | 2.68 | 2.33 | 2.67 | 2.88 | 2.28 |
| SD | 0.56 | 0.72 | 0.82 | 0.74 | 0.68 | 0.97 | 1.29 | 0.83 | 1.11 | 1.17 | 0.97 |
| P value | <0.001 | 0.01 | >0.05 | <0.001 | 0.003 | >0.05 | 0.03 | 0.01 | >0.05 | >0.05 | 0.01 |
Every 1‐point increase in personal morale was associated with a rise of 2.27 on the professional growth scale (P = 0.01). The correlation between these 2 scales was 0.26 (P = 0.01). Every 1‐point increase in personal morale was associated with a 2.21 point decrease on the Cohen stress scale (P > 0.05). The correlation between these 2 scales was 0.21 (P > 0.05).
Morale and Intent to Leave Due to Unhappiness
Sixteen (37%) academic and 18 (36%) community hospitalists reported having thoughts of leaving their current hospitalist program due to unhappiness. The mean personal morale score for hospitalists with no intent to leave their current group was 2.97, whereas that of those with intent to leave was 2.45 (diff. = 0.53, P < 0.001). Each 1‐point increase in the personal morale score was associated with an 85% decrease (OR: 0.15, 95% CI: 0.05‐0.41, P < 0.001) in the odds of leaving because of unhappiness. Holding self‐perception of being a career hospitalist constant, each 1‐point increase in the personal morale score was associated with an 83% decrease (OR: 0.17, 95% CI: 0.05‐0.51, P = 0.002) in the odds of leaving because of unhappiness. Hospitalists who reported intent to leave had significantly lower factor scores for all factors and items except workload, material reward, and autonomy than those who did not report intent to leave (Table 3). Within the academic groups, those who reported intent to leave had significantly lower scores for professional growth (diff. = 1.08, P = 0.01). For community groups, those who reported intent to leave had significantly lower scores for clinical work (diff. = 0.54, P = 0.003), workload (diff. = 0.50, P = 0.02), leadership (diff. = 1.19, P < 0.001), feeling appreciated and acknowledged (diff. = 0.68, P = 0.01), job security (diff. = 0.70, P = 0.03), and institutional climate (diff. = 0.67, P = 0.02) than those who did not report intent to leave.
DISCUSSION
The HMI is a validated tool that objectively measures and quantifies hospitalist morale. The HMI's capacity to comprehensively assess morale comes from its breadth and depth in uncovering work‐related areas that may be sources of contentment or displeasure. Furthermore, the fact that HMI scores varied among groups of individuals, including those who are thinking about leaving their hospitalist group because they are unhappy and those who are highly invested in their hospitalist group, speaks to its ability to highlight and account for what is most important to hospitalist providers.
Low employee morale has been associated with decreased productivity, increased absenteeism, increased turnover, and decreased patient satisfaction.[2, 26, 27, 28] A few frustrated workers can breed group discontentment and lower the entire group's morale.[28] In addition to its financial impact, departures due to low morale can be sudden and devastating, leading to loss of team cohesiveness, increased work burden on the remaining workforce, burnout, and cascades of more turnover.[2] In contrast, when morale is high, workers more commonly go the extra mile, are more committed to the organization's mission, and are more supportive of their coworkers.[28]
While we asked the informants about plans to leave their job, there are many factors that drive an individual's intent and ultimate decision to make changes in his or her employment. Some factors are outside the control of the employer or practice leaders, such as change in an individual's family life or desire and opportunity to pursue fellowship training. Others variables, however, are more directly tied to the job or practice environment. In a specialty where providers are relatively mobile and turnover is high, it is important for hospitalist practices to cultivate a climate in which the sacrifices associated with leaving outweigh the promised benefits.[29]
Results from the HMPWS suggested the need to address climate and fairness issues in hospitalist programs to improve satisfaction and retention.[9] Two large healthcare systems achieved success by investing in multipronged physician retention strategies including recruiting advisors, sign‐on bonuses, extensive onboarding, family support, and the promotion of ongoing effective communication.[3, 30]
Our findings suggest that morale for hospitalists is a complex amalgam of contentment and importance, and that there may not be a one size fits all solution to improving morale for all. While we did not find a difference in personal morale scores across individual hospitalist groups, or even between academic and community groups, each group had a unique profile with variability in the dynamics between importance and contentment of different factors. If practice group leaders review HMI data for their providers and use the information to facilitate meaningful dialogue with them about the factors influencing their morale, such leaders will have great insight into allocating resources for the best return on investment.
While we believe that the HMI is providing unique perspective compared to other commonly used metrics, it may be best to employ HMI data as complementary measures alongside that of some of the benchmarked scales that explore job satisfaction, job fit, and burnout among hospitalists.[6, 9, 10, 31, 32, 33, 34, 35] Aggregate HMI data at the group level may allow for the identification of factors that are highly important to morale but scored low in contentment. Such factors deserve priority and attention such that the subgroups within a practice can collaborate to come to consensus on strategies for amelioration. Because the HMI generates a score and profile for each provider, we can imagine effective leaders using the HMI with individuals as part of an annual review to facilitate discussion about maximizing contentment at work. Being fully transparent and sharing an honest nonanonymous version of the HMI with a superior would require a special relationship founded on trust and mutual respect.
Several limitations of this study should be considered. First, the initial item reduction and EFA were based on a single‐site survey, and our overall sample size was relatively small. We plan on expanding our sample size in the future for further validation of our exploratory findings. Second, the data were collected at 2 specific times several years ago. In continuing to analyze the data from subsequent years, validity and reliability results remain stable, thereby minimizing the likelihood of significant historical bias. Third, there may have been some recall bias, in that respondents may have overlooked the good and perseverated over variables that disappointed them. Fourth, although intention to leave does not necessarily equate actual employee turnover, intention has been found to be a strong predictor of quitting a job.[36, 37] Finally, while we had high response rates, response bias may have existed wherein those with lower morale may have elected not to complete the survey or became apathetic in their responses.
The HMI is a validated instrument that evaluates hospitalist morale by incorporating each provider's characterization of the importance of and contentment with 27 variables. By accounting for the multidimensional and dynamic nature of morale, the HMI may help program leaders tailor retention and engagement strategies specific to their own group. Future studies may explore trends in contributors to morale and examine whether interventions to augment low morale can result in improved morale and hospitalist retention.
Acknowledgements
The authors are indebted to the hospitalists who were willing to share their perspectives about their work, and grateful to Ms. Lisa Roberts, Ms. Barbara Brigade, and Ms. Regina Landis for insuring confidentiality in managing the survey database.
Disclosures: Dr. Chandra had full access to all of the data in the study and takes responsibility for the integrity of the data and the accuracy of the data analysis. Dr. Wright is a Miller‐Coulson Family Scholar through the Johns Hopkins Center for Innovative Medicine. Ethical approval has been granted for studies involving human subjects by a Johns Hopkins University School of Medicine institutional review board. The authors report no conflicts of interest.
- 2014 State of Hospital Medicine Report. Philadelphia, PA: Society of Hospital Medicine; 2014.
- , , . A review of physician turnover: rates, causes, and consequences. Am J Med Qual. 2004;19(2):56–66.
- . Physician retention plans help reduce costs and optimize revenues. Healthc Financ Manage. 1998;52(1):75–77.
- SHM Career Satisfaction Task Force. A Challenge for a New Specialty: A White Paper on Hospitalist Career Satisfaction.; 2006. Available at: www.hospitalmedicine.org. Accessed February 28, 2009.
- , . Outcomes of physician job satisfaction: a narrative review, implications, and directions for future research. Health Care Manage Rev. 2003;28(2):119–139.
- , , , , . Characteristics and work experiences of hospitalists in the United States. Arch Intern Med. 2001;161(6):851–858.
- . Doing the same and earning less: male and female physicians in a new medical specialty. Inquiry. 2004;41(3):301–315.
- . Physician satisfaction and communication. National findings and best practices. Available at: http://www.pressganey.com/files/clark_cox_acpe_apr06.pdf. Accessed October 10, 2010.
- , , , , . Worklife and satisfaction of hospitalists: toward flourishing careers. J Gen Intern Med. 2012;27(1):28–36.
- , , , , ; Society of Hospital Medicine Career Satisfaction Task Force. Job characteristics, satisfaction, and burnout across hospitalist practice models. J Hosp Med. 2012;7(5):402–410.
- Morale | Define Morale at Dictionary.com. Morale | Define Morale at Dictionary.com. Morale | Define Morale at Dictionary.com. Available at: http://dictionary.reference.com/browse/morale. Accessed June 5, 2014.
- . Morale and satisfaction: a study in past‐future time perspective. Adm Sci Q. 1958:195–209.
- . Men and Women of the Corporation. 2nd ed. New York, NY: Basic Books; 1993.
- . The relation of morale to turnover among teachers. Am Educ Res J. 1965:163–173.
- . Structural and individual determinants of organization morale and satisfaction. Soc Forces. 1982;61:1088.
- , , . Morale matters: midlevel administrators and their intent to leave. J Higher Educ. 2000:34–59.
- . Factors influencing employee morale. Harv Bus Rev. 1950;28(1):61–73.
- . Dimensions of teacher morale. Am Educ Res J. 1970;7(2):221.
- , . The definition and measurement of employee morale. Adm Sci Q. 1958:157–184.
- , , , et al. Measuring physician job satisfaction in a changing workplace and a challenging environment. SGIM Career Satisfaction Study Group. Society of General Internal Medicine. Med Care. 1999;37(11):1174–1182.
- . Structural and individual determinants of organization morale and satisfaction. Soc Forces. 1983;61(4):1088–1108.
- . Morale and its measurement. Am J Sociol. 1941;47(3):406–414.
- , , , . Following morale over time within an academic hospitalist division. J Clin Outcomes Manag. 2011;18(1):21–26.
- , , , et al. Personal growth and its correlates during residency training. Med Educ. 2006;40(8):737–745.
- , , . A global measure of perceived stress. J Health Soc Behav. 1983:385–396.
- , , . Morale matters: midlevel administrators and their intent to leave. J Higher Educ. 2000;71(1):34–59.
- , . Faculty members' morale and their intention to leave: a multilevel explanation. J Higher Educ. 2002;73(4):518–542.
- , . Employee Morale. New York, NY: Palgrave Macmillan; 2009.
- , , , , . Silence Kills. Silence Kills: The Seven Crucial Conversations® for Healthcare. VitalSmarts™ in association with the American Association of Critical Care Nurses, USA. 2005. Accessed October 10, 2014.
- , , . The lifelong iterative process of physician retention. J Healthc Manag. 2009;54(4):220–226.
- . Physicians' burnout. Rev Prat. 2004;54(7):753–754.
- , , , , , . Work stress and health in primary health care physicians and hospital physicians. Occup Environ Med. 2008;65(5):364–366.
- , , , et al. Understanding physicians' intentions to withdraw from practice: the role of job satisfaction, job stress, mental and physical health. 2001. Health Care Manage Rev. 2010;35(2):105–115.
- , , , , , . Physician satisfaction and burnout at different career stages. Mayo Clin Proc. 2013;88(12):1358–1367.
- , . Burnout and Hospitalists: Etiology and Prevention. In: What Exactly Does A Hospitalist Do? Best of the Best Hospital Medicine 2005: Strategies for Success. Society of Hospital Medicine; 2005:5.
- , . Using job involvement and organizational commitment interactively to predict turnover. J Manage. 1989;15(1):115–127.
- , , , et al. Nurse turnover: a literature review. Int J Nurs Stud. 2006;43(2):237–263.
Explosive growth in hospital medicine has led to hospitalists having the option to change jobs easily. Annual turnover for all physicians is 6.8%, whereas that of hospitalists exceeds 14.8%.[1] Losing a single physician has significant financial and operational implications, with estimates of $20,000 to $120,000 in recruiting costs, and up to $500,000 in lost revenue that may take years to recoup due to the time required for new physician assimilation.[2, 3] In 2006, the Society of Hospital Medicine (SHM) appointed a career task force to develop retention recommendations, 1 of which includes monitoring hospitalists' job satisfaction.[4]
Studies examining physician satisfaction have demonstrated that high physician job satisfaction is associated with lower physician turnover.[5] However, surveys of hospitalists, including SHM's Hospital Medicine Physician Worklife Survey (HMPWS), have reported high job satisfaction among hospitalists,[6, 7, 8, 9, 10] suggesting that high job satisfaction may not be enough to overcome forces that pull hospitalists toward other opportunities.
Morale, a more complex construct related to an individual's contentment and happiness, might provide insight into reducing hospitalist turnover. Morale has been defined as the emotional or mental condition with respect to cheerfulness, confidence, or zeal and is especially relevant in the face of opposition or hardship.[11] Job satisfaction is 1 element that contributes to morale, but alone does not equate morale.[12] Morale, more than satisfaction, relates to how people see themselves within the group and may be closely tied to the concept of esprit de corps. To illustrate, workers may feel satisfied with the content of their job, but frustration with the organization may result in low morale.[13] Efforts focused on assessing provider morale may provide deeper understanding of hospitalists' professional needs and garner insight for retention strategies.
The construct of hospitalist morale and its underlying drivers has not been explored in the literature. Using literature within and outside of healthcare,[1, 12, 14, 15, 16, 17, 18, 19, 20, 21, 22] and our own prior work,[23] we sought to characterize elements that contribute to hospitalist morale and develop a metric to measure it. The HMPWS found that job satisfaction factors vary across hospitalist groups.[9] We suspected that the same would hold true for factors important to morale at the individual level. This study describes the development and validation of the Hospitalist Morale Index (HMI), and explores the relationship between morale and intent to leave due to unhappiness.
METHODS
2009 Pilot Survey
To establish content validity, after reviewing employee morale literature, and examining qualitative comments from our 2007 and 2008 morale surveys, our expert panel, consisting of practicing hospitalists, hospitalist leaders, and administrative staff, identified 46 potential drivers of hospitalist morale. In May 2009, all hospitalists, including physicians, nurse practitioners (NPs), and physician assistants (PAs) from a single hospitalist group received invitations to complete the pilot survey. We asked hospitalists to assess on 5‐point Likert scales the importance of (not at all to tremendously) and contentment with (extremely discontent to extremely content) each of the 46 items as it relates to their work morale. Also included were demographic questions and general morale questions (including rating participants' own morale), investment, long‐term career plans, and intent to leave due to unhappiness.
Data Collection
To maintain anonymity and limit social desirability bias, a database manager, working outside the Division of Hospital Medicine and otherwise not associated with the research team, used Survey Monkey to coordinate survey distribution and data collection. Each respondent had a unique identifier code that was unrelated to the respondent's name and email address. Personal identifiers were maintained in a secure database accessible only to the database manager.
Establishing Internal Structure Validity Evidence
Response frequency to each question was examined for irregularities in distribution. For continuous variables, descriptive statistics were examined for evidence of skewness, outliers, and non‐normality to ensure appropriate use of parametric statistical tests. Upon ranking importance ratings by mode, 15 of 46 items were judged to be of low importance by almost all participants and removed from further consideration.
Stata 13.1 (StataCorp, College Station, TX) was used for exploratory factor analysis (EFA) of the importance responses for all 31 remaining items by principal components factoring. Eigenvalues >1 were designated as a cutoff point for inclusion in varimax rotation. Factor loading of 0.50 was the threshold for inclusion in a factor.
The 31 items loaded across 10 factors; however, 3 factors included 1 item each. After reviewing the scree plot and considering their face value, these items/factors were omitted. Repeating the factor analysis resulted in a 28‐item, 7‐factor solution that accounted for 75% variance. All items were considered informative as demonstrated by low uniqueness scores (0.050.38). Using standard validation procedures, all 7 factors were found to have acceptable factor loadings (0.460.98) and face validity. Cronbach's quantified internal reliability of the 7 factors with scores ranging from 0.68 to 0.92. We named the resultant solution the Hospitalist Morale Index (HMI).
Establishing Response Process Validity Evidence
In developing the HMI, we asked respondents to rate the importance of and their contentment with each variable as related to their work morale. From pilot testing, which included discussions with respondents immediately after completing the survey, we learned that the 2‐part consideration of each variable resulted in thoughtful reflection about their morale. Further, by multiplying the contentment score for each item (scaled from 15) by the corresponding importance score (scaled 01), we quantified the relative contribution and contentment of each item for each hospitalist. Scaling importance scores from 0 to 1 insured that items that were not considered important to the respondent did not affect the respondent's personal morale score. Averaging resultant item scores that were greater than 0 resulted in a personal morale score for each hospitalist. Averaging item scores >0 that constituted each factor resulted in factor scores.
May 2011 Survey
The refined survey was distributed in May 2011 to a convenience sample of 5 hospitalist programs at separate hospitals (3 community hospitals, 2 academic hospitals) encompassing 108 hospitalists in 3 different states. Responses to the 2011 survey were used to complete confirmatory factor analyses (CFA) and establish further validity and reliability evidence.
Based on the 28‐item, 7‐factor solution developed from the pilot study, we developed the theoretical model of factors constituting hospitalist morale. We used the structural equation modeling command in Stata 13 to perform CFA. Factor loading of 0.50 was the threshold for inclusion of an item in a factor. To measure internal consistency, we considered Cronbach's score of 0.60 acceptable. Iterative models were reviewed to find the optimal solution for the data. Four items did not fit into any of the 5 resulting factors and were evaluated in terms of mean importance score and face value. Three items were considered important enough to warrant being stand‐alone items, whereas 1 was omitted. Two additional items had borderline factor loadings (0.48, 0.49) and were included in the model as stand‐alone items due to their overall relevance. The resultant solution was a 5‐factor model with 5 additional stand‐alone items (Table 1).
| Factor | Cronbach's | |||||
|---|---|---|---|---|---|---|
| Clinical | Workload | Leadership | Appreciation and Acknowledgement | Material Rewards | ||
| How much does the following item contribute to your morale? | ||||||
| Paperwork | 0.72 | 0.89 | ||||
| Relationship with patients | 0.69 | 0.90 | ||||
| Electronic medical system | 0.60 | 0.90 | ||||
| Intellectual stimulation | 0.59 | 0.90 | ||||
| Variety of cases | 0.58 | 0.90 | ||||
| Relationship with consultants | 0.51 | 0.89 | ||||
| No. of night shifts | 0.74 | 0.89 | ||||
| Patient census | 0.61 | 0.90 | ||||
| No. of shifts | 0.52 | 0.90 | ||||
| Fairness of leadership | 0.82 | 0.89 | ||||
| Effectiveness of leadership | 0.82 | 0.89 | ||||
| Leadership's receptiveness to my thoughts and suggestions | 0.78 | 0.89 | ||||
| Leadership as advocate for my needs | 0.77 | 0.89 | ||||
| Approachability of leadership | 0.77 | 0.89 | ||||
| Accessibility of leadership | 0.69 | 0.89 | ||||
| Alignment of the group's goals with my goals | 0.50 | 0.89 | ||||
| Recognition within the group | 0.82 | 0.89 | ||||
| Feeling valued within the institution | 0.73 | 0.89 | ||||
| Feeling valued within the group | 0.73 | 0.89 | ||||
| Feedback | 0.52 | 0.89 | ||||
| Pay | 0.99 | 0.90 | ||||
| Benefits | 0.56 | 0.89 | ||||
| Cronbach's | 0.78 | 0.65 | 0.89 | 0.78 | 0.71 | |
| How much does the following item contribute to your morale? | Single item indicators | |||||
| Family time | 0.90 | |||||
| Job security | 0.90 | |||||
| Institutional climate | 0.89 | |||||
| Opportunities for professional growth | 0.90 | |||||
| Autonomy | 0.89 | |||||
| Cronbach's | 0.90 | |||||
Establishing Convergent, Concurrent, and Discriminant Validity Evidence
To establish convergent, concurrent, and discriminant validity, linear and logistic regression models were examined for continuous and categorical data accordingly.
Self‐perceived overall work morale and perceived group morale, as assessed by 6‐point Likert questions with response options from terrible to excellent, were modeled as predictors for personal morale as calculated by the HMI.
Personal morale scores were modeled as predictors of professional growth, stress, investment in the group, and intent to leave due to unhappiness. While completing the HMI, hospitalists simultaneously completed a validated professional growth scale[24] and Cohen stress scale.[25] We hypothesized that those with higher morale would have more professional growth. Stress, although an important issue in the workplace, is a distinct construct from morale, and we did not expect a significant relationship between personal morale and stress. We used Pearson's r to assess the strength of association between the HMI and these scales. Participants' level of investment in their group was assessed on a 5‐point Likert scale. To simplify presentation, highly invested represents those claiming to be very or tremendously invested in the success of their current hospitalist group. Intent to leave due to unhappiness was assessed on a 5‐point Likert scale, I have had serious thoughts about leaving my current hospitalist group because I am unhappy, with responses from strongly disagree (1) to strongly agree (5). To simplify presentation, responses higher than 2 are considered to be consistent with intending to leave due to unhappiness.
Our institutional review board approved the study.
RESULTS
Respondents
In May 2009, 30 of the 33 (91%) invited hospitalists completed the original pilot morale survey; 19 (63%) were women. Eleven hospitalists (37%) had been part of the group 1 year or less, whereas 4 (13%) had been with the group for more than 5 years.
In May 2011, 93 of the 108 (86%) hospitalists from 5 hospitals completed the demographic and global parts of the survey. Fifty (53%) were from community hospitals; 47 (51%) were women. Thirty‐seven (40%) physicians and 6 (60%) NPs/PAs were from academic hospitals. Thirty‐nine hospitalists (42%) had been with their current group 1 year or less. Ten hospitalists (11%) had been with their current group over 5 years. Sixty‐three respondents (68%) considered themselves career hospitalists, whereas 5 (5%) did not; the rest were undecided.
Internal Structure Validity Evidence
The final CFA from the 2011 survey resulted in a 5‐factor plus 5stand‐alone‐items HMI. The solution with item‐level and factor‐level Cronbach's scores (range, 0.890.90 and range, 0.650.89, respectively) are shown in Table 1.
Personal Morale Scores and Factor Scores
Personal morale scores were normally distributed (mean = 2.79; standard deviation [SD] = 0.58), ranging from 1.23 to 4.22, with a theoretical low of 0 and high of 5 (Figure 1). Mean personal morale scores across hospitalist groups ranged from 2.70 to 2.99 (P > 0.05). Personal morale scores, factor sores and item scores for NPs and PAs did not significantly differ from those of physicians (P > 0.05 for all analyses). Personal morale scores were lower for those in their first 3 years with their current group, compared to those with greater institutional longevity. For every categorical increase in a participant's response to seeing oneself as a career hospitalist, the personal morale score rose 0.23 points (P < 0.001).
Factor scores for material reward and mean item scores for professional growth were significantly different across the 5 hospitalist groups (P = 0.03 and P < 0.001, respectively). Community hospitalists had significantly higher factor scores, despite having similar importance scores, for material rewards than academic hospitalists (diff. = 0.44, P = 0.02). Academic hospitalists had significantly higher scores for professional growth (diff. = 0.94, P < 0.001) (Table 2). Professional growth had the highest importance score for academic hospitalists (mean = 0.87, SD = 0.18) and the lowest importance score for community hospitalists (mean = 0.65, SD = 0.24, P < 0.001).
| Personal Morale Score | Factor 1 | Factor 2 | Factor 3 | Factor 4 | Factor 5 | Item 1 | Item 2 | Item 3 | Item 4 | Item 5 | ||
|---|---|---|---|---|---|---|---|---|---|---|---|---|
| Clinical | Workload | Leadership | Appreciation and Acknowledgement | Material Rewards | Family Time | Institutional Climate | Job Security | Autonomy | Professional Growth | |||
| ||||||||||||
| All participants | Mean | 2.79 | 2.54 | 2.78 | 3.18 | 2.58 | 2.48 | 3.05 | 2.67 | 2.92 | 3.00 | 2.76 |
| SD | 0.58 | 0.63 | 0.70 | 0.95 | 0.86 | 0.85 | 1.15 | 0.97 | 1.11 | 1.10 | 1.21 | |
| Academic A | Mean | 2.77 | 2.43 | 2.92 | 3.10 | 2.54 | 2.28 | 3.16 | 2.70 | 3.06 | 3.20 | 3.08 |
| SD | 0.57 | 0.62 | 0.64 | 0.92 | 0.84 | 0.77 | 1.19 | 0.95 | 1.08 | 1.12 | 1.24 | |
| Academic B | Mean | 2.99 | 2.58 | 2.99 | 3.88 | 2.69 | 2.00 | 2.58 | 2.13 | 1.65 | 3.29 | 4.33 |
| SD | 0.36 | 0.70 | 0.80 | 0.29 | 0.80 | 0.35 | 0.92 | 0.88 | 0.78 | 1.01 | 0.82 | |
| Community A | Mean | 2.86 | 2.61 | 2.51 | 3.23 | 2.73 | 3.03 | 2.88 | 2.84 | 2.95 | 3.23 | 2.66 |
| SD | 0.75 | 0.79 | 0.68 | 1.21 | 1.11 | 1.14 | 1.37 | 1.17 | 0.98 | 1.24 | 1.15 | |
| Community B | Mean | 2.86 | 2.74 | 2.97 | 3.37 | 2.67 | 2.44 | 3.28 | 2.35 | 2.70 | 2.50 | 2.25 |
| SD | 0.67 | 0.55 | 0.86 | 1.04 | 0.94 | 0.87 | 1.00 | 1.15 | 1.40 | 0.72 | 1.26 | |
| Community C | Mean | 2.70 | 2.56 | 2.64 | 2.99 | 2.47 | 2.53 | 3.03 | 2.79 | 3.07 | 2.68 | 2.15 |
| SD | 0.49 | 0.53 | 0.67 | 0.85 | 0.73 | 0.64 | 1.08 | 0.76 | 1.05 | 1.07 | 0.71 | |
| Academic combined | Mean | 2.80 | 2.45 | 2.93 | 3.22 | 2.56 | 2.24 | 3.07 | 2.62 | 2.88 | 3.21 | 3.28 |
| SD | 0.54 | 0.63 | 0.66 | 0.89 | 0.82 | 0.72 | 1.16 | 0.95 | 1.14 | 1.10 | 1.26 | |
| Community combined | Mean | 2.79 | 2.61 | 2.66 | 3.14 | 2.60 | 2.68 | 3.03 | 2.72 | 2.95 | 2.82 | 2.34 |
| SD | 0.62 | 0.62 | 0.72 | 1.01 | 0.90 | 0.90 | 1.15 | 0.99 | 1.09 | 1.09 | 1.00 | |
| P value | >0.05 | >0.05 | >0.05 | >0.05 | >0.05 | 0.02 | >0.05 | >0.05 | >0.05 | >0.05 | <0.001 | |
Convergent, Concurrent, and Discriminant Validity Evidence
For every categorical increase on the question assessing overall morale, the personal morale score was 0.23 points higher (P < 0.001). For every categorical increase in a participant's perception of the group's morale, the personal morale score was 0.29 points higher (P < 0.001).
For every 1‐point increase in personal morale score, the odds of being highly invested in the group increased by 5 times (odds ratio [OR]: 5.23, 95% confidence interval [CI]: 1.91‐14.35, P = 0.001). The mean personal morale score for highly invested hospitalists was 2.92, whereas that of those less invested was 2.43 (diff. = 0.49, P < 0.001) (Table 3). Highly invested hospitalists had significantly higher importance factor scores for leadership (diff. = 0.08, P = 0.03) as well as appreciation and acknowledgement (diff. = 0.08, P = 0.02).
| Personal Morale Score | Factor 1 | Factor 2 | Factor 3 | Factor 4 | Factor 5 | Item 1 | Item 2 | Item 3 | Item 4 | Item 5 | |
|---|---|---|---|---|---|---|---|---|---|---|---|
| Clinical | Workload | Leadership | Appreciation and Acknowledgement | Material Rewards | Family Time | Institutional Climate | Job Security | Autonomy | Professional Growth | ||
| |||||||||||
| Highly invested in success of current hospitalist group | |||||||||||
| Mean | 2.92 | 2.61 | 2.89 | 3.38 | 2.78 | 2.45 | 3.21 | 2.78 | 2.86 | 3.10 | 2.95 |
| SD | 0.55 | 0.59 | 0.68 | 0.92 | 0.88 | 0.77 | 1.11 | 1.00 | 1.09 | 1.06 | 1.25 |
| Less invested in success of current hospitalist group | |||||||||||
| Mean | 2.43 | 2.34 | 2.48 | 2.60 | 2.02 | 2.57 | 2.60 | 2.38 | 3.08 | 2.69 | 2.24 |
| SD | 0.52 | 0.69 | 0.69 | 0.81 | 0.49 | 1.04 | 1.17 | 0.83 | 1.18 | 1.19 | 0.94 |
| P value | <0.001 | >0.05 | 0.02 | 0.001 | <0.001 | >0.05 | 0.03 | >0.05 | >0.05 | >0.05 | 0.02 |
| Not intending to leave because unhappy | |||||||||||
| Mean | 2.97 | 2.67 | 2.89 | 3.48 | 2.77 | 2.52 | 3.24 | 2.85 | 3.05 | 3.06 | 3.01 |
| SD | 0.51 | 0.54 | 0.61 | 0.91 | 0.89 | 0.78 | 1.03 | 0.99 | 1.10 | 1.07 | 1.25 |
| Intending to leave current group because unhappy | |||||||||||
| Mean | 2.45 | 2.30 | 2.59 | 2.59 | 2.21 | 2.40 | 2.68 | 2.33 | 2.67 | 2.88 | 2.28 |
| SD | 0.56 | 0.72 | 0.82 | 0.74 | 0.68 | 0.97 | 1.29 | 0.83 | 1.11 | 1.17 | 0.97 |
| P value | <0.001 | 0.01 | >0.05 | <0.001 | 0.003 | >0.05 | 0.03 | 0.01 | >0.05 | >0.05 | 0.01 |
Every 1‐point increase in personal morale was associated with a rise of 2.27 on the professional growth scale (P = 0.01). The correlation between these 2 scales was 0.26 (P = 0.01). Every 1‐point increase in personal morale was associated with a 2.21 point decrease on the Cohen stress scale (P > 0.05). The correlation between these 2 scales was 0.21 (P > 0.05).
Morale and Intent to Leave Due to Unhappiness
Sixteen (37%) academic and 18 (36%) community hospitalists reported having thoughts of leaving their current hospitalist program due to unhappiness. The mean personal morale score for hospitalists with no intent to leave their current group was 2.97, whereas that of those with intent to leave was 2.45 (diff. = 0.53, P < 0.001). Each 1‐point increase in the personal morale score was associated with an 85% decrease (OR: 0.15, 95% CI: 0.05‐0.41, P < 0.001) in the odds of leaving because of unhappiness. Holding self‐perception of being a career hospitalist constant, each 1‐point increase in the personal morale score was associated with an 83% decrease (OR: 0.17, 95% CI: 0.05‐0.51, P = 0.002) in the odds of leaving because of unhappiness. Hospitalists who reported intent to leave had significantly lower factor scores for all factors and items except workload, material reward, and autonomy than those who did not report intent to leave (Table 3). Within the academic groups, those who reported intent to leave had significantly lower scores for professional growth (diff. = 1.08, P = 0.01). For community groups, those who reported intent to leave had significantly lower scores for clinical work (diff. = 0.54, P = 0.003), workload (diff. = 0.50, P = 0.02), leadership (diff. = 1.19, P < 0.001), feeling appreciated and acknowledged (diff. = 0.68, P = 0.01), job security (diff. = 0.70, P = 0.03), and institutional climate (diff. = 0.67, P = 0.02) than those who did not report intent to leave.
DISCUSSION
The HMI is a validated tool that objectively measures and quantifies hospitalist morale. The HMI's capacity to comprehensively assess morale comes from its breadth and depth in uncovering work‐related areas that may be sources of contentment or displeasure. Furthermore, the fact that HMI scores varied among groups of individuals, including those who are thinking about leaving their hospitalist group because they are unhappy and those who are highly invested in their hospitalist group, speaks to its ability to highlight and account for what is most important to hospitalist providers.
Low employee morale has been associated with decreased productivity, increased absenteeism, increased turnover, and decreased patient satisfaction.[2, 26, 27, 28] A few frustrated workers can breed group discontentment and lower the entire group's morale.[28] In addition to its financial impact, departures due to low morale can be sudden and devastating, leading to loss of team cohesiveness, increased work burden on the remaining workforce, burnout, and cascades of more turnover.[2] In contrast, when morale is high, workers more commonly go the extra mile, are more committed to the organization's mission, and are more supportive of their coworkers.[28]
While we asked the informants about plans to leave their job, there are many factors that drive an individual's intent and ultimate decision to make changes in his or her employment. Some factors are outside the control of the employer or practice leaders, such as change in an individual's family life or desire and opportunity to pursue fellowship training. Others variables, however, are more directly tied to the job or practice environment. In a specialty where providers are relatively mobile and turnover is high, it is important for hospitalist practices to cultivate a climate in which the sacrifices associated with leaving outweigh the promised benefits.[29]
Results from the HMPWS suggested the need to address climate and fairness issues in hospitalist programs to improve satisfaction and retention.[9] Two large healthcare systems achieved success by investing in multipronged physician retention strategies including recruiting advisors, sign‐on bonuses, extensive onboarding, family support, and the promotion of ongoing effective communication.[3, 30]
Our findings suggest that morale for hospitalists is a complex amalgam of contentment and importance, and that there may not be a one size fits all solution to improving morale for all. While we did not find a difference in personal morale scores across individual hospitalist groups, or even between academic and community groups, each group had a unique profile with variability in the dynamics between importance and contentment of different factors. If practice group leaders review HMI data for their providers and use the information to facilitate meaningful dialogue with them about the factors influencing their morale, such leaders will have great insight into allocating resources for the best return on investment.
While we believe that the HMI is providing unique perspective compared to other commonly used metrics, it may be best to employ HMI data as complementary measures alongside that of some of the benchmarked scales that explore job satisfaction, job fit, and burnout among hospitalists.[6, 9, 10, 31, 32, 33, 34, 35] Aggregate HMI data at the group level may allow for the identification of factors that are highly important to morale but scored low in contentment. Such factors deserve priority and attention such that the subgroups within a practice can collaborate to come to consensus on strategies for amelioration. Because the HMI generates a score and profile for each provider, we can imagine effective leaders using the HMI with individuals as part of an annual review to facilitate discussion about maximizing contentment at work. Being fully transparent and sharing an honest nonanonymous version of the HMI with a superior would require a special relationship founded on trust and mutual respect.
Several limitations of this study should be considered. First, the initial item reduction and EFA were based on a single‐site survey, and our overall sample size was relatively small. We plan on expanding our sample size in the future for further validation of our exploratory findings. Second, the data were collected at 2 specific times several years ago. In continuing to analyze the data from subsequent years, validity and reliability results remain stable, thereby minimizing the likelihood of significant historical bias. Third, there may have been some recall bias, in that respondents may have overlooked the good and perseverated over variables that disappointed them. Fourth, although intention to leave does not necessarily equate actual employee turnover, intention has been found to be a strong predictor of quitting a job.[36, 37] Finally, while we had high response rates, response bias may have existed wherein those with lower morale may have elected not to complete the survey or became apathetic in their responses.
The HMI is a validated instrument that evaluates hospitalist morale by incorporating each provider's characterization of the importance of and contentment with 27 variables. By accounting for the multidimensional and dynamic nature of morale, the HMI may help program leaders tailor retention and engagement strategies specific to their own group. Future studies may explore trends in contributors to morale and examine whether interventions to augment low morale can result in improved morale and hospitalist retention.
Acknowledgements
The authors are indebted to the hospitalists who were willing to share their perspectives about their work, and grateful to Ms. Lisa Roberts, Ms. Barbara Brigade, and Ms. Regina Landis for insuring confidentiality in managing the survey database.
Disclosures: Dr. Chandra had full access to all of the data in the study and takes responsibility for the integrity of the data and the accuracy of the data analysis. Dr. Wright is a Miller‐Coulson Family Scholar through the Johns Hopkins Center for Innovative Medicine. Ethical approval has been granted for studies involving human subjects by a Johns Hopkins University School of Medicine institutional review board. The authors report no conflicts of interest.
- 2014 State of Hospital Medicine Report. Philadelphia, PA: Society of Hospital Medicine; 2014.
- , , . A review of physician turnover: rates, causes, and consequences. Am J Med Qual. 2004;19(2):56–66.
- . Physician retention plans help reduce costs and optimize revenues. Healthc Financ Manage. 1998;52(1):75–77.
- SHM Career Satisfaction Task Force. A Challenge for a New Specialty: A White Paper on Hospitalist Career Satisfaction.; 2006. Available at: www.hospitalmedicine.org. Accessed February 28, 2009.
- , . Outcomes of physician job satisfaction: a narrative review, implications, and directions for future research. Health Care Manage Rev. 2003;28(2):119–139.
- , , , , . Characteristics and work experiences of hospitalists in the United States. Arch Intern Med. 2001;161(6):851–858.
- . Doing the same and earning less: male and female physicians in a new medical specialty. Inquiry. 2004;41(3):301–315.
- . Physician satisfaction and communication. National findings and best practices. Available at: http://www.pressganey.com/files/clark_cox_acpe_apr06.pdf. Accessed October 10, 2010.
- , , , , . Worklife and satisfaction of hospitalists: toward flourishing careers. J Gen Intern Med. 2012;27(1):28–36.
- , , , , ; Society of Hospital Medicine Career Satisfaction Task Force. Job characteristics, satisfaction, and burnout across hospitalist practice models. J Hosp Med. 2012;7(5):402–410.
- Morale | Define Morale at Dictionary.com. Morale | Define Morale at Dictionary.com. Morale | Define Morale at Dictionary.com. Available at: http://dictionary.reference.com/browse/morale. Accessed June 5, 2014.
- . Morale and satisfaction: a study in past‐future time perspective. Adm Sci Q. 1958:195–209.
- . Men and Women of the Corporation. 2nd ed. New York, NY: Basic Books; 1993.
- . The relation of morale to turnover among teachers. Am Educ Res J. 1965:163–173.
- . Structural and individual determinants of organization morale and satisfaction. Soc Forces. 1982;61:1088.
- , , . Morale matters: midlevel administrators and their intent to leave. J Higher Educ. 2000:34–59.
- . Factors influencing employee morale. Harv Bus Rev. 1950;28(1):61–73.
- . Dimensions of teacher morale. Am Educ Res J. 1970;7(2):221.
- , . The definition and measurement of employee morale. Adm Sci Q. 1958:157–184.
- , , , et al. Measuring physician job satisfaction in a changing workplace and a challenging environment. SGIM Career Satisfaction Study Group. Society of General Internal Medicine. Med Care. 1999;37(11):1174–1182.
- . Structural and individual determinants of organization morale and satisfaction. Soc Forces. 1983;61(4):1088–1108.
- . Morale and its measurement. Am J Sociol. 1941;47(3):406–414.
- , , , . Following morale over time within an academic hospitalist division. J Clin Outcomes Manag. 2011;18(1):21–26.
- , , , et al. Personal growth and its correlates during residency training. Med Educ. 2006;40(8):737–745.
- , , . A global measure of perceived stress. J Health Soc Behav. 1983:385–396.
- , , . Morale matters: midlevel administrators and their intent to leave. J Higher Educ. 2000;71(1):34–59.
- , . Faculty members' morale and their intention to leave: a multilevel explanation. J Higher Educ. 2002;73(4):518–542.
- , . Employee Morale. New York, NY: Palgrave Macmillan; 2009.
- , , , , . Silence Kills. Silence Kills: The Seven Crucial Conversations® for Healthcare. VitalSmarts™ in association with the American Association of Critical Care Nurses, USA. 2005. Accessed October 10, 2014.
- , , . The lifelong iterative process of physician retention. J Healthc Manag. 2009;54(4):220–226.
- . Physicians' burnout. Rev Prat. 2004;54(7):753–754.
- , , , , , . Work stress and health in primary health care physicians and hospital physicians. Occup Environ Med. 2008;65(5):364–366.
- , , , et al. Understanding physicians' intentions to withdraw from practice: the role of job satisfaction, job stress, mental and physical health. 2001. Health Care Manage Rev. 2010;35(2):105–115.
- , , , , , . Physician satisfaction and burnout at different career stages. Mayo Clin Proc. 2013;88(12):1358–1367.
- , . Burnout and Hospitalists: Etiology and Prevention. In: What Exactly Does A Hospitalist Do? Best of the Best Hospital Medicine 2005: Strategies for Success. Society of Hospital Medicine; 2005:5.
- , . Using job involvement and organizational commitment interactively to predict turnover. J Manage. 1989;15(1):115–127.
- , , , et al. Nurse turnover: a literature review. Int J Nurs Stud. 2006;43(2):237–263.
© 2016 Society of Hospital Medicine

IVC Ultrasound Imaging Training
The use of hand‐carried ultrasound by nonspecialists is increasing. Of particular interest to hospitalists is bedside ultrasound assessment of the inferior vena cava (IVC), which more accurately estimates left atrial pressure than does assessment of jugular venous pressure by physical examination.[1] Invasively measured central venous pressure (CVP) also correlates closely with estimates from IVC imaging.[1, 2, 3, 4] Although quick, accurate bedside determination of CVP may have broad potential applications in hospital medicine,[5, 6, 7, 8] of particular interest to patients and their advocates is whether hospitalists are sufficiently skilled to perform this procedure. Lucas et al. found that 8 hospitalists trained to perform 6 cardiac assessments by hand‐carried ultrasound could identify an enlarged IVC with moderate accuracy (sensitivity 56%, specificity 86%).[9] To our knowledge, no other study has examined whether hospitalists can readily develop the skills to accurately assess the IVC by ultrasound. We therefore studied whether the skills needed to acquire and interpret IVC images by ultrasound could be acquired by hospitalists after a brief training program.
METHODS
Study Populations
Hospitalists and volunteer subjects both provided informed consent to participate in this study, which was approved by the Johns Hopkins University School of Medicine Institutional Review Board. Nonpregnant volunteer subjects at least 18 years of age who agreed to attend training sessions were solicited from the investigators' ambulatory clinic patient population (see Supporting Information, Appendix A, in the online version of this article) and were compensated for their time. Volunteer subjects were solicited to represent a range of cardiac pathology. Hospitalists were solicited from among 28 members of the Johns Hopkins Bayview Medical Center's Division of Hospital Medicine, a nationally renowned academic hospitalist program comprising tenure‐track faculty who dedicate at least 30% of their time to academic endeavors.
Image Acquisition and Interpretation
A pocket‐sized portable hand‐carried ultrasound device was used for all IVC images (Vscan; GE Healthcare, Milwaukee, WI). All IVC images were acquired using the conventional methods with a subcostal view while the patient is supine. Cine loops of the IVC with respiration were captured in the longitudinal axis. Diameters were obtained approximately and by convention, approximately 2 cm from the IVC and right atrial junction. The IVC minimum diameter was measured during a cine loop of a patient performing a nasal sniff. The IVC collapsibility was determined by the formula: IVC Collapsibility Index=(IVCmaxIVCmin/IVCmax), where IVCmax and IVCmin represent the maximum and minimum IVC diameters respectively.[2] The IVC maximum diameters and collapsibility measurements that were used to estimate CVP are shown in the Supporting Information, Appendix B, in the online version of this article.
Educational Intervention and Skills Performance Assessment
One to 2 days prior to the in‐person training session, hospitalists were provided a brief introductory online curriculum (see Supporting Information, Appendix B, in the online version of this article). Groups of 3 to 4 hospitalists then completed an in‐person training and testing session (7 hours total time), which consisted of a precourse survey, a didactic session, and up to 4 hours of practice time with 10 volunteer subjects supervised by an experienced board‐certified cardiologist (G.A.H.) and a research echocardiography technician (C.M.). The survey included details on medical training, years in practice, prior ultrasound experience, and confidence in obtaining and interpreting IVC images. Confidence was rated on a Likert scale from 1=strongly confident to 5=not confident (3=neutral).
Next, each hospitalist's skills were assessed on 5 volunteer subjects selected by the cardiologist to represent a range of IVC appearance and body mass index (BMI). After appropriately identifying the IVC, they were first asked to make a visual qualitative judgement whether the IVC collapsed more than 50% during rapid inspiration or a sniff maneuver. Then hospitalists measured IVC diameter in a longitudinal view and calculated IVC collapsibility. Performance was evaluated by an experienced cardiologist (G.A.H.), who directly observed each hospitalist acquire and interpret IVC images and judged them relative to his own hand‐carried ultrasound assessments on the same subjects performed just before the hospitalists' scans. For each volunteer imaged, hospitalists had to acquire a technically adequate image of the IVC and correctly measure the inspiratory and expiratory IVC diameters. Hospitalists then had to estimate CVP by interpreting IVC diameters and collapsibility in 10 previously acquired sets of IVC video and still images. First, the hospitalists performed visual IVC collapsibility assessments (IVC collapse more than 50%) of video clips showing IVC appearance at baseline and during a rapid inspiration or sniff, without any measurements provided. Then, using still images showing premeasured maximum and minimum IVC diameters, they estimated CVP based on calculating IVC collapsibility (see Supporting Information, Appendix B, in the online version of this article for correlation of CVP to IVC maximum diameter and collapsibility). At the end of initial training hospitalists were again surveyed on confidence and also rated level of agreement (Likert scale, 1=strongly agree to 5=strongly disagree) regarding their ability to adequately obtain and accurately interpret IVC images and measurements. The post‐training survey also reviewed the training curriculum and asked hospitalists to identify potential barriers to clinical use of IVC ultrasound.
Following initial training, hospitalists were provided with a hand‐carried ultrasound device and allowed to use the device for IVC imaging on their general medical inpatients; the hospitalists could access the research echocardiography technician (C.M.) for assistance if desired. The number of additional patients imaged and whether scans were assisted was recorded for the study. At least 6 weeks after initial training, the hospitalists' IVC image acquisition and interpretation skills were again assessed on 5 volunteer subjects. At the follow‐up assessment, 4 of the 5 volunteers were new volunteers compared to the hospitalists' initial skills testing.
Statistics
The mean and standard deviations were used to describe continuous variables and percentages to describe proportions, and survey responses were described using medians and the interquartile ranges (25th percentile, 75th percentile). Wilcoxon rank sum tests were used to measure the pre‐ and post‐training differences in the individual survey responses (Stata Statistical Software: Release 12; StataCorp, College Station, TX).
RESULTS
From among 18 hospitalist volunteers, the 10 board‐certified hospitalists who could attend 1 of the scheduled training sessions were enrolled and completed the study. Hospitalists' demographic information and performance are summarized in Table 1. Hospitalists completed the initial online curriculum in an average of 18.37 minutes. After the in‐person training session, 8 of 10 hospitalists acquired adequate IVC images on all 5 volunteer subjects. One hospitalist obtained adequate images in 4 of 5 patients. Another hospitalist only obtained adequate images in 3 of 5 patients; a hepatic vein and the abdominal aorta were erroneously measured instead of the IVC in 1 subject each. This hospitalist later performed supervised IVC imaging on 7 additional hospital inpatients and was the only hospitalist to request additional direct supervision by the research echocardiography technician. All hospitalists were able to accurately quantify the IVC collapsibility index and estimate the CVP from all 10 prerecorded cases showing still images and video clips of the IVC. Based on IVC images, 1 of the 5 volunteers used in testing each day had a very elevated CVP, and the other 4 had CVPs ranging from low to normal. The volunteer's average BMI was overweight at 27.4, with a range from 15.4 to 37.1.
| Hospitalist | Years in Practice | Previous Ultrasound Training (Hours)a | No. of Subjects Adequately Imaged and Correctly Interpreted After First Session (5 Maximum) | No. of Subjects Adequately Imaged and Correctly Interpreted at Follow‐up (5 Maximum) | After Study Completion Felt Training Was Adequate to Perform IVC Imagingb |
|---|---|---|---|---|---|
| |||||
| 1 | 5.5 | 10 | 5 | 5 | 4 |
| 2 | 0.8 | 0 | 5 | 5 | 5 |
| 3 | 1.8 | 4.5 | 3 | 4 | 2 |
| 4 | 1.8 | 0 | 5 | 5 | 5 |
| 5 | 10.5 | 6 | 5 | 5 | 5 |
| 6 | 1.7 | 1 | 5 | 5 | 5 |
| 7 | 0.6 | 0 | 5 | 5 | 5 |
| 8 | 2.6 | 0 | 4 | 5 | 4 |
| 9 | 1.7 | 0 | 5 | 5 | 5 |
| 10 | 5.5 | 10 | 5 | 5 | 5 |
At 7.40.7 weeks (range, 6.98.6 weeks) follow‐up, 9 of 10 hospitalists obtained adequate IVC images in all 5 volunteer subjects and interpreted them correctly for estimating CVP. The hospitalist who performed most poorly at the initial assessment acquired adequate images and interpreted them correctly in 4 of 5 patients at follow‐up. Overall, hospitalists' visual assessment of IVC collapsibility index agreed with the quantitative collapsibility index calculation in 180 of 198 (91%) of the interpretable encounters. By the time of the follow‐up assessment, hospitalists had performed IVC imaging on 3.93.0 additional hospital inpatients (range, 011 inpatients). Lack of time assigned to the clinical service was the main barrier limiting further IVC imaging during that interval. Hospitalists also identified time constraints and need for secure yet accessible device storage as other barriers.
None of the hospitalists had previous experience imaging the IVC, and prior to training they rated their average confidence to acquire an IVC image and interpret it by the hand‐carried ultrasound device at 3 (3, 4) and 3 (3, 4), respectively. After the initial training session, 9 of 10 hospitalists believed they had received adequate online and in‐person training and were confident in their ability to acquire and interpret IVC images. After all training sessions the hospitalists on average rated their confidence statistically significantly better for acquiring and interpreting IVC images at 2 (1, 2) (P=0.005) and 2 (1, 2) (P=0.004), respectively compared to baseline.
DISCUSSION
This study shows that after a relatively brief training intervention, hospitalists can develop and over a short term retain important skills in the acquisition and interpretation of IVC images to estimate CVP. Estimating CVP is key to the care of many patients, but cannot be done accurately by most physicians.[10] Although our study has a number of limitations, the ability to estimate CVP acquired after only a brief training intervention could have important effects on patient care. Given that a dilated IVC with reduced respiratory collapsibility was found to be a statistically significant predictor of 30‐day readmission for heart failure,11 key clinical outcomes to measure in future work include whether IVC ultrasound assessment can help guide diuresis, limit complications, and ultimately reduce rehospitalizations for heart failure, the most expensive diagnosis for Medicare.[12]
Because hand‐carried ultrasound is a point‐of‐care diagnostic tool, we also examined the ability of hospitalists to visually approximate the IVC collapsibility index. Hospitalists' qualitative performance (IVC collapsibility judged correctly 91% of the time without performing formal measurements) is consistent with studies involving emergency medicine physicians and suggests that CVP may be rapidly and accurately estimated in most instances.[13] There may be, however, value to formally measuring the IVC maximum diameter, because it may be inaccurately visually estimated due to changes in scale when the imaging depth is adjusted. Accurately measuring the IVC maximum diameter is important because a maximum diameter of more than 2.0 cm is evidence of an elevated right atrial pressure (82% sensitivity and 84% specificity for predicting right atrial pressure of 10 mm Hg or above) and an elevated pulmonary capillary wedge pressure (75% sensitivity and 83% specificity for pulmonary capillary wedge pressure of 15 mm Hg or more).[14]
Limitations
Our findings should be interpreted cautiously given the relatively small number of hospitalists and subjects used for hand‐carried ultrasound imaging. Although our direct observations of hospitalist performance in IVC imaging were based on objective measurements performed and interpreted accurately, we did not record the images, which would have allowed separate analyses of inter‐rater reliability measures. The majority of volunteer subjects were chronically ill, but they were nonetheless stable outpatients and may have been easier to position and image relative to acutely ill inpatients. Hospitalist self‐selected participation may introduce a bias favoring hospitalists interested in learning hand‐carried ultrasound skills; however, nearly half of the hospitalist group volunteered and enrollments in the study were based only on their availability for the previously scheduled study dates.
IMPLICATIONS FOR TRAINING
Our study, especially the assessment of the hospitalists' ability to retain their skills, adds to what is known about training hospitalists in hand‐carried ultrasound and may help inform deliberations among hospitalists as to whether to join other professional societies in defining specialty‐specific bedside ultrasound indications and training protocols.[9, 15] As individuals acquire new skills at variable rates, training cannot be defined by the number of procedures performed, but rather by the need to provide objective evidence of acquired procedural skills. Thus, going forward there is also a need to develop and validate tools for assessment of competence in IVC imaging skills.
Disclosures
This project was funded as an investigator‐sponsored research project by General Electric (GE) Medical Systems Ultrasound and Primary Care Diagnostics, LLC. The devices used in this training were supplied by GE. All authors had access to the data and contributed to the preparation of the manuscript. GE was not involved in the study design, analysis, or preparation of the manuscript. All authors received research support to perform this study from the funding source.
- , , , et al. A comparison by medicine residents of physical examination versus hand‐carried ultrasound for estimation of right atrial pressure. Am J Cardiol. 2007;99(11):1614–1616.
- , , . Noninvasive estimation of right atrial pressure from the inspiratory collapse of the inferior vena cava. Am J Cardiol. 1990;66:493–496.
- , , , et al. Reappraisal of the use of inferior vena cava for estimating right atrial pressure. J Am Soc Echocardiogr. 2007;20:857–861.
- , , , et al. Use of hand‐carried ultrasound, B‐type natriuretic peptide, and clinical assessment in identifying abnormal left ventricular filling pressures in patients referred for right heart catheterization. J Cardiac Fail. 2010;16:69–75.
- , , . Identification of congestive heart failure via respiratory variation of inferior vena cava diameter. Am J Emerg Med. 2009;27:71–75.
- , , , . Role of inferior vena cava diameter in assessment of volume status: a meta‐analysis. Am J Emerg Med. 2012;30(8):1414–1419.e1.
- , , , et al. Qualitative assessment of the inferior vena cava: useful tool for the evaluation of fluid status in critically ill patients. Am Surg. 2012;78(4):468–470.
- , , , et al. Inferior vena cava collapsibility to guide fluid removal in slow continuous ultrafiltration: a pilot study. Intensive Care Med 2010;36:692–696.
- , , , et al. Diagnostic accuracy of hospitalist‐performed hand‐carried ultrasound echocardiography after a brief training program. J Hosp Med. 2009;4(6):340–349.
- , , . Can the clinical examination diagnose left‐sided heart failure in adults? JAMA. 1997;277:1712–1719.
- , , , et al. Comparison of hand‐carried ultrasound assessment of the inferior vena cava and N‐terminal pro‐brain natriuretic peptide for predicting readmission after hospitalization for acute decompensated heart failure. JACC Cardiovasc Imaging. 2008;1:595–601.
- , , . Rehospitalizations among patients in the Medicare Fee‐for‐Service Program. N Engl J Med. 2009;360:1418–1428.
- , , , et al. The interrater reliability of inferior vena cava ultrasound by bedside clinician sonographers in emergency department patients. Acad Emerg Med. 2011;18:98–101.
- , , , et al. Usefulness of hand‐carried ultrasound to predict elevated left ventricular filling pressure. Am J Cardiol. 2009;103:246–247.
- , , , et al. Hospitalist performance of cardiac hand‐carried ultrasound after focused training. Am J Med. 2007;120(11):1000–1004.
The use of hand‐carried ultrasound by nonspecialists is increasing. Of particular interest to hospitalists is bedside ultrasound assessment of the inferior vena cava (IVC), which more accurately estimates left atrial pressure than does assessment of jugular venous pressure by physical examination.[1] Invasively measured central venous pressure (CVP) also correlates closely with estimates from IVC imaging.[1, 2, 3, 4] Although quick, accurate bedside determination of CVP may have broad potential applications in hospital medicine,[5, 6, 7, 8] of particular interest to patients and their advocates is whether hospitalists are sufficiently skilled to perform this procedure. Lucas et al. found that 8 hospitalists trained to perform 6 cardiac assessments by hand‐carried ultrasound could identify an enlarged IVC with moderate accuracy (sensitivity 56%, specificity 86%).[9] To our knowledge, no other study has examined whether hospitalists can readily develop the skills to accurately assess the IVC by ultrasound. We therefore studied whether the skills needed to acquire and interpret IVC images by ultrasound could be acquired by hospitalists after a brief training program.
METHODS
Study Populations
Hospitalists and volunteer subjects both provided informed consent to participate in this study, which was approved by the Johns Hopkins University School of Medicine Institutional Review Board. Nonpregnant volunteer subjects at least 18 years of age who agreed to attend training sessions were solicited from the investigators' ambulatory clinic patient population (see Supporting Information, Appendix A, in the online version of this article) and were compensated for their time. Volunteer subjects were solicited to represent a range of cardiac pathology. Hospitalists were solicited from among 28 members of the Johns Hopkins Bayview Medical Center's Division of Hospital Medicine, a nationally renowned academic hospitalist program comprising tenure‐track faculty who dedicate at least 30% of their time to academic endeavors.
Image Acquisition and Interpretation
A pocket‐sized portable hand‐carried ultrasound device was used for all IVC images (Vscan; GE Healthcare, Milwaukee, WI). All IVC images were acquired using the conventional methods with a subcostal view while the patient is supine. Cine loops of the IVC with respiration were captured in the longitudinal axis. Diameters were obtained approximately and by convention, approximately 2 cm from the IVC and right atrial junction. The IVC minimum diameter was measured during a cine loop of a patient performing a nasal sniff. The IVC collapsibility was determined by the formula: IVC Collapsibility Index=(IVCmaxIVCmin/IVCmax), where IVCmax and IVCmin represent the maximum and minimum IVC diameters respectively.[2] The IVC maximum diameters and collapsibility measurements that were used to estimate CVP are shown in the Supporting Information, Appendix B, in the online version of this article.
Educational Intervention and Skills Performance Assessment
One to 2 days prior to the in‐person training session, hospitalists were provided a brief introductory online curriculum (see Supporting Information, Appendix B, in the online version of this article). Groups of 3 to 4 hospitalists then completed an in‐person training and testing session (7 hours total time), which consisted of a precourse survey, a didactic session, and up to 4 hours of practice time with 10 volunteer subjects supervised by an experienced board‐certified cardiologist (G.A.H.) and a research echocardiography technician (C.M.). The survey included details on medical training, years in practice, prior ultrasound experience, and confidence in obtaining and interpreting IVC images. Confidence was rated on a Likert scale from 1=strongly confident to 5=not confident (3=neutral).
Next, each hospitalist's skills were assessed on 5 volunteer subjects selected by the cardiologist to represent a range of IVC appearance and body mass index (BMI). After appropriately identifying the IVC, they were first asked to make a visual qualitative judgement whether the IVC collapsed more than 50% during rapid inspiration or a sniff maneuver. Then hospitalists measured IVC diameter in a longitudinal view and calculated IVC collapsibility. Performance was evaluated by an experienced cardiologist (G.A.H.), who directly observed each hospitalist acquire and interpret IVC images and judged them relative to his own hand‐carried ultrasound assessments on the same subjects performed just before the hospitalists' scans. For each volunteer imaged, hospitalists had to acquire a technically adequate image of the IVC and correctly measure the inspiratory and expiratory IVC diameters. Hospitalists then had to estimate CVP by interpreting IVC diameters and collapsibility in 10 previously acquired sets of IVC video and still images. First, the hospitalists performed visual IVC collapsibility assessments (IVC collapse more than 50%) of video clips showing IVC appearance at baseline and during a rapid inspiration or sniff, without any measurements provided. Then, using still images showing premeasured maximum and minimum IVC diameters, they estimated CVP based on calculating IVC collapsibility (see Supporting Information, Appendix B, in the online version of this article for correlation of CVP to IVC maximum diameter and collapsibility). At the end of initial training hospitalists were again surveyed on confidence and also rated level of agreement (Likert scale, 1=strongly agree to 5=strongly disagree) regarding their ability to adequately obtain and accurately interpret IVC images and measurements. The post‐training survey also reviewed the training curriculum and asked hospitalists to identify potential barriers to clinical use of IVC ultrasound.
Following initial training, hospitalists were provided with a hand‐carried ultrasound device and allowed to use the device for IVC imaging on their general medical inpatients; the hospitalists could access the research echocardiography technician (C.M.) for assistance if desired. The number of additional patients imaged and whether scans were assisted was recorded for the study. At least 6 weeks after initial training, the hospitalists' IVC image acquisition and interpretation skills were again assessed on 5 volunteer subjects. At the follow‐up assessment, 4 of the 5 volunteers were new volunteers compared to the hospitalists' initial skills testing.
Statistics
The mean and standard deviations were used to describe continuous variables and percentages to describe proportions, and survey responses were described using medians and the interquartile ranges (25th percentile, 75th percentile). Wilcoxon rank sum tests were used to measure the pre‐ and post‐training differences in the individual survey responses (Stata Statistical Software: Release 12; StataCorp, College Station, TX).
RESULTS
From among 18 hospitalist volunteers, the 10 board‐certified hospitalists who could attend 1 of the scheduled training sessions were enrolled and completed the study. Hospitalists' demographic information and performance are summarized in Table 1. Hospitalists completed the initial online curriculum in an average of 18.37 minutes. After the in‐person training session, 8 of 10 hospitalists acquired adequate IVC images on all 5 volunteer subjects. One hospitalist obtained adequate images in 4 of 5 patients. Another hospitalist only obtained adequate images in 3 of 5 patients; a hepatic vein and the abdominal aorta were erroneously measured instead of the IVC in 1 subject each. This hospitalist later performed supervised IVC imaging on 7 additional hospital inpatients and was the only hospitalist to request additional direct supervision by the research echocardiography technician. All hospitalists were able to accurately quantify the IVC collapsibility index and estimate the CVP from all 10 prerecorded cases showing still images and video clips of the IVC. Based on IVC images, 1 of the 5 volunteers used in testing each day had a very elevated CVP, and the other 4 had CVPs ranging from low to normal. The volunteer's average BMI was overweight at 27.4, with a range from 15.4 to 37.1.
| Hospitalist | Years in Practice | Previous Ultrasound Training (Hours)a | No. of Subjects Adequately Imaged and Correctly Interpreted After First Session (5 Maximum) | No. of Subjects Adequately Imaged and Correctly Interpreted at Follow‐up (5 Maximum) | After Study Completion Felt Training Was Adequate to Perform IVC Imagingb |
|---|---|---|---|---|---|
| |||||
| 1 | 5.5 | 10 | 5 | 5 | 4 |
| 2 | 0.8 | 0 | 5 | 5 | 5 |
| 3 | 1.8 | 4.5 | 3 | 4 | 2 |
| 4 | 1.8 | 0 | 5 | 5 | 5 |
| 5 | 10.5 | 6 | 5 | 5 | 5 |
| 6 | 1.7 | 1 | 5 | 5 | 5 |
| 7 | 0.6 | 0 | 5 | 5 | 5 |
| 8 | 2.6 | 0 | 4 | 5 | 4 |
| 9 | 1.7 | 0 | 5 | 5 | 5 |
| 10 | 5.5 | 10 | 5 | 5 | 5 |
At 7.40.7 weeks (range, 6.98.6 weeks) follow‐up, 9 of 10 hospitalists obtained adequate IVC images in all 5 volunteer subjects and interpreted them correctly for estimating CVP. The hospitalist who performed most poorly at the initial assessment acquired adequate images and interpreted them correctly in 4 of 5 patients at follow‐up. Overall, hospitalists' visual assessment of IVC collapsibility index agreed with the quantitative collapsibility index calculation in 180 of 198 (91%) of the interpretable encounters. By the time of the follow‐up assessment, hospitalists had performed IVC imaging on 3.93.0 additional hospital inpatients (range, 011 inpatients). Lack of time assigned to the clinical service was the main barrier limiting further IVC imaging during that interval. Hospitalists also identified time constraints and need for secure yet accessible device storage as other barriers.
None of the hospitalists had previous experience imaging the IVC, and prior to training they rated their average confidence to acquire an IVC image and interpret it by the hand‐carried ultrasound device at 3 (3, 4) and 3 (3, 4), respectively. After the initial training session, 9 of 10 hospitalists believed they had received adequate online and in‐person training and were confident in their ability to acquire and interpret IVC images. After all training sessions the hospitalists on average rated their confidence statistically significantly better for acquiring and interpreting IVC images at 2 (1, 2) (P=0.005) and 2 (1, 2) (P=0.004), respectively compared to baseline.
DISCUSSION
This study shows that after a relatively brief training intervention, hospitalists can develop and over a short term retain important skills in the acquisition and interpretation of IVC images to estimate CVP. Estimating CVP is key to the care of many patients, but cannot be done accurately by most physicians.[10] Although our study has a number of limitations, the ability to estimate CVP acquired after only a brief training intervention could have important effects on patient care. Given that a dilated IVC with reduced respiratory collapsibility was found to be a statistically significant predictor of 30‐day readmission for heart failure,11 key clinical outcomes to measure in future work include whether IVC ultrasound assessment can help guide diuresis, limit complications, and ultimately reduce rehospitalizations for heart failure, the most expensive diagnosis for Medicare.[12]
Because hand‐carried ultrasound is a point‐of‐care diagnostic tool, we also examined the ability of hospitalists to visually approximate the IVC collapsibility index. Hospitalists' qualitative performance (IVC collapsibility judged correctly 91% of the time without performing formal measurements) is consistent with studies involving emergency medicine physicians and suggests that CVP may be rapidly and accurately estimated in most instances.[13] There may be, however, value to formally measuring the IVC maximum diameter, because it may be inaccurately visually estimated due to changes in scale when the imaging depth is adjusted. Accurately measuring the IVC maximum diameter is important because a maximum diameter of more than 2.0 cm is evidence of an elevated right atrial pressure (82% sensitivity and 84% specificity for predicting right atrial pressure of 10 mm Hg or above) and an elevated pulmonary capillary wedge pressure (75% sensitivity and 83% specificity for pulmonary capillary wedge pressure of 15 mm Hg or more).[14]
Limitations
Our findings should be interpreted cautiously given the relatively small number of hospitalists and subjects used for hand‐carried ultrasound imaging. Although our direct observations of hospitalist performance in IVC imaging were based on objective measurements performed and interpreted accurately, we did not record the images, which would have allowed separate analyses of inter‐rater reliability measures. The majority of volunteer subjects were chronically ill, but they were nonetheless stable outpatients and may have been easier to position and image relative to acutely ill inpatients. Hospitalist self‐selected participation may introduce a bias favoring hospitalists interested in learning hand‐carried ultrasound skills; however, nearly half of the hospitalist group volunteered and enrollments in the study were based only on their availability for the previously scheduled study dates.
IMPLICATIONS FOR TRAINING
Our study, especially the assessment of the hospitalists' ability to retain their skills, adds to what is known about training hospitalists in hand‐carried ultrasound and may help inform deliberations among hospitalists as to whether to join other professional societies in defining specialty‐specific bedside ultrasound indications and training protocols.[9, 15] As individuals acquire new skills at variable rates, training cannot be defined by the number of procedures performed, but rather by the need to provide objective evidence of acquired procedural skills. Thus, going forward there is also a need to develop and validate tools for assessment of competence in IVC imaging skills.
Disclosures
This project was funded as an investigator‐sponsored research project by General Electric (GE) Medical Systems Ultrasound and Primary Care Diagnostics, LLC. The devices used in this training were supplied by GE. All authors had access to the data and contributed to the preparation of the manuscript. GE was not involved in the study design, analysis, or preparation of the manuscript. All authors received research support to perform this study from the funding source.
- , , , et al. A comparison by medicine residents of physical examination versus hand‐carried ultrasound for estimation of right atrial pressure. Am J Cardiol. 2007;99(11):1614–1616.
- , , . Noninvasive estimation of right atrial pressure from the inspiratory collapse of the inferior vena cava. Am J Cardiol. 1990;66:493–496.
- , , , et al. Reappraisal of the use of inferior vena cava for estimating right atrial pressure. J Am Soc Echocardiogr. 2007;20:857–861.
- , , , et al. Use of hand‐carried ultrasound, B‐type natriuretic peptide, and clinical assessment in identifying abnormal left ventricular filling pressures in patients referred for right heart catheterization. J Cardiac Fail. 2010;16:69–75.
- , , . Identification of congestive heart failure via respiratory variation of inferior vena cava diameter. Am J Emerg Med. 2009;27:71–75.
- , , , . Role of inferior vena cava diameter in assessment of volume status: a meta‐analysis. Am J Emerg Med. 2012;30(8):1414–1419.e1.
- , , , et al. Qualitative assessment of the inferior vena cava: useful tool for the evaluation of fluid status in critically ill patients. Am Surg. 2012;78(4):468–470.
- , , , et al. Inferior vena cava collapsibility to guide fluid removal in slow continuous ultrafiltration: a pilot study. Intensive Care Med 2010;36:692–696.
- , , , et al. Diagnostic accuracy of hospitalist‐performed hand‐carried ultrasound echocardiography after a brief training program. J Hosp Med. 2009;4(6):340–349.
- , , . Can the clinical examination diagnose left‐sided heart failure in adults? JAMA. 1997;277:1712–1719.
- , , , et al. Comparison of hand‐carried ultrasound assessment of the inferior vena cava and N‐terminal pro‐brain natriuretic peptide for predicting readmission after hospitalization for acute decompensated heart failure. JACC Cardiovasc Imaging. 2008;1:595–601.
- , , . Rehospitalizations among patients in the Medicare Fee‐for‐Service Program. N Engl J Med. 2009;360:1418–1428.
- , , , et al. The interrater reliability of inferior vena cava ultrasound by bedside clinician sonographers in emergency department patients. Acad Emerg Med. 2011;18:98–101.
- , , , et al. Usefulness of hand‐carried ultrasound to predict elevated left ventricular filling pressure. Am J Cardiol. 2009;103:246–247.
- , , , et al. Hospitalist performance of cardiac hand‐carried ultrasound after focused training. Am J Med. 2007;120(11):1000–1004.
RIP Conference Provides Peer Mentoring
The research‐in‐progress (RIP) conference is commonplace in academia, but there are no studies that objectively characterize its value. Bringing faculty together away from revenue‐generating activities carries a significant cost. As such, measuring the success of such gatherings is necessary.
Mentors are an invaluable influence on the careers of junior faculty members, helping them to produce high‐quality research.13 Unfortunately, some divisions lack mentorship to support the academic needs of less experienced faculty.1 Peer mentorship may be a solution. RIP sessions represent an opportunity to intentionally formalize peer mentoring. Further, these sessions can facilitate collaborations as individuals become aware of colleagues' interests. The goal of this study was to assess the value of the research‐in‐progress conference initiated within the hospitalist division at our institution.
Methods
Study Design
This cohort study was conducted to evaluate the value of the RIP conference among hospitalists in our division and the academic outcomes of the projects.
Setting and Participants
The study took place at Johns Hopkins Bayview Medical Center (JHBMC), a 335‐bed university‐affiliated medical center in Baltimore, Maryland. The hospitalist division consists of faculty physicians, nurse practitioners, and physician assistants (20.06 FTE physicians and 7.41 FTE midlevel providers). Twelve (54%) of our faculty members are female, and the mean age of providers is 35.7 years. The providers have been practicing hospitalist medicine for 3.0 years on average; 2 (9%) are clinical associates, 16 (73%) are instructors, and 3 (14%) are assistant professors.
All faculty members presenting at the RIP session were members of the division. A senior faculty member (a professor in the Division of General Internal Medicine) helps to coordinate the conference. The group's research assistant was present at the sessions and was charged with data collection and collation.
The Johns Hopkins University institutional review board approved the study.
The Research in Progress Conference
During the 2009 academic year, our division held 15 RIP sessions. At each session, 1 faculty member presented a research proposal. The goal of each session was to provide a forum where faculty members could share their research ideas (specific aims, hypotheses, planned design, outcome measures, analytic plans, and preliminary results [if applicable]) in order to receive feedback. The senior faculty member met with the presenter prior to each session in order to: (1) ensure that half the RIP time was reserved for discussion and (2) review the presenter's goals so these would be made explicit to peers. The coordinator of the RIP conference facilitated the discussion, solicited input from all attendees, and encouraged constructive criticism.
Evaluation, Data Collection, and Analysis
At the end of each session, attendees (who were exclusively members of the hospitalist division) were asked to complete an anonymous survey. The 1‐page instrument was designed (1) with input from curriculum development experts4 and (2) after a review of the literature about RIP conferences. These steps conferred content validity to the instrument, which assessed perceptions about the session's quality and what was learned. Five‐point Likert scales were used to characterize the conference's success in several areas, including being intellectually/professionally stimulating and keeping them apprised of their colleagues' interests. The survey also assessed the participatory nature of the conference (balance of presentation vs discussion), its climate (extremely critical vs extremely supportive), and how the conference assisted the presenter. The presenters completed a distinct survey related to how helpful the conference was in improving/enhancing their projects. A final open‐ended section invited additional comments. The instrument was piloted and iteratively revised before its use in this study.
For the projects presented, we assessed the percentage that resulted in a peer‐reviewed publication or a presentation at a national meeting.
Results
The mean number of attendees at the RIP sessions was 9.6 persons. A total of 143 evaluations were completed. All 15 presenters (100%) completed their assessments. The research ideas presented spanned a breadth of topics in clinical research, quality improvement, policy, and professional development (Table 1).
| Session | Date | Presenter | Topic | Evaluations Completed |
|---|---|---|---|---|
| 1 | 7/2008 | Dr. CS | Hospital medicine in Canada versus the United States | 7 |
| 2 | 7/2008 | Dr. RT | Procedures by hospitalists | 9 |
| 3 | 8/2008 | Dr. MA | Clostridium difficile treatment in the hospital | 11 |
| 4 | 8/2008 | Dr. EH | Active bed management | 6 |
| 5 | 9/2008 | Dr. AS | Medication reconciliation for geriatric inpatients | 10 |
| 6 | 9/2008 | Dr. DT | Time‐motion study of hospitalists | 10 |
| 7 | 10/2008 | Dr. KV | e‐Triage pilot | 16 |
| 8 | 11/2008 | Dr. EH | Assessing clinical performance of hospitalists | 7 |
| 9 | 12/2008 | Dr. SC | Trends and implications of hospitalists' morale | 8 |
| 10 | 1/2009 | Dr. TB | Lessons learned: tracking urinary catheter use at Bayview | 11 |
| 11 | 2/2009 | Dr. FK | Utilizing audit and feedback to improve performance in tobacco dependence counseling | 12 |
| 12 | 3/2009 | Dr. MK | Survivorship care plans | 7 |
| 13 | 4/2009 | Dr. DK | Outpatient provider preference for discharge summary format/style/length | 7 |
| 14 | 5/2009 | Dr. RW | Comparing preoperative consults done by hospitalists and cardiologists | 11 |
| 15 | 6/2009 | Dr. AK | Development of Web‐based messaging tool for providers | 12 |
Presenter Perspective
All 15 presenters (100%) felt a lot or tremendously supported during their sessions. Thirteen physicians (86%) believed that the sessions were a lot or tremendously helpful in advancing their projects. The presenters believed that the guidance and discussions related to their research ideas, aims, hypotheses, and plans were most helpful for advancing their projects (Table 2).
| Not at All, n (%) | A Little, n (%) | Some, n (%) | A Lot, n (%) | Tremendously, n (%) | |
|---|---|---|---|---|---|
| General questions: | |||||
| Intellectually/professionally stimulating | 0 (0) | 0 (0) | 0 (0) | 5 (33) | 10 (66) |
| Feeling supported by your colleagues in your scholarly pursuits | 0 (0) | 0 (0) | 0 (0) | 4 (27) | 11 (73) |
| Session helpful in the following areas: | |||||
| Advancing your project | 0 (0) | 0 (0) | 2 (13) | 5 (33) | 8 (53) |
| Generated new hypotheses | 1 (6) | 3 (20) | 5 (33) | 5 (33) | 1 (6) |
| Clarification of research questions | 0 (0) | 2 (13) | 4 (27) | 7 (47) | 2 (13) |
| Ideas for alternate methods | 1 (6) | 1 (6) | 2 (13) | 7 (47) | 4 (27) |
| New outcomes suggested | 1 (6) | 2 (13) | 2 (13) | 5 (33) | 5 (33) |
| Strategies to improve or enhance data collection | 0 (0) | 2 (13) | 0 (0) | 8 (53) | 5 (33) |
| Suggestions for alternate analyses or analytical strategies | 1 (1) | 1 (6) | 4 (27) | 5 (33) | 4 (27) |
| Input into what is most novel/emnteresting about this work | 0 (0) | 2 (13) | 3 (20) | 6 (40) | 4 (27) |
| Guidance about the implications of the work | 1 (6) | 2 (13) | 1 (6) | 7 (47) | 4 (27) |
| Ideas about next steps or future direction/studies | 0 (0) | 0 (0) | 3 (21) | 8 (57) | 3 (21) |
Examples of the written comments are:
I was overwhelmed by how engaged people were in my project.
The process of preparing for the session and then the discussion both helped my thinking. Colleagues were very supportive.
I am so glad I heard these comments and received this feedback now, rather than from peer reviewers selected by a journal to review my study. It would have been a much more difficult situation to fix at that later time.
Attendee Perspective
The majority of attendees (123 of 143, 86%) found the sessions to be a lot or extremely stimulating, and almost all (96%) were a lot or extremely satisfied with how the RIP sessions kept them abreast of their colleagues' academic interests. In addition, 92% judged the session's climate to be a lot or extremely supportive, and 88% deemed the balance of presentation to discussion to be just right. Attendees believed that they were most helpful to the presenter in terms of conceiving ideas for alternative methods to be used to answer the research question and in providing strategies to improve data collection (Table 3).
| Insight Offered | n (%) |
|---|---|
| Ideas for alternate methods | 92 (64%) |
| Strategies to improve data collection | 85 (59.4%) |
| New hypotheses generated | 84 (58.7%) |
| Ideas for next steps/future direction/studies | 83 (58%) |
| New outcomes suggested that should be considered | 69 (48%) |
| Clarification of the research questions | 61 (43%) |
| Input about what is most novel/emnteresting about the work | 60 (42%) |
| Guidance about the real implications of the work | 59 (41%) |
| Suggestions for alternate analyses or analytical strategies | 51 (36%) |
The free text comments primarily addressed how the presenters' research ideas were helped by the session:
There were great ideas for improvementincluding practical approaches for recruitment.
The session made me think of the daily routine things that we do that could be studied.
There were some great ideas to help Dr. A make the study more simple, doable, and practical. There were also some good ideas regarding potential sources of funding.
Academic Success
Of the 15 projects, 6 have been published in peer‐reviewed journals as first‐ or senior‐authored publications.510 Of these, 3 were presented at national meetings prior to publication. Four additional projects have been presented at a national society's annual meeting, all of which are being prepared for publication. Of the remaining 5 presentations, 4 were terminated because of the low likelihood of academic success. The remaining project is ongoing.
Comparatively, scholarly output in the prior year by the 24 physicians in the hospitalist group was 4 first‐ or senior‐authored publications in peer‐reviewed journals and 3 presentations at national meetings.
Discussion
In this article, we report our experience with the RIP conference. The sessions were perceived to be intellectually stimulating and supportive, whereas the discussions proved helpful in advancing project ideas. Ample discussion time and good attendance were thought to be critical to the success.
To our knowledge, this is the first article gathering feedback from attendees and presenters at a RIP conference and to track academic outcomes. Several types of meetings have been established within faculty and trainee groups to support and encourage scholarly activities.11, 12 The benefits of peer collaboration and peer mentoring have been described in the literature.13, 14 For example, Edwards described the success of shortstop meetings among small groups of faculty members every 4‐6 weeks in which discussions of research projects and mutual feedback would occur.15 Santucci described peer‐mentored research development meetings, with increased research productivity.12
Mentoring is critically important for academic success in medicine.1619 When divisions have limited senior mentors available, peer mentoring has proven to be indispensable as a mechanism to support faculty members.2022 The RIP conference provided a forum for peer mentoring and provided a partial solution to the limited resource of experienced research mentors in the division. The RIP sessions appear to have helped to bring the majority of presented ideas to academic fruition. Perhaps even more important, the sessions were able to terminate studies judged to have low academic promise before the faculty had invested significant time.
Several limitations of our study should be considered. First, this study involved a research‐in‐progress conference coordinated for a group of hospitalist physicians at 1 institution, and the results may not be generalizable. Second, although attendance was good at each conference, some faculty members did not come to many sessions. It is possible that those not attending may have rated the sessions differently. Session evaluations were anonymous, and we do not know whether specific attendees rated all sessions highly, thereby resulting in some degree of clustering. Third, this study did not compare the effectiveness of the RIP conference with other peer‐mentorship models. Finally, our study was uncontrolled. Although it would not be possible to restrict specific faculty from presenting at or attending the RIP conference, we intend to more carefully collect attendance data to see whether there might be a dose‐response effect with respect to participation in this conference and academic success.
In conclusion, our RIP conference was perceived as valuable by our group and was associated with academic success. In our division, the RIP conference serves as a way to operationalize peer mentoring. Our findings may help other groups to refine either the focus or format of their RIP sessions and those wishing to initiate such a conference.
- ,,, et al.Junior faculty members' mentoring relationships and their professional development in US medical schools.Acad Med.1998;73:318–323.
- ,.Mentors, Advisors and Role Models in Graduate and Professional Education.Washington, DC:Association of Academic Health Centers;1996.
- ,.Characteristics of the successful researcher and implications for faculty development.J Med Educ.1986;61:22–31.
- ,,.Curriculum Development for Medical Education: A Six‐Step Approach.2nd ed.Baltimore, MD:The Johns Hopkins University Press;2009.
- ,,, et al.Characteristics of hospitalists and hospitalist programs in the United States and Canada.J Clin Outcomes Meas.2009;16:69–74
- ,,, et al.Procedures performed by hospitalist and non‐hospitalist general internists.J Gen Intern Med.2010;25:448–452.
- ,,, et al.Intravenous immunoglobulin for the treatment of severe Clostridium difficile colitis: an observational study and review of the literature [review].J Hosp Med.2010;5:E1–E9.
- ,,, et al.Active bed management by hospitalists and emergency department throughput.Ann Intern Med.2008;149:804–811.
- ,,, et al.Transitioning to breast cancer survivorship: perspectives of patients, cancer specialists, and primary care providers.J Gen Intern Med.2009;24(Suppl 2):S459–S466.
- ,,, et al.Utilizing audit and feedback to improve hospitalists' performance in tobacco dependence counseling.Nicotine Tob Res.2010;12:797–800.
- ,,, et al.An internal medicine interest group research program can improve scholarly productivity of medical students and foster mentoring relationships with internists.Teach Learn Med.2008;20:163–167.
- ,,, et al.Peer‐mentored research development meeting: a model for successful peer mentoring among junior level researchers.Acad Psychiatry.2008;32:493–497.
- ,,, et al.Mentoring junior faculty in geriatric oncology: report from the cancer and aging research group.J Clin Oncol.2008;26:3125–3127.
- ,,the Canadian Critical Care Trials Group.Investigator‐led clinical research consortia: the Canadian Critical Care Trials Group.Crit Care Med.2009;37(1):S165–S172.
- .“Short stops”: peer support of scholarly activity.Acad Med.2002;77:939.
- ,,,,,,.Mentorship in academic general internal medicine. Results of a survey of mentors.J Gen Intern Med.2005;20:1014–1018.
- ,,, et al.Making the most of mentors: a guide for mentees.Acad Med.2009;84:140–144.
- ,,.Mentoring in academic medicine: a systematic review.JAMA.2006;296:1103–1115.
- ,,, et al.Assessing the role of influential mentors in the research development of primary care fellows.Acad Med.2004;79:865–872.
- ,,.Peer group mentoring of junior faculty.Acad Psychiatry.2008;32:230–235.
- ,,,.Facilitated peer mentorship: a pilot program for academic advancement of female medical faculty.J Womens Health.2008;17:1009–1015.
- ,Mentoring faculty in academic medicine. A new paradigm?J Gen Intern Med.2005;20:866–870.
The research‐in‐progress (RIP) conference is commonplace in academia, but there are no studies that objectively characterize its value. Bringing faculty together away from revenue‐generating activities carries a significant cost. As such, measuring the success of such gatherings is necessary.
Mentors are an invaluable influence on the careers of junior faculty members, helping them to produce high‐quality research.13 Unfortunately, some divisions lack mentorship to support the academic needs of less experienced faculty.1 Peer mentorship may be a solution. RIP sessions represent an opportunity to intentionally formalize peer mentoring. Further, these sessions can facilitate collaborations as individuals become aware of colleagues' interests. The goal of this study was to assess the value of the research‐in‐progress conference initiated within the hospitalist division at our institution.
Methods
Study Design
This cohort study was conducted to evaluate the value of the RIP conference among hospitalists in our division and the academic outcomes of the projects.
Setting and Participants
The study took place at Johns Hopkins Bayview Medical Center (JHBMC), a 335‐bed university‐affiliated medical center in Baltimore, Maryland. The hospitalist division consists of faculty physicians, nurse practitioners, and physician assistants (20.06 FTE physicians and 7.41 FTE midlevel providers). Twelve (54%) of our faculty members are female, and the mean age of providers is 35.7 years. The providers have been practicing hospitalist medicine for 3.0 years on average; 2 (9%) are clinical associates, 16 (73%) are instructors, and 3 (14%) are assistant professors.
All faculty members presenting at the RIP session were members of the division. A senior faculty member (a professor in the Division of General Internal Medicine) helps to coordinate the conference. The group's research assistant was present at the sessions and was charged with data collection and collation.
The Johns Hopkins University institutional review board approved the study.
The Research in Progress Conference
During the 2009 academic year, our division held 15 RIP sessions. At each session, 1 faculty member presented a research proposal. The goal of each session was to provide a forum where faculty members could share their research ideas (specific aims, hypotheses, planned design, outcome measures, analytic plans, and preliminary results [if applicable]) in order to receive feedback. The senior faculty member met with the presenter prior to each session in order to: (1) ensure that half the RIP time was reserved for discussion and (2) review the presenter's goals so these would be made explicit to peers. The coordinator of the RIP conference facilitated the discussion, solicited input from all attendees, and encouraged constructive criticism.
Evaluation, Data Collection, and Analysis
At the end of each session, attendees (who were exclusively members of the hospitalist division) were asked to complete an anonymous survey. The 1‐page instrument was designed (1) with input from curriculum development experts4 and (2) after a review of the literature about RIP conferences. These steps conferred content validity to the instrument, which assessed perceptions about the session's quality and what was learned. Five‐point Likert scales were used to characterize the conference's success in several areas, including being intellectually/professionally stimulating and keeping them apprised of their colleagues' interests. The survey also assessed the participatory nature of the conference (balance of presentation vs discussion), its climate (extremely critical vs extremely supportive), and how the conference assisted the presenter. The presenters completed a distinct survey related to how helpful the conference was in improving/enhancing their projects. A final open‐ended section invited additional comments. The instrument was piloted and iteratively revised before its use in this study.
For the projects presented, we assessed the percentage that resulted in a peer‐reviewed publication or a presentation at a national meeting.
Results
The mean number of attendees at the RIP sessions was 9.6 persons. A total of 143 evaluations were completed. All 15 presenters (100%) completed their assessments. The research ideas presented spanned a breadth of topics in clinical research, quality improvement, policy, and professional development (Table 1).
| Session | Date | Presenter | Topic | Evaluations Completed |
|---|---|---|---|---|
| 1 | 7/2008 | Dr. CS | Hospital medicine in Canada versus the United States | 7 |
| 2 | 7/2008 | Dr. RT | Procedures by hospitalists | 9 |
| 3 | 8/2008 | Dr. MA | Clostridium difficile treatment in the hospital | 11 |
| 4 | 8/2008 | Dr. EH | Active bed management | 6 |
| 5 | 9/2008 | Dr. AS | Medication reconciliation for geriatric inpatients | 10 |
| 6 | 9/2008 | Dr. DT | Time‐motion study of hospitalists | 10 |
| 7 | 10/2008 | Dr. KV | e‐Triage pilot | 16 |
| 8 | 11/2008 | Dr. EH | Assessing clinical performance of hospitalists | 7 |
| 9 | 12/2008 | Dr. SC | Trends and implications of hospitalists' morale | 8 |
| 10 | 1/2009 | Dr. TB | Lessons learned: tracking urinary catheter use at Bayview | 11 |
| 11 | 2/2009 | Dr. FK | Utilizing audit and feedback to improve performance in tobacco dependence counseling | 12 |
| 12 | 3/2009 | Dr. MK | Survivorship care plans | 7 |
| 13 | 4/2009 | Dr. DK | Outpatient provider preference for discharge summary format/style/length | 7 |
| 14 | 5/2009 | Dr. RW | Comparing preoperative consults done by hospitalists and cardiologists | 11 |
| 15 | 6/2009 | Dr. AK | Development of Web‐based messaging tool for providers | 12 |
Presenter Perspective
All 15 presenters (100%) felt a lot or tremendously supported during their sessions. Thirteen physicians (86%) believed that the sessions were a lot or tremendously helpful in advancing their projects. The presenters believed that the guidance and discussions related to their research ideas, aims, hypotheses, and plans were most helpful for advancing their projects (Table 2).
| Not at All, n (%) | A Little, n (%) | Some, n (%) | A Lot, n (%) | Tremendously, n (%) | |
|---|---|---|---|---|---|
| General questions: | |||||
| Intellectually/professionally stimulating | 0 (0) | 0 (0) | 0 (0) | 5 (33) | 10 (66) |
| Feeling supported by your colleagues in your scholarly pursuits | 0 (0) | 0 (0) | 0 (0) | 4 (27) | 11 (73) |
| Session helpful in the following areas: | |||||
| Advancing your project | 0 (0) | 0 (0) | 2 (13) | 5 (33) | 8 (53) |
| Generated new hypotheses | 1 (6) | 3 (20) | 5 (33) | 5 (33) | 1 (6) |
| Clarification of research questions | 0 (0) | 2 (13) | 4 (27) | 7 (47) | 2 (13) |
| Ideas for alternate methods | 1 (6) | 1 (6) | 2 (13) | 7 (47) | 4 (27) |
| New outcomes suggested | 1 (6) | 2 (13) | 2 (13) | 5 (33) | 5 (33) |
| Strategies to improve or enhance data collection | 0 (0) | 2 (13) | 0 (0) | 8 (53) | 5 (33) |
| Suggestions for alternate analyses or analytical strategies | 1 (1) | 1 (6) | 4 (27) | 5 (33) | 4 (27) |
| Input into what is most novel/emnteresting about this work | 0 (0) | 2 (13) | 3 (20) | 6 (40) | 4 (27) |
| Guidance about the implications of the work | 1 (6) | 2 (13) | 1 (6) | 7 (47) | 4 (27) |
| Ideas about next steps or future direction/studies | 0 (0) | 0 (0) | 3 (21) | 8 (57) | 3 (21) |
Examples of the written comments are:
I was overwhelmed by how engaged people were in my project.
The process of preparing for the session and then the discussion both helped my thinking. Colleagues were very supportive.
I am so glad I heard these comments and received this feedback now, rather than from peer reviewers selected by a journal to review my study. It would have been a much more difficult situation to fix at that later time.
Attendee Perspective
The majority of attendees (123 of 143, 86%) found the sessions to be a lot or extremely stimulating, and almost all (96%) were a lot or extremely satisfied with how the RIP sessions kept them abreast of their colleagues' academic interests. In addition, 92% judged the session's climate to be a lot or extremely supportive, and 88% deemed the balance of presentation to discussion to be just right. Attendees believed that they were most helpful to the presenter in terms of conceiving ideas for alternative methods to be used to answer the research question and in providing strategies to improve data collection (Table 3).
| Insight Offered | n (%) |
|---|---|
| Ideas for alternate methods | 92 (64%) |
| Strategies to improve data collection | 85 (59.4%) |
| New hypotheses generated | 84 (58.7%) |
| Ideas for next steps/future direction/studies | 83 (58%) |
| New outcomes suggested that should be considered | 69 (48%) |
| Clarification of the research questions | 61 (43%) |
| Input about what is most novel/emnteresting about the work | 60 (42%) |
| Guidance about the real implications of the work | 59 (41%) |
| Suggestions for alternate analyses or analytical strategies | 51 (36%) |
The free text comments primarily addressed how the presenters' research ideas were helped by the session:
There were great ideas for improvementincluding practical approaches for recruitment.
The session made me think of the daily routine things that we do that could be studied.
There were some great ideas to help Dr. A make the study more simple, doable, and practical. There were also some good ideas regarding potential sources of funding.
Academic Success
Of the 15 projects, 6 have been published in peer‐reviewed journals as first‐ or senior‐authored publications.510 Of these, 3 were presented at national meetings prior to publication. Four additional projects have been presented at a national society's annual meeting, all of which are being prepared for publication. Of the remaining 5 presentations, 4 were terminated because of the low likelihood of academic success. The remaining project is ongoing.
Comparatively, scholarly output in the prior year by the 24 physicians in the hospitalist group was 4 first‐ or senior‐authored publications in peer‐reviewed journals and 3 presentations at national meetings.
Discussion
In this article, we report our experience with the RIP conference. The sessions were perceived to be intellectually stimulating and supportive, whereas the discussions proved helpful in advancing project ideas. Ample discussion time and good attendance were thought to be critical to the success.
To our knowledge, this is the first article gathering feedback from attendees and presenters at a RIP conference and to track academic outcomes. Several types of meetings have been established within faculty and trainee groups to support and encourage scholarly activities.11, 12 The benefits of peer collaboration and peer mentoring have been described in the literature.13, 14 For example, Edwards described the success of shortstop meetings among small groups of faculty members every 4‐6 weeks in which discussions of research projects and mutual feedback would occur.15 Santucci described peer‐mentored research development meetings, with increased research productivity.12
Mentoring is critically important for academic success in medicine.1619 When divisions have limited senior mentors available, peer mentoring has proven to be indispensable as a mechanism to support faculty members.2022 The RIP conference provided a forum for peer mentoring and provided a partial solution to the limited resource of experienced research mentors in the division. The RIP sessions appear to have helped to bring the majority of presented ideas to academic fruition. Perhaps even more important, the sessions were able to terminate studies judged to have low academic promise before the faculty had invested significant time.
Several limitations of our study should be considered. First, this study involved a research‐in‐progress conference coordinated for a group of hospitalist physicians at 1 institution, and the results may not be generalizable. Second, although attendance was good at each conference, some faculty members did not come to many sessions. It is possible that those not attending may have rated the sessions differently. Session evaluations were anonymous, and we do not know whether specific attendees rated all sessions highly, thereby resulting in some degree of clustering. Third, this study did not compare the effectiveness of the RIP conference with other peer‐mentorship models. Finally, our study was uncontrolled. Although it would not be possible to restrict specific faculty from presenting at or attending the RIP conference, we intend to more carefully collect attendance data to see whether there might be a dose‐response effect with respect to participation in this conference and academic success.
In conclusion, our RIP conference was perceived as valuable by our group and was associated with academic success. In our division, the RIP conference serves as a way to operationalize peer mentoring. Our findings may help other groups to refine either the focus or format of their RIP sessions and those wishing to initiate such a conference.
- ,,, et al.Junior faculty members' mentoring relationships and their professional development in US medical schools.Acad Med.1998;73:318–323.
- ,.Mentors, Advisors and Role Models in Graduate and Professional Education.Washington, DC:Association of Academic Health Centers;1996.
- ,.Characteristics of the successful researcher and implications for faculty development.J Med Educ.1986;61:22–31.
- ,,.Curriculum Development for Medical Education: A Six‐Step Approach.2nd ed.Baltimore, MD:The Johns Hopkins University Press;2009.
- ,,, et al.Characteristics of hospitalists and hospitalist programs in the United States and Canada.J Clin Outcomes Meas.2009;16:69–74
- ,,, et al.Procedures performed by hospitalist and non‐hospitalist general internists.J Gen Intern Med.2010;25:448–452.
- ,,, et al.Intravenous immunoglobulin for the treatment of severe Clostridium difficile colitis: an observational study and review of the literature [review].J Hosp Med.2010;5:E1–E9.
- ,,, et al.Active bed management by hospitalists and emergency department throughput.Ann Intern Med.2008;149:804–811.
- ,,, et al.Transitioning to breast cancer survivorship: perspectives of patients, cancer specialists, and primary care providers.J Gen Intern Med.2009;24(Suppl 2):S459–S466.
- ,,, et al.Utilizing audit and feedback to improve hospitalists' performance in tobacco dependence counseling.Nicotine Tob Res.2010;12:797–800.
- ,,, et al.An internal medicine interest group research program can improve scholarly productivity of medical students and foster mentoring relationships with internists.Teach Learn Med.2008;20:163–167.
- ,,, et al.Peer‐mentored research development meeting: a model for successful peer mentoring among junior level researchers.Acad Psychiatry.2008;32:493–497.
- ,,, et al.Mentoring junior faculty in geriatric oncology: report from the cancer and aging research group.J Clin Oncol.2008;26:3125–3127.
- ,,the Canadian Critical Care Trials Group.Investigator‐led clinical research consortia: the Canadian Critical Care Trials Group.Crit Care Med.2009;37(1):S165–S172.
- .“Short stops”: peer support of scholarly activity.Acad Med.2002;77:939.
- ,,,,,,.Mentorship in academic general internal medicine. Results of a survey of mentors.J Gen Intern Med.2005;20:1014–1018.
- ,,, et al.Making the most of mentors: a guide for mentees.Acad Med.2009;84:140–144.
- ,,.Mentoring in academic medicine: a systematic review.JAMA.2006;296:1103–1115.
- ,,, et al.Assessing the role of influential mentors in the research development of primary care fellows.Acad Med.2004;79:865–872.
- ,,.Peer group mentoring of junior faculty.Acad Psychiatry.2008;32:230–235.
- ,,,.Facilitated peer mentorship: a pilot program for academic advancement of female medical faculty.J Womens Health.2008;17:1009–1015.
- ,Mentoring faculty in academic medicine. A new paradigm?J Gen Intern Med.2005;20:866–870.
Copyright © 2011 Society of Hospital Medicine
Hospitalist Physician Leadership Skills
Physicians assume myriad leadership roles within medical institutions. Clinically‐oriented leadership roles can range from managing a small group of providers, to leading entire health systems, to heading up national quality improvement initiatives. While often competent in the practice of medicine, many physicians have not pursued structured management or administrative training. In a survey of Medicine Department Chairs at academic medical centers, none had advanced management degrees despite spending an average of 55% of their time on administrative duties. It is not uncommon for physicians to attend leadership development programs or management seminars, as evidenced by the increasing demand for education.1 Various methods for skill enhancement have been described24; however, the most effective approaches have yet to be determined.
Miller and Dollard5 and Bandura6, 7 have explained that behavioral contracts have evolved from social cognitive theory principles. These contracts are formal written agreements, often negotiated between 2 individuals, to facilitate behavior change. Typically, they involve a clear definition of expected behaviors with specific consequences (usually positive reinforcement).810 Their use in modifying physician behavior, particularly those related to leadership, has not been studied.
Hospitalist physicians represent the fastest growing specialty in the United States.11, 12 Among other responsibilities, they have taken on roles as leaders in hospital administration, education, quality improvement, and public health.1315 The Society of Hospital Medicine (SHM), the largest US organization committed to the practice of hospital medicine,16 has established Leadership Academies to prepare hospitalists for these duties. The goal of this study was to assess how hospitalist physicians' commitment to grow as leaders was expressed using behavioral contacts as a vehicle to clarify their intentions and whether behavioral change occurred over time.
Methods
Study Design
A qualitative study design was selected to explore how current and future hospitalist leaders planned to modify their behaviors after participating in a hospitalist leadership training course. Participants were encouraged to complete a behavioral contract highlighting their personal goals.
Approximately 12 months later, follow‐up data were collected. Participants were sent copies of their behavioral contracts and surveyed about the extent to which they have realized their personal goals.
Subjects
Hospitalist leaders participating in the 4‐day level I or II leadership courses of the SHM Leadership Academy were studied.
Data Collection
In the final sessions of the 2007‐2008 Leadership Academy courses, participants completed an optional behavioral contract exercise in which they partnered with a colleague and were asked to identify 4 action plans they intended to implement upon their return home. These were written down and signed. Selected demographic information was also collected.
Follow‐up surveys were sent by mail and electronically to a subset of participants with completed behavioral contracts. A 5‐point Likert scale (strongly agree . . . strongly disagree) was used to assess the extent of adherence to the goals listed in the behavioral contracts.
Data Analysis
Transcripts were analyzed using an editing organizing style, a qualitative analysis technique to find meaningful units or segments of text that both stand on their own and relate to the purpose of the study.12 With this method, the coding template emerges from the data. Two investigators independently analyzed the transcripts and created a coding template based on common themes identified among the participants. In cases of discrepant coding, the 2 investigators had discussions to reach consensus. The authors agreed on representative quotes for each theme. Triangulation was established through sharing results of the analysis with a subset of participants.
Follow‐up survey data was summarized descriptively showing proportion data.
Results
Response Rate and Participant Demographics
Out of 264 people who completed the course, 120 decided to participate in the optional behavioral contract exercise. The median age of participants was 38 years (Table 1). The majority were male (84; 70.0%), and hospitalist leaders (76; 63.3%). The median time in practice as a hospitalist was 4 years. Fewer than one‐half held an academic appointment (40; 33.3%) with most being at the rank of Assistant Professor (14; 11.7%). Most of the participants worked in a private hospital (80; 66.7%).
| Characteristic | |
|---|---|
| |
| Age in years [median (SD)] | 38 (8) |
| Male [n (%)] | 84 (70.0) |
| Years in practice as hospitalist [median (SD)] | 4 (13) |
| Leader of hospitalist program [n (%)] | 76 (63.3) |
| Academic affiliation [n (%)] | 40 (33.3) |
| Academic rank [n (%)] | |
| Instructor | 9 (7.5) |
| Assistant professor | 14 (11.7) |
| Associate professor | 13 (10.8) |
| Hospital type [n (%)] | |
| Private | 80 (66.7) |
| University | 15 (12.5) |
| Government | 2 (1.7) |
| Veterans administration | 0 (0.0) |
| Other | 1 (0.1) |
Results of Qualitative Analysis of Behavioral Contracts
From the analyses of the behavioral contracts, themes emerged related to ways in which participants hoped to develop and improve. The themes and the frequencies with which they were recorded in the behavioral contracts are shown in Table 2.
| Theme | Total Number of Times Theme Mentioned in All Behavioral Contracts | Number of Respondents Referring to Theme [n (%)] |
|---|---|---|
| ||
| Improving communication and interpersonal skills | 132 | 70 (58.3) |
| Refinement of vision, goals, and strategic planning | 115 | 62 (51.7) |
| Improve intrapersonal development | 65 | 36 (30.0) |
| Enhance negotiation skills | 65 | 44 (36.7) |
| Commit to organizational change | 53 | 32 (26.7) |
| Understanding business drivers | 38 | 28 (23.3) |
| Setting performance and clinical metrics | 34 | 26 (21.7) |
| Strengthen interdepartmental relations | 32 | 26 (21.7) |
Improving Communication and Interpersonal Skills
A desire to improve communication and listening skills, particularly in the context of conflict resolution, was mentioned repeatedly. Heightened awareness about different personality types to allow for improved interpersonal relationships was another concept that was emphasized.
One female Instructor from an academic medical center described her intentions:
I will try to do a better job at assessing the behavioral tendencies of my partners and adjust my own style for more effective communication.
Refinement of Vision, Goals, and Strategic Planning
Physicians were committed to returning to their home institutions and embarking on initiatives to advance vision and goals of their groups within the context of strategic planning. Participants were interested in creating hospitalist‐specific mission statements, developing specific goals that take advantage of strengths and opportunities while minimizing internal weaknesses and considering external threats. They described wanting to align the interests of members of their hospitalist groups around a common goal.
A female hospitalist leader in private practice wished to:
Clearly define a group vision and commit to re‐evaluation on a regular basis to ensure we are on track . . . and conduct a SWOT (Strengths, Weaknesses, Opportunities, Threats) analysis to set future goals.
Improve Intrapersonal Development
Participants expressed desire to improve their leadership skills. Proposed goals included: (1) recognizing their weaknesses and soliciting feedback from colleagues, (2) minimizing emotional response to stress, (3) sharing their knowledge and skills for the benefit of peers, (4) delegating work more effectively to others, (5) reading suggested books on leadership, (6) serving as a positive role model and mentor, and (7) managing meetings and difficult coworkers more skillfully.
One female Assistant Professor from an academic medical center outlined:
I want to be able to: (1) manage up better and effectively negotiate with the administration on behalf of my group; (2) become better at leadership skills by using the tools offered at the Academy; and (3) effectively support my group members to develop their skills to become successful in their chosen niches. I will . . . improve the poor morale in my group.
Enhance Negotiation Skills
Many physician leaders identified negotiation principles and techniques as foundations for improvement for interactions within their own groups, as well as with the hospital administration.
A male private hospitalist leader working for 4 years as a hospitalist described plans to utilize negotiation skills within and outside the group:
Negotiate with my team of hospitalists to make them more compliant with the rules and regulations of the group, and negotiate an excellent contract with hospital administration. . . .
Commit to Organizational Change
The hospitalist respondents described their ability to influence organizational change given their unique position at the interface between patient care delivery and hospital administration. To realize organizational change, commonly cited ideas included recruitment and retention of clinically excellent practitioners, and developing standard protocols to facilitate quality improvement initiatives.
A male Instructor of Medicine listed select areas in which to become more involved:
Participation with the Chief Executive Officer of the company in quality improvement projects, calls to the primary care practitioners upon discharge, and the handoff process.
Other Themes
The final 3 themes included are: understanding business drivers; the establishment of better metrics to assess performance; and the strengthening of interdepartmental relations.
Follow‐up Data About Adherence to Plans Delineated in Behavioral Contracts
Out of 65 completed behavioral contracts from the 2007 Level I participants, 32 returned a follow‐up survey (response rate 49.3%). Figure 1 shows the extent to which respondents believed that they were compliant with their proposed plans for change or improvement. Degree of adherence was displayed as a proportion of total goals. Out of those who returned a follow‐up survey, all but 1 respondent either strongly agreed or agreed that they adhered to at least one of their goals (96.9%).

Select representative comments that illustrate the physicians' appreciation of using behavioral contracts include:
my approach to problems is a bit more analytical.
simple changes in how I approach people and interact with them has greatly improved my skills as a leader and allowed me to accomplish my goals with much less effort.
Discussion
Through the qualitative analysis of the behavioral contracts completed by participants of a Leadership Academy for hospitalists, we characterized the ways that hospitalist practitioners hoped to evolve as leaders. The major themes that emerged relate not only to their own growth and development but also their pledge to advance the success of the group or division. The level of commitment and impact of the behavioral contracts appear to be reinforced by an overwhelmingly positive response to adherence to personal goals one year after course participation. Communication and interpersonal development were most frequently cited in the behavioral contracts as areas for which the hospitalist leaders acknowledged a desire to grow. In a study of academic department of medicine chairs, communication skills were identified as being vital for effective leadership.3 The Chairs also recognized other proficiencies required for leading that were consistent with those outlined in the behavioral contracts: strategic planning, change management, team building, personnel management, and systems thinking. McDade et al.17 examined the effects of participation in an executive leadership program developed for female academic faculty in medical and dental schools in the United States and Canada. They noted increased self‐assessed leadership capabilities at 18 months after attending the program, across 10 leadership constructs taught in the classes. These leadership constructs resonate with the themes found in the plans for change described by our informants.
Hospitalists are assuming leadership roles in an increasing number and with greater scope; however, until now their perspectives on what skill sets are required to be successful have not been well documented. Significant time, effort, and money are invested into the development of hospitalists as leaders.4 The behavioral contract appears to be a tool acceptable to hospitalist physicians; perhaps it can be used as part annual reviews with hospitalists aspiring to be leaders.
Several limitations of the study shall be considered. First, not all participants attending the Leadership Academy opted to fill out the behavioral contracts. Second, this qualitative study is limited to those practitioners who are genuinely interested in growing as leaders as evidenced by their willingness to invest in going to the course. Third, follow‐up surveys relied on self‐assessment and it is not known whether actual realization of these goals occurred or the extent to which behavioral contracts were responsible. Further, follow‐up data were only completed by 49% percent of those targeted. However, hospitalists may be fairly resistant to being surveyed as evidenced by the fact that SHM's 2005‐2006 membership survey yielded a response rate of only 26%.18 Finally, many of the thematic goals were described by fewer than 50% of informants. However, it is important to note that the elements included on each person's behavioral contract emerged spontaneously. If subjects were specifically asked about each theme, the number of comments related to each would certainly be much higher. Qualitative analysis does not really allow us to know whether one theme is more important than another merely because it was mentioned more frequently.
Hospitalist leaders appear to be committed to professional growth and they have reported realization of goals delineated in their behavioral contracts. While varied methods are being used as part of physician leadership training programs, behavioral contracts may enhance promise for change.
Acknowledgements
The authors thank Regina Hess for assistance in data preparation and Laurence Wellikson, MD, FHM, Russell Holman, MD and Erica Pearson (all from the SHM) for data collection.
Physicians assume myriad leadership roles within medical institutions. Clinically‐oriented leadership roles can range from managing a small group of providers, to leading entire health systems, to heading up national quality improvement initiatives. While often competent in the practice of medicine, many physicians have not pursued structured management or administrative training. In a survey of Medicine Department Chairs at academic medical centers, none had advanced management degrees despite spending an average of 55% of their time on administrative duties. It is not uncommon for physicians to attend leadership development programs or management seminars, as evidenced by the increasing demand for education.1 Various methods for skill enhancement have been described24; however, the most effective approaches have yet to be determined.
Miller and Dollard5 and Bandura6, 7 have explained that behavioral contracts have evolved from social cognitive theory principles. These contracts are formal written agreements, often negotiated between 2 individuals, to facilitate behavior change. Typically, they involve a clear definition of expected behaviors with specific consequences (usually positive reinforcement).810 Their use in modifying physician behavior, particularly those related to leadership, has not been studied.
Hospitalist physicians represent the fastest growing specialty in the United States.11, 12 Among other responsibilities, they have taken on roles as leaders in hospital administration, education, quality improvement, and public health.1315 The Society of Hospital Medicine (SHM), the largest US organization committed to the practice of hospital medicine,16 has established Leadership Academies to prepare hospitalists for these duties. The goal of this study was to assess how hospitalist physicians' commitment to grow as leaders was expressed using behavioral contacts as a vehicle to clarify their intentions and whether behavioral change occurred over time.
Methods
Study Design
A qualitative study design was selected to explore how current and future hospitalist leaders planned to modify their behaviors after participating in a hospitalist leadership training course. Participants were encouraged to complete a behavioral contract highlighting their personal goals.
Approximately 12 months later, follow‐up data were collected. Participants were sent copies of their behavioral contracts and surveyed about the extent to which they have realized their personal goals.
Subjects
Hospitalist leaders participating in the 4‐day level I or II leadership courses of the SHM Leadership Academy were studied.
Data Collection
In the final sessions of the 2007‐2008 Leadership Academy courses, participants completed an optional behavioral contract exercise in which they partnered with a colleague and were asked to identify 4 action plans they intended to implement upon their return home. These were written down and signed. Selected demographic information was also collected.
Follow‐up surveys were sent by mail and electronically to a subset of participants with completed behavioral contracts. A 5‐point Likert scale (strongly agree . . . strongly disagree) was used to assess the extent of adherence to the goals listed in the behavioral contracts.
Data Analysis
Transcripts were analyzed using an editing organizing style, a qualitative analysis technique to find meaningful units or segments of text that both stand on their own and relate to the purpose of the study.12 With this method, the coding template emerges from the data. Two investigators independently analyzed the transcripts and created a coding template based on common themes identified among the participants. In cases of discrepant coding, the 2 investigators had discussions to reach consensus. The authors agreed on representative quotes for each theme. Triangulation was established through sharing results of the analysis with a subset of participants.
Follow‐up survey data was summarized descriptively showing proportion data.
Results
Response Rate and Participant Demographics
Out of 264 people who completed the course, 120 decided to participate in the optional behavioral contract exercise. The median age of participants was 38 years (Table 1). The majority were male (84; 70.0%), and hospitalist leaders (76; 63.3%). The median time in practice as a hospitalist was 4 years. Fewer than one‐half held an academic appointment (40; 33.3%) with most being at the rank of Assistant Professor (14; 11.7%). Most of the participants worked in a private hospital (80; 66.7%).
| Characteristic | |
|---|---|
| |
| Age in years [median (SD)] | 38 (8) |
| Male [n (%)] | 84 (70.0) |
| Years in practice as hospitalist [median (SD)] | 4 (13) |
| Leader of hospitalist program [n (%)] | 76 (63.3) |
| Academic affiliation [n (%)] | 40 (33.3) |
| Academic rank [n (%)] | |
| Instructor | 9 (7.5) |
| Assistant professor | 14 (11.7) |
| Associate professor | 13 (10.8) |
| Hospital type [n (%)] | |
| Private | 80 (66.7) |
| University | 15 (12.5) |
| Government | 2 (1.7) |
| Veterans administration | 0 (0.0) |
| Other | 1 (0.1) |
Results of Qualitative Analysis of Behavioral Contracts
From the analyses of the behavioral contracts, themes emerged related to ways in which participants hoped to develop and improve. The themes and the frequencies with which they were recorded in the behavioral contracts are shown in Table 2.
| Theme | Total Number of Times Theme Mentioned in All Behavioral Contracts | Number of Respondents Referring to Theme [n (%)] |
|---|---|---|
| ||
| Improving communication and interpersonal skills | 132 | 70 (58.3) |
| Refinement of vision, goals, and strategic planning | 115 | 62 (51.7) |
| Improve intrapersonal development | 65 | 36 (30.0) |
| Enhance negotiation skills | 65 | 44 (36.7) |
| Commit to organizational change | 53 | 32 (26.7) |
| Understanding business drivers | 38 | 28 (23.3) |
| Setting performance and clinical metrics | 34 | 26 (21.7) |
| Strengthen interdepartmental relations | 32 | 26 (21.7) |
Improving Communication and Interpersonal Skills
A desire to improve communication and listening skills, particularly in the context of conflict resolution, was mentioned repeatedly. Heightened awareness about different personality types to allow for improved interpersonal relationships was another concept that was emphasized.
One female Instructor from an academic medical center described her intentions:
I will try to do a better job at assessing the behavioral tendencies of my partners and adjust my own style for more effective communication.
Refinement of Vision, Goals, and Strategic Planning
Physicians were committed to returning to their home institutions and embarking on initiatives to advance vision and goals of their groups within the context of strategic planning. Participants were interested in creating hospitalist‐specific mission statements, developing specific goals that take advantage of strengths and opportunities while minimizing internal weaknesses and considering external threats. They described wanting to align the interests of members of their hospitalist groups around a common goal.
A female hospitalist leader in private practice wished to:
Clearly define a group vision and commit to re‐evaluation on a regular basis to ensure we are on track . . . and conduct a SWOT (Strengths, Weaknesses, Opportunities, Threats) analysis to set future goals.
Improve Intrapersonal Development
Participants expressed desire to improve their leadership skills. Proposed goals included: (1) recognizing their weaknesses and soliciting feedback from colleagues, (2) minimizing emotional response to stress, (3) sharing their knowledge and skills for the benefit of peers, (4) delegating work more effectively to others, (5) reading suggested books on leadership, (6) serving as a positive role model and mentor, and (7) managing meetings and difficult coworkers more skillfully.
One female Assistant Professor from an academic medical center outlined:
I want to be able to: (1) manage up better and effectively negotiate with the administration on behalf of my group; (2) become better at leadership skills by using the tools offered at the Academy; and (3) effectively support my group members to develop their skills to become successful in their chosen niches. I will . . . improve the poor morale in my group.
Enhance Negotiation Skills
Many physician leaders identified negotiation principles and techniques as foundations for improvement for interactions within their own groups, as well as with the hospital administration.
A male private hospitalist leader working for 4 years as a hospitalist described plans to utilize negotiation skills within and outside the group:
Negotiate with my team of hospitalists to make them more compliant with the rules and regulations of the group, and negotiate an excellent contract with hospital administration. . . .
Commit to Organizational Change
The hospitalist respondents described their ability to influence organizational change given their unique position at the interface between patient care delivery and hospital administration. To realize organizational change, commonly cited ideas included recruitment and retention of clinically excellent practitioners, and developing standard protocols to facilitate quality improvement initiatives.
A male Instructor of Medicine listed select areas in which to become more involved:
Participation with the Chief Executive Officer of the company in quality improvement projects, calls to the primary care practitioners upon discharge, and the handoff process.
Other Themes
The final 3 themes included are: understanding business drivers; the establishment of better metrics to assess performance; and the strengthening of interdepartmental relations.
Follow‐up Data About Adherence to Plans Delineated in Behavioral Contracts
Out of 65 completed behavioral contracts from the 2007 Level I participants, 32 returned a follow‐up survey (response rate 49.3%). Figure 1 shows the extent to which respondents believed that they were compliant with their proposed plans for change or improvement. Degree of adherence was displayed as a proportion of total goals. Out of those who returned a follow‐up survey, all but 1 respondent either strongly agreed or agreed that they adhered to at least one of their goals (96.9%).
Select representative comments that illustrate the physicians' appreciation of using behavioral contracts include:
my approach to problems is a bit more analytical.
simple changes in how I approach people and interact with them has greatly improved my skills as a leader and allowed me to accomplish my goals with much less effort.
Discussion
Through the qualitative analysis of the behavioral contracts completed by participants of a Leadership Academy for hospitalists, we characterized the ways that hospitalist practitioners hoped to evolve as leaders. The major themes that emerged relate not only to their own growth and development but also their pledge to advance the success of the group or division. The level of commitment and impact of the behavioral contracts appear to be reinforced by an overwhelmingly positive response to adherence to personal goals one year after course participation. Communication and interpersonal development were most frequently cited in the behavioral contracts as areas for which the hospitalist leaders acknowledged a desire to grow. In a study of academic department of medicine chairs, communication skills were identified as being vital for effective leadership.3 The Chairs also recognized other proficiencies required for leading that were consistent with those outlined in the behavioral contracts: strategic planning, change management, team building, personnel management, and systems thinking. McDade et al.17 examined the effects of participation in an executive leadership program developed for female academic faculty in medical and dental schools in the United States and Canada. They noted increased self‐assessed leadership capabilities at 18 months after attending the program, across 10 leadership constructs taught in the classes. These leadership constructs resonate with the themes found in the plans for change described by our informants.
Hospitalists are assuming leadership roles in an increasing number and with greater scope; however, until now their perspectives on what skill sets are required to be successful have not been well documented. Significant time, effort, and money are invested into the development of hospitalists as leaders.4 The behavioral contract appears to be a tool acceptable to hospitalist physicians; perhaps it can be used as part annual reviews with hospitalists aspiring to be leaders.
Several limitations of the study shall be considered. First, not all participants attending the Leadership Academy opted to fill out the behavioral contracts. Second, this qualitative study is limited to those practitioners who are genuinely interested in growing as leaders as evidenced by their willingness to invest in going to the course. Third, follow‐up surveys relied on self‐assessment and it is not known whether actual realization of these goals occurred or the extent to which behavioral contracts were responsible. Further, follow‐up data were only completed by 49% percent of those targeted. However, hospitalists may be fairly resistant to being surveyed as evidenced by the fact that SHM's 2005‐2006 membership survey yielded a response rate of only 26%.18 Finally, many of the thematic goals were described by fewer than 50% of informants. However, it is important to note that the elements included on each person's behavioral contract emerged spontaneously. If subjects were specifically asked about each theme, the number of comments related to each would certainly be much higher. Qualitative analysis does not really allow us to know whether one theme is more important than another merely because it was mentioned more frequently.
Hospitalist leaders appear to be committed to professional growth and they have reported realization of goals delineated in their behavioral contracts. While varied methods are being used as part of physician leadership training programs, behavioral contracts may enhance promise for change.
Acknowledgements
The authors thank Regina Hess for assistance in data preparation and Laurence Wellikson, MD, FHM, Russell Holman, MD and Erica Pearson (all from the SHM) for data collection.
Copyright © 2010 Society of Hospital Medicine