User login
Underserved populations and colorectal cancer screening: Patient perceptions of barriers to care and effective interventions
Editor's Note:
Importantly, these barriers often vary between specific population subsets. In this month’s In Focus article, brought to you by The New Gastroenterologist, the members of the AGA Institute Diversity Committee provide an enlightening overview of the barriers affecting underserved populations as well as strategies that can be employed to overcome these impediments. Better understanding of patient-specific barriers will, I hope, allow us to more effectively redress them and ultimately increase colorectal cancer screening rates in all populations.
Bryson W. Katona, MD, PhD
Editor in Chief, The New Gastroenterologist
Despite the positive public health effects of colorectal cancer (CRC) screening, there remains differential uptake of CRC screening in the United States. Minority populations born in the United States and immigrant populations are among those with the lowest rates of CRC screening, and both socioeconomic status and ethnicity are strongly associated with stage of CRC at diagnosis.1,2 Thus, recognizing the economic, social, and cultural factors that result in low rates of CRC screening in underserved populations is important in order to devise targeted interventions to increase CRC uptake and reduce morbidity and mortality in these populations.

What are the facts and figures?
The overall rate of screening colonoscopies has increased in all ethnic groups in the past 10 years but still falls below the goal of 71% established by the Healthy People project (www.healthypeople.gov) for the year 2020.3 According to the Centers for Disease Control and Prevention ethnicity-specific data for U.S.-born populations, 60% of whites, 55% of African Americans (AA), 50% of American Indian/Alaskan natives (AI/AN), 46% of Latino Americans, and 47% of Asians undergo CRC screening (Figure 1A).4 While CRC incidence in non-Hispanic whites age 50 years and older has dropped by 32% since 2000 because of screening, this trend has not been observed in AAs.5,6
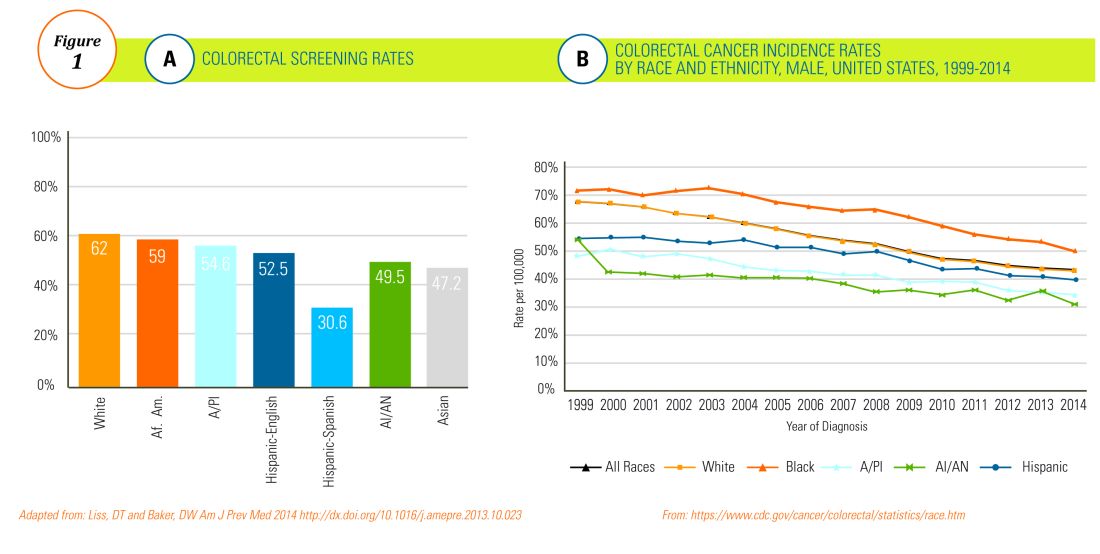
The incidence of CRC in AAs is estimated at 49/10,000, one of the highest amongst U.S. populations and is the second and third most common cancer in AA women and men, respectively (Figure 1B).
Similar to AAs, AI/AN patients present with more advanced CRC disease and at younger ages and have lower survival rates, compared with other racial groups, a trend that has not changed in the last decade.7 CRC screening data in this population vary according to sex, geographic location, and health care utilization, with as few as 4.0% of asymptomatic, average-risk AI/ANs who receive medical care in the Indian Health Services being screened for CRC.8
The low rate of CRC screening among Latinos also poses a significant obstacle to the Healthy People project since it is expected that by 2060 Latinos will constitute 30% of the U.S. population. Therefore, strategies to improve CRC screening in this population are needed to continue the gains made in overall CRC mortality rates.
The percentage of immigrants in the U.S. population increased from 4.7% in 1970 to 13.5% in 2015. Immigrants, regardless of their ethnicity, represent a very vulnerable population, and CRC screening data in this population are not as robust as for U.S.-born groups. In general, immigrants have substantially lower CRC screening rates, compared with U.S.-born populations (21% vs. 60%),9 and it is suspected that additional, significant barriers to CRC screening and care exist for undocumented immigrants.

Another often overlooked group, are individuals with physical or cognitive disabilities. In this group, screening rates range from 49% to 65%.10
Finally, while information is available for many health care conditions and disparities faced by various ethnic groups, there are few CRC screening data for the LGBTQ community. Perhaps amplifying this problem is the existence of conflicting data in this population, with some studies suggesting there is no difference in CRC risk across groups in the LGBTQ community and others suggesting an increased risk.11,12 Notably, sexual orientation has been identified as a positive predictor of CRC screening in gay and bisexual men – CRC screening rates are higher in these groups, compared with heterosexual men.13 In contrast, no such difference has been found between homosexual and heterosexual women.14

What are the barriers?
Several common themes contribute to disparities in CRC screening among minority groups, including psychosocial/cultural, socioeconomic, provider-specific, and insurance-related factors. Some patient-related barriers include issues of illiteracy, having poor health literacy or English proficiency, having only grade school education,15,16 cultural misconceptions, transportation issues, difficulties affording copayments or deductibles, and a lack of follow-up for scheduled appointments and exams.17-20 Poor health literacy has a profound effect on exam perceptions, fear of test results, and compliance with scheduling tests and bowel preparation instructions21-25; it also affects one’s understanding of the importance of CRC screening, the recommended screening age, and the available choice of screening tests.

Even when some apparent barriers are mitigated, disparities in CRC screening remain. For example, even among the insured and among Medicare beneficiaries, screening rates and adequate follow-up rates after abnormal findings remain lower among AAs and those of low socioeconomic status than they are among whites.26-28 At least part of this paradox results from the presence of unmeasured cultural/belief systems that affect CRC screening uptake. Some of these factors include fear and/or denial of CRC diagnoses, mistrust of the health care system, and reluctance to undergo medical treatment and surgery.16,29 AAs are also less likely to be aware of a family history of CRC and to discuss personal and/or family history of CRC or polyps, which can thereby hinder the identification of high-risk individuals who would benefit from early screening.15,30
The deeply rooted sense of fatalism also plays a crucial role and has been cited for many minority and immigrant populations. Fatalism leads patients to view a diagnosis of cancer as a matter of “fate” or “God’s will,” and therefore, it is to be endured.23,31 Similarly, in a qualitative study of 44 Somali men living in St. Paul and Minneapolis, believing cancer was more common in whites, believing they were protected from cancer by God, fearing a cancer diagnosis, and fearing ostracism from their community were reported as barriers to cancer screening.32
Perceptions about CRC screening methods in Latino populations also have a tremendous influence and can include fear, stigma of sexual prejudice, embarrassment of being exposed during the exam, worries about humiliation in a male sense of masculinity, a lack of trust in the medical professionals, a sense of being a “guinea pig” for physicians, concerns about health care racism, and expectations of pain.33-37 Studies have reported that immigrants are afraid to seek health care because of the increasingly hostile environment associated with immigration enforcement.38 In addition, the impending dissolution of the Deferred Action for Childhood Arrivals act is likely to augment the barriers to care for Latino groups.39
In addition, provider-specific barriers to care also exist. Racial and ethnic minorities are less likely than whites to receive recommendations for screening by their physician. In fact, this factor alone has been demonstrated to be the main reason for lack of screening among AAs in a Californian cohort.40 In addition, patients from rural areas or those from AI/AN communities are at especially increased risk for lack of access to care because of a scarcity of providers along with patient perceptions regarding their primary care provider’s ability to connect them to subspecialists.41-43 Other cited examples include misconceptions about and poor treatment of the LGBTQ population by health care providers/systems.44
How can we intervene successfully?
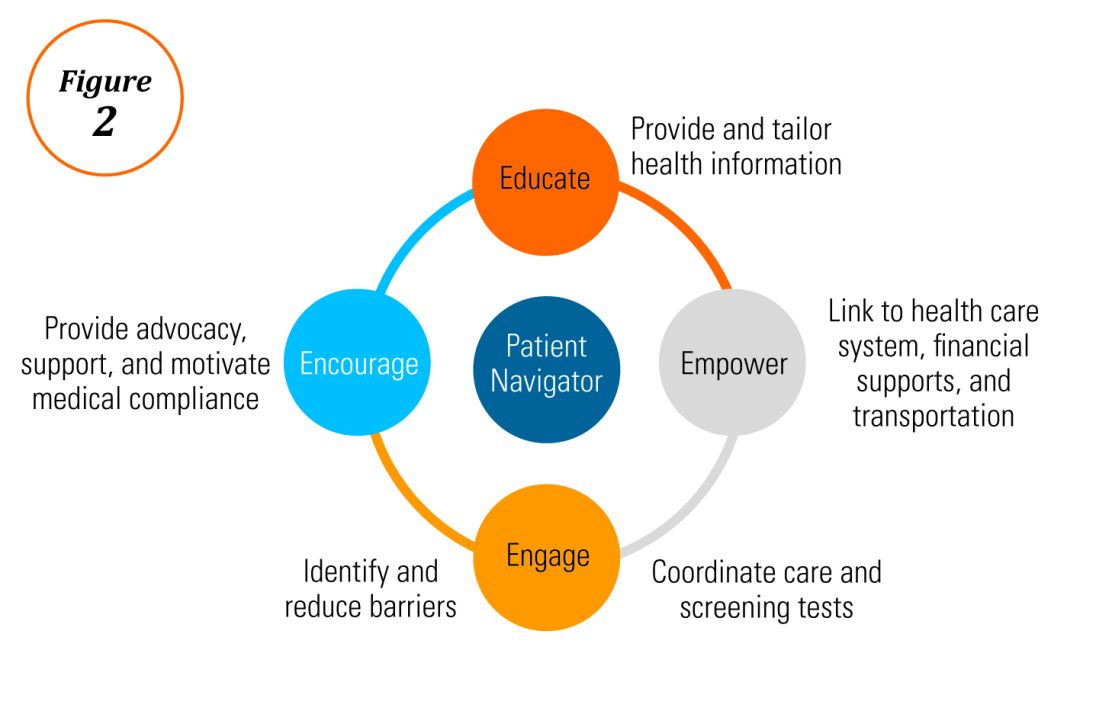
Characterization of barriers is important because it promotes the development of targeted interventions. Intervention models include community engagement programs, incorporation of fecal occult testing, and patient navigator programs.45-47 In response to the alarming disparity in CRC screening rates in Latino communities, several interventions have been set in motion in different clinical scenarios, which include patient navigation and a focus on patient education.

Randomized trials have shown that outreach efforts and patient navigation increase CRC screening rates in AAs.48,54,55 Studies evaluating the effects of print-based educational materials on improving screening showed improvement in screening rates, decreases in cancer-related fatalistic attitudes, and patients had a better understanding of the benefits of screening as compared with the cost associated with screening and the cost of advanced disease.56 Similarly, the use of touch-screen computers that tailor informational messages to decisional stage and screening barriers increased participation in CRC screening.57 Including patient navigators along with printed education material was even more effective at increasing the proportion of patients getting colonoscopy screening than providing printed material alone, with more-intensive navigation needed for individuals with low literacy.58 Grubbs et al.reported the success of their patient navigation program, which included wider comprehensive screening and coverage for colonoscopy screening.59 In AAs, they estimated an annual reduction of CRC incidence and mortality of 4,200 and 2,700 patients, respectively.
Among immigrants, there is an increased likelihood of CRC screening in those immigrants with a higher number of primary care visits.60 The intersection of culture, race, socioeconomic status, housing enclaves, limited English proficiency, low health literacy, and immigration policy all play a role in immigrant health and access to health care.61

Therefore, different strategies may be needed for each immigrant group to improve CRC screening. For this group of patients, efforts aimed at mitigating the adverse effects of national immigration policies on immigrant populations may have the additional consequence of improving health care access and CRC screening for these patients.
Data gaps still exist in our understanding of patient perceptions, perspectives, and barriers that present opportunities for further study to develop long-lasting interventions that will improve health care of underserved populations. By raising awareness of the barriers, physicians can enhance their own self-awareness to keenly be attuned to these challenges as patients cross their clinic threshold for medical care.
Additional resources link: www.cdc.gov/cancer/colorectal/
References
1. Klabunde CN et al. Trends in colorectal cancer test use among vulnerable populations in the United States. Cancer Epidemiol Biomarkers Prev. 2011 Aug;20(8):1611-21.
2. Parikh-Patel A et al. Colorectal cancer stage at diagnosis by socioeconomic and urban/rural status in California, 1988-2000. Cancer. 2006 Sep;107(5 Suppl):1189-95.
3. Promotion OoDPaH. Healthy People 2020. Cancer. Volume 2017.
4. Centers for Disease Control and Prevention. Cancer screening – United States, 2010. MMWR Morb Mortal Wkly Rep. 2012 Jan 27;61(3):41-5.
5. Doubeni CA et al. Racial and ethnic trends of colorectal cancer screening among Medicare enrollees. Am J Prev Med. 2010 Feb;38(2):184-91.
6. Kupfer SS et al. Reducing colorectal cancer risk among African Americans. Gastroenterology. 2015 Nov;149(6):1302-4.
7. Espey DK et al. Annual report to the nation on the status of cancer, 1975-2004, featuring cancer in American Indians and Alaska Natives. Cancer. 2007 Nov;110(10):2119-52.
8. Day LW et al. Screening prevalence and incidence of colorectal cancer among American Indian/Alaskan natives in the Indian Health Service. Dig Dis Sci. 2011 Jul;56(7):2104-13.
9. Gupta S et al. Challenges and possible solutions to colorectal cancer screening for the underserved. J Natl Cancer Inst. 2014 Apr;106(4):dju032.
10. Steele CB et al. Colorectal cancer incidence and screening – United States, 2008 and 2010. MMWR Suppl. 2013 Nov 22;62(3):53-60.
11. Boehmer U et al. Cancer survivorship and sexual orientation. Cancer 2011 Aug 15;117(16):3796-804.
12. Austin SB, Pazaris MJ, Wei EK, et al. Application of the Rosner-Wei risk-prediction model to estimate sexual orientation patterns in colon cancer risk in a prospective cohort of US women. Cancer Causes Control. 2014 Aug;25(8):999-1006.
13. Heslin KC et al. Sexual orientation and testing for prostate and colorectal cancers among men in California. Med Care. 2008 Dec;46(12):1240-8.
14. McElroy JA et al. Advancing Health Care for Lesbian, Gay, Bisexual, and Transgender Patients in Missouri. Mo Med. 2015 Jul-Aug;112(4):262-5.
15. Greiner KA et al. Knowledge and perceptions of colorectal cancer screening among urban African Americans. J Gen Intern Med. 2005 Nov;20(11):977-83.
16. Green PM, Kelly BA. Colorectal cancer knowledge, perceptions, and behaviors in African Americans. Cancer Nurs. 2004 May-Jun;27(3):206-15; quiz 216-7.
17. Berkowitz Z et al. Beliefs, risk perceptions, and gaps in knowledge as barriers to colorectal cancer screening in older adults. J Am Geriatr Soc. 2008 Feb;56(2):307-14.
18. Dolan NC et al. Colorectal cancer screening knowledge, attitudes, and beliefs among veterans: Does literacy make a difference? J Clin Oncol. 2004 Jul;22(13):2617-22.
19. Peterson NB et al. The influence of health literacy on colorectal cancer screening knowledge, beliefs and behavior. J Natl Med Assoc. 2007 Oct;99(10):1105-12.
20. Haddock MG et al. Intraoperative irradiation for locally recurrent colorectal cancer in previously irradiated patients. Int J Radiat Oncol Biol Phys. 2001 Apr 1;49(5):1267-74.
21. Jones RM et al. Patient-reported barriers to colorectal cancer screening: a mixed-methods analysis. Am J Prev Med. 2010 May;38(5):508-16.
22. Basch CH et al. Screening colonoscopy bowel preparation: experience in an urban minority population. Therap Adv Gastroenterol. 2013 Nov;6(6):442-6.
23. Davis JL et al. Sociodemographic differences in fears and mistrust contributing to unwillingness to participate in cancer screenings. J Health Care Poor Underserved. 2012 Nov;23(4 Suppl):67-76.
24. Robinson CM et al. Barriers to colorectal cancer screening among publicly insured urban women: no knowledge of tests and no clinician recommendation. J Natl Med Assoc. 2011 Aug;103(8):746-53.
25. Goldman RE et al. Perspectives of colorectal cancer risk and screening among Dominicans and Puerto Ricans: Stigma and misperceptions. Qual Health Res. 2009 Nov;19(11):1559-68.
26. Laiyemo AO et al. Race and colorectal cancer disparities: Health-care utilization vs different cancer susceptibilities. J Natl Cancer Inst. 2010 Apr 21;102(8):538-46.
27. White A et al. Racial disparities and treatment trends in a large cohort of elderly African Americans and Caucasians with colorectal cancer, 1991 to 2002. Cancer. 2008 Dec 15;113(12):3400-9.
28. Doubeni CA et al. Neighborhood socioeconomic status and use of colonoscopy in an insured population – A retrospective cohort study. PLoS One. 2012;7(5):e36392.
29. Tammana VS, Laiyemo AO. Colorectal cancer disparities: Issues, controversies and solutions. World J Gastroenterol. 2014 Jan 28;20(4):869-76.
30. Carethers JM. Screening for colorectal cancer in African Americans: determinants and rationale for an earlier age to commence screening. Dig Dis Sci. 2015 Mar;60(3):711-21.
31. Miranda-Diaz C et al. Barriers for Compliance to Breast, Colorectal, and Cervical Screening Cancer Tests among Hispanic Patients. Int J Environ Res Public Health. 2015 Dec 22;13(1):ijerph13010021.
32. Sewali B et al. Understanding cancer screening service utilization by Somali men in Minnesota. J Immigr Minor Health. 2015 Jun;17(3):773-80.
33. Walsh JM et al. Barriers to colorectal cancer screening in Latino and Vietnamese Americans. Compared with non-Latino white Americans. J Gen Intern Med. 2004 Feb;19(2):156-66.
34. Perez-Stable EJ et al. Self-reported use of cancer screening tests among Latinos and Anglos in a prepaid health plan. Arch Intern Med. 1994 May 23;154(10):1073-81.
35. Shariff-Marco S et al. Racial/ethnic differences in self-reported racism and its association with cancer-related health behaviors. Am J Public Health. 2010 Feb;100(2):364-74.
36. Powe BD et al. Comparing knowledge of colorectal and prostate cancer among African American and Hispanic men. Cancer Nurs. 2009 Sep-Oct;32(5):412-7.
37. Jun J, Oh KM. Asian and Hispanic Americans’ cancer fatalism and colon cancer screening. Am J Health Behav. 2013 Mar;37(2):145-54.
38. Hacker K et al. The impact of Immigration and Customs Enforcement on immigrant health: Perceptions of immigrants in Everett, Massachusetts, USA. Soc Sci Med. 2011 Aug;73(4):586-94.
39. Firger J. Rescinding DACA could spur a public health crisis, from lost services to higher rates of depression, substance abuse. Newsweek.
40. May FP et al. Racial minorities are more likely than whites to report lack of provider recommendation for colon cancer screening. Am J Gastroenterol. 2015 Oct;110(10):1388-94.
41. Levy BT et al. Why hasn’t this patient been screened for colon cancer? An Iowa Research Network study. J Am Board Fam Med. 2007 Sep-Oct;20(5):458-68.
42. Rosenblatt RA. A view from the periphery – health care in rural America. N Engl J Med. 2004 Sep 9;351(11):1049-51.
43. Young WF et al. Predictors of colorectal screening in rural Colorado: testing to prevent colon cancer in the high plains research network. J Rural Health. 2007 Summer;23(3):238-45.
44. Kates J et al. Health and Access to Care and Coverage for Lesbian, Gay, Bisexual, and Transgender (LGBT) Individuals in the U.S. In: Foundation KF, ed. Disparities Policy Issue Brief. Volume 2017; Aug 30, 2017.
45. Katz ML et al. Improving colorectal cancer screening by using community volunteers: results of the Carolinas cancer education and screening (CARES) project. Cancer. 2007 Oct 1;110(7):1602-10.
46. Jean-Jacques M et al. Program to improve colorectal cancer screening in a low-income, racially diverse population: A randomized controlled trial. Ann Fam Med. 2012 Sep-Oct;10(5):412-7.
47. Reuland DS et al. Effect of combined patient decision aid and patient navigation vs usual care for colorectal cancer screening in a vulnerable patient population: A randomized clinical trial. JAMA Intern Med. 2017 Jul 1;177(7):967-74.
48. Percac-Lima S et al. A culturally tailored navigator program for colorectal cancer screening in a community health center: a randomized, controlled trial. J Gen Intern Med. 2009 Feb;24(2):211-7.
49. Nash D et al. Evaluation of an intervention to increase screening colonoscopy in an urban public hospital setting. J Urban Health. 2006 Mar;83(2):231-43.
50. Lebwohl B et al. Effect of a patient navigator program on the volume and quality of colonoscopy. J Clin Gastroenterol. 2011 May-Jun;45(5):e47-53.
51. Khankari K et al. Improving colorectal cancer screening among the medically underserved: A pilot study within a federally qualified health center. J Gen Intern Med. 2007 Oct;22(10):1410-4.
52. Wang JH et al. Recruiting Chinese Americans into cancer screening intervention trials: Strategies and outcomes. Clin Trials. 2014 Apr;11(2):167-77.
53. Katz ML et al. Patient activation increases colorectal cancer screening rates: a randomized trial among low-income minority patients. Cancer Epidemiol Biomarkers Prev. 2012 Jan;21(1):45-52.
54. Ford ME et al. Enhancing adherence among older African American men enrolled in a longitudinal cancer screening trial. Gerontologist. 2006 Aug;46(4):545-50.
55. Christie J et al. A randomized controlled trial using patient navigation to increase colonoscopy screening among low-income minorities. J Natl Med Assoc. 2008 Mar;100(3):278-84.
56. Philip EJ et al. Evaluating the impact of an educational intervention to increase CRC screening rates in the African American community: A preliminary study. Cancer Causes Control. 2010 Oct;21(10):1685-91.
57. Greiner KA et al. Implementation intentions and colorectal screening: A randomized trial in safety-net clinics. Am J Prev Med. 2014 Dec;47(6):703-14.
58. Horne HN et al. Effect of patient navigation on colorectal cancer screening in a community-based randomized controlled trial of urban African American adults. Cancer Causes Control. 2015 Feb;26(2):239-46.
59. Grubbs SS et al. Eliminating racial disparities in colorectal cancer in the real world: It took a village. J Clin Oncol. 2013 Jun 1;31(16):1928-30.
60. Jung MY et al. The Chinese and Korean American immigrant experience: a mixed-methods examination of facilitators and barriers of colorectal cancer screening. Ethn Health. 2017 Feb 25:1-20.
61. Viruell-Fuentes EA et al. More than culture: structural racism, intersectionality theory, and immigrant health. Soc Sci Med. 2012 Dec;75(12):2099-106.
Dr. Oduyebo is a third-year fellow at the Mayo Clinic, Rochester, Minn.; Dr. Malespin is an assistant professor in the department of medicine and the medical director of hepatology at the University of Florida Health, Jacksonville; Dr. Mendoza Ladd is an assistant professor of medicine at Texas Tech University, El Paso; Dr. Day is an associate professor of medicine at the University of California, San Francisco; Dr. Charabaty is an associate professor of medicine and the director of the IBD Center in the division of gastroenterology at Medstar-Georgetown University Center, Washington; Dr. Chen is an associate professor of medicine, the director of patient safety and quality, and the director of the small-bowel endoscopy program in division of gastroenterology at Washington University, St. Louis; Dr. Carr is an assistant professor of medicine in the division of gastroenterology at the University of Pennsylvania, Philadelphia; Dr. Quezada is an assistant dean for admissions, an assistant dean for academic and multicultural affairs, and an assistant professor of medicine in the division of gastroenterology and hepatology at the University of Maryland, Baltimore; and Dr. Lamousé-Smith is a director of translational medicine, immunology, and early development at Janssen Pharmaceuticals Research and Development, Spring House, Penn.
Editor's Note:
Importantly, these barriers often vary between specific population subsets. In this month’s In Focus article, brought to you by The New Gastroenterologist, the members of the AGA Institute Diversity Committee provide an enlightening overview of the barriers affecting underserved populations as well as strategies that can be employed to overcome these impediments. Better understanding of patient-specific barriers will, I hope, allow us to more effectively redress them and ultimately increase colorectal cancer screening rates in all populations.
Bryson W. Katona, MD, PhD
Editor in Chief, The New Gastroenterologist
Despite the positive public health effects of colorectal cancer (CRC) screening, there remains differential uptake of CRC screening in the United States. Minority populations born in the United States and immigrant populations are among those with the lowest rates of CRC screening, and both socioeconomic status and ethnicity are strongly associated with stage of CRC at diagnosis.1,2 Thus, recognizing the economic, social, and cultural factors that result in low rates of CRC screening in underserved populations is important in order to devise targeted interventions to increase CRC uptake and reduce morbidity and mortality in these populations.
What are the facts and figures?
The overall rate of screening colonoscopies has increased in all ethnic groups in the past 10 years but still falls below the goal of 71% established by the Healthy People project (www.healthypeople.gov) for the year 2020.3 According to the Centers for Disease Control and Prevention ethnicity-specific data for U.S.-born populations, 60% of whites, 55% of African Americans (AA), 50% of American Indian/Alaskan natives (AI/AN), 46% of Latino Americans, and 47% of Asians undergo CRC screening (Figure 1A).4 While CRC incidence in non-Hispanic whites age 50 years and older has dropped by 32% since 2000 because of screening, this trend has not been observed in AAs.5,6
The incidence of CRC in AAs is estimated at 49/10,000, one of the highest amongst U.S. populations and is the second and third most common cancer in AA women and men, respectively (Figure 1B).
Similar to AAs, AI/AN patients present with more advanced CRC disease and at younger ages and have lower survival rates, compared with other racial groups, a trend that has not changed in the last decade.7 CRC screening data in this population vary according to sex, geographic location, and health care utilization, with as few as 4.0% of asymptomatic, average-risk AI/ANs who receive medical care in the Indian Health Services being screened for CRC.8
The low rate of CRC screening among Latinos also poses a significant obstacle to the Healthy People project since it is expected that by 2060 Latinos will constitute 30% of the U.S. population. Therefore, strategies to improve CRC screening in this population are needed to continue the gains made in overall CRC mortality rates.
The percentage of immigrants in the U.S. population increased from 4.7% in 1970 to 13.5% in 2015. Immigrants, regardless of their ethnicity, represent a very vulnerable population, and CRC screening data in this population are not as robust as for U.S.-born groups. In general, immigrants have substantially lower CRC screening rates, compared with U.S.-born populations (21% vs. 60%),9 and it is suspected that additional, significant barriers to CRC screening and care exist for undocumented immigrants.
Another often overlooked group, are individuals with physical or cognitive disabilities. In this group, screening rates range from 49% to 65%.10
Finally, while information is available for many health care conditions and disparities faced by various ethnic groups, there are few CRC screening data for the LGBTQ community. Perhaps amplifying this problem is the existence of conflicting data in this population, with some studies suggesting there is no difference in CRC risk across groups in the LGBTQ community and others suggesting an increased risk.11,12 Notably, sexual orientation has been identified as a positive predictor of CRC screening in gay and bisexual men – CRC screening rates are higher in these groups, compared with heterosexual men.13 In contrast, no such difference has been found between homosexual and heterosexual women.14
What are the barriers?
Several common themes contribute to disparities in CRC screening among minority groups, including psychosocial/cultural, socioeconomic, provider-specific, and insurance-related factors. Some patient-related barriers include issues of illiteracy, having poor health literacy or English proficiency, having only grade school education,15,16 cultural misconceptions, transportation issues, difficulties affording copayments or deductibles, and a lack of follow-up for scheduled appointments and exams.17-20 Poor health literacy has a profound effect on exam perceptions, fear of test results, and compliance with scheduling tests and bowel preparation instructions21-25; it also affects one’s understanding of the importance of CRC screening, the recommended screening age, and the available choice of screening tests.
Even when some apparent barriers are mitigated, disparities in CRC screening remain. For example, even among the insured and among Medicare beneficiaries, screening rates and adequate follow-up rates after abnormal findings remain lower among AAs and those of low socioeconomic status than they are among whites.26-28 At least part of this paradox results from the presence of unmeasured cultural/belief systems that affect CRC screening uptake. Some of these factors include fear and/or denial of CRC diagnoses, mistrust of the health care system, and reluctance to undergo medical treatment and surgery.16,29 AAs are also less likely to be aware of a family history of CRC and to discuss personal and/or family history of CRC or polyps, which can thereby hinder the identification of high-risk individuals who would benefit from early screening.15,30
The deeply rooted sense of fatalism also plays a crucial role and has been cited for many minority and immigrant populations. Fatalism leads patients to view a diagnosis of cancer as a matter of “fate” or “God’s will,” and therefore, it is to be endured.23,31 Similarly, in a qualitative study of 44 Somali men living in St. Paul and Minneapolis, believing cancer was more common in whites, believing they were protected from cancer by God, fearing a cancer diagnosis, and fearing ostracism from their community were reported as barriers to cancer screening.32
Perceptions about CRC screening methods in Latino populations also have a tremendous influence and can include fear, stigma of sexual prejudice, embarrassment of being exposed during the exam, worries about humiliation in a male sense of masculinity, a lack of trust in the medical professionals, a sense of being a “guinea pig” for physicians, concerns about health care racism, and expectations of pain.33-37 Studies have reported that immigrants are afraid to seek health care because of the increasingly hostile environment associated with immigration enforcement.38 In addition, the impending dissolution of the Deferred Action for Childhood Arrivals act is likely to augment the barriers to care for Latino groups.39
In addition, provider-specific barriers to care also exist. Racial and ethnic minorities are less likely than whites to receive recommendations for screening by their physician. In fact, this factor alone has been demonstrated to be the main reason for lack of screening among AAs in a Californian cohort.40 In addition, patients from rural areas or those from AI/AN communities are at especially increased risk for lack of access to care because of a scarcity of providers along with patient perceptions regarding their primary care provider’s ability to connect them to subspecialists.41-43 Other cited examples include misconceptions about and poor treatment of the LGBTQ population by health care providers/systems.44
How can we intervene successfully?
Characterization of barriers is important because it promotes the development of targeted interventions. Intervention models include community engagement programs, incorporation of fecal occult testing, and patient navigator programs.45-47 In response to the alarming disparity in CRC screening rates in Latino communities, several interventions have been set in motion in different clinical scenarios, which include patient navigation and a focus on patient education.
Randomized trials have shown that outreach efforts and patient navigation increase CRC screening rates in AAs.48,54,55 Studies evaluating the effects of print-based educational materials on improving screening showed improvement in screening rates, decreases in cancer-related fatalistic attitudes, and patients had a better understanding of the benefits of screening as compared with the cost associated with screening and the cost of advanced disease.56 Similarly, the use of touch-screen computers that tailor informational messages to decisional stage and screening barriers increased participation in CRC screening.57 Including patient navigators along with printed education material was even more effective at increasing the proportion of patients getting colonoscopy screening than providing printed material alone, with more-intensive navigation needed for individuals with low literacy.58 Grubbs et al.reported the success of their patient navigation program, which included wider comprehensive screening and coverage for colonoscopy screening.59 In AAs, they estimated an annual reduction of CRC incidence and mortality of 4,200 and 2,700 patients, respectively.
Among immigrants, there is an increased likelihood of CRC screening in those immigrants with a higher number of primary care visits.60 The intersection of culture, race, socioeconomic status, housing enclaves, limited English proficiency, low health literacy, and immigration policy all play a role in immigrant health and access to health care.61
Therefore, different strategies may be needed for each immigrant group to improve CRC screening. For this group of patients, efforts aimed at mitigating the adverse effects of national immigration policies on immigrant populations may have the additional consequence of improving health care access and CRC screening for these patients.
Data gaps still exist in our understanding of patient perceptions, perspectives, and barriers that present opportunities for further study to develop long-lasting interventions that will improve health care of underserved populations. By raising awareness of the barriers, physicians can enhance their own self-awareness to keenly be attuned to these challenges as patients cross their clinic threshold for medical care.
Additional resources link: www.cdc.gov/cancer/colorectal/
References
1. Klabunde CN et al. Trends in colorectal cancer test use among vulnerable populations in the United States. Cancer Epidemiol Biomarkers Prev. 2011 Aug;20(8):1611-21.
2. Parikh-Patel A et al. Colorectal cancer stage at diagnosis by socioeconomic and urban/rural status in California, 1988-2000. Cancer. 2006 Sep;107(5 Suppl):1189-95.
3. Promotion OoDPaH. Healthy People 2020. Cancer. Volume 2017.
4. Centers for Disease Control and Prevention. Cancer screening – United States, 2010. MMWR Morb Mortal Wkly Rep. 2012 Jan 27;61(3):41-5.
5. Doubeni CA et al. Racial and ethnic trends of colorectal cancer screening among Medicare enrollees. Am J Prev Med. 2010 Feb;38(2):184-91.
6. Kupfer SS et al. Reducing colorectal cancer risk among African Americans. Gastroenterology. 2015 Nov;149(6):1302-4.
7. Espey DK et al. Annual report to the nation on the status of cancer, 1975-2004, featuring cancer in American Indians and Alaska Natives. Cancer. 2007 Nov;110(10):2119-52.
8. Day LW et al. Screening prevalence and incidence of colorectal cancer among American Indian/Alaskan natives in the Indian Health Service. Dig Dis Sci. 2011 Jul;56(7):2104-13.
9. Gupta S et al. Challenges and possible solutions to colorectal cancer screening for the underserved. J Natl Cancer Inst. 2014 Apr;106(4):dju032.
10. Steele CB et al. Colorectal cancer incidence and screening – United States, 2008 and 2010. MMWR Suppl. 2013 Nov 22;62(3):53-60.
11. Boehmer U et al. Cancer survivorship and sexual orientation. Cancer 2011 Aug 15;117(16):3796-804.
12. Austin SB, Pazaris MJ, Wei EK, et al. Application of the Rosner-Wei risk-prediction model to estimate sexual orientation patterns in colon cancer risk in a prospective cohort of US women. Cancer Causes Control. 2014 Aug;25(8):999-1006.
13. Heslin KC et al. Sexual orientation and testing for prostate and colorectal cancers among men in California. Med Care. 2008 Dec;46(12):1240-8.
14. McElroy JA et al. Advancing Health Care for Lesbian, Gay, Bisexual, and Transgender Patients in Missouri. Mo Med. 2015 Jul-Aug;112(4):262-5.
15. Greiner KA et al. Knowledge and perceptions of colorectal cancer screening among urban African Americans. J Gen Intern Med. 2005 Nov;20(11):977-83.
16. Green PM, Kelly BA. Colorectal cancer knowledge, perceptions, and behaviors in African Americans. Cancer Nurs. 2004 May-Jun;27(3):206-15; quiz 216-7.
17. Berkowitz Z et al. Beliefs, risk perceptions, and gaps in knowledge as barriers to colorectal cancer screening in older adults. J Am Geriatr Soc. 2008 Feb;56(2):307-14.
18. Dolan NC et al. Colorectal cancer screening knowledge, attitudes, and beliefs among veterans: Does literacy make a difference? J Clin Oncol. 2004 Jul;22(13):2617-22.
19. Peterson NB et al. The influence of health literacy on colorectal cancer screening knowledge, beliefs and behavior. J Natl Med Assoc. 2007 Oct;99(10):1105-12.
20. Haddock MG et al. Intraoperative irradiation for locally recurrent colorectal cancer in previously irradiated patients. Int J Radiat Oncol Biol Phys. 2001 Apr 1;49(5):1267-74.
21. Jones RM et al. Patient-reported barriers to colorectal cancer screening: a mixed-methods analysis. Am J Prev Med. 2010 May;38(5):508-16.
22. Basch CH et al. Screening colonoscopy bowel preparation: experience in an urban minority population. Therap Adv Gastroenterol. 2013 Nov;6(6):442-6.
23. Davis JL et al. Sociodemographic differences in fears and mistrust contributing to unwillingness to participate in cancer screenings. J Health Care Poor Underserved. 2012 Nov;23(4 Suppl):67-76.
24. Robinson CM et al. Barriers to colorectal cancer screening among publicly insured urban women: no knowledge of tests and no clinician recommendation. J Natl Med Assoc. 2011 Aug;103(8):746-53.
25. Goldman RE et al. Perspectives of colorectal cancer risk and screening among Dominicans and Puerto Ricans: Stigma and misperceptions. Qual Health Res. 2009 Nov;19(11):1559-68.
26. Laiyemo AO et al. Race and colorectal cancer disparities: Health-care utilization vs different cancer susceptibilities. J Natl Cancer Inst. 2010 Apr 21;102(8):538-46.
27. White A et al. Racial disparities and treatment trends in a large cohort of elderly African Americans and Caucasians with colorectal cancer, 1991 to 2002. Cancer. 2008 Dec 15;113(12):3400-9.
28. Doubeni CA et al. Neighborhood socioeconomic status and use of colonoscopy in an insured population – A retrospective cohort study. PLoS One. 2012;7(5):e36392.
29. Tammana VS, Laiyemo AO. Colorectal cancer disparities: Issues, controversies and solutions. World J Gastroenterol. 2014 Jan 28;20(4):869-76.
30. Carethers JM. Screening for colorectal cancer in African Americans: determinants and rationale for an earlier age to commence screening. Dig Dis Sci. 2015 Mar;60(3):711-21.
31. Miranda-Diaz C et al. Barriers for Compliance to Breast, Colorectal, and Cervical Screening Cancer Tests among Hispanic Patients. Int J Environ Res Public Health. 2015 Dec 22;13(1):ijerph13010021.
32. Sewali B et al. Understanding cancer screening service utilization by Somali men in Minnesota. J Immigr Minor Health. 2015 Jun;17(3):773-80.
33. Walsh JM et al. Barriers to colorectal cancer screening in Latino and Vietnamese Americans. Compared with non-Latino white Americans. J Gen Intern Med. 2004 Feb;19(2):156-66.
34. Perez-Stable EJ et al. Self-reported use of cancer screening tests among Latinos and Anglos in a prepaid health plan. Arch Intern Med. 1994 May 23;154(10):1073-81.
35. Shariff-Marco S et al. Racial/ethnic differences in self-reported racism and its association with cancer-related health behaviors. Am J Public Health. 2010 Feb;100(2):364-74.
36. Powe BD et al. Comparing knowledge of colorectal and prostate cancer among African American and Hispanic men. Cancer Nurs. 2009 Sep-Oct;32(5):412-7.
37. Jun J, Oh KM. Asian and Hispanic Americans’ cancer fatalism and colon cancer screening. Am J Health Behav. 2013 Mar;37(2):145-54.
38. Hacker K et al. The impact of Immigration and Customs Enforcement on immigrant health: Perceptions of immigrants in Everett, Massachusetts, USA. Soc Sci Med. 2011 Aug;73(4):586-94.
39. Firger J. Rescinding DACA could spur a public health crisis, from lost services to higher rates of depression, substance abuse. Newsweek.
40. May FP et al. Racial minorities are more likely than whites to report lack of provider recommendation for colon cancer screening. Am J Gastroenterol. 2015 Oct;110(10):1388-94.
41. Levy BT et al. Why hasn’t this patient been screened for colon cancer? An Iowa Research Network study. J Am Board Fam Med. 2007 Sep-Oct;20(5):458-68.
42. Rosenblatt RA. A view from the periphery – health care in rural America. N Engl J Med. 2004 Sep 9;351(11):1049-51.
43. Young WF et al. Predictors of colorectal screening in rural Colorado: testing to prevent colon cancer in the high plains research network. J Rural Health. 2007 Summer;23(3):238-45.
44. Kates J et al. Health and Access to Care and Coverage for Lesbian, Gay, Bisexual, and Transgender (LGBT) Individuals in the U.S. In: Foundation KF, ed. Disparities Policy Issue Brief. Volume 2017; Aug 30, 2017.
45. Katz ML et al. Improving colorectal cancer screening by using community volunteers: results of the Carolinas cancer education and screening (CARES) project. Cancer. 2007 Oct 1;110(7):1602-10.
46. Jean-Jacques M et al. Program to improve colorectal cancer screening in a low-income, racially diverse population: A randomized controlled trial. Ann Fam Med. 2012 Sep-Oct;10(5):412-7.
47. Reuland DS et al. Effect of combined patient decision aid and patient navigation vs usual care for colorectal cancer screening in a vulnerable patient population: A randomized clinical trial. JAMA Intern Med. 2017 Jul 1;177(7):967-74.
48. Percac-Lima S et al. A culturally tailored navigator program for colorectal cancer screening in a community health center: a randomized, controlled trial. J Gen Intern Med. 2009 Feb;24(2):211-7.
49. Nash D et al. Evaluation of an intervention to increase screening colonoscopy in an urban public hospital setting. J Urban Health. 2006 Mar;83(2):231-43.
50. Lebwohl B et al. Effect of a patient navigator program on the volume and quality of colonoscopy. J Clin Gastroenterol. 2011 May-Jun;45(5):e47-53.
51. Khankari K et al. Improving colorectal cancer screening among the medically underserved: A pilot study within a federally qualified health center. J Gen Intern Med. 2007 Oct;22(10):1410-4.
52. Wang JH et al. Recruiting Chinese Americans into cancer screening intervention trials: Strategies and outcomes. Clin Trials. 2014 Apr;11(2):167-77.
53. Katz ML et al. Patient activation increases colorectal cancer screening rates: a randomized trial among low-income minority patients. Cancer Epidemiol Biomarkers Prev. 2012 Jan;21(1):45-52.
54. Ford ME et al. Enhancing adherence among older African American men enrolled in a longitudinal cancer screening trial. Gerontologist. 2006 Aug;46(4):545-50.
55. Christie J et al. A randomized controlled trial using patient navigation to increase colonoscopy screening among low-income minorities. J Natl Med Assoc. 2008 Mar;100(3):278-84.
56. Philip EJ et al. Evaluating the impact of an educational intervention to increase CRC screening rates in the African American community: A preliminary study. Cancer Causes Control. 2010 Oct;21(10):1685-91.
57. Greiner KA et al. Implementation intentions and colorectal screening: A randomized trial in safety-net clinics. Am J Prev Med. 2014 Dec;47(6):703-14.
58. Horne HN et al. Effect of patient navigation on colorectal cancer screening in a community-based randomized controlled trial of urban African American adults. Cancer Causes Control. 2015 Feb;26(2):239-46.
59. Grubbs SS et al. Eliminating racial disparities in colorectal cancer in the real world: It took a village. J Clin Oncol. 2013 Jun 1;31(16):1928-30.
60. Jung MY et al. The Chinese and Korean American immigrant experience: a mixed-methods examination of facilitators and barriers of colorectal cancer screening. Ethn Health. 2017 Feb 25:1-20.
61. Viruell-Fuentes EA et al. More than culture: structural racism, intersectionality theory, and immigrant health. Soc Sci Med. 2012 Dec;75(12):2099-106.
Dr. Oduyebo is a third-year fellow at the Mayo Clinic, Rochester, Minn.; Dr. Malespin is an assistant professor in the department of medicine and the medical director of hepatology at the University of Florida Health, Jacksonville; Dr. Mendoza Ladd is an assistant professor of medicine at Texas Tech University, El Paso; Dr. Day is an associate professor of medicine at the University of California, San Francisco; Dr. Charabaty is an associate professor of medicine and the director of the IBD Center in the division of gastroenterology at Medstar-Georgetown University Center, Washington; Dr. Chen is an associate professor of medicine, the director of patient safety and quality, and the director of the small-bowel endoscopy program in division of gastroenterology at Washington University, St. Louis; Dr. Carr is an assistant professor of medicine in the division of gastroenterology at the University of Pennsylvania, Philadelphia; Dr. Quezada is an assistant dean for admissions, an assistant dean for academic and multicultural affairs, and an assistant professor of medicine in the division of gastroenterology and hepatology at the University of Maryland, Baltimore; and Dr. Lamousé-Smith is a director of translational medicine, immunology, and early development at Janssen Pharmaceuticals Research and Development, Spring House, Penn.

Does provider self-reporting of etiquette behaviors improve patient experience? A randomized controlled trial
Physicians have historically had limited adoption of strategies to improve patient experience and often cite suboptimal data and lack of evidence-driven strategies. 1,2 However, public reporting of hospital-level physician domain Hospital Consumer Assessment of Healthcare Providers and Systems (HCAHPS) experience scores, and more recent linking of payments to performance on patient experience metrics, have been associated with significant increases in physician domain scores for most of the hospitals. 3 Hospitals and healthcare organizations have deployed a broad range of strategies to engage physicians. These include emphasizing the relationship between patient experience and patient compliance, complaints, and malpractice lawsuits; appealing to physicians’ sense of competitiveness by publishing individual provider experience scores; educating physicians on HCAHPS and providing them with regularly updated data; and development of specific techniques for improving patient-physician interaction. 4-8
Studies show that educational curricula on improving etiquette and communication skills for physicians lead to improvement in patient experience, and many such training programs are available to hospitals for a significant cost.9-15 Other studies that have focused on providing timely and individual feedback to physicians using tools other than HCAHPS have shown improvement in experience in some instances. 16,17 However, these strategies are resource intensive, require the presence of an independent observer in each patient room, and may not be practical in many settings. Further, long-term sustainability may be problematic.
Since the goal of any educational intervention targeting physicians is routinizing best practices, and since resource-intensive strategies of continuous assessment and feedback may not be practical, we sought to test the impact of periodic physician self-reporting of their etiquette-based behavior on their patient experience scores.
METHODS
Subjects
Hospitalists from 4 hospitals (2 community and 2 academic) that are part of the same healthcare system were the study subjects. Hospitalists who had at least 15 unique patients responding to the routinely administered Press Ganey experience survey during the baseline period were considered eligible. Eligible hospitalists were invited to enroll in the study if their site director confirmed that the provider was likely to stay with the group for the subsequent 12-month study period.

Randomization, Intervention and Control Group
Hospitalists were randomized to the study arm or control arm (1:1 randomization). Study arm participants received biweekly etiquette behavior (EB) surveys and were asked to report how frequently they performed 7 best-practice bedside etiquette behaviors during the previous 2-week period (Table 1). These behaviors were pre-defined by a consensus group of investigators as being amenable to self-report and commonly considered best practice as described in detail below. Control-arm participants received similarly worded survey on quality improvement behaviors (QIB) that would not be expected to impact patient experience (such as reviewing medications to ensure that antithrombotic prophylaxis was prescribed, Table 1).
Baseline and Study Periods
A 12-month period prior to the enrollment of each hospitalist was considered the baseline period for that individual. Hospitalist eligibility was assessed based on number of unique patients for each hospitalist who responded to the survey during this baseline period. Once enrolled, baseline provider-level patient experience scores were calculated based on the survey responses during this 12-month baseline period. Baseline etiquette behavior performance of the study was calculated from the first survey. After the initial survey, hospitalists received biweekly surveys (EB or QIB) for the 12-month study period for a total of 26 surveys (including the initial survey).
Survey Development, Nature of Survey, Survey Distribution Methods
The EB and QIB physician self-report surveys were developed through an iterative process by the study team. The EB survey included elements from an etiquette-based medicine checklist for hospitalized patients described by Kahn et al. 18 We conducted a review of literature to identify evidence-based practices.19-22 Research team members contributed items on best practices in etiquette-based medicine from their experience. Specifically, behaviors were selected if they met the following 4 criteria: 1) performing the behavior did not lead to significant increase in workload and was relatively easy to incorporate in the work flow; 2) occurrence of the behavior would be easy to note for any outside observer or the providers themselves; 3) the practice was considered to be either an evidence-based or consensus-based best-practice; 4) there was consensus among study team members on including the item. The survey was tested for understandability by hospitalists who were not eligible for the study.
The EB survey contained 7 items related to behaviors that were expected to impact patient experience. The QIB survey contained 4 items related to behaviors that were expected to improve quality (Table 1). The initial survey also included questions about demographic characteristics of the participants.
Survey questionnaires were sent via email every 2 weeks for a period of 12 months. The survey questionnaire became available every other week, between Friday morning and Tuesday midnight, during the study period. Hospitalists received daily email reminders on each of these days with a link to the survey website if they did not complete the survey. They had the opportunity to report that they were not on service in the prior week and opt out of the survey for the specific 2-week period. The survey questions were available online as well as on a mobile device format.
Provider Level Patient Experience Scores
Provider-level patient experience scores were calculated from the physician domain Press Ganey survey items, which included the time that the physician spent with patients, the physician addressed questions/worries, the physician kept patients informed, the friendliness/courtesy of physician, and the skill of physician. Press Ganey responses were scored from 1 to 5 based on the Likert scale responses on the survey such that a response “very good” was scored 5 and a response “very poor” was scored 1. Additionally, physician domain HCAHPS item (doctors treat with courtesy/respect, doctors listen carefully, doctors explain in way patients understand) responses were utilized to calculate another set of HCAHPS provider level experience scores. The responses were scored as 1 for “always” response and “0” for any other response, consistent with CMS dichotomization of these results for public reporting. Weighted scores were calculated for individual hospitalists based on the proportion of days each hospitalist billed for the hospitalization so that experience scores of patients who were cared for by multiple providers were assigned to each provider in proportion to the percent of care delivered.23 Separate composite physician scores were generated from the 5 Press Ganey and for the 3 HCAHPS physician items. Each item was weighted equally, with the maximum possible for Press Ganey composite score of 25 (sum of the maximum possible score of 5 on each of the 5 Press Ganey items) and the HCAHPS possible total was 3 (sum of the maximum possible score of 1 on each of the 3 HCAHPS items).
ANALYSIS AND STATISTICAL METHODS
We analyzed the data to assess for changes in frequency of self-reported behavior over the study period, changes in provider-level patient experience between baseline and study period, and the association between the these 2 outcomes. The self-reported etiquette-based behavior responses were scored as 1 for the lowest response (never) to 4 as the highest (always). With 7 questions, the maximum attainable score was 28. The maximum score was normalized to 100 for ease of interpretation (corresponding to percentage of time etiquette behaviors were employed, by self-report). Similarly, the maximum attainable self-reported QIB-related behavior score on the 4 questions was 16. This was also converted to 0-100 scale for ease of comparison.
Two additional sets of analyses were performed to evaluate changes in patient experience during the study period. First, the mean 12-month provider level patient experience composite score in the baseline period was compared with the 12-month composite score during the 12-month study period for the study group and the control group. These were assessed with and without adjusting for age, sex, race, and U.S. medical school graduate (USMG) status. In the second set of unadjusted and adjusted analyses, changes in biweekly composite scores during the study period were compared between the intervention and the control groups while accounting for correlation between observations from the same physician using mixed linear models. Linear mixed models were used to accommodate correlations among multiple observations made on the same physician by including random effects within each regression model. Furthermore, these models allowed us to account for unbalanced design in our data when not all physicians had an equal number of observations and data elements were collected asynchronously.24 Analyses were performed in R version 3.2.2 (The R Project for Statistical Computing, Vienna, Austria); linear mixed models were performed using the ‘nlme’ package.25
We hypothesized that self-reporting on biweekly surveys would result in increases in the frequency of the reported behavior in each arm. We also hypothesized that, because of biweekly reflection and self-reporting on etiquette-based bedside behavior, patient experience scores would increase in the study arm.
RESULTS
Of the 80 hospitalists approached to participate in the study, 64 elected to participate (80% participation rate). The mean response rate to the survey was 57.4% for the intervention arm and 85.7% for the control arm. Higher response rates were not associated with improved patient experience scores. Of the respondents, 43.1% were younger than 35 years of age, 51.5% practiced in academic settings, and 53.1% were female. There was no statistical difference between hospitalists’ baseline composite experience scores based on gender, age, academic hospitalist status, USMG status, and English as a second language status. Similarly, there were no differences in poststudy composite experience scores based on physician characteristics.
Physicians reported high rates of etiquette-based behavior at baseline (mean score, 83.9+/-3.3), and this showed moderate improvement over the study period (5.6 % [3.9%-7.3%, P < 0.0001]). Similarly, there was a moderate increase in frequency of self-reported behavior in the control arm (6.8% [3.5%-10.1%, P < 0.0001]). Hospitalists reported on 80.7% (77.6%-83.4%) of the biweekly surveys that they “almost always” wrapped up by asking, “Do you have any other questions or concerns” or something similar. In contrast, hospitalists reported on only 27.9% (24.7%-31.3%) of the biweekly survey that they “almost always” sat down in the patient room.
The composite physician domain Press Ganey experience scores were no different for the intervention arm and the control arm during the 12-month baseline period (21.8 vs. 21.7; P = 0.90) and the 12-month intervention period (21.6 vs. 21.5; P = 0.75). Baseline self-reported behaviors were not associated with baseline experience scores. Similarly, there were no differences between the arms on composite physician domain HCAHPS experience scores during baseline (2.1 vs. 2.3; P = 0.13) and intervention periods (2.2 vs. 2.1; P = 0.33).
The difference in difference analysis of the baseline and postintervention composite between the intervention arm and the control arm was not statistically significant for Press Ganey composite physician experience scores (-0.163 vs. -0.322; P = 0.71) or HCAHPS composite physician scores (-0.162 vs. -0.071; P = 0.06). The results did not change when controlled for survey response rate (percentage biweekly surveys completed by the hospitalist), age, gender, USMG status, English as a second language status, or percent clinical effort. The difference in difference analysis of the individual Press Ganey and HCAHPS physician domain items that were used to calculate the composite score was also not statistically significant (Table 2).

Changes in self-reported etiquette-based behavior were not associated with any changes in composite Press Ganey and HCAHPS experience score or individual items of the composite experience scores between baseline and intervention period. Similarly, biweekly self-reported etiquette behaviors were not associated with composite and individual item experience scores derived from responses of the patients discharged during the same 2-week reporting period. The intra-class correlation between observations from the same physician was only 0.02%, suggesting that most of the variation in scores was likely due to patient factors and did not result from differences between physicians.
DISCUSSION
This 12-month randomized multicenter study of hospitalists showed that repeated self-reporting of etiquette-based behavior results in modest reported increases in performance of these behaviors. However, there was no associated increase in provider level patient experience scores at the end of the study period when compared to baseline scores of the same physicians or when compared to the scores of the control group. The study demonstrated feasibility of self-reporting of behaviors by physicians with high participation when provided modest incentives.
Educational and feedback strategies used to improve patient experience are very resource intensive. Training sessions provided at some hospitals may take hours, and sustained effects are unproved. The presence of an independent observer in patient rooms to generate feedback for providers is not scalable and sustainable outside of a research study environment.9-11,15,17,26-29 We attempted to use physician repeated self-reporting to reinforce the important and easy to adopt components of etiquette-based behavior to develop a more easily sustainable strategy. This may have failed for several reasons.
When combining “always” and “usually” responses, the physicians in our study reported a high level of etiquette behavior at baseline. If physicians believe that they are performing well at baseline, they would not consider this to be an area in need of improvement. Bigger changes in behavior may have been possible had the physicians rated themselves less favorably at baseline. Inflated or high baseline self-assessment of performance might also have led to limited success of other types of educational interventions had they been employed.
Studies published since the rollout of our study have shown that physicians significantly overestimate how frequently they perform these etiquette behaviors.30,31 It is likely that was the case in our study subjects. This may, at best, indicate that a much higher change in the level of self-reported performance would be needed to result in meaningful actual changes, or worse, may render self-reported etiquette behavior entirely unreliable. Interventions designed to improve etiquette-based behavior might need to provide feedback about performance.
A program that provides education on the importance of etiquette-based behaviors, obtains objective measures of performance of these behaviors, and offers individualized feedback may be more likely to increase the desired behaviors. This is a limitation of our study. However, we aimed to test a method that required limited resources. Additionally, our method for attributing HCAHPS scores to an individual physician, based on weighted scores that were calculated according to the proportion of days each hospitalist billed for the hospitalization, may be inaccurate. It is possible that each interaction does not contribute equally to the overall score. A team-based intervention and experience measurements could overcome this limitation.
CONCLUSION
This randomized trial demonstrated the feasibility of self-assessment of bedside etiquette behaviors by hospitalists but failed to demonstrate a meaningful impact on patient experience through self-report. These findings suggest that more intensive interventions, perhaps involving direct observation, peer-to-peer mentoring, or other techniques may be required to impact significantly physician etiquette behaviors.
Disclosure
Johns Hopkins Hospitalist Scholars Program provided funding support. Dr. Qayyum is a consultant for Sunovion. The other authors have nothing to report.
1. Blumenthal D, Kilo CM. A report card on continuous quality improvement. Milbank Q. 1998;76(4):625-648. PubMed
2. Shortell SM, Bennett CL, Byck GR. Assessing the impact of continuous quality improvement on clinical practice: What it will take to accelerate progress. Milbank Q. 1998;76(4):593-624. PubMed
3. Mann RK, Siddiqui Z, Kurbanova N, Qayyum R. Effect of HCAHPS reporting on patient satisfaction with physician communication. J Hosp Med. 2015;11(2):105-110. PubMed
4. Rivers PA, Glover SH. Health care competition, strategic mission, and patient satisfaction: research model and propositions. J Health Organ Manag. 2008;22(6):627-641. PubMed
5. Kim SS, Kaplowitz S, Johnston MV. The effects of physician empathy on patient satisfaction and compliance. Eval Health Prof. 2004;27(3):237-251. PubMed
6. Stelfox HT, Gandhi TK, Orav EJ, Gustafson ML. The relation of patient satisfaction with complaints against physicians and malpractice lawsuits. Am J Med. 2005;118(10):1126-1133. PubMed
7. Rodriguez HP, Rodday AM, Marshall RE, Nelson KL, Rogers WH, Safran DG. Relation of patients’ experiences with individual physicians to malpractice risk. Int J Qual Health Care. 2008;20(1):5-12. PubMed
8. Cydulka RK, Tamayo-Sarver J, Gage A, Bagnoli D. Association of patient satisfaction with complaints and risk management among emergency physicians. J Emerg Med. 2011;41(4):405-411. PubMed
9. Windover AK, Boissy A, Rice TW, Gilligan T, Velez VJ, Merlino J. The REDE model of healthcare communication: Optimizing relationship as a therapeutic agent. Journal of Patient Experience. 2014;1(1):8-13.
10. Chou CL, Hirschmann K, Fortin AH 6th, Lichstein PR. The impact of a faculty learning community on professional and personal development: the facilitator training program of the American Academy on Communication in Healthcare. Acad Med. 2014;89(7):1051-1056. PubMed
11. Kennedy M, Denise M, Fasolino M, John P, Gullen M, David J. Improving the patient experience through provider communication skills building. Patient Experience Journal. 2014;1(1):56-60.
12. Braverman AM, Kunkel EJ, Katz L, et al. Do I buy it? How AIDET™ training changes residents’ values about patient care. Journal of Patient Experience. 2015;2(1):13-20.
13. Riess H, Kelley JM, Bailey RW, Dunn EJ, Phillips M. Empathy training for resident physicians: a randomized controlled trial of a neuroscience-informed curriculum. J Gen Intern Med. 2012;27(10):1280-1286. PubMed
14. Rothberg MB, Steele JR, Wheeler J, Arora A, Priya A, Lindenauer PK. The relationship between time spent communicating and communication outcomes on a hospital medicine service. J Gen Internl Med. 2012;27(2):185-189. PubMed
15. O’Leary KJ, Cyrus RM. Improving patient satisfaction: timely feedback to specific physicians is essential for success. J Hosp Med. 2015;10(8):555-556. PubMed
16. Indovina K, Keniston A, Reid M, et al. Real‐time patient experience surveys of hospitalized medical patients. J Hosp Med. 2016;10(8):497-502. PubMed
17. Banka G, Edgington S, Kyulo N, et al. Improving patient satisfaction through physician education, feedback, and incentives. J Hosp Med. 2015;10(8):497-502. PubMed
18. Kahn MW. Etiquette-based medicine. N Engl J Med. 2008;358(19):1988-1989. PubMed
19. Arora V, Gangireddy S, Mehrotra A, Ginde R, Tormey M, Meltzer D. Ability of hospitalized patients to identify their in-hospital physicians. Arch Intern Med. 2009;169(2):199-201. PubMed
20. Francis JJ, Pankratz VS, Huddleston JM. Patient satisfaction associated with correct identification of physicians’ photographs. Mayo Clin Proc. 2001;76(6):604-608. PubMed
21. Strasser F, Palmer JL, Willey J, et al. Impact of physician sitting versus standing during inpatient oncology consultations: patients’ preference and perception of compassion and duration. A randomized controlled trial. J Pain Symptom Manage. 2005;29(5):489-497. PubMed
22. Dudas RA, Lemerman H, Barone M, Serwint JR. PHACES (Photographs of Academic Clinicians and Their Educational Status): a tool to improve delivery of family-centered care. Acad Pediatr. 2010;10(2):138-145. PubMed
23. Herzke C, Michtalik H, Durkin N, et al. A method for attributing patient-level metrics to rotating providers in an inpatient setting. J Hosp Med. Under revision.
24. Holden JE, Kelley K, Agarwal R. Analyzing change: a primer on multilevel models with applications to nephrology. Am J Nephrol. 2008;28(5):792-801. PubMed
25. Pinheiro J, Bates D, DebRoy S, Sarkar D. Linear and nonlinear mixed effects models. R package version. 2007;3:57.
26. Braverman AM, Kunkel EJ, Katz L, et al. Do I buy it? How AIDET™ training changes residents’ values about patient care. Journal of Patient Experience. 2015;2(1):13-20.
27. Riess H, Kelley JM, Bailey RW, Dunn EJ, Phillips M. Empathy training for resident physicians: A randomized controlled trial of a neuroscience-informed curriculum. J Gen Intern Med. 2012;27(10):1280-1286. PubMed
28. Raper SE, Gupta M, Okusanya O, Morris JB. Improving communication skills: A course for academic medical center surgery residents and faculty. J Surg Educ. 2015;72(6):e202-e211. PubMed
29. Indovina K, Keniston A, Reid M, et al. Real‐time patient experience surveys of hospitalized medical patients. J Hosp Med. 2016;11(4):251-256. PubMed
30. Block L, Hutzler L, Habicht R, et al. Do internal medicine interns practice etiquette‐based communication? A critical look at the inpatient encounter. J Hosp Med. 2013;8(11):631-634. PubMed
31. Tackett S, Tad-y D, Rios R, Kisuule F, Wright S. Appraising the practice of etiquette-based medicine in the inpatient setting. J Gen Intern Med. 2013;28(7):908-913. PubMed
Physicians have historically had limited adoption of strategies to improve patient experience and often cite suboptimal data and lack of evidence-driven strategies. 1,2 However, public reporting of hospital-level physician domain Hospital Consumer Assessment of Healthcare Providers and Systems (HCAHPS) experience scores, and more recent linking of payments to performance on patient experience metrics, have been associated with significant increases in physician domain scores for most of the hospitals. 3 Hospitals and healthcare organizations have deployed a broad range of strategies to engage physicians. These include emphasizing the relationship between patient experience and patient compliance, complaints, and malpractice lawsuits; appealing to physicians’ sense of competitiveness by publishing individual provider experience scores; educating physicians on HCAHPS and providing them with regularly updated data; and development of specific techniques for improving patient-physician interaction. 4-8
Studies show that educational curricula on improving etiquette and communication skills for physicians lead to improvement in patient experience, and many such training programs are available to hospitals for a significant cost.9-15 Other studies that have focused on providing timely and individual feedback to physicians using tools other than HCAHPS have shown improvement in experience in some instances. 16,17 However, these strategies are resource intensive, require the presence of an independent observer in each patient room, and may not be practical in many settings. Further, long-term sustainability may be problematic.
Since the goal of any educational intervention targeting physicians is routinizing best practices, and since resource-intensive strategies of continuous assessment and feedback may not be practical, we sought to test the impact of periodic physician self-reporting of their etiquette-based behavior on their patient experience scores.
METHODS
Subjects
Hospitalists from 4 hospitals (2 community and 2 academic) that are part of the same healthcare system were the study subjects. Hospitalists who had at least 15 unique patients responding to the routinely administered Press Ganey experience survey during the baseline period were considered eligible. Eligible hospitalists were invited to enroll in the study if their site director confirmed that the provider was likely to stay with the group for the subsequent 12-month study period.
Randomization, Intervention and Control Group
Hospitalists were randomized to the study arm or control arm (1:1 randomization). Study arm participants received biweekly etiquette behavior (EB) surveys and were asked to report how frequently they performed 7 best-practice bedside etiquette behaviors during the previous 2-week period (Table 1). These behaviors were pre-defined by a consensus group of investigators as being amenable to self-report and commonly considered best practice as described in detail below. Control-arm participants received similarly worded survey on quality improvement behaviors (QIB) that would not be expected to impact patient experience (such as reviewing medications to ensure that antithrombotic prophylaxis was prescribed, Table 1).
Baseline and Study Periods
A 12-month period prior to the enrollment of each hospitalist was considered the baseline period for that individual. Hospitalist eligibility was assessed based on number of unique patients for each hospitalist who responded to the survey during this baseline period. Once enrolled, baseline provider-level patient experience scores were calculated based on the survey responses during this 12-month baseline period. Baseline etiquette behavior performance of the study was calculated from the first survey. After the initial survey, hospitalists received biweekly surveys (EB or QIB) for the 12-month study period for a total of 26 surveys (including the initial survey).
Survey Development, Nature of Survey, Survey Distribution Methods
The EB and QIB physician self-report surveys were developed through an iterative process by the study team. The EB survey included elements from an etiquette-based medicine checklist for hospitalized patients described by Kahn et al. 18 We conducted a review of literature to identify evidence-based practices.19-22 Research team members contributed items on best practices in etiquette-based medicine from their experience. Specifically, behaviors were selected if they met the following 4 criteria: 1) performing the behavior did not lead to significant increase in workload and was relatively easy to incorporate in the work flow; 2) occurrence of the behavior would be easy to note for any outside observer or the providers themselves; 3) the practice was considered to be either an evidence-based or consensus-based best-practice; 4) there was consensus among study team members on including the item. The survey was tested for understandability by hospitalists who were not eligible for the study.
The EB survey contained 7 items related to behaviors that were expected to impact patient experience. The QIB survey contained 4 items related to behaviors that were expected to improve quality (Table 1). The initial survey also included questions about demographic characteristics of the participants.
Survey questionnaires were sent via email every 2 weeks for a period of 12 months. The survey questionnaire became available every other week, between Friday morning and Tuesday midnight, during the study period. Hospitalists received daily email reminders on each of these days with a link to the survey website if they did not complete the survey. They had the opportunity to report that they were not on service in the prior week and opt out of the survey for the specific 2-week period. The survey questions were available online as well as on a mobile device format.
Provider Level Patient Experience Scores
Provider-level patient experience scores were calculated from the physician domain Press Ganey survey items, which included the time that the physician spent with patients, the physician addressed questions/worries, the physician kept patients informed, the friendliness/courtesy of physician, and the skill of physician. Press Ganey responses were scored from 1 to 5 based on the Likert scale responses on the survey such that a response “very good” was scored 5 and a response “very poor” was scored 1. Additionally, physician domain HCAHPS item (doctors treat with courtesy/respect, doctors listen carefully, doctors explain in way patients understand) responses were utilized to calculate another set of HCAHPS provider level experience scores. The responses were scored as 1 for “always” response and “0” for any other response, consistent with CMS dichotomization of these results for public reporting. Weighted scores were calculated for individual hospitalists based on the proportion of days each hospitalist billed for the hospitalization so that experience scores of patients who were cared for by multiple providers were assigned to each provider in proportion to the percent of care delivered.23 Separate composite physician scores were generated from the 5 Press Ganey and for the 3 HCAHPS physician items. Each item was weighted equally, with the maximum possible for Press Ganey composite score of 25 (sum of the maximum possible score of 5 on each of the 5 Press Ganey items) and the HCAHPS possible total was 3 (sum of the maximum possible score of 1 on each of the 3 HCAHPS items).
ANALYSIS AND STATISTICAL METHODS
We analyzed the data to assess for changes in frequency of self-reported behavior over the study period, changes in provider-level patient experience between baseline and study period, and the association between the these 2 outcomes. The self-reported etiquette-based behavior responses were scored as 1 for the lowest response (never) to 4 as the highest (always). With 7 questions, the maximum attainable score was 28. The maximum score was normalized to 100 for ease of interpretation (corresponding to percentage of time etiquette behaviors were employed, by self-report). Similarly, the maximum attainable self-reported QIB-related behavior score on the 4 questions was 16. This was also converted to 0-100 scale for ease of comparison.
Two additional sets of analyses were performed to evaluate changes in patient experience during the study period. First, the mean 12-month provider level patient experience composite score in the baseline period was compared with the 12-month composite score during the 12-month study period for the study group and the control group. These were assessed with and without adjusting for age, sex, race, and U.S. medical school graduate (USMG) status. In the second set of unadjusted and adjusted analyses, changes in biweekly composite scores during the study period were compared between the intervention and the control groups while accounting for correlation between observations from the same physician using mixed linear models. Linear mixed models were used to accommodate correlations among multiple observations made on the same physician by including random effects within each regression model. Furthermore, these models allowed us to account for unbalanced design in our data when not all physicians had an equal number of observations and data elements were collected asynchronously.24 Analyses were performed in R version 3.2.2 (The R Project for Statistical Computing, Vienna, Austria); linear mixed models were performed using the ‘nlme’ package.25
We hypothesized that self-reporting on biweekly surveys would result in increases in the frequency of the reported behavior in each arm. We also hypothesized that, because of biweekly reflection and self-reporting on etiquette-based bedside behavior, patient experience scores would increase in the study arm.
RESULTS
Of the 80 hospitalists approached to participate in the study, 64 elected to participate (80% participation rate). The mean response rate to the survey was 57.4% for the intervention arm and 85.7% for the control arm. Higher response rates were not associated with improved patient experience scores. Of the respondents, 43.1% were younger than 35 years of age, 51.5% practiced in academic settings, and 53.1% were female. There was no statistical difference between hospitalists’ baseline composite experience scores based on gender, age, academic hospitalist status, USMG status, and English as a second language status. Similarly, there were no differences in poststudy composite experience scores based on physician characteristics.
Physicians reported high rates of etiquette-based behavior at baseline (mean score, 83.9+/-3.3), and this showed moderate improvement over the study period (5.6 % [3.9%-7.3%, P < 0.0001]). Similarly, there was a moderate increase in frequency of self-reported behavior in the control arm (6.8% [3.5%-10.1%, P < 0.0001]). Hospitalists reported on 80.7% (77.6%-83.4%) of the biweekly surveys that they “almost always” wrapped up by asking, “Do you have any other questions or concerns” or something similar. In contrast, hospitalists reported on only 27.9% (24.7%-31.3%) of the biweekly survey that they “almost always” sat down in the patient room.
The composite physician domain Press Ganey experience scores were no different for the intervention arm and the control arm during the 12-month baseline period (21.8 vs. 21.7; P = 0.90) and the 12-month intervention period (21.6 vs. 21.5; P = 0.75). Baseline self-reported behaviors were not associated with baseline experience scores. Similarly, there were no differences between the arms on composite physician domain HCAHPS experience scores during baseline (2.1 vs. 2.3; P = 0.13) and intervention periods (2.2 vs. 2.1; P = 0.33).
The difference in difference analysis of the baseline and postintervention composite between the intervention arm and the control arm was not statistically significant for Press Ganey composite physician experience scores (-0.163 vs. -0.322; P = 0.71) or HCAHPS composite physician scores (-0.162 vs. -0.071; P = 0.06). The results did not change when controlled for survey response rate (percentage biweekly surveys completed by the hospitalist), age, gender, USMG status, English as a second language status, or percent clinical effort. The difference in difference analysis of the individual Press Ganey and HCAHPS physician domain items that were used to calculate the composite score was also not statistically significant (Table 2).
Changes in self-reported etiquette-based behavior were not associated with any changes in composite Press Ganey and HCAHPS experience score or individual items of the composite experience scores between baseline and intervention period. Similarly, biweekly self-reported etiquette behaviors were not associated with composite and individual item experience scores derived from responses of the patients discharged during the same 2-week reporting period. The intra-class correlation between observations from the same physician was only 0.02%, suggesting that most of the variation in scores was likely due to patient factors and did not result from differences between physicians.
DISCUSSION
This 12-month randomized multicenter study of hospitalists showed that repeated self-reporting of etiquette-based behavior results in modest reported increases in performance of these behaviors. However, there was no associated increase in provider level patient experience scores at the end of the study period when compared to baseline scores of the same physicians or when compared to the scores of the control group. The study demonstrated feasibility of self-reporting of behaviors by physicians with high participation when provided modest incentives.
Educational and feedback strategies used to improve patient experience are very resource intensive. Training sessions provided at some hospitals may take hours, and sustained effects are unproved. The presence of an independent observer in patient rooms to generate feedback for providers is not scalable and sustainable outside of a research study environment.9-11,15,17,26-29 We attempted to use physician repeated self-reporting to reinforce the important and easy to adopt components of etiquette-based behavior to develop a more easily sustainable strategy. This may have failed for several reasons.
When combining “always” and “usually” responses, the physicians in our study reported a high level of etiquette behavior at baseline. If physicians believe that they are performing well at baseline, they would not consider this to be an area in need of improvement. Bigger changes in behavior may have been possible had the physicians rated themselves less favorably at baseline. Inflated or high baseline self-assessment of performance might also have led to limited success of other types of educational interventions had they been employed.
Studies published since the rollout of our study have shown that physicians significantly overestimate how frequently they perform these etiquette behaviors.30,31 It is likely that was the case in our study subjects. This may, at best, indicate that a much higher change in the level of self-reported performance would be needed to result in meaningful actual changes, or worse, may render self-reported etiquette behavior entirely unreliable. Interventions designed to improve etiquette-based behavior might need to provide feedback about performance.
A program that provides education on the importance of etiquette-based behaviors, obtains objective measures of performance of these behaviors, and offers individualized feedback may be more likely to increase the desired behaviors. This is a limitation of our study. However, we aimed to test a method that required limited resources. Additionally, our method for attributing HCAHPS scores to an individual physician, based on weighted scores that were calculated according to the proportion of days each hospitalist billed for the hospitalization, may be inaccurate. It is possible that each interaction does not contribute equally to the overall score. A team-based intervention and experience measurements could overcome this limitation.
CONCLUSION
This randomized trial demonstrated the feasibility of self-assessment of bedside etiquette behaviors by hospitalists but failed to demonstrate a meaningful impact on patient experience through self-report. These findings suggest that more intensive interventions, perhaps involving direct observation, peer-to-peer mentoring, or other techniques may be required to impact significantly physician etiquette behaviors.
Disclosure
Johns Hopkins Hospitalist Scholars Program provided funding support. Dr. Qayyum is a consultant for Sunovion. The other authors have nothing to report.
1. Blumenthal D, Kilo CM. A report card on continuous quality improvement. Milbank Q. 1998;76(4):625-648. PubMed
2. Shortell SM, Bennett CL, Byck GR. Assessing the impact of continuous quality improvement on clinical practice: What it will take to accelerate progress. Milbank Q. 1998;76(4):593-624. PubMed
3. Mann RK, Siddiqui Z, Kurbanova N, Qayyum R. Effect of HCAHPS reporting on patient satisfaction with physician communication. J Hosp Med. 2015;11(2):105-110. PubMed
4. Rivers PA, Glover SH. Health care competition, strategic mission, and patient satisfaction: research model and propositions. J Health Organ Manag. 2008;22(6):627-641. PubMed
5. Kim SS, Kaplowitz S, Johnston MV. The effects of physician empathy on patient satisfaction and compliance. Eval Health Prof. 2004;27(3):237-251. PubMed
6. Stelfox HT, Gandhi TK, Orav EJ, Gustafson ML. The relation of patient satisfaction with complaints against physicians and malpractice lawsuits. Am J Med. 2005;118(10):1126-1133. PubMed
7. Rodriguez HP, Rodday AM, Marshall RE, Nelson KL, Rogers WH, Safran DG. Relation of patients’ experiences with individual physicians to malpractice risk. Int J Qual Health Care. 2008;20(1):5-12. PubMed
8. Cydulka RK, Tamayo-Sarver J, Gage A, Bagnoli D. Association of patient satisfaction with complaints and risk management among emergency physicians. J Emerg Med. 2011;41(4):405-411. PubMed
9. Windover AK, Boissy A, Rice TW, Gilligan T, Velez VJ, Merlino J. The REDE model of healthcare communication: Optimizing relationship as a therapeutic agent. Journal of Patient Experience. 2014;1(1):8-13.
10. Chou CL, Hirschmann K, Fortin AH 6th, Lichstein PR. The impact of a faculty learning community on professional and personal development: the facilitator training program of the American Academy on Communication in Healthcare. Acad Med. 2014;89(7):1051-1056. PubMed
11. Kennedy M, Denise M, Fasolino M, John P, Gullen M, David J. Improving the patient experience through provider communication skills building. Patient Experience Journal. 2014;1(1):56-60.
12. Braverman AM, Kunkel EJ, Katz L, et al. Do I buy it? How AIDET™ training changes residents’ values about patient care. Journal of Patient Experience. 2015;2(1):13-20.
13. Riess H, Kelley JM, Bailey RW, Dunn EJ, Phillips M. Empathy training for resident physicians: a randomized controlled trial of a neuroscience-informed curriculum. J Gen Intern Med. 2012;27(10):1280-1286. PubMed
14. Rothberg MB, Steele JR, Wheeler J, Arora A, Priya A, Lindenauer PK. The relationship between time spent communicating and communication outcomes on a hospital medicine service. J Gen Internl Med. 2012;27(2):185-189. PubMed
15. O’Leary KJ, Cyrus RM. Improving patient satisfaction: timely feedback to specific physicians is essential for success. J Hosp Med. 2015;10(8):555-556. PubMed
16. Indovina K, Keniston A, Reid M, et al. Real‐time patient experience surveys of hospitalized medical patients. J Hosp Med. 2016;10(8):497-502. PubMed
17. Banka G, Edgington S, Kyulo N, et al. Improving patient satisfaction through physician education, feedback, and incentives. J Hosp Med. 2015;10(8):497-502. PubMed
18. Kahn MW. Etiquette-based medicine. N Engl J Med. 2008;358(19):1988-1989. PubMed
19. Arora V, Gangireddy S, Mehrotra A, Ginde R, Tormey M, Meltzer D. Ability of hospitalized patients to identify their in-hospital physicians. Arch Intern Med. 2009;169(2):199-201. PubMed
20. Francis JJ, Pankratz VS, Huddleston JM. Patient satisfaction associated with correct identification of physicians’ photographs. Mayo Clin Proc. 2001;76(6):604-608. PubMed
21. Strasser F, Palmer JL, Willey J, et al. Impact of physician sitting versus standing during inpatient oncology consultations: patients’ preference and perception of compassion and duration. A randomized controlled trial. J Pain Symptom Manage. 2005;29(5):489-497. PubMed
22. Dudas RA, Lemerman H, Barone M, Serwint JR. PHACES (Photographs of Academic Clinicians and Their Educational Status): a tool to improve delivery of family-centered care. Acad Pediatr. 2010;10(2):138-145. PubMed
23. Herzke C, Michtalik H, Durkin N, et al. A method for attributing patient-level metrics to rotating providers in an inpatient setting. J Hosp Med. Under revision.
24. Holden JE, Kelley K, Agarwal R. Analyzing change: a primer on multilevel models with applications to nephrology. Am J Nephrol. 2008;28(5):792-801. PubMed
25. Pinheiro J, Bates D, DebRoy S, Sarkar D. Linear and nonlinear mixed effects models. R package version. 2007;3:57.
26. Braverman AM, Kunkel EJ, Katz L, et al. Do I buy it? How AIDET™ training changes residents’ values about patient care. Journal of Patient Experience. 2015;2(1):13-20.
27. Riess H, Kelley JM, Bailey RW, Dunn EJ, Phillips M. Empathy training for resident physicians: A randomized controlled trial of a neuroscience-informed curriculum. J Gen Intern Med. 2012;27(10):1280-1286. PubMed
28. Raper SE, Gupta M, Okusanya O, Morris JB. Improving communication skills: A course for academic medical center surgery residents and faculty. J Surg Educ. 2015;72(6):e202-e211. PubMed
29. Indovina K, Keniston A, Reid M, et al. Real‐time patient experience surveys of hospitalized medical patients. J Hosp Med. 2016;11(4):251-256. PubMed
30. Block L, Hutzler L, Habicht R, et al. Do internal medicine interns practice etiquette‐based communication? A critical look at the inpatient encounter. J Hosp Med. 2013;8(11):631-634. PubMed
31. Tackett S, Tad-y D, Rios R, Kisuule F, Wright S. Appraising the practice of etiquette-based medicine in the inpatient setting. J Gen Intern Med. 2013;28(7):908-913. PubMed
© 2017 Society of Hospital Medicine