User login
A Method for Attributing Patient-Level Metrics to Rotating Providers in an Inpatient Setting
Hospitalists’ performance is routinely evaluated by third-party payers, employers, and patients. As hospitalist programs mature, there is a need to develop processes to identify, internally measure, and report on individual and group performance. We know from Society of Hospital Medicine (SHM) data that a significant amount of hospitalists’ total compensation is at least partially based on performance. Often this is based at least in part on quality data. In 2006, SHM issued a white paper detailing the key elements of a successful performance monitoring and reporting process.1,2 Recommendations included the identification of meaningful operational and clinical performance metrics, and the ability to monitor and report both group and individual metrics was highlighted as an essential component. There is evidence that comparison of individual provider performance with that of their peers is a necessary element of successful provider dashboards.3 Additionally, regular feedback and a clear, visual presentation of the data are important components of successful provider feedback dashboards.3-6
Much of the literature regarding provider feedback dashboards has been based in the outpatient setting. The majority of these dashboards focus on the management of chronic illnesses (eg, diabetes and hypertension), rates of preventative care services (eg, colonoscopy or mammogram), or avoidance of unnecessary care (eg, antibiotics for sinusitis).4,5 Unlike in the outpatient setting, in which 1 provider often provides a majority of the care for a given episode of care, hospitalized patients are often cared for by multiple providers, challenging the appropriate attribution of patient-level metrics to specific providers. Under the standard approach, an entire hospitalization is attributed to 1 physician, generally the attending of record for the hospitalization, which may be the admitting provider or the discharging provider, depending on the approach used by the hospital. However, assigning responsibility for an entire hospitalization to a provider who may have only seen the patient for a small percentage of a hospitalization may jeopardize the validity of metrics. As provider metrics are increasingly being used for compensation, it is important to ensure that the method for attribution correctly identifies the providers caring for patients. To our knowledge there is no gold standard approach for attributing metrics to providers when patients are cared for by multiple providers, and the standard attending of record–based approach may lack face validity in many cases.
We aimed to develop and operationalize a system to more fairly attribute patient-level data to individual providers across a single hospitalization even when multiple providers cared for the patient. We then compared our methodology to the standard approach, in which the attending of record receives full attribution for each metric, to determine the difference on a provider level between the 2 models.
METHODS
Clinical Setting
The Johns Hopkins Hospital is a 1145-bed, tertiary-care hospital. Over the years of this project, the Johns Hopkins Hospitalist Program was an approximately 20-physician group providing care in a variety of settings, including a dedicated hospitalist floor, where this metrics program was initiated. Hospitalists in this setting work Monday through Friday, with 1 hospitalist and a moonlighter covering on the weekends. Admissions are performed by an admitter, and overnight care is provided by a nocturnist. Initially 17 beds, this unit expanded to 24 beds in June 2012. For the purposes of this article, we included all general medicine patients admitted to this floor between July 1, 2010, and June 30, 2014, who were cared for by hospitalists. During this period, all patients were inpatients; no patients were admitted under observation status. All of these patients were cared for by hospitalists without housestaff or advanced practitioners. Since 2014, the metrics program has been expanded to other hospitalist-run services in the hospital, but for simplicity, we have not presented these more recent data.
Individual Provider Metrics
Metrics were chosen to reflect institutional quality and efficiency priorities. Our choice of metrics was restricted to those that (1) plausibly reflect provider performance, at least in part, and (2) could be accessed in electronic form (without any manual chart review). Whenever possible, we chose metrics with objective data. Additionally, because funding for this effort was provided by the hospital, we sought to ensure that enough of the metrics were related to cost to justify ongoing hospital support of the project. SAS 9.2 (SAS Institute Inc, Cary, NC) was used to calculate metric weights. Specific metrics included American College of Chest Physicians (ACCP)–compliant venous thromboembolism (VTE) prophylaxis,7 observed-to-expected length of stay (LOS) ratio, percentage of discharges per day, discharges before 3 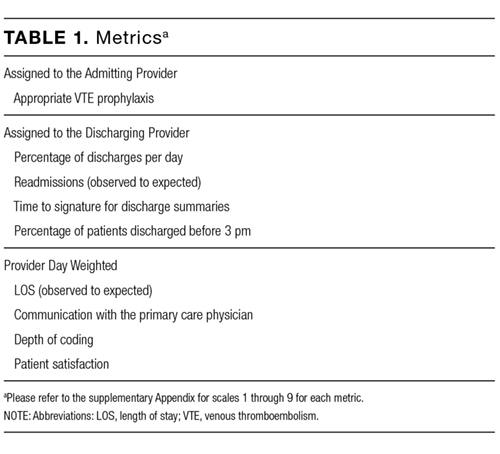
Appropriate prophylaxis for VTE was calculated by using an algorithm embedded within the computerized provider order entry system, which assessed the prescription of ACCP-compliant VTE prophylaxis within 24 hours following admission. This included a risk assessment, and credit was given for no prophylaxis and/or mechanical and/or pharmacologic prophylaxis per the ACCP guidelines.7
Observed-to-expected LOS was defined by using the University HealthSystem Consortium (UHC; now Vizient Inc) expected LOS for the given calendar year. This approach incorporates patient diagnoses, demographics, and other administrative variables to define an expected LOS for each patient.
The percent of patients discharged per day was defined from billing data as the percentage of a provider’s evaluation and management charges that were the final charge of a patient’s stay (regardless of whether a discharge day service was coded).
Discharge prior to 3
Depth of coding was defined as the number of coded diagnoses submitted to the Maryland Health Services Cost Review Commission for determining payment and was viewed as an indicator of the thoroughness of provider documentation.
Patient satisfaction was defined at the patient level (for those patients who turned in patient satisfaction surveys) as the pooled value of the 5 provider questions on the hospital’s patient satisfaction survey administered by Press Ganey: “time the physician spent with you,” “did the physician show concern for your questions/worries,” “did the physician keep you informed,” “friendliness/courtesy of the physician,” and “skill of the physician.”8
Readmission rates were defined as same-hospital readmissions divided by the total number of patients discharged by a given provider, with exclusions based on the Centers for Medicare and Medicaid Services hospital-wide, all-cause readmission measure.1 The expected same-hospital readmission rate was defined for each patient as the observed readmission rate in the entire UHC (Vizient) data set for all patients with the same All Patient Refined Diagnosis Related Group and severity of illness, as we have described previously.9
Communication with the primary care provider was the only self-reported metric used. It was based on a mandatory prompt on the discharge worksheet in the electronic medical record (EMR). Successful communication with the outpatient provider was defined as verbal or electronic communication by the hospitalist with the outpatient provider. Partial (50%) credit was given for providers who attempted but were unsuccessful in communicating with the outpatient provider, for patients for whom the provider had access to the Johns Hopkins EMR system, and for planned admissions without new or important information to convey. No credit was given for providers who indicated that communication was not indicated, who indicated that a patient and/or family would update the provider, or who indicated that the discharge summary would be sufficient.9 Because the discharge worksheet could be initiated at any time during the hospitalization, providers could document communication with the outpatient provider at any point during hospitalization.
Discharge summary turnaround was defined as the average number of days elapsed between the day of discharge and the signing of the discharge summary in the EMR.
Assigning Ownership of Patients to Individual Providers
Using billing data, we assigned ownership of patient care based on the type, timing, and number of charges that occurred during each hospitalization (Figure 1). Eligible charges included all history and physical (codes 99221, 99222, and 99223), subsequent care (codes 99231, 99232, and 99233), and discharge charges (codes 99238 and 99239).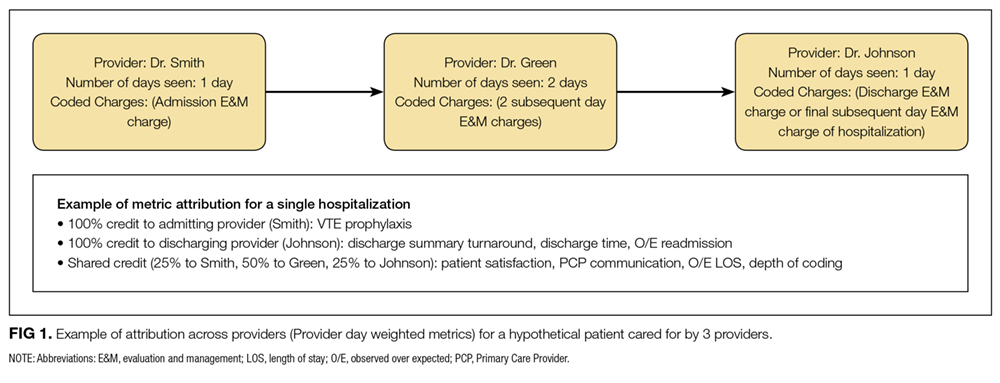
By using a unique identifier assigned for each hospitalization, professional fees submitted by providers were used to identify which provider saw the patient on the admission day, discharge day, as well as subsequent care days. Providers’ productivity, bonus supplements, and policy compliance were determined by using billing data, which encouraged the prompt submittal of charges.
The provider who billed the admission history and physical (codes 99221, 99222, and 99223) within 1 calendar date of the patient’s initial admission was defined as the admitting provider. Patients transferred to the hospitalist service from other services were not assigned an admitting hospitalist. The sole metric assigned to the admitting hospitalist was ACCP-compliant VTE prophylaxis.
The provider who billed the final subsequent care or discharge code (codes 99231, 99232, 99233, 99238, and 99239) within 1 calendar date of discharge was defined as the discharging provider. For hospitalizations characterized by a single provider charge (eg, for patients admitted and discharged on the same day), the provider billing this charge was assigned as both the admitting and discharging physician. Patients upgraded to the intensive care unit (ICU) were not counted as a discharge unless the patient was downgraded and discharged from the hospitalist service. The discharging provider was assigned responsibility for the time of discharge, the percent of patients discharged per day, the discharge summary turnaround time, and hospital readmissions.
Metrics that were assigned to multiple providers for a single hospitalization were termed “provider day–weighted” metrics. The formula for calculating the weight for each provider day–weighted metric was as follows: weight for provider A = [number of daily charges billed by provider A] divided by [LOS +1]. The initial hospital day was counted as day 0. LOS plus 1 was used to recognize that a typical hospitalization will have a charge on the day of admission (day 0) and a charge on the day of discharge such that an LOS of 2 days (eg, a patient admitted on Monday and discharged on Wednesday) will have 3 daily charges. Provider day–weighted metrics included patient satisfaction, communication with the outpatient provider, depth of coding, and observed-to-expected LOS.
Our billing software prevented providers from the same group from billing multiple daily charges, thus ensuring that there were no duplicated charges submitted for a given day.
Presenting Results
Providers were only shown data from the day-weighted approach. For ease of visual interpretation, scores for each metric were scaled ordinally from 1 (worst performance) to 9 (best performance; Table 1). Data were displayed in a dashboard format on a password-protected website for each provider to view his or her own data relative to that of the hospitalist peer group. The dashboard was implemented in this format on July 1, 2011. Data were updated quarterly (Figure 2).
Results were displayed in a polyhedral or spider-web graph (Figure 2). Provider and group metrics were scaled according to predefined benchmarks established for each metric and standardized to a scale ranging from 1 to 9. The scale for each metric was set based on examining historical data and group median performance on the metrics to ensure that there was a range of performance (ie, to avoid having most hospitalists scoring a 1 or 9). Scaling thresholds were periodically adjusted as appropriate to maintain good visual discrimination. Higher scores (creating a larger-volume polygon) are desirable even for metrics such as LOS, for which a low value is desirable. Both a spider-web graph and trends over time were available to the provider (Figure 2). These graphs display a comparison of the individual provider scores for each metric to the hospitalist group average for that metric.
Comparison with the Standard (Attending of Record) Method of Attribution
For the purposes of this report, we sought to determine whether there were meaningful differences between our day-weighted approach versus the standard method of attribution, in which the attending of record is assigned responsibility for each metric that would not have been attributed to the discharging attending under both methods. Our goal was to determine where and whether there was a meaningful difference between the 2 methodologies, recognizing that the degree of difference between these 2 methodologies might vary in other institutions and settings. In our hospital, the attending of record is generally the discharging attending. In order to compare the 2 methodologies, we arbitrarily picked 2015 to retrospectively evaluate the differences between these 2 methods of attribution. We did not display or provide data using the standard methodology to providers at any point; this approach was used only for the purposes of this report. Because these metrics are intended to evaluate relative provider performance, we assigned a percentile to each provider for his or her performance on the given metric using our attribution methodology and then, similarly, assigned a percentile to each provider using the standard methodology. This yielded 2 percentile scores for each provider and each metric. We then compared these percentile ranks for providers in 2 ways: (1) we determined how often providers who scored in the top half of the group for a given metric (above the 50th percentile) also scored in the top half of the group for that metric by using the other calculation method, and (2) we calculated the absolute value of the difference in percentiles between the 2 methods to characterize the impact on a provider’s ranking for that metric that might result from switching to the other method. For instance, if a provider scored at the 20th percentile for the group in patient satisfaction with 1 attribution method and scored at the 40th percentile for the group in patient satisfaction using the other method, the absolute change in percentile would be 20 percentile points. But, this provider would still be below the 50th percentile by both methods (concordant bottom half performance). We did not perform this comparison for metrics assigned to the discharging provider (such as discharge summary turnaround time or readmissions) because the attending of record designation is assigned to the discharging provider at our hospital.
RESULTS
The dashboard was successfully operationalized on July 1, 2011, with displays visible to providers as shown in Figure 2. Consistent with the principles of providing effective performance feedback to providers, the display simultaneously showed providers their individual performance as well as the performance of their peers. Providers were able to view their spider-web plot for prior quarters. Not shown are additional views that allowed providers to see quarterly trends in their data versus their peers across several fiscal years. Also available to providers was their ranking relative to their peers for each metric; specific peers were deidentified in the display.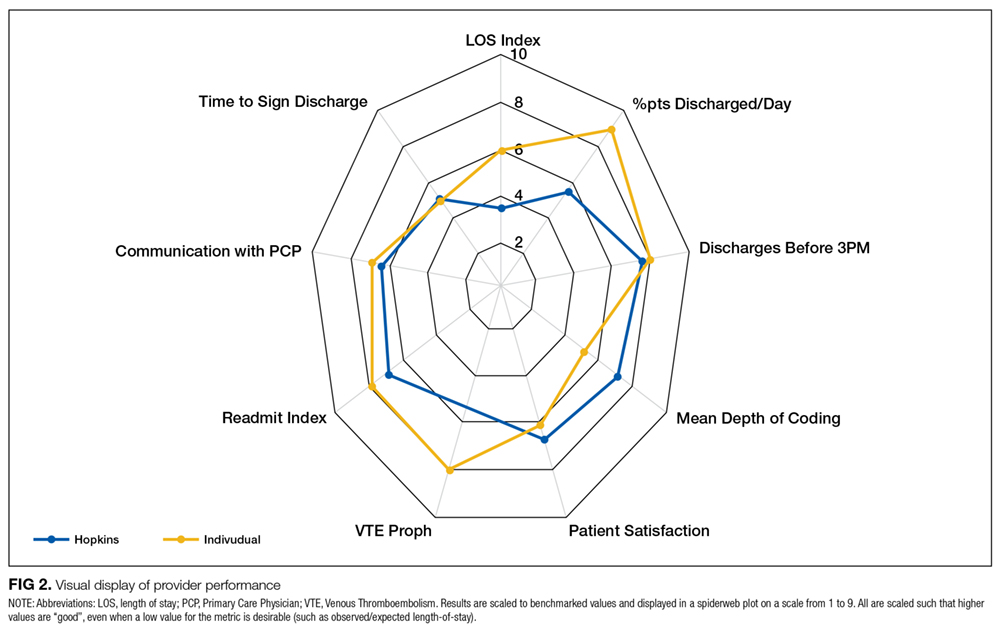
There was notable discordance between provider rankings between the 2 methodologies, as shown in Table 2. Provider performance above or below the median was concordant 56% to 75% of the time (depending on the particular metric), indicating substantial discordance because top-half or bottom-half concordance would be expected to occur by chance 50% of the time. Although the provider percentile differences between the 2 methods tended to be modest for most providers (the median difference between the methods was 13 to 22 percentile points for the various metrics), there were some providers for whom the method of calculation dramatically impacted their rankings. For 5 of the 6 metrics we examined, at least 1 provider had a 50-percentile or greater change in his or her ranking based on the method used. This indicates that at least some providers would have had markedly different scores relative to their peers had we used the alternative methodology (Table 2). In VTE prophylaxis, for example, at least 1 provider had a 94-percentile change in his or her ranking; similarly, a provider had an 88-perentile change in his or her LOS ranking between the 2 methodologies.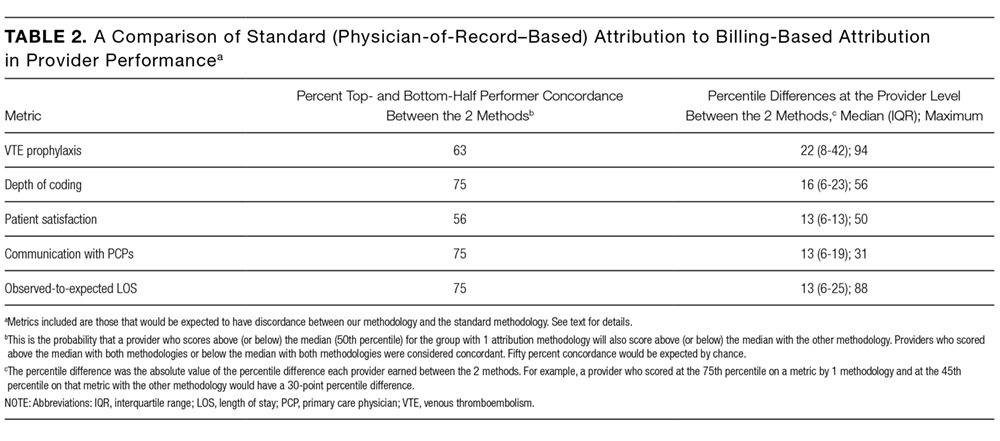
DISCUSSION
We found that it is possible to assign metrics across 1 hospital stay to multiple providers by using billing data. We also found a meaningful discrepancy in how well providers scored (relative to their peers) based on the method used for attribution. These results imply that hospitals should consider attributing performance metrics based on ascribed ownership from billing data and not just from attending of record status.
As hospitalist programs and providers in general are increasingly being asked to develop dashboards to monitor individual and group performance, correctly attributing care to providers is likely to become increasingly important. Experts agree that principles of effective provider performance dashboards include ranking individual provider performance relative to peers, clearly displaying data in an easily accessible format, and ensuring that data can be credibly attributed to the individual provider.3,4,6 However, there appears to be no gold standard method for attribution, especially in the inpatient setting. Our results imply that hospitals should consider attributing performance metrics based on ascribed ownership from billing data and not just from attending of record status.
Several limitations of our findings are important to consider. First, our program is a relatively small, academic group with handoffs that typically occur every 1 to 2 weeks and sometimes with additional handoffs on weekends. Different care patterns and settings might impact the utility of our attribution methodology relative to the standard methodology. Additionally, it is important to note that the relative merits of the different methodologies cannot be ascertained from our comparison. We can demonstrate discordance between the attribution methodologies, but we cannot say that 1 method is correct and the other is flawed. Although we believe that our day-weighted approach feels fairer to providers based on group input and feedback, we did not conduct a formal survey to examine providers’ preferences for the standard versus day-weighted approaches. The appropriateness of a particular attribution method needs to be assessed locally and may vary based on the clinical setting. For instance, on a service in which patients are admitted for procedures, it may make more sense to attribute the outcome of the case to the proceduralist even if that provider did not bill for the patient’s care on a daily basis. Finally, the computational requirements of our methodology are not trivial and require linking billing data with administrative patient-level data, which may be challenging to operationalize in some institutions.
These limitations aside, we believe that our attribution methodology has face validity. For example, a provider might be justifiably frustrated if, using the standard methodology, he or she is charged with the LOS of a patient who had been hospitalized for months, particularly if that patient is discharged shortly after the provider assumes care. Our method addresses this type of misattribution. Particularly when individual provider compensation is based on performance on metrics (as is the case at our institution), optimizing provider attribution to particular patients may be important, and face validity may be required for group buy-in.
In summary, we have demonstrated that it is possible to use billing data to assign ownership of patients to multiple providers over 1 hospital stay. This could be applied to other hospitalist programs as well as other healthcare settings in which multiple providers care for patients during 1 healthcare encounter (eg, ICUs).
Disclosure
The authors declare they have no relevant conflicts of interest.
1. Horwitz L, Partovian C, Lin Z, et al. Hospital-Wide (All-Condition) 30‐Day Risk-Standardized Readmission Measure. https://www.cms.gov/Medicare/Quality-Initiatives-Patient-Assessment-Instruments/MMS/downloads/MMSHospital-WideAll-ConditionReadmissionRate.pdf. Accessed March 6, 2015.
2. Medicine SoH. Measuring Hospitalist Performance: Metrics, Reports, and Dashboards. 2007; https://www.hospitalmedicine.org/Web/Practice_Management/Products_and_Programs/measure_hosp_perf_metrics_reports_dashboards.aspx. Accessed May 12, 2013.
3. Teleki SS, Shaw R, Damberg CL, McGlynn EA. Providing performance feedback to individual physicians: current practice and emerging lessons. Santa Monica, CA: RAND Corporation; 2006. 1-47. https://www.rand.org/content/dam/rand/pubs/working_papers/2006/RAND_WR381.pdf. Accessed August, 2017.
4. Brehaut JC, Colquhoun HL, Eva KW, et al. Practice Feedback Interventions: 15 Suggestions for Optimizing Effectiveness Practice Feedback Interventions. Ann Intern Med. 2016;164(6):435-441. PubMed
5. Dowding D, Randell R, Gardner P, et al. Dashboards for improving patient care: review of the literature. Int J Med Inform. 2015;84(2):87-100. PubMed
6. Landon BE, Normand S-LT, Blumenthal D, Daley J. Physician clinical performance assessment: prospects and barriers. JAMA. 2003;290(9):1183-1189. PubMed
7. Guyatt GH, Akl EA, Crowther M, Gutterman DD, Schuünemann HJ. Executive summary: Antit hrombotic therapy and prevention of thrombosis, 9th ed: American College of Chest Physicians evidence-based clinical practice guidelines. Ann Intern Med. 2012;141(2 suppl):7S-47S. PubMed
8. Siddiqui Z, Qayyum R, Bertram A, et al. Does Provider Self-reporting of Etiquette Behaviors Improve Patient Experience? A Randomized Controlled Trial. J Hosp Med. 2017;12(6):402-406. PubMed
9. Oduyebo I, Lehmann CU, Pollack CE, et al. Association of self-reported hospital discharge handoffs with 30-day readmissions. JAMA Intern Med. 2013;173(8):624-629. PubMed
Hospitalists’ performance is routinely evaluated by third-party payers, employers, and patients. As hospitalist programs mature, there is a need to develop processes to identify, internally measure, and report on individual and group performance. We know from Society of Hospital Medicine (SHM) data that a significant amount of hospitalists’ total compensation is at least partially based on performance. Often this is based at least in part on quality data. In 2006, SHM issued a white paper detailing the key elements of a successful performance monitoring and reporting process.1,2 Recommendations included the identification of meaningful operational and clinical performance metrics, and the ability to monitor and report both group and individual metrics was highlighted as an essential component. There is evidence that comparison of individual provider performance with that of their peers is a necessary element of successful provider dashboards.3 Additionally, regular feedback and a clear, visual presentation of the data are important components of successful provider feedback dashboards.3-6
Much of the literature regarding provider feedback dashboards has been based in the outpatient setting. The majority of these dashboards focus on the management of chronic illnesses (eg, diabetes and hypertension), rates of preventative care services (eg, colonoscopy or mammogram), or avoidance of unnecessary care (eg, antibiotics for sinusitis).4,5 Unlike in the outpatient setting, in which 1 provider often provides a majority of the care for a given episode of care, hospitalized patients are often cared for by multiple providers, challenging the appropriate attribution of patient-level metrics to specific providers. Under the standard approach, an entire hospitalization is attributed to 1 physician, generally the attending of record for the hospitalization, which may be the admitting provider or the discharging provider, depending on the approach used by the hospital. However, assigning responsibility for an entire hospitalization to a provider who may have only seen the patient for a small percentage of a hospitalization may jeopardize the validity of metrics. As provider metrics are increasingly being used for compensation, it is important to ensure that the method for attribution correctly identifies the providers caring for patients. To our knowledge there is no gold standard approach for attributing metrics to providers when patients are cared for by multiple providers, and the standard attending of record–based approach may lack face validity in many cases.
We aimed to develop and operationalize a system to more fairly attribute patient-level data to individual providers across a single hospitalization even when multiple providers cared for the patient. We then compared our methodology to the standard approach, in which the attending of record receives full attribution for each metric, to determine the difference on a provider level between the 2 models.
METHODS
Clinical Setting
The Johns Hopkins Hospital is a 1145-bed, tertiary-care hospital. Over the years of this project, the Johns Hopkins Hospitalist Program was an approximately 20-physician group providing care in a variety of settings, including a dedicated hospitalist floor, where this metrics program was initiated. Hospitalists in this setting work Monday through Friday, with 1 hospitalist and a moonlighter covering on the weekends. Admissions are performed by an admitter, and overnight care is provided by a nocturnist. Initially 17 beds, this unit expanded to 24 beds in June 2012. For the purposes of this article, we included all general medicine patients admitted to this floor between July 1, 2010, and June 30, 2014, who were cared for by hospitalists. During this period, all patients were inpatients; no patients were admitted under observation status. All of these patients were cared for by hospitalists without housestaff or advanced practitioners. Since 2014, the metrics program has been expanded to other hospitalist-run services in the hospital, but for simplicity, we have not presented these more recent data.
Individual Provider Metrics
Metrics were chosen to reflect institutional quality and efficiency priorities. Our choice of metrics was restricted to those that (1) plausibly reflect provider performance, at least in part, and (2) could be accessed in electronic form (without any manual chart review). Whenever possible, we chose metrics with objective data. Additionally, because funding for this effort was provided by the hospital, we sought to ensure that enough of the metrics were related to cost to justify ongoing hospital support of the project. SAS 9.2 (SAS Institute Inc, Cary, NC) was used to calculate metric weights. Specific metrics included American College of Chest Physicians (ACCP)–compliant venous thromboembolism (VTE) prophylaxis,7 observed-to-expected length of stay (LOS) ratio, percentage of discharges per day, discharges before 3
Appropriate prophylaxis for VTE was calculated by using an algorithm embedded within the computerized provider order entry system, which assessed the prescription of ACCP-compliant VTE prophylaxis within 24 hours following admission. This included a risk assessment, and credit was given for no prophylaxis and/or mechanical and/or pharmacologic prophylaxis per the ACCP guidelines.7
Observed-to-expected LOS was defined by using the University HealthSystem Consortium (UHC; now Vizient Inc) expected LOS for the given calendar year. This approach incorporates patient diagnoses, demographics, and other administrative variables to define an expected LOS for each patient.
The percent of patients discharged per day was defined from billing data as the percentage of a provider’s evaluation and management charges that were the final charge of a patient’s stay (regardless of whether a discharge day service was coded).
Discharge prior to 3
Depth of coding was defined as the number of coded diagnoses submitted to the Maryland Health Services Cost Review Commission for determining payment and was viewed as an indicator of the thoroughness of provider documentation.
Patient satisfaction was defined at the patient level (for those patients who turned in patient satisfaction surveys) as the pooled value of the 5 provider questions on the hospital’s patient satisfaction survey administered by Press Ganey: “time the physician spent with you,” “did the physician show concern for your questions/worries,” “did the physician keep you informed,” “friendliness/courtesy of the physician,” and “skill of the physician.”8
Readmission rates were defined as same-hospital readmissions divided by the total number of patients discharged by a given provider, with exclusions based on the Centers for Medicare and Medicaid Services hospital-wide, all-cause readmission measure.1 The expected same-hospital readmission rate was defined for each patient as the observed readmission rate in the entire UHC (Vizient) data set for all patients with the same All Patient Refined Diagnosis Related Group and severity of illness, as we have described previously.9
Communication with the primary care provider was the only self-reported metric used. It was based on a mandatory prompt on the discharge worksheet in the electronic medical record (EMR). Successful communication with the outpatient provider was defined as verbal or electronic communication by the hospitalist with the outpatient provider. Partial (50%) credit was given for providers who attempted but were unsuccessful in communicating with the outpatient provider, for patients for whom the provider had access to the Johns Hopkins EMR system, and for planned admissions without new or important information to convey. No credit was given for providers who indicated that communication was not indicated, who indicated that a patient and/or family would update the provider, or who indicated that the discharge summary would be sufficient.9 Because the discharge worksheet could be initiated at any time during the hospitalization, providers could document communication with the outpatient provider at any point during hospitalization.
Discharge summary turnaround was defined as the average number of days elapsed between the day of discharge and the signing of the discharge summary in the EMR.
Assigning Ownership of Patients to Individual Providers
Using billing data, we assigned ownership of patient care based on the type, timing, and number of charges that occurred during each hospitalization (Figure 1). Eligible charges included all history and physical (codes 99221, 99222, and 99223), subsequent care (codes 99231, 99232, and 99233), and discharge charges (codes 99238 and 99239).
By using a unique identifier assigned for each hospitalization, professional fees submitted by providers were used to identify which provider saw the patient on the admission day, discharge day, as well as subsequent care days. Providers’ productivity, bonus supplements, and policy compliance were determined by using billing data, which encouraged the prompt submittal of charges.
The provider who billed the admission history and physical (codes 99221, 99222, and 99223) within 1 calendar date of the patient’s initial admission was defined as the admitting provider. Patients transferred to the hospitalist service from other services were not assigned an admitting hospitalist. The sole metric assigned to the admitting hospitalist was ACCP-compliant VTE prophylaxis.
The provider who billed the final subsequent care or discharge code (codes 99231, 99232, 99233, 99238, and 99239) within 1 calendar date of discharge was defined as the discharging provider. For hospitalizations characterized by a single provider charge (eg, for patients admitted and discharged on the same day), the provider billing this charge was assigned as both the admitting and discharging physician. Patients upgraded to the intensive care unit (ICU) were not counted as a discharge unless the patient was downgraded and discharged from the hospitalist service. The discharging provider was assigned responsibility for the time of discharge, the percent of patients discharged per day, the discharge summary turnaround time, and hospital readmissions.
Metrics that were assigned to multiple providers for a single hospitalization were termed “provider day–weighted” metrics. The formula for calculating the weight for each provider day–weighted metric was as follows: weight for provider A = [number of daily charges billed by provider A] divided by [LOS +1]. The initial hospital day was counted as day 0. LOS plus 1 was used to recognize that a typical hospitalization will have a charge on the day of admission (day 0) and a charge on the day of discharge such that an LOS of 2 days (eg, a patient admitted on Monday and discharged on Wednesday) will have 3 daily charges. Provider day–weighted metrics included patient satisfaction, communication with the outpatient provider, depth of coding, and observed-to-expected LOS.
Our billing software prevented providers from the same group from billing multiple daily charges, thus ensuring that there were no duplicated charges submitted for a given day.
Presenting Results
Providers were only shown data from the day-weighted approach. For ease of visual interpretation, scores for each metric were scaled ordinally from 1 (worst performance) to 9 (best performance; Table 1). Data were displayed in a dashboard format on a password-protected website for each provider to view his or her own data relative to that of the hospitalist peer group. The dashboard was implemented in this format on July 1, 2011. Data were updated quarterly (Figure 2).
Results were displayed in a polyhedral or spider-web graph (Figure 2). Provider and group metrics were scaled according to predefined benchmarks established for each metric and standardized to a scale ranging from 1 to 9. The scale for each metric was set based on examining historical data and group median performance on the metrics to ensure that there was a range of performance (ie, to avoid having most hospitalists scoring a 1 or 9). Scaling thresholds were periodically adjusted as appropriate to maintain good visual discrimination. Higher scores (creating a larger-volume polygon) are desirable even for metrics such as LOS, for which a low value is desirable. Both a spider-web graph and trends over time were available to the provider (Figure 2). These graphs display a comparison of the individual provider scores for each metric to the hospitalist group average for that metric.
Comparison with the Standard (Attending of Record) Method of Attribution
For the purposes of this report, we sought to determine whether there were meaningful differences between our day-weighted approach versus the standard method of attribution, in which the attending of record is assigned responsibility for each metric that would not have been attributed to the discharging attending under both methods. Our goal was to determine where and whether there was a meaningful difference between the 2 methodologies, recognizing that the degree of difference between these 2 methodologies might vary in other institutions and settings. In our hospital, the attending of record is generally the discharging attending. In order to compare the 2 methodologies, we arbitrarily picked 2015 to retrospectively evaluate the differences between these 2 methods of attribution. We did not display or provide data using the standard methodology to providers at any point; this approach was used only for the purposes of this report. Because these metrics are intended to evaluate relative provider performance, we assigned a percentile to each provider for his or her performance on the given metric using our attribution methodology and then, similarly, assigned a percentile to each provider using the standard methodology. This yielded 2 percentile scores for each provider and each metric. We then compared these percentile ranks for providers in 2 ways: (1) we determined how often providers who scored in the top half of the group for a given metric (above the 50th percentile) also scored in the top half of the group for that metric by using the other calculation method, and (2) we calculated the absolute value of the difference in percentiles between the 2 methods to characterize the impact on a provider’s ranking for that metric that might result from switching to the other method. For instance, if a provider scored at the 20th percentile for the group in patient satisfaction with 1 attribution method and scored at the 40th percentile for the group in patient satisfaction using the other method, the absolute change in percentile would be 20 percentile points. But, this provider would still be below the 50th percentile by both methods (concordant bottom half performance). We did not perform this comparison for metrics assigned to the discharging provider (such as discharge summary turnaround time or readmissions) because the attending of record designation is assigned to the discharging provider at our hospital.
RESULTS
The dashboard was successfully operationalized on July 1, 2011, with displays visible to providers as shown in Figure 2. Consistent with the principles of providing effective performance feedback to providers, the display simultaneously showed providers their individual performance as well as the performance of their peers. Providers were able to view their spider-web plot for prior quarters. Not shown are additional views that allowed providers to see quarterly trends in their data versus their peers across several fiscal years. Also available to providers was their ranking relative to their peers for each metric; specific peers were deidentified in the display.
There was notable discordance between provider rankings between the 2 methodologies, as shown in Table 2. Provider performance above or below the median was concordant 56% to 75% of the time (depending on the particular metric), indicating substantial discordance because top-half or bottom-half concordance would be expected to occur by chance 50% of the time. Although the provider percentile differences between the 2 methods tended to be modest for most providers (the median difference between the methods was 13 to 22 percentile points for the various metrics), there were some providers for whom the method of calculation dramatically impacted their rankings. For 5 of the 6 metrics we examined, at least 1 provider had a 50-percentile or greater change in his or her ranking based on the method used. This indicates that at least some providers would have had markedly different scores relative to their peers had we used the alternative methodology (Table 2). In VTE prophylaxis, for example, at least 1 provider had a 94-percentile change in his or her ranking; similarly, a provider had an 88-perentile change in his or her LOS ranking between the 2 methodologies.
DISCUSSION
We found that it is possible to assign metrics across 1 hospital stay to multiple providers by using billing data. We also found a meaningful discrepancy in how well providers scored (relative to their peers) based on the method used for attribution. These results imply that hospitals should consider attributing performance metrics based on ascribed ownership from billing data and not just from attending of record status.
As hospitalist programs and providers in general are increasingly being asked to develop dashboards to monitor individual and group performance, correctly attributing care to providers is likely to become increasingly important. Experts agree that principles of effective provider performance dashboards include ranking individual provider performance relative to peers, clearly displaying data in an easily accessible format, and ensuring that data can be credibly attributed to the individual provider.3,4,6 However, there appears to be no gold standard method for attribution, especially in the inpatient setting. Our results imply that hospitals should consider attributing performance metrics based on ascribed ownership from billing data and not just from attending of record status.
Several limitations of our findings are important to consider. First, our program is a relatively small, academic group with handoffs that typically occur every 1 to 2 weeks and sometimes with additional handoffs on weekends. Different care patterns and settings might impact the utility of our attribution methodology relative to the standard methodology. Additionally, it is important to note that the relative merits of the different methodologies cannot be ascertained from our comparison. We can demonstrate discordance between the attribution methodologies, but we cannot say that 1 method is correct and the other is flawed. Although we believe that our day-weighted approach feels fairer to providers based on group input and feedback, we did not conduct a formal survey to examine providers’ preferences for the standard versus day-weighted approaches. The appropriateness of a particular attribution method needs to be assessed locally and may vary based on the clinical setting. For instance, on a service in which patients are admitted for procedures, it may make more sense to attribute the outcome of the case to the proceduralist even if that provider did not bill for the patient’s care on a daily basis. Finally, the computational requirements of our methodology are not trivial and require linking billing data with administrative patient-level data, which may be challenging to operationalize in some institutions.
These limitations aside, we believe that our attribution methodology has face validity. For example, a provider might be justifiably frustrated if, using the standard methodology, he or she is charged with the LOS of a patient who had been hospitalized for months, particularly if that patient is discharged shortly after the provider assumes care. Our method addresses this type of misattribution. Particularly when individual provider compensation is based on performance on metrics (as is the case at our institution), optimizing provider attribution to particular patients may be important, and face validity may be required for group buy-in.
In summary, we have demonstrated that it is possible to use billing data to assign ownership of patients to multiple providers over 1 hospital stay. This could be applied to other hospitalist programs as well as other healthcare settings in which multiple providers care for patients during 1 healthcare encounter (eg, ICUs).
Disclosure
The authors declare they have no relevant conflicts of interest.
1. Horwitz L, Partovian C, Lin Z, et al. Hospital-Wide (All-Condition) 30‐Day Risk-Standardized Readmission Measure. https://www.cms.gov/Medicare/Quality-Initiatives-Patient-Assessment-Instruments/MMS/downloads/MMSHospital-WideAll-ConditionReadmissionRate.pdf. Accessed March 6, 2015.
2. Medicine SoH. Measuring Hospitalist Performance: Metrics, Reports, and Dashboards. 2007; https://www.hospitalmedicine.org/Web/Practice_Management/Products_and_Programs/measure_hosp_perf_metrics_reports_dashboards.aspx. Accessed May 12, 2013.
3. Teleki SS, Shaw R, Damberg CL, McGlynn EA. Providing performance feedback to individual physicians: current practice and emerging lessons. Santa Monica, CA: RAND Corporation; 2006. 1-47. https://www.rand.org/content/dam/rand/pubs/working_papers/2006/RAND_WR381.pdf. Accessed August, 2017.
4. Brehaut JC, Colquhoun HL, Eva KW, et al. Practice Feedback Interventions: 15 Suggestions for Optimizing Effectiveness Practice Feedback Interventions. Ann Intern Med. 2016;164(6):435-441. PubMed
5. Dowding D, Randell R, Gardner P, et al. Dashboards for improving patient care: review of the literature. Int J Med Inform. 2015;84(2):87-100. PubMed
6. Landon BE, Normand S-LT, Blumenthal D, Daley J. Physician clinical performance assessment: prospects and barriers. JAMA. 2003;290(9):1183-1189. PubMed
7. Guyatt GH, Akl EA, Crowther M, Gutterman DD, Schuünemann HJ. Executive summary: Antit hrombotic therapy and prevention of thrombosis, 9th ed: American College of Chest Physicians evidence-based clinical practice guidelines. Ann Intern Med. 2012;141(2 suppl):7S-47S. PubMed
8. Siddiqui Z, Qayyum R, Bertram A, et al. Does Provider Self-reporting of Etiquette Behaviors Improve Patient Experience? A Randomized Controlled Trial. J Hosp Med. 2017;12(6):402-406. PubMed
9. Oduyebo I, Lehmann CU, Pollack CE, et al. Association of self-reported hospital discharge handoffs with 30-day readmissions. JAMA Intern Med. 2013;173(8):624-629. PubMed
© 2017 Society of Hospital Medicine
A Concise Tool for Measuring Care Coordination from the Provider’s Perspective in the Hospital Setting
Care Coordination has been defined as “…the deliberate organization of patient care activities between two or more participants (including the patient) involved in a patient’s care to facilitate the appropriate delivery of healthcare services.”1 The Institute of Medicine identified care coordination as a key strategy to improve the American healthcare system,2 and evidence has been building that well-coordinated care improves patient outcomes and reduces healthcare costs associated with chronic conditions.3-5 In 2012, Johns Hopkins Medicine was awarded a Healthcare Innovation Award by the Centers for Medicare & Medicaid Services to improve coordination of care across the continuum of care for adult patients admitted to Johns Hopkins Hospital (JHH) and Johns Hopkins Bayview Medical Center (JHBMC), and for high-risk low-income Medicare and Medicaid beneficiaries receiving ambulatory care in targeted zip codes. The purpose of this project, known as the Johns Hopkins Community Health Partnership (J-CHiP), was to improve health and healthcare and to reduce healthcare costs. The acute care component of the program consisted of a bundle of interventions focused on improving coordination of care for all patients, including a “bridge to home” discharge process, as they transitioned back to the community from inpatient admission. The bundle included the following: early screening for discharge planning to predict needed postdischarge services; discussion in daily multidisciplinary rounds about goals and priorities of the hospitalization and potential postdischarge needs; patient and family self-care management; education enhanced medication management, including the option of “medications in hand” at the time of discharge; postdischarge telephone follow-up by nurses; and, for patients identified as high-risk, a “transition guide” (a nurse who works with the patient via home visits and by phone to optimize compliance with care for 30 days postdischarge).6 While the primary endpoints of the J-CHiP program were to improve clinical outcomes and reduce healthcare costs, we were also interested in the impact of the program on care coordination processes in the acute care setting. This created the need for an instrument to measure healthcare professionals’ views of care coordination in their immediate work environments.
We began our search for existing measures by reviewing the Coordination Measures Atlas published in 2014.7 Although this report evaluates over 80 different measures of care coordination, most of them focus on the perspective of the patient and/or family members, on specific conditions, and on primary care or outpatient settings.7,8 We were unable to identify an existing measure from the provider perspective, designed for the inpatient setting, that was both brief but comprehensive enough to cover a range of care coordination domains.8
Consequently, our first aim was to develop a brief, comprehensive tool to measure care coordination from the perspective of hospital inpatient staff that could be used to compare different units or types of providers, or to conduct longitudinal assessment. The second aim was to conduct a preliminary evaluation of the tool in our healthcare setting, including to assess its psychometric properties, to describe provider perceptions of care coordination after the implementation of J-CHiP, and to explore potential differences among departments, types of professionals, and between the 2 hospitals.
METHODS
Development of the Care Coordination Questionnaire
The survey was developed in collaboration with leaders of the J-CHiP Acute Care Team. We met at the outset and on multiple subsequent occasions to align survey domains with the main components of the J-CHiP acute care intervention and to assure that the survey would be relevant and understandable to a variety of multidisciplinary professionals, including physicians, nurses, social workers, physical therapists, and other health professionals. Care was taken to avoid redundancy with existing evaluation efforts and to minimize respondent burden. This process helped to ensure the content validity of the items, the usefulness of the results, and the future usability of the tool.
We modeled the Care Coordination Questionnaire (CCQ) after the Safety Attitudes Questionnaire (SAQ),9 a widely used survey that is deployed approximately annually at JHH and JHBMC. While the SAQ focuses on healthcare provider attitudes about issues relevant to patient safety (often referred to as safety climate or safety culture), this new tool was designed to focus on healthcare professionals’ attitudes about care coordination. Similar to the way that the SAQ “elicits a snapshot of the safety climate through surveys of frontline worker perceptions,” we sought to elicit a picture of our care coordination climate through a survey of frontline hospital staff.
The CCQ was built upon the domains and approaches to care coordination described in the Agency for Healthcare Research and Quality Care Coordination Atlas.3 This report identifies 9 mechanisms for achieving care coordination, including the following: Establish Accountability or Negotiate Responsibility; Communicate; Facilitate Transitions; Assess Needs and Goals; Create a Proactive Plan of Care; Monitor, Follow Up, and Respond to Change; Support Self-Management Goals; Link to Community Resources; and Align Resources with Patient and Population Needs; as well as 5 broad approaches commonly used to improve the delivery of healthcare, including Teamwork Focused on Coordination, Healthcare Home, Care Management, Medication Management, and Health IT-Enabled Coordination.7 We generated at least 1 item to represent 8 of the 9 domains, as well as the broad approach described as Teamwork Focused on Coordination. After developing an initial set of items, we sought input from 3 senior leaders of the J-CHiP Acute Care Team to determine if the items covered the care coordination domains of interest, and to provide feedback on content validity. To test the interpretability of survey items and consistency across professional groups, we sent an initial version of the survey questions to at least 1 person from each of the following professional groups: hospitalist, social worker, case manager, clinical pharmacist, and nurse. We asked them to review all of our survey questions and to provide us with feedback on all aspects of the questions, such as whether they believed the questions were relevant and understandable to the members of their professional discipline, the appropriateness of the wording of the questions, and other comments. Modifications were made to the content and wording of the questions based on the feedback received. The final draft of the questionnaire was reviewed by the leadership team of the J-CHiP Acute Care Team to ensure its usefulness in providing actionable information.
The resulting 12-item questionnaire used a 5-point Likert response scale ranging from 1 = “disagree strongly” to 5 = “agree strongly,” and an additional option of “not applicable (N/A).” To help assess construct validity, a global question was added at the end of the questionnaire asking, “Overall, how would you rate the care coordination at the hospital of your primary work setting?” The response was measured on a 10-point Likert-type scale ranging from 1 = “totally uncoordinated care” to 10 = “perfectly coordinated care” (see Appendix). In addition, the questionnaire requested information about the respondents’ gender, position, and their primary unit, department, and hospital affiliation.
Data Collection Procedures
An invitation to complete an anonymous questionnaire was sent to the following inpatient care professionals: all nursing staff working on care coordination units in the departments of medicine, surgery, and neurology/neurosurgery, as well as physicians, pharmacists, acute care therapists (eg, occupational and physical therapists), and other frontline staff. All healthcare staff fitting these criteria was sent an e-mail with a request to fill out the survey online using QualtricsTM (Qualtrics Labs Inc., Provo, UT), as well as multiple follow-up reminders. The participants worked either at the JHH (a 1194-bed tertiary academic medical center in Baltimore, MD) or the JHBMC (a 440-bed academic community hospital located nearby). Data were collected from October 2015 through January 2016.
Analysis
Means and standard deviations were calculated by treating the responses as continuous variables. We tried 3 different methods to handle missing data: (1) without imputation, (2) imputing the mean value of each item, and (3) substituting a neutral score. Because all 3 methods produced very similar results, we treated the N/A responses as missing values without imputation for simplicity of analysis. We used STATA 13.1 (Stata Corporation, College Station, Texas) to analyze the data.
To identify subscales, we performed exploratory factor analysis on responses to the 12 specific items. Promax rotation was selected based on the simple structure. Subscale scores for each respondent were generated by computing the mean of responses to the items in the subscale. Internal consistency reliability of the subscales was estimated using Cronbach’s alpha. We calculated Pearson correlation coefficients for the items in each subscale, and examined Cronbach’s alpha deleting each item in turn. For each of the subscales identified and the global scale, we calculated the mean, standard deviation, median and interquartile range. Although distributions of scores tended to be non-normal, this was done to increase interpretability. We also calculated percent scoring at the ceiling (highest possible score).
We analyzed the data with 3 research questions in mind: Was there a difference in perceptions of care coordination between (1) staff affiliated with the 2 different hospitals, (2) staff affiliated with different clinical departments, or (3) staff with different professional roles? For comparisons based on hospital and department, and type of professional, nonparametric tests (Wilcoxon rank-sum and Kruskal-Wallis test) were used with a level of statistical significance set at 0.05. The comparison between hospitals and departments was made only among nurses to minimize the confounding effect of different distribution of professionals. We tested the distribution of “years in specialty” between hospitals and departments for this comparison using Pearson’s χ2 test. The difference was not statistically significant (P = 0.167 for hospitals, and P = 0.518 for departments), so we assumed that the potential confounding effect of this variable was negligible in this analysis. The comparison of scores within each professional group used the Friedman test. Pearson’s χ2 test was used to compare the baseline characteristics between 2 hospitals.
RESULTS
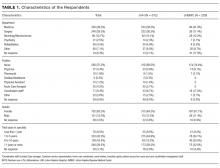
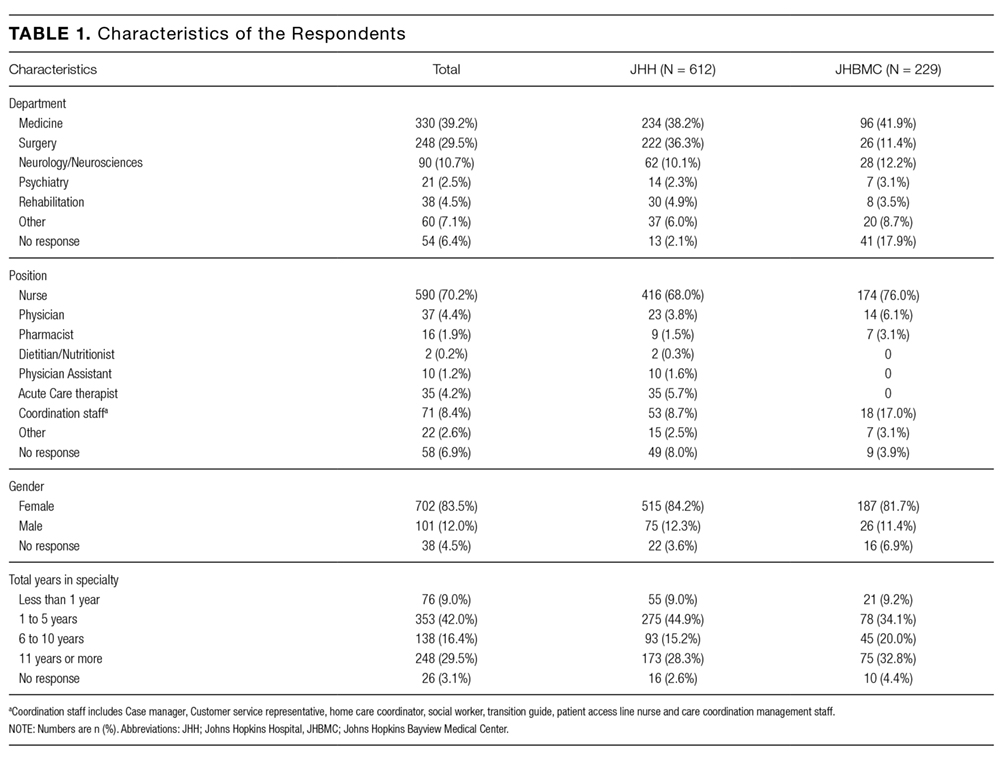
Among the 1486 acute care professionals asked to participate in the survey, 841 completed the questionnaire (response rate 56.6%). Table 1 shows the characteristics of the participants from each hospital. Table 2 summarizes the item response rates, proportion scoring at the ceiling, and weighting from the factor analysis. All items had completion rates of 99.2% or higher, with N/A responses ranging from 0% (item 2) to 3.1% (item 7). The percent scoring at the ceiling was 1.7% for the global item and ranged from 18.3% up to 63.3% for other individual items.
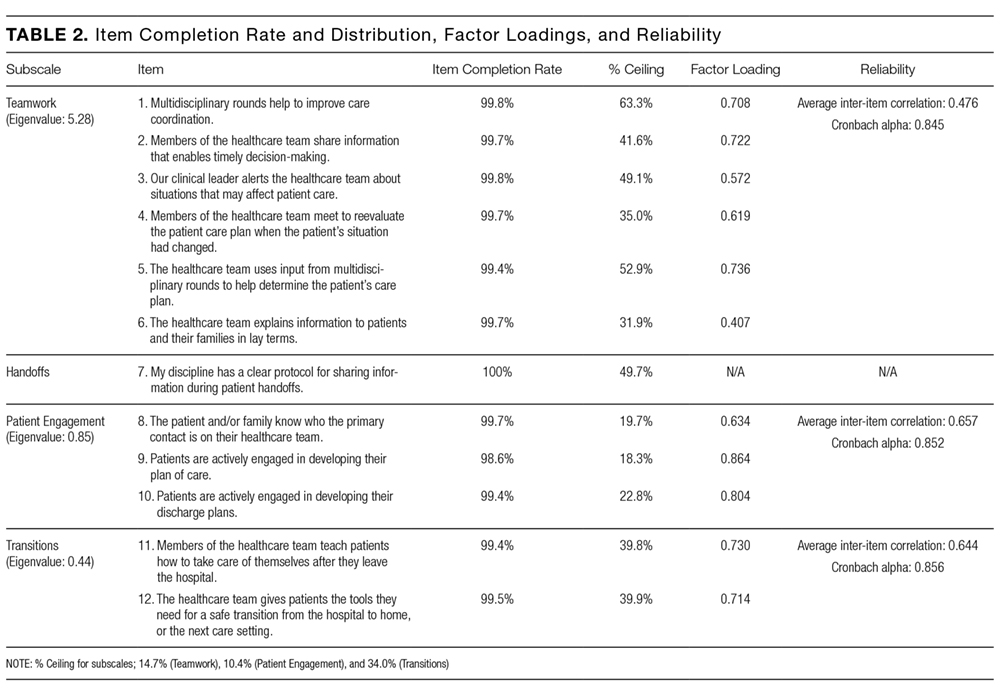

We also examined differences in perceptions of care coordination among nursing units to illustrate the tool’s ability to detect variation in Patient Engagement subscale scores for JHH nurses (see Appendix).
DISCUSSION
This study resulted in one of the first measurement tools to succinctly measure multiple aspects of care coordination in the hospital from the perspective of healthcare professionals. Given the hectic work environment of healthcare professionals, and the increasing emphasis on collecting data for evaluation and improvement, it is important to minimize respondent burden. This effort was catalyzed by a multifaceted initiative to redesign acute care delivery and promote seamless transitions of care, supported by the Center for Medicare & Medicaid Innovation. In initial testing, this questionnaire has evidence for reliability and validity. It was encouraging to find that the preliminary psychometric performance of the measure was very similar in 2 different settings of a tertiary academic hospital and a community hospital.
Our analysis of the survey data explored potential differences between the 2 hospitals, among different types of healthcare professionals and across different departments. Although we expected differences, we had no specific hypotheses about what those differences might be, and, in fact, did not observe any substantial differences. This could be taken to indicate that the intervention was uniformly and successfully implemented in both hospitals, and engaged various professionals in different departments. The ability to detect differences in care coordination at the nursing unit level could also prove to be beneficial for more precisely targeting where process improvement is needed. Further data collection and analyses should be conducted to more systematically compare units and to help identify those where practice is most advanced and those where improvements may be needed. It would also be informative to link differences in care coordination scores with patient outcomes. In addition, differences identified on specific domains between professional groups could be helpful to identify where greater efforts are needed to improve interdisciplinary practice. Sampling strategies stratified by provider type would need to be targeted to make this kind of analysis informative.
The consistently lower scores observed for patient engagement, from the perspective of care professionals in all groups, suggest that this is an area where improvement is needed. These findings are consistent with published reports on the common failure by hospitals to include patients as a member of their own care team. In addition to measuring care processes from the perspective of frontline healthcare workers, future evaluations within the healthcare system would also benefit from including data collected from the perspective of the patient and family.
This study had some limitations. First, there may be more than 4 domains of care coordination that are important and can be measured in the acute care setting from provider perspective. However, the addition of more domains should be balanced against practicality and respondent burden. It may be possible to further clarify priority domains in hospital settings as opposed to the primary care setting. Future research should be directed to find these areas and to develop a more comprehensive, yet still concise measurement instrument. Second, the tool was developed to measure the impact of a large-scale intervention, and to fit into the specific context of 2 hospitals. Therefore, it should be tested in different settings of hospital care to see how it performs. However, virtually all hospitals in the United States today are adapting to changes in both financing and healthcare delivery. A tool such as the one described in this paper could be helpful to many organizations. Third, the scoring system for the overall scale score is not weighted and therefore reflects teamwork more than other components of care coordination, which are represented by fewer items. In general, we believe that use of the subscale scores may be more informative. Alternative scoring systems might also be proposed, including item weighting based on factor scores.
For the purposes of evaluation in this specific instance, we only collected data at a single point in time, after the intervention had been deployed. Thus, we were not able to evaluate the effectiveness of the J-CHiP intervention. We also did not intend to focus too much on the differences between units, given the limited number of respondents from individual units. It would be useful to collect more data at future time points, both to test the responsiveness of the scales and to evaluate the impact of future interventions at both the hospital and unit level.
The preliminary data from this study have generated insights about gaps in current practice, such as in engaging patients in the inpatient care process. It has also increased awareness by hospital leaders about the need to achieve high reliability in the adoption of new procedures and interdisciplinary practice. This tool might be used to find areas in need of improvement, to evaluate the effect of initiatives to improve care coordination, to monitor the change over time in the perception of care coordination among healthcare professionals, and to develop better intervention strategies for coordination activities in acute care settings. Additional research is needed to provide further evidence for the reliability and validity of this measure in diverse settings.
Disclosure
The project described was supported by Grant Number 1C1CMS331053-01-00 from the US Department of Health and Human Services, Centers for Medicare & Medicaid Services. The contents of this publication are solely the responsibility of the authors and do not necessarily represent the official views of the US Department of Health and Human Services or any of its agencies. The research presented was conducted by the awardee. Results may or may not be consistent with or confirmed by the findings of the independent evaluation contractor.
The authors have no other disclosures.
1. McDonald KM, Sundaram V, Bravata DM, et al. Closing the Quality Gap: A Critical Analysis of Quality Improvement Strategies (Vol. 7: Care Coordination). Technical Reviews, No. 9.7. Rockville (MD): Agency for Healthcare Research and Quality (US); 2007. PubMed
2. Adams K, Corrigan J. Priority areas for national action: transforming health care quality. Washington, DC: National Academies Press; 2003. PubMed
3. Renders CM, Valk GD, Griffin S, Wagner EH, Eijk JT, Assendelft WJ. Interventions to improve the management of diabetes mellitus in primary care, outpatient and community settings. Cochrane Database Syst Rev. 2001(1):CD001481. PubMed
4. McAlister FA, Lawson FM, Teo KK, Armstrong PW. A systematic review of randomized trials of disease management programs in heart failure. Am J Med. 2001;110(5):378-384. PubMed
5. Bruce ML, Raue PJ, Reilly CF, et al. Clinical effectiveness of integrating depression care management into medicare home health: the Depression CAREPATH Randomized trial. JAMA Intern Med. 2015;175(1):55-64. PubMed
6. Berkowitz SA, Brown P, Brotman DJ, et al. Case Study: Johns Hopkins Community Health Partnership: A model for transformation. Healthc (Amst). 2016;4(4):264-270. PubMed
7. McDonald. KM, Schultz. E, Albin. L, et al. Care Coordination Measures Atlas Version 4. Rockville, MD: Agency for Healthcare Research and Quality; 2014.
8 Schultz EM, Pineda N, Lonhart J, Davies SM, McDonald KM. A systematic review of the care coordination measurement landscape. BMC Health Serv Res. 2013;13:119. PubMed
9. Sexton JB, Helmreich RL, Neilands TB, et al. The Safety Attitudes Questionnaire: psychometric properties, benchmarking data, and emerging research. BMC Health Serv Res. 2006;6:44. PubMed
Care Coordination has been defined as “…the deliberate organization of patient care activities between two or more participants (including the patient) involved in a patient’s care to facilitate the appropriate delivery of healthcare services.”1 The Institute of Medicine identified care coordination as a key strategy to improve the American healthcare system,2 and evidence has been building that well-coordinated care improves patient outcomes and reduces healthcare costs associated with chronic conditions.3-5 In 2012, Johns Hopkins Medicine was awarded a Healthcare Innovation Award by the Centers for Medicare & Medicaid Services to improve coordination of care across the continuum of care for adult patients admitted to Johns Hopkins Hospital (JHH) and Johns Hopkins Bayview Medical Center (JHBMC), and for high-risk low-income Medicare and Medicaid beneficiaries receiving ambulatory care in targeted zip codes. The purpose of this project, known as the Johns Hopkins Community Health Partnership (J-CHiP), was to improve health and healthcare and to reduce healthcare costs. The acute care component of the program consisted of a bundle of interventions focused on improving coordination of care for all patients, including a “bridge to home” discharge process, as they transitioned back to the community from inpatient admission. The bundle included the following: early screening for discharge planning to predict needed postdischarge services; discussion in daily multidisciplinary rounds about goals and priorities of the hospitalization and potential postdischarge needs; patient and family self-care management; education enhanced medication management, including the option of “medications in hand” at the time of discharge; postdischarge telephone follow-up by nurses; and, for patients identified as high-risk, a “transition guide” (a nurse who works with the patient via home visits and by phone to optimize compliance with care for 30 days postdischarge).6 While the primary endpoints of the J-CHiP program were to improve clinical outcomes and reduce healthcare costs, we were also interested in the impact of the program on care coordination processes in the acute care setting. This created the need for an instrument to measure healthcare professionals’ views of care coordination in their immediate work environments.
We began our search for existing measures by reviewing the Coordination Measures Atlas published in 2014.7 Although this report evaluates over 80 different measures of care coordination, most of them focus on the perspective of the patient and/or family members, on specific conditions, and on primary care or outpatient settings.7,8 We were unable to identify an existing measure from the provider perspective, designed for the inpatient setting, that was both brief but comprehensive enough to cover a range of care coordination domains.8
Consequently, our first aim was to develop a brief, comprehensive tool to measure care coordination from the perspective of hospital inpatient staff that could be used to compare different units or types of providers, or to conduct longitudinal assessment. The second aim was to conduct a preliminary evaluation of the tool in our healthcare setting, including to assess its psychometric properties, to describe provider perceptions of care coordination after the implementation of J-CHiP, and to explore potential differences among departments, types of professionals, and between the 2 hospitals.
METHODS
Development of the Care Coordination Questionnaire
The survey was developed in collaboration with leaders of the J-CHiP Acute Care Team. We met at the outset and on multiple subsequent occasions to align survey domains with the main components of the J-CHiP acute care intervention and to assure that the survey would be relevant and understandable to a variety of multidisciplinary professionals, including physicians, nurses, social workers, physical therapists, and other health professionals. Care was taken to avoid redundancy with existing evaluation efforts and to minimize respondent burden. This process helped to ensure the content validity of the items, the usefulness of the results, and the future usability of the tool.
We modeled the Care Coordination Questionnaire (CCQ) after the Safety Attitudes Questionnaire (SAQ),9 a widely used survey that is deployed approximately annually at JHH and JHBMC. While the SAQ focuses on healthcare provider attitudes about issues relevant to patient safety (often referred to as safety climate or safety culture), this new tool was designed to focus on healthcare professionals’ attitudes about care coordination. Similar to the way that the SAQ “elicits a snapshot of the safety climate through surveys of frontline worker perceptions,” we sought to elicit a picture of our care coordination climate through a survey of frontline hospital staff.
The CCQ was built upon the domains and approaches to care coordination described in the Agency for Healthcare Research and Quality Care Coordination Atlas.3 This report identifies 9 mechanisms for achieving care coordination, including the following: Establish Accountability or Negotiate Responsibility; Communicate; Facilitate Transitions; Assess Needs and Goals; Create a Proactive Plan of Care; Monitor, Follow Up, and Respond to Change; Support Self-Management Goals; Link to Community Resources; and Align Resources with Patient and Population Needs; as well as 5 broad approaches commonly used to improve the delivery of healthcare, including Teamwork Focused on Coordination, Healthcare Home, Care Management, Medication Management, and Health IT-Enabled Coordination.7 We generated at least 1 item to represent 8 of the 9 domains, as well as the broad approach described as Teamwork Focused on Coordination. After developing an initial set of items, we sought input from 3 senior leaders of the J-CHiP Acute Care Team to determine if the items covered the care coordination domains of interest, and to provide feedback on content validity. To test the interpretability of survey items and consistency across professional groups, we sent an initial version of the survey questions to at least 1 person from each of the following professional groups: hospitalist, social worker, case manager, clinical pharmacist, and nurse. We asked them to review all of our survey questions and to provide us with feedback on all aspects of the questions, such as whether they believed the questions were relevant and understandable to the members of their professional discipline, the appropriateness of the wording of the questions, and other comments. Modifications were made to the content and wording of the questions based on the feedback received. The final draft of the questionnaire was reviewed by the leadership team of the J-CHiP Acute Care Team to ensure its usefulness in providing actionable information.
The resulting 12-item questionnaire used a 5-point Likert response scale ranging from 1 = “disagree strongly” to 5 = “agree strongly,” and an additional option of “not applicable (N/A).” To help assess construct validity, a global question was added at the end of the questionnaire asking, “Overall, how would you rate the care coordination at the hospital of your primary work setting?” The response was measured on a 10-point Likert-type scale ranging from 1 = “totally uncoordinated care” to 10 = “perfectly coordinated care” (see Appendix). In addition, the questionnaire requested information about the respondents’ gender, position, and their primary unit, department, and hospital affiliation.
Data Collection Procedures
An invitation to complete an anonymous questionnaire was sent to the following inpatient care professionals: all nursing staff working on care coordination units in the departments of medicine, surgery, and neurology/neurosurgery, as well as physicians, pharmacists, acute care therapists (eg, occupational and physical therapists), and other frontline staff. All healthcare staff fitting these criteria was sent an e-mail with a request to fill out the survey online using QualtricsTM (Qualtrics Labs Inc., Provo, UT), as well as multiple follow-up reminders. The participants worked either at the JHH (a 1194-bed tertiary academic medical center in Baltimore, MD) or the JHBMC (a 440-bed academic community hospital located nearby). Data were collected from October 2015 through January 2016.
Analysis
Means and standard deviations were calculated by treating the responses as continuous variables. We tried 3 different methods to handle missing data: (1) without imputation, (2) imputing the mean value of each item, and (3) substituting a neutral score. Because all 3 methods produced very similar results, we treated the N/A responses as missing values without imputation for simplicity of analysis. We used STATA 13.1 (Stata Corporation, College Station, Texas) to analyze the data.
To identify subscales, we performed exploratory factor analysis on responses to the 12 specific items. Promax rotation was selected based on the simple structure. Subscale scores for each respondent were generated by computing the mean of responses to the items in the subscale. Internal consistency reliability of the subscales was estimated using Cronbach’s alpha. We calculated Pearson correlation coefficients for the items in each subscale, and examined Cronbach’s alpha deleting each item in turn. For each of the subscales identified and the global scale, we calculated the mean, standard deviation, median and interquartile range. Although distributions of scores tended to be non-normal, this was done to increase interpretability. We also calculated percent scoring at the ceiling (highest possible score).
We analyzed the data with 3 research questions in mind: Was there a difference in perceptions of care coordination between (1) staff affiliated with the 2 different hospitals, (2) staff affiliated with different clinical departments, or (3) staff with different professional roles? For comparisons based on hospital and department, and type of professional, nonparametric tests (Wilcoxon rank-sum and Kruskal-Wallis test) were used with a level of statistical significance set at 0.05. The comparison between hospitals and departments was made only among nurses to minimize the confounding effect of different distribution of professionals. We tested the distribution of “years in specialty” between hospitals and departments for this comparison using Pearson’s χ2 test. The difference was not statistically significant (P = 0.167 for hospitals, and P = 0.518 for departments), so we assumed that the potential confounding effect of this variable was negligible in this analysis. The comparison of scores within each professional group used the Friedman test. Pearson’s χ2 test was used to compare the baseline characteristics between 2 hospitals.
RESULTS
Among the 1486 acute care professionals asked to participate in the survey, 841 completed the questionnaire (response rate 56.6%). Table 1 shows the characteristics of the participants from each hospital. Table 2 summarizes the item response rates, proportion scoring at the ceiling, and weighting from the factor analysis. All items had completion rates of 99.2% or higher, with N/A responses ranging from 0% (item 2) to 3.1% (item 7). The percent scoring at the ceiling was 1.7% for the global item and ranged from 18.3% up to 63.3% for other individual items.
We also examined differences in perceptions of care coordination among nursing units to illustrate the tool’s ability to detect variation in Patient Engagement subscale scores for JHH nurses (see Appendix).
DISCUSSION
This study resulted in one of the first measurement tools to succinctly measure multiple aspects of care coordination in the hospital from the perspective of healthcare professionals. Given the hectic work environment of healthcare professionals, and the increasing emphasis on collecting data for evaluation and improvement, it is important to minimize respondent burden. This effort was catalyzed by a multifaceted initiative to redesign acute care delivery and promote seamless transitions of care, supported by the Center for Medicare & Medicaid Innovation. In initial testing, this questionnaire has evidence for reliability and validity. It was encouraging to find that the preliminary psychometric performance of the measure was very similar in 2 different settings of a tertiary academic hospital and a community hospital.
Our analysis of the survey data explored potential differences between the 2 hospitals, among different types of healthcare professionals and across different departments. Although we expected differences, we had no specific hypotheses about what those differences might be, and, in fact, did not observe any substantial differences. This could be taken to indicate that the intervention was uniformly and successfully implemented in both hospitals, and engaged various professionals in different departments. The ability to detect differences in care coordination at the nursing unit level could also prove to be beneficial for more precisely targeting where process improvement is needed. Further data collection and analyses should be conducted to more systematically compare units and to help identify those where practice is most advanced and those where improvements may be needed. It would also be informative to link differences in care coordination scores with patient outcomes. In addition, differences identified on specific domains between professional groups could be helpful to identify where greater efforts are needed to improve interdisciplinary practice. Sampling strategies stratified by provider type would need to be targeted to make this kind of analysis informative.
The consistently lower scores observed for patient engagement, from the perspective of care professionals in all groups, suggest that this is an area where improvement is needed. These findings are consistent with published reports on the common failure by hospitals to include patients as a member of their own care team. In addition to measuring care processes from the perspective of frontline healthcare workers, future evaluations within the healthcare system would also benefit from including data collected from the perspective of the patient and family.
This study had some limitations. First, there may be more than 4 domains of care coordination that are important and can be measured in the acute care setting from provider perspective. However, the addition of more domains should be balanced against practicality and respondent burden. It may be possible to further clarify priority domains in hospital settings as opposed to the primary care setting. Future research should be directed to find these areas and to develop a more comprehensive, yet still concise measurement instrument. Second, the tool was developed to measure the impact of a large-scale intervention, and to fit into the specific context of 2 hospitals. Therefore, it should be tested in different settings of hospital care to see how it performs. However, virtually all hospitals in the United States today are adapting to changes in both financing and healthcare delivery. A tool such as the one described in this paper could be helpful to many organizations. Third, the scoring system for the overall scale score is not weighted and therefore reflects teamwork more than other components of care coordination, which are represented by fewer items. In general, we believe that use of the subscale scores may be more informative. Alternative scoring systems might also be proposed, including item weighting based on factor scores.
For the purposes of evaluation in this specific instance, we only collected data at a single point in time, after the intervention had been deployed. Thus, we were not able to evaluate the effectiveness of the J-CHiP intervention. We also did not intend to focus too much on the differences between units, given the limited number of respondents from individual units. It would be useful to collect more data at future time points, both to test the responsiveness of the scales and to evaluate the impact of future interventions at both the hospital and unit level.
The preliminary data from this study have generated insights about gaps in current practice, such as in engaging patients in the inpatient care process. It has also increased awareness by hospital leaders about the need to achieve high reliability in the adoption of new procedures and interdisciplinary practice. This tool might be used to find areas in need of improvement, to evaluate the effect of initiatives to improve care coordination, to monitor the change over time in the perception of care coordination among healthcare professionals, and to develop better intervention strategies for coordination activities in acute care settings. Additional research is needed to provide further evidence for the reliability and validity of this measure in diverse settings.
Disclosure
The project described was supported by Grant Number 1C1CMS331053-01-00 from the US Department of Health and Human Services, Centers for Medicare & Medicaid Services. The contents of this publication are solely the responsibility of the authors and do not necessarily represent the official views of the US Department of Health and Human Services or any of its agencies. The research presented was conducted by the awardee. Results may or may not be consistent with or confirmed by the findings of the independent evaluation contractor.
The authors have no other disclosures.
1. McDonald KM, Sundaram V, Bravata DM, et al. Closing the Quality Gap: A Critical Analysis of Quality Improvement Strategies (Vol. 7: Care Coordination). Technical Reviews, No. 9.7. Rockville (MD): Agency for Healthcare Research and Quality (US); 2007. PubMed
2. Adams K, Corrigan J. Priority areas for national action: transforming health care quality. Washington, DC: National Academies Press; 2003. PubMed
3. Renders CM, Valk GD, Griffin S, Wagner EH, Eijk JT, Assendelft WJ. Interventions to improve the management of diabetes mellitus in primary care, outpatient and community settings. Cochrane Database Syst Rev. 2001(1):CD001481. PubMed
4. McAlister FA, Lawson FM, Teo KK, Armstrong PW. A systematic review of randomized trials of disease management programs in heart failure. Am J Med. 2001;110(5):378-384. PubMed
5. Bruce ML, Raue PJ, Reilly CF, et al. Clinical effectiveness of integrating depression care management into medicare home health: the Depression CAREPATH Randomized trial. JAMA Intern Med. 2015;175(1):55-64. PubMed
6. Berkowitz SA, Brown P, Brotman DJ, et al. Case Study: Johns Hopkins Community Health Partnership: A model for transformation. Healthc (Amst). 2016;4(4):264-270. PubMed
7. McDonald. KM, Schultz. E, Albin. L, et al. Care Coordination Measures Atlas Version 4. Rockville, MD: Agency for Healthcare Research and Quality; 2014.
8 Schultz EM, Pineda N, Lonhart J, Davies SM, McDonald KM. A systematic review of the care coordination measurement landscape. BMC Health Serv Res. 2013;13:119. PubMed
9. Sexton JB, Helmreich RL, Neilands TB, et al. The Safety Attitudes Questionnaire: psychometric properties, benchmarking data, and emerging research. BMC Health Serv Res. 2006;6:44. PubMed
© 2017 Society of Hospital Medicine
Hospitalizations with observation services and the Medicare Part A complex appeals process at three academic medical centers
Hospitalists and other inpatient providers are familiar with hospitalizations classified observation. The Centers for Medicare & Medicaid Services (CMS) uses the “2-midnight rule” to distinguish between outpatient services (which include all observation stays) and inpatient services for most hospitalizations. The rule states that “inpatient admissions will generally be payable … if the admitting practitioner expected the patient to require a hospital stay that crossed two midnights and the medical record supports that reasonable expectation.”1
Hospitalization under inpatient versus outpatient status is a billing distinction that can have significant financial consequences for patients, providers, and hospitals. The inpatient or outpatient observation orders written by hospitalists and other hospital-based providers direct billing based on CMS and other third-party regulation. However, providers may have variable expertise writing such orders. To audit the correct use of the visit-status orders by hospital providers, CMS uses recovery auditors (RAs), also referred to as recovery audit contractors.2,3
Historically, RAs had up to 3 years from date of service (DOS) to perform an audit, which involves asking a hospital for a medical record for a particular stay. The audit timeline includes 45 days for hospitals to produce such documentation, and 60 days for the RA either to agree with the hospital’s billing or to make an “overpayment determination” that the hospital should have billed Medicare Part B (outpatient) instead of Part A (inpatient).3,4 The hospital may either accept the RA decision, or contest it by using the pre-appeals discussion period or by directly entering the 5-level Medicare administrative appeals process.3,4 Level 1 and Level 2 appeals are heard by a government contractor, Level 3 by an administrative law judge (ALJ), Level 4 by a Medicare appeals council, and Level 5 by a federal district court. These different appeal types have different deadlines (Appendix 1). The deadlines for hospitals and government responses beyond Level 1 are set by Congress and enforced by CMS,3,4 and CMS sets discussion period timelines. Hospitals that miss an appeals deadline automatically default their appeals request, but there are no penalties for missed government deadlines.
Recently, there has been increased scrutiny of the audit-and-appeals process of outpatient and inpatient status determinations.5 Despite the 2-midnight rule, the Medicare Benefit Policy Manual (MBPM) retains the passage: “Physicians should use a 24-hour period as a benchmark, i.e., they should order admission for patients who are expected to need hospital care for 24 hours or more, and treat other patients on an outpatient basis.”6 Auditors often cite “medical necessity” in their decisions, which is not well defined in the MBPM and can be open to different interpretation. This lack of clarity likely contributed to the large number of status determination discrepancies between providers and RAs, thereby creating a federal appeals backlog that caused the Office of Medicare Hearings and Appeals to halt hospital appeals assignments7 and prompted an ongoing lawsuit against CMS regarding the lengthy appeals process.4 To address these problems and clear the appeals backlog, CMS proposed a “$0.68 settlement offer.”4 The settlement “offered an administrative agreement to any hospital willing to withdraw their pending appeals in exchange for timely partial payment (68% of the net allowable amount)”8 and paid out almost $1.5 billion to the third of eligible hospitals that accepted the offer.9 CMS also made programmatic improvements to the RA program.10
Despite these efforts, problems remain. On June 9, 2016, the U.S. Government Accountability Office (GAO) published Medicare Fee-for-Service: Opportunities Remain to Improve Appeals Process, citing an approximate 2000% increase in hospital inpatient appeals during the period 2010–2014 and the concern that appeals requests will continue to exceed adjudication capabilities.11 On July 5, 2016, CMS issued its proposed rule for appeals reform that allows the Medicare Appeals Council (Level 4) to set precedents which would be binding at lower levels and allows senior attorneys to handle some cases and effectively increase manpower at the Level 3 (ALJ). In addition, CMS proposes to revise the method for calculating dollars at risk needed to schedule an ALJ hearing, and develop methods to better adjudicate similar claims, and other process improvements aimed at decreasing the more than 750,000 current claims awaiting ALJ decisions.12
We conducted a study to better understand the Medicare appeals process in the context of the proposed CMS reforms by investigating all appeals reaching Level 3 at Johns Hopkins Hospital (JHH), University of Wisconsin Hospitals and Clinics (UWHC), and University of Utah Hospital (UU). Because relatively few cases nationally are appealed beyond Level 3, the study focused on most-relevant data.3 We examined time spent at each appeal Level and whether it met federally mandated deadlines, as well as the percentage accountable to hospitals versus government contractors or ALJs. We also recorded the overturn rate at Level 3 and evaluated standardized text in de-identified decision letters to determine criteria cited by contractors in their decisions to deny hospital appeal requests.
METHODS
The JHH, UWHC, and UU Institutional Review Boards did not require a review. The study included all complex Part A appeals involving DOS before October 1, 2013 and reaching Level 3 (ALJ) as of May 1, 2016.
Our general methods were described previously.2 Briefly, the 3 academic medical centers are geographically diverse. JHH is in region A, UWHC in region B, and UU in region D (3 of the 4 RA regions are represented). The hospitals had different Medicare administrative contractors but the same qualified independent contractor until March 1, 2015 (Appendix 2).
 at 3 Academic Medical Centers")
For this paper, time spent in the discussion period, if applicable, is included in appeals time, except as specified (Table 1). The term partially favorable is used for UU cases only, based on the O’Connor Hospital decision13 (Table 1). Reflecting ambiguity in the MBPM, for time-based encounter length of stay (LOS) statements, JHH and UU used time between admission order and discharge order, whereas UWHC used time between decision to admit (for emergency department patients) or time care began (direct admissions) and time patient stopped receiving care (Table 2). Although CMS now defines when a hospital encounter begins under the 2-midnight rule,14 there was no standard definition when the cases in this study were audited.

We reviewed de-identified standardized text in Level 1 and Level 2 decision letters. Each hospital designated an analyst to search letters for Medicare Benefit Policy Manual chapter 1, which references the 24-hour benchmark, or the MBPM statement regarding use of the 24-hour period as a benchmark to guide inpatient admission orders.6 Associated paragraphs that included these terms were coded and reviewed by Drs. Sheehy, Engel, and Locke to confirm that the 24-hour time-based benchmark was mentioned, as per the MBPM statement (Table 2, Appendix 3).
Descriptive statistics are used to describe the data, and representative de-identified standardized text is included.
RESULTS
Of 219 Level 3 cases, 135 (61.6%) concluded at Level 3. Of these 135 cases, 96 (71.1%) were decided in favor of the hospital, 11 (8.1%) were settled in the CMS $0.68 settlement offer, and 28 (20.7%) were unfavorable to the hospital (Table 1).
Mean total days since DOS was 1,663.3 (536.8) (mean [SD]), with median 1708 days. This included 560.4 (351.6) days between DOS and audit (median 556 days) and 891.3 (320.3) days in appeal (median 979 days). The hospitals were responsible for 29.3% of that time (260.7 [68.2] days) while government contractors were responsible for 70.7% (630.6 [277.2] days). Government contractors and ALJs met deadlines 47.7% of the time, meeting appeals deadlines 92.5% of the time for Discussion, 85.4% for Level 1, 38.8% for Level 2, and 0% for Level 3 (Table 1).
All “redetermination” (level 1 appeals letters) received at UU and UWHC, and all “reconsideration” (level 2 appeals letters) received by UU, UWHC, and JHH contained standardized time-based 24–hour benchmark text directly or referencing the MBPM containing such text, to describe criteria for inpatient status (Table 2 and Appendix 3).6 In total, 417 of 438 (95.2%) of Level 1 and Level 2 appeals results letters contained time-based 24-hour benchmark criteria for inpatient status despite 154 of 219 (70.3%) of denied cases exceeding a 24-hour LOS.
DISCUSSION
This study demonstrated process and timeliness concerns in the Medicare RA program for Level 3 cases at 3 academic medical centers. Although hospitals forfeit any appeal for which they miss a filing deadline, government contractors and ALJs met their deadlines less than half the time without default or penalty. Average time from the rendering of services to the conclusion of the audit-and-appeals process exceeded 4.5 years, which included an average 560 days between hospital stay and initial RA audit, and almost 900 days in appeals, with more than 70% of that time attributable to government contractors and ALJs.
Objective time-based 24-hour inpatient status criteria were referenced in 95% of decision letters, even though LOS exceeded 24 hours in more than 70% of these cases, suggesting that objective LOS data played only a small role in contractor decisions, or that contractors did not actually audit for LOS when reviewing cases. Unclear criteria likely contributed to payment denials and improper payments, despite admitting providers’ best efforts to comply with Medicare rules when writing visit-status orders. There was also a significant cost to hospitals; our prior study found that navigating the appeals process required 5 full-time equivalents per institution.2
At the 2 study hospitals with Level 3 decisions, more than two thirds of the decisions favored the hospital, suggesting the hospitals were justified in appealing RA Level 1 and Level 2 determinations. This proportion is consistent with the 43% ALJ overturn rate (including RA- and non-RA-derived appeals) cited in the recent U.S. Court of Appeals for the DC Circuit decision.9
This study potentially was limited by contractor and hospital use of the nonstandardized LOS calculation during the study period. That the majority of JHH and UU cases cited the 24-hour benchmark in their letters but nevertheless exceeded 24-hour LOS (using the most conservative definition of LOS) suggests contractors did not audit for or consider LOS in their decisions.
Our results support recent steps taken by CMS to reform the appeals process, including shortening the RA “look-back period” from 3 years to 6 months,10 which will markedly shorten the 560-day lag between DOS and audit found in this study. In addition, CMS has replaced RAs with beneficiary and family-centered care quality improvement organizations (BFCC-QIOs)1,8 for initial status determination audits. Although it is too soon to tell, the hope is that BFCC-QIOs will decrease the volume of audits and denials that have overwhelmed the system and most probably contributed to process delays and the appeals backlog.
However, our data demonstrate several areas of concern not addressed in the recent GAO report11 or in the rule proposed by CMS.12 Most important, CMS could consider an appeals deadline missed by a government contractor as a decision for the hospital, in the same way a hospital’s missed deadline defaults its appeal. Such equity would ensure due process and prevent another appeals backlog. In addition, the large number of Level 3 decisions favoring hospitals suggests a need for process improvement at the Medicare administrative contractor and qualified independent contractor Level of appeals—such as mandatory review of Level 1 and Level 2 decision letters for appeals overturned at Level 3, accountability for Level 1 and Level 2 contractors with high rates of Level 3 overturn, and clarification of criteria used to judge determinations.
Medicare fraud cannot be tolerated, and a robust auditing process is essential to the integrity of the Medicare program. CMS’s current and proposed reforms may not be enough to eliminate the appeals backlog and restore a timely and fair appeals process. As CMS explores bundled payments and other reimbursement reforms, perhaps the need to distinguish observation hospital care will be eliminated. Short of that, additional actions must be taken so that a just and efficient Medicare appeals system can be realized for observation hospitalizations.
Acknowledgments
For invaluable assistance in data preparation and presentation, the authors thank Becky Borchert, RN, MS, MBA, Program Manager for Medicare/Medicaid Utilization Review, University of Wisconsin Hospital and Clinics; Carol Duhaney, Calvin Young, and Joan Kratz, RN, Johns Hopkins Hospital; and Morgan Walker and Lisa Whittaker, RN, University of Utah.
Disclosure
Nothing to report.
1. Centers for Medicare & Medicaid Services, US Dept of Health and Human Services. Fact sheet: 2-midnight rule. https://www.cms.gov/Newsroom/MediaReleaseDatabase/Fact-sheets/2015-Fact-sheets-items/2015-07-01-2.html. Published July 1, 2015. Accessed August 9, 2016.
2. Sheehy AM, Locke C, Engel JZ, et al. Recovery Audit Contractor audits and appeals at three academic medical centers. J Hosp Med. 2015;10(4):212-219. PubMed
3. Centers for Medicare & Medicaid Services, US Dept of Health and Human Services. Recovery auditing in Medicare for fiscal year 2014. https://www.cms.gov/Research-Statistics-Data-and-Systems/Monitoring-Programs/Medicare-FFS-Compliance-Programs/Recovery-Audit-Program/Downloads/RAC-RTC-FY2014.pdf. Accessed August 9, 2016.
4. American Hospital Association vs Burwell. No 15-5015. Circuit court decision. https://www.cadc.uscourts.gov/internet/opinions.nsf/CDFE9734F0D36C2185257F540052A39D/$file/15-5015-1597907.pdf. Decided February 9, 2016. Accessed August 9, 2016
5. AMA news: Payment recovery audit program needs overhaul: Doctors to CMS. https://wire.ama-assn.org/ama-news/payment-recovery-audit-program-needs-overhaul-doctors-cms. Accessed March 17, 2017.
6. Centers for Medicare & Medicaid Services, US Dept of Health and Human Services. Inpatient hospital services covered under Part A. In: Medicare Benefit Policy Manual. Chapter 1. Publication 100-02. https://www.cms.gov/Regulations-and-Guidance/Guidance/Manuals/downloads/bp102c01.pdf. Accessed August 9, 2016.
7. Griswold NJ; Office of Medicare Hearings and Appeals, US Dept of Health and Human Services. Memorandum to OMHA Medicare appellants. http://www.modernhealthcare.com/assets/pdf/CH92573110.pdf. Accessed August 9, 2016.
8. Centers for Medicare & Medicaid Services, US Dept of Health and Human Services. Inpatient hospital reviews. https://www.cms.gov/Research-Statistics-Data-and-Systems/Monitoring-Programs/Medicare-FFS-Compliance-Programs/Medical-Review/InpatientHospitalReviews.html. Accessed August 9, 2016.
9. Galewitz P. CMS identifies hospitals paid nearly $1.5B in 2015 Medicare billing settlement. Kaiser Health News. http://khn.org/news/cms-identifies-hospitals-paid-nearly-1-5b-in-2015-medicare-billing-settlement/. Published August 23, 2016. Accessed October 14, 2016.
10. Centers for Medicare & Medicaid Services, US Dept of Health and Human Services. Recovery audit program improvements. https://www.cms.gov/research-statistics-data-and-systems/monitoring-programs/medicare-ffs-compliance-programs/recovery-audit-program/downloads/RAC-program-improvements.pdf. Accessed August 9, 2016.
11. US Government Accountability Office. Medicare Fee-for-Service: Opportunities Remain to Improve Appeals Process. http://www.gao.gov/assets/680/677034.pdf. Publication GAO-16-366. Published May 10, 2016. Accessed August 9, 2016.
12. Centers for Medicare & Medicaid Services, US Dept of Health and Human Services. Changes to the Medicare Claims and Entitlement, Medicare Advantage Organization Determination, and Medicare Prescription Drug Coverage Determination Appeals Procedures. https://www.gpo.gov/fdsys/pkg/FR-2016-07-05/pdf/2016-15192.pdf. Accessed August 9, 2016.
13. Departmental Appeals Board, US Dept of Health and Human Services. Action and Order of Medicare Appeals Council: in the case of O’Connor Hospital. http://www.hhs.gov/dab/divisions/medicareoperations/macdecisions/oconnorhospital.pdf. Accessed August 9, 2016.
14. Centers for Medicare & Medicaid Services, US Dept of Health and Human Services. Frequently asked questions: 2 midnight inpatient admission guidance & patient status reviews for admissions on or after October 1, 2013. https://www.cms.gov/Research-Statistics-Data-and-Systems/Monitoring-Programs/Medical-Review/Downloads/QAsforWebsitePosting_110413-v2-CLEAN.pdf. Accessed August 9, 2016.
Hospitalists and other inpatient providers are familiar with hospitalizations classified observation. The Centers for Medicare & Medicaid Services (CMS) uses the “2-midnight rule” to distinguish between outpatient services (which include all observation stays) and inpatient services for most hospitalizations. The rule states that “inpatient admissions will generally be payable … if the admitting practitioner expected the patient to require a hospital stay that crossed two midnights and the medical record supports that reasonable expectation.”1
Hospitalization under inpatient versus outpatient status is a billing distinction that can have significant financial consequences for patients, providers, and hospitals. The inpatient or outpatient observation orders written by hospitalists and other hospital-based providers direct billing based on CMS and other third-party regulation. However, providers may have variable expertise writing such orders. To audit the correct use of the visit-status orders by hospital providers, CMS uses recovery auditors (RAs), also referred to as recovery audit contractors.2,3
Historically, RAs had up to 3 years from date of service (DOS) to perform an audit, which involves asking a hospital for a medical record for a particular stay. The audit timeline includes 45 days for hospitals to produce such documentation, and 60 days for the RA either to agree with the hospital’s billing or to make an “overpayment determination” that the hospital should have billed Medicare Part B (outpatient) instead of Part A (inpatient).3,4 The hospital may either accept the RA decision, or contest it by using the pre-appeals discussion period or by directly entering the 5-level Medicare administrative appeals process.3,4 Level 1 and Level 2 appeals are heard by a government contractor, Level 3 by an administrative law judge (ALJ), Level 4 by a Medicare appeals council, and Level 5 by a federal district court. These different appeal types have different deadlines (Appendix 1). The deadlines for hospitals and government responses beyond Level 1 are set by Congress and enforced by CMS,3,4 and CMS sets discussion period timelines. Hospitals that miss an appeals deadline automatically default their appeals request, but there are no penalties for missed government deadlines.
Recently, there has been increased scrutiny of the audit-and-appeals process of outpatient and inpatient status determinations.5 Despite the 2-midnight rule, the Medicare Benefit Policy Manual (MBPM) retains the passage: “Physicians should use a 24-hour period as a benchmark, i.e., they should order admission for patients who are expected to need hospital care for 24 hours or more, and treat other patients on an outpatient basis.”6 Auditors often cite “medical necessity” in their decisions, which is not well defined in the MBPM and can be open to different interpretation. This lack of clarity likely contributed to the large number of status determination discrepancies between providers and RAs, thereby creating a federal appeals backlog that caused the Office of Medicare Hearings and Appeals to halt hospital appeals assignments7 and prompted an ongoing lawsuit against CMS regarding the lengthy appeals process.4 To address these problems and clear the appeals backlog, CMS proposed a “$0.68 settlement offer.”4 The settlement “offered an administrative agreement to any hospital willing to withdraw their pending appeals in exchange for timely partial payment (68% of the net allowable amount)”8 and paid out almost $1.5 billion to the third of eligible hospitals that accepted the offer.9 CMS also made programmatic improvements to the RA program.10
Despite these efforts, problems remain. On June 9, 2016, the U.S. Government Accountability Office (GAO) published Medicare Fee-for-Service: Opportunities Remain to Improve Appeals Process, citing an approximate 2000% increase in hospital inpatient appeals during the period 2010–2014 and the concern that appeals requests will continue to exceed adjudication capabilities.11 On July 5, 2016, CMS issued its proposed rule for appeals reform that allows the Medicare Appeals Council (Level 4) to set precedents which would be binding at lower levels and allows senior attorneys to handle some cases and effectively increase manpower at the Level 3 (ALJ). In addition, CMS proposes to revise the method for calculating dollars at risk needed to schedule an ALJ hearing, and develop methods to better adjudicate similar claims, and other process improvements aimed at decreasing the more than 750,000 current claims awaiting ALJ decisions.12
We conducted a study to better understand the Medicare appeals process in the context of the proposed CMS reforms by investigating all appeals reaching Level 3 at Johns Hopkins Hospital (JHH), University of Wisconsin Hospitals and Clinics (UWHC), and University of Utah Hospital (UU). Because relatively few cases nationally are appealed beyond Level 3, the study focused on most-relevant data.3 We examined time spent at each appeal Level and whether it met federally mandated deadlines, as well as the percentage accountable to hospitals versus government contractors or ALJs. We also recorded the overturn rate at Level 3 and evaluated standardized text in de-identified decision letters to determine criteria cited by contractors in their decisions to deny hospital appeal requests.
METHODS
The JHH, UWHC, and UU Institutional Review Boards did not require a review. The study included all complex Part A appeals involving DOS before October 1, 2013 and reaching Level 3 (ALJ) as of May 1, 2016.
Our general methods were described previously.2 Briefly, the 3 academic medical centers are geographically diverse. JHH is in region A, UWHC in region B, and UU in region D (3 of the 4 RA regions are represented). The hospitals had different Medicare administrative contractors but the same qualified independent contractor until March 1, 2015 (Appendix 2).
For this paper, time spent in the discussion period, if applicable, is included in appeals time, except as specified (Table 1). The term partially favorable is used for UU cases only, based on the O’Connor Hospital decision13 (Table 1). Reflecting ambiguity in the MBPM, for time-based encounter length of stay (LOS) statements, JHH and UU used time between admission order and discharge order, whereas UWHC used time between decision to admit (for emergency department patients) or time care began (direct admissions) and time patient stopped receiving care (Table 2). Although CMS now defines when a hospital encounter begins under the 2-midnight rule,14 there was no standard definition when the cases in this study were audited.
We reviewed de-identified standardized text in Level 1 and Level 2 decision letters. Each hospital designated an analyst to search letters for Medicare Benefit Policy Manual chapter 1, which references the 24-hour benchmark, or the MBPM statement regarding use of the 24-hour period as a benchmark to guide inpatient admission orders.6 Associated paragraphs that included these terms were coded and reviewed by Drs. Sheehy, Engel, and Locke to confirm that the 24-hour time-based benchmark was mentioned, as per the MBPM statement (Table 2, Appendix 3).
Descriptive statistics are used to describe the data, and representative de-identified standardized text is included.
RESULTS
Of 219 Level 3 cases, 135 (61.6%) concluded at Level 3. Of these 135 cases, 96 (71.1%) were decided in favor of the hospital, 11 (8.1%) were settled in the CMS $0.68 settlement offer, and 28 (20.7%) were unfavorable to the hospital (Table 1).
Mean total days since DOS was 1,663.3 (536.8) (mean [SD]), with median 1708 days. This included 560.4 (351.6) days between DOS and audit (median 556 days) and 891.3 (320.3) days in appeal (median 979 days). The hospitals were responsible for 29.3% of that time (260.7 [68.2] days) while government contractors were responsible for 70.7% (630.6 [277.2] days). Government contractors and ALJs met deadlines 47.7% of the time, meeting appeals deadlines 92.5% of the time for Discussion, 85.4% for Level 1, 38.8% for Level 2, and 0% for Level 3 (Table 1).
All “redetermination” (level 1 appeals letters) received at UU and UWHC, and all “reconsideration” (level 2 appeals letters) received by UU, UWHC, and JHH contained standardized time-based 24–hour benchmark text directly or referencing the MBPM containing such text, to describe criteria for inpatient status (Table 2 and Appendix 3).6 In total, 417 of 438 (95.2%) of Level 1 and Level 2 appeals results letters contained time-based 24-hour benchmark criteria for inpatient status despite 154 of 219 (70.3%) of denied cases exceeding a 24-hour LOS.
DISCUSSION
This study demonstrated process and timeliness concerns in the Medicare RA program for Level 3 cases at 3 academic medical centers. Although hospitals forfeit any appeal for which they miss a filing deadline, government contractors and ALJs met their deadlines less than half the time without default or penalty. Average time from the rendering of services to the conclusion of the audit-and-appeals process exceeded 4.5 years, which included an average 560 days between hospital stay and initial RA audit, and almost 900 days in appeals, with more than 70% of that time attributable to government contractors and ALJs.
Objective time-based 24-hour inpatient status criteria were referenced in 95% of decision letters, even though LOS exceeded 24 hours in more than 70% of these cases, suggesting that objective LOS data played only a small role in contractor decisions, or that contractors did not actually audit for LOS when reviewing cases. Unclear criteria likely contributed to payment denials and improper payments, despite admitting providers’ best efforts to comply with Medicare rules when writing visit-status orders. There was also a significant cost to hospitals; our prior study found that navigating the appeals process required 5 full-time equivalents per institution.2
At the 2 study hospitals with Level 3 decisions, more than two thirds of the decisions favored the hospital, suggesting the hospitals were justified in appealing RA Level 1 and Level 2 determinations. This proportion is consistent with the 43% ALJ overturn rate (including RA- and non-RA-derived appeals) cited in the recent U.S. Court of Appeals for the DC Circuit decision.9
This study potentially was limited by contractor and hospital use of the nonstandardized LOS calculation during the study period. That the majority of JHH and UU cases cited the 24-hour benchmark in their letters but nevertheless exceeded 24-hour LOS (using the most conservative definition of LOS) suggests contractors did not audit for or consider LOS in their decisions.
Our results support recent steps taken by CMS to reform the appeals process, including shortening the RA “look-back period” from 3 years to 6 months,10 which will markedly shorten the 560-day lag between DOS and audit found in this study. In addition, CMS has replaced RAs with beneficiary and family-centered care quality improvement organizations (BFCC-QIOs)1,8 for initial status determination audits. Although it is too soon to tell, the hope is that BFCC-QIOs will decrease the volume of audits and denials that have overwhelmed the system and most probably contributed to process delays and the appeals backlog.
However, our data demonstrate several areas of concern not addressed in the recent GAO report11 or in the rule proposed by CMS.12 Most important, CMS could consider an appeals deadline missed by a government contractor as a decision for the hospital, in the same way a hospital’s missed deadline defaults its appeal. Such equity would ensure due process and prevent another appeals backlog. In addition, the large number of Level 3 decisions favoring hospitals suggests a need for process improvement at the Medicare administrative contractor and qualified independent contractor Level of appeals—such as mandatory review of Level 1 and Level 2 decision letters for appeals overturned at Level 3, accountability for Level 1 and Level 2 contractors with high rates of Level 3 overturn, and clarification of criteria used to judge determinations.
Medicare fraud cannot be tolerated, and a robust auditing process is essential to the integrity of the Medicare program. CMS’s current and proposed reforms may not be enough to eliminate the appeals backlog and restore a timely and fair appeals process. As CMS explores bundled payments and other reimbursement reforms, perhaps the need to distinguish observation hospital care will be eliminated. Short of that, additional actions must be taken so that a just and efficient Medicare appeals system can be realized for observation hospitalizations.
Acknowledgments
For invaluable assistance in data preparation and presentation, the authors thank Becky Borchert, RN, MS, MBA, Program Manager for Medicare/Medicaid Utilization Review, University of Wisconsin Hospital and Clinics; Carol Duhaney, Calvin Young, and Joan Kratz, RN, Johns Hopkins Hospital; and Morgan Walker and Lisa Whittaker, RN, University of Utah.
Disclosure
Nothing to report.
1. Centers for Medicare & Medicaid Services, US Dept of Health and Human Services. Fact sheet: 2-midnight rule. https://www.cms.gov/Newsroom/MediaReleaseDatabase/Fact-sheets/2015-Fact-sheets-items/2015-07-01-2.html. Published July 1, 2015. Accessed August 9, 2016.
2. Sheehy AM, Locke C, Engel JZ, et al. Recovery Audit Contractor audits and appeals at three academic medical centers. J Hosp Med. 2015;10(4):212-219. PubMed
3. Centers for Medicare & Medicaid Services, US Dept of Health and Human Services. Recovery auditing in Medicare for fiscal year 2014. https://www.cms.gov/Research-Statistics-Data-and-Systems/Monitoring-Programs/Medicare-FFS-Compliance-Programs/Recovery-Audit-Program/Downloads/RAC-RTC-FY2014.pdf. Accessed August 9, 2016.
4. American Hospital Association vs Burwell. No 15-5015. Circuit court decision. https://www.cadc.uscourts.gov/internet/opinions.nsf/CDFE9734F0D36C2185257F540052A39D/$file/15-5015-1597907.pdf. Decided February 9, 2016. Accessed August 9, 2016
5. AMA news: Payment recovery audit program needs overhaul: Doctors to CMS. https://wire.ama-assn.org/ama-news/payment-recovery-audit-program-needs-overhaul-doctors-cms. Accessed March 17, 2017.
6. Centers for Medicare & Medicaid Services, US Dept of Health and Human Services. Inpatient hospital services covered under Part A. In: Medicare Benefit Policy Manual. Chapter 1. Publication 100-02. https://www.cms.gov/Regulations-and-Guidance/Guidance/Manuals/downloads/bp102c01.pdf. Accessed August 9, 2016.
7. Griswold NJ; Office of Medicare Hearings and Appeals, US Dept of Health and Human Services. Memorandum to OMHA Medicare appellants. http://www.modernhealthcare.com/assets/pdf/CH92573110.pdf. Accessed August 9, 2016.
8. Centers for Medicare & Medicaid Services, US Dept of Health and Human Services. Inpatient hospital reviews. https://www.cms.gov/Research-Statistics-Data-and-Systems/Monitoring-Programs/Medicare-FFS-Compliance-Programs/Medical-Review/InpatientHospitalReviews.html. Accessed August 9, 2016.
9. Galewitz P. CMS identifies hospitals paid nearly $1.5B in 2015 Medicare billing settlement. Kaiser Health News. http://khn.org/news/cms-identifies-hospitals-paid-nearly-1-5b-in-2015-medicare-billing-settlement/. Published August 23, 2016. Accessed October 14, 2016.
10. Centers for Medicare & Medicaid Services, US Dept of Health and Human Services. Recovery audit program improvements. https://www.cms.gov/research-statistics-data-and-systems/monitoring-programs/medicare-ffs-compliance-programs/recovery-audit-program/downloads/RAC-program-improvements.pdf. Accessed August 9, 2016.
11. US Government Accountability Office. Medicare Fee-for-Service: Opportunities Remain to Improve Appeals Process. http://www.gao.gov/assets/680/677034.pdf. Publication GAO-16-366. Published May 10, 2016. Accessed August 9, 2016.
12. Centers for Medicare & Medicaid Services, US Dept of Health and Human Services. Changes to the Medicare Claims and Entitlement, Medicare Advantage Organization Determination, and Medicare Prescription Drug Coverage Determination Appeals Procedures. https://www.gpo.gov/fdsys/pkg/FR-2016-07-05/pdf/2016-15192.pdf. Accessed August 9, 2016.
13. Departmental Appeals Board, US Dept of Health and Human Services. Action and Order of Medicare Appeals Council: in the case of O’Connor Hospital. http://www.hhs.gov/dab/divisions/medicareoperations/macdecisions/oconnorhospital.pdf. Accessed August 9, 2016.
14. Centers for Medicare & Medicaid Services, US Dept of Health and Human Services. Frequently asked questions: 2 midnight inpatient admission guidance & patient status reviews for admissions on or after October 1, 2013. https://www.cms.gov/Research-Statistics-Data-and-Systems/Monitoring-Programs/Medical-Review/Downloads/QAsforWebsitePosting_110413-v2-CLEAN.pdf. Accessed August 9, 2016.
© 2017 Society of Hospital Medicine
Observation, Visit Status, and RAC Audits
Medicare patients are increasingly hospitalized as outpatients under observation. From 2006 to 2012, outpatient services grew nationally by 28.5%, whereas inpatient discharges decreased by 12.6% per Medicare beneficiary.[1] This increased use of observation stays for hospitalized Medicare beneficiaries and the recent Centers for Medicare & Medicaid Services (CMS) 2‐Midnight rule for determination of visit status are increasing areas of concern for hospitals, policymakers, and the public,[2] as patients hospitalized under observation are not covered by Medicare Part A hospital insurance, are subject to uncapped out‐of‐pocket charges under Medicare Part B, and may be billed by the hospital for certain medications. Additionally, Medicare beneficiaries hospitalized in outpatient status, which includes all hospitalizations under observation, do not qualify for skilled nursing facility care benefits after discharge, which requires a stay that spans at least 3 consecutive midnights as an inpatient.[3]
In contrast, the federal Recovery Audit program, previously called and still commonly referred to as the Recovery Audit Contractor (RAC) program, responsible for postpayment review of inpatient claims, has received relatively little attention. Established in 2006, and fully operationalized in federal fiscal year (FY) 2010,[4] RACs are private government contractors granted the authority to audit hospital charts for appropriate medical necessity, which can consider whether the care delivered was indicated and whether it was delivered in the appropriate Medicare visit status, outpatient or inpatient. Criteria for hospitalization status (inpatient vs outpatient) as defined in the Medicare Conditions of Participation, often allow for subjectivity (medical judgment) in determining which status is appropriate.[5] Hospitals may contest RAC decisions and payment denials through a preappeals discussion period, then through a 5‐level appeals process. Although early appeals occur between the hospital and private contractors, appeals reaching level 3 are heard by the Department of Health and Human Services (HHS) Office of Medicare Hearings and Appeals (OMHA) Administrative Law Judges (ALJ). Levels 4 (Medicare Appeals Council) and 5 (United States District Court) appeals are also handled by the federal government.[6]
Medicare fraud and abuse should not be tolerated, and systematic surveillance needs to be an integral part of the Medicare program.[4] However, there are increasing concerns that the RAC program has resulted in overaggressive denials.[7, 8] Unlike other Medicare contractors, RAC auditors are paid a contingency fee based on the percentage of hospital payment recouped for cases they audit and deny for improper payment.[4] RACs are not subject to any financial penalty for cases they deny but are overturned in the discussion period or in the appeals process. This may create an incentive system that financially encourages RACs to assert improper payment, and the current system lacks both transparency and clear performance metrics for auditors. Of particular concern are Medicare Part A complex reviews, the most fiscally impactful area of RAC activity. According to CMS FY 2013 data, 41.1% of all claims with collections were complex reviews, yet these claims accounted for almost all (95.2%) of total dollars recovered by the RACs, with almost all (96%) dollars recovered being from Part A claims.[9] Complex reviews involve an auditor retrospectively and manually reviewing a medical record and then using his or her clinical and related professional judgment to decide whether the care was medically necessary. This is compared to automated coding or billing reviews, which are based solely on claims data.
Increased RAC activity and the willingness of hospitals to challenge RAC findings of improper payment has led to an increase in appeals volume that has overloaded the appeals process. On March 13, 2013, CMS offered hospitals the ability to rebill Medicare Part B as an appeals alternative.[10] This did not temper level 3 appeals requests received by the OMHA, which increased from 1250 per week in January 2012 to over 15,000 per week by November 2013.[11] Citing an overwhelmingly increased rate of appeal submissions and the resultant backlog, the OMHA decided to freeze new hospital appeals assignments in December 2013.[11] In another attempt to clear the backlog, on August 29, 2014, CMS offered a settlement that would pay hospitals 68% of the net allowable amount of the original Part A claim (minus any beneficiary deductibles) if a hospital agreed to concede all of its eligible appeals.[12] Notably, cases settled under this agreement would remain officially categorized as denied for improper payment.
The HHS Office of Inspector General (OIG)[4] and the CMS[9, 13, 14] have produced recent reports of RAC auditing and appeals activity that contain variable numbers that conflict with hospital accounts of auditing and appeals activity.[15, 16] In addition to these conflicting reports, little is known about RAC auditing of individual programs over time, the length of time cases spend in appeals, and staff required to navigate the audit and appeals processes. Given these questions, and the importance of RAC auditing pressure in the growth of hospital observation care, we conducted a retrospective descriptive study of all RAC activity for complex Medicare Part A alleged overpayment determinations at the Johns Hopkins Hospital, the University of Utah, and University of Wisconsin Hospital and Clinics for calendar years 2010 to 2013.
METHODS
The University of Wisconsin‐Madison Health Sciences institutional review board (IRB) and the Johns Hopkins Hospital IRB did not require review of this study. The University of Utah received an exemption. All 3 hospitals are tertiary care academic medical centers. The University of Wisconsin Hospital and Clinics (UWHC) is a 592‐bed hospital located in Madison, Wisconsin,[17] the Johns Hopkins Hospital (JHH) is a 1145‐bed medical center located in Baltimore, Maryland,[18] and the University of Utah Hospital (UU) is a 770‐bed facility in Salt Lake City, Utah (information available upon request). Each hospital is under a different RAC, representing 3 of the 4 RAC regions, and each is under a different Medicare Administrative Contractor, contractors responsible for level 1 appeals. The 3 hospitals have the same Qualified Independent Contractor responsible for level 2 appeals.
For the purposes of this study, any chart or medical record requested for review by an RAC was considered a medical necessity chart request or an audit. The terms overpayment determinations and denials were used interchangeably to describe audits the RACs alleged did not meet medical necessity for Medicare Part A billing. As previously described, the term medical necessity specifically considered not only whether actual medical services were appropriate, but also whether the services were delivered in the appropriate status, outpatient or inpatient. Appeals and/or request for discussion were cases where the overpayment determination was disputed and challenged by the hospital.
All complex review Medicare Part A RAC medical record requests by date of RAC request from the official start of the RAC program, January 1, 2010,[4] to December 31, 2013, were included in this study. Medical record requests for automated reviews that related to coding and billing clarifications were not included in this study, nor were complex Medicare Part B reviews, complex reviews for inpatient rehabilitation facilities, or psychiatric day hospitalizations. Notably, JHH is a Periodic Interim Payment (PIP) Medicare hospital, which is a reimbursement mechanism where biweekly payments [are] made to a Provider enrolled in the PIP program, and are based on the hospital's estimate of applicable Medicare reimbursement for the current cost report period.[19] Because PIP payments are made collectively to the hospital based on historical data, adjustments for individual inpatients could not be easily adjudicated and processed. Due to the increased complexity of this reimbursement mechanism, RAC audits did not begin at JHH until 2012. In addition, in contrast to the other 2 institutions, all of the RAC complex review audits at JHH in 2013 were for Part B cases, such as disputing need for intensity‐modulated radiation therapy versus conventional radiation therapy, or contesting the medical necessity of blepharoplasty. As a result, JHH had complex Part A review audits only for 2012 during the study time period. All data were deidentified prior to review by investigators.
As RACs can audit charts for up to 3 years after the bill is submitted,[13] a chart request in 2013 may represent a 2010 hospitalization, but for purposes of this study, was logged as a 2013 case. There currently is no standard methodology to calculate time spent in appeals. The UWHC and JHH calculate time in discussion or appeals from the day the discussion or appeal was initiated by the hospital, and the UU calculates the time in appeals from the date of the findings letter from the RAC, which makes comparable recorded time in appeals longer at UU (estimated 510 days for 20112013 cases, up to 120 days for 2010 cases).Time in appeals includes all cases that remain in the discussion or appeals process as of June 30, 2014.
The RAC process is as follows (Tables 1 and 2):
- The RAC requests hospital claims (RAC Medical Necessity Chart Requests [Audits]).
- The RAC either concludes the hospital claim was compliant as filed/paid and the process ends or the RAC asserts improper payment and requests repayment (RAC Overpayment Determinations of Requested Charts [Denials]).
- The hospital makes an initial decision to not contest the RAC decision (and repay), or to dispute the decision (Hospital Disputes Overpayment Determination [Appeal/Discussion]). Prior to filing an appeal, the hospital may request a discussion of the case with an RAC medical director, during which the RAC medical director can overturn the original determination. If the RAC declines to overturn the decision in discussion, the hospital may proceed with a formal appeal. Although CMS does not calculate the discussion period as part of the appeals process,[12] overpayment determinations contested by the hospital in either discussion or appeal represent the sum total of RAC denials disputed by the hospital.
Contested cases have 1 of 4 outcomes:
Contested overpayment determinations can be decided in favor of the hospital (Discussion or Appeal Decided in Favor of Hospital or RAC Withdrew)
- Contested overpayment determinations can be decided in favor of the RAC during the appeal process, and either the hospital exhausts the appeal process or elects not to take the appeal to the next level. Although the appeals process has 5 levels, no cases at our 3 hospitals have reached level 4 or 5, so cases without a decision to date remain in appeals at 1 of the first 3 levels (Case Still in Discussion or Appeals).[4]
- Hospital may miss an appeal deadline (Hospital Missed Appeal Deadline at Any Level) and the case is automatically decided in favor of the RAC.
- As of March 13, 2013,[10] for appeals that meet certain criteria and involve dispute over the billing of hospital services under Part A, CMS allowed hospitals to withdraw an appeal and rebill Medicare Part B. Prior to this time, hospitals could rebill for a very limited list of ancillary Part B Only services, and only within the 1‐year timely filing period.[13] Due to the lengthy appeals process and associated legal and administrative costs, hospitals may not agree with the RAC determination but make a business decision to recoup some payment under this mechanism (Hospital Chose to Rebill as Part B During Discussion or Appeals Process).
| Totals | Johns Hopkins Hospital | ||||||||||
|---|---|---|---|---|---|---|---|---|---|---|---|
| 2010 | 2011 | 2012 | 2013 | All Years | 2010 | 2011 | 2012 | 2013 | All Years | ||
| University of Wisconsin Hospital and Clinics | University of Utah | ||||||||||
| 2010 | 2011 | 2012 | 2013 | All Years | 2010 | 2011 | 2012 | 2013 | All Years | ||
| |||||||||||
| Total no. of Medicare encounters | 24,400 | 24,998 | 25,370 | 27,094 | 101,862 | 11,212b | 11,750b | 11,842 | 12,674c | 47,478 | |
| RAC Medical Necessity Chart Requests (Audits) | 547 | 1,735 | 3,887 | 1,941 | 8,110 (8.0%) | 0 | 0 | 938 | 0 | 938 (2.0%) | |
| RAC Overpayment Determinations Of Requested Charts (Denials)d | 164 (30.0%) | 516 (29.7%) | 1,200 (30.9%) | 656 (33.8%) | 2,536 (31.3%) | 0 (0%) | 0 (0%) | 432 (46.1%) | 0 (0%) | 432 (46.1%) | |
| Hospital Disputes Overpayment Determination (Appeal/Discussion) | 128 (78.0%) | 409 (79.3%) | 1,129 (94.1%) | 643 (98.0%) | 2,309 (91.0% | 0 (0%) | 0 (0%) | 431 (99.8%) | 0 (0%) | 431 (99.8%) | |
| Outcome of Disputed Overpayment Determinatione | |||||||||||
| Hospital Missed Appeal Deadline at Any Level | 0 (0.0%) | 1 (0.2%) | 13 (1.2%) | 4 (0.6%) | 18 (0.8%) | 0 (0%) | 0 (0%) | 0 (0.0%) | 0 (0%) | 0 (0.0%) | |
| Hospital Chose To Rebill as Part B During Discussion Or Appeals Process | 80 (62.5%) | 202 (49.4%) | 511 (45.3%) | 158 (24.6%) | 951 (41.2%) | 0 (0%) | 0 (0%) | 208 (48.3%) | 0 (0%) | 208 (48.3%) | |
| Discussion or Appeal Decided In Favor Of Hospital or RAC Withdrewf | 45 (35.2%) | 127 (31.1%) | 449 (39.8%) | 345 (53.7%) | 966 (41.8%) | 0 (0%) | 0 (0%) | 151 (35.0%) | 0 (0%) | 151 (35.0%) | |
| Case Still in Discussion or Appeals | 3 (2.3%) | 79 (19.3%) | 156 13.8%) | 136 (21.2%) | 374 (16.2%) | 0 (0%) | 0 (0%) | 72 (16.7%) | 0 (0%) | 72 (16.7%) | |
| Mean Time for Cases Still in Discussion or Appeals, d (SD) | 1208 (41) | 958 (79) | 518 (125) | 350 (101) | 555 (255) | N/A | N/A | 478 (164) | N/A | 478 (164) | |
| Total no. of Medicare encounters l | 8,096 | 8,038 | 8,429 | 9,086 | 33,649 | 5,092 | 5,210 | 5,099 | 5,334 | 20,735 | |
| RAC Medical Necessity Chart Requests (Audits) | 15 | 526 | 1,484 | 960 | 2,985 (8.9%) | 532 | 1,209 | 1,465 | 981 | 4,187 (20.2%) | |
| RAC Overpayment Determinations of Requested Charts (Denials)bd | 3 (20.0%) | 147 (27.9%) | 240 (16.2%) | 164 (17.1%) | 554 (18.6%) | 161 (30.3%) | 369 (30.5%) | 528 (36.0%) | 492 (50.2%) | 1,550 (37.0%) | |
| Hospital Disputes Overpayment Determination (Appeal/Discussion) | 1 (33.3%) | 71 (48.3%) | 170 (70.8%) | 151 (92.1%) | 393 (70.9%) | 127 (78.9%) | 338 (91.6%) | 528 (100.0%) | 492 (100.0%) | 1,485 (95.8%) | |
| Outcome of Disputed Overpayment Determinatione | |||||||||||
| Hospital Missed Appeal Deadline at Any Level | 0 (0.0%) | 1 (1.4%) | 0 (0.0%) | 4 (2.6%) | 5 (1.3%) | 0 (0.0%) | 0 (0.0%) | 13 (2.5%) | 0 (0.0%) | 13 (0.9%) | |
| Hospital Chose to Rebill as Part B During Discussion or Appeals Process | 1 (100%) | 3 (4.2%) | 13 (7.6%) | 3 (2.0%) | 20 (5.1%) | 79 (62.2%) | 199 (58.9%) | 290 (54.9%) | 155 (31.5%) | 723 (48.7%) | |
| Discussion or Appeal Decided in Favor of Hospital or RAC Withdrewf | 0 (0.0%) | 44 (62.0%) | 123 (72.4%) | 93 (61.6%) | 260 (66.2%) | 45 (35.4%) | 83 (24.6%) | 175 (33.1%) | 252 (51.2%) | 555 (37.4%) | |
| Case Still in Discussion or Appeals | 0 0.0% | 23 (32.4%) | 34 (20.0%) | 51 (33.8%) | 108 (27.5%) | 3 (2.4%) | 56 (16.6%) | 50 (9.5%) | 85 (17.3%) | 194 (13.1%) | |
| Mean Time for Cases Still in Discussion or Appeals, d (SD) | N/A | 926 (70) | 564 (90) | 323 (134) | 528 (258) | 1,208 (41) | 970 (80) | 544 (25) | 365 (72) | 599 (273) | |
| 2010 | 2011 | 2012 | 2013 | All | 2010 | 2011 | 2012 | 2013 | All | |
|---|---|---|---|---|---|---|---|---|---|---|
| Total Appeals With Decisions | Johns Hopkins Hospital | |||||||||
| Total no. | 125 | 330 | 973 | 507 | 1,935 | 0 | 0 | 359 | 0 | 359 |
| ||||||||||
| Hospital Missed Appeal Deadline at Any Level | 0 (0.0%) | 1 (0.3%) | 13 (1.3%) | 4 (0.8%) | 18 (0.9%) | 0 (0.0%) | 0 (0.0%) | 0 (0.0%) | 0 (0.0%) | 0 (0.0%) |
| Hospital Chose to Rebill as Part B During Discussion or Appeals Process | 80 (64.0%) | 202 (61.2%) | 511 (52.5%) | 158 (31.2%) | 951 (49.1%) | 0 (0.0%) | 0 (0.0%) | 208 (57.9%) | 0 (0.0%) | 208 (57.9%) |
| Discussion or Appeal Decided in Favor of Hospital or RAC Withdrew | 45 (36.0%) | 127 (38.5%) | 449 (46.1%) | 345 (68.0%) | 966 (49.9%) | 0 (0.0%) | 0 (0.0%) | 151 (42.1%) | 0 (0.0%) | 151 (42.1%) |
| Discussion Period and RAC Withdrawals | 0 (0.0%) | 59 (17.9%) | 351 (36.1%) | 235 (46.4%) | 645 (33.3%) | 0 (0.0%) | 0 (0.0%) | 139 (38.7%) | 0 (0.0%) | 139 (38.7%) |
| Level 1 Appeal | 10 (8.0%) | 22 (6.7%) | 60 (6.2%) | 62 (12.2%)1 | 154 (8.0%) | 0 (0.0%) | 0 (0.0%) | 2 (0.6%) | 0 (0.0%) | 2 (0.6%) |
| Level 2 Appeal | 22 (17.6%) | 36 (10.9%) | 38 (3.9%) | 48 (9.5%)1 | 144 (7.4%) | 0 (0.0%) | 0 (0.0%) | 10 (2.8%) | 0 (0.0%) | 10 (2.8%) |
| Level 3 Appealc | 13 (10.4%) | 10 (3.0%) | N/A (N/A) | N/A (N/A) | 23 (1.2%) | 0 (0.0%) | 0 (0.0%) | N/A (N/A) | 0 (0.0%) | 0 (0.0%) |
| 2010 | 2011 | 2012 | 2013 | All | 2010 | 2011 | 2012 | 2013 | All | |
| University of Wisconsin Hospital and Clinics | University of Utah | |||||||||
| Total no. | 1 | 48 | 136 | 100 | 285 | 124 | 282 | 478 | 407 | 1,291 |
| Hospital Missed Appeal Deadline at Any Level | 0 (0.0%) | 1 (2.1% | 0 (0.0%) | 4 (4.0%) | 5 (1.8%) | 0 (0.0%) | 0 (0.0%) | 13 (2.7%) | 0 (0.0%) | 13 (1.0%) |
| Hospital Chose to Rebill as Part B During Discussion or Appeals Process | 1 (100.0%) | 3 (6.3% | 13 (9.6%) | 3 (3.0%) | 20 (7.0%) | 79 (63.7%) | 199 (70.6%) | 290 (60.7%) | 155 (38.1%) | 723 (56.0%) |
| Discussion or Appeal Decided in Favor of Hospital or RAC Withdrewb | 0 (0.0%) | 44 (91.7%) | 123 (90.4%) | 93 (93.0%) | 260 (91.2%) | 45 (36.3%) | 83 (29.4%) | 175 (36.6%) | 252 (61.9%) | 555 (43.0%) |
| Discussion Period and RAC Withdrawals | 0 (0.0%) | 38 (79.2%) | 66 (48.5%) | 44 (44.0%) | 148 (51.9% | 0 (0.0%) | 21 (7.4%) | 146 (30.5%) | 191 (46.9%) | 358 (27.7%) |
| Level 1 Appeal | 0 (0.0%) | 2 (4.2%) | 47 (34.6%) | 34 (34.0%) | 83 (29.1%) | 10 (8.1%) | 20 (7.1%) | 11 (2.3%) | 28 (6.9%) | 69 (5.3%) |
| Level 2 Appeal | 0 (0.0%) | 4 (8.3%) | 10 (7.4%) | 15 (15.0%) | 29 (10.2%) | 22 (17.7%) | 32 (11.3%) | 18 (3.8%) | 33 (8.1%) | 105 (8.1%) |
| Level 3 Appealc | 0 (0.0%) | N/A (N/A) | N/A (N/A) | N/A (N/A) | 0 (0.0%) | 13 (10.5%) | 10 (3.5%) | N/A (N/A) | N/A(N/A) | 23 (1.8%) |
The administration at each hospital provided labor estimates for workforce dedicated to the review process generated by the RACs based on hourly accounting of one‐quarter of work during 2012, updated to FY 2014 accounting (Table 3). Concurrent case management status determination work was not included in these numbers due to the difficulty in solely attributing concurrent review workforce numbers to the RACs, as concurrent case management is a CMS Condition of Participation irrespective of the RAC program.
| JHH | UWHC | UU | Mean | |
|---|---|---|---|---|
| ||||
| Physicians: assist with status determinations, audits, and appeals | 1.0 | 0.5 | 0.6 | 0.7 |
| Nursing administration: audit and appeal preparation | 0.9 | 0.2 | 1.9 | 1.0 |
| Legal counsel: assist with rules interpretation, audit, and appeal preparation | 0.2 | 0.3 | 0.1 | 0.2 |
| Data analyst: prepare and track reports of audit and appeals | 2.0 | 1.8 | 2.4 | 2.0 |
| Administration and other directors | 2.3 | 0.9 | 0.3 | 1.2 |
| Total FTE workforce | 6.4 | 3.7 | 5.3 | 5.1 |
Statistics
Descriptive statistics were used to describe the data. Staffing numbers are expressed as full‐time equivalents (FTE).
RESULTS
Yearly Medicare Encounters and RAC Activity of Part A Complex Reviews
RACs audited 8.0% (8110/101,862) of inpatient Medicare cases, alleged noncompliance (all overpayments) for 31.3% (2536/8110) of Part A complex review cases requested, and the hospitals disputed 91.0% (2309/2536) of these assertions. None of these cases of alleged noncompliance claimed the actual medical services were unnecessary. Rather, every Part A complex review overpayment determination by all 3 RACs contested medical necessity related to outpatient versus inpatient status. In 2010 and 2011, there were in aggregate fewer audits (2282), overpayment determinations (680), and appeals or discussion requests (537 of 680, 79.0%), compared to audits (5828), overpayment determinations (1856), and appeals or discussion requests (1772 of 1856, 95.5%) in 2012 and 2013. The hospitals appealed or requested discussion of a greater percentage each successive year (2010, 78.0%; 2011, 79.3%; 2012, 94.1%; and 2013, 98.0%). This increased RAC activity, and hospital willingness to dispute the RAC overpayment determinations equaled a more than 300% increase in appeals and discussion request volume related to Part A complex review audits in just 2 years.
The 16.2% (374/2309) of disputed cases still under discussion or appeal have spent an average mean of 555 days (standard deviation 255 days) without a decision, with time in appeals exceeding 900 days for cases from 2010 and 2011. Notably, the 3 programs were subject to Part A complex review audits at widely different rates (Table 1).
Yearly RAC Part A Complex Review Overpayment Determinations Disputed by Hospitals With Decisions
The hospitals won, either in discussion or appeal, a combined greater percentage of contested overpayment determinations annually, from 36.0% (45/125) in 2010, to 38.5% (127/330) in 2011, to 46.1% (449/973) in 2012, to 68.0% (345/507) in 2013. Overall, for 49.1% (951/1935) of cases with decisions, the hospitals withdrew or rebilled under Part B at some point in the discussion or appeals process to avoid the lengthy appeals process and/or loss of the amount of the entire claim. A total of 49.9% (966/1935) of appeals with decisions have been won in discussion or appeal over the 4‐year study period. One‐third of all resolved cases (33.3%, 645/1935) were decided in favor of the hospital in the discussion period, with these discussion cases accounting for two‐thirds (66.8%, 645/966) of all favorable resolved cases for the hospital. Importantly, if cases overturned in discussion were omitted as they are in federal reports, the hospitals' success rate would fall to 16.6% (321/1935), a number similar to those that appear in annual CMS reports.[9, 13, 14] The hospitals also conceded 18 cases (0.9%) by missing a filing deadline (Table 2).
Estimated Workforce Dedicated to Part A Complex Review Medical Necessity Audits and Appeals
The institutions each employ an average of 5.1 FTE staff to manage the audit and appeal process, a number that does not include concurrent case management staff who assist in daily status determinations (Table 3).
CONCLUSIONS
In this study of 3 academic medical centers, there was a more than 2‐fold increase in RAC audits and a nearly 3‐fold rise in overpayment determinations over the last 2 calendar years of the study, resulting in a more than 3‐fold increase in appeals or requests for discussion in 2012 to 2013 compared to 2010 to 2011. In addition, although CMS manually reviews less than 0.3% of submitted claims each year through programs such as the Recovery Audit Program,[9] at the study hospitals, complex Part A RAC audits occurred at a rate more than 25 times that (8.0%), suggesting that these types of claims are a disproportionate focus of auditing activity. The high overall complex Part A audit rate, accompanied by acceleration of RAC activity and the hospitals' increased willingness to dispute RAC overpayment determinations each year, if representative of similar institutions, would explain the appeals backlog, most notably at the ALJ (level 3) level. Importantly, none of these Part A complex review denials contested a need for the medical care delivered, demonstrating that much of the RAC process at the hospitals focused exclusively on the nuances of medical necessity and variation in interpretation of CMS guidelines that related to whether hospital care should be provided under inpatient or outpatient status.
These data also show continued aggressive RAC audit activity despite an increasing overturn rate in favor of the hospitals in discussion or on appeal each year (from 36.0% in 2010 to 68.0% in 2013). The majority of the hospitals' successful decisions occurred in the discussion period, when the hospital had the opportunity to review the denial with the RAC medical director, a physician, prior to beginning the official appeals process. The 33% overturn rate found in the discussion period represents an error rate by the initial RAC auditors that was internally verified by the RAC medical director. The RAC internal error rate was replicated at 3 different RACs, highlighting internal process problems across the RAC system. This is concerning, because the discussion period is not considered part of the formal appeals process, so these cases are not appearing in CMS or OIG reports of RAC activity, leading to an underestimation of the true successful overturned denial rates at the 3 study hospitals, and likely many other hospitals.
The study hospitals are also being denied timely due process and payments for services delivered. The hospitals currently face an appeals process that, on average, far exceeds 500 days. In almost half of the contested overpayment determinations, the hospitals withdrew a case or rebilled Part B, not due to agreement with a RAC determination, but to avoid the lengthy, cumbersome, and expensive appeals process and/or to minimize the risk of losing the amount of the entire Part A claim. This is concerning, as cases withdrawn in the appeals process are considered improper payments in federal reports, despite a large number of these cases being withdrawn simply to avoid an inefficient appeals process. Notably, Medicare is not adhering to its own rules, which require appeals to be heard in a timely manner, specifically 60 days for level 1 or 2 appeals, and 90 days for a level 3 appeal,[6, 20] even though the hospitals lost the ability to appeal cases when they missed a deadline. Even if hospitals agreed to the recent 68% settlement offer[12] from CMS, appeals may reaccumulate without auditing reform. As noted earlier, this recent settlement offer came more than a year after the enhanced ability to rebill denied Part A claims for Part B, yet the backlog remains.
This study also showed that a large hospital workforce is required to manage the lengthy audit and appeals process generated by RACs. These staff are paid with funds that could be used to provide direct patient care or internal process improvement. The federal government also directly pays for unchecked RAC activity through the complex appeals process. Any report of dollars that RACs recoup for the federal government should be considered in light of their administrative costs to hospitals and government contractors, and direct costs at the federal level.
This study also showed that RACs audited the 3 institutions differently, despite similar willingness of the hospitals to dispute overpayment determinations and similar hospital success rates in appeals or discussion, suggesting that hospital compliance with Medicare policy was not the driver of variable RAC activity. This variation may be due to factors not apparent in this study, such as variable RAC interpretation of federal policy, a decision of a particular RAC to focus on complex Medicare Part B or automated reviews instead of complex Part A reviews, or RAC workforce differences that are not specific to the hospitals. Regardless, the variation in audit activity suggests that greater transparency and accountability in RAC activity is merited.
Perhaps most importantly, this study highlights factors that may help explain differing auditing and appeals numbers reported by the OIG,[4] CMS,[9, 13, 14] and hospitals.[15, 16] Given the marked increase in RAC activity over the last 4 years, the 2010 and 2011 data included in a recent OIG report[4] likely do not represent current auditing and appeals practice. With regard to the CMS reports,[9, 13, 14] although CMS included FY 2013[9] activity in its most recent report, it did not account for denials overturned in the discussion period, as these are not technically appeals, even though these are contested cases decided in favor of the hospital. This most recent CMS report[9] uses overpayment determinations from FY 2013, yet counts appeals and decisions that occurred in 2013, with the comment that these decisions may be for overpayment determinations prior to 2013. The CMS reports also variably combine automated, semiautomated, complex Part A, and complex Part B claims in its reports, making interpretation challenging. Finally, although CMS reported an increase in improper payments recovered from FY 2011[14] ($939 million) to FY 2012[13] ($2.4 billion) to FY 2013[9] ($3.75 billion), this is at least partly a reflection of increased RAC activity as demonstrated in this study, and may reflect the fact that many hospitals do not have the resources to continually appeal or choose not to contest these cases based on a financial business decision. Importantly, these numbers now far exceed recoupment in other quality programs, such as the Readmissions Reduction Program (estimated $428 million next FY),[21] indicating the increased fiscal impact of the RAC program on hospital reimbursement.
To increase accuracy, future federal reports of auditing and appeals should detail and include cases overturned in the discussion period, and carefully describe the denominator of total audits and appeals given the likelihood that many appeals in a given year will not have a decision in that year. Percent of total Medicare claims subject to complex Part A audit should be stated. Reports should also identify and consider an alternative classification for complex Part A cases the hospital elects to rebill under Medicare Part B, and also detail on what grounds medical necessity is being contested (eg, whether the actual care delivered was not necessary or if it is an outpatient versus inpatient billing issue). Time spent in the appeals process must also be reported. Complex Part A, complex Part B, semiautomated, and automated reviews should also be considered separately, and dates of reported audits and appeals must be as current as possible in this rapidly changing environment.
In this study, RACs conducted complex Part A audits at a rate 25 times the CMS‐reported overall audit rate, confirming complex Part A audits are a particular focus of RAC activity. There was a more than doubling of RAC audits at the study hospitals from the years 2010 ‐ 2011 to 2012 ‐ 2013 and a nearly 3‐fold increase in overpayment determinations. Concomitantly, the more than 3‐fold increase in appeals and discussion volume over this same time period was consistent with the development of the current national appeals backlog. The 3 study hospitals won a greater percentage of contested cases each year, from approximately one‐third of cases in 2010 to two‐thirds of cases with decisions in 2013, but there was no appreciable decrease in RAC overpayment determinations over that time period. The majority of successfully challenged cases were won in discussion, favorable decisions for hospitals not appearing in federal appeals reports. Time in appeals exceeded 550 days, causing the hospitals to withdraw some cases to avoid the lengthy appeals process and/or to minimize the risk of losing the amount of the entire Part A claim. The hospitals also lost a small number of appeals by missing a filing deadline, yet there was no reciprocal case concession when the appeals system missed a deadline. RACs found no cases of care at the 3 hospitals that should not have been delivered, but rather challenged the status determination (inpatient vs outpatient) to dispute medical necessity of care delivered. Finally, an average of approximately 5 FTEs at each institution were employed in the audits and appeals process. These data support a need for systematic improvements in the RAC system so that fair, constructive, and cost‐efficient surveillance of the Medicare program can be realized.
Acknowledgements
The authors thank Becky Borchert, MS, RN BC, ACM, CPHQ, Program Manager for Medicare/Medicaid Utilization Review at the University of Wisconsin Hospital and Clinics; Carol Duhaney and Joan Kratz, RN, at Johns Hopkins Hospital; and Morgan Walker at the University of Utah for their assistance in data preparation and presentation. Without their meticulous work and invaluable assistance, this study would not have been possible. The authors also thank Josh Boswell, JD, for his critical review of the manuscript.
Disclosure: Nothing to report.
- Medicare Payment Advisory Commission. Hospital inpatient and observation services. 2014 Report to Congress. Medicare Payment Policy. Available at: http://www.medpac.gov/documents/reports/mar14_entirereport.pdf?sfvrsn=0. Accessed September 22, 2014.
- American Hospital Association “2‐midnight rule” lawsuit vs Department of Health and Human Services. Available at: http://www.aha.org/content/14/140414‐complaint‐2midnight.pdf. Accessed August 8, 2014.
- Centers for Medicare administrative law judge hearing program for Medicare claim appeals. Fed Regist. 2014;79(214): 65660 – 65663. Available at: http://www.hhs.gov/omha/files/omha_federal_register_notice_2014–26214.pdf. Accessed December 6, 2014.
- . Medicare fines 2,610 hospitals in third round of readmission penalties. Kaiser Health News. Available at: http://kaiserhealthnews.org/news/medicare‐readmissions‐penalties‐2015. Accessed November 30, 2014.
Medicare patients are increasingly hospitalized as outpatients under observation. From 2006 to 2012, outpatient services grew nationally by 28.5%, whereas inpatient discharges decreased by 12.6% per Medicare beneficiary.[1] This increased use of observation stays for hospitalized Medicare beneficiaries and the recent Centers for Medicare & Medicaid Services (CMS) 2‐Midnight rule for determination of visit status are increasing areas of concern for hospitals, policymakers, and the public,[2] as patients hospitalized under observation are not covered by Medicare Part A hospital insurance, are subject to uncapped out‐of‐pocket charges under Medicare Part B, and may be billed by the hospital for certain medications. Additionally, Medicare beneficiaries hospitalized in outpatient status, which includes all hospitalizations under observation, do not qualify for skilled nursing facility care benefits after discharge, which requires a stay that spans at least 3 consecutive midnights as an inpatient.[3]
In contrast, the federal Recovery Audit program, previously called and still commonly referred to as the Recovery Audit Contractor (RAC) program, responsible for postpayment review of inpatient claims, has received relatively little attention. Established in 2006, and fully operationalized in federal fiscal year (FY) 2010,[4] RACs are private government contractors granted the authority to audit hospital charts for appropriate medical necessity, which can consider whether the care delivered was indicated and whether it was delivered in the appropriate Medicare visit status, outpatient or inpatient. Criteria for hospitalization status (inpatient vs outpatient) as defined in the Medicare Conditions of Participation, often allow for subjectivity (medical judgment) in determining which status is appropriate.[5] Hospitals may contest RAC decisions and payment denials through a preappeals discussion period, then through a 5‐level appeals process. Although early appeals occur between the hospital and private contractors, appeals reaching level 3 are heard by the Department of Health and Human Services (HHS) Office of Medicare Hearings and Appeals (OMHA) Administrative Law Judges (ALJ). Levels 4 (Medicare Appeals Council) and 5 (United States District Court) appeals are also handled by the federal government.[6]
Medicare fraud and abuse should not be tolerated, and systematic surveillance needs to be an integral part of the Medicare program.[4] However, there are increasing concerns that the RAC program has resulted in overaggressive denials.[7, 8] Unlike other Medicare contractors, RAC auditors are paid a contingency fee based on the percentage of hospital payment recouped for cases they audit and deny for improper payment.[4] RACs are not subject to any financial penalty for cases they deny but are overturned in the discussion period or in the appeals process. This may create an incentive system that financially encourages RACs to assert improper payment, and the current system lacks both transparency and clear performance metrics for auditors. Of particular concern are Medicare Part A complex reviews, the most fiscally impactful area of RAC activity. According to CMS FY 2013 data, 41.1% of all claims with collections were complex reviews, yet these claims accounted for almost all (95.2%) of total dollars recovered by the RACs, with almost all (96%) dollars recovered being from Part A claims.[9] Complex reviews involve an auditor retrospectively and manually reviewing a medical record and then using his or her clinical and related professional judgment to decide whether the care was medically necessary. This is compared to automated coding or billing reviews, which are based solely on claims data.
Increased RAC activity and the willingness of hospitals to challenge RAC findings of improper payment has led to an increase in appeals volume that has overloaded the appeals process. On March 13, 2013, CMS offered hospitals the ability to rebill Medicare Part B as an appeals alternative.[10] This did not temper level 3 appeals requests received by the OMHA, which increased from 1250 per week in January 2012 to over 15,000 per week by November 2013.[11] Citing an overwhelmingly increased rate of appeal submissions and the resultant backlog, the OMHA decided to freeze new hospital appeals assignments in December 2013.[11] In another attempt to clear the backlog, on August 29, 2014, CMS offered a settlement that would pay hospitals 68% of the net allowable amount of the original Part A claim (minus any beneficiary deductibles) if a hospital agreed to concede all of its eligible appeals.[12] Notably, cases settled under this agreement would remain officially categorized as denied for improper payment.
The HHS Office of Inspector General (OIG)[4] and the CMS[9, 13, 14] have produced recent reports of RAC auditing and appeals activity that contain variable numbers that conflict with hospital accounts of auditing and appeals activity.[15, 16] In addition to these conflicting reports, little is known about RAC auditing of individual programs over time, the length of time cases spend in appeals, and staff required to navigate the audit and appeals processes. Given these questions, and the importance of RAC auditing pressure in the growth of hospital observation care, we conducted a retrospective descriptive study of all RAC activity for complex Medicare Part A alleged overpayment determinations at the Johns Hopkins Hospital, the University of Utah, and University of Wisconsin Hospital and Clinics for calendar years 2010 to 2013.
METHODS
The University of Wisconsin‐Madison Health Sciences institutional review board (IRB) and the Johns Hopkins Hospital IRB did not require review of this study. The University of Utah received an exemption. All 3 hospitals are tertiary care academic medical centers. The University of Wisconsin Hospital and Clinics (UWHC) is a 592‐bed hospital located in Madison, Wisconsin,[17] the Johns Hopkins Hospital (JHH) is a 1145‐bed medical center located in Baltimore, Maryland,[18] and the University of Utah Hospital (UU) is a 770‐bed facility in Salt Lake City, Utah (information available upon request). Each hospital is under a different RAC, representing 3 of the 4 RAC regions, and each is under a different Medicare Administrative Contractor, contractors responsible for level 1 appeals. The 3 hospitals have the same Qualified Independent Contractor responsible for level 2 appeals.
For the purposes of this study, any chart or medical record requested for review by an RAC was considered a medical necessity chart request or an audit. The terms overpayment determinations and denials were used interchangeably to describe audits the RACs alleged did not meet medical necessity for Medicare Part A billing. As previously described, the term medical necessity specifically considered not only whether actual medical services were appropriate, but also whether the services were delivered in the appropriate status, outpatient or inpatient. Appeals and/or request for discussion were cases where the overpayment determination was disputed and challenged by the hospital.
All complex review Medicare Part A RAC medical record requests by date of RAC request from the official start of the RAC program, January 1, 2010,[4] to December 31, 2013, were included in this study. Medical record requests for automated reviews that related to coding and billing clarifications were not included in this study, nor were complex Medicare Part B reviews, complex reviews for inpatient rehabilitation facilities, or psychiatric day hospitalizations. Notably, JHH is a Periodic Interim Payment (PIP) Medicare hospital, which is a reimbursement mechanism where biweekly payments [are] made to a Provider enrolled in the PIP program, and are based on the hospital's estimate of applicable Medicare reimbursement for the current cost report period.[19] Because PIP payments are made collectively to the hospital based on historical data, adjustments for individual inpatients could not be easily adjudicated and processed. Due to the increased complexity of this reimbursement mechanism, RAC audits did not begin at JHH until 2012. In addition, in contrast to the other 2 institutions, all of the RAC complex review audits at JHH in 2013 were for Part B cases, such as disputing need for intensity‐modulated radiation therapy versus conventional radiation therapy, or contesting the medical necessity of blepharoplasty. As a result, JHH had complex Part A review audits only for 2012 during the study time period. All data were deidentified prior to review by investigators.
As RACs can audit charts for up to 3 years after the bill is submitted,[13] a chart request in 2013 may represent a 2010 hospitalization, but for purposes of this study, was logged as a 2013 case. There currently is no standard methodology to calculate time spent in appeals. The UWHC and JHH calculate time in discussion or appeals from the day the discussion or appeal was initiated by the hospital, and the UU calculates the time in appeals from the date of the findings letter from the RAC, which makes comparable recorded time in appeals longer at UU (estimated 510 days for 20112013 cases, up to 120 days for 2010 cases).Time in appeals includes all cases that remain in the discussion or appeals process as of June 30, 2014.
The RAC process is as follows (Tables 1 and 2):
- The RAC requests hospital claims (RAC Medical Necessity Chart Requests [Audits]).
- The RAC either concludes the hospital claim was compliant as filed/paid and the process ends or the RAC asserts improper payment and requests repayment (RAC Overpayment Determinations of Requested Charts [Denials]).
- The hospital makes an initial decision to not contest the RAC decision (and repay), or to dispute the decision (Hospital Disputes Overpayment Determination [Appeal/Discussion]). Prior to filing an appeal, the hospital may request a discussion of the case with an RAC medical director, during which the RAC medical director can overturn the original determination. If the RAC declines to overturn the decision in discussion, the hospital may proceed with a formal appeal. Although CMS does not calculate the discussion period as part of the appeals process,[12] overpayment determinations contested by the hospital in either discussion or appeal represent the sum total of RAC denials disputed by the hospital.
Contested cases have 1 of 4 outcomes:
Contested overpayment determinations can be decided in favor of the hospital (Discussion or Appeal Decided in Favor of Hospital or RAC Withdrew)
- Contested overpayment determinations can be decided in favor of the RAC during the appeal process, and either the hospital exhausts the appeal process or elects not to take the appeal to the next level. Although the appeals process has 5 levels, no cases at our 3 hospitals have reached level 4 or 5, so cases without a decision to date remain in appeals at 1 of the first 3 levels (Case Still in Discussion or Appeals).[4]
- Hospital may miss an appeal deadline (Hospital Missed Appeal Deadline at Any Level) and the case is automatically decided in favor of the RAC.
- As of March 13, 2013,[10] for appeals that meet certain criteria and involve dispute over the billing of hospital services under Part A, CMS allowed hospitals to withdraw an appeal and rebill Medicare Part B. Prior to this time, hospitals could rebill for a very limited list of ancillary Part B Only services, and only within the 1‐year timely filing period.[13] Due to the lengthy appeals process and associated legal and administrative costs, hospitals may not agree with the RAC determination but make a business decision to recoup some payment under this mechanism (Hospital Chose to Rebill as Part B During Discussion or Appeals Process).
| Totals | Johns Hopkins Hospital | ||||||||||
|---|---|---|---|---|---|---|---|---|---|---|---|
| 2010 | 2011 | 2012 | 2013 | All Years | 2010 | 2011 | 2012 | 2013 | All Years | ||
| University of Wisconsin Hospital and Clinics | University of Utah | ||||||||||
| 2010 | 2011 | 2012 | 2013 | All Years | 2010 | 2011 | 2012 | 2013 | All Years | ||
| |||||||||||
| Total no. of Medicare encounters | 24,400 | 24,998 | 25,370 | 27,094 | 101,862 | 11,212b | 11,750b | 11,842 | 12,674c | 47,478 | |
| RAC Medical Necessity Chart Requests (Audits) | 547 | 1,735 | 3,887 | 1,941 | 8,110 (8.0%) | 0 | 0 | 938 | 0 | 938 (2.0%) | |
| RAC Overpayment Determinations Of Requested Charts (Denials)d | 164 (30.0%) | 516 (29.7%) | 1,200 (30.9%) | 656 (33.8%) | 2,536 (31.3%) | 0 (0%) | 0 (0%) | 432 (46.1%) | 0 (0%) | 432 (46.1%) | |
| Hospital Disputes Overpayment Determination (Appeal/Discussion) | 128 (78.0%) | 409 (79.3%) | 1,129 (94.1%) | 643 (98.0%) | 2,309 (91.0% | 0 (0%) | 0 (0%) | 431 (99.8%) | 0 (0%) | 431 (99.8%) | |
| Outcome of Disputed Overpayment Determinatione | |||||||||||
| Hospital Missed Appeal Deadline at Any Level | 0 (0.0%) | 1 (0.2%) | 13 (1.2%) | 4 (0.6%) | 18 (0.8%) | 0 (0%) | 0 (0%) | 0 (0.0%) | 0 (0%) | 0 (0.0%) | |
| Hospital Chose To Rebill as Part B During Discussion Or Appeals Process | 80 (62.5%) | 202 (49.4%) | 511 (45.3%) | 158 (24.6%) | 951 (41.2%) | 0 (0%) | 0 (0%) | 208 (48.3%) | 0 (0%) | 208 (48.3%) | |
| Discussion or Appeal Decided In Favor Of Hospital or RAC Withdrewf | 45 (35.2%) | 127 (31.1%) | 449 (39.8%) | 345 (53.7%) | 966 (41.8%) | 0 (0%) | 0 (0%) | 151 (35.0%) | 0 (0%) | 151 (35.0%) | |
| Case Still in Discussion or Appeals | 3 (2.3%) | 79 (19.3%) | 156 13.8%) | 136 (21.2%) | 374 (16.2%) | 0 (0%) | 0 (0%) | 72 (16.7%) | 0 (0%) | 72 (16.7%) | |
| Mean Time for Cases Still in Discussion or Appeals, d (SD) | 1208 (41) | 958 (79) | 518 (125) | 350 (101) | 555 (255) | N/A | N/A | 478 (164) | N/A | 478 (164) | |
| Total no. of Medicare encounters l | 8,096 | 8,038 | 8,429 | 9,086 | 33,649 | 5,092 | 5,210 | 5,099 | 5,334 | 20,735 | |
| RAC Medical Necessity Chart Requests (Audits) | 15 | 526 | 1,484 | 960 | 2,985 (8.9%) | 532 | 1,209 | 1,465 | 981 | 4,187 (20.2%) | |
| RAC Overpayment Determinations of Requested Charts (Denials)bd | 3 (20.0%) | 147 (27.9%) | 240 (16.2%) | 164 (17.1%) | 554 (18.6%) | 161 (30.3%) | 369 (30.5%) | 528 (36.0%) | 492 (50.2%) | 1,550 (37.0%) | |
| Hospital Disputes Overpayment Determination (Appeal/Discussion) | 1 (33.3%) | 71 (48.3%) | 170 (70.8%) | 151 (92.1%) | 393 (70.9%) | 127 (78.9%) | 338 (91.6%) | 528 (100.0%) | 492 (100.0%) | 1,485 (95.8%) | |
| Outcome of Disputed Overpayment Determinatione | |||||||||||
| Hospital Missed Appeal Deadline at Any Level | 0 (0.0%) | 1 (1.4%) | 0 (0.0%) | 4 (2.6%) | 5 (1.3%) | 0 (0.0%) | 0 (0.0%) | 13 (2.5%) | 0 (0.0%) | 13 (0.9%) | |
| Hospital Chose to Rebill as Part B During Discussion or Appeals Process | 1 (100%) | 3 (4.2%) | 13 (7.6%) | 3 (2.0%) | 20 (5.1%) | 79 (62.2%) | 199 (58.9%) | 290 (54.9%) | 155 (31.5%) | 723 (48.7%) | |
| Discussion or Appeal Decided in Favor of Hospital or RAC Withdrewf | 0 (0.0%) | 44 (62.0%) | 123 (72.4%) | 93 (61.6%) | 260 (66.2%) | 45 (35.4%) | 83 (24.6%) | 175 (33.1%) | 252 (51.2%) | 555 (37.4%) | |
| Case Still in Discussion or Appeals | 0 0.0% | 23 (32.4%) | 34 (20.0%) | 51 (33.8%) | 108 (27.5%) | 3 (2.4%) | 56 (16.6%) | 50 (9.5%) | 85 (17.3%) | 194 (13.1%) | |
| Mean Time for Cases Still in Discussion or Appeals, d (SD) | N/A | 926 (70) | 564 (90) | 323 (134) | 528 (258) | 1,208 (41) | 970 (80) | 544 (25) | 365 (72) | 599 (273) | |
| 2010 | 2011 | 2012 | 2013 | All | 2010 | 2011 | 2012 | 2013 | All | |
|---|---|---|---|---|---|---|---|---|---|---|
| Total Appeals With Decisions | Johns Hopkins Hospital | |||||||||
| Total no. | 125 | 330 | 973 | 507 | 1,935 | 0 | 0 | 359 | 0 | 359 |
| ||||||||||
| Hospital Missed Appeal Deadline at Any Level | 0 (0.0%) | 1 (0.3%) | 13 (1.3%) | 4 (0.8%) | 18 (0.9%) | 0 (0.0%) | 0 (0.0%) | 0 (0.0%) | 0 (0.0%) | 0 (0.0%) |
| Hospital Chose to Rebill as Part B During Discussion or Appeals Process | 80 (64.0%) | 202 (61.2%) | 511 (52.5%) | 158 (31.2%) | 951 (49.1%) | 0 (0.0%) | 0 (0.0%) | 208 (57.9%) | 0 (0.0%) | 208 (57.9%) |
| Discussion or Appeal Decided in Favor of Hospital or RAC Withdrew | 45 (36.0%) | 127 (38.5%) | 449 (46.1%) | 345 (68.0%) | 966 (49.9%) | 0 (0.0%) | 0 (0.0%) | 151 (42.1%) | 0 (0.0%) | 151 (42.1%) |
| Discussion Period and RAC Withdrawals | 0 (0.0%) | 59 (17.9%) | 351 (36.1%) | 235 (46.4%) | 645 (33.3%) | 0 (0.0%) | 0 (0.0%) | 139 (38.7%) | 0 (0.0%) | 139 (38.7%) |
| Level 1 Appeal | 10 (8.0%) | 22 (6.7%) | 60 (6.2%) | 62 (12.2%)1 | 154 (8.0%) | 0 (0.0%) | 0 (0.0%) | 2 (0.6%) | 0 (0.0%) | 2 (0.6%) |
| Level 2 Appeal | 22 (17.6%) | 36 (10.9%) | 38 (3.9%) | 48 (9.5%)1 | 144 (7.4%) | 0 (0.0%) | 0 (0.0%) | 10 (2.8%) | 0 (0.0%) | 10 (2.8%) |
| Level 3 Appealc | 13 (10.4%) | 10 (3.0%) | N/A (N/A) | N/A (N/A) | 23 (1.2%) | 0 (0.0%) | 0 (0.0%) | N/A (N/A) | 0 (0.0%) | 0 (0.0%) |
| 2010 | 2011 | 2012 | 2013 | All | 2010 | 2011 | 2012 | 2013 | All | |
| University of Wisconsin Hospital and Clinics | University of Utah | |||||||||
| Total no. | 1 | 48 | 136 | 100 | 285 | 124 | 282 | 478 | 407 | 1,291 |
| Hospital Missed Appeal Deadline at Any Level | 0 (0.0%) | 1 (2.1% | 0 (0.0%) | 4 (4.0%) | 5 (1.8%) | 0 (0.0%) | 0 (0.0%) | 13 (2.7%) | 0 (0.0%) | 13 (1.0%) |
| Hospital Chose to Rebill as Part B During Discussion or Appeals Process | 1 (100.0%) | 3 (6.3% | 13 (9.6%) | 3 (3.0%) | 20 (7.0%) | 79 (63.7%) | 199 (70.6%) | 290 (60.7%) | 155 (38.1%) | 723 (56.0%) |
| Discussion or Appeal Decided in Favor of Hospital or RAC Withdrewb | 0 (0.0%) | 44 (91.7%) | 123 (90.4%) | 93 (93.0%) | 260 (91.2%) | 45 (36.3%) | 83 (29.4%) | 175 (36.6%) | 252 (61.9%) | 555 (43.0%) |
| Discussion Period and RAC Withdrawals | 0 (0.0%) | 38 (79.2%) | 66 (48.5%) | 44 (44.0%) | 148 (51.9% | 0 (0.0%) | 21 (7.4%) | 146 (30.5%) | 191 (46.9%) | 358 (27.7%) |
| Level 1 Appeal | 0 (0.0%) | 2 (4.2%) | 47 (34.6%) | 34 (34.0%) | 83 (29.1%) | 10 (8.1%) | 20 (7.1%) | 11 (2.3%) | 28 (6.9%) | 69 (5.3%) |
| Level 2 Appeal | 0 (0.0%) | 4 (8.3%) | 10 (7.4%) | 15 (15.0%) | 29 (10.2%) | 22 (17.7%) | 32 (11.3%) | 18 (3.8%) | 33 (8.1%) | 105 (8.1%) |
| Level 3 Appealc | 0 (0.0%) | N/A (N/A) | N/A (N/A) | N/A (N/A) | 0 (0.0%) | 13 (10.5%) | 10 (3.5%) | N/A (N/A) | N/A(N/A) | 23 (1.8%) |
The administration at each hospital provided labor estimates for workforce dedicated to the review process generated by the RACs based on hourly accounting of one‐quarter of work during 2012, updated to FY 2014 accounting (Table 3). Concurrent case management status determination work was not included in these numbers due to the difficulty in solely attributing concurrent review workforce numbers to the RACs, as concurrent case management is a CMS Condition of Participation irrespective of the RAC program.
| JHH | UWHC | UU | Mean | |
|---|---|---|---|---|
| ||||
| Physicians: assist with status determinations, audits, and appeals | 1.0 | 0.5 | 0.6 | 0.7 |
| Nursing administration: audit and appeal preparation | 0.9 | 0.2 | 1.9 | 1.0 |
| Legal counsel: assist with rules interpretation, audit, and appeal preparation | 0.2 | 0.3 | 0.1 | 0.2 |
| Data analyst: prepare and track reports of audit and appeals | 2.0 | 1.8 | 2.4 | 2.0 |
| Administration and other directors | 2.3 | 0.9 | 0.3 | 1.2 |
| Total FTE workforce | 6.4 | 3.7 | 5.3 | 5.1 |
Statistics
Descriptive statistics were used to describe the data. Staffing numbers are expressed as full‐time equivalents (FTE).
RESULTS
Yearly Medicare Encounters and RAC Activity of Part A Complex Reviews
RACs audited 8.0% (8110/101,862) of inpatient Medicare cases, alleged noncompliance (all overpayments) for 31.3% (2536/8110) of Part A complex review cases requested, and the hospitals disputed 91.0% (2309/2536) of these assertions. None of these cases of alleged noncompliance claimed the actual medical services were unnecessary. Rather, every Part A complex review overpayment determination by all 3 RACs contested medical necessity related to outpatient versus inpatient status. In 2010 and 2011, there were in aggregate fewer audits (2282), overpayment determinations (680), and appeals or discussion requests (537 of 680, 79.0%), compared to audits (5828), overpayment determinations (1856), and appeals or discussion requests (1772 of 1856, 95.5%) in 2012 and 2013. The hospitals appealed or requested discussion of a greater percentage each successive year (2010, 78.0%; 2011, 79.3%; 2012, 94.1%; and 2013, 98.0%). This increased RAC activity, and hospital willingness to dispute the RAC overpayment determinations equaled a more than 300% increase in appeals and discussion request volume related to Part A complex review audits in just 2 years.
The 16.2% (374/2309) of disputed cases still under discussion or appeal have spent an average mean of 555 days (standard deviation 255 days) without a decision, with time in appeals exceeding 900 days for cases from 2010 and 2011. Notably, the 3 programs were subject to Part A complex review audits at widely different rates (Table 1).
Yearly RAC Part A Complex Review Overpayment Determinations Disputed by Hospitals With Decisions
The hospitals won, either in discussion or appeal, a combined greater percentage of contested overpayment determinations annually, from 36.0% (45/125) in 2010, to 38.5% (127/330) in 2011, to 46.1% (449/973) in 2012, to 68.0% (345/507) in 2013. Overall, for 49.1% (951/1935) of cases with decisions, the hospitals withdrew or rebilled under Part B at some point in the discussion or appeals process to avoid the lengthy appeals process and/or loss of the amount of the entire claim. A total of 49.9% (966/1935) of appeals with decisions have been won in discussion or appeal over the 4‐year study period. One‐third of all resolved cases (33.3%, 645/1935) were decided in favor of the hospital in the discussion period, with these discussion cases accounting for two‐thirds (66.8%, 645/966) of all favorable resolved cases for the hospital. Importantly, if cases overturned in discussion were omitted as they are in federal reports, the hospitals' success rate would fall to 16.6% (321/1935), a number similar to those that appear in annual CMS reports.[9, 13, 14] The hospitals also conceded 18 cases (0.9%) by missing a filing deadline (Table 2).
Estimated Workforce Dedicated to Part A Complex Review Medical Necessity Audits and Appeals
The institutions each employ an average of 5.1 FTE staff to manage the audit and appeal process, a number that does not include concurrent case management staff who assist in daily status determinations (Table 3).
CONCLUSIONS
In this study of 3 academic medical centers, there was a more than 2‐fold increase in RAC audits and a nearly 3‐fold rise in overpayment determinations over the last 2 calendar years of the study, resulting in a more than 3‐fold increase in appeals or requests for discussion in 2012 to 2013 compared to 2010 to 2011. In addition, although CMS manually reviews less than 0.3% of submitted claims each year through programs such as the Recovery Audit Program,[9] at the study hospitals, complex Part A RAC audits occurred at a rate more than 25 times that (8.0%), suggesting that these types of claims are a disproportionate focus of auditing activity. The high overall complex Part A audit rate, accompanied by acceleration of RAC activity and the hospitals' increased willingness to dispute RAC overpayment determinations each year, if representative of similar institutions, would explain the appeals backlog, most notably at the ALJ (level 3) level. Importantly, none of these Part A complex review denials contested a need for the medical care delivered, demonstrating that much of the RAC process at the hospitals focused exclusively on the nuances of medical necessity and variation in interpretation of CMS guidelines that related to whether hospital care should be provided under inpatient or outpatient status.
These data also show continued aggressive RAC audit activity despite an increasing overturn rate in favor of the hospitals in discussion or on appeal each year (from 36.0% in 2010 to 68.0% in 2013). The majority of the hospitals' successful decisions occurred in the discussion period, when the hospital had the opportunity to review the denial with the RAC medical director, a physician, prior to beginning the official appeals process. The 33% overturn rate found in the discussion period represents an error rate by the initial RAC auditors that was internally verified by the RAC medical director. The RAC internal error rate was replicated at 3 different RACs, highlighting internal process problems across the RAC system. This is concerning, because the discussion period is not considered part of the formal appeals process, so these cases are not appearing in CMS or OIG reports of RAC activity, leading to an underestimation of the true successful overturned denial rates at the 3 study hospitals, and likely many other hospitals.
The study hospitals are also being denied timely due process and payments for services delivered. The hospitals currently face an appeals process that, on average, far exceeds 500 days. In almost half of the contested overpayment determinations, the hospitals withdrew a case or rebilled Part B, not due to agreement with a RAC determination, but to avoid the lengthy, cumbersome, and expensive appeals process and/or to minimize the risk of losing the amount of the entire Part A claim. This is concerning, as cases withdrawn in the appeals process are considered improper payments in federal reports, despite a large number of these cases being withdrawn simply to avoid an inefficient appeals process. Notably, Medicare is not adhering to its own rules, which require appeals to be heard in a timely manner, specifically 60 days for level 1 or 2 appeals, and 90 days for a level 3 appeal,[6, 20] even though the hospitals lost the ability to appeal cases when they missed a deadline. Even if hospitals agreed to the recent 68% settlement offer[12] from CMS, appeals may reaccumulate without auditing reform. As noted earlier, this recent settlement offer came more than a year after the enhanced ability to rebill denied Part A claims for Part B, yet the backlog remains.
This study also showed that a large hospital workforce is required to manage the lengthy audit and appeals process generated by RACs. These staff are paid with funds that could be used to provide direct patient care or internal process improvement. The federal government also directly pays for unchecked RAC activity through the complex appeals process. Any report of dollars that RACs recoup for the federal government should be considered in light of their administrative costs to hospitals and government contractors, and direct costs at the federal level.
This study also showed that RACs audited the 3 institutions differently, despite similar willingness of the hospitals to dispute overpayment determinations and similar hospital success rates in appeals or discussion, suggesting that hospital compliance with Medicare policy was not the driver of variable RAC activity. This variation may be due to factors not apparent in this study, such as variable RAC interpretation of federal policy, a decision of a particular RAC to focus on complex Medicare Part B or automated reviews instead of complex Part A reviews, or RAC workforce differences that are not specific to the hospitals. Regardless, the variation in audit activity suggests that greater transparency and accountability in RAC activity is merited.
Perhaps most importantly, this study highlights factors that may help explain differing auditing and appeals numbers reported by the OIG,[4] CMS,[9, 13, 14] and hospitals.[15, 16] Given the marked increase in RAC activity over the last 4 years, the 2010 and 2011 data included in a recent OIG report[4] likely do not represent current auditing and appeals practice. With regard to the CMS reports,[9, 13, 14] although CMS included FY 2013[9] activity in its most recent report, it did not account for denials overturned in the discussion period, as these are not technically appeals, even though these are contested cases decided in favor of the hospital. This most recent CMS report[9] uses overpayment determinations from FY 2013, yet counts appeals and decisions that occurred in 2013, with the comment that these decisions may be for overpayment determinations prior to 2013. The CMS reports also variably combine automated, semiautomated, complex Part A, and complex Part B claims in its reports, making interpretation challenging. Finally, although CMS reported an increase in improper payments recovered from FY 2011[14] ($939 million) to FY 2012[13] ($2.4 billion) to FY 2013[9] ($3.75 billion), this is at least partly a reflection of increased RAC activity as demonstrated in this study, and may reflect the fact that many hospitals do not have the resources to continually appeal or choose not to contest these cases based on a financial business decision. Importantly, these numbers now far exceed recoupment in other quality programs, such as the Readmissions Reduction Program (estimated $428 million next FY),[21] indicating the increased fiscal impact of the RAC program on hospital reimbursement.
To increase accuracy, future federal reports of auditing and appeals should detail and include cases overturned in the discussion period, and carefully describe the denominator of total audits and appeals given the likelihood that many appeals in a given year will not have a decision in that year. Percent of total Medicare claims subject to complex Part A audit should be stated. Reports should also identify and consider an alternative classification for complex Part A cases the hospital elects to rebill under Medicare Part B, and also detail on what grounds medical necessity is being contested (eg, whether the actual care delivered was not necessary or if it is an outpatient versus inpatient billing issue). Time spent in the appeals process must also be reported. Complex Part A, complex Part B, semiautomated, and automated reviews should also be considered separately, and dates of reported audits and appeals must be as current as possible in this rapidly changing environment.
In this study, RACs conducted complex Part A audits at a rate 25 times the CMS‐reported overall audit rate, confirming complex Part A audits are a particular focus of RAC activity. There was a more than doubling of RAC audits at the study hospitals from the years 2010 ‐ 2011 to 2012 ‐ 2013 and a nearly 3‐fold increase in overpayment determinations. Concomitantly, the more than 3‐fold increase in appeals and discussion volume over this same time period was consistent with the development of the current national appeals backlog. The 3 study hospitals won a greater percentage of contested cases each year, from approximately one‐third of cases in 2010 to two‐thirds of cases with decisions in 2013, but there was no appreciable decrease in RAC overpayment determinations over that time period. The majority of successfully challenged cases were won in discussion, favorable decisions for hospitals not appearing in federal appeals reports. Time in appeals exceeded 550 days, causing the hospitals to withdraw some cases to avoid the lengthy appeals process and/or to minimize the risk of losing the amount of the entire Part A claim. The hospitals also lost a small number of appeals by missing a filing deadline, yet there was no reciprocal case concession when the appeals system missed a deadline. RACs found no cases of care at the 3 hospitals that should not have been delivered, but rather challenged the status determination (inpatient vs outpatient) to dispute medical necessity of care delivered. Finally, an average of approximately 5 FTEs at each institution were employed in the audits and appeals process. These data support a need for systematic improvements in the RAC system so that fair, constructive, and cost‐efficient surveillance of the Medicare program can be realized.
Acknowledgements
The authors thank Becky Borchert, MS, RN BC, ACM, CPHQ, Program Manager for Medicare/Medicaid Utilization Review at the University of Wisconsin Hospital and Clinics; Carol Duhaney and Joan Kratz, RN, at Johns Hopkins Hospital; and Morgan Walker at the University of Utah for their assistance in data preparation and presentation. Without their meticulous work and invaluable assistance, this study would not have been possible. The authors also thank Josh Boswell, JD, for his critical review of the manuscript.
Disclosure: Nothing to report.
- Medicare Payment Advisory Commission. Hospital inpatient and observation services. 2014 Report to Congress. Medicare Payment Policy. Available at: http://www.medpac.gov/documents/reports/mar14_entirereport.pdf?sfvrsn=0. Accessed September 22, 2014.
- American Hospital Association “2‐midnight rule” lawsuit vs Department of Health and Human Services. Available at: http://www.aha.org/content/14/140414‐complaint‐2midnight.pdf. Accessed August 8, 2014.
- Centers for Medicare administrative law judge hearing program for Medicare claim appeals. Fed Regist. 2014;79(214): 65660 – 65663. Available at: http://www.hhs.gov/omha/files/omha_federal_register_notice_2014–26214.pdf. Accessed December 6, 2014.
- . Medicare fines 2,610 hospitals in third round of readmission penalties. Kaiser Health News. Available at: http://kaiserhealthnews.org/news/medicare‐readmissions‐penalties‐2015. Accessed November 30, 2014.
© 2015 Society of Hospital Medicine
Inpatient vs Outpatient Hospitalization
Status determinations (outpatient versus inpatient) for hospitalized patients have become a routine part of patient care in the United States. Under the guidance provided by the Medicare Benefits Policy Manual, hospitalized Medicare beneficiaries are assigned 1 of these 2 statuses. The status assignment does not affect the care a patient can receive, but rather how the hospital services provided are billed to Medicare. Hospital services provided under inpatient status are billed under Medicare Part A. Hospital services provided under outpatient status, which includes all patients receiving observation services (commonly referred to as under observation), are billed under Medicare Part B. Whether hospital services are billed under Part A or Part B is important to hospitals and Medicare beneficiaries, as both the hospital reimbursement and beneficiary liability can vary greatly depending on whether services are billed under Part A versus Part B. Hospitals are generally reimbursed at a higher rate for services provided as an inpatient (Part A). The Office of the Inspector General (OIG) recently found that Medicare paid nearly three times more for a short inpatient stay than an [outpatient] stay for the same condition.[1] Medicare beneficiary liability also varies based on status. First, beneficiaries hospitalized as inpatients are subject to a deductible under Part A ($1,216 in 2014) for hospital services associated with that hospitalization and any future inpatient hospitalization beyond 60 days of discharge.[2] Beneficiaries hospitalized as outpatients are subject to the Medicare Part B deductible ($147 in 2014), and then a 20% copay on each individual outpatient hospital service, with no cumulative limit.[2, 3] In addition, hospital pharmacy charges for Medicare beneficiaries hospitalized as inpatients are covered under Medicare A. However, for Medicare patients hospitalized as outpatients, many medications are not covered by Medicare Part B benefits. Finally, time spent hospitalized as an outpatient does not count toward the Medicare 3‐day medically necessary inpatient stay requirement to qualify for the skilled nursing facility care benefit following discharge.
HISTORY AND INTENT OF INPATIENT AND OUTPATIENT STATUS DETERMINATIONS
Prior to October 1, 2013, the Centers for Medicare & Medicaid Services (CMS) stated that physician judgment and an expectation of at least an overnight hospitalization should determine inpatient status of hospitalized Medicare beneficiaries. Guidance as to when inpatient services were covered was found in the Medicare Benefits Policy Manual (MBPM)[4]:
An inpatient is a person who has been admitted to a hospital for bed occupancy for purposes of receiving inpatient hospital services. Generally, a patient is considered an inpatient if formally admitted as inpatient with the expectation that he or she will remain at least overnight and occupy a bed even though it later develops that the patient can be discharged or transferred to another hospital and not actually use a hospital bed overnight. The physician or other practitioner responsible for a patient's care at the hospital is also responsible for deciding whether the patient should be admitted as an inpatient. Physicians should use a 24‐hour period as a benchmark, i.e., they should order admission for patients who are expected to need hospital care for 24 hours or more, and treat other patients on an outpatient basis. However, the decision to admit a patient is a complex medical judgment that can be made only after the physician has considered a number of factors, including the patient's medical history and current medical needs, the types of facilities available to inpatients and to outpatients, the hospital's by‐laws and admissions policies, and the relative appropriateness of treatment in each setting.
For a subset of patients who are hospitalized under outpatient status, billing for observation services is allowed. CMS defines observation as a well defined set of services, that should last less than 24 hours and in only rare and exceptional casesspan more than 48 hours.[5] Many providers recognize the utility of a few additional hours of hospital care and/or testing in a hospital setting to determine whether a patient can go home or needs additional evaluation, monitoring, and/or treatment that can only be provided in a hospital, consistent with the CMS definition of observation.[6] It is important to note that although observation and outpatient are frequently used interchangeably, only outpatient is technically a CMS status. Patients in observation or under observation are, in fact, a subset of patients who are hospitalized under an outpatient status.
Outpatient status may also be appropriate for patients who require hospitalization for routine and expected overnight monitoring following a procedure. These patients are often not eligible for billing of observation services or as an inpatient because alternative methods of billing for the recovery time following the procedure exist. When determining the appropriate status of a Medicare beneficiary for a hospitalization following a procedure, physicians need to be aware of whether a specific procedure appears on the Medicare inpatient‐only procedures list.[7] Per CMS, procedures designated as inpatient only are reimbursed only when the patient is admitted as an inpatient at the time the procedure is performed.[8] Conversely, outpatient status for an overnight hospitalization associated with a procedure not on the inpatient‐only list is generally appropriate. Therefore, patients hospitalized for a procedure that appears on this list should always be hospitalized under inpatient status, regardless of the amount of time that the patient is expected to be hospitalized following the procedure, including those cases for which the hospitalization is expected to be only overnight.[7, 8] Only a limited number of Current Procedural Technology (CPT) codes, mostly surgical, automatically qualify for inpatient status and do not have outpatient prospective payment system eligibility. Although most procedures on the inpatient‐only list are associated with a hospitalization that commonly span at least 2 midnights, such as coronary artery bypass grafting, some potentially overnight stay cases, such as cholecystectomy (CPT 47600) appear on the 2014 inpatient‐only list.[9]
As noted above, prior to October 1, 2013, the Medicare definitions governing outpatient versus inpatient status included a 24‐hour benchmark. However, the MBPM also notes that: Admissions of particular patients are not covered or non‐covered solely on the basis of the length of time the patient actually spends in the hospital.[10]
In practice, status determination was ultimately dependent on physician or other practitioner's complex medical judgment as specified by CMS. To validate this judgment, CMS recommended that reviewers use a screening tool as part of their medical review. This screening tool could include practice guidelines that are well accepted by the medical community but did not require or identify a specific criteria set.[11] Not surprisingly, there was and continues to be great variability in the application of outpatient versus inpatient status across hospitals in actual practice.[1, 12, 13] The ambiguity in the definition of a hospitalized patient's status helped spawn commercial clinical decision tools, such as InterQual (McKesson Corporation, San Francisco, CA) and MCG (formally known as Milliman Care Guidelines; MCG Health, LLC, Seattle, WA), to help define inpatients versus outpatients.[14, 15] However, these guidelines are complex, can be difficult to interpret and apply, and have been criticized for poor predictive value and attempting to replace physician judgment.[16, 17, 18] Furthermore, CMS has never formally endorsed any specific decision tool.
INPATIENT AND OUTPATIENT PAYMENTS AND THE RECOVERY AUDIT CONTRACTOR PROGRAM
In 2000, CMS started using Ambulatory Payment Classifications for hospital services, which made inpatient care more financially favorable for hospitals. In response to concerns that hospitals would be incentivized to overuse inpatient status, CMS made a number of changes to their payment system, including the creation of the Recovery Audit Program in 2003. This program was originally called the Recovery Audit Contractor (RAC) Program and continues to be most commonly referred to as the RAC program. The RAC program, tasked with finding and correcting improper claims to the Medicare program, began as a demonstration required in the Medicare Prescription Drug Improvement and Modernization Act of 2003 (MMA), and subsequently became a nationwide audit program under the Tax Relief and Health Care Act of 2006. Under this program, private contractors review hospital and billing records of Medicare patients and are paid on a contingency fee (8%12.5%) for all underpayments and overpayments that are identified and corrected.[19] Importantly, the RACs are not subject to any financial penalties for cases improperly denied.
RACs initially targeted many overnight inpatient stays for recoupment. These cases were attractive audit targets because the RACs could argue that the inpatient hospital services were delivered in the improper status based solely on the length of stay, without having to consider in their audit the complexity of decision making or medical necessity of the services provided. However, it is worth noting that with improvement in efficiency and advancements in medical technology, hospitals and physicians have been increasingly able to safely evaluate and treat medically complex and severely ill patients quickly, sometimes with just an overnight stay. As perspective, in 1965, the average length of stay for a Medicare patient was 13 days; in 2010, it was 5.4 days, with over one‐third of hospitalizations lasting <3 days.[20]
Concurrent with the increased RAC denials for services provided in an inpatient status, the use of observation services changed significantly from 2007 to 2012. The average length of stay for Medicare patients under outpatient status with observation services exceeded 24 hours in 2007, was 28.2 hours by 2009,[21] and grew to 29 hours by 2012.[22] Between July 2010 and December 2011, at the University of Wisconsin Hospital, 1 in 6 observation stays lasted longer than 48 hours, suggesting that long observation stays were no longer rare and exceptional as stated in CMS' own definition.[23] This same University of Wisconsin study also found that observation services were not well defined, with 1141 distinct diagnosis codes used for these services.[23]
Additionally, a Medicare Payment Advisory Commission (MedPAC; described on their website,
Hospitals have also expressed concern that the RAC contingency fee payment model and a lack of penalty for improper denials promotes overzealous auditing.[24, 25] RAC recoupment has increased from approximately $939 million in 2011, to $2.4 billion in 2012, to $3.8 billion in 2013.[26, 27, 28] Given the money now at stake, it is not surprising that hospitals have become very active in appealing RAC denials. Self‐reported data submitted to the American Hospital Association (AHA) for the months January 2014 to March of 2014 show that hospitals now appeal 50% of RAC denials and win 66% of these appeals.[29] The AHA data also show that 69% of self‐reporting hospitals spent over $10,000 to manage their audit and appeals process over this same 3‐month time period, with 11% spending more than $100,000.
This appeals process is not only costly to hospitals, it is also lengthy. As of January 2014, the average wait time for an appeal hearing with an administrative law judge (level 3 appeal) exceeded 16 months.[30] In fact, the appeals process has become so backlogged that hospitals' rights to assignment of level 3 (administrative law judge) appeals have been temporarily suspended.[30] In August 2014, CMS offered a $0.68 on the dollar partial payment for hospitals willing to settle all eligible outstanding appeals in an attempt to relieve the appeals backlog.[31] In addition, the AHA currently has a suit against the US Department of Health & Human Services over the RAC appeals backlog.[32]
Increased use of outpatient status may be driven by pressures from the RAC program and, potentially, by improvements in the efficiency of care. Because hospitals are paid less for care provided under outpatient status than they are for the identical care provided under inpatient status, hospitals faced both potential financial penalty for improvements in efficiency and the threat of RAC audits.
THE 2‐MIDNIGHT RULE: A FIX?
Given the challenges in defining inpatient versus outpatient hospitalization, the increasing use of outpatient status and the increasing length of stay of outpatient hospitalizations with observation services, in 2013, CMS responded with new policies to define the visit status for hospitalized patients. On August 2, 2013, CMS announced the fiscal year 2014 hospital Inpatient Prospective Payment System final rule (IPPS‐2014) to become effective October 1, 2013. This document was formally issued as part of the Federal Register on August 19, 2013.[33] Central to the CMS IPPS‐2014 was a 2‐midnight benchmark that offered a major change in how physicians were to determine the status (inpatient vs outpatient) of hospitalized patients. With this 2‐midnight benchmark, now informally known as the 2‐midnight rule, CMS finalized its proposal to generally consider patients that are expected by a practitioner (with knowledge of the case and with admitting privileges) to need hospitalization that will span 2 or more midnights as inpatient. The IPPS‐2014 also finalized the converse of this: hospitalizations expected to span <2 midnights are to be regarded as outpatient with 2 exceptions:
- If the hospitalization is associated with a procedure appearing on the previously described Medicare inpatient‐only procedures list, or
- A rare and unusual circumstance in which an inpatient admission would be reasonable regardless of length of stay. Currently, unanticipated mechanical ventilation initiated during the hospitalization visit is the only rare and unusual circumstance that qualifies as such an exception.[7]
CMS' stated goals and expectations for the 2‐midnight benchmark were:
- Reduce the growing number of prolonged hospitalizations (>48 hours) for Medicare beneficiaries under outpatient status.
- Decrease billing disputes between hospitals and Medicare auditors, especially RACs, by establishing more clearly defined, time‐based status criteria.
- Reduce the number of outpatient encounters overall. Because CMS expected the rule to convert a net increase of cases from outpatient to inpatient, resulting in higher payments to hospitals, CMS included a 0.2% payment cut in hospital reimbursement in the IPPS‐2014 as an offset.[33, 34]
Although unrelated to the goals and expectations above, the IPPS‐2014 also included a requirement that:
[T]he order [for inpatient admission] must be furnished by a qualified and licensed practitioner who has admitting privileges at the hospital as permitted by State law, and who is knowledgeable about the patient's hospital course, medical plan of care and current condition.
CMS allowed for an authentication (generally regarded as a cosignature that is timed and dated) of the inpatient admission order by an attending physician with admitting privileges, done prior to discharge, in cases where the inpatient order had been placed by a practitioner (such as a resident, fellow, or physician assistant) without admitting privileges. Attending physician authentication of the inpatient admission order must be done prior to discharge [a]s a condition of payment for hospital inpatient services under Medicare Part A.[35]
From the August 2, 2013 announcement until the effective date of October 1, 2013, hospitals had just 2 months to interpret and comply with the IPPS‐2014, a complex 546‐page document that required hospitals to make extensive changes to admission procedures, workflows, and electronic health records (EHRs). In addition, extensive physician, provider, and administrator education was needed. During these 2 months, hospitals continued to request additional information and clarification from CMS regarding many aspects of the IPPS‐2014, including basic questions that included (1) how to apply the 2‐midnight benchmark to patients who were transferred from 1 hospital to another and (2) when the clock started for hospital services in determining a patient's expected length of hospitalization.
Despite concerns voiced by Congress and medical organizations, the new policy went into effect as scheduled.[36, 37] However, just days prior to October 1, 2013, CMS issued a 3‐month limited suspension of auditing and enforcement of the 2‐midnight rule by the RACs that was subsequently extended by CMS 2 more times, first through March 31, 2014 and then again through September 30, 2014. Other audits to be performed by RACs and all other government audits, including those performed by Medicare Administrative Contractors (MACs) were allowed to continue.[38] In particular, the MACs were instructed to conduct patient status reviews using a probe and educate strategy, which, via educational outreach efforts, would instruct hospitals how to adapt to the new rule. On April 1, 2014, the Protecting Access to Medicare Act of 2014 was signed into law, which, under section 111 of this law, permitted CMS to continue medical review activities under the MAC probe and educate process through March of 2015, and prohibited CMS from allowing RACs to conduct inpatient hospital status reviews on claims with these same dates of admission, October 1, 2013 through March 31, 2015.
The MACs were created by the MMA of 2003, which mandated that the Secretary of Health & Human Services replace Part A Fiscal Intermediaries and Part B carriers with Medicare Administrative Contractors (MACs).[39] As established by CMS, MACs are multi‐state, regional contractors responsible for administering both Medicare Part A and Medicare Part B claims and serve as the primary operational contact between the Medicare Fee‐For‐Service program, and approximately 1.5 million health care providers enrolled in the program.[39]
THE IPPS‐2014 AND CMS' STATED GOALS AND EXPECTATIONS
In the analysis that accompanied the IPPS‐2014, Medicare expected the use of outpatient services to decrease overall, as the new rules would effectively eliminate almost all outpatient hospitalizations >48 hours. Although no official data are yet available from CMS, our early experience under the 2‐midnight rule has suggested that long observation stays have declined in frequency, a favorable outcome of the new policy. However, as designed, the new 2‐midnight IPPS rule most predominately affects 1‐day stays, or more accurately, 1‐midnight stays. This is because many hospitalizations that previously met inpatient criteria (as defined by commercially available products such as MCG or InterQual), but spanned <2 midnights would have been classified as inpatient prior to October 1, 2013. However, since October 1, 2013, these same hospitalizations are now classified as outpatient. An example of such a case is a patient who presents to an emergency department with symptoms of a transient ischemic attack and has a high ABCD (age 60 years, blood pressure 140/90 mm Hg at initial evaluation, clinical features, duration of symptoms, diabetes score).[40] Prior to the 2‐midnight rule, this patient, based on the severity of the signs and symptoms upon presentation, could have been appropriately hospitalized as an inpatient.
Now, under the current IPPS and the ability of many hospitals to efficiently evaluate and treat such patient in <2 midnights, the patient should be categorized as an outpatient, at least initially, despite the severity and high risk of his/her presentation. In fiscal year 2013, The Johns Hopkins Hospital had 1791, 1‐day inpatient stays for Medicare beneficiaries, representing 15.2% of all Medicare admissions. Similarly, in the 12 months just prior to the 2‐midnight rule (October 1, 2012 to September 30, 2013), 10.4% (1280) of all Medicare encounters at the University of Wisconsin were 1‐day inpatient stays under previous criteria. Because of implementation of the 2‐midnight rule in October 2013, Medicare outpatient hospitalization for 1‐day stays at The Johns Hopkins Hospital increased by 49%, from an average of 117 patients/month to 174 patients/month. Nationally, it is possible that a reduction in long observation stays could be offset by an increase in 1‐day‐stay outpatient hospitalization encounters.
A second key expectation and goal of IPPS‐2014 was, by shifting to a more concrete, time‐based definition of inpatient, to decrease the disagreement between hospitals and auditors regarding patient status (inpatient vs outpatient). As noted earlier, many disputes with auditors for hospitalizations prior to October 2013 did not involve the need or type of hospital services provided, but rather the status under which the care was provided. However, the new time‐based criterion hinges not on actual length of hospitalization, but the expected length of hospitalization as determined by a practitioner with admitting privileges and knowledge of the patient. Accurately and consistently predicting the length of hospitalization has proven to be challenging, even for the most experienced practitioners. Since October 2013, for patients hospitalized at The Johns Hopkins Hospital through its emergency department, the admitting physicians' expectation of whether a patient would require 1 versus 2 or more midnights of necessary hospitalization was correct only half of the time. Given past experience, the RACs may challenge the medical judgment that lead practitioners to expect a hospitalization of 2 or more midnights without having to challenge whether the care provided was medically necessary.
Further, the IPPS‐2014 has not been accompanied by any significant changes to the payment scheme for auditors. RACs continue to be paid a percentage of any monies they determine to have been improperly paid by CMS, but with no penalty for cases that are overturned on appeal. Historically, the vast majority of RAC recovery fees have been due to determination of overpayments by CMS.[41, 42] Despite the 2‐midnight rule, RACs will continue to have a financial incentive to allege overpayment. In the initial probe and educate audits by MACs under the new 2014‐IPPS, despite inpatient admission orders being authenticated and certified by an attending physician, claims are being denied because the documentation does not support an expectation for a 2‐midnight hospitalization. Namely, auditors are continuing to challenge not the medical necessity of the services that hospitals provide, but rather the status in which those services were provided. Thus far, the IPPS‐2014 does not appear to fully remedy the auditing conflict that existed prior to October 2013.
As noted above, the IPPS‐2014 also requires, as of October 1, 2013, as a condition of payment for hospital services under Part A, that the inpatient admission order must be either entered by a practitioner with admitting privileges or authenticated prior to discharge by an attending physician involved in the care of the patient in cases in which the inpatient admission order was entered by a practitioner without admitting privileges (eg, resident, physician assistant, or fellow).[43] The requirement of an attending physician's cosignature has involved major changes to physician workflow and the electronic heath record (EHR) framework at The Johns Hopkins and the University of Wisconsin Hospitals, and does not keep up with modern healthcare systems in which patients are admitted 24 hours a day by a variety of providers (eg, residents, nurse practitioners) who otherwise may write stand‐alone orders. These changes have proven to be time‐consuming, costly, and have not, to our knowledge, improved patient care or utilization of resources.
The new visit status rules have also led to confusion among clinicians. A recent large survey of hospitalists conducted by the Society of Hospital Medicine demonstrated that more than half of respondents disagreed that the 2‐midnight rule improved hospitalist workflow compared to prior observation policy.[44] In addition, only 40% of hospitalists reported confidence in how to apply the rule.[44] Thus, the intent to clarify visit status policy with the IPPS‐2014 has not translated to clear and useful rules for frontline clinicians.
FUTURE DIRECTIONS
After over a year under the 2‐midnight rule, although long observation stays may be reduced, it seems unlikely these new regulations will achieve 2 of CMS' stated goals: (1) decreasing the use of outpatient status for hospitalizations and (2) resolving status disputes between auditors and hospitals. In addition, attempts at compliance with the new rules and regulations have diverted large amounts of physician time and hospital resources away from patient care. There is a clear need to reform both the hospitalization status policy and the RAC programs that enforce these rules.
One path Congress and CMS could consider is to reform the current Medicare reimbursement paradigm for hospital services to eliminate the need to distinguish inpatient from outpatient status. For example, H.R. 1179Improving Access to Medicare Coverage Act of 2013,[45] of the 113th Congress, if reintroduced, would decouple the link between the qualification for skilled nursing facility benefits from visit status by allowing time spent hospitalized as an outpatient to count toward the 3‐day benchmark. The overarching goals of any visit status policy reform should be to: (1) simplify or eliminate the 2‐track status process for hospitalized patients, (2) stop or minimize the threat of audits based on status, and (3) maintain budget neutrality. Two additional options for consideration would be to: (1) create a low‐acuity modifier for use with patients anticipated to have short stays and low resource use and (2) preselect specific Diagnosis Related Groups based on historical data and create designations for those diagnoses of lesser intensity. Accountable care organizations contracts, a new model for healthcare payment, could potentially be structured to eliminate or simplify payment based on visit status for hospitalized patients. With bundled payments on the horizon and the possible phase‐out of fee‐for‐service reimbursement, the issue may become less paramount in the coming years. No solution will be perfect and must balance costs, ease of administration, and beneficiary protection.
There are reasons to be optimistic that change may soon be realized. CMS is currently considering significant hospitalization status policy reform. In the proposed IPPS‐2015, CMS asked for input on payment for short‐stay hospitalizations and, in the final IPPS‐2015 released August 4, 2014, CMS indicated its willingness to continue to work with stakeholders in revising these policies.[46] Additionally, CMS has responded to hospitals on 3 separate occasions by delaying RAC audits pertaining to the 2‐midnight rule. Further, the current MAC probe and educate audits focus on education with respect to 2‐midnight rule implementation rather than threatening hospitals with major financial penalties.[47] Congress has also been responsive in this area. In addition to the 3 delays announced by CMS, Congress passed legislation that mandated an additional delay to RAC audits that pertain to the 2‐midnight rule. Moreover, the Subcommittee on Health of the House Ways and Means Committee held hearings that included the 2‐midnight rule and RAC reform in May 2014, and the Senate Special Committee on Aging held hearings on the impact of visit status on Medicare beneficiaries in July 2014.[48, 49] Additionally, the House Ways and Means Health Subcommittee recently issued a draft bill to address Medicare hospital issues.[50] The OIG has also been responsive to hospital concerns regarding the current RAC program with a recent report recommending that CMS develop additional performance evaluation metrics to improve RAC performance and ensure that RACs are evaluated on all contract requirements.[51] Additionally, MedPAC has been considering several short‐stay payment reform options, modifying the need for a 3‐day inpatient hospitalization to qualify for postdischarge skilled nursing facility benefits and adjusting RAC contingency fees based on overturn rates.[52, 53] These actions by CMS, Congress, and the OIG, as well as the options under consideration by MedPAC, demonstrate a degree of regulatory and legislative responsiveness to hospital and provider concerns in the area of visit status determination.
The Medicare program is vital to tens of millions of disabled and elderly Americans. Fraud and abuse of the Medicare program should not be tolerated. Yet, the current system of assigning, monitoring, and auditing outpatient versus inpatient hospital care is in need of reform. It will be up to CMS and Congress to continue to work with hospitals and physicians to find an improved way to appropriately and fairly compensate hospitals for hospital services in a way that that does not depend on a poorly defined and contentious status of a patient. Such reform must include the RAC program. It is our hope that both CMS and Congress will prioritize status determination and payment reform so that Medicare beneficiaries, physicians, and hospitals all have a sustainable, fair, and transparent process.
- Testimony of Jodi D Nudelman, Regional Inspector General for the Office of Evaluation and Inspections, Office of the Inspector General, US Department of Health and Human Services, Hearing: Current Hospital Issues in the Medicare Program, House Committee on Ways and Means, Subcommittee on Health, May 20, 2014. Available at: https://oig.hhs.gov/newsroom/testimony‐and‐speeches/index.asp. Accessed November 24, 2014.
- Centers for Medicare 173:1999–2000.
- US Department of Health 49:893–909.
- US Department of Health 28:95–111.
- . The price of admission: increasing use of decision‐support technology draws criticism for changing roles in hospital‐admissions process. Modern Healthcare website. Available at: http://www.modernhealthcare.com/article/20121117/MAGAZINE/311179951. Published November 17, 2012. Accessed November 9, 2014.
- , , , et al. The accuracy of interqual criteria in determining the need for observation versus hospitalization in emergency department patients with chronic heart failure. Crit Pathw Cardiol. 2013;12:192–196.
- US Department of Health 31:1251–1259.
- MedPAC March 2104 Report to the Congress, Medicare Payment Policy. Available at: http://www.medpac.gov/documents/reports/mar14_entirereport.pdf?sfvrsn=0. Accessed on December 22, 2014.
- , , , et al, Hospitalized but not admitted: characteristics of patients with “observation status” at an academic medical center. JAMA Intern Med. 2013;173:1991–1998.
- . The recovery audit contractor program and observation status for hospitalized Medicare beneficiaries. JAMA Internal Medicine blog. Available at: http://internalmedicineblog.jamainternalmed.com/2014/02/04/the‐recovery‐audit‐contractor‐program‐and‐observation‐status‐for‐hospitalized‐medicare‐beneficiaries. Published February 4, 2014. Accessed June 15, 2014.
- . Broken RAC system continues to hurt patients, providers. The Hospital Leader blog. Available at: http://blogs.hospitalmedicine.org/Blog/broken‐rac‐system‐continues‐to‐hurt‐patients‐providers. Published April 22, 2014. Accessed June 15, 2014.
- US Department of Health 78(160). Available at: http://www.gpo.gov/fdsys/pkg/FR‐2013‐08‐19/pdf/2013‐18956.pdf. Accessed August 4, 2014.
- US Department of Health use of observation and inpatient stays for Medicare beneficiaries, OEI‐02‐12‐00040. Available at: http://oig.hhs.gov/oei/reports/oei‐02‐12‐00040.pdf. Accessed June 15, 2014.
- US Department of Health
Status determinations (outpatient versus inpatient) for hospitalized patients have become a routine part of patient care in the United States. Under the guidance provided by the Medicare Benefits Policy Manual, hospitalized Medicare beneficiaries are assigned 1 of these 2 statuses. The status assignment does not affect the care a patient can receive, but rather how the hospital services provided are billed to Medicare. Hospital services provided under inpatient status are billed under Medicare Part A. Hospital services provided under outpatient status, which includes all patients receiving observation services (commonly referred to as under observation), are billed under Medicare Part B. Whether hospital services are billed under Part A or Part B is important to hospitals and Medicare beneficiaries, as both the hospital reimbursement and beneficiary liability can vary greatly depending on whether services are billed under Part A versus Part B. Hospitals are generally reimbursed at a higher rate for services provided as an inpatient (Part A). The Office of the Inspector General (OIG) recently found that Medicare paid nearly three times more for a short inpatient stay than an [outpatient] stay for the same condition.[1] Medicare beneficiary liability also varies based on status. First, beneficiaries hospitalized as inpatients are subject to a deductible under Part A ($1,216 in 2014) for hospital services associated with that hospitalization and any future inpatient hospitalization beyond 60 days of discharge.[2] Beneficiaries hospitalized as outpatients are subject to the Medicare Part B deductible ($147 in 2014), and then a 20% copay on each individual outpatient hospital service, with no cumulative limit.[2, 3] In addition, hospital pharmacy charges for Medicare beneficiaries hospitalized as inpatients are covered under Medicare A. However, for Medicare patients hospitalized as outpatients, many medications are not covered by Medicare Part B benefits. Finally, time spent hospitalized as an outpatient does not count toward the Medicare 3‐day medically necessary inpatient stay requirement to qualify for the skilled nursing facility care benefit following discharge.
HISTORY AND INTENT OF INPATIENT AND OUTPATIENT STATUS DETERMINATIONS
Prior to October 1, 2013, the Centers for Medicare & Medicaid Services (CMS) stated that physician judgment and an expectation of at least an overnight hospitalization should determine inpatient status of hospitalized Medicare beneficiaries. Guidance as to when inpatient services were covered was found in the Medicare Benefits Policy Manual (MBPM)[4]:
An inpatient is a person who has been admitted to a hospital for bed occupancy for purposes of receiving inpatient hospital services. Generally, a patient is considered an inpatient if formally admitted as inpatient with the expectation that he or she will remain at least overnight and occupy a bed even though it later develops that the patient can be discharged or transferred to another hospital and not actually use a hospital bed overnight. The physician or other practitioner responsible for a patient's care at the hospital is also responsible for deciding whether the patient should be admitted as an inpatient. Physicians should use a 24‐hour period as a benchmark, i.e., they should order admission for patients who are expected to need hospital care for 24 hours or more, and treat other patients on an outpatient basis. However, the decision to admit a patient is a complex medical judgment that can be made only after the physician has considered a number of factors, including the patient's medical history and current medical needs, the types of facilities available to inpatients and to outpatients, the hospital's by‐laws and admissions policies, and the relative appropriateness of treatment in each setting.
For a subset of patients who are hospitalized under outpatient status, billing for observation services is allowed. CMS defines observation as a well defined set of services, that should last less than 24 hours and in only rare and exceptional casesspan more than 48 hours.[5] Many providers recognize the utility of a few additional hours of hospital care and/or testing in a hospital setting to determine whether a patient can go home or needs additional evaluation, monitoring, and/or treatment that can only be provided in a hospital, consistent with the CMS definition of observation.[6] It is important to note that although observation and outpatient are frequently used interchangeably, only outpatient is technically a CMS status. Patients in observation or under observation are, in fact, a subset of patients who are hospitalized under an outpatient status.
Outpatient status may also be appropriate for patients who require hospitalization for routine and expected overnight monitoring following a procedure. These patients are often not eligible for billing of observation services or as an inpatient because alternative methods of billing for the recovery time following the procedure exist. When determining the appropriate status of a Medicare beneficiary for a hospitalization following a procedure, physicians need to be aware of whether a specific procedure appears on the Medicare inpatient‐only procedures list.[7] Per CMS, procedures designated as inpatient only are reimbursed only when the patient is admitted as an inpatient at the time the procedure is performed.[8] Conversely, outpatient status for an overnight hospitalization associated with a procedure not on the inpatient‐only list is generally appropriate. Therefore, patients hospitalized for a procedure that appears on this list should always be hospitalized under inpatient status, regardless of the amount of time that the patient is expected to be hospitalized following the procedure, including those cases for which the hospitalization is expected to be only overnight.[7, 8] Only a limited number of Current Procedural Technology (CPT) codes, mostly surgical, automatically qualify for inpatient status and do not have outpatient prospective payment system eligibility. Although most procedures on the inpatient‐only list are associated with a hospitalization that commonly span at least 2 midnights, such as coronary artery bypass grafting, some potentially overnight stay cases, such as cholecystectomy (CPT 47600) appear on the 2014 inpatient‐only list.[9]
As noted above, prior to October 1, 2013, the Medicare definitions governing outpatient versus inpatient status included a 24‐hour benchmark. However, the MBPM also notes that: Admissions of particular patients are not covered or non‐covered solely on the basis of the length of time the patient actually spends in the hospital.[10]
In practice, status determination was ultimately dependent on physician or other practitioner's complex medical judgment as specified by CMS. To validate this judgment, CMS recommended that reviewers use a screening tool as part of their medical review. This screening tool could include practice guidelines that are well accepted by the medical community but did not require or identify a specific criteria set.[11] Not surprisingly, there was and continues to be great variability in the application of outpatient versus inpatient status across hospitals in actual practice.[1, 12, 13] The ambiguity in the definition of a hospitalized patient's status helped spawn commercial clinical decision tools, such as InterQual (McKesson Corporation, San Francisco, CA) and MCG (formally known as Milliman Care Guidelines; MCG Health, LLC, Seattle, WA), to help define inpatients versus outpatients.[14, 15] However, these guidelines are complex, can be difficult to interpret and apply, and have been criticized for poor predictive value and attempting to replace physician judgment.[16, 17, 18] Furthermore, CMS has never formally endorsed any specific decision tool.
INPATIENT AND OUTPATIENT PAYMENTS AND THE RECOVERY AUDIT CONTRACTOR PROGRAM
In 2000, CMS started using Ambulatory Payment Classifications for hospital services, which made inpatient care more financially favorable for hospitals. In response to concerns that hospitals would be incentivized to overuse inpatient status, CMS made a number of changes to their payment system, including the creation of the Recovery Audit Program in 2003. This program was originally called the Recovery Audit Contractor (RAC) Program and continues to be most commonly referred to as the RAC program. The RAC program, tasked with finding and correcting improper claims to the Medicare program, began as a demonstration required in the Medicare Prescription Drug Improvement and Modernization Act of 2003 (MMA), and subsequently became a nationwide audit program under the Tax Relief and Health Care Act of 2006. Under this program, private contractors review hospital and billing records of Medicare patients and are paid on a contingency fee (8%12.5%) for all underpayments and overpayments that are identified and corrected.[19] Importantly, the RACs are not subject to any financial penalties for cases improperly denied.
RACs initially targeted many overnight inpatient stays for recoupment. These cases were attractive audit targets because the RACs could argue that the inpatient hospital services were delivered in the improper status based solely on the length of stay, without having to consider in their audit the complexity of decision making or medical necessity of the services provided. However, it is worth noting that with improvement in efficiency and advancements in medical technology, hospitals and physicians have been increasingly able to safely evaluate and treat medically complex and severely ill patients quickly, sometimes with just an overnight stay. As perspective, in 1965, the average length of stay for a Medicare patient was 13 days; in 2010, it was 5.4 days, with over one‐third of hospitalizations lasting <3 days.[20]
Concurrent with the increased RAC denials for services provided in an inpatient status, the use of observation services changed significantly from 2007 to 2012. The average length of stay for Medicare patients under outpatient status with observation services exceeded 24 hours in 2007, was 28.2 hours by 2009,[21] and grew to 29 hours by 2012.[22] Between July 2010 and December 2011, at the University of Wisconsin Hospital, 1 in 6 observation stays lasted longer than 48 hours, suggesting that long observation stays were no longer rare and exceptional as stated in CMS' own definition.[23] This same University of Wisconsin study also found that observation services were not well defined, with 1141 distinct diagnosis codes used for these services.[23]
Additionally, a Medicare Payment Advisory Commission (MedPAC; described on their website,
Hospitals have also expressed concern that the RAC contingency fee payment model and a lack of penalty for improper denials promotes overzealous auditing.[24, 25] RAC recoupment has increased from approximately $939 million in 2011, to $2.4 billion in 2012, to $3.8 billion in 2013.[26, 27, 28] Given the money now at stake, it is not surprising that hospitals have become very active in appealing RAC denials. Self‐reported data submitted to the American Hospital Association (AHA) for the months January 2014 to March of 2014 show that hospitals now appeal 50% of RAC denials and win 66% of these appeals.[29] The AHA data also show that 69% of self‐reporting hospitals spent over $10,000 to manage their audit and appeals process over this same 3‐month time period, with 11% spending more than $100,000.
This appeals process is not only costly to hospitals, it is also lengthy. As of January 2014, the average wait time for an appeal hearing with an administrative law judge (level 3 appeal) exceeded 16 months.[30] In fact, the appeals process has become so backlogged that hospitals' rights to assignment of level 3 (administrative law judge) appeals have been temporarily suspended.[30] In August 2014, CMS offered a $0.68 on the dollar partial payment for hospitals willing to settle all eligible outstanding appeals in an attempt to relieve the appeals backlog.[31] In addition, the AHA currently has a suit against the US Department of Health & Human Services over the RAC appeals backlog.[32]
Increased use of outpatient status may be driven by pressures from the RAC program and, potentially, by improvements in the efficiency of care. Because hospitals are paid less for care provided under outpatient status than they are for the identical care provided under inpatient status, hospitals faced both potential financial penalty for improvements in efficiency and the threat of RAC audits.
THE 2‐MIDNIGHT RULE: A FIX?
Given the challenges in defining inpatient versus outpatient hospitalization, the increasing use of outpatient status and the increasing length of stay of outpatient hospitalizations with observation services, in 2013, CMS responded with new policies to define the visit status for hospitalized patients. On August 2, 2013, CMS announced the fiscal year 2014 hospital Inpatient Prospective Payment System final rule (IPPS‐2014) to become effective October 1, 2013. This document was formally issued as part of the Federal Register on August 19, 2013.[33] Central to the CMS IPPS‐2014 was a 2‐midnight benchmark that offered a major change in how physicians were to determine the status (inpatient vs outpatient) of hospitalized patients. With this 2‐midnight benchmark, now informally known as the 2‐midnight rule, CMS finalized its proposal to generally consider patients that are expected by a practitioner (with knowledge of the case and with admitting privileges) to need hospitalization that will span 2 or more midnights as inpatient. The IPPS‐2014 also finalized the converse of this: hospitalizations expected to span <2 midnights are to be regarded as outpatient with 2 exceptions:
- If the hospitalization is associated with a procedure appearing on the previously described Medicare inpatient‐only procedures list, or
- A rare and unusual circumstance in which an inpatient admission would be reasonable regardless of length of stay. Currently, unanticipated mechanical ventilation initiated during the hospitalization visit is the only rare and unusual circumstance that qualifies as such an exception.[7]
CMS' stated goals and expectations for the 2‐midnight benchmark were:
- Reduce the growing number of prolonged hospitalizations (>48 hours) for Medicare beneficiaries under outpatient status.
- Decrease billing disputes between hospitals and Medicare auditors, especially RACs, by establishing more clearly defined, time‐based status criteria.
- Reduce the number of outpatient encounters overall. Because CMS expected the rule to convert a net increase of cases from outpatient to inpatient, resulting in higher payments to hospitals, CMS included a 0.2% payment cut in hospital reimbursement in the IPPS‐2014 as an offset.[33, 34]
Although unrelated to the goals and expectations above, the IPPS‐2014 also included a requirement that:
[T]he order [for inpatient admission] must be furnished by a qualified and licensed practitioner who has admitting privileges at the hospital as permitted by State law, and who is knowledgeable about the patient's hospital course, medical plan of care and current condition.
CMS allowed for an authentication (generally regarded as a cosignature that is timed and dated) of the inpatient admission order by an attending physician with admitting privileges, done prior to discharge, in cases where the inpatient order had been placed by a practitioner (such as a resident, fellow, or physician assistant) without admitting privileges. Attending physician authentication of the inpatient admission order must be done prior to discharge [a]s a condition of payment for hospital inpatient services under Medicare Part A.[35]
From the August 2, 2013 announcement until the effective date of October 1, 2013, hospitals had just 2 months to interpret and comply with the IPPS‐2014, a complex 546‐page document that required hospitals to make extensive changes to admission procedures, workflows, and electronic health records (EHRs). In addition, extensive physician, provider, and administrator education was needed. During these 2 months, hospitals continued to request additional information and clarification from CMS regarding many aspects of the IPPS‐2014, including basic questions that included (1) how to apply the 2‐midnight benchmark to patients who were transferred from 1 hospital to another and (2) when the clock started for hospital services in determining a patient's expected length of hospitalization.
Despite concerns voiced by Congress and medical organizations, the new policy went into effect as scheduled.[36, 37] However, just days prior to October 1, 2013, CMS issued a 3‐month limited suspension of auditing and enforcement of the 2‐midnight rule by the RACs that was subsequently extended by CMS 2 more times, first through March 31, 2014 and then again through September 30, 2014. Other audits to be performed by RACs and all other government audits, including those performed by Medicare Administrative Contractors (MACs) were allowed to continue.[38] In particular, the MACs were instructed to conduct patient status reviews using a probe and educate strategy, which, via educational outreach efforts, would instruct hospitals how to adapt to the new rule. On April 1, 2014, the Protecting Access to Medicare Act of 2014 was signed into law, which, under section 111 of this law, permitted CMS to continue medical review activities under the MAC probe and educate process through March of 2015, and prohibited CMS from allowing RACs to conduct inpatient hospital status reviews on claims with these same dates of admission, October 1, 2013 through March 31, 2015.
The MACs were created by the MMA of 2003, which mandated that the Secretary of Health & Human Services replace Part A Fiscal Intermediaries and Part B carriers with Medicare Administrative Contractors (MACs).[39] As established by CMS, MACs are multi‐state, regional contractors responsible for administering both Medicare Part A and Medicare Part B claims and serve as the primary operational contact between the Medicare Fee‐For‐Service program, and approximately 1.5 million health care providers enrolled in the program.[39]
THE IPPS‐2014 AND CMS' STATED GOALS AND EXPECTATIONS
In the analysis that accompanied the IPPS‐2014, Medicare expected the use of outpatient services to decrease overall, as the new rules would effectively eliminate almost all outpatient hospitalizations >48 hours. Although no official data are yet available from CMS, our early experience under the 2‐midnight rule has suggested that long observation stays have declined in frequency, a favorable outcome of the new policy. However, as designed, the new 2‐midnight IPPS rule most predominately affects 1‐day stays, or more accurately, 1‐midnight stays. This is because many hospitalizations that previously met inpatient criteria (as defined by commercially available products such as MCG or InterQual), but spanned <2 midnights would have been classified as inpatient prior to October 1, 2013. However, since October 1, 2013, these same hospitalizations are now classified as outpatient. An example of such a case is a patient who presents to an emergency department with symptoms of a transient ischemic attack and has a high ABCD (age 60 years, blood pressure 140/90 mm Hg at initial evaluation, clinical features, duration of symptoms, diabetes score).[40] Prior to the 2‐midnight rule, this patient, based on the severity of the signs and symptoms upon presentation, could have been appropriately hospitalized as an inpatient.
Now, under the current IPPS and the ability of many hospitals to efficiently evaluate and treat such patient in <2 midnights, the patient should be categorized as an outpatient, at least initially, despite the severity and high risk of his/her presentation. In fiscal year 2013, The Johns Hopkins Hospital had 1791, 1‐day inpatient stays for Medicare beneficiaries, representing 15.2% of all Medicare admissions. Similarly, in the 12 months just prior to the 2‐midnight rule (October 1, 2012 to September 30, 2013), 10.4% (1280) of all Medicare encounters at the University of Wisconsin were 1‐day inpatient stays under previous criteria. Because of implementation of the 2‐midnight rule in October 2013, Medicare outpatient hospitalization for 1‐day stays at The Johns Hopkins Hospital increased by 49%, from an average of 117 patients/month to 174 patients/month. Nationally, it is possible that a reduction in long observation stays could be offset by an increase in 1‐day‐stay outpatient hospitalization encounters.
A second key expectation and goal of IPPS‐2014 was, by shifting to a more concrete, time‐based definition of inpatient, to decrease the disagreement between hospitals and auditors regarding patient status (inpatient vs outpatient). As noted earlier, many disputes with auditors for hospitalizations prior to October 2013 did not involve the need or type of hospital services provided, but rather the status under which the care was provided. However, the new time‐based criterion hinges not on actual length of hospitalization, but the expected length of hospitalization as determined by a practitioner with admitting privileges and knowledge of the patient. Accurately and consistently predicting the length of hospitalization has proven to be challenging, even for the most experienced practitioners. Since October 2013, for patients hospitalized at The Johns Hopkins Hospital through its emergency department, the admitting physicians' expectation of whether a patient would require 1 versus 2 or more midnights of necessary hospitalization was correct only half of the time. Given past experience, the RACs may challenge the medical judgment that lead practitioners to expect a hospitalization of 2 or more midnights without having to challenge whether the care provided was medically necessary.
Further, the IPPS‐2014 has not been accompanied by any significant changes to the payment scheme for auditors. RACs continue to be paid a percentage of any monies they determine to have been improperly paid by CMS, but with no penalty for cases that are overturned on appeal. Historically, the vast majority of RAC recovery fees have been due to determination of overpayments by CMS.[41, 42] Despite the 2‐midnight rule, RACs will continue to have a financial incentive to allege overpayment. In the initial probe and educate audits by MACs under the new 2014‐IPPS, despite inpatient admission orders being authenticated and certified by an attending physician, claims are being denied because the documentation does not support an expectation for a 2‐midnight hospitalization. Namely, auditors are continuing to challenge not the medical necessity of the services that hospitals provide, but rather the status in which those services were provided. Thus far, the IPPS‐2014 does not appear to fully remedy the auditing conflict that existed prior to October 2013.
As noted above, the IPPS‐2014 also requires, as of October 1, 2013, as a condition of payment for hospital services under Part A, that the inpatient admission order must be either entered by a practitioner with admitting privileges or authenticated prior to discharge by an attending physician involved in the care of the patient in cases in which the inpatient admission order was entered by a practitioner without admitting privileges (eg, resident, physician assistant, or fellow).[43] The requirement of an attending physician's cosignature has involved major changes to physician workflow and the electronic heath record (EHR) framework at The Johns Hopkins and the University of Wisconsin Hospitals, and does not keep up with modern healthcare systems in which patients are admitted 24 hours a day by a variety of providers (eg, residents, nurse practitioners) who otherwise may write stand‐alone orders. These changes have proven to be time‐consuming, costly, and have not, to our knowledge, improved patient care or utilization of resources.
The new visit status rules have also led to confusion among clinicians. A recent large survey of hospitalists conducted by the Society of Hospital Medicine demonstrated that more than half of respondents disagreed that the 2‐midnight rule improved hospitalist workflow compared to prior observation policy.[44] In addition, only 40% of hospitalists reported confidence in how to apply the rule.[44] Thus, the intent to clarify visit status policy with the IPPS‐2014 has not translated to clear and useful rules for frontline clinicians.
FUTURE DIRECTIONS
After over a year under the 2‐midnight rule, although long observation stays may be reduced, it seems unlikely these new regulations will achieve 2 of CMS' stated goals: (1) decreasing the use of outpatient status for hospitalizations and (2) resolving status disputes between auditors and hospitals. In addition, attempts at compliance with the new rules and regulations have diverted large amounts of physician time and hospital resources away from patient care. There is a clear need to reform both the hospitalization status policy and the RAC programs that enforce these rules.
One path Congress and CMS could consider is to reform the current Medicare reimbursement paradigm for hospital services to eliminate the need to distinguish inpatient from outpatient status. For example, H.R. 1179Improving Access to Medicare Coverage Act of 2013,[45] of the 113th Congress, if reintroduced, would decouple the link between the qualification for skilled nursing facility benefits from visit status by allowing time spent hospitalized as an outpatient to count toward the 3‐day benchmark. The overarching goals of any visit status policy reform should be to: (1) simplify or eliminate the 2‐track status process for hospitalized patients, (2) stop or minimize the threat of audits based on status, and (3) maintain budget neutrality. Two additional options for consideration would be to: (1) create a low‐acuity modifier for use with patients anticipated to have short stays and low resource use and (2) preselect specific Diagnosis Related Groups based on historical data and create designations for those diagnoses of lesser intensity. Accountable care organizations contracts, a new model for healthcare payment, could potentially be structured to eliminate or simplify payment based on visit status for hospitalized patients. With bundled payments on the horizon and the possible phase‐out of fee‐for‐service reimbursement, the issue may become less paramount in the coming years. No solution will be perfect and must balance costs, ease of administration, and beneficiary protection.
There are reasons to be optimistic that change may soon be realized. CMS is currently considering significant hospitalization status policy reform. In the proposed IPPS‐2015, CMS asked for input on payment for short‐stay hospitalizations and, in the final IPPS‐2015 released August 4, 2014, CMS indicated its willingness to continue to work with stakeholders in revising these policies.[46] Additionally, CMS has responded to hospitals on 3 separate occasions by delaying RAC audits pertaining to the 2‐midnight rule. Further, the current MAC probe and educate audits focus on education with respect to 2‐midnight rule implementation rather than threatening hospitals with major financial penalties.[47] Congress has also been responsive in this area. In addition to the 3 delays announced by CMS, Congress passed legislation that mandated an additional delay to RAC audits that pertain to the 2‐midnight rule. Moreover, the Subcommittee on Health of the House Ways and Means Committee held hearings that included the 2‐midnight rule and RAC reform in May 2014, and the Senate Special Committee on Aging held hearings on the impact of visit status on Medicare beneficiaries in July 2014.[48, 49] Additionally, the House Ways and Means Health Subcommittee recently issued a draft bill to address Medicare hospital issues.[50] The OIG has also been responsive to hospital concerns regarding the current RAC program with a recent report recommending that CMS develop additional performance evaluation metrics to improve RAC performance and ensure that RACs are evaluated on all contract requirements.[51] Additionally, MedPAC has been considering several short‐stay payment reform options, modifying the need for a 3‐day inpatient hospitalization to qualify for postdischarge skilled nursing facility benefits and adjusting RAC contingency fees based on overturn rates.[52, 53] These actions by CMS, Congress, and the OIG, as well as the options under consideration by MedPAC, demonstrate a degree of regulatory and legislative responsiveness to hospital and provider concerns in the area of visit status determination.
The Medicare program is vital to tens of millions of disabled and elderly Americans. Fraud and abuse of the Medicare program should not be tolerated. Yet, the current system of assigning, monitoring, and auditing outpatient versus inpatient hospital care is in need of reform. It will be up to CMS and Congress to continue to work with hospitals and physicians to find an improved way to appropriately and fairly compensate hospitals for hospital services in a way that that does not depend on a poorly defined and contentious status of a patient. Such reform must include the RAC program. It is our hope that both CMS and Congress will prioritize status determination and payment reform so that Medicare beneficiaries, physicians, and hospitals all have a sustainable, fair, and transparent process.
- Testimony of Jodi D Nudelman, Regional Inspector General for the Office of Evaluation and Inspections, Office of the Inspector General, US Department of Health and Human Services, Hearing: Current Hospital Issues in the Medicare Program, House Committee on Ways and Means, Subcommittee on Health, May 20, 2014. Available at: https://oig.hhs.gov/newsroom/testimony‐and‐speeches/index.asp. Accessed November 24, 2014.
- Centers for Medicare 173:1999–2000.
- US Department of Health 49:893–909.
- US Department of Health 28:95–111.
- . The price of admission: increasing use of decision‐support technology draws criticism for changing roles in hospital‐admissions process. Modern Healthcare website. Available at: http://www.modernhealthcare.com/article/20121117/MAGAZINE/311179951. Published November 17, 2012. Accessed November 9, 2014.
- , , , et al. The accuracy of interqual criteria in determining the need for observation versus hospitalization in emergency department patients with chronic heart failure. Crit Pathw Cardiol. 2013;12:192–196.
- US Department of Health 31:1251–1259.
- MedPAC March 2104 Report to the Congress, Medicare Payment Policy. Available at: http://www.medpac.gov/documents/reports/mar14_entirereport.pdf?sfvrsn=0. Accessed on December 22, 2014.
- , , , et al, Hospitalized but not admitted: characteristics of patients with “observation status” at an academic medical center. JAMA Intern Med. 2013;173:1991–1998.
- . The recovery audit contractor program and observation status for hospitalized Medicare beneficiaries. JAMA Internal Medicine blog. Available at: http://internalmedicineblog.jamainternalmed.com/2014/02/04/the‐recovery‐audit‐contractor‐program‐and‐observation‐status‐for‐hospitalized‐medicare‐beneficiaries. Published February 4, 2014. Accessed June 15, 2014.
- . Broken RAC system continues to hurt patients, providers. The Hospital Leader blog. Available at: http://blogs.hospitalmedicine.org/Blog/broken‐rac‐system‐continues‐to‐hurt‐patients‐providers. Published April 22, 2014. Accessed June 15, 2014.
- US Department of Health 78(160). Available at: http://www.gpo.gov/fdsys/pkg/FR‐2013‐08‐19/pdf/2013‐18956.pdf. Accessed August 4, 2014.
- US Department of Health use of observation and inpatient stays for Medicare beneficiaries, OEI‐02‐12‐00040. Available at: http://oig.hhs.gov/oei/reports/oei‐02‐12‐00040.pdf. Accessed June 15, 2014.
- US Department of Health