User login
Beyond Reporting Early Warning Score Sensitivity: The Temporal Relationship and Clinical Relevance of “True Positive” Alerts that Precede Critical Deterioration
Patients at risk for clinical deterioration in the inpatient setting may not be identified efficiently or effectively by health care providers. Early warning systems that link clinical observations to rapid response mechanisms (such as medical emergency teams) have the potential to improve outcomes, but rigorous studies are lacking.1 The pediatric Rothman Index (pRI) is an automated early warning system sold by the company PeraHealth that is integrated with the electronic health record. The system incorporates vital signs, labs, and nursing assessments from existing electronic health record data to provide a single numeric score that generates alerts based on low absolute scores and acute decreases in score (low scores indicate high mortality risk).2 Automated alerts or rules based on the pRI score are meant to bring important changes in clinical status to the attention of clinicians.
Adverse outcomes (eg, unplanned intensive care unit [ICU] transfers and mortality) are associated with low pRI scores, and scores appear to decline prior to such events.2 However, the limitation of this and other studies evaluating the sensitivity of early warning systems3-6 is that the generated alerts are assigned “true positive” status if they precede clinical deterioration, regardless of whether or not they provide meaningful information to the clinicians caring for the patients. There are two potential critiques of this approach. First, the alert may have preceded a deterioration event but may not have been clinically relevant (eg, an alert triggered by a finding unrelated to the patient’s acute health status, such as a scar that was newly documented as an abnormal skin finding and as a result led to a worsening in the pRI). Second, even if the preceding alert demonstrated clinical relevance to a deterioration event, the clinicians at the bedside may have been aware of the patient’s deterioration for hours and have already escalated care. In this situation, the alert would simply confirm what the clinician already knew.
To better understand the relationship between early warning system acuity alerts and clinical practice, we examined a cohort of hospitalized patients who experienced a critical deterioration event (CDE)7 and who would have triggered a preceding pRI alert. We evaluated the clinical relationship of the alert to the CDE (ie, whether the alert reflected physiologic changes related to a CDE or was instead an artifact of documentation) and identified whether the alert would have preceded evidence that clinicians recognized deterioration or escalated care.
METHODS
Patients and Setting
This retrospective cross-sectional study was performed at Children’s Hospital of Philadelphia (CHOP), a freestanding children’s hospital with 546 beds. Eligible patients were hospitalized on nonintensive care, noncardiology, surgical wards between January 1, 2013, and December 31, 2013. The CHOP Institutional Review Board (IRB) approved the study with waivers of consent and assent. A HIPAA Business Associate Agreement and an IRB Reliance Agreement were in place with PeraHealth to permit data transfer.
Definition of Critical Deterioration Events
Critical deterioration events (CDEs) were defined according to an existing, validated measure7 as unplanned transfers to the ICU with continuous or bilevel positive airway pressure, tracheal intubation, and/or vasopressor infusion in the 12 hours after transfer. At CHOP, all unplanned ICU transfers are routed through the hospital’s rapid response or code blue teams, so these patients were identified using an existing database managed by the CHOP Resuscitation Committee. In the database, the elements of CDEs are entered as part of ongoing quality improvement activities. The time of CDE was defined as the time of the rapid response call precipitating unplanned transfer to the ICU.
The Pediatric Rothman Index
The pRI is an automated acuity score that has been validated in hospitalized pediatric patients.2 The pRI is calculated using existing variables from the electronic health record, including manually entered vital signs, laboratory values, cardiac rhythm, and nursing assessments of organ systems. The weights assigned to continuous variables are a function of deviation from the norm.2,8 (See Supplement 1 for a complete list of variables.)
The pRI is integrated with the electronic health record and automatically generates a score each time a new data observation becomes available. Changes in score over time and low absolute scores generate a graduated series of alerts ranging from medium to very high acuity. This analysis used PeraHealth’s standard pRI alerts. Medium acuity alerts occurred when the pRI score decreased by ≥30% in 24 hours. A high acuity alert occurred when the pRI score decreased by ≥40% in 6 hours. A very high acuity alert occurred when the pRI absolute score was ≤ 30.
Development of the Source Dataset
In 2014, CHOP shared one year of clinical data with PeraHealth as part of the process of deciding whether or not to implement the pRI. The pRI algorithm retrospectively generated scores and acuity alerts for all CHOP patients who experienced CDEs between January 1, 2013, and December 31, 2013. The pRI algorithm was not active in the hospital environment during this time period; the scores and acuity alerts were not visible to clinicians. This dataset was provided to the investigators at CHOP to conduct this project.
Data Collection
Pediatric intensive care nurses trained in clinical research data abstraction from the CHOP Critical Care Center for Evidence and Outcomes performed the chart review for this study. Chart abstraction comparisons were completed on the first 15 charts to ensure interrater reliability, and additional quality assurance checks were performed on intermittent charts to ensure consistency and definition adherence. We managed all data using Research Electronic Data Capture.9
To study the value of alerts labeled as “true positives,” we restricted the dataset to CDEs in which acuity alert(s) within the prior 72 hours would have been triggered if the pRI had been in clinical use at the time.
To identify the clinical relationship between pRI and CDE, we reviewed each chart with the goal of determining whether the preceding acuity alerts were clinically associated with the etiology of the CDE. We determined the etiology of the CDE by reviewing the cause(s) identified in the note written by rapid response or code blue team responders or by the admitting clinical team after transfer to the ICU. We then used a tool provided by PeraHealth to identify the specific score components that led to worsening pRI. If the score components that worsened were (a) consistent with a clinical change as opposed to a documentation artifact and (b) an organ system change that was plausibly related to the CDE etiology, we concluded that the alert was clinically related to the etiology of the CDE.
We defined documentation artifacts as instances in nursing documentation in which a finding unrelated to the patient’s acute health status, such as a scar, was newly documented as abnormal and led to worsening pRI. Any cases in which the clinical relevance was unclear underwent review by additional members of the team
To determine the temporal relationship among pRI, CDE, and clinician awareness or action, we then sought to systematically determine whether the preceding acuity alerts preceded documented evidence of clinicians recognizing deterioration or escalation of care. We made the a priori decision that acuity alerts that occurred more than 24 hours prior to a deterioration event had questionable clinical actionability. Therefore, we restricted this next analysis to CDEs with acuity alerts during the 24 hours prior to a CDE. We reviewed time-stamped progress notes written by clinicians in the 24 hours period prior to the time of the CDE and identified whether the notes reflected an adverse change in patient status or a clinical intervention. We then compared the times of these notes with the times of the alerts and CDEs. Given that documentation of change in clinical status often occurs after clinical intervention, we also reviewed new orders placed in the 24 hours prior to each CDE to determine escalation of care. We identified the following orders as reflective of escalation of care independent of specific disease process: administration of intravenous fluid bolus, blood product, steroid, or antibiotic, increased respiratory support, new imaging studies, and new laboratory studies. We then compared the time of each order with the time of the alert and CDE.
RESULTS
During the study period, 73 events met the CDE criteria and had a pRI alert during admission. Of the 73 events, 50 would have triggered at least one pRI alert in the 72-hour period leading up to the CDE (sensitivity 68%). Of the 50 events, 39 generated pRI alerts in the 24 hours leading up to the event, and 11 others generated pRI alerts between 24 and 72 hours prior to the event but did not generate any alerts during the 24 hours leading up to the event (Figure).
Patient Characteristics
The 50 CDEs labeled as true positives occurred in 46 unique patients. Table 1 displays the event characteristics.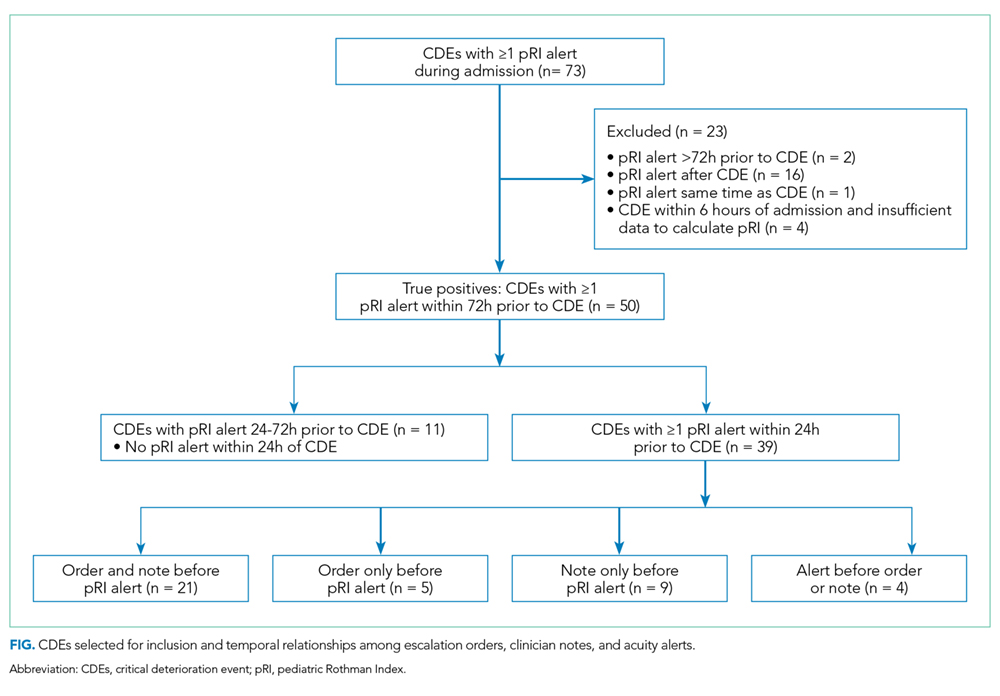
Acuity Alerts
A total of 79 pRI alerts preceded the 50 CDEs. Of these acuity alerts, 44 (56%) were medium acuity alerts, 17 (22%) were high acuity alerts, and 18 (23%) were very high acuity alerts. Of the 50 CDEs that would have triggered pRI alerts, 33 (66%) would have triggered a single acuity alert and 17 (34%) would have triggered multiple acuity alerts.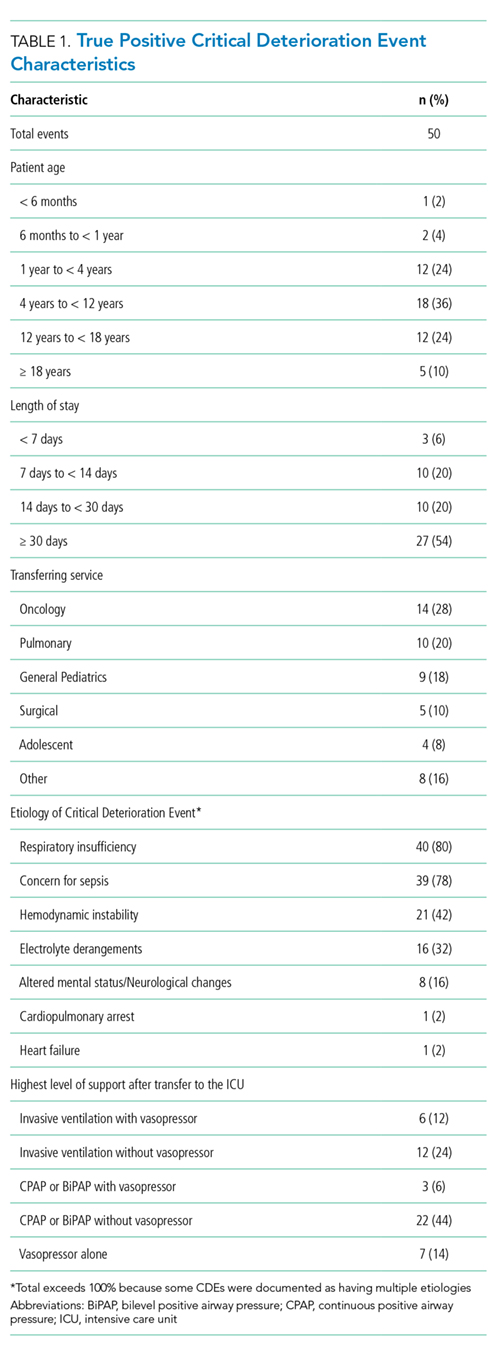
Of the 50 CDEs, 39 (78%) had a preceding acuity alert within 24 hours prior to the CDE. In these cases, the alert preceded the CDE by a median of 3.1 hours (interquartile range of 0.7 to 10.3 hours).
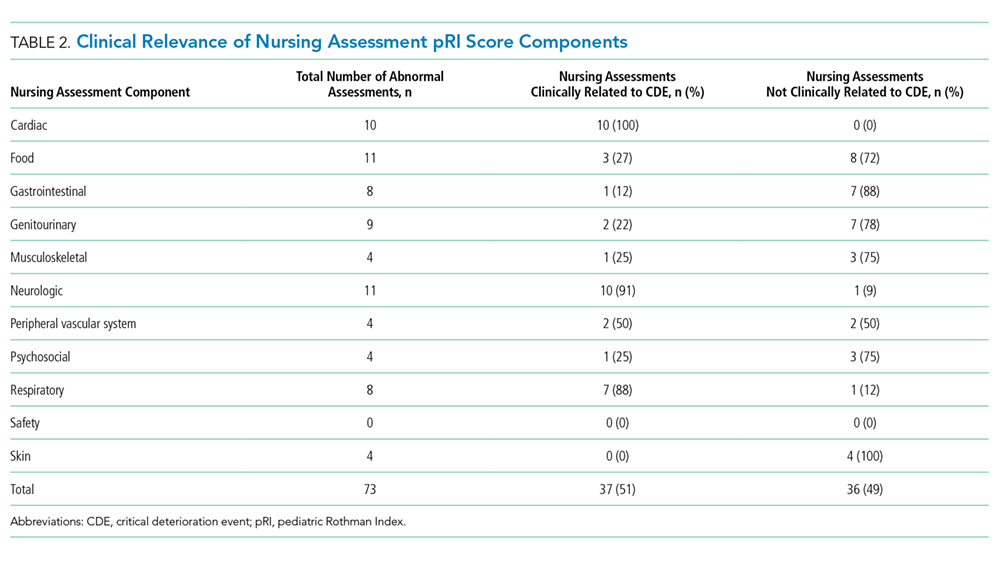
We assessed the score components that caused each alert to trigger. All of the vital sign and laboratory components were assessed as clinically related to the CDE’s etiology. By contrast, about half of nursing assessment components were assessed as clinically related to the etiology of the CDE (Table 2). Abnormal cardiac, respiratory, and neurologic assessments were most frequently assessed as clinically relevant.
Escalation Orders
To determine whether the pRI alert would have preceded the earliest documented treatment efforts, we restricted evaluation to the 39 CDEs that had at least one alert in the 24-hour window prior to the CDE. When we reviewed escalation orders placed by clinicians, we found that in 26 cases (67%), the first clinician order reflecting escalation of care would have preceded the first pRI alert within the 24-hour period prior to the CDE. In 13 cases (33%), the first pRI alert would have preceded the first escalation order placed by the clinician. The first pRI alert and the first escalation order would have occurred within the same 1-hour period in 6 of these cases.
Provider Notes
Temporal Relationships
In Supplement 2, we present the proportion of CDEs in which the order or note preceded the pRI alert for each abnormal organ system.
The Figure shows the temporal relationships among escalation orders, clinician notes, and acuity alerts for the 39 CDEs with one or more alerts in the 24 hours leading up to the event. In 21 cases (54%), both an escalation order and a note preceded the first acuity alert. In 14 cases (36%), either an escalation order or a note preceded the first acuity alert. In four cases (10%), the alert preceded any documented evidence that clinicians had recognized deterioration or escalating care.
DISCUSSION
The main finding of this study is that 90% of CDE events that generated “true positive” pRI alerts had evidence suggesting that clinicians had already recognized deterioration and/or were already escalating care before most pRI alerts would have been triggered.
The impacts of early warning scores on patient safety outcomes are not well established. In a recent 21-hospital cluster randomized trial of the BedsidePEWS, a pediatric early warning score system, investigators found that implementing the system does not significantly decrease all-cause mortality in hospitalized children, although hospitals using the BedsidePEWS have low rates of significant CDEs.10 In other studies, early warning scores were often coimplemented with rapid response teams, and separating the incremental benefit of the scoring tool from the availability of a rapid response team is usually not possible.11
Therefore, the benefits of early warning scores are often inferred based on their test characteristics (eg, sensitivity and positive predictive value).12 Sensitivity, which is the proportion of patients who deteriorated and also triggered the early warning score within a reasonable time window preceding the event, is an important consideration when deciding whether an early warning score is worth implementing. A challenging follow-up question that goes beyond sensitivity is how often an early warning score adds new knowledge by identifying patients on a path toward deterioration who were not yet recognized. This study is the first to address that follow-up question. Our results revealed that the score appeared to precede evidence of clinician recognition of deterioration in 10% of CDEs. In some patients, the alert could have contributed to a detection of deterioration that was not previously evident. In the portion of CDEs in which the alert and escalation order or note occurred within the same one-hour window, the alert could have been used as confirmation of clinical suspicion. Notably, we did not evaluate the 16 cases in which a CDE preceded any pRI alert because we chose to focus on “true positive” cases in which pRI alerts preceded CDEs. These events could have had timely recognition by clinicians that we did not capture, so these results may provide an overestimation of CDEs in which the pRI preceded clinician recognition.
Prior work has described a range of mechanisms by which early warning scores can impact patient safety.13 The results of this study suggest limited incremental benefit for the pRI to alert physicians and nurses to new concerning changes at this hospital, although the benefits to low-resourced community hospitals that care for children may be great. The pRI score may also serve as evidence that empowers nurses to overcome barriers to further escalate care, even if the process of escalation has already begun. In addition to empowering nurses, the score may support trainees and clinicians with varying levels of pediatric expertise in the decision to escalate care. Evaluating these potential benefits would require prospective study.
We used the pRI alerts as they were already defined by PeraHealth for CHOP, and different alert thresholds may change score performance. Our study did not identify additional variables to improve score performance, but they can be investigated in future research.
This study had several limitations. First, this work is a single-center study with highly skilled pediatric providers, a mature rapid response system, and low rates of cardiopulmonary arrest outside ICUs. Therefore, the results that we obtained were not immediately generalizable. In a community environment with nurses and physicians who are less experienced in caring for ill children, an early warning score with high sensitivity may be beneficial in ensuring patient safety.
Second, by using escalation orders and notes from the patient chart, we did not capture all the undocumented ways in which clinicians demonstrate awareness of deterioration. For example, a resident may alert the attending on service or a team may informally request consultation with a specialist. We also gave equal weight to escalation orders and clinician notes as evidence of recognition of deterioration. It could be that either orders or notes more closely correlated with clinician awareness.
Finally, the data were from 2013. Although the score components have not changed, efforts to standardize nursing assessments may have altered the performance of the score in the intervening years.
CONCLUSIONS
In most patients who had a CDE at a large freestanding children’s hospital, escalation orders or documented changes in patient status would have occurred before a pRI alert. However, in a minority of patients, the alert could have contributed to the detection of deterioration that was not previously evident.
Disclosures
The authors have nothing to disclose
Funding
The study was supported by funds from the Department of Biomedical and Health Informatics at Children’s Hospital of Philadelphia. PeraHealth, the company that sells the Rothman Index software, provided a service to the investigators but no funding. They applied their proprietary scoring algorithm to the data from Children’s Hospital of Philadelphia to generate alerts retrospectively. This service was provided free of charge in 2014 during the time period when Children’s Hospital of Philadelphia was considering purchasing and implementing PeraHealth software, which it subsequently did. We did not receive any funding for the study from PeraHealth. PeraHealth personnel did not influence the study design, the interpretation of data, the writing of the report, or the decision to submit the article for publication.
1. Alam N, Hobbelink EL, van Tienhoven AJ, van de Ven PM, Jansma EP, Nanayakkara PWB. The impact of the use of the Early Warning Score (EWS) on patient outcomes: a systematic review. Resuscitation. 2014;85(5):587-594. doi: 10.1016/j.resuscitation.2014.01.013. PubMed
2. Rothman MJ, Tepas JJ, Nowalk AJ, et al. Development and validation of a continuously age-adjusted measure of patient condition for hospitalized children using the electronic medical record. J Biomed Inform. 2017;66 (Supplement C):180-193. doi: 10.1016/j.jbi.2016.12.013. PubMed
3. Akre M, Finkelstein M, Erickson M, Liu M, Vanderbilt L, Billman G. Sensitivity of the pediatric early warning score to identify patient deterioration. Pediatrics. 2010;125(4):e763-e769. doi: 10.1542/peds.2009-0338. PubMed
4. Seiger N, Maconochie I, Oostenbrink R, Moll HA. Validity of different pediatric early warning scores in the emergency department. Pediatrics. 2013;132(4):e841-e850. doi: 10.1542/peds.2012-3594. PubMed
5. Parshuram CS, Hutchison J, Middaugh K. Development and initial validation of the Bedside Paediatric Early Warning System score. Crit Care Lond Engl. 2009;13(4):R135. doi: 10.1186/cc7998. PubMed
6. Hollis RH, Graham LA, Lazenby JP, et al. A role for the early warning score in early identification of critical postoperative complications. Ann Surg. 2016;263(5):918-923. doi: 10.1097/SLA.0000000000001514. PubMed
7. Bonafide CP, Roberts KE, Priestley MA, et al. Development of a pragmatic measure for evaluating and optimizing rapid response systems. Pediatrics. 2012;129(4):e874-e881. doi: 10.1542/peds.2011-2784. PubMed
8. Rothman MJ, Rothman SI, Beals J. Development and validation of a continuous measure of patient condition using the electronic medical record. J Biomed Inform. 2013;46(5):837-848. doi: 10.1016/j.jbi.2013.06.011. PubMed
9. Harris PA, Taylor R, Thielke R, Payne J, Gonzalez N, Conde JG. Research Electronic Data Capture (REDCap) - A metadata-driven methodology and workflow process for providing translational research informatics support. J Biomed Inform. 2009;42(2):377-381. doi: 10.1016/j.jbi.2008.08.010. PubMed
10. Parshuram CS, Dryden-Palmer K, Farrell C, et al. Effect of a pediatric early warning system on all-cause mortality in hospitalized pediatric patients: the EPOCH randomized clinical trial. JAMA. 2018;319(10):1002-1012. doi: 10.1001/jama.2018.0948. PubMed
11. Bonafide CP, Localio AR, Roberts KE, Nadkarni VM, Weirich CM, Keren R. Impact of rapid response system implementation on critical deterioration events in children. JAMA Pediatr. 2014;168(1):25-33. doi: 10.1001/jamapediatrics.2013.3266. PubMed
12. Romero-Brufau S, Huddleston JM, Escobar GJ, Liebow M. Why the C-statistic is not informative to evaluate early warning scores and what metrics to use. Crit Care. 2015;19:285. doi: 10.1186/s13054-015-0999-1. PubMed
13. Bonafide CP, Roberts KE, Weirich CM, et al. Beyond statistical prediction: qualitative evaluation of the mechanisms by which pediatric early warning scores impact patient safety. J Hosp Med. 2013;8(5):248-253. doi: 10.1002/jhm.2026. PubMed
Patients at risk for clinical deterioration in the inpatient setting may not be identified efficiently or effectively by health care providers. Early warning systems that link clinical observations to rapid response mechanisms (such as medical emergency teams) have the potential to improve outcomes, but rigorous studies are lacking.1 The pediatric Rothman Index (pRI) is an automated early warning system sold by the company PeraHealth that is integrated with the electronic health record. The system incorporates vital signs, labs, and nursing assessments from existing electronic health record data to provide a single numeric score that generates alerts based on low absolute scores and acute decreases in score (low scores indicate high mortality risk).2 Automated alerts or rules based on the pRI score are meant to bring important changes in clinical status to the attention of clinicians.
Adverse outcomes (eg, unplanned intensive care unit [ICU] transfers and mortality) are associated with low pRI scores, and scores appear to decline prior to such events.2 However, the limitation of this and other studies evaluating the sensitivity of early warning systems3-6 is that the generated alerts are assigned “true positive” status if they precede clinical deterioration, regardless of whether or not they provide meaningful information to the clinicians caring for the patients. There are two potential critiques of this approach. First, the alert may have preceded a deterioration event but may not have been clinically relevant (eg, an alert triggered by a finding unrelated to the patient’s acute health status, such as a scar that was newly documented as an abnormal skin finding and as a result led to a worsening in the pRI). Second, even if the preceding alert demonstrated clinical relevance to a deterioration event, the clinicians at the bedside may have been aware of the patient’s deterioration for hours and have already escalated care. In this situation, the alert would simply confirm what the clinician already knew.
To better understand the relationship between early warning system acuity alerts and clinical practice, we examined a cohort of hospitalized patients who experienced a critical deterioration event (CDE)7 and who would have triggered a preceding pRI alert. We evaluated the clinical relationship of the alert to the CDE (ie, whether the alert reflected physiologic changes related to a CDE or was instead an artifact of documentation) and identified whether the alert would have preceded evidence that clinicians recognized deterioration or escalated care.
METHODS
Patients and Setting
This retrospective cross-sectional study was performed at Children’s Hospital of Philadelphia (CHOP), a freestanding children’s hospital with 546 beds. Eligible patients were hospitalized on nonintensive care, noncardiology, surgical wards between January 1, 2013, and December 31, 2013. The CHOP Institutional Review Board (IRB) approved the study with waivers of consent and assent. A HIPAA Business Associate Agreement and an IRB Reliance Agreement were in place with PeraHealth to permit data transfer.
Definition of Critical Deterioration Events
Critical deterioration events (CDEs) were defined according to an existing, validated measure7 as unplanned transfers to the ICU with continuous or bilevel positive airway pressure, tracheal intubation, and/or vasopressor infusion in the 12 hours after transfer. At CHOP, all unplanned ICU transfers are routed through the hospital’s rapid response or code blue teams, so these patients were identified using an existing database managed by the CHOP Resuscitation Committee. In the database, the elements of CDEs are entered as part of ongoing quality improvement activities. The time of CDE was defined as the time of the rapid response call precipitating unplanned transfer to the ICU.
The Pediatric Rothman Index
The pRI is an automated acuity score that has been validated in hospitalized pediatric patients.2 The pRI is calculated using existing variables from the electronic health record, including manually entered vital signs, laboratory values, cardiac rhythm, and nursing assessments of organ systems. The weights assigned to continuous variables are a function of deviation from the norm.2,8 (See Supplement 1 for a complete list of variables.)
The pRI is integrated with the electronic health record and automatically generates a score each time a new data observation becomes available. Changes in score over time and low absolute scores generate a graduated series of alerts ranging from medium to very high acuity. This analysis used PeraHealth’s standard pRI alerts. Medium acuity alerts occurred when the pRI score decreased by ≥30% in 24 hours. A high acuity alert occurred when the pRI score decreased by ≥40% in 6 hours. A very high acuity alert occurred when the pRI absolute score was ≤ 30.
Development of the Source Dataset
In 2014, CHOP shared one year of clinical data with PeraHealth as part of the process of deciding whether or not to implement the pRI. The pRI algorithm retrospectively generated scores and acuity alerts for all CHOP patients who experienced CDEs between January 1, 2013, and December 31, 2013. The pRI algorithm was not active in the hospital environment during this time period; the scores and acuity alerts were not visible to clinicians. This dataset was provided to the investigators at CHOP to conduct this project.
Data Collection
Pediatric intensive care nurses trained in clinical research data abstraction from the CHOP Critical Care Center for Evidence and Outcomes performed the chart review for this study. Chart abstraction comparisons were completed on the first 15 charts to ensure interrater reliability, and additional quality assurance checks were performed on intermittent charts to ensure consistency and definition adherence. We managed all data using Research Electronic Data Capture.9
To study the value of alerts labeled as “true positives,” we restricted the dataset to CDEs in which acuity alert(s) within the prior 72 hours would have been triggered if the pRI had been in clinical use at the time.
To identify the clinical relationship between pRI and CDE, we reviewed each chart with the goal of determining whether the preceding acuity alerts were clinically associated with the etiology of the CDE. We determined the etiology of the CDE by reviewing the cause(s) identified in the note written by rapid response or code blue team responders or by the admitting clinical team after transfer to the ICU. We then used a tool provided by PeraHealth to identify the specific score components that led to worsening pRI. If the score components that worsened were (a) consistent with a clinical change as opposed to a documentation artifact and (b) an organ system change that was plausibly related to the CDE etiology, we concluded that the alert was clinically related to the etiology of the CDE.
We defined documentation artifacts as instances in nursing documentation in which a finding unrelated to the patient’s acute health status, such as a scar, was newly documented as abnormal and led to worsening pRI. Any cases in which the clinical relevance was unclear underwent review by additional members of the team
To determine the temporal relationship among pRI, CDE, and clinician awareness or action, we then sought to systematically determine whether the preceding acuity alerts preceded documented evidence of clinicians recognizing deterioration or escalation of care. We made the a priori decision that acuity alerts that occurred more than 24 hours prior to a deterioration event had questionable clinical actionability. Therefore, we restricted this next analysis to CDEs with acuity alerts during the 24 hours prior to a CDE. We reviewed time-stamped progress notes written by clinicians in the 24 hours period prior to the time of the CDE and identified whether the notes reflected an adverse change in patient status or a clinical intervention. We then compared the times of these notes with the times of the alerts and CDEs. Given that documentation of change in clinical status often occurs after clinical intervention, we also reviewed new orders placed in the 24 hours prior to each CDE to determine escalation of care. We identified the following orders as reflective of escalation of care independent of specific disease process: administration of intravenous fluid bolus, blood product, steroid, or antibiotic, increased respiratory support, new imaging studies, and new laboratory studies. We then compared the time of each order with the time of the alert and CDE.
RESULTS
During the study period, 73 events met the CDE criteria and had a pRI alert during admission. Of the 73 events, 50 would have triggered at least one pRI alert in the 72-hour period leading up to the CDE (sensitivity 68%). Of the 50 events, 39 generated pRI alerts in the 24 hours leading up to the event, and 11 others generated pRI alerts between 24 and 72 hours prior to the event but did not generate any alerts during the 24 hours leading up to the event (Figure).
Patient Characteristics
The 50 CDEs labeled as true positives occurred in 46 unique patients. Table 1 displays the event characteristics.
Acuity Alerts
A total of 79 pRI alerts preceded the 50 CDEs. Of these acuity alerts, 44 (56%) were medium acuity alerts, 17 (22%) were high acuity alerts, and 18 (23%) were very high acuity alerts. Of the 50 CDEs that would have triggered pRI alerts, 33 (66%) would have triggered a single acuity alert and 17 (34%) would have triggered multiple acuity alerts.
Of the 50 CDEs, 39 (78%) had a preceding acuity alert within 24 hours prior to the CDE. In these cases, the alert preceded the CDE by a median of 3.1 hours (interquartile range of 0.7 to 10.3 hours).
We assessed the score components that caused each alert to trigger. All of the vital sign and laboratory components were assessed as clinically related to the CDE’s etiology. By contrast, about half of nursing assessment components were assessed as clinically related to the etiology of the CDE (Table 2). Abnormal cardiac, respiratory, and neurologic assessments were most frequently assessed as clinically relevant.
Escalation Orders
To determine whether the pRI alert would have preceded the earliest documented treatment efforts, we restricted evaluation to the 39 CDEs that had at least one alert in the 24-hour window prior to the CDE. When we reviewed escalation orders placed by clinicians, we found that in 26 cases (67%), the first clinician order reflecting escalation of care would have preceded the first pRI alert within the 24-hour period prior to the CDE. In 13 cases (33%), the first pRI alert would have preceded the first escalation order placed by the clinician. The first pRI alert and the first escalation order would have occurred within the same 1-hour period in 6 of these cases.
Provider Notes
Temporal Relationships
In Supplement 2, we present the proportion of CDEs in which the order or note preceded the pRI alert for each abnormal organ system.
The Figure shows the temporal relationships among escalation orders, clinician notes, and acuity alerts for the 39 CDEs with one or more alerts in the 24 hours leading up to the event. In 21 cases (54%), both an escalation order and a note preceded the first acuity alert. In 14 cases (36%), either an escalation order or a note preceded the first acuity alert. In four cases (10%), the alert preceded any documented evidence that clinicians had recognized deterioration or escalating care.
DISCUSSION
The main finding of this study is that 90% of CDE events that generated “true positive” pRI alerts had evidence suggesting that clinicians had already recognized deterioration and/or were already escalating care before most pRI alerts would have been triggered.
The impacts of early warning scores on patient safety outcomes are not well established. In a recent 21-hospital cluster randomized trial of the BedsidePEWS, a pediatric early warning score system, investigators found that implementing the system does not significantly decrease all-cause mortality in hospitalized children, although hospitals using the BedsidePEWS have low rates of significant CDEs.10 In other studies, early warning scores were often coimplemented with rapid response teams, and separating the incremental benefit of the scoring tool from the availability of a rapid response team is usually not possible.11
Therefore, the benefits of early warning scores are often inferred based on their test characteristics (eg, sensitivity and positive predictive value).12 Sensitivity, which is the proportion of patients who deteriorated and also triggered the early warning score within a reasonable time window preceding the event, is an important consideration when deciding whether an early warning score is worth implementing. A challenging follow-up question that goes beyond sensitivity is how often an early warning score adds new knowledge by identifying patients on a path toward deterioration who were not yet recognized. This study is the first to address that follow-up question. Our results revealed that the score appeared to precede evidence of clinician recognition of deterioration in 10% of CDEs. In some patients, the alert could have contributed to a detection of deterioration that was not previously evident. In the portion of CDEs in which the alert and escalation order or note occurred within the same one-hour window, the alert could have been used as confirmation of clinical suspicion. Notably, we did not evaluate the 16 cases in which a CDE preceded any pRI alert because we chose to focus on “true positive” cases in which pRI alerts preceded CDEs. These events could have had timely recognition by clinicians that we did not capture, so these results may provide an overestimation of CDEs in which the pRI preceded clinician recognition.
Prior work has described a range of mechanisms by which early warning scores can impact patient safety.13 The results of this study suggest limited incremental benefit for the pRI to alert physicians and nurses to new concerning changes at this hospital, although the benefits to low-resourced community hospitals that care for children may be great. The pRI score may also serve as evidence that empowers nurses to overcome barriers to further escalate care, even if the process of escalation has already begun. In addition to empowering nurses, the score may support trainees and clinicians with varying levels of pediatric expertise in the decision to escalate care. Evaluating these potential benefits would require prospective study.
We used the pRI alerts as they were already defined by PeraHealth for CHOP, and different alert thresholds may change score performance. Our study did not identify additional variables to improve score performance, but they can be investigated in future research.
This study had several limitations. First, this work is a single-center study with highly skilled pediatric providers, a mature rapid response system, and low rates of cardiopulmonary arrest outside ICUs. Therefore, the results that we obtained were not immediately generalizable. In a community environment with nurses and physicians who are less experienced in caring for ill children, an early warning score with high sensitivity may be beneficial in ensuring patient safety.
Second, by using escalation orders and notes from the patient chart, we did not capture all the undocumented ways in which clinicians demonstrate awareness of deterioration. For example, a resident may alert the attending on service or a team may informally request consultation with a specialist. We also gave equal weight to escalation orders and clinician notes as evidence of recognition of deterioration. It could be that either orders or notes more closely correlated with clinician awareness.
Finally, the data were from 2013. Although the score components have not changed, efforts to standardize nursing assessments may have altered the performance of the score in the intervening years.
CONCLUSIONS
In most patients who had a CDE at a large freestanding children’s hospital, escalation orders or documented changes in patient status would have occurred before a pRI alert. However, in a minority of patients, the alert could have contributed to the detection of deterioration that was not previously evident.
Disclosures
The authors have nothing to disclose
Funding
The study was supported by funds from the Department of Biomedical and Health Informatics at Children’s Hospital of Philadelphia. PeraHealth, the company that sells the Rothman Index software, provided a service to the investigators but no funding. They applied their proprietary scoring algorithm to the data from Children’s Hospital of Philadelphia to generate alerts retrospectively. This service was provided free of charge in 2014 during the time period when Children’s Hospital of Philadelphia was considering purchasing and implementing PeraHealth software, which it subsequently did. We did not receive any funding for the study from PeraHealth. PeraHealth personnel did not influence the study design, the interpretation of data, the writing of the report, or the decision to submit the article for publication.
1. Alam N, Hobbelink EL, van Tienhoven AJ, van de Ven PM, Jansma EP, Nanayakkara PWB. The impact of the use of the Early Warning Score (EWS) on patient outcomes: a systematic review. Resuscitation. 2014;85(5):587-594. doi: 10.1016/j.resuscitation.2014.01.013. PubMed
2. Rothman MJ, Tepas JJ, Nowalk AJ, et al. Development and validation of a continuously age-adjusted measure of patient condition for hospitalized children using the electronic medical record. J Biomed Inform. 2017;66 (Supplement C):180-193. doi: 10.1016/j.jbi.2016.12.013. PubMed
3. Akre M, Finkelstein M, Erickson M, Liu M, Vanderbilt L, Billman G. Sensitivity of the pediatric early warning score to identify patient deterioration. Pediatrics. 2010;125(4):e763-e769. doi: 10.1542/peds.2009-0338. PubMed
4. Seiger N, Maconochie I, Oostenbrink R, Moll HA. Validity of different pediatric early warning scores in the emergency department. Pediatrics. 2013;132(4):e841-e850. doi: 10.1542/peds.2012-3594. PubMed
5. Parshuram CS, Hutchison J, Middaugh K. Development and initial validation of the Bedside Paediatric Early Warning System score. Crit Care Lond Engl. 2009;13(4):R135. doi: 10.1186/cc7998. PubMed
6. Hollis RH, Graham LA, Lazenby JP, et al. A role for the early warning score in early identification of critical postoperative complications. Ann Surg. 2016;263(5):918-923. doi: 10.1097/SLA.0000000000001514. PubMed
7. Bonafide CP, Roberts KE, Priestley MA, et al. Development of a pragmatic measure for evaluating and optimizing rapid response systems. Pediatrics. 2012;129(4):e874-e881. doi: 10.1542/peds.2011-2784. PubMed
8. Rothman MJ, Rothman SI, Beals J. Development and validation of a continuous measure of patient condition using the electronic medical record. J Biomed Inform. 2013;46(5):837-848. doi: 10.1016/j.jbi.2013.06.011. PubMed
9. Harris PA, Taylor R, Thielke R, Payne J, Gonzalez N, Conde JG. Research Electronic Data Capture (REDCap) - A metadata-driven methodology and workflow process for providing translational research informatics support. J Biomed Inform. 2009;42(2):377-381. doi: 10.1016/j.jbi.2008.08.010. PubMed
10. Parshuram CS, Dryden-Palmer K, Farrell C, et al. Effect of a pediatric early warning system on all-cause mortality in hospitalized pediatric patients: the EPOCH randomized clinical trial. JAMA. 2018;319(10):1002-1012. doi: 10.1001/jama.2018.0948. PubMed
11. Bonafide CP, Localio AR, Roberts KE, Nadkarni VM, Weirich CM, Keren R. Impact of rapid response system implementation on critical deterioration events in children. JAMA Pediatr. 2014;168(1):25-33. doi: 10.1001/jamapediatrics.2013.3266. PubMed
12. Romero-Brufau S, Huddleston JM, Escobar GJ, Liebow M. Why the C-statistic is not informative to evaluate early warning scores and what metrics to use. Crit Care. 2015;19:285. doi: 10.1186/s13054-015-0999-1. PubMed
13. Bonafide CP, Roberts KE, Weirich CM, et al. Beyond statistical prediction: qualitative evaluation of the mechanisms by which pediatric early warning scores impact patient safety. J Hosp Med. 2013;8(5):248-253. doi: 10.1002/jhm.2026. PubMed
© 2018 Society of Hospital Medicine.
Association of Weekend Admission and Weekend Discharge with Length of Stay and 30-Day Readmission in Children’s Hospitals
Increasingly, metrics such as length of stay (LOS) and readmissions are being utilized in the United States to assess quality of healthcare because these factors may represent opportunities to reduce cost and improve healthcare delivery.1-8 However, the relatively low rate of pediatric readmissions,9 coupled with limited data regarding recommended LOS or best practices to prevent readmissions in children, challenges the ability of hospitals to safely reduce LOS and readmission rates for children.10–12
In adults, weekend admission is associated with prolonged LOS, increased readmission rates, and increased risk of mortality.13-21 This association is referred to as the “weekend effect.” While the weekend effect has been examined in children, the results of these studies have been variable, with some studies supporting this association and others refuting it.22-31 In contrast to patient demographic and clinical characteristics that are known to affect LOS and readmissions,32 the weekend effect represents a potentially modifiable aspect of a hospitalization that could be targeted to improve healthcare delivery.
With increasing national attention toward improving quality of care and reducing LOS and healthcare costs, more definitive evidence of the weekend effect is necessary to prioritize resource use at both the local and national levels. Therefore, we sought to determine the association of weekend admission and weekend discharge on LOS and 30-day readmissions, respectively, among a national cohort of children. We hypothesized that children admitted on the weekend would have longer LOS, whereas those discharged on the weekend would have higher readmission rates.
METHODS
Study Design and Data Source
We conducted a multicenter, retrospective, cross-sectional study. Data were obtained from the Pediatric Health Information System (PHIS), an administrative and billing database of 46 free-standing tertiary care pediatric hospitals affiliated with the Children’s Hospital Association (Lenexa, Kansas). Patient data are de-identified within PHIS; however, encrypted patient identifiers allow individual patients to be followed across visits. This study was not considered human subjects research by the policies of the Cincinnati Children’s Hospital Institutional Review Board.
Participants
We included hospitalizations to a PHIS-participating hospital for children aged 0-17 years between October 1, 2014 and September 30, 2015. We excluded children who were transferred from/to another institution, left against medical advice, or died in the hospital because these indications may result in incomplete LOS information and would not consistently contribute to readmission rates. We also excluded birth hospitalizations and children admitted for planned procedures. Birth hospitalizations were defined as hospitalizations that began on the day of birth.
Main Exposures
No standard definition of weekend admission or discharge was identified in the literature.33 Thus, we defined a weekend admission as an admission between 3:00
Main Outcomes
Our outcomes included LOS for weekend admission and 30-day readmissions for weekend discharge. LOS, measured in hours, was defined using the reported admission and discharge times. Readmissions were defined as a return to the same hospital within the subsequent 30 days following discharge.
Patient Demographics and Other Study Variables
Patient demographics included age, gender, race/ethnicity, payer, and median household income quartile based on the patient’s home ZIP code. Other study variables included presence of a complex chronic condition (CCC),34 technology dependence,34 number of chronic conditions of any complexity, admission through the emergency department, intensive care unit (ICU) admission, and case mix index. ICU admission and case mix index were chosen as markers for severity of illness. ICU admission was defined as any child who incurred ICU charges at any time following admission. Case mix index in PHIS is a relative weight assigned to each discharge based on the All-Patient Refined Diagnostic Group (APR-DRG; 3M) assignment and APR-DRG severity of illness, which ranges from 1 (minor) to 4 (extreme). The weights are derived by the Children’s Hospital Association from the HCUP KID 2012 database as the ratio of the average cost for discharges within a specific APR-DRG severity of illness combination to the average cost for all discharges in the database.
Statistical Analysis
Continuous variables were summarized with medians and interquartile ranges, while categorical variables were summarized with frequencies and percentages. Differences in admission and discharge characteristics between weekend and weekday were assessed using Wilcoxon rank sum tests for continuous variables and chi-square tests of association for categorical variables. We used generalized linear mixed modeling (GLMM) techniques to assess the impact of weekend admission on LOS and weekend discharge on readmission, adjusting for important patient demographic and clinical characteristics. Furthermore, we used GLMM point estimates to describe the variation across hospitals of the impact of weekday versus weekend care on LOS and readmissions. We assumed an underlying log-normal distribution for LOS and an underlying binomial distribution for 30-day readmission. All GLMMs included a random intercept for each hospital to account for patient clustering within a hospital. All statistical analyses were performed using SAS v.9.4 (SAS Institute, Cary, North Carolina), and P values <.05 were considered statistically significant.
RESULTS
We identified 390,745 hospitalizations that met inclusion criteria (Supplementary Figure 1). The median LOS among our cohort was 41 hours (interquartile range [IQR] 24-71) and the median 30-day readmission rate was 8.2% (IQR 7.2-9.4).
Admission Demographics for Weekends and Weekdays
Among the included hospitalizations, 92,266 (23.6%) admissions occurred on a weekend (Supplementary Table 1). Overall, a higher percentage of children <5 years of age were admitted on a weekend compared with those admitted on a weekday (53.3% vs 49.1%, P < .001). We observed a small but statistically significant difference in the proportion of weekend versus weekday admissions according to gender, race/ethnicity, payer, and median household income quartile. Children with medical complexity and those with technology dependence were admitted less frequently on a weekend. A higher proportion of children were admitted through the emergency department on a weekend and a higher frequency of ICU utilization was observed for children admitted on a weekend compared with those admitted on a weekday.
Association Between Study Variables and Length of Stay
In comparing adjusted LOS for weekend versus weekday admissions across 43 hospitals, not only did LOS vary across hospitals (P < .001), but the association between LOS and weekend versus weekday care also varied across hospitals (P < .001) (Figure 1). Weekend admission was associated with a significantly longer LOS at eight (18.6%) hospitals and a significantly shorter LOS at four (9.3%) hospitals with nonstatistically significant differences at the remaining hospitals.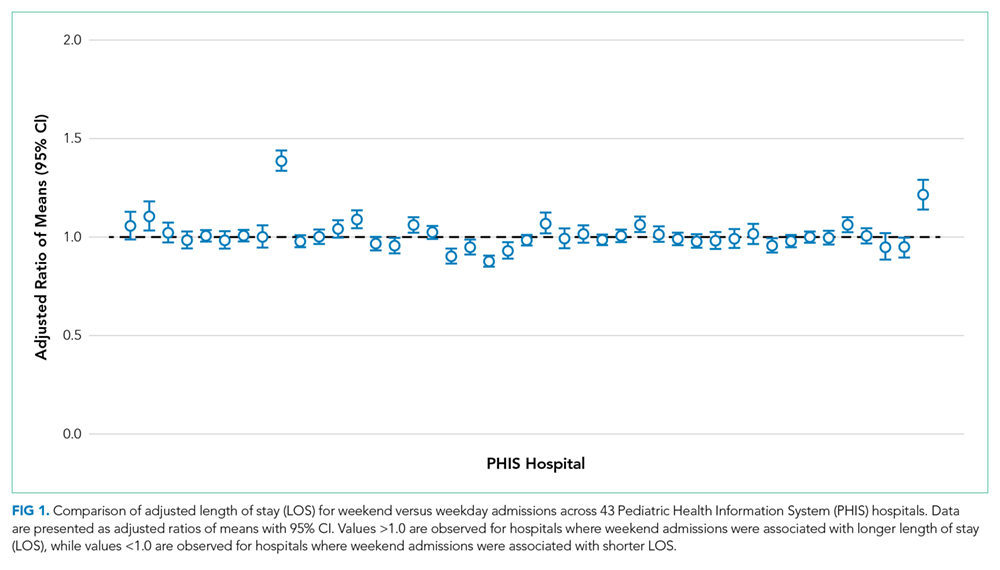
In adjusted analyses, we observed that infants ≤30 days of age, on average, had an adjusted LOS that was 24% longer than that of 15- to 17-year-olds, while children aged 1-14 years had an adjusted LOS that was 6%-18% shorter (Table 1). ICU utilization, admission through the emergency department, and number of chronic conditions had the greatest association with LOS. As the number of chronic conditions increased, the LOS increased. No association was found between weekend versus weekday admission and LOS (adjusted LOS [95% CI]: weekend 63.70 [61.01-66.52] hours versus weekday 63.40 [60.73-66.19] hours, P = .112).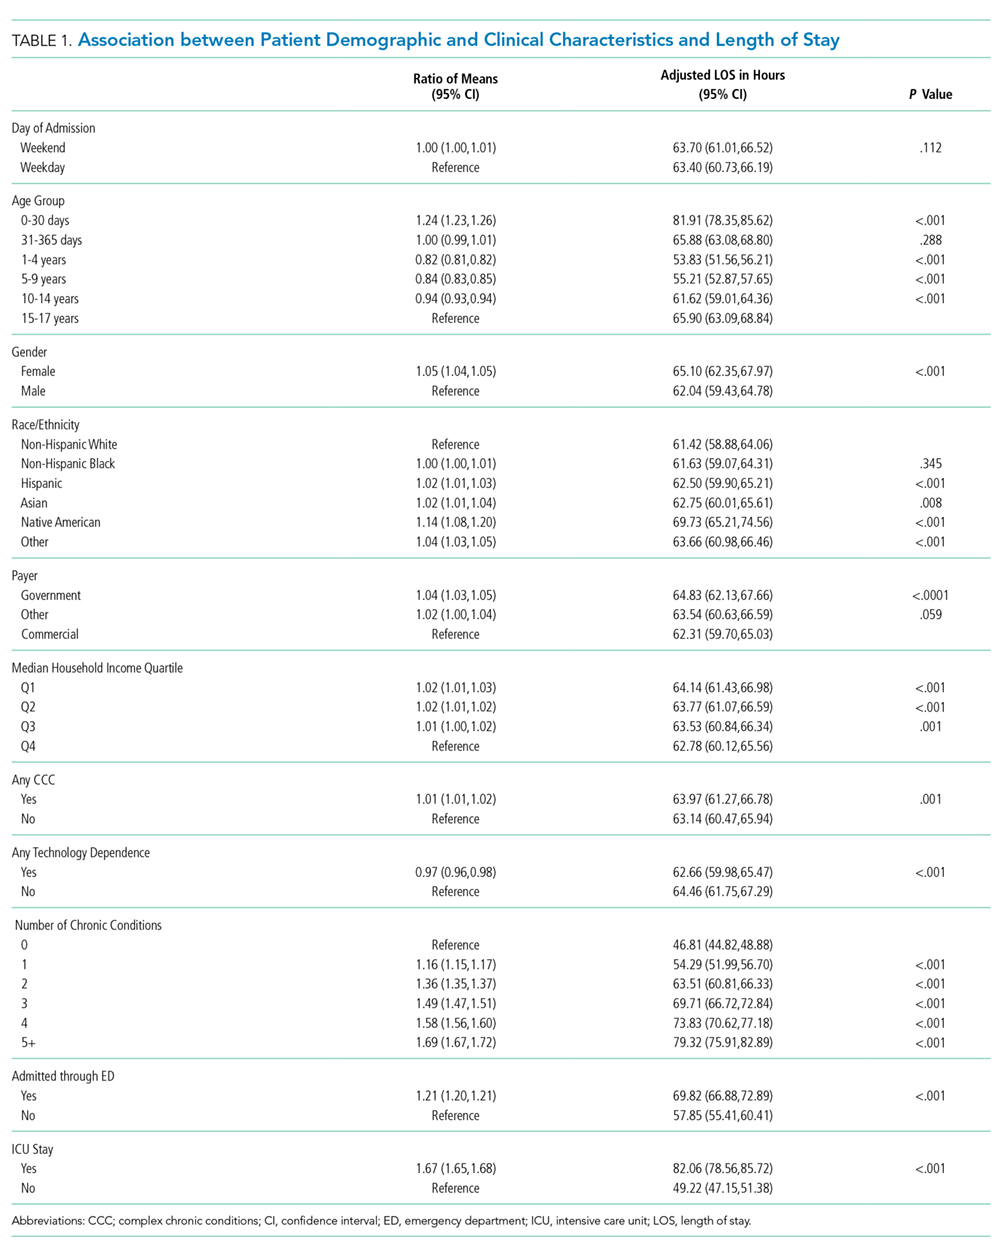
Discharge Demographics for Weekends and Weekdays
Of the included hospitalizations, 127,421 (32.6%) discharges occurred on a weekend (Supplementary Table 2). Overall, a greater percentage of weekend discharges comprised children <5 years of age compared with the percentage of weekday discharges for children <5 years of age (51.5% vs 49.5%, P < .001). No statistically significant differences were found in gender, payer, or median household income quartile between those children discharged on a weekend versus those discharged on a weekday. We found small, statistically significant differences in the proportion of weekend versus weekday discharges according to race/ethnicity, with fewer non-Hispanic white children being discharged on the weekend versus weekday. Children with medical complexity, technology dependence, and patients with ICU utilization were less frequently discharged on a weekend compared with those discharged on a weekday.
Association Between Study Variables and Readmissions
In comparing the adjusted odds of readmissions for weekend versus weekday discharges across 43 PHIS hospitals, we observed significant variation (P < .001) in readmission rates from hospital to hospital (Figure 2). However, the direction of impact of weekend care on readmissions was similar (P = .314) across hospitals (ie, for 37 of 43 hospitals, the readmission rate was greater for weekend discharges compared with that for weekday discharges). For 17 (39.5%) of 43 hospitals, weekend discharge was associated with a significantly higher readmission rate, while the differences between weekday and weekend discharge were not statistically significant for the remaining hospitals.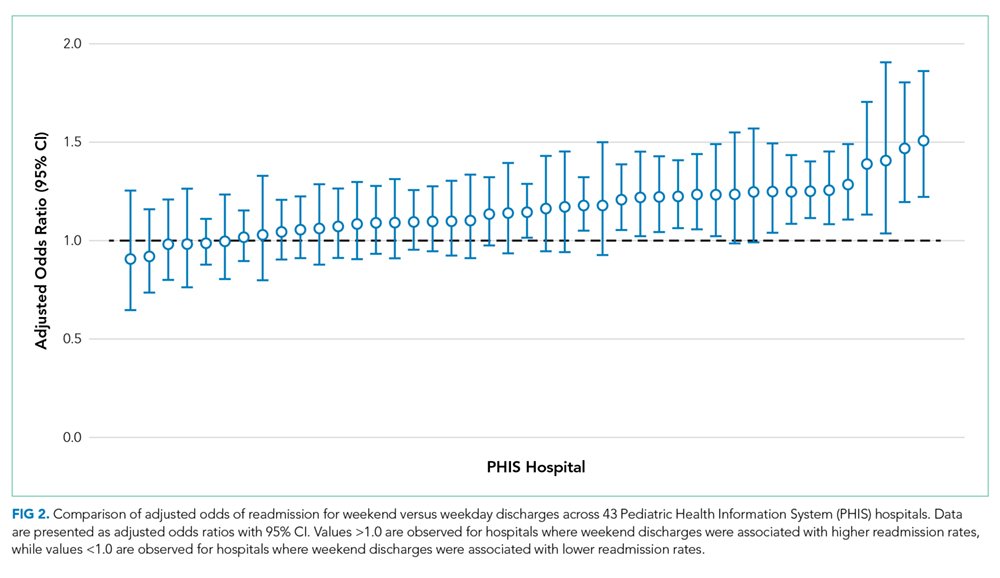
In adjusted analyses, we observed that infants <1 year were more likely to be readmitted compared with 15- to 17-year-olds, while children 5-14 years of age were less likely to be readmitted (Table 2). Medical complexity and the number of chronic conditions had the greatest association with readmissions, with increased likelihood of readmission observed as the number of chronic conditions increased. Weekend discharge was associated with increased probability of readmission compared with weekday discharge (adjusted probability of readmission [95% CI]: weekend 0.13 [0.12-0.13] vs weekday 0.11 [0.11-0.12], P < .001).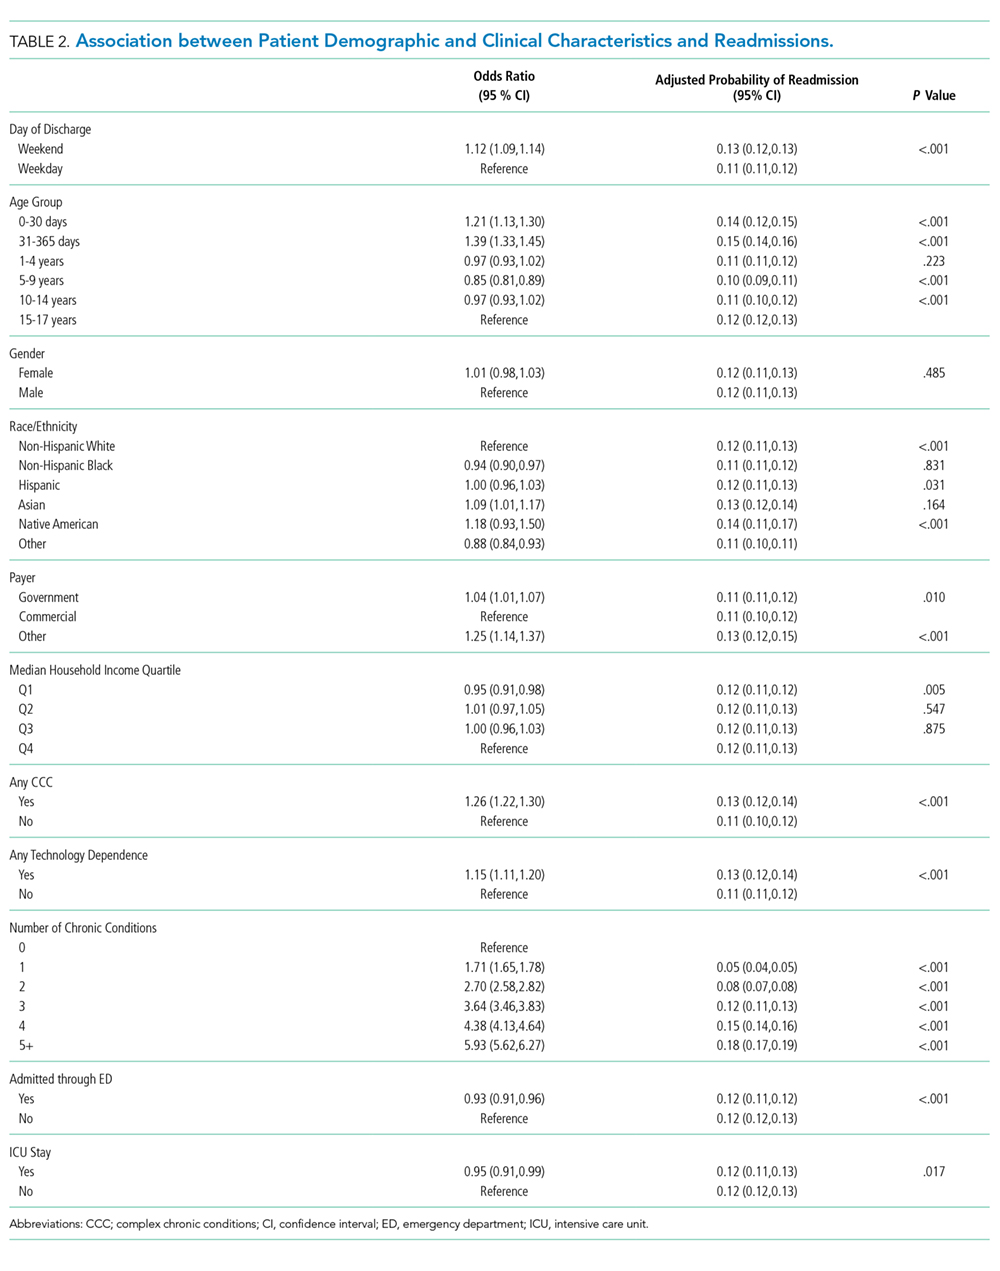
DISCUSSION
While the reasons for the weekend effect are unclear, data supporting this difference have been observed across many diverse patient groups and health systems both nationally and internationally.13-27,31 Weekend care is thought to differ from weekday care because of differences in physician and nurse staffing, availability of ancillary services, access to diagnostic testing and therapeutic interventions, ability to arrange outpatient follow-up, and individual patient clinical factors, including acuity of illness. Few studies have assessed the effect of weekend discharges on patient or system outcomes. Among children within a single health system, readmission risk was associated with weekend admission but not with weekend discharge.22 This observation suggests that if differential care exists, then it occurs during initial clinical management rather than during discharge planning. Consequently, understanding the interaction of weekend admission and LOS is important. In addition, the relative paucity of pediatric data examining a weekend discharge effect limits the ability to generalize these findings across other hospitals or health systems.
In contrast to prior work, we observed a modest increased risk for readmission among those discharged on the weekend in a large sample of children. Auger and Davis reported a lack of association between weekend discharge and readmissions at one tertiary care children’s hospital, citing reduced discharge volumes on the weekend, especially among children with medical complexity, as a possible driver for their observation.22 The inclusion of a much larger population across 43 hospitals in our study may explain our different findings compared with previous research. In addition, the inclusion/exclusion criteria differed between the two studies; we excluded index admissions for planned procedures in this study (which are more likely to occur during the week), which may have contributed to the differing conclusions. Although Auger and Davis suggest that differences in initial clinical management may be responsible for the weekend effect,22 our observations suggest that discharge planning practices may also contribute to readmission risk. For example, a family’s inability to access compounded medications at a local pharmacy or to access primary care following discharge could reasonably contribute to treatment failure and increased readmission risk. Attention to improving and standardizing discharge practices may alleviate differences in readmission risk among children discharged on a weekend.
Individual patient characteristics greatly influence LOS and readmission risk. Congruent with prior studies, medical complexity and technology dependence were among the factors in our study that had the strongest association with LOS and readmission risk.32 As with prior studies22, we observed that children with medical complexity and technology dependence were less frequently admitted and discharged on a weekend than on a weekday, which suggests that physicians may avoid complicated discharges on the weekend. Children with medical complexity present a unique challenge to physicians when assessing discharge readiness, given that these children frequently require careful coordination of durable medical equipment, obtainment of special medication preparations, and possibly the resumption or establishment of home health services. Notably, we cannot discern from our data what proportion of discharges may be delayed over the weekend secondary to challenges involved in coordinating care for children with medical complexity. Future investigations aimed at assessing physician decision making and discharge readiness in relation to discharge timing among children with medical complexity may establish this relationship more clearly.
We observed substantial variation in LOS and readmission risk across 43 tertiary care children’s hospitals. Since the 1970s, numerous studies have reported worse outcomes among patients admitted on the weekend. While the majority of studies support the weekend effect, several recent studies suggest that patients admitted on the weekend are at no greater risk of adverse outcomes than those admitted during the week.35-37 Our work builds on the existing literature, demonstrating a complex and variable relationship between weekend admission/discharge, LOS, and readmission risk across hospitals. Notably, while many hospitals in our study experienced a significant weekend effect in LOS or readmission risk, only four hospitals experienced a statistically significant weekend effect for both LOS and readmission risk (three hospitals experienced increased risk for both, while one hospital experienced increased readmission risk but decreased LOS). Future investigations of the weekend effect should focus on exploring the differences in admission/discharge practices and staffing patterns of hospitals that did or did not experience a weekend effect.
This study has several limitations
CONCLUSION
In a study of 43 children’s hospitals, children discharged on the weekend had a slightly increased readmission risk compared with children discharged on a weekday. Wide variation in the weekend effect on LOS and readmission risk was evident across hospitals. Individual patient characteristics had a greater impact on LOS and readmission risk than the weekend effect. Future investigations aimed at understanding which factors contribute most strongly to a weekend effect within individual hospitals (eg, differences in institutional admission/discharge practices) may help alleviate the weekend effect and improve healthcare quality.
Acknowledgments
This manuscript resulted from “Paper in a Day,” a Pediatric Research in Inpatient Settings (PRIS) Network-sponsored workshop presented at the Pediatric Hospital Medicine 2017 annual meeting. Workshop participants learned how to ask and answer a health services research question and efficiently prepare a manuscript for publication. The following are the members of the PRIS Network who contributed to this work: Jessica L. Bettenhausen, MD; Rebecca M. Cantu, MD, MPH; Jillian M Cotter, MD; Megan Deisz, MD; Teresa Frazer, MD; Pratichi Goenka, MD; Ashley Jenkins, MD; Kathryn E. Kyler, MD; Janet T. Lau, MD; Brian E. Lee, MD; Christiane Lenzen, MD; Trisha Marshall, MD; John M. Morrison MD, PhD; Lauren Nassetta, MD; Raymond Parlar-Chun, MD; Sonya Tang Girdwood MD, PhD; Tony R Tarchichi, MD; Irina G. Trifonova, MD; Jacqueline M. Walker, MD, MHPE; and Susan C. Walley, MD. See appendix for contact information for members of the PRIS Network
Funding
The authors have no financial relationships relevant to this article to disclose.
Disclosures
The authors have no conflicts of interest to disclose.
1. Crossing the Quality Chasm: The IOM Health Care Quality Initiative : Health and Medicine Division. http://www.nationalacademies.org/hmd/Global/News%20Announcements/Crossing-the-Quality-Chasm-The-IOM-Health-Care-Quality-Initiative.aspx. Accessed November 20, 2017.
2. Institute for Healthcare Improvement: IHI Home Page. http://www.ihi.org:80/Pages/default.aspx. Accessed November 20, 2017.
3. Berry JG, Zaslavsky AM, Toomey SL, et al. Recognizing differences in hospital quality performance for pediatric inpatient care. Pediatrics. 2015;136(2):251-262. doi:10.1542/peds.2014-3131
4. NQF: All-Cause Admissions and Readmissions Measures - Final Report. http://www.qualityforum.org/Publications/2015/04/All-Cause_Admissions_and_Readmissions_Measures_-_Final_Report.aspx. Accessed March 24, 2018.
5. Hospital Inpatient Potentially Preventable Readmissions Information and Reports. https://www.illinois.gov/hfs/MedicalProviders/hospitals/PPRReports/Pages/default.aspx. Accessed November 6, 2016.
6. Potentially Preventable Readmissions in Texas Medicaid and CHIP Programs - Fiscal Year 2013 | Texas Health and Human Services. https://hhs.texas.gov/reports/2016/08/potentially-preventable-readmissions-texas-medicaid-and-chip-programs-fiscal-year. Accessed November 6, 2016.
7. Statewide Planning and Research Cooperative System. http://www.health.ny.gov/statistics/sparcs/sb/. Accessed November 6, 2016.
8. HCA Implements Potentially Preventable Readmission (PPR) Adjustments. Wash State Hosp Assoc. http://www.wsha.org/articles/hca-implements-potentially-preventable-readmission-ppr-adjustments/. Accessed November 8, 2016.
9. Berry JG, Toomey SL, Zaslavsky AM, et al. Pediatric readmission prevalence and variability across hospitals. JAMA. 2013;309(4):372-380. doi:10.1001/jama.2012.188351 PubMed
10. Bardach NS, Vittinghoff E, Asteria-Peñaloza R, et al. Measuring hospital quality using pediatric readmission and revisit rates. Pediatrics. 2013;132(3):429-436. doi:10.1542/peds.2012-3527 PubMed
11. Berry JG, Blaine K, Rogers J, et al. A framework of pediatric hospital discharge care informed by legislation, research, and practice. JAMA Pediatr. 2014;168(10):955-962; quiz 965-966. doi:10.1001/jamapediatrics.2014.891 PubMed
12. Auger KA, Simon TD, Cooperberg D, et al. Summary of STARNet: seamless transitions and (Re)admissions network. Pediatrics. 2015;135(1):164. doi:10.1542/peds.2014-1887 PubMed
13. Freemantle N, Ray D, McNulty D, et al. Increased mortality associated with weekend hospital admission: a case for expanded seven day services? BMJ. 2015;351:h4596. doi:10.1136/bmj.h4596 PubMed
14. Schilling PL, Campbell DA, Englesbe MJ, Davis MM. A comparison of in-hospital mortality risk conferred by high hospital occupancy, differences in nurse staffing levels, weekend admission, and seasonal influenza. Med Care. 2010;48(3):224-232. doi:10.1097/MLR.0b013e3181c162c0 PubMed
15. Cram P, Hillis SL, Barnett M, Rosenthal GE. Effects of weekend admission and hospital teaching status on in-hospital mortality. Am J Med. 2004;117(3):151-157. doi:10.1016/j.amjmed.2004.02.035 PubMed
16. Zapf MAC, Kothari AN, Markossian T, et al. The “weekend effect” in urgent general operative procedures. Surgery. 2015;158(2):508-514. doi:10.1016/j.surg.2015.02.024 PubMed
17. Freemantle N, Richardson M, Wood J, et al. Weekend hospitalization and additional risk of death: an analysis of inpatient data. J R Soc Med. 2012;105(2):74-84. doi:10.1258/jrsm.2012.120009 PubMed
18. Bell CM, Redelmeier DA. Mortality among patients admitted to hospitals on weekends as compared with weekdays. N Engl J Med. 2001;345(9):663-668. doi:10.1056/NEJMsa003376 PubMed
19. Coiera E, Wang Y, Magrabi F, Concha OP, Gallego B, Runciman W. Predicting the cumulative risk of death during hospitalization by modeling weekend, weekday and diurnal mortality risks. BMC Health Serv Res. 2014;14:226. doi:10.1186/1472-6963-14-226 PubMed
20. Powell ES, Khare RK, Courtney DM, Feinglass J. The weekend effect for patients with sepsis presenting to the emergency department. J Emerg Med. 2013;45(5):641-648. doi:10.1016/j.jemermed.2013.04.042 PubMed
21. Ananthakrishnan AN, McGinley EL, Saeian K. Outcomes of weekend admissions for upper gastrointestinal hemorrhage: a nationwide analysis. Clin Gastroenterol Hepatol Off Clin Pract J Am Gastroenterol Assoc. 2009;7(3):296-302e1. doi:10.1016/j.cgh.2008.08.013 PubMed
22. Auger KA, Davis MM. Pediatric weekend admission and increased unplanned readmission rates. J Hosp Med. 2015;10(11):743-745. doi:10.1002/jhm.2426 PubMed
23. Goldstein SD, Papandria DJ, Aboagye J, et al. The “weekend effect” in pediatric surgery - increased mortality for children undergoing urgent surgery during the weekend. J Pediatr Surg. 2014;49(7):1087-1091. doi:10.1016/j.jpedsurg.2014.01.001 PubMed
24. Adil MM, Vidal G, Beslow LA. Weekend effect in children with stroke in the nationwide inpatient sample. Stroke. 2016;47(6):1436-1443. doi:10.1161/STROKEAHA.116.013453 PubMed
25. McCrory MC, Spaeder MC, Gower EW, et al. Time of admission to the PICU and mortality. Pediatr Crit Care Med J Soc Crit Care Med World Fed Pediatr Intensive Crit Care Soc. 2017;18(10):915-923. doi:10.1097/PCC.0000000000001268 PubMed
26. Mangold WD. Neonatal mortality by the day of the week in the 1974-75 Arkansas live birth cohort. Am J Public Health. 1981;71(6):601-605. PubMed
27. MacFarlane A. Variations in number of births and perinatal mortality by day of week in England and Wales. Br Med J. 1978;2(6153):1670-1673. PubMed
28. McShane P, Draper ES, McKinney PA, McFadzean J, Parslow RC, Paediatric intensive care audit network (PICANet). Effects of out-of-hours and winter admissions and number of patients per unit on mortality in pediatric intensive care. J Pediatr. 2013;163(4):1039-1044.e5. doi:10.1016/j.jpeds.2013.03.061 PubMed
29. Hixson ED, Davis S, Morris S, Harrison AM. Do weekends or evenings matter in a pediatric intensive care unit? Pediatr Crit Care Med J Soc Crit Care Med World Fed Pediatr Intensive Crit Care Soc. 2005;6(5):523-530. PubMed
30. Gonzalez KW, Dalton BGA, Weaver KL, Sherman AK, St Peter SD, Snyder CL. Effect of timing of cannulation on outcome for pediatric extracorporeal life support. Pediatr Surg Int. 2016;32(7):665-669. doi:10.1007/s00383-016-3901-6 PubMed
31. Desai V, Gonda D, Ryan SL, et al. The effect of weekend and after-hours surgery on morbidity and mortality rates in pediatric neurosurgery patients. J Neurosurg Pediatr. 2015;16(6):726-731. doi:10.3171/2015.6.PEDS15184 PubMed
32. Berry JG, Hall DE, Kuo DZ, et al. Hospital utilization and characteristics of patients experiencing recurrent readmissions within children’s hospitals. JAMA. 2011;305(7):682-690. doi:10.1001/jama.2011.122 PubMed
33. Hoshijima H, Takeuchi R, Mihara T, et al. Weekend versus weekday admission and short-term mortality: A meta-analysis of 88 cohort studies including 56,934,649 participants. Medicine (Baltimore). 2017;96(17):e6685. doi:10.1097/MD.0000000000006685 PubMed
34. Feudtner C, Feinstein JA, Zhong W, Hall M, Dai D. Pediatric complex chronic conditions classification system version 2: updated for ICD-10 and complex medical technology dependence and transplantation. BMC Pediatr. 2014;14:199. doi:10.1186/1471-2431-14-199 PubMed
35. Li L, Rothwell PM, Oxford Vascular Study. Biases in detection of apparent “weekend effect” on outcome with administrative coding data: population based study of stroke. BMJ. 2016;353:i2648. doi: https://doi.org/10.1136/bmj.i2648 PubMed
36. Bray BD, Cloud GC, James MA, et al. Weekly variation in health-care quality by day and time of admission: a nationwide, registry-based, prospective cohort study of acute stroke care. The Lancet. 2016;388(10040):170-177. doi:10.1016/S0140-6736(16)30443-3 PubMed
37. Ko SQ, Strom JB, Shen C, Yeh RW. Mortality, Length of Stay, and Cost of Weekend Admissions. J Hosp Med. 2018. doi:10.12788/jhm.2906 PubMed
38. Tubbs-Cooley HL, Cimiotti JP, Silber JH, Sloane DM, Aiken LH. An observational study of nurse staffing ratios and hospital readmission among children admitted for common conditions. BMJ Qual Saf. 2013;22(9):735-742. doi:10.1136/bmjqs-2012-001610 PubMed
39. Ong M, Bostrom A, Vidyarthi A, McCulloch C, Auerbach A. House staff team workload and organization effects on patient outcomes in an academic general internal medicine inpatient service. Arch Intern Med. 2007;167(1):47-52. doi:10.1001/archinte.167.1.47 PubMed
Increasingly, metrics such as length of stay (LOS) and readmissions are being utilized in the United States to assess quality of healthcare because these factors may represent opportunities to reduce cost and improve healthcare delivery.1-8 However, the relatively low rate of pediatric readmissions,9 coupled with limited data regarding recommended LOS or best practices to prevent readmissions in children, challenges the ability of hospitals to safely reduce LOS and readmission rates for children.10–12
In adults, weekend admission is associated with prolonged LOS, increased readmission rates, and increased risk of mortality.13-21 This association is referred to as the “weekend effect.” While the weekend effect has been examined in children, the results of these studies have been variable, with some studies supporting this association and others refuting it.22-31 In contrast to patient demographic and clinical characteristics that are known to affect LOS and readmissions,32 the weekend effect represents a potentially modifiable aspect of a hospitalization that could be targeted to improve healthcare delivery.
With increasing national attention toward improving quality of care and reducing LOS and healthcare costs, more definitive evidence of the weekend effect is necessary to prioritize resource use at both the local and national levels. Therefore, we sought to determine the association of weekend admission and weekend discharge on LOS and 30-day readmissions, respectively, among a national cohort of children. We hypothesized that children admitted on the weekend would have longer LOS, whereas those discharged on the weekend would have higher readmission rates.
METHODS
Study Design and Data Source
We conducted a multicenter, retrospective, cross-sectional study. Data were obtained from the Pediatric Health Information System (PHIS), an administrative and billing database of 46 free-standing tertiary care pediatric hospitals affiliated with the Children’s Hospital Association (Lenexa, Kansas). Patient data are de-identified within PHIS; however, encrypted patient identifiers allow individual patients to be followed across visits. This study was not considered human subjects research by the policies of the Cincinnati Children’s Hospital Institutional Review Board.
Participants
We included hospitalizations to a PHIS-participating hospital for children aged 0-17 years between October 1, 2014 and September 30, 2015. We excluded children who were transferred from/to another institution, left against medical advice, or died in the hospital because these indications may result in incomplete LOS information and would not consistently contribute to readmission rates. We also excluded birth hospitalizations and children admitted for planned procedures. Birth hospitalizations were defined as hospitalizations that began on the day of birth.
Main Exposures
No standard definition of weekend admission or discharge was identified in the literature.33 Thus, we defined a weekend admission as an admission between 3:00
Main Outcomes
Our outcomes included LOS for weekend admission and 30-day readmissions for weekend discharge. LOS, measured in hours, was defined using the reported admission and discharge times. Readmissions were defined as a return to the same hospital within the subsequent 30 days following discharge.
Patient Demographics and Other Study Variables
Patient demographics included age, gender, race/ethnicity, payer, and median household income quartile based on the patient’s home ZIP code. Other study variables included presence of a complex chronic condition (CCC),34 technology dependence,34 number of chronic conditions of any complexity, admission through the emergency department, intensive care unit (ICU) admission, and case mix index. ICU admission and case mix index were chosen as markers for severity of illness. ICU admission was defined as any child who incurred ICU charges at any time following admission. Case mix index in PHIS is a relative weight assigned to each discharge based on the All-Patient Refined Diagnostic Group (APR-DRG; 3M) assignment and APR-DRG severity of illness, which ranges from 1 (minor) to 4 (extreme). The weights are derived by the Children’s Hospital Association from the HCUP KID 2012 database as the ratio of the average cost for discharges within a specific APR-DRG severity of illness combination to the average cost for all discharges in the database.
Statistical Analysis
Continuous variables were summarized with medians and interquartile ranges, while categorical variables were summarized with frequencies and percentages. Differences in admission and discharge characteristics between weekend and weekday were assessed using Wilcoxon rank sum tests for continuous variables and chi-square tests of association for categorical variables. We used generalized linear mixed modeling (GLMM) techniques to assess the impact of weekend admission on LOS and weekend discharge on readmission, adjusting for important patient demographic and clinical characteristics. Furthermore, we used GLMM point estimates to describe the variation across hospitals of the impact of weekday versus weekend care on LOS and readmissions. We assumed an underlying log-normal distribution for LOS and an underlying binomial distribution for 30-day readmission. All GLMMs included a random intercept for each hospital to account for patient clustering within a hospital. All statistical analyses were performed using SAS v.9.4 (SAS Institute, Cary, North Carolina), and P values <.05 were considered statistically significant.
RESULTS
We identified 390,745 hospitalizations that met inclusion criteria (Supplementary Figure 1). The median LOS among our cohort was 41 hours (interquartile range [IQR] 24-71) and the median 30-day readmission rate was 8.2% (IQR 7.2-9.4).
Admission Demographics for Weekends and Weekdays
Among the included hospitalizations, 92,266 (23.6%) admissions occurred on a weekend (Supplementary Table 1). Overall, a higher percentage of children <5 years of age were admitted on a weekend compared with those admitted on a weekday (53.3% vs 49.1%, P < .001). We observed a small but statistically significant difference in the proportion of weekend versus weekday admissions according to gender, race/ethnicity, payer, and median household income quartile. Children with medical complexity and those with technology dependence were admitted less frequently on a weekend. A higher proportion of children were admitted through the emergency department on a weekend and a higher frequency of ICU utilization was observed for children admitted on a weekend compared with those admitted on a weekday.
Association Between Study Variables and Length of Stay
In comparing adjusted LOS for weekend versus weekday admissions across 43 hospitals, not only did LOS vary across hospitals (P < .001), but the association between LOS and weekend versus weekday care also varied across hospitals (P < .001) (Figure 1). Weekend admission was associated with a significantly longer LOS at eight (18.6%) hospitals and a significantly shorter LOS at four (9.3%) hospitals with nonstatistically significant differences at the remaining hospitals.
In adjusted analyses, we observed that infants ≤30 days of age, on average, had an adjusted LOS that was 24% longer than that of 15- to 17-year-olds, while children aged 1-14 years had an adjusted LOS that was 6%-18% shorter (Table 1). ICU utilization, admission through the emergency department, and number of chronic conditions had the greatest association with LOS. As the number of chronic conditions increased, the LOS increased. No association was found between weekend versus weekday admission and LOS (adjusted LOS [95% CI]: weekend 63.70 [61.01-66.52] hours versus weekday 63.40 [60.73-66.19] hours, P = .112).
Discharge Demographics for Weekends and Weekdays
Of the included hospitalizations, 127,421 (32.6%) discharges occurred on a weekend (Supplementary Table 2). Overall, a greater percentage of weekend discharges comprised children <5 years of age compared with the percentage of weekday discharges for children <5 years of age (51.5% vs 49.5%, P < .001). No statistically significant differences were found in gender, payer, or median household income quartile between those children discharged on a weekend versus those discharged on a weekday. We found small, statistically significant differences in the proportion of weekend versus weekday discharges according to race/ethnicity, with fewer non-Hispanic white children being discharged on the weekend versus weekday. Children with medical complexity, technology dependence, and patients with ICU utilization were less frequently discharged on a weekend compared with those discharged on a weekday.
Association Between Study Variables and Readmissions
In comparing the adjusted odds of readmissions for weekend versus weekday discharges across 43 PHIS hospitals, we observed significant variation (P < .001) in readmission rates from hospital to hospital (Figure 2). However, the direction of impact of weekend care on readmissions was similar (P = .314) across hospitals (ie, for 37 of 43 hospitals, the readmission rate was greater for weekend discharges compared with that for weekday discharges). For 17 (39.5%) of 43 hospitals, weekend discharge was associated with a significantly higher readmission rate, while the differences between weekday and weekend discharge were not statistically significant for the remaining hospitals.
In adjusted analyses, we observed that infants <1 year were more likely to be readmitted compared with 15- to 17-year-olds, while children 5-14 years of age were less likely to be readmitted (Table 2). Medical complexity and the number of chronic conditions had the greatest association with readmissions, with increased likelihood of readmission observed as the number of chronic conditions increased. Weekend discharge was associated with increased probability of readmission compared with weekday discharge (adjusted probability of readmission [95% CI]: weekend 0.13 [0.12-0.13] vs weekday 0.11 [0.11-0.12], P < .001).
DISCUSSION
While the reasons for the weekend effect are unclear, data supporting this difference have been observed across many diverse patient groups and health systems both nationally and internationally.13-27,31 Weekend care is thought to differ from weekday care because of differences in physician and nurse staffing, availability of ancillary services, access to diagnostic testing and therapeutic interventions, ability to arrange outpatient follow-up, and individual patient clinical factors, including acuity of illness. Few studies have assessed the effect of weekend discharges on patient or system outcomes. Among children within a single health system, readmission risk was associated with weekend admission but not with weekend discharge.22 This observation suggests that if differential care exists, then it occurs during initial clinical management rather than during discharge planning. Consequently, understanding the interaction of weekend admission and LOS is important. In addition, the relative paucity of pediatric data examining a weekend discharge effect limits the ability to generalize these findings across other hospitals or health systems.
In contrast to prior work, we observed a modest increased risk for readmission among those discharged on the weekend in a large sample of children. Auger and Davis reported a lack of association between weekend discharge and readmissions at one tertiary care children’s hospital, citing reduced discharge volumes on the weekend, especially among children with medical complexity, as a possible driver for their observation.22 The inclusion of a much larger population across 43 hospitals in our study may explain our different findings compared with previous research. In addition, the inclusion/exclusion criteria differed between the two studies; we excluded index admissions for planned procedures in this study (which are more likely to occur during the week), which may have contributed to the differing conclusions. Although Auger and Davis suggest that differences in initial clinical management may be responsible for the weekend effect,22 our observations suggest that discharge planning practices may also contribute to readmission risk. For example, a family’s inability to access compounded medications at a local pharmacy or to access primary care following discharge could reasonably contribute to treatment failure and increased readmission risk. Attention to improving and standardizing discharge practices may alleviate differences in readmission risk among children discharged on a weekend.
Individual patient characteristics greatly influence LOS and readmission risk. Congruent with prior studies, medical complexity and technology dependence were among the factors in our study that had the strongest association with LOS and readmission risk.32 As with prior studies22, we observed that children with medical complexity and technology dependence were less frequently admitted and discharged on a weekend than on a weekday, which suggests that physicians may avoid complicated discharges on the weekend. Children with medical complexity present a unique challenge to physicians when assessing discharge readiness, given that these children frequently require careful coordination of durable medical equipment, obtainment of special medication preparations, and possibly the resumption or establishment of home health services. Notably, we cannot discern from our data what proportion of discharges may be delayed over the weekend secondary to challenges involved in coordinating care for children with medical complexity. Future investigations aimed at assessing physician decision making and discharge readiness in relation to discharge timing among children with medical complexity may establish this relationship more clearly.
We observed substantial variation in LOS and readmission risk across 43 tertiary care children’s hospitals. Since the 1970s, numerous studies have reported worse outcomes among patients admitted on the weekend. While the majority of studies support the weekend effect, several recent studies suggest that patients admitted on the weekend are at no greater risk of adverse outcomes than those admitted during the week.35-37 Our work builds on the existing literature, demonstrating a complex and variable relationship between weekend admission/discharge, LOS, and readmission risk across hospitals. Notably, while many hospitals in our study experienced a significant weekend effect in LOS or readmission risk, only four hospitals experienced a statistically significant weekend effect for both LOS and readmission risk (three hospitals experienced increased risk for both, while one hospital experienced increased readmission risk but decreased LOS). Future investigations of the weekend effect should focus on exploring the differences in admission/discharge practices and staffing patterns of hospitals that did or did not experience a weekend effect.
This study has several limitations
CONCLUSION
In a study of 43 children’s hospitals, children discharged on the weekend had a slightly increased readmission risk compared with children discharged on a weekday. Wide variation in the weekend effect on LOS and readmission risk was evident across hospitals. Individual patient characteristics had a greater impact on LOS and readmission risk than the weekend effect. Future investigations aimed at understanding which factors contribute most strongly to a weekend effect within individual hospitals (eg, differences in institutional admission/discharge practices) may help alleviate the weekend effect and improve healthcare quality.
Acknowledgments
This manuscript resulted from “Paper in a Day,” a Pediatric Research in Inpatient Settings (PRIS) Network-sponsored workshop presented at the Pediatric Hospital Medicine 2017 annual meeting. Workshop participants learned how to ask and answer a health services research question and efficiently prepare a manuscript for publication. The following are the members of the PRIS Network who contributed to this work: Jessica L. Bettenhausen, MD; Rebecca M. Cantu, MD, MPH; Jillian M Cotter, MD; Megan Deisz, MD; Teresa Frazer, MD; Pratichi Goenka, MD; Ashley Jenkins, MD; Kathryn E. Kyler, MD; Janet T. Lau, MD; Brian E. Lee, MD; Christiane Lenzen, MD; Trisha Marshall, MD; John M. Morrison MD, PhD; Lauren Nassetta, MD; Raymond Parlar-Chun, MD; Sonya Tang Girdwood MD, PhD; Tony R Tarchichi, MD; Irina G. Trifonova, MD; Jacqueline M. Walker, MD, MHPE; and Susan C. Walley, MD. See appendix for contact information for members of the PRIS Network
Funding
The authors have no financial relationships relevant to this article to disclose.
Disclosures
The authors have no conflicts of interest to disclose.
1. Crossing the Quality Chasm: The IOM Health Care Quality Initiative : Health and Medicine Division. http://www.nationalacademies.org/hmd/Global/News%20Announcements/Crossing-the-Quality-Chasm-The-IOM-Health-Care-Quality-Initiative.aspx. Accessed November 20, 2017.
2. Institute for Healthcare Improvement: IHI Home Page. http://www.ihi.org:80/Pages/default.aspx. Accessed November 20, 2017.
3. Berry JG, Zaslavsky AM, Toomey SL, et al. Recognizing differences in hospital quality performance for pediatric inpatient care. Pediatrics. 2015;136(2):251-262. doi:10.1542/peds.2014-3131
4. NQF: All-Cause Admissions and Readmissions Measures - Final Report. http://www.qualityforum.org/Publications/2015/04/All-Cause_Admissions_and_Readmissions_Measures_-_Final_Report.aspx. Accessed March 24, 2018.
5. Hospital Inpatient Potentially Preventable Readmissions Information and Reports. https://www.illinois.gov/hfs/MedicalProviders/hospitals/PPRReports/Pages/default.aspx. Accessed November 6, 2016.
6. Potentially Preventable Readmissions in Texas Medicaid and CHIP Programs - Fiscal Year 2013 | Texas Health and Human Services. https://hhs.texas.gov/reports/2016/08/potentially-preventable-readmissions-texas-medicaid-and-chip-programs-fiscal-year. Accessed November 6, 2016.
7. Statewide Planning and Research Cooperative System. http://www.health.ny.gov/statistics/sparcs/sb/. Accessed November 6, 2016.
8. HCA Implements Potentially Preventable Readmission (PPR) Adjustments. Wash State Hosp Assoc. http://www.wsha.org/articles/hca-implements-potentially-preventable-readmission-ppr-adjustments/. Accessed November 8, 2016.
9. Berry JG, Toomey SL, Zaslavsky AM, et al. Pediatric readmission prevalence and variability across hospitals. JAMA. 2013;309(4):372-380. doi:10.1001/jama.2012.188351 PubMed
10. Bardach NS, Vittinghoff E, Asteria-Peñaloza R, et al. Measuring hospital quality using pediatric readmission and revisit rates. Pediatrics. 2013;132(3):429-436. doi:10.1542/peds.2012-3527 PubMed
11. Berry JG, Blaine K, Rogers J, et al. A framework of pediatric hospital discharge care informed by legislation, research, and practice. JAMA Pediatr. 2014;168(10):955-962; quiz 965-966. doi:10.1001/jamapediatrics.2014.891 PubMed
12. Auger KA, Simon TD, Cooperberg D, et al. Summary of STARNet: seamless transitions and (Re)admissions network. Pediatrics. 2015;135(1):164. doi:10.1542/peds.2014-1887 PubMed
13. Freemantle N, Ray D, McNulty D, et al. Increased mortality associated with weekend hospital admission: a case for expanded seven day services? BMJ. 2015;351:h4596. doi:10.1136/bmj.h4596 PubMed
14. Schilling PL, Campbell DA, Englesbe MJ, Davis MM. A comparison of in-hospital mortality risk conferred by high hospital occupancy, differences in nurse staffing levels, weekend admission, and seasonal influenza. Med Care. 2010;48(3):224-232. doi:10.1097/MLR.0b013e3181c162c0 PubMed
15. Cram P, Hillis SL, Barnett M, Rosenthal GE. Effects of weekend admission and hospital teaching status on in-hospital mortality. Am J Med. 2004;117(3):151-157. doi:10.1016/j.amjmed.2004.02.035 PubMed
16. Zapf MAC, Kothari AN, Markossian T, et al. The “weekend effect” in urgent general operative procedures. Surgery. 2015;158(2):508-514. doi:10.1016/j.surg.2015.02.024 PubMed
17. Freemantle N, Richardson M, Wood J, et al. Weekend hospitalization and additional risk of death: an analysis of inpatient data. J R Soc Med. 2012;105(2):74-84. doi:10.1258/jrsm.2012.120009 PubMed
18. Bell CM, Redelmeier DA. Mortality among patients admitted to hospitals on weekends as compared with weekdays. N Engl J Med. 2001;345(9):663-668. doi:10.1056/NEJMsa003376 PubMed
19. Coiera E, Wang Y, Magrabi F, Concha OP, Gallego B, Runciman W. Predicting the cumulative risk of death during hospitalization by modeling weekend, weekday and diurnal mortality risks. BMC Health Serv Res. 2014;14:226. doi:10.1186/1472-6963-14-226 PubMed
20. Powell ES, Khare RK, Courtney DM, Feinglass J. The weekend effect for patients with sepsis presenting to the emergency department. J Emerg Med. 2013;45(5):641-648. doi:10.1016/j.jemermed.2013.04.042 PubMed
21. Ananthakrishnan AN, McGinley EL, Saeian K. Outcomes of weekend admissions for upper gastrointestinal hemorrhage: a nationwide analysis. Clin Gastroenterol Hepatol Off Clin Pract J Am Gastroenterol Assoc. 2009;7(3):296-302e1. doi:10.1016/j.cgh.2008.08.013 PubMed
22. Auger KA, Davis MM. Pediatric weekend admission and increased unplanned readmission rates. J Hosp Med. 2015;10(11):743-745. doi:10.1002/jhm.2426 PubMed
23. Goldstein SD, Papandria DJ, Aboagye J, et al. The “weekend effect” in pediatric surgery - increased mortality for children undergoing urgent surgery during the weekend. J Pediatr Surg. 2014;49(7):1087-1091. doi:10.1016/j.jpedsurg.2014.01.001 PubMed
24. Adil MM, Vidal G, Beslow LA. Weekend effect in children with stroke in the nationwide inpatient sample. Stroke. 2016;47(6):1436-1443. doi:10.1161/STROKEAHA.116.013453 PubMed
25. McCrory MC, Spaeder MC, Gower EW, et al. Time of admission to the PICU and mortality. Pediatr Crit Care Med J Soc Crit Care Med World Fed Pediatr Intensive Crit Care Soc. 2017;18(10):915-923. doi:10.1097/PCC.0000000000001268 PubMed
26. Mangold WD. Neonatal mortality by the day of the week in the 1974-75 Arkansas live birth cohort. Am J Public Health. 1981;71(6):601-605. PubMed
27. MacFarlane A. Variations in number of births and perinatal mortality by day of week in England and Wales. Br Med J. 1978;2(6153):1670-1673. PubMed
28. McShane P, Draper ES, McKinney PA, McFadzean J, Parslow RC, Paediatric intensive care audit network (PICANet). Effects of out-of-hours and winter admissions and number of patients per unit on mortality in pediatric intensive care. J Pediatr. 2013;163(4):1039-1044.e5. doi:10.1016/j.jpeds.2013.03.061 PubMed
29. Hixson ED, Davis S, Morris S, Harrison AM. Do weekends or evenings matter in a pediatric intensive care unit? Pediatr Crit Care Med J Soc Crit Care Med World Fed Pediatr Intensive Crit Care Soc. 2005;6(5):523-530. PubMed
30. Gonzalez KW, Dalton BGA, Weaver KL, Sherman AK, St Peter SD, Snyder CL. Effect of timing of cannulation on outcome for pediatric extracorporeal life support. Pediatr Surg Int. 2016;32(7):665-669. doi:10.1007/s00383-016-3901-6 PubMed
31. Desai V, Gonda D, Ryan SL, et al. The effect of weekend and after-hours surgery on morbidity and mortality rates in pediatric neurosurgery patients. J Neurosurg Pediatr. 2015;16(6):726-731. doi:10.3171/2015.6.PEDS15184 PubMed
32. Berry JG, Hall DE, Kuo DZ, et al. Hospital utilization and characteristics of patients experiencing recurrent readmissions within children’s hospitals. JAMA. 2011;305(7):682-690. doi:10.1001/jama.2011.122 PubMed
33. Hoshijima H, Takeuchi R, Mihara T, et al. Weekend versus weekday admission and short-term mortality: A meta-analysis of 88 cohort studies including 56,934,649 participants. Medicine (Baltimore). 2017;96(17):e6685. doi:10.1097/MD.0000000000006685 PubMed
34. Feudtner C, Feinstein JA, Zhong W, Hall M, Dai D. Pediatric complex chronic conditions classification system version 2: updated for ICD-10 and complex medical technology dependence and transplantation. BMC Pediatr. 2014;14:199. doi:10.1186/1471-2431-14-199 PubMed
35. Li L, Rothwell PM, Oxford Vascular Study. Biases in detection of apparent “weekend effect” on outcome with administrative coding data: population based study of stroke. BMJ. 2016;353:i2648. doi: https://doi.org/10.1136/bmj.i2648 PubMed
36. Bray BD, Cloud GC, James MA, et al. Weekly variation in health-care quality by day and time of admission: a nationwide, registry-based, prospective cohort study of acute stroke care. The Lancet. 2016;388(10040):170-177. doi:10.1016/S0140-6736(16)30443-3 PubMed
37. Ko SQ, Strom JB, Shen C, Yeh RW. Mortality, Length of Stay, and Cost of Weekend Admissions. J Hosp Med. 2018. doi:10.12788/jhm.2906 PubMed
38. Tubbs-Cooley HL, Cimiotti JP, Silber JH, Sloane DM, Aiken LH. An observational study of nurse staffing ratios and hospital readmission among children admitted for common conditions. BMJ Qual Saf. 2013;22(9):735-742. doi:10.1136/bmjqs-2012-001610 PubMed
39. Ong M, Bostrom A, Vidyarthi A, McCulloch C, Auerbach A. House staff team workload and organization effects on patient outcomes in an academic general internal medicine inpatient service. Arch Intern Med. 2007;167(1):47-52. doi:10.1001/archinte.167.1.47 PubMed
© 2018 Society of Hospital Medicine
Safety Huddle Intervention for Reducing Physiologic Monitor Alarms: A Hybrid Effectiveness-Implementation Cluster Randomized Trial
Physiologic monitor alarms occur frequently in the hospital environment, with average rates on pediatric wards between 42 and 155 alarms per monitored patient-day.1 However, average rates do not depict the full story, because only 9%–25% of patients are responsible for most alarms on inpatient wards.1,2 In addition, only 0.5%–1% of alarms on pediatric wards warrant action.3,4 Downstream consequences of high alarm rates include interruptions5,6 and alarm fatigue.3,4,7
Alarm customization, the process of reviewing individual patients’ alarm data and using that data to implement patient-specific alarm reduction interventions, has emerged as a potential approach to unit-wide alarm management.8-11 Potential customizations include broadening alarm thresholds, instituting delays between the time the alarm condition is met and the time the alarm sounds, and changing electrodes.8-11 However, the workflows within which to identify the patients who will benefit from customization, make decisions about how to customize, and implement customizations have not been delineated.
Safety huddles are brief structured discussions among physicians, nurses, and other staff aiming to identify and mitigate threats to patient safety.11-13 In this study, we aimed to evaluate the influence of a safety huddle-based alarm intervention strategy targeting high alarm pediatric ward patients on (a) unit-level alarm rates and (b) patient-level alarm rates, as well as to (c) evaluate implementation outcomes. We hypothesized that patients discussed in huddles would have greater reductions in alarm rates in the 24 hours following their huddle than patients who were not discussed. Given that most alarms are generated by a small fraction of patients,1,2 we hypothesized that patient-level reductions would translate to unit-level reductions.
METHODS
Human Subject Protection
The Institutional Review Board of Children’s Hospital of Philadelphia approved this study with a waiver of informed consent. We registered the study at ClinicalTrials.gov (identifier NCT02458872). The original protocol is available as an Online Supplement.
Design and Framework

For our secondary effectiveness outcome evaluating the effect of the intervention on the alarm rates of the individual patients discussed in huddles, we used a cohort design embedded within the trial to analyze patient-specific alarm data collected only on randomly selected “intensive data collection days,” described below and in Figure 1.
Setting and Subjects
All patients hospitalized on 8 units that admit general pediatric and medical subspecialty patients at Children’s Hospital of Philadelphia between June 15, 2015 and May 8, 2016 were included in the primary (unit-level) analysis. Every patient’s bedside included a General Electric Dash 3000 physiologic monitor. Decisions to monitor patients were made by physicians and required orders. Default alarm settings are available in Supplementary Table 1; these settings required orders to change.
All 8 units were already convening scheduled safety huddles led by the charge nurse each day. All nurses and at least one resident were expected to attend; attending physicians and fellows were welcome but not expected to attend. Huddles focused on discussing safety concerns and patient flow. None of the preexisting huddles included alarm discussion.
Intervention
For each nonholiday weekday, we generated customized paper-based alarm huddle data “dashboards” (Supplementary Figure 1) displaying data from the patients (up to a maximum of 4) on each intervention unit with the highest numbers of high-acuity alarms (“crisis” and “warning” audible alarms, see Supplementary Table 2 for detailed listing of alarm types) in the preceding 4 hours by reviewing data from the monitor network using BedMasterEx v4.2 (Excel Medical Electronics). Dashboards listed the most frequent types of alarms, alarm settings, and included a script for discussing the alarms with checkboxes to indicate changes agreed upon by the team during the huddle. Patients with fewer than 20 alarms in the preceding 4h were not included; thus, sometimes fewer than 4 patients’ data were available for discussion. We hand-delivered dashboards to the charge nurses leading huddles, and they facilitated the multidisciplinary alarm discussions focused on reviewing alarm data and customizing settings to reduce unnecessary alarms.
Study Periods
The study had 3 periods as shown in Supplementary Figure 2: (1) 16-week baseline data collection, (2) phased intervention implementation during which we serially spent 2-8 weeks on each of the 4 intervention units implementing the intervention, and (3) 16-week postimplementation data collection.
Outcomes
The primary effectiveness outcome was the change in unit-level alarms per patient-day between the baseline and postimplementation periods in intervention versus control units, with all patients on the units included. The secondary effectiveness outcome (analyzed using the embedded cohort design) was the change in individual patient-level alarms between the 24 hours leading up to a huddle and the 24 hours following huddles in patients who were versus patients who were not discussed in huddles.
Implementation outcomes included adoption and fidelity measures. To measure adoption (defined as “intention to try” the intervention),16 we measured the frequency of discussions attended by patients’ nurses and physicians. We evaluated 3 elements of fidelity: adherence, dose, and quality of delivery.17 We measured adherence as the incorporation of alarm discussion into huddles when there were eligible patients to discuss. We measured dose as the average number of patients discussed on each unit per calendar day during the postimplementation period. We measured quality of delivery as the extent to which changes to monitoring that were agreed upon in the huddles were made at the bedside.
Safety Measures
To surveil for unintended consequences of reduced monitoring, we screened the hospital’s rapid response and code blue team database weekly for any events in patients previously discussed in huddles that occurred between huddle and hospital discharge. We reviewed charts to determine if the events were related to the intervention.
Randomization
Prior to randomization, the 8 units were divided into pairs based on participation in hospital-wide Joint Commission alarm management activities, use of alarm middleware that relayed detailed alarm information to nurses’ mobile phones, and baseline alarm rates. One unit in each pair was randomized to intervention and the other to control by coin flip.
Data Collection
We used Research Electronic Data Capture (REDCap)18 database tools.
Data for Unit-Level Analyses
We captured all alarms occurring on the study units during the study period using data from BedMasterEx. We obtained census data accurate to the hour from the Clinical Data Warehouse.
Data Captured in All Huddles
During each huddle, we collected the number of patients whose alarms were discussed, patient characteristics, presence of nurses and physicians, and monitoring changes agreed upon. We then followed up 4 hours later to determine if changes were made at the bedside by examining monitor settings.
Data Captured Only During Intensive Data Collection Days
We randomly selected 1 day during each of the 16 weeks of the postimplementation period to obtain additional patient-level data. On each intensive data collection day, the 4 monitored patients on each intervention and control unit with the most high-acuity alarms in the 4 hours prior to huddles occurring — regardless of whether or not these patients were later discussed in huddles — were identified for data collection. On these dates, a member of the research team reviewed each patient’s alarm counts in 4-hour blocks during the 24 hours before and after the huddle. Given that the huddles were not always at the same time every day (ranging between 10:00 and 13:00), we operationally set the huddle time as 12:00 for all units.
Data Analysis
We used Stata/SE 14.2 for all analyses.
Unit-Level Alarm Rates
To compare unit-level rates, we performed an interrupted time series analysis using segmented (piecewise) regression to evaluate the impact of the intervention.19,20 We used a multivariable generalized estimating equation model with the negative binomial distribution21 and clustering by unit. We bootstrapped the model and generated percentile-based 95% confidence intervals. We then used the model to estimate the alarm rate difference in differences between the baseline data collection period and the postimplementation data collection period for intervention versus control units.
Patient-Level Alarm Rates
In contrast to unit-level analysis, we used an embedded cohort design to model the change in individual patients’ alarms between the 24 hours leading up to huddles and the 24 hours following huddles in patients who were versus patients who were not discussed in huddles. The analysis was restricted to the patients included in intensive data collection days. We performed bootstrapped linear regression and generated percentile-based 95% confidence intervals using the difference in 4-hour block alarm rate between pre- and posthuddle as the outcome. We clustered within patients. We stratified by unit and preceding alarm rate. We modeled the alarm rate difference between the 24-hour prehuddle and the 24-hour posthuddle for huddled and nonhuddled patients and the difference in differences between exposure groups.
Implementation Outcomes
We summarized adoption and fidelity using proportions.
RESULTS
Alarm dashboards informed 580 structured alarm discussions during 353 safety huddles (huddles often included discussion of more than one patient).
Unit-Level Alarm Rates
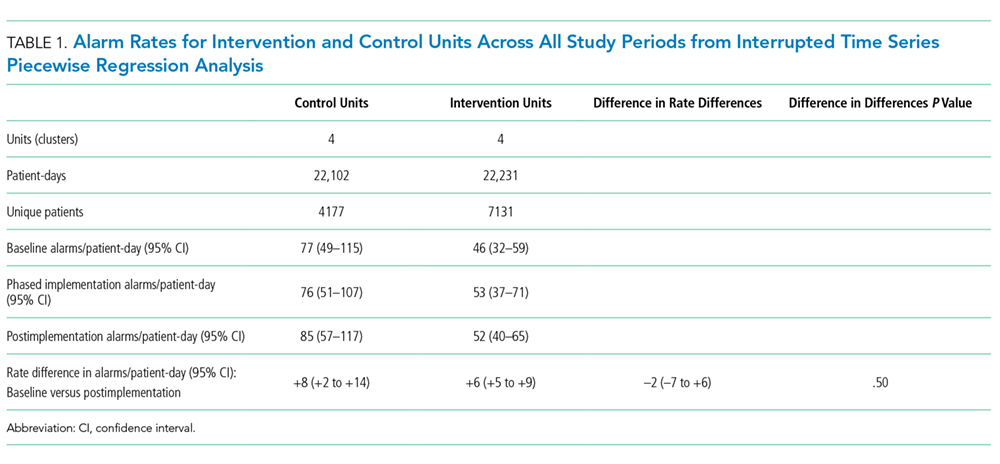
Visually, alarm rates over time on each individual unit appeared flat despite the intervention (Supplementary Figure 3). Using piecewise regression, we found that intervention and control units had small increases in alarm rates between the baseline and postimplementation periods with a nonsignificant difference in these differences between the control and intervention groups (Table 1).
Patient-Level Alarm Rates
We then restricted the analysis to the patients whose data were collected during intensive data collection days. We obtained data from 1974 pre-post pairs of 4-hour time periods.
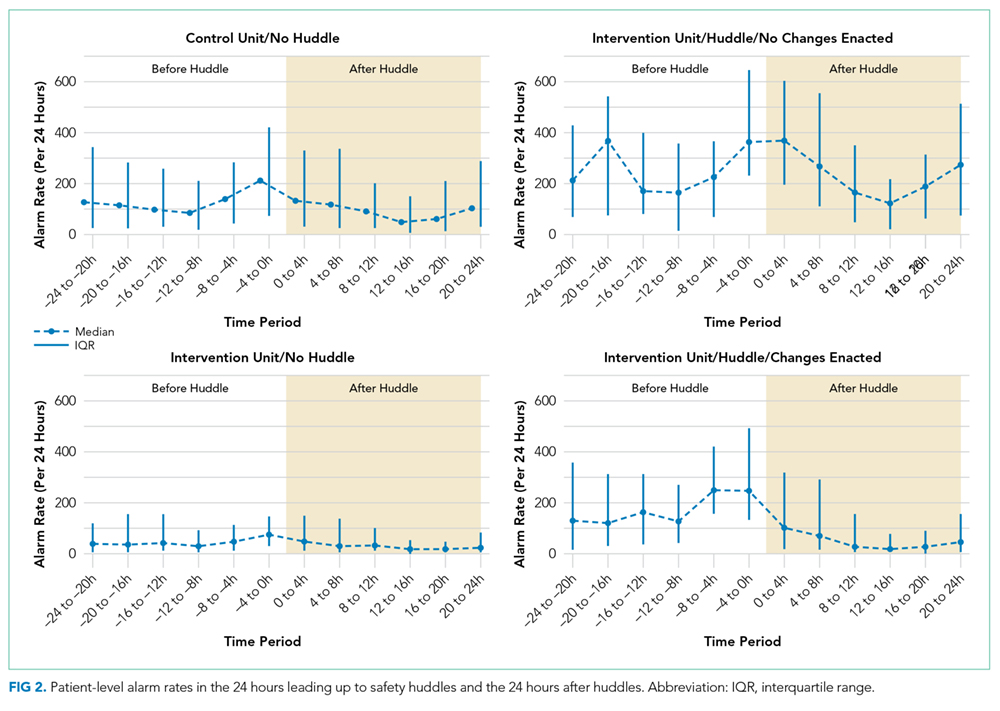

Implementation Outcomes
Adoption
The patient’s nurse attended 482 of the 580 huddle discussions (83.1%), and at least one of the patient’s physicians (resident, fellow, or attending) attended 394 (67.9%).
Fidelity: Adherence
In addition to the 353 huddles that included alarm discussion, 123 instances had no patients with ≥20 high acuity alarms in the preceding 4 hours therefore, no data were brought to the huddle. There were an additional 30 instances when a huddle did not occur or there was no alarm discussion in the huddle despite data being available. Thus, adherence occurred in 353 of 383 huddles (92.2%).
Fidelity: Dose
During the 112 calendar day postimplementation period, 379 patients’ alarms were discussed in huddles for an average intervention dose of 0.85 discussions per unit per calendar day.
Fidelity: Quality of Delivery
In 362 of the 580 huddle discussions (62.4%), changes were agreed upon. The most frequently agreed upon changes were discontinuing monitoring (32.0%), monitoring only when asleep or unsupervised (23.8%), widening heart rate parameters (12.7%), changing electrocardiographic leads/wires (8.6%), changing the pulse oximetry probe (8.0%), and increasing the delay time between when oxygen desaturation was detected and when the alarm was generated (4.7%). Of the huddle discussions with changes agreed upon, 346 (95.6%) changes were enacted at the bedside.
Safety Measures
There were 0 code blue events and 26 rapid response team activations for patients discussed in huddles. None were related to the intervention.
Discussion
Our main finding was that the huddle strategy was effective in safely reducing the burden of alarms for the high alarm pediatric ward patients whose alarms were discussed, but it did not reduce unit-level alarm rates. Implementation outcomes explained this finding. Although adoption and adherence were high, the overall dose of the intervention was low.
We also found that 36% of alarms had technical causes, the majority of which were related to the pulse oximetry probe detecting that it was off the patient or searching for a pulse. Although these alarms are likely perceived differently by clinical staff (most monitors generate different sounds for technical alarms), they still represent a substantial contribution to the alarm environment. Minimizing them in patients who must remain continuously monitored requires more intensive effort to implement other types of interventions than the main focus of this study, such as changing pulse oximetry probes and electrocardiographic leads/wires.
In one-third of huddles, monitoring was simply discontinued. We observed in many cases that, while these patients may have had legitimate indications for monitoring upon admission, their conditions had improved; after brief multidisciplinary discussion, the team concluded that monitoring was no longer indicated. This observation may suggest interventions at the ordering phase, such as prespecifying a monitoring duration.22,23
This study’s findings were consistent with a quasi-experimental study of safety huddle-based alarm discussions in a pediatric intensive care unit that showed a patient-level reduction of 116 alarms per patient-day in those discussed in huddles relative to controls.11 A smaller quasi-experimental study of implementing a nighttime alarm “ward round” in an adult intensive care unit showed a significant reduction in unit-level alarms/patient-day from 168 to 84.9 In a quality improvement report, a monitoring care process bundle that included discussion of alarm settings showed a reduction in unit-level alarms/patient-day from 180 to 40.10 Our study strengthens the body of literature using a cluster-randomized design, measuring patient- and unit-level outcomes, and including implementation outcomes that explain effectiveness findings.
On a hypothetical unit similar to the ones we studied with 20 occupied beds and 60 alarms/patient-day, an average of 1200 alarms would occur each day. We delivered the intervention to 0.85 patients per day. Changes were made at the bedside in 60% of those with the intervention delivered, and those patients had a difference in differences of 119 fewer alarms compared with the comparison patients on control units. In this scenario, we could expect a relative reduction of 0.85 x 0.60 x 119 = 61 fewer alarms/day total on the unit or a 5% reduction. However, that estimated reduction did not account for the arrival of new patients with high alarm rates, which certainly occurred in this study and explained the lack of effect at the unit level.
As described above, the intervention dose was low, which translated into a lack of effect at the unit level despite a strong effect at the patient level. This result was partly due to the manual process required to produce the alarm dashboards that restricted their availability to nonholiday weekdays. The study was performed at one hospital, which limited generalizability. The study hospital was already convening daily safety huddles that were well attended by nurses and physicians. Other hospitals without existing huddle structures may face challenges in implementing similar multidisciplinary alarm discussions. In addition, the study design was randomized at the unit (rather than patient) level, which limited our ability to balance potential confounders at the patient level.
Conclusion
A safety huddle intervention strategy to drive alarm customization was effective in safely reducing alarms for individual children discussed. However, unit-level alarm rates were not affected by the intervention due to a low dose. Leaders of efforts to reduce alarms should consider beginning with passive interventions (such as changes to default settings and alarm delays) and use huddle-based discussion as a second-line intervention to address remaining patients with high alarm rates.
Acknowledgments
We thank Matthew MacMurchy, BA, for his assistance with data collection.
Funding/Support
This study was supported by a Young Investigator Award (Bonafide, PI) from the Academic Pediatric Association.
Role of the Funder/Sponsor
The Academic Pediatric Association had no role in the design or conduct of the study; collection, management, analysis, or interpretation of the data; preparation, review, or approval of the manuscript; or decision to submit for publication.
Disclosures
No relevant financial activities, aside from the grant funding from the Academic Pediatric Association listed above, are reported.
1. Schondelmeyer AC, Brady PW, Goel VV, et al. Physiologic monitor alarm rates at 5 children’s hospitals. J Hosp Med. 2018;In press. PubMed
2. Cvach M, Kitchens M, Smith K, Harris P, Flack MN. Customizing alarm limits based on specific needs of patients. Biomed Instrum Technol. 2017;51(3):227-234. PubMed
3. Bonafide CP, Lin R, Zander M, et al. Association between exposure to nonactionable physiologic monitor alarms and response time in a children’s hospital. J Hosp Med. 2015;10(6):345-351. PubMed
4. Bonafide CP, Localio AR, Holmes JH, et al. Video analysis of factors associated with response time to physiologic monitor alarms in a children’s hospital. JAMA Pediatr. 2017;171(6):524-531. PubMed
5. Lange K, Nowak M, Zoller R, Lauer W. Boundary conditions for safe detection of clinical alarms: An observational study to identify the cognitive and perceptual demands on an Intensive Care Unit. In: In: D. de Waard, K.A. Brookhuis, A. Toffetti, A. Stuiver, C. Weikert, D. Coelho, D. Manzey, A.B. Ünal, S. Röttger, and N. Merat (Eds.) Proceedings of the Human Factors and Ergonomics Society Europe Chapter 2015 Annual Conference. Groningen, Netherlands; 2016.
6. Westbrook JI, Li L, Hooper TD, Raban MZ, Middleton S, Lehnbom EC. Effectiveness of a ‘Do not interrupt’ bundled intervention to reduce interruptions during medication administration: a cluster randomised controlled feasibility study. BMJ Qual Saf. 2017;26:734-742. PubMed
7. Chopra V, McMahon LF Jr. Redesigning hospital alarms for patient safety: alarmed and potentially dangerous. JAMA. 2014;311(12):1199-1200. PubMed
8. Turmell JW, Coke L, Catinella R, Hosford T, Majeski A. Alarm fatigue: use of an evidence-based alarm management strategy. J Nurs Care Qual. 2017;32(1):47-54. PubMed
9. Koerber JP, Walker J, Worsley M, Thorpe CM. An alarm ward round reduces the frequency of false alarms on the ICU at night. J Intensive Care Soc. 2011;12(1):75-76.
10. Dandoy CE, Davies SM, Flesch L, et al. A team-based approach to reducing cardiac monitor alarms. Pediatrics. 2014;134(6):e1686-1694. PubMed
11. Dewan M, Wolfe H, Lin R, et al. Impact of a safety huddle–based intervention on monitor alarm rates in low-acuity pediatric intensive care unit patients. J Hosp Med. 2017;12(8):652-657. PubMed
12. Goldenhar LM, Brady PW, Sutcliffe KM, Muething SE. Huddling for high reliability and situation awareness. BMJ Qual Saf. 2013;22(11):899-906. PubMed
13. Brady PW, Muething S, Kotagal U, et al. Improving situation awareness to reduce unrecognized clinical deterioration and serious safety events. Pediatrics. 2013;131:e298-308. PubMed
14. Curran GM, Bauer M, Mittman B, Pyne JM, Stetler C. Effectiveness-implementation hybrid designs: combining elements of clinical effectiveness and implementation research to enhance public health impact. Med Care. 2012;50(3):217-226. PubMed
15. Damschroder LJ, Aron DC, Keith RE, Kirsh SR, Alexander JA, Lowery JC. Fostering implementation of health services research findings into practice: a consolidated framework for advancing implementation science. Implement Sci. 2009;4(1):50. PubMed
16. Proctor E, Silmere H, Raghavan R, et al. Outcomes for implementation research: conceptual distinctions, measurement challenges, and research agenda. Adm Policy Ment Health. 2011;38(2):65-76. PubMed
17. Allen JD, Linnan LA, Emmons KM. Fidelity and its relationship to implementation effectiveness, adaptation, and dissemination. In: Dissemination and Implementation Research in Health: Translating Science to Practice (Brownson RC, Proctor EK, Colditz GA Eds.). Oxford University Press; 2012:281-304.
18. Harris PA, Taylor R, Thielke R, Payne J, Gonzalez N, Conde JG. Research electronic data capture (REDCap)—a metadata-driven methodology and workflow process for providing translational research informatics support. J Biomed Inf. 2009;42:377-381. PubMed
19. Singer JD, Willett JB. Applied Longitudinal Data Analysis: Modeling Change and Event Occurrence. New York: Oxford University Press; 2003.
20. Wagner AK, Soumerai SB, Zhang F, Ross-Degnan D. Segmented regression analysis of interrupted time series studies in medication use research. J Clin Pharm Ther. 2002;27:299-309. PubMed
21. Gardner W, Mulvey EP, Shaw EC. Regression analyses of counts and rates: Poisson, overdispersed Poisson, and negative binomial models. Psychol Bull. 1995;118:392-404. PubMed
22. Dressler R, Dryer MM, Coletti C, Mahoney D, Doorey AJ. Altering overuse of cardiac telemetry in non-intensive care unit settings by hardwiring the use of American Heart Association guidelines. JAMA Intern Med. 2014;174(11):1852-1854. PubMed
23. Boggan JC, Navar-Boggan AM, Patel V, Schulteis RD, Simel DL. Reductions in telemetry order duration do not reduce telemetry utilization. J Hosp Med. 2014;9(12):795-796. PubMed
Physiologic monitor alarms occur frequently in the hospital environment, with average rates on pediatric wards between 42 and 155 alarms per monitored patient-day.1 However, average rates do not depict the full story, because only 9%–25% of patients are responsible for most alarms on inpatient wards.1,2 In addition, only 0.5%–1% of alarms on pediatric wards warrant action.3,4 Downstream consequences of high alarm rates include interruptions5,6 and alarm fatigue.3,4,7
Alarm customization, the process of reviewing individual patients’ alarm data and using that data to implement patient-specific alarm reduction interventions, has emerged as a potential approach to unit-wide alarm management.8-11 Potential customizations include broadening alarm thresholds, instituting delays between the time the alarm condition is met and the time the alarm sounds, and changing electrodes.8-11 However, the workflows within which to identify the patients who will benefit from customization, make decisions about how to customize, and implement customizations have not been delineated.
Safety huddles are brief structured discussions among physicians, nurses, and other staff aiming to identify and mitigate threats to patient safety.11-13 In this study, we aimed to evaluate the influence of a safety huddle-based alarm intervention strategy targeting high alarm pediatric ward patients on (a) unit-level alarm rates and (b) patient-level alarm rates, as well as to (c) evaluate implementation outcomes. We hypothesized that patients discussed in huddles would have greater reductions in alarm rates in the 24 hours following their huddle than patients who were not discussed. Given that most alarms are generated by a small fraction of patients,1,2 we hypothesized that patient-level reductions would translate to unit-level reductions.
METHODS
Human Subject Protection
The Institutional Review Board of Children’s Hospital of Philadelphia approved this study with a waiver of informed consent. We registered the study at ClinicalTrials.gov (identifier NCT02458872). The original protocol is available as an Online Supplement.
Design and Framework
For our secondary effectiveness outcome evaluating the effect of the intervention on the alarm rates of the individual patients discussed in huddles, we used a cohort design embedded within the trial to analyze patient-specific alarm data collected only on randomly selected “intensive data collection days,” described below and in Figure 1.
Setting and Subjects
All patients hospitalized on 8 units that admit general pediatric and medical subspecialty patients at Children’s Hospital of Philadelphia between June 15, 2015 and May 8, 2016 were included in the primary (unit-level) analysis. Every patient’s bedside included a General Electric Dash 3000 physiologic monitor. Decisions to monitor patients were made by physicians and required orders. Default alarm settings are available in Supplementary Table 1; these settings required orders to change.
All 8 units were already convening scheduled safety huddles led by the charge nurse each day. All nurses and at least one resident were expected to attend; attending physicians and fellows were welcome but not expected to attend. Huddles focused on discussing safety concerns and patient flow. None of the preexisting huddles included alarm discussion.
Intervention
For each nonholiday weekday, we generated customized paper-based alarm huddle data “dashboards” (Supplementary Figure 1) displaying data from the patients (up to a maximum of 4) on each intervention unit with the highest numbers of high-acuity alarms (“crisis” and “warning” audible alarms, see Supplementary Table 2 for detailed listing of alarm types) in the preceding 4 hours by reviewing data from the monitor network using BedMasterEx v4.2 (Excel Medical Electronics). Dashboards listed the most frequent types of alarms, alarm settings, and included a script for discussing the alarms with checkboxes to indicate changes agreed upon by the team during the huddle. Patients with fewer than 20 alarms in the preceding 4h were not included; thus, sometimes fewer than 4 patients’ data were available for discussion. We hand-delivered dashboards to the charge nurses leading huddles, and they facilitated the multidisciplinary alarm discussions focused on reviewing alarm data and customizing settings to reduce unnecessary alarms.
Study Periods
The study had 3 periods as shown in Supplementary Figure 2: (1) 16-week baseline data collection, (2) phased intervention implementation during which we serially spent 2-8 weeks on each of the 4 intervention units implementing the intervention, and (3) 16-week postimplementation data collection.
Outcomes
The primary effectiveness outcome was the change in unit-level alarms per patient-day between the baseline and postimplementation periods in intervention versus control units, with all patients on the units included. The secondary effectiveness outcome (analyzed using the embedded cohort design) was the change in individual patient-level alarms between the 24 hours leading up to a huddle and the 24 hours following huddles in patients who were versus patients who were not discussed in huddles.
Implementation outcomes included adoption and fidelity measures. To measure adoption (defined as “intention to try” the intervention),16 we measured the frequency of discussions attended by patients’ nurses and physicians. We evaluated 3 elements of fidelity: adherence, dose, and quality of delivery.17 We measured adherence as the incorporation of alarm discussion into huddles when there were eligible patients to discuss. We measured dose as the average number of patients discussed on each unit per calendar day during the postimplementation period. We measured quality of delivery as the extent to which changes to monitoring that were agreed upon in the huddles were made at the bedside.
Safety Measures
To surveil for unintended consequences of reduced monitoring, we screened the hospital’s rapid response and code blue team database weekly for any events in patients previously discussed in huddles that occurred between huddle and hospital discharge. We reviewed charts to determine if the events were related to the intervention.
Randomization
Prior to randomization, the 8 units were divided into pairs based on participation in hospital-wide Joint Commission alarm management activities, use of alarm middleware that relayed detailed alarm information to nurses’ mobile phones, and baseline alarm rates. One unit in each pair was randomized to intervention and the other to control by coin flip.
Data Collection
We used Research Electronic Data Capture (REDCap)18 database tools.
Data for Unit-Level Analyses
We captured all alarms occurring on the study units during the study period using data from BedMasterEx. We obtained census data accurate to the hour from the Clinical Data Warehouse.
Data Captured in All Huddles
During each huddle, we collected the number of patients whose alarms were discussed, patient characteristics, presence of nurses and physicians, and monitoring changes agreed upon. We then followed up 4 hours later to determine if changes were made at the bedside by examining monitor settings.
Data Captured Only During Intensive Data Collection Days
We randomly selected 1 day during each of the 16 weeks of the postimplementation period to obtain additional patient-level data. On each intensive data collection day, the 4 monitored patients on each intervention and control unit with the most high-acuity alarms in the 4 hours prior to huddles occurring — regardless of whether or not these patients were later discussed in huddles — were identified for data collection. On these dates, a member of the research team reviewed each patient’s alarm counts in 4-hour blocks during the 24 hours before and after the huddle. Given that the huddles were not always at the same time every day (ranging between 10:00 and 13:00), we operationally set the huddle time as 12:00 for all units.
Data Analysis
We used Stata/SE 14.2 for all analyses.
Unit-Level Alarm Rates
To compare unit-level rates, we performed an interrupted time series analysis using segmented (piecewise) regression to evaluate the impact of the intervention.19,20 We used a multivariable generalized estimating equation model with the negative binomial distribution21 and clustering by unit. We bootstrapped the model and generated percentile-based 95% confidence intervals. We then used the model to estimate the alarm rate difference in differences between the baseline data collection period and the postimplementation data collection period for intervention versus control units.
Patient-Level Alarm Rates
In contrast to unit-level analysis, we used an embedded cohort design to model the change in individual patients’ alarms between the 24 hours leading up to huddles and the 24 hours following huddles in patients who were versus patients who were not discussed in huddles. The analysis was restricted to the patients included in intensive data collection days. We performed bootstrapped linear regression and generated percentile-based 95% confidence intervals using the difference in 4-hour block alarm rate between pre- and posthuddle as the outcome. We clustered within patients. We stratified by unit and preceding alarm rate. We modeled the alarm rate difference between the 24-hour prehuddle and the 24-hour posthuddle for huddled and nonhuddled patients and the difference in differences between exposure groups.
Implementation Outcomes
We summarized adoption and fidelity using proportions.
RESULTS
Alarm dashboards informed 580 structured alarm discussions during 353 safety huddles (huddles often included discussion of more than one patient).
Unit-Level Alarm Rates
Visually, alarm rates over time on each individual unit appeared flat despite the intervention (Supplementary Figure 3). Using piecewise regression, we found that intervention and control units had small increases in alarm rates between the baseline and postimplementation periods with a nonsignificant difference in these differences between the control and intervention groups (Table 1).
Patient-Level Alarm Rates
We then restricted the analysis to the patients whose data were collected during intensive data collection days. We obtained data from 1974 pre-post pairs of 4-hour time periods.
Implementation Outcomes
Adoption
The patient’s nurse attended 482 of the 580 huddle discussions (83.1%), and at least one of the patient’s physicians (resident, fellow, or attending) attended 394 (67.9%).
Fidelity: Adherence
In addition to the 353 huddles that included alarm discussion, 123 instances had no patients with ≥20 high acuity alarms in the preceding 4 hours therefore, no data were brought to the huddle. There were an additional 30 instances when a huddle did not occur or there was no alarm discussion in the huddle despite data being available. Thus, adherence occurred in 353 of 383 huddles (92.2%).
Fidelity: Dose
During the 112 calendar day postimplementation period, 379 patients’ alarms were discussed in huddles for an average intervention dose of 0.85 discussions per unit per calendar day.
Fidelity: Quality of Delivery
In 362 of the 580 huddle discussions (62.4%), changes were agreed upon. The most frequently agreed upon changes were discontinuing monitoring (32.0%), monitoring only when asleep or unsupervised (23.8%), widening heart rate parameters (12.7%), changing electrocardiographic leads/wires (8.6%), changing the pulse oximetry probe (8.0%), and increasing the delay time between when oxygen desaturation was detected and when the alarm was generated (4.7%). Of the huddle discussions with changes agreed upon, 346 (95.6%) changes were enacted at the bedside.
Safety Measures
There were 0 code blue events and 26 rapid response team activations for patients discussed in huddles. None were related to the intervention.
Discussion
Our main finding was that the huddle strategy was effective in safely reducing the burden of alarms for the high alarm pediatric ward patients whose alarms were discussed, but it did not reduce unit-level alarm rates. Implementation outcomes explained this finding. Although adoption and adherence were high, the overall dose of the intervention was low.
We also found that 36% of alarms had technical causes, the majority of which were related to the pulse oximetry probe detecting that it was off the patient or searching for a pulse. Although these alarms are likely perceived differently by clinical staff (most monitors generate different sounds for technical alarms), they still represent a substantial contribution to the alarm environment. Minimizing them in patients who must remain continuously monitored requires more intensive effort to implement other types of interventions than the main focus of this study, such as changing pulse oximetry probes and electrocardiographic leads/wires.
In one-third of huddles, monitoring was simply discontinued. We observed in many cases that, while these patients may have had legitimate indications for monitoring upon admission, their conditions had improved; after brief multidisciplinary discussion, the team concluded that monitoring was no longer indicated. This observation may suggest interventions at the ordering phase, such as prespecifying a monitoring duration.22,23
This study’s findings were consistent with a quasi-experimental study of safety huddle-based alarm discussions in a pediatric intensive care unit that showed a patient-level reduction of 116 alarms per patient-day in those discussed in huddles relative to controls.11 A smaller quasi-experimental study of implementing a nighttime alarm “ward round” in an adult intensive care unit showed a significant reduction in unit-level alarms/patient-day from 168 to 84.9 In a quality improvement report, a monitoring care process bundle that included discussion of alarm settings showed a reduction in unit-level alarms/patient-day from 180 to 40.10 Our study strengthens the body of literature using a cluster-randomized design, measuring patient- and unit-level outcomes, and including implementation outcomes that explain effectiveness findings.
On a hypothetical unit similar to the ones we studied with 20 occupied beds and 60 alarms/patient-day, an average of 1200 alarms would occur each day. We delivered the intervention to 0.85 patients per day. Changes were made at the bedside in 60% of those with the intervention delivered, and those patients had a difference in differences of 119 fewer alarms compared with the comparison patients on control units. In this scenario, we could expect a relative reduction of 0.85 x 0.60 x 119 = 61 fewer alarms/day total on the unit or a 5% reduction. However, that estimated reduction did not account for the arrival of new patients with high alarm rates, which certainly occurred in this study and explained the lack of effect at the unit level.
As described above, the intervention dose was low, which translated into a lack of effect at the unit level despite a strong effect at the patient level. This result was partly due to the manual process required to produce the alarm dashboards that restricted their availability to nonholiday weekdays. The study was performed at one hospital, which limited generalizability. The study hospital was already convening daily safety huddles that were well attended by nurses and physicians. Other hospitals without existing huddle structures may face challenges in implementing similar multidisciplinary alarm discussions. In addition, the study design was randomized at the unit (rather than patient) level, which limited our ability to balance potential confounders at the patient level.
Conclusion
A safety huddle intervention strategy to drive alarm customization was effective in safely reducing alarms for individual children discussed. However, unit-level alarm rates were not affected by the intervention due to a low dose. Leaders of efforts to reduce alarms should consider beginning with passive interventions (such as changes to default settings and alarm delays) and use huddle-based discussion as a second-line intervention to address remaining patients with high alarm rates.
Acknowledgments
We thank Matthew MacMurchy, BA, for his assistance with data collection.
Funding/Support
This study was supported by a Young Investigator Award (Bonafide, PI) from the Academic Pediatric Association.
Role of the Funder/Sponsor
The Academic Pediatric Association had no role in the design or conduct of the study; collection, management, analysis, or interpretation of the data; preparation, review, or approval of the manuscript; or decision to submit for publication.
Disclosures
No relevant financial activities, aside from the grant funding from the Academic Pediatric Association listed above, are reported.
1. Schondelmeyer AC, Brady PW, Goel VV, et al. Physiologic monitor alarm rates at 5 children’s hospitals. J Hosp Med. 2018;In press. PubMed
2. Cvach M, Kitchens M, Smith K, Harris P, Flack MN. Customizing alarm limits based on specific needs of patients. Biomed Instrum Technol. 2017;51(3):227-234. PubMed
3. Bonafide CP, Lin R, Zander M, et al. Association between exposure to nonactionable physiologic monitor alarms and response time in a children’s hospital. J Hosp Med. 2015;10(6):345-351. PubMed
4. Bonafide CP, Localio AR, Holmes JH, et al. Video analysis of factors associated with response time to physiologic monitor alarms in a children’s hospital. JAMA Pediatr. 2017;171(6):524-531. PubMed
5. Lange K, Nowak M, Zoller R, Lauer W. Boundary conditions for safe detection of clinical alarms: An observational study to identify the cognitive and perceptual demands on an Intensive Care Unit. In: In: D. de Waard, K.A. Brookhuis, A. Toffetti, A. Stuiver, C. Weikert, D. Coelho, D. Manzey, A.B. Ünal, S. Röttger, and N. Merat (Eds.) Proceedings of the Human Factors and Ergonomics Society Europe Chapter 2015 Annual Conference. Groningen, Netherlands; 2016.
6. Westbrook JI, Li L, Hooper TD, Raban MZ, Middleton S, Lehnbom EC. Effectiveness of a ‘Do not interrupt’ bundled intervention to reduce interruptions during medication administration: a cluster randomised controlled feasibility study. BMJ Qual Saf. 2017;26:734-742. PubMed
7. Chopra V, McMahon LF Jr. Redesigning hospital alarms for patient safety: alarmed and potentially dangerous. JAMA. 2014;311(12):1199-1200. PubMed
8. Turmell JW, Coke L, Catinella R, Hosford T, Majeski A. Alarm fatigue: use of an evidence-based alarm management strategy. J Nurs Care Qual. 2017;32(1):47-54. PubMed
9. Koerber JP, Walker J, Worsley M, Thorpe CM. An alarm ward round reduces the frequency of false alarms on the ICU at night. J Intensive Care Soc. 2011;12(1):75-76.
10. Dandoy CE, Davies SM, Flesch L, et al. A team-based approach to reducing cardiac monitor alarms. Pediatrics. 2014;134(6):e1686-1694. PubMed
11. Dewan M, Wolfe H, Lin R, et al. Impact of a safety huddle–based intervention on monitor alarm rates in low-acuity pediatric intensive care unit patients. J Hosp Med. 2017;12(8):652-657. PubMed
12. Goldenhar LM, Brady PW, Sutcliffe KM, Muething SE. Huddling for high reliability and situation awareness. BMJ Qual Saf. 2013;22(11):899-906. PubMed
13. Brady PW, Muething S, Kotagal U, et al. Improving situation awareness to reduce unrecognized clinical deterioration and serious safety events. Pediatrics. 2013;131:e298-308. PubMed
14. Curran GM, Bauer M, Mittman B, Pyne JM, Stetler C. Effectiveness-implementation hybrid designs: combining elements of clinical effectiveness and implementation research to enhance public health impact. Med Care. 2012;50(3):217-226. PubMed
15. Damschroder LJ, Aron DC, Keith RE, Kirsh SR, Alexander JA, Lowery JC. Fostering implementation of health services research findings into practice: a consolidated framework for advancing implementation science. Implement Sci. 2009;4(1):50. PubMed
16. Proctor E, Silmere H, Raghavan R, et al. Outcomes for implementation research: conceptual distinctions, measurement challenges, and research agenda. Adm Policy Ment Health. 2011;38(2):65-76. PubMed
17. Allen JD, Linnan LA, Emmons KM. Fidelity and its relationship to implementation effectiveness, adaptation, and dissemination. In: Dissemination and Implementation Research in Health: Translating Science to Practice (Brownson RC, Proctor EK, Colditz GA Eds.). Oxford University Press; 2012:281-304.
18. Harris PA, Taylor R, Thielke R, Payne J, Gonzalez N, Conde JG. Research electronic data capture (REDCap)—a metadata-driven methodology and workflow process for providing translational research informatics support. J Biomed Inf. 2009;42:377-381. PubMed
19. Singer JD, Willett JB. Applied Longitudinal Data Analysis: Modeling Change and Event Occurrence. New York: Oxford University Press; 2003.
20. Wagner AK, Soumerai SB, Zhang F, Ross-Degnan D. Segmented regression analysis of interrupted time series studies in medication use research. J Clin Pharm Ther. 2002;27:299-309. PubMed
21. Gardner W, Mulvey EP, Shaw EC. Regression analyses of counts and rates: Poisson, overdispersed Poisson, and negative binomial models. Psychol Bull. 1995;118:392-404. PubMed
22. Dressler R, Dryer MM, Coletti C, Mahoney D, Doorey AJ. Altering overuse of cardiac telemetry in non-intensive care unit settings by hardwiring the use of American Heart Association guidelines. JAMA Intern Med. 2014;174(11):1852-1854. PubMed
23. Boggan JC, Navar-Boggan AM, Patel V, Schulteis RD, Simel DL. Reductions in telemetry order duration do not reduce telemetry utilization. J Hosp Med. 2014;9(12):795-796. PubMed
© 2018 Society of Hospital Medicine
Physiologic Monitor Alarm Rates at 5 Children’s Hospitals
Alarm fatigue is a patient safety hazard in hospitals1 that occurs when exposure to high rates of alarms leads clinicians to ignore or delay their responses to the alarms.2,3 To date, most studies of physiologic monitor alarms in hospitalized children have used data from single institutions and often only a few units within each institution.4 These limited studies have found that alarms in pediatric units are rarely actionable.2 They have also shown that physiologic monitor alarms occur frequently in children’s hospitals and that alarm rates can vary widely within a single institution,5 but the extent of variation between children’s hospitals is unknown. In this study, we aimed to describe and compare physiologic monitor alarm characteristics and the proportion of patients monitored in the inpatient units of 5 children’s hospitals.
METHODS
We performed a cross-sectional study using a point-prevalence design of physiologic monitor alarms and monitoring during a 24-hour period at 5 large, freestanding tertiary-care children’s hospitals. At the time of the study, each hospital had an alarm management committee in place and was working to address alarm fatigue. Each hospital’s institutional review board reviewed and approved the study.
We collected 24 consecutive hours of data from the inpatient units of each hospital between March 24, 2015, and May 1, 2015. Each hospital selected the data collection date within that window based on the availability of staff to perform data collection.6 We excluded emergency departments, procedural areas, and inpatient psychiatry and rehabilitation units. By using existing central alarm-collection software that interfaced with bedside physiologic monitors, we collected data on audible alarms generated for apnea, arrhythmia, low and high oxygen saturation, heart rate, respiratory rate, blood pressure, and exhaled carbon dioxide. Bedside alarm systems and alarm collection software differed between centers; therefore, alarm types that were not consistently collected at every institution (eg, alarms for electrode and device malfunction, ventilators, intracranial and central venous pressure monitors, and temperatures probes) were excluded. To estimate alarm rates and to account for fluctuations in hospital census throughout the day,7 we collected census (to calculate the number of alarms per patient day) and the number of monitored patients (to calculate the number of alarms per monitored-patient day, including only monitored patients in the denominator) on each unit at 3 time points, 8 hours apart. Patients were considered continuously monitored if they had presence of a waveform and data for pulse oximetry, respiratory rate, and/or heart rate at the time of data collection. We then determined the rate of alarms by unit type—medical-surgical unit (MSU), neonatal intensive care unit (NICU), or pediatric intensive care unit (PICU)—and the alarm types. Based on prior literature demonstrating up to 95% of alarms contributed by a minority of patients on a single unit,8 we also calculated the percentage of alarms contributed by beds in the highest quartile of alarms. We also assessed the percentage of patients monitored by unit type. The Supplementary Appendix shows the alarm parameter thresholds in use at the time of the study.
RESULTS
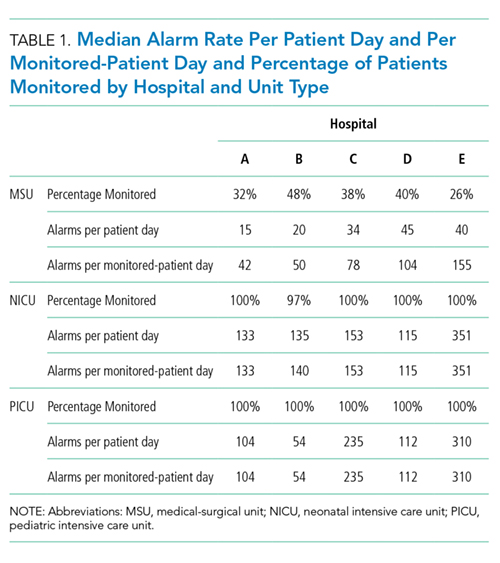
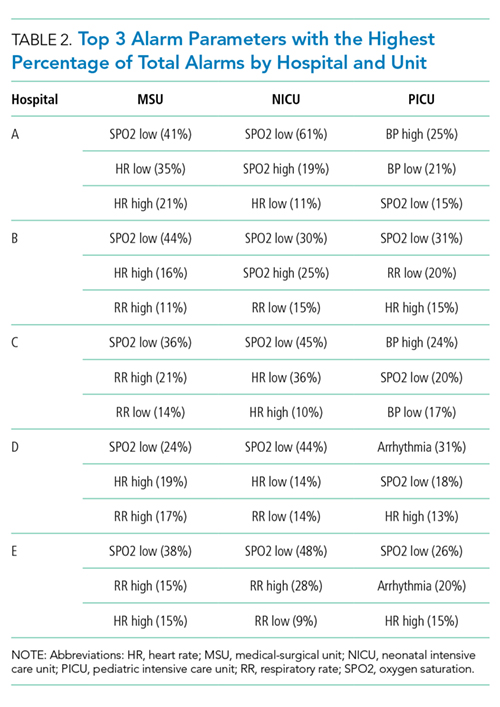
Averaged across study hospitals, one-quarter of the monitored beds were responsible for 71% of alarms in MSUs, 61% of alarms in NICUs, and 63% of alarms in PICUs.
DISCUSSION
Physiologic monitor alarm rates and the proportion of patients monitored varied widely between unit types and among the tertiary-care children’s hospitals in our study. We found that among MSUs, the hospital with the lowest proportion of beds monitored had the highest alarm rate, with over triple the rate seen at the hospital with the lowest alarm rate. Regardless of unit type, a small subgroup of patients at each hospital contributed a disproportionate share of alarms. These findings are concerning because of the patient morbidity and mortality associated with alarm fatigue1 and the studies suggesting that higher alarm rates may lead to delays in response to potentially critical alarms.2
We previously described alarm rates at a single children’s hospital and found that alarm rates were high both in and outside of the ICU areas.5 This study supports those findings and goes further to show that alarm rates on some MSUs approached rates seen in the ICU areas at other centers.4 However, our results should be considered in the context of several limitations. First, the 5 study hospitals utilized different bedside monitors, equipment, and software to collect alarm data. It is possible that this impacted how alarms were counted, though there were no technical specifications to suggest that results should have been biased in a specific way. Second, our data did not reflect alarm validity (ie, whether an alarm accurately reflected the physiologic state of the patient) or factors outside of the number of patients monitored—such as practices around ICU admission and transfer as well as monitor practices such as lead changes, the type of leads employed, and the degree to which alarm parameter thresholds could be customized, which may have also affected alarm rates. Finally, we excluded alarm types that were not consistently collected at all hospitals. We were also unable to capture alarms from other alarm-generating devices, including ventilators and infusion pumps, which have also been identified as sources of alarm-related safety issues in hospitals.9-11 This suggests that the alarm rates reported here underestimate the total number of audible alarms experienced by staff and by hospitalized patients and families.
While our data collection was limited in scope, the striking differences in alarm rates between hospitals and between similar units in the same hospitals suggest that unit- and hospital-level factors—including default alarm parameter threshold settings, types of monitors used, and monitoring practices such as the degree to which alarm parameters are customized to the patient’s physiologic state—likely contribute to the variability. It is also important to note that while there were clear outlier hospitals, no single hospital had the lowest alarm rate across all unit types. And while we found that a small number of patients contributed disproportionately to alarms, monitoring fewer patients overall was not consistently associated with lower alarm rates. While it is difficult to draw conclusions based on a limited study, these findings suggest that solutions to meaningfully lower alarm rates may be multifaceted. Standardization of care in multiple areas of medicine has shown the potential to decrease unnecessary utilization of testing and therapies while maintaining good patient outcomes.12-15 Our findings suggest that the concept of positive deviance,16 by which some organizations produce better outcomes than others despite similar limitations, may help identify successful alarm reduction strategies for further testing. Larger quantitative studies of alarm rates and ethnographic or qualitative studies of monitoring practices may reveal practices and policies that are associated with lower alarm rates with similar or improved monitoring outcomes.
CONCLUSION
We found wide variability in physiologic monitor alarm rates and the proportion of patients monitored across 5 children’s hospitals. Because alarm fatigue remains a pressing patient safety concern, further study of the features of high-performing (low-alarm) hospital systems may help identify barriers and facilitators of safe, effective monitoring and develop targeted interventions to reduce alarms.
ACKNOWLEDGEMENTS
The authors thank Melinda Egan, Matt MacMurchy, and Shannon Stemler for their assistance with data collection.
Disclosure
Dr. Bonafide is supported by the National Heart, Lung, and Blood Institute of the National Institutes of Health under Award Number K23HL116427. Dr. Brady is supported by the Agency for Healthcare Research and Quality under Award Number K08HS23827. The content is solely the responsibility of the authors and does not necessarily represent the official views of the National Institutes of Health or the Agency for Healthcare Research and Quality. There was no external funding obtained for this study. The authors have no conflicts of interest to disclose.
1. Sentinel Event Alert Issue 50: Medical device alarm safety in hospitals. The Joint Commission. April 8, 2013. www.jointcommission.org/sea_issue_50. Accessed December 16, 2017.
2. Bonafide CP, Lin R, Zander M, et al. Association between exposure to nonactionable physiologic monitor alarms and response time in a children’s hospital. J Hosp Med. 2015;10(6):345-351. PubMed
3. Voepel-Lewis T, Parker ML, Burke CN, et al. Pulse oximetry desaturation alarms on a general postoperative adult unit: A prospective observational study of nurse response time. Int J Nurs Stud. 2013;50(10):1351-1358. PubMed
4. Paine CW, Goel VV, Ely E, et al. Systematic review of physiologic monitor alarm characteristics and pragmatic interventions to reduce alarm frequency. J Hosp Med. 2016;11(2):136-144. PubMed
5. Schondelmeyer AC, Bonafide CP, Goel VV, et al. The frequency of physiologic monitor alarms in a children’s hospital. J Hosp Med. 2016;11(11):796-798. PubMed
6. Zingg W, Hopkins S, Gayet-Ageron A, et al. Health-care-associated infections in neonates, children, and adolescents: An analysis of paediatric data from the European Centre for Disease Prevention and Control point-prevalence survey. Lancet Infect Dis. 2017;17(4):381-389. PubMed
7. Fieldston E, Ragavan M, Jayaraman B, Metlay J, Pati S. Traditional measures of hospital utilization may not accurately reflect dynamic patient demand: Findings from a children’s hospital. Hosp Pediatr. 2012;2(1):10-18. PubMed
8. Cvach M, Kitchens M, Smith K, Harris P, Flack MN. Customizing alarm limits based on specific needs of patients. Biomed Instrum Technol. 2017;51(3):227-234. PubMed
9. Pham JC, Williams TL, Sparnon EM, Cillie TK, Scharen HF, Marella WM. Ventilator-related adverse events: A taxonomy and findings from 3 incident reporting systems. Respir Care. 2016;61(5):621-631. PubMed
10. Cho OM, Kim H, Lee YW, Cho I. Clinical alarms in intensive care units: Perceived obstacles of alarm management and alarm fatigue in nurses. Healthc Inform Res. 2016;22(1):46-53. PubMed
11. Edworthy J, Hellier E. Alarms and human behaviour: Implications for medical alarms. Br J Anaesth. 2006;97(1):12-17. PubMed
12. Fisher ES, Wennberg DE, Stukel TA, Gottlieb DJ, Lucas FL, Pinder EL. The implications of regional variations in medicare spending. Part 1: The content, quality, and accessibility of care. Ann Intern Med. 2003;138(4):273-287. PubMed
13. Fisher ES, Wennberg DE, Stukel TA, Gottlieb DJ, Lucas FL, Pinder EL. The implications of regional variations in medicare spending. Part 2: Health outcomes and satisfaction with care. Ann Intern Med. 2003;138(4):288-298. PubMed
14. Lion KC, Wright DR, Spencer S, Zhou C, Del Beccaro M, Mangione-Smith R. Standardized clinical pathways for hospitalized children and outcomes. Pediatrics. 2016;137(4) e20151202. PubMed
15. Goodman DC. Unwarranted variation in pediatric medical care. Pediatr Clin North Am. 2009;56(4):745-755. PubMed
16. Baxter R, Taylor N, Kellar I, Lawton R. What methods are used to apply positive deviance within healthcare organisations? A systematic review. BMJ Qual Saf. 2016;25(3):190-201. PubMed
Alarm fatigue is a patient safety hazard in hospitals1 that occurs when exposure to high rates of alarms leads clinicians to ignore or delay their responses to the alarms.2,3 To date, most studies of physiologic monitor alarms in hospitalized children have used data from single institutions and often only a few units within each institution.4 These limited studies have found that alarms in pediatric units are rarely actionable.2 They have also shown that physiologic monitor alarms occur frequently in children’s hospitals and that alarm rates can vary widely within a single institution,5 but the extent of variation between children’s hospitals is unknown. In this study, we aimed to describe and compare physiologic monitor alarm characteristics and the proportion of patients monitored in the inpatient units of 5 children’s hospitals.
METHODS
We performed a cross-sectional study using a point-prevalence design of physiologic monitor alarms and monitoring during a 24-hour period at 5 large, freestanding tertiary-care children’s hospitals. At the time of the study, each hospital had an alarm management committee in place and was working to address alarm fatigue. Each hospital’s institutional review board reviewed and approved the study.
We collected 24 consecutive hours of data from the inpatient units of each hospital between March 24, 2015, and May 1, 2015. Each hospital selected the data collection date within that window based on the availability of staff to perform data collection.6 We excluded emergency departments, procedural areas, and inpatient psychiatry and rehabilitation units. By using existing central alarm-collection software that interfaced with bedside physiologic monitors, we collected data on audible alarms generated for apnea, arrhythmia, low and high oxygen saturation, heart rate, respiratory rate, blood pressure, and exhaled carbon dioxide. Bedside alarm systems and alarm collection software differed between centers; therefore, alarm types that were not consistently collected at every institution (eg, alarms for electrode and device malfunction, ventilators, intracranial and central venous pressure monitors, and temperatures probes) were excluded. To estimate alarm rates and to account for fluctuations in hospital census throughout the day,7 we collected census (to calculate the number of alarms per patient day) and the number of monitored patients (to calculate the number of alarms per monitored-patient day, including only monitored patients in the denominator) on each unit at 3 time points, 8 hours apart. Patients were considered continuously monitored if they had presence of a waveform and data for pulse oximetry, respiratory rate, and/or heart rate at the time of data collection. We then determined the rate of alarms by unit type—medical-surgical unit (MSU), neonatal intensive care unit (NICU), or pediatric intensive care unit (PICU)—and the alarm types. Based on prior literature demonstrating up to 95% of alarms contributed by a minority of patients on a single unit,8 we also calculated the percentage of alarms contributed by beds in the highest quartile of alarms. We also assessed the percentage of patients monitored by unit type. The Supplementary Appendix shows the alarm parameter thresholds in use at the time of the study.
RESULTS
Averaged across study hospitals, one-quarter of the monitored beds were responsible for 71% of alarms in MSUs, 61% of alarms in NICUs, and 63% of alarms in PICUs.
DISCUSSION
Physiologic monitor alarm rates and the proportion of patients monitored varied widely between unit types and among the tertiary-care children’s hospitals in our study. We found that among MSUs, the hospital with the lowest proportion of beds monitored had the highest alarm rate, with over triple the rate seen at the hospital with the lowest alarm rate. Regardless of unit type, a small subgroup of patients at each hospital contributed a disproportionate share of alarms. These findings are concerning because of the patient morbidity and mortality associated with alarm fatigue1 and the studies suggesting that higher alarm rates may lead to delays in response to potentially critical alarms.2
We previously described alarm rates at a single children’s hospital and found that alarm rates were high both in and outside of the ICU areas.5 This study supports those findings and goes further to show that alarm rates on some MSUs approached rates seen in the ICU areas at other centers.4 However, our results should be considered in the context of several limitations. First, the 5 study hospitals utilized different bedside monitors, equipment, and software to collect alarm data. It is possible that this impacted how alarms were counted, though there were no technical specifications to suggest that results should have been biased in a specific way. Second, our data did not reflect alarm validity (ie, whether an alarm accurately reflected the physiologic state of the patient) or factors outside of the number of patients monitored—such as practices around ICU admission and transfer as well as monitor practices such as lead changes, the type of leads employed, and the degree to which alarm parameter thresholds could be customized, which may have also affected alarm rates. Finally, we excluded alarm types that were not consistently collected at all hospitals. We were also unable to capture alarms from other alarm-generating devices, including ventilators and infusion pumps, which have also been identified as sources of alarm-related safety issues in hospitals.9-11 This suggests that the alarm rates reported here underestimate the total number of audible alarms experienced by staff and by hospitalized patients and families.
While our data collection was limited in scope, the striking differences in alarm rates between hospitals and between similar units in the same hospitals suggest that unit- and hospital-level factors—including default alarm parameter threshold settings, types of monitors used, and monitoring practices such as the degree to which alarm parameters are customized to the patient’s physiologic state—likely contribute to the variability. It is also important to note that while there were clear outlier hospitals, no single hospital had the lowest alarm rate across all unit types. And while we found that a small number of patients contributed disproportionately to alarms, monitoring fewer patients overall was not consistently associated with lower alarm rates. While it is difficult to draw conclusions based on a limited study, these findings suggest that solutions to meaningfully lower alarm rates may be multifaceted. Standardization of care in multiple areas of medicine has shown the potential to decrease unnecessary utilization of testing and therapies while maintaining good patient outcomes.12-15 Our findings suggest that the concept of positive deviance,16 by which some organizations produce better outcomes than others despite similar limitations, may help identify successful alarm reduction strategies for further testing. Larger quantitative studies of alarm rates and ethnographic or qualitative studies of monitoring practices may reveal practices and policies that are associated with lower alarm rates with similar or improved monitoring outcomes.
CONCLUSION
We found wide variability in physiologic monitor alarm rates and the proportion of patients monitored across 5 children’s hospitals. Because alarm fatigue remains a pressing patient safety concern, further study of the features of high-performing (low-alarm) hospital systems may help identify barriers and facilitators of safe, effective monitoring and develop targeted interventions to reduce alarms.
ACKNOWLEDGEMENTS
The authors thank Melinda Egan, Matt MacMurchy, and Shannon Stemler for their assistance with data collection.
Disclosure
Dr. Bonafide is supported by the National Heart, Lung, and Blood Institute of the National Institutes of Health under Award Number K23HL116427. Dr. Brady is supported by the Agency for Healthcare Research and Quality under Award Number K08HS23827. The content is solely the responsibility of the authors and does not necessarily represent the official views of the National Institutes of Health or the Agency for Healthcare Research and Quality. There was no external funding obtained for this study. The authors have no conflicts of interest to disclose.
1. Sentinel Event Alert Issue 50: Medical device alarm safety in hospitals. The Joint Commission. April 8, 2013. www.jointcommission.org/sea_issue_50. Accessed December 16, 2017.
2. Bonafide CP, Lin R, Zander M, et al. Association between exposure to nonactionable physiologic monitor alarms and response time in a children’s hospital. J Hosp Med. 2015;10(6):345-351. PubMed
3. Voepel-Lewis T, Parker ML, Burke CN, et al. Pulse oximetry desaturation alarms on a general postoperative adult unit: A prospective observational study of nurse response time. Int J Nurs Stud. 2013;50(10):1351-1358. PubMed
4. Paine CW, Goel VV, Ely E, et al. Systematic review of physiologic monitor alarm characteristics and pragmatic interventions to reduce alarm frequency. J Hosp Med. 2016;11(2):136-144. PubMed
5. Schondelmeyer AC, Bonafide CP, Goel VV, et al. The frequency of physiologic monitor alarms in a children’s hospital. J Hosp Med. 2016;11(11):796-798. PubMed
6. Zingg W, Hopkins S, Gayet-Ageron A, et al. Health-care-associated infections in neonates, children, and adolescents: An analysis of paediatric data from the European Centre for Disease Prevention and Control point-prevalence survey. Lancet Infect Dis. 2017;17(4):381-389. PubMed
7. Fieldston E, Ragavan M, Jayaraman B, Metlay J, Pati S. Traditional measures of hospital utilization may not accurately reflect dynamic patient demand: Findings from a children’s hospital. Hosp Pediatr. 2012;2(1):10-18. PubMed
8. Cvach M, Kitchens M, Smith K, Harris P, Flack MN. Customizing alarm limits based on specific needs of patients. Biomed Instrum Technol. 2017;51(3):227-234. PubMed
9. Pham JC, Williams TL, Sparnon EM, Cillie TK, Scharen HF, Marella WM. Ventilator-related adverse events: A taxonomy and findings from 3 incident reporting systems. Respir Care. 2016;61(5):621-631. PubMed
10. Cho OM, Kim H, Lee YW, Cho I. Clinical alarms in intensive care units: Perceived obstacles of alarm management and alarm fatigue in nurses. Healthc Inform Res. 2016;22(1):46-53. PubMed
11. Edworthy J, Hellier E. Alarms and human behaviour: Implications for medical alarms. Br J Anaesth. 2006;97(1):12-17. PubMed
12. Fisher ES, Wennberg DE, Stukel TA, Gottlieb DJ, Lucas FL, Pinder EL. The implications of regional variations in medicare spending. Part 1: The content, quality, and accessibility of care. Ann Intern Med. 2003;138(4):273-287. PubMed
13. Fisher ES, Wennberg DE, Stukel TA, Gottlieb DJ, Lucas FL, Pinder EL. The implications of regional variations in medicare spending. Part 2: Health outcomes and satisfaction with care. Ann Intern Med. 2003;138(4):288-298. PubMed
14. Lion KC, Wright DR, Spencer S, Zhou C, Del Beccaro M, Mangione-Smith R. Standardized clinical pathways for hospitalized children and outcomes. Pediatrics. 2016;137(4) e20151202. PubMed
15. Goodman DC. Unwarranted variation in pediatric medical care. Pediatr Clin North Am. 2009;56(4):745-755. PubMed
16. Baxter R, Taylor N, Kellar I, Lawton R. What methods are used to apply positive deviance within healthcare organisations? A systematic review. BMJ Qual Saf. 2016;25(3):190-201. PubMed
© 2018 Society of Hospital Medicine
Pushing the Limits
Deciding when a hospitalized child's vital signs are acceptably within range and when they should generate alerts, alarms, and escalations of care is critically important yet surprisingly complicated. Many patients in the hospital who are recovering appropriately exhibit vital signs that fall outside normal ranges for well children. In a technology‐focused hospital environment, these out‐of‐range vital signs often generate alerts in the electronic health record (EHR) and alarms on physiologic monitors that can disrupt patients' sleep, generate concern in parents, lead to unnecessary testing and treatment by physicians, interrupt nurses during important patient care tasks, and lead to alarm fatigue. It is this last area, the problem of alarm fatigue, that Goel and colleagues[1] have used to frame the rationale and results of their study reported in this issue of the Journal of Hospital Medicine.
Goel and colleagues correctly point out that physiologic monitor alarm rates are high in children's hospitals, and alarms warranting intervention or action are rare.[2, 3, 4, 5, 6] Few studies have rigorously examined interventions to reduce unnecessary hospital physiologic monitor alarms, especially in pediatric settings. Of all the potential interventions, widening parameters has the most face validity: if you set wide enough alarm parameters, fewer alarms will be triggered. However, it comes with a potential safety tradeoff of missed actionable alarms.
Before EHR data became widely available for research, normal (or perhaps more appropriate for the hospital setting, expected) vital sign ranges were defined using expert opinion. The first publication describing the distribution of EHR‐documented vital signs in hospitalized children was published in 2013.[7] Goel and colleagues have built upon this prior work in their article, in which they present percentiles of EHR‐documented heart rate (HR) and respiratory rate (RR) developed using data from more than 7000 children hospitalized at an academic children's hospital. In a separate validation dataset, they then compared the performance of their proposed physiologic monitor alarm parametersthe 5th and 95th percentiles for HR and RR from this studyto the 2004 National Institutes of Health (NIH) vital sign reference ranges[8] that were the basis of default alarm parameters at their hospital. They also compared their percentiles to the 2013 study.[7]
The 2 main findings of Goel and colleagues' study were: (1) using their separate validation dataset, 55.6% fewer HR and RR observations were out of range based on their newly developed percentiles as compared to the NIH vital sign reference ranges; and (2) the HR and RR percentiles they developed were very similar to those reported in the 2013 study,[7] which used data from 2 other institutions, externally validating their findings.
The team then pushed the data a step further in a safety analysis and evaluated the sensitivity of the 5th and 95th percentiles for HR and RR from this study for detecting deterioration in 148 patients in the 12 hours before either a rapid response team activation or a cardiorespiratory arrest. The overall sensitivity for having either a HR or RR value out of range was 93% for Goel and colleagues' percentiles and 97% for the NIH ranges. Goel and colleagues concluded that using the 5th and 95th HR and RR percentiles provides a potentially safe means by which to modify physiologic bedside monitor alarm limits.
There are 2 important limitations to this work. The first is that the study uses EHR‐documented data to estimate the performance of new physiologic monitor settings. Although there are few published reports of differences between nurse‐charted vital signs and monitor data, those that do exist suggest that nurse charting favors more stable vital signs,[9, 10] even when charting oxygen saturation in patients with true, prolonged desaturation.[9] We agree with the authors of 1 report, who speculated that nurses recognize that temporary changes in vital signs are untypical for that patient and might choose to ignore them and either await a period of stability or make an educated estimate for that hour.[9] When using Goel and colleagues' 5th and 95th percentiles as alarm parameters, the expected scenario is that monitors will generate alarms for 10% of HR values and 10% of RR values. Because of the differences between nurse‐charted vital signs and monitor data, the monitors will probably generate many more alarms.
The second limitation is the approach Goel and colleagues took in performing a safety analysis using chart review. Unfortunately, it is nearly impossible for a retrospective chart review to form the basis of a convincing scientific argument for the safety of different alarm parameters. It requires balancing the complex and sometimes competing nurse‐level, patient‐level, and alarm‐level factors that determine nurse response time to alarms. It is possible to do prospectively, and we hope Goel's team will follow up this article with a description of the implementation and safety of these parameters in clinical practice.
In addition, the clinical implications of HR and RR at the 95th percentile might be considered less immediately life threatening than HR and RR at the 5th percentile, even though statistically they are equally abnormal. When choosing percentile‐based alarm parameters, statistical symmetry might be less important than the potential immediate consequences of missing bradycardia or bradypnea. It would be reasonable to consider setting high HR and RR at the 99th percentile or higher, because elevated HR or RR alone is rarely immediately actionable, and set the low HR and RR at the 5th or 10th percentile.
Despite these caveats, should the percentiles proposed by Goel and colleagues be used to inform pediatric vital sign clinical decision support throughout the world? When faced with the alternative of using vital sign parameters that are not based on data from hospitalized children, these percentiles offer a clear advantage, especially for hospitals similar to Goel's. The most obvious immediate use for these percentiles is to improve noninterruptive[11] vital sign clinical decision support in the EHR, the actual source of the data in this study.
The question of whether to implement Goel's 5th and 95th percentiles as physiologic monitor alarm parameters is more complex. In contrast to EHR decision support, there are much clearer downstream consequences of sounding unnecessary alarms as well as failing to sound important alarms for a child in extremis. Because their percentiles are not based on monitor data, the projected number of alarms generated at different percentile thresholds cannot be accurately estimated, although using their 5th and 95th percentiles should result in fewer alarms than the NIH parameters.
In conclusion, the work by Goel and colleagues represents an important contribution to knowledge about the ranges of expected vital signs in hospitalized children. Their findings can be immediately used to guide EHR decision support. Their percentiles are also relevant to physiologic monitor alarm parameters, although the performance and safety of using the 5th and 95th percentiles remain in question. Hospitals aiming to implement these data‐driven parameters should first evaluate the performance of different percentiles from this article using data obtained from their own monitor system and, if proceeding with clinical implementation, pilot the parameters to accurately gauge alarm rates and assess safety before spreading hospital wide.
Disclosures
Dr. Bonafide is supported by a Mentored Patient‐Oriented Research Career Development Award from the National Heart, Lung, and Blood Institute of the National Institutes of Health under award number K23HL116427. Dr. Brady is supported by a Patient‐Centered Outcomes Research Mentored Clinical Investigator Award from the Agency for Healthcare Research and Quality under award number K08HS023827. The content is solely the responsibility of the authors and does not necessarily represent the official views of the funding organizations. The funding organizations had no role in the design, preparation, review, or approval of this article; nor the decision to submit the article for publication. The authors have no financial relationships relevant to this article or conflicts of interest to disclose.
- , , , et al. Safety analysis of proposed data‐driven physiologic alarm parameters for hospitalized children. J Hosp Med. 2016;11(12):817–823.
- , , , et al. Association between exposure to nonactionable physiologic monitor alarms and response time in a children's hospital. J Hosp Med. 2015;10(6):345–351.
- . Crying wolf: false alarms in a pediatric intensive care unit. Crit Care Med. 1994;22(6):981–985.
- , , , , . What are we missing? Arrhythmia detection in the pediatric intensive care unit. J Pediatr. 2013;163(2):511–514.
- , , , et al. Cardiopulmonary monitors and clinically significant events in critically ill children. Biomed Instrum Technol. 2011;(suppl):38–45.
- , . Poor prognosis for existing monitors in the intensive care unit. Crit Care Med. 1997;25(4):614–619.
- , , , , , . Development of heart and respiratory rate percentile curves for hospitalized children. Pediatrics. 2013;131:e1150–e1157.
- NIH Clinical Center. Pediatric services: age‐appropriate vital signs. Available at: https://web.archive.org/web/20041101222327/http://www.cc. nih.gov/ccc/pedweb/pedsstaff/age.html. Published November 1, 2004. Accessed June 9, 2016.
- , , , , . A comparison of oxygen saturation data in inpatients with low oxygen saturation using automated continuous monitoring and intermittent manual data charting. Anesth Analg. 2014;118(2):326–331.
- , , , . Comparison of nurse and computer charting of physiological variables in an intensive care unit. Int J Clin Monit Comput. 1996;13(4):235–241.
- , , , et al. Drug‐drug interactions that should be non‐interruptive in order to reduce alert fatigue in electronic health records. J Am Med Inform Assoc. 2013;20(3):489–493.
Deciding when a hospitalized child's vital signs are acceptably within range and when they should generate alerts, alarms, and escalations of care is critically important yet surprisingly complicated. Many patients in the hospital who are recovering appropriately exhibit vital signs that fall outside normal ranges for well children. In a technology‐focused hospital environment, these out‐of‐range vital signs often generate alerts in the electronic health record (EHR) and alarms on physiologic monitors that can disrupt patients' sleep, generate concern in parents, lead to unnecessary testing and treatment by physicians, interrupt nurses during important patient care tasks, and lead to alarm fatigue. It is this last area, the problem of alarm fatigue, that Goel and colleagues[1] have used to frame the rationale and results of their study reported in this issue of the Journal of Hospital Medicine.
Goel and colleagues correctly point out that physiologic monitor alarm rates are high in children's hospitals, and alarms warranting intervention or action are rare.[2, 3, 4, 5, 6] Few studies have rigorously examined interventions to reduce unnecessary hospital physiologic monitor alarms, especially in pediatric settings. Of all the potential interventions, widening parameters has the most face validity: if you set wide enough alarm parameters, fewer alarms will be triggered. However, it comes with a potential safety tradeoff of missed actionable alarms.
Before EHR data became widely available for research, normal (or perhaps more appropriate for the hospital setting, expected) vital sign ranges were defined using expert opinion. The first publication describing the distribution of EHR‐documented vital signs in hospitalized children was published in 2013.[7] Goel and colleagues have built upon this prior work in their article, in which they present percentiles of EHR‐documented heart rate (HR) and respiratory rate (RR) developed using data from more than 7000 children hospitalized at an academic children's hospital. In a separate validation dataset, they then compared the performance of their proposed physiologic monitor alarm parametersthe 5th and 95th percentiles for HR and RR from this studyto the 2004 National Institutes of Health (NIH) vital sign reference ranges[8] that were the basis of default alarm parameters at their hospital. They also compared their percentiles to the 2013 study.[7]
The 2 main findings of Goel and colleagues' study were: (1) using their separate validation dataset, 55.6% fewer HR and RR observations were out of range based on their newly developed percentiles as compared to the NIH vital sign reference ranges; and (2) the HR and RR percentiles they developed were very similar to those reported in the 2013 study,[7] which used data from 2 other institutions, externally validating their findings.
The team then pushed the data a step further in a safety analysis and evaluated the sensitivity of the 5th and 95th percentiles for HR and RR from this study for detecting deterioration in 148 patients in the 12 hours before either a rapid response team activation or a cardiorespiratory arrest. The overall sensitivity for having either a HR or RR value out of range was 93% for Goel and colleagues' percentiles and 97% for the NIH ranges. Goel and colleagues concluded that using the 5th and 95th HR and RR percentiles provides a potentially safe means by which to modify physiologic bedside monitor alarm limits.
There are 2 important limitations to this work. The first is that the study uses EHR‐documented data to estimate the performance of new physiologic monitor settings. Although there are few published reports of differences between nurse‐charted vital signs and monitor data, those that do exist suggest that nurse charting favors more stable vital signs,[9, 10] even when charting oxygen saturation in patients with true, prolonged desaturation.[9] We agree with the authors of 1 report, who speculated that nurses recognize that temporary changes in vital signs are untypical for that patient and might choose to ignore them and either await a period of stability or make an educated estimate for that hour.[9] When using Goel and colleagues' 5th and 95th percentiles as alarm parameters, the expected scenario is that monitors will generate alarms for 10% of HR values and 10% of RR values. Because of the differences between nurse‐charted vital signs and monitor data, the monitors will probably generate many more alarms.
The second limitation is the approach Goel and colleagues took in performing a safety analysis using chart review. Unfortunately, it is nearly impossible for a retrospective chart review to form the basis of a convincing scientific argument for the safety of different alarm parameters. It requires balancing the complex and sometimes competing nurse‐level, patient‐level, and alarm‐level factors that determine nurse response time to alarms. It is possible to do prospectively, and we hope Goel's team will follow up this article with a description of the implementation and safety of these parameters in clinical practice.
In addition, the clinical implications of HR and RR at the 95th percentile might be considered less immediately life threatening than HR and RR at the 5th percentile, even though statistically they are equally abnormal. When choosing percentile‐based alarm parameters, statistical symmetry might be less important than the potential immediate consequences of missing bradycardia or bradypnea. It would be reasonable to consider setting high HR and RR at the 99th percentile or higher, because elevated HR or RR alone is rarely immediately actionable, and set the low HR and RR at the 5th or 10th percentile.
Despite these caveats, should the percentiles proposed by Goel and colleagues be used to inform pediatric vital sign clinical decision support throughout the world? When faced with the alternative of using vital sign parameters that are not based on data from hospitalized children, these percentiles offer a clear advantage, especially for hospitals similar to Goel's. The most obvious immediate use for these percentiles is to improve noninterruptive[11] vital sign clinical decision support in the EHR, the actual source of the data in this study.
The question of whether to implement Goel's 5th and 95th percentiles as physiologic monitor alarm parameters is more complex. In contrast to EHR decision support, there are much clearer downstream consequences of sounding unnecessary alarms as well as failing to sound important alarms for a child in extremis. Because their percentiles are not based on monitor data, the projected number of alarms generated at different percentile thresholds cannot be accurately estimated, although using their 5th and 95th percentiles should result in fewer alarms than the NIH parameters.
In conclusion, the work by Goel and colleagues represents an important contribution to knowledge about the ranges of expected vital signs in hospitalized children. Their findings can be immediately used to guide EHR decision support. Their percentiles are also relevant to physiologic monitor alarm parameters, although the performance and safety of using the 5th and 95th percentiles remain in question. Hospitals aiming to implement these data‐driven parameters should first evaluate the performance of different percentiles from this article using data obtained from their own monitor system and, if proceeding with clinical implementation, pilot the parameters to accurately gauge alarm rates and assess safety before spreading hospital wide.
Disclosures
Dr. Bonafide is supported by a Mentored Patient‐Oriented Research Career Development Award from the National Heart, Lung, and Blood Institute of the National Institutes of Health under award number K23HL116427. Dr. Brady is supported by a Patient‐Centered Outcomes Research Mentored Clinical Investigator Award from the Agency for Healthcare Research and Quality under award number K08HS023827. The content is solely the responsibility of the authors and does not necessarily represent the official views of the funding organizations. The funding organizations had no role in the design, preparation, review, or approval of this article; nor the decision to submit the article for publication. The authors have no financial relationships relevant to this article or conflicts of interest to disclose.
- , , , et al. Safety analysis of proposed data‐driven physiologic alarm parameters for hospitalized children. J Hosp Med. 2016;11(12):817–823.
- , , , et al. Association between exposure to nonactionable physiologic monitor alarms and response time in a children's hospital. J Hosp Med. 2015;10(6):345–351.
- . Crying wolf: false alarms in a pediatric intensive care unit. Crit Care Med. 1994;22(6):981–985.
- , , , , . What are we missing? Arrhythmia detection in the pediatric intensive care unit. J Pediatr. 2013;163(2):511–514.
- , , , et al. Cardiopulmonary monitors and clinically significant events in critically ill children. Biomed Instrum Technol. 2011;(suppl):38–45.
- , . Poor prognosis for existing monitors in the intensive care unit. Crit Care Med. 1997;25(4):614–619.
- , , , , , . Development of heart and respiratory rate percentile curves for hospitalized children. Pediatrics. 2013;131:e1150–e1157.
- NIH Clinical Center. Pediatric services: age‐appropriate vital signs. Available at: https://web.archive.org/web/20041101222327/http://www.cc. nih.gov/ccc/pedweb/pedsstaff/age.html. Published November 1, 2004. Accessed June 9, 2016.
- , , , , . A comparison of oxygen saturation data in inpatients with low oxygen saturation using automated continuous monitoring and intermittent manual data charting. Anesth Analg. 2014;118(2):326–331.
- , , , . Comparison of nurse and computer charting of physiological variables in an intensive care unit. Int J Clin Monit Comput. 1996;13(4):235–241.
- , , , et al. Drug‐drug interactions that should be non‐interruptive in order to reduce alert fatigue in electronic health records. J Am Med Inform Assoc. 2013;20(3):489–493.
Monitor Alarms in a Children's Hospital
Physiologic monitor alarms are an inescapable part of the soundtrack for hospitals. Data from primarily adult hospitals have shown that alarms occur at high rates, and most alarms are not actionable.[1] Small studies have suggested that high alarm rates can lead to alarm fatigue.[2, 3] To prioritize alarm types to target in future intervention studies, in this study we aimed to investigate the alarm rates on all inpatient units and the most common causes of alarms at a children's hospital.
METHODS
This was a cross‐sectional study of audible physiologic monitor alarms at Cincinnati Children's Hospital Medical Center (CCHMC) over 7 consecutive days during August 2014. CCHMC is a 522‐bed free‐standing children's hospital. Inpatient beds are equipped with GE Healthcare (Little Chalfont, United Kingdom) bedside monitors (models Dash 3000, 4000, and 5000, and Solar 8000). Age‐specific vital sign parameters were employed for monitors on all units.
We obtained date, time, and type of alarm from bedside physiologic monitors using Connexall middleware (GlobeStar Systems, Toronto, Ontario, Canada).
We determined unit census using the electronic health records for the time period concurrent with the alarm data collection. Given previously described variation in hospital census over the day,[4] we used 4 daily census measurements (6:00 am, 12:00 pm, 6:00 pm, and 11:00 pm) rather than 1 single measurement to more accurately reflect the hospital census.
The CCHMC Institutional Review Board determined this work to be not human subjects research.
Statistical Analysis
For each unit and each census time interval, we generated a rate based on the number of occupied beds (alarms per patient‐day) resulting in a total of 28 rates (4 census measurement periods per/day 7 days) for each unit over the study period. We used descriptive statistics to summarize alarms per patient‐day by unit. Analysis of variance was used to compare alarm rates between units. For significant main effects, we used Tukey's multiple comparisons tests for all pairwise comparisons to control the type I experiment‐wise error rate. Alarms were then classified by alarm cause (eg, high heart rate). We summarized the cause for all alarms using counts and percentages.
RESULTS
There were a total of 220,813 audible alarms over 1 week. Median alarm rate per patient‐day by unit ranged from 30.4 to 228.5; the highest alarm rates occurred in the cardiac intensive care unit, with a median of 228.5 (interquartile range [IQR], 193275) followed by the pediatric intensive care unit (172.4; IQR, 141188) (Figure 1). The average alarm rate was significantly different among the units (P < 0.01).
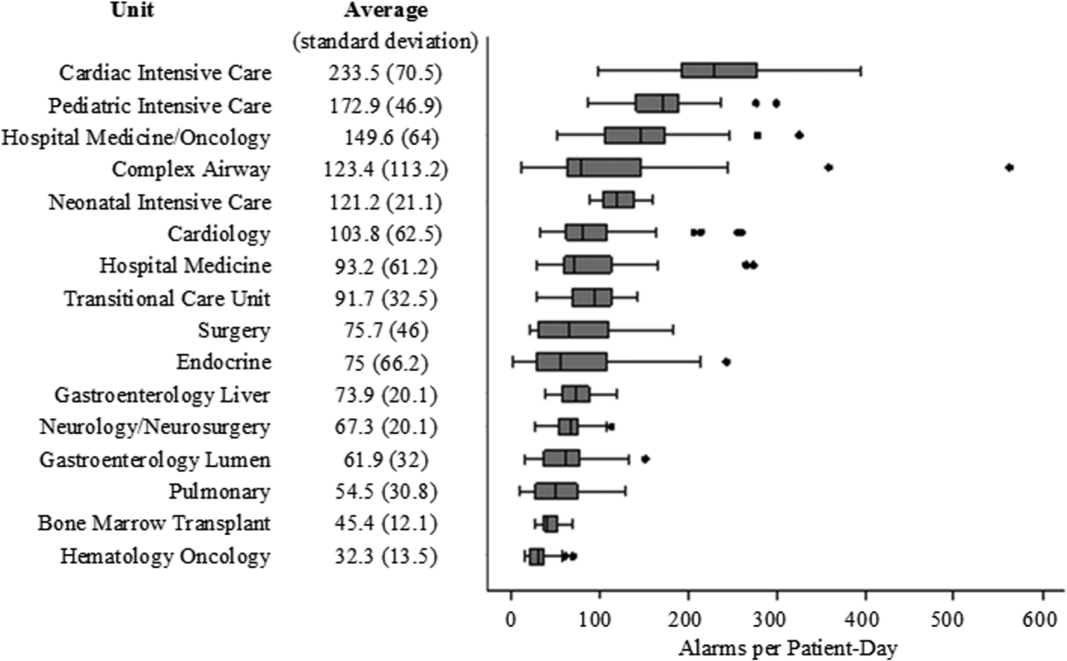
Technical alarms (eg, alarms for artifact, lead failure), comprised 33% of the total number of alarms. The remaining 67% of alarms were for clinical conditions, the most common of which was low oxygen saturation (30% of clinical alarms) (Figure 2).
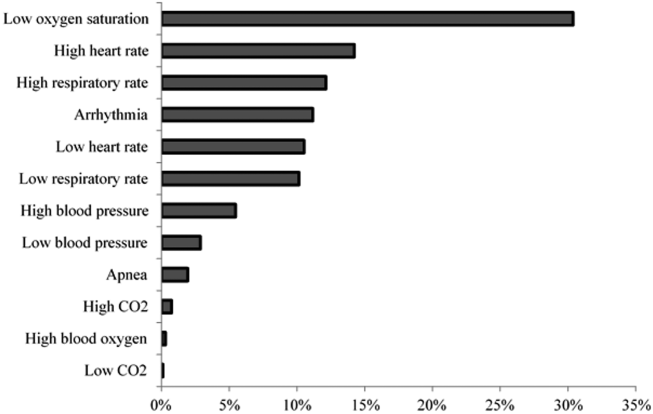
DISCUSSION
We described alarm rates and causes over multiple units at a large children's hospital. To our knowledge, this is the first description of alarm rates across multiple pediatric inpatient units. Alarm counts were high even for the general units, indicating that a nurse taking care of 4 monitored patients would need to process a physiologic monitor alarm every 4 minutes on average, in addition to other sources of alarms such as infusion pumps.
Alarm rates were highest in the intensive care unit areas, which may be attributable to both higher rates of monitoring and sicker patients. Importantly, however, alarms were quite high and variable on the acute care units. This suggests that factors other than patient acuity may have substantial influence on alarm rates.
Technical alarms, alarms that do not indicate a change in patient condition, accounted for the largest percentage of alarms during the study period. This is consistent with prior literature that has suggested that regular electrode replacement, which decreases technical alarms, can be effective in reducing alarm rates.[5, 6] The most common vital sign change to cause alarms was low oxygen saturation, followed by elevated heart rate and elevated respiratory rate. Whereas in most healthy patients, certain low oxygen levels would prompt initiation of supplemental oxygen, there are many conditions in which elevated heart rate and respiratory rate may not require titration of any particular therapy. These may be potential intervention targets for hospitals trying to improve alarm rates.
Limitations
There are several limitations to our study. First, our results are not necessarily generalizable to other types of hospitals or those utilizing monitors from other vendors. Second, we were unable to include other sources of alarms such as infusion pumps and ventilators. However, given the high alarm rates from physiologic monitors alone, these data add urgency to the need for further investigation in the pediatric setting.
CONCLUSION
Alarm rates at a single children's hospital varied depending on the unit. Strategies targeted at reducing technical alarms and reducing nonactionable clinical alarms for low oxygen saturation, high heart rate, and high respiratory rate may offer the greatest opportunity to reduce alarm rates.
Acknowledgements
The authors acknowledge Melinda Egan for her assistance in obtaining data for this study and Ting Sa for her assistance with data management.
Disclosures: Dr. Bonafide is supported by the National Heart, Lung, and Blood Institute of the National Institutes of Health under award number K23HL116427. Dr. Bonafide also holds a Young Investigator Award grant from the Academic Pediatric Association evaluating the impact of a data‐driven monitor alarm reduction strategy implemented in safety huddles. Dr. Brady is supported by the Agency for Healthcare Research and Quality under award number K08HS23827. The content is solely the responsibility of the authors and does not necessarily represent the official views of the National Institutes of Health or the Agency for Healthcare Research and Quality. This study was funded by the Arnold W. Strauss Fellow Grant, Cincinnati Children's Hospital Medical Center. The authors have no conflicts of interest to disclose.
- , , , et al. Systematic review of physiologic monitor alarm characteristics and pragmatic interventions to reduce alarm frequency. J Hosp Med. 2016;11(2):136–144.
- , , , et al. Association between exposure to nonactionable physiologic monitor alarms and response time in a children's hospital. J Hosp Med. 2015;10(6):345–351.
- , , , et al. Pulse oximetry desaturation alarms on a general postoperative adult unit: a prospective observational study of nurse response time. Int J Nurs Stud. 2013;50(10):1351–1358.
- , , , , . Traditional measures of hospital utilization may not accurately reflect dynamic patient demand: findings from a children's hospital. Hosp Pediatr. 2012;2(1):10–18.
- , , , et al. A team‐based approach to reducing cardiac monitor alarms. Pediatrics. 2014;134(6):e1686–e1694.
- , , , . Daily electrode change and effect on cardiac monitor alarms: an evidence‐based practice approach. J Nurs Care Qual. 2013;28(3):265–271.
Physiologic monitor alarms are an inescapable part of the soundtrack for hospitals. Data from primarily adult hospitals have shown that alarms occur at high rates, and most alarms are not actionable.[1] Small studies have suggested that high alarm rates can lead to alarm fatigue.[2, 3] To prioritize alarm types to target in future intervention studies, in this study we aimed to investigate the alarm rates on all inpatient units and the most common causes of alarms at a children's hospital.
METHODS
This was a cross‐sectional study of audible physiologic monitor alarms at Cincinnati Children's Hospital Medical Center (CCHMC) over 7 consecutive days during August 2014. CCHMC is a 522‐bed free‐standing children's hospital. Inpatient beds are equipped with GE Healthcare (Little Chalfont, United Kingdom) bedside monitors (models Dash 3000, 4000, and 5000, and Solar 8000). Age‐specific vital sign parameters were employed for monitors on all units.
We obtained date, time, and type of alarm from bedside physiologic monitors using Connexall middleware (GlobeStar Systems, Toronto, Ontario, Canada).
We determined unit census using the electronic health records for the time period concurrent with the alarm data collection. Given previously described variation in hospital census over the day,[4] we used 4 daily census measurements (6:00 am, 12:00 pm, 6:00 pm, and 11:00 pm) rather than 1 single measurement to more accurately reflect the hospital census.
The CCHMC Institutional Review Board determined this work to be not human subjects research.
Statistical Analysis
For each unit and each census time interval, we generated a rate based on the number of occupied beds (alarms per patient‐day) resulting in a total of 28 rates (4 census measurement periods per/day 7 days) for each unit over the study period. We used descriptive statistics to summarize alarms per patient‐day by unit. Analysis of variance was used to compare alarm rates between units. For significant main effects, we used Tukey's multiple comparisons tests for all pairwise comparisons to control the type I experiment‐wise error rate. Alarms were then classified by alarm cause (eg, high heart rate). We summarized the cause for all alarms using counts and percentages.
RESULTS
There were a total of 220,813 audible alarms over 1 week. Median alarm rate per patient‐day by unit ranged from 30.4 to 228.5; the highest alarm rates occurred in the cardiac intensive care unit, with a median of 228.5 (interquartile range [IQR], 193275) followed by the pediatric intensive care unit (172.4; IQR, 141188) (Figure 1). The average alarm rate was significantly different among the units (P < 0.01).
Technical alarms (eg, alarms for artifact, lead failure), comprised 33% of the total number of alarms. The remaining 67% of alarms were for clinical conditions, the most common of which was low oxygen saturation (30% of clinical alarms) (Figure 2).
DISCUSSION
We described alarm rates and causes over multiple units at a large children's hospital. To our knowledge, this is the first description of alarm rates across multiple pediatric inpatient units. Alarm counts were high even for the general units, indicating that a nurse taking care of 4 monitored patients would need to process a physiologic monitor alarm every 4 minutes on average, in addition to other sources of alarms such as infusion pumps.
Alarm rates were highest in the intensive care unit areas, which may be attributable to both higher rates of monitoring and sicker patients. Importantly, however, alarms were quite high and variable on the acute care units. This suggests that factors other than patient acuity may have substantial influence on alarm rates.
Technical alarms, alarms that do not indicate a change in patient condition, accounted for the largest percentage of alarms during the study period. This is consistent with prior literature that has suggested that regular electrode replacement, which decreases technical alarms, can be effective in reducing alarm rates.[5, 6] The most common vital sign change to cause alarms was low oxygen saturation, followed by elevated heart rate and elevated respiratory rate. Whereas in most healthy patients, certain low oxygen levels would prompt initiation of supplemental oxygen, there are many conditions in which elevated heart rate and respiratory rate may not require titration of any particular therapy. These may be potential intervention targets for hospitals trying to improve alarm rates.
Limitations
There are several limitations to our study. First, our results are not necessarily generalizable to other types of hospitals or those utilizing monitors from other vendors. Second, we were unable to include other sources of alarms such as infusion pumps and ventilators. However, given the high alarm rates from physiologic monitors alone, these data add urgency to the need for further investigation in the pediatric setting.
CONCLUSION
Alarm rates at a single children's hospital varied depending on the unit. Strategies targeted at reducing technical alarms and reducing nonactionable clinical alarms for low oxygen saturation, high heart rate, and high respiratory rate may offer the greatest opportunity to reduce alarm rates.
Acknowledgements
The authors acknowledge Melinda Egan for her assistance in obtaining data for this study and Ting Sa for her assistance with data management.
Disclosures: Dr. Bonafide is supported by the National Heart, Lung, and Blood Institute of the National Institutes of Health under award number K23HL116427. Dr. Bonafide also holds a Young Investigator Award grant from the Academic Pediatric Association evaluating the impact of a data‐driven monitor alarm reduction strategy implemented in safety huddles. Dr. Brady is supported by the Agency for Healthcare Research and Quality under award number K08HS23827. The content is solely the responsibility of the authors and does not necessarily represent the official views of the National Institutes of Health or the Agency for Healthcare Research and Quality. This study was funded by the Arnold W. Strauss Fellow Grant, Cincinnati Children's Hospital Medical Center. The authors have no conflicts of interest to disclose.
- , , , et al. Systematic review of physiologic monitor alarm characteristics and pragmatic interventions to reduce alarm frequency. J Hosp Med. 2016;11(2):136–144.
- , , , et al. Association between exposure to nonactionable physiologic monitor alarms and response time in a children's hospital. J Hosp Med. 2015;10(6):345–351.
- , , , et al. Pulse oximetry desaturation alarms on a general postoperative adult unit: a prospective observational study of nurse response time. Int J Nurs Stud. 2013;50(10):1351–1358.
- , , , , . Traditional measures of hospital utilization may not accurately reflect dynamic patient demand: findings from a children's hospital. Hosp Pediatr. 2012;2(1):10–18.
- , , , et al. A team‐based approach to reducing cardiac monitor alarms. Pediatrics. 2014;134(6):e1686–e1694.
- , , , . Daily electrode change and effect on cardiac monitor alarms: an evidence‐based practice approach. J Nurs Care Qual. 2013;28(3):265–271.

Review of Physiologic Monitor Alarms
Clinical alarm safety has become a recent target for improvement in many hospitals. In 2013, The Joint Commission released a National Patient Safety Goal prompting accredited hospitals to establish alarm safety as a hospital priority, identify the most important alarm signals to manage, and, by 2016, develop policies and procedures that address alarm management.[1] In addition, the Emergency Care Research Institute has named alarm hazards the top health technology hazard each year since 2012.[2]
The primary arguments supporting the elevation of alarm management to a national hospital priority in the United States include the following: (1) clinicians rely on alarms to notify them of important physiologic changes, (2) alarms occur frequently and usually do not warrant clinical intervention, and (3) alarm overload renders clinicians unable to respond to all alarms, resulting in alarm fatigue: responding more slowly or ignoring alarms that may represent actual clinical deterioration.[3, 4] These arguments are built largely on anecdotal data, reported safety event databases, and small studies that have not previously been systematically analyzed.
Despite the national focus on alarms, we still know very little about fundamental questions key to improving alarm safety. In this systematic review, we aimed to answer 3 key questions about physiologic monitor alarms: (1) What proportion of alarms warrant attention or clinical intervention (ie, actionable alarms), and how does this proportion vary between adult and pediatric populations and between intensive care unit (ICU) and ward settings? (2) What is the relationship between alarm exposure and clinician response time? (3) What interventions are effective in reducing the frequency of alarms?
We limited our scope to monitor alarms because few studies have evaluated the characteristics of alarms from other medical devices, and because missing relevant monitor alarms could adversely impact patient safety.
METHODS
We performed a systematic review of the literature in accordance with the Meta‐Analysis of Observational Studies in Epidemiology guidelines[5] and developed this manuscript using the Preferred Reporting Items for Systematic Reviews and Meta‐Analyses (PRISMA) statement.[6]
Eligibility Criteria
With help from an experienced biomedical librarian (C.D.S.), we searched PubMed, the Cumulative Index to Nursing and Allied Health Literature, Scopus, Cochrane Library,
We included peer‐reviewed, original research studies published in English, Spanish, or French that addressed the questions outlined above. Eligible patient populations were children and adults admitted to hospital inpatient units and emergency departments (EDs). We excluded alarms in procedural suites or operating rooms (typically responded to by anesthesiologists already with the patient) because of the differences in environment of care, staff‐to‐patient ratio, and equipment. We included observational studies reporting the actionability of physiologic monitor alarms (ie, alarms warranting special attention or clinical intervention), as well as nurse responses to these alarms. We excluded studies focused on the effects of alarms unrelated to patient safety, such as families' and patients' stress, noise, or sleep disturbance. We included only intervention studies evaluating pragmatic interventions ready for clinical implementation (ie, not experimental devices or software algorithms).
Selection Process and Data Extraction
First, 2 authors screened the titles and abstracts of articles for eligibility. To maximize sensitivity, if at least 1 author considered the article relevant, the article proceeded to full‐text review. Second, the full texts of articles screened were independently reviewed by 2 authors in an unblinded fashion to determine their eligibility. Any disagreements concerning eligibility were resolved by team consensus. To assure consistency in eligibility determinations across the team, a core group of the authors (C.W.P, C.P.B., E.E., and V.V.G.) held a series of meetings to review and discuss each potentially eligible article and reach consensus on the final list of included articles. Two authors independently extracted the following characteristics from included studies: alarm review methods, analytic design, fidelity measurement, consideration of unintended adverse safety consequences, and key results. Reviewers were not blinded to journal, authors, or affiliations.
Synthesis of Results and Risk Assessment
Given the high degree of heterogeneity in methodology, we were unable to generate summary proportions of the observational studies or perform a meta‐analysis of the intervention studies. Thus, we organized the studies into clinically relevant categories and presented key aspects in tables. Due to the heterogeneity of the studies and the controversy surrounding quality scores,[5] we did not generate summary scores of study quality. Instead, we evaluated and reported key design elements that had the potential to bias the results. To recognize the more comprehensive studies in the field, we developed by consensus a set of characteristics that distinguished studies with lower risk of bias. These characteristics are shown and defined in Table 1.
| First Author and Publication Year | Alarm Review Method | Indicators of Potential Bias for Observational Studies | Indicators of Potential Bias for Intervention Studies | |||||||||||||
|---|---|---|---|---|---|---|---|---|---|---|---|---|---|---|---|---|
| Monitor System | Direct Observation | Medical Record Review | Rhythm Annotation | Video Observation | Remote Monitoring Staff | Medical Device Industry Involved | Two Independent Reviewers | At Least 1 Reviewer Is a Clinical Expert | Reviewer Not Simultaneously in Patient Care | Clear Definition of Alarm Actionability | Census Included | Statistical Testing or QI SPC Methods | Fidelity Assessed | Safety Assessed | Lower Risk of Bias | |
| ||||||||||||||||
| Adult Observational | ||||||||||||||||
| Atzema 2006[7] | ✓* | ✓ | ✓ | |||||||||||||
| Billinghurst 2003[8] | ✓ | ✓ | ✓ | ✓ | ||||||||||||
| Biot 2000[9] | ✓ | ✓ | ✓ | ✓ | ||||||||||||
| Chambrin 1999[10] | ✓ | ✓ | ✓ | ✓ | ||||||||||||
| Drew 2014[11] | ✓ | ✓ | ✓ | ✓ | ✓ | ✓ | ✓ | ✓ | ||||||||
| Gazarian 2014[12] | ✓ | ✓ | ✓ | ✓ | ✓ | |||||||||||
| Grges 2009[13] | ✓ | ✓ | ✓ | ✓ | ||||||||||||
| Gross 2011[15] | ✓ | ✓ | ✓ | ✓ | ✓ | ✓ | ✓ | |||||||||
| Inokuchi 2013[14] | ✓ | ✓ | ✓ | ✓ | ✓ | ✓ | ✓ | |||||||||
| Koski 1990[16] | ✓ | ✓ | ✓ | ✓ | ||||||||||||
| Morales Snchez 2014[17] | ✓ | ✓ | ✓ | ✓ | ||||||||||||
| Pergher 2014[18] | ✓ | ✓ | ||||||||||||||
| Siebig 2010[19] | ✓ | ✓ | ✓ | ✓ | ✓ | ✓ | ||||||||||
| Voepel‐Lewis 2013[20] | ✓ | ✓ | ✓ | ✓ | ||||||||||||
| Way 2014[21] | ✓ | ✓ | ✓ | |||||||||||||
| Pediatric Observational | ||||||||||||||||
| Bonafide 2015[22] | ✓ | ✓ | ✓ | ✓ | ✓ | ✓ | ✓ | |||||||||
| Lawless 1994[23] | ✓ | ✓ | ||||||||||||||
| Rosman 2013[24] | ✓ | ✓ | ✓ | ✓ | ✓ | |||||||||||
| Talley 2011[25] | ✓ | ✓ | ✓ | ✓ | ✓ | |||||||||||
| Tsien 1997[26] | ✓ | ✓ | ✓ | ✓ | ||||||||||||
| van Pul 2015[27] | ✓ | |||||||||||||||
| Varpio 2012[28] | ✓ | ✓ | ✓ | ✓ | ||||||||||||
| Mixed Adult and Pediatric Observational | ||||||||||||||||
| O'Carroll 1986[29] | ✓ | |||||||||||||||
| Wiklund 1994[30] | ✓ | ✓ | ✓ | ✓ | ||||||||||||
| Adult Intervention | ||||||||||||||||
| Albert 2015[32] | ✓ | ✓ | ✓ | ✓ | ✓ | ✓ | ✓ | |||||||||
| Cvach 2013[33] | ✓ | ✓ | ||||||||||||||
| Cvach 2014[34] | ✓ | ✓ | ||||||||||||||
| Graham 2010[35] | ✓ | |||||||||||||||
| Rheineck‐Leyssius 1997[36] | ✓ | ✓ | ✓ | ✓ | ✓ | ✓ | ||||||||||
| Taenzer 2010[31] | ✓ | ✓ | ✓ | ✓ | ✓ | ✓ | ||||||||||
| Whalen 2014[37] | ✓ | ✓ | ✓ | |||||||||||||
| Pediatric Intervention | ||||||||||||||||
| Dandoy 2014[38] | ✓ | ✓ | ✓ | ✓ | ✓ | ✓ | ||||||||||
For the purposes of this review, we defined nonactionable alarms as including both invalid (false) alarms that do not that accurately represent the physiologic status of the patient and alarms that are valid but do not warrant special attention or clinical intervention (nuisance alarms). We did not separate out invalid alarms due to the tremendous variation between studies in how validity was measured.
RESULTS
Study Selection
Search results produced 4629 articles (see the flow diagram in the Supporting Information in the online version of this article), of which 32 articles were eligible: 24 observational studies describing alarm characteristics and 8 studies describing interventions to reduce alarm frequency.
Observational Study Characteristics
Characteristics of included studies are shown in Table 1. Of the 24 observational studies,[7, 8, 9, 10, 11, 12, 13, 14, 15, 16, 17, 18, 19, 20, 21, 22, 23, 24, 25, 26, 27, 28, 29, 30] 15 included adult patients,[7, 8, 9, 10, 11, 12, 13, 14, 15, 16, 17, 18, 19, 20, 21] 7 included pediatric patients,[22, 23, 24, 25, 26, 27, 28] and 2 included both adult and pediatric patients.[29, 30] All were single‐hospital studies, except for 1 study by Chambrin and colleagues[10] that included 5 sites. The number of patient‐hours examined in each study ranged from 60 to 113,880.[7, 8, 9, 10, 11, 13, 14, 15, 16, 18, 19, 20, 21, 22, 23, 24, 25, 26, 27, 29, 30] Hospital settings included ICUs (n = 16),[9, 10, 11, 13, 14, 16, 17, 18, 19, 22, 23, 24, 25, 26, 27, 29] general wards (n = 5),[12, 15, 20, 22, 28] EDs (n = 2),[7, 21] postanesthesia care unit (PACU) (n = 1),[30] and cardiac care unit (CCU) (n = 1).[8] Studies varied in the type of physiologic signals recorded and data collection methods, ranging from direct observation by a nurse who was simultaneously caring for patients[29] to video recording with expert review.[14, 19, 22] Four observational studies met the criteria for lower risk of bias.[11, 14, 15, 22]
Intervention Study Characteristics
Of the 8 intervention studies, 7 included adult patients,[31, 32, 33, 34, 35, 36, 37] and 1 included pediatric patients.[38] All were single‐hospital studies; 6 were quasi‐experimental[31, 33, 34, 35, 37, 38] and 2 were experimental.[32, 36] Settings included progressive care units (n = 3),[33, 34, 35] CCUs (n = 3),[32, 33, 37] wards (n = 2),[31, 38] PACU (n = 1),[36] and a step‐down unit (n = 1).[32] All except 1 study[32] used the monitoring system to record alarm data. Several studies evaluated multicomponent interventions that included combinations of the following: widening alarm parameters,[31, 35, 36, 37, 38] instituting alarm delays,[31, 34, 36, 38] reconfiguring alarm acuity,[35, 37] use of secondary notifications,[34] daily change of electrocardiographic electrodes or use of disposable electrocardiographic wires,[32, 33, 38] universal monitoring in high‐risk populations,[31] and timely discontinuation of monitoring in low‐risk populations.[38] Four intervention studies met our prespecified lower risk of bias criteria.[31, 32, 36, 38]
Proportion of Alarms Considered Actionable
Results of the observational studies are provided in Table 2. The proportion of alarms that were actionable was <1% to 26% in adult ICU settings,[9, 10, 11, 13, 14, 16, 17, 19] 20% to 36% in adult ward settings,[12, 15, 20] 17% in a mixed adult and pediatric PACU setting,[30] 3% to 13% in pediatric ICU settings,[22, 23, 24, 25, 26] and 1% in a pediatric ward setting.[22]
| Signals Included | ||||||||||
|---|---|---|---|---|---|---|---|---|---|---|
| First Author and Publication Year | Setting | Monitored Patient‐Hours | SpO2 | ECG Arrhythmia | ECG Parametersa | Blood Pressure | Total Alarms | Actionable Alarms | Alarm Response | Lower Risk of Bias |
| ||||||||||
| Adult | ||||||||||
| Atzema 2006[7] | ED | 371 | ✓ | 1,762 | 0.20% | |||||
| Billinghurst 2003[8] | CCU | 420 | ✓ | 751 | Not reported; 17% were valid | Nurses with higher acuity patients and smaller % of valid alarms had slower response rates | ||||
| Biot 2000[9] | ICU | 250 | ✓ | ✓ | ✓ | ✓ | 3,665 | 3% | ||
| Chambrin 1999[10] | ICU | 1,971 | ✓ | ✓ | ✓ | ✓ | 3,188 | 26% | ||
| Drew 2014[11] | ICU | 48,173 | ✓ | ✓ | ✓ | ✓ | 2,558,760 | 0.3% of 3,861 VT alarms | ✓ | |
| Gazarian 2014[12] | Ward | 54 nurse‐hours | ✓ | ✓ | ✓ | 205 | 22% | Response to 47% of alarms | ||
| Grges 2009[13] | ICU | 200 | ✓ | ✓ | ✓ | ✓ | 1,214 | 5% | ||
| Gross 2011[15] | Ward | 530 | ✓ | ✓ | ✓ | ✓ | 4,393 | 20% | ✓ | |
| Inokuchi 2013[14] | ICU | 2,697 | ✓ | ✓ | ✓ | ✓ | 11,591 | 6% | ✓ | |
| Koski 1990[16] | ICU | 400 | ✓ | ✓ | 2,322 | 12% | ||||
| Morales Snchez 2014[17] | ICU | 434 sessions | ✓ | ✓ | ✓ | 215 | 25% | Response to 93% of alarms, of which 50% were within 10 seconds | ||
| Pergher 2014[18] | ICU | 60 | ✓ | 76 | Not reported | 72% of alarms stopped before nurse response or had >10 minutes response time | ||||
| Siebig 2010[19] | ICU | 982 | ✓ | ✓ | ✓ | ✓ | 5,934 | 15% | ||
| Voepel‐Lewis 2013[20] | Ward | 1,616 | ✓ | 710 | 36% | Response time was longer for patients in highest quartile of total alarms | ||||
| Way 2014[21] | ED | 93 | ✓ | ✓ | ✓ | ✓ | 572 | Not reported; 75% were valid | Nurses responded to more alarms in resuscitation room vs acute care area, but response time was longer | |
| Pediatric | ||||||||||
| Bonafide 2015[22] | Ward + ICU | 210 | ✓ | ✓ | ✓ | ✓ | 5,070 | 13% PICU, 1% ward | Incremental increases in response time as number of nonactionable alarms in preceding 120 minutes increased | ✓ |
| Lawless 1994[23] | ICU | 928 | ✓ | ✓ | ✓ | 2,176 | 6% | |||
| Rosman 2013[24] | ICU | 8,232 | ✓ | ✓ | ✓ | ✓ | 54,656 | 4% of rhythm alarms true critical" | ||
| Talley 2011[25] | ICU | 1,470∥ | ✓ | ✓ | ✓ | ✓ | 2,245 | 3% | ||
| Tsien 1997[26] | ICU | 298 | ✓ | ✓ | ✓ | 2,942 | 8% | |||
| van Pul 2015[27] | ICU | 113,880∥ | ✓ | ✓ | ✓ | ✓ | 222,751 | Not reported | Assigned nurse did not respond to 6% of alarms within 45 seconds | |
| Varpio 2012[28] | Ward | 49 unit‐hours | ✓ | ✓ | ✓ | ✓ | 446 | Not reported | 70% of all alarms and 41% of crisis alarms were not responded to within 1 minute | |
| Both | ||||||||||
| O'Carroll 1986[29] | ICU | 2,258∥ | ✓ | 284 | 2% | |||||
| Wiklund 1994[30] | PACU | 207 | ✓ | ✓ | ✓ | 1,891 | 17% | |||
Relationship Between Alarm Exposure and Response Time
Whereas 9 studies addressed response time,[8, 12, 17, 18, 20, 21, 22, 27, 28] only 2 evaluated the relationship between alarm burden and nurse response time.[20, 22] Voepel‐Lewis and colleagues found that nurse responses were slower to patients with the highest quartile of alarms (57.6 seconds) compared to those with the lowest (45.4 seconds) or medium (42.3 seconds) quartiles of alarms on an adult ward (P = 0.046). They did not find an association between false alarm exposure and response time.[20] Bonafide and colleagues found incremental increases in response time as the number of nonactionable alarms in the preceding 120 minutes increased (P < 0.001 in the pediatric ICU, P = 0.009 on the pediatric ward).[22]
Interventions Effective in Reducing Alarms
Results of the 8 intervention studies are provided in Table 3. Three studies evaluated single interventions;[32, 33, 36] the remainder of the studies tested interventions with multiple components such that it was impossible to separate the effect of each component. Below, we have summarized study results, arranged by component. Because only 1 study focused on pediatric patients,[38] results from pediatric and adult settings are combined.
| First Author and Publication Year | Design | Setting | Main Intervention Components | Other/ Comments | Key Results | Results Statistically Significant? | Lower Risk of Bias | ||||
|---|---|---|---|---|---|---|---|---|---|---|---|
| Widen Default Settings | Alarm Delays | Reconfigure Alarm Acuity | Secondary Notification | ECG Changes | |||||||
| |||||||||||
| Adult | |||||||||||
| Albert 2015[32] | Experimental (cluster‐randomized) | CCU | ✓ | Disposable vs reusable wires | Disposable leads had 29% fewer no‐telemetry, leads‐fail, and leads‐off alarms and similar artifact alarms | ✓ | ✓ | ||||
| Cvach 2013[33] | Quasi‐experimental (before and after) | CCU and PCU | ✓ | Daily change of electrodes | 46% fewer alarms/bed/day | ||||||
| Cvach 2014[34] | Quasi‐experimental (ITS) | PCU | ✓* | ✓ | Slope of regression line suggests decrease of 0.75 alarms/bed/day | ||||||
| Graham 2010[35] | Quasi‐experimental (before and after) | PCU | ✓ | ✓ | 43% fewer crisis, warning, and system warning alarms on unit | ||||||
| Rheineck‐Leyssius 1997[36] | Experimental (RCT) | PACU | ✓ | ✓ | Alarm limit of 85% had fewer alarms/patient but higher incidence of true hypoxemia for >1 minute (6% vs 2%) | ✓ | ✓ | ||||
| Taenzer 2010[31] | Quasi‐experimental (before and after with concurrent controls) | Ward | ✓ | ✓ | Universal SpO2 monitoring | Rescue events decreased from 3.4 to 1.2 per 1,000 discharges; transfers to ICU decreased from 5.6 to 2.9 per 1,000 patient‐days, only 4 alarms/patient‐day | ✓ | ✓ | |||
| Whalen 2014[37] | Quasi‐experimental (before and after) | CCU | ✓ | ✓ | 89% fewer audible alarms on unit | ✓ | |||||
| Pediatric | |||||||||||
| Dandoy 2014[38] | Quasi‐experimental (ITS) | Ward | ✓ | ✓ | ✓ | Timely monitor discontinuation; daily change of ECG electrodes | Decrease in alarms/patient‐days from 180 to 40 | ✓ | |||
Widening alarm parameter default settings was evaluated in 5 studies:[31, 35, 36, 37, 38] 1 single intervention randomized controlled trial (RCT),[36] and 4 multiple‐intervention, quasi‐experimental studies.[31, 35, 37, 38] In the RCT, using a lower SpO2 limit of 85% instead of the standard 90% resulted in 61% fewer alarms. In the 4 multiple intervention studies, 1 study reported significant reductions in alarm rates (P < 0.001),[37] 1 study did not report preintervention alarm rates but reported a postintervention alarm rate of 4 alarms per patient‐day,[31] and 2 studies reported reductions in alarm rates but did not report any statistical testing.[35, 38] Of the 3 studies examining patient safety, 1 study with universal monitoring reported fewer rescue events and transfers to the ICU postimplementation,[31] 1 study reported no missed acute decompensations,[38] and 1 study (the RCT) reported significantly more true hypoxemia events (P = 0.001).[36]
Alarm delays were evaluated in 4 studies:[31, 34, 36, 38] 3 multiple‐intervention, quasi‐experimental studies[31, 34, 38] and 1 retrospective analysis of data from an RCT.[36] One study combined alarm delays with widening defaults in a universal monitoring strategy and reported a postintervention alarm rate of 4 alarms per patient.[31] Another study evaluated delays as part of a secondary notification pager system and found a negatively sloping regression line that suggested a decreasing alarm rate, but did not report statistical testing.[34] The third study reported a reduction in alarm rates but did not report statistical testing.[38] The RCT compared the impact of a hypothetical 15‐second alarm delay to that of a lower SpO2 limit reduction and reported a similar reduction in alarms.[36] Of the 4 studies examining patient safety, 1 study with universal monitoring reported improvements,[31] 2 studies reported no adverse outcomes,[35, 38] and the retrospective analysis of data from the RCT reported the theoretical adverse outcome of delayed detection of sudden, severe desaturations.[36]
Reconfiguring alarm acuity was evaluated in 2 studies, both of which were multiple‐intervention quasi‐experimental studies.[35, 37] Both showed reductions in alarm rates: 1 was significant without increasing adverse events (P < 0.001),[37] and the other did not report statistical testing or safety outcomes.[35]
Secondary notification of nurses using pagers was the main intervention component of 1 study incorporating delays between the alarms and the alarm pages.[34] As mentioned above, a negatively sloping regression line was displayed, but no statistical testing or safety outcomes were reported.
Disposable electrocardiographic lead wires or daily electrode changes were evaluated in 3 studies:[32, 33, 38] 1 single intervention cluster‐randomized trial[32] and 2 quasi‐experimental studies.[33, 38] In the cluster‐randomized trial, disposable lead wires were compared to reusable lead wires, with disposable lead wires having significantly fewer technical alarms for lead signal failures (P = 0.03) but a similar number of monitoring artifact alarms (P = 0.44).[32] In a single‐intervention, quasi‐experimental study, daily electrode change showed a reduction in alarms, but no statistical testing was reported.[33] One multiple‐intervention, quasi‐experimental study incorporating daily electrode change showed fewer alarms without statistical testing.[38] Of the 2 studies examining patient safety, both reported no adverse outcomes.[32, 38]
DISCUSSION
This systematic review of physiologic monitor alarms in the hospital yielded the following main findings: (1) between 74% and 99% of physiologic monitor alarms were not actionable, (2) a significant relationship between alarm exposure and nurse response time was demonstrated in 2 small observational studies, and (3) although interventions were most often studied in combination, results from the studies with lower risk of bias suggest that widening alarm parameters, implementing alarm delays, and using disposable electrocardiographic lead wires and/or changing electrodes daily are the most promising interventions for reducing alarms. Only 5 of 8 intervention studies measured intervention safety and found that widening alarm parameters and implementing alarm delays had mixed safety outcomes, whereas disposable electrocardiographic lead wires and daily electrode changes had no adverse safety outcomes.[29, 30, 34, 35, 36] Safety measures are crucial to ensuring the highest level of patient safety is met; interventions are rendered useless without ensuring actionable alarms are not disabled. The variation in results across studies likely reflects the wide range of care settings as well as differences in design and quality.
This field is still in its infancy, with 18 of the 32 articles published in the past 5 years. We anticipate improvements in quality and rigor as the field matures, as well as clinically tested interventions that incorporate smart alarms. Smart alarms integrate data from multiple physiologic signals and the patient's history to better detect physiologic changes in the patient and improve the positive predictive value of alarms. Academicindustry partnerships will be required to implement and rigorously test smart alarms and other emerging technologies in the hospital.
To our knowledge, this is the first systematic review focused on monitor alarms with specific review questions relevant to alarm fatigue. Cvach recently published an integrative review of alarm fatigue using research published through 2011.[39] Our review builds upon her work by contributing a more extensive and systematic search strategy with databases spanning nursing, medicine, and engineering, including additional languages, and including newer studies published through April 2015. In addition, we included multiple cross‐team checks in our eligibility review to ensure high sensitivity and specificity of the resulting set of studies.
Although we focused on interventions aiming to reduce alarms, there has also been important recent work focused on reducing telemetry utilization in adult hospital populations as well as work focused on reducing pulse oximetry utilization in children admitted with respiratory conditions. Dressler and colleagues reported an immediate and sustained reduction in telemetry utilization in hospitalized adults upon redesign of cardiac telemetry order sets to include the clinical indication, which defaulted to the American Heart Association guideline‐recommended telemetry duration.[40] Instructions for bedside nurses were also included in the order set to facilitate appropriate telemetry discontinuation. Schondelmeyer and colleagues reported reductions in continuous pulse oximetry utilization in hospitalized children with asthma and bronchiolitis upon introduction of a multifaceted quality improvement program that included provider education, a nurse handoff checklist, and discontinuation criteria incorporated into order sets.[41]
Limitations of This Review and the Underlying Body of Work
There are limitations to this systematic review and its underlying body of work. With respect to our approach to this systematic review, we focused only on monitor alarms. Numerous other medical devices generate alarms in the patient‐care environment that also can contribute to alarm fatigue and deserve equally rigorous evaluation. With respect to the underlying body of work, the quality of individual studies was generally low. For example, determinations of alarm actionability were often made by a single rater without evaluation of the reliability or validity of these determinations, and statistical testing was often missing. There were also limitations specific to intervention studies, including evaluation of nongeneralizable patient populations, failure to measure the fidelity of the interventions, inadequate measures of intervention safety, and failure to statistically evaluate alarm reductions. Finally, though not necessarily a limitation, several studies were conducted by authors involved in or funded by the medical device industry.[11, 15, 19, 31, 32] This has the potential to introduce bias, although we have no indication that the quality of the science was adversely impacted.
Moving forward, the research agenda for physiologic monitor alarms should include the following: (1) more intensive focus on evaluating the relationship between alarm exposure and response time with analysis of important mediating factors that may promote or prevent alarm fatigue, (2) emphasis on studying interventions aimed at improving alarm management using rigorous designs such as cluster‐randomized trials and trials randomized by individual participant, (3) monitoring and reporting clinically meaningful balancing measures that represent unintended consequences of disabling or delaying potentially important alarms and possibly reducing the clinicians' ability to detect true patient deterioration and intervene in a timely manner, and (4) support for transparent academicindustry partnerships to evaluate new alarm technology in real‐world settings. As evidence‐based interventions emerge, there will be new opportunities to study different implementation strategies of these interventions to optimize effectiveness.
CONCLUSIONS
The body of literature relevant to physiologic monitor alarm characteristics and alarm fatigue is limited but growing rapidly. Although we know that most alarms are not actionable and that there appears to be a relationship between alarm exposure and response time that could be caused by alarm fatigue, we cannot yet say with certainty that we know which interventions are most effective in safely reducing unnecessary alarms. Interventions that appear most promising and should be prioritized for intensive evaluation include widening alarm parameters, implementing alarm delays, and using disposable electrocardiographic lead wires and changing electrodes daily. Careful evaluation of these interventions must include systematically examining adverse patient safety consequences.
Acknowledgements
The authors thank Amogh Karnik and Micheal Sellars for their technical assistance during the review and extraction process.
Disclosures: Ms. Zander is supported by the Society of Hospital Medicine Student Hospitalist Scholar Grant. Dr. Bonafide and Ms. Stemler are supported by the National Heart, Lung, and Blood Institute of the National Institutes of Health under award number K23HL116427. The content is solely the responsibility of the authors and does not necessarily represent the official views of the National Institutes of Health. The authors report no conflicts of interest.
- National Patient Safety Goals Effective January 1, 2015. The Joint Commission Web site. http://www.jointcommission.org/assets/1/6/2015_NPSG_HAP.pdf. Accessed July 17, 2015.
- ECRI Institute. 2015 Top 10 Health Technology Hazards. Available at: https://www.ecri.org/Pages/2015‐Hazards.aspx. Accessed June 23, 2015.
- , . Alarm fatigue: a patient safety concern. AACN Adv Crit Care. 2013;24(4):378–386.
- , . Redesigning hospital alarms for patient safety: alarmed and potentially dangerous. JAMA. 2014;311(12):1199–1200.
- , , , et al. Meta‐analysis of observational studies in epidemiology: a proposal for reporting. Meta‐analysis Of Observational Studies in Epidemiology (MOOSE) Group. JAMA. 2000;283(15):2008–2012.
- , , , ; PRISMA Group. Preferred reporting items for systematic reviews and meta‐analyses: the PRISMA statement. Ann Intern Med. 2009;151(4):264–269, W64.
- , , , , . ALARMED: adverse events in low‐risk patients with chest pain receiving continuous electrocardiographic monitoring in the emergency department. A pilot study. Am J Emerg Med. 2006;24:62–67.
- , , . Patient and nurse‐related implications of remote cardiac telemetry. Clin Nurs Res. 2003;12(4):356–370.
- , , , , . Clinical evaluation of alarm efficiency in intensive care [in French]. Ann Fr Anesth Reanim. 2000;19:459–466.
- , , , , , . Multicentric study of monitoring alarms in the adult intensive care unit (ICU): a descriptive analysis. Intensive Care Med. 1999;25:1360–1366.
- , , , et al. Insights into the problem of alarm fatigue with physiologic monitor devices: a comprehensive observational study of consecutive intensive care unit patients. PloS One. 2014;9(10):e110274.
- . Nurses' response to frequency and types of electrocardiography alarms in a non‐ critical care setting: a descriptive study. Int J Nurs Stud. 2014;51(2):190–197.
- , , . Improving alarm performance in the medical intensive care unit using delays and clinical context. Anesth Analg. 2009;108:1546–1552.
- , , , et al. The proportion of clinically relevant alarms decreases as patient clinical severity decreases in intensive care units: a pilot study. BMJ Open. 2013;3(9):e003354–e003354.
- , , . Physiologic monitoring alarm load on medical/surgical floors of a community hospital. Biomed Instrum Technol. 2011;45:29–36.
- , , , . Frequency and reliability of alarms in the monitoring of cardiac postoperative patients. Int J Clin Monit Comput. 1990;7(2):129–133.
- , , , et al. Audit of the bedside monitor alarms in a critical care unit [in Spanish]. Enferm Intensiva. 2014;25(3):83–90.
- , . Stimulus‐response time to invasive blood pressure alarms: implications for the safety of critical‐care patients. Rev Gaúcha Enferm. 2014;35(2):135–141.
- , , , , , . Intensive care unit alarms— how many do we need? Crit Care Med. 2010;38:451–456.
- , , , et al. Pulse oximetry desaturation alarms on a general postoperative adult unit: a prospective observational study of nurse response time. Int J Nurs Stud. 2013;50(10):1351–1358.
- , , . Whats that noise? Bedside monitoring in the Emergency Department. Int Emerg Nurs. 2014;22(4):197–201.
- , , , et al. Association between exposure to nonactionable physiologic monitor alarms and response time in a children's hospital. J Hosp Med. 2015;10(6):345–351.
- . Crying wolf: false alarms in a pediatric intensive care unit. Crit Care Med. 1994;22(6):981–985.
- , , , , . What are we missing? Arrhythmia detection in the pediatric intensive care unit. J Pediatr. 2013;163(2):511–514.
- , , , et al. Cardiopulmonary monitors and clinically significant events in critically ill children. Biomed Instrum Technol. 2011;45(s1):38–45.
- , . Poor prognosis for existing monitors in the intensive care unit. Crit Care Med. 1997;25:614–619.
- , , , , . Safe patient monitoring is challenging but still feasible in a neonatal intensive care unit with single family rooms. Acta Paediatr Oslo Nor 1992. 2015;104(6):e247–e254.
- , , , . The helpful or hindering effects of in‐hospital patient monitor alarms on nurses: a qualitative analysis. CIN Comput Inform Nurs. 2012;30(4):210–217.
- . Survey of alarms in an intensive therapy unit. Anaesthesia. 1986;41(7):742–744.
- , , , . Postanesthesia monitoring revisited: frequency of true and false alarms from different monitoring devices. J Clin Anesth. 1994;6(3):182–188.
- , , , . Impact of pulse oximetry surveillance on rescue events and intensive care unit transfers: a before‐and‐after concurrence study. Anesthesiology. 2010;112(2):282–287.
- , , , et al. Differences in alarm events between disposable and reusable electrocardiography lead wires. Am J Crit Care. 2015;24(1):67–74.
- , , , . Daily electrode change and effect on cardiac monitor alarms: an evidence‐based practice approach. J Nurs Care Qual. 2013;28:265–271.
- , , , . Use of pagers with an alarm escalation system to reduce cardiac monitor alarm signals. J Nurs Care Qual. 2014;29(1):9–18.
- , . Monitor alarm fatigue: standardizing use of physiological monitors and decreasing nuisance alarms. Am J Crit Care. 2010;19:28–34.
- , . Influence of pulse oximeter lower alarm limit on the incidence of hypoxaemia in the recovery room. Br J Anaesth. 1997;79(4):460–464.
- , , , , , . Novel approach to cardiac alarm management on telemetry units. J Cardiovasc Nurs. 2014;29(5):E13–E22.
- , , , et al. A team‐based approach to reducing cardiac monitor alarms. Pediatrics. 2014;134(6):e1686–e1694.
- . Monitor alarm fatigue: an integrative review. Biomed Instrum Technol. 2012;46(4):268–277.
- , , , , . Altering overuse of cardiac telemetry in non‐intensive care unit settings by hardwiring the use of American Heart Association guidelines. JAMA Intern Med. 2014;174(11):1852–1854.
- , , , et al. Using quality improvement to reduce continuous pulse oximetry use in children with wheezing. Pediatrics. 2015;135(4):e1044–e1051.
- , . The feasibility of creating a checklist for the assessment of the methodological quality both of randomised and non‐randomised studies of health care interventions. J Epidemiol Community Health. 1998;52(6):377–384.
Clinical alarm safety has become a recent target for improvement in many hospitals. In 2013, The Joint Commission released a National Patient Safety Goal prompting accredited hospitals to establish alarm safety as a hospital priority, identify the most important alarm signals to manage, and, by 2016, develop policies and procedures that address alarm management.[1] In addition, the Emergency Care Research Institute has named alarm hazards the top health technology hazard each year since 2012.[2]
The primary arguments supporting the elevation of alarm management to a national hospital priority in the United States include the following: (1) clinicians rely on alarms to notify them of important physiologic changes, (2) alarms occur frequently and usually do not warrant clinical intervention, and (3) alarm overload renders clinicians unable to respond to all alarms, resulting in alarm fatigue: responding more slowly or ignoring alarms that may represent actual clinical deterioration.[3, 4] These arguments are built largely on anecdotal data, reported safety event databases, and small studies that have not previously been systematically analyzed.
Despite the national focus on alarms, we still know very little about fundamental questions key to improving alarm safety. In this systematic review, we aimed to answer 3 key questions about physiologic monitor alarms: (1) What proportion of alarms warrant attention or clinical intervention (ie, actionable alarms), and how does this proportion vary between adult and pediatric populations and between intensive care unit (ICU) and ward settings? (2) What is the relationship between alarm exposure and clinician response time? (3) What interventions are effective in reducing the frequency of alarms?
We limited our scope to monitor alarms because few studies have evaluated the characteristics of alarms from other medical devices, and because missing relevant monitor alarms could adversely impact patient safety.
METHODS
We performed a systematic review of the literature in accordance with the Meta‐Analysis of Observational Studies in Epidemiology guidelines[5] and developed this manuscript using the Preferred Reporting Items for Systematic Reviews and Meta‐Analyses (PRISMA) statement.[6]
Eligibility Criteria
With help from an experienced biomedical librarian (C.D.S.), we searched PubMed, the Cumulative Index to Nursing and Allied Health Literature, Scopus, Cochrane Library,
We included peer‐reviewed, original research studies published in English, Spanish, or French that addressed the questions outlined above. Eligible patient populations were children and adults admitted to hospital inpatient units and emergency departments (EDs). We excluded alarms in procedural suites or operating rooms (typically responded to by anesthesiologists already with the patient) because of the differences in environment of care, staff‐to‐patient ratio, and equipment. We included observational studies reporting the actionability of physiologic monitor alarms (ie, alarms warranting special attention or clinical intervention), as well as nurse responses to these alarms. We excluded studies focused on the effects of alarms unrelated to patient safety, such as families' and patients' stress, noise, or sleep disturbance. We included only intervention studies evaluating pragmatic interventions ready for clinical implementation (ie, not experimental devices or software algorithms).
Selection Process and Data Extraction
First, 2 authors screened the titles and abstracts of articles for eligibility. To maximize sensitivity, if at least 1 author considered the article relevant, the article proceeded to full‐text review. Second, the full texts of articles screened were independently reviewed by 2 authors in an unblinded fashion to determine their eligibility. Any disagreements concerning eligibility were resolved by team consensus. To assure consistency in eligibility determinations across the team, a core group of the authors (C.W.P, C.P.B., E.E., and V.V.G.) held a series of meetings to review and discuss each potentially eligible article and reach consensus on the final list of included articles. Two authors independently extracted the following characteristics from included studies: alarm review methods, analytic design, fidelity measurement, consideration of unintended adverse safety consequences, and key results. Reviewers were not blinded to journal, authors, or affiliations.
Synthesis of Results and Risk Assessment
Given the high degree of heterogeneity in methodology, we were unable to generate summary proportions of the observational studies or perform a meta‐analysis of the intervention studies. Thus, we organized the studies into clinically relevant categories and presented key aspects in tables. Due to the heterogeneity of the studies and the controversy surrounding quality scores,[5] we did not generate summary scores of study quality. Instead, we evaluated and reported key design elements that had the potential to bias the results. To recognize the more comprehensive studies in the field, we developed by consensus a set of characteristics that distinguished studies with lower risk of bias. These characteristics are shown and defined in Table 1.
| First Author and Publication Year | Alarm Review Method | Indicators of Potential Bias for Observational Studies | Indicators of Potential Bias for Intervention Studies | |||||||||||||
|---|---|---|---|---|---|---|---|---|---|---|---|---|---|---|---|---|
| Monitor System | Direct Observation | Medical Record Review | Rhythm Annotation | Video Observation | Remote Monitoring Staff | Medical Device Industry Involved | Two Independent Reviewers | At Least 1 Reviewer Is a Clinical Expert | Reviewer Not Simultaneously in Patient Care | Clear Definition of Alarm Actionability | Census Included | Statistical Testing or QI SPC Methods | Fidelity Assessed | Safety Assessed | Lower Risk of Bias | |
| ||||||||||||||||
| Adult Observational | ||||||||||||||||
| Atzema 2006[7] | ✓* | ✓ | ✓ | |||||||||||||
| Billinghurst 2003[8] | ✓ | ✓ | ✓ | ✓ | ||||||||||||
| Biot 2000[9] | ✓ | ✓ | ✓ | ✓ | ||||||||||||
| Chambrin 1999[10] | ✓ | ✓ | ✓ | ✓ | ||||||||||||
| Drew 2014[11] | ✓ | ✓ | ✓ | ✓ | ✓ | ✓ | ✓ | ✓ | ||||||||
| Gazarian 2014[12] | ✓ | ✓ | ✓ | ✓ | ✓ | |||||||||||
| Grges 2009[13] | ✓ | ✓ | ✓ | ✓ | ||||||||||||
| Gross 2011[15] | ✓ | ✓ | ✓ | ✓ | ✓ | ✓ | ✓ | |||||||||
| Inokuchi 2013[14] | ✓ | ✓ | ✓ | ✓ | ✓ | ✓ | ✓ | |||||||||
| Koski 1990[16] | ✓ | ✓ | ✓ | ✓ | ||||||||||||
| Morales Snchez 2014[17] | ✓ | ✓ | ✓ | ✓ | ||||||||||||
| Pergher 2014[18] | ✓ | ✓ | ||||||||||||||
| Siebig 2010[19] | ✓ | ✓ | ✓ | ✓ | ✓ | ✓ | ||||||||||
| Voepel‐Lewis 2013[20] | ✓ | ✓ | ✓ | ✓ | ||||||||||||
| Way 2014[21] | ✓ | ✓ | ✓ | |||||||||||||
| Pediatric Observational | ||||||||||||||||
| Bonafide 2015[22] | ✓ | ✓ | ✓ | ✓ | ✓ | ✓ | ✓ | |||||||||
| Lawless 1994[23] | ✓ | ✓ | ||||||||||||||
| Rosman 2013[24] | ✓ | ✓ | ✓ | ✓ | ✓ | |||||||||||
| Talley 2011[25] | ✓ | ✓ | ✓ | ✓ | ✓ | |||||||||||
| Tsien 1997[26] | ✓ | ✓ | ✓ | ✓ | ||||||||||||
| van Pul 2015[27] | ✓ | |||||||||||||||
| Varpio 2012[28] | ✓ | ✓ | ✓ | ✓ | ||||||||||||
| Mixed Adult and Pediatric Observational | ||||||||||||||||
| O'Carroll 1986[29] | ✓ | |||||||||||||||
| Wiklund 1994[30] | ✓ | ✓ | ✓ | ✓ | ||||||||||||
| Adult Intervention | ||||||||||||||||
| Albert 2015[32] | ✓ | ✓ | ✓ | ✓ | ✓ | ✓ | ✓ | |||||||||
| Cvach 2013[33] | ✓ | ✓ | ||||||||||||||
| Cvach 2014[34] | ✓ | ✓ | ||||||||||||||
| Graham 2010[35] | ✓ | |||||||||||||||
| Rheineck‐Leyssius 1997[36] | ✓ | ✓ | ✓ | ✓ | ✓ | ✓ | ||||||||||
| Taenzer 2010[31] | ✓ | ✓ | ✓ | ✓ | ✓ | ✓ | ||||||||||
| Whalen 2014[37] | ✓ | ✓ | ✓ | |||||||||||||
| Pediatric Intervention | ||||||||||||||||
| Dandoy 2014[38] | ✓ | ✓ | ✓ | ✓ | ✓ | ✓ | ||||||||||
For the purposes of this review, we defined nonactionable alarms as including both invalid (false) alarms that do not that accurately represent the physiologic status of the patient and alarms that are valid but do not warrant special attention or clinical intervention (nuisance alarms). We did not separate out invalid alarms due to the tremendous variation between studies in how validity was measured.
RESULTS
Study Selection
Search results produced 4629 articles (see the flow diagram in the Supporting Information in the online version of this article), of which 32 articles were eligible: 24 observational studies describing alarm characteristics and 8 studies describing interventions to reduce alarm frequency.
Observational Study Characteristics
Characteristics of included studies are shown in Table 1. Of the 24 observational studies,[7, 8, 9, 10, 11, 12, 13, 14, 15, 16, 17, 18, 19, 20, 21, 22, 23, 24, 25, 26, 27, 28, 29, 30] 15 included adult patients,[7, 8, 9, 10, 11, 12, 13, 14, 15, 16, 17, 18, 19, 20, 21] 7 included pediatric patients,[22, 23, 24, 25, 26, 27, 28] and 2 included both adult and pediatric patients.[29, 30] All were single‐hospital studies, except for 1 study by Chambrin and colleagues[10] that included 5 sites. The number of patient‐hours examined in each study ranged from 60 to 113,880.[7, 8, 9, 10, 11, 13, 14, 15, 16, 18, 19, 20, 21, 22, 23, 24, 25, 26, 27, 29, 30] Hospital settings included ICUs (n = 16),[9, 10, 11, 13, 14, 16, 17, 18, 19, 22, 23, 24, 25, 26, 27, 29] general wards (n = 5),[12, 15, 20, 22, 28] EDs (n = 2),[7, 21] postanesthesia care unit (PACU) (n = 1),[30] and cardiac care unit (CCU) (n = 1).[8] Studies varied in the type of physiologic signals recorded and data collection methods, ranging from direct observation by a nurse who was simultaneously caring for patients[29] to video recording with expert review.[14, 19, 22] Four observational studies met the criteria for lower risk of bias.[11, 14, 15, 22]
Intervention Study Characteristics
Of the 8 intervention studies, 7 included adult patients,[31, 32, 33, 34, 35, 36, 37] and 1 included pediatric patients.[38] All were single‐hospital studies; 6 were quasi‐experimental[31, 33, 34, 35, 37, 38] and 2 were experimental.[32, 36] Settings included progressive care units (n = 3),[33, 34, 35] CCUs (n = 3),[32, 33, 37] wards (n = 2),[31, 38] PACU (n = 1),[36] and a step‐down unit (n = 1).[32] All except 1 study[32] used the monitoring system to record alarm data. Several studies evaluated multicomponent interventions that included combinations of the following: widening alarm parameters,[31, 35, 36, 37, 38] instituting alarm delays,[31, 34, 36, 38] reconfiguring alarm acuity,[35, 37] use of secondary notifications,[34] daily change of electrocardiographic electrodes or use of disposable electrocardiographic wires,[32, 33, 38] universal monitoring in high‐risk populations,[31] and timely discontinuation of monitoring in low‐risk populations.[38] Four intervention studies met our prespecified lower risk of bias criteria.[31, 32, 36, 38]
Proportion of Alarms Considered Actionable
Results of the observational studies are provided in Table 2. The proportion of alarms that were actionable was <1% to 26% in adult ICU settings,[9, 10, 11, 13, 14, 16, 17, 19] 20% to 36% in adult ward settings,[12, 15, 20] 17% in a mixed adult and pediatric PACU setting,[30] 3% to 13% in pediatric ICU settings,[22, 23, 24, 25, 26] and 1% in a pediatric ward setting.[22]
| Signals Included | ||||||||||
|---|---|---|---|---|---|---|---|---|---|---|
| First Author and Publication Year | Setting | Monitored Patient‐Hours | SpO2 | ECG Arrhythmia | ECG Parametersa | Blood Pressure | Total Alarms | Actionable Alarms | Alarm Response | Lower Risk of Bias |
| ||||||||||
| Adult | ||||||||||
| Atzema 2006[7] | ED | 371 | ✓ | 1,762 | 0.20% | |||||
| Billinghurst 2003[8] | CCU | 420 | ✓ | 751 | Not reported; 17% were valid | Nurses with higher acuity patients and smaller % of valid alarms had slower response rates | ||||
| Biot 2000[9] | ICU | 250 | ✓ | ✓ | ✓ | ✓ | 3,665 | 3% | ||
| Chambrin 1999[10] | ICU | 1,971 | ✓ | ✓ | ✓ | ✓ | 3,188 | 26% | ||
| Drew 2014[11] | ICU | 48,173 | ✓ | ✓ | ✓ | ✓ | 2,558,760 | 0.3% of 3,861 VT alarms | ✓ | |
| Gazarian 2014[12] | Ward | 54 nurse‐hours | ✓ | ✓ | ✓ | 205 | 22% | Response to 47% of alarms | ||
| Grges 2009[13] | ICU | 200 | ✓ | ✓ | ✓ | ✓ | 1,214 | 5% | ||
| Gross 2011[15] | Ward | 530 | ✓ | ✓ | ✓ | ✓ | 4,393 | 20% | ✓ | |
| Inokuchi 2013[14] | ICU | 2,697 | ✓ | ✓ | ✓ | ✓ | 11,591 | 6% | ✓ | |
| Koski 1990[16] | ICU | 400 | ✓ | ✓ | 2,322 | 12% | ||||
| Morales Snchez 2014[17] | ICU | 434 sessions | ✓ | ✓ | ✓ | 215 | 25% | Response to 93% of alarms, of which 50% were within 10 seconds | ||
| Pergher 2014[18] | ICU | 60 | ✓ | 76 | Not reported | 72% of alarms stopped before nurse response or had >10 minutes response time | ||||
| Siebig 2010[19] | ICU | 982 | ✓ | ✓ | ✓ | ✓ | 5,934 | 15% | ||
| Voepel‐Lewis 2013[20] | Ward | 1,616 | ✓ | 710 | 36% | Response time was longer for patients in highest quartile of total alarms | ||||
| Way 2014[21] | ED | 93 | ✓ | ✓ | ✓ | ✓ | 572 | Not reported; 75% were valid | Nurses responded to more alarms in resuscitation room vs acute care area, but response time was longer | |
| Pediatric | ||||||||||
| Bonafide 2015[22] | Ward + ICU | 210 | ✓ | ✓ | ✓ | ✓ | 5,070 | 13% PICU, 1% ward | Incremental increases in response time as number of nonactionable alarms in preceding 120 minutes increased | ✓ |
| Lawless 1994[23] | ICU | 928 | ✓ | ✓ | ✓ | 2,176 | 6% | |||
| Rosman 2013[24] | ICU | 8,232 | ✓ | ✓ | ✓ | ✓ | 54,656 | 4% of rhythm alarms true critical" | ||
| Talley 2011[25] | ICU | 1,470∥ | ✓ | ✓ | ✓ | ✓ | 2,245 | 3% | ||
| Tsien 1997[26] | ICU | 298 | ✓ | ✓ | ✓ | 2,942 | 8% | |||
| van Pul 2015[27] | ICU | 113,880∥ | ✓ | ✓ | ✓ | ✓ | 222,751 | Not reported | Assigned nurse did not respond to 6% of alarms within 45 seconds | |
| Varpio 2012[28] | Ward | 49 unit‐hours | ✓ | ✓ | ✓ | ✓ | 446 | Not reported | 70% of all alarms and 41% of crisis alarms were not responded to within 1 minute | |
| Both | ||||||||||
| O'Carroll 1986[29] | ICU | 2,258∥ | ✓ | 284 | 2% | |||||
| Wiklund 1994[30] | PACU | 207 | ✓ | ✓ | ✓ | 1,891 | 17% | |||
Relationship Between Alarm Exposure and Response Time
Whereas 9 studies addressed response time,[8, 12, 17, 18, 20, 21, 22, 27, 28] only 2 evaluated the relationship between alarm burden and nurse response time.[20, 22] Voepel‐Lewis and colleagues found that nurse responses were slower to patients with the highest quartile of alarms (57.6 seconds) compared to those with the lowest (45.4 seconds) or medium (42.3 seconds) quartiles of alarms on an adult ward (P = 0.046). They did not find an association between false alarm exposure and response time.[20] Bonafide and colleagues found incremental increases in response time as the number of nonactionable alarms in the preceding 120 minutes increased (P < 0.001 in the pediatric ICU, P = 0.009 on the pediatric ward).[22]
Interventions Effective in Reducing Alarms
Results of the 8 intervention studies are provided in Table 3. Three studies evaluated single interventions;[32, 33, 36] the remainder of the studies tested interventions with multiple components such that it was impossible to separate the effect of each component. Below, we have summarized study results, arranged by component. Because only 1 study focused on pediatric patients,[38] results from pediatric and adult settings are combined.
| First Author and Publication Year | Design | Setting | Main Intervention Components | Other/ Comments | Key Results | Results Statistically Significant? | Lower Risk of Bias | ||||
|---|---|---|---|---|---|---|---|---|---|---|---|
| Widen Default Settings | Alarm Delays | Reconfigure Alarm Acuity | Secondary Notification | ECG Changes | |||||||
| |||||||||||
| Adult | |||||||||||
| Albert 2015[32] | Experimental (cluster‐randomized) | CCU | ✓ | Disposable vs reusable wires | Disposable leads had 29% fewer no‐telemetry, leads‐fail, and leads‐off alarms and similar artifact alarms | ✓ | ✓ | ||||
| Cvach 2013[33] | Quasi‐experimental (before and after) | CCU and PCU | ✓ | Daily change of electrodes | 46% fewer alarms/bed/day | ||||||
| Cvach 2014[34] | Quasi‐experimental (ITS) | PCU | ✓* | ✓ | Slope of regression line suggests decrease of 0.75 alarms/bed/day | ||||||
| Graham 2010[35] | Quasi‐experimental (before and after) | PCU | ✓ | ✓ | 43% fewer crisis, warning, and system warning alarms on unit | ||||||
| Rheineck‐Leyssius 1997[36] | Experimental (RCT) | PACU | ✓ | ✓ | Alarm limit of 85% had fewer alarms/patient but higher incidence of true hypoxemia for >1 minute (6% vs 2%) | ✓ | ✓ | ||||
| Taenzer 2010[31] | Quasi‐experimental (before and after with concurrent controls) | Ward | ✓ | ✓ | Universal SpO2 monitoring | Rescue events decreased from 3.4 to 1.2 per 1,000 discharges; transfers to ICU decreased from 5.6 to 2.9 per 1,000 patient‐days, only 4 alarms/patient‐day | ✓ | ✓ | |||
| Whalen 2014[37] | Quasi‐experimental (before and after) | CCU | ✓ | ✓ | 89% fewer audible alarms on unit | ✓ | |||||
| Pediatric | |||||||||||
| Dandoy 2014[38] | Quasi‐experimental (ITS) | Ward | ✓ | ✓ | ✓ | Timely monitor discontinuation; daily change of ECG electrodes | Decrease in alarms/patient‐days from 180 to 40 | ✓ | |||
Widening alarm parameter default settings was evaluated in 5 studies:[31, 35, 36, 37, 38] 1 single intervention randomized controlled trial (RCT),[36] and 4 multiple‐intervention, quasi‐experimental studies.[31, 35, 37, 38] In the RCT, using a lower SpO2 limit of 85% instead of the standard 90% resulted in 61% fewer alarms. In the 4 multiple intervention studies, 1 study reported significant reductions in alarm rates (P < 0.001),[37] 1 study did not report preintervention alarm rates but reported a postintervention alarm rate of 4 alarms per patient‐day,[31] and 2 studies reported reductions in alarm rates but did not report any statistical testing.[35, 38] Of the 3 studies examining patient safety, 1 study with universal monitoring reported fewer rescue events and transfers to the ICU postimplementation,[31] 1 study reported no missed acute decompensations,[38] and 1 study (the RCT) reported significantly more true hypoxemia events (P = 0.001).[36]
Alarm delays were evaluated in 4 studies:[31, 34, 36, 38] 3 multiple‐intervention, quasi‐experimental studies[31, 34, 38] and 1 retrospective analysis of data from an RCT.[36] One study combined alarm delays with widening defaults in a universal monitoring strategy and reported a postintervention alarm rate of 4 alarms per patient.[31] Another study evaluated delays as part of a secondary notification pager system and found a negatively sloping regression line that suggested a decreasing alarm rate, but did not report statistical testing.[34] The third study reported a reduction in alarm rates but did not report statistical testing.[38] The RCT compared the impact of a hypothetical 15‐second alarm delay to that of a lower SpO2 limit reduction and reported a similar reduction in alarms.[36] Of the 4 studies examining patient safety, 1 study with universal monitoring reported improvements,[31] 2 studies reported no adverse outcomes,[35, 38] and the retrospective analysis of data from the RCT reported the theoretical adverse outcome of delayed detection of sudden, severe desaturations.[36]
Reconfiguring alarm acuity was evaluated in 2 studies, both of which were multiple‐intervention quasi‐experimental studies.[35, 37] Both showed reductions in alarm rates: 1 was significant without increasing adverse events (P < 0.001),[37] and the other did not report statistical testing or safety outcomes.[35]
Secondary notification of nurses using pagers was the main intervention component of 1 study incorporating delays between the alarms and the alarm pages.[34] As mentioned above, a negatively sloping regression line was displayed, but no statistical testing or safety outcomes were reported.
Disposable electrocardiographic lead wires or daily electrode changes were evaluated in 3 studies:[32, 33, 38] 1 single intervention cluster‐randomized trial[32] and 2 quasi‐experimental studies.[33, 38] In the cluster‐randomized trial, disposable lead wires were compared to reusable lead wires, with disposable lead wires having significantly fewer technical alarms for lead signal failures (P = 0.03) but a similar number of monitoring artifact alarms (P = 0.44).[32] In a single‐intervention, quasi‐experimental study, daily electrode change showed a reduction in alarms, but no statistical testing was reported.[33] One multiple‐intervention, quasi‐experimental study incorporating daily electrode change showed fewer alarms without statistical testing.[38] Of the 2 studies examining patient safety, both reported no adverse outcomes.[32, 38]
DISCUSSION
This systematic review of physiologic monitor alarms in the hospital yielded the following main findings: (1) between 74% and 99% of physiologic monitor alarms were not actionable, (2) a significant relationship between alarm exposure and nurse response time was demonstrated in 2 small observational studies, and (3) although interventions were most often studied in combination, results from the studies with lower risk of bias suggest that widening alarm parameters, implementing alarm delays, and using disposable electrocardiographic lead wires and/or changing electrodes daily are the most promising interventions for reducing alarms. Only 5 of 8 intervention studies measured intervention safety and found that widening alarm parameters and implementing alarm delays had mixed safety outcomes, whereas disposable electrocardiographic lead wires and daily electrode changes had no adverse safety outcomes.[29, 30, 34, 35, 36] Safety measures are crucial to ensuring the highest level of patient safety is met; interventions are rendered useless without ensuring actionable alarms are not disabled. The variation in results across studies likely reflects the wide range of care settings as well as differences in design and quality.
This field is still in its infancy, with 18 of the 32 articles published in the past 5 years. We anticipate improvements in quality and rigor as the field matures, as well as clinically tested interventions that incorporate smart alarms. Smart alarms integrate data from multiple physiologic signals and the patient's history to better detect physiologic changes in the patient and improve the positive predictive value of alarms. Academicindustry partnerships will be required to implement and rigorously test smart alarms and other emerging technologies in the hospital.
To our knowledge, this is the first systematic review focused on monitor alarms with specific review questions relevant to alarm fatigue. Cvach recently published an integrative review of alarm fatigue using research published through 2011.[39] Our review builds upon her work by contributing a more extensive and systematic search strategy with databases spanning nursing, medicine, and engineering, including additional languages, and including newer studies published through April 2015. In addition, we included multiple cross‐team checks in our eligibility review to ensure high sensitivity and specificity of the resulting set of studies.
Although we focused on interventions aiming to reduce alarms, there has also been important recent work focused on reducing telemetry utilization in adult hospital populations as well as work focused on reducing pulse oximetry utilization in children admitted with respiratory conditions. Dressler and colleagues reported an immediate and sustained reduction in telemetry utilization in hospitalized adults upon redesign of cardiac telemetry order sets to include the clinical indication, which defaulted to the American Heart Association guideline‐recommended telemetry duration.[40] Instructions for bedside nurses were also included in the order set to facilitate appropriate telemetry discontinuation. Schondelmeyer and colleagues reported reductions in continuous pulse oximetry utilization in hospitalized children with asthma and bronchiolitis upon introduction of a multifaceted quality improvement program that included provider education, a nurse handoff checklist, and discontinuation criteria incorporated into order sets.[41]
Limitations of This Review and the Underlying Body of Work
There are limitations to this systematic review and its underlying body of work. With respect to our approach to this systematic review, we focused only on monitor alarms. Numerous other medical devices generate alarms in the patient‐care environment that also can contribute to alarm fatigue and deserve equally rigorous evaluation. With respect to the underlying body of work, the quality of individual studies was generally low. For example, determinations of alarm actionability were often made by a single rater without evaluation of the reliability or validity of these determinations, and statistical testing was often missing. There were also limitations specific to intervention studies, including evaluation of nongeneralizable patient populations, failure to measure the fidelity of the interventions, inadequate measures of intervention safety, and failure to statistically evaluate alarm reductions. Finally, though not necessarily a limitation, several studies were conducted by authors involved in or funded by the medical device industry.[11, 15, 19, 31, 32] This has the potential to introduce bias, although we have no indication that the quality of the science was adversely impacted.
Moving forward, the research agenda for physiologic monitor alarms should include the following: (1) more intensive focus on evaluating the relationship between alarm exposure and response time with analysis of important mediating factors that may promote or prevent alarm fatigue, (2) emphasis on studying interventions aimed at improving alarm management using rigorous designs such as cluster‐randomized trials and trials randomized by individual participant, (3) monitoring and reporting clinically meaningful balancing measures that represent unintended consequences of disabling or delaying potentially important alarms and possibly reducing the clinicians' ability to detect true patient deterioration and intervene in a timely manner, and (4) support for transparent academicindustry partnerships to evaluate new alarm technology in real‐world settings. As evidence‐based interventions emerge, there will be new opportunities to study different implementation strategies of these interventions to optimize effectiveness.
CONCLUSIONS
The body of literature relevant to physiologic monitor alarm characteristics and alarm fatigue is limited but growing rapidly. Although we know that most alarms are not actionable and that there appears to be a relationship between alarm exposure and response time that could be caused by alarm fatigue, we cannot yet say with certainty that we know which interventions are most effective in safely reducing unnecessary alarms. Interventions that appear most promising and should be prioritized for intensive evaluation include widening alarm parameters, implementing alarm delays, and using disposable electrocardiographic lead wires and changing electrodes daily. Careful evaluation of these interventions must include systematically examining adverse patient safety consequences.
Acknowledgements
The authors thank Amogh Karnik and Micheal Sellars for their technical assistance during the review and extraction process.
Disclosures: Ms. Zander is supported by the Society of Hospital Medicine Student Hospitalist Scholar Grant. Dr. Bonafide and Ms. Stemler are supported by the National Heart, Lung, and Blood Institute of the National Institutes of Health under award number K23HL116427. The content is solely the responsibility of the authors and does not necessarily represent the official views of the National Institutes of Health. The authors report no conflicts of interest.
- National Patient Safety Goals Effective January 1, 2015. The Joint Commission Web site. http://www.jointcommission.org/assets/1/6/2015_NPSG_HAP.pdf. Accessed July 17, 2015.
- ECRI Institute. 2015 Top 10 Health Technology Hazards. Available at: https://www.ecri.org/Pages/2015‐Hazards.aspx. Accessed June 23, 2015.
- , . Alarm fatigue: a patient safety concern. AACN Adv Crit Care. 2013;24(4):378–386.
- , . Redesigning hospital alarms for patient safety: alarmed and potentially dangerous. JAMA. 2014;311(12):1199–1200.
- , , , et al. Meta‐analysis of observational studies in epidemiology: a proposal for reporting. Meta‐analysis Of Observational Studies in Epidemiology (MOOSE) Group. JAMA. 2000;283(15):2008–2012.
- , , , ; PRISMA Group. Preferred reporting items for systematic reviews and meta‐analyses: the PRISMA statement. Ann Intern Med. 2009;151(4):264–269, W64.
- , , , , . ALARMED: adverse events in low‐risk patients with chest pain receiving continuous electrocardiographic monitoring in the emergency department. A pilot study. Am J Emerg Med. 2006;24:62–67.
- , , . Patient and nurse‐related implications of remote cardiac telemetry. Clin Nurs Res. 2003;12(4):356–370.
- , , , , . Clinical evaluation of alarm efficiency in intensive care [in French]. Ann Fr Anesth Reanim. 2000;19:459–466.
- , , , , , . Multicentric study of monitoring alarms in the adult intensive care unit (ICU): a descriptive analysis. Intensive Care Med. 1999;25:1360–1366.
- , , , et al. Insights into the problem of alarm fatigue with physiologic monitor devices: a comprehensive observational study of consecutive intensive care unit patients. PloS One. 2014;9(10):e110274.
- . Nurses' response to frequency and types of electrocardiography alarms in a non‐ critical care setting: a descriptive study. Int J Nurs Stud. 2014;51(2):190–197.
- , , . Improving alarm performance in the medical intensive care unit using delays and clinical context. Anesth Analg. 2009;108:1546–1552.
- , , , et al. The proportion of clinically relevant alarms decreases as patient clinical severity decreases in intensive care units: a pilot study. BMJ Open. 2013;3(9):e003354–e003354.
- , , . Physiologic monitoring alarm load on medical/surgical floors of a community hospital. Biomed Instrum Technol. 2011;45:29–36.
- , , , . Frequency and reliability of alarms in the monitoring of cardiac postoperative patients. Int J Clin Monit Comput. 1990;7(2):129–133.
- , , , et al. Audit of the bedside monitor alarms in a critical care unit [in Spanish]. Enferm Intensiva. 2014;25(3):83–90.
- , . Stimulus‐response time to invasive blood pressure alarms: implications for the safety of critical‐care patients. Rev Gaúcha Enferm. 2014;35(2):135–141.
- , , , , , . Intensive care unit alarms— how many do we need? Crit Care Med. 2010;38:451–456.
- , , , et al. Pulse oximetry desaturation alarms on a general postoperative adult unit: a prospective observational study of nurse response time. Int J Nurs Stud. 2013;50(10):1351–1358.
- , , . Whats that noise? Bedside monitoring in the Emergency Department. Int Emerg Nurs. 2014;22(4):197–201.
- , , , et al. Association between exposure to nonactionable physiologic monitor alarms and response time in a children's hospital. J Hosp Med. 2015;10(6):345–351.
- . Crying wolf: false alarms in a pediatric intensive care unit. Crit Care Med. 1994;22(6):981–985.
- , , , , . What are we missing? Arrhythmia detection in the pediatric intensive care unit. J Pediatr. 2013;163(2):511–514.
- , , , et al. Cardiopulmonary monitors and clinically significant events in critically ill children. Biomed Instrum Technol. 2011;45(s1):38–45.
- , . Poor prognosis for existing monitors in the intensive care unit. Crit Care Med. 1997;25:614–619.
- , , , , . Safe patient monitoring is challenging but still feasible in a neonatal intensive care unit with single family rooms. Acta Paediatr Oslo Nor 1992. 2015;104(6):e247–e254.
- , , , . The helpful or hindering effects of in‐hospital patient monitor alarms on nurses: a qualitative analysis. CIN Comput Inform Nurs. 2012;30(4):210–217.
- . Survey of alarms in an intensive therapy unit. Anaesthesia. 1986;41(7):742–744.
- , , , . Postanesthesia monitoring revisited: frequency of true and false alarms from different monitoring devices. J Clin Anesth. 1994;6(3):182–188.
- , , , . Impact of pulse oximetry surveillance on rescue events and intensive care unit transfers: a before‐and‐after concurrence study. Anesthesiology. 2010;112(2):282–287.
- , , , et al. Differences in alarm events between disposable and reusable electrocardiography lead wires. Am J Crit Care. 2015;24(1):67–74.
- , , , . Daily electrode change and effect on cardiac monitor alarms: an evidence‐based practice approach. J Nurs Care Qual. 2013;28:265–271.
- , , , . Use of pagers with an alarm escalation system to reduce cardiac monitor alarm signals. J Nurs Care Qual. 2014;29(1):9–18.
- , . Monitor alarm fatigue: standardizing use of physiological monitors and decreasing nuisance alarms. Am J Crit Care. 2010;19:28–34.
- , . Influence of pulse oximeter lower alarm limit on the incidence of hypoxaemia in the recovery room. Br J Anaesth. 1997;79(4):460–464.
- , , , , , . Novel approach to cardiac alarm management on telemetry units. J Cardiovasc Nurs. 2014;29(5):E13–E22.
- , , , et al. A team‐based approach to reducing cardiac monitor alarms. Pediatrics. 2014;134(6):e1686–e1694.
- . Monitor alarm fatigue: an integrative review. Biomed Instrum Technol. 2012;46(4):268–277.
- , , , , . Altering overuse of cardiac telemetry in non‐intensive care unit settings by hardwiring the use of American Heart Association guidelines. JAMA Intern Med. 2014;174(11):1852–1854.
- , , , et al. Using quality improvement to reduce continuous pulse oximetry use in children with wheezing. Pediatrics. 2015;135(4):e1044–e1051.
- , . The feasibility of creating a checklist for the assessment of the methodological quality both of randomised and non‐randomised studies of health care interventions. J Epidemiol Community Health. 1998;52(6):377–384.
Monitor Alarms and Response Time
Hospital physiologic monitors can alert clinicians to early signs of physiologic deterioration, and thus have great potential to save lives. However, monitors generate frequent alarms,[1, 2, 3, 4, 5, 6, 7, 8] and most are not relevant to the patient's safety (over 90% of pediatric intensive care unit (PICU)[1, 2] and over 70% of adult intensive care alarms).[5, 6] In psychology experiments, humans rapidly learn to ignore or respond more slowly to alarms when exposed to high false‐alarm rates, exhibiting alarm fatigue.[9, 10] In 2013, The Joint Commission named alarm fatigue the most common contributing factor to alarm‐related sentinel events in hospitals.[11, 12]
Although alarm fatigue has been implicated as a major threat to patient safety, little empirical data support its existence in hospitals. In this study, we aimed to determine if there was an association between nurses' recent exposure to nonactionable physiologic monitor alarms and their response time to future alarms for the same patients. This exploratory work was designed to inform future research in this area, acknowledging that the sample size would be too small for multivariable modeling.
METHODS
Study Definitions
The alarm classification scheme is shown in Figure 1. Note that, for clarity, we have intentionally avoided using the terms true and false alarms because their interpretations vary across studies and can be misleading.
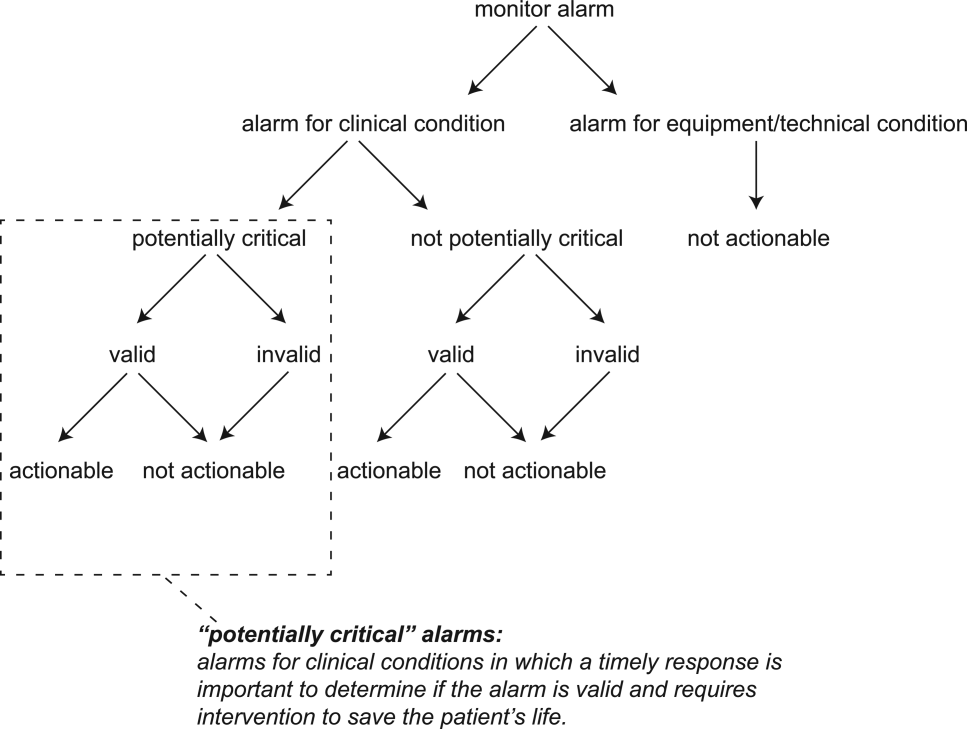
Potentially Critical Alarm
A potentially critical alarm is any alarm for a clinical condition for which a timely response is important to determine if the alarm requires intervention to save the patient's life. This is based on the alarm type alone, including alarms for life‐threatening arrhythmias such as asystole and ventricular tachycardia, as well as alarms for vital signs outside the set limits. Supporting Table 1 in the online version of this article lists the breakdown of alarm types that we defined a priori as potentially and not potentially critical.
| PICU | Ward | |||||||
|---|---|---|---|---|---|---|---|---|
| Alarm type | No. | % of Total | % Valid | % Actionable | No. | % of Total | % Valid | % Actionable |
| ||||||||
| Oxygen saturation | 197 | 19.4 | 82.7 | 38.6 | 590 | 41.2 | 24.4 | 1.9 |
| Heart rate | 194 | 19.1 | 95.4 | 1.0 | 266 | 18.6 | 87.2 | 0.0 |
| Respiratory rate | 229 | 22.6 | 80.8 | 13.5 | 316 | 22.1 | 48.1 | 1.0 |
| Blood pressure | 259 | 25.5 | 83.8 | 5.8 | 11 | 0.8 | 72.7 | 0.0 |
| Critical arrhythmia | 1 | 0.1 | 0.0 | 0.0 | 4 | 0.3 | 0.0 | 0.0 |
| Noncritical arrhythmia | 71 | 7.0 | 2.8 | 0.0 | 244 | 17.1 | 8.6 | 0.0 |
| Central venous pressure | 49 | 4.8 | 0.0 | 0.0 | 0 | 0.0 | N/A | N/A |
| Exhaled carbon dioxide | 14 | 1.4 | 92.9 | 50.0 | 0 | 0.0 | N/A | N/A |
| Total | 1014 | 100.0 | 75.6 | 12.9 | 1,431 | 100.0 | 38.9 | 1.0 |
Valid Alarm
A valid alarm is any alarm that correctly identifies the physiologic status of the patient. Validity was based on waveform quality, lead signal strength indicators, and artifact conditions, referencing each monitor's operator's manual.
Actionable Alarm
An actionable alarm is any valid alarm for a clinical condition that either: (1) leads to a clinical intervention; (2) leads to a consultation with another clinician at the bedside (and thus visible on camera); or (3) is a situation that should have led to intervention or consultation, but the alarm was unwitnessed or misinterpreted by the staff at the bedside.
Nonactionable Alarm
An unactionable alarm is any alarm that does not meet the actionable definition above, including invalid alarms such as those caused by motion artifact, equipment/technical alarms, and alarms that are valid but nonactionable (nuisance alarms).[13]
Response Time
The response time is the time elapsed from when the alarm fired at the bedside to when the nurse entered the room or peered through a window or door, measured in seconds.
Setting and Subjects
We performed this study between August 2012 and July 2013 at a freestanding children's hospital. We evaluated nurses caring for 2 populations: (1) PICU patients with heart and/or lung failure (requiring inotropic support and/or invasive mechanical ventilation), and (2) medical patients on a general inpatient ward. Nurses caring for heart and/or lung failure patients in the PICU typically were assigned 1 to 2 total patients. Nurses on the medical ward typically were assigned 2 to 4 patients. We identified subjects from the population of nurses caring for eligible patients with parents available to provide in‐person consent in each setting. Our primary interest was to evaluate the association between nonactionable alarms and response time, and not to study the epidemiology of alarms in a random sample. Therefore, when alarm data were available prior to screening, we first approached nurses caring for patients in the top 25% of alarm rates for that unit over the preceding 4 hours. We identified preceding alarm rates using BedMasterEx (Excel Medical Electronics, Jupiter, FL).
Human Subjects Protection
This study was approved by the institutional review board of The Children's Hospital of Philadelphia. We obtained written in‐person consent from the patient's parent and the nurse subject. We obtained a Certificate of Confidentiality from the National Institutes of Health to further protect study participants.[14]
Monitoring Equipment
All patients in the PICU were monitored continuously using General Electric (GE) (Fairfield, CT) solar devices. All bed spaces on the wards include GE Dash monitors that are used if ordered. On the ward we studied, 30% to 50% of patients are typically monitored at any given time. In addition to alarming at the bedside, most clinical alarms also generated a text message sent to the nurse's wireless phone listing the room number and the word monitor. Messages did not provide any clinical information about the alarm or patient's status. There were no technicians reviewing alarms centrally.
Physicians used an order set to order monitoring, selecting 1 of 4 available preconfigured profiles: infant <6 months, infant 6 months to 1 year, child, and adult. The parameters for each age group are in Supporting Figure 1, available in the online version of this article. A physician order is required for a nurse to change the parameters. Participating in the study did not affect this workflow.
Primary Outcome
The primary outcome was the nurse's response time to potentially critical monitor alarms that occurred while neither they nor any other clinicians were in the patient's room.
Primary Exposure and Alarm Classification
The primary exposure was the number of nonactionable alarms in the same patient over the preceding 120 minutes (rolling and updated each minute). The alarm classification scheme is shown in Figure 1.
Due to technical limitations with obtaining time‐stamped alarm data from the different ventilators in use during the study period, we were unable to identify the causes of all ventilator alarms. Therefore, we included ventilator alarms that did not lead to clinical interventions as nonactionable alarm exposures, but we did not evaluate the response time to any ventilator alarms.
Data Collection
We combined video recordings with monitor time‐stamp data to evaluate the association between nonactionable alarms and the nurse's response time. Our detailed video recording and annotation methods have been published separately.[15] Briefly, we mounted up to 6 small video cameras in patients' rooms and recorded up to 6 hours per session. The cameras captured the monitor display, a wide view of the room, a close‐up view of the patient, and all windows and doors through which staff could visually assess the patient without entering the room.
Video Processing, Review, and Annotation
The first 5 video sessions were reviewed in a group training setting. Research assistants received instruction on how to determine alarm validity and actionability in accordance with the study definitions. Following the training period, the review workflow was as follows. First, a research assistant entered basic information and a preliminary assessment of the alarm's clinical validity and actionability into a REDCap (Research Electronic Data Capture; Vanderbilt University, Nashville, TN) database.[16] Later, a physician investigator secondarily reviewed all alarms and confirmed the assessments of the research assistants or, when disagreements occurred, discussed and reconciled the database. Alarms that remained unresolved after secondary review were flagged for review with an additional physician or nurse investigator in a team meeting.
Data Analysis
We summarized the patient and nurse subjects, the distributions of alarms, and the response times to potentially critical monitor alarms that occurred while neither the nurse nor any other clinicians were in the patient's room. We explored the data using plots of alarms and response times occurring within individual video sessions as well as with simple linear regression. Hypothesizing that any alarm fatigue effect would be strongest in the highest alarm patients, and having observed that alarms are distributed very unevenly across patients in both the PICU and ward, we made the decision not to use quartiles, but rather to form clinically meaningful categories. We also hypothesized that nurses might not exhibit alarm fatigue unless they were inundated with alarms. We thus divided the nonactionable alarm counts over the preceding 120 minutes into 3 categories: 0 to 29 alarms to represent a low to average alarm rate exhibited by the bottom 50% of the patients, 30 to 79 alarms to represent an elevated alarm rate, and 80+ alarms to represent an extremely high alarm rate exhibited by the top 5%. Because the exposure time was 120 minutes, we conducted the analysis on the alarms occurring after a nurse had been video recorded for at least 120 minutes.
We further evaluated the relationship between nonactionable alarms and nurse response time with Kaplan‐Meier plots by nonactionable alarm count category using the observed response‐time data. The Kaplan‐Meier plots compared response time across the nonactionable alarm exposure group, without any statistical modeling. A log‐rank test stratified by nurse evaluated whether the distributions of response time in the Kaplan‐Meier plots differed across the 3 alarm exposure groups, accounting for within‐nurse clustering.
Accelerated failure‐time regression based on the Weibull distribution then allowed us to compare response time across each alarm exposure group and provided confidence intervals. Accelerated failure‐time models are comparable to Cox models, but emphasize time to event rather than hazards.[17, 18] We determined that the Weibull distribution was suitable by evaluating smoothed hazard and log‐hazard plots, the confidence intervals of the shape parameters in the Weibull models that did not include 1, and by demonstrating that the Weibull model had better fit than an alternative (exponential) model using the likelihood‐ratio test (P<0.0001 for PICU, P=0.02 for ward). Due to the small sample size of nurses and patients, we could not adjust for nurse‐ or patient‐level covariates in the model. When comparing the nonactionable alarm exposure groups in the regression model (029 vs 3079, 3079 vs 80+, and 029 vs 80+), we Bonferroni corrected the critical P value for the 3 comparisons, for a critical P value of 0.05/3=0.0167.
Nurse Questionnaire
At the session's conclusion, nurses completed a questionnaire that included demographics and asked, Did you respond more quickly to monitor alarms during this study because you knew you were being filmed? to measure if nurses would report experiencing a Hawthorne‐like effect.[19, 20, 21]
RESULTS
We performed 40 sessions among 40 patients and 36 nurses over 210 hours. We performed 20 sessions in children with heart and/or lung failure in the PICU and 20 sessions in children on a general ward. Sessions took place on weekdays between 9:00 am and 6:00 pm. There were 3 occasions when we filmed 2 patients cared for by the same nurse at the same time.
Nurses were mostly female (94.4%) and had between 2 months and 28 years of experience (median, 4.8 years). Patients on the ward ranged from 5 days to 5.4 years old (median, 6 months). Patients in the PICU ranged from 5 months to 16 years old (median, 2.5 years). Among the PICU patients, 14 (70%) were receiving mechanical ventilation only, 3 (15%) were receiving vasopressors only, and 3 (15%) were receiving mechanical ventilation and vasopressors.
We observed 5070 alarms during the 40 sessions. We excluded 108 (2.1%) that occurred at the end of video recording sessions with the nurse absent from the room because the nurse's response could not be determined. Alarms per session ranged from 10 to 1430 (median, 75; interquartile range [IQR], 35138). We excluded the outlier PICU patient with 1430 alarms in 5 hours from the analysis to avoid the potential for biasing the results. Figure 2 depicts the data flow.
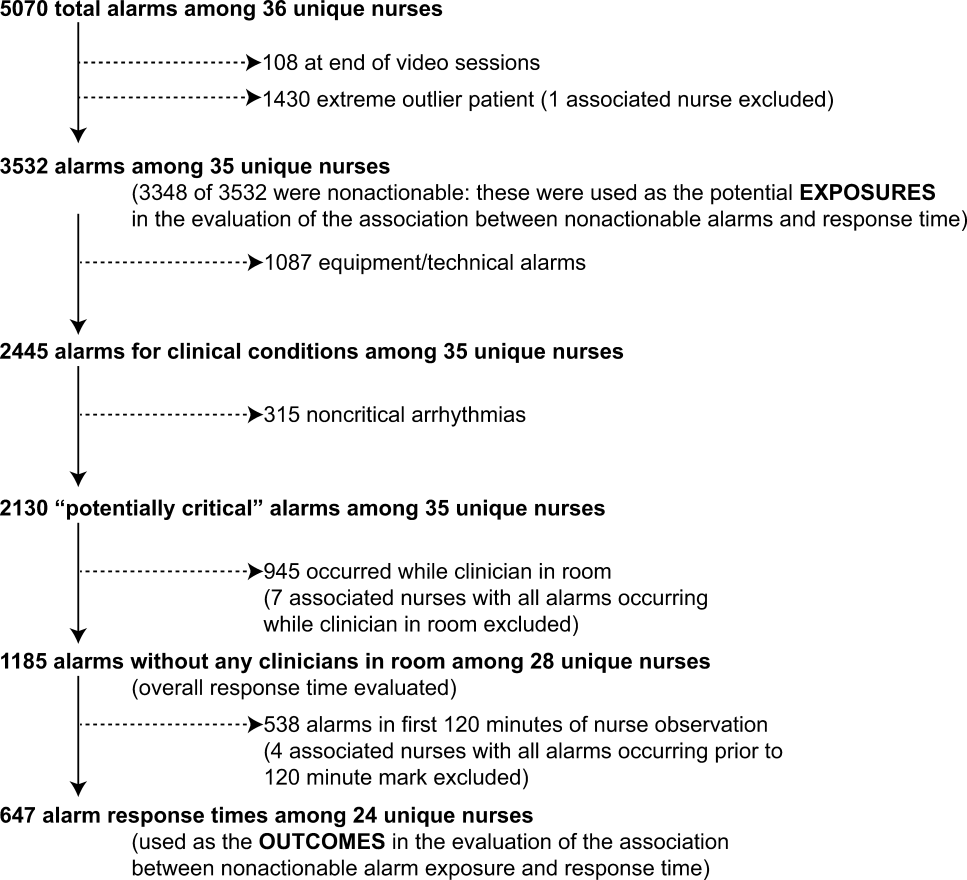
Following the 5 training sessions, research assistants independently reviewed and made preliminary assessments on 4674 alarms; these alarms were all secondarily reviewed by a physician. Using the physician reviewer as the gold standard, the research assistant's sensitivity (assess alarm as actionable when physician also assesses as actionable) was 96.8% and specificity (assess alarm as nonactionable when physician also assesses as nonactionable) was 96.9%. We had to review 54 of 4674 alarms (1.2%) with an additional physician or nurse investigator to achieve consensus.
Characteristics of the 2445 alarms for clinical conditions are shown in Table 1. Only 12.9% of alarms in heart‐ and/or lung‐failure patients in the PICU were actionable, and only 1.0% of alarms in medical patients on a general inpatient ward were actionable.
Overall Response Times for Out‐of‐Room Alarms
We first evaluated response times without excluding alarms occurring prior to the 120‐minute mark. Of the 2445 clinical condition alarms, we excluded the 315 noncritical arrhythmia types from analysis of response time because they did not meet our definition of potentially critical alarms. Of the 2130 potentially critical alarms, 1185 (55.6%) occurred while neither the nurse nor any other clinician was in the patient's room. We proceeded to analyze the response time to these 1185 alarms (307 in the PICU and 878 on the ward). In the PICU, median response time was 3.3 minutes (IQR, 0.814.4). On the ward, median response time was 9.8 minutes (IQR, 3.222.4).
Response‐Time Association With Nonactionable Alarm Exposure
Next, we analyzed the association between response time to potentially critical alarms that occurred when the nurse was not in the patient's room and the number of nonactionable alarms occurring over the preceding 120‐minute window. This required excluding the alarms that occurred in the first 120 minutes of each session, leaving 647 alarms with eligible response times to evaluate the exposure between prior nonactionable alarm exposure and response time: 219 in the PICU and 428 on the ward. Kaplan‐Meier plots and tabulated response times demonstrated the incremental relationships between each nonactionable alarm exposure category in the observed data, with the effects most prominent as the Kaplan‐Meier plots diverged beyond the median (Figure 3 and Table 2). Excluding the extreme outlier patient had no effect on the results, because 1378 of the 1430 alarms occurred with the nurse present at the bedside, and only 2 of the remaining alarms were potentially critical.
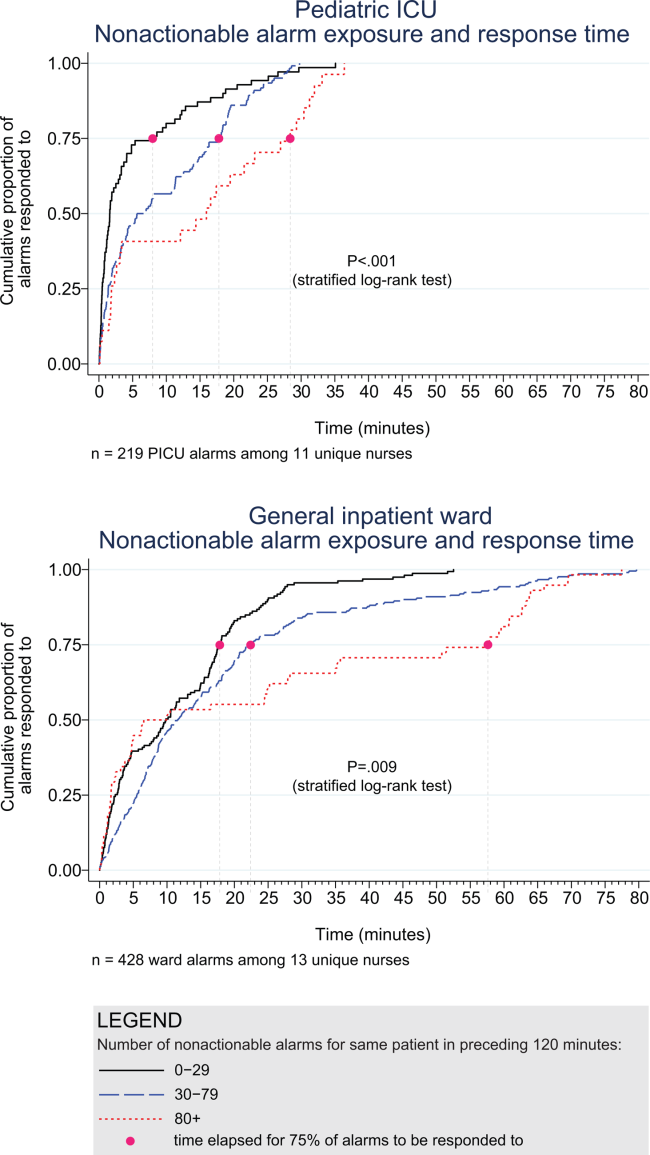
| Observed Data | Accelerated Failure‐Time Model | |||||||
|---|---|---|---|---|---|---|---|---|
| Number of Potentially Critical Alarms | Minutes Elapsed Until This Percentage of Alarms Was Responded to | Modeled Response Time, min | 95% CI, min | P Value* | ||||
| 50% (Median) | 75% | 90% | 95% | |||||
| ||||||||
| PICU | ||||||||
| 029 nonactionable alarms | 70 | 1.6 | 8.0 | 18.6 | 25.1 | 2.8 | 1.9‐3.8 | Reference |
| 3079 nonactionable alarms | 122 | 6.3 | 17.8 | 22.5 | 26.0 | 5.3 | 4.06.7 | 0.001 (vs 029) |
| 80+ nonactionable alarms | 27 | 16.0 | 28.4 | 32.0 | 33.1 | 8.5 | 4.312.7 | 0.009 (vs 029), 0.15 (vs 3079) |
| Ward | ||||||||
| 029 nonactionable alarms | 159 | 9.8 | 17.8 | 25.0 | 28.9 | 7.7 | 6.39.1 | Reference |
| 3079 nonactionable alarms | 211 | 11.6 | 22.4 | 44.6 | 63.2 | 11.5 | 9.613.3 | 0.001 (vs 029) |
| 80+ nonactionable alarms | 58 | 8.3 | 57.6 | 63.8 | 69.5 | 15.6 | 11.020.1 | 0.001 (vs 029), 0.09 (vs 3079) |
Accelerated failure‐time regressions revealed significant incremental increases in the modeled response time as the number of preceding nonactionable alarms increased in both the PICU and ward settings (Table 2).
Hawthorne‐like Effects
Four of the 36 nurses reported that they responded more quickly to monitor alarms because they knew they were being filmed.
DISCUSSION
Alarm fatigue has recently generated interest among nurses,[22] physicians,[23] regulatory bodies,[24] patient safety organizations,[25] and even attorneys,[26] despite a lack of prior evidence linking nonactionable alarm exposure to response time or other adverse patient‐relevant outcomes. This study's main findings were that (1) the vast majority of alarms were nonactionable, (2) response time to alarms occurring while the nurse was out of the room increased as the number of nonactionable alarms over the preceding 120 minutes increased. These findings may be explained by alarm fatigue.
Our results build upon the findings of other related studies. The nonactionable alarm proportions we found were similar to other pediatric studies, reporting greater than 90% nonactionable alarms.[1, 2] One other study has reported a relationship between alarm exposure and response time. In that study, Voepel‐Lewis and colleagues evaluated nurse responses to pulse oximetry desaturation alarms in adult orthopedic surgery patients using time‐stamp data from their monitor notification system.[27] They found that alarm response time was significantly longer for patients in the highest quartile of alarms compared to those in lower quartiles. Our study provides new data suggesting a relationship between nonactionable alarm exposure and nurse response time.
Our study has several limitations. First, as a preliminary study to investigate feasibility and possible association, the sample of patients and nurses was necessarily limited and did not permit adjustment for nurse‐ or patient‐level covariates. A multivariable analysis with a larger sample might provide insight into alternate explanations for these findings other than alarm fatigue, including measures of nurse workload and patient factors (such as age and illness severity). Additional factors that are not as easily measured can also contribute to the complex decision of when and how to respond to alarms.[28, 29] Second, nurses were aware that they were being video recorded as part of a study of nonactionable alarms, although they did not know the specific details of measurement. Although this lack of blinding might lead to a Hawthorne‐like effect, our positive results suggest that this effect, if present, did not fully obscure the association. Third, all sessions took place on weekdays during daytime hours, but effects of nonactionable alarms might vary by time and day. Finally, we suspect that when nurses experience critical alarms that require them to intervene and rescue a patient, their response times to that patient's alarms that occur later in their shift will be quicker due to a heightened concern for the alarm being actionable. We were unable to explore that relationship in this analysis because the number of critical alarms requiring intervention was very small. This is a topic of future study.
CONCLUSIONS
We identified an association between a nurse's prior exposure to nonactionable alarms and response time to future alarms. This finding is consistent with alarm fatigue, but requires further study to more clearly delineate other factors that might confound or modify that relationship.
Disclosures
This project was funded by the Health Research Formula Fund Grant 4100050891 from the Pennsylvania Department of Public Health Commonwealth Universal Research Enhancement Program (awarded to Drs. Keren and Bonafide). Dr. Bonafide is also supported by the National Heart, Lung, and Blood Institute of the National Institutes of Health under award number K23HL116427. The content is solely the responsibility of the authors and does not necessarily represent the official views of the National Institutes of Health. The authors have no financial relationships or conflicts of interest relevant to this article to disclose.
- . Crying wolf: false alarms in a pediatric intensive care unit. Crit Care Med. 1994;22(6):981–985.
- , . Poor prognosis for existing monitors in the intensive care unit. Crit Care Med. 1997;25(4):614–619.
- , , , , . Clinical evaluation of alarm efficiency in intensive care [in French]. Ann Fr Anesth Reanim. 2000;19:459–466.
- , , , . Reducing false alarms of intensive care online‐monitoring systems: an evaluation of two signal extraction algorithms. Comput Math Methods Med. 2011;2011:143480.
- , , , , , . Multicentric study of monitoring alarms in the adult intensive care unit (ICU): a descriptive analysis. Intensive Care Med. 1999;25:1360–1366.
- , , . Improving alarm performance in the medical intensive care unit using delays and clinical context. Anesth Analg. 2009;108:1546–1552.
- , . Monitor alarm fatigue: standardizing use of physiological monitors and decreasing nuisance alarms. Am J Crit Care. 2010;19:28–34.
- , , , , , . Intensive care unit alarms—how many do we need? Crit Care Med. 2010;38:451–456.
- , , , . System operator response to warnings of danger: a laboratory investigation of the effects of the predictive value of a warning on human response time. J Exp Psychol Appl. 1995;1:19–33.
- , , . Human probability matching behaviour in response to alarms of varying reliability. Ergonomics. 1995;38:2300–2312.
- The Joint Commission. Sentinel event alert: medical device alarm safety in hospitals. 2013. Available at: http://www.jointcommission.org/sea_issue_50/. Accessed October 9, 2014.
- . Joint commission warns of alarm fatigue: multitude of alarms from monitoring devices problematic. JAMA. 2013;309(22):2315–2316.
- . Monitor alarm fatigue: an integrative review. Biomed Instrum Technol. 2012;46(4):268–277.
- NIH Certificates of Confidentiality Kiosk. Available at: http://grants.nih.gov/grants/policy/coc/. Accessed April 21, 2014.
- , , , et al. Video methods for evaluating physiologic monitor alarms and alarm responses. Biomed Instrum Technol. 2014;48(3):220–230.
- , , , , , . Research electronic data capture (REDCap)—a metadata‐driven methodology and workflow process for providing translational research informatics support. J Biomed Inf. 2009;42:377–381.
- . Accelerated failure time and other parametric models. In: Modelling Survival Data in Medical Research. 2nd ed. Boca Raton, FL: Chapman 2003:197–229.
- , , , . Parametric models. In: An Introduction to Survival Analysis Using Stata, 3rd ed. College Station, TX: Stata Press; 2010:229–244.
- , . Management and the Worker. Cambridge, MA: Harvard University Press; 1939.
- . What happened at Hawthorne? Science. 1974;183(4128):922–932.
- , , , , . Validation of the Work Observation Method By Activity Timing (WOMBAT) method of conducting time‐motion observations in critical care settings: an observational study. BMC Med Inf Decis Mak. 2011;11:32.
- , . Alarm fatigue: a patient safety concern. AACN Adv Crit Care. 2013;24(4):378–386.
- , . Redesigning hospital alarms for patient safety: alarmed and potentially dangerous. JAMA. 2014;311(12):1199–1200.
- The Joint Commission. The Joint Commission announces 2014 National Patient Safety Goal. Jt Comm Perspect. 2013;33:1–4.
- Top 10 health technology hazards for 2014. Health Devices. 2013;42(11):354–380.
- My Philly Lawyer. Medical malpractice: alarm fatigue threatens patient safety. 2014. Available at: http://www.myphillylawyer.com/Resources/Legal-Articles/Medical-Malpractice-Alarm-Fatigue-Threatens-Patient-Safety.shtml. Accessed April 4, 2014.
- , , , et al. Pulse oximetry desaturation alarms on a general postoperative adult unit: a prospective observational study of nurse response time. Int J Nurs Stud. 2013;50(10):1351–1358.
- , , , , . A description of nurses' decision‐making in managing electrocardiographic monitor alarms [published online ahead of print May 10, 2014]. J Clin Nurs. doi:10.1111/jocn.12625.
- . Nurses' response to frequency and types of electrocardiography alarms in a non‐critical care setting: a descriptive study. Int J Nurs Stud. 2014;51(2):190–197.
Hospital physiologic monitors can alert clinicians to early signs of physiologic deterioration, and thus have great potential to save lives. However, monitors generate frequent alarms,[1, 2, 3, 4, 5, 6, 7, 8] and most are not relevant to the patient's safety (over 90% of pediatric intensive care unit (PICU)[1, 2] and over 70% of adult intensive care alarms).[5, 6] In psychology experiments, humans rapidly learn to ignore or respond more slowly to alarms when exposed to high false‐alarm rates, exhibiting alarm fatigue.[9, 10] In 2013, The Joint Commission named alarm fatigue the most common contributing factor to alarm‐related sentinel events in hospitals.[11, 12]
Although alarm fatigue has been implicated as a major threat to patient safety, little empirical data support its existence in hospitals. In this study, we aimed to determine if there was an association between nurses' recent exposure to nonactionable physiologic monitor alarms and their response time to future alarms for the same patients. This exploratory work was designed to inform future research in this area, acknowledging that the sample size would be too small for multivariable modeling.
METHODS
Study Definitions
The alarm classification scheme is shown in Figure 1. Note that, for clarity, we have intentionally avoided using the terms true and false alarms because their interpretations vary across studies and can be misleading.
Potentially Critical Alarm
A potentially critical alarm is any alarm for a clinical condition for which a timely response is important to determine if the alarm requires intervention to save the patient's life. This is based on the alarm type alone, including alarms for life‐threatening arrhythmias such as asystole and ventricular tachycardia, as well as alarms for vital signs outside the set limits. Supporting Table 1 in the online version of this article lists the breakdown of alarm types that we defined a priori as potentially and not potentially critical.
| PICU | Ward | |||||||
|---|---|---|---|---|---|---|---|---|
| Alarm type | No. | % of Total | % Valid | % Actionable | No. | % of Total | % Valid | % Actionable |
| ||||||||
| Oxygen saturation | 197 | 19.4 | 82.7 | 38.6 | 590 | 41.2 | 24.4 | 1.9 |
| Heart rate | 194 | 19.1 | 95.4 | 1.0 | 266 | 18.6 | 87.2 | 0.0 |
| Respiratory rate | 229 | 22.6 | 80.8 | 13.5 | 316 | 22.1 | 48.1 | 1.0 |
| Blood pressure | 259 | 25.5 | 83.8 | 5.8 | 11 | 0.8 | 72.7 | 0.0 |
| Critical arrhythmia | 1 | 0.1 | 0.0 | 0.0 | 4 | 0.3 | 0.0 | 0.0 |
| Noncritical arrhythmia | 71 | 7.0 | 2.8 | 0.0 | 244 | 17.1 | 8.6 | 0.0 |
| Central venous pressure | 49 | 4.8 | 0.0 | 0.0 | 0 | 0.0 | N/A | N/A |
| Exhaled carbon dioxide | 14 | 1.4 | 92.9 | 50.0 | 0 | 0.0 | N/A | N/A |
| Total | 1014 | 100.0 | 75.6 | 12.9 | 1,431 | 100.0 | 38.9 | 1.0 |
Valid Alarm
A valid alarm is any alarm that correctly identifies the physiologic status of the patient. Validity was based on waveform quality, lead signal strength indicators, and artifact conditions, referencing each monitor's operator's manual.
Actionable Alarm
An actionable alarm is any valid alarm for a clinical condition that either: (1) leads to a clinical intervention; (2) leads to a consultation with another clinician at the bedside (and thus visible on camera); or (3) is a situation that should have led to intervention or consultation, but the alarm was unwitnessed or misinterpreted by the staff at the bedside.
Nonactionable Alarm
An unactionable alarm is any alarm that does not meet the actionable definition above, including invalid alarms such as those caused by motion artifact, equipment/technical alarms, and alarms that are valid but nonactionable (nuisance alarms).[13]
Response Time
The response time is the time elapsed from when the alarm fired at the bedside to when the nurse entered the room or peered through a window or door, measured in seconds.
Setting and Subjects
We performed this study between August 2012 and July 2013 at a freestanding children's hospital. We evaluated nurses caring for 2 populations: (1) PICU patients with heart and/or lung failure (requiring inotropic support and/or invasive mechanical ventilation), and (2) medical patients on a general inpatient ward. Nurses caring for heart and/or lung failure patients in the PICU typically were assigned 1 to 2 total patients. Nurses on the medical ward typically were assigned 2 to 4 patients. We identified subjects from the population of nurses caring for eligible patients with parents available to provide in‐person consent in each setting. Our primary interest was to evaluate the association between nonactionable alarms and response time, and not to study the epidemiology of alarms in a random sample. Therefore, when alarm data were available prior to screening, we first approached nurses caring for patients in the top 25% of alarm rates for that unit over the preceding 4 hours. We identified preceding alarm rates using BedMasterEx (Excel Medical Electronics, Jupiter, FL).
Human Subjects Protection
This study was approved by the institutional review board of The Children's Hospital of Philadelphia. We obtained written in‐person consent from the patient's parent and the nurse subject. We obtained a Certificate of Confidentiality from the National Institutes of Health to further protect study participants.[14]
Monitoring Equipment
All patients in the PICU were monitored continuously using General Electric (GE) (Fairfield, CT) solar devices. All bed spaces on the wards include GE Dash monitors that are used if ordered. On the ward we studied, 30% to 50% of patients are typically monitored at any given time. In addition to alarming at the bedside, most clinical alarms also generated a text message sent to the nurse's wireless phone listing the room number and the word monitor. Messages did not provide any clinical information about the alarm or patient's status. There were no technicians reviewing alarms centrally.
Physicians used an order set to order monitoring, selecting 1 of 4 available preconfigured profiles: infant <6 months, infant 6 months to 1 year, child, and adult. The parameters for each age group are in Supporting Figure 1, available in the online version of this article. A physician order is required for a nurse to change the parameters. Participating in the study did not affect this workflow.
Primary Outcome
The primary outcome was the nurse's response time to potentially critical monitor alarms that occurred while neither they nor any other clinicians were in the patient's room.
Primary Exposure and Alarm Classification
The primary exposure was the number of nonactionable alarms in the same patient over the preceding 120 minutes (rolling and updated each minute). The alarm classification scheme is shown in Figure 1.
Due to technical limitations with obtaining time‐stamped alarm data from the different ventilators in use during the study period, we were unable to identify the causes of all ventilator alarms. Therefore, we included ventilator alarms that did not lead to clinical interventions as nonactionable alarm exposures, but we did not evaluate the response time to any ventilator alarms.
Data Collection
We combined video recordings with monitor time‐stamp data to evaluate the association between nonactionable alarms and the nurse's response time. Our detailed video recording and annotation methods have been published separately.[15] Briefly, we mounted up to 6 small video cameras in patients' rooms and recorded up to 6 hours per session. The cameras captured the monitor display, a wide view of the room, a close‐up view of the patient, and all windows and doors through which staff could visually assess the patient without entering the room.
Video Processing, Review, and Annotation
The first 5 video sessions were reviewed in a group training setting. Research assistants received instruction on how to determine alarm validity and actionability in accordance with the study definitions. Following the training period, the review workflow was as follows. First, a research assistant entered basic information and a preliminary assessment of the alarm's clinical validity and actionability into a REDCap (Research Electronic Data Capture; Vanderbilt University, Nashville, TN) database.[16] Later, a physician investigator secondarily reviewed all alarms and confirmed the assessments of the research assistants or, when disagreements occurred, discussed and reconciled the database. Alarms that remained unresolved after secondary review were flagged for review with an additional physician or nurse investigator in a team meeting.
Data Analysis
We summarized the patient and nurse subjects, the distributions of alarms, and the response times to potentially critical monitor alarms that occurred while neither the nurse nor any other clinicians were in the patient's room. We explored the data using plots of alarms and response times occurring within individual video sessions as well as with simple linear regression. Hypothesizing that any alarm fatigue effect would be strongest in the highest alarm patients, and having observed that alarms are distributed very unevenly across patients in both the PICU and ward, we made the decision not to use quartiles, but rather to form clinically meaningful categories. We also hypothesized that nurses might not exhibit alarm fatigue unless they were inundated with alarms. We thus divided the nonactionable alarm counts over the preceding 120 minutes into 3 categories: 0 to 29 alarms to represent a low to average alarm rate exhibited by the bottom 50% of the patients, 30 to 79 alarms to represent an elevated alarm rate, and 80+ alarms to represent an extremely high alarm rate exhibited by the top 5%. Because the exposure time was 120 minutes, we conducted the analysis on the alarms occurring after a nurse had been video recorded for at least 120 minutes.
We further evaluated the relationship between nonactionable alarms and nurse response time with Kaplan‐Meier plots by nonactionable alarm count category using the observed response‐time data. The Kaplan‐Meier plots compared response time across the nonactionable alarm exposure group, without any statistical modeling. A log‐rank test stratified by nurse evaluated whether the distributions of response time in the Kaplan‐Meier plots differed across the 3 alarm exposure groups, accounting for within‐nurse clustering.
Accelerated failure‐time regression based on the Weibull distribution then allowed us to compare response time across each alarm exposure group and provided confidence intervals. Accelerated failure‐time models are comparable to Cox models, but emphasize time to event rather than hazards.[17, 18] We determined that the Weibull distribution was suitable by evaluating smoothed hazard and log‐hazard plots, the confidence intervals of the shape parameters in the Weibull models that did not include 1, and by demonstrating that the Weibull model had better fit than an alternative (exponential) model using the likelihood‐ratio test (P<0.0001 for PICU, P=0.02 for ward). Due to the small sample size of nurses and patients, we could not adjust for nurse‐ or patient‐level covariates in the model. When comparing the nonactionable alarm exposure groups in the regression model (029 vs 3079, 3079 vs 80+, and 029 vs 80+), we Bonferroni corrected the critical P value for the 3 comparisons, for a critical P value of 0.05/3=0.0167.
Nurse Questionnaire
At the session's conclusion, nurses completed a questionnaire that included demographics and asked, Did you respond more quickly to monitor alarms during this study because you knew you were being filmed? to measure if nurses would report experiencing a Hawthorne‐like effect.[19, 20, 21]
RESULTS
We performed 40 sessions among 40 patients and 36 nurses over 210 hours. We performed 20 sessions in children with heart and/or lung failure in the PICU and 20 sessions in children on a general ward. Sessions took place on weekdays between 9:00 am and 6:00 pm. There were 3 occasions when we filmed 2 patients cared for by the same nurse at the same time.
Nurses were mostly female (94.4%) and had between 2 months and 28 years of experience (median, 4.8 years). Patients on the ward ranged from 5 days to 5.4 years old (median, 6 months). Patients in the PICU ranged from 5 months to 16 years old (median, 2.5 years). Among the PICU patients, 14 (70%) were receiving mechanical ventilation only, 3 (15%) were receiving vasopressors only, and 3 (15%) were receiving mechanical ventilation and vasopressors.
We observed 5070 alarms during the 40 sessions. We excluded 108 (2.1%) that occurred at the end of video recording sessions with the nurse absent from the room because the nurse's response could not be determined. Alarms per session ranged from 10 to 1430 (median, 75; interquartile range [IQR], 35138). We excluded the outlier PICU patient with 1430 alarms in 5 hours from the analysis to avoid the potential for biasing the results. Figure 2 depicts the data flow.
Following the 5 training sessions, research assistants independently reviewed and made preliminary assessments on 4674 alarms; these alarms were all secondarily reviewed by a physician. Using the physician reviewer as the gold standard, the research assistant's sensitivity (assess alarm as actionable when physician also assesses as actionable) was 96.8% and specificity (assess alarm as nonactionable when physician also assesses as nonactionable) was 96.9%. We had to review 54 of 4674 alarms (1.2%) with an additional physician or nurse investigator to achieve consensus.
Characteristics of the 2445 alarms for clinical conditions are shown in Table 1. Only 12.9% of alarms in heart‐ and/or lung‐failure patients in the PICU were actionable, and only 1.0% of alarms in medical patients on a general inpatient ward were actionable.
Overall Response Times for Out‐of‐Room Alarms
We first evaluated response times without excluding alarms occurring prior to the 120‐minute mark. Of the 2445 clinical condition alarms, we excluded the 315 noncritical arrhythmia types from analysis of response time because they did not meet our definition of potentially critical alarms. Of the 2130 potentially critical alarms, 1185 (55.6%) occurred while neither the nurse nor any other clinician was in the patient's room. We proceeded to analyze the response time to these 1185 alarms (307 in the PICU and 878 on the ward). In the PICU, median response time was 3.3 minutes (IQR, 0.814.4). On the ward, median response time was 9.8 minutes (IQR, 3.222.4).
Response‐Time Association With Nonactionable Alarm Exposure
Next, we analyzed the association between response time to potentially critical alarms that occurred when the nurse was not in the patient's room and the number of nonactionable alarms occurring over the preceding 120‐minute window. This required excluding the alarms that occurred in the first 120 minutes of each session, leaving 647 alarms with eligible response times to evaluate the exposure between prior nonactionable alarm exposure and response time: 219 in the PICU and 428 on the ward. Kaplan‐Meier plots and tabulated response times demonstrated the incremental relationships between each nonactionable alarm exposure category in the observed data, with the effects most prominent as the Kaplan‐Meier plots diverged beyond the median (Figure 3 and Table 2). Excluding the extreme outlier patient had no effect on the results, because 1378 of the 1430 alarms occurred with the nurse present at the bedside, and only 2 of the remaining alarms were potentially critical.
| Observed Data | Accelerated Failure‐Time Model | |||||||
|---|---|---|---|---|---|---|---|---|
| Number of Potentially Critical Alarms | Minutes Elapsed Until This Percentage of Alarms Was Responded to | Modeled Response Time, min | 95% CI, min | P Value* | ||||
| 50% (Median) | 75% | 90% | 95% | |||||
| ||||||||
| PICU | ||||||||
| 029 nonactionable alarms | 70 | 1.6 | 8.0 | 18.6 | 25.1 | 2.8 | 1.9‐3.8 | Reference |
| 3079 nonactionable alarms | 122 | 6.3 | 17.8 | 22.5 | 26.0 | 5.3 | 4.06.7 | 0.001 (vs 029) |
| 80+ nonactionable alarms | 27 | 16.0 | 28.4 | 32.0 | 33.1 | 8.5 | 4.312.7 | 0.009 (vs 029), 0.15 (vs 3079) |
| Ward | ||||||||
| 029 nonactionable alarms | 159 | 9.8 | 17.8 | 25.0 | 28.9 | 7.7 | 6.39.1 | Reference |
| 3079 nonactionable alarms | 211 | 11.6 | 22.4 | 44.6 | 63.2 | 11.5 | 9.613.3 | 0.001 (vs 029) |
| 80+ nonactionable alarms | 58 | 8.3 | 57.6 | 63.8 | 69.5 | 15.6 | 11.020.1 | 0.001 (vs 029), 0.09 (vs 3079) |
Accelerated failure‐time regressions revealed significant incremental increases in the modeled response time as the number of preceding nonactionable alarms increased in both the PICU and ward settings (Table 2).
Hawthorne‐like Effects
Four of the 36 nurses reported that they responded more quickly to monitor alarms because they knew they were being filmed.
DISCUSSION
Alarm fatigue has recently generated interest among nurses,[22] physicians,[23] regulatory bodies,[24] patient safety organizations,[25] and even attorneys,[26] despite a lack of prior evidence linking nonactionable alarm exposure to response time or other adverse patient‐relevant outcomes. This study's main findings were that (1) the vast majority of alarms were nonactionable, (2) response time to alarms occurring while the nurse was out of the room increased as the number of nonactionable alarms over the preceding 120 minutes increased. These findings may be explained by alarm fatigue.
Our results build upon the findings of other related studies. The nonactionable alarm proportions we found were similar to other pediatric studies, reporting greater than 90% nonactionable alarms.[1, 2] One other study has reported a relationship between alarm exposure and response time. In that study, Voepel‐Lewis and colleagues evaluated nurse responses to pulse oximetry desaturation alarms in adult orthopedic surgery patients using time‐stamp data from their monitor notification system.[27] They found that alarm response time was significantly longer for patients in the highest quartile of alarms compared to those in lower quartiles. Our study provides new data suggesting a relationship between nonactionable alarm exposure and nurse response time.
Our study has several limitations. First, as a preliminary study to investigate feasibility and possible association, the sample of patients and nurses was necessarily limited and did not permit adjustment for nurse‐ or patient‐level covariates. A multivariable analysis with a larger sample might provide insight into alternate explanations for these findings other than alarm fatigue, including measures of nurse workload and patient factors (such as age and illness severity). Additional factors that are not as easily measured can also contribute to the complex decision of when and how to respond to alarms.[28, 29] Second, nurses were aware that they were being video recorded as part of a study of nonactionable alarms, although they did not know the specific details of measurement. Although this lack of blinding might lead to a Hawthorne‐like effect, our positive results suggest that this effect, if present, did not fully obscure the association. Third, all sessions took place on weekdays during daytime hours, but effects of nonactionable alarms might vary by time and day. Finally, we suspect that when nurses experience critical alarms that require them to intervene and rescue a patient, their response times to that patient's alarms that occur later in their shift will be quicker due to a heightened concern for the alarm being actionable. We were unable to explore that relationship in this analysis because the number of critical alarms requiring intervention was very small. This is a topic of future study.
CONCLUSIONS
We identified an association between a nurse's prior exposure to nonactionable alarms and response time to future alarms. This finding is consistent with alarm fatigue, but requires further study to more clearly delineate other factors that might confound or modify that relationship.
Disclosures
This project was funded by the Health Research Formula Fund Grant 4100050891 from the Pennsylvania Department of Public Health Commonwealth Universal Research Enhancement Program (awarded to Drs. Keren and Bonafide). Dr. Bonafide is also supported by the National Heart, Lung, and Blood Institute of the National Institutes of Health under award number K23HL116427. The content is solely the responsibility of the authors and does not necessarily represent the official views of the National Institutes of Health. The authors have no financial relationships or conflicts of interest relevant to this article to disclose.
- . Crying wolf: false alarms in a pediatric intensive care unit. Crit Care Med. 1994;22(6):981–985.
- , . Poor prognosis for existing monitors in the intensive care unit. Crit Care Med. 1997;25(4):614–619.
- , , , , . Clinical evaluation of alarm efficiency in intensive care [in French]. Ann Fr Anesth Reanim. 2000;19:459–466.
- , , , . Reducing false alarms of intensive care online‐monitoring systems: an evaluation of two signal extraction algorithms. Comput Math Methods Med. 2011;2011:143480.
- , , , , , . Multicentric study of monitoring alarms in the adult intensive care unit (ICU): a descriptive analysis. Intensive Care Med. 1999;25:1360–1366.
- , , . Improving alarm performance in the medical intensive care unit using delays and clinical context. Anesth Analg. 2009;108:1546–1552.
- , . Monitor alarm fatigue: standardizing use of physiological monitors and decreasing nuisance alarms. Am J Crit Care. 2010;19:28–34.
- , , , , , . Intensive care unit alarms—how many do we need? Crit Care Med. 2010;38:451–456.
- , , , . System operator response to warnings of danger: a laboratory investigation of the effects of the predictive value of a warning on human response time. J Exp Psychol Appl. 1995;1:19–33.
- , , . Human probability matching behaviour in response to alarms of varying reliability. Ergonomics. 1995;38:2300–2312.
- The Joint Commission. Sentinel event alert: medical device alarm safety in hospitals. 2013. Available at: http://www.jointcommission.org/sea_issue_50/. Accessed October 9, 2014.
- . Joint commission warns of alarm fatigue: multitude of alarms from monitoring devices problematic. JAMA. 2013;309(22):2315–2316.
- . Monitor alarm fatigue: an integrative review. Biomed Instrum Technol. 2012;46(4):268–277.
- NIH Certificates of Confidentiality Kiosk. Available at: http://grants.nih.gov/grants/policy/coc/. Accessed April 21, 2014.
- , , , et al. Video methods for evaluating physiologic monitor alarms and alarm responses. Biomed Instrum Technol. 2014;48(3):220–230.
- , , , , , . Research electronic data capture (REDCap)—a metadata‐driven methodology and workflow process for providing translational research informatics support. J Biomed Inf. 2009;42:377–381.
- . Accelerated failure time and other parametric models. In: Modelling Survival Data in Medical Research. 2nd ed. Boca Raton, FL: Chapman 2003:197–229.
- , , , . Parametric models. In: An Introduction to Survival Analysis Using Stata, 3rd ed. College Station, TX: Stata Press; 2010:229–244.
- , . Management and the Worker. Cambridge, MA: Harvard University Press; 1939.
- . What happened at Hawthorne? Science. 1974;183(4128):922–932.
- , , , , . Validation of the Work Observation Method By Activity Timing (WOMBAT) method of conducting time‐motion observations in critical care settings: an observational study. BMC Med Inf Decis Mak. 2011;11:32.
- , . Alarm fatigue: a patient safety concern. AACN Adv Crit Care. 2013;24(4):378–386.
- , . Redesigning hospital alarms for patient safety: alarmed and potentially dangerous. JAMA. 2014;311(12):1199–1200.
- The Joint Commission. The Joint Commission announces 2014 National Patient Safety Goal. Jt Comm Perspect. 2013;33:1–4.
- Top 10 health technology hazards for 2014. Health Devices. 2013;42(11):354–380.
- My Philly Lawyer. Medical malpractice: alarm fatigue threatens patient safety. 2014. Available at: http://www.myphillylawyer.com/Resources/Legal-Articles/Medical-Malpractice-Alarm-Fatigue-Threatens-Patient-Safety.shtml. Accessed April 4, 2014.
- , , , et al. Pulse oximetry desaturation alarms on a general postoperative adult unit: a prospective observational study of nurse response time. Int J Nurs Stud. 2013;50(10):1351–1358.
- , , , , . A description of nurses' decision‐making in managing electrocardiographic monitor alarms [published online ahead of print May 10, 2014]. J Clin Nurs. doi:10.1111/jocn.12625.
- . Nurses' response to frequency and types of electrocardiography alarms in a non‐critical care setting: a descriptive study. Int J Nurs Stud. 2014;51(2):190–197.
© 2015 Society of Hospital Medicine

Medications and Pediatric Deterioration
In recent years, many hospitals have implemented rapid response systems (RRSs) in efforts to reduce mortality outside the intensive care unit (ICU). Rapid response systems include 2 clinical components (efferent and afferent limbs) and 2 organizational components (process improvement and administrative limbs).[1, 2] The efferent limb includes medical emergency teams (METs) that can be summoned to hospital wards to rescue deteriorating patients. The afferent limb identifies patients at risk of deterioration using tools such as early warning scores and triggers a MET response when appropriate.[2] The process‐improvement limb evaluates and optimizes the RRS. The administrative limb implements the RRS and supports its ongoing operation. The effectiveness of most RRSs depends upon the ward team making the decision to escalate care by activating the MET. Barriers to activating the MET may include reduced situational awareness,[3, 4] hierarchical barriers to calling for help,[3, 4, 5, 6, 7, 8] fear of criticism,[3, 8, 9] and other hospital safety cultural barriers.[3, 4, 8]
Proactive critical‐care outreach[10, 11, 12, 13] or rover[14] teams seek to reduce barriers to activation and improve outcomes by systematically identifying and evaluating at‐risk patients without relying on requests for assistance from the ward team. Structured similarly to early warning scores, surveillance tools intended for rover teams might improve their ability to rapidly identify at‐risk patients throughout a hospital. They could combine vital signs with other variables, such as diagnostic and therapeutic interventions that reflect the ward team's early, evolving concern. In particular, the incorporation of medications associated with deterioration may enhance the performance of surveillance tools.
Medications may be associated with deterioration in one of several ways. They could play a causal role in deterioration (ie, opioids causing respiratory insufficiency), represent clinical worsening and anticipation of possible deterioration (ie, broad‐spectrum antibiotics for a positive blood culture), or represent rescue therapies for early deterioration (ie, antihistamines for allergic reactions). In each case, the associated therapeutic classes could be considered sentinel markers of clinical deterioration.
Combined with vital signs and other risk factors, therapeutic classes could serve as useful components of surveillance tools to detect signs of early, evolving deterioration and flag at‐risk patients for evaluation. As a first step, we sought to identify therapeutic classes associated with clinical deterioration. This effort to improve existing afferent tools falls within the process‐improvement limb of RRSs.
PATIENTS AND METHODS
Study Design
We performed a case‐crossover study of children who experienced clinical deterioration. An alternative to the matched case‐control design, the case‐crossover design involves longitudinal within‐subject comparisons exclusively of case subjects such that an individual serves as his or her own control. It is most effective when studying intermittent exposures that result in transient changes in the risk of an acute event,[15, 16, 17] making it appropriate for our study.
Using the case‐crossover design, we compared a discrete time period in close proximity to the deterioration event, called the hazard interval, with earlier time periods in the hospitalization, called the control intervals.[15, 16, 17] In our primary analysis (Figure 1B), we defined the durations of these intervals as follows: We first censored the 2 hours immediately preceding the clinical deterioration event (hours 0 to 2). We made this decision a priori to exclude medications used after deterioration was recognized and resuscitation had already begun. The 12‐hour period immediately preceding the censored interval was the hazard interval (hours 2 to 14). Each 12‐hour period immediately preceding the hazard interval was a control interval (hours 14 to 26, 26 to 38, 38 to 50, and 50 to 62). Depending on the child's length of stay prior to the deterioration event, each hazard interval had 14 control intervals for comparison. In sensitivity analysis, we altered the durations of these intervals (see below).
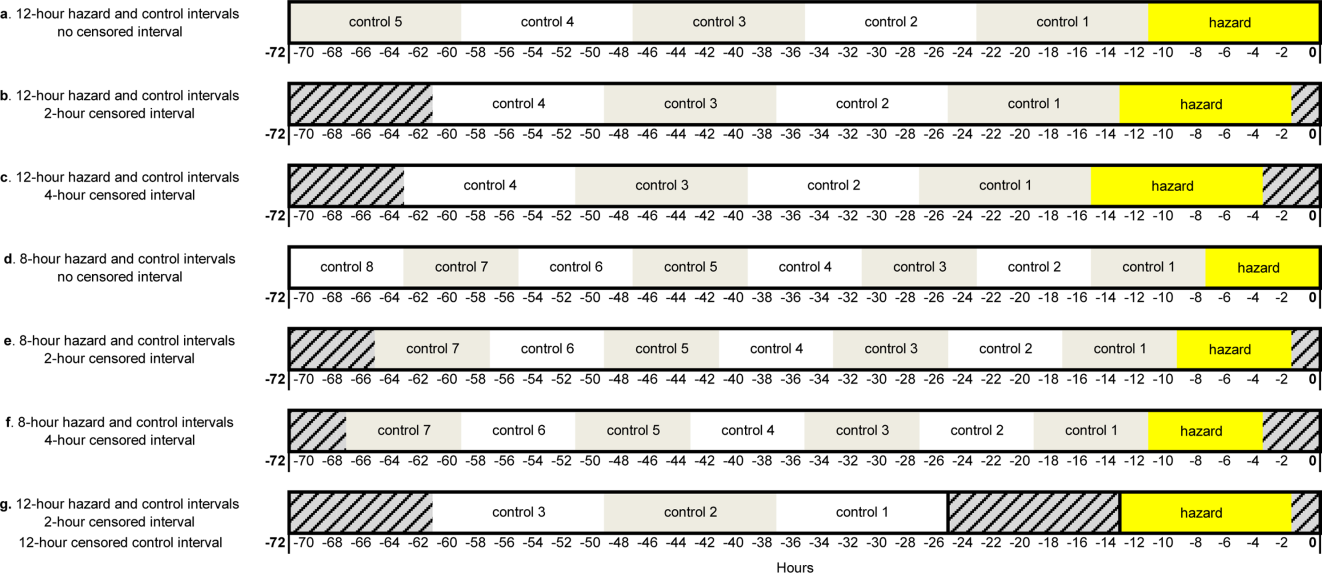
Study Setting and Participants
We performed this study among children age <18 years who experienced clinical deterioration between January 1, 2005, and December 31, 2008, after being hospitalized on a general medical or surgical unit at The Children's Hospital of Philadelphia for 24 hours. Clinical deterioration was a composite outcome defined as cardiopulmonary arrest (CPA), acute respiratory compromise (ARC), or urgent ICU transfer. Cardiopulmonary arrest events required either pulselessness or a pulse with inadequate perfusion treated with chest compressions and/or defibrillation. Acute respiratory compromise events required respiratory insufficiency treated with bag‐valve‐mask or invasive airway interventions. Urgent ICU transfers included 1 of the following outcomes in the 12 hours after transfer: death, CPA, intubation, initiation of noninvasive ventilation, or administration of a vasoactive medication infusion used for the treatment of shock. Time zero was the time of the CPA/ARC, or the time at which the child arrived in the ICU for urgent transfers. These subjects also served as the cases for a previously published case‐control study evaluating different risk factors for deterioration.[18] The institutional review board of The Children's Hospital of Philadelphia approved the study.
At the time of the study, the hospital did not have a formal RRS. An immediate‐response code‐blue team was available throughout the study period for emergencies occurring outside the ICU. Physicians could also page the pediatric ICU fellow to discuss patients who did not require immediate assistance from the code‐blue team but were clinically deteriorating. There were no established triggering criteria.
Medication Exposures
Intravenous (IV) medications administered in the 72 hours prior to clinical deterioration were considered the exposures of interest. Each medication was included in 1 therapeutic classes assigned in the hospital's formulary (Lexicomp, Hudson, OH).[19] In order to determine which therapeutic classes to evaluate, we performed a power calculation using the sampsi_mcc package for Stata 12 (StataCorp, College Station, TX). We estimated that we would have 3 matched control intervals per hazard interval. We found that, in order to detect a minimum odds ratio of 3.0 with 80% power, a therapeutic class had to be administered in 5% of control periods. All therapeutic classes meeting that requirement were included in the analysis and are listed in Table 1. (See lists of the individual medications comprising each class in the Supporting Information, Tables 124, in the online version of this article.)
| Therapeutic Class | No. of Control Intervals | % |
|---|---|---|
| ||
| Sedatives | 107 | 25 |
| Antiemetics | 92 | 22 |
| Third‐ and fourth‐generation cephalosporins | 83 | 20 |
| Antihistamines | 74 | 17 |
| Antidotes to hypersensitivity reactions (diphenhydramine) | 65 | 15 |
| Gastric acid secretion inhibitors | 62 | 15 |
| Loop diuretics | 62 | 15 |
| Anti‐inflammatory agents | 61 | 14 |
| Penicillin antibiotics | 61 | 14 |
| Benzodiazepines | 59 | 14 |
| Hypnotics | 58 | 14 |
| Narcotic analgesics (full opioid agonists) | 54 | 13 |
| Antianxiety agents | 53 | 13 |
| Systemic corticosteroids | 53 | 13 |
| Glycopeptide antibiotics (vancomycin) | 46 | 11 |
| Anaerobic antibiotics | 45 | 11 |
| Histamine H2 antagonists | 41 | 10 |
| Antifungal agents | 37 | 9 |
| Phenothiazine derivatives | 37 | 9 |
| Adrenal corticosteroids | 35 | 8 |
| Antiviral agents | 30 | 7 |
| Aminoglycoside antibiotics | 26 | 6 |
| Narcotic analgesics (partial opioid agonists) | 26 | 6 |
| PPIs | 26 | 6 |
Data Collection
Data were abstracted from the electronic medication administration record (Sunrise Clinical Manager; Allscripts, Chicago, IL) into a database. For each subject, we recorded the name and time of administration of each IV medication given in the 72 hours preceding deterioration, as well as demographic, event, and hospitalization characteristics.
Statistical Analysis
We used univariable conditional logistic regression to evaluate the association between each therapeutic class and the composite outcome of clinical deterioration in the primary analysis. Because cases serve as their own controls in the case‐crossover design, this method inherently adjusts for all subject‐specific time‐invariant confounding variables, such as patient demographics, disease, and hospital‐ward characteristics.[15]
Sensitivity Analysis
Our primary analysis used a 2‐hour censored interval and 12‐hour hazard and control intervals. Excluding the censored interval from analysis was a conservative approach that we chose because our goal was to identify therapeutic classes associated with deterioration during a phase in which adverse outcomes may be prevented with early intervention. In order to test whether our findings were stable across different lengths of censored, hazard, and control intervals, we performed a sensitivity analysis, also using conditional logistic regression, on all therapeutic classes that were significant (P<0.05) in primary analysis. In 6 iterations of the sensitivity analysis, we varied the length of the hazard and control intervals between 8 and 12 hours, and the length of the censored interval between 0 and 4 hours (Figure 1AF). In a seventh iteration, we used a variant of the primary analysis in which we censored the first control interval (Figure 1G).
RESULTS
We identified 12 CPAs, 41 ARCs, and 699 ICU transfers during the study period. Of these 752 events, 141 (19%) were eligible as cases according to our inclusion criteria.[18] (A flowchart demonstrating the identification of eligible cases is provided in Supporting Table 25 in the online version of this article.) Of the 81% excluded, 37% were ICU transfers who did not meet urgent criteria. Another 31% were excluded because they were hospitalized for <24 hours at the time of the event, making their analysis in a case‐crossover design using 12‐hour periods impossible. Event characteristics, demographics, and hospitalization characteristics are shown in Table 2.
| n | % | |
|---|---|---|
| ||
| Type of event | ||
| CPA | 4 | 3 |
| ARC | 29 | 20 |
| Urgent ICU transfer | 108 | 77 |
| Demographics | ||
| Age | ||
| 0<6 months | 17 | 12 |
| 6<12 months | 22 | 16 |
| 1<4 years | 34 | 24 |
| 4<10 years | 26 | 18 |
| 10<18 years | 42 | 30 |
| Sex | ||
| F | 60 | 43 |
| M | 81 | 57 |
| Race | ||
| White | 69 | 49 |
| Black/African American | 49 | 35 |
| Asian/Pacific Islander | 0 | 0 |
| Other | 23 | 16 |
| Ethnicity | ||
| Non‐Hispanic | 127 | 90 |
| Hispanic | 14 | 10 |
| Hospitalization | ||
| Surgical service | 4 | 3 |
| Survived to hospital discharge | 107 | 76 |
Primary Analysis
A total of 141 hazard intervals and 487 control intervals were included in the primary analysis, the results of which are shown in Table 3. Among the antimicrobial therapeutic classes, glycopeptide antibiotics (vancomycin), anaerobic antibiotics, third‐generation and fourth‐generation cephalosporins, and aminoglycoside antibiotics were significant. All of the anti‐inflammatory therapeutic classes, including systemic corticosteroids, anti‐inflammatory agents, and adrenal corticosteroids, were significant. All of the sedatives, hypnotics, and antianxiety therapeutic classes, including sedatives, benzodiazepines, hypnotics, and antianxiety agents, were significant. Among the narcotic analgesic therapeutic classes, only 1 class, narcotic analgesics (full opioid agonists), was significant. None of the gastrointestinal therapeutic classes were significant. Among the classes classified as other, loop diuretics and antidotes to hypersensitivity reactions (diphenhydramine) were significant.
| OR | LCI | UCI | P Value | |
|---|---|---|---|---|
| ||||
| Antimicrobial therapeutic classes | ||||
| Glycopeptide antibiotics (vancomycin) | 5.84 | 2.01 | 16.98 | 0.001 |
| Anaerobic antibiotics | 5.33 | 1.36 | 20.94 | 0.02 |
| Third‐ and fourth‐generation cephalosporins | 2.78 | 1.15 | 6.69 | 0.02 |
| Aminoglycoside antibiotics | 2.90 | 1.11 | 7.56 | 0.03 |
| Penicillin antibiotics | 2.40 | 0.9 | 6.4 | 0.08 |
| Antiviral agents | 1.52 | 0.20 | 11.46 | 0.68 |
| Antifungal agents | 1.06 | 0.44 | 2.58 | 0.89 |
| Corticosteroids and other anti‐inflammatory therapeutic classes* | ||||
| Systemic corticosteroids | 3.69 | 1.09 | 12.55 | 0.04 |
| Anti‐inflammatory agents | 3.69 | 1.09 | 12.55 | 0.04 |
| Adrenal corticosteroids | 3.69 | 1.09 | 12.55 | 0.04 |
| Sedatives, hypnotics, and antianxiety therapeutic classes | ||||
| Sedatives | 3.48 | 1.78 | 6.78 | <0.001 |
| Benzodiazepines | 2.71 | 1.36 | 5.40 | 0.01 |
| Hypnotics | 2.54 | 1.27 | 5.09 | 0.01 |
| Antianxiety agents | 2.28 | 1.06 | 4.91 | 0.04 |
| Narcotic analgesic therapeutic classes | ||||
| Narcotic analgesics (full opioid agonists) | 2.48 | 1.07 | 5.73 | 0.03 |
| Narcotic analgesics (partial opioid agonists) | 1.97 | 0.57 | 6.85 | 0.29 |
| GI therapeutic classes | ||||
| Antiemetics | 0.57 | 0.22 | 1.48 | 0.25 |
| PPIs | 2.05 | 0.58 | 7.25 | 0.26 |
| Phenothiazine derivatives | 0.47 | 0.12 | 1.83 | 0.27 |
| Gastric acid secretion inhibitors | 1.71 | 0.61 | 4.81 | 0.31 |
| Histamine H2 antagonists | 0.95 | 0.17 | 5.19 | 0.95 |
| Other therapeutic classes | ||||
| Loop diuretics | 2.87 | 1.28 | 6.47 | 0.01 |
| Antidotes to hypersensitivity reactions (diphenhydramine) | 2.45 | 1.15 | 5.23 | 0.02 |
| Antihistamines | 2.00 | 0.97 | 4.12 | 0.06 |
Sensitivity Analysis
Of the 14 classes that were significant in primary analysis, we carried 9 forward to sensitivity analysis. The 5 that were not carried forward overlapped substantially with other classes that were carried forward. The decision of which overlapping class to carry forward was based upon (1) parsimony and (2) clinical relevance. This is described briefly in the footnotes to Table 3 (see Supporting information in the online version of this article for a full description of this process). Figure 2 presents the odds ratios and their 95% confidence intervals for the sensitivity analysis of each therapeutic class that was significant in primary analysis. Loop diuretics remained significantly associated with deterioration in all 7 iterations. Glycopeptide antibiotics (vancomycin), third‐generation and fourth‐generation cephalosporins, systemic corticosteroids, and benzodiazepines were significant in 6. Anaerobic antibiotics and narcotic analgesics (full opioid agonists) were significant in 5, and aminoglycoside antibiotics and antidotes to hypersensitivity reactions (diphenhydramine) in 4.
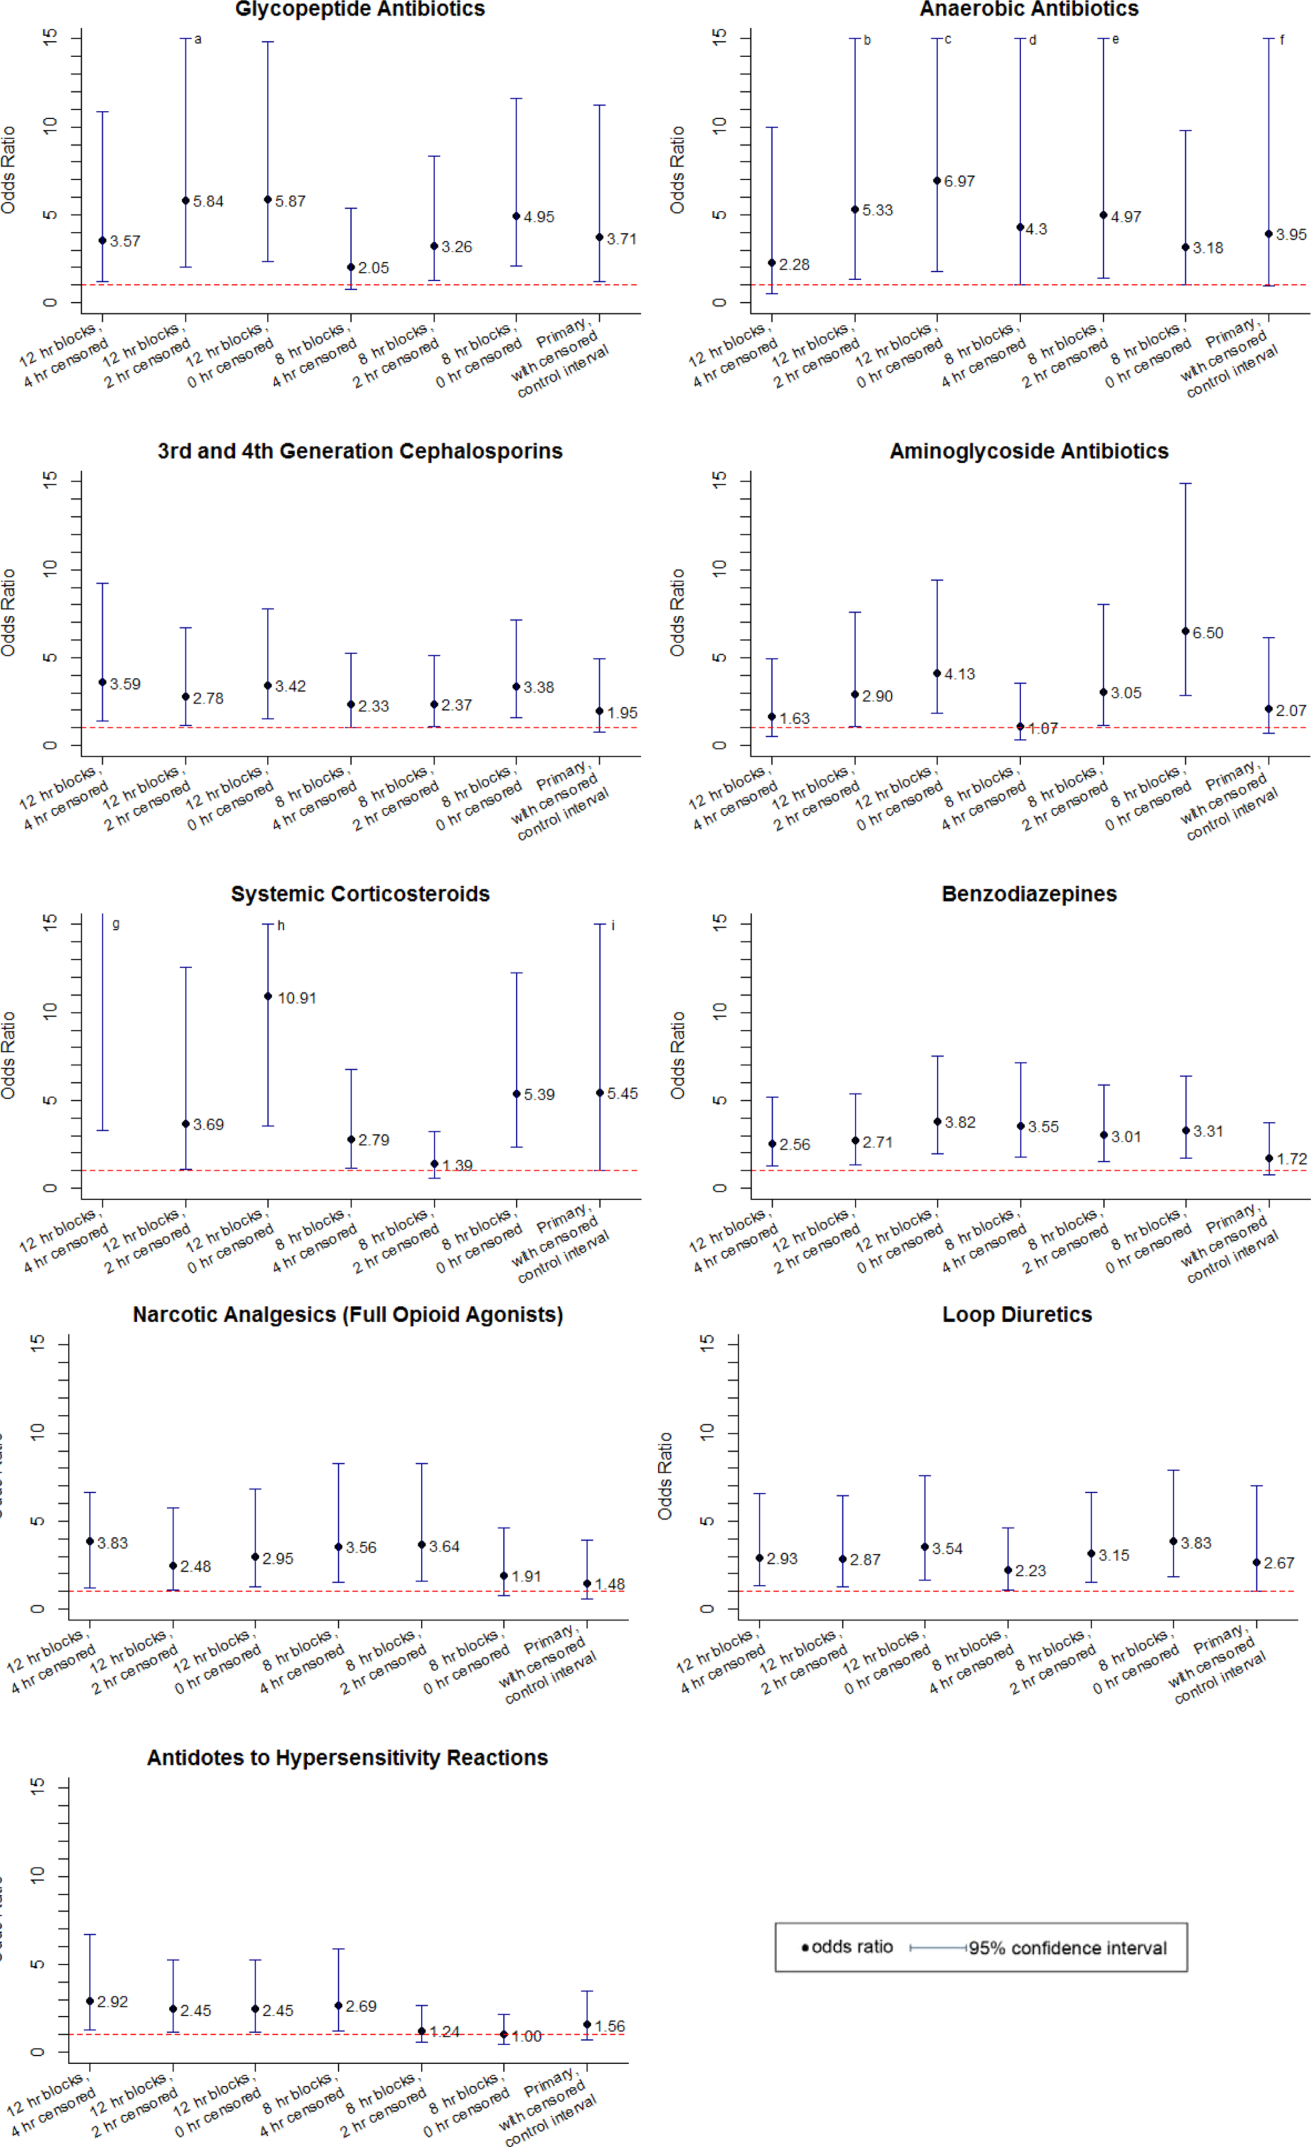
DISCUSSION
We identified 9 therapeutic classes which were associated with a 2.5‐fold to 5.8‐fold increased risk of clinical deterioration. The results were robust to sensitivity analysis. Given their temporal association to the deterioration events, these therapeutic classes may serve as sentinels of early deterioration and are candidate variables to combine with vital signs and other risk factors in a surveillance tool for rover teams or an early warning score.
Although most early warning scores intended for use at the bedside are based upon vital signs and clinical observations, a few also include medications. Monaghan's Pediatric Early Warning Score, the basis for many modified scores used in children's hospitals throughout the world, assigns points for children requiring frequent doses of nebulized medication.[20, 21, 22] Nebulized epinephrine is a component of the Bristol Paediatric Early Warning Tool.[23] The number of medications administered in the preceding 24 hours was included in an early version of the Bedside Paediatric Early Warning System Score.[24] Adding IV antibiotics to the Maximum Modified Early Warning Score improved prediction of the need for higher care utilization among hospitalized adults.[25]
In order to determine the role of the IV medications we found to be associated with clinical deterioration, the necessary next step is to develop a multivariable predictive model to determine if they improve the performance of existing early warning scores in identifying deteriorating patients. Although simplicity is an important characteristic of hand‐calculated early warning scores, integration of a more complex scoring system with more variables, such as these medications, into the electronic health record would allow for automated scoring, eliminating the need to sacrifice score performance to keep the tool simple. Integration into the electronic health record would have the additional benefit of making the score available to clinicians who are not at the bedside. Such tools would be especially useful for remote surveillance for deterioration by critical‐care outreach or rover teams.
Our study has several limitations. First, the sample size was small, and although we sought to minimize the likelihood of chance associations by performing sensitivity analysis, these findings should be confirmed in a larger study. Second, we only evaluated IV medications. Medications administered by other routes could also be associated with clinical deterioration and should be analyzed in future studies. Third, we excluded children hospitalized for <24 hours, as well as transfers that did not meet urgent criteria. These may be limitations because (1) the first 24 hours of hospitalization may be a high‐risk period, and (2) patients who were on trajectories toward severe deterioration and received interventions that prevented further deterioration but did not meet urgent transfer criteria were excluded. It may be that the children we included as cases were at increased risk of deterioration that is either more difficult to recognize early, or more difficult to treat effectively without ICU interventions. Finally, we acknowledge that in some cases the therapeutic classes were associated with deterioration in a causal fashion, and in others the medications administered did not cause deterioration but were signs of therapeutic interventions that were initiated in response to clinical worsening. Identifying the specific indications for administration of drugs used in response to clinical worsening may have resulted in stronger associations with deterioration. However, these indications are often complex, multifactorial, and poorly documented in real time. This limits the ability to automate their detection using the electronic health record, the ultimate goal of this line of research.
CONCLUSION
We used a case‐crossover approach to identify therapeutic classes that are associated with increased risk of clinical deterioration in hospitalized children on pediatric wards. These sentinel therapeutic classes may serve as useful components of electronic health recordbased surveillance tools to detect signs of early, evolving deterioration and flag at‐risk patients for critical‐care outreach or rover team review. Future research should focus on evaluating whether including these therapeutic classes in early warning scores improves their accuracy in detecting signs of deterioration and determining if providing this information as clinical decision support improves patient outcomes.
Acknowledgments
Disclosures: This study was funded by The Children's Hospital of Philadelphia Center for Pediatric Clinical Effectiveness Pilot Grant and the University of Pennsylvania Provost's Undergraduate Research Mentoring Program. Drs. Bonafide and Keren also receive funding from the Pennsylvania Health Research Formula Fund Award from the Pennsylvania Department of Health for research in pediatric hospital quality, safety, and costs. The authors have no other conflicts of interest to report.
- , , , et al. Findings of the first consensus conference on medical emergency teams. Crit Care Med. 2006;34(9):2463–2478.
- , , , et al. “Identifying the hospitalised patient in crisis”—a consensus conference on the afferent limb of rapid response systems. Resuscitation. 2010;81(4):375–382.
- , , , . Attitudes and barriers to a medical emergency team system at a tertiary paediatric hospital. Resuscitation. 2011;82(2):167–174.
- , , , et al. Why don't hospital staff activate the rapid response system (RRS)? How frequently is it needed and can the process be improved? Implement Sci. 2011;6:39.
- , . Failure of the afferent limb: a persistent problem in rapid response systems. Resuscitation. 2011;82(7):797–798.
- , , . Understanding how rapid response systems may improve safety for the acutely ill patient: learning from the frontline. BMJ Qual Saf. 2012;21(2):135–144.
- , , . How RNs rescue patients: a qualitative study of RNs' perceived involvement in rapid response teams. Qual Saf Health Care. 2010;19(5):1–4.
- , , , et al. A survey of nurses' beliefs about the medical emergency team system in a Canadian tertiary hospital. Am J Crit Care. 2010;19(1):74–83.
- , , , et al. Nurses' attitudes to a medical emergency team service in a teaching hospital. Qual Saf Health Care. 2006;15(6):427–432.
- , , , et al. Introducing critical care outreach: a ward‐randomised trial of phased introduction in a general hospital. Intensive Care Med. 2004;30(7):1398–1404.
- . Out of our reach? Assessing the impact of introducing a critical care outreach service. Anaesthesia. 2003;58(9):882–885.
- , , . Effect of the critical care outreach team on patient survival to discharge from hospital and readmission to critical care: non‐randomised population based study. BMJ. 2003;327(7422):1014.
- , , , et al. Successful implementation of a family and patient activated rapid response team in an adult level 1 trauma center. Resuscitation. 2010;81(12):1676–1681.
- , , , et al. Beyond rapid response teams: instituting a “Rover Team” improves the management of at‐risk patients, facilitates proactive interventions, and improves outcomes. In: Henriksen K, Battles JB, Keyes MA, Grady ML, eds. Advances in Patient Safety: New Directions and Alternative Approaches. Rockville, MD: Agency for Healthcare Research and Quality; 2008.
- , . The case‐crossover study design in pharmacoepidemiology. Stat Methods Med Res. 2009;18(1):53–65.
- , , , et al. Comparison of the statistical efficiency of case‐crossover and case‐control designs: application to severe cutaneous adverse reactions. J Clin Epidemiol. 2001;54(12):1218–1227.
- . The case‐crossover design: a method for studying transient effects on the risk of acute events. Am J Epidemiol. 1991;133(2):144–153.
- , , , , , . Development of a score to predict clinical deterioration in hospitalized children. J Hosp Med. 2012;7(4):345–349.
- Lexicomp. Available at: http://www.lexi.com. Accessed July 26, 2012.
- , , , , , . Sensitivity of the Pediatric Early Warning Score to identify patient deterioration. Pediatrics. 2010;125(4):e763–e769.
- . Detecting and managing deterioration in children. Paediatr Nurs. 2005;17(1):32–35.
- , , , , . Prospective evaluation of a pediatric inpatient early warning scoring system. J Spec Pediatr Nurs. 2009;14(2):79–85.
- , , . Promoting care for acutely ill children—development and evaluation of a Paediatric Early Warning Tool. Intensive Crit Care Nurs. 2006;22(2):73–81.
- , , . The Pediatric Early Warning System Score: a severity of illness score to predict urgent medical need in hospitalized children. J Crit Care. 2006;21(3):271–278.
- , , , , , . Performance of the maximum modified early warning score to predict the need for higher care utilization among admitted emergency department patients. J Hosp Med. 2010;5(1):E46–E52.
In recent years, many hospitals have implemented rapid response systems (RRSs) in efforts to reduce mortality outside the intensive care unit (ICU). Rapid response systems include 2 clinical components (efferent and afferent limbs) and 2 organizational components (process improvement and administrative limbs).[1, 2] The efferent limb includes medical emergency teams (METs) that can be summoned to hospital wards to rescue deteriorating patients. The afferent limb identifies patients at risk of deterioration using tools such as early warning scores and triggers a MET response when appropriate.[2] The process‐improvement limb evaluates and optimizes the RRS. The administrative limb implements the RRS and supports its ongoing operation. The effectiveness of most RRSs depends upon the ward team making the decision to escalate care by activating the MET. Barriers to activating the MET may include reduced situational awareness,[3, 4] hierarchical barriers to calling for help,[3, 4, 5, 6, 7, 8] fear of criticism,[3, 8, 9] and other hospital safety cultural barriers.[3, 4, 8]
Proactive critical‐care outreach[10, 11, 12, 13] or rover[14] teams seek to reduce barriers to activation and improve outcomes by systematically identifying and evaluating at‐risk patients without relying on requests for assistance from the ward team. Structured similarly to early warning scores, surveillance tools intended for rover teams might improve their ability to rapidly identify at‐risk patients throughout a hospital. They could combine vital signs with other variables, such as diagnostic and therapeutic interventions that reflect the ward team's early, evolving concern. In particular, the incorporation of medications associated with deterioration may enhance the performance of surveillance tools.
Medications may be associated with deterioration in one of several ways. They could play a causal role in deterioration (ie, opioids causing respiratory insufficiency), represent clinical worsening and anticipation of possible deterioration (ie, broad‐spectrum antibiotics for a positive blood culture), or represent rescue therapies for early deterioration (ie, antihistamines for allergic reactions). In each case, the associated therapeutic classes could be considered sentinel markers of clinical deterioration.
Combined with vital signs and other risk factors, therapeutic classes could serve as useful components of surveillance tools to detect signs of early, evolving deterioration and flag at‐risk patients for evaluation. As a first step, we sought to identify therapeutic classes associated with clinical deterioration. This effort to improve existing afferent tools falls within the process‐improvement limb of RRSs.
PATIENTS AND METHODS
Study Design
We performed a case‐crossover study of children who experienced clinical deterioration. An alternative to the matched case‐control design, the case‐crossover design involves longitudinal within‐subject comparisons exclusively of case subjects such that an individual serves as his or her own control. It is most effective when studying intermittent exposures that result in transient changes in the risk of an acute event,[15, 16, 17] making it appropriate for our study.
Using the case‐crossover design, we compared a discrete time period in close proximity to the deterioration event, called the hazard interval, with earlier time periods in the hospitalization, called the control intervals.[15, 16, 17] In our primary analysis (Figure 1B), we defined the durations of these intervals as follows: We first censored the 2 hours immediately preceding the clinical deterioration event (hours 0 to 2). We made this decision a priori to exclude medications used after deterioration was recognized and resuscitation had already begun. The 12‐hour period immediately preceding the censored interval was the hazard interval (hours 2 to 14). Each 12‐hour period immediately preceding the hazard interval was a control interval (hours 14 to 26, 26 to 38, 38 to 50, and 50 to 62). Depending on the child's length of stay prior to the deterioration event, each hazard interval had 14 control intervals for comparison. In sensitivity analysis, we altered the durations of these intervals (see below).
Study Setting and Participants
We performed this study among children age <18 years who experienced clinical deterioration between January 1, 2005, and December 31, 2008, after being hospitalized on a general medical or surgical unit at The Children's Hospital of Philadelphia for 24 hours. Clinical deterioration was a composite outcome defined as cardiopulmonary arrest (CPA), acute respiratory compromise (ARC), or urgent ICU transfer. Cardiopulmonary arrest events required either pulselessness or a pulse with inadequate perfusion treated with chest compressions and/or defibrillation. Acute respiratory compromise events required respiratory insufficiency treated with bag‐valve‐mask or invasive airway interventions. Urgent ICU transfers included 1 of the following outcomes in the 12 hours after transfer: death, CPA, intubation, initiation of noninvasive ventilation, or administration of a vasoactive medication infusion used for the treatment of shock. Time zero was the time of the CPA/ARC, or the time at which the child arrived in the ICU for urgent transfers. These subjects also served as the cases for a previously published case‐control study evaluating different risk factors for deterioration.[18] The institutional review board of The Children's Hospital of Philadelphia approved the study.
At the time of the study, the hospital did not have a formal RRS. An immediate‐response code‐blue team was available throughout the study period for emergencies occurring outside the ICU. Physicians could also page the pediatric ICU fellow to discuss patients who did not require immediate assistance from the code‐blue team but were clinically deteriorating. There were no established triggering criteria.
Medication Exposures
Intravenous (IV) medications administered in the 72 hours prior to clinical deterioration were considered the exposures of interest. Each medication was included in 1 therapeutic classes assigned in the hospital's formulary (Lexicomp, Hudson, OH).[19] In order to determine which therapeutic classes to evaluate, we performed a power calculation using the sampsi_mcc package for Stata 12 (StataCorp, College Station, TX). We estimated that we would have 3 matched control intervals per hazard interval. We found that, in order to detect a minimum odds ratio of 3.0 with 80% power, a therapeutic class had to be administered in 5% of control periods. All therapeutic classes meeting that requirement were included in the analysis and are listed in Table 1. (See lists of the individual medications comprising each class in the Supporting Information, Tables 124, in the online version of this article.)
| Therapeutic Class | No. of Control Intervals | % |
|---|---|---|
| ||
| Sedatives | 107 | 25 |
| Antiemetics | 92 | 22 |
| Third‐ and fourth‐generation cephalosporins | 83 | 20 |
| Antihistamines | 74 | 17 |
| Antidotes to hypersensitivity reactions (diphenhydramine) | 65 | 15 |
| Gastric acid secretion inhibitors | 62 | 15 |
| Loop diuretics | 62 | 15 |
| Anti‐inflammatory agents | 61 | 14 |
| Penicillin antibiotics | 61 | 14 |
| Benzodiazepines | 59 | 14 |
| Hypnotics | 58 | 14 |
| Narcotic analgesics (full opioid agonists) | 54 | 13 |
| Antianxiety agents | 53 | 13 |
| Systemic corticosteroids | 53 | 13 |
| Glycopeptide antibiotics (vancomycin) | 46 | 11 |
| Anaerobic antibiotics | 45 | 11 |
| Histamine H2 antagonists | 41 | 10 |
| Antifungal agents | 37 | 9 |
| Phenothiazine derivatives | 37 | 9 |
| Adrenal corticosteroids | 35 | 8 |
| Antiviral agents | 30 | 7 |
| Aminoglycoside antibiotics | 26 | 6 |
| Narcotic analgesics (partial opioid agonists) | 26 | 6 |
| PPIs | 26 | 6 |
Data Collection
Data were abstracted from the electronic medication administration record (Sunrise Clinical Manager; Allscripts, Chicago, IL) into a database. For each subject, we recorded the name and time of administration of each IV medication given in the 72 hours preceding deterioration, as well as demographic, event, and hospitalization characteristics.
Statistical Analysis
We used univariable conditional logistic regression to evaluate the association between each therapeutic class and the composite outcome of clinical deterioration in the primary analysis. Because cases serve as their own controls in the case‐crossover design, this method inherently adjusts for all subject‐specific time‐invariant confounding variables, such as patient demographics, disease, and hospital‐ward characteristics.[15]
Sensitivity Analysis
Our primary analysis used a 2‐hour censored interval and 12‐hour hazard and control intervals. Excluding the censored interval from analysis was a conservative approach that we chose because our goal was to identify therapeutic classes associated with deterioration during a phase in which adverse outcomes may be prevented with early intervention. In order to test whether our findings were stable across different lengths of censored, hazard, and control intervals, we performed a sensitivity analysis, also using conditional logistic regression, on all therapeutic classes that were significant (P<0.05) in primary analysis. In 6 iterations of the sensitivity analysis, we varied the length of the hazard and control intervals between 8 and 12 hours, and the length of the censored interval between 0 and 4 hours (Figure 1AF). In a seventh iteration, we used a variant of the primary analysis in which we censored the first control interval (Figure 1G).
RESULTS
We identified 12 CPAs, 41 ARCs, and 699 ICU transfers during the study period. Of these 752 events, 141 (19%) were eligible as cases according to our inclusion criteria.[18] (A flowchart demonstrating the identification of eligible cases is provided in Supporting Table 25 in the online version of this article.) Of the 81% excluded, 37% were ICU transfers who did not meet urgent criteria. Another 31% were excluded because they were hospitalized for <24 hours at the time of the event, making their analysis in a case‐crossover design using 12‐hour periods impossible. Event characteristics, demographics, and hospitalization characteristics are shown in Table 2.
| n | % | |
|---|---|---|
| ||
| Type of event | ||
| CPA | 4 | 3 |
| ARC | 29 | 20 |
| Urgent ICU transfer | 108 | 77 |
| Demographics | ||
| Age | ||
| 0<6 months | 17 | 12 |
| 6<12 months | 22 | 16 |
| 1<4 years | 34 | 24 |
| 4<10 years | 26 | 18 |
| 10<18 years | 42 | 30 |
| Sex | ||
| F | 60 | 43 |
| M | 81 | 57 |
| Race | ||
| White | 69 | 49 |
| Black/African American | 49 | 35 |
| Asian/Pacific Islander | 0 | 0 |
| Other | 23 | 16 |
| Ethnicity | ||
| Non‐Hispanic | 127 | 90 |
| Hispanic | 14 | 10 |
| Hospitalization | ||
| Surgical service | 4 | 3 |
| Survived to hospital discharge | 107 | 76 |
Primary Analysis
A total of 141 hazard intervals and 487 control intervals were included in the primary analysis, the results of which are shown in Table 3. Among the antimicrobial therapeutic classes, glycopeptide antibiotics (vancomycin), anaerobic antibiotics, third‐generation and fourth‐generation cephalosporins, and aminoglycoside antibiotics were significant. All of the anti‐inflammatory therapeutic classes, including systemic corticosteroids, anti‐inflammatory agents, and adrenal corticosteroids, were significant. All of the sedatives, hypnotics, and antianxiety therapeutic classes, including sedatives, benzodiazepines, hypnotics, and antianxiety agents, were significant. Among the narcotic analgesic therapeutic classes, only 1 class, narcotic analgesics (full opioid agonists), was significant. None of the gastrointestinal therapeutic classes were significant. Among the classes classified as other, loop diuretics and antidotes to hypersensitivity reactions (diphenhydramine) were significant.
| OR | LCI | UCI | P Value | |
|---|---|---|---|---|
| ||||
| Antimicrobial therapeutic classes | ||||
| Glycopeptide antibiotics (vancomycin) | 5.84 | 2.01 | 16.98 | 0.001 |
| Anaerobic antibiotics | 5.33 | 1.36 | 20.94 | 0.02 |
| Third‐ and fourth‐generation cephalosporins | 2.78 | 1.15 | 6.69 | 0.02 |
| Aminoglycoside antibiotics | 2.90 | 1.11 | 7.56 | 0.03 |
| Penicillin antibiotics | 2.40 | 0.9 | 6.4 | 0.08 |
| Antiviral agents | 1.52 | 0.20 | 11.46 | 0.68 |
| Antifungal agents | 1.06 | 0.44 | 2.58 | 0.89 |
| Corticosteroids and other anti‐inflammatory therapeutic classes* | ||||
| Systemic corticosteroids | 3.69 | 1.09 | 12.55 | 0.04 |
| Anti‐inflammatory agents | 3.69 | 1.09 | 12.55 | 0.04 |
| Adrenal corticosteroids | 3.69 | 1.09 | 12.55 | 0.04 |
| Sedatives, hypnotics, and antianxiety therapeutic classes | ||||
| Sedatives | 3.48 | 1.78 | 6.78 | <0.001 |
| Benzodiazepines | 2.71 | 1.36 | 5.40 | 0.01 |
| Hypnotics | 2.54 | 1.27 | 5.09 | 0.01 |
| Antianxiety agents | 2.28 | 1.06 | 4.91 | 0.04 |
| Narcotic analgesic therapeutic classes | ||||
| Narcotic analgesics (full opioid agonists) | 2.48 | 1.07 | 5.73 | 0.03 |
| Narcotic analgesics (partial opioid agonists) | 1.97 | 0.57 | 6.85 | 0.29 |
| GI therapeutic classes | ||||
| Antiemetics | 0.57 | 0.22 | 1.48 | 0.25 |
| PPIs | 2.05 | 0.58 | 7.25 | 0.26 |
| Phenothiazine derivatives | 0.47 | 0.12 | 1.83 | 0.27 |
| Gastric acid secretion inhibitors | 1.71 | 0.61 | 4.81 | 0.31 |
| Histamine H2 antagonists | 0.95 | 0.17 | 5.19 | 0.95 |
| Other therapeutic classes | ||||
| Loop diuretics | 2.87 | 1.28 | 6.47 | 0.01 |
| Antidotes to hypersensitivity reactions (diphenhydramine) | 2.45 | 1.15 | 5.23 | 0.02 |
| Antihistamines | 2.00 | 0.97 | 4.12 | 0.06 |
Sensitivity Analysis
Of the 14 classes that were significant in primary analysis, we carried 9 forward to sensitivity analysis. The 5 that were not carried forward overlapped substantially with other classes that were carried forward. The decision of which overlapping class to carry forward was based upon (1) parsimony and (2) clinical relevance. This is described briefly in the footnotes to Table 3 (see Supporting information in the online version of this article for a full description of this process). Figure 2 presents the odds ratios and their 95% confidence intervals for the sensitivity analysis of each therapeutic class that was significant in primary analysis. Loop diuretics remained significantly associated with deterioration in all 7 iterations. Glycopeptide antibiotics (vancomycin), third‐generation and fourth‐generation cephalosporins, systemic corticosteroids, and benzodiazepines were significant in 6. Anaerobic antibiotics and narcotic analgesics (full opioid agonists) were significant in 5, and aminoglycoside antibiotics and antidotes to hypersensitivity reactions (diphenhydramine) in 4.
DISCUSSION
We identified 9 therapeutic classes which were associated with a 2.5‐fold to 5.8‐fold increased risk of clinical deterioration. The results were robust to sensitivity analysis. Given their temporal association to the deterioration events, these therapeutic classes may serve as sentinels of early deterioration and are candidate variables to combine with vital signs and other risk factors in a surveillance tool for rover teams or an early warning score.
Although most early warning scores intended for use at the bedside are based upon vital signs and clinical observations, a few also include medications. Monaghan's Pediatric Early Warning Score, the basis for many modified scores used in children's hospitals throughout the world, assigns points for children requiring frequent doses of nebulized medication.[20, 21, 22] Nebulized epinephrine is a component of the Bristol Paediatric Early Warning Tool.[23] The number of medications administered in the preceding 24 hours was included in an early version of the Bedside Paediatric Early Warning System Score.[24] Adding IV antibiotics to the Maximum Modified Early Warning Score improved prediction of the need for higher care utilization among hospitalized adults.[25]
In order to determine the role of the IV medications we found to be associated with clinical deterioration, the necessary next step is to develop a multivariable predictive model to determine if they improve the performance of existing early warning scores in identifying deteriorating patients. Although simplicity is an important characteristic of hand‐calculated early warning scores, integration of a more complex scoring system with more variables, such as these medications, into the electronic health record would allow for automated scoring, eliminating the need to sacrifice score performance to keep the tool simple. Integration into the electronic health record would have the additional benefit of making the score available to clinicians who are not at the bedside. Such tools would be especially useful for remote surveillance for deterioration by critical‐care outreach or rover teams.
Our study has several limitations. First, the sample size was small, and although we sought to minimize the likelihood of chance associations by performing sensitivity analysis, these findings should be confirmed in a larger study. Second, we only evaluated IV medications. Medications administered by other routes could also be associated with clinical deterioration and should be analyzed in future studies. Third, we excluded children hospitalized for <24 hours, as well as transfers that did not meet urgent criteria. These may be limitations because (1) the first 24 hours of hospitalization may be a high‐risk period, and (2) patients who were on trajectories toward severe deterioration and received interventions that prevented further deterioration but did not meet urgent transfer criteria were excluded. It may be that the children we included as cases were at increased risk of deterioration that is either more difficult to recognize early, or more difficult to treat effectively without ICU interventions. Finally, we acknowledge that in some cases the therapeutic classes were associated with deterioration in a causal fashion, and in others the medications administered did not cause deterioration but were signs of therapeutic interventions that were initiated in response to clinical worsening. Identifying the specific indications for administration of drugs used in response to clinical worsening may have resulted in stronger associations with deterioration. However, these indications are often complex, multifactorial, and poorly documented in real time. This limits the ability to automate their detection using the electronic health record, the ultimate goal of this line of research.
CONCLUSION
We used a case‐crossover approach to identify therapeutic classes that are associated with increased risk of clinical deterioration in hospitalized children on pediatric wards. These sentinel therapeutic classes may serve as useful components of electronic health recordbased surveillance tools to detect signs of early, evolving deterioration and flag at‐risk patients for critical‐care outreach or rover team review. Future research should focus on evaluating whether including these therapeutic classes in early warning scores improves their accuracy in detecting signs of deterioration and determining if providing this information as clinical decision support improves patient outcomes.
Acknowledgments
Disclosures: This study was funded by The Children's Hospital of Philadelphia Center for Pediatric Clinical Effectiveness Pilot Grant and the University of Pennsylvania Provost's Undergraduate Research Mentoring Program. Drs. Bonafide and Keren also receive funding from the Pennsylvania Health Research Formula Fund Award from the Pennsylvania Department of Health for research in pediatric hospital quality, safety, and costs. The authors have no other conflicts of interest to report.
- , , , et al. Findings of the first consensus conference on medical emergency teams. Crit Care Med. 2006;34(9):2463–2478.
- , , , et al. “Identifying the hospitalised patient in crisis”—a consensus conference on the afferent limb of rapid response systems. Resuscitation. 2010;81(4):375–382.
- , , , . Attitudes and barriers to a medical emergency team system at a tertiary paediatric hospital. Resuscitation. 2011;82(2):167–174.
- , , , et al. Why don't hospital staff activate the rapid response system (RRS)? How frequently is it needed and can the process be improved? Implement Sci. 2011;6:39.
- , . Failure of the afferent limb: a persistent problem in rapid response systems. Resuscitation. 2011;82(7):797–798.
- , , . Understanding how rapid response systems may improve safety for the acutely ill patient: learning from the frontline. BMJ Qual Saf. 2012;21(2):135–144.
- , , . How RNs rescue patients: a qualitative study of RNs' perceived involvement in rapid response teams. Qual Saf Health Care. 2010;19(5):1–4.
- , , , et al. A survey of nurses' beliefs about the medical emergency team system in a Canadian tertiary hospital. Am J Crit Care. 2010;19(1):74–83.
- , , , et al. Nurses' attitudes to a medical emergency team service in a teaching hospital. Qual Saf Health Care. 2006;15(6):427–432.
- , , , et al. Introducing critical care outreach: a ward‐randomised trial of phased introduction in a general hospital. Intensive Care Med. 2004;30(7):1398–1404.
- . Out of our reach? Assessing the impact of introducing a critical care outreach service. Anaesthesia. 2003;58(9):882–885.
- , , . Effect of the critical care outreach team on patient survival to discharge from hospital and readmission to critical care: non‐randomised population based study. BMJ. 2003;327(7422):1014.
- , , , et al. Successful implementation of a family and patient activated rapid response team in an adult level 1 trauma center. Resuscitation. 2010;81(12):1676–1681.
- , , , et al. Beyond rapid response teams: instituting a “Rover Team” improves the management of at‐risk patients, facilitates proactive interventions, and improves outcomes. In: Henriksen K, Battles JB, Keyes MA, Grady ML, eds. Advances in Patient Safety: New Directions and Alternative Approaches. Rockville, MD: Agency for Healthcare Research and Quality; 2008.
- , . The case‐crossover study design in pharmacoepidemiology. Stat Methods Med Res. 2009;18(1):53–65.
- , , , et al. Comparison of the statistical efficiency of case‐crossover and case‐control designs: application to severe cutaneous adverse reactions. J Clin Epidemiol. 2001;54(12):1218–1227.
- . The case‐crossover design: a method for studying transient effects on the risk of acute events. Am J Epidemiol. 1991;133(2):144–153.
- , , , , , . Development of a score to predict clinical deterioration in hospitalized children. J Hosp Med. 2012;7(4):345–349.
- Lexicomp. Available at: http://www.lexi.com. Accessed July 26, 2012.
- , , , , , . Sensitivity of the Pediatric Early Warning Score to identify patient deterioration. Pediatrics. 2010;125(4):e763–e769.
- . Detecting and managing deterioration in children. Paediatr Nurs. 2005;17(1):32–35.
- , , , , . Prospective evaluation of a pediatric inpatient early warning scoring system. J Spec Pediatr Nurs. 2009;14(2):79–85.
- , , . Promoting care for acutely ill children—development and evaluation of a Paediatric Early Warning Tool. Intensive Crit Care Nurs. 2006;22(2):73–81.
- , , . The Pediatric Early Warning System Score: a severity of illness score to predict urgent medical need in hospitalized children. J Crit Care. 2006;21(3):271–278.
- , , , , , . Performance of the maximum modified early warning score to predict the need for higher care utilization among admitted emergency department patients. J Hosp Med. 2010;5(1):E46–E52.
Copyright © 2013 Society of Hospital Medicine

FDR and Telemetry Rhythm at Time of IHCA
In‐hospital cardiac arrest (IHCA) research often relies on the first documented cardiac rhythm (FDR) on resuscitation records at the time of cardiopulmonary resuscitation (CPR) initiation as a surrogate for arrest etiology.[1] Over 1000 hospitals report the FDR and associated cardiac arrest data to national registries annually.[2, 3] These data are subsequently used to report national IHCA epidemiology, as well as to develop and refine guidelines for in‐hospital resuscitation.[4]
Suspecting that the FDR might represent the later stage of a progressive cardiopulmonary process rather than a sudden dysrhythmia, we sought to compare the first rhythm documented on resuscitation records at the time of CPR initiation with the telemetry rhythm at the time of the code blue call. We hypothesized that the agreement between FDR and telemetry rhythm would be <80% beyond that predicted by chance (kappa<0.8).[5]
METHODS
Design
Between June 2008 and February 2010, we performed a cross‐sectional study at a 750‐bed adult tertiary care hospital (Christiana Hospital) and a 240‐bed adult inner city community hospital (Wilmington Hospital). Both hospitals included teaching and nonteaching inpatient services. The Christiana Care Health System Institutional Review Board approved the study.
Study Population
Eligible subjects included a convenience sample of adult inpatients aged 18 years who were monitored on the hospital's telemetry system during the 2 minutes prior to a code blue call from a nonintensive care, noncardiac care inpatient ward for IHCA. Intensive care unit (ICU) locations were excluded because they are not captured in our central telemetry recording system. We defined IHCA as a resuscitation event requiring >1 minute of chest compressions and/or defibrillation. We excluded patients with do not attempt resuscitation orders at the time of the IHCA. For patients with multiple IHCAs, only their first event was included in the analysis. International Classification of Diseases, 9th Revision admission diagnoses were categorized into infectious, oncology, endocrine/metabolic; cardiovascular, renal, or other disease categories. The decision to place patients on telemetry monitoring was not part of the study and was entirely at the discretion of the physicians caring for the patients.
Variables and Measurements
We reviewed the paper resuscitation records of each IHCA during the study period and identified the FDR. To create groups that would allow comparison between telemetry and resuscitation record rhythms, we placed each rhythm into 1 of the following 3 categories: asystole, ventricular tachyarrhythmia (VTA), or other organized rhythms (Table 1). It was not possible to retrospectively ascertain the presence of pulses to determine if an organized rhythm identified on telemetry tracings was pulseless electrical activity (PEA) or a perfusing rhythm. Therefore, we elected to take a conservative approach that would bias toward agreement (the opposite direction of our hypothesis that the rhythms are discrepant) and consider all other organized rhythms in agreement with one another. We reviewed printouts of telemetry electrocardiographic records for each patient. Minute 0 was defined as the time of the code blue call. Two physician investigators (C.C. and U.B.) independently reviewed telemetry data for each patient at minute 0 and the 2 minutes preceding the code blue call (minutes 1 and 2). Rhythms at each minute mark were assigned to 1 of the following categories according to the classification scheme in Table 1: asystole, VTA, or other organized rhythms. Leads off and uninterpretable telemetry were also noted. Discrepancies in rhythm categorization between reviewers were resolved by a third investigator (M.Z.) blinded to rhythm category assignment. We used the telemetry rhythm at minute 0 for analysis whenever possible. If the leads were off or the telemetry was uninterpretable at minute 0, we used minute 1. If minute 1 was also unusable, we used minute 2. If there were no usable data at minutes 0, 1, or 2, we excluded the patient.
| Category | Rhythm |
|---|---|
| Asystole | Asystole |
| Ventricular tachyarrhythmia | Ventricular fibrillation, ventricular tachycardia |
| Other organized rhythms | Atrial fibrillation, bradycardia, paced pulseless electrical activity, sinus, idioventricular, other |
Statistical Analysis
We determined the percent agreement between the resuscitation record rhythm category and the last interpretable telemetry rhythm category. We then calculated an unweighted kappa for the agreement between the resuscitation record rhythm category and the last interpretable telemetry rhythm category.
RESULTS
During the study period, there were 135 code blue calls for urgent assistance among telemetry‐monitored non‐ICU patients. Of the 135 calls, we excluded 4 events (3%) that did not meet the definition of IHCA, 9 events (7%) with missing or uninterpretable data, and 53 events (39%) with unobtainable data due to automatic purging from the telemetry server. Therefore, 69 events in 69 different patients remained for analysis. Twelve of the 69 included arrests that occurred at Wilmington Hospital and 57 at Christiana Hospital. The characteristics of the patients are shown in Table 2.
| n | % | |
|---|---|---|
| Age, y | ||
| 3039 | 1 | 1.4 |
| 4049 | 4 | 5.8 |
| 5059 | 11 | 15.9 |
| 6069 | 15 | 21.7 |
| 7079 | 16 | 23.2 |
| 8089 | 18 | 26.1 |
| 90+ | 4 | 5.8 |
| Sex | ||
| Male | 26 | 37.7 |
| Female | 43 | 62.3 |
| Race/ethnicity | ||
| White | 51 | 73.9 |
| Black | 17 | 24.6 |
| Hispanic | 1 | 1.4 |
| Admission body mass index | ||
| Underweight (<18.5) | 3 | 4.3 |
| Normal (18.5<25) | 15 | 21.7 |
| Overweight (25<30) 24 | 24 | 34.8 |
| Obese (30<35) | 17 | 24.6 |
| Very obese (35) | 9 | 13.0 |
| Unknown | 1 | 1.4 |
| Admission diagnosis category | ||
| Infectious | 29 | 42.0 |
| Oncology | 4 | 5.8 |
| Endocrine/metabolic | 22 | 31.9 |
| Cardiovascular | 7 | 10.1 |
| Renal | 2 | 2.8 |
| Other | 5 | 7.2 |
Of the 69 arrests, we used the telemetry rhythm at minute 0 in 42 patients (61%), minute 1 in 22 patients (32%), and minute 2 in 5 patients (7%). Agreement between telemetry and FDR was 65% (kappa=0.37, 95% confidence interval: 0.17‐0.56) (Table 3). Agreement did not vary significantly by sex, race, hospital, weekday, time of day, or minute used in the analysis. Agreement was not associated with survival to hospital discharge.
| Telemetry | Resuscitation Record | |||
|---|---|---|---|---|
| Asystole | Ventricular Tachyarrhythmia | Other Organized Rhythms | Total | |
| ||||
| Asystole | 3 | 0 | 2 | 5 |
| Ventricular tachyarrhythmia | 1 | 12 | 8 | 21 |
| Other organized rhythms | 8 | 5 | 30 | 43 |
| Total | 12 | 17 | 40 | 69 |
Of the 69 IHCA events, the FDRs vs telemetry rhythms at the time of IHCA were: asystole 17% vs 7%, VTA 25% vs 31%, and other organized rhythms 58% vs 62%. Among the 12 events with FDR recorded as asystole, telemetry at the time of the code call was asystole in 3 (25%), VTA in 1 (8%), and other organized rhythms in 8 (67%). Among the 17 events with FDR recorded as VTA, telemetry at the time of the code call was VTA in 12 (71%) and other organized rhythms in 5 (29%). Among the 40 events with FDR recorded as other organized rhythms, telemetry at the time of the code call was asystole in 2 (5%), VTA in 8 (20%), and other organized rhythms in 30 (75%). Among the 8 patients with VTA on telemetry and other organized rhythms on the resuscitation record, the other organized rhythms were documented as PEA (n=6), sinus (n=1), and bradycardia (n=1). Of the 12 patients with VTA on telemetry and on the resuscitation record, 8 (67%) had ventricular tachycardia on telemetry. Four of the 8 (50%) who had ventricular tachycardia on telemetry had deteriorated into ventricular fibrillation by the time the FDR was recorded. Of the 4 who had ventricular fibrillation on telemetry, all had ventricular fibrillation as the FDR on the resuscitation record.
DISCUSSION
These results establish that FDRs often differ from the telemetry rhythms at the time of the code blue call. This is important because national registries such as the American Heart Association's Get with the GuidelinesResuscitation[2] database use the FDR as a surrogate for arrest etiology, and use their findings to report national IHCA outcomes as well as to develop and refine evidence‐based guidelines for in‐hospital resuscitation. Our findings suggest that using the FDR may be an oversimplification of the complex progression of cardiac rhythms that occurs in the periarrest period. Adding preceding telemetry rhythms to the data elements collected may shed additional light on etiology. Furthermore, our results demonstrate that, among adults with VTA or asystole documented upon arrival of the code blue team, other organized rhythms are often present at the time the staff recognized a life‐threatening condition and called for immediate assistance. This suggests that the VTA and asystole FDRs may represent the later stages of progressive cardiopulmonary processes. This is in contrast to out‐of‐hospital cardiac arrests typically attributed to sudden catastrophic dysrhythmias that often progress to asystole unless rapidly defibrillated.[6, 7, 8] Out‐of‐hospital and in‐hospital arrests are likely different (but overlapping) entities that might benefit from different resuscitation strategies.[9, 10] We hypothesize that, for a subset of these patients, progressive respiratory insufficiency and circulatory shockconditions classically associated more strongly with pediatric than adult IHCAmay have been directly responsible for the event.[1] If future research supports the concept that progressive respiratory insufficiency and circulatory shock are responsible for more adult IHCA than previously recognized, more robust monitoring may be indicated for a larger subset of adult patients hospitalized on general wards. This could include pulse oximetry (wave form can be a surrogate for perfusion), respiratory rate, and/or end‐tidal CO2 monitoring. In addition, if future research confirms that there is a greater distinction between in‐hospital and out‐of‐hospital cardiac arrest etiology, the expert panels that develop resuscitation guidelines should consider including setting of resuscitation as a branch point in future algorithms.
Our study had several limitations. First, the sample size was small due to uninterpretable rhythm strips, and for 39% of the total code events, the telemetry data had already been purged from the system by the time research staff attempted to retrieve it. Although we do not believe that there was any systematic bias to the data analyzed, the possibility cannot be completely excluded. Second, we were constrained by the inability to retrospectively ascertain the presence of pulses to determine if an organized rhythm identified on telemetry tracings was PEA. Thus, we categorized rhythms into large groups. Although this limited the granularity of the rhythm groups, it was a conservative approach that likely biased toward agreement (the opposite direction of our hypothesis). Third, the lack of perfect time synchronization between the telemetry system, wall clocks in the hospital, and wrist watches that may be referenced when documenting resuscitative efforts on the resuscitation record means that the rhythms we used may have reflected physiology after interventions had already commenced. Thus, in some situations, minute 1, 2, or earlier minutes may more accurately reflect the preintervention rhythm. Highly accurate time synchronization should be a central component of future prospective work in this area.
CONCLUSIONS
The FDR had only fair agreement with the telemetry rhythm at the time of the code blue call. Among those with VTA or asystole documented on CPR initiation, telemetry often revealed other organized rhythms present at the time hospital staff recognized a life‐threatening condition. In contrast to out‐of‐hospital cardiac arrest, FDR of asystole was only rarely preceded by VTA, and FDR of VTA was often preceded by an organized rhythm.[8, 11] Future studies should examine antecedent rhythms in combination with respiratory and perfusion status to more precisely determine arrest etiology.
Acknowledgments
The authors thank the staff at Flex Monitoring at Christiana Care Health System for their vital contributions to the study.
Disclosures
Dr. Zubrow had full access to all the data in the study and takes responsibility for the integrity of the data and the accuracy of the data analysis. The authors report no conflicts of interest.
- , , , et al. First documented rhythm and clinical outcome from in‐hospital cardiac arrest among children and adults. JAMA. 2006;295(1):50–57.
- Get With The Guidelines–Resuscitation (GWTG‐R) overview. Available at: http://www.heart.org/HEARTORG/HealthcareResearch/GetWithTheGuidelines‐Resuscitation/Get‐With‐The‐Guidelines‐ResuscitationOverview_UCM_314497_Article.jsp. Accessed May 8, 2012.
- , , , et al. Recommended guidelines for reviewing, reporting, and conducting research on in‐hospital resuscitation: the in‐hospital “Utstein Style”. Circulation. 1997;95:2213–2239.
- , , , et al. Cardiopulmonary resuscitation of adults in the hospital: a report of 14,720 cardiac arrests from the National Registry of Cardiopulmonary Resuscitation. Resuscitation. 2003;58:297–308.
- , . The measurement of observer agreement for categorical data. Biometrics. 1977;33(1):159–174.
- , , , et al. Characteristics and outcome among patients suffering in‐hospital cardiac arrest in monitored and nonmonitored areas. Resuscitation. 2001;48:125–135.
- , , , et al. A comparison between patients suffering in‐hospital and out‐of hospital cardiac arrest in terms of treatment and outcome. J Intern Med. 2000;248:53–60.
- , , , et al. Cardiac arrest outside and inside hospital in a community: mechanisms behind the differences in outcomes and outcome in relation to time of arrest. Am Heart J. 2010;159:749–756.
- , , , et al.; Resuscitation Outcomes Consortium Investigators. Ventricular tachyarrhythmias after cardiac arrest in public versus at home. N Engl J Med. 2011;364:313–321.
- , . In‐hospital cardiac arrest. Emerg Med Clin North Am. 2012;30:25–34.
- , , , et al. Analysis of initial rhythm, witnessed status and delay to treatment among survivors of out‐of‐hospital cardiac arrest in Sweden. Heart. 2010;96:1826–1830.
In‐hospital cardiac arrest (IHCA) research often relies on the first documented cardiac rhythm (FDR) on resuscitation records at the time of cardiopulmonary resuscitation (CPR) initiation as a surrogate for arrest etiology.[1] Over 1000 hospitals report the FDR and associated cardiac arrest data to national registries annually.[2, 3] These data are subsequently used to report national IHCA epidemiology, as well as to develop and refine guidelines for in‐hospital resuscitation.[4]
Suspecting that the FDR might represent the later stage of a progressive cardiopulmonary process rather than a sudden dysrhythmia, we sought to compare the first rhythm documented on resuscitation records at the time of CPR initiation with the telemetry rhythm at the time of the code blue call. We hypothesized that the agreement between FDR and telemetry rhythm would be <80% beyond that predicted by chance (kappa<0.8).[5]
METHODS
Design
Between June 2008 and February 2010, we performed a cross‐sectional study at a 750‐bed adult tertiary care hospital (Christiana Hospital) and a 240‐bed adult inner city community hospital (Wilmington Hospital). Both hospitals included teaching and nonteaching inpatient services. The Christiana Care Health System Institutional Review Board approved the study.
Study Population
Eligible subjects included a convenience sample of adult inpatients aged 18 years who were monitored on the hospital's telemetry system during the 2 minutes prior to a code blue call from a nonintensive care, noncardiac care inpatient ward for IHCA. Intensive care unit (ICU) locations were excluded because they are not captured in our central telemetry recording system. We defined IHCA as a resuscitation event requiring >1 minute of chest compressions and/or defibrillation. We excluded patients with do not attempt resuscitation orders at the time of the IHCA. For patients with multiple IHCAs, only their first event was included in the analysis. International Classification of Diseases, 9th Revision admission diagnoses were categorized into infectious, oncology, endocrine/metabolic; cardiovascular, renal, or other disease categories. The decision to place patients on telemetry monitoring was not part of the study and was entirely at the discretion of the physicians caring for the patients.
Variables and Measurements
We reviewed the paper resuscitation records of each IHCA during the study period and identified the FDR. To create groups that would allow comparison between telemetry and resuscitation record rhythms, we placed each rhythm into 1 of the following 3 categories: asystole, ventricular tachyarrhythmia (VTA), or other organized rhythms (Table 1). It was not possible to retrospectively ascertain the presence of pulses to determine if an organized rhythm identified on telemetry tracings was pulseless electrical activity (PEA) or a perfusing rhythm. Therefore, we elected to take a conservative approach that would bias toward agreement (the opposite direction of our hypothesis that the rhythms are discrepant) and consider all other organized rhythms in agreement with one another. We reviewed printouts of telemetry electrocardiographic records for each patient. Minute 0 was defined as the time of the code blue call. Two physician investigators (C.C. and U.B.) independently reviewed telemetry data for each patient at minute 0 and the 2 minutes preceding the code blue call (minutes 1 and 2). Rhythms at each minute mark were assigned to 1 of the following categories according to the classification scheme in Table 1: asystole, VTA, or other organized rhythms. Leads off and uninterpretable telemetry were also noted. Discrepancies in rhythm categorization between reviewers were resolved by a third investigator (M.Z.) blinded to rhythm category assignment. We used the telemetry rhythm at minute 0 for analysis whenever possible. If the leads were off or the telemetry was uninterpretable at minute 0, we used minute 1. If minute 1 was also unusable, we used minute 2. If there were no usable data at minutes 0, 1, or 2, we excluded the patient.
| Category | Rhythm |
|---|---|
| Asystole | Asystole |
| Ventricular tachyarrhythmia | Ventricular fibrillation, ventricular tachycardia |
| Other organized rhythms | Atrial fibrillation, bradycardia, paced pulseless electrical activity, sinus, idioventricular, other |
Statistical Analysis
We determined the percent agreement between the resuscitation record rhythm category and the last interpretable telemetry rhythm category. We then calculated an unweighted kappa for the agreement between the resuscitation record rhythm category and the last interpretable telemetry rhythm category.
RESULTS
During the study period, there were 135 code blue calls for urgent assistance among telemetry‐monitored non‐ICU patients. Of the 135 calls, we excluded 4 events (3%) that did not meet the definition of IHCA, 9 events (7%) with missing or uninterpretable data, and 53 events (39%) with unobtainable data due to automatic purging from the telemetry server. Therefore, 69 events in 69 different patients remained for analysis. Twelve of the 69 included arrests that occurred at Wilmington Hospital and 57 at Christiana Hospital. The characteristics of the patients are shown in Table 2.
| n | % | |
|---|---|---|
| Age, y | ||
| 3039 | 1 | 1.4 |
| 4049 | 4 | 5.8 |
| 5059 | 11 | 15.9 |
| 6069 | 15 | 21.7 |
| 7079 | 16 | 23.2 |
| 8089 | 18 | 26.1 |
| 90+ | 4 | 5.8 |
| Sex | ||
| Male | 26 | 37.7 |
| Female | 43 | 62.3 |
| Race/ethnicity | ||
| White | 51 | 73.9 |
| Black | 17 | 24.6 |
| Hispanic | 1 | 1.4 |
| Admission body mass index | ||
| Underweight (<18.5) | 3 | 4.3 |
| Normal (18.5<25) | 15 | 21.7 |
| Overweight (25<30) 24 | 24 | 34.8 |
| Obese (30<35) | 17 | 24.6 |
| Very obese (35) | 9 | 13.0 |
| Unknown | 1 | 1.4 |
| Admission diagnosis category | ||
| Infectious | 29 | 42.0 |
| Oncology | 4 | 5.8 |
| Endocrine/metabolic | 22 | 31.9 |
| Cardiovascular | 7 | 10.1 |
| Renal | 2 | 2.8 |
| Other | 5 | 7.2 |
Of the 69 arrests, we used the telemetry rhythm at minute 0 in 42 patients (61%), minute 1 in 22 patients (32%), and minute 2 in 5 patients (7%). Agreement between telemetry and FDR was 65% (kappa=0.37, 95% confidence interval: 0.17‐0.56) (Table 3). Agreement did not vary significantly by sex, race, hospital, weekday, time of day, or minute used in the analysis. Agreement was not associated with survival to hospital discharge.
| Telemetry | Resuscitation Record | |||
|---|---|---|---|---|
| Asystole | Ventricular Tachyarrhythmia | Other Organized Rhythms | Total | |
| ||||
| Asystole | 3 | 0 | 2 | 5 |
| Ventricular tachyarrhythmia | 1 | 12 | 8 | 21 |
| Other organized rhythms | 8 | 5 | 30 | 43 |
| Total | 12 | 17 | 40 | 69 |
Of the 69 IHCA events, the FDRs vs telemetry rhythms at the time of IHCA were: asystole 17% vs 7%, VTA 25% vs 31%, and other organized rhythms 58% vs 62%. Among the 12 events with FDR recorded as asystole, telemetry at the time of the code call was asystole in 3 (25%), VTA in 1 (8%), and other organized rhythms in 8 (67%). Among the 17 events with FDR recorded as VTA, telemetry at the time of the code call was VTA in 12 (71%) and other organized rhythms in 5 (29%). Among the 40 events with FDR recorded as other organized rhythms, telemetry at the time of the code call was asystole in 2 (5%), VTA in 8 (20%), and other organized rhythms in 30 (75%). Among the 8 patients with VTA on telemetry and other organized rhythms on the resuscitation record, the other organized rhythms were documented as PEA (n=6), sinus (n=1), and bradycardia (n=1). Of the 12 patients with VTA on telemetry and on the resuscitation record, 8 (67%) had ventricular tachycardia on telemetry. Four of the 8 (50%) who had ventricular tachycardia on telemetry had deteriorated into ventricular fibrillation by the time the FDR was recorded. Of the 4 who had ventricular fibrillation on telemetry, all had ventricular fibrillation as the FDR on the resuscitation record.
DISCUSSION
These results establish that FDRs often differ from the telemetry rhythms at the time of the code blue call. This is important because national registries such as the American Heart Association's Get with the GuidelinesResuscitation[2] database use the FDR as a surrogate for arrest etiology, and use their findings to report national IHCA outcomes as well as to develop and refine evidence‐based guidelines for in‐hospital resuscitation. Our findings suggest that using the FDR may be an oversimplification of the complex progression of cardiac rhythms that occurs in the periarrest period. Adding preceding telemetry rhythms to the data elements collected may shed additional light on etiology. Furthermore, our results demonstrate that, among adults with VTA or asystole documented upon arrival of the code blue team, other organized rhythms are often present at the time the staff recognized a life‐threatening condition and called for immediate assistance. This suggests that the VTA and asystole FDRs may represent the later stages of progressive cardiopulmonary processes. This is in contrast to out‐of‐hospital cardiac arrests typically attributed to sudden catastrophic dysrhythmias that often progress to asystole unless rapidly defibrillated.[6, 7, 8] Out‐of‐hospital and in‐hospital arrests are likely different (but overlapping) entities that might benefit from different resuscitation strategies.[9, 10] We hypothesize that, for a subset of these patients, progressive respiratory insufficiency and circulatory shockconditions classically associated more strongly with pediatric than adult IHCAmay have been directly responsible for the event.[1] If future research supports the concept that progressive respiratory insufficiency and circulatory shock are responsible for more adult IHCA than previously recognized, more robust monitoring may be indicated for a larger subset of adult patients hospitalized on general wards. This could include pulse oximetry (wave form can be a surrogate for perfusion), respiratory rate, and/or end‐tidal CO2 monitoring. In addition, if future research confirms that there is a greater distinction between in‐hospital and out‐of‐hospital cardiac arrest etiology, the expert panels that develop resuscitation guidelines should consider including setting of resuscitation as a branch point in future algorithms.
Our study had several limitations. First, the sample size was small due to uninterpretable rhythm strips, and for 39% of the total code events, the telemetry data had already been purged from the system by the time research staff attempted to retrieve it. Although we do not believe that there was any systematic bias to the data analyzed, the possibility cannot be completely excluded. Second, we were constrained by the inability to retrospectively ascertain the presence of pulses to determine if an organized rhythm identified on telemetry tracings was PEA. Thus, we categorized rhythms into large groups. Although this limited the granularity of the rhythm groups, it was a conservative approach that likely biased toward agreement (the opposite direction of our hypothesis). Third, the lack of perfect time synchronization between the telemetry system, wall clocks in the hospital, and wrist watches that may be referenced when documenting resuscitative efforts on the resuscitation record means that the rhythms we used may have reflected physiology after interventions had already commenced. Thus, in some situations, minute 1, 2, or earlier minutes may more accurately reflect the preintervention rhythm. Highly accurate time synchronization should be a central component of future prospective work in this area.
CONCLUSIONS
The FDR had only fair agreement with the telemetry rhythm at the time of the code blue call. Among those with VTA or asystole documented on CPR initiation, telemetry often revealed other organized rhythms present at the time hospital staff recognized a life‐threatening condition. In contrast to out‐of‐hospital cardiac arrest, FDR of asystole was only rarely preceded by VTA, and FDR of VTA was often preceded by an organized rhythm.[8, 11] Future studies should examine antecedent rhythms in combination with respiratory and perfusion status to more precisely determine arrest etiology.
Acknowledgments
The authors thank the staff at Flex Monitoring at Christiana Care Health System for their vital contributions to the study.
Disclosures
Dr. Zubrow had full access to all the data in the study and takes responsibility for the integrity of the data and the accuracy of the data analysis. The authors report no conflicts of interest.
- , , , et al. First documented rhythm and clinical outcome from in‐hospital cardiac arrest among children and adults. JAMA. 2006;295(1):50–57.
- Get With The Guidelines–Resuscitation (GWTG‐R) overview. Available at: http://www.heart.org/HEARTORG/HealthcareResearch/GetWithTheGuidelines‐Resuscitation/Get‐With‐The‐Guidelines‐ResuscitationOverview_UCM_314497_Article.jsp. Accessed May 8, 2012.
- , , , et al. Recommended guidelines for reviewing, reporting, and conducting research on in‐hospital resuscitation: the in‐hospital “Utstein Style”. Circulation. 1997;95:2213–2239.
- , , , et al. Cardiopulmonary resuscitation of adults in the hospital: a report of 14,720 cardiac arrests from the National Registry of Cardiopulmonary Resuscitation. Resuscitation. 2003;58:297–308.
- , . The measurement of observer agreement for categorical data. Biometrics. 1977;33(1):159–174.
- , , , et al. Characteristics and outcome among patients suffering in‐hospital cardiac arrest in monitored and nonmonitored areas. Resuscitation. 2001;48:125–135.
- , , , et al. A comparison between patients suffering in‐hospital and out‐of hospital cardiac arrest in terms of treatment and outcome. J Intern Med. 2000;248:53–60.
- , , , et al. Cardiac arrest outside and inside hospital in a community: mechanisms behind the differences in outcomes and outcome in relation to time of arrest. Am Heart J. 2010;159:749–756.
- , , , et al.; Resuscitation Outcomes Consortium Investigators. Ventricular tachyarrhythmias after cardiac arrest in public versus at home. N Engl J Med. 2011;364:313–321.
- , . In‐hospital cardiac arrest. Emerg Med Clin North Am. 2012;30:25–34.
- , , , et al. Analysis of initial rhythm, witnessed status and delay to treatment among survivors of out‐of‐hospital cardiac arrest in Sweden. Heart. 2010;96:1826–1830.