User login
Safety Huddle Intervention for Reducing Physiologic Monitor Alarms: A Hybrid Effectiveness-Implementation Cluster Randomized Trial
Physiologic monitor alarms occur frequently in the hospital environment, with average rates on pediatric wards between 42 and 155 alarms per monitored patient-day.1 However, average rates do not depict the full story, because only 9%–25% of patients are responsible for most alarms on inpatient wards.1,2 In addition, only 0.5%–1% of alarms on pediatric wards warrant action.3,4 Downstream consequences of high alarm rates include interruptions5,6 and alarm fatigue.3,4,7
Alarm customization, the process of reviewing individual patients’ alarm data and using that data to implement patient-specific alarm reduction interventions, has emerged as a potential approach to unit-wide alarm management.8-11 Potential customizations include broadening alarm thresholds, instituting delays between the time the alarm condition is met and the time the alarm sounds, and changing electrodes.8-11 However, the workflows within which to identify the patients who will benefit from customization, make decisions about how to customize, and implement customizations have not been delineated.
Safety huddles are brief structured discussions among physicians, nurses, and other staff aiming to identify and mitigate threats to patient safety.11-13 In this study, we aimed to evaluate the influence of a safety huddle-based alarm intervention strategy targeting high alarm pediatric ward patients on (a) unit-level alarm rates and (b) patient-level alarm rates, as well as to (c) evaluate implementation outcomes. We hypothesized that patients discussed in huddles would have greater reductions in alarm rates in the 24 hours following their huddle than patients who were not discussed. Given that most alarms are generated by a small fraction of patients,1,2 we hypothesized that patient-level reductions would translate to unit-level reductions.
METHODS
Human Subject Protection
The Institutional Review Board of Children’s Hospital of Philadelphia approved this study with a waiver of informed consent. We registered the study at ClinicalTrials.gov (identifier NCT02458872). The original protocol is available as an Online Supplement.
Design and Framework

For our secondary effectiveness outcome evaluating the effect of the intervention on the alarm rates of the individual patients discussed in huddles, we used a cohort design embedded within the trial to analyze patient-specific alarm data collected only on randomly selected “intensive data collection days,” described below and in Figure 1.
Setting and Subjects
All patients hospitalized on 8 units that admit general pediatric and medical subspecialty patients at Children’s Hospital of Philadelphia between June 15, 2015 and May 8, 2016 were included in the primary (unit-level) analysis. Every patient’s bedside included a General Electric Dash 3000 physiologic monitor. Decisions to monitor patients were made by physicians and required orders. Default alarm settings are available in Supplementary Table 1; these settings required orders to change.
All 8 units were already convening scheduled safety huddles led by the charge nurse each day. All nurses and at least one resident were expected to attend; attending physicians and fellows were welcome but not expected to attend. Huddles focused on discussing safety concerns and patient flow. None of the preexisting huddles included alarm discussion.
Intervention
For each nonholiday weekday, we generated customized paper-based alarm huddle data “dashboards” (Supplementary Figure 1) displaying data from the patients (up to a maximum of 4) on each intervention unit with the highest numbers of high-acuity alarms (“crisis” and “warning” audible alarms, see Supplementary Table 2 for detailed listing of alarm types) in the preceding 4 hours by reviewing data from the monitor network using BedMasterEx v4.2 (Excel Medical Electronics). Dashboards listed the most frequent types of alarms, alarm settings, and included a script for discussing the alarms with checkboxes to indicate changes agreed upon by the team during the huddle. Patients with fewer than 20 alarms in the preceding 4h were not included; thus, sometimes fewer than 4 patients’ data were available for discussion. We hand-delivered dashboards to the charge nurses leading huddles, and they facilitated the multidisciplinary alarm discussions focused on reviewing alarm data and customizing settings to reduce unnecessary alarms.
Study Periods
The study had 3 periods as shown in Supplementary Figure 2: (1) 16-week baseline data collection, (2) phased intervention implementation during which we serially spent 2-8 weeks on each of the 4 intervention units implementing the intervention, and (3) 16-week postimplementation data collection.
Outcomes
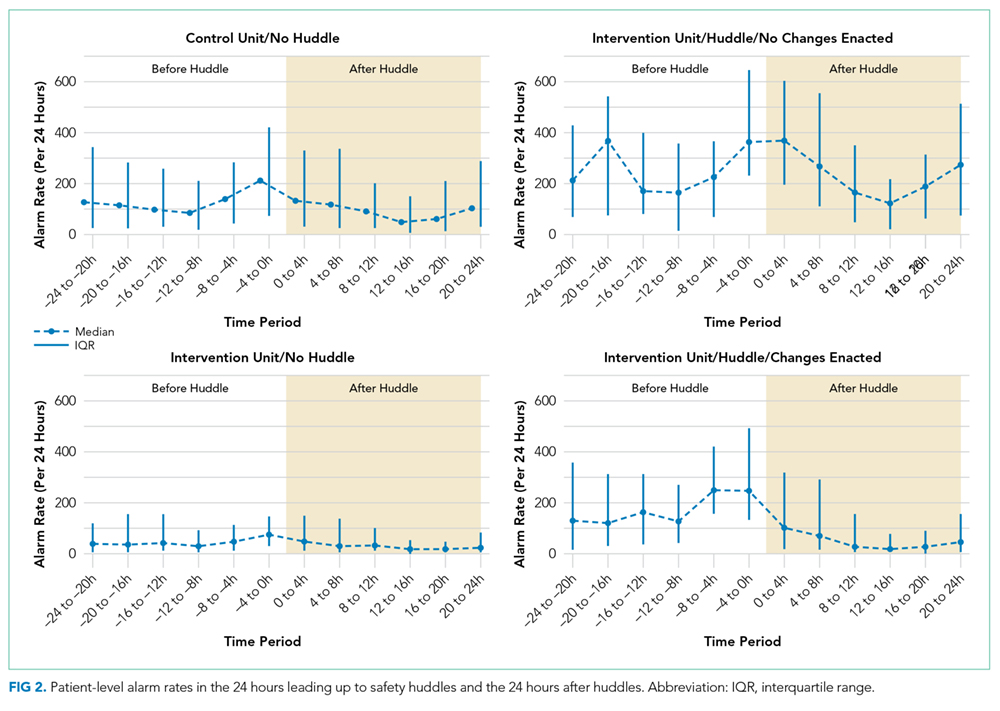
The primary effectiveness outcome was the change in unit-level alarms per patient-day between the baseline and postimplementation periods in intervention versus control units, with all patients on the units included. The secondary effectiveness outcome (analyzed using the embedded cohort design) was the change in individual patient-level alarms between the 24 hours leading up to a huddle and the 24 hours following huddles in patients who were versus patients who were not discussed in huddles.
Implementation outcomes included adoption and fidelity measures. To measure adoption (defined as “intention to try” the intervention),16 we measured the frequency of discussions attended by patients’ nurses and physicians. We evaluated 3 elements of fidelity: adherence, dose, and quality of delivery.17 We measured adherence as the incorporation of alarm discussion into huddles when there were eligible patients to discuss. We measured dose as the average number of patients discussed on each unit per calendar day during the postimplementation period. We measured quality of delivery as the extent to which changes to monitoring that were agreed upon in the huddles were made at the bedside.
Safety Measures
To surveil for unintended consequences of reduced monitoring, we screened the hospital’s rapid response and code blue team database weekly for any events in patients previously discussed in huddles that occurred between huddle and hospital discharge. We reviewed charts to determine if the events were related to the intervention.
Randomization
Prior to randomization, the 8 units were divided into pairs based on participation in hospital-wide Joint Commission alarm management activities, use of alarm middleware that relayed detailed alarm information to nurses’ mobile phones, and baseline alarm rates. One unit in each pair was randomized to intervention and the other to control by coin flip.
Data Collection
We used Research Electronic Data Capture (REDCap)18 database tools.
Data for Unit-Level Analyses
We captured all alarms occurring on the study units during the study period using data from BedMasterEx. We obtained census data accurate to the hour from the Clinical Data Warehouse.
Data Captured in All Huddles
During each huddle, we collected the number of patients whose alarms were discussed, patient characteristics, presence of nurses and physicians, and monitoring changes agreed upon. We then followed up 4 hours later to determine if changes were made at the bedside by examining monitor settings.
Data Captured Only During Intensive Data Collection Days
We randomly selected 1 day during each of the 16 weeks of the postimplementation period to obtain additional patient-level data. On each intensive data collection day, the 4 monitored patients on each intervention and control unit with the most high-acuity alarms in the 4 hours prior to huddles occurring — regardless of whether or not these patients were later discussed in huddles — were identified for data collection. On these dates, a member of the research team reviewed each patient’s alarm counts in 4-hour blocks during the 24 hours before and after the huddle. Given that the huddles were not always at the same time every day (ranging between 10:00 and 13:00), we operationally set the huddle time as 12:00 for all units.
Data Analysis
We used Stata/SE 14.2 for all analyses.
Unit-Level Alarm Rates
To compare unit-level rates, we performed an interrupted time series analysis using segmented (piecewise) regression to evaluate the impact of the intervention.19,20 We used a multivariable generalized estimating equation model with the negative binomial distribution21 and clustering by unit. We bootstrapped the model and generated percentile-based 95% confidence intervals. We then used the model to estimate the alarm rate difference in differences between the baseline data collection period and the postimplementation data collection period for intervention versus control units.
Patient-Level Alarm Rates
In contrast to unit-level analysis, we used an embedded cohort design to model the change in individual patients’ alarms between the 24 hours leading up to huddles and the 24 hours following huddles in patients who were versus patients who were not discussed in huddles. The analysis was restricted to the patients included in intensive data collection days. We performed bootstrapped linear regression and generated percentile-based 95% confidence intervals using the difference in 4-hour block alarm rate between pre- and posthuddle as the outcome. We clustered within patients. We stratified by unit and preceding alarm rate. We modeled the alarm rate difference between the 24-hour prehuddle and the 24-hour posthuddle for huddled and nonhuddled patients and the difference in differences between exposure groups.
Implementation Outcomes
We summarized adoption and fidelity using proportions.
RESULTS
Alarm dashboards informed 580 structured alarm discussions during 353 safety huddles (huddles often included discussion of more than one patient).
Unit-Level Alarm Rates
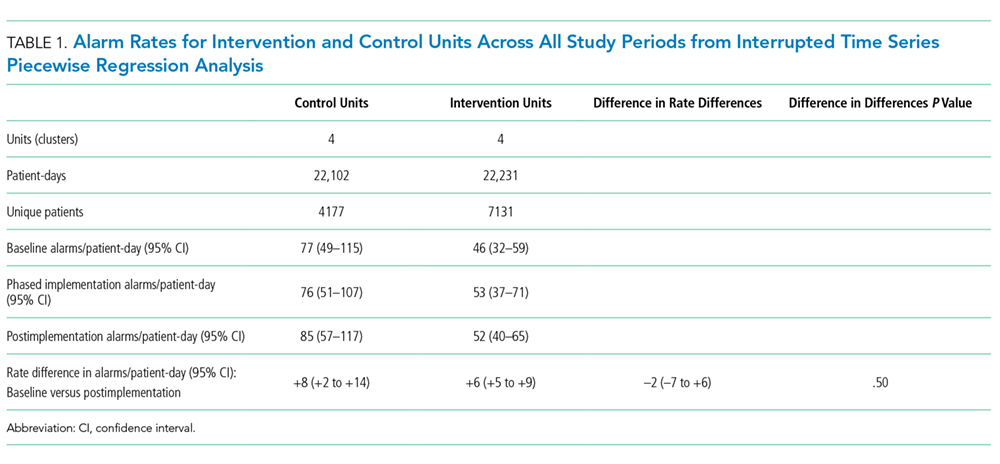
Visually, alarm rates over time on each individual unit appeared flat despite the intervention (Supplementary Figure 3). Using piecewise regression, we found that intervention and control units had small increases in alarm rates between the baseline and postimplementation periods with a nonsignificant difference in these differences between the control and intervention groups (Table 1).
Patient-Level Alarm Rates
We then restricted the analysis to the patients whose data were collected during intensive data collection days. We obtained data from 1974 pre-post pairs of 4-hour time periods.

Implementation Outcomes
Adoption
The patient’s nurse attended 482 of the 580 huddle discussions (83.1%), and at least one of the patient’s physicians (resident, fellow, or attending) attended 394 (67.9%).
Fidelity: Adherence
In addition to the 353 huddles that included alarm discussion, 123 instances had no patients with ≥20 high acuity alarms in the preceding 4 hours therefore, no data were brought to the huddle. There were an additional 30 instances when a huddle did not occur or there was no alarm discussion in the huddle despite data being available. Thus, adherence occurred in 353 of 383 huddles (92.2%).
Fidelity: Dose
During the 112 calendar day postimplementation period, 379 patients’ alarms were discussed in huddles for an average intervention dose of 0.85 discussions per unit per calendar day.
Fidelity: Quality of Delivery
In 362 of the 580 huddle discussions (62.4%), changes were agreed upon. The most frequently agreed upon changes were discontinuing monitoring (32.0%), monitoring only when asleep or unsupervised (23.8%), widening heart rate parameters (12.7%), changing electrocardiographic leads/wires (8.6%), changing the pulse oximetry probe (8.0%), and increasing the delay time between when oxygen desaturation was detected and when the alarm was generated (4.7%). Of the huddle discussions with changes agreed upon, 346 (95.6%) changes were enacted at the bedside.
Safety Measures
There were 0 code blue events and 26 rapid response team activations for patients discussed in huddles. None were related to the intervention.
Discussion
Our main finding was that the huddle strategy was effective in safely reducing the burden of alarms for the high alarm pediatric ward patients whose alarms were discussed, but it did not reduce unit-level alarm rates. Implementation outcomes explained this finding. Although adoption and adherence were high, the overall dose of the intervention was low.
We also found that 36% of alarms had technical causes, the majority of which were related to the pulse oximetry probe detecting that it was off the patient or searching for a pulse. Although these alarms are likely perceived differently by clinical staff (most monitors generate different sounds for technical alarms), they still represent a substantial contribution to the alarm environment. Minimizing them in patients who must remain continuously monitored requires more intensive effort to implement other types of interventions than the main focus of this study, such as changing pulse oximetry probes and electrocardiographic leads/wires.
In one-third of huddles, monitoring was simply discontinued. We observed in many cases that, while these patients may have had legitimate indications for monitoring upon admission, their conditions had improved; after brief multidisciplinary discussion, the team concluded that monitoring was no longer indicated. This observation may suggest interventions at the ordering phase, such as prespecifying a monitoring duration.22,23
This study’s findings were consistent with a quasi-experimental study of safety huddle-based alarm discussions in a pediatric intensive care unit that showed a patient-level reduction of 116 alarms per patient-day in those discussed in huddles relative to controls.11 A smaller quasi-experimental study of implementing a nighttime alarm “ward round” in an adult intensive care unit showed a significant reduction in unit-level alarms/patient-day from 168 to 84.9 In a quality improvement report, a monitoring care process bundle that included discussion of alarm settings showed a reduction in unit-level alarms/patient-day from 180 to 40.10 Our study strengthens the body of literature using a cluster-randomized design, measuring patient- and unit-level outcomes, and including implementation outcomes that explain effectiveness findings.
On a hypothetical unit similar to the ones we studied with 20 occupied beds and 60 alarms/patient-day, an average of 1200 alarms would occur each day. We delivered the intervention to 0.85 patients per day. Changes were made at the bedside in 60% of those with the intervention delivered, and those patients had a difference in differences of 119 fewer alarms compared with the comparison patients on control units. In this scenario, we could expect a relative reduction of 0.85 x 0.60 x 119 = 61 fewer alarms/day total on the unit or a 5% reduction. However, that estimated reduction did not account for the arrival of new patients with high alarm rates, which certainly occurred in this study and explained the lack of effect at the unit level.
As described above, the intervention dose was low, which translated into a lack of effect at the unit level despite a strong effect at the patient level. This result was partly due to the manual process required to produce the alarm dashboards that restricted their availability to nonholiday weekdays. The study was performed at one hospital, which limited generalizability. The study hospital was already convening daily safety huddles that were well attended by nurses and physicians. Other hospitals without existing huddle structures may face challenges in implementing similar multidisciplinary alarm discussions. In addition, the study design was randomized at the unit (rather than patient) level, which limited our ability to balance potential confounders at the patient level.
Conclusion
A safety huddle intervention strategy to drive alarm customization was effective in safely reducing alarms for individual children discussed. However, unit-level alarm rates were not affected by the intervention due to a low dose. Leaders of efforts to reduce alarms should consider beginning with passive interventions (such as changes to default settings and alarm delays) and use huddle-based discussion as a second-line intervention to address remaining patients with high alarm rates.
Acknowledgments
We thank Matthew MacMurchy, BA, for his assistance with data collection.
Funding/Support
This study was supported by a Young Investigator Award (Bonafide, PI) from the Academic Pediatric Association.
Role of the Funder/Sponsor
The Academic Pediatric Association had no role in the design or conduct of the study; collection, management, analysis, or interpretation of the data; preparation, review, or approval of the manuscript; or decision to submit for publication.
Disclosures
No relevant financial activities, aside from the grant funding from the Academic Pediatric Association listed above, are reported.
1. Schondelmeyer AC, Brady PW, Goel VV, et al. Physiologic monitor alarm rates at 5 children’s hospitals. J Hosp Med. 2018;In press. PubMed
2. Cvach M, Kitchens M, Smith K, Harris P, Flack MN. Customizing alarm limits based on specific needs of patients. Biomed Instrum Technol. 2017;51(3):227-234. PubMed
3. Bonafide CP, Lin R, Zander M, et al. Association between exposure to nonactionable physiologic monitor alarms and response time in a children’s hospital. J Hosp Med. 2015;10(6):345-351. PubMed
4. Bonafide CP, Localio AR, Holmes JH, et al. Video analysis of factors associated with response time to physiologic monitor alarms in a children’s hospital. JAMA Pediatr. 2017;171(6):524-531. PubMed
5. Lange K, Nowak M, Zoller R, Lauer W. Boundary conditions for safe detection of clinical alarms: An observational study to identify the cognitive and perceptual demands on an Intensive Care Unit. In: In: D. de Waard, K.A. Brookhuis, A. Toffetti, A. Stuiver, C. Weikert, D. Coelho, D. Manzey, A.B. Ünal, S. Röttger, and N. Merat (Eds.) Proceedings of the Human Factors and Ergonomics Society Europe Chapter 2015 Annual Conference. Groningen, Netherlands; 2016.
6. Westbrook JI, Li L, Hooper TD, Raban MZ, Middleton S, Lehnbom EC. Effectiveness of a ‘Do not interrupt’ bundled intervention to reduce interruptions during medication administration: a cluster randomised controlled feasibility study. BMJ Qual Saf. 2017;26:734-742. PubMed
7. Chopra V, McMahon LF Jr. Redesigning hospital alarms for patient safety: alarmed and potentially dangerous. JAMA. 2014;311(12):1199-1200. PubMed
8. Turmell JW, Coke L, Catinella R, Hosford T, Majeski A. Alarm fatigue: use of an evidence-based alarm management strategy. J Nurs Care Qual. 2017;32(1):47-54. PubMed
9. Koerber JP, Walker J, Worsley M, Thorpe CM. An alarm ward round reduces the frequency of false alarms on the ICU at night. J Intensive Care Soc. 2011;12(1):75-76.
10. Dandoy CE, Davies SM, Flesch L, et al. A team-based approach to reducing cardiac monitor alarms. Pediatrics. 2014;134(6):e1686-1694. PubMed
11. Dewan M, Wolfe H, Lin R, et al. Impact of a safety huddle–based intervention on monitor alarm rates in low-acuity pediatric intensive care unit patients. J Hosp Med. 2017;12(8):652-657. PubMed
12. Goldenhar LM, Brady PW, Sutcliffe KM, Muething SE. Huddling for high reliability and situation awareness. BMJ Qual Saf. 2013;22(11):899-906. PubMed
13. Brady PW, Muething S, Kotagal U, et al. Improving situation awareness to reduce unrecognized clinical deterioration and serious safety events. Pediatrics. 2013;131:e298-308. PubMed
14. Curran GM, Bauer M, Mittman B, Pyne JM, Stetler C. Effectiveness-implementation hybrid designs: combining elements of clinical effectiveness and implementation research to enhance public health impact. Med Care. 2012;50(3):217-226. PubMed
15. Damschroder LJ, Aron DC, Keith RE, Kirsh SR, Alexander JA, Lowery JC. Fostering implementation of health services research findings into practice: a consolidated framework for advancing implementation science. Implement Sci. 2009;4(1):50. PubMed
16. Proctor E, Silmere H, Raghavan R, et al. Outcomes for implementation research: conceptual distinctions, measurement challenges, and research agenda. Adm Policy Ment Health. 2011;38(2):65-76. PubMed
17. Allen JD, Linnan LA, Emmons KM. Fidelity and its relationship to implementation effectiveness, adaptation, and dissemination. In: Dissemination and Implementation Research in Health: Translating Science to Practice (Brownson RC, Proctor EK, Colditz GA Eds.). Oxford University Press; 2012:281-304.
18. Harris PA, Taylor R, Thielke R, Payne J, Gonzalez N, Conde JG. Research electronic data capture (REDCap)—a metadata-driven methodology and workflow process for providing translational research informatics support. J Biomed Inf. 2009;42:377-381. PubMed
19. Singer JD, Willett JB. Applied Longitudinal Data Analysis: Modeling Change and Event Occurrence. New York: Oxford University Press; 2003.
20. Wagner AK, Soumerai SB, Zhang F, Ross-Degnan D. Segmented regression analysis of interrupted time series studies in medication use research. J Clin Pharm Ther. 2002;27:299-309. PubMed
21. Gardner W, Mulvey EP, Shaw EC. Regression analyses of counts and rates: Poisson, overdispersed Poisson, and negative binomial models. Psychol Bull. 1995;118:392-404. PubMed
22. Dressler R, Dryer MM, Coletti C, Mahoney D, Doorey AJ. Altering overuse of cardiac telemetry in non-intensive care unit settings by hardwiring the use of American Heart Association guidelines. JAMA Intern Med. 2014;174(11):1852-1854. PubMed
23. Boggan JC, Navar-Boggan AM, Patel V, Schulteis RD, Simel DL. Reductions in telemetry order duration do not reduce telemetry utilization. J Hosp Med. 2014;9(12):795-796. PubMed
Physiologic monitor alarms occur frequently in the hospital environment, with average rates on pediatric wards between 42 and 155 alarms per monitored patient-day.1 However, average rates do not depict the full story, because only 9%–25% of patients are responsible for most alarms on inpatient wards.1,2 In addition, only 0.5%–1% of alarms on pediatric wards warrant action.3,4 Downstream consequences of high alarm rates include interruptions5,6 and alarm fatigue.3,4,7
Alarm customization, the process of reviewing individual patients’ alarm data and using that data to implement patient-specific alarm reduction interventions, has emerged as a potential approach to unit-wide alarm management.8-11 Potential customizations include broadening alarm thresholds, instituting delays between the time the alarm condition is met and the time the alarm sounds, and changing electrodes.8-11 However, the workflows within which to identify the patients who will benefit from customization, make decisions about how to customize, and implement customizations have not been delineated.
Safety huddles are brief structured discussions among physicians, nurses, and other staff aiming to identify and mitigate threats to patient safety.11-13 In this study, we aimed to evaluate the influence of a safety huddle-based alarm intervention strategy targeting high alarm pediatric ward patients on (a) unit-level alarm rates and (b) patient-level alarm rates, as well as to (c) evaluate implementation outcomes. We hypothesized that patients discussed in huddles would have greater reductions in alarm rates in the 24 hours following their huddle than patients who were not discussed. Given that most alarms are generated by a small fraction of patients,1,2 we hypothesized that patient-level reductions would translate to unit-level reductions.
METHODS
Human Subject Protection
The Institutional Review Board of Children’s Hospital of Philadelphia approved this study with a waiver of informed consent. We registered the study at ClinicalTrials.gov (identifier NCT02458872). The original protocol is available as an Online Supplement.
Design and Framework
For our secondary effectiveness outcome evaluating the effect of the intervention on the alarm rates of the individual patients discussed in huddles, we used a cohort design embedded within the trial to analyze patient-specific alarm data collected only on randomly selected “intensive data collection days,” described below and in Figure 1.
Setting and Subjects
All patients hospitalized on 8 units that admit general pediatric and medical subspecialty patients at Children’s Hospital of Philadelphia between June 15, 2015 and May 8, 2016 were included in the primary (unit-level) analysis. Every patient’s bedside included a General Electric Dash 3000 physiologic monitor. Decisions to monitor patients were made by physicians and required orders. Default alarm settings are available in Supplementary Table 1; these settings required orders to change.
All 8 units were already convening scheduled safety huddles led by the charge nurse each day. All nurses and at least one resident were expected to attend; attending physicians and fellows were welcome but not expected to attend. Huddles focused on discussing safety concerns and patient flow. None of the preexisting huddles included alarm discussion.
Intervention
For each nonholiday weekday, we generated customized paper-based alarm huddle data “dashboards” (Supplementary Figure 1) displaying data from the patients (up to a maximum of 4) on each intervention unit with the highest numbers of high-acuity alarms (“crisis” and “warning” audible alarms, see Supplementary Table 2 for detailed listing of alarm types) in the preceding 4 hours by reviewing data from the monitor network using BedMasterEx v4.2 (Excel Medical Electronics). Dashboards listed the most frequent types of alarms, alarm settings, and included a script for discussing the alarms with checkboxes to indicate changes agreed upon by the team during the huddle. Patients with fewer than 20 alarms in the preceding 4h were not included; thus, sometimes fewer than 4 patients’ data were available for discussion. We hand-delivered dashboards to the charge nurses leading huddles, and they facilitated the multidisciplinary alarm discussions focused on reviewing alarm data and customizing settings to reduce unnecessary alarms.
Study Periods
The study had 3 periods as shown in Supplementary Figure 2: (1) 16-week baseline data collection, (2) phased intervention implementation during which we serially spent 2-8 weeks on each of the 4 intervention units implementing the intervention, and (3) 16-week postimplementation data collection.
Outcomes
The primary effectiveness outcome was the change in unit-level alarms per patient-day between the baseline and postimplementation periods in intervention versus control units, with all patients on the units included. The secondary effectiveness outcome (analyzed using the embedded cohort design) was the change in individual patient-level alarms between the 24 hours leading up to a huddle and the 24 hours following huddles in patients who were versus patients who were not discussed in huddles.
Implementation outcomes included adoption and fidelity measures. To measure adoption (defined as “intention to try” the intervention),16 we measured the frequency of discussions attended by patients’ nurses and physicians. We evaluated 3 elements of fidelity: adherence, dose, and quality of delivery.17 We measured adherence as the incorporation of alarm discussion into huddles when there were eligible patients to discuss. We measured dose as the average number of patients discussed on each unit per calendar day during the postimplementation period. We measured quality of delivery as the extent to which changes to monitoring that were agreed upon in the huddles were made at the bedside.
Safety Measures
To surveil for unintended consequences of reduced monitoring, we screened the hospital’s rapid response and code blue team database weekly for any events in patients previously discussed in huddles that occurred between huddle and hospital discharge. We reviewed charts to determine if the events were related to the intervention.
Randomization
Prior to randomization, the 8 units were divided into pairs based on participation in hospital-wide Joint Commission alarm management activities, use of alarm middleware that relayed detailed alarm information to nurses’ mobile phones, and baseline alarm rates. One unit in each pair was randomized to intervention and the other to control by coin flip.
Data Collection
We used Research Electronic Data Capture (REDCap)18 database tools.
Data for Unit-Level Analyses
We captured all alarms occurring on the study units during the study period using data from BedMasterEx. We obtained census data accurate to the hour from the Clinical Data Warehouse.
Data Captured in All Huddles
During each huddle, we collected the number of patients whose alarms were discussed, patient characteristics, presence of nurses and physicians, and monitoring changes agreed upon. We then followed up 4 hours later to determine if changes were made at the bedside by examining monitor settings.
Data Captured Only During Intensive Data Collection Days
We randomly selected 1 day during each of the 16 weeks of the postimplementation period to obtain additional patient-level data. On each intensive data collection day, the 4 monitored patients on each intervention and control unit with the most high-acuity alarms in the 4 hours prior to huddles occurring — regardless of whether or not these patients were later discussed in huddles — were identified for data collection. On these dates, a member of the research team reviewed each patient’s alarm counts in 4-hour blocks during the 24 hours before and after the huddle. Given that the huddles were not always at the same time every day (ranging between 10:00 and 13:00), we operationally set the huddle time as 12:00 for all units.
Data Analysis
We used Stata/SE 14.2 for all analyses.
Unit-Level Alarm Rates
To compare unit-level rates, we performed an interrupted time series analysis using segmented (piecewise) regression to evaluate the impact of the intervention.19,20 We used a multivariable generalized estimating equation model with the negative binomial distribution21 and clustering by unit. We bootstrapped the model and generated percentile-based 95% confidence intervals. We then used the model to estimate the alarm rate difference in differences between the baseline data collection period and the postimplementation data collection period for intervention versus control units.
Patient-Level Alarm Rates
In contrast to unit-level analysis, we used an embedded cohort design to model the change in individual patients’ alarms between the 24 hours leading up to huddles and the 24 hours following huddles in patients who were versus patients who were not discussed in huddles. The analysis was restricted to the patients included in intensive data collection days. We performed bootstrapped linear regression and generated percentile-based 95% confidence intervals using the difference in 4-hour block alarm rate between pre- and posthuddle as the outcome. We clustered within patients. We stratified by unit and preceding alarm rate. We modeled the alarm rate difference between the 24-hour prehuddle and the 24-hour posthuddle for huddled and nonhuddled patients and the difference in differences between exposure groups.
Implementation Outcomes
We summarized adoption and fidelity using proportions.
RESULTS
Alarm dashboards informed 580 structured alarm discussions during 353 safety huddles (huddles often included discussion of more than one patient).
Unit-Level Alarm Rates
Visually, alarm rates over time on each individual unit appeared flat despite the intervention (Supplementary Figure 3). Using piecewise regression, we found that intervention and control units had small increases in alarm rates between the baseline and postimplementation periods with a nonsignificant difference in these differences between the control and intervention groups (Table 1).
Patient-Level Alarm Rates
We then restricted the analysis to the patients whose data were collected during intensive data collection days. We obtained data from 1974 pre-post pairs of 4-hour time periods.
Implementation Outcomes
Adoption
The patient’s nurse attended 482 of the 580 huddle discussions (83.1%), and at least one of the patient’s physicians (resident, fellow, or attending) attended 394 (67.9%).
Fidelity: Adherence
In addition to the 353 huddles that included alarm discussion, 123 instances had no patients with ≥20 high acuity alarms in the preceding 4 hours therefore, no data were brought to the huddle. There were an additional 30 instances when a huddle did not occur or there was no alarm discussion in the huddle despite data being available. Thus, adherence occurred in 353 of 383 huddles (92.2%).
Fidelity: Dose
During the 112 calendar day postimplementation period, 379 patients’ alarms were discussed in huddles for an average intervention dose of 0.85 discussions per unit per calendar day.
Fidelity: Quality of Delivery
In 362 of the 580 huddle discussions (62.4%), changes were agreed upon. The most frequently agreed upon changes were discontinuing monitoring (32.0%), monitoring only when asleep or unsupervised (23.8%), widening heart rate parameters (12.7%), changing electrocardiographic leads/wires (8.6%), changing the pulse oximetry probe (8.0%), and increasing the delay time between when oxygen desaturation was detected and when the alarm was generated (4.7%). Of the huddle discussions with changes agreed upon, 346 (95.6%) changes were enacted at the bedside.
Safety Measures
There were 0 code blue events and 26 rapid response team activations for patients discussed in huddles. None were related to the intervention.
Discussion
Our main finding was that the huddle strategy was effective in safely reducing the burden of alarms for the high alarm pediatric ward patients whose alarms were discussed, but it did not reduce unit-level alarm rates. Implementation outcomes explained this finding. Although adoption and adherence were high, the overall dose of the intervention was low.
We also found that 36% of alarms had technical causes, the majority of which were related to the pulse oximetry probe detecting that it was off the patient or searching for a pulse. Although these alarms are likely perceived differently by clinical staff (most monitors generate different sounds for technical alarms), they still represent a substantial contribution to the alarm environment. Minimizing them in patients who must remain continuously monitored requires more intensive effort to implement other types of interventions than the main focus of this study, such as changing pulse oximetry probes and electrocardiographic leads/wires.
In one-third of huddles, monitoring was simply discontinued. We observed in many cases that, while these patients may have had legitimate indications for monitoring upon admission, their conditions had improved; after brief multidisciplinary discussion, the team concluded that monitoring was no longer indicated. This observation may suggest interventions at the ordering phase, such as prespecifying a monitoring duration.22,23
This study’s findings were consistent with a quasi-experimental study of safety huddle-based alarm discussions in a pediatric intensive care unit that showed a patient-level reduction of 116 alarms per patient-day in those discussed in huddles relative to controls.11 A smaller quasi-experimental study of implementing a nighttime alarm “ward round” in an adult intensive care unit showed a significant reduction in unit-level alarms/patient-day from 168 to 84.9 In a quality improvement report, a monitoring care process bundle that included discussion of alarm settings showed a reduction in unit-level alarms/patient-day from 180 to 40.10 Our study strengthens the body of literature using a cluster-randomized design, measuring patient- and unit-level outcomes, and including implementation outcomes that explain effectiveness findings.
On a hypothetical unit similar to the ones we studied with 20 occupied beds and 60 alarms/patient-day, an average of 1200 alarms would occur each day. We delivered the intervention to 0.85 patients per day. Changes were made at the bedside in 60% of those with the intervention delivered, and those patients had a difference in differences of 119 fewer alarms compared with the comparison patients on control units. In this scenario, we could expect a relative reduction of 0.85 x 0.60 x 119 = 61 fewer alarms/day total on the unit or a 5% reduction. However, that estimated reduction did not account for the arrival of new patients with high alarm rates, which certainly occurred in this study and explained the lack of effect at the unit level.
As described above, the intervention dose was low, which translated into a lack of effect at the unit level despite a strong effect at the patient level. This result was partly due to the manual process required to produce the alarm dashboards that restricted their availability to nonholiday weekdays. The study was performed at one hospital, which limited generalizability. The study hospital was already convening daily safety huddles that were well attended by nurses and physicians. Other hospitals without existing huddle structures may face challenges in implementing similar multidisciplinary alarm discussions. In addition, the study design was randomized at the unit (rather than patient) level, which limited our ability to balance potential confounders at the patient level.
Conclusion
A safety huddle intervention strategy to drive alarm customization was effective in safely reducing alarms for individual children discussed. However, unit-level alarm rates were not affected by the intervention due to a low dose. Leaders of efforts to reduce alarms should consider beginning with passive interventions (such as changes to default settings and alarm delays) and use huddle-based discussion as a second-line intervention to address remaining patients with high alarm rates.
Acknowledgments
We thank Matthew MacMurchy, BA, for his assistance with data collection.
Funding/Support
This study was supported by a Young Investigator Award (Bonafide, PI) from the Academic Pediatric Association.
Role of the Funder/Sponsor
The Academic Pediatric Association had no role in the design or conduct of the study; collection, management, analysis, or interpretation of the data; preparation, review, or approval of the manuscript; or decision to submit for publication.
Disclosures
No relevant financial activities, aside from the grant funding from the Academic Pediatric Association listed above, are reported.
1. Schondelmeyer AC, Brady PW, Goel VV, et al. Physiologic monitor alarm rates at 5 children’s hospitals. J Hosp Med. 2018;In press. PubMed
2. Cvach M, Kitchens M, Smith K, Harris P, Flack MN. Customizing alarm limits based on specific needs of patients. Biomed Instrum Technol. 2017;51(3):227-234. PubMed
3. Bonafide CP, Lin R, Zander M, et al. Association between exposure to nonactionable physiologic monitor alarms and response time in a children’s hospital. J Hosp Med. 2015;10(6):345-351. PubMed
4. Bonafide CP, Localio AR, Holmes JH, et al. Video analysis of factors associated with response time to physiologic monitor alarms in a children’s hospital. JAMA Pediatr. 2017;171(6):524-531. PubMed
5. Lange K, Nowak M, Zoller R, Lauer W. Boundary conditions for safe detection of clinical alarms: An observational study to identify the cognitive and perceptual demands on an Intensive Care Unit. In: In: D. de Waard, K.A. Brookhuis, A. Toffetti, A. Stuiver, C. Weikert, D. Coelho, D. Manzey, A.B. Ünal, S. Röttger, and N. Merat (Eds.) Proceedings of the Human Factors and Ergonomics Society Europe Chapter 2015 Annual Conference. Groningen, Netherlands; 2016.
6. Westbrook JI, Li L, Hooper TD, Raban MZ, Middleton S, Lehnbom EC. Effectiveness of a ‘Do not interrupt’ bundled intervention to reduce interruptions during medication administration: a cluster randomised controlled feasibility study. BMJ Qual Saf. 2017;26:734-742. PubMed
7. Chopra V, McMahon LF Jr. Redesigning hospital alarms for patient safety: alarmed and potentially dangerous. JAMA. 2014;311(12):1199-1200. PubMed
8. Turmell JW, Coke L, Catinella R, Hosford T, Majeski A. Alarm fatigue: use of an evidence-based alarm management strategy. J Nurs Care Qual. 2017;32(1):47-54. PubMed
9. Koerber JP, Walker J, Worsley M, Thorpe CM. An alarm ward round reduces the frequency of false alarms on the ICU at night. J Intensive Care Soc. 2011;12(1):75-76.
10. Dandoy CE, Davies SM, Flesch L, et al. A team-based approach to reducing cardiac monitor alarms. Pediatrics. 2014;134(6):e1686-1694. PubMed
11. Dewan M, Wolfe H, Lin R, et al. Impact of a safety huddle–based intervention on monitor alarm rates in low-acuity pediatric intensive care unit patients. J Hosp Med. 2017;12(8):652-657. PubMed
12. Goldenhar LM, Brady PW, Sutcliffe KM, Muething SE. Huddling for high reliability and situation awareness. BMJ Qual Saf. 2013;22(11):899-906. PubMed
13. Brady PW, Muething S, Kotagal U, et al. Improving situation awareness to reduce unrecognized clinical deterioration and serious safety events. Pediatrics. 2013;131:e298-308. PubMed
14. Curran GM, Bauer M, Mittman B, Pyne JM, Stetler C. Effectiveness-implementation hybrid designs: combining elements of clinical effectiveness and implementation research to enhance public health impact. Med Care. 2012;50(3):217-226. PubMed
15. Damschroder LJ, Aron DC, Keith RE, Kirsh SR, Alexander JA, Lowery JC. Fostering implementation of health services research findings into practice: a consolidated framework for advancing implementation science. Implement Sci. 2009;4(1):50. PubMed
16. Proctor E, Silmere H, Raghavan R, et al. Outcomes for implementation research: conceptual distinctions, measurement challenges, and research agenda. Adm Policy Ment Health. 2011;38(2):65-76. PubMed
17. Allen JD, Linnan LA, Emmons KM. Fidelity and its relationship to implementation effectiveness, adaptation, and dissemination. In: Dissemination and Implementation Research in Health: Translating Science to Practice (Brownson RC, Proctor EK, Colditz GA Eds.). Oxford University Press; 2012:281-304.
18. Harris PA, Taylor R, Thielke R, Payne J, Gonzalez N, Conde JG. Research electronic data capture (REDCap)—a metadata-driven methodology and workflow process for providing translational research informatics support. J Biomed Inf. 2009;42:377-381. PubMed
19. Singer JD, Willett JB. Applied Longitudinal Data Analysis: Modeling Change and Event Occurrence. New York: Oxford University Press; 2003.
20. Wagner AK, Soumerai SB, Zhang F, Ross-Degnan D. Segmented regression analysis of interrupted time series studies in medication use research. J Clin Pharm Ther. 2002;27:299-309. PubMed
21. Gardner W, Mulvey EP, Shaw EC. Regression analyses of counts and rates: Poisson, overdispersed Poisson, and negative binomial models. Psychol Bull. 1995;118:392-404. PubMed
22. Dressler R, Dryer MM, Coletti C, Mahoney D, Doorey AJ. Altering overuse of cardiac telemetry in non-intensive care unit settings by hardwiring the use of American Heart Association guidelines. JAMA Intern Med. 2014;174(11):1852-1854. PubMed
23. Boggan JC, Navar-Boggan AM, Patel V, Schulteis RD, Simel DL. Reductions in telemetry order duration do not reduce telemetry utilization. J Hosp Med. 2014;9(12):795-796. PubMed
© 2018 Society of Hospital Medicine
Monitor Alarms and Response Time
Hospital physiologic monitors can alert clinicians to early signs of physiologic deterioration, and thus have great potential to save lives. However, monitors generate frequent alarms,[1, 2, 3, 4, 5, 6, 7, 8] and most are not relevant to the patient's safety (over 90% of pediatric intensive care unit (PICU)[1, 2] and over 70% of adult intensive care alarms).[5, 6] In psychology experiments, humans rapidly learn to ignore or respond more slowly to alarms when exposed to high false‐alarm rates, exhibiting alarm fatigue.[9, 10] In 2013, The Joint Commission named alarm fatigue the most common contributing factor to alarm‐related sentinel events in hospitals.[11, 12]
Although alarm fatigue has been implicated as a major threat to patient safety, little empirical data support its existence in hospitals. In this study, we aimed to determine if there was an association between nurses' recent exposure to nonactionable physiologic monitor alarms and their response time to future alarms for the same patients. This exploratory work was designed to inform future research in this area, acknowledging that the sample size would be too small for multivariable modeling.
METHODS
Study Definitions
The alarm classification scheme is shown in Figure 1. Note that, for clarity, we have intentionally avoided using the terms true and false alarms because their interpretations vary across studies and can be misleading.
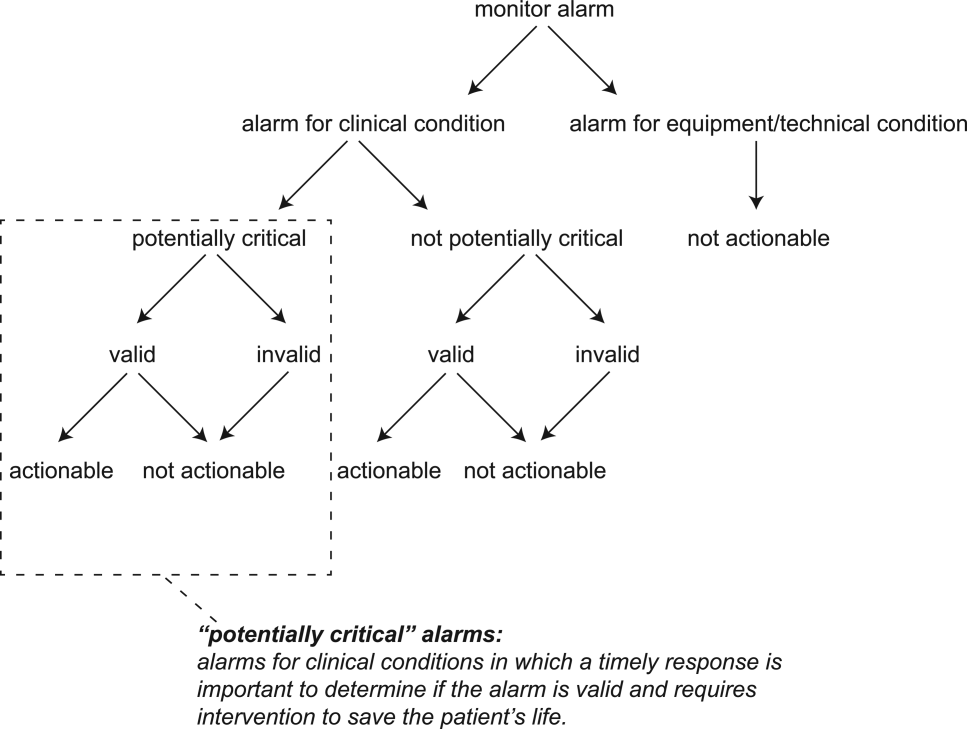
Potentially Critical Alarm
A potentially critical alarm is any alarm for a clinical condition for which a timely response is important to determine if the alarm requires intervention to save the patient's life. This is based on the alarm type alone, including alarms for life‐threatening arrhythmias such as asystole and ventricular tachycardia, as well as alarms for vital signs outside the set limits. Supporting Table 1 in the online version of this article lists the breakdown of alarm types that we defined a priori as potentially and not potentially critical.
| PICU | Ward | |||||||
|---|---|---|---|---|---|---|---|---|
| Alarm type | No. | % of Total | % Valid | % Actionable | No. | % of Total | % Valid | % Actionable |
| ||||||||
| Oxygen saturation | 197 | 19.4 | 82.7 | 38.6 | 590 | 41.2 | 24.4 | 1.9 |
| Heart rate | 194 | 19.1 | 95.4 | 1.0 | 266 | 18.6 | 87.2 | 0.0 |
| Respiratory rate | 229 | 22.6 | 80.8 | 13.5 | 316 | 22.1 | 48.1 | 1.0 |
| Blood pressure | 259 | 25.5 | 83.8 | 5.8 | 11 | 0.8 | 72.7 | 0.0 |
| Critical arrhythmia | 1 | 0.1 | 0.0 | 0.0 | 4 | 0.3 | 0.0 | 0.0 |
| Noncritical arrhythmia | 71 | 7.0 | 2.8 | 0.0 | 244 | 17.1 | 8.6 | 0.0 |
| Central venous pressure | 49 | 4.8 | 0.0 | 0.0 | 0 | 0.0 | N/A | N/A |
| Exhaled carbon dioxide | 14 | 1.4 | 92.9 | 50.0 | 0 | 0.0 | N/A | N/A |
| Total | 1014 | 100.0 | 75.6 | 12.9 | 1,431 | 100.0 | 38.9 | 1.0 |
Valid Alarm
A valid alarm is any alarm that correctly identifies the physiologic status of the patient. Validity was based on waveform quality, lead signal strength indicators, and artifact conditions, referencing each monitor's operator's manual.
Actionable Alarm
An actionable alarm is any valid alarm for a clinical condition that either: (1) leads to a clinical intervention; (2) leads to a consultation with another clinician at the bedside (and thus visible on camera); or (3) is a situation that should have led to intervention or consultation, but the alarm was unwitnessed or misinterpreted by the staff at the bedside.
Nonactionable Alarm
An unactionable alarm is any alarm that does not meet the actionable definition above, including invalid alarms such as those caused by motion artifact, equipment/technical alarms, and alarms that are valid but nonactionable (nuisance alarms).[13]
Response Time
The response time is the time elapsed from when the alarm fired at the bedside to when the nurse entered the room or peered through a window or door, measured in seconds.
Setting and Subjects
We performed this study between August 2012 and July 2013 at a freestanding children's hospital. We evaluated nurses caring for 2 populations: (1) PICU patients with heart and/or lung failure (requiring inotropic support and/or invasive mechanical ventilation), and (2) medical patients on a general inpatient ward. Nurses caring for heart and/or lung failure patients in the PICU typically were assigned 1 to 2 total patients. Nurses on the medical ward typically were assigned 2 to 4 patients. We identified subjects from the population of nurses caring for eligible patients with parents available to provide in‐person consent in each setting. Our primary interest was to evaluate the association between nonactionable alarms and response time, and not to study the epidemiology of alarms in a random sample. Therefore, when alarm data were available prior to screening, we first approached nurses caring for patients in the top 25% of alarm rates for that unit over the preceding 4 hours. We identified preceding alarm rates using BedMasterEx (Excel Medical Electronics, Jupiter, FL).
Human Subjects Protection
This study was approved by the institutional review board of The Children's Hospital of Philadelphia. We obtained written in‐person consent from the patient's parent and the nurse subject. We obtained a Certificate of Confidentiality from the National Institutes of Health to further protect study participants.[14]
Monitoring Equipment
All patients in the PICU were monitored continuously using General Electric (GE) (Fairfield, CT) solar devices. All bed spaces on the wards include GE Dash monitors that are used if ordered. On the ward we studied, 30% to 50% of patients are typically monitored at any given time. In addition to alarming at the bedside, most clinical alarms also generated a text message sent to the nurse's wireless phone listing the room number and the word monitor. Messages did not provide any clinical information about the alarm or patient's status. There were no technicians reviewing alarms centrally.
Physicians used an order set to order monitoring, selecting 1 of 4 available preconfigured profiles: infant <6 months, infant 6 months to 1 year, child, and adult. The parameters for each age group are in Supporting Figure 1, available in the online version of this article. A physician order is required for a nurse to change the parameters. Participating in the study did not affect this workflow.
Primary Outcome
The primary outcome was the nurse's response time to potentially critical monitor alarms that occurred while neither they nor any other clinicians were in the patient's room.
Primary Exposure and Alarm Classification
The primary exposure was the number of nonactionable alarms in the same patient over the preceding 120 minutes (rolling and updated each minute). The alarm classification scheme is shown in Figure 1.
Due to technical limitations with obtaining time‐stamped alarm data from the different ventilators in use during the study period, we were unable to identify the causes of all ventilator alarms. Therefore, we included ventilator alarms that did not lead to clinical interventions as nonactionable alarm exposures, but we did not evaluate the response time to any ventilator alarms.
Data Collection
We combined video recordings with monitor time‐stamp data to evaluate the association between nonactionable alarms and the nurse's response time. Our detailed video recording and annotation methods have been published separately.[15] Briefly, we mounted up to 6 small video cameras in patients' rooms and recorded up to 6 hours per session. The cameras captured the monitor display, a wide view of the room, a close‐up view of the patient, and all windows and doors through which staff could visually assess the patient without entering the room.
Video Processing, Review, and Annotation
The first 5 video sessions were reviewed in a group training setting. Research assistants received instruction on how to determine alarm validity and actionability in accordance with the study definitions. Following the training period, the review workflow was as follows. First, a research assistant entered basic information and a preliminary assessment of the alarm's clinical validity and actionability into a REDCap (Research Electronic Data Capture; Vanderbilt University, Nashville, TN) database.[16] Later, a physician investigator secondarily reviewed all alarms and confirmed the assessments of the research assistants or, when disagreements occurred, discussed and reconciled the database. Alarms that remained unresolved after secondary review were flagged for review with an additional physician or nurse investigator in a team meeting.
Data Analysis
We summarized the patient and nurse subjects, the distributions of alarms, and the response times to potentially critical monitor alarms that occurred while neither the nurse nor any other clinicians were in the patient's room. We explored the data using plots of alarms and response times occurring within individual video sessions as well as with simple linear regression. Hypothesizing that any alarm fatigue effect would be strongest in the highest alarm patients, and having observed that alarms are distributed very unevenly across patients in both the PICU and ward, we made the decision not to use quartiles, but rather to form clinically meaningful categories. We also hypothesized that nurses might not exhibit alarm fatigue unless they were inundated with alarms. We thus divided the nonactionable alarm counts over the preceding 120 minutes into 3 categories: 0 to 29 alarms to represent a low to average alarm rate exhibited by the bottom 50% of the patients, 30 to 79 alarms to represent an elevated alarm rate, and 80+ alarms to represent an extremely high alarm rate exhibited by the top 5%. Because the exposure time was 120 minutes, we conducted the analysis on the alarms occurring after a nurse had been video recorded for at least 120 minutes.
We further evaluated the relationship between nonactionable alarms and nurse response time with Kaplan‐Meier plots by nonactionable alarm count category using the observed response‐time data. The Kaplan‐Meier plots compared response time across the nonactionable alarm exposure group, without any statistical modeling. A log‐rank test stratified by nurse evaluated whether the distributions of response time in the Kaplan‐Meier plots differed across the 3 alarm exposure groups, accounting for within‐nurse clustering.
Accelerated failure‐time regression based on the Weibull distribution then allowed us to compare response time across each alarm exposure group and provided confidence intervals. Accelerated failure‐time models are comparable to Cox models, but emphasize time to event rather than hazards.[17, 18] We determined that the Weibull distribution was suitable by evaluating smoothed hazard and log‐hazard plots, the confidence intervals of the shape parameters in the Weibull models that did not include 1, and by demonstrating that the Weibull model had better fit than an alternative (exponential) model using the likelihood‐ratio test (P<0.0001 for PICU, P=0.02 for ward). Due to the small sample size of nurses and patients, we could not adjust for nurse‐ or patient‐level covariates in the model. When comparing the nonactionable alarm exposure groups in the regression model (029 vs 3079, 3079 vs 80+, and 029 vs 80+), we Bonferroni corrected the critical P value for the 3 comparisons, for a critical P value of 0.05/3=0.0167.
Nurse Questionnaire
At the session's conclusion, nurses completed a questionnaire that included demographics and asked, Did you respond more quickly to monitor alarms during this study because you knew you were being filmed? to measure if nurses would report experiencing a Hawthorne‐like effect.[19, 20, 21]
RESULTS
We performed 40 sessions among 40 patients and 36 nurses over 210 hours. We performed 20 sessions in children with heart and/or lung failure in the PICU and 20 sessions in children on a general ward. Sessions took place on weekdays between 9:00 am and 6:00 pm. There were 3 occasions when we filmed 2 patients cared for by the same nurse at the same time.
Nurses were mostly female (94.4%) and had between 2 months and 28 years of experience (median, 4.8 years). Patients on the ward ranged from 5 days to 5.4 years old (median, 6 months). Patients in the PICU ranged from 5 months to 16 years old (median, 2.5 years). Among the PICU patients, 14 (70%) were receiving mechanical ventilation only, 3 (15%) were receiving vasopressors only, and 3 (15%) were receiving mechanical ventilation and vasopressors.
We observed 5070 alarms during the 40 sessions. We excluded 108 (2.1%) that occurred at the end of video recording sessions with the nurse absent from the room because the nurse's response could not be determined. Alarms per session ranged from 10 to 1430 (median, 75; interquartile range [IQR], 35138). We excluded the outlier PICU patient with 1430 alarms in 5 hours from the analysis to avoid the potential for biasing the results. Figure 2 depicts the data flow.
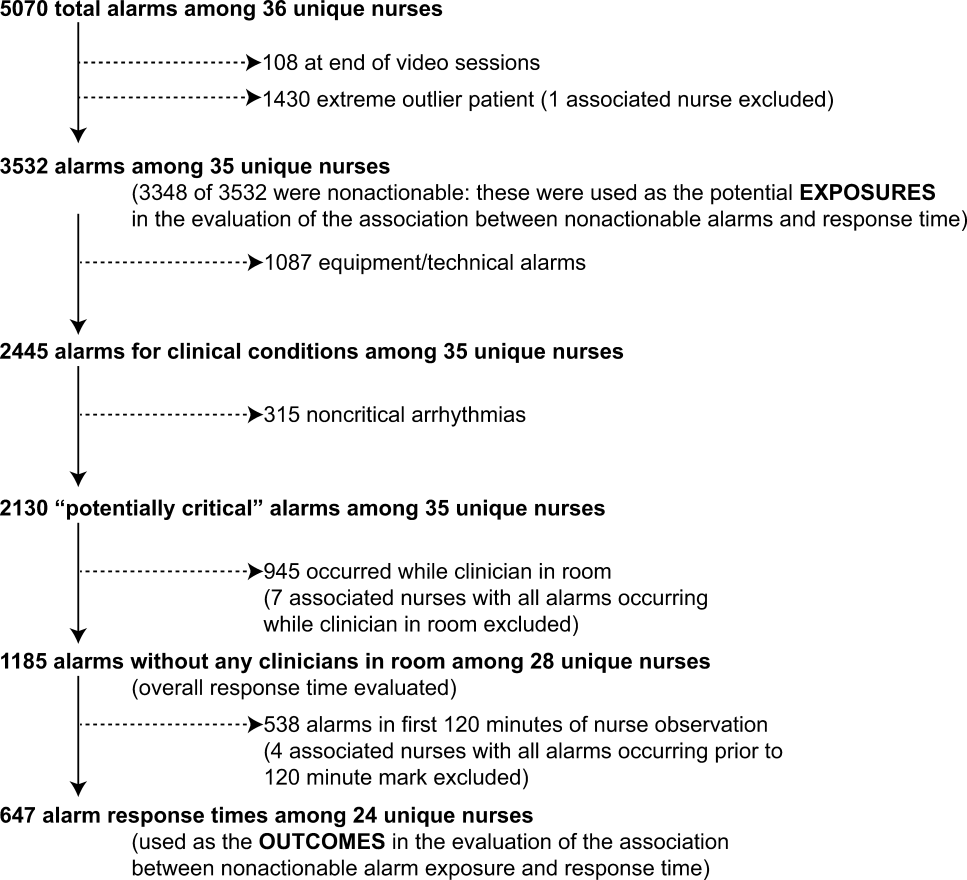
Following the 5 training sessions, research assistants independently reviewed and made preliminary assessments on 4674 alarms; these alarms were all secondarily reviewed by a physician. Using the physician reviewer as the gold standard, the research assistant's sensitivity (assess alarm as actionable when physician also assesses as actionable) was 96.8% and specificity (assess alarm as nonactionable when physician also assesses as nonactionable) was 96.9%. We had to review 54 of 4674 alarms (1.2%) with an additional physician or nurse investigator to achieve consensus.
Characteristics of the 2445 alarms for clinical conditions are shown in Table 1. Only 12.9% of alarms in heart‐ and/or lung‐failure patients in the PICU were actionable, and only 1.0% of alarms in medical patients on a general inpatient ward were actionable.
Overall Response Times for Out‐of‐Room Alarms
We first evaluated response times without excluding alarms occurring prior to the 120‐minute mark. Of the 2445 clinical condition alarms, we excluded the 315 noncritical arrhythmia types from analysis of response time because they did not meet our definition of potentially critical alarms. Of the 2130 potentially critical alarms, 1185 (55.6%) occurred while neither the nurse nor any other clinician was in the patient's room. We proceeded to analyze the response time to these 1185 alarms (307 in the PICU and 878 on the ward). In the PICU, median response time was 3.3 minutes (IQR, 0.814.4). On the ward, median response time was 9.8 minutes (IQR, 3.222.4).
Response‐Time Association With Nonactionable Alarm Exposure
Next, we analyzed the association between response time to potentially critical alarms that occurred when the nurse was not in the patient's room and the number of nonactionable alarms occurring over the preceding 120‐minute window. This required excluding the alarms that occurred in the first 120 minutes of each session, leaving 647 alarms with eligible response times to evaluate the exposure between prior nonactionable alarm exposure and response time: 219 in the PICU and 428 on the ward. Kaplan‐Meier plots and tabulated response times demonstrated the incremental relationships between each nonactionable alarm exposure category in the observed data, with the effects most prominent as the Kaplan‐Meier plots diverged beyond the median (Figure 3 and Table 2). Excluding the extreme outlier patient had no effect on the results, because 1378 of the 1430 alarms occurred with the nurse present at the bedside, and only 2 of the remaining alarms were potentially critical.
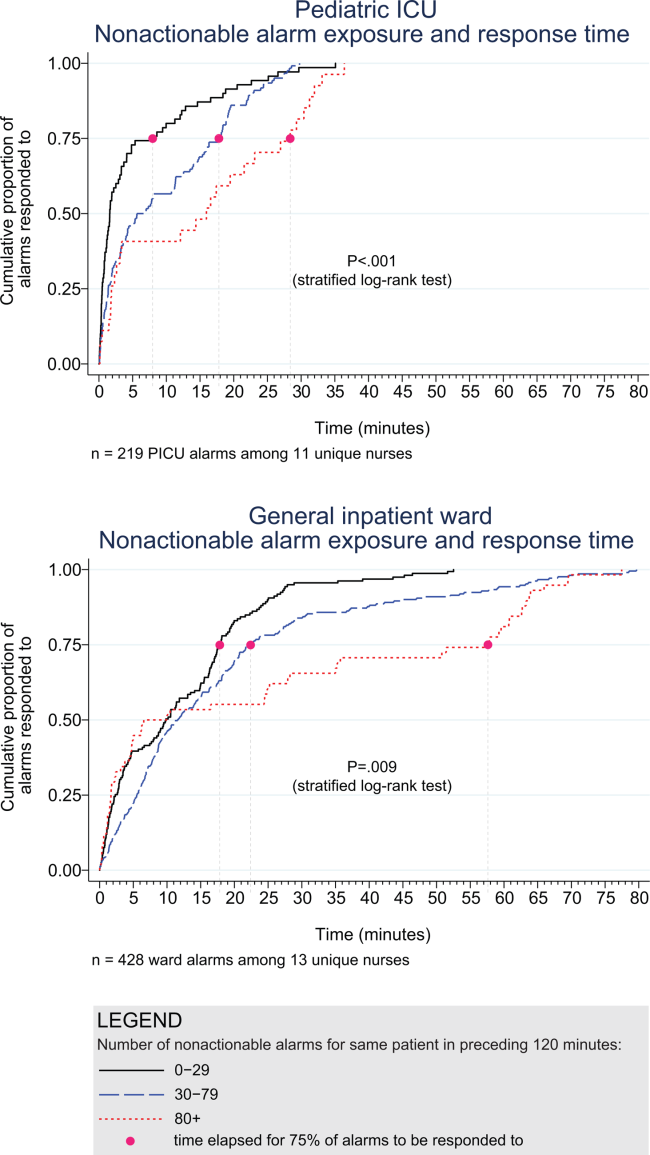
| Observed Data | Accelerated Failure‐Time Model | |||||||
|---|---|---|---|---|---|---|---|---|
| Number of Potentially Critical Alarms | Minutes Elapsed Until This Percentage of Alarms Was Responded to | Modeled Response Time, min | 95% CI, min | P Value* | ||||
| 50% (Median) | 75% | 90% | 95% | |||||
| ||||||||
| PICU | ||||||||
| 029 nonactionable alarms | 70 | 1.6 | 8.0 | 18.6 | 25.1 | 2.8 | 1.9‐3.8 | Reference |
| 3079 nonactionable alarms | 122 | 6.3 | 17.8 | 22.5 | 26.0 | 5.3 | 4.06.7 | 0.001 (vs 029) |
| 80+ nonactionable alarms | 27 | 16.0 | 28.4 | 32.0 | 33.1 | 8.5 | 4.312.7 | 0.009 (vs 029), 0.15 (vs 3079) |
| Ward | ||||||||
| 029 nonactionable alarms | 159 | 9.8 | 17.8 | 25.0 | 28.9 | 7.7 | 6.39.1 | Reference |
| 3079 nonactionable alarms | 211 | 11.6 | 22.4 | 44.6 | 63.2 | 11.5 | 9.613.3 | 0.001 (vs 029) |
| 80+ nonactionable alarms | 58 | 8.3 | 57.6 | 63.8 | 69.5 | 15.6 | 11.020.1 | 0.001 (vs 029), 0.09 (vs 3079) |
Accelerated failure‐time regressions revealed significant incremental increases in the modeled response time as the number of preceding nonactionable alarms increased in both the PICU and ward settings (Table 2).
Hawthorne‐like Effects
Four of the 36 nurses reported that they responded more quickly to monitor alarms because they knew they were being filmed.
DISCUSSION
Alarm fatigue has recently generated interest among nurses,[22] physicians,[23] regulatory bodies,[24] patient safety organizations,[25] and even attorneys,[26] despite a lack of prior evidence linking nonactionable alarm exposure to response time or other adverse patient‐relevant outcomes. This study's main findings were that (1) the vast majority of alarms were nonactionable, (2) response time to alarms occurring while the nurse was out of the room increased as the number of nonactionable alarms over the preceding 120 minutes increased. These findings may be explained by alarm fatigue.
Our results build upon the findings of other related studies. The nonactionable alarm proportions we found were similar to other pediatric studies, reporting greater than 90% nonactionable alarms.[1, 2] One other study has reported a relationship between alarm exposure and response time. In that study, Voepel‐Lewis and colleagues evaluated nurse responses to pulse oximetry desaturation alarms in adult orthopedic surgery patients using time‐stamp data from their monitor notification system.[27] They found that alarm response time was significantly longer for patients in the highest quartile of alarms compared to those in lower quartiles. Our study provides new data suggesting a relationship between nonactionable alarm exposure and nurse response time.
Our study has several limitations. First, as a preliminary study to investigate feasibility and possible association, the sample of patients and nurses was necessarily limited and did not permit adjustment for nurse‐ or patient‐level covariates. A multivariable analysis with a larger sample might provide insight into alternate explanations for these findings other than alarm fatigue, including measures of nurse workload and patient factors (such as age and illness severity). Additional factors that are not as easily measured can also contribute to the complex decision of when and how to respond to alarms.[28, 29] Second, nurses were aware that they were being video recorded as part of a study of nonactionable alarms, although they did not know the specific details of measurement. Although this lack of blinding might lead to a Hawthorne‐like effect, our positive results suggest that this effect, if present, did not fully obscure the association. Third, all sessions took place on weekdays during daytime hours, but effects of nonactionable alarms might vary by time and day. Finally, we suspect that when nurses experience critical alarms that require them to intervene and rescue a patient, their response times to that patient's alarms that occur later in their shift will be quicker due to a heightened concern for the alarm being actionable. We were unable to explore that relationship in this analysis because the number of critical alarms requiring intervention was very small. This is a topic of future study.
CONCLUSIONS
We identified an association between a nurse's prior exposure to nonactionable alarms and response time to future alarms. This finding is consistent with alarm fatigue, but requires further study to more clearly delineate other factors that might confound or modify that relationship.
Disclosures
This project was funded by the Health Research Formula Fund Grant 4100050891 from the Pennsylvania Department of Public Health Commonwealth Universal Research Enhancement Program (awarded to Drs. Keren and Bonafide). Dr. Bonafide is also supported by the National Heart, Lung, and Blood Institute of the National Institutes of Health under award number K23HL116427. The content is solely the responsibility of the authors and does not necessarily represent the official views of the National Institutes of Health. The authors have no financial relationships or conflicts of interest relevant to this article to disclose.
- . Crying wolf: false alarms in a pediatric intensive care unit. Crit Care Med. 1994;22(6):981–985.
- , . Poor prognosis for existing monitors in the intensive care unit. Crit Care Med. 1997;25(4):614–619.
- , , , , . Clinical evaluation of alarm efficiency in intensive care [in French]. Ann Fr Anesth Reanim. 2000;19:459–466.
- , , , . Reducing false alarms of intensive care online‐monitoring systems: an evaluation of two signal extraction algorithms. Comput Math Methods Med. 2011;2011:143480.
- , , , , , . Multicentric study of monitoring alarms in the adult intensive care unit (ICU): a descriptive analysis. Intensive Care Med. 1999;25:1360–1366.
- , , . Improving alarm performance in the medical intensive care unit using delays and clinical context. Anesth Analg. 2009;108:1546–1552.
- , . Monitor alarm fatigue: standardizing use of physiological monitors and decreasing nuisance alarms. Am J Crit Care. 2010;19:28–34.
- , , , , , . Intensive care unit alarms—how many do we need? Crit Care Med. 2010;38:451–456.
- , , , . System operator response to warnings of danger: a laboratory investigation of the effects of the predictive value of a warning on human response time. J Exp Psychol Appl. 1995;1:19–33.
- , , . Human probability matching behaviour in response to alarms of varying reliability. Ergonomics. 1995;38:2300–2312.
- The Joint Commission. Sentinel event alert: medical device alarm safety in hospitals. 2013. Available at: http://www.jointcommission.org/sea_issue_50/. Accessed October 9, 2014.
- . Joint commission warns of alarm fatigue: multitude of alarms from monitoring devices problematic. JAMA. 2013;309(22):2315–2316.
- . Monitor alarm fatigue: an integrative review. Biomed Instrum Technol. 2012;46(4):268–277.
- NIH Certificates of Confidentiality Kiosk. Available at: http://grants.nih.gov/grants/policy/coc/. Accessed April 21, 2014.
- , , , et al. Video methods for evaluating physiologic monitor alarms and alarm responses. Biomed Instrum Technol. 2014;48(3):220–230.
- , , , , , . Research electronic data capture (REDCap)—a metadata‐driven methodology and workflow process for providing translational research informatics support. J Biomed Inf. 2009;42:377–381.
- . Accelerated failure time and other parametric models. In: Modelling Survival Data in Medical Research. 2nd ed. Boca Raton, FL: Chapman 2003:197–229.
- , , , . Parametric models. In: An Introduction to Survival Analysis Using Stata, 3rd ed. College Station, TX: Stata Press; 2010:229–244.
- , . Management and the Worker. Cambridge, MA: Harvard University Press; 1939.
- . What happened at Hawthorne? Science. 1974;183(4128):922–932.
- , , , , . Validation of the Work Observation Method By Activity Timing (WOMBAT) method of conducting time‐motion observations in critical care settings: an observational study. BMC Med Inf Decis Mak. 2011;11:32.
- , . Alarm fatigue: a patient safety concern. AACN Adv Crit Care. 2013;24(4):378–386.
- , . Redesigning hospital alarms for patient safety: alarmed and potentially dangerous. JAMA. 2014;311(12):1199–1200.
- The Joint Commission. The Joint Commission announces 2014 National Patient Safety Goal. Jt Comm Perspect. 2013;33:1–4.
- Top 10 health technology hazards for 2014. Health Devices. 2013;42(11):354–380.
- My Philly Lawyer. Medical malpractice: alarm fatigue threatens patient safety. 2014. Available at: http://www.myphillylawyer.com/Resources/Legal-Articles/Medical-Malpractice-Alarm-Fatigue-Threatens-Patient-Safety.shtml. Accessed April 4, 2014.
- , , , et al. Pulse oximetry desaturation alarms on a general postoperative adult unit: a prospective observational study of nurse response time. Int J Nurs Stud. 2013;50(10):1351–1358.
- , , , , . A description of nurses' decision‐making in managing electrocardiographic monitor alarms [published online ahead of print May 10, 2014]. J Clin Nurs. doi:10.1111/jocn.12625.
- . Nurses' response to frequency and types of electrocardiography alarms in a non‐critical care setting: a descriptive study. Int J Nurs Stud. 2014;51(2):190–197.
Hospital physiologic monitors can alert clinicians to early signs of physiologic deterioration, and thus have great potential to save lives. However, monitors generate frequent alarms,[1, 2, 3, 4, 5, 6, 7, 8] and most are not relevant to the patient's safety (over 90% of pediatric intensive care unit (PICU)[1, 2] and over 70% of adult intensive care alarms).[5, 6] In psychology experiments, humans rapidly learn to ignore or respond more slowly to alarms when exposed to high false‐alarm rates, exhibiting alarm fatigue.[9, 10] In 2013, The Joint Commission named alarm fatigue the most common contributing factor to alarm‐related sentinel events in hospitals.[11, 12]
Although alarm fatigue has been implicated as a major threat to patient safety, little empirical data support its existence in hospitals. In this study, we aimed to determine if there was an association between nurses' recent exposure to nonactionable physiologic monitor alarms and their response time to future alarms for the same patients. This exploratory work was designed to inform future research in this area, acknowledging that the sample size would be too small for multivariable modeling.
METHODS
Study Definitions
The alarm classification scheme is shown in Figure 1. Note that, for clarity, we have intentionally avoided using the terms true and false alarms because their interpretations vary across studies and can be misleading.
Potentially Critical Alarm
A potentially critical alarm is any alarm for a clinical condition for which a timely response is important to determine if the alarm requires intervention to save the patient's life. This is based on the alarm type alone, including alarms for life‐threatening arrhythmias such as asystole and ventricular tachycardia, as well as alarms for vital signs outside the set limits. Supporting Table 1 in the online version of this article lists the breakdown of alarm types that we defined a priori as potentially and not potentially critical.
| PICU | Ward | |||||||
|---|---|---|---|---|---|---|---|---|
| Alarm type | No. | % of Total | % Valid | % Actionable | No. | % of Total | % Valid | % Actionable |
| ||||||||
| Oxygen saturation | 197 | 19.4 | 82.7 | 38.6 | 590 | 41.2 | 24.4 | 1.9 |
| Heart rate | 194 | 19.1 | 95.4 | 1.0 | 266 | 18.6 | 87.2 | 0.0 |
| Respiratory rate | 229 | 22.6 | 80.8 | 13.5 | 316 | 22.1 | 48.1 | 1.0 |
| Blood pressure | 259 | 25.5 | 83.8 | 5.8 | 11 | 0.8 | 72.7 | 0.0 |
| Critical arrhythmia | 1 | 0.1 | 0.0 | 0.0 | 4 | 0.3 | 0.0 | 0.0 |
| Noncritical arrhythmia | 71 | 7.0 | 2.8 | 0.0 | 244 | 17.1 | 8.6 | 0.0 |
| Central venous pressure | 49 | 4.8 | 0.0 | 0.0 | 0 | 0.0 | N/A | N/A |
| Exhaled carbon dioxide | 14 | 1.4 | 92.9 | 50.0 | 0 | 0.0 | N/A | N/A |
| Total | 1014 | 100.0 | 75.6 | 12.9 | 1,431 | 100.0 | 38.9 | 1.0 |
Valid Alarm
A valid alarm is any alarm that correctly identifies the physiologic status of the patient. Validity was based on waveform quality, lead signal strength indicators, and artifact conditions, referencing each monitor's operator's manual.
Actionable Alarm
An actionable alarm is any valid alarm for a clinical condition that either: (1) leads to a clinical intervention; (2) leads to a consultation with another clinician at the bedside (and thus visible on camera); or (3) is a situation that should have led to intervention or consultation, but the alarm was unwitnessed or misinterpreted by the staff at the bedside.
Nonactionable Alarm
An unactionable alarm is any alarm that does not meet the actionable definition above, including invalid alarms such as those caused by motion artifact, equipment/technical alarms, and alarms that are valid but nonactionable (nuisance alarms).[13]
Response Time
The response time is the time elapsed from when the alarm fired at the bedside to when the nurse entered the room or peered through a window or door, measured in seconds.
Setting and Subjects
We performed this study between August 2012 and July 2013 at a freestanding children's hospital. We evaluated nurses caring for 2 populations: (1) PICU patients with heart and/or lung failure (requiring inotropic support and/or invasive mechanical ventilation), and (2) medical patients on a general inpatient ward. Nurses caring for heart and/or lung failure patients in the PICU typically were assigned 1 to 2 total patients. Nurses on the medical ward typically were assigned 2 to 4 patients. We identified subjects from the population of nurses caring for eligible patients with parents available to provide in‐person consent in each setting. Our primary interest was to evaluate the association between nonactionable alarms and response time, and not to study the epidemiology of alarms in a random sample. Therefore, when alarm data were available prior to screening, we first approached nurses caring for patients in the top 25% of alarm rates for that unit over the preceding 4 hours. We identified preceding alarm rates using BedMasterEx (Excel Medical Electronics, Jupiter, FL).
Human Subjects Protection
This study was approved by the institutional review board of The Children's Hospital of Philadelphia. We obtained written in‐person consent from the patient's parent and the nurse subject. We obtained a Certificate of Confidentiality from the National Institutes of Health to further protect study participants.[14]
Monitoring Equipment
All patients in the PICU were monitored continuously using General Electric (GE) (Fairfield, CT) solar devices. All bed spaces on the wards include GE Dash monitors that are used if ordered. On the ward we studied, 30% to 50% of patients are typically monitored at any given time. In addition to alarming at the bedside, most clinical alarms also generated a text message sent to the nurse's wireless phone listing the room number and the word monitor. Messages did not provide any clinical information about the alarm or patient's status. There were no technicians reviewing alarms centrally.
Physicians used an order set to order monitoring, selecting 1 of 4 available preconfigured profiles: infant <6 months, infant 6 months to 1 year, child, and adult. The parameters for each age group are in Supporting Figure 1, available in the online version of this article. A physician order is required for a nurse to change the parameters. Participating in the study did not affect this workflow.
Primary Outcome
The primary outcome was the nurse's response time to potentially critical monitor alarms that occurred while neither they nor any other clinicians were in the patient's room.
Primary Exposure and Alarm Classification
The primary exposure was the number of nonactionable alarms in the same patient over the preceding 120 minutes (rolling and updated each minute). The alarm classification scheme is shown in Figure 1.
Due to technical limitations with obtaining time‐stamped alarm data from the different ventilators in use during the study period, we were unable to identify the causes of all ventilator alarms. Therefore, we included ventilator alarms that did not lead to clinical interventions as nonactionable alarm exposures, but we did not evaluate the response time to any ventilator alarms.
Data Collection
We combined video recordings with monitor time‐stamp data to evaluate the association between nonactionable alarms and the nurse's response time. Our detailed video recording and annotation methods have been published separately.[15] Briefly, we mounted up to 6 small video cameras in patients' rooms and recorded up to 6 hours per session. The cameras captured the monitor display, a wide view of the room, a close‐up view of the patient, and all windows and doors through which staff could visually assess the patient without entering the room.
Video Processing, Review, and Annotation
The first 5 video sessions were reviewed in a group training setting. Research assistants received instruction on how to determine alarm validity and actionability in accordance with the study definitions. Following the training period, the review workflow was as follows. First, a research assistant entered basic information and a preliminary assessment of the alarm's clinical validity and actionability into a REDCap (Research Electronic Data Capture; Vanderbilt University, Nashville, TN) database.[16] Later, a physician investigator secondarily reviewed all alarms and confirmed the assessments of the research assistants or, when disagreements occurred, discussed and reconciled the database. Alarms that remained unresolved after secondary review were flagged for review with an additional physician or nurse investigator in a team meeting.
Data Analysis
We summarized the patient and nurse subjects, the distributions of alarms, and the response times to potentially critical monitor alarms that occurred while neither the nurse nor any other clinicians were in the patient's room. We explored the data using plots of alarms and response times occurring within individual video sessions as well as with simple linear regression. Hypothesizing that any alarm fatigue effect would be strongest in the highest alarm patients, and having observed that alarms are distributed very unevenly across patients in both the PICU and ward, we made the decision not to use quartiles, but rather to form clinically meaningful categories. We also hypothesized that nurses might not exhibit alarm fatigue unless they were inundated with alarms. We thus divided the nonactionable alarm counts over the preceding 120 minutes into 3 categories: 0 to 29 alarms to represent a low to average alarm rate exhibited by the bottom 50% of the patients, 30 to 79 alarms to represent an elevated alarm rate, and 80+ alarms to represent an extremely high alarm rate exhibited by the top 5%. Because the exposure time was 120 minutes, we conducted the analysis on the alarms occurring after a nurse had been video recorded for at least 120 minutes.
We further evaluated the relationship between nonactionable alarms and nurse response time with Kaplan‐Meier plots by nonactionable alarm count category using the observed response‐time data. The Kaplan‐Meier plots compared response time across the nonactionable alarm exposure group, without any statistical modeling. A log‐rank test stratified by nurse evaluated whether the distributions of response time in the Kaplan‐Meier plots differed across the 3 alarm exposure groups, accounting for within‐nurse clustering.
Accelerated failure‐time regression based on the Weibull distribution then allowed us to compare response time across each alarm exposure group and provided confidence intervals. Accelerated failure‐time models are comparable to Cox models, but emphasize time to event rather than hazards.[17, 18] We determined that the Weibull distribution was suitable by evaluating smoothed hazard and log‐hazard plots, the confidence intervals of the shape parameters in the Weibull models that did not include 1, and by demonstrating that the Weibull model had better fit than an alternative (exponential) model using the likelihood‐ratio test (P<0.0001 for PICU, P=0.02 for ward). Due to the small sample size of nurses and patients, we could not adjust for nurse‐ or patient‐level covariates in the model. When comparing the nonactionable alarm exposure groups in the regression model (029 vs 3079, 3079 vs 80+, and 029 vs 80+), we Bonferroni corrected the critical P value for the 3 comparisons, for a critical P value of 0.05/3=0.0167.
Nurse Questionnaire
At the session's conclusion, nurses completed a questionnaire that included demographics and asked, Did you respond more quickly to monitor alarms during this study because you knew you were being filmed? to measure if nurses would report experiencing a Hawthorne‐like effect.[19, 20, 21]
RESULTS
We performed 40 sessions among 40 patients and 36 nurses over 210 hours. We performed 20 sessions in children with heart and/or lung failure in the PICU and 20 sessions in children on a general ward. Sessions took place on weekdays between 9:00 am and 6:00 pm. There were 3 occasions when we filmed 2 patients cared for by the same nurse at the same time.
Nurses were mostly female (94.4%) and had between 2 months and 28 years of experience (median, 4.8 years). Patients on the ward ranged from 5 days to 5.4 years old (median, 6 months). Patients in the PICU ranged from 5 months to 16 years old (median, 2.5 years). Among the PICU patients, 14 (70%) were receiving mechanical ventilation only, 3 (15%) were receiving vasopressors only, and 3 (15%) were receiving mechanical ventilation and vasopressors.
We observed 5070 alarms during the 40 sessions. We excluded 108 (2.1%) that occurred at the end of video recording sessions with the nurse absent from the room because the nurse's response could not be determined. Alarms per session ranged from 10 to 1430 (median, 75; interquartile range [IQR], 35138). We excluded the outlier PICU patient with 1430 alarms in 5 hours from the analysis to avoid the potential for biasing the results. Figure 2 depicts the data flow.
Following the 5 training sessions, research assistants independently reviewed and made preliminary assessments on 4674 alarms; these alarms were all secondarily reviewed by a physician. Using the physician reviewer as the gold standard, the research assistant's sensitivity (assess alarm as actionable when physician also assesses as actionable) was 96.8% and specificity (assess alarm as nonactionable when physician also assesses as nonactionable) was 96.9%. We had to review 54 of 4674 alarms (1.2%) with an additional physician or nurse investigator to achieve consensus.
Characteristics of the 2445 alarms for clinical conditions are shown in Table 1. Only 12.9% of alarms in heart‐ and/or lung‐failure patients in the PICU were actionable, and only 1.0% of alarms in medical patients on a general inpatient ward were actionable.
Overall Response Times for Out‐of‐Room Alarms
We first evaluated response times without excluding alarms occurring prior to the 120‐minute mark. Of the 2445 clinical condition alarms, we excluded the 315 noncritical arrhythmia types from analysis of response time because they did not meet our definition of potentially critical alarms. Of the 2130 potentially critical alarms, 1185 (55.6%) occurred while neither the nurse nor any other clinician was in the patient's room. We proceeded to analyze the response time to these 1185 alarms (307 in the PICU and 878 on the ward). In the PICU, median response time was 3.3 minutes (IQR, 0.814.4). On the ward, median response time was 9.8 minutes (IQR, 3.222.4).
Response‐Time Association With Nonactionable Alarm Exposure
Next, we analyzed the association between response time to potentially critical alarms that occurred when the nurse was not in the patient's room and the number of nonactionable alarms occurring over the preceding 120‐minute window. This required excluding the alarms that occurred in the first 120 minutes of each session, leaving 647 alarms with eligible response times to evaluate the exposure between prior nonactionable alarm exposure and response time: 219 in the PICU and 428 on the ward. Kaplan‐Meier plots and tabulated response times demonstrated the incremental relationships between each nonactionable alarm exposure category in the observed data, with the effects most prominent as the Kaplan‐Meier plots diverged beyond the median (Figure 3 and Table 2). Excluding the extreme outlier patient had no effect on the results, because 1378 of the 1430 alarms occurred with the nurse present at the bedside, and only 2 of the remaining alarms were potentially critical.
| Observed Data | Accelerated Failure‐Time Model | |||||||
|---|---|---|---|---|---|---|---|---|
| Number of Potentially Critical Alarms | Minutes Elapsed Until This Percentage of Alarms Was Responded to | Modeled Response Time, min | 95% CI, min | P Value* | ||||
| 50% (Median) | 75% | 90% | 95% | |||||
| ||||||||
| PICU | ||||||||
| 029 nonactionable alarms | 70 | 1.6 | 8.0 | 18.6 | 25.1 | 2.8 | 1.9‐3.8 | Reference |
| 3079 nonactionable alarms | 122 | 6.3 | 17.8 | 22.5 | 26.0 | 5.3 | 4.06.7 | 0.001 (vs 029) |
| 80+ nonactionable alarms | 27 | 16.0 | 28.4 | 32.0 | 33.1 | 8.5 | 4.312.7 | 0.009 (vs 029), 0.15 (vs 3079) |
| Ward | ||||||||
| 029 nonactionable alarms | 159 | 9.8 | 17.8 | 25.0 | 28.9 | 7.7 | 6.39.1 | Reference |
| 3079 nonactionable alarms | 211 | 11.6 | 22.4 | 44.6 | 63.2 | 11.5 | 9.613.3 | 0.001 (vs 029) |
| 80+ nonactionable alarms | 58 | 8.3 | 57.6 | 63.8 | 69.5 | 15.6 | 11.020.1 | 0.001 (vs 029), 0.09 (vs 3079) |
Accelerated failure‐time regressions revealed significant incremental increases in the modeled response time as the number of preceding nonactionable alarms increased in both the PICU and ward settings (Table 2).
Hawthorne‐like Effects
Four of the 36 nurses reported that they responded more quickly to monitor alarms because they knew they were being filmed.
DISCUSSION
Alarm fatigue has recently generated interest among nurses,[22] physicians,[23] regulatory bodies,[24] patient safety organizations,[25] and even attorneys,[26] despite a lack of prior evidence linking nonactionable alarm exposure to response time or other adverse patient‐relevant outcomes. This study's main findings were that (1) the vast majority of alarms were nonactionable, (2) response time to alarms occurring while the nurse was out of the room increased as the number of nonactionable alarms over the preceding 120 minutes increased. These findings may be explained by alarm fatigue.
Our results build upon the findings of other related studies. The nonactionable alarm proportions we found were similar to other pediatric studies, reporting greater than 90% nonactionable alarms.[1, 2] One other study has reported a relationship between alarm exposure and response time. In that study, Voepel‐Lewis and colleagues evaluated nurse responses to pulse oximetry desaturation alarms in adult orthopedic surgery patients using time‐stamp data from their monitor notification system.[27] They found that alarm response time was significantly longer for patients in the highest quartile of alarms compared to those in lower quartiles. Our study provides new data suggesting a relationship between nonactionable alarm exposure and nurse response time.
Our study has several limitations. First, as a preliminary study to investigate feasibility and possible association, the sample of patients and nurses was necessarily limited and did not permit adjustment for nurse‐ or patient‐level covariates. A multivariable analysis with a larger sample might provide insight into alternate explanations for these findings other than alarm fatigue, including measures of nurse workload and patient factors (such as age and illness severity). Additional factors that are not as easily measured can also contribute to the complex decision of when and how to respond to alarms.[28, 29] Second, nurses were aware that they were being video recorded as part of a study of nonactionable alarms, although they did not know the specific details of measurement. Although this lack of blinding might lead to a Hawthorne‐like effect, our positive results suggest that this effect, if present, did not fully obscure the association. Third, all sessions took place on weekdays during daytime hours, but effects of nonactionable alarms might vary by time and day. Finally, we suspect that when nurses experience critical alarms that require them to intervene and rescue a patient, their response times to that patient's alarms that occur later in their shift will be quicker due to a heightened concern for the alarm being actionable. We were unable to explore that relationship in this analysis because the number of critical alarms requiring intervention was very small. This is a topic of future study.
CONCLUSIONS
We identified an association between a nurse's prior exposure to nonactionable alarms and response time to future alarms. This finding is consistent with alarm fatigue, but requires further study to more clearly delineate other factors that might confound or modify that relationship.
Disclosures
This project was funded by the Health Research Formula Fund Grant 4100050891 from the Pennsylvania Department of Public Health Commonwealth Universal Research Enhancement Program (awarded to Drs. Keren and Bonafide). Dr. Bonafide is also supported by the National Heart, Lung, and Blood Institute of the National Institutes of Health under award number K23HL116427. The content is solely the responsibility of the authors and does not necessarily represent the official views of the National Institutes of Health. The authors have no financial relationships or conflicts of interest relevant to this article to disclose.
- . Crying wolf: false alarms in a pediatric intensive care unit. Crit Care Med. 1994;22(6):981–985.
- , . Poor prognosis for existing monitors in the intensive care unit. Crit Care Med. 1997;25(4):614–619.
- , , , , . Clinical evaluation of alarm efficiency in intensive care [in French]. Ann Fr Anesth Reanim. 2000;19:459–466.
- , , , . Reducing false alarms of intensive care online‐monitoring systems: an evaluation of two signal extraction algorithms. Comput Math Methods Med. 2011;2011:143480.
- , , , , , . Multicentric study of monitoring alarms in the adult intensive care unit (ICU): a descriptive analysis. Intensive Care Med. 1999;25:1360–1366.
- , , . Improving alarm performance in the medical intensive care unit using delays and clinical context. Anesth Analg. 2009;108:1546–1552.
- , . Monitor alarm fatigue: standardizing use of physiological monitors and decreasing nuisance alarms. Am J Crit Care. 2010;19:28–34.
- , , , , , . Intensive care unit alarms—how many do we need? Crit Care Med. 2010;38:451–456.
- , , , . System operator response to warnings of danger: a laboratory investigation of the effects of the predictive value of a warning on human response time. J Exp Psychol Appl. 1995;1:19–33.
- , , . Human probability matching behaviour in response to alarms of varying reliability. Ergonomics. 1995;38:2300–2312.
- The Joint Commission. Sentinel event alert: medical device alarm safety in hospitals. 2013. Available at: http://www.jointcommission.org/sea_issue_50/. Accessed October 9, 2014.
- . Joint commission warns of alarm fatigue: multitude of alarms from monitoring devices problematic. JAMA. 2013;309(22):2315–2316.
- . Monitor alarm fatigue: an integrative review. Biomed Instrum Technol. 2012;46(4):268–277.
- NIH Certificates of Confidentiality Kiosk. Available at: http://grants.nih.gov/grants/policy/coc/. Accessed April 21, 2014.
- , , , et al. Video methods for evaluating physiologic monitor alarms and alarm responses. Biomed Instrum Technol. 2014;48(3):220–230.
- , , , , , . Research electronic data capture (REDCap)—a metadata‐driven methodology and workflow process for providing translational research informatics support. J Biomed Inf. 2009;42:377–381.
- . Accelerated failure time and other parametric models. In: Modelling Survival Data in Medical Research. 2nd ed. Boca Raton, FL: Chapman 2003:197–229.
- , , , . Parametric models. In: An Introduction to Survival Analysis Using Stata, 3rd ed. College Station, TX: Stata Press; 2010:229–244.
- , . Management and the Worker. Cambridge, MA: Harvard University Press; 1939.
- . What happened at Hawthorne? Science. 1974;183(4128):922–932.
- , , , , . Validation of the Work Observation Method By Activity Timing (WOMBAT) method of conducting time‐motion observations in critical care settings: an observational study. BMC Med Inf Decis Mak. 2011;11:32.
- , . Alarm fatigue: a patient safety concern. AACN Adv Crit Care. 2013;24(4):378–386.
- , . Redesigning hospital alarms for patient safety: alarmed and potentially dangerous. JAMA. 2014;311(12):1199–1200.
- The Joint Commission. The Joint Commission announces 2014 National Patient Safety Goal. Jt Comm Perspect. 2013;33:1–4.
- Top 10 health technology hazards for 2014. Health Devices. 2013;42(11):354–380.
- My Philly Lawyer. Medical malpractice: alarm fatigue threatens patient safety. 2014. Available at: http://www.myphillylawyer.com/Resources/Legal-Articles/Medical-Malpractice-Alarm-Fatigue-Threatens-Patient-Safety.shtml. Accessed April 4, 2014.
- , , , et al. Pulse oximetry desaturation alarms on a general postoperative adult unit: a prospective observational study of nurse response time. Int J Nurs Stud. 2013;50(10):1351–1358.
- , , , , . A description of nurses' decision‐making in managing electrocardiographic monitor alarms [published online ahead of print May 10, 2014]. J Clin Nurs. doi:10.1111/jocn.12625.
- . Nurses' response to frequency and types of electrocardiography alarms in a non‐critical care setting: a descriptive study. Int J Nurs Stud. 2014;51(2):190–197.
© 2015 Society of Hospital Medicine
