User login
Medications and Pediatric Deterioration
In recent years, many hospitals have implemented rapid response systems (RRSs) in efforts to reduce mortality outside the intensive care unit (ICU). Rapid response systems include 2 clinical components (efferent and afferent limbs) and 2 organizational components (process improvement and administrative limbs).[1, 2] The efferent limb includes medical emergency teams (METs) that can be summoned to hospital wards to rescue deteriorating patients. The afferent limb identifies patients at risk of deterioration using tools such as early warning scores and triggers a MET response when appropriate.[2] The process‐improvement limb evaluates and optimizes the RRS. The administrative limb implements the RRS and supports its ongoing operation. The effectiveness of most RRSs depends upon the ward team making the decision to escalate care by activating the MET. Barriers to activating the MET may include reduced situational awareness,[3, 4] hierarchical barriers to calling for help,[3, 4, 5, 6, 7, 8] fear of criticism,[3, 8, 9] and other hospital safety cultural barriers.[3, 4, 8]
Proactive critical‐care outreach[10, 11, 12, 13] or rover[14] teams seek to reduce barriers to activation and improve outcomes by systematically identifying and evaluating at‐risk patients without relying on requests for assistance from the ward team. Structured similarly to early warning scores, surveillance tools intended for rover teams might improve their ability to rapidly identify at‐risk patients throughout a hospital. They could combine vital signs with other variables, such as diagnostic and therapeutic interventions that reflect the ward team's early, evolving concern. In particular, the incorporation of medications associated with deterioration may enhance the performance of surveillance tools.
Medications may be associated with deterioration in one of several ways. They could play a causal role in deterioration (ie, opioids causing respiratory insufficiency), represent clinical worsening and anticipation of possible deterioration (ie, broad‐spectrum antibiotics for a positive blood culture), or represent rescue therapies for early deterioration (ie, antihistamines for allergic reactions). In each case, the associated therapeutic classes could be considered sentinel markers of clinical deterioration.
Combined with vital signs and other risk factors, therapeutic classes could serve as useful components of surveillance tools to detect signs of early, evolving deterioration and flag at‐risk patients for evaluation. As a first step, we sought to identify therapeutic classes associated with clinical deterioration. This effort to improve existing afferent tools falls within the process‐improvement limb of RRSs.
PATIENTS AND METHODS
Study Design
We performed a case‐crossover study of children who experienced clinical deterioration. An alternative to the matched case‐control design, the case‐crossover design involves longitudinal within‐subject comparisons exclusively of case subjects such that an individual serves as his or her own control. It is most effective when studying intermittent exposures that result in transient changes in the risk of an acute event,[15, 16, 17] making it appropriate for our study.
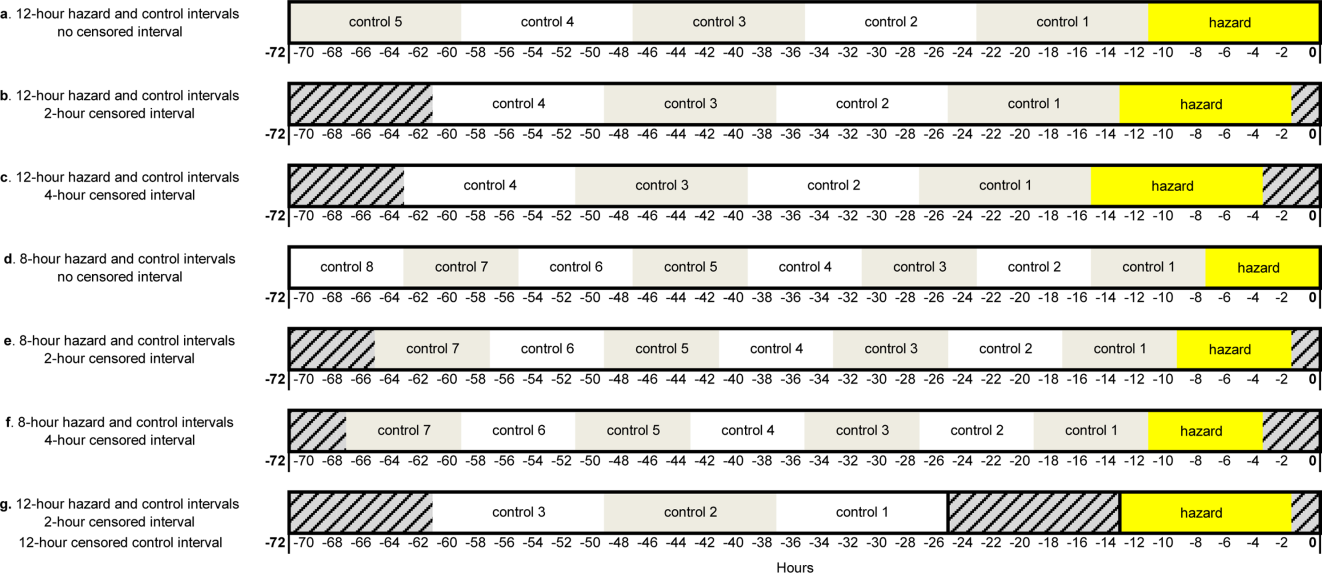
Using the case‐crossover design, we compared a discrete time period in close proximity to the deterioration event, called the hazard interval, with earlier time periods in the hospitalization, called the control intervals.[15, 16, 17] In our primary analysis (Figure 1B), we defined the durations of these intervals as follows: We first censored the 2 hours immediately preceding the clinical deterioration event (hours 0 to 2). We made this decision a priori to exclude medications used after deterioration was recognized and resuscitation had already begun. The 12‐hour period immediately preceding the censored interval was the hazard interval (hours 2 to 14). Each 12‐hour period immediately preceding the hazard interval was a control interval (hours 14 to 26, 26 to 38, 38 to 50, and 50 to 62). Depending on the child's length of stay prior to the deterioration event, each hazard interval had 14 control intervals for comparison. In sensitivity analysis, we altered the durations of these intervals (see below).
Study Setting and Participants
We performed this study among children age <18 years who experienced clinical deterioration between January 1, 2005, and December 31, 2008, after being hospitalized on a general medical or surgical unit at The Children's Hospital of Philadelphia for 24 hours. Clinical deterioration was a composite outcome defined as cardiopulmonary arrest (CPA), acute respiratory compromise (ARC), or urgent ICU transfer. Cardiopulmonary arrest events required either pulselessness or a pulse with inadequate perfusion treated with chest compressions and/or defibrillation. Acute respiratory compromise events required respiratory insufficiency treated with bag‐valve‐mask or invasive airway interventions. Urgent ICU transfers included 1 of the following outcomes in the 12 hours after transfer: death, CPA, intubation, initiation of noninvasive ventilation, or administration of a vasoactive medication infusion used for the treatment of shock. Time zero was the time of the CPA/ARC, or the time at which the child arrived in the ICU for urgent transfers. These subjects also served as the cases for a previously published case‐control study evaluating different risk factors for deterioration.[18] The institutional review board of The Children's Hospital of Philadelphia approved the study.
At the time of the study, the hospital did not have a formal RRS. An immediate‐response code‐blue team was available throughout the study period for emergencies occurring outside the ICU. Physicians could also page the pediatric ICU fellow to discuss patients who did not require immediate assistance from the code‐blue team but were clinically deteriorating. There were no established triggering criteria.
Medication Exposures
Intravenous (IV) medications administered in the 72 hours prior to clinical deterioration were considered the exposures of interest. Each medication was included in 1 therapeutic classes assigned in the hospital's formulary (Lexicomp, Hudson, OH).[19] In order to determine which therapeutic classes to evaluate, we performed a power calculation using the sampsi_mcc package for Stata 12 (StataCorp, College Station, TX). We estimated that we would have 3 matched control intervals per hazard interval. We found that, in order to detect a minimum odds ratio of 3.0 with 80% power, a therapeutic class had to be administered in 5% of control periods. All therapeutic classes meeting that requirement were included in the analysis and are listed in Table 1. (See lists of the individual medications comprising each class in the Supporting Information, Tables 124, in the online version of this article.)
| Therapeutic Class | No. of Control Intervals | % |
|---|---|---|
| ||
| Sedatives | 107 | 25 |
| Antiemetics | 92 | 22 |
| Third‐ and fourth‐generation cephalosporins | 83 | 20 |
| Antihistamines | 74 | 17 |
| Antidotes to hypersensitivity reactions (diphenhydramine) | 65 | 15 |
| Gastric acid secretion inhibitors | 62 | 15 |
| Loop diuretics | 62 | 15 |
| Anti‐inflammatory agents | 61 | 14 |
| Penicillin antibiotics | 61 | 14 |
| Benzodiazepines | 59 | 14 |
| Hypnotics | 58 | 14 |
| Narcotic analgesics (full opioid agonists) | 54 | 13 |
| Antianxiety agents | 53 | 13 |
| Systemic corticosteroids | 53 | 13 |
| Glycopeptide antibiotics (vancomycin) | 46 | 11 |
| Anaerobic antibiotics | 45 | 11 |
| Histamine H2 antagonists | 41 | 10 |
| Antifungal agents | 37 | 9 |
| Phenothiazine derivatives | 37 | 9 |
| Adrenal corticosteroids | 35 | 8 |
| Antiviral agents | 30 | 7 |
| Aminoglycoside antibiotics | 26 | 6 |
| Narcotic analgesics (partial opioid agonists) | 26 | 6 |
| PPIs | 26 | 6 |
Data Collection
Data were abstracted from the electronic medication administration record (Sunrise Clinical Manager; Allscripts, Chicago, IL) into a database. For each subject, we recorded the name and time of administration of each IV medication given in the 72 hours preceding deterioration, as well as demographic, event, and hospitalization characteristics.
Statistical Analysis
We used univariable conditional logistic regression to evaluate the association between each therapeutic class and the composite outcome of clinical deterioration in the primary analysis. Because cases serve as their own controls in the case‐crossover design, this method inherently adjusts for all subject‐specific time‐invariant confounding variables, such as patient demographics, disease, and hospital‐ward characteristics.[15]
Sensitivity Analysis
Our primary analysis used a 2‐hour censored interval and 12‐hour hazard and control intervals. Excluding the censored interval from analysis was a conservative approach that we chose because our goal was to identify therapeutic classes associated with deterioration during a phase in which adverse outcomes may be prevented with early intervention. In order to test whether our findings were stable across different lengths of censored, hazard, and control intervals, we performed a sensitivity analysis, also using conditional logistic regression, on all therapeutic classes that were significant (P<0.05) in primary analysis. In 6 iterations of the sensitivity analysis, we varied the length of the hazard and control intervals between 8 and 12 hours, and the length of the censored interval between 0 and 4 hours (Figure 1AF). In a seventh iteration, we used a variant of the primary analysis in which we censored the first control interval (Figure 1G).
RESULTS
We identified 12 CPAs, 41 ARCs, and 699 ICU transfers during the study period. Of these 752 events, 141 (19%) were eligible as cases according to our inclusion criteria.[18] (A flowchart demonstrating the identification of eligible cases is provided in Supporting Table 25 in the online version of this article.) Of the 81% excluded, 37% were ICU transfers who did not meet urgent criteria. Another 31% were excluded because they were hospitalized for <24 hours at the time of the event, making their analysis in a case‐crossover design using 12‐hour periods impossible. Event characteristics, demographics, and hospitalization characteristics are shown in Table 2.
| n | % | |
|---|---|---|
| ||
| Type of event | ||
| CPA | 4 | 3 |
| ARC | 29 | 20 |
| Urgent ICU transfer | 108 | 77 |
| Demographics | ||
| Age | ||
| 0<6 months | 17 | 12 |
| 6<12 months | 22 | 16 |
| 1<4 years | 34 | 24 |
| 4<10 years | 26 | 18 |
| 10<18 years | 42 | 30 |
| Sex | ||
| F | 60 | 43 |
| M | 81 | 57 |
| Race | ||
| White | 69 | 49 |
| Black/African American | 49 | 35 |
| Asian/Pacific Islander | 0 | 0 |
| Other | 23 | 16 |
| Ethnicity | ||
| Non‐Hispanic | 127 | 90 |
| Hispanic | 14 | 10 |
| Hospitalization | ||
| Surgical service | 4 | 3 |
| Survived to hospital discharge | 107 | 76 |
Primary Analysis
A total of 141 hazard intervals and 487 control intervals were included in the primary analysis, the results of which are shown in Table 3. Among the antimicrobial therapeutic classes, glycopeptide antibiotics (vancomycin), anaerobic antibiotics, third‐generation and fourth‐generation cephalosporins, and aminoglycoside antibiotics were significant. All of the anti‐inflammatory therapeutic classes, including systemic corticosteroids, anti‐inflammatory agents, and adrenal corticosteroids, were significant. All of the sedatives, hypnotics, and antianxiety therapeutic classes, including sedatives, benzodiazepines, hypnotics, and antianxiety agents, were significant. Among the narcotic analgesic therapeutic classes, only 1 class, narcotic analgesics (full opioid agonists), was significant. None of the gastrointestinal therapeutic classes were significant. Among the classes classified as other, loop diuretics and antidotes to hypersensitivity reactions (diphenhydramine) were significant.
| OR | LCI | UCI | P Value | |
|---|---|---|---|---|
| ||||
| Antimicrobial therapeutic classes | ||||
| Glycopeptide antibiotics (vancomycin) | 5.84 | 2.01 | 16.98 | 0.001 |
| Anaerobic antibiotics | 5.33 | 1.36 | 20.94 | 0.02 |
| Third‐ and fourth‐generation cephalosporins | 2.78 | 1.15 | 6.69 | 0.02 |
| Aminoglycoside antibiotics | 2.90 | 1.11 | 7.56 | 0.03 |
| Penicillin antibiotics | 2.40 | 0.9 | 6.4 | 0.08 |
| Antiviral agents | 1.52 | 0.20 | 11.46 | 0.68 |
| Antifungal agents | 1.06 | 0.44 | 2.58 | 0.89 |
| Corticosteroids and other anti‐inflammatory therapeutic classes* | ||||
| Systemic corticosteroids | 3.69 | 1.09 | 12.55 | 0.04 |
| Anti‐inflammatory agents | 3.69 | 1.09 | 12.55 | 0.04 |
| Adrenal corticosteroids | 3.69 | 1.09 | 12.55 | 0.04 |
| Sedatives, hypnotics, and antianxiety therapeutic classes | ||||
| Sedatives | 3.48 | 1.78 | 6.78 | <0.001 |
| Benzodiazepines | 2.71 | 1.36 | 5.40 | 0.01 |
| Hypnotics | 2.54 | 1.27 | 5.09 | 0.01 |
| Antianxiety agents | 2.28 | 1.06 | 4.91 | 0.04 |
| Narcotic analgesic therapeutic classes | ||||
| Narcotic analgesics (full opioid agonists) | 2.48 | 1.07 | 5.73 | 0.03 |
| Narcotic analgesics (partial opioid agonists) | 1.97 | 0.57 | 6.85 | 0.29 |
| GI therapeutic classes | ||||
| Antiemetics | 0.57 | 0.22 | 1.48 | 0.25 |
| PPIs | 2.05 | 0.58 | 7.25 | 0.26 |
| Phenothiazine derivatives | 0.47 | 0.12 | 1.83 | 0.27 |
| Gastric acid secretion inhibitors | 1.71 | 0.61 | 4.81 | 0.31 |
| Histamine H2 antagonists | 0.95 | 0.17 | 5.19 | 0.95 |
| Other therapeutic classes | ||||
| Loop diuretics | 2.87 | 1.28 | 6.47 | 0.01 |
| Antidotes to hypersensitivity reactions (diphenhydramine) | 2.45 | 1.15 | 5.23 | 0.02 |
| Antihistamines | 2.00 | 0.97 | 4.12 | 0.06 |
Sensitivity Analysis
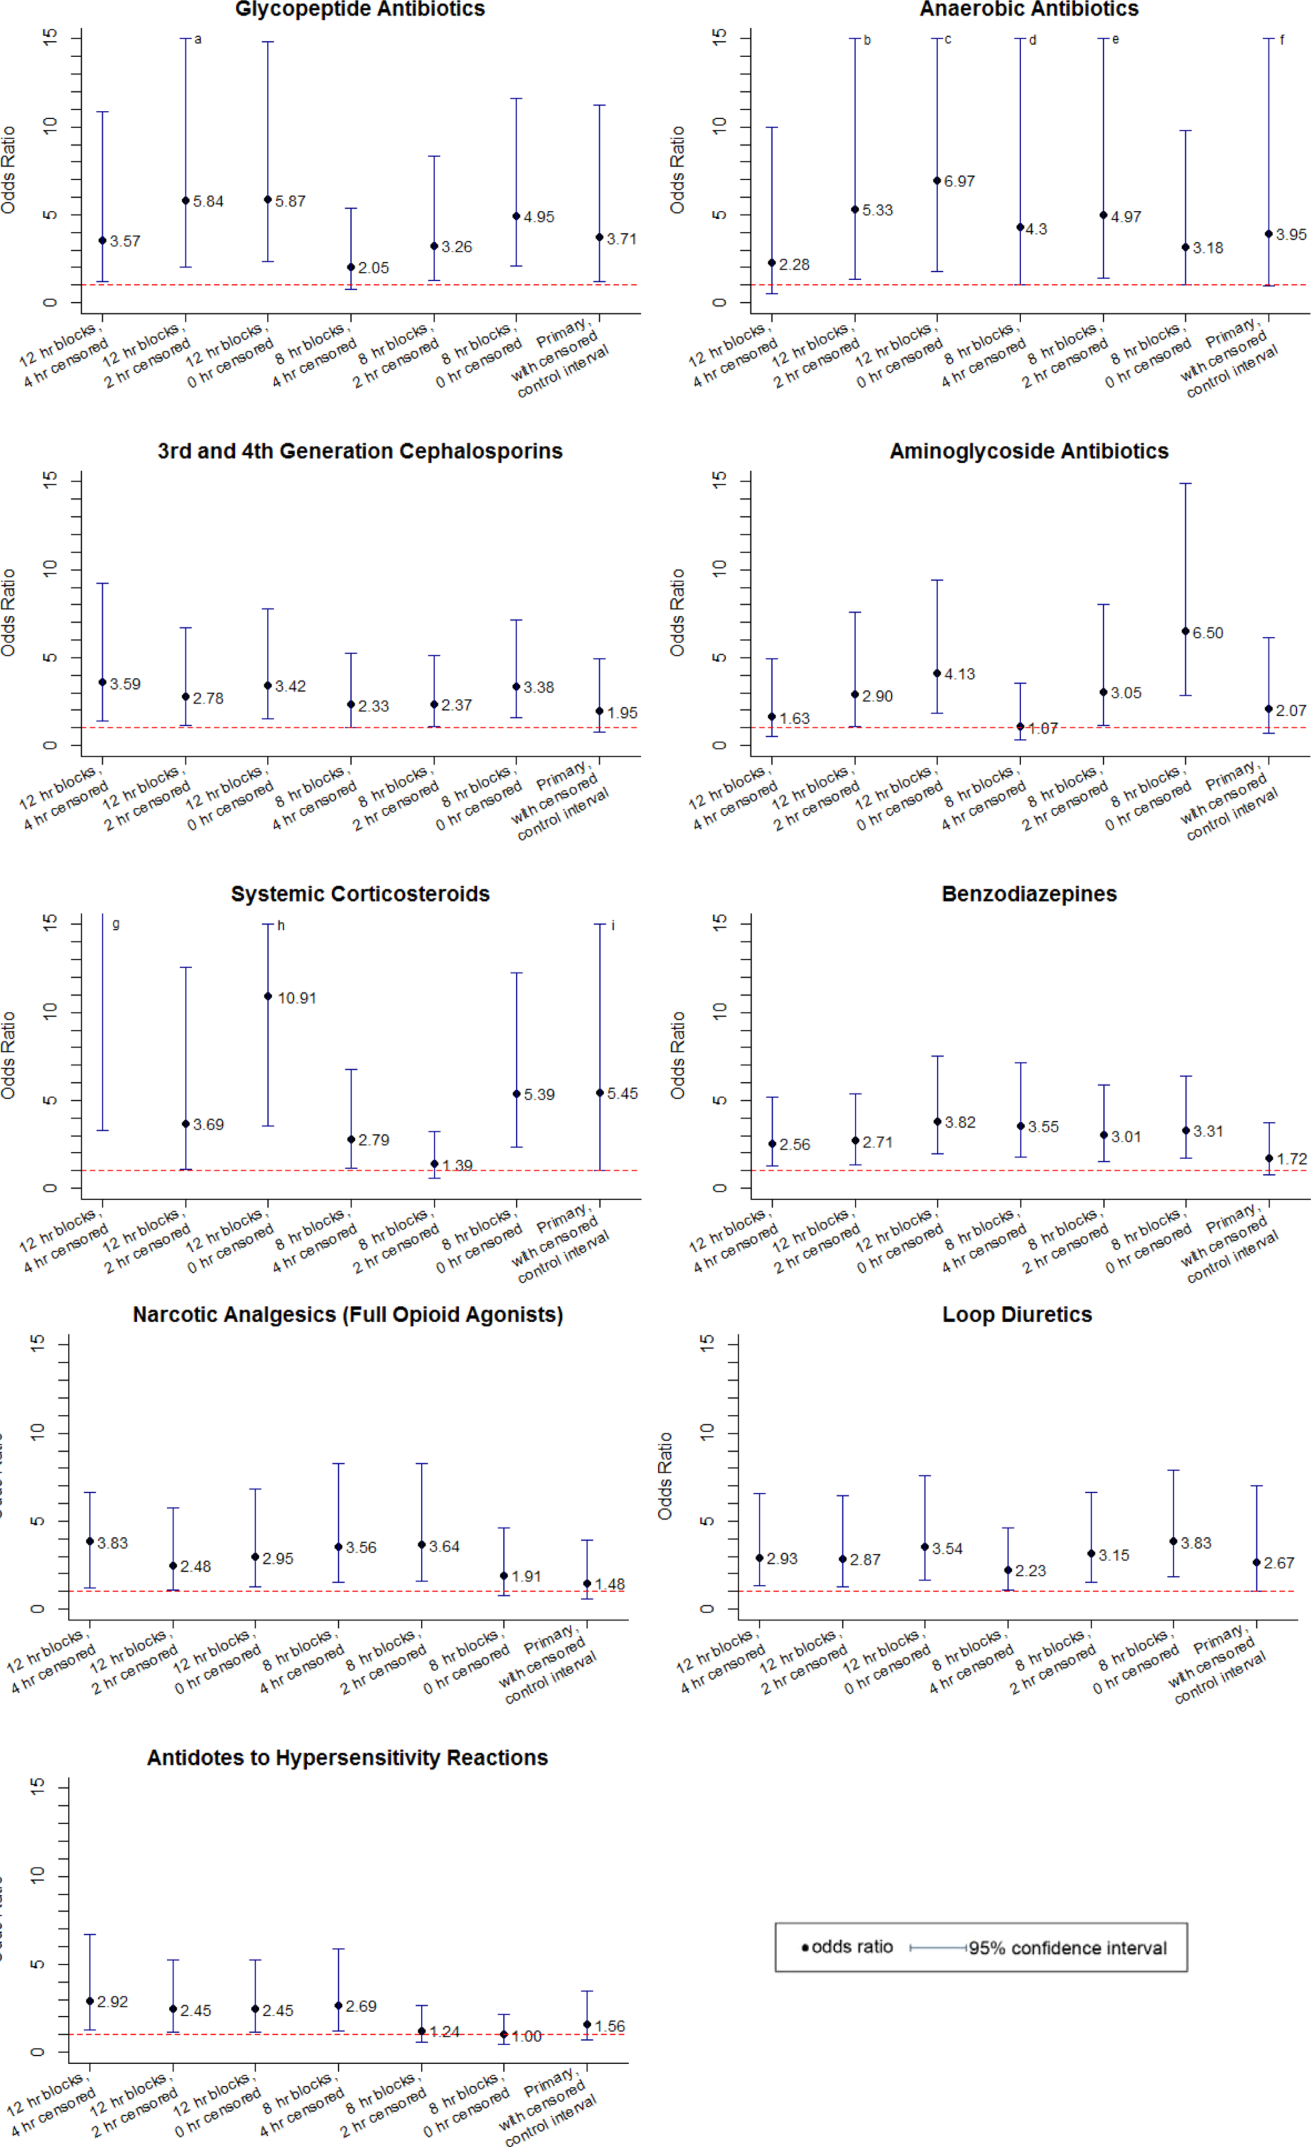
Of the 14 classes that were significant in primary analysis, we carried 9 forward to sensitivity analysis. The 5 that were not carried forward overlapped substantially with other classes that were carried forward. The decision of which overlapping class to carry forward was based upon (1) parsimony and (2) clinical relevance. This is described briefly in the footnotes to Table 3 (see Supporting information in the online version of this article for a full description of this process). Figure 2 presents the odds ratios and their 95% confidence intervals for the sensitivity analysis of each therapeutic class that was significant in primary analysis. Loop diuretics remained significantly associated with deterioration in all 7 iterations. Glycopeptide antibiotics (vancomycin), third‐generation and fourth‐generation cephalosporins, systemic corticosteroids, and benzodiazepines were significant in 6. Anaerobic antibiotics and narcotic analgesics (full opioid agonists) were significant in 5, and aminoglycoside antibiotics and antidotes to hypersensitivity reactions (diphenhydramine) in 4.
DISCUSSION
We identified 9 therapeutic classes which were associated with a 2.5‐fold to 5.8‐fold increased risk of clinical deterioration. The results were robust to sensitivity analysis. Given their temporal association to the deterioration events, these therapeutic classes may serve as sentinels of early deterioration and are candidate variables to combine with vital signs and other risk factors in a surveillance tool for rover teams or an early warning score.
Although most early warning scores intended for use at the bedside are based upon vital signs and clinical observations, a few also include medications. Monaghan's Pediatric Early Warning Score, the basis for many modified scores used in children's hospitals throughout the world, assigns points for children requiring frequent doses of nebulized medication.[20, 21, 22] Nebulized epinephrine is a component of the Bristol Paediatric Early Warning Tool.[23] The number of medications administered in the preceding 24 hours was included in an early version of the Bedside Paediatric Early Warning System Score.[24] Adding IV antibiotics to the Maximum Modified Early Warning Score improved prediction of the need for higher care utilization among hospitalized adults.[25]
In order to determine the role of the IV medications we found to be associated with clinical deterioration, the necessary next step is to develop a multivariable predictive model to determine if they improve the performance of existing early warning scores in identifying deteriorating patients. Although simplicity is an important characteristic of hand‐calculated early warning scores, integration of a more complex scoring system with more variables, such as these medications, into the electronic health record would allow for automated scoring, eliminating the need to sacrifice score performance to keep the tool simple. Integration into the electronic health record would have the additional benefit of making the score available to clinicians who are not at the bedside. Such tools would be especially useful for remote surveillance for deterioration by critical‐care outreach or rover teams.
Our study has several limitations. First, the sample size was small, and although we sought to minimize the likelihood of chance associations by performing sensitivity analysis, these findings should be confirmed in a larger study. Second, we only evaluated IV medications. Medications administered by other routes could also be associated with clinical deterioration and should be analyzed in future studies. Third, we excluded children hospitalized for <24 hours, as well as transfers that did not meet urgent criteria. These may be limitations because (1) the first 24 hours of hospitalization may be a high‐risk period, and (2) patients who were on trajectories toward severe deterioration and received interventions that prevented further deterioration but did not meet urgent transfer criteria were excluded. It may be that the children we included as cases were at increased risk of deterioration that is either more difficult to recognize early, or more difficult to treat effectively without ICU interventions. Finally, we acknowledge that in some cases the therapeutic classes were associated with deterioration in a causal fashion, and in others the medications administered did not cause deterioration but were signs of therapeutic interventions that were initiated in response to clinical worsening. Identifying the specific indications for administration of drugs used in response to clinical worsening may have resulted in stronger associations with deterioration. However, these indications are often complex, multifactorial, and poorly documented in real time. This limits the ability to automate their detection using the electronic health record, the ultimate goal of this line of research.
CONCLUSION
We used a case‐crossover approach to identify therapeutic classes that are associated with increased risk of clinical deterioration in hospitalized children on pediatric wards. These sentinel therapeutic classes may serve as useful components of electronic health recordbased surveillance tools to detect signs of early, evolving deterioration and flag at‐risk patients for critical‐care outreach or rover team review. Future research should focus on evaluating whether including these therapeutic classes in early warning scores improves their accuracy in detecting signs of deterioration and determining if providing this information as clinical decision support improves patient outcomes.
Acknowledgments
Disclosures: This study was funded by The Children's Hospital of Philadelphia Center for Pediatric Clinical Effectiveness Pilot Grant and the University of Pennsylvania Provost's Undergraduate Research Mentoring Program. Drs. Bonafide and Keren also receive funding from the Pennsylvania Health Research Formula Fund Award from the Pennsylvania Department of Health for research in pediatric hospital quality, safety, and costs. The authors have no other conflicts of interest to report.
- , , , et al. Findings of the first consensus conference on medical emergency teams. Crit Care Med. 2006;34(9):2463–2478.
- , , , et al. “Identifying the hospitalised patient in crisis”—a consensus conference on the afferent limb of rapid response systems. Resuscitation. 2010;81(4):375–382.
- , , , . Attitudes and barriers to a medical emergency team system at a tertiary paediatric hospital. Resuscitation. 2011;82(2):167–174.
- , , , et al. Why don't hospital staff activate the rapid response system (RRS)? How frequently is it needed and can the process be improved? Implement Sci. 2011;6:39.
- , . Failure of the afferent limb: a persistent problem in rapid response systems. Resuscitation. 2011;82(7):797–798.
- , , . Understanding how rapid response systems may improve safety for the acutely ill patient: learning from the frontline. BMJ Qual Saf. 2012;21(2):135–144.
- , , . How RNs rescue patients: a qualitative study of RNs' perceived involvement in rapid response teams. Qual Saf Health Care. 2010;19(5):1–4.
- , , , et al. A survey of nurses' beliefs about the medical emergency team system in a Canadian tertiary hospital. Am J Crit Care. 2010;19(1):74–83.
- , , , et al. Nurses' attitudes to a medical emergency team service in a teaching hospital. Qual Saf Health Care. 2006;15(6):427–432.
- , , , et al. Introducing critical care outreach: a ward‐randomised trial of phased introduction in a general hospital. Intensive Care Med. 2004;30(7):1398–1404.
- . Out of our reach? Assessing the impact of introducing a critical care outreach service. Anaesthesia. 2003;58(9):882–885.
- , , . Effect of the critical care outreach team on patient survival to discharge from hospital and readmission to critical care: non‐randomised population based study. BMJ. 2003;327(7422):1014.
- , , , et al. Successful implementation of a family and patient activated rapid response team in an adult level 1 trauma center. Resuscitation. 2010;81(12):1676–1681.
- , , , et al. Beyond rapid response teams: instituting a “Rover Team” improves the management of at‐risk patients, facilitates proactive interventions, and improves outcomes. In: Henriksen K, Battles JB, Keyes MA, Grady ML, eds. Advances in Patient Safety: New Directions and Alternative Approaches. Rockville, MD: Agency for Healthcare Research and Quality; 2008.
- , . The case‐crossover study design in pharmacoepidemiology. Stat Methods Med Res. 2009;18(1):53–65.
- , , , et al. Comparison of the statistical efficiency of case‐crossover and case‐control designs: application to severe cutaneous adverse reactions. J Clin Epidemiol. 2001;54(12):1218–1227.
- . The case‐crossover design: a method for studying transient effects on the risk of acute events. Am J Epidemiol. 1991;133(2):144–153.
- , , , , , . Development of a score to predict clinical deterioration in hospitalized children. J Hosp Med. 2012;7(4):345–349.
- Lexicomp. Available at: http://www.lexi.com. Accessed July 26, 2012.
- , , , , , . Sensitivity of the Pediatric Early Warning Score to identify patient deterioration. Pediatrics. 2010;125(4):e763–e769.
- . Detecting and managing deterioration in children. Paediatr Nurs. 2005;17(1):32–35.
- , , , , . Prospective evaluation of a pediatric inpatient early warning scoring system. J Spec Pediatr Nurs. 2009;14(2):79–85.
- , , . Promoting care for acutely ill children—development and evaluation of a Paediatric Early Warning Tool. Intensive Crit Care Nurs. 2006;22(2):73–81.
- , , . The Pediatric Early Warning System Score: a severity of illness score to predict urgent medical need in hospitalized children. J Crit Care. 2006;21(3):271–278.
- , , , , , . Performance of the maximum modified early warning score to predict the need for higher care utilization among admitted emergency department patients. J Hosp Med. 2010;5(1):E46–E52.
In recent years, many hospitals have implemented rapid response systems (RRSs) in efforts to reduce mortality outside the intensive care unit (ICU). Rapid response systems include 2 clinical components (efferent and afferent limbs) and 2 organizational components (process improvement and administrative limbs).[1, 2] The efferent limb includes medical emergency teams (METs) that can be summoned to hospital wards to rescue deteriorating patients. The afferent limb identifies patients at risk of deterioration using tools such as early warning scores and triggers a MET response when appropriate.[2] The process‐improvement limb evaluates and optimizes the RRS. The administrative limb implements the RRS and supports its ongoing operation. The effectiveness of most RRSs depends upon the ward team making the decision to escalate care by activating the MET. Barriers to activating the MET may include reduced situational awareness,[3, 4] hierarchical barriers to calling for help,[3, 4, 5, 6, 7, 8] fear of criticism,[3, 8, 9] and other hospital safety cultural barriers.[3, 4, 8]
Proactive critical‐care outreach[10, 11, 12, 13] or rover[14] teams seek to reduce barriers to activation and improve outcomes by systematically identifying and evaluating at‐risk patients without relying on requests for assistance from the ward team. Structured similarly to early warning scores, surveillance tools intended for rover teams might improve their ability to rapidly identify at‐risk patients throughout a hospital. They could combine vital signs with other variables, such as diagnostic and therapeutic interventions that reflect the ward team's early, evolving concern. In particular, the incorporation of medications associated with deterioration may enhance the performance of surveillance tools.
Medications may be associated with deterioration in one of several ways. They could play a causal role in deterioration (ie, opioids causing respiratory insufficiency), represent clinical worsening and anticipation of possible deterioration (ie, broad‐spectrum antibiotics for a positive blood culture), or represent rescue therapies for early deterioration (ie, antihistamines for allergic reactions). In each case, the associated therapeutic classes could be considered sentinel markers of clinical deterioration.
Combined with vital signs and other risk factors, therapeutic classes could serve as useful components of surveillance tools to detect signs of early, evolving deterioration and flag at‐risk patients for evaluation. As a first step, we sought to identify therapeutic classes associated with clinical deterioration. This effort to improve existing afferent tools falls within the process‐improvement limb of RRSs.
PATIENTS AND METHODS
Study Design
We performed a case‐crossover study of children who experienced clinical deterioration. An alternative to the matched case‐control design, the case‐crossover design involves longitudinal within‐subject comparisons exclusively of case subjects such that an individual serves as his or her own control. It is most effective when studying intermittent exposures that result in transient changes in the risk of an acute event,[15, 16, 17] making it appropriate for our study.
Using the case‐crossover design, we compared a discrete time period in close proximity to the deterioration event, called the hazard interval, with earlier time periods in the hospitalization, called the control intervals.[15, 16, 17] In our primary analysis (Figure 1B), we defined the durations of these intervals as follows: We first censored the 2 hours immediately preceding the clinical deterioration event (hours 0 to 2). We made this decision a priori to exclude medications used after deterioration was recognized and resuscitation had already begun. The 12‐hour period immediately preceding the censored interval was the hazard interval (hours 2 to 14). Each 12‐hour period immediately preceding the hazard interval was a control interval (hours 14 to 26, 26 to 38, 38 to 50, and 50 to 62). Depending on the child's length of stay prior to the deterioration event, each hazard interval had 14 control intervals for comparison. In sensitivity analysis, we altered the durations of these intervals (see below).
Study Setting and Participants
We performed this study among children age <18 years who experienced clinical deterioration between January 1, 2005, and December 31, 2008, after being hospitalized on a general medical or surgical unit at The Children's Hospital of Philadelphia for 24 hours. Clinical deterioration was a composite outcome defined as cardiopulmonary arrest (CPA), acute respiratory compromise (ARC), or urgent ICU transfer. Cardiopulmonary arrest events required either pulselessness or a pulse with inadequate perfusion treated with chest compressions and/or defibrillation. Acute respiratory compromise events required respiratory insufficiency treated with bag‐valve‐mask or invasive airway interventions. Urgent ICU transfers included 1 of the following outcomes in the 12 hours after transfer: death, CPA, intubation, initiation of noninvasive ventilation, or administration of a vasoactive medication infusion used for the treatment of shock. Time zero was the time of the CPA/ARC, or the time at which the child arrived in the ICU for urgent transfers. These subjects also served as the cases for a previously published case‐control study evaluating different risk factors for deterioration.[18] The institutional review board of The Children's Hospital of Philadelphia approved the study.
At the time of the study, the hospital did not have a formal RRS. An immediate‐response code‐blue team was available throughout the study period for emergencies occurring outside the ICU. Physicians could also page the pediatric ICU fellow to discuss patients who did not require immediate assistance from the code‐blue team but were clinically deteriorating. There were no established triggering criteria.
Medication Exposures
Intravenous (IV) medications administered in the 72 hours prior to clinical deterioration were considered the exposures of interest. Each medication was included in 1 therapeutic classes assigned in the hospital's formulary (Lexicomp, Hudson, OH).[19] In order to determine which therapeutic classes to evaluate, we performed a power calculation using the sampsi_mcc package for Stata 12 (StataCorp, College Station, TX). We estimated that we would have 3 matched control intervals per hazard interval. We found that, in order to detect a minimum odds ratio of 3.0 with 80% power, a therapeutic class had to be administered in 5% of control periods. All therapeutic classes meeting that requirement were included in the analysis and are listed in Table 1. (See lists of the individual medications comprising each class in the Supporting Information, Tables 124, in the online version of this article.)
| Therapeutic Class | No. of Control Intervals | % |
|---|---|---|
| ||
| Sedatives | 107 | 25 |
| Antiemetics | 92 | 22 |
| Third‐ and fourth‐generation cephalosporins | 83 | 20 |
| Antihistamines | 74 | 17 |
| Antidotes to hypersensitivity reactions (diphenhydramine) | 65 | 15 |
| Gastric acid secretion inhibitors | 62 | 15 |
| Loop diuretics | 62 | 15 |
| Anti‐inflammatory agents | 61 | 14 |
| Penicillin antibiotics | 61 | 14 |
| Benzodiazepines | 59 | 14 |
| Hypnotics | 58 | 14 |
| Narcotic analgesics (full opioid agonists) | 54 | 13 |
| Antianxiety agents | 53 | 13 |
| Systemic corticosteroids | 53 | 13 |
| Glycopeptide antibiotics (vancomycin) | 46 | 11 |
| Anaerobic antibiotics | 45 | 11 |
| Histamine H2 antagonists | 41 | 10 |
| Antifungal agents | 37 | 9 |
| Phenothiazine derivatives | 37 | 9 |
| Adrenal corticosteroids | 35 | 8 |
| Antiviral agents | 30 | 7 |
| Aminoglycoside antibiotics | 26 | 6 |
| Narcotic analgesics (partial opioid agonists) | 26 | 6 |
| PPIs | 26 | 6 |
Data Collection
Data were abstracted from the electronic medication administration record (Sunrise Clinical Manager; Allscripts, Chicago, IL) into a database. For each subject, we recorded the name and time of administration of each IV medication given in the 72 hours preceding deterioration, as well as demographic, event, and hospitalization characteristics.
Statistical Analysis
We used univariable conditional logistic regression to evaluate the association between each therapeutic class and the composite outcome of clinical deterioration in the primary analysis. Because cases serve as their own controls in the case‐crossover design, this method inherently adjusts for all subject‐specific time‐invariant confounding variables, such as patient demographics, disease, and hospital‐ward characteristics.[15]
Sensitivity Analysis
Our primary analysis used a 2‐hour censored interval and 12‐hour hazard and control intervals. Excluding the censored interval from analysis was a conservative approach that we chose because our goal was to identify therapeutic classes associated with deterioration during a phase in which adverse outcomes may be prevented with early intervention. In order to test whether our findings were stable across different lengths of censored, hazard, and control intervals, we performed a sensitivity analysis, also using conditional logistic regression, on all therapeutic classes that were significant (P<0.05) in primary analysis. In 6 iterations of the sensitivity analysis, we varied the length of the hazard and control intervals between 8 and 12 hours, and the length of the censored interval between 0 and 4 hours (Figure 1AF). In a seventh iteration, we used a variant of the primary analysis in which we censored the first control interval (Figure 1G).
RESULTS
We identified 12 CPAs, 41 ARCs, and 699 ICU transfers during the study period. Of these 752 events, 141 (19%) were eligible as cases according to our inclusion criteria.[18] (A flowchart demonstrating the identification of eligible cases is provided in Supporting Table 25 in the online version of this article.) Of the 81% excluded, 37% were ICU transfers who did not meet urgent criteria. Another 31% were excluded because they were hospitalized for <24 hours at the time of the event, making their analysis in a case‐crossover design using 12‐hour periods impossible. Event characteristics, demographics, and hospitalization characteristics are shown in Table 2.
| n | % | |
|---|---|---|
| ||
| Type of event | ||
| CPA | 4 | 3 |
| ARC | 29 | 20 |
| Urgent ICU transfer | 108 | 77 |
| Demographics | ||
| Age | ||
| 0<6 months | 17 | 12 |
| 6<12 months | 22 | 16 |
| 1<4 years | 34 | 24 |
| 4<10 years | 26 | 18 |
| 10<18 years | 42 | 30 |
| Sex | ||
| F | 60 | 43 |
| M | 81 | 57 |
| Race | ||
| White | 69 | 49 |
| Black/African American | 49 | 35 |
| Asian/Pacific Islander | 0 | 0 |
| Other | 23 | 16 |
| Ethnicity | ||
| Non‐Hispanic | 127 | 90 |
| Hispanic | 14 | 10 |
| Hospitalization | ||
| Surgical service | 4 | 3 |
| Survived to hospital discharge | 107 | 76 |
Primary Analysis
A total of 141 hazard intervals and 487 control intervals were included in the primary analysis, the results of which are shown in Table 3. Among the antimicrobial therapeutic classes, glycopeptide antibiotics (vancomycin), anaerobic antibiotics, third‐generation and fourth‐generation cephalosporins, and aminoglycoside antibiotics were significant. All of the anti‐inflammatory therapeutic classes, including systemic corticosteroids, anti‐inflammatory agents, and adrenal corticosteroids, were significant. All of the sedatives, hypnotics, and antianxiety therapeutic classes, including sedatives, benzodiazepines, hypnotics, and antianxiety agents, were significant. Among the narcotic analgesic therapeutic classes, only 1 class, narcotic analgesics (full opioid agonists), was significant. None of the gastrointestinal therapeutic classes were significant. Among the classes classified as other, loop diuretics and antidotes to hypersensitivity reactions (diphenhydramine) were significant.
| OR | LCI | UCI | P Value | |
|---|---|---|---|---|
| ||||
| Antimicrobial therapeutic classes | ||||
| Glycopeptide antibiotics (vancomycin) | 5.84 | 2.01 | 16.98 | 0.001 |
| Anaerobic antibiotics | 5.33 | 1.36 | 20.94 | 0.02 |
| Third‐ and fourth‐generation cephalosporins | 2.78 | 1.15 | 6.69 | 0.02 |
| Aminoglycoside antibiotics | 2.90 | 1.11 | 7.56 | 0.03 |
| Penicillin antibiotics | 2.40 | 0.9 | 6.4 | 0.08 |
| Antiviral agents | 1.52 | 0.20 | 11.46 | 0.68 |
| Antifungal agents | 1.06 | 0.44 | 2.58 | 0.89 |
| Corticosteroids and other anti‐inflammatory therapeutic classes* | ||||
| Systemic corticosteroids | 3.69 | 1.09 | 12.55 | 0.04 |
| Anti‐inflammatory agents | 3.69 | 1.09 | 12.55 | 0.04 |
| Adrenal corticosteroids | 3.69 | 1.09 | 12.55 | 0.04 |
| Sedatives, hypnotics, and antianxiety therapeutic classes | ||||
| Sedatives | 3.48 | 1.78 | 6.78 | <0.001 |
| Benzodiazepines | 2.71 | 1.36 | 5.40 | 0.01 |
| Hypnotics | 2.54 | 1.27 | 5.09 | 0.01 |
| Antianxiety agents | 2.28 | 1.06 | 4.91 | 0.04 |
| Narcotic analgesic therapeutic classes | ||||
| Narcotic analgesics (full opioid agonists) | 2.48 | 1.07 | 5.73 | 0.03 |
| Narcotic analgesics (partial opioid agonists) | 1.97 | 0.57 | 6.85 | 0.29 |
| GI therapeutic classes | ||||
| Antiemetics | 0.57 | 0.22 | 1.48 | 0.25 |
| PPIs | 2.05 | 0.58 | 7.25 | 0.26 |
| Phenothiazine derivatives | 0.47 | 0.12 | 1.83 | 0.27 |
| Gastric acid secretion inhibitors | 1.71 | 0.61 | 4.81 | 0.31 |
| Histamine H2 antagonists | 0.95 | 0.17 | 5.19 | 0.95 |
| Other therapeutic classes | ||||
| Loop diuretics | 2.87 | 1.28 | 6.47 | 0.01 |
| Antidotes to hypersensitivity reactions (diphenhydramine) | 2.45 | 1.15 | 5.23 | 0.02 |
| Antihistamines | 2.00 | 0.97 | 4.12 | 0.06 |
Sensitivity Analysis
Of the 14 classes that were significant in primary analysis, we carried 9 forward to sensitivity analysis. The 5 that were not carried forward overlapped substantially with other classes that were carried forward. The decision of which overlapping class to carry forward was based upon (1) parsimony and (2) clinical relevance. This is described briefly in the footnotes to Table 3 (see Supporting information in the online version of this article for a full description of this process). Figure 2 presents the odds ratios and their 95% confidence intervals for the sensitivity analysis of each therapeutic class that was significant in primary analysis. Loop diuretics remained significantly associated with deterioration in all 7 iterations. Glycopeptide antibiotics (vancomycin), third‐generation and fourth‐generation cephalosporins, systemic corticosteroids, and benzodiazepines were significant in 6. Anaerobic antibiotics and narcotic analgesics (full opioid agonists) were significant in 5, and aminoglycoside antibiotics and antidotes to hypersensitivity reactions (diphenhydramine) in 4.
DISCUSSION
We identified 9 therapeutic classes which were associated with a 2.5‐fold to 5.8‐fold increased risk of clinical deterioration. The results were robust to sensitivity analysis. Given their temporal association to the deterioration events, these therapeutic classes may serve as sentinels of early deterioration and are candidate variables to combine with vital signs and other risk factors in a surveillance tool for rover teams or an early warning score.
Although most early warning scores intended for use at the bedside are based upon vital signs and clinical observations, a few also include medications. Monaghan's Pediatric Early Warning Score, the basis for many modified scores used in children's hospitals throughout the world, assigns points for children requiring frequent doses of nebulized medication.[20, 21, 22] Nebulized epinephrine is a component of the Bristol Paediatric Early Warning Tool.[23] The number of medications administered in the preceding 24 hours was included in an early version of the Bedside Paediatric Early Warning System Score.[24] Adding IV antibiotics to the Maximum Modified Early Warning Score improved prediction of the need for higher care utilization among hospitalized adults.[25]
In order to determine the role of the IV medications we found to be associated with clinical deterioration, the necessary next step is to develop a multivariable predictive model to determine if they improve the performance of existing early warning scores in identifying deteriorating patients. Although simplicity is an important characteristic of hand‐calculated early warning scores, integration of a more complex scoring system with more variables, such as these medications, into the electronic health record would allow for automated scoring, eliminating the need to sacrifice score performance to keep the tool simple. Integration into the electronic health record would have the additional benefit of making the score available to clinicians who are not at the bedside. Such tools would be especially useful for remote surveillance for deterioration by critical‐care outreach or rover teams.
Our study has several limitations. First, the sample size was small, and although we sought to minimize the likelihood of chance associations by performing sensitivity analysis, these findings should be confirmed in a larger study. Second, we only evaluated IV medications. Medications administered by other routes could also be associated with clinical deterioration and should be analyzed in future studies. Third, we excluded children hospitalized for <24 hours, as well as transfers that did not meet urgent criteria. These may be limitations because (1) the first 24 hours of hospitalization may be a high‐risk period, and (2) patients who were on trajectories toward severe deterioration and received interventions that prevented further deterioration but did not meet urgent transfer criteria were excluded. It may be that the children we included as cases were at increased risk of deterioration that is either more difficult to recognize early, or more difficult to treat effectively without ICU interventions. Finally, we acknowledge that in some cases the therapeutic classes were associated with deterioration in a causal fashion, and in others the medications administered did not cause deterioration but were signs of therapeutic interventions that were initiated in response to clinical worsening. Identifying the specific indications for administration of drugs used in response to clinical worsening may have resulted in stronger associations with deterioration. However, these indications are often complex, multifactorial, and poorly documented in real time. This limits the ability to automate their detection using the electronic health record, the ultimate goal of this line of research.
CONCLUSION
We used a case‐crossover approach to identify therapeutic classes that are associated with increased risk of clinical deterioration in hospitalized children on pediatric wards. These sentinel therapeutic classes may serve as useful components of electronic health recordbased surveillance tools to detect signs of early, evolving deterioration and flag at‐risk patients for critical‐care outreach or rover team review. Future research should focus on evaluating whether including these therapeutic classes in early warning scores improves their accuracy in detecting signs of deterioration and determining if providing this information as clinical decision support improves patient outcomes.
Acknowledgments
Disclosures: This study was funded by The Children's Hospital of Philadelphia Center for Pediatric Clinical Effectiveness Pilot Grant and the University of Pennsylvania Provost's Undergraduate Research Mentoring Program. Drs. Bonafide and Keren also receive funding from the Pennsylvania Health Research Formula Fund Award from the Pennsylvania Department of Health for research in pediatric hospital quality, safety, and costs. The authors have no other conflicts of interest to report.
- , , , et al. Findings of the first consensus conference on medical emergency teams. Crit Care Med. 2006;34(9):2463–2478.
- , , , et al. “Identifying the hospitalised patient in crisis”—a consensus conference on the afferent limb of rapid response systems. Resuscitation. 2010;81(4):375–382.
- , , , . Attitudes and barriers to a medical emergency team system at a tertiary paediatric hospital. Resuscitation. 2011;82(2):167–174.
- , , , et al. Why don't hospital staff activate the rapid response system (RRS)? How frequently is it needed and can the process be improved? Implement Sci. 2011;6:39.
- , . Failure of the afferent limb: a persistent problem in rapid response systems. Resuscitation. 2011;82(7):797–798.
- , , . Understanding how rapid response systems may improve safety for the acutely ill patient: learning from the frontline. BMJ Qual Saf. 2012;21(2):135–144.
- , , . How RNs rescue patients: a qualitative study of RNs' perceived involvement in rapid response teams. Qual Saf Health Care. 2010;19(5):1–4.
- , , , et al. A survey of nurses' beliefs about the medical emergency team system in a Canadian tertiary hospital. Am J Crit Care. 2010;19(1):74–83.
- , , , et al. Nurses' attitudes to a medical emergency team service in a teaching hospital. Qual Saf Health Care. 2006;15(6):427–432.
- , , , et al. Introducing critical care outreach: a ward‐randomised trial of phased introduction in a general hospital. Intensive Care Med. 2004;30(7):1398–1404.
- . Out of our reach? Assessing the impact of introducing a critical care outreach service. Anaesthesia. 2003;58(9):882–885.
- , , . Effect of the critical care outreach team on patient survival to discharge from hospital and readmission to critical care: non‐randomised population based study. BMJ. 2003;327(7422):1014.
- , , , et al. Successful implementation of a family and patient activated rapid response team in an adult level 1 trauma center. Resuscitation. 2010;81(12):1676–1681.
- , , , et al. Beyond rapid response teams: instituting a “Rover Team” improves the management of at‐risk patients, facilitates proactive interventions, and improves outcomes. In: Henriksen K, Battles JB, Keyes MA, Grady ML, eds. Advances in Patient Safety: New Directions and Alternative Approaches. Rockville, MD: Agency for Healthcare Research and Quality; 2008.
- , . The case‐crossover study design in pharmacoepidemiology. Stat Methods Med Res. 2009;18(1):53–65.
- , , , et al. Comparison of the statistical efficiency of case‐crossover and case‐control designs: application to severe cutaneous adverse reactions. J Clin Epidemiol. 2001;54(12):1218–1227.
- . The case‐crossover design: a method for studying transient effects on the risk of acute events. Am J Epidemiol. 1991;133(2):144–153.
- , , , , , . Development of a score to predict clinical deterioration in hospitalized children. J Hosp Med. 2012;7(4):345–349.
- Lexicomp. Available at: http://www.lexi.com. Accessed July 26, 2012.
- , , , , , . Sensitivity of the Pediatric Early Warning Score to identify patient deterioration. Pediatrics. 2010;125(4):e763–e769.
- . Detecting and managing deterioration in children. Paediatr Nurs. 2005;17(1):32–35.
- , , , , . Prospective evaluation of a pediatric inpatient early warning scoring system. J Spec Pediatr Nurs. 2009;14(2):79–85.
- , , . Promoting care for acutely ill children—development and evaluation of a Paediatric Early Warning Tool. Intensive Crit Care Nurs. 2006;22(2):73–81.
- , , . The Pediatric Early Warning System Score: a severity of illness score to predict urgent medical need in hospitalized children. J Crit Care. 2006;21(3):271–278.
- , , , , , . Performance of the maximum modified early warning score to predict the need for higher care utilization among admitted emergency department patients. J Hosp Med. 2010;5(1):E46–E52.
Copyright © 2013 Society of Hospital Medicine
