User login
Comparing Two Proximal Measures of Unrecognized Clinical Deterioration in Children
Unrecognized in-hospital clinical deterioration can lead to substantial morbidity and mortality.1 As a result, hospitals have implemented systems to identify and mitigate this form of potentially preventable harm.2-4 Cardiopulmonary arrest rates are useful metrics to evaluate the effectiveness of systems designed to identify and respond to deteriorating adult patients.5 Pediatric arrests outside of the intensive care unit (ICU) are rare; therefore, the identification of valid and more frequent proximal measures of deterioration is critical to the assessment of current systems and to guide future improvement efforts.6
Bonafide et al developed and validated the critical deterioration event (CDE) metric, demonstrating that children who were transferred to the ICU and who received noninvasive ventilation, intubation, or vasopressor initiation within 12 hours of transfer had an over 13-fold increased risk of in-hospital mortality.7 Implementation of a rapid response system was subsequently associated with a decrease in the trajectory of CDEs.2 At Cincinnati Children’s Hospital Medical Center (CCHMC), an additional proximal outcome measure was developed for unrecognized clinical deterioration: emergency transfers (ETs).8,9 An event meets criteria for an ET when the patient undergoes intubation, inotropic support, or three or more fluid boluses in the first hour after arrival or prior to ICU transfer.9 Recently, ETs were associated with an increased in-hospital mortality, ICU length of stay, and post-transfer hospital length of stay when compared with nonemergent transfers.10,11
While both CDEs and ETs were associated with adverse outcomes in children and may be modifiable through better rapid response systems, researchers have not previously compared the extent to which CDEs and ETs capture similar versus distinct events. Furthermore, the ability of focused situation awareness interventions to identify high-risk patients has not previously been assessed. Situation awareness is defined as the perception of elements in the environment, the comprehension of their meaning, and the projection of their status in the near future.12 Clinically, improved situation awareness can lead to earlier recognition of deterioration and a reduction in failure to rescue events.9 The objectives of this study were to (1) describe CDEs and ETs and assess for similarities, differences, and trends, and (2) evaluate the utility of situation awareness interventions to detect patients who experience these events.
METHODS
Setting and Inclusion Criteria
We conducted a retrospective cross-sectional study at CCHMC, a free-standing tertiary care children’s hospital. We included all patients cared for outside of the ICU during their hospitalization from January 2016 to July 2018. Transfer to the ICU included the pediatric and the cardiac ICUs.
Study Definitions
CDEs were events in which a patient received noninvasive ventilation, intubation, or vasopressor initiation within 12 hours of ICU transfer (Figure).7 ETs were events in which a patient underwent intubation, inotropes, or three or more fluid boluses in the first hour after arrival or before transfer (Figure).9 We examined two distinct situation awareness interventions: watcher identification and the pediatric early warning score (PEWS). A watcher is a situation awareness concern based on clinician perception, or “gut feeling,” that the patient is at high risk for deterioration.9,13 When clinicians designate a patient as a watcher in the electronic medical record, they establish an action plan, reassessment timeline, and objective criteria for activation of the rapid response team to assess the patient. Watcher patients are discussed at institution-wide safety huddles three times daily. The PEWS is a reproducible assessment of the patient’s status based on physiologic parameters, including behavior, cardiovascular, and respiratory assessments.3,4 At CCHMC, a Monaghan PEWS score is calculated with each assessment of vital signs.14 The bedside nurse calls the physician or advanced practice provider to assess the patient for a score of 4 or greater.
Event Identification and Classification
Two trained research nurses (C.F. and D.H.) manually reviewed all ICU transfers during the study period to determine if CDE criteria were met. Events meeting CDE criteria were classified as respiratory (requiring noninvasive or invasive ventilation), cardiac (requiring inotropes), or cardiopulmonary resuscitation (CPR) in which cardiac and respiratory interventions were initiated simultaneously. Additional information obtained included the time the patient met CDE criteria relative to the time of ICU transfer, watcher identification prior to the event, and the highest PEWS documented within 12 hours of the event. A physician (T.S.) performed manual chart review of each CDE as an additional validation step. ETs during the study period were obtained from an existing institutional database. ICU transfers meeting ET criteria are entered into this database in nearly real time by the inpatient nurse manager; this nurse attends all rapid response team calls and is aware of the disposition for each event. A physician (T.S.) performed manual chart review of each ET to determine event classification by intervention type, watcher identification, and the highest PEWS documented within 12 hours of the event. All CDEs and ETs were cross-referenced to determine overlap.
Outcome Measures and Statistical Analysis
The primary outcomes were CDEs and ETs, calculated as absolute counts and number of events per 10,000 non-ICU patient days. Events were classified by (1) category of intervention, (2) watcher identification prior to the event, and (3) PEWS of 4 or greater documented in the 12 hours prior to the event.
RESULTS
Incidence and Overlap of CDEs and ETs
There were 1,828 ICU transfers during the study period, of which 365 (20%) met criteria for a CDE, ET, or both. Among events captured, 359 (98.4%) met criteria for a CDE, occurring at a rate of 16.7 per 10,000 non-ICU patient days, and 88 (24.1%) met criteria for an ET, occurring at a rate of 4.1 per 10,000 non-ICU patient days (Table). Of the 88 ETs, 82 also met criteria for a CDE.

Timing and Categorization of CDEs and ETs
Despite the 12-hour time horizon, most CDEs (62.1%) met criteria within 1 hour of ICU transfer, and 79.9% met criteria within 3 hours (Figure). Respiratory events were most common for both CDEs (80.5%) and ETs (47.7%) (Table). Of respiratory CDEs, 67.4% required noninvasive ventilation, and 32.5% required invasive ventilation. Fluid or inotrope support were responsible for 11.7% of CDEs and nearly one-third of ETs; of note, the CDE definition does not include fluid boluses. Less than 10% of CDEs were characterized by CPR, whereas this accounted for 22.7% of ETs.

Identification of Events by Situation Awareness Interventions
The Table depicts the identification of events by watcher status and PEWS. All events were included for watcher identification, and events with a documented score in the 12 hours prior to transfer were included for PEWS. While half or less of the events were captured by watcher or PEWS separately, over 85% of events were captured by either one or both of the situation awareness interventions. The situation awareness interventions identified CDEs and ETs similarly.
DISCUSSION
This study is the first to classify and compare two proximal measures of clinical deterioration in children. Given that children with escalating respiratory symptoms are often treated successfully outside of the ICU, the findings that most events are respiratory in nature and occur within 1 hour of transfer are not unexpected. The analysis of situation awareness interventions suggests that neither watcher identification nor PEWS is independently sufficient to predict future deterioration. These findings support the necessity of both a clinician “gut feeling” and objective vital sign and physical exam findings to indicate a patient’s clinical status.9 Initiatives to improve the early recognition and mitigation of patient deterioration should focus on both tools to initiate an escalation of care, and work to understand gaps in these identification systems, which currently miss approximately 15% of acutely deteriorating patients. Although most patients had watcher identification or elevated PEWS prior to the event, they still required emergent life-sustaining care, which suggests that opportunities exist to improve mitigation and escalation pathways as a critical prevention effort.7,10
It is likely that CDEs and ETs are important outcome metrics in the evaluation of pediatric escalation systems, including rapid response systems.15 ETs are less common and more specific for unrecognized deterioration, which makes them a more feasible early metric for assessment. CDEs, which are likely more sensitive, may be useful in settings in which deterioration is rare or a more common outcome enhances power to detect the effect of interventions.10
This study has limitations and lends itself to future work. While CDEs and ETs are more common than cardiopulmonary arrest, they remain relatively uncommon. This was a single-site study at a large, tertiary care, free-standing children’s hospital, so generalizability to centers with different characteristics and patient populations may be limited. Future work should focus on comparing patient-level outcomes of CDEs and ETs, including length of stay and mortality. The determination of specific diagnoses and conditions associated with CDEs and ETs may inform targeted preventive improvement science interventions.
CONCLUSION
CDEs were roughly fourfold more common than ETs, with most CDEs occurring within 1 hour of ICU transfer. Most patients were identified by either watcher status or elevated PEWS, suggesting that these tools, when utilized as complementary situation awareness interventions, are important for identifying patients at risk for deterioration. Opportunities exist for improved escalation plans for patients identified as high-risk to prevent the need for emergent life-sustaining intervention.
1. Buist M, Bernard S, Nguyen TV, Moore G, Anderson J. Association between clinically abnormal observations and subsequent in-hospital mortality: a prospective study. Resuscitation. 2004;62(2):137-141. https://doi.org/10.1016/j.resuscitation.2004.03.005
2. Bonafide CP, Localio AR, Roberts KE, Nadkarni VM, Weirich CM, Keren R. Impact of rapid response system implementation on critical deterioration events in children. JAMA Pediatr. 2014;168(1):25-33. https://doi.org/10.1001/jamapediatrics.2013.3266
3. Duncan H, Hutchison J, Parshuram CS. The Pediatric Early Warning System score: a severity of illness score to predict urgent medical need in hospitalized children. J Crit Care. 2006;21(3):271-278. https://doi.org/10.1016/j.jcrc.2006.06.007
4. Sefton G, McGrath C, Tume L, Lane S, Lisboa PJ, Carrol ED. What impact did a Paediatric Early Warning system have on emergency admissions to the paediatric intensive care unit? an observational cohort study. Intensive Crit Care Nurs. 2015;31(2):91-99. https://doi.org/10.1016/j.iccn.2014.01.001
5. Schein RM, Hazday N, Pena M, Ruben BH, Sprung CL. Clinical antecedents to in-hospital cardiopulmonary arrest. Chest. 1990;98(6):1388-1392. https://doi.org/10.1378/chest.98.6.1388
6. Feudtner C, Berry JG, Parry G, et al. Statistical uncertainty of mortality rates and rankings for children’s hospitals. Pediatrics. 2011;128(4):e966-e972. https://doi.org/10.1542/peds.2010-3074
7. Bonafide CP, Roberts KE, Priestley MA, et al. Development of a pragmatic measure for evaluating and optimizing rapid response systems. Pediatrics. 2012;129(4):e874-e881. https://doi.org/10.1542/peds.2011-2784
8. Brady PW, Goldenhar LM. A qualitative study examining the influences on situation awareness and the identification, mitigation and escalation of recognised patient risk. BMJ Qual Saf. 2014;23(2):153-161. https://doi.org/10.1136/bmjqs-2012-001747
9. Brady PW, Muething S, Kotagal U, et al. Improving situation awareness to reduce unrecognized clinical deterioration and serious safety events. Pediatrics. 2013;131(1):e298-e308. https://doi.org/10.1542/peds.2012-1364
10. Hussain FS, Sosa T, Ambroggio L, Gallagher R, Brady PW. Emergency transfers: an important predictor of adverse outcomes in hospitalized children. J Hosp Med. 2019;14(8):482-485. https://doi.org/10.12788/jhm.3219
11. Aoki Y, Inata Y, Hatachi T, Shimizu Y, Takeuchi M. Outcomes of ‘unrecognised situation awareness failures events’ in intensive care unit transfer of children in a Japanese children’s hospital. J Paediatr Child Health. 2019;55(2):213-215. https://doi.org/10.1111/jpc.14185
12. Endsley MR. Toward a theory of situation awareness in dynamic systems. Human Factors. 1995;37(1):32-64. https://doi.org/10.1518/001872095779049543
13. McClain Smith M, Chumpia M, Wargo L, Nicol J, Bugnitz M. Watcher initiative associated with decrease in failure to rescue events in pediatric population. Hosp Pediatr. 2017;7(12):710-715. https://doi.org/10.1542/hpeds.2017-0042
14. Monaghan A. Detecting and managing deterioration in children. Paediatr Nurs. 2005;17(1):32-35. https://doi.org/10.7748/paed2005.02.17.1.32.c964
15. Subbe CP, Bannard-Smith J, Bunch J, et al. Quality metrics for the evaluation of Rapid Response Systems: proceedings from the third international consensus conference on Rapid Response Systems. Resuscitation. 2019;141:1-12. https://doi.org/10.1016/j.resuscitation.2019.05.012
Unrecognized in-hospital clinical deterioration can lead to substantial morbidity and mortality.1 As a result, hospitals have implemented systems to identify and mitigate this form of potentially preventable harm.2-4 Cardiopulmonary arrest rates are useful metrics to evaluate the effectiveness of systems designed to identify and respond to deteriorating adult patients.5 Pediatric arrests outside of the intensive care unit (ICU) are rare; therefore, the identification of valid and more frequent proximal measures of deterioration is critical to the assessment of current systems and to guide future improvement efforts.6
Bonafide et al developed and validated the critical deterioration event (CDE) metric, demonstrating that children who were transferred to the ICU and who received noninvasive ventilation, intubation, or vasopressor initiation within 12 hours of transfer had an over 13-fold increased risk of in-hospital mortality.7 Implementation of a rapid response system was subsequently associated with a decrease in the trajectory of CDEs.2 At Cincinnati Children’s Hospital Medical Center (CCHMC), an additional proximal outcome measure was developed for unrecognized clinical deterioration: emergency transfers (ETs).8,9 An event meets criteria for an ET when the patient undergoes intubation, inotropic support, or three or more fluid boluses in the first hour after arrival or prior to ICU transfer.9 Recently, ETs were associated with an increased in-hospital mortality, ICU length of stay, and post-transfer hospital length of stay when compared with nonemergent transfers.10,11
While both CDEs and ETs were associated with adverse outcomes in children and may be modifiable through better rapid response systems, researchers have not previously compared the extent to which CDEs and ETs capture similar versus distinct events. Furthermore, the ability of focused situation awareness interventions to identify high-risk patients has not previously been assessed. Situation awareness is defined as the perception of elements in the environment, the comprehension of their meaning, and the projection of their status in the near future.12 Clinically, improved situation awareness can lead to earlier recognition of deterioration and a reduction in failure to rescue events.9 The objectives of this study were to (1) describe CDEs and ETs and assess for similarities, differences, and trends, and (2) evaluate the utility of situation awareness interventions to detect patients who experience these events.
METHODS
Setting and Inclusion Criteria
We conducted a retrospective cross-sectional study at CCHMC, a free-standing tertiary care children’s hospital. We included all patients cared for outside of the ICU during their hospitalization from January 2016 to July 2018. Transfer to the ICU included the pediatric and the cardiac ICUs.
Study Definitions
CDEs were events in which a patient received noninvasive ventilation, intubation, or vasopressor initiation within 12 hours of ICU transfer (Figure).7 ETs were events in which a patient underwent intubation, inotropes, or three or more fluid boluses in the first hour after arrival or before transfer (Figure).9 We examined two distinct situation awareness interventions: watcher identification and the pediatric early warning score (PEWS). A watcher is a situation awareness concern based on clinician perception, or “gut feeling,” that the patient is at high risk for deterioration.9,13 When clinicians designate a patient as a watcher in the electronic medical record, they establish an action plan, reassessment timeline, and objective criteria for activation of the rapid response team to assess the patient. Watcher patients are discussed at institution-wide safety huddles three times daily. The PEWS is a reproducible assessment of the patient’s status based on physiologic parameters, including behavior, cardiovascular, and respiratory assessments.3,4 At CCHMC, a Monaghan PEWS score is calculated with each assessment of vital signs.14 The bedside nurse calls the physician or advanced practice provider to assess the patient for a score of 4 or greater.
Event Identification and Classification
Two trained research nurses (C.F. and D.H.) manually reviewed all ICU transfers during the study period to determine if CDE criteria were met. Events meeting CDE criteria were classified as respiratory (requiring noninvasive or invasive ventilation), cardiac (requiring inotropes), or cardiopulmonary resuscitation (CPR) in which cardiac and respiratory interventions were initiated simultaneously. Additional information obtained included the time the patient met CDE criteria relative to the time of ICU transfer, watcher identification prior to the event, and the highest PEWS documented within 12 hours of the event. A physician (T.S.) performed manual chart review of each CDE as an additional validation step. ETs during the study period were obtained from an existing institutional database. ICU transfers meeting ET criteria are entered into this database in nearly real time by the inpatient nurse manager; this nurse attends all rapid response team calls and is aware of the disposition for each event. A physician (T.S.) performed manual chart review of each ET to determine event classification by intervention type, watcher identification, and the highest PEWS documented within 12 hours of the event. All CDEs and ETs were cross-referenced to determine overlap.
Outcome Measures and Statistical Analysis
The primary outcomes were CDEs and ETs, calculated as absolute counts and number of events per 10,000 non-ICU patient days. Events were classified by (1) category of intervention, (2) watcher identification prior to the event, and (3) PEWS of 4 or greater documented in the 12 hours prior to the event.
RESULTS
Incidence and Overlap of CDEs and ETs
There were 1,828 ICU transfers during the study period, of which 365 (20%) met criteria for a CDE, ET, or both. Among events captured, 359 (98.4%) met criteria for a CDE, occurring at a rate of 16.7 per 10,000 non-ICU patient days, and 88 (24.1%) met criteria for an ET, occurring at a rate of 4.1 per 10,000 non-ICU patient days (Table). Of the 88 ETs, 82 also met criteria for a CDE.
Timing and Categorization of CDEs and ETs
Despite the 12-hour time horizon, most CDEs (62.1%) met criteria within 1 hour of ICU transfer, and 79.9% met criteria within 3 hours (Figure). Respiratory events were most common for both CDEs (80.5%) and ETs (47.7%) (Table). Of respiratory CDEs, 67.4% required noninvasive ventilation, and 32.5% required invasive ventilation. Fluid or inotrope support were responsible for 11.7% of CDEs and nearly one-third of ETs; of note, the CDE definition does not include fluid boluses. Less than 10% of CDEs were characterized by CPR, whereas this accounted for 22.7% of ETs.
Identification of Events by Situation Awareness Interventions
The Table depicts the identification of events by watcher status and PEWS. All events were included for watcher identification, and events with a documented score in the 12 hours prior to transfer were included for PEWS. While half or less of the events were captured by watcher or PEWS separately, over 85% of events were captured by either one or both of the situation awareness interventions. The situation awareness interventions identified CDEs and ETs similarly.
DISCUSSION
This study is the first to classify and compare two proximal measures of clinical deterioration in children. Given that children with escalating respiratory symptoms are often treated successfully outside of the ICU, the findings that most events are respiratory in nature and occur within 1 hour of transfer are not unexpected. The analysis of situation awareness interventions suggests that neither watcher identification nor PEWS is independently sufficient to predict future deterioration. These findings support the necessity of both a clinician “gut feeling” and objective vital sign and physical exam findings to indicate a patient’s clinical status.9 Initiatives to improve the early recognition and mitigation of patient deterioration should focus on both tools to initiate an escalation of care, and work to understand gaps in these identification systems, which currently miss approximately 15% of acutely deteriorating patients. Although most patients had watcher identification or elevated PEWS prior to the event, they still required emergent life-sustaining care, which suggests that opportunities exist to improve mitigation and escalation pathways as a critical prevention effort.7,10
It is likely that CDEs and ETs are important outcome metrics in the evaluation of pediatric escalation systems, including rapid response systems.15 ETs are less common and more specific for unrecognized deterioration, which makes them a more feasible early metric for assessment. CDEs, which are likely more sensitive, may be useful in settings in which deterioration is rare or a more common outcome enhances power to detect the effect of interventions.10
This study has limitations and lends itself to future work. While CDEs and ETs are more common than cardiopulmonary arrest, they remain relatively uncommon. This was a single-site study at a large, tertiary care, free-standing children’s hospital, so generalizability to centers with different characteristics and patient populations may be limited. Future work should focus on comparing patient-level outcomes of CDEs and ETs, including length of stay and mortality. The determination of specific diagnoses and conditions associated with CDEs and ETs may inform targeted preventive improvement science interventions.
CONCLUSION
CDEs were roughly fourfold more common than ETs, with most CDEs occurring within 1 hour of ICU transfer. Most patients were identified by either watcher status or elevated PEWS, suggesting that these tools, when utilized as complementary situation awareness interventions, are important for identifying patients at risk for deterioration. Opportunities exist for improved escalation plans for patients identified as high-risk to prevent the need for emergent life-sustaining intervention.
1. Buist M, Bernard S, Nguyen TV, Moore G, Anderson J. Association between clinically abnormal observations and subsequent in-hospital mortality: a prospective study. Resuscitation. 2004;62(2):137-141. https://doi.org/10.1016/j.resuscitation.2004.03.005
2. Bonafide CP, Localio AR, Roberts KE, Nadkarni VM, Weirich CM, Keren R. Impact of rapid response system implementation on critical deterioration events in children. JAMA Pediatr. 2014;168(1):25-33. https://doi.org/10.1001/jamapediatrics.2013.3266
3. Duncan H, Hutchison J, Parshuram CS. The Pediatric Early Warning System score: a severity of illness score to predict urgent medical need in hospitalized children. J Crit Care. 2006;21(3):271-278. https://doi.org/10.1016/j.jcrc.2006.06.007
4. Sefton G, McGrath C, Tume L, Lane S, Lisboa PJ, Carrol ED. What impact did a Paediatric Early Warning system have on emergency admissions to the paediatric intensive care unit? an observational cohort study. Intensive Crit Care Nurs. 2015;31(2):91-99. https://doi.org/10.1016/j.iccn.2014.01.001
5. Schein RM, Hazday N, Pena M, Ruben BH, Sprung CL. Clinical antecedents to in-hospital cardiopulmonary arrest. Chest. 1990;98(6):1388-1392. https://doi.org/10.1378/chest.98.6.1388
6. Feudtner C, Berry JG, Parry G, et al. Statistical uncertainty of mortality rates and rankings for children’s hospitals. Pediatrics. 2011;128(4):e966-e972. https://doi.org/10.1542/peds.2010-3074
7. Bonafide CP, Roberts KE, Priestley MA, et al. Development of a pragmatic measure for evaluating and optimizing rapid response systems. Pediatrics. 2012;129(4):e874-e881. https://doi.org/10.1542/peds.2011-2784
8. Brady PW, Goldenhar LM. A qualitative study examining the influences on situation awareness and the identification, mitigation and escalation of recognised patient risk. BMJ Qual Saf. 2014;23(2):153-161. https://doi.org/10.1136/bmjqs-2012-001747
9. Brady PW, Muething S, Kotagal U, et al. Improving situation awareness to reduce unrecognized clinical deterioration and serious safety events. Pediatrics. 2013;131(1):e298-e308. https://doi.org/10.1542/peds.2012-1364
10. Hussain FS, Sosa T, Ambroggio L, Gallagher R, Brady PW. Emergency transfers: an important predictor of adverse outcomes in hospitalized children. J Hosp Med. 2019;14(8):482-485. https://doi.org/10.12788/jhm.3219
11. Aoki Y, Inata Y, Hatachi T, Shimizu Y, Takeuchi M. Outcomes of ‘unrecognised situation awareness failures events’ in intensive care unit transfer of children in a Japanese children’s hospital. J Paediatr Child Health. 2019;55(2):213-215. https://doi.org/10.1111/jpc.14185
12. Endsley MR. Toward a theory of situation awareness in dynamic systems. Human Factors. 1995;37(1):32-64. https://doi.org/10.1518/001872095779049543
13. McClain Smith M, Chumpia M, Wargo L, Nicol J, Bugnitz M. Watcher initiative associated with decrease in failure to rescue events in pediatric population. Hosp Pediatr. 2017;7(12):710-715. https://doi.org/10.1542/hpeds.2017-0042
14. Monaghan A. Detecting and managing deterioration in children. Paediatr Nurs. 2005;17(1):32-35. https://doi.org/10.7748/paed2005.02.17.1.32.c964
15. Subbe CP, Bannard-Smith J, Bunch J, et al. Quality metrics for the evaluation of Rapid Response Systems: proceedings from the third international consensus conference on Rapid Response Systems. Resuscitation. 2019;141:1-12. https://doi.org/10.1016/j.resuscitation.2019.05.012
© 2020 Society of Hospital Medicine
The Effects of Care Team Roles on Situation Awareness in the Pediatric Intensive Care Unit: A Prospective Cross-Sectional Study
Reduction in serious pediatric medical errors has been achieved through sharing of best practices and structured collaboration.1 However, limited progress has been made in reducing complex, multifactorial events such as unrecognized and undertreated patient deterioration events.2 To address this critical gap, interventions to improve clinician situation awareness (SA) have increasingly been applied.3
SA is the ability to recognize and monitor cues regarding what is happening, create a comprehensive picture with available information, and extrapolate whether it indicates adverse developments either immediately or in the near future.4 Methods such as care team huddling5-8 and using standardized patient acuity scoring instruments9 increase SA shared across care team roles. Shared SA is the degree to which each team member possesses a common understanding of what is going on. A team is considered to have shared SA when all the individuals agree on both what is happening (accurate perception and comprehension) and what is going to happen in the future (correct projection). Shared SA for high-risk patients in the pediatric intensive care unit (PICU) has not previously been described and may be an opportunity to improve interprofessional team communication for the sickest patients. Shared SA for high-risk patient status is only one aspect of SA, but it facilitates team-based mitigation planning and is an important starting place for understanding opportunities to improve SA. The primary objective of this study was to measure and compare SA among care team roles regarding patients with high-risk status in the PICU.
METHODS
We conducted a prospective, cross-sectional study from March 2018 to July 2019 examining the individual and shared SA of patient care team trios: the nurse, respiratory therapist (RT), and pediatric resident. The Institutional Review Board at Cincinnati Children’s Hospital Medical Center (CCHMC) determined this study to be non–human-subjects research.
Setting
Research was conducted in the 35-bed PICU of CCHMC, a 500-bed academic free-standing quaternary care children’s hospital.
Participants
We conducted independent surveys of the nurse, RT, and pediatric resident (care team trio) caring for each patient regarding the patient’s clinical deterioration risk status. No patients or care team trios were excluded.
Reference Standard
In 2016, a local panel of experts derived clinical criteria to determine high-risk status for PICU patients, the definition of which, as well as other study terms, appears in Table 1. A PICU attending or fellow identifies a patient as “high risk” when these clinical criteria are met. A plan for prevention and mitigation is formulated and documented for high-risk patients by the PICU attending or fellow at two preexisting daily SA huddles. This plan includes prevention measures to take immediately, specific vital sign thresholds for early identification of deterioration, and guidance on which emergency medication order sets should be utilized to expedite treatment in the event of clinical decline. Dissemination of the care team’s plan is the responsibility of the PICU fellow with additional follow-up by the charge nurse to improve reliability. Identification of high-risk status and development of the prevention and mitigation plan, as completed by the PICU fellow or attending, served as the reference standard for this study.

Survey Instrument Development
The locally developed survey tool was modeled after a validated handoff communication instrument.10 The tool covered the patient’s risk status, which high-risk clinical criteria were met, the presence and content of a mitigation plan, and planned patient interventions (Appendix).
Data Collection
Care team trios were sampled weekly on weekdays during day and night shifts within 4 to 6 hours of the SA huddle by a core group of three research assistants. Care team trios for one group of five to nine patients within a small geographically isolated pod were surveyed each time. The care team trio was surveyed individually regarding the patient’s risk status, the high-risk clinical criteria met, the presence and content of a mitigation plan, and planned patient interventions. The responses were compared for accuracy against the reference standard, which was defined as identification of high-risk patient status and development of the prevention and mitigation plan as completed by the PICU fellow or attending.
Data Analysis
Rates of agreement between the reference standard and individual members of the care team trio were evaluated via a calculation of proportions by care team role. The agreement between each care team trio member and the reference standard was compared with the nurse role performance using chi-square tests. Rates of concordance within the members of the care team trio were calculated via Light’s kappa for determination of high-risk status.11 Assuming a correct assessment of high-risk status of 62%,12 with a difference between groups of 10%, a sample size of 400 bedside provider trios gives a power of 85% at the P < .05 significance level for a two-sided chi-square test.
RESULTS
Between March 1, 2018, and July 11, 2019, 400 care team trios were surveyed. Seventy-three trios cared for patients designated high risk (Table 2 for N and proportions). Among all surveyed trios, 94% of nurses (reference), 95% of RTs (P = .4), and 87% of residents (P = .002) identified patient’s risk status correctly. Care trio member concordance for high-risk status was moderate agreement as assessed by a kappa of 0.57 (95% CI, 0.25-0.90).

Of the 73 high-risk patients, nurses correctly identified risk status for 82% (reference), RTs 85% (P = .7), and residents 67% (P = .04). For high-risk patients, nurses identified the presence of a mitigation plan for 98% of patients (reference), RTs 90% (P = .06), and residents 88% (P = .03). Among the care team members who correctly identified the presence of a mitigation plan, nurses were able to specify the correct plan for 83% of patients (reference), RTs for 68% (P = .09), and residents for 70% (P = .11; Figure).

When shared SA for high-risk patients was examined more closely, all three care team roles correctly identified the clinical reason for high-risk status for 32% of patients, with only one or two clinicians being correct for 53%. All three care team clinicians were incorrect for 15% of high-risk patients. Among trios with partial accuracy in which two of three care team members correctly identified a patient as high risk, we examined which care-member was most likely to be incorrect. Nurses incorrectly identified risk for 17% of patients (reference), RTs 19% (P = .8), and residents 64% (P < .0001).
DISCUSSION
Examining 400 care team trios, we found lower individual SA for residents, compared with nurses, regarding high-risk status, the reason for this status, and the presence of a mitigation plan. In all reported measures except for the content of mitigation plans, residents were significantly less correct than the bedside nurses while RTs performed similarly to bedside nurses throughout. In addition, there was only moderate agreement between care team roles, which shows further opportunities for improvement in shared SA. The disparities between care team roles are consistent with studies that suggest certain factors grounded in institutional culture and interpersonal dynamics, such as poor communication, can lead to breakdowns in shared knowledge.13,14 Communication issues demonstrate differences across care team roles14 and may provide insight into barriers to individual and shared SA throughout the care team.
In addition, the effects of patient load on SA needs further study. While our PICU nurses are commonly assigned to 1 to 2 patients, RTs care for 7 to 11 patients, and an on-call resident may be covering 15 to 20 patients during a high-census season. The increased patient load cannot serve as an excuse for the knowledge gap regarding high-risk status and mitigation plan, but may provide an opportunity to support residents and other medical providers through the use of clinical decision-support tools that indicate high-risk status and represent mitigation plans.12
This study has multiple limitations. First, while we based our survey tool on a communication assessment tool with prior validity evidence,10,12 our tool has not been used prior to this study. The adapted tool contained relevant categorizations of patient information, including explicit statement of patient status and planned treatment consistent with study definitions of SA, and has been used in the critical care setting previously.11 The survey tool used to measure SA in this study was locally designed and implemented only within the study unit, which could lead to decreased reliability and generalizability of the results to other units and institutions at large. Second, while the sample size for the primary measure (N = 400) was adequately powered because our baseline SA was higher than estimated, we had insufficient power for some subgroup analyses that can lead to type II errors. Third, care team trios may have been surveyed repeatedly on the same patient without adjustment in the results for repeated measures. However, as we surveyed on average only once a week and alternated areas of the PICU surveyed, it is unlikely that it affected results given that the most lengths of stay within the PICU range from 3 to 4 days. Finally, individual characteristics of patients were not collected for this work, and therefore, no adjustments or further analysis can be made on the effect of the patient characteristic on the care team role SA.
CONCLUSION
This study is the first to assess differences in individual and shared SA within a PICU by care team role. Efforts to expand on these findings should include investigation into the causes for the disparities in SA among care team roles for individual patients and among the care teams of high-risk and normal-risk patients. Given the association between increased SA and improved patient outcomes,4 future efforts should be structured to address care team role–specific gaps in SA because these may advance the quality of care in the pediatric inpatient setting.
1. Lyren A, Brilli RJ, Zieker K, Marino M, Muething S, Sharek PJ. Children’s hospitals’ solutions for patient safety collaborative impact on hospital-acquired harm. Pediatrics. 2017;140(3):e20163494. https://doi.org/10.1542/peds.2016-3494
2. Buist M, Bernard S, Nguyen TV, Moore G, Anderson J. Association between clinically abnormal observations and subsequent in-hospital mortality: a prospective study. Resuscitation. 2004;62(2):137-141. https://doi.org/10.1016/j.resuscitation.2004.03.005
3. Brady PW, Muething S, Kotagal U, et al. Improving situation awareness to reduce unrecognized clinical deterioration and serious safety events. Pediatrics. 2013;131(1):e298-308. https://doi.org/10.1542/peds.2012-1364
4. Endsley MR. Theoretical underpinnings of situation awareness: a critical review. In: Endsley MR, Garland DJ, eds. Situation Awareness Analysis and Measurement. Lawrence Erlbaum Associates; 2000.
5. Dewan M, Wolfe H, Lin R, et al. Impact of a safety huddle-based intervention on monitor alarm rates in low-acuity pediatric intensive care unit patients. J Hosp Med. 2017;12(8):652‐657. https://doi.org/10.12788/jhm.2782
6. Bonafide CP, Localio AR, Stemler S, et al. Safety huddle intervention for reducing physiologic monitor alarms: a hybrid effectiveness-implementation cluster randomized trial. J Hosp Med. 2018;13(9):609‐615. https://doi.org/10.12788/jhm.2956
7. Provost SM, Lanham HJ, Leykum LK, McDaniel RR Jr, Pugh J. Health care huddles: managing complexity to achieve high reliability. Health Care Manage Rev. 2015;40(1):2-12. https://doi.org/10.1097/HMR.0000000000000009
8. Goldenhar LM, Brady PW, Sutcliffe KM, Muething SE, Anderson JM. Huddling for high reliability and situation awareness. BMJ Qual Saf. 2013;22(11):899-906. https://doi.org/10.1136/bmjqs-2012-001467
9. Edelson DP, Retzer E, Weidman EK, et al. Patient acuity rating: quantifying clinical judgment regarding inpatient stability. J Hosp Med. 2011;6(8):475-479. https://doi.org/10.1002/jhm.886
10. Shahian DM, McEachern K, Rossi L, Chisari RG, Mort E. Large-scale implementation of the I-PASS handover system at an academic medical centre. BMJ Qual Saf. 2017;26(9):760-770. https://doi.org/10.1136/bmjqs-2016-006195
11. Gamer M, Lemon J, Fellows I, Singh P. Various Coefficients of Interrater Reliability and Agreement. January 26, 2019. Accessed January 24, 2020. http://cran.r-project.org/web/packages/irr/irr.pdf
12. Shelov E, Muthu N, Wolfe H, et al. Design and implementation of a pediatric ICU acuity scoring tool as clinical decision support. Appl Clin Inf. 2018;09(3):576-587. https://doi.org/10.1055/s-0038-1667122
13. Sutcliffe KM, Lewton E, Rosenthal MM. Communication failures: an insidious contributor to medical mishaps. Acad Med. 2004;79(2):186-194. https://doi.org/10.1097/00001888-200402000-00019
14. Sexton B, Thomas E, Helmreich RL. Error, stress, and teamwork in medicine and aviation: cross sectional surveys. BMJ. 2000;320(7237):745-749. doi:10.1136/bmj.320.7237.745
Reduction in serious pediatric medical errors has been achieved through sharing of best practices and structured collaboration.1 However, limited progress has been made in reducing complex, multifactorial events such as unrecognized and undertreated patient deterioration events.2 To address this critical gap, interventions to improve clinician situation awareness (SA) have increasingly been applied.3
SA is the ability to recognize and monitor cues regarding what is happening, create a comprehensive picture with available information, and extrapolate whether it indicates adverse developments either immediately or in the near future.4 Methods such as care team huddling5-8 and using standardized patient acuity scoring instruments9 increase SA shared across care team roles. Shared SA is the degree to which each team member possesses a common understanding of what is going on. A team is considered to have shared SA when all the individuals agree on both what is happening (accurate perception and comprehension) and what is going to happen in the future (correct projection). Shared SA for high-risk patients in the pediatric intensive care unit (PICU) has not previously been described and may be an opportunity to improve interprofessional team communication for the sickest patients. Shared SA for high-risk patient status is only one aspect of SA, but it facilitates team-based mitigation planning and is an important starting place for understanding opportunities to improve SA. The primary objective of this study was to measure and compare SA among care team roles regarding patients with high-risk status in the PICU.
METHODS
We conducted a prospective, cross-sectional study from March 2018 to July 2019 examining the individual and shared SA of patient care team trios: the nurse, respiratory therapist (RT), and pediatric resident. The Institutional Review Board at Cincinnati Children’s Hospital Medical Center (CCHMC) determined this study to be non–human-subjects research.
Setting
Research was conducted in the 35-bed PICU of CCHMC, a 500-bed academic free-standing quaternary care children’s hospital.
Participants
We conducted independent surveys of the nurse, RT, and pediatric resident (care team trio) caring for each patient regarding the patient’s clinical deterioration risk status. No patients or care team trios were excluded.
Reference Standard
In 2016, a local panel of experts derived clinical criteria to determine high-risk status for PICU patients, the definition of which, as well as other study terms, appears in Table 1. A PICU attending or fellow identifies a patient as “high risk” when these clinical criteria are met. A plan for prevention and mitigation is formulated and documented for high-risk patients by the PICU attending or fellow at two preexisting daily SA huddles. This plan includes prevention measures to take immediately, specific vital sign thresholds for early identification of deterioration, and guidance on which emergency medication order sets should be utilized to expedite treatment in the event of clinical decline. Dissemination of the care team’s plan is the responsibility of the PICU fellow with additional follow-up by the charge nurse to improve reliability. Identification of high-risk status and development of the prevention and mitigation plan, as completed by the PICU fellow or attending, served as the reference standard for this study.
Survey Instrument Development
The locally developed survey tool was modeled after a validated handoff communication instrument.10 The tool covered the patient’s risk status, which high-risk clinical criteria were met, the presence and content of a mitigation plan, and planned patient interventions (Appendix).
Data Collection
Care team trios were sampled weekly on weekdays during day and night shifts within 4 to 6 hours of the SA huddle by a core group of three research assistants. Care team trios for one group of five to nine patients within a small geographically isolated pod were surveyed each time. The care team trio was surveyed individually regarding the patient’s risk status, the high-risk clinical criteria met, the presence and content of a mitigation plan, and planned patient interventions. The responses were compared for accuracy against the reference standard, which was defined as identification of high-risk patient status and development of the prevention and mitigation plan as completed by the PICU fellow or attending.
Data Analysis
Rates of agreement between the reference standard and individual members of the care team trio were evaluated via a calculation of proportions by care team role. The agreement between each care team trio member and the reference standard was compared with the nurse role performance using chi-square tests. Rates of concordance within the members of the care team trio were calculated via Light’s kappa for determination of high-risk status.11 Assuming a correct assessment of high-risk status of 62%,12 with a difference between groups of 10%, a sample size of 400 bedside provider trios gives a power of 85% at the P < .05 significance level for a two-sided chi-square test.
RESULTS
Between March 1, 2018, and July 11, 2019, 400 care team trios were surveyed. Seventy-three trios cared for patients designated high risk (Table 2 for N and proportions). Among all surveyed trios, 94% of nurses (reference), 95% of RTs (P = .4), and 87% of residents (P = .002) identified patient’s risk status correctly. Care trio member concordance for high-risk status was moderate agreement as assessed by a kappa of 0.57 (95% CI, 0.25-0.90).
Of the 73 high-risk patients, nurses correctly identified risk status for 82% (reference), RTs 85% (P = .7), and residents 67% (P = .04). For high-risk patients, nurses identified the presence of a mitigation plan for 98% of patients (reference), RTs 90% (P = .06), and residents 88% (P = .03). Among the care team members who correctly identified the presence of a mitigation plan, nurses were able to specify the correct plan for 83% of patients (reference), RTs for 68% (P = .09), and residents for 70% (P = .11; Figure).
When shared SA for high-risk patients was examined more closely, all three care team roles correctly identified the clinical reason for high-risk status for 32% of patients, with only one or two clinicians being correct for 53%. All three care team clinicians were incorrect for 15% of high-risk patients. Among trios with partial accuracy in which two of three care team members correctly identified a patient as high risk, we examined which care-member was most likely to be incorrect. Nurses incorrectly identified risk for 17% of patients (reference), RTs 19% (P = .8), and residents 64% (P < .0001).
DISCUSSION
Examining 400 care team trios, we found lower individual SA for residents, compared with nurses, regarding high-risk status, the reason for this status, and the presence of a mitigation plan. In all reported measures except for the content of mitigation plans, residents were significantly less correct than the bedside nurses while RTs performed similarly to bedside nurses throughout. In addition, there was only moderate agreement between care team roles, which shows further opportunities for improvement in shared SA. The disparities between care team roles are consistent with studies that suggest certain factors grounded in institutional culture and interpersonal dynamics, such as poor communication, can lead to breakdowns in shared knowledge.13,14 Communication issues demonstrate differences across care team roles14 and may provide insight into barriers to individual and shared SA throughout the care team.
In addition, the effects of patient load on SA needs further study. While our PICU nurses are commonly assigned to 1 to 2 patients, RTs care for 7 to 11 patients, and an on-call resident may be covering 15 to 20 patients during a high-census season. The increased patient load cannot serve as an excuse for the knowledge gap regarding high-risk status and mitigation plan, but may provide an opportunity to support residents and other medical providers through the use of clinical decision-support tools that indicate high-risk status and represent mitigation plans.12
This study has multiple limitations. First, while we based our survey tool on a communication assessment tool with prior validity evidence,10,12 our tool has not been used prior to this study. The adapted tool contained relevant categorizations of patient information, including explicit statement of patient status and planned treatment consistent with study definitions of SA, and has been used in the critical care setting previously.11 The survey tool used to measure SA in this study was locally designed and implemented only within the study unit, which could lead to decreased reliability and generalizability of the results to other units and institutions at large. Second, while the sample size for the primary measure (N = 400) was adequately powered because our baseline SA was higher than estimated, we had insufficient power for some subgroup analyses that can lead to type II errors. Third, care team trios may have been surveyed repeatedly on the same patient without adjustment in the results for repeated measures. However, as we surveyed on average only once a week and alternated areas of the PICU surveyed, it is unlikely that it affected results given that the most lengths of stay within the PICU range from 3 to 4 days. Finally, individual characteristics of patients were not collected for this work, and therefore, no adjustments or further analysis can be made on the effect of the patient characteristic on the care team role SA.
CONCLUSION
This study is the first to assess differences in individual and shared SA within a PICU by care team role. Efforts to expand on these findings should include investigation into the causes for the disparities in SA among care team roles for individual patients and among the care teams of high-risk and normal-risk patients. Given the association between increased SA and improved patient outcomes,4 future efforts should be structured to address care team role–specific gaps in SA because these may advance the quality of care in the pediatric inpatient setting.
1. Lyren A, Brilli RJ, Zieker K, Marino M, Muething S, Sharek PJ. Children’s hospitals’ solutions for patient safety collaborative impact on hospital-acquired harm. Pediatrics. 2017;140(3):e20163494. https://doi.org/10.1542/peds.2016-3494
2. Buist M, Bernard S, Nguyen TV, Moore G, Anderson J. Association between clinically abnormal observations and subsequent in-hospital mortality: a prospective study. Resuscitation. 2004;62(2):137-141. https://doi.org/10.1016/j.resuscitation.2004.03.005
3. Brady PW, Muething S, Kotagal U, et al. Improving situation awareness to reduce unrecognized clinical deterioration and serious safety events. Pediatrics. 2013;131(1):e298-308. https://doi.org/10.1542/peds.2012-1364
4. Endsley MR. Theoretical underpinnings of situation awareness: a critical review. In: Endsley MR, Garland DJ, eds. Situation Awareness Analysis and Measurement. Lawrence Erlbaum Associates; 2000.
5. Dewan M, Wolfe H, Lin R, et al. Impact of a safety huddle-based intervention on monitor alarm rates in low-acuity pediatric intensive care unit patients. J Hosp Med. 2017;12(8):652‐657. https://doi.org/10.12788/jhm.2782
6. Bonafide CP, Localio AR, Stemler S, et al. Safety huddle intervention for reducing physiologic monitor alarms: a hybrid effectiveness-implementation cluster randomized trial. J Hosp Med. 2018;13(9):609‐615. https://doi.org/10.12788/jhm.2956
7. Provost SM, Lanham HJ, Leykum LK, McDaniel RR Jr, Pugh J. Health care huddles: managing complexity to achieve high reliability. Health Care Manage Rev. 2015;40(1):2-12. https://doi.org/10.1097/HMR.0000000000000009
8. Goldenhar LM, Brady PW, Sutcliffe KM, Muething SE, Anderson JM. Huddling for high reliability and situation awareness. BMJ Qual Saf. 2013;22(11):899-906. https://doi.org/10.1136/bmjqs-2012-001467
9. Edelson DP, Retzer E, Weidman EK, et al. Patient acuity rating: quantifying clinical judgment regarding inpatient stability. J Hosp Med. 2011;6(8):475-479. https://doi.org/10.1002/jhm.886
10. Shahian DM, McEachern K, Rossi L, Chisari RG, Mort E. Large-scale implementation of the I-PASS handover system at an academic medical centre. BMJ Qual Saf. 2017;26(9):760-770. https://doi.org/10.1136/bmjqs-2016-006195
11. Gamer M, Lemon J, Fellows I, Singh P. Various Coefficients of Interrater Reliability and Agreement. January 26, 2019. Accessed January 24, 2020. http://cran.r-project.org/web/packages/irr/irr.pdf
12. Shelov E, Muthu N, Wolfe H, et al. Design and implementation of a pediatric ICU acuity scoring tool as clinical decision support. Appl Clin Inf. 2018;09(3):576-587. https://doi.org/10.1055/s-0038-1667122
13. Sutcliffe KM, Lewton E, Rosenthal MM. Communication failures: an insidious contributor to medical mishaps. Acad Med. 2004;79(2):186-194. https://doi.org/10.1097/00001888-200402000-00019
14. Sexton B, Thomas E, Helmreich RL. Error, stress, and teamwork in medicine and aviation: cross sectional surveys. BMJ. 2000;320(7237):745-749. doi:10.1136/bmj.320.7237.745
© 2020 Society of Hospital Medicine
Safety Huddle Intervention for Reducing Physiologic Monitor Alarms: A Hybrid Effectiveness-Implementation Cluster Randomized Trial
Physiologic monitor alarms occur frequently in the hospital environment, with average rates on pediatric wards between 42 and 155 alarms per monitored patient-day.1 However, average rates do not depict the full story, because only 9%–25% of patients are responsible for most alarms on inpatient wards.1,2 In addition, only 0.5%–1% of alarms on pediatric wards warrant action.3,4 Downstream consequences of high alarm rates include interruptions5,6 and alarm fatigue.3,4,7
Alarm customization, the process of reviewing individual patients’ alarm data and using that data to implement patient-specific alarm reduction interventions, has emerged as a potential approach to unit-wide alarm management.8-11 Potential customizations include broadening alarm thresholds, instituting delays between the time the alarm condition is met and the time the alarm sounds, and changing electrodes.8-11 However, the workflows within which to identify the patients who will benefit from customization, make decisions about how to customize, and implement customizations have not been delineated.
Safety huddles are brief structured discussions among physicians, nurses, and other staff aiming to identify and mitigate threats to patient safety.11-13 In this study, we aimed to evaluate the influence of a safety huddle-based alarm intervention strategy targeting high alarm pediatric ward patients on (a) unit-level alarm rates and (b) patient-level alarm rates, as well as to (c) evaluate implementation outcomes. We hypothesized that patients discussed in huddles would have greater reductions in alarm rates in the 24 hours following their huddle than patients who were not discussed. Given that most alarms are generated by a small fraction of patients,1,2 we hypothesized that patient-level reductions would translate to unit-level reductions.
METHODS
Human Subject Protection
The Institutional Review Board of Children’s Hospital of Philadelphia approved this study with a waiver of informed consent. We registered the study at ClinicalTrials.gov (identifier NCT02458872). The original protocol is available as an Online Supplement.
Design and Framework

For our secondary effectiveness outcome evaluating the effect of the intervention on the alarm rates of the individual patients discussed in huddles, we used a cohort design embedded within the trial to analyze patient-specific alarm data collected only on randomly selected “intensive data collection days,” described below and in Figure 1.
Setting and Subjects
All patients hospitalized on 8 units that admit general pediatric and medical subspecialty patients at Children’s Hospital of Philadelphia between June 15, 2015 and May 8, 2016 were included in the primary (unit-level) analysis. Every patient’s bedside included a General Electric Dash 3000 physiologic monitor. Decisions to monitor patients were made by physicians and required orders. Default alarm settings are available in Supplementary Table 1; these settings required orders to change.
All 8 units were already convening scheduled safety huddles led by the charge nurse each day. All nurses and at least one resident were expected to attend; attending physicians and fellows were welcome but not expected to attend. Huddles focused on discussing safety concerns and patient flow. None of the preexisting huddles included alarm discussion.
Intervention
For each nonholiday weekday, we generated customized paper-based alarm huddle data “dashboards” (Supplementary Figure 1) displaying data from the patients (up to a maximum of 4) on each intervention unit with the highest numbers of high-acuity alarms (“crisis” and “warning” audible alarms, see Supplementary Table 2 for detailed listing of alarm types) in the preceding 4 hours by reviewing data from the monitor network using BedMasterEx v4.2 (Excel Medical Electronics). Dashboards listed the most frequent types of alarms, alarm settings, and included a script for discussing the alarms with checkboxes to indicate changes agreed upon by the team during the huddle. Patients with fewer than 20 alarms in the preceding 4h were not included; thus, sometimes fewer than 4 patients’ data were available for discussion. We hand-delivered dashboards to the charge nurses leading huddles, and they facilitated the multidisciplinary alarm discussions focused on reviewing alarm data and customizing settings to reduce unnecessary alarms.
Study Periods
The study had 3 periods as shown in Supplementary Figure 2: (1) 16-week baseline data collection, (2) phased intervention implementation during which we serially spent 2-8 weeks on each of the 4 intervention units implementing the intervention, and (3) 16-week postimplementation data collection.
Outcomes
The primary effectiveness outcome was the change in unit-level alarms per patient-day between the baseline and postimplementation periods in intervention versus control units, with all patients on the units included. The secondary effectiveness outcome (analyzed using the embedded cohort design) was the change in individual patient-level alarms between the 24 hours leading up to a huddle and the 24 hours following huddles in patients who were versus patients who were not discussed in huddles.
Implementation outcomes included adoption and fidelity measures. To measure adoption (defined as “intention to try” the intervention),16 we measured the frequency of discussions attended by patients’ nurses and physicians. We evaluated 3 elements of fidelity: adherence, dose, and quality of delivery.17 We measured adherence as the incorporation of alarm discussion into huddles when there were eligible patients to discuss. We measured dose as the average number of patients discussed on each unit per calendar day during the postimplementation period. We measured quality of delivery as the extent to which changes to monitoring that were agreed upon in the huddles were made at the bedside.
Safety Measures
To surveil for unintended consequences of reduced monitoring, we screened the hospital’s rapid response and code blue team database weekly for any events in patients previously discussed in huddles that occurred between huddle and hospital discharge. We reviewed charts to determine if the events were related to the intervention.
Randomization
Prior to randomization, the 8 units were divided into pairs based on participation in hospital-wide Joint Commission alarm management activities, use of alarm middleware that relayed detailed alarm information to nurses’ mobile phones, and baseline alarm rates. One unit in each pair was randomized to intervention and the other to control by coin flip.
Data Collection
We used Research Electronic Data Capture (REDCap)18 database tools.
Data for Unit-Level Analyses
We captured all alarms occurring on the study units during the study period using data from BedMasterEx. We obtained census data accurate to the hour from the Clinical Data Warehouse.
Data Captured in All Huddles
During each huddle, we collected the number of patients whose alarms were discussed, patient characteristics, presence of nurses and physicians, and monitoring changes agreed upon. We then followed up 4 hours later to determine if changes were made at the bedside by examining monitor settings.
Data Captured Only During Intensive Data Collection Days
We randomly selected 1 day during each of the 16 weeks of the postimplementation period to obtain additional patient-level data. On each intensive data collection day, the 4 monitored patients on each intervention and control unit with the most high-acuity alarms in the 4 hours prior to huddles occurring — regardless of whether or not these patients were later discussed in huddles — were identified for data collection. On these dates, a member of the research team reviewed each patient’s alarm counts in 4-hour blocks during the 24 hours before and after the huddle. Given that the huddles were not always at the same time every day (ranging between 10:00 and 13:00), we operationally set the huddle time as 12:00 for all units.
Data Analysis
We used Stata/SE 14.2 for all analyses.
Unit-Level Alarm Rates
To compare unit-level rates, we performed an interrupted time series analysis using segmented (piecewise) regression to evaluate the impact of the intervention.19,20 We used a multivariable generalized estimating equation model with the negative binomial distribution21 and clustering by unit. We bootstrapped the model and generated percentile-based 95% confidence intervals. We then used the model to estimate the alarm rate difference in differences between the baseline data collection period and the postimplementation data collection period for intervention versus control units.
Patient-Level Alarm Rates
In contrast to unit-level analysis, we used an embedded cohort design to model the change in individual patients’ alarms between the 24 hours leading up to huddles and the 24 hours following huddles in patients who were versus patients who were not discussed in huddles. The analysis was restricted to the patients included in intensive data collection days. We performed bootstrapped linear regression and generated percentile-based 95% confidence intervals using the difference in 4-hour block alarm rate between pre- and posthuddle as the outcome. We clustered within patients. We stratified by unit and preceding alarm rate. We modeled the alarm rate difference between the 24-hour prehuddle and the 24-hour posthuddle for huddled and nonhuddled patients and the difference in differences between exposure groups.
Implementation Outcomes
We summarized adoption and fidelity using proportions.
RESULTS
Alarm dashboards informed 580 structured alarm discussions during 353 safety huddles (huddles often included discussion of more than one patient).
Unit-Level Alarm Rates
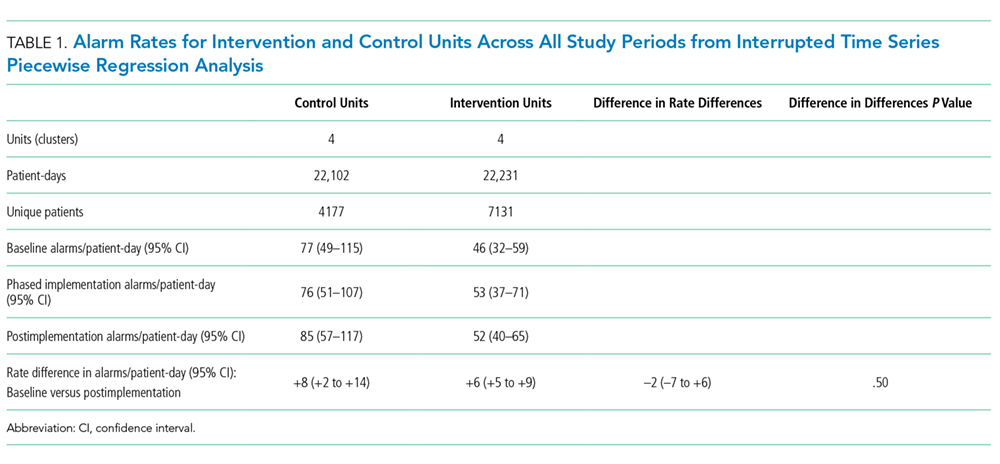
Visually, alarm rates over time on each individual unit appeared flat despite the intervention (Supplementary Figure 3). Using piecewise regression, we found that intervention and control units had small increases in alarm rates between the baseline and postimplementation periods with a nonsignificant difference in these differences between the control and intervention groups (Table 1).
Patient-Level Alarm Rates
We then restricted the analysis to the patients whose data were collected during intensive data collection days. We obtained data from 1974 pre-post pairs of 4-hour time periods.
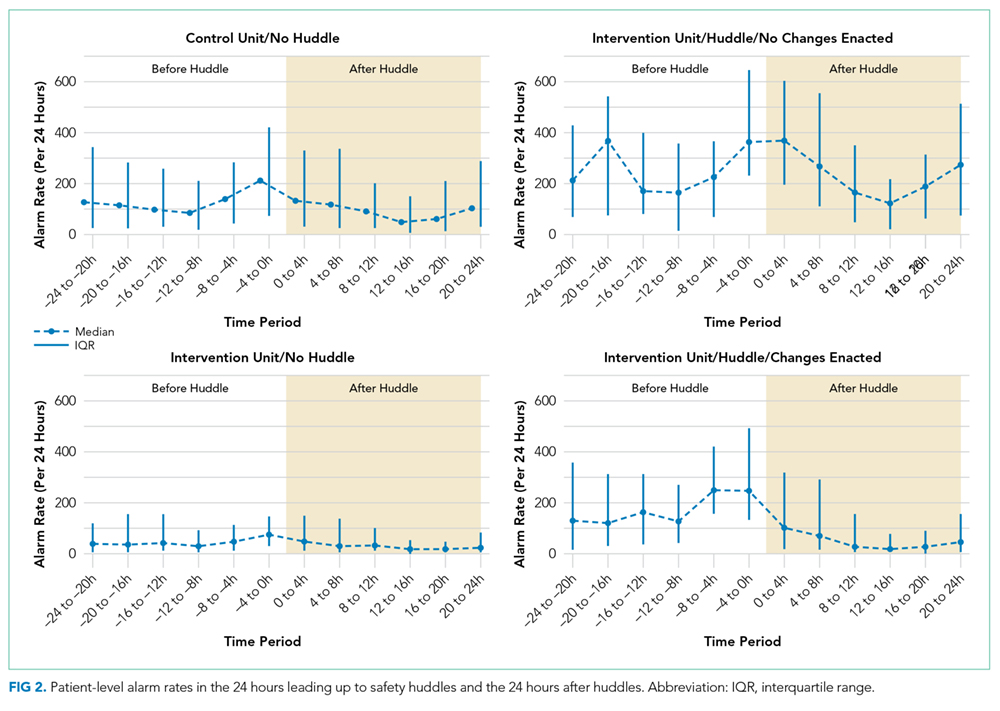

Implementation Outcomes
Adoption
The patient’s nurse attended 482 of the 580 huddle discussions (83.1%), and at least one of the patient’s physicians (resident, fellow, or attending) attended 394 (67.9%).
Fidelity: Adherence
In addition to the 353 huddles that included alarm discussion, 123 instances had no patients with ≥20 high acuity alarms in the preceding 4 hours therefore, no data were brought to the huddle. There were an additional 30 instances when a huddle did not occur or there was no alarm discussion in the huddle despite data being available. Thus, adherence occurred in 353 of 383 huddles (92.2%).
Fidelity: Dose
During the 112 calendar day postimplementation period, 379 patients’ alarms were discussed in huddles for an average intervention dose of 0.85 discussions per unit per calendar day.
Fidelity: Quality of Delivery
In 362 of the 580 huddle discussions (62.4%), changes were agreed upon. The most frequently agreed upon changes were discontinuing monitoring (32.0%), monitoring only when asleep or unsupervised (23.8%), widening heart rate parameters (12.7%), changing electrocardiographic leads/wires (8.6%), changing the pulse oximetry probe (8.0%), and increasing the delay time between when oxygen desaturation was detected and when the alarm was generated (4.7%). Of the huddle discussions with changes agreed upon, 346 (95.6%) changes were enacted at the bedside.
Safety Measures
There were 0 code blue events and 26 rapid response team activations for patients discussed in huddles. None were related to the intervention.
Discussion
Our main finding was that the huddle strategy was effective in safely reducing the burden of alarms for the high alarm pediatric ward patients whose alarms were discussed, but it did not reduce unit-level alarm rates. Implementation outcomes explained this finding. Although adoption and adherence were high, the overall dose of the intervention was low.
We also found that 36% of alarms had technical causes, the majority of which were related to the pulse oximetry probe detecting that it was off the patient or searching for a pulse. Although these alarms are likely perceived differently by clinical staff (most monitors generate different sounds for technical alarms), they still represent a substantial contribution to the alarm environment. Minimizing them in patients who must remain continuously monitored requires more intensive effort to implement other types of interventions than the main focus of this study, such as changing pulse oximetry probes and electrocardiographic leads/wires.
In one-third of huddles, monitoring was simply discontinued. We observed in many cases that, while these patients may have had legitimate indications for monitoring upon admission, their conditions had improved; after brief multidisciplinary discussion, the team concluded that monitoring was no longer indicated. This observation may suggest interventions at the ordering phase, such as prespecifying a monitoring duration.22,23
This study’s findings were consistent with a quasi-experimental study of safety huddle-based alarm discussions in a pediatric intensive care unit that showed a patient-level reduction of 116 alarms per patient-day in those discussed in huddles relative to controls.11 A smaller quasi-experimental study of implementing a nighttime alarm “ward round” in an adult intensive care unit showed a significant reduction in unit-level alarms/patient-day from 168 to 84.9 In a quality improvement report, a monitoring care process bundle that included discussion of alarm settings showed a reduction in unit-level alarms/patient-day from 180 to 40.10 Our study strengthens the body of literature using a cluster-randomized design, measuring patient- and unit-level outcomes, and including implementation outcomes that explain effectiveness findings.
On a hypothetical unit similar to the ones we studied with 20 occupied beds and 60 alarms/patient-day, an average of 1200 alarms would occur each day. We delivered the intervention to 0.85 patients per day. Changes were made at the bedside in 60% of those with the intervention delivered, and those patients had a difference in differences of 119 fewer alarms compared with the comparison patients on control units. In this scenario, we could expect a relative reduction of 0.85 x 0.60 x 119 = 61 fewer alarms/day total on the unit or a 5% reduction. However, that estimated reduction did not account for the arrival of new patients with high alarm rates, which certainly occurred in this study and explained the lack of effect at the unit level.
As described above, the intervention dose was low, which translated into a lack of effect at the unit level despite a strong effect at the patient level. This result was partly due to the manual process required to produce the alarm dashboards that restricted their availability to nonholiday weekdays. The study was performed at one hospital, which limited generalizability. The study hospital was already convening daily safety huddles that were well attended by nurses and physicians. Other hospitals without existing huddle structures may face challenges in implementing similar multidisciplinary alarm discussions. In addition, the study design was randomized at the unit (rather than patient) level, which limited our ability to balance potential confounders at the patient level.
Conclusion
A safety huddle intervention strategy to drive alarm customization was effective in safely reducing alarms for individual children discussed. However, unit-level alarm rates were not affected by the intervention due to a low dose. Leaders of efforts to reduce alarms should consider beginning with passive interventions (such as changes to default settings and alarm delays) and use huddle-based discussion as a second-line intervention to address remaining patients with high alarm rates.
Acknowledgments
We thank Matthew MacMurchy, BA, for his assistance with data collection.
Funding/Support
This study was supported by a Young Investigator Award (Bonafide, PI) from the Academic Pediatric Association.
Role of the Funder/Sponsor
The Academic Pediatric Association had no role in the design or conduct of the study; collection, management, analysis, or interpretation of the data; preparation, review, or approval of the manuscript; or decision to submit for publication.
Disclosures
No relevant financial activities, aside from the grant funding from the Academic Pediatric Association listed above, are reported.
1. Schondelmeyer AC, Brady PW, Goel VV, et al. Physiologic monitor alarm rates at 5 children’s hospitals. J Hosp Med. 2018;In press. PubMed
2. Cvach M, Kitchens M, Smith K, Harris P, Flack MN. Customizing alarm limits based on specific needs of patients. Biomed Instrum Technol. 2017;51(3):227-234. PubMed
3. Bonafide CP, Lin R, Zander M, et al. Association between exposure to nonactionable physiologic monitor alarms and response time in a children’s hospital. J Hosp Med. 2015;10(6):345-351. PubMed
4. Bonafide CP, Localio AR, Holmes JH, et al. Video analysis of factors associated with response time to physiologic monitor alarms in a children’s hospital. JAMA Pediatr. 2017;171(6):524-531. PubMed
5. Lange K, Nowak M, Zoller R, Lauer W. Boundary conditions for safe detection of clinical alarms: An observational study to identify the cognitive and perceptual demands on an Intensive Care Unit. In: In: D. de Waard, K.A. Brookhuis, A. Toffetti, A. Stuiver, C. Weikert, D. Coelho, D. Manzey, A.B. Ünal, S. Röttger, and N. Merat (Eds.) Proceedings of the Human Factors and Ergonomics Society Europe Chapter 2015 Annual Conference. Groningen, Netherlands; 2016.
6. Westbrook JI, Li L, Hooper TD, Raban MZ, Middleton S, Lehnbom EC. Effectiveness of a ‘Do not interrupt’ bundled intervention to reduce interruptions during medication administration: a cluster randomised controlled feasibility study. BMJ Qual Saf. 2017;26:734-742. PubMed
7. Chopra V, McMahon LF Jr. Redesigning hospital alarms for patient safety: alarmed and potentially dangerous. JAMA. 2014;311(12):1199-1200. PubMed
8. Turmell JW, Coke L, Catinella R, Hosford T, Majeski A. Alarm fatigue: use of an evidence-based alarm management strategy. J Nurs Care Qual. 2017;32(1):47-54. PubMed
9. Koerber JP, Walker J, Worsley M, Thorpe CM. An alarm ward round reduces the frequency of false alarms on the ICU at night. J Intensive Care Soc. 2011;12(1):75-76.
10. Dandoy CE, Davies SM, Flesch L, et al. A team-based approach to reducing cardiac monitor alarms. Pediatrics. 2014;134(6):e1686-1694. PubMed
11. Dewan M, Wolfe H, Lin R, et al. Impact of a safety huddle–based intervention on monitor alarm rates in low-acuity pediatric intensive care unit patients. J Hosp Med. 2017;12(8):652-657. PubMed
12. Goldenhar LM, Brady PW, Sutcliffe KM, Muething SE. Huddling for high reliability and situation awareness. BMJ Qual Saf. 2013;22(11):899-906. PubMed
13. Brady PW, Muething S, Kotagal U, et al. Improving situation awareness to reduce unrecognized clinical deterioration and serious safety events. Pediatrics. 2013;131:e298-308. PubMed
14. Curran GM, Bauer M, Mittman B, Pyne JM, Stetler C. Effectiveness-implementation hybrid designs: combining elements of clinical effectiveness and implementation research to enhance public health impact. Med Care. 2012;50(3):217-226. PubMed
15. Damschroder LJ, Aron DC, Keith RE, Kirsh SR, Alexander JA, Lowery JC. Fostering implementation of health services research findings into practice: a consolidated framework for advancing implementation science. Implement Sci. 2009;4(1):50. PubMed
16. Proctor E, Silmere H, Raghavan R, et al. Outcomes for implementation research: conceptual distinctions, measurement challenges, and research agenda. Adm Policy Ment Health. 2011;38(2):65-76. PubMed
17. Allen JD, Linnan LA, Emmons KM. Fidelity and its relationship to implementation effectiveness, adaptation, and dissemination. In: Dissemination and Implementation Research in Health: Translating Science to Practice (Brownson RC, Proctor EK, Colditz GA Eds.). Oxford University Press; 2012:281-304.
18. Harris PA, Taylor R, Thielke R, Payne J, Gonzalez N, Conde JG. Research electronic data capture (REDCap)—a metadata-driven methodology and workflow process for providing translational research informatics support. J Biomed Inf. 2009;42:377-381. PubMed
19. Singer JD, Willett JB. Applied Longitudinal Data Analysis: Modeling Change and Event Occurrence. New York: Oxford University Press; 2003.
20. Wagner AK, Soumerai SB, Zhang F, Ross-Degnan D. Segmented regression analysis of interrupted time series studies in medication use research. J Clin Pharm Ther. 2002;27:299-309. PubMed
21. Gardner W, Mulvey EP, Shaw EC. Regression analyses of counts and rates: Poisson, overdispersed Poisson, and negative binomial models. Psychol Bull. 1995;118:392-404. PubMed
22. Dressler R, Dryer MM, Coletti C, Mahoney D, Doorey AJ. Altering overuse of cardiac telemetry in non-intensive care unit settings by hardwiring the use of American Heart Association guidelines. JAMA Intern Med. 2014;174(11):1852-1854. PubMed
23. Boggan JC, Navar-Boggan AM, Patel V, Schulteis RD, Simel DL. Reductions in telemetry order duration do not reduce telemetry utilization. J Hosp Med. 2014;9(12):795-796. PubMed
Physiologic monitor alarms occur frequently in the hospital environment, with average rates on pediatric wards between 42 and 155 alarms per monitored patient-day.1 However, average rates do not depict the full story, because only 9%–25% of patients are responsible for most alarms on inpatient wards.1,2 In addition, only 0.5%–1% of alarms on pediatric wards warrant action.3,4 Downstream consequences of high alarm rates include interruptions5,6 and alarm fatigue.3,4,7
Alarm customization, the process of reviewing individual patients’ alarm data and using that data to implement patient-specific alarm reduction interventions, has emerged as a potential approach to unit-wide alarm management.8-11 Potential customizations include broadening alarm thresholds, instituting delays between the time the alarm condition is met and the time the alarm sounds, and changing electrodes.8-11 However, the workflows within which to identify the patients who will benefit from customization, make decisions about how to customize, and implement customizations have not been delineated.
Safety huddles are brief structured discussions among physicians, nurses, and other staff aiming to identify and mitigate threats to patient safety.11-13 In this study, we aimed to evaluate the influence of a safety huddle-based alarm intervention strategy targeting high alarm pediatric ward patients on (a) unit-level alarm rates and (b) patient-level alarm rates, as well as to (c) evaluate implementation outcomes. We hypothesized that patients discussed in huddles would have greater reductions in alarm rates in the 24 hours following their huddle than patients who were not discussed. Given that most alarms are generated by a small fraction of patients,1,2 we hypothesized that patient-level reductions would translate to unit-level reductions.
METHODS
Human Subject Protection
The Institutional Review Board of Children’s Hospital of Philadelphia approved this study with a waiver of informed consent. We registered the study at ClinicalTrials.gov (identifier NCT02458872). The original protocol is available as an Online Supplement.
Design and Framework
For our secondary effectiveness outcome evaluating the effect of the intervention on the alarm rates of the individual patients discussed in huddles, we used a cohort design embedded within the trial to analyze patient-specific alarm data collected only on randomly selected “intensive data collection days,” described below and in Figure 1.
Setting and Subjects
All patients hospitalized on 8 units that admit general pediatric and medical subspecialty patients at Children’s Hospital of Philadelphia between June 15, 2015 and May 8, 2016 were included in the primary (unit-level) analysis. Every patient’s bedside included a General Electric Dash 3000 physiologic monitor. Decisions to monitor patients were made by physicians and required orders. Default alarm settings are available in Supplementary Table 1; these settings required orders to change.
All 8 units were already convening scheduled safety huddles led by the charge nurse each day. All nurses and at least one resident were expected to attend; attending physicians and fellows were welcome but not expected to attend. Huddles focused on discussing safety concerns and patient flow. None of the preexisting huddles included alarm discussion.
Intervention
For each nonholiday weekday, we generated customized paper-based alarm huddle data “dashboards” (Supplementary Figure 1) displaying data from the patients (up to a maximum of 4) on each intervention unit with the highest numbers of high-acuity alarms (“crisis” and “warning” audible alarms, see Supplementary Table 2 for detailed listing of alarm types) in the preceding 4 hours by reviewing data from the monitor network using BedMasterEx v4.2 (Excel Medical Electronics). Dashboards listed the most frequent types of alarms, alarm settings, and included a script for discussing the alarms with checkboxes to indicate changes agreed upon by the team during the huddle. Patients with fewer than 20 alarms in the preceding 4h were not included; thus, sometimes fewer than 4 patients’ data were available for discussion. We hand-delivered dashboards to the charge nurses leading huddles, and they facilitated the multidisciplinary alarm discussions focused on reviewing alarm data and customizing settings to reduce unnecessary alarms.
Study Periods
The study had 3 periods as shown in Supplementary Figure 2: (1) 16-week baseline data collection, (2) phased intervention implementation during which we serially spent 2-8 weeks on each of the 4 intervention units implementing the intervention, and (3) 16-week postimplementation data collection.
Outcomes
The primary effectiveness outcome was the change in unit-level alarms per patient-day between the baseline and postimplementation periods in intervention versus control units, with all patients on the units included. The secondary effectiveness outcome (analyzed using the embedded cohort design) was the change in individual patient-level alarms between the 24 hours leading up to a huddle and the 24 hours following huddles in patients who were versus patients who were not discussed in huddles.
Implementation outcomes included adoption and fidelity measures. To measure adoption (defined as “intention to try” the intervention),16 we measured the frequency of discussions attended by patients’ nurses and physicians. We evaluated 3 elements of fidelity: adherence, dose, and quality of delivery.17 We measured adherence as the incorporation of alarm discussion into huddles when there were eligible patients to discuss. We measured dose as the average number of patients discussed on each unit per calendar day during the postimplementation period. We measured quality of delivery as the extent to which changes to monitoring that were agreed upon in the huddles were made at the bedside.
Safety Measures
To surveil for unintended consequences of reduced monitoring, we screened the hospital’s rapid response and code blue team database weekly for any events in patients previously discussed in huddles that occurred between huddle and hospital discharge. We reviewed charts to determine if the events were related to the intervention.
Randomization
Prior to randomization, the 8 units were divided into pairs based on participation in hospital-wide Joint Commission alarm management activities, use of alarm middleware that relayed detailed alarm information to nurses’ mobile phones, and baseline alarm rates. One unit in each pair was randomized to intervention and the other to control by coin flip.
Data Collection
We used Research Electronic Data Capture (REDCap)18 database tools.
Data for Unit-Level Analyses
We captured all alarms occurring on the study units during the study period using data from BedMasterEx. We obtained census data accurate to the hour from the Clinical Data Warehouse.
Data Captured in All Huddles
During each huddle, we collected the number of patients whose alarms were discussed, patient characteristics, presence of nurses and physicians, and monitoring changes agreed upon. We then followed up 4 hours later to determine if changes were made at the bedside by examining monitor settings.
Data Captured Only During Intensive Data Collection Days
We randomly selected 1 day during each of the 16 weeks of the postimplementation period to obtain additional patient-level data. On each intensive data collection day, the 4 monitored patients on each intervention and control unit with the most high-acuity alarms in the 4 hours prior to huddles occurring — regardless of whether or not these patients were later discussed in huddles — were identified for data collection. On these dates, a member of the research team reviewed each patient’s alarm counts in 4-hour blocks during the 24 hours before and after the huddle. Given that the huddles were not always at the same time every day (ranging between 10:00 and 13:00), we operationally set the huddle time as 12:00 for all units.
Data Analysis
We used Stata/SE 14.2 for all analyses.
Unit-Level Alarm Rates
To compare unit-level rates, we performed an interrupted time series analysis using segmented (piecewise) regression to evaluate the impact of the intervention.19,20 We used a multivariable generalized estimating equation model with the negative binomial distribution21 and clustering by unit. We bootstrapped the model and generated percentile-based 95% confidence intervals. We then used the model to estimate the alarm rate difference in differences between the baseline data collection period and the postimplementation data collection period for intervention versus control units.
Patient-Level Alarm Rates
In contrast to unit-level analysis, we used an embedded cohort design to model the change in individual patients’ alarms between the 24 hours leading up to huddles and the 24 hours following huddles in patients who were versus patients who were not discussed in huddles. The analysis was restricted to the patients included in intensive data collection days. We performed bootstrapped linear regression and generated percentile-based 95% confidence intervals using the difference in 4-hour block alarm rate between pre- and posthuddle as the outcome. We clustered within patients. We stratified by unit and preceding alarm rate. We modeled the alarm rate difference between the 24-hour prehuddle and the 24-hour posthuddle for huddled and nonhuddled patients and the difference in differences between exposure groups.
Implementation Outcomes
We summarized adoption and fidelity using proportions.
RESULTS
Alarm dashboards informed 580 structured alarm discussions during 353 safety huddles (huddles often included discussion of more than one patient).
Unit-Level Alarm Rates
Visually, alarm rates over time on each individual unit appeared flat despite the intervention (Supplementary Figure 3). Using piecewise regression, we found that intervention and control units had small increases in alarm rates between the baseline and postimplementation periods with a nonsignificant difference in these differences between the control and intervention groups (Table 1).
Patient-Level Alarm Rates
We then restricted the analysis to the patients whose data were collected during intensive data collection days. We obtained data from 1974 pre-post pairs of 4-hour time periods.
Implementation Outcomes
Adoption
The patient’s nurse attended 482 of the 580 huddle discussions (83.1%), and at least one of the patient’s physicians (resident, fellow, or attending) attended 394 (67.9%).
Fidelity: Adherence
In addition to the 353 huddles that included alarm discussion, 123 instances had no patients with ≥20 high acuity alarms in the preceding 4 hours therefore, no data were brought to the huddle. There were an additional 30 instances when a huddle did not occur or there was no alarm discussion in the huddle despite data being available. Thus, adherence occurred in 353 of 383 huddles (92.2%).
Fidelity: Dose
During the 112 calendar day postimplementation period, 379 patients’ alarms were discussed in huddles for an average intervention dose of 0.85 discussions per unit per calendar day.
Fidelity: Quality of Delivery
In 362 of the 580 huddle discussions (62.4%), changes were agreed upon. The most frequently agreed upon changes were discontinuing monitoring (32.0%), monitoring only when asleep or unsupervised (23.8%), widening heart rate parameters (12.7%), changing electrocardiographic leads/wires (8.6%), changing the pulse oximetry probe (8.0%), and increasing the delay time between when oxygen desaturation was detected and when the alarm was generated (4.7%). Of the huddle discussions with changes agreed upon, 346 (95.6%) changes were enacted at the bedside.
Safety Measures
There were 0 code blue events and 26 rapid response team activations for patients discussed in huddles. None were related to the intervention.
Discussion
Our main finding was that the huddle strategy was effective in safely reducing the burden of alarms for the high alarm pediatric ward patients whose alarms were discussed, but it did not reduce unit-level alarm rates. Implementation outcomes explained this finding. Although adoption and adherence were high, the overall dose of the intervention was low.
We also found that 36% of alarms had technical causes, the majority of which were related to the pulse oximetry probe detecting that it was off the patient or searching for a pulse. Although these alarms are likely perceived differently by clinical staff (most monitors generate different sounds for technical alarms), they still represent a substantial contribution to the alarm environment. Minimizing them in patients who must remain continuously monitored requires more intensive effort to implement other types of interventions than the main focus of this study, such as changing pulse oximetry probes and electrocardiographic leads/wires.
In one-third of huddles, monitoring was simply discontinued. We observed in many cases that, while these patients may have had legitimate indications for monitoring upon admission, their conditions had improved; after brief multidisciplinary discussion, the team concluded that monitoring was no longer indicated. This observation may suggest interventions at the ordering phase, such as prespecifying a monitoring duration.22,23
This study’s findings were consistent with a quasi-experimental study of safety huddle-based alarm discussions in a pediatric intensive care unit that showed a patient-level reduction of 116 alarms per patient-day in those discussed in huddles relative to controls.11 A smaller quasi-experimental study of implementing a nighttime alarm “ward round” in an adult intensive care unit showed a significant reduction in unit-level alarms/patient-day from 168 to 84.9 In a quality improvement report, a monitoring care process bundle that included discussion of alarm settings showed a reduction in unit-level alarms/patient-day from 180 to 40.10 Our study strengthens the body of literature using a cluster-randomized design, measuring patient- and unit-level outcomes, and including implementation outcomes that explain effectiveness findings.
On a hypothetical unit similar to the ones we studied with 20 occupied beds and 60 alarms/patient-day, an average of 1200 alarms would occur each day. We delivered the intervention to 0.85 patients per day. Changes were made at the bedside in 60% of those with the intervention delivered, and those patients had a difference in differences of 119 fewer alarms compared with the comparison patients on control units. In this scenario, we could expect a relative reduction of 0.85 x 0.60 x 119 = 61 fewer alarms/day total on the unit or a 5% reduction. However, that estimated reduction did not account for the arrival of new patients with high alarm rates, which certainly occurred in this study and explained the lack of effect at the unit level.
As described above, the intervention dose was low, which translated into a lack of effect at the unit level despite a strong effect at the patient level. This result was partly due to the manual process required to produce the alarm dashboards that restricted their availability to nonholiday weekdays. The study was performed at one hospital, which limited generalizability. The study hospital was already convening daily safety huddles that were well attended by nurses and physicians. Other hospitals without existing huddle structures may face challenges in implementing similar multidisciplinary alarm discussions. In addition, the study design was randomized at the unit (rather than patient) level, which limited our ability to balance potential confounders at the patient level.
Conclusion
A safety huddle intervention strategy to drive alarm customization was effective in safely reducing alarms for individual children discussed. However, unit-level alarm rates were not affected by the intervention due to a low dose. Leaders of efforts to reduce alarms should consider beginning with passive interventions (such as changes to default settings and alarm delays) and use huddle-based discussion as a second-line intervention to address remaining patients with high alarm rates.
Acknowledgments
We thank Matthew MacMurchy, BA, for his assistance with data collection.
Funding/Support
This study was supported by a Young Investigator Award (Bonafide, PI) from the Academic Pediatric Association.
Role of the Funder/Sponsor
The Academic Pediatric Association had no role in the design or conduct of the study; collection, management, analysis, or interpretation of the data; preparation, review, or approval of the manuscript; or decision to submit for publication.
Disclosures
No relevant financial activities, aside from the grant funding from the Academic Pediatric Association listed above, are reported.
1. Schondelmeyer AC, Brady PW, Goel VV, et al. Physiologic monitor alarm rates at 5 children’s hospitals. J Hosp Med. 2018;In press. PubMed
2. Cvach M, Kitchens M, Smith K, Harris P, Flack MN. Customizing alarm limits based on specific needs of patients. Biomed Instrum Technol. 2017;51(3):227-234. PubMed
3. Bonafide CP, Lin R, Zander M, et al. Association between exposure to nonactionable physiologic monitor alarms and response time in a children’s hospital. J Hosp Med. 2015;10(6):345-351. PubMed
4. Bonafide CP, Localio AR, Holmes JH, et al. Video analysis of factors associated with response time to physiologic monitor alarms in a children’s hospital. JAMA Pediatr. 2017;171(6):524-531. PubMed
5. Lange K, Nowak M, Zoller R, Lauer W. Boundary conditions for safe detection of clinical alarms: An observational study to identify the cognitive and perceptual demands on an Intensive Care Unit. In: In: D. de Waard, K.A. Brookhuis, A. Toffetti, A. Stuiver, C. Weikert, D. Coelho, D. Manzey, A.B. Ünal, S. Röttger, and N. Merat (Eds.) Proceedings of the Human Factors and Ergonomics Society Europe Chapter 2015 Annual Conference. Groningen, Netherlands; 2016.
6. Westbrook JI, Li L, Hooper TD, Raban MZ, Middleton S, Lehnbom EC. Effectiveness of a ‘Do not interrupt’ bundled intervention to reduce interruptions during medication administration: a cluster randomised controlled feasibility study. BMJ Qual Saf. 2017;26:734-742. PubMed
7. Chopra V, McMahon LF Jr. Redesigning hospital alarms for patient safety: alarmed and potentially dangerous. JAMA. 2014;311(12):1199-1200. PubMed
8. Turmell JW, Coke L, Catinella R, Hosford T, Majeski A. Alarm fatigue: use of an evidence-based alarm management strategy. J Nurs Care Qual. 2017;32(1):47-54. PubMed
9. Koerber JP, Walker J, Worsley M, Thorpe CM. An alarm ward round reduces the frequency of false alarms on the ICU at night. J Intensive Care Soc. 2011;12(1):75-76.
10. Dandoy CE, Davies SM, Flesch L, et al. A team-based approach to reducing cardiac monitor alarms. Pediatrics. 2014;134(6):e1686-1694. PubMed
11. Dewan M, Wolfe H, Lin R, et al. Impact of a safety huddle–based intervention on monitor alarm rates in low-acuity pediatric intensive care unit patients. J Hosp Med. 2017;12(8):652-657. PubMed
12. Goldenhar LM, Brady PW, Sutcliffe KM, Muething SE. Huddling for high reliability and situation awareness. BMJ Qual Saf. 2013;22(11):899-906. PubMed
13. Brady PW, Muething S, Kotagal U, et al. Improving situation awareness to reduce unrecognized clinical deterioration and serious safety events. Pediatrics. 2013;131:e298-308. PubMed
14. Curran GM, Bauer M, Mittman B, Pyne JM, Stetler C. Effectiveness-implementation hybrid designs: combining elements of clinical effectiveness and implementation research to enhance public health impact. Med Care. 2012;50(3):217-226. PubMed
15. Damschroder LJ, Aron DC, Keith RE, Kirsh SR, Alexander JA, Lowery JC. Fostering implementation of health services research findings into practice: a consolidated framework for advancing implementation science. Implement Sci. 2009;4(1):50. PubMed
16. Proctor E, Silmere H, Raghavan R, et al. Outcomes for implementation research: conceptual distinctions, measurement challenges, and research agenda. Adm Policy Ment Health. 2011;38(2):65-76. PubMed
17. Allen JD, Linnan LA, Emmons KM. Fidelity and its relationship to implementation effectiveness, adaptation, and dissemination. In: Dissemination and Implementation Research in Health: Translating Science to Practice (Brownson RC, Proctor EK, Colditz GA Eds.). Oxford University Press; 2012:281-304.
18. Harris PA, Taylor R, Thielke R, Payne J, Gonzalez N, Conde JG. Research electronic data capture (REDCap)—a metadata-driven methodology and workflow process for providing translational research informatics support. J Biomed Inf. 2009;42:377-381. PubMed
19. Singer JD, Willett JB. Applied Longitudinal Data Analysis: Modeling Change and Event Occurrence. New York: Oxford University Press; 2003.
20. Wagner AK, Soumerai SB, Zhang F, Ross-Degnan D. Segmented regression analysis of interrupted time series studies in medication use research. J Clin Pharm Ther. 2002;27:299-309. PubMed
21. Gardner W, Mulvey EP, Shaw EC. Regression analyses of counts and rates: Poisson, overdispersed Poisson, and negative binomial models. Psychol Bull. 1995;118:392-404. PubMed
22. Dressler R, Dryer MM, Coletti C, Mahoney D, Doorey AJ. Altering overuse of cardiac telemetry in non-intensive care unit settings by hardwiring the use of American Heart Association guidelines. JAMA Intern Med. 2014;174(11):1852-1854. PubMed
23. Boggan JC, Navar-Boggan AM, Patel V, Schulteis RD, Simel DL. Reductions in telemetry order duration do not reduce telemetry utilization. J Hosp Med. 2014;9(12):795-796. PubMed
© 2018 Society of Hospital Medicine
Impact of a Safety Huddle–Based Intervention on Monitor Alarm Rates in Low-Acuity Pediatric Intensive Care Unit Patients
BACKGROUND
Physiologic monitors are intended to prevent cardiac and respiratory arrest by generating alarms to alert clinicians to signs of instability. To minimize the probability that monitors will miss signs of deterioration, alarm algorithms and default parameters are often set to maximize sensitivity while sacrificing specificity.1 As a result, monitors generate large numbers of nonactionable alarms—alarms that are either invalid and do not accurately represent the physiologic status of the patient or are valid but do not warrant clinical intervention.2 Prior research has demonstrated that the pediatric intensive care unit (PICU) is responsible for a higher proportion of alarms than pediatric wards3 and a large proportion of these alarms, 87% - 97%, are nonactionable.4-8 In national surveys of healthcare staff, respondents report that high alarm rates interrupt patient care and can lead clinicians to disable alarms entirely.9 Recent research has supported this, demonstrating that nurses who are exposed to higher numbers of alarms have slower response times to alarms.4,10 In an attempt to mitigate safety risks, the Joint Commission in 2012 issued recommendations for hospitals to (a) establish guidelines for tailoring alarm settings and limits for individual patients and (b) identify situations in which alarms are not clinically necessary.11
In order to address these recommendations within our PICU, we sought to evaluate the impact of a focused physiologic monitor alarm reduction intervention integrated into safety huddles. Safety huddles are brief, structured discussions among physicians, nurses, and other staff aiming to identify safety concerns.12 Huddles offer an appropriate forum for reviewing alarm data and identifying patients whose high alarm rates may necessitate safe tailoring of alarm limits. Pilot data demonstrating high alarm rates among low-acuity PICU patients led us to hypothesize that low-acuity, high-alarm PICU patients would be a safe and effective target for an alarm huddle-based intervention.
In this study, we aimed to measure the impact of a structured safety huddle review of low-acuity PICU patients with high rates of priority alarms who were randomized to intervention compared with other low-acuity, high-alarm, concurrent, and historical control patients in the PICU.
METHODS
Study Definitions
Priority alarm activation rate. We conceptualized priority alarms as any alarm for a clinical condition that requires a timely response to determine if intervention is necessary to save a patient’s life,4 yet little empirical data support its existence in the hospital. We operationally defined these alarms on the General Electric Solar physiologic monitoring devices as any potentially life-threatening events including lethal arrhythmias (asystole, ventricular tachycardia, and ventricular fibrillation) and alarms for vital signs (heart rate, respiratory rate, and oxygen saturation) outside of the set parameter limits. These alarms produced audible tones in the patient room and automatically sent text messages to the nurse’s phone and had the potential to contribute to alarm fatigue regardless of the nurse’s location.
High-alarm patients. High-alarm patients were those who had more than 40 priority alarms in the preceding 4 hours, representing the top 20% of alarm rates in the PICU according to prior quality improvement projects completed in our PICU.
Low-acuity patients. Prior to and during this study, patient acuity was determined using the OptiLink Patient Classification System (OptiLink Healthcare Management Systems, Inc.; Tigard, OR; www.optilinkhealthcare.com; see Appendix 1) for the PICU twice daily. Low-acuity patients comprised on average 16% of the PICU patients.
Setting and Subjects
This study was performed in the PICU at The Children’s Hospital of Philadelphia.
The PICU is made up of 3 separate wings: east, south, and west. Bed availability was the only factor determining patient placement on the east, south, or west wing; the physical bed location was not preferentially assigned based on diagnosis or disease severity. The east wing was the intervention unit where the huddles occurred.
The PICU is composed of 3 different geographical teams. Two of the teams are composed of 4 to 5 pediatric or emergency medicine residents, 1 fellow, and 1 attending covering the south and west wings. The third team, located on the east wing, is composed of 1 to 2 pediatric residents, 2 to 3 nurse practitioners, 1 fellow, and 1 attending. Bedside family-centered rounds are held at each patient room, with the bedside nurse participating by reading a nursing rounding script that includes vital signs, vascular access, continuous medications, and additional questions or concerns.
Control subjects were any monitored patients on any of the 3 wings of the PICU between April 1, 2015, and October 31, 2015. The control patients were in 2 categories: historical controls from April 1, 2015, to May 31, 2015, and concurrent controls from June 1, 2015, to October 31, 2015, who were located anywhere in the PICU. On each nonholiday weekday beginning June 1, 2015, we randomly selected up to 2 patients to receive the intervention. These were high-alarm, low-acuity patients on the east wing to be discussed in the daily morning huddle. If more than 2 high-alarm, low-acuity patients were eligible for intervention, they were randomly selected by using the RAND function in Microsoft Excel. The other low-acuity, high-alarm patients in the PICU were included as control patients. Patients were eligible for the study if they were present for the 4 hours prior to huddle and present past noon on the day of huddle. If patients met criteria as high-alarm, low-acuity patients on multiple days, they could be enrolled as intervention or control patients multiple times. Patients’ alarm rates were calculated by dividing the number of alarms by their length of stay to the minute. There was no adjustment made for patients enrolled more than once.
Human Subjects Protection
The Institutional Review Board of The Children’s Hospital of Philadelphia approved this study with a waiver of informed consent.
Alarm Capture
We used BedMasterEx (Excel Medical Electronics; Jupiter, FL, http://excel-medical.com/products/bedmaster-ex) software connected to the General Electric monitor network to measure alarm rates. The software captured, in near real time, every alarm that occurred on every monitor in the PICU. Alarm rates over the preceding 4 hours for all PICU patients were exported and summarized by alarm type and level as set by hospital policy (crisis, warning, advisory, and system warning). Crisis and warning alarms were included as they represented potential life-threatening events meeting the definition of priority alarms. Physicians used an order within the PICU admission order-set to order monitoring based on preset age parameters (see online Appendix 1 for default settings). Physician orders were required for nurses to change alarm parameters. Daily electrode changes to reduce false alarms were standard of care.
Primary Outcome
The primary outcome was the change in priority alarm activation rate (the number of priority alarms per day) from prehuddle period (24 hours before morning huddle) to posthuddle period (the 24 hours following morning huddle) for intervention cases as compared with controls.
Primary Intervention
The intervention consisted of integrating a short script to facilitate the discussion of the alarm data during existing safety huddle and rounding workflows. The discussion and subsequent workflow proceeded as follows: A member of the research team who was not involved in patient care brought an alarm data sheet for each randomly selected intervention patient on the east wing to each safety huddle. The huddles were attended by the outgoing night charge nurse, the day charge nurse, and all bedside nurses working on the east wing that day. The alarm data sheet provided to the charge nurse displayed data on the 1 to 2 alarm parameters (respiratory rate, heart rate, or pulse oximetry) that generated the highest number of alarms. The charge nurse listed the high-alarm patients by room number during huddle, and the alarm data sheet was given to the bedside nurse responsible for the patient to facilitate further scripted discussion during bedside rounds with patient-specific information to reduce the alarm rates of individual patients throughout the adjustment of physiologic monitor parameters (see Appendix 2 for sample data sheet and script).
Data Collection
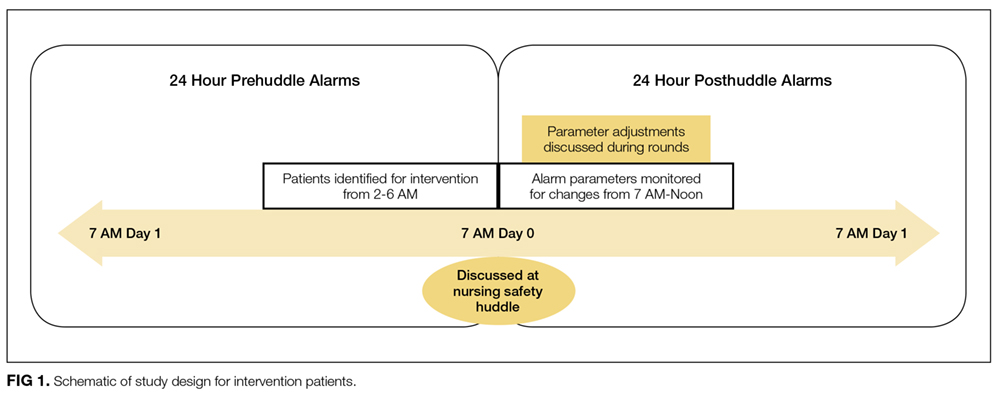
Intervention patients were high-alarm, low-acuity patients on the east wing from June 1, 2015, through October 31, 2015. Two months of baseline data were gathered prior to intervention on all 3 wings; therefore, control patients were high-alarm, low-acuity patients throughout the PICU from April 1, 2015, to May 31, 2015, as historical controls and from June 1, 2015, to October 31, 2015, as concurrent controls. Alarm rates for the 24 hours prior to huddle and the 24 hours following huddle were collected and analyzed. See Figure 1 for schematic of study design.
We collected data on patient characteristics, including patient location, age, sex, and intervention date. Information regarding changes to monitor alarm parameters for both intervention and control patients during the posthuddle period (the period following morning huddle until noon on intervention day) was also collected. We monitored for code blue events and unexpected changes in acuity until discharge or transfer out of the PICU.
Data Analysis
We compared the priority alarm activation rates of individual patients in the 24 hours before and the 24 hours after the huddle intervention and contrasted the differences in rates between intervention and control patients, both concurrent and historical controls. We also divided the intervention and control groups into 2 additional groups each—those patients whose alarm parameters were changed, compared with those whose parameters did not change. We evaluated for possible contamination by comparing alarm rates of historical and concurrent controls, as well as evaluating alarm rates by location. We used mixed-effects regression models to evaluate the effect of the intervention and control type (historical or concurrent) on alarm rates, adjusted for patient age and sex. Analysis was performed using Stata version 10.3 (StataCorp, LLC, College Station, TX) and SAS version 9.4 (SAS Institute Inc., Cary, NC).
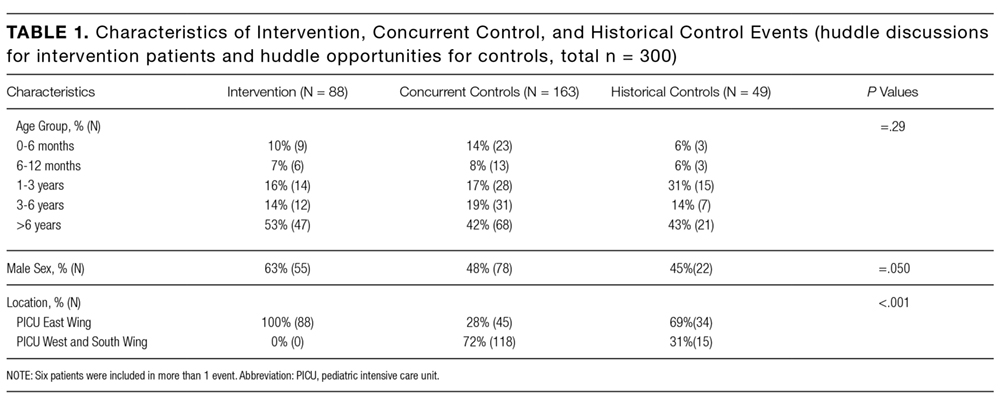
RESULTS
Because patients could be enrolled more than once, we refer to the instances when they were included in the study as “events” (huddle discussions for intervention patients and huddle opportunities for controls) below. We identified 49 historical control events between April 1, 2015, and May 31, 2015. During the intervention period, we identified 88 intervention events and 163 concurrent control events between June 1, 2015, and October 31, 2015 (total n = 300; see Table 1 for event characteristics). A total of 6 patients were enrolled more than once as either intervention or control patients.
UNADJUSTED ANALYSIS OF CHANGES IN ALARM RATES
The average priority alarm activation rate for intervention patients was 433 alarms (95% confidence interval [CI], 392-472) per day in the 24 hours leading up to the intervention and 223 alarms (95% CI, 182-265) per day in the 24 hours following the intervention, a 48.5% unadjusted decrease (95% CI, 38.1%-58.9%). In contrast, priority alarm activation rates for concurrent control patients averaged 412 alarms (95% CI, 383-442) per day in the 24 hours leading up to the morning huddle and 323 alarms (95% CI, 270-375) per day in the 24 hours following huddle, a 21.6% unadjusted decrease (95% CI, 15.3%-27.9%). For historical controls, priority alarm activation rates averaged 369 alarms (95% CI, 339-399) per day in the 24 hours leading up to the morning huddle and 242 alarms (95% CI, 164-320) per day in the 24 hours following huddle, a 34.4% unadjusted decrease (95% CI, 13.5%-55.0%). When we compared historical versus concurrent controls in the unadjusted analysis, concurrent controls had 37 more alarms per day (95% CI, 59 fewer to 134 more; P = 0.45) than historical controls. There was no significant difference between concurrent and historical controls, demonstrating no evidence of contamination.
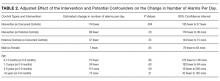
Adjusted Analysis of Changes in Alarm Rates
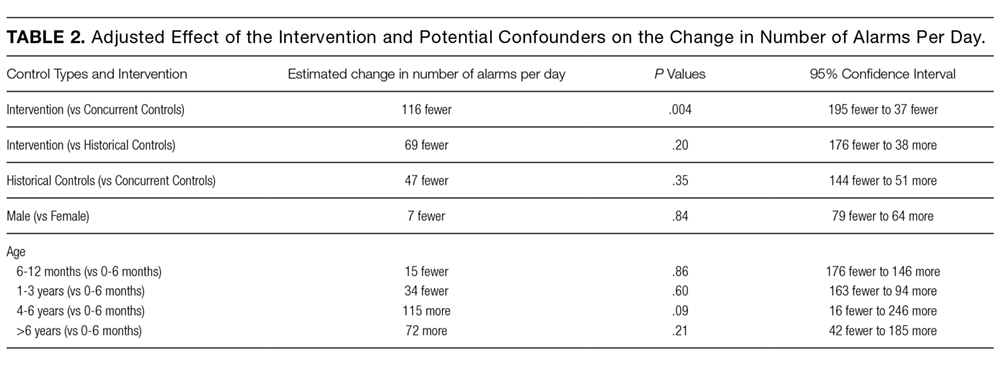
The overall estimate of the effect of the intervention adjusted for age and sex compared with concurrent controls was a reduction of 116 priority alarms per day (95% CI, 37-194; P = 0.004, Table 2). The adjusted percent decrease was 29.0% (95% CI, 12.1%-46.0%). There were no unexpected changes in patient acuity or code blue events related to the intervention.
Fidelity Analysis
We tracked changes in alarm parameter settings for evidence of intervention fidelity to determine if the team carried out the recommendations made. We found that 42% of intervention patients and 24% of combined control patients had alarm parameters changed during the posthuddle period (P = 0.002).
For those intervention patients who had parameters changed during the posthuddle period (N = 37), the mean effect was greater at a 54.9% decrease (95% CI, 38.8%-70.8%) in priority alarms as compared with control patients who had parameters adjusted during the posthuddle period (n = 50), having a mean decrease of only 12.2% (95% CI, –18.1%-42.3%). There was a 43.2% decrease (95% CI, 29.3%-57.0%) for intervention patients who were discussed but did not have parameters adjusted during the time window of observation (n = 51), as compared with combined control patients who did not have parameters adjusted (N = 162) who had a 28.1% decrease (95% CI, 16.8%-39.1%); see Figure 2.
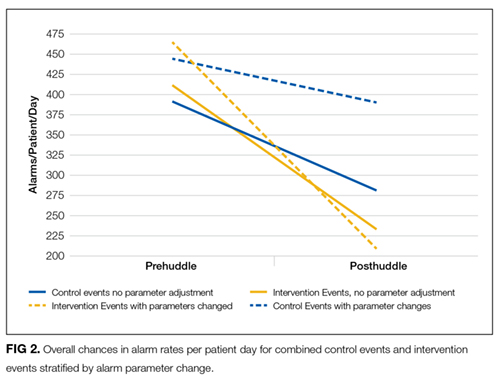
This study is the first to demonstrate a successful and safe intervention to reduce the alarm rates of PICU patients. In addition, we observed a more significant reduction in priority alarm activation rates for intervention patients who had their alarm parameters changed during the monitored time period, leading us to hypothesize that providing patient-specific data regarding types of alarms was a key component of the intervention.
In control patients, we observed a reduction in alarm rates over time as well. There are 2 potential explanations for this. First, it is possible that as patients stabilize in the PICU, their vital signs become less extreme and generate fewer alarms even if the alarm parameters are not changed. The second is that parameters were changed within or outside of the time windows during which we evaluated for alarm parameter changes. Nevertheless, the decline over time observed in the intervention patients was greater than in both control groups. This change was even more noticeable in the intervention patients who had their alarm parameters changed during the posthuddle period as compared with controls who had their alarm parameters changed following the posthuddle period. This may have been due to the data provided during the huddle intervention, pointing the team to the cause of the high alarm rate.
Prior successful research regarding reduction of pediatric alarms has often shown decreased use of physiological monitors as 1 approach to reducing unnecessary alarms. The single prior pediatric alarm intervention study conducted on a pediatric ward involved instituting a cardiac monitor care process that included the ordering of age-based parameters, daily replacement of electrodes, individualized assessment of parameters, and a reliable method to discontinue monitoring.13 Because most patients in the PICU are critically ill, the reliance on monitor discontinuation as a main approach to decreasing alarms is not feasible in this setting. Instead, the use of targeted alarm parameter adjustments for low-acuity patients demonstrated a safe and feasible approach to decreasing alarms in PICU patients. The daily electrode change and age-based parameters were already in place at our institution.
There are a few limitations to this study. First, we focused only on low-acuity PICU patients. We believe that focusing on low-acuity patients allows for reduction in nonactionable alarms with limited potential for adverse events; however, this approach excludes many critically ill patients who might be at highest risk for harm from alarm fatigue if important alarms are ignored. Second, many of our patients were not present for the full 24 hours pre- and posthuddle due to their low acuity limiting our ability to follow alarm rates over time. Third, changes in alarm parameters were only monitored for a set period of 5 hours following the huddle to determine the effect of the recommended rounding script on changes to alarms. It is possible the changes to alarm parameters outside of the observed posthuddle period affected the alarm rates of both intervention and control patients. Lastly, the balancing metrics of unexpected changes in OptiLink status and code blue events are rare events, and therefore we may have been underpowered to find them. The effects of the huddle intervention on safety huddle length and rounding length were not measured.
CONCLUSION
Integrating a data-driven monitor alarm discussion into safety huddles was a safe and effective approach to reduce alarms in low-acuity, high-alarm PICU patients. Innovative approaches to make data-driven alarm decisions using informatics tools integrated into monitoring systems and electronic health records have the potential to facilitate cost-effective spread of this intervention.
Disclosure
This work was supported by a pilot grant from the Center for Pediatric Clinical Effectiveness, The Children’s Hospital of Philadelphia. Dr. Bonafide is supported by a Mentored Patient-Oriented Research Career Development Award from the National Heart, Lung, and Blood Institute of the National Institutes of Health under Award Number K23HL116427. The content is solely the responsibility of the authors and does not necessarily represent the official views of the funding organizations or employers. The funding organizations had no role in the design, preparation, review, or approval of this paper, nor the decision to submit for publication.
1. Drew BJ, Califf RM, Funk M, et al. Practice standards for electrocardiographic monitoring in hospital settings: An American Heart Association scientific statement from the councils on cardiovascular nursing, clinical cardiology, and cardiovascular disease in the young. Circulation. 2004;110(17):2721-2746; DOI:10.1161/01.CIR.0000145144.56673.59. PubMed
2. Paine CW, Goel V V, Ely E, et al. Systematic Review of Physiologic Monitor Alarm Characteristics and Pragmatic Interventions to Reduce Alarm Frequency. J Hosp Med. 2016;11(2):136-144; DOI:10.1002/jhm.2520. PubMed
3. Schondelmeyer AC, Bonafide CP, Goel V V, et al. The frequency of physiologic monitor alarms in a children’s hospital. J Hosp Med. 2016;11(11):796-798; DOI:10.1002/jhm.2612. PubMed
4. Bonafide CP, Lin R, Zander M, et al. Association between exposure to nonactionable physiologic monitor alarms and response time in a children’s hospital. J Hosp Med. 2015;10(6):345-351; DOI:10.1002/jhm.2331. PubMed
5. Lawless ST. Crying wolf: false alarms in a pediatric intensive care unit. Crit Care Med. 1994;22(6):981-985; DOI:10.1016/0025-326X(92)90542-E. PubMed
6. Tsien CL, Fackler JC. Poor prognosis for existing monitors in the intensive care unit. Crit Care Med. 1997;25(4):614-619 DOI:10.1097/00003246-199704000-00010. PubMed
7. Talley LB, Hooper J, Jacobs B, et al. Cardiopulmonary monitors and clinically significant events in critically ill children. Biomed Instrum Technol. 2011;45(SPRING):38-45; DOI:10.2345/0899-8205-45.s1.38. PubMed
8. Rosman EC, Blaufox AD, Menco A, Trope R, Seiden HS. What are we missing? Arrhythmia detection in the pediatric intensive care unit. J Pediatr. 2013;163(2):511-514; DOI:10.1016/j.jpeds.2013.01.053. PubMed
9. Korniewicz DM, Clark T, David Y. A national online survey on the effectiveness of clinical alarms. Am J Crit Care. 2008;17(1):36-41; DOI:17/1/36 [pii]. PubMed
10. Voepel-Lewis T, Parker ML, Burke CN, et al. Pulse oximetry desaturation alarms on a general postoperative adult unit: A prospective observational study of nurse response time. Int J Nurs Stud. 2013;50(10):1351-1358; DOI:10.1016/j.ijnurstu.2013.02.006. PubMed
11. Joint Commission on Accreditation of Healthcare Organizations. Medical device alarm safety in hospitals. Sentin Event Alert. 2012:1-3. PubMed
12. Goldenhar LM, Brady PW, Sutcliffe KM, Muething SE, Anderson JM. Huddling for high reliability and situation awareness. BMJ Qual Saf. 2013;22:899-906; DOI:10.1136/bmjqs-2012-001467. PubMed
13. Dandoy CE, Davies SM, Flesch L, et al. A Team-Based Approach to Reducing Cardiac Monitor Alarms. Pediatrics. 2014;134(6):E1686-E1694. DOI: 10.1542/peds.2014-1162. PubMed
BACKGROUND
Physiologic monitors are intended to prevent cardiac and respiratory arrest by generating alarms to alert clinicians to signs of instability. To minimize the probability that monitors will miss signs of deterioration, alarm algorithms and default parameters are often set to maximize sensitivity while sacrificing specificity.1 As a result, monitors generate large numbers of nonactionable alarms—alarms that are either invalid and do not accurately represent the physiologic status of the patient or are valid but do not warrant clinical intervention.2 Prior research has demonstrated that the pediatric intensive care unit (PICU) is responsible for a higher proportion of alarms than pediatric wards3 and a large proportion of these alarms, 87% - 97%, are nonactionable.4-8 In national surveys of healthcare staff, respondents report that high alarm rates interrupt patient care and can lead clinicians to disable alarms entirely.9 Recent research has supported this, demonstrating that nurses who are exposed to higher numbers of alarms have slower response times to alarms.4,10 In an attempt to mitigate safety risks, the Joint Commission in 2012 issued recommendations for hospitals to (a) establish guidelines for tailoring alarm settings and limits for individual patients and (b) identify situations in which alarms are not clinically necessary.11
In order to address these recommendations within our PICU, we sought to evaluate the impact of a focused physiologic monitor alarm reduction intervention integrated into safety huddles. Safety huddles are brief, structured discussions among physicians, nurses, and other staff aiming to identify safety concerns.12 Huddles offer an appropriate forum for reviewing alarm data and identifying patients whose high alarm rates may necessitate safe tailoring of alarm limits. Pilot data demonstrating high alarm rates among low-acuity PICU patients led us to hypothesize that low-acuity, high-alarm PICU patients would be a safe and effective target for an alarm huddle-based intervention.
In this study, we aimed to measure the impact of a structured safety huddle review of low-acuity PICU patients with high rates of priority alarms who were randomized to intervention compared with other low-acuity, high-alarm, concurrent, and historical control patients in the PICU.
METHODS
Study Definitions
Priority alarm activation rate. We conceptualized priority alarms as any alarm for a clinical condition that requires a timely response to determine if intervention is necessary to save a patient’s life,4 yet little empirical data support its existence in the hospital. We operationally defined these alarms on the General Electric Solar physiologic monitoring devices as any potentially life-threatening events including lethal arrhythmias (asystole, ventricular tachycardia, and ventricular fibrillation) and alarms for vital signs (heart rate, respiratory rate, and oxygen saturation) outside of the set parameter limits. These alarms produced audible tones in the patient room and automatically sent text messages to the nurse’s phone and had the potential to contribute to alarm fatigue regardless of the nurse’s location.
High-alarm patients. High-alarm patients were those who had more than 40 priority alarms in the preceding 4 hours, representing the top 20% of alarm rates in the PICU according to prior quality improvement projects completed in our PICU.
Low-acuity patients. Prior to and during this study, patient acuity was determined using the OptiLink Patient Classification System (OptiLink Healthcare Management Systems, Inc.; Tigard, OR; www.optilinkhealthcare.com; see Appendix 1) for the PICU twice daily. Low-acuity patients comprised on average 16% of the PICU patients.
Setting and Subjects
This study was performed in the PICU at The Children’s Hospital of Philadelphia.
The PICU is made up of 3 separate wings: east, south, and west. Bed availability was the only factor determining patient placement on the east, south, or west wing; the physical bed location was not preferentially assigned based on diagnosis or disease severity. The east wing was the intervention unit where the huddles occurred.
The PICU is composed of 3 different geographical teams. Two of the teams are composed of 4 to 5 pediatric or emergency medicine residents, 1 fellow, and 1 attending covering the south and west wings. The third team, located on the east wing, is composed of 1 to 2 pediatric residents, 2 to 3 nurse practitioners, 1 fellow, and 1 attending. Bedside family-centered rounds are held at each patient room, with the bedside nurse participating by reading a nursing rounding script that includes vital signs, vascular access, continuous medications, and additional questions or concerns.
Control subjects were any monitored patients on any of the 3 wings of the PICU between April 1, 2015, and October 31, 2015. The control patients were in 2 categories: historical controls from April 1, 2015, to May 31, 2015, and concurrent controls from June 1, 2015, to October 31, 2015, who were located anywhere in the PICU. On each nonholiday weekday beginning June 1, 2015, we randomly selected up to 2 patients to receive the intervention. These were high-alarm, low-acuity patients on the east wing to be discussed in the daily morning huddle. If more than 2 high-alarm, low-acuity patients were eligible for intervention, they were randomly selected by using the RAND function in Microsoft Excel. The other low-acuity, high-alarm patients in the PICU were included as control patients. Patients were eligible for the study if they were present for the 4 hours prior to huddle and present past noon on the day of huddle. If patients met criteria as high-alarm, low-acuity patients on multiple days, they could be enrolled as intervention or control patients multiple times. Patients’ alarm rates were calculated by dividing the number of alarms by their length of stay to the minute. There was no adjustment made for patients enrolled more than once.
Human Subjects Protection
The Institutional Review Board of The Children’s Hospital of Philadelphia approved this study with a waiver of informed consent.
Alarm Capture
We used BedMasterEx (Excel Medical Electronics; Jupiter, FL, http://excel-medical.com/products/bedmaster-ex) software connected to the General Electric monitor network to measure alarm rates. The software captured, in near real time, every alarm that occurred on every monitor in the PICU. Alarm rates over the preceding 4 hours for all PICU patients were exported and summarized by alarm type and level as set by hospital policy (crisis, warning, advisory, and system warning). Crisis and warning alarms were included as they represented potential life-threatening events meeting the definition of priority alarms. Physicians used an order within the PICU admission order-set to order monitoring based on preset age parameters (see online Appendix 1 for default settings). Physician orders were required for nurses to change alarm parameters. Daily electrode changes to reduce false alarms were standard of care.
Primary Outcome
The primary outcome was the change in priority alarm activation rate (the number of priority alarms per day) from prehuddle period (24 hours before morning huddle) to posthuddle period (the 24 hours following morning huddle) for intervention cases as compared with controls.
Primary Intervention
The intervention consisted of integrating a short script to facilitate the discussion of the alarm data during existing safety huddle and rounding workflows. The discussion and subsequent workflow proceeded as follows: A member of the research team who was not involved in patient care brought an alarm data sheet for each randomly selected intervention patient on the east wing to each safety huddle. The huddles were attended by the outgoing night charge nurse, the day charge nurse, and all bedside nurses working on the east wing that day. The alarm data sheet provided to the charge nurse displayed data on the 1 to 2 alarm parameters (respiratory rate, heart rate, or pulse oximetry) that generated the highest number of alarms. The charge nurse listed the high-alarm patients by room number during huddle, and the alarm data sheet was given to the bedside nurse responsible for the patient to facilitate further scripted discussion during bedside rounds with patient-specific information to reduce the alarm rates of individual patients throughout the adjustment of physiologic monitor parameters (see Appendix 2 for sample data sheet and script).
Data Collection
Intervention patients were high-alarm, low-acuity patients on the east wing from June 1, 2015, through October 31, 2015. Two months of baseline data were gathered prior to intervention on all 3 wings; therefore, control patients were high-alarm, low-acuity patients throughout the PICU from April 1, 2015, to May 31, 2015, as historical controls and from June 1, 2015, to October 31, 2015, as concurrent controls. Alarm rates for the 24 hours prior to huddle and the 24 hours following huddle were collected and analyzed. See Figure 1 for schematic of study design.
We collected data on patient characteristics, including patient location, age, sex, and intervention date. Information regarding changes to monitor alarm parameters for both intervention and control patients during the posthuddle period (the period following morning huddle until noon on intervention day) was also collected. We monitored for code blue events and unexpected changes in acuity until discharge or transfer out of the PICU.
Data Analysis
We compared the priority alarm activation rates of individual patients in the 24 hours before and the 24 hours after the huddle intervention and contrasted the differences in rates between intervention and control patients, both concurrent and historical controls. We also divided the intervention and control groups into 2 additional groups each—those patients whose alarm parameters were changed, compared with those whose parameters did not change. We evaluated for possible contamination by comparing alarm rates of historical and concurrent controls, as well as evaluating alarm rates by location. We used mixed-effects regression models to evaluate the effect of the intervention and control type (historical or concurrent) on alarm rates, adjusted for patient age and sex. Analysis was performed using Stata version 10.3 (StataCorp, LLC, College Station, TX) and SAS version 9.4 (SAS Institute Inc., Cary, NC).
RESULTS
Because patients could be enrolled more than once, we refer to the instances when they were included in the study as “events” (huddle discussions for intervention patients and huddle opportunities for controls) below. We identified 49 historical control events between April 1, 2015, and May 31, 2015. During the intervention period, we identified 88 intervention events and 163 concurrent control events between June 1, 2015, and October 31, 2015 (total n = 300; see Table 1 for event characteristics). A total of 6 patients were enrolled more than once as either intervention or control patients.
UNADJUSTED ANALYSIS OF CHANGES IN ALARM RATES
The average priority alarm activation rate for intervention patients was 433 alarms (95% confidence interval [CI], 392-472) per day in the 24 hours leading up to the intervention and 223 alarms (95% CI, 182-265) per day in the 24 hours following the intervention, a 48.5% unadjusted decrease (95% CI, 38.1%-58.9%). In contrast, priority alarm activation rates for concurrent control patients averaged 412 alarms (95% CI, 383-442) per day in the 24 hours leading up to the morning huddle and 323 alarms (95% CI, 270-375) per day in the 24 hours following huddle, a 21.6% unadjusted decrease (95% CI, 15.3%-27.9%). For historical controls, priority alarm activation rates averaged 369 alarms (95% CI, 339-399) per day in the 24 hours leading up to the morning huddle and 242 alarms (95% CI, 164-320) per day in the 24 hours following huddle, a 34.4% unadjusted decrease (95% CI, 13.5%-55.0%). When we compared historical versus concurrent controls in the unadjusted analysis, concurrent controls had 37 more alarms per day (95% CI, 59 fewer to 134 more; P = 0.45) than historical controls. There was no significant difference between concurrent and historical controls, demonstrating no evidence of contamination.
Adjusted Analysis of Changes in Alarm Rates
The overall estimate of the effect of the intervention adjusted for age and sex compared with concurrent controls was a reduction of 116 priority alarms per day (95% CI, 37-194; P = 0.004, Table 2). The adjusted percent decrease was 29.0% (95% CI, 12.1%-46.0%). There were no unexpected changes in patient acuity or code blue events related to the intervention.
Fidelity Analysis
We tracked changes in alarm parameter settings for evidence of intervention fidelity to determine if the team carried out the recommendations made. We found that 42% of intervention patients and 24% of combined control patients had alarm parameters changed during the posthuddle period (P = 0.002).
For those intervention patients who had parameters changed during the posthuddle period (N = 37), the mean effect was greater at a 54.9% decrease (95% CI, 38.8%-70.8%) in priority alarms as compared with control patients who had parameters adjusted during the posthuddle period (n = 50), having a mean decrease of only 12.2% (95% CI, –18.1%-42.3%). There was a 43.2% decrease (95% CI, 29.3%-57.0%) for intervention patients who were discussed but did not have parameters adjusted during the time window of observation (n = 51), as compared with combined control patients who did not have parameters adjusted (N = 162) who had a 28.1% decrease (95% CI, 16.8%-39.1%); see Figure 2.
This study is the first to demonstrate a successful and safe intervention to reduce the alarm rates of PICU patients. In addition, we observed a more significant reduction in priority alarm activation rates for intervention patients who had their alarm parameters changed during the monitored time period, leading us to hypothesize that providing patient-specific data regarding types of alarms was a key component of the intervention.
In control patients, we observed a reduction in alarm rates over time as well. There are 2 potential explanations for this. First, it is possible that as patients stabilize in the PICU, their vital signs become less extreme and generate fewer alarms even if the alarm parameters are not changed. The second is that parameters were changed within or outside of the time windows during which we evaluated for alarm parameter changes. Nevertheless, the decline over time observed in the intervention patients was greater than in both control groups. This change was even more noticeable in the intervention patients who had their alarm parameters changed during the posthuddle period as compared with controls who had their alarm parameters changed following the posthuddle period. This may have been due to the data provided during the huddle intervention, pointing the team to the cause of the high alarm rate.
Prior successful research regarding reduction of pediatric alarms has often shown decreased use of physiological monitors as 1 approach to reducing unnecessary alarms. The single prior pediatric alarm intervention study conducted on a pediatric ward involved instituting a cardiac monitor care process that included the ordering of age-based parameters, daily replacement of electrodes, individualized assessment of parameters, and a reliable method to discontinue monitoring.13 Because most patients in the PICU are critically ill, the reliance on monitor discontinuation as a main approach to decreasing alarms is not feasible in this setting. Instead, the use of targeted alarm parameter adjustments for low-acuity patients demonstrated a safe and feasible approach to decreasing alarms in PICU patients. The daily electrode change and age-based parameters were already in place at our institution.
There are a few limitations to this study. First, we focused only on low-acuity PICU patients. We believe that focusing on low-acuity patients allows for reduction in nonactionable alarms with limited potential for adverse events; however, this approach excludes many critically ill patients who might be at highest risk for harm from alarm fatigue if important alarms are ignored. Second, many of our patients were not present for the full 24 hours pre- and posthuddle due to their low acuity limiting our ability to follow alarm rates over time. Third, changes in alarm parameters were only monitored for a set period of 5 hours following the huddle to determine the effect of the recommended rounding script on changes to alarms. It is possible the changes to alarm parameters outside of the observed posthuddle period affected the alarm rates of both intervention and control patients. Lastly, the balancing metrics of unexpected changes in OptiLink status and code blue events are rare events, and therefore we may have been underpowered to find them. The effects of the huddle intervention on safety huddle length and rounding length were not measured.
CONCLUSION
Integrating a data-driven monitor alarm discussion into safety huddles was a safe and effective approach to reduce alarms in low-acuity, high-alarm PICU patients. Innovative approaches to make data-driven alarm decisions using informatics tools integrated into monitoring systems and electronic health records have the potential to facilitate cost-effective spread of this intervention.
Disclosure
This work was supported by a pilot grant from the Center for Pediatric Clinical Effectiveness, The Children’s Hospital of Philadelphia. Dr. Bonafide is supported by a Mentored Patient-Oriented Research Career Development Award from the National Heart, Lung, and Blood Institute of the National Institutes of Health under Award Number K23HL116427. The content is solely the responsibility of the authors and does not necessarily represent the official views of the funding organizations or employers. The funding organizations had no role in the design, preparation, review, or approval of this paper, nor the decision to submit for publication.
1. Drew BJ, Califf RM, Funk M, et al. Practice standards for electrocardiographic monitoring in hospital settings: An American Heart Association scientific statement from the councils on cardiovascular nursing, clinical cardiology, and cardiovascular disease in the young. Circulation. 2004;110(17):2721-2746; DOI:10.1161/01.CIR.0000145144.56673.59. PubMed
2. Paine CW, Goel V V, Ely E, et al. Systematic Review of Physiologic Monitor Alarm Characteristics and Pragmatic Interventions to Reduce Alarm Frequency. J Hosp Med. 2016;11(2):136-144; DOI:10.1002/jhm.2520. PubMed
3. Schondelmeyer AC, Bonafide CP, Goel V V, et al. The frequency of physiologic monitor alarms in a children’s hospital. J Hosp Med. 2016;11(11):796-798; DOI:10.1002/jhm.2612. PubMed
4. Bonafide CP, Lin R, Zander M, et al. Association between exposure to nonactionable physiologic monitor alarms and response time in a children’s hospital. J Hosp Med. 2015;10(6):345-351; DOI:10.1002/jhm.2331. PubMed
5. Lawless ST. Crying wolf: false alarms in a pediatric intensive care unit. Crit Care Med. 1994;22(6):981-985; DOI:10.1016/0025-326X(92)90542-E. PubMed
6. Tsien CL, Fackler JC. Poor prognosis for existing monitors in the intensive care unit. Crit Care Med. 1997;25(4):614-619 DOI:10.1097/00003246-199704000-00010. PubMed
7. Talley LB, Hooper J, Jacobs B, et al. Cardiopulmonary monitors and clinically significant events in critically ill children. Biomed Instrum Technol. 2011;45(SPRING):38-45; DOI:10.2345/0899-8205-45.s1.38. PubMed
8. Rosman EC, Blaufox AD, Menco A, Trope R, Seiden HS. What are we missing? Arrhythmia detection in the pediatric intensive care unit. J Pediatr. 2013;163(2):511-514; DOI:10.1016/j.jpeds.2013.01.053. PubMed
9. Korniewicz DM, Clark T, David Y. A national online survey on the effectiveness of clinical alarms. Am J Crit Care. 2008;17(1):36-41; DOI:17/1/36 [pii]. PubMed
10. Voepel-Lewis T, Parker ML, Burke CN, et al. Pulse oximetry desaturation alarms on a general postoperative adult unit: A prospective observational study of nurse response time. Int J Nurs Stud. 2013;50(10):1351-1358; DOI:10.1016/j.ijnurstu.2013.02.006. PubMed
11. Joint Commission on Accreditation of Healthcare Organizations. Medical device alarm safety in hospitals. Sentin Event Alert. 2012:1-3. PubMed
12. Goldenhar LM, Brady PW, Sutcliffe KM, Muething SE, Anderson JM. Huddling for high reliability and situation awareness. BMJ Qual Saf. 2013;22:899-906; DOI:10.1136/bmjqs-2012-001467. PubMed
13. Dandoy CE, Davies SM, Flesch L, et al. A Team-Based Approach to Reducing Cardiac Monitor Alarms. Pediatrics. 2014;134(6):E1686-E1694. DOI: 10.1542/peds.2014-1162. PubMed
© 2017 Society of Hospital Medicine