User login
Monitor Alarms and Response Time
Hospital physiologic monitors can alert clinicians to early signs of physiologic deterioration, and thus have great potential to save lives. However, monitors generate frequent alarms,[1, 2, 3, 4, 5, 6, 7, 8] and most are not relevant to the patient's safety (over 90% of pediatric intensive care unit (PICU)[1, 2] and over 70% of adult intensive care alarms).[5, 6] In psychology experiments, humans rapidly learn to ignore or respond more slowly to alarms when exposed to high false‐alarm rates, exhibiting alarm fatigue.[9, 10] In 2013, The Joint Commission named alarm fatigue the most common contributing factor to alarm‐related sentinel events in hospitals.[11, 12]
Although alarm fatigue has been implicated as a major threat to patient safety, little empirical data support its existence in hospitals. In this study, we aimed to determine if there was an association between nurses' recent exposure to nonactionable physiologic monitor alarms and their response time to future alarms for the same patients. This exploratory work was designed to inform future research in this area, acknowledging that the sample size would be too small for multivariable modeling.
METHODS
Study Definitions
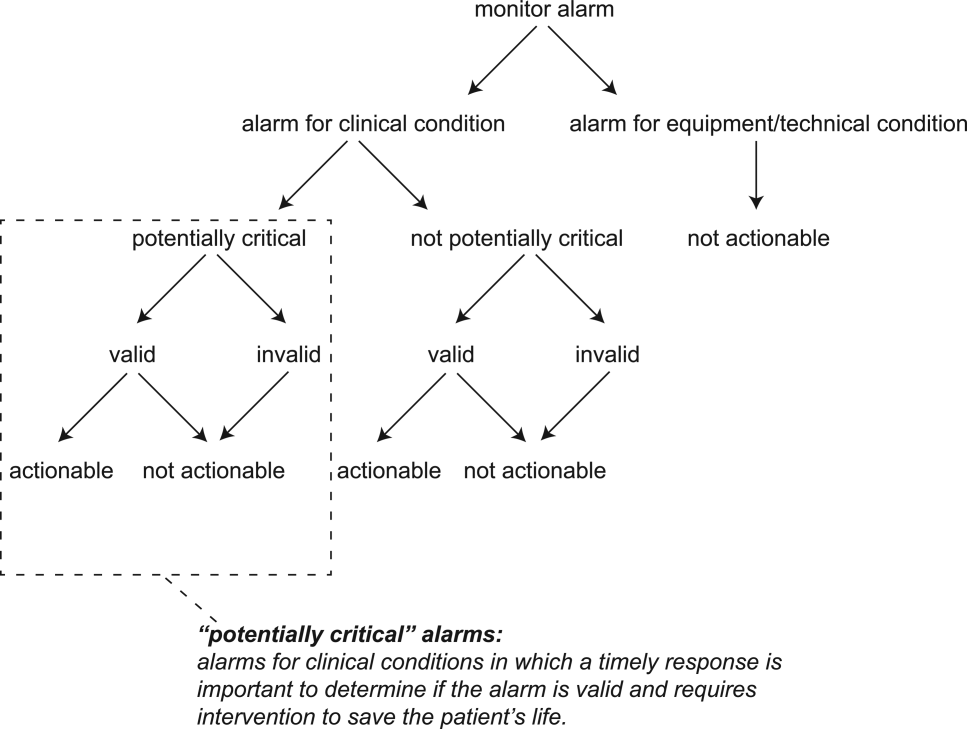
The alarm classification scheme is shown in Figure 1. Note that, for clarity, we have intentionally avoided using the terms true and false alarms because their interpretations vary across studies and can be misleading.
Potentially Critical Alarm
A potentially critical alarm is any alarm for a clinical condition for which a timely response is important to determine if the alarm requires intervention to save the patient's life. This is based on the alarm type alone, including alarms for life‐threatening arrhythmias such as asystole and ventricular tachycardia, as well as alarms for vital signs outside the set limits. Supporting Table 1 in the online version of this article lists the breakdown of alarm types that we defined a priori as potentially and not potentially critical.
| PICU | Ward | |||||||
|---|---|---|---|---|---|---|---|---|
| Alarm type | No. | % of Total | % Valid | % Actionable | No. | % of Total | % Valid | % Actionable |
| ||||||||
| Oxygen saturation | 197 | 19.4 | 82.7 | 38.6 | 590 | 41.2 | 24.4 | 1.9 |
| Heart rate | 194 | 19.1 | 95.4 | 1.0 | 266 | 18.6 | 87.2 | 0.0 |
| Respiratory rate | 229 | 22.6 | 80.8 | 13.5 | 316 | 22.1 | 48.1 | 1.0 |
| Blood pressure | 259 | 25.5 | 83.8 | 5.8 | 11 | 0.8 | 72.7 | 0.0 |
| Critical arrhythmia | 1 | 0.1 | 0.0 | 0.0 | 4 | 0.3 | 0.0 | 0.0 |
| Noncritical arrhythmia | 71 | 7.0 | 2.8 | 0.0 | 244 | 17.1 | 8.6 | 0.0 |
| Central venous pressure | 49 | 4.8 | 0.0 | 0.0 | 0 | 0.0 | N/A | N/A |
| Exhaled carbon dioxide | 14 | 1.4 | 92.9 | 50.0 | 0 | 0.0 | N/A | N/A |
| Total | 1014 | 100.0 | 75.6 | 12.9 | 1,431 | 100.0 | 38.9 | 1.0 |
Valid Alarm
A valid alarm is any alarm that correctly identifies the physiologic status of the patient. Validity was based on waveform quality, lead signal strength indicators, and artifact conditions, referencing each monitor's operator's manual.
Actionable Alarm
An actionable alarm is any valid alarm for a clinical condition that either: (1) leads to a clinical intervention; (2) leads to a consultation with another clinician at the bedside (and thus visible on camera); or (3) is a situation that should have led to intervention or consultation, but the alarm was unwitnessed or misinterpreted by the staff at the bedside.
Nonactionable Alarm
An unactionable alarm is any alarm that does not meet the actionable definition above, including invalid alarms such as those caused by motion artifact, equipment/technical alarms, and alarms that are valid but nonactionable (nuisance alarms).[13]
Response Time
The response time is the time elapsed from when the alarm fired at the bedside to when the nurse entered the room or peered through a window or door, measured in seconds.
Setting and Subjects
We performed this study between August 2012 and July 2013 at a freestanding children's hospital. We evaluated nurses caring for 2 populations: (1) PICU patients with heart and/or lung failure (requiring inotropic support and/or invasive mechanical ventilation), and (2) medical patients on a general inpatient ward. Nurses caring for heart and/or lung failure patients in the PICU typically were assigned 1 to 2 total patients. Nurses on the medical ward typically were assigned 2 to 4 patients. We identified subjects from the population of nurses caring for eligible patients with parents available to provide in‐person consent in each setting. Our primary interest was to evaluate the association between nonactionable alarms and response time, and not to study the epidemiology of alarms in a random sample. Therefore, when alarm data were available prior to screening, we first approached nurses caring for patients in the top 25% of alarm rates for that unit over the preceding 4 hours. We identified preceding alarm rates using BedMasterEx (Excel Medical Electronics, Jupiter, FL).
Human Subjects Protection
This study was approved by the institutional review board of The Children's Hospital of Philadelphia. We obtained written in‐person consent from the patient's parent and the nurse subject. We obtained a Certificate of Confidentiality from the National Institutes of Health to further protect study participants.[14]
Monitoring Equipment
All patients in the PICU were monitored continuously using General Electric (GE) (Fairfield, CT) solar devices. All bed spaces on the wards include GE Dash monitors that are used if ordered. On the ward we studied, 30% to 50% of patients are typically monitored at any given time. In addition to alarming at the bedside, most clinical alarms also generated a text message sent to the nurse's wireless phone listing the room number and the word monitor. Messages did not provide any clinical information about the alarm or patient's status. There were no technicians reviewing alarms centrally.
Physicians used an order set to order monitoring, selecting 1 of 4 available preconfigured profiles: infant <6 months, infant 6 months to 1 year, child, and adult. The parameters for each age group are in Supporting Figure 1, available in the online version of this article. A physician order is required for a nurse to change the parameters. Participating in the study did not affect this workflow.
Primary Outcome
The primary outcome was the nurse's response time to potentially critical monitor alarms that occurred while neither they nor any other clinicians were in the patient's room.
Primary Exposure and Alarm Classification
The primary exposure was the number of nonactionable alarms in the same patient over the preceding 120 minutes (rolling and updated each minute). The alarm classification scheme is shown in Figure 1.
Due to technical limitations with obtaining time‐stamped alarm data from the different ventilators in use during the study period, we were unable to identify the causes of all ventilator alarms. Therefore, we included ventilator alarms that did not lead to clinical interventions as nonactionable alarm exposures, but we did not evaluate the response time to any ventilator alarms.
Data Collection
We combined video recordings with monitor time‐stamp data to evaluate the association between nonactionable alarms and the nurse's response time. Our detailed video recording and annotation methods have been published separately.[15] Briefly, we mounted up to 6 small video cameras in patients' rooms and recorded up to 6 hours per session. The cameras captured the monitor display, a wide view of the room, a close‐up view of the patient, and all windows and doors through which staff could visually assess the patient without entering the room.
Video Processing, Review, and Annotation
The first 5 video sessions were reviewed in a group training setting. Research assistants received instruction on how to determine alarm validity and actionability in accordance with the study definitions. Following the training period, the review workflow was as follows. First, a research assistant entered basic information and a preliminary assessment of the alarm's clinical validity and actionability into a REDCap (Research Electronic Data Capture; Vanderbilt University, Nashville, TN) database.[16] Later, a physician investigator secondarily reviewed all alarms and confirmed the assessments of the research assistants or, when disagreements occurred, discussed and reconciled the database. Alarms that remained unresolved after secondary review were flagged for review with an additional physician or nurse investigator in a team meeting.
Data Analysis
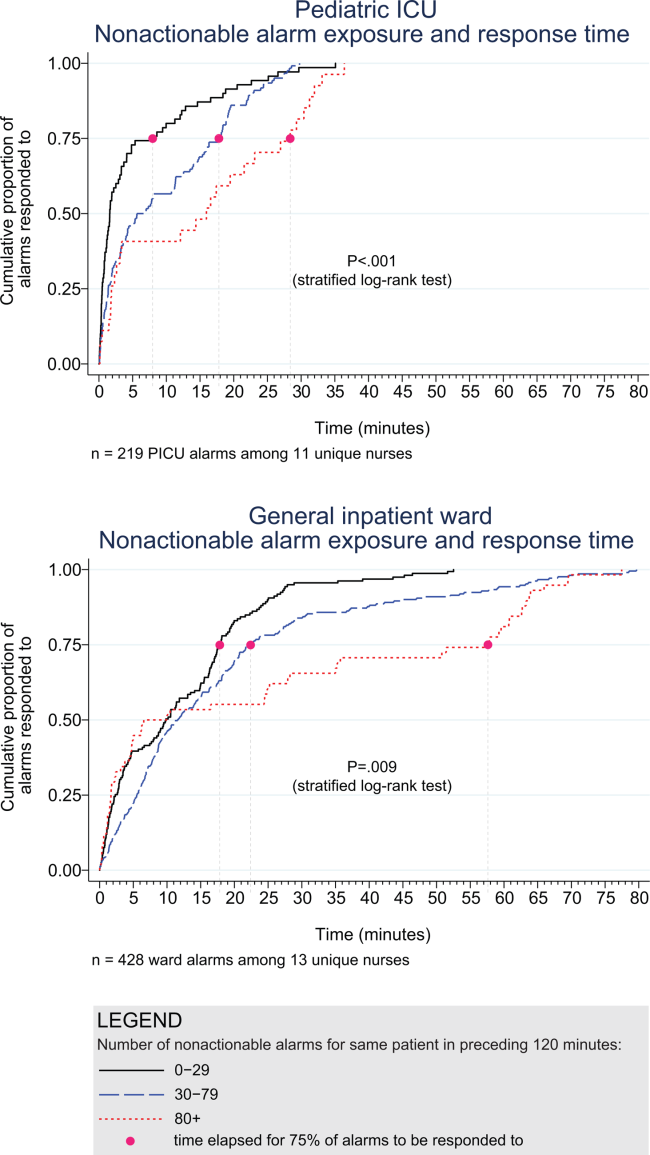
We summarized the patient and nurse subjects, the distributions of alarms, and the response times to potentially critical monitor alarms that occurred while neither the nurse nor any other clinicians were in the patient's room. We explored the data using plots of alarms and response times occurring within individual video sessions as well as with simple linear regression. Hypothesizing that any alarm fatigue effect would be strongest in the highest alarm patients, and having observed that alarms are distributed very unevenly across patients in both the PICU and ward, we made the decision not to use quartiles, but rather to form clinically meaningful categories. We also hypothesized that nurses might not exhibit alarm fatigue unless they were inundated with alarms. We thus divided the nonactionable alarm counts over the preceding 120 minutes into 3 categories: 0 to 29 alarms to represent a low to average alarm rate exhibited by the bottom 50% of the patients, 30 to 79 alarms to represent an elevated alarm rate, and 80+ alarms to represent an extremely high alarm rate exhibited by the top 5%. Because the exposure time was 120 minutes, we conducted the analysis on the alarms occurring after a nurse had been video recorded for at least 120 minutes.
We further evaluated the relationship between nonactionable alarms and nurse response time with Kaplan‐Meier plots by nonactionable alarm count category using the observed response‐time data. The Kaplan‐Meier plots compared response time across the nonactionable alarm exposure group, without any statistical modeling. A log‐rank test stratified by nurse evaluated whether the distributions of response time in the Kaplan‐Meier plots differed across the 3 alarm exposure groups, accounting for within‐nurse clustering.
Accelerated failure‐time regression based on the Weibull distribution then allowed us to compare response time across each alarm exposure group and provided confidence intervals. Accelerated failure‐time models are comparable to Cox models, but emphasize time to event rather than hazards.[17, 18] We determined that the Weibull distribution was suitable by evaluating smoothed hazard and log‐hazard plots, the confidence intervals of the shape parameters in the Weibull models that did not include 1, and by demonstrating that the Weibull model had better fit than an alternative (exponential) model using the likelihood‐ratio test (P<0.0001 for PICU, P=0.02 for ward). Due to the small sample size of nurses and patients, we could not adjust for nurse‐ or patient‐level covariates in the model. When comparing the nonactionable alarm exposure groups in the regression model (029 vs 3079, 3079 vs 80+, and 029 vs 80+), we Bonferroni corrected the critical P value for the 3 comparisons, for a critical P value of 0.05/3=0.0167.
Nurse Questionnaire
At the session's conclusion, nurses completed a questionnaire that included demographics and asked, Did you respond more quickly to monitor alarms during this study because you knew you were being filmed? to measure if nurses would report experiencing a Hawthorne‐like effect.[19, 20, 21]
RESULTS
We performed 40 sessions among 40 patients and 36 nurses over 210 hours. We performed 20 sessions in children with heart and/or lung failure in the PICU and 20 sessions in children on a general ward. Sessions took place on weekdays between 9:00 am and 6:00 pm. There were 3 occasions when we filmed 2 patients cared for by the same nurse at the same time.
Nurses were mostly female (94.4%) and had between 2 months and 28 years of experience (median, 4.8 years). Patients on the ward ranged from 5 days to 5.4 years old (median, 6 months). Patients in the PICU ranged from 5 months to 16 years old (median, 2.5 years). Among the PICU patients, 14 (70%) were receiving mechanical ventilation only, 3 (15%) were receiving vasopressors only, and 3 (15%) were receiving mechanical ventilation and vasopressors.
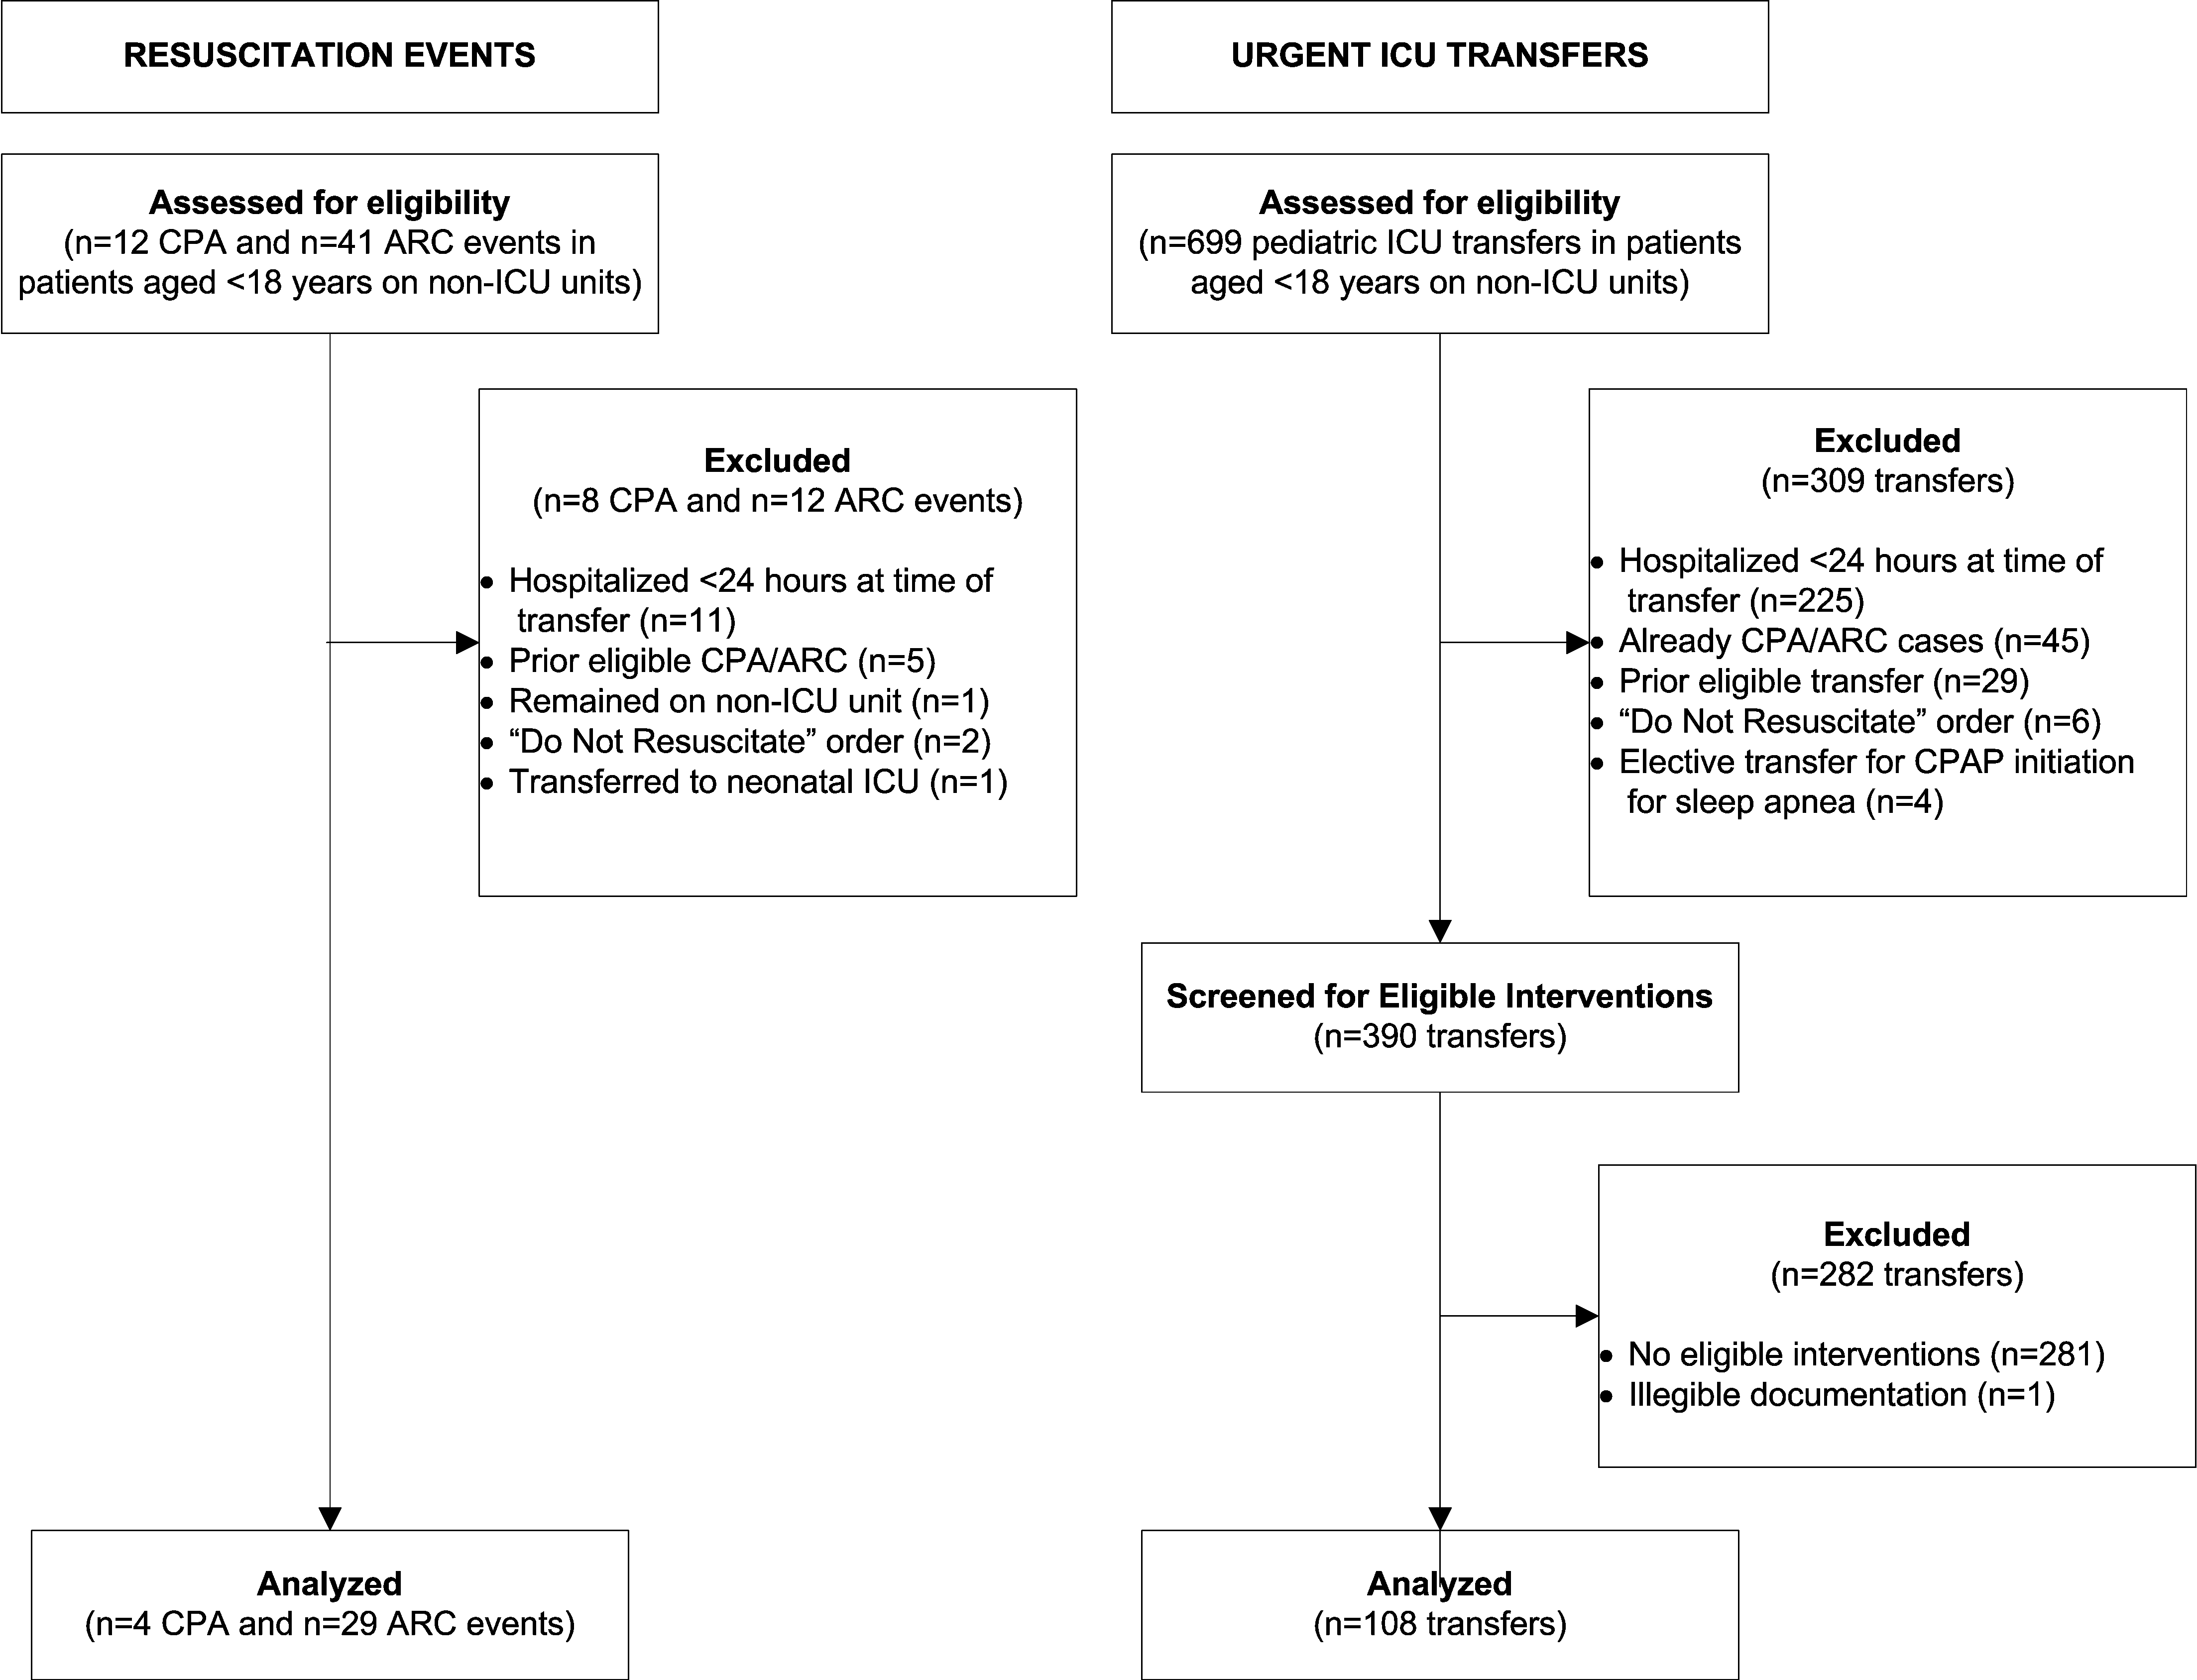
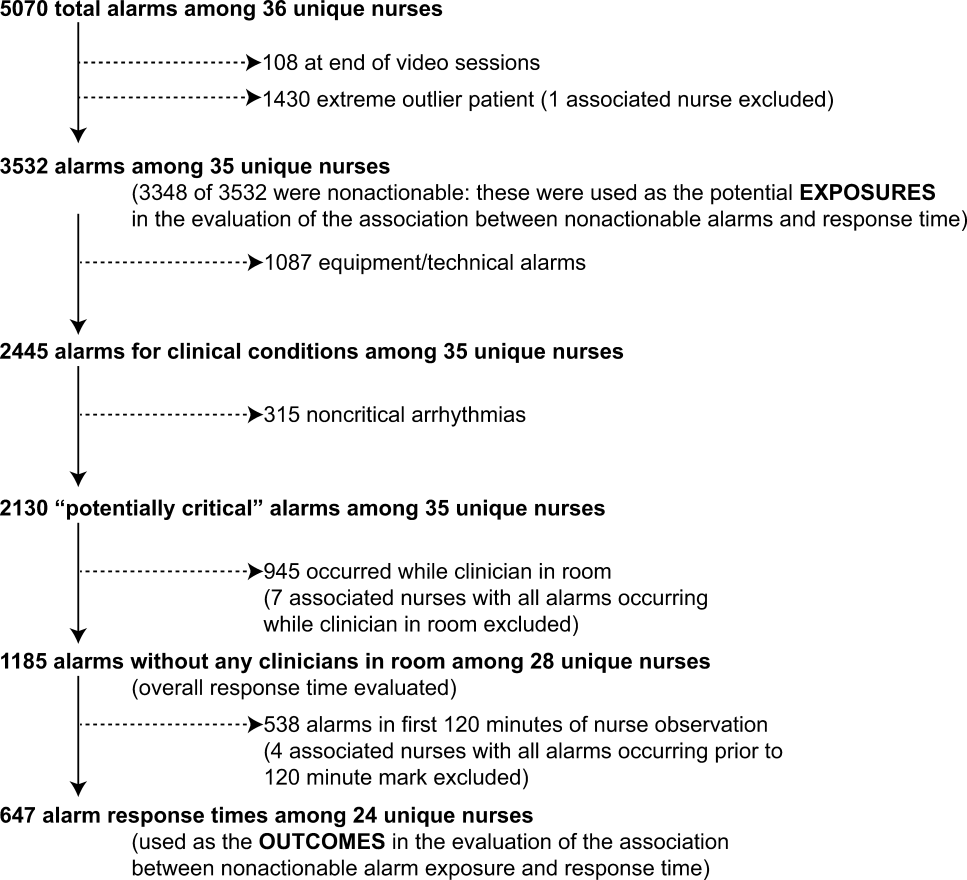
We observed 5070 alarms during the 40 sessions. We excluded 108 (2.1%) that occurred at the end of video recording sessions with the nurse absent from the room because the nurse's response could not be determined. Alarms per session ranged from 10 to 1430 (median, 75; interquartile range [IQR], 35138). We excluded the outlier PICU patient with 1430 alarms in 5 hours from the analysis to avoid the potential for biasing the results. Figure 2 depicts the data flow.
Following the 5 training sessions, research assistants independently reviewed and made preliminary assessments on 4674 alarms; these alarms were all secondarily reviewed by a physician. Using the physician reviewer as the gold standard, the research assistant's sensitivity (assess alarm as actionable when physician also assesses as actionable) was 96.8% and specificity (assess alarm as nonactionable when physician also assesses as nonactionable) was 96.9%. We had to review 54 of 4674 alarms (1.2%) with an additional physician or nurse investigator to achieve consensus.
Characteristics of the 2445 alarms for clinical conditions are shown in Table 1. Only 12.9% of alarms in heart‐ and/or lung‐failure patients in the PICU were actionable, and only 1.0% of alarms in medical patients on a general inpatient ward were actionable.
Overall Response Times for Out‐of‐Room Alarms
We first evaluated response times without excluding alarms occurring prior to the 120‐minute mark. Of the 2445 clinical condition alarms, we excluded the 315 noncritical arrhythmia types from analysis of response time because they did not meet our definition of potentially critical alarms. Of the 2130 potentially critical alarms, 1185 (55.6%) occurred while neither the nurse nor any other clinician was in the patient's room. We proceeded to analyze the response time to these 1185 alarms (307 in the PICU and 878 on the ward). In the PICU, median response time was 3.3 minutes (IQR, 0.814.4). On the ward, median response time was 9.8 minutes (IQR, 3.222.4).
Response‐Time Association With Nonactionable Alarm Exposure
Next, we analyzed the association between response time to potentially critical alarms that occurred when the nurse was not in the patient's room and the number of nonactionable alarms occurring over the preceding 120‐minute window. This required excluding the alarms that occurred in the first 120 minutes of each session, leaving 647 alarms with eligible response times to evaluate the exposure between prior nonactionable alarm exposure and response time: 219 in the PICU and 428 on the ward. Kaplan‐Meier plots and tabulated response times demonstrated the incremental relationships between each nonactionable alarm exposure category in the observed data, with the effects most prominent as the Kaplan‐Meier plots diverged beyond the median (Figure 3 and Table 2). Excluding the extreme outlier patient had no effect on the results, because 1378 of the 1430 alarms occurred with the nurse present at the bedside, and only 2 of the remaining alarms were potentially critical.
| Observed Data | Accelerated Failure‐Time Model | |||||||
|---|---|---|---|---|---|---|---|---|
| Number of Potentially Critical Alarms | Minutes Elapsed Until This Percentage of Alarms Was Responded to | Modeled Response Time, min | 95% CI, min | P Value* | ||||
| 50% (Median) | 75% | 90% | 95% | |||||
| ||||||||
| PICU | ||||||||
| 029 nonactionable alarms | 70 | 1.6 | 8.0 | 18.6 | 25.1 | 2.8 | 1.9‐3.8 | Reference |
| 3079 nonactionable alarms | 122 | 6.3 | 17.8 | 22.5 | 26.0 | 5.3 | 4.06.7 | 0.001 (vs 029) |
| 80+ nonactionable alarms | 27 | 16.0 | 28.4 | 32.0 | 33.1 | 8.5 | 4.312.7 | 0.009 (vs 029), 0.15 (vs 3079) |
| Ward | ||||||||
| 029 nonactionable alarms | 159 | 9.8 | 17.8 | 25.0 | 28.9 | 7.7 | 6.39.1 | Reference |
| 3079 nonactionable alarms | 211 | 11.6 | 22.4 | 44.6 | 63.2 | 11.5 | 9.613.3 | 0.001 (vs 029) |
| 80+ nonactionable alarms | 58 | 8.3 | 57.6 | 63.8 | 69.5 | 15.6 | 11.020.1 | 0.001 (vs 029), 0.09 (vs 3079) |
Accelerated failure‐time regressions revealed significant incremental increases in the modeled response time as the number of preceding nonactionable alarms increased in both the PICU and ward settings (Table 2).
Hawthorne‐like Effects
Four of the 36 nurses reported that they responded more quickly to monitor alarms because they knew they were being filmed.
DISCUSSION
Alarm fatigue has recently generated interest among nurses,[22] physicians,[23] regulatory bodies,[24] patient safety organizations,[25] and even attorneys,[26] despite a lack of prior evidence linking nonactionable alarm exposure to response time or other adverse patient‐relevant outcomes. This study's main findings were that (1) the vast majority of alarms were nonactionable, (2) response time to alarms occurring while the nurse was out of the room increased as the number of nonactionable alarms over the preceding 120 minutes increased. These findings may be explained by alarm fatigue.
Our results build upon the findings of other related studies. The nonactionable alarm proportions we found were similar to other pediatric studies, reporting greater than 90% nonactionable alarms.[1, 2] One other study has reported a relationship between alarm exposure and response time. In that study, Voepel‐Lewis and colleagues evaluated nurse responses to pulse oximetry desaturation alarms in adult orthopedic surgery patients using time‐stamp data from their monitor notification system.[27] They found that alarm response time was significantly longer for patients in the highest quartile of alarms compared to those in lower quartiles. Our study provides new data suggesting a relationship between nonactionable alarm exposure and nurse response time.
Our study has several limitations. First, as a preliminary study to investigate feasibility and possible association, the sample of patients and nurses was necessarily limited and did not permit adjustment for nurse‐ or patient‐level covariates. A multivariable analysis with a larger sample might provide insight into alternate explanations for these findings other than alarm fatigue, including measures of nurse workload and patient factors (such as age and illness severity). Additional factors that are not as easily measured can also contribute to the complex decision of when and how to respond to alarms.[28, 29] Second, nurses were aware that they were being video recorded as part of a study of nonactionable alarms, although they did not know the specific details of measurement. Although this lack of blinding might lead to a Hawthorne‐like effect, our positive results suggest that this effect, if present, did not fully obscure the association. Third, all sessions took place on weekdays during daytime hours, but effects of nonactionable alarms might vary by time and day. Finally, we suspect that when nurses experience critical alarms that require them to intervene and rescue a patient, their response times to that patient's alarms that occur later in their shift will be quicker due to a heightened concern for the alarm being actionable. We were unable to explore that relationship in this analysis because the number of critical alarms requiring intervention was very small. This is a topic of future study.
CONCLUSIONS
We identified an association between a nurse's prior exposure to nonactionable alarms and response time to future alarms. This finding is consistent with alarm fatigue, but requires further study to more clearly delineate other factors that might confound or modify that relationship.
Disclosures
This project was funded by the Health Research Formula Fund Grant 4100050891 from the Pennsylvania Department of Public Health Commonwealth Universal Research Enhancement Program (awarded to Drs. Keren and Bonafide). Dr. Bonafide is also supported by the National Heart, Lung, and Blood Institute of the National Institutes of Health under award number K23HL116427. The content is solely the responsibility of the authors and does not necessarily represent the official views of the National Institutes of Health. The authors have no financial relationships or conflicts of interest relevant to this article to disclose.
- . Crying wolf: false alarms in a pediatric intensive care unit. Crit Care Med. 1994;22(6):981–985.
- , . Poor prognosis for existing monitors in the intensive care unit. Crit Care Med. 1997;25(4):614–619.
- , , , , . Clinical evaluation of alarm efficiency in intensive care [in French]. Ann Fr Anesth Reanim. 2000;19:459–466.
- , , , . Reducing false alarms of intensive care online‐monitoring systems: an evaluation of two signal extraction algorithms. Comput Math Methods Med. 2011;2011:143480.
- , , , , , . Multicentric study of monitoring alarms in the adult intensive care unit (ICU): a descriptive analysis. Intensive Care Med. 1999;25:1360–1366.
- , , . Improving alarm performance in the medical intensive care unit using delays and clinical context. Anesth Analg. 2009;108:1546–1552.
- , . Monitor alarm fatigue: standardizing use of physiological monitors and decreasing nuisance alarms. Am J Crit Care. 2010;19:28–34.
- , , , , , . Intensive care unit alarms—how many do we need? Crit Care Med. 2010;38:451–456.
- , , , . System operator response to warnings of danger: a laboratory investigation of the effects of the predictive value of a warning on human response time. J Exp Psychol Appl. 1995;1:19–33.
- , , . Human probability matching behaviour in response to alarms of varying reliability. Ergonomics. 1995;38:2300–2312.
- The Joint Commission. Sentinel event alert: medical device alarm safety in hospitals. 2013. Available at: http://www.jointcommission.org/sea_issue_50/. Accessed October 9, 2014.
- . Joint commission warns of alarm fatigue: multitude of alarms from monitoring devices problematic. JAMA. 2013;309(22):2315–2316.
- . Monitor alarm fatigue: an integrative review. Biomed Instrum Technol. 2012;46(4):268–277.
- NIH Certificates of Confidentiality Kiosk. Available at: http://grants.nih.gov/grants/policy/coc/. Accessed April 21, 2014.
- , , , et al. Video methods for evaluating physiologic monitor alarms and alarm responses. Biomed Instrum Technol. 2014;48(3):220–230.
- , , , , , . Research electronic data capture (REDCap)—a metadata‐driven methodology and workflow process for providing translational research informatics support. J Biomed Inf. 2009;42:377–381.
- . Accelerated failure time and other parametric models. In: Modelling Survival Data in Medical Research. 2nd ed. Boca Raton, FL: Chapman 2003:197–229.
- , , , . Parametric models. In: An Introduction to Survival Analysis Using Stata, 3rd ed. College Station, TX: Stata Press; 2010:229–244.
- , . Management and the Worker. Cambridge, MA: Harvard University Press; 1939.
- . What happened at Hawthorne? Science. 1974;183(4128):922–932.
- , , , , . Validation of the Work Observation Method By Activity Timing (WOMBAT) method of conducting time‐motion observations in critical care settings: an observational study. BMC Med Inf Decis Mak. 2011;11:32.
- , . Alarm fatigue: a patient safety concern. AACN Adv Crit Care. 2013;24(4):378–386.
- , . Redesigning hospital alarms for patient safety: alarmed and potentially dangerous. JAMA. 2014;311(12):1199–1200.
- The Joint Commission. The Joint Commission announces 2014 National Patient Safety Goal. Jt Comm Perspect. 2013;33:1–4.
- Top 10 health technology hazards for 2014. Health Devices. 2013;42(11):354–380.
- My Philly Lawyer. Medical malpractice: alarm fatigue threatens patient safety. 2014. Available at: http://www.myphillylawyer.com/Resources/Legal-Articles/Medical-Malpractice-Alarm-Fatigue-Threatens-Patient-Safety.shtml. Accessed April 4, 2014.
- , , , et al. Pulse oximetry desaturation alarms on a general postoperative adult unit: a prospective observational study of nurse response time. Int J Nurs Stud. 2013;50(10):1351–1358.
- , , , , . A description of nurses' decision‐making in managing electrocardiographic monitor alarms [published online ahead of print May 10, 2014]. J Clin Nurs. doi:10.1111/jocn.12625.
- . Nurses' response to frequency and types of electrocardiography alarms in a non‐critical care setting: a descriptive study. Int J Nurs Stud. 2014;51(2):190–197.
Hospital physiologic monitors can alert clinicians to early signs of physiologic deterioration, and thus have great potential to save lives. However, monitors generate frequent alarms,[1, 2, 3, 4, 5, 6, 7, 8] and most are not relevant to the patient's safety (over 90% of pediatric intensive care unit (PICU)[1, 2] and over 70% of adult intensive care alarms).[5, 6] In psychology experiments, humans rapidly learn to ignore or respond more slowly to alarms when exposed to high false‐alarm rates, exhibiting alarm fatigue.[9, 10] In 2013, The Joint Commission named alarm fatigue the most common contributing factor to alarm‐related sentinel events in hospitals.[11, 12]
Although alarm fatigue has been implicated as a major threat to patient safety, little empirical data support its existence in hospitals. In this study, we aimed to determine if there was an association between nurses' recent exposure to nonactionable physiologic monitor alarms and their response time to future alarms for the same patients. This exploratory work was designed to inform future research in this area, acknowledging that the sample size would be too small for multivariable modeling.
METHODS
Study Definitions
The alarm classification scheme is shown in Figure 1. Note that, for clarity, we have intentionally avoided using the terms true and false alarms because their interpretations vary across studies and can be misleading.
Potentially Critical Alarm
A potentially critical alarm is any alarm for a clinical condition for which a timely response is important to determine if the alarm requires intervention to save the patient's life. This is based on the alarm type alone, including alarms for life‐threatening arrhythmias such as asystole and ventricular tachycardia, as well as alarms for vital signs outside the set limits. Supporting Table 1 in the online version of this article lists the breakdown of alarm types that we defined a priori as potentially and not potentially critical.
| PICU | Ward | |||||||
|---|---|---|---|---|---|---|---|---|
| Alarm type | No. | % of Total | % Valid | % Actionable | No. | % of Total | % Valid | % Actionable |
| ||||||||
| Oxygen saturation | 197 | 19.4 | 82.7 | 38.6 | 590 | 41.2 | 24.4 | 1.9 |
| Heart rate | 194 | 19.1 | 95.4 | 1.0 | 266 | 18.6 | 87.2 | 0.0 |
| Respiratory rate | 229 | 22.6 | 80.8 | 13.5 | 316 | 22.1 | 48.1 | 1.0 |
| Blood pressure | 259 | 25.5 | 83.8 | 5.8 | 11 | 0.8 | 72.7 | 0.0 |
| Critical arrhythmia | 1 | 0.1 | 0.0 | 0.0 | 4 | 0.3 | 0.0 | 0.0 |
| Noncritical arrhythmia | 71 | 7.0 | 2.8 | 0.0 | 244 | 17.1 | 8.6 | 0.0 |
| Central venous pressure | 49 | 4.8 | 0.0 | 0.0 | 0 | 0.0 | N/A | N/A |
| Exhaled carbon dioxide | 14 | 1.4 | 92.9 | 50.0 | 0 | 0.0 | N/A | N/A |
| Total | 1014 | 100.0 | 75.6 | 12.9 | 1,431 | 100.0 | 38.9 | 1.0 |
Valid Alarm
A valid alarm is any alarm that correctly identifies the physiologic status of the patient. Validity was based on waveform quality, lead signal strength indicators, and artifact conditions, referencing each monitor's operator's manual.
Actionable Alarm
An actionable alarm is any valid alarm for a clinical condition that either: (1) leads to a clinical intervention; (2) leads to a consultation with another clinician at the bedside (and thus visible on camera); or (3) is a situation that should have led to intervention or consultation, but the alarm was unwitnessed or misinterpreted by the staff at the bedside.
Nonactionable Alarm
An unactionable alarm is any alarm that does not meet the actionable definition above, including invalid alarms such as those caused by motion artifact, equipment/technical alarms, and alarms that are valid but nonactionable (nuisance alarms).[13]
Response Time
The response time is the time elapsed from when the alarm fired at the bedside to when the nurse entered the room or peered through a window or door, measured in seconds.
Setting and Subjects
We performed this study between August 2012 and July 2013 at a freestanding children's hospital. We evaluated nurses caring for 2 populations: (1) PICU patients with heart and/or lung failure (requiring inotropic support and/or invasive mechanical ventilation), and (2) medical patients on a general inpatient ward. Nurses caring for heart and/or lung failure patients in the PICU typically were assigned 1 to 2 total patients. Nurses on the medical ward typically were assigned 2 to 4 patients. We identified subjects from the population of nurses caring for eligible patients with parents available to provide in‐person consent in each setting. Our primary interest was to evaluate the association between nonactionable alarms and response time, and not to study the epidemiology of alarms in a random sample. Therefore, when alarm data were available prior to screening, we first approached nurses caring for patients in the top 25% of alarm rates for that unit over the preceding 4 hours. We identified preceding alarm rates using BedMasterEx (Excel Medical Electronics, Jupiter, FL).
Human Subjects Protection
This study was approved by the institutional review board of The Children's Hospital of Philadelphia. We obtained written in‐person consent from the patient's parent and the nurse subject. We obtained a Certificate of Confidentiality from the National Institutes of Health to further protect study participants.[14]
Monitoring Equipment
All patients in the PICU were monitored continuously using General Electric (GE) (Fairfield, CT) solar devices. All bed spaces on the wards include GE Dash monitors that are used if ordered. On the ward we studied, 30% to 50% of patients are typically monitored at any given time. In addition to alarming at the bedside, most clinical alarms also generated a text message sent to the nurse's wireless phone listing the room number and the word monitor. Messages did not provide any clinical information about the alarm or patient's status. There were no technicians reviewing alarms centrally.
Physicians used an order set to order monitoring, selecting 1 of 4 available preconfigured profiles: infant <6 months, infant 6 months to 1 year, child, and adult. The parameters for each age group are in Supporting Figure 1, available in the online version of this article. A physician order is required for a nurse to change the parameters. Participating in the study did not affect this workflow.
Primary Outcome
The primary outcome was the nurse's response time to potentially critical monitor alarms that occurred while neither they nor any other clinicians were in the patient's room.
Primary Exposure and Alarm Classification
The primary exposure was the number of nonactionable alarms in the same patient over the preceding 120 minutes (rolling and updated each minute). The alarm classification scheme is shown in Figure 1.
Due to technical limitations with obtaining time‐stamped alarm data from the different ventilators in use during the study period, we were unable to identify the causes of all ventilator alarms. Therefore, we included ventilator alarms that did not lead to clinical interventions as nonactionable alarm exposures, but we did not evaluate the response time to any ventilator alarms.
Data Collection
We combined video recordings with monitor time‐stamp data to evaluate the association between nonactionable alarms and the nurse's response time. Our detailed video recording and annotation methods have been published separately.[15] Briefly, we mounted up to 6 small video cameras in patients' rooms and recorded up to 6 hours per session. The cameras captured the monitor display, a wide view of the room, a close‐up view of the patient, and all windows and doors through which staff could visually assess the patient without entering the room.
Video Processing, Review, and Annotation
The first 5 video sessions were reviewed in a group training setting. Research assistants received instruction on how to determine alarm validity and actionability in accordance with the study definitions. Following the training period, the review workflow was as follows. First, a research assistant entered basic information and a preliminary assessment of the alarm's clinical validity and actionability into a REDCap (Research Electronic Data Capture; Vanderbilt University, Nashville, TN) database.[16] Later, a physician investigator secondarily reviewed all alarms and confirmed the assessments of the research assistants or, when disagreements occurred, discussed and reconciled the database. Alarms that remained unresolved after secondary review were flagged for review with an additional physician or nurse investigator in a team meeting.
Data Analysis
We summarized the patient and nurse subjects, the distributions of alarms, and the response times to potentially critical monitor alarms that occurred while neither the nurse nor any other clinicians were in the patient's room. We explored the data using plots of alarms and response times occurring within individual video sessions as well as with simple linear regression. Hypothesizing that any alarm fatigue effect would be strongest in the highest alarm patients, and having observed that alarms are distributed very unevenly across patients in both the PICU and ward, we made the decision not to use quartiles, but rather to form clinically meaningful categories. We also hypothesized that nurses might not exhibit alarm fatigue unless they were inundated with alarms. We thus divided the nonactionable alarm counts over the preceding 120 minutes into 3 categories: 0 to 29 alarms to represent a low to average alarm rate exhibited by the bottom 50% of the patients, 30 to 79 alarms to represent an elevated alarm rate, and 80+ alarms to represent an extremely high alarm rate exhibited by the top 5%. Because the exposure time was 120 minutes, we conducted the analysis on the alarms occurring after a nurse had been video recorded for at least 120 minutes.
We further evaluated the relationship between nonactionable alarms and nurse response time with Kaplan‐Meier plots by nonactionable alarm count category using the observed response‐time data. The Kaplan‐Meier plots compared response time across the nonactionable alarm exposure group, without any statistical modeling. A log‐rank test stratified by nurse evaluated whether the distributions of response time in the Kaplan‐Meier plots differed across the 3 alarm exposure groups, accounting for within‐nurse clustering.
Accelerated failure‐time regression based on the Weibull distribution then allowed us to compare response time across each alarm exposure group and provided confidence intervals. Accelerated failure‐time models are comparable to Cox models, but emphasize time to event rather than hazards.[17, 18] We determined that the Weibull distribution was suitable by evaluating smoothed hazard and log‐hazard plots, the confidence intervals of the shape parameters in the Weibull models that did not include 1, and by demonstrating that the Weibull model had better fit than an alternative (exponential) model using the likelihood‐ratio test (P<0.0001 for PICU, P=0.02 for ward). Due to the small sample size of nurses and patients, we could not adjust for nurse‐ or patient‐level covariates in the model. When comparing the nonactionable alarm exposure groups in the regression model (029 vs 3079, 3079 vs 80+, and 029 vs 80+), we Bonferroni corrected the critical P value for the 3 comparisons, for a critical P value of 0.05/3=0.0167.
Nurse Questionnaire
At the session's conclusion, nurses completed a questionnaire that included demographics and asked, Did you respond more quickly to monitor alarms during this study because you knew you were being filmed? to measure if nurses would report experiencing a Hawthorne‐like effect.[19, 20, 21]
RESULTS
We performed 40 sessions among 40 patients and 36 nurses over 210 hours. We performed 20 sessions in children with heart and/or lung failure in the PICU and 20 sessions in children on a general ward. Sessions took place on weekdays between 9:00 am and 6:00 pm. There were 3 occasions when we filmed 2 patients cared for by the same nurse at the same time.
Nurses were mostly female (94.4%) and had between 2 months and 28 years of experience (median, 4.8 years). Patients on the ward ranged from 5 days to 5.4 years old (median, 6 months). Patients in the PICU ranged from 5 months to 16 years old (median, 2.5 years). Among the PICU patients, 14 (70%) were receiving mechanical ventilation only, 3 (15%) were receiving vasopressors only, and 3 (15%) were receiving mechanical ventilation and vasopressors.
We observed 5070 alarms during the 40 sessions. We excluded 108 (2.1%) that occurred at the end of video recording sessions with the nurse absent from the room because the nurse's response could not be determined. Alarms per session ranged from 10 to 1430 (median, 75; interquartile range [IQR], 35138). We excluded the outlier PICU patient with 1430 alarms in 5 hours from the analysis to avoid the potential for biasing the results. Figure 2 depicts the data flow.
Following the 5 training sessions, research assistants independently reviewed and made preliminary assessments on 4674 alarms; these alarms were all secondarily reviewed by a physician. Using the physician reviewer as the gold standard, the research assistant's sensitivity (assess alarm as actionable when physician also assesses as actionable) was 96.8% and specificity (assess alarm as nonactionable when physician also assesses as nonactionable) was 96.9%. We had to review 54 of 4674 alarms (1.2%) with an additional physician or nurse investigator to achieve consensus.
Characteristics of the 2445 alarms for clinical conditions are shown in Table 1. Only 12.9% of alarms in heart‐ and/or lung‐failure patients in the PICU were actionable, and only 1.0% of alarms in medical patients on a general inpatient ward were actionable.
Overall Response Times for Out‐of‐Room Alarms
We first evaluated response times without excluding alarms occurring prior to the 120‐minute mark. Of the 2445 clinical condition alarms, we excluded the 315 noncritical arrhythmia types from analysis of response time because they did not meet our definition of potentially critical alarms. Of the 2130 potentially critical alarms, 1185 (55.6%) occurred while neither the nurse nor any other clinician was in the patient's room. We proceeded to analyze the response time to these 1185 alarms (307 in the PICU and 878 on the ward). In the PICU, median response time was 3.3 minutes (IQR, 0.814.4). On the ward, median response time was 9.8 minutes (IQR, 3.222.4).
Response‐Time Association With Nonactionable Alarm Exposure
Next, we analyzed the association between response time to potentially critical alarms that occurred when the nurse was not in the patient's room and the number of nonactionable alarms occurring over the preceding 120‐minute window. This required excluding the alarms that occurred in the first 120 minutes of each session, leaving 647 alarms with eligible response times to evaluate the exposure between prior nonactionable alarm exposure and response time: 219 in the PICU and 428 on the ward. Kaplan‐Meier plots and tabulated response times demonstrated the incremental relationships between each nonactionable alarm exposure category in the observed data, with the effects most prominent as the Kaplan‐Meier plots diverged beyond the median (Figure 3 and Table 2). Excluding the extreme outlier patient had no effect on the results, because 1378 of the 1430 alarms occurred with the nurse present at the bedside, and only 2 of the remaining alarms were potentially critical.
| Observed Data | Accelerated Failure‐Time Model | |||||||
|---|---|---|---|---|---|---|---|---|
| Number of Potentially Critical Alarms | Minutes Elapsed Until This Percentage of Alarms Was Responded to | Modeled Response Time, min | 95% CI, min | P Value* | ||||
| 50% (Median) | 75% | 90% | 95% | |||||
| ||||||||
| PICU | ||||||||
| 029 nonactionable alarms | 70 | 1.6 | 8.0 | 18.6 | 25.1 | 2.8 | 1.9‐3.8 | Reference |
| 3079 nonactionable alarms | 122 | 6.3 | 17.8 | 22.5 | 26.0 | 5.3 | 4.06.7 | 0.001 (vs 029) |
| 80+ nonactionable alarms | 27 | 16.0 | 28.4 | 32.0 | 33.1 | 8.5 | 4.312.7 | 0.009 (vs 029), 0.15 (vs 3079) |
| Ward | ||||||||
| 029 nonactionable alarms | 159 | 9.8 | 17.8 | 25.0 | 28.9 | 7.7 | 6.39.1 | Reference |
| 3079 nonactionable alarms | 211 | 11.6 | 22.4 | 44.6 | 63.2 | 11.5 | 9.613.3 | 0.001 (vs 029) |
| 80+ nonactionable alarms | 58 | 8.3 | 57.6 | 63.8 | 69.5 | 15.6 | 11.020.1 | 0.001 (vs 029), 0.09 (vs 3079) |
Accelerated failure‐time regressions revealed significant incremental increases in the modeled response time as the number of preceding nonactionable alarms increased in both the PICU and ward settings (Table 2).
Hawthorne‐like Effects
Four of the 36 nurses reported that they responded more quickly to monitor alarms because they knew they were being filmed.
DISCUSSION
Alarm fatigue has recently generated interest among nurses,[22] physicians,[23] regulatory bodies,[24] patient safety organizations,[25] and even attorneys,[26] despite a lack of prior evidence linking nonactionable alarm exposure to response time or other adverse patient‐relevant outcomes. This study's main findings were that (1) the vast majority of alarms were nonactionable, (2) response time to alarms occurring while the nurse was out of the room increased as the number of nonactionable alarms over the preceding 120 minutes increased. These findings may be explained by alarm fatigue.
Our results build upon the findings of other related studies. The nonactionable alarm proportions we found were similar to other pediatric studies, reporting greater than 90% nonactionable alarms.[1, 2] One other study has reported a relationship between alarm exposure and response time. In that study, Voepel‐Lewis and colleagues evaluated nurse responses to pulse oximetry desaturation alarms in adult orthopedic surgery patients using time‐stamp data from their monitor notification system.[27] They found that alarm response time was significantly longer for patients in the highest quartile of alarms compared to those in lower quartiles. Our study provides new data suggesting a relationship between nonactionable alarm exposure and nurse response time.
Our study has several limitations. First, as a preliminary study to investigate feasibility and possible association, the sample of patients and nurses was necessarily limited and did not permit adjustment for nurse‐ or patient‐level covariates. A multivariable analysis with a larger sample might provide insight into alternate explanations for these findings other than alarm fatigue, including measures of nurse workload and patient factors (such as age and illness severity). Additional factors that are not as easily measured can also contribute to the complex decision of when and how to respond to alarms.[28, 29] Second, nurses were aware that they were being video recorded as part of a study of nonactionable alarms, although they did not know the specific details of measurement. Although this lack of blinding might lead to a Hawthorne‐like effect, our positive results suggest that this effect, if present, did not fully obscure the association. Third, all sessions took place on weekdays during daytime hours, but effects of nonactionable alarms might vary by time and day. Finally, we suspect that when nurses experience critical alarms that require them to intervene and rescue a patient, their response times to that patient's alarms that occur later in their shift will be quicker due to a heightened concern for the alarm being actionable. We were unable to explore that relationship in this analysis because the number of critical alarms requiring intervention was very small. This is a topic of future study.
CONCLUSIONS
We identified an association between a nurse's prior exposure to nonactionable alarms and response time to future alarms. This finding is consistent with alarm fatigue, but requires further study to more clearly delineate other factors that might confound or modify that relationship.
Disclosures
This project was funded by the Health Research Formula Fund Grant 4100050891 from the Pennsylvania Department of Public Health Commonwealth Universal Research Enhancement Program (awarded to Drs. Keren and Bonafide). Dr. Bonafide is also supported by the National Heart, Lung, and Blood Institute of the National Institutes of Health under award number K23HL116427. The content is solely the responsibility of the authors and does not necessarily represent the official views of the National Institutes of Health. The authors have no financial relationships or conflicts of interest relevant to this article to disclose.
- . Crying wolf: false alarms in a pediatric intensive care unit. Crit Care Med. 1994;22(6):981–985.
- , . Poor prognosis for existing monitors in the intensive care unit. Crit Care Med. 1997;25(4):614–619.
- , , , , . Clinical evaluation of alarm efficiency in intensive care [in French]. Ann Fr Anesth Reanim. 2000;19:459–466.
- , , , . Reducing false alarms of intensive care online‐monitoring systems: an evaluation of two signal extraction algorithms. Comput Math Methods Med. 2011;2011:143480.
- , , , , , . Multicentric study of monitoring alarms in the adult intensive care unit (ICU): a descriptive analysis. Intensive Care Med. 1999;25:1360–1366.
- , , . Improving alarm performance in the medical intensive care unit using delays and clinical context. Anesth Analg. 2009;108:1546–1552.
- , . Monitor alarm fatigue: standardizing use of physiological monitors and decreasing nuisance alarms. Am J Crit Care. 2010;19:28–34.
- , , , , , . Intensive care unit alarms—how many do we need? Crit Care Med. 2010;38:451–456.
- , , , . System operator response to warnings of danger: a laboratory investigation of the effects of the predictive value of a warning on human response time. J Exp Psychol Appl. 1995;1:19–33.
- , , . Human probability matching behaviour in response to alarms of varying reliability. Ergonomics. 1995;38:2300–2312.
- The Joint Commission. Sentinel event alert: medical device alarm safety in hospitals. 2013. Available at: http://www.jointcommission.org/sea_issue_50/. Accessed October 9, 2014.
- . Joint commission warns of alarm fatigue: multitude of alarms from monitoring devices problematic. JAMA. 2013;309(22):2315–2316.
- . Monitor alarm fatigue: an integrative review. Biomed Instrum Technol. 2012;46(4):268–277.
- NIH Certificates of Confidentiality Kiosk. Available at: http://grants.nih.gov/grants/policy/coc/. Accessed April 21, 2014.
- , , , et al. Video methods for evaluating physiologic monitor alarms and alarm responses. Biomed Instrum Technol. 2014;48(3):220–230.
- , , , , , . Research electronic data capture (REDCap)—a metadata‐driven methodology and workflow process for providing translational research informatics support. J Biomed Inf. 2009;42:377–381.
- . Accelerated failure time and other parametric models. In: Modelling Survival Data in Medical Research. 2nd ed. Boca Raton, FL: Chapman 2003:197–229.
- , , , . Parametric models. In: An Introduction to Survival Analysis Using Stata, 3rd ed. College Station, TX: Stata Press; 2010:229–244.
- , . Management and the Worker. Cambridge, MA: Harvard University Press; 1939.
- . What happened at Hawthorne? Science. 1974;183(4128):922–932.
- , , , , . Validation of the Work Observation Method By Activity Timing (WOMBAT) method of conducting time‐motion observations in critical care settings: an observational study. BMC Med Inf Decis Mak. 2011;11:32.
- , . Alarm fatigue: a patient safety concern. AACN Adv Crit Care. 2013;24(4):378–386.
- , . Redesigning hospital alarms for patient safety: alarmed and potentially dangerous. JAMA. 2014;311(12):1199–1200.
- The Joint Commission. The Joint Commission announces 2014 National Patient Safety Goal. Jt Comm Perspect. 2013;33:1–4.
- Top 10 health technology hazards for 2014. Health Devices. 2013;42(11):354–380.
- My Philly Lawyer. Medical malpractice: alarm fatigue threatens patient safety. 2014. Available at: http://www.myphillylawyer.com/Resources/Legal-Articles/Medical-Malpractice-Alarm-Fatigue-Threatens-Patient-Safety.shtml. Accessed April 4, 2014.
- , , , et al. Pulse oximetry desaturation alarms on a general postoperative adult unit: a prospective observational study of nurse response time. Int J Nurs Stud. 2013;50(10):1351–1358.
- , , , , . A description of nurses' decision‐making in managing electrocardiographic monitor alarms [published online ahead of print May 10, 2014]. J Clin Nurs. doi:10.1111/jocn.12625.
- . Nurses' response to frequency and types of electrocardiography alarms in a non‐critical care setting: a descriptive study. Int J Nurs Stud. 2014;51(2):190–197.
© 2015 Society of Hospital Medicine

Medications and Pediatric Deterioration
In recent years, many hospitals have implemented rapid response systems (RRSs) in efforts to reduce mortality outside the intensive care unit (ICU). Rapid response systems include 2 clinical components (efferent and afferent limbs) and 2 organizational components (process improvement and administrative limbs).[1, 2] The efferent limb includes medical emergency teams (METs) that can be summoned to hospital wards to rescue deteriorating patients. The afferent limb identifies patients at risk of deterioration using tools such as early warning scores and triggers a MET response when appropriate.[2] The process‐improvement limb evaluates and optimizes the RRS. The administrative limb implements the RRS and supports its ongoing operation. The effectiveness of most RRSs depends upon the ward team making the decision to escalate care by activating the MET. Barriers to activating the MET may include reduced situational awareness,[3, 4] hierarchical barriers to calling for help,[3, 4, 5, 6, 7, 8] fear of criticism,[3, 8, 9] and other hospital safety cultural barriers.[3, 4, 8]
Proactive critical‐care outreach[10, 11, 12, 13] or rover[14] teams seek to reduce barriers to activation and improve outcomes by systematically identifying and evaluating at‐risk patients without relying on requests for assistance from the ward team. Structured similarly to early warning scores, surveillance tools intended for rover teams might improve their ability to rapidly identify at‐risk patients throughout a hospital. They could combine vital signs with other variables, such as diagnostic and therapeutic interventions that reflect the ward team's early, evolving concern. In particular, the incorporation of medications associated with deterioration may enhance the performance of surveillance tools.
Medications may be associated with deterioration in one of several ways. They could play a causal role in deterioration (ie, opioids causing respiratory insufficiency), represent clinical worsening and anticipation of possible deterioration (ie, broad‐spectrum antibiotics for a positive blood culture), or represent rescue therapies for early deterioration (ie, antihistamines for allergic reactions). In each case, the associated therapeutic classes could be considered sentinel markers of clinical deterioration.
Combined with vital signs and other risk factors, therapeutic classes could serve as useful components of surveillance tools to detect signs of early, evolving deterioration and flag at‐risk patients for evaluation. As a first step, we sought to identify therapeutic classes associated with clinical deterioration. This effort to improve existing afferent tools falls within the process‐improvement limb of RRSs.
PATIENTS AND METHODS
Study Design
We performed a case‐crossover study of children who experienced clinical deterioration. An alternative to the matched case‐control design, the case‐crossover design involves longitudinal within‐subject comparisons exclusively of case subjects such that an individual serves as his or her own control. It is most effective when studying intermittent exposures that result in transient changes in the risk of an acute event,[15, 16, 17] making it appropriate for our study.
Using the case‐crossover design, we compared a discrete time period in close proximity to the deterioration event, called the hazard interval, with earlier time periods in the hospitalization, called the control intervals.[15, 16, 17] In our primary analysis (Figure 1B), we defined the durations of these intervals as follows: We first censored the 2 hours immediately preceding the clinical deterioration event (hours 0 to 2). We made this decision a priori to exclude medications used after deterioration was recognized and resuscitation had already begun. The 12‐hour period immediately preceding the censored interval was the hazard interval (hours 2 to 14). Each 12‐hour period immediately preceding the hazard interval was a control interval (hours 14 to 26, 26 to 38, 38 to 50, and 50 to 62). Depending on the child's length of stay prior to the deterioration event, each hazard interval had 14 control intervals for comparison. In sensitivity analysis, we altered the durations of these intervals (see below).
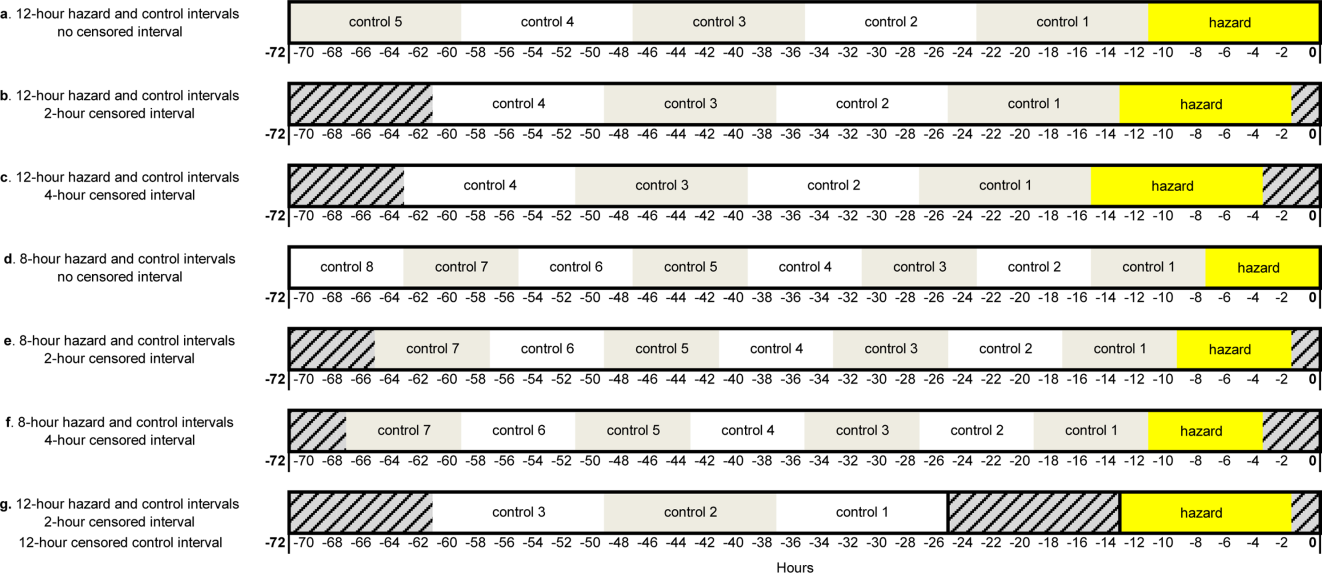
Study Setting and Participants
We performed this study among children age <18 years who experienced clinical deterioration between January 1, 2005, and December 31, 2008, after being hospitalized on a general medical or surgical unit at The Children's Hospital of Philadelphia for 24 hours. Clinical deterioration was a composite outcome defined as cardiopulmonary arrest (CPA), acute respiratory compromise (ARC), or urgent ICU transfer. Cardiopulmonary arrest events required either pulselessness or a pulse with inadequate perfusion treated with chest compressions and/or defibrillation. Acute respiratory compromise events required respiratory insufficiency treated with bag‐valve‐mask or invasive airway interventions. Urgent ICU transfers included 1 of the following outcomes in the 12 hours after transfer: death, CPA, intubation, initiation of noninvasive ventilation, or administration of a vasoactive medication infusion used for the treatment of shock. Time zero was the time of the CPA/ARC, or the time at which the child arrived in the ICU for urgent transfers. These subjects also served as the cases for a previously published case‐control study evaluating different risk factors for deterioration.[18] The institutional review board of The Children's Hospital of Philadelphia approved the study.
At the time of the study, the hospital did not have a formal RRS. An immediate‐response code‐blue team was available throughout the study period for emergencies occurring outside the ICU. Physicians could also page the pediatric ICU fellow to discuss patients who did not require immediate assistance from the code‐blue team but were clinically deteriorating. There were no established triggering criteria.
Medication Exposures
Intravenous (IV) medications administered in the 72 hours prior to clinical deterioration were considered the exposures of interest. Each medication was included in 1 therapeutic classes assigned in the hospital's formulary (Lexicomp, Hudson, OH).[19] In order to determine which therapeutic classes to evaluate, we performed a power calculation using the sampsi_mcc package for Stata 12 (StataCorp, College Station, TX). We estimated that we would have 3 matched control intervals per hazard interval. We found that, in order to detect a minimum odds ratio of 3.0 with 80% power, a therapeutic class had to be administered in 5% of control periods. All therapeutic classes meeting that requirement were included in the analysis and are listed in Table 1. (See lists of the individual medications comprising each class in the Supporting Information, Tables 124, in the online version of this article.)
| Therapeutic Class | No. of Control Intervals | % |
|---|---|---|
| ||
| Sedatives | 107 | 25 |
| Antiemetics | 92 | 22 |
| Third‐ and fourth‐generation cephalosporins | 83 | 20 |
| Antihistamines | 74 | 17 |
| Antidotes to hypersensitivity reactions (diphenhydramine) | 65 | 15 |
| Gastric acid secretion inhibitors | 62 | 15 |
| Loop diuretics | 62 | 15 |
| Anti‐inflammatory agents | 61 | 14 |
| Penicillin antibiotics | 61 | 14 |
| Benzodiazepines | 59 | 14 |
| Hypnotics | 58 | 14 |
| Narcotic analgesics (full opioid agonists) | 54 | 13 |
| Antianxiety agents | 53 | 13 |
| Systemic corticosteroids | 53 | 13 |
| Glycopeptide antibiotics (vancomycin) | 46 | 11 |
| Anaerobic antibiotics | 45 | 11 |
| Histamine H2 antagonists | 41 | 10 |
| Antifungal agents | 37 | 9 |
| Phenothiazine derivatives | 37 | 9 |
| Adrenal corticosteroids | 35 | 8 |
| Antiviral agents | 30 | 7 |
| Aminoglycoside antibiotics | 26 | 6 |
| Narcotic analgesics (partial opioid agonists) | 26 | 6 |
| PPIs | 26 | 6 |
Data Collection
Data were abstracted from the electronic medication administration record (Sunrise Clinical Manager; Allscripts, Chicago, IL) into a database. For each subject, we recorded the name and time of administration of each IV medication given in the 72 hours preceding deterioration, as well as demographic, event, and hospitalization characteristics.
Statistical Analysis
We used univariable conditional logistic regression to evaluate the association between each therapeutic class and the composite outcome of clinical deterioration in the primary analysis. Because cases serve as their own controls in the case‐crossover design, this method inherently adjusts for all subject‐specific time‐invariant confounding variables, such as patient demographics, disease, and hospital‐ward characteristics.[15]
Sensitivity Analysis
Our primary analysis used a 2‐hour censored interval and 12‐hour hazard and control intervals. Excluding the censored interval from analysis was a conservative approach that we chose because our goal was to identify therapeutic classes associated with deterioration during a phase in which adverse outcomes may be prevented with early intervention. In order to test whether our findings were stable across different lengths of censored, hazard, and control intervals, we performed a sensitivity analysis, also using conditional logistic regression, on all therapeutic classes that were significant (P<0.05) in primary analysis. In 6 iterations of the sensitivity analysis, we varied the length of the hazard and control intervals between 8 and 12 hours, and the length of the censored interval between 0 and 4 hours (Figure 1AF). In a seventh iteration, we used a variant of the primary analysis in which we censored the first control interval (Figure 1G).
RESULTS
We identified 12 CPAs, 41 ARCs, and 699 ICU transfers during the study period. Of these 752 events, 141 (19%) were eligible as cases according to our inclusion criteria.[18] (A flowchart demonstrating the identification of eligible cases is provided in Supporting Table 25 in the online version of this article.) Of the 81% excluded, 37% were ICU transfers who did not meet urgent criteria. Another 31% were excluded because they were hospitalized for <24 hours at the time of the event, making their analysis in a case‐crossover design using 12‐hour periods impossible. Event characteristics, demographics, and hospitalization characteristics are shown in Table 2.
| n | % | |
|---|---|---|
| ||
| Type of event | ||
| CPA | 4 | 3 |
| ARC | 29 | 20 |
| Urgent ICU transfer | 108 | 77 |
| Demographics | ||
| Age | ||
| 0<6 months | 17 | 12 |
| 6<12 months | 22 | 16 |
| 1<4 years | 34 | 24 |
| 4<10 years | 26 | 18 |
| 10<18 years | 42 | 30 |
| Sex | ||
| F | 60 | 43 |
| M | 81 | 57 |
| Race | ||
| White | 69 | 49 |
| Black/African American | 49 | 35 |
| Asian/Pacific Islander | 0 | 0 |
| Other | 23 | 16 |
| Ethnicity | ||
| Non‐Hispanic | 127 | 90 |
| Hispanic | 14 | 10 |
| Hospitalization | ||
| Surgical service | 4 | 3 |
| Survived to hospital discharge | 107 | 76 |
Primary Analysis
A total of 141 hazard intervals and 487 control intervals were included in the primary analysis, the results of which are shown in Table 3. Among the antimicrobial therapeutic classes, glycopeptide antibiotics (vancomycin), anaerobic antibiotics, third‐generation and fourth‐generation cephalosporins, and aminoglycoside antibiotics were significant. All of the anti‐inflammatory therapeutic classes, including systemic corticosteroids, anti‐inflammatory agents, and adrenal corticosteroids, were significant. All of the sedatives, hypnotics, and antianxiety therapeutic classes, including sedatives, benzodiazepines, hypnotics, and antianxiety agents, were significant. Among the narcotic analgesic therapeutic classes, only 1 class, narcotic analgesics (full opioid agonists), was significant. None of the gastrointestinal therapeutic classes were significant. Among the classes classified as other, loop diuretics and antidotes to hypersensitivity reactions (diphenhydramine) were significant.
| OR | LCI | UCI | P Value | |
|---|---|---|---|---|
| ||||
| Antimicrobial therapeutic classes | ||||
| Glycopeptide antibiotics (vancomycin) | 5.84 | 2.01 | 16.98 | 0.001 |
| Anaerobic antibiotics | 5.33 | 1.36 | 20.94 | 0.02 |
| Third‐ and fourth‐generation cephalosporins | 2.78 | 1.15 | 6.69 | 0.02 |
| Aminoglycoside antibiotics | 2.90 | 1.11 | 7.56 | 0.03 |
| Penicillin antibiotics | 2.40 | 0.9 | 6.4 | 0.08 |
| Antiviral agents | 1.52 | 0.20 | 11.46 | 0.68 |
| Antifungal agents | 1.06 | 0.44 | 2.58 | 0.89 |
| Corticosteroids and other anti‐inflammatory therapeutic classes* | ||||
| Systemic corticosteroids | 3.69 | 1.09 | 12.55 | 0.04 |
| Anti‐inflammatory agents | 3.69 | 1.09 | 12.55 | 0.04 |
| Adrenal corticosteroids | 3.69 | 1.09 | 12.55 | 0.04 |
| Sedatives, hypnotics, and antianxiety therapeutic classes | ||||
| Sedatives | 3.48 | 1.78 | 6.78 | <0.001 |
| Benzodiazepines | 2.71 | 1.36 | 5.40 | 0.01 |
| Hypnotics | 2.54 | 1.27 | 5.09 | 0.01 |
| Antianxiety agents | 2.28 | 1.06 | 4.91 | 0.04 |
| Narcotic analgesic therapeutic classes | ||||
| Narcotic analgesics (full opioid agonists) | 2.48 | 1.07 | 5.73 | 0.03 |
| Narcotic analgesics (partial opioid agonists) | 1.97 | 0.57 | 6.85 | 0.29 |
| GI therapeutic classes | ||||
| Antiemetics | 0.57 | 0.22 | 1.48 | 0.25 |
| PPIs | 2.05 | 0.58 | 7.25 | 0.26 |
| Phenothiazine derivatives | 0.47 | 0.12 | 1.83 | 0.27 |
| Gastric acid secretion inhibitors | 1.71 | 0.61 | 4.81 | 0.31 |
| Histamine H2 antagonists | 0.95 | 0.17 | 5.19 | 0.95 |
| Other therapeutic classes | ||||
| Loop diuretics | 2.87 | 1.28 | 6.47 | 0.01 |
| Antidotes to hypersensitivity reactions (diphenhydramine) | 2.45 | 1.15 | 5.23 | 0.02 |
| Antihistamines | 2.00 | 0.97 | 4.12 | 0.06 |
Sensitivity Analysis
Of the 14 classes that were significant in primary analysis, we carried 9 forward to sensitivity analysis. The 5 that were not carried forward overlapped substantially with other classes that were carried forward. The decision of which overlapping class to carry forward was based upon (1) parsimony and (2) clinical relevance. This is described briefly in the footnotes to Table 3 (see Supporting information in the online version of this article for a full description of this process). Figure 2 presents the odds ratios and their 95% confidence intervals for the sensitivity analysis of each therapeutic class that was significant in primary analysis. Loop diuretics remained significantly associated with deterioration in all 7 iterations. Glycopeptide antibiotics (vancomycin), third‐generation and fourth‐generation cephalosporins, systemic corticosteroids, and benzodiazepines were significant in 6. Anaerobic antibiotics and narcotic analgesics (full opioid agonists) were significant in 5, and aminoglycoside antibiotics and antidotes to hypersensitivity reactions (diphenhydramine) in 4.
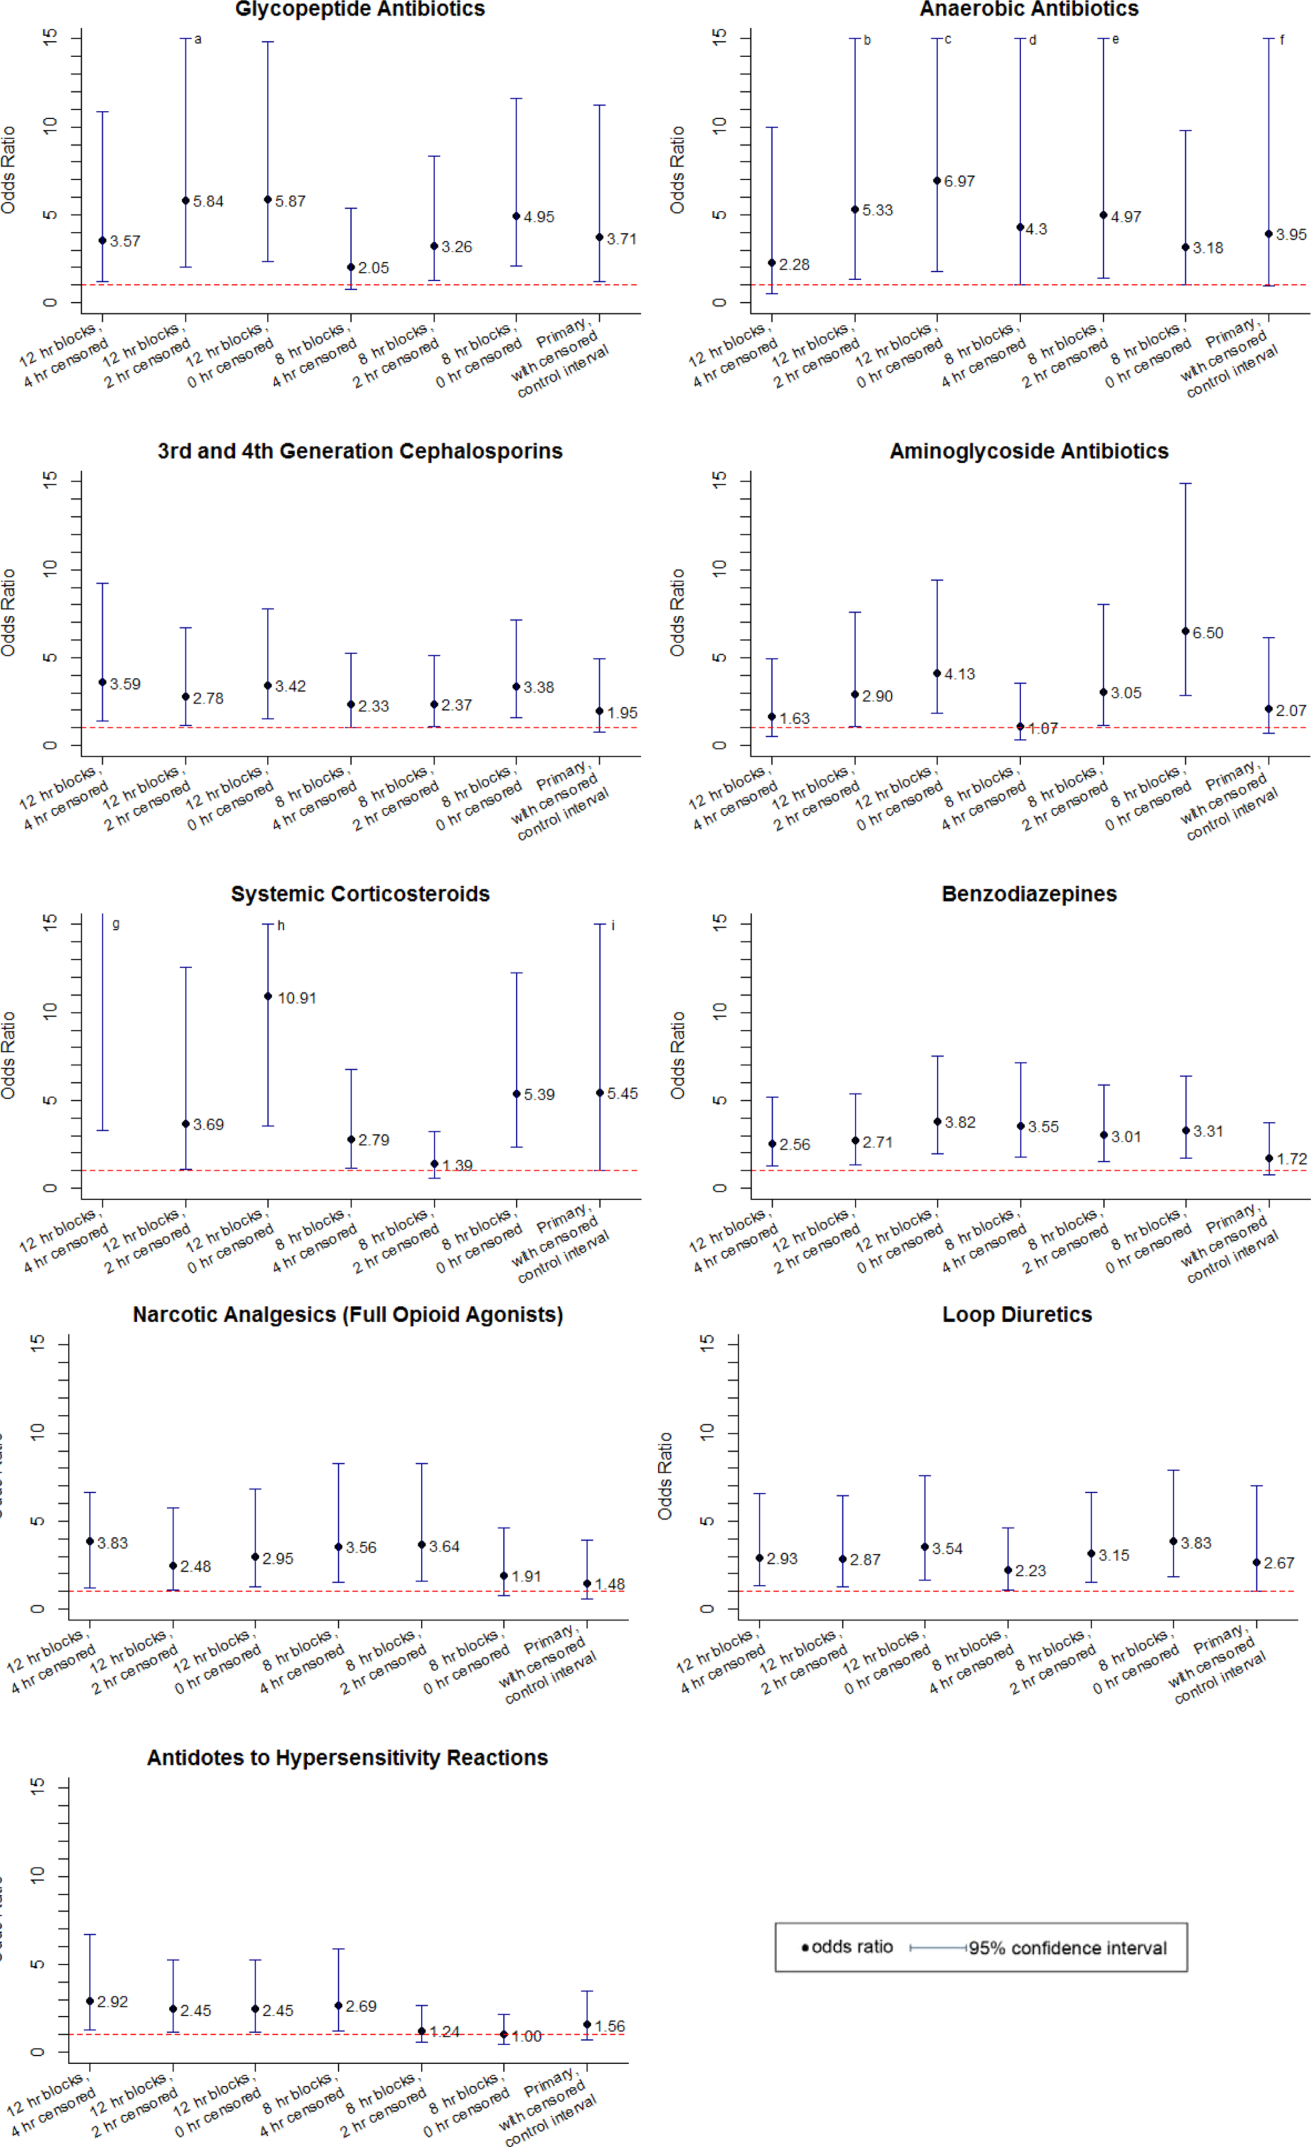
DISCUSSION
We identified 9 therapeutic classes which were associated with a 2.5‐fold to 5.8‐fold increased risk of clinical deterioration. The results were robust to sensitivity analysis. Given their temporal association to the deterioration events, these therapeutic classes may serve as sentinels of early deterioration and are candidate variables to combine with vital signs and other risk factors in a surveillance tool for rover teams or an early warning score.
Although most early warning scores intended for use at the bedside are based upon vital signs and clinical observations, a few also include medications. Monaghan's Pediatric Early Warning Score, the basis for many modified scores used in children's hospitals throughout the world, assigns points for children requiring frequent doses of nebulized medication.[20, 21, 22] Nebulized epinephrine is a component of the Bristol Paediatric Early Warning Tool.[23] The number of medications administered in the preceding 24 hours was included in an early version of the Bedside Paediatric Early Warning System Score.[24] Adding IV antibiotics to the Maximum Modified Early Warning Score improved prediction of the need for higher care utilization among hospitalized adults.[25]
In order to determine the role of the IV medications we found to be associated with clinical deterioration, the necessary next step is to develop a multivariable predictive model to determine if they improve the performance of existing early warning scores in identifying deteriorating patients. Although simplicity is an important characteristic of hand‐calculated early warning scores, integration of a more complex scoring system with more variables, such as these medications, into the electronic health record would allow for automated scoring, eliminating the need to sacrifice score performance to keep the tool simple. Integration into the electronic health record would have the additional benefit of making the score available to clinicians who are not at the bedside. Such tools would be especially useful for remote surveillance for deterioration by critical‐care outreach or rover teams.
Our study has several limitations. First, the sample size was small, and although we sought to minimize the likelihood of chance associations by performing sensitivity analysis, these findings should be confirmed in a larger study. Second, we only evaluated IV medications. Medications administered by other routes could also be associated with clinical deterioration and should be analyzed in future studies. Third, we excluded children hospitalized for <24 hours, as well as transfers that did not meet urgent criteria. These may be limitations because (1) the first 24 hours of hospitalization may be a high‐risk period, and (2) patients who were on trajectories toward severe deterioration and received interventions that prevented further deterioration but did not meet urgent transfer criteria were excluded. It may be that the children we included as cases were at increased risk of deterioration that is either more difficult to recognize early, or more difficult to treat effectively without ICU interventions. Finally, we acknowledge that in some cases the therapeutic classes were associated with deterioration in a causal fashion, and in others the medications administered did not cause deterioration but were signs of therapeutic interventions that were initiated in response to clinical worsening. Identifying the specific indications for administration of drugs used in response to clinical worsening may have resulted in stronger associations with deterioration. However, these indications are often complex, multifactorial, and poorly documented in real time. This limits the ability to automate their detection using the electronic health record, the ultimate goal of this line of research.
CONCLUSION
We used a case‐crossover approach to identify therapeutic classes that are associated with increased risk of clinical deterioration in hospitalized children on pediatric wards. These sentinel therapeutic classes may serve as useful components of electronic health recordbased surveillance tools to detect signs of early, evolving deterioration and flag at‐risk patients for critical‐care outreach or rover team review. Future research should focus on evaluating whether including these therapeutic classes in early warning scores improves their accuracy in detecting signs of deterioration and determining if providing this information as clinical decision support improves patient outcomes.
Acknowledgments
Disclosures: This study was funded by The Children's Hospital of Philadelphia Center for Pediatric Clinical Effectiveness Pilot Grant and the University of Pennsylvania Provost's Undergraduate Research Mentoring Program. Drs. Bonafide and Keren also receive funding from the Pennsylvania Health Research Formula Fund Award from the Pennsylvania Department of Health for research in pediatric hospital quality, safety, and costs. The authors have no other conflicts of interest to report.
- , , , et al. Findings of the first consensus conference on medical emergency teams. Crit Care Med. 2006;34(9):2463–2478.
- , , , et al. “Identifying the hospitalised patient in crisis”—a consensus conference on the afferent limb of rapid response systems. Resuscitation. 2010;81(4):375–382.
- , , , . Attitudes and barriers to a medical emergency team system at a tertiary paediatric hospital. Resuscitation. 2011;82(2):167–174.
- , , , et al. Why don't hospital staff activate the rapid response system (RRS)? How frequently is it needed and can the process be improved? Implement Sci. 2011;6:39.
- , . Failure of the afferent limb: a persistent problem in rapid response systems. Resuscitation. 2011;82(7):797–798.
- , , . Understanding how rapid response systems may improve safety for the acutely ill patient: learning from the frontline. BMJ Qual Saf. 2012;21(2):135–144.
- , , . How RNs rescue patients: a qualitative study of RNs' perceived involvement in rapid response teams. Qual Saf Health Care. 2010;19(5):1–4.
- , , , et al. A survey of nurses' beliefs about the medical emergency team system in a Canadian tertiary hospital. Am J Crit Care. 2010;19(1):74–83.
- , , , et al. Nurses' attitudes to a medical emergency team service in a teaching hospital. Qual Saf Health Care. 2006;15(6):427–432.
- , , , et al. Introducing critical care outreach: a ward‐randomised trial of phased introduction in a general hospital. Intensive Care Med. 2004;30(7):1398–1404.
- . Out of our reach? Assessing the impact of introducing a critical care outreach service. Anaesthesia. 2003;58(9):882–885.
- , , . Effect of the critical care outreach team on patient survival to discharge from hospital and readmission to critical care: non‐randomised population based study. BMJ. 2003;327(7422):1014.
- , , , et al. Successful implementation of a family and patient activated rapid response team in an adult level 1 trauma center. Resuscitation. 2010;81(12):1676–1681.
- , , , et al. Beyond rapid response teams: instituting a “Rover Team” improves the management of at‐risk patients, facilitates proactive interventions, and improves outcomes. In: Henriksen K, Battles JB, Keyes MA, Grady ML, eds. Advances in Patient Safety: New Directions and Alternative Approaches. Rockville, MD: Agency for Healthcare Research and Quality; 2008.
- , . The case‐crossover study design in pharmacoepidemiology. Stat Methods Med Res. 2009;18(1):53–65.
- , , , et al. Comparison of the statistical efficiency of case‐crossover and case‐control designs: application to severe cutaneous adverse reactions. J Clin Epidemiol. 2001;54(12):1218–1227.
- . The case‐crossover design: a method for studying transient effects on the risk of acute events. Am J Epidemiol. 1991;133(2):144–153.
- , , , , , . Development of a score to predict clinical deterioration in hospitalized children. J Hosp Med. 2012;7(4):345–349.
- Lexicomp. Available at: http://www.lexi.com. Accessed July 26, 2012.
- , , , , , . Sensitivity of the Pediatric Early Warning Score to identify patient deterioration. Pediatrics. 2010;125(4):e763–e769.
- . Detecting and managing deterioration in children. Paediatr Nurs. 2005;17(1):32–35.
- , , , , . Prospective evaluation of a pediatric inpatient early warning scoring system. J Spec Pediatr Nurs. 2009;14(2):79–85.
- , , . Promoting care for acutely ill children—development and evaluation of a Paediatric Early Warning Tool. Intensive Crit Care Nurs. 2006;22(2):73–81.
- , , . The Pediatric Early Warning System Score: a severity of illness score to predict urgent medical need in hospitalized children. J Crit Care. 2006;21(3):271–278.
- , , , , , . Performance of the maximum modified early warning score to predict the need for higher care utilization among admitted emergency department patients. J Hosp Med. 2010;5(1):E46–E52.
In recent years, many hospitals have implemented rapid response systems (RRSs) in efforts to reduce mortality outside the intensive care unit (ICU). Rapid response systems include 2 clinical components (efferent and afferent limbs) and 2 organizational components (process improvement and administrative limbs).[1, 2] The efferent limb includes medical emergency teams (METs) that can be summoned to hospital wards to rescue deteriorating patients. The afferent limb identifies patients at risk of deterioration using tools such as early warning scores and triggers a MET response when appropriate.[2] The process‐improvement limb evaluates and optimizes the RRS. The administrative limb implements the RRS and supports its ongoing operation. The effectiveness of most RRSs depends upon the ward team making the decision to escalate care by activating the MET. Barriers to activating the MET may include reduced situational awareness,[3, 4] hierarchical barriers to calling for help,[3, 4, 5, 6, 7, 8] fear of criticism,[3, 8, 9] and other hospital safety cultural barriers.[3, 4, 8]
Proactive critical‐care outreach[10, 11, 12, 13] or rover[14] teams seek to reduce barriers to activation and improve outcomes by systematically identifying and evaluating at‐risk patients without relying on requests for assistance from the ward team. Structured similarly to early warning scores, surveillance tools intended for rover teams might improve their ability to rapidly identify at‐risk patients throughout a hospital. They could combine vital signs with other variables, such as diagnostic and therapeutic interventions that reflect the ward team's early, evolving concern. In particular, the incorporation of medications associated with deterioration may enhance the performance of surveillance tools.
Medications may be associated with deterioration in one of several ways. They could play a causal role in deterioration (ie, opioids causing respiratory insufficiency), represent clinical worsening and anticipation of possible deterioration (ie, broad‐spectrum antibiotics for a positive blood culture), or represent rescue therapies for early deterioration (ie, antihistamines for allergic reactions). In each case, the associated therapeutic classes could be considered sentinel markers of clinical deterioration.
Combined with vital signs and other risk factors, therapeutic classes could serve as useful components of surveillance tools to detect signs of early, evolving deterioration and flag at‐risk patients for evaluation. As a first step, we sought to identify therapeutic classes associated with clinical deterioration. This effort to improve existing afferent tools falls within the process‐improvement limb of RRSs.
PATIENTS AND METHODS
Study Design
We performed a case‐crossover study of children who experienced clinical deterioration. An alternative to the matched case‐control design, the case‐crossover design involves longitudinal within‐subject comparisons exclusively of case subjects such that an individual serves as his or her own control. It is most effective when studying intermittent exposures that result in transient changes in the risk of an acute event,[15, 16, 17] making it appropriate for our study.
Using the case‐crossover design, we compared a discrete time period in close proximity to the deterioration event, called the hazard interval, with earlier time periods in the hospitalization, called the control intervals.[15, 16, 17] In our primary analysis (Figure 1B), we defined the durations of these intervals as follows: We first censored the 2 hours immediately preceding the clinical deterioration event (hours 0 to 2). We made this decision a priori to exclude medications used after deterioration was recognized and resuscitation had already begun. The 12‐hour period immediately preceding the censored interval was the hazard interval (hours 2 to 14). Each 12‐hour period immediately preceding the hazard interval was a control interval (hours 14 to 26, 26 to 38, 38 to 50, and 50 to 62). Depending on the child's length of stay prior to the deterioration event, each hazard interval had 14 control intervals for comparison. In sensitivity analysis, we altered the durations of these intervals (see below).
Study Setting and Participants
We performed this study among children age <18 years who experienced clinical deterioration between January 1, 2005, and December 31, 2008, after being hospitalized on a general medical or surgical unit at The Children's Hospital of Philadelphia for 24 hours. Clinical deterioration was a composite outcome defined as cardiopulmonary arrest (CPA), acute respiratory compromise (ARC), or urgent ICU transfer. Cardiopulmonary arrest events required either pulselessness or a pulse with inadequate perfusion treated with chest compressions and/or defibrillation. Acute respiratory compromise events required respiratory insufficiency treated with bag‐valve‐mask or invasive airway interventions. Urgent ICU transfers included 1 of the following outcomes in the 12 hours after transfer: death, CPA, intubation, initiation of noninvasive ventilation, or administration of a vasoactive medication infusion used for the treatment of shock. Time zero was the time of the CPA/ARC, or the time at which the child arrived in the ICU for urgent transfers. These subjects also served as the cases for a previously published case‐control study evaluating different risk factors for deterioration.[18] The institutional review board of The Children's Hospital of Philadelphia approved the study.
At the time of the study, the hospital did not have a formal RRS. An immediate‐response code‐blue team was available throughout the study period for emergencies occurring outside the ICU. Physicians could also page the pediatric ICU fellow to discuss patients who did not require immediate assistance from the code‐blue team but were clinically deteriorating. There were no established triggering criteria.
Medication Exposures
Intravenous (IV) medications administered in the 72 hours prior to clinical deterioration were considered the exposures of interest. Each medication was included in 1 therapeutic classes assigned in the hospital's formulary (Lexicomp, Hudson, OH).[19] In order to determine which therapeutic classes to evaluate, we performed a power calculation using the sampsi_mcc package for Stata 12 (StataCorp, College Station, TX). We estimated that we would have 3 matched control intervals per hazard interval. We found that, in order to detect a minimum odds ratio of 3.0 with 80% power, a therapeutic class had to be administered in 5% of control periods. All therapeutic classes meeting that requirement were included in the analysis and are listed in Table 1. (See lists of the individual medications comprising each class in the Supporting Information, Tables 124, in the online version of this article.)
| Therapeutic Class | No. of Control Intervals | % |
|---|---|---|
| ||
| Sedatives | 107 | 25 |
| Antiemetics | 92 | 22 |
| Third‐ and fourth‐generation cephalosporins | 83 | 20 |
| Antihistamines | 74 | 17 |
| Antidotes to hypersensitivity reactions (diphenhydramine) | 65 | 15 |
| Gastric acid secretion inhibitors | 62 | 15 |
| Loop diuretics | 62 | 15 |
| Anti‐inflammatory agents | 61 | 14 |
| Penicillin antibiotics | 61 | 14 |
| Benzodiazepines | 59 | 14 |
| Hypnotics | 58 | 14 |
| Narcotic analgesics (full opioid agonists) | 54 | 13 |
| Antianxiety agents | 53 | 13 |
| Systemic corticosteroids | 53 | 13 |
| Glycopeptide antibiotics (vancomycin) | 46 | 11 |
| Anaerobic antibiotics | 45 | 11 |
| Histamine H2 antagonists | 41 | 10 |
| Antifungal agents | 37 | 9 |
| Phenothiazine derivatives | 37 | 9 |
| Adrenal corticosteroids | 35 | 8 |
| Antiviral agents | 30 | 7 |
| Aminoglycoside antibiotics | 26 | 6 |
| Narcotic analgesics (partial opioid agonists) | 26 | 6 |
| PPIs | 26 | 6 |
Data Collection
Data were abstracted from the electronic medication administration record (Sunrise Clinical Manager; Allscripts, Chicago, IL) into a database. For each subject, we recorded the name and time of administration of each IV medication given in the 72 hours preceding deterioration, as well as demographic, event, and hospitalization characteristics.
Statistical Analysis
We used univariable conditional logistic regression to evaluate the association between each therapeutic class and the composite outcome of clinical deterioration in the primary analysis. Because cases serve as their own controls in the case‐crossover design, this method inherently adjusts for all subject‐specific time‐invariant confounding variables, such as patient demographics, disease, and hospital‐ward characteristics.[15]
Sensitivity Analysis
Our primary analysis used a 2‐hour censored interval and 12‐hour hazard and control intervals. Excluding the censored interval from analysis was a conservative approach that we chose because our goal was to identify therapeutic classes associated with deterioration during a phase in which adverse outcomes may be prevented with early intervention. In order to test whether our findings were stable across different lengths of censored, hazard, and control intervals, we performed a sensitivity analysis, also using conditional logistic regression, on all therapeutic classes that were significant (P<0.05) in primary analysis. In 6 iterations of the sensitivity analysis, we varied the length of the hazard and control intervals between 8 and 12 hours, and the length of the censored interval between 0 and 4 hours (Figure 1AF). In a seventh iteration, we used a variant of the primary analysis in which we censored the first control interval (Figure 1G).
RESULTS
We identified 12 CPAs, 41 ARCs, and 699 ICU transfers during the study period. Of these 752 events, 141 (19%) were eligible as cases according to our inclusion criteria.[18] (A flowchart demonstrating the identification of eligible cases is provided in Supporting Table 25 in the online version of this article.) Of the 81% excluded, 37% were ICU transfers who did not meet urgent criteria. Another 31% were excluded because they were hospitalized for <24 hours at the time of the event, making their analysis in a case‐crossover design using 12‐hour periods impossible. Event characteristics, demographics, and hospitalization characteristics are shown in Table 2.
| n | % | |
|---|---|---|
| ||
| Type of event | ||
| CPA | 4 | 3 |
| ARC | 29 | 20 |
| Urgent ICU transfer | 108 | 77 |
| Demographics | ||
| Age | ||
| 0<6 months | 17 | 12 |
| 6<12 months | 22 | 16 |
| 1<4 years | 34 | 24 |
| 4<10 years | 26 | 18 |
| 10<18 years | 42 | 30 |
| Sex | ||
| F | 60 | 43 |
| M | 81 | 57 |
| Race | ||
| White | 69 | 49 |
| Black/African American | 49 | 35 |
| Asian/Pacific Islander | 0 | 0 |
| Other | 23 | 16 |
| Ethnicity | ||
| Non‐Hispanic | 127 | 90 |
| Hispanic | 14 | 10 |
| Hospitalization | ||
| Surgical service | 4 | 3 |
| Survived to hospital discharge | 107 | 76 |
Primary Analysis
A total of 141 hazard intervals and 487 control intervals were included in the primary analysis, the results of which are shown in Table 3. Among the antimicrobial therapeutic classes, glycopeptide antibiotics (vancomycin), anaerobic antibiotics, third‐generation and fourth‐generation cephalosporins, and aminoglycoside antibiotics were significant. All of the anti‐inflammatory therapeutic classes, including systemic corticosteroids, anti‐inflammatory agents, and adrenal corticosteroids, were significant. All of the sedatives, hypnotics, and antianxiety therapeutic classes, including sedatives, benzodiazepines, hypnotics, and antianxiety agents, were significant. Among the narcotic analgesic therapeutic classes, only 1 class, narcotic analgesics (full opioid agonists), was significant. None of the gastrointestinal therapeutic classes were significant. Among the classes classified as other, loop diuretics and antidotes to hypersensitivity reactions (diphenhydramine) were significant.
| OR | LCI | UCI | P Value | |
|---|---|---|---|---|
| ||||
| Antimicrobial therapeutic classes | ||||
| Glycopeptide antibiotics (vancomycin) | 5.84 | 2.01 | 16.98 | 0.001 |
| Anaerobic antibiotics | 5.33 | 1.36 | 20.94 | 0.02 |
| Third‐ and fourth‐generation cephalosporins | 2.78 | 1.15 | 6.69 | 0.02 |
| Aminoglycoside antibiotics | 2.90 | 1.11 | 7.56 | 0.03 |
| Penicillin antibiotics | 2.40 | 0.9 | 6.4 | 0.08 |
| Antiviral agents | 1.52 | 0.20 | 11.46 | 0.68 |
| Antifungal agents | 1.06 | 0.44 | 2.58 | 0.89 |
| Corticosteroids and other anti‐inflammatory therapeutic classes* | ||||
| Systemic corticosteroids | 3.69 | 1.09 | 12.55 | 0.04 |
| Anti‐inflammatory agents | 3.69 | 1.09 | 12.55 | 0.04 |
| Adrenal corticosteroids | 3.69 | 1.09 | 12.55 | 0.04 |
| Sedatives, hypnotics, and antianxiety therapeutic classes | ||||
| Sedatives | 3.48 | 1.78 | 6.78 | <0.001 |
| Benzodiazepines | 2.71 | 1.36 | 5.40 | 0.01 |
| Hypnotics | 2.54 | 1.27 | 5.09 | 0.01 |
| Antianxiety agents | 2.28 | 1.06 | 4.91 | 0.04 |
| Narcotic analgesic therapeutic classes | ||||
| Narcotic analgesics (full opioid agonists) | 2.48 | 1.07 | 5.73 | 0.03 |
| Narcotic analgesics (partial opioid agonists) | 1.97 | 0.57 | 6.85 | 0.29 |
| GI therapeutic classes | ||||
| Antiemetics | 0.57 | 0.22 | 1.48 | 0.25 |
| PPIs | 2.05 | 0.58 | 7.25 | 0.26 |
| Phenothiazine derivatives | 0.47 | 0.12 | 1.83 | 0.27 |
| Gastric acid secretion inhibitors | 1.71 | 0.61 | 4.81 | 0.31 |
| Histamine H2 antagonists | 0.95 | 0.17 | 5.19 | 0.95 |
| Other therapeutic classes | ||||
| Loop diuretics | 2.87 | 1.28 | 6.47 | 0.01 |
| Antidotes to hypersensitivity reactions (diphenhydramine) | 2.45 | 1.15 | 5.23 | 0.02 |
| Antihistamines | 2.00 | 0.97 | 4.12 | 0.06 |
Sensitivity Analysis
Of the 14 classes that were significant in primary analysis, we carried 9 forward to sensitivity analysis. The 5 that were not carried forward overlapped substantially with other classes that were carried forward. The decision of which overlapping class to carry forward was based upon (1) parsimony and (2) clinical relevance. This is described briefly in the footnotes to Table 3 (see Supporting information in the online version of this article for a full description of this process). Figure 2 presents the odds ratios and their 95% confidence intervals for the sensitivity analysis of each therapeutic class that was significant in primary analysis. Loop diuretics remained significantly associated with deterioration in all 7 iterations. Glycopeptide antibiotics (vancomycin), third‐generation and fourth‐generation cephalosporins, systemic corticosteroids, and benzodiazepines were significant in 6. Anaerobic antibiotics and narcotic analgesics (full opioid agonists) were significant in 5, and aminoglycoside antibiotics and antidotes to hypersensitivity reactions (diphenhydramine) in 4.
DISCUSSION
We identified 9 therapeutic classes which were associated with a 2.5‐fold to 5.8‐fold increased risk of clinical deterioration. The results were robust to sensitivity analysis. Given their temporal association to the deterioration events, these therapeutic classes may serve as sentinels of early deterioration and are candidate variables to combine with vital signs and other risk factors in a surveillance tool for rover teams or an early warning score.
Although most early warning scores intended for use at the bedside are based upon vital signs and clinical observations, a few also include medications. Monaghan's Pediatric Early Warning Score, the basis for many modified scores used in children's hospitals throughout the world, assigns points for children requiring frequent doses of nebulized medication.[20, 21, 22] Nebulized epinephrine is a component of the Bristol Paediatric Early Warning Tool.[23] The number of medications administered in the preceding 24 hours was included in an early version of the Bedside Paediatric Early Warning System Score.[24] Adding IV antibiotics to the Maximum Modified Early Warning Score improved prediction of the need for higher care utilization among hospitalized adults.[25]
In order to determine the role of the IV medications we found to be associated with clinical deterioration, the necessary next step is to develop a multivariable predictive model to determine if they improve the performance of existing early warning scores in identifying deteriorating patients. Although simplicity is an important characteristic of hand‐calculated early warning scores, integration of a more complex scoring system with more variables, such as these medications, into the electronic health record would allow for automated scoring, eliminating the need to sacrifice score performance to keep the tool simple. Integration into the electronic health record would have the additional benefit of making the score available to clinicians who are not at the bedside. Such tools would be especially useful for remote surveillance for deterioration by critical‐care outreach or rover teams.
Our study has several limitations. First, the sample size was small, and although we sought to minimize the likelihood of chance associations by performing sensitivity analysis, these findings should be confirmed in a larger study. Second, we only evaluated IV medications. Medications administered by other routes could also be associated with clinical deterioration and should be analyzed in future studies. Third, we excluded children hospitalized for <24 hours, as well as transfers that did not meet urgent criteria. These may be limitations because (1) the first 24 hours of hospitalization may be a high‐risk period, and (2) patients who were on trajectories toward severe deterioration and received interventions that prevented further deterioration but did not meet urgent transfer criteria were excluded. It may be that the children we included as cases were at increased risk of deterioration that is either more difficult to recognize early, or more difficult to treat effectively without ICU interventions. Finally, we acknowledge that in some cases the therapeutic classes were associated with deterioration in a causal fashion, and in others the medications administered did not cause deterioration but were signs of therapeutic interventions that were initiated in response to clinical worsening. Identifying the specific indications for administration of drugs used in response to clinical worsening may have resulted in stronger associations with deterioration. However, these indications are often complex, multifactorial, and poorly documented in real time. This limits the ability to automate their detection using the electronic health record, the ultimate goal of this line of research.
CONCLUSION
We used a case‐crossover approach to identify therapeutic classes that are associated with increased risk of clinical deterioration in hospitalized children on pediatric wards. These sentinel therapeutic classes may serve as useful components of electronic health recordbased surveillance tools to detect signs of early, evolving deterioration and flag at‐risk patients for critical‐care outreach or rover team review. Future research should focus on evaluating whether including these therapeutic classes in early warning scores improves their accuracy in detecting signs of deterioration and determining if providing this information as clinical decision support improves patient outcomes.
Acknowledgments
Disclosures: This study was funded by The Children's Hospital of Philadelphia Center for Pediatric Clinical Effectiveness Pilot Grant and the University of Pennsylvania Provost's Undergraduate Research Mentoring Program. Drs. Bonafide and Keren also receive funding from the Pennsylvania Health Research Formula Fund Award from the Pennsylvania Department of Health for research in pediatric hospital quality, safety, and costs. The authors have no other conflicts of interest to report.
- , , , et al. Findings of the first consensus conference on medical emergency teams. Crit Care Med. 2006;34(9):2463–2478.
- , , , et al. “Identifying the hospitalised patient in crisis”—a consensus conference on the afferent limb of rapid response systems. Resuscitation. 2010;81(4):375–382.
- , , , . Attitudes and barriers to a medical emergency team system at a tertiary paediatric hospital. Resuscitation. 2011;82(2):167–174.
- , , , et al. Why don't hospital staff activate the rapid response system (RRS)? How frequently is it needed and can the process be improved? Implement Sci. 2011;6:39.
- , . Failure of the afferent limb: a persistent problem in rapid response systems. Resuscitation. 2011;82(7):797–798.
- , , . Understanding how rapid response systems may improve safety for the acutely ill patient: learning from the frontline. BMJ Qual Saf. 2012;21(2):135–144.
- , , . How RNs rescue patients: a qualitative study of RNs' perceived involvement in rapid response teams. Qual Saf Health Care. 2010;19(5):1–4.
- , , , et al. A survey of nurses' beliefs about the medical emergency team system in a Canadian tertiary hospital. Am J Crit Care. 2010;19(1):74–83.
- , , , et al. Nurses' attitudes to a medical emergency team service in a teaching hospital. Qual Saf Health Care. 2006;15(6):427–432.
- , , , et al. Introducing critical care outreach: a ward‐randomised trial of phased introduction in a general hospital. Intensive Care Med. 2004;30(7):1398–1404.
- . Out of our reach? Assessing the impact of introducing a critical care outreach service. Anaesthesia. 2003;58(9):882–885.
- , , . Effect of the critical care outreach team on patient survival to discharge from hospital and readmission to critical care: non‐randomised population based study. BMJ. 2003;327(7422):1014.
- , , , et al. Successful implementation of a family and patient activated rapid response team in an adult level 1 trauma center. Resuscitation. 2010;81(12):1676–1681.
- , , , et al. Beyond rapid response teams: instituting a “Rover Team” improves the management of at‐risk patients, facilitates proactive interventions, and improves outcomes. In: Henriksen K, Battles JB, Keyes MA, Grady ML, eds. Advances in Patient Safety: New Directions and Alternative Approaches. Rockville, MD: Agency for Healthcare Research and Quality; 2008.
- , . The case‐crossover study design in pharmacoepidemiology. Stat Methods Med Res. 2009;18(1):53–65.
- , , , et al. Comparison of the statistical efficiency of case‐crossover and case‐control designs: application to severe cutaneous adverse reactions. J Clin Epidemiol. 2001;54(12):1218–1227.
- . The case‐crossover design: a method for studying transient effects on the risk of acute events. Am J Epidemiol. 1991;133(2):144–153.
- , , , , , . Development of a score to predict clinical deterioration in hospitalized children. J Hosp Med. 2012;7(4):345–349.
- Lexicomp. Available at: http://www.lexi.com. Accessed July 26, 2012.
- , , , , , . Sensitivity of the Pediatric Early Warning Score to identify patient deterioration. Pediatrics. 2010;125(4):e763–e769.
- . Detecting and managing deterioration in children. Paediatr Nurs. 2005;17(1):32–35.
- , , , , . Prospective evaluation of a pediatric inpatient early warning scoring system. J Spec Pediatr Nurs. 2009;14(2):79–85.
- , , . Promoting care for acutely ill children—development and evaluation of a Paediatric Early Warning Tool. Intensive Crit Care Nurs. 2006;22(2):73–81.
- , , . The Pediatric Early Warning System Score: a severity of illness score to predict urgent medical need in hospitalized children. J Crit Care. 2006;21(3):271–278.
- , , , , , . Performance of the maximum modified early warning score to predict the need for higher care utilization among admitted emergency department patients. J Hosp Med. 2010;5(1):E46–E52.
Copyright © 2013 Society of Hospital Medicine

FDR and Telemetry Rhythm at Time of IHCA
In‐hospital cardiac arrest (IHCA) research often relies on the first documented cardiac rhythm (FDR) on resuscitation records at the time of cardiopulmonary resuscitation (CPR) initiation as a surrogate for arrest etiology.[1] Over 1000 hospitals report the FDR and associated cardiac arrest data to national registries annually.[2, 3] These data are subsequently used to report national IHCA epidemiology, as well as to develop and refine guidelines for in‐hospital resuscitation.[4]
Suspecting that the FDR might represent the later stage of a progressive cardiopulmonary process rather than a sudden dysrhythmia, we sought to compare the first rhythm documented on resuscitation records at the time of CPR initiation with the telemetry rhythm at the time of the code blue call. We hypothesized that the agreement between FDR and telemetry rhythm would be <80% beyond that predicted by chance (kappa<0.8).[5]
METHODS
Design
Between June 2008 and February 2010, we performed a cross‐sectional study at a 750‐bed adult tertiary care hospital (Christiana Hospital) and a 240‐bed adult inner city community hospital (Wilmington Hospital). Both hospitals included teaching and nonteaching inpatient services. The Christiana Care Health System Institutional Review Board approved the study.
Study Population
Eligible subjects included a convenience sample of adult inpatients aged 18 years who were monitored on the hospital's telemetry system during the 2 minutes prior to a code blue call from a nonintensive care, noncardiac care inpatient ward for IHCA. Intensive care unit (ICU) locations were excluded because they are not captured in our central telemetry recording system. We defined IHCA as a resuscitation event requiring >1 minute of chest compressions and/or defibrillation. We excluded patients with do not attempt resuscitation orders at the time of the IHCA. For patients with multiple IHCAs, only their first event was included in the analysis. International Classification of Diseases, 9th Revision admission diagnoses were categorized into infectious, oncology, endocrine/metabolic; cardiovascular, renal, or other disease categories. The decision to place patients on telemetry monitoring was not part of the study and was entirely at the discretion of the physicians caring for the patients.
Variables and Measurements
We reviewed the paper resuscitation records of each IHCA during the study period and identified the FDR. To create groups that would allow comparison between telemetry and resuscitation record rhythms, we placed each rhythm into 1 of the following 3 categories: asystole, ventricular tachyarrhythmia (VTA), or other organized rhythms (Table 1). It was not possible to retrospectively ascertain the presence of pulses to determine if an organized rhythm identified on telemetry tracings was pulseless electrical activity (PEA) or a perfusing rhythm. Therefore, we elected to take a conservative approach that would bias toward agreement (the opposite direction of our hypothesis that the rhythms are discrepant) and consider all other organized rhythms in agreement with one another. We reviewed printouts of telemetry electrocardiographic records for each patient. Minute 0 was defined as the time of the code blue call. Two physician investigators (C.C. and U.B.) independently reviewed telemetry data for each patient at minute 0 and the 2 minutes preceding the code blue call (minutes 1 and 2). Rhythms at each minute mark were assigned to 1 of the following categories according to the classification scheme in Table 1: asystole, VTA, or other organized rhythms. Leads off and uninterpretable telemetry were also noted. Discrepancies in rhythm categorization between reviewers were resolved by a third investigator (M.Z.) blinded to rhythm category assignment. We used the telemetry rhythm at minute 0 for analysis whenever possible. If the leads were off or the telemetry was uninterpretable at minute 0, we used minute 1. If minute 1 was also unusable, we used minute 2. If there were no usable data at minutes 0, 1, or 2, we excluded the patient.
| Category | Rhythm |
|---|---|
| Asystole | Asystole |
| Ventricular tachyarrhythmia | Ventricular fibrillation, ventricular tachycardia |
| Other organized rhythms | Atrial fibrillation, bradycardia, paced pulseless electrical activity, sinus, idioventricular, other |
Statistical Analysis
We determined the percent agreement between the resuscitation record rhythm category and the last interpretable telemetry rhythm category. We then calculated an unweighted kappa for the agreement between the resuscitation record rhythm category and the last interpretable telemetry rhythm category.
RESULTS
During the study period, there were 135 code blue calls for urgent assistance among telemetry‐monitored non‐ICU patients. Of the 135 calls, we excluded 4 events (3%) that did not meet the definition of IHCA, 9 events (7%) with missing or uninterpretable data, and 53 events (39%) with unobtainable data due to automatic purging from the telemetry server. Therefore, 69 events in 69 different patients remained for analysis. Twelve of the 69 included arrests that occurred at Wilmington Hospital and 57 at Christiana Hospital. The characteristics of the patients are shown in Table 2.
| n | % | |
|---|---|---|
| Age, y | ||
| 3039 | 1 | 1.4 |
| 4049 | 4 | 5.8 |
| 5059 | 11 | 15.9 |
| 6069 | 15 | 21.7 |
| 7079 | 16 | 23.2 |
| 8089 | 18 | 26.1 |
| 90+ | 4 | 5.8 |
| Sex | ||
| Male | 26 | 37.7 |
| Female | 43 | 62.3 |
| Race/ethnicity | ||
| White | 51 | 73.9 |
| Black | 17 | 24.6 |
| Hispanic | 1 | 1.4 |
| Admission body mass index | ||
| Underweight (<18.5) | 3 | 4.3 |
| Normal (18.5<25) | 15 | 21.7 |
| Overweight (25<30) 24 | 24 | 34.8 |
| Obese (30<35) | 17 | 24.6 |
| Very obese (35) | 9 | 13.0 |
| Unknown | 1 | 1.4 |
| Admission diagnosis category | ||
| Infectious | 29 | 42.0 |
| Oncology | 4 | 5.8 |
| Endocrine/metabolic | 22 | 31.9 |
| Cardiovascular | 7 | 10.1 |
| Renal | 2 | 2.8 |
| Other | 5 | 7.2 |
Of the 69 arrests, we used the telemetry rhythm at minute 0 in 42 patients (61%), minute 1 in 22 patients (32%), and minute 2 in 5 patients (7%). Agreement between telemetry and FDR was 65% (kappa=0.37, 95% confidence interval: 0.17‐0.56) (Table 3). Agreement did not vary significantly by sex, race, hospital, weekday, time of day, or minute used in the analysis. Agreement was not associated with survival to hospital discharge.
| Telemetry | Resuscitation Record | |||
|---|---|---|---|---|
| Asystole | Ventricular Tachyarrhythmia | Other Organized Rhythms | Total | |
| ||||
| Asystole | 3 | 0 | 2 | 5 |
| Ventricular tachyarrhythmia | 1 | 12 | 8 | 21 |
| Other organized rhythms | 8 | 5 | 30 | 43 |
| Total | 12 | 17 | 40 | 69 |
Of the 69 IHCA events, the FDRs vs telemetry rhythms at the time of IHCA were: asystole 17% vs 7%, VTA 25% vs 31%, and other organized rhythms 58% vs 62%. Among the 12 events with FDR recorded as asystole, telemetry at the time of the code call was asystole in 3 (25%), VTA in 1 (8%), and other organized rhythms in 8 (67%). Among the 17 events with FDR recorded as VTA, telemetry at the time of the code call was VTA in 12 (71%) and other organized rhythms in 5 (29%). Among the 40 events with FDR recorded as other organized rhythms, telemetry at the time of the code call was asystole in 2 (5%), VTA in 8 (20%), and other organized rhythms in 30 (75%). Among the 8 patients with VTA on telemetry and other organized rhythms on the resuscitation record, the other organized rhythms were documented as PEA (n=6), sinus (n=1), and bradycardia (n=1). Of the 12 patients with VTA on telemetry and on the resuscitation record, 8 (67%) had ventricular tachycardia on telemetry. Four of the 8 (50%) who had ventricular tachycardia on telemetry had deteriorated into ventricular fibrillation by the time the FDR was recorded. Of the 4 who had ventricular fibrillation on telemetry, all had ventricular fibrillation as the FDR on the resuscitation record.
DISCUSSION
These results establish that FDRs often differ from the telemetry rhythms at the time of the code blue call. This is important because national registries such as the American Heart Association's Get with the GuidelinesResuscitation[2] database use the FDR as a surrogate for arrest etiology, and use their findings to report national IHCA outcomes as well as to develop and refine evidence‐based guidelines for in‐hospital resuscitation. Our findings suggest that using the FDR may be an oversimplification of the complex progression of cardiac rhythms that occurs in the periarrest period. Adding preceding telemetry rhythms to the data elements collected may shed additional light on etiology. Furthermore, our results demonstrate that, among adults with VTA or asystole documented upon arrival of the code blue team, other organized rhythms are often present at the time the staff recognized a life‐threatening condition and called for immediate assistance. This suggests that the VTA and asystole FDRs may represent the later stages of progressive cardiopulmonary processes. This is in contrast to out‐of‐hospital cardiac arrests typically attributed to sudden catastrophic dysrhythmias that often progress to asystole unless rapidly defibrillated.[6, 7, 8] Out‐of‐hospital and in‐hospital arrests are likely different (but overlapping) entities that might benefit from different resuscitation strategies.[9, 10] We hypothesize that, for a subset of these patients, progressive respiratory insufficiency and circulatory shockconditions classically associated more strongly with pediatric than adult IHCAmay have been directly responsible for the event.[1] If future research supports the concept that progressive respiratory insufficiency and circulatory shock are responsible for more adult IHCA than previously recognized, more robust monitoring may be indicated for a larger subset of adult patients hospitalized on general wards. This could include pulse oximetry (wave form can be a surrogate for perfusion), respiratory rate, and/or end‐tidal CO2 monitoring. In addition, if future research confirms that there is a greater distinction between in‐hospital and out‐of‐hospital cardiac arrest etiology, the expert panels that develop resuscitation guidelines should consider including setting of resuscitation as a branch point in future algorithms.
Our study had several limitations. First, the sample size was small due to uninterpretable rhythm strips, and for 39% of the total code events, the telemetry data had already been purged from the system by the time research staff attempted to retrieve it. Although we do not believe that there was any systematic bias to the data analyzed, the possibility cannot be completely excluded. Second, we were constrained by the inability to retrospectively ascertain the presence of pulses to determine if an organized rhythm identified on telemetry tracings was PEA. Thus, we categorized rhythms into large groups. Although this limited the granularity of the rhythm groups, it was a conservative approach that likely biased toward agreement (the opposite direction of our hypothesis). Third, the lack of perfect time synchronization between the telemetry system, wall clocks in the hospital, and wrist watches that may be referenced when documenting resuscitative efforts on the resuscitation record means that the rhythms we used may have reflected physiology after interventions had already commenced. Thus, in some situations, minute 1, 2, or earlier minutes may more accurately reflect the preintervention rhythm. Highly accurate time synchronization should be a central component of future prospective work in this area.
CONCLUSIONS
The FDR had only fair agreement with the telemetry rhythm at the time of the code blue call. Among those with VTA or asystole documented on CPR initiation, telemetry often revealed other organized rhythms present at the time hospital staff recognized a life‐threatening condition. In contrast to out‐of‐hospital cardiac arrest, FDR of asystole was only rarely preceded by VTA, and FDR of VTA was often preceded by an organized rhythm.[8, 11] Future studies should examine antecedent rhythms in combination with respiratory and perfusion status to more precisely determine arrest etiology.
Acknowledgments
The authors thank the staff at Flex Monitoring at Christiana Care Health System for their vital contributions to the study.
Disclosures
Dr. Zubrow had full access to all the data in the study and takes responsibility for the integrity of the data and the accuracy of the data analysis. The authors report no conflicts of interest.
- , , , et al. First documented rhythm and clinical outcome from in‐hospital cardiac arrest among children and adults. JAMA. 2006;295(1):50–57.
- Get With The Guidelines–Resuscitation (GWTG‐R) overview. Available at: http://www.heart.org/HEARTORG/HealthcareResearch/GetWithTheGuidelines‐Resuscitation/Get‐With‐The‐Guidelines‐ResuscitationOverview_UCM_314497_Article.jsp. Accessed May 8, 2012.
- , , , et al. Recommended guidelines for reviewing, reporting, and conducting research on in‐hospital resuscitation: the in‐hospital “Utstein Style”. Circulation. 1997;95:2213–2239.
- , , , et al. Cardiopulmonary resuscitation of adults in the hospital: a report of 14,720 cardiac arrests from the National Registry of Cardiopulmonary Resuscitation. Resuscitation. 2003;58:297–308.
- , . The measurement of observer agreement for categorical data. Biometrics. 1977;33(1):159–174.
- , , , et al. Characteristics and outcome among patients suffering in‐hospital cardiac arrest in monitored and nonmonitored areas. Resuscitation. 2001;48:125–135.
- , , , et al. A comparison between patients suffering in‐hospital and out‐of hospital cardiac arrest in terms of treatment and outcome. J Intern Med. 2000;248:53–60.
- , , , et al. Cardiac arrest outside and inside hospital in a community: mechanisms behind the differences in outcomes and outcome in relation to time of arrest. Am Heart J. 2010;159:749–756.
- , , , et al.; Resuscitation Outcomes Consortium Investigators. Ventricular tachyarrhythmias after cardiac arrest in public versus at home. N Engl J Med. 2011;364:313–321.
- , . In‐hospital cardiac arrest. Emerg Med Clin North Am. 2012;30:25–34.
- , , , et al. Analysis of initial rhythm, witnessed status and delay to treatment among survivors of out‐of‐hospital cardiac arrest in Sweden. Heart. 2010;96:1826–1830.
In‐hospital cardiac arrest (IHCA) research often relies on the first documented cardiac rhythm (FDR) on resuscitation records at the time of cardiopulmonary resuscitation (CPR) initiation as a surrogate for arrest etiology.[1] Over 1000 hospitals report the FDR and associated cardiac arrest data to national registries annually.[2, 3] These data are subsequently used to report national IHCA epidemiology, as well as to develop and refine guidelines for in‐hospital resuscitation.[4]
Suspecting that the FDR might represent the later stage of a progressive cardiopulmonary process rather than a sudden dysrhythmia, we sought to compare the first rhythm documented on resuscitation records at the time of CPR initiation with the telemetry rhythm at the time of the code blue call. We hypothesized that the agreement between FDR and telemetry rhythm would be <80% beyond that predicted by chance (kappa<0.8).[5]
METHODS
Design
Between June 2008 and February 2010, we performed a cross‐sectional study at a 750‐bed adult tertiary care hospital (Christiana Hospital) and a 240‐bed adult inner city community hospital (Wilmington Hospital). Both hospitals included teaching and nonteaching inpatient services. The Christiana Care Health System Institutional Review Board approved the study.
Study Population
Eligible subjects included a convenience sample of adult inpatients aged 18 years who were monitored on the hospital's telemetry system during the 2 minutes prior to a code blue call from a nonintensive care, noncardiac care inpatient ward for IHCA. Intensive care unit (ICU) locations were excluded because they are not captured in our central telemetry recording system. We defined IHCA as a resuscitation event requiring >1 minute of chest compressions and/or defibrillation. We excluded patients with do not attempt resuscitation orders at the time of the IHCA. For patients with multiple IHCAs, only their first event was included in the analysis. International Classification of Diseases, 9th Revision admission diagnoses were categorized into infectious, oncology, endocrine/metabolic; cardiovascular, renal, or other disease categories. The decision to place patients on telemetry monitoring was not part of the study and was entirely at the discretion of the physicians caring for the patients.
Variables and Measurements
We reviewed the paper resuscitation records of each IHCA during the study period and identified the FDR. To create groups that would allow comparison between telemetry and resuscitation record rhythms, we placed each rhythm into 1 of the following 3 categories: asystole, ventricular tachyarrhythmia (VTA), or other organized rhythms (Table 1). It was not possible to retrospectively ascertain the presence of pulses to determine if an organized rhythm identified on telemetry tracings was pulseless electrical activity (PEA) or a perfusing rhythm. Therefore, we elected to take a conservative approach that would bias toward agreement (the opposite direction of our hypothesis that the rhythms are discrepant) and consider all other organized rhythms in agreement with one another. We reviewed printouts of telemetry electrocardiographic records for each patient. Minute 0 was defined as the time of the code blue call. Two physician investigators (C.C. and U.B.) independently reviewed telemetry data for each patient at minute 0 and the 2 minutes preceding the code blue call (minutes 1 and 2). Rhythms at each minute mark were assigned to 1 of the following categories according to the classification scheme in Table 1: asystole, VTA, or other organized rhythms. Leads off and uninterpretable telemetry were also noted. Discrepancies in rhythm categorization between reviewers were resolved by a third investigator (M.Z.) blinded to rhythm category assignment. We used the telemetry rhythm at minute 0 for analysis whenever possible. If the leads were off or the telemetry was uninterpretable at minute 0, we used minute 1. If minute 1 was also unusable, we used minute 2. If there were no usable data at minutes 0, 1, or 2, we excluded the patient.
| Category | Rhythm |
|---|---|
| Asystole | Asystole |
| Ventricular tachyarrhythmia | Ventricular fibrillation, ventricular tachycardia |
| Other organized rhythms | Atrial fibrillation, bradycardia, paced pulseless electrical activity, sinus, idioventricular, other |
Statistical Analysis
We determined the percent agreement between the resuscitation record rhythm category and the last interpretable telemetry rhythm category. We then calculated an unweighted kappa for the agreement between the resuscitation record rhythm category and the last interpretable telemetry rhythm category.
RESULTS
During the study period, there were 135 code blue calls for urgent assistance among telemetry‐monitored non‐ICU patients. Of the 135 calls, we excluded 4 events (3%) that did not meet the definition of IHCA, 9 events (7%) with missing or uninterpretable data, and 53 events (39%) with unobtainable data due to automatic purging from the telemetry server. Therefore, 69 events in 69 different patients remained for analysis. Twelve of the 69 included arrests that occurred at Wilmington Hospital and 57 at Christiana Hospital. The characteristics of the patients are shown in Table 2.
| n | % | |
|---|---|---|
| Age, y | ||
| 3039 | 1 | 1.4 |
| 4049 | 4 | 5.8 |
| 5059 | 11 | 15.9 |
| 6069 | 15 | 21.7 |
| 7079 | 16 | 23.2 |
| 8089 | 18 | 26.1 |
| 90+ | 4 | 5.8 |
| Sex | ||
| Male | 26 | 37.7 |
| Female | 43 | 62.3 |
| Race/ethnicity | ||
| White | 51 | 73.9 |
| Black | 17 | 24.6 |
| Hispanic | 1 | 1.4 |
| Admission body mass index | ||
| Underweight (<18.5) | 3 | 4.3 |
| Normal (18.5<25) | 15 | 21.7 |
| Overweight (25<30) 24 | 24 | 34.8 |
| Obese (30<35) | 17 | 24.6 |
| Very obese (35) | 9 | 13.0 |
| Unknown | 1 | 1.4 |
| Admission diagnosis category | ||
| Infectious | 29 | 42.0 |
| Oncology | 4 | 5.8 |
| Endocrine/metabolic | 22 | 31.9 |
| Cardiovascular | 7 | 10.1 |
| Renal | 2 | 2.8 |
| Other | 5 | 7.2 |
Of the 69 arrests, we used the telemetry rhythm at minute 0 in 42 patients (61%), minute 1 in 22 patients (32%), and minute 2 in 5 patients (7%). Agreement between telemetry and FDR was 65% (kappa=0.37, 95% confidence interval: 0.17‐0.56) (Table 3). Agreement did not vary significantly by sex, race, hospital, weekday, time of day, or minute used in the analysis. Agreement was not associated with survival to hospital discharge.
| Telemetry | Resuscitation Record | |||
|---|---|---|---|---|
| Asystole | Ventricular Tachyarrhythmia | Other Organized Rhythms | Total | |
| ||||
| Asystole | 3 | 0 | 2 | 5 |
| Ventricular tachyarrhythmia | 1 | 12 | 8 | 21 |
| Other organized rhythms | 8 | 5 | 30 | 43 |
| Total | 12 | 17 | 40 | 69 |
Of the 69 IHCA events, the FDRs vs telemetry rhythms at the time of IHCA were: asystole 17% vs 7%, VTA 25% vs 31%, and other organized rhythms 58% vs 62%. Among the 12 events with FDR recorded as asystole, telemetry at the time of the code call was asystole in 3 (25%), VTA in 1 (8%), and other organized rhythms in 8 (67%). Among the 17 events with FDR recorded as VTA, telemetry at the time of the code call was VTA in 12 (71%) and other organized rhythms in 5 (29%). Among the 40 events with FDR recorded as other organized rhythms, telemetry at the time of the code call was asystole in 2 (5%), VTA in 8 (20%), and other organized rhythms in 30 (75%). Among the 8 patients with VTA on telemetry and other organized rhythms on the resuscitation record, the other organized rhythms were documented as PEA (n=6), sinus (n=1), and bradycardia (n=1). Of the 12 patients with VTA on telemetry and on the resuscitation record, 8 (67%) had ventricular tachycardia on telemetry. Four of the 8 (50%) who had ventricular tachycardia on telemetry had deteriorated into ventricular fibrillation by the time the FDR was recorded. Of the 4 who had ventricular fibrillation on telemetry, all had ventricular fibrillation as the FDR on the resuscitation record.
DISCUSSION
These results establish that FDRs often differ from the telemetry rhythms at the time of the code blue call. This is important because national registries such as the American Heart Association's Get with the GuidelinesResuscitation[2] database use the FDR as a surrogate for arrest etiology, and use their findings to report national IHCA outcomes as well as to develop and refine evidence‐based guidelines for in‐hospital resuscitation. Our findings suggest that using the FDR may be an oversimplification of the complex progression of cardiac rhythms that occurs in the periarrest period. Adding preceding telemetry rhythms to the data elements collected may shed additional light on etiology. Furthermore, our results demonstrate that, among adults with VTA or asystole documented upon arrival of the code blue team, other organized rhythms are often present at the time the staff recognized a life‐threatening condition and called for immediate assistance. This suggests that the VTA and asystole FDRs may represent the later stages of progressive cardiopulmonary processes. This is in contrast to out‐of‐hospital cardiac arrests typically attributed to sudden catastrophic dysrhythmias that often progress to asystole unless rapidly defibrillated.[6, 7, 8] Out‐of‐hospital and in‐hospital arrests are likely different (but overlapping) entities that might benefit from different resuscitation strategies.[9, 10] We hypothesize that, for a subset of these patients, progressive respiratory insufficiency and circulatory shockconditions classically associated more strongly with pediatric than adult IHCAmay have been directly responsible for the event.[1] If future research supports the concept that progressive respiratory insufficiency and circulatory shock are responsible for more adult IHCA than previously recognized, more robust monitoring may be indicated for a larger subset of adult patients hospitalized on general wards. This could include pulse oximetry (wave form can be a surrogate for perfusion), respiratory rate, and/or end‐tidal CO2 monitoring. In addition, if future research confirms that there is a greater distinction between in‐hospital and out‐of‐hospital cardiac arrest etiology, the expert panels that develop resuscitation guidelines should consider including setting of resuscitation as a branch point in future algorithms.
Our study had several limitations. First, the sample size was small due to uninterpretable rhythm strips, and for 39% of the total code events, the telemetry data had already been purged from the system by the time research staff attempted to retrieve it. Although we do not believe that there was any systematic bias to the data analyzed, the possibility cannot be completely excluded. Second, we were constrained by the inability to retrospectively ascertain the presence of pulses to determine if an organized rhythm identified on telemetry tracings was PEA. Thus, we categorized rhythms into large groups. Although this limited the granularity of the rhythm groups, it was a conservative approach that likely biased toward agreement (the opposite direction of our hypothesis). Third, the lack of perfect time synchronization between the telemetry system, wall clocks in the hospital, and wrist watches that may be referenced when documenting resuscitative efforts on the resuscitation record means that the rhythms we used may have reflected physiology after interventions had already commenced. Thus, in some situations, minute 1, 2, or earlier minutes may more accurately reflect the preintervention rhythm. Highly accurate time synchronization should be a central component of future prospective work in this area.
CONCLUSIONS
The FDR had only fair agreement with the telemetry rhythm at the time of the code blue call. Among those with VTA or asystole documented on CPR initiation, telemetry often revealed other organized rhythms present at the time hospital staff recognized a life‐threatening condition. In contrast to out‐of‐hospital cardiac arrest, FDR of asystole was only rarely preceded by VTA, and FDR of VTA was often preceded by an organized rhythm.[8, 11] Future studies should examine antecedent rhythms in combination with respiratory and perfusion status to more precisely determine arrest etiology.
Acknowledgments
The authors thank the staff at Flex Monitoring at Christiana Care Health System for their vital contributions to the study.
Disclosures
Dr. Zubrow had full access to all the data in the study and takes responsibility for the integrity of the data and the accuracy of the data analysis. The authors report no conflicts of interest.
- , , , et al. First documented rhythm and clinical outcome from in‐hospital cardiac arrest among children and adults. JAMA. 2006;295(1):50–57.
- Get With The Guidelines–Resuscitation (GWTG‐R) overview. Available at: http://www.heart.org/HEARTORG/HealthcareResearch/GetWithTheGuidelines‐Resuscitation/Get‐With‐The‐Guidelines‐ResuscitationOverview_UCM_314497_Article.jsp. Accessed May 8, 2012.
- , , , et al. Recommended guidelines for reviewing, reporting, and conducting research on in‐hospital resuscitation: the in‐hospital “Utstein Style”. Circulation. 1997;95:2213–2239.
- , , , et al. Cardiopulmonary resuscitation of adults in the hospital: a report of 14,720 cardiac arrests from the National Registry of Cardiopulmonary Resuscitation. Resuscitation. 2003;58:297–308.
- , . The measurement of observer agreement for categorical data. Biometrics. 1977;33(1):159–174.
- , , , et al. Characteristics and outcome among patients suffering in‐hospital cardiac arrest in monitored and nonmonitored areas. Resuscitation. 2001;48:125–135.
- , , , et al. A comparison between patients suffering in‐hospital and out‐of hospital cardiac arrest in terms of treatment and outcome. J Intern Med. 2000;248:53–60.
- , , , et al. Cardiac arrest outside and inside hospital in a community: mechanisms behind the differences in outcomes and outcome in relation to time of arrest. Am Heart J. 2010;159:749–756.
- , , , et al.; Resuscitation Outcomes Consortium Investigators. Ventricular tachyarrhythmias after cardiac arrest in public versus at home. N Engl J Med. 2011;364:313–321.
- , . In‐hospital cardiac arrest. Emerg Med Clin North Am. 2012;30:25–34.
- , , , et al. Analysis of initial rhythm, witnessed status and delay to treatment among survivors of out‐of‐hospital cardiac arrest in Sweden. Heart. 2010;96:1826–1830.
Pediatric Deterioration Risk Score
Thousands of hospitals have implemented rapid response systems in recent years in attempts to reduce mortality outside the intensive care unit (ICU).1 These systems have 2 components, a response arm and an identification arm. The response arm is usually comprised of a multidisciplinary critical care team that responds to calls for urgent assistance outside the ICU; this team is often called a rapid response team or a medical emergency team. The identification arm comes in 2 forms, predictive and detective. Predictive tools estimate a patient's risk of deterioration over time based on factors that are not rapidly changing, such as elements of the patient's history. In contrast, detective tools include highly time‐varying signs of active deterioration, such as vital sign abnormalities.2 To date, most pediatric studies have focused on developing detective tools, including several early warning scores.38
In this study, we sought to identify the characteristics that increase the probability that a hospitalized child will deteriorate, and combine these characteristics into a predictive score. Tools like this may be helpful in identifying and triaging the subset of high‐risk children who should be intensively monitored for early signs of deterioration at the time of admission, as well as in identifying very low‐risk children who, in the absence of other clinical concerns, may be monitored less intensively.
METHODS
Detailed methods, including the inclusion/exclusion criteria, the matching procedures, and a full description of the statistical analysis are provided as an appendix (see Supporting Online Appendix: Supplement to Methods Section in the online version of this article). An abbreviated version follows.
Design
We performed a case‐control study among children, younger than 18 years old, hospitalized for >24 hours between January 1, 2005 and December 31, 2008. The case group consisted of children who experienced clinical deterioration, a composite outcome defined as cardiopulmonary arrest (CPA), acute respiratory compromise (ARC), or urgent ICU transfer, while on a non‐ICU unit. ICU transfers were considered urgent if they included at least one of the following outcomes in the 12 hours after transfer: death, CPA, intubation, initiation of noninvasive ventilation, or administration of a vasoactive medication infusion used for the treatment of shock. The control group consisted of a random sample of patients matched 3:1 to cases if they met the criteria of being on a non‐ICU unit at the same time as their matched case.
Variables and Measurements
We collected data on demographics, complex chronic conditions (CCCs), other patient characteristics, and laboratory studies. CCCs were specific diagnoses divided into the following 9 categories according to an established framework: neuromuscular, cardiovascular, respiratory, renal, gastrointestinal, hematologic/emmmunologic, metabolic, malignancy, and genetic/congenital defects.9 Other patient characteristics evaluated included age, weight‐for‐age, gestational age, history of transplant, time from hospital admission to event, recent ICU stays, administration of total parenteral nutrition, use of a patient‐controlled analgesia pump, and presence of medical devices including central venous lines and enteral tubes (naso‐gastric, gastrostomy, or jejunostomy).
Laboratory studies evaluated included hemoglobin value, white blood cell count, and blood culture drawn in the preceding 72 hours. We included these laboratory studies in this predictive score because we hypothesized that they represented factors that increased a child's risk of deterioration over time, as opposed to signs of acute deterioration that would be more appropriate for a detective score.
Statistical Analysis
We used conditional logistic regression for the bivariable and multivariable analyses to account for the matching. We derived the predictive score using an established method10 in which the regression coefficients for each covariate were divided by the smallest coefficient, and then rounded to the nearest integer, to establish each variable's sub‐score. We grouped the total scores into very low, low, intermediate, and high‐risk groups, calculated overall stratum‐specific likelihood ratios (SSLRs), and estimated stratum‐specific probabilities of deterioration for each group.
RESULTS
Patient Characteristics
We identified 12 CPAs, 41 ARCs, and 699 urgent ICU transfers during the study period. A total of 141 cases met our strict criteria for inclusion (see Figure in Supporting Online Appendix: Supplement to Methods Section in the online version of this article) among approximately 96,000 admissions during the study period, making the baseline incidence of events (pre‐test probability) approximately 0.15%. The case and control groups were similar in age, sex, and family‐reported race/ethnicity. Cases had been hospitalized longer than controls at the time of their event, were less likely to have been on a surgical service, and were less likely to survive to hospital discharge (Table 1). There was a high prevalence of CCCs among both cases and controls; 78% of cases and 52% of controls had at least 1 CCC.
| Cases (n = 141) | Controls (n = 423) | ||
|---|---|---|---|
| n (%) | n (%) | P Value | |
| |||
| Type of event | |||
| Cardiopulmonary arrest | 4 (3) | 0 | NA |
| Acute respiratory compromise | 29 (20) | 0 | NA |
| Urgent ICU transfer | 108 (77) | 0 | NA |
| Demographics | |||
| Age | 0.34 | ||
| 0‐<6 mo | 17 (12) | 62 (15) | |
| 6‐<12 mo | 22 (16) | 41 (10) | |
| 1‐<4 yr | 34 (24) | 97 (23) | |
| 4‐<10 yr | 26 (18) | 78 (18) | |
| 10‐<18 yr | 42 (30) | 145 (34) | |
| Sex | 0.70 | ||
| Female | 60 (43) | 188 (44) | |
| Male | 81 (57) | 235 (56) | |
| Race | 0.40 | ||
| White | 69 (49) | 189 (45) | |
| Black/African‐American | 49 (35) | 163 (38) | |
| Asian/Pacific Islander | 0 (0) | 7 (2) | |
| Other | 23 (16) | 62 (15) | |
| Not reported | 0 (0) | 2 (<1) | |
| Ethnicity | 0.53 | ||
| Non‐Hispanic | 127 (90) | 388 (92) | |
| Hispanic | 14 (10) | 33 (8) | |
| Unknown/not reported | 0 (0) | 2 (<1) | |
| Hospitalization | |||
| Length of stay in days, median (interquartile range) | 7.8 (2.6‐18.2) | 3.9 (1.9‐11.2) | <0.001 |
| Surgical service | 4 (3) | 67 (16) | <0.001 |
| Survived to hospital discharge | 107 (76) | 421 (99.5) | <0.001 |
Unadjusted (Bivariable) Analysis
Results of bivariable analysis are shown in Table 2.
| Variable | Cases n (%) | Controls n (%) | OR* | 95% CI | P Value |
|---|---|---|---|---|---|
| |||||
| Complex chronic conditions categories | |||||
| Congenital/genetic | 19 (13) | 21 (5) | 3.0 | 1.6‐5.8 | 0.001 |
| Neuromuscular | 31 (22) | 48 (11) | 2.2 | 1.3‐3.7 | 0.002 |
| Respiratory | 18 (13) | 27 (6) | 2.0 | 1.1‐3.7 | 0.02 |
| Cardiovascular | 15 (10) | 24 (6) | 2.0 | 1.0‐3.9 | 0.05 |
| Metabolic | 5 (3) | 6 (1) | 2.5 | 0.8‐8.2 | 0.13 |
| Gastrointestinal | 10 (7) | 24 (6) | 1.3 | 0.6‐2.7 | 0.54 |
| Renal | 3 (2) | 8 (2) | 1.1 | 0.3‐4.2 | 0.86 |
| Hematology/emmmunodeficiency | 6 (4) | 19 (4) | 0.9 | 0.4‐2.4 | 0.91 |
| Specific conditions | |||||
| Mental retardation | 21 (15) | 25 (6) | 2.7 | 1.5‐4.9 | 0.001 |
| Malignancy | 49 (35) | 90 (21) | 1.9 | 1.3‐2.8 | 0.002 |
| Epilepsy | 22 (15) | 30 (7) | 2.4 | 1.3‐4.3 | 0.004 |
| Cardiac malformations | 14 (10) | 19 (4) | 2.2 | 1.1‐4.4 | 0.02 |
| Chronic respiratory disease arising in the perinatal period | 11 (8) | 15 (4) | 2.2 | 1.0‐4.8 | 0.05 |
| Cerebral palsy | 7 (5) | 13 (3) | 1.7 | 0.6‐4.2 | 0.30 |
| Cystic fibrosis | 1 (1) | 9 (2) | 0.3 | <0.1‐2.6 | 0.30 |
| Other patient characteristics | |||||
| Time from hospital admission to event 7 days | 74 (52) | 146 (35) | 2.1 | 1.4‐3.1 | <0.001 |
| History of any transplant | 27 (19) | 17 (4) | 5.7 | 2.9‐11.1 | <0.001 |
| Enteral tube | 65 (46) | 102 (24) | 2.6 | 1.8‐3.9 | <0.001 |
| Hospitalized in an intensive care unit during the same admission | 43 (31) | 77 (18) | 2.0 | 1.3‐3.1 | 0.002 |
| Administration of TPN in preceding 24 hr | 26 (18) | 36 (9) | 2.3 | 1.4‐3.9 | 0.002 |
| Administration of an opioid via a patient‐controlled analgesia pump in the preceding 24 hr | 14 (9) | 14 (3) | 3.6 | 1.6‐8.3 | 0.002 |
| Weight‐for‐age <5th percentile | 49 (35) | 94 (22) | 1.9 | 1.2‐2.9 | 0.003 |
| Central venous line | 55 (39) | 113 (27) | 1.8 | 1.2‐2.7 | 0.005 |
| Age <1 yr | 39 (28) | 103 (24) | 1.2 | 0.8‐1.9 | 0.42 |
| Gestational age <37 wk or documentation of prematurity | 21 (15) | 60 (14) | 1.1 | 0.6‐1.8 | 0.84 |
| Laboratory studies | |||||
| Hemoglobin in preceding 72 hr | |||||
| Not tested | 28 (20) | 190 (45) | 1.0 | [reference] | |
| 10 g/dL | 42 (30) | 144 (34) | 2.0 | 1.2‐3.5 | 0.01 |
| <10 g/dL | 71 (50) | 89 (21) | 5.6 | 3.3‐9.5 | <0.001 |
| White blood cell count in preceding 72 hr | |||||
| Not tested | 28 (20) | 190 (45) | 1.0 | [reference] | |
| 5000 to <15,000/l | 45 (32) | 131 (31) | 2.4 | 1.4‐4.1 | 0.001 |
| 15,000/l | 19 (13) | 25 (6) | 5.7 | 2.7‐12.0 | <0.001 |
| <5000/l | 49 (35) | 77 (18) | 4.5 | 2.6‐7.8 | <0.001 |
| Blood culture drawn in preceding 72 hr | 78 (55) | 85 (20) | 5.2 | 3.3‐8.1 | <0.001 |
Adjusted (Multivariable) Analysis
The multivariable conditional logistic regression model included 7 independent risk factors for deterioration (Table 3): age <1 year, epilepsy, congenital/genetic defects, history of transplant, enteral tubes, hemoglobin <10 g/dL, and blood culture drawn in the preceding 72 hours.
| Predictor | Adjusted OR (95% CI) | P Value | Regression Coefficient (95% CI) | Score* |
|---|---|---|---|---|
| ||||
| Age <1 yr | 1.9 (1.0‐3.4) | 0.038 | 0.6 (<0.1‐1.2) | 1 |
| Epilepsy | 4.4 (1.9‐9.8) | <0.001 | 1.5 (0.7‐2.3) | 2 |
| Congenital/genetic defects | 2.1 (0.9‐4.9) | 0.075 | 0.8 (0.1‐1.6) | 1 |
| History of any transplant | 3.0 (1.3‐6.9) | 0.010 | 1.1 (0.3‐1.9) | 2 |
| Enteral tube | 2.1 (1.3‐3.6) | 0.003 | 0.8 (0.3‐1.3) | 1 |
| Hemoglobin <10 g/dL in preceding 72 hr | 3.0 (1.8‐5.1) | <0.001 | 1.1 (0.6‐1.6) | 2 |
| Blood culture drawn in preceding 72 hr | 5.8 (3.3‐10.3) | <0.001 | 1.8 (1.2‐2.3) | 3 |
Predictive Score
The range of the resulting predictive score was 0 to 12. The median score among cases was 4, and the median score among controls was 1 (P < 0.001). The area under the receiver operating characteristic curve was 0.78 (95% confidence interval 0.74‐0.83).
We grouped the scores by SSLRs into 4 risk strata and calculated each group's estimated post‐test probability of deterioration based on the pre‐test probability of deterioration of 0.15% (Table 4). The very low‐risk group had a probability of deterioration of 0.06%, less than one‐half the pre‐test probability. The low‐risk group had a probability of deterioration of 0.18%, similar to the pre‐test probability. The intermediate‐risk group had a probability of deterioration of 0.39%, 2.6 times higher than the pre‐test probability. The high‐risk group had a probability of deterioration of 12.60%, 84 times higher than the pre‐test probability.
| Risk stratum | Score range | Cases in stratumn (%) | Controls in stratumn (%) | SSLR (95% CI) | Probability of deterioration (%)* |
|---|---|---|---|---|---|
| |||||
| Very low | 0‐2 | 37 (26) | 288 (68) | 0.4 (0.3‐0.5) | 0.06 |
| Low | 3‐4 | 37 (26) | 94 (22) | 1.2 (0.9‐1.6) | 0.2 |
| Intermediate | 5‐6 | 35 (25) | 40 (9) | 2.6 (1.7‐4.0) | 0.4 |
| High | 7‐12 | 32 (23) | 1 (<1) | 96.0 (13.2‐696.2) | 12.6 |
DISCUSSION
Despite the widespread adoption of rapid response systems, we know little about the optimal methods to identify patients whose clinical characteristics alone put them at increased risk of deterioration, and triage the care they receive based on this risk. Pediatric case series have suggested that younger children and those with chronic illnesses are more likely to require assistance from a medical emergency team,1112 but this is the first study to measure their association with this outcome in children.
Most studies with the objective of identifying patients at risk have focused on tools designed to detect symptoms of deterioration that have already begun, using single‐parameter medical emergency team calling criteria1316 or multi‐parameter early warning scores.38 Rather than create a tool to detect deterioration that has already begun, we developed a predictive score that incorporates patient characteristics independently associated with deterioration in hospitalized children, including age <1 year, epilepsy, congenital/genetic defects, history of transplant, enteral tube, hemoglobin <10 g/dL, and blood culture drawn in the preceding 72 hours. The score has the potential to help clinicians identify the children at highest risk of deterioration who might benefit most from the use of vital sign‐based methods to detect deterioration, as well as the children at lowest risk for whom monitoring may be unnecessary. For example, this score could be performed at the time of admission, and those at very low risk of deterioration and without other clinically concerning findings might be considered for a low‐intensity schedule of vital signs and monitoring (such as vital signs every 8 hours, no continuous cardiorespiratory monitoring or pulse oximetry, and early warning score calculation daily), while patients in the intermediate and high‐risk groups might be considered for a more intensive schedule of vital signs and monitoring (such as vital signs every 4 hours, continuous cardiorespiratory monitoring and pulse oximetry, and early warning score calculation every 4 hours). It should be noted, however, that 37 cases (26%) fell into the very low‐risk category, raising the importance of external validation at the point of admission from the emergency department, before the score can be implemented for the potential clinical use described above. If the score performs well in validation studies, then its use in tailoring monitoring parameters has the potential to reduce the amount of time nurses spend responding to false monitor alarms and calculating early warning scores on patients at very low risk of deterioration.
Of note, we excluded children hospitalized for fewer than 24 hours, resulting in the exclusion of 31% of the potentially eligible events. We also excluded 40% of the potentially eligible ICU transfers because they did not meet urgent criteria. These may be limitations because: (1) the first 24 hours of hospitalization may be a high‐risk period; and (2) patients who were on trajectories toward severe deterioration and received interventions that prevented further deterioration, but did not meet urgent criteria, were excluded. It may be that the children we included as cases were at increased risk of deterioration that is either more difficult to recognize early, or more difficult to treat effectively without ICU interventions. In addition, the population of patients meeting urgent criteria may vary across hospitals, limiting generalizability of this score.
In summary, we developed a predictive score and risk stratification tool that may be useful in triaging the intensity of monitoring and surveillance for deterioration that children receive when hospitalized on non‐ICU units. External validation using the setting and frequency of score measurement that would be most valuable clinically (for example, in the emergency department at the time of admission) is needed before clinical use can be recommended.
Acknowledgements
The authors thank Annie Chung, BA, Emily Huang, and Susan Lipsett, MD, for their assistance with data collection.
- Institute for Healthcare Improvement. About IHI. Available at: http://www.ihi.org/ihi/about. Accessed July 18,2010.
- ,,, et al.“Identifying the hospitalised patient in crisis”—a consensus conference on the afferent limb of Rapid Response Systems.Resuscitation.2010;81(4):375–382.
- ,,.The Pediatric Early Warning System score: a severity of illness score to predict urgent medical need in hospitalized children.J Crit Care.2006;21(3):271–278.
- ,,.Development and initial validation of the Bedside Paediatric Early Warning System score.Crit Care.2009;13(4):R135.
- .Detecting and managing deterioration in children.Paediatr Nurs.2005;17(1):32–35.
- ,,.Promoting care for acutely ill children—development and evaluation of a Paediatric Early Warning Tool.Intensive Crit Care Nurs.2006;22(2):73–81.
- ,,,,.Prospective evaluation of a pediatric inpatient early warning scoring system.J Spec Pediatr Nurs.2009;14(2):79–85.
- ,,,.Prospective cohort study to test the predictability of the Cardiff and Vale paediatric early warning system.Arch Dis Child.2009;94(8):602–606.
- ,,,,,.Deaths attributed to pediatric complex chronic conditions: national trends and implications for supportive care services.Pediatrics.2001;107(6):e99.
- ,,,,.Early prediction of neurological sequelae or death after bacterial meningitis.Acta Paediatr.2002;91(4):391–398.
- ,,,,.Retrospective review of emergency response activations during a 13‐year period at a tertiary care children's hospital.J Hosp Med.2011;6(3):131–135.
- ,,,.Clinical profile of hospitalized children provided with urgent assistance from a medical emergency team.Pediatrics.2008;121(6):e1577–e1584.
- ,,, et al.Implementation of a medical emergency team in a large pediatric teaching hospital prevents respiratory and cardiopulmonary arrests outside the intensive care unit.Pediatr Crit Care Med.2007;8(3):236–246.
- ,,, et al.Effect of a rapid response team on hospital‐wide mortality and code rates outside the ICU in a children's hospital.JAMA.2007;298(19):2267–2274.
- ,,, et al.Transition from a traditional code team to a medical emergency team and categorization of cardiopulmonary arrests in a children's center.Arch Pediatr Adolesc Med.2008;162(2):117–122.
- ,.Reduction of hospital mortality and of preventable cardiac arrest and death on introduction of a pediatric medical emergency team.Pediatr Crit Care Med.2009;10(3):306–312.
Thousands of hospitals have implemented rapid response systems in recent years in attempts to reduce mortality outside the intensive care unit (ICU).1 These systems have 2 components, a response arm and an identification arm. The response arm is usually comprised of a multidisciplinary critical care team that responds to calls for urgent assistance outside the ICU; this team is often called a rapid response team or a medical emergency team. The identification arm comes in 2 forms, predictive and detective. Predictive tools estimate a patient's risk of deterioration over time based on factors that are not rapidly changing, such as elements of the patient's history. In contrast, detective tools include highly time‐varying signs of active deterioration, such as vital sign abnormalities.2 To date, most pediatric studies have focused on developing detective tools, including several early warning scores.38
In this study, we sought to identify the characteristics that increase the probability that a hospitalized child will deteriorate, and combine these characteristics into a predictive score. Tools like this may be helpful in identifying and triaging the subset of high‐risk children who should be intensively monitored for early signs of deterioration at the time of admission, as well as in identifying very low‐risk children who, in the absence of other clinical concerns, may be monitored less intensively.
METHODS
Detailed methods, including the inclusion/exclusion criteria, the matching procedures, and a full description of the statistical analysis are provided as an appendix (see Supporting Online Appendix: Supplement to Methods Section in the online version of this article). An abbreviated version follows.
Design
We performed a case‐control study among children, younger than 18 years old, hospitalized for >24 hours between January 1, 2005 and December 31, 2008. The case group consisted of children who experienced clinical deterioration, a composite outcome defined as cardiopulmonary arrest (CPA), acute respiratory compromise (ARC), or urgent ICU transfer, while on a non‐ICU unit. ICU transfers were considered urgent if they included at least one of the following outcomes in the 12 hours after transfer: death, CPA, intubation, initiation of noninvasive ventilation, or administration of a vasoactive medication infusion used for the treatment of shock. The control group consisted of a random sample of patients matched 3:1 to cases if they met the criteria of being on a non‐ICU unit at the same time as their matched case.
Variables and Measurements
We collected data on demographics, complex chronic conditions (CCCs), other patient characteristics, and laboratory studies. CCCs were specific diagnoses divided into the following 9 categories according to an established framework: neuromuscular, cardiovascular, respiratory, renal, gastrointestinal, hematologic/emmmunologic, metabolic, malignancy, and genetic/congenital defects.9 Other patient characteristics evaluated included age, weight‐for‐age, gestational age, history of transplant, time from hospital admission to event, recent ICU stays, administration of total parenteral nutrition, use of a patient‐controlled analgesia pump, and presence of medical devices including central venous lines and enteral tubes (naso‐gastric, gastrostomy, or jejunostomy).
Laboratory studies evaluated included hemoglobin value, white blood cell count, and blood culture drawn in the preceding 72 hours. We included these laboratory studies in this predictive score because we hypothesized that they represented factors that increased a child's risk of deterioration over time, as opposed to signs of acute deterioration that would be more appropriate for a detective score.
Statistical Analysis
We used conditional logistic regression for the bivariable and multivariable analyses to account for the matching. We derived the predictive score using an established method10 in which the regression coefficients for each covariate were divided by the smallest coefficient, and then rounded to the nearest integer, to establish each variable's sub‐score. We grouped the total scores into very low, low, intermediate, and high‐risk groups, calculated overall stratum‐specific likelihood ratios (SSLRs), and estimated stratum‐specific probabilities of deterioration for each group.
RESULTS
Patient Characteristics
We identified 12 CPAs, 41 ARCs, and 699 urgent ICU transfers during the study period. A total of 141 cases met our strict criteria for inclusion (see Figure in Supporting Online Appendix: Supplement to Methods Section in the online version of this article) among approximately 96,000 admissions during the study period, making the baseline incidence of events (pre‐test probability) approximately 0.15%. The case and control groups were similar in age, sex, and family‐reported race/ethnicity. Cases had been hospitalized longer than controls at the time of their event, were less likely to have been on a surgical service, and were less likely to survive to hospital discharge (Table 1). There was a high prevalence of CCCs among both cases and controls; 78% of cases and 52% of controls had at least 1 CCC.
| Cases (n = 141) | Controls (n = 423) | ||
|---|---|---|---|
| n (%) | n (%) | P Value | |
| |||
| Type of event | |||
| Cardiopulmonary arrest | 4 (3) | 0 | NA |
| Acute respiratory compromise | 29 (20) | 0 | NA |
| Urgent ICU transfer | 108 (77) | 0 | NA |
| Demographics | |||
| Age | 0.34 | ||
| 0‐<6 mo | 17 (12) | 62 (15) | |
| 6‐<12 mo | 22 (16) | 41 (10) | |
| 1‐<4 yr | 34 (24) | 97 (23) | |
| 4‐<10 yr | 26 (18) | 78 (18) | |
| 10‐<18 yr | 42 (30) | 145 (34) | |
| Sex | 0.70 | ||
| Female | 60 (43) | 188 (44) | |
| Male | 81 (57) | 235 (56) | |
| Race | 0.40 | ||
| White | 69 (49) | 189 (45) | |
| Black/African‐American | 49 (35) | 163 (38) | |
| Asian/Pacific Islander | 0 (0) | 7 (2) | |
| Other | 23 (16) | 62 (15) | |
| Not reported | 0 (0) | 2 (<1) | |
| Ethnicity | 0.53 | ||
| Non‐Hispanic | 127 (90) | 388 (92) | |
| Hispanic | 14 (10) | 33 (8) | |
| Unknown/not reported | 0 (0) | 2 (<1) | |
| Hospitalization | |||
| Length of stay in days, median (interquartile range) | 7.8 (2.6‐18.2) | 3.9 (1.9‐11.2) | <0.001 |
| Surgical service | 4 (3) | 67 (16) | <0.001 |
| Survived to hospital discharge | 107 (76) | 421 (99.5) | <0.001 |
Unadjusted (Bivariable) Analysis
Results of bivariable analysis are shown in Table 2.
| Variable | Cases n (%) | Controls n (%) | OR* | 95% CI | P Value |
|---|---|---|---|---|---|
| |||||
| Complex chronic conditions categories | |||||
| Congenital/genetic | 19 (13) | 21 (5) | 3.0 | 1.6‐5.8 | 0.001 |
| Neuromuscular | 31 (22) | 48 (11) | 2.2 | 1.3‐3.7 | 0.002 |
| Respiratory | 18 (13) | 27 (6) | 2.0 | 1.1‐3.7 | 0.02 |
| Cardiovascular | 15 (10) | 24 (6) | 2.0 | 1.0‐3.9 | 0.05 |
| Metabolic | 5 (3) | 6 (1) | 2.5 | 0.8‐8.2 | 0.13 |
| Gastrointestinal | 10 (7) | 24 (6) | 1.3 | 0.6‐2.7 | 0.54 |
| Renal | 3 (2) | 8 (2) | 1.1 | 0.3‐4.2 | 0.86 |
| Hematology/emmmunodeficiency | 6 (4) | 19 (4) | 0.9 | 0.4‐2.4 | 0.91 |
| Specific conditions | |||||
| Mental retardation | 21 (15) | 25 (6) | 2.7 | 1.5‐4.9 | 0.001 |
| Malignancy | 49 (35) | 90 (21) | 1.9 | 1.3‐2.8 | 0.002 |
| Epilepsy | 22 (15) | 30 (7) | 2.4 | 1.3‐4.3 | 0.004 |
| Cardiac malformations | 14 (10) | 19 (4) | 2.2 | 1.1‐4.4 | 0.02 |
| Chronic respiratory disease arising in the perinatal period | 11 (8) | 15 (4) | 2.2 | 1.0‐4.8 | 0.05 |
| Cerebral palsy | 7 (5) | 13 (3) | 1.7 | 0.6‐4.2 | 0.30 |
| Cystic fibrosis | 1 (1) | 9 (2) | 0.3 | <0.1‐2.6 | 0.30 |
| Other patient characteristics | |||||
| Time from hospital admission to event 7 days | 74 (52) | 146 (35) | 2.1 | 1.4‐3.1 | <0.001 |
| History of any transplant | 27 (19) | 17 (4) | 5.7 | 2.9‐11.1 | <0.001 |
| Enteral tube | 65 (46) | 102 (24) | 2.6 | 1.8‐3.9 | <0.001 |
| Hospitalized in an intensive care unit during the same admission | 43 (31) | 77 (18) | 2.0 | 1.3‐3.1 | 0.002 |
| Administration of TPN in preceding 24 hr | 26 (18) | 36 (9) | 2.3 | 1.4‐3.9 | 0.002 |
| Administration of an opioid via a patient‐controlled analgesia pump in the preceding 24 hr | 14 (9) | 14 (3) | 3.6 | 1.6‐8.3 | 0.002 |
| Weight‐for‐age <5th percentile | 49 (35) | 94 (22) | 1.9 | 1.2‐2.9 | 0.003 |
| Central venous line | 55 (39) | 113 (27) | 1.8 | 1.2‐2.7 | 0.005 |
| Age <1 yr | 39 (28) | 103 (24) | 1.2 | 0.8‐1.9 | 0.42 |
| Gestational age <37 wk or documentation of prematurity | 21 (15) | 60 (14) | 1.1 | 0.6‐1.8 | 0.84 |
| Laboratory studies | |||||
| Hemoglobin in preceding 72 hr | |||||
| Not tested | 28 (20) | 190 (45) | 1.0 | [reference] | |
| 10 g/dL | 42 (30) | 144 (34) | 2.0 | 1.2‐3.5 | 0.01 |
| <10 g/dL | 71 (50) | 89 (21) | 5.6 | 3.3‐9.5 | <0.001 |
| White blood cell count in preceding 72 hr | |||||
| Not tested | 28 (20) | 190 (45) | 1.0 | [reference] | |
| 5000 to <15,000/l | 45 (32) | 131 (31) | 2.4 | 1.4‐4.1 | 0.001 |
| 15,000/l | 19 (13) | 25 (6) | 5.7 | 2.7‐12.0 | <0.001 |
| <5000/l | 49 (35) | 77 (18) | 4.5 | 2.6‐7.8 | <0.001 |
| Blood culture drawn in preceding 72 hr | 78 (55) | 85 (20) | 5.2 | 3.3‐8.1 | <0.001 |
Adjusted (Multivariable) Analysis
The multivariable conditional logistic regression model included 7 independent risk factors for deterioration (Table 3): age <1 year, epilepsy, congenital/genetic defects, history of transplant, enteral tubes, hemoglobin <10 g/dL, and blood culture drawn in the preceding 72 hours.
| Predictor | Adjusted OR (95% CI) | P Value | Regression Coefficient (95% CI) | Score* |
|---|---|---|---|---|
| ||||
| Age <1 yr | 1.9 (1.0‐3.4) | 0.038 | 0.6 (<0.1‐1.2) | 1 |
| Epilepsy | 4.4 (1.9‐9.8) | <0.001 | 1.5 (0.7‐2.3) | 2 |
| Congenital/genetic defects | 2.1 (0.9‐4.9) | 0.075 | 0.8 (0.1‐1.6) | 1 |
| History of any transplant | 3.0 (1.3‐6.9) | 0.010 | 1.1 (0.3‐1.9) | 2 |
| Enteral tube | 2.1 (1.3‐3.6) | 0.003 | 0.8 (0.3‐1.3) | 1 |
| Hemoglobin <10 g/dL in preceding 72 hr | 3.0 (1.8‐5.1) | <0.001 | 1.1 (0.6‐1.6) | 2 |
| Blood culture drawn in preceding 72 hr | 5.8 (3.3‐10.3) | <0.001 | 1.8 (1.2‐2.3) | 3 |
Predictive Score
The range of the resulting predictive score was 0 to 12. The median score among cases was 4, and the median score among controls was 1 (P < 0.001). The area under the receiver operating characteristic curve was 0.78 (95% confidence interval 0.74‐0.83).
We grouped the scores by SSLRs into 4 risk strata and calculated each group's estimated post‐test probability of deterioration based on the pre‐test probability of deterioration of 0.15% (Table 4). The very low‐risk group had a probability of deterioration of 0.06%, less than one‐half the pre‐test probability. The low‐risk group had a probability of deterioration of 0.18%, similar to the pre‐test probability. The intermediate‐risk group had a probability of deterioration of 0.39%, 2.6 times higher than the pre‐test probability. The high‐risk group had a probability of deterioration of 12.60%, 84 times higher than the pre‐test probability.
| Risk stratum | Score range | Cases in stratumn (%) | Controls in stratumn (%) | SSLR (95% CI) | Probability of deterioration (%)* |
|---|---|---|---|---|---|
| |||||
| Very low | 0‐2 | 37 (26) | 288 (68) | 0.4 (0.3‐0.5) | 0.06 |
| Low | 3‐4 | 37 (26) | 94 (22) | 1.2 (0.9‐1.6) | 0.2 |
| Intermediate | 5‐6 | 35 (25) | 40 (9) | 2.6 (1.7‐4.0) | 0.4 |
| High | 7‐12 | 32 (23) | 1 (<1) | 96.0 (13.2‐696.2) | 12.6 |
DISCUSSION
Despite the widespread adoption of rapid response systems, we know little about the optimal methods to identify patients whose clinical characteristics alone put them at increased risk of deterioration, and triage the care they receive based on this risk. Pediatric case series have suggested that younger children and those with chronic illnesses are more likely to require assistance from a medical emergency team,1112 but this is the first study to measure their association with this outcome in children.
Most studies with the objective of identifying patients at risk have focused on tools designed to detect symptoms of deterioration that have already begun, using single‐parameter medical emergency team calling criteria1316 or multi‐parameter early warning scores.38 Rather than create a tool to detect deterioration that has already begun, we developed a predictive score that incorporates patient characteristics independently associated with deterioration in hospitalized children, including age <1 year, epilepsy, congenital/genetic defects, history of transplant, enteral tube, hemoglobin <10 g/dL, and blood culture drawn in the preceding 72 hours. The score has the potential to help clinicians identify the children at highest risk of deterioration who might benefit most from the use of vital sign‐based methods to detect deterioration, as well as the children at lowest risk for whom monitoring may be unnecessary. For example, this score could be performed at the time of admission, and those at very low risk of deterioration and without other clinically concerning findings might be considered for a low‐intensity schedule of vital signs and monitoring (such as vital signs every 8 hours, no continuous cardiorespiratory monitoring or pulse oximetry, and early warning score calculation daily), while patients in the intermediate and high‐risk groups might be considered for a more intensive schedule of vital signs and monitoring (such as vital signs every 4 hours, continuous cardiorespiratory monitoring and pulse oximetry, and early warning score calculation every 4 hours). It should be noted, however, that 37 cases (26%) fell into the very low‐risk category, raising the importance of external validation at the point of admission from the emergency department, before the score can be implemented for the potential clinical use described above. If the score performs well in validation studies, then its use in tailoring monitoring parameters has the potential to reduce the amount of time nurses spend responding to false monitor alarms and calculating early warning scores on patients at very low risk of deterioration.
Of note, we excluded children hospitalized for fewer than 24 hours, resulting in the exclusion of 31% of the potentially eligible events. We also excluded 40% of the potentially eligible ICU transfers because they did not meet urgent criteria. These may be limitations because: (1) the first 24 hours of hospitalization may be a high‐risk period; and (2) patients who were on trajectories toward severe deterioration and received interventions that prevented further deterioration, but did not meet urgent criteria, were excluded. It may be that the children we included as cases were at increased risk of deterioration that is either more difficult to recognize early, or more difficult to treat effectively without ICU interventions. In addition, the population of patients meeting urgent criteria may vary across hospitals, limiting generalizability of this score.
In summary, we developed a predictive score and risk stratification tool that may be useful in triaging the intensity of monitoring and surveillance for deterioration that children receive when hospitalized on non‐ICU units. External validation using the setting and frequency of score measurement that would be most valuable clinically (for example, in the emergency department at the time of admission) is needed before clinical use can be recommended.
Acknowledgements
The authors thank Annie Chung, BA, Emily Huang, and Susan Lipsett, MD, for their assistance with data collection.
- Institute for Healthcare Improvement. About IHI. Available at: http://www.ihi.org/ihi/about. Accessed July 18,2010.
- ,,, et al.“Identifying the hospitalised patient in crisis”—a consensus conference on the afferent limb of Rapid Response Systems.Resuscitation.2010;81(4):375–382.
- ,,.The Pediatric Early Warning System score: a severity of illness score to predict urgent medical need in hospitalized children.J Crit Care.2006;21(3):271–278.
- ,,.Development and initial validation of the Bedside Paediatric Early Warning System score.Crit Care.2009;13(4):R135.
- .Detecting and managing deterioration in children.Paediatr Nurs.2005;17(1):32–35.
- ,,.Promoting care for acutely ill children—development and evaluation of a Paediatric Early Warning Tool.Intensive Crit Care Nurs.2006;22(2):73–81.
- ,,,,.Prospective evaluation of a pediatric inpatient early warning scoring system.J Spec Pediatr Nurs.2009;14(2):79–85.
- ,,,.Prospective cohort study to test the predictability of the Cardiff and Vale paediatric early warning system.Arch Dis Child.2009;94(8):602–606.
- ,,,,,.Deaths attributed to pediatric complex chronic conditions: national trends and implications for supportive care services.Pediatrics.2001;107(6):e99.
- ,,,,.Early prediction of neurological sequelae or death after bacterial meningitis.Acta Paediatr.2002;91(4):391–398.
- ,,,,.Retrospective review of emergency response activations during a 13‐year period at a tertiary care children's hospital.J Hosp Med.2011;6(3):131–135.
- ,,,.Clinical profile of hospitalized children provided with urgent assistance from a medical emergency team.Pediatrics.2008;121(6):e1577–e1584.
- ,,, et al.Implementation of a medical emergency team in a large pediatric teaching hospital prevents respiratory and cardiopulmonary arrests outside the intensive care unit.Pediatr Crit Care Med.2007;8(3):236–246.
- ,,, et al.Effect of a rapid response team on hospital‐wide mortality and code rates outside the ICU in a children's hospital.JAMA.2007;298(19):2267–2274.
- ,,, et al.Transition from a traditional code team to a medical emergency team and categorization of cardiopulmonary arrests in a children's center.Arch Pediatr Adolesc Med.2008;162(2):117–122.
- ,.Reduction of hospital mortality and of preventable cardiac arrest and death on introduction of a pediatric medical emergency team.Pediatr Crit Care Med.2009;10(3):306–312.