User login
Medications and Pediatric Deterioration
In recent years, many hospitals have implemented rapid response systems (RRSs) in efforts to reduce mortality outside the intensive care unit (ICU). Rapid response systems include 2 clinical components (efferent and afferent limbs) and 2 organizational components (process improvement and administrative limbs).[1, 2] The efferent limb includes medical emergency teams (METs) that can be summoned to hospital wards to rescue deteriorating patients. The afferent limb identifies patients at risk of deterioration using tools such as early warning scores and triggers a MET response when appropriate.[2] The process‐improvement limb evaluates and optimizes the RRS. The administrative limb implements the RRS and supports its ongoing operation. The effectiveness of most RRSs depends upon the ward team making the decision to escalate care by activating the MET. Barriers to activating the MET may include reduced situational awareness,[3, 4] hierarchical barriers to calling for help,[3, 4, 5, 6, 7, 8] fear of criticism,[3, 8, 9] and other hospital safety cultural barriers.[3, 4, 8]
Proactive critical‐care outreach[10, 11, 12, 13] or rover[14] teams seek to reduce barriers to activation and improve outcomes by systematically identifying and evaluating at‐risk patients without relying on requests for assistance from the ward team. Structured similarly to early warning scores, surveillance tools intended for rover teams might improve their ability to rapidly identify at‐risk patients throughout a hospital. They could combine vital signs with other variables, such as diagnostic and therapeutic interventions that reflect the ward team's early, evolving concern. In particular, the incorporation of medications associated with deterioration may enhance the performance of surveillance tools.
Medications may be associated with deterioration in one of several ways. They could play a causal role in deterioration (ie, opioids causing respiratory insufficiency), represent clinical worsening and anticipation of possible deterioration (ie, broad‐spectrum antibiotics for a positive blood culture), or represent rescue therapies for early deterioration (ie, antihistamines for allergic reactions). In each case, the associated therapeutic classes could be considered sentinel markers of clinical deterioration.
Combined with vital signs and other risk factors, therapeutic classes could serve as useful components of surveillance tools to detect signs of early, evolving deterioration and flag at‐risk patients for evaluation. As a first step, we sought to identify therapeutic classes associated with clinical deterioration. This effort to improve existing afferent tools falls within the process‐improvement limb of RRSs.
PATIENTS AND METHODS
Study Design
We performed a case‐crossover study of children who experienced clinical deterioration. An alternative to the matched case‐control design, the case‐crossover design involves longitudinal within‐subject comparisons exclusively of case subjects such that an individual serves as his or her own control. It is most effective when studying intermittent exposures that result in transient changes in the risk of an acute event,[15, 16, 17] making it appropriate for our study.
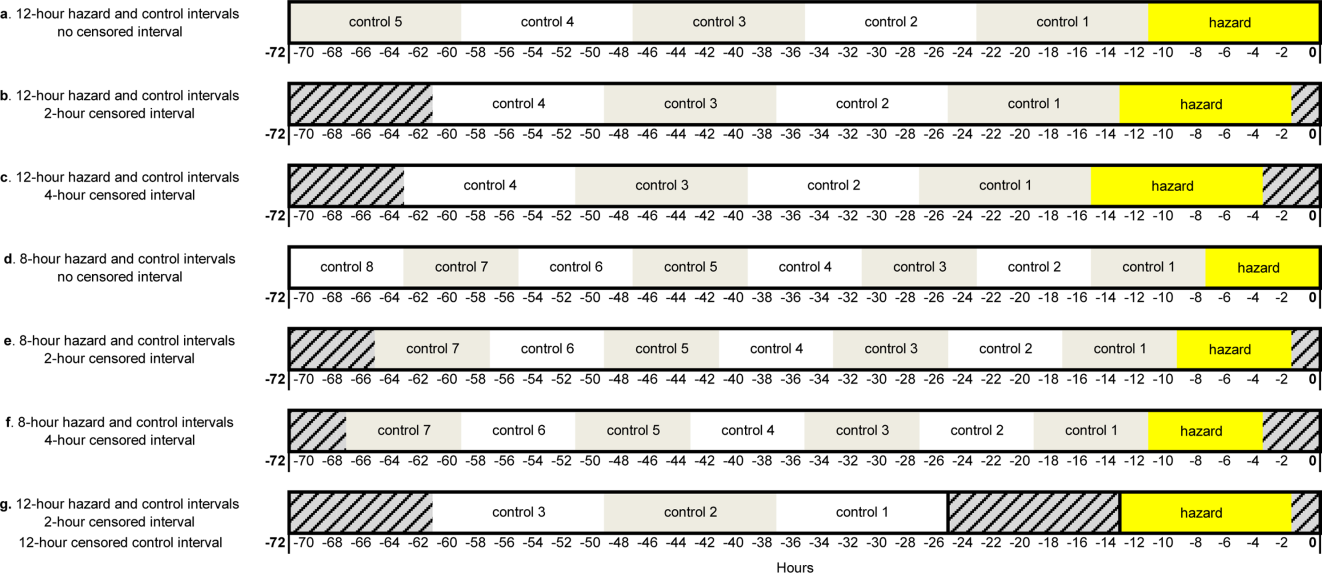
Using the case‐crossover design, we compared a discrete time period in close proximity to the deterioration event, called the hazard interval, with earlier time periods in the hospitalization, called the control intervals.[15, 16, 17] In our primary analysis (Figure 1B), we defined the durations of these intervals as follows: We first censored the 2 hours immediately preceding the clinical deterioration event (hours 0 to 2). We made this decision a priori to exclude medications used after deterioration was recognized and resuscitation had already begun. The 12‐hour period immediately preceding the censored interval was the hazard interval (hours 2 to 14). Each 12‐hour period immediately preceding the hazard interval was a control interval (hours 14 to 26, 26 to 38, 38 to 50, and 50 to 62). Depending on the child's length of stay prior to the deterioration event, each hazard interval had 14 control intervals for comparison. In sensitivity analysis, we altered the durations of these intervals (see below).
Study Setting and Participants
We performed this study among children age <18 years who experienced clinical deterioration between January 1, 2005, and December 31, 2008, after being hospitalized on a general medical or surgical unit at The Children's Hospital of Philadelphia for 24 hours. Clinical deterioration was a composite outcome defined as cardiopulmonary arrest (CPA), acute respiratory compromise (ARC), or urgent ICU transfer. Cardiopulmonary arrest events required either pulselessness or a pulse with inadequate perfusion treated with chest compressions and/or defibrillation. Acute respiratory compromise events required respiratory insufficiency treated with bag‐valve‐mask or invasive airway interventions. Urgent ICU transfers included 1 of the following outcomes in the 12 hours after transfer: death, CPA, intubation, initiation of noninvasive ventilation, or administration of a vasoactive medication infusion used for the treatment of shock. Time zero was the time of the CPA/ARC, or the time at which the child arrived in the ICU for urgent transfers. These subjects also served as the cases for a previously published case‐control study evaluating different risk factors for deterioration.[18] The institutional review board of The Children's Hospital of Philadelphia approved the study.
At the time of the study, the hospital did not have a formal RRS. An immediate‐response code‐blue team was available throughout the study period for emergencies occurring outside the ICU. Physicians could also page the pediatric ICU fellow to discuss patients who did not require immediate assistance from the code‐blue team but were clinically deteriorating. There were no established triggering criteria.
Medication Exposures
Intravenous (IV) medications administered in the 72 hours prior to clinical deterioration were considered the exposures of interest. Each medication was included in 1 therapeutic classes assigned in the hospital's formulary (Lexicomp, Hudson, OH).[19] In order to determine which therapeutic classes to evaluate, we performed a power calculation using the sampsi_mcc package for Stata 12 (StataCorp, College Station, TX). We estimated that we would have 3 matched control intervals per hazard interval. We found that, in order to detect a minimum odds ratio of 3.0 with 80% power, a therapeutic class had to be administered in 5% of control periods. All therapeutic classes meeting that requirement were included in the analysis and are listed in Table 1. (See lists of the individual medications comprising each class in the Supporting Information, Tables 124, in the online version of this article.)
| Therapeutic Class | No. of Control Intervals | % |
|---|---|---|
| ||
| Sedatives | 107 | 25 |
| Antiemetics | 92 | 22 |
| Third‐ and fourth‐generation cephalosporins | 83 | 20 |
| Antihistamines | 74 | 17 |
| Antidotes to hypersensitivity reactions (diphenhydramine) | 65 | 15 |
| Gastric acid secretion inhibitors | 62 | 15 |
| Loop diuretics | 62 | 15 |
| Anti‐inflammatory agents | 61 | 14 |
| Penicillin antibiotics | 61 | 14 |
| Benzodiazepines | 59 | 14 |
| Hypnotics | 58 | 14 |
| Narcotic analgesics (full opioid agonists) | 54 | 13 |
| Antianxiety agents | 53 | 13 |
| Systemic corticosteroids | 53 | 13 |
| Glycopeptide antibiotics (vancomycin) | 46 | 11 |
| Anaerobic antibiotics | 45 | 11 |
| Histamine H2 antagonists | 41 | 10 |
| Antifungal agents | 37 | 9 |
| Phenothiazine derivatives | 37 | 9 |
| Adrenal corticosteroids | 35 | 8 |
| Antiviral agents | 30 | 7 |
| Aminoglycoside antibiotics | 26 | 6 |
| Narcotic analgesics (partial opioid agonists) | 26 | 6 |
| PPIs | 26 | 6 |
Data Collection
Data were abstracted from the electronic medication administration record (Sunrise Clinical Manager; Allscripts, Chicago, IL) into a database. For each subject, we recorded the name and time of administration of each IV medication given in the 72 hours preceding deterioration, as well as demographic, event, and hospitalization characteristics.
Statistical Analysis
We used univariable conditional logistic regression to evaluate the association between each therapeutic class and the composite outcome of clinical deterioration in the primary analysis. Because cases serve as their own controls in the case‐crossover design, this method inherently adjusts for all subject‐specific time‐invariant confounding variables, such as patient demographics, disease, and hospital‐ward characteristics.[15]
Sensitivity Analysis
Our primary analysis used a 2‐hour censored interval and 12‐hour hazard and control intervals. Excluding the censored interval from analysis was a conservative approach that we chose because our goal was to identify therapeutic classes associated with deterioration during a phase in which adverse outcomes may be prevented with early intervention. In order to test whether our findings were stable across different lengths of censored, hazard, and control intervals, we performed a sensitivity analysis, also using conditional logistic regression, on all therapeutic classes that were significant (P<0.05) in primary analysis. In 6 iterations of the sensitivity analysis, we varied the length of the hazard and control intervals between 8 and 12 hours, and the length of the censored interval between 0 and 4 hours (Figure 1AF). In a seventh iteration, we used a variant of the primary analysis in which we censored the first control interval (Figure 1G).
RESULTS
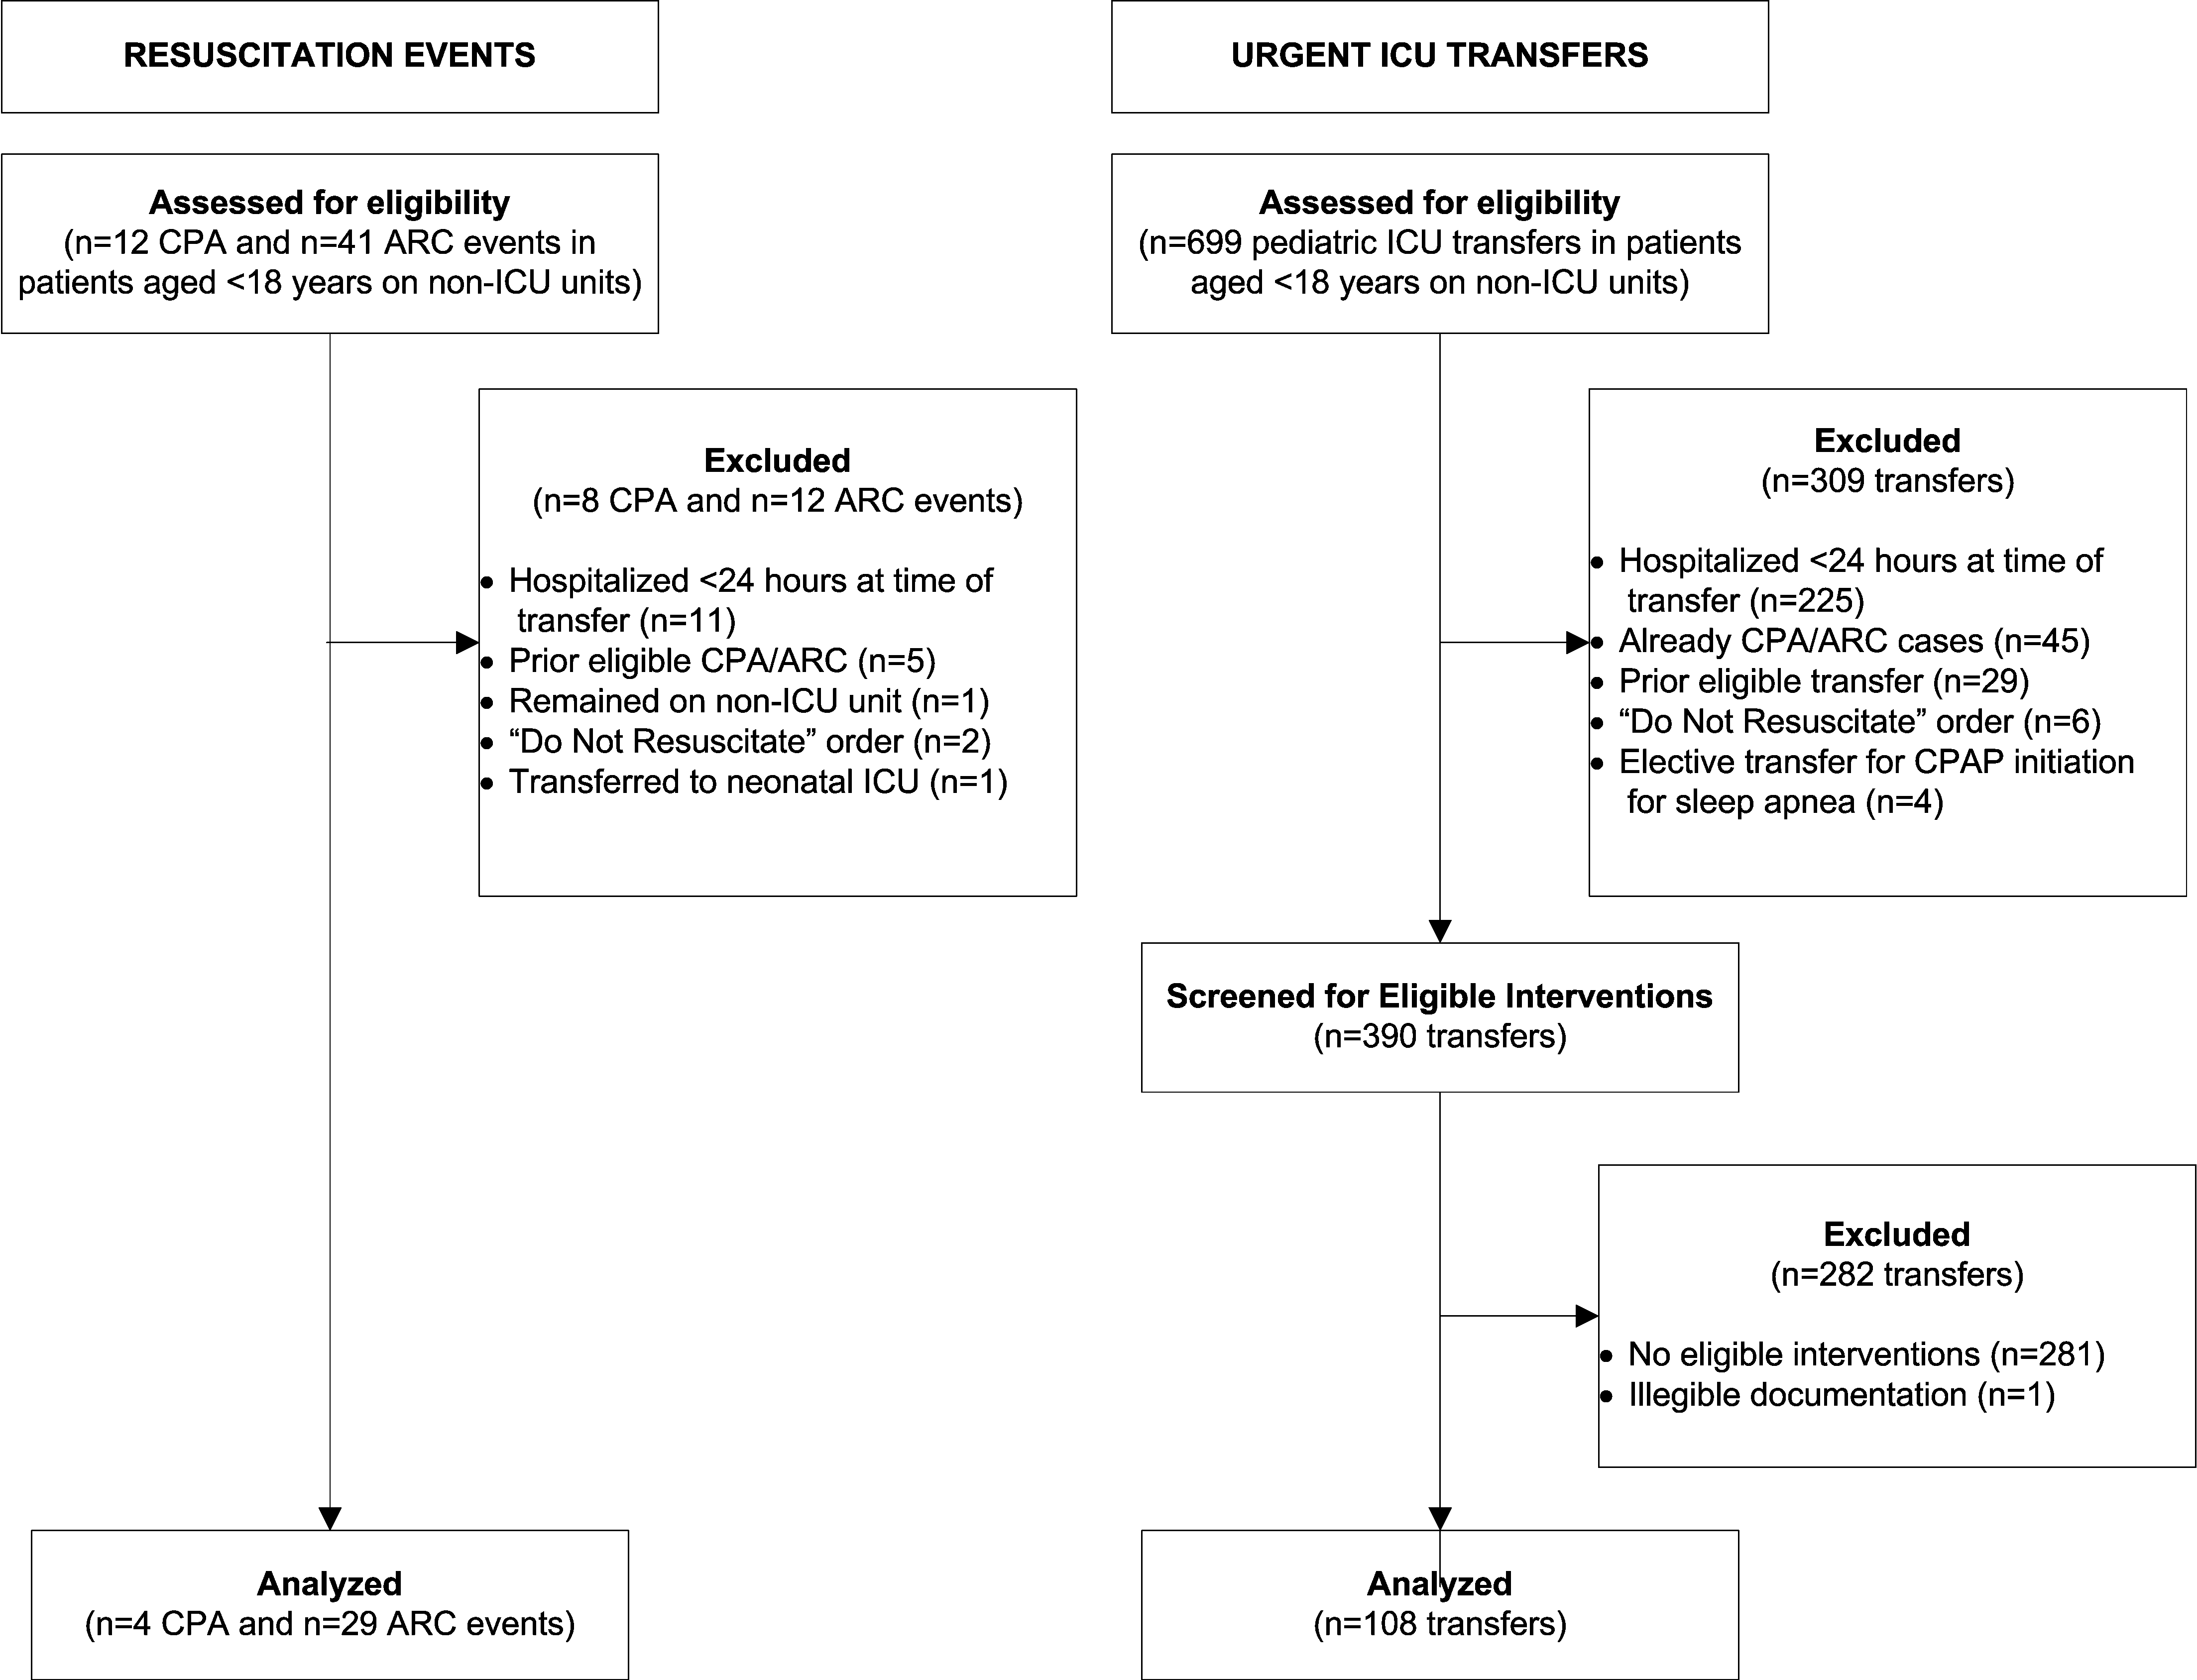
We identified 12 CPAs, 41 ARCs, and 699 ICU transfers during the study period. Of these 752 events, 141 (19%) were eligible as cases according to our inclusion criteria.[18] (A flowchart demonstrating the identification of eligible cases is provided in Supporting Table 25 in the online version of this article.) Of the 81% excluded, 37% were ICU transfers who did not meet urgent criteria. Another 31% were excluded because they were hospitalized for <24 hours at the time of the event, making their analysis in a case‐crossover design using 12‐hour periods impossible. Event characteristics, demographics, and hospitalization characteristics are shown in Table 2.
| n | % | |
|---|---|---|
| ||
| Type of event | ||
| CPA | 4 | 3 |
| ARC | 29 | 20 |
| Urgent ICU transfer | 108 | 77 |
| Demographics | ||
| Age | ||
| 0<6 months | 17 | 12 |
| 6<12 months | 22 | 16 |
| 1<4 years | 34 | 24 |
| 4<10 years | 26 | 18 |
| 10<18 years | 42 | 30 |
| Sex | ||
| F | 60 | 43 |
| M | 81 | 57 |
| Race | ||
| White | 69 | 49 |
| Black/African American | 49 | 35 |
| Asian/Pacific Islander | 0 | 0 |
| Other | 23 | 16 |
| Ethnicity | ||
| Non‐Hispanic | 127 | 90 |
| Hispanic | 14 | 10 |
| Hospitalization | ||
| Surgical service | 4 | 3 |
| Survived to hospital discharge | 107 | 76 |
Primary Analysis
A total of 141 hazard intervals and 487 control intervals were included in the primary analysis, the results of which are shown in Table 3. Among the antimicrobial therapeutic classes, glycopeptide antibiotics (vancomycin), anaerobic antibiotics, third‐generation and fourth‐generation cephalosporins, and aminoglycoside antibiotics were significant. All of the anti‐inflammatory therapeutic classes, including systemic corticosteroids, anti‐inflammatory agents, and adrenal corticosteroids, were significant. All of the sedatives, hypnotics, and antianxiety therapeutic classes, including sedatives, benzodiazepines, hypnotics, and antianxiety agents, were significant. Among the narcotic analgesic therapeutic classes, only 1 class, narcotic analgesics (full opioid agonists), was significant. None of the gastrointestinal therapeutic classes were significant. Among the classes classified as other, loop diuretics and antidotes to hypersensitivity reactions (diphenhydramine) were significant.
| OR | LCI | UCI | P Value | |
|---|---|---|---|---|
| ||||
| Antimicrobial therapeutic classes | ||||
| Glycopeptide antibiotics (vancomycin) | 5.84 | 2.01 | 16.98 | 0.001 |
| Anaerobic antibiotics | 5.33 | 1.36 | 20.94 | 0.02 |
| Third‐ and fourth‐generation cephalosporins | 2.78 | 1.15 | 6.69 | 0.02 |
| Aminoglycoside antibiotics | 2.90 | 1.11 | 7.56 | 0.03 |
| Penicillin antibiotics | 2.40 | 0.9 | 6.4 | 0.08 |
| Antiviral agents | 1.52 | 0.20 | 11.46 | 0.68 |
| Antifungal agents | 1.06 | 0.44 | 2.58 | 0.89 |
| Corticosteroids and other anti‐inflammatory therapeutic classes* | ||||
| Systemic corticosteroids | 3.69 | 1.09 | 12.55 | 0.04 |
| Anti‐inflammatory agents | 3.69 | 1.09 | 12.55 | 0.04 |
| Adrenal corticosteroids | 3.69 | 1.09 | 12.55 | 0.04 |
| Sedatives, hypnotics, and antianxiety therapeutic classes | ||||
| Sedatives | 3.48 | 1.78 | 6.78 | <0.001 |
| Benzodiazepines | 2.71 | 1.36 | 5.40 | 0.01 |
| Hypnotics | 2.54 | 1.27 | 5.09 | 0.01 |
| Antianxiety agents | 2.28 | 1.06 | 4.91 | 0.04 |
| Narcotic analgesic therapeutic classes | ||||
| Narcotic analgesics (full opioid agonists) | 2.48 | 1.07 | 5.73 | 0.03 |
| Narcotic analgesics (partial opioid agonists) | 1.97 | 0.57 | 6.85 | 0.29 |
| GI therapeutic classes | ||||
| Antiemetics | 0.57 | 0.22 | 1.48 | 0.25 |
| PPIs | 2.05 | 0.58 | 7.25 | 0.26 |
| Phenothiazine derivatives | 0.47 | 0.12 | 1.83 | 0.27 |
| Gastric acid secretion inhibitors | 1.71 | 0.61 | 4.81 | 0.31 |
| Histamine H2 antagonists | 0.95 | 0.17 | 5.19 | 0.95 |
| Other therapeutic classes | ||||
| Loop diuretics | 2.87 | 1.28 | 6.47 | 0.01 |
| Antidotes to hypersensitivity reactions (diphenhydramine) | 2.45 | 1.15 | 5.23 | 0.02 |
| Antihistamines | 2.00 | 0.97 | 4.12 | 0.06 |
Sensitivity Analysis
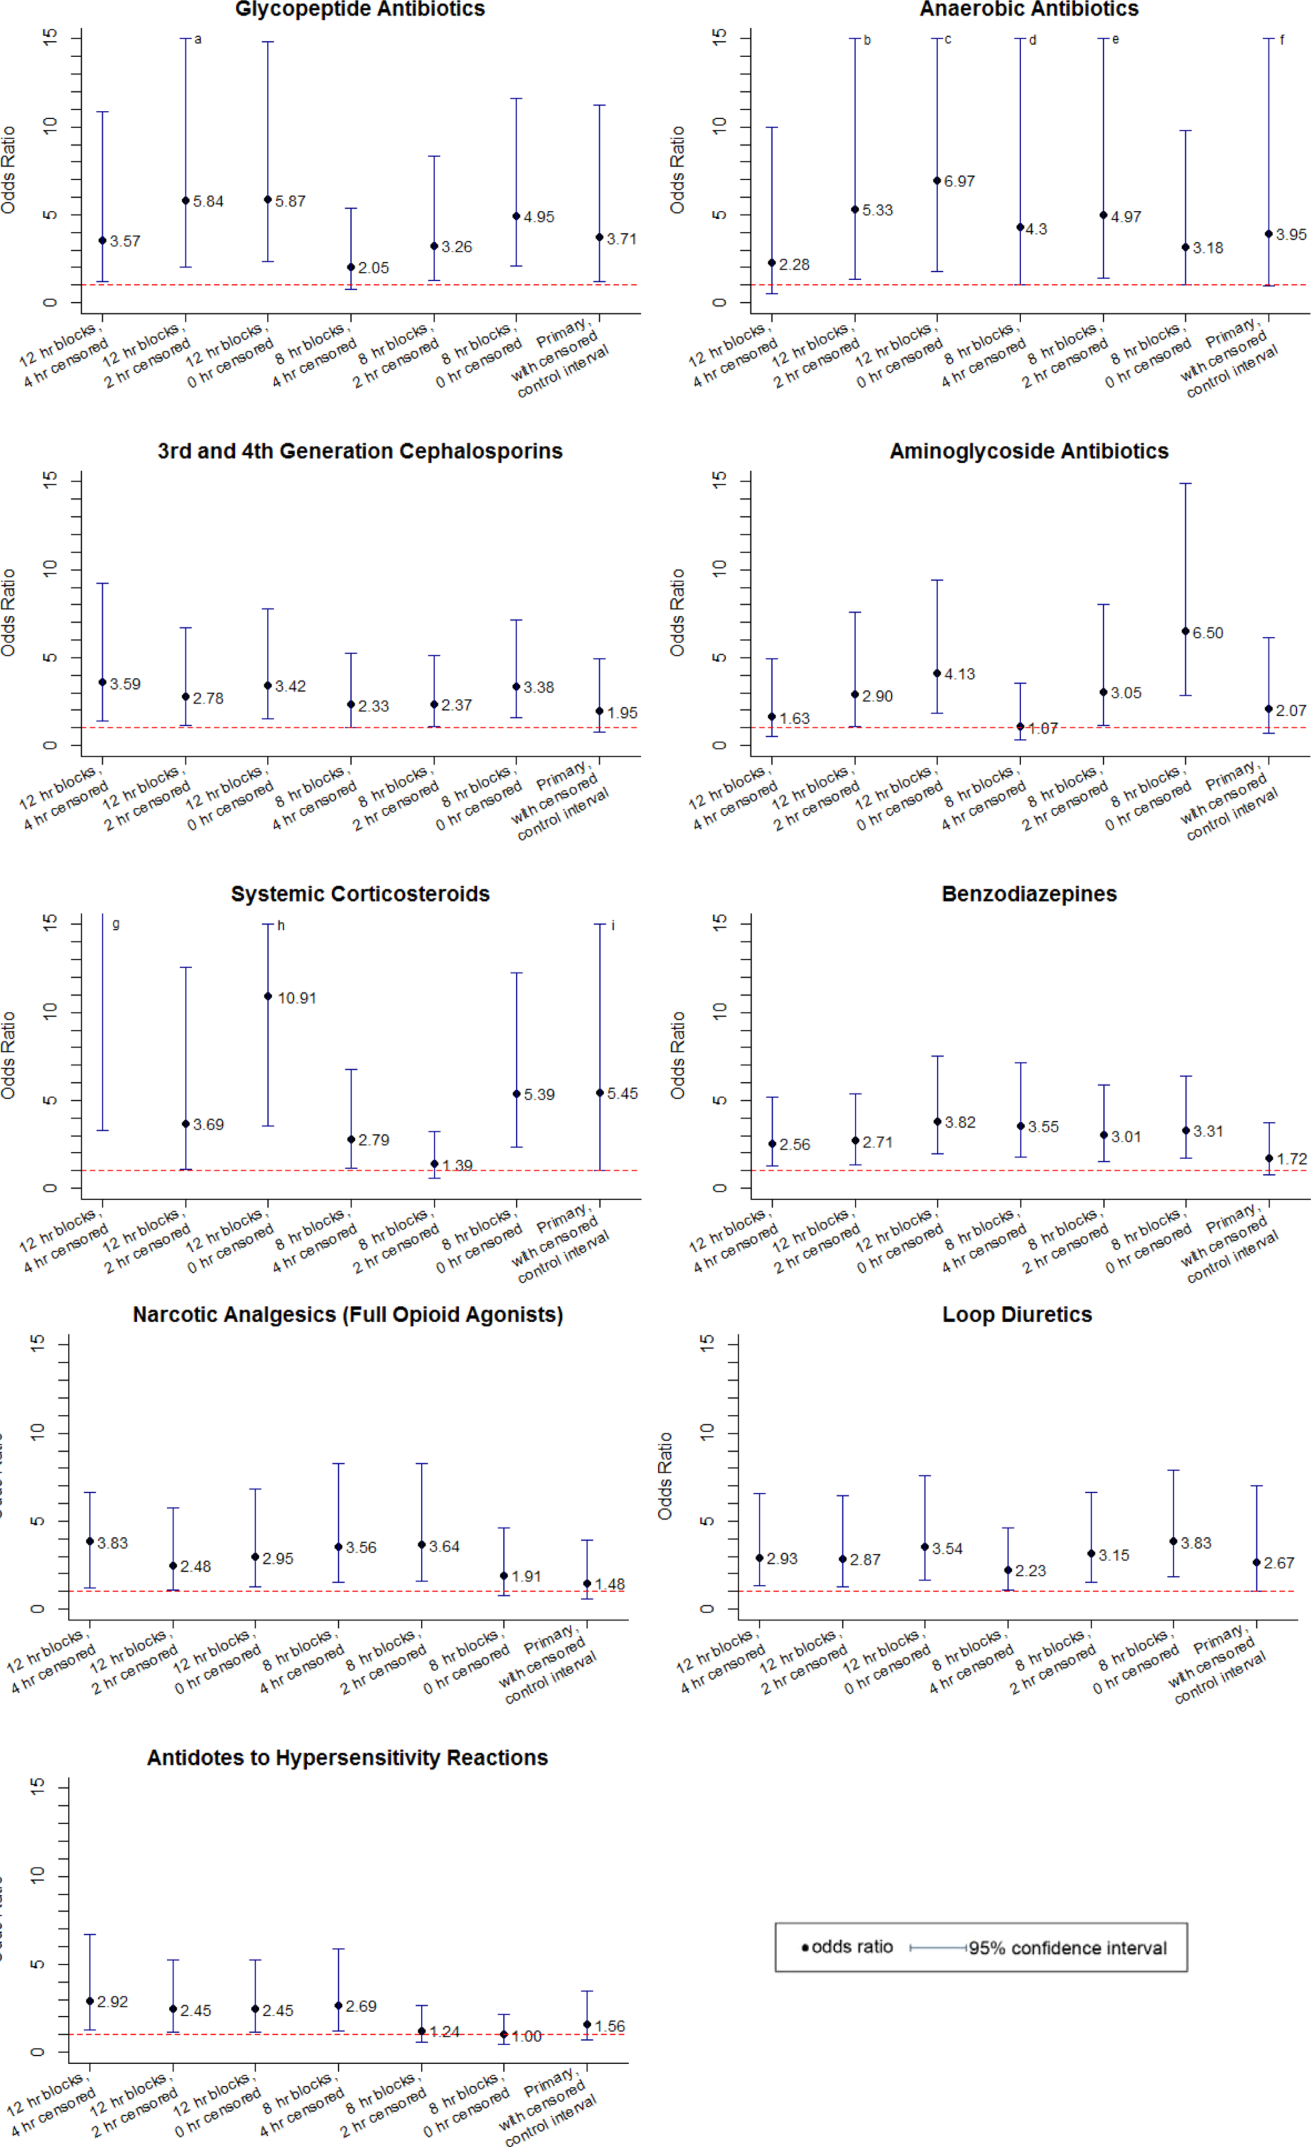
Of the 14 classes that were significant in primary analysis, we carried 9 forward to sensitivity analysis. The 5 that were not carried forward overlapped substantially with other classes that were carried forward. The decision of which overlapping class to carry forward was based upon (1) parsimony and (2) clinical relevance. This is described briefly in the footnotes to Table 3 (see Supporting information in the online version of this article for a full description of this process). Figure 2 presents the odds ratios and their 95% confidence intervals for the sensitivity analysis of each therapeutic class that was significant in primary analysis. Loop diuretics remained significantly associated with deterioration in all 7 iterations. Glycopeptide antibiotics (vancomycin), third‐generation and fourth‐generation cephalosporins, systemic corticosteroids, and benzodiazepines were significant in 6. Anaerobic antibiotics and narcotic analgesics (full opioid agonists) were significant in 5, and aminoglycoside antibiotics and antidotes to hypersensitivity reactions (diphenhydramine) in 4.
DISCUSSION
We identified 9 therapeutic classes which were associated with a 2.5‐fold to 5.8‐fold increased risk of clinical deterioration. The results were robust to sensitivity analysis. Given their temporal association to the deterioration events, these therapeutic classes may serve as sentinels of early deterioration and are candidate variables to combine with vital signs and other risk factors in a surveillance tool for rover teams or an early warning score.
Although most early warning scores intended for use at the bedside are based upon vital signs and clinical observations, a few also include medications. Monaghan's Pediatric Early Warning Score, the basis for many modified scores used in children's hospitals throughout the world, assigns points for children requiring frequent doses of nebulized medication.[20, 21, 22] Nebulized epinephrine is a component of the Bristol Paediatric Early Warning Tool.[23] The number of medications administered in the preceding 24 hours was included in an early version of the Bedside Paediatric Early Warning System Score.[24] Adding IV antibiotics to the Maximum Modified Early Warning Score improved prediction of the need for higher care utilization among hospitalized adults.[25]
In order to determine the role of the IV medications we found to be associated with clinical deterioration, the necessary next step is to develop a multivariable predictive model to determine if they improve the performance of existing early warning scores in identifying deteriorating patients. Although simplicity is an important characteristic of hand‐calculated early warning scores, integration of a more complex scoring system with more variables, such as these medications, into the electronic health record would allow for automated scoring, eliminating the need to sacrifice score performance to keep the tool simple. Integration into the electronic health record would have the additional benefit of making the score available to clinicians who are not at the bedside. Such tools would be especially useful for remote surveillance for deterioration by critical‐care outreach or rover teams.
Our study has several limitations. First, the sample size was small, and although we sought to minimize the likelihood of chance associations by performing sensitivity analysis, these findings should be confirmed in a larger study. Second, we only evaluated IV medications. Medications administered by other routes could also be associated with clinical deterioration and should be analyzed in future studies. Third, we excluded children hospitalized for <24 hours, as well as transfers that did not meet urgent criteria. These may be limitations because (1) the first 24 hours of hospitalization may be a high‐risk period, and (2) patients who were on trajectories toward severe deterioration and received interventions that prevented further deterioration but did not meet urgent transfer criteria were excluded. It may be that the children we included as cases were at increased risk of deterioration that is either more difficult to recognize early, or more difficult to treat effectively without ICU interventions. Finally, we acknowledge that in some cases the therapeutic classes were associated with deterioration in a causal fashion, and in others the medications administered did not cause deterioration but were signs of therapeutic interventions that were initiated in response to clinical worsening. Identifying the specific indications for administration of drugs used in response to clinical worsening may have resulted in stronger associations with deterioration. However, these indications are often complex, multifactorial, and poorly documented in real time. This limits the ability to automate their detection using the electronic health record, the ultimate goal of this line of research.
CONCLUSION
We used a case‐crossover approach to identify therapeutic classes that are associated with increased risk of clinical deterioration in hospitalized children on pediatric wards. These sentinel therapeutic classes may serve as useful components of electronic health recordbased surveillance tools to detect signs of early, evolving deterioration and flag at‐risk patients for critical‐care outreach or rover team review. Future research should focus on evaluating whether including these therapeutic classes in early warning scores improves their accuracy in detecting signs of deterioration and determining if providing this information as clinical decision support improves patient outcomes.
Acknowledgments
Disclosures: This study was funded by The Children's Hospital of Philadelphia Center for Pediatric Clinical Effectiveness Pilot Grant and the University of Pennsylvania Provost's Undergraduate Research Mentoring Program. Drs. Bonafide and Keren also receive funding from the Pennsylvania Health Research Formula Fund Award from the Pennsylvania Department of Health for research in pediatric hospital quality, safety, and costs. The authors have no other conflicts of interest to report.
- , , , et al. Findings of the first consensus conference on medical emergency teams. Crit Care Med. 2006;34(9):2463–2478.
- , , , et al. “Identifying the hospitalised patient in crisis”—a consensus conference on the afferent limb of rapid response systems. Resuscitation. 2010;81(4):375–382.
- , , , . Attitudes and barriers to a medical emergency team system at a tertiary paediatric hospital. Resuscitation. 2011;82(2):167–174.
- , , , et al. Why don't hospital staff activate the rapid response system (RRS)? How frequently is it needed and can the process be improved? Implement Sci. 2011;6:39.
- , . Failure of the afferent limb: a persistent problem in rapid response systems. Resuscitation. 2011;82(7):797–798.
- , , . Understanding how rapid response systems may improve safety for the acutely ill patient: learning from the frontline. BMJ Qual Saf. 2012;21(2):135–144.
- , , . How RNs rescue patients: a qualitative study of RNs' perceived involvement in rapid response teams. Qual Saf Health Care. 2010;19(5):1–4.
- , , , et al. A survey of nurses' beliefs about the medical emergency team system in a Canadian tertiary hospital. Am J Crit Care. 2010;19(1):74–83.
- , , , et al. Nurses' attitudes to a medical emergency team service in a teaching hospital. Qual Saf Health Care. 2006;15(6):427–432.
- , , , et al. Introducing critical care outreach: a ward‐randomised trial of phased introduction in a general hospital. Intensive Care Med. 2004;30(7):1398–1404.
- . Out of our reach? Assessing the impact of introducing a critical care outreach service. Anaesthesia. 2003;58(9):882–885.
- , , . Effect of the critical care outreach team on patient survival to discharge from hospital and readmission to critical care: non‐randomised population based study. BMJ. 2003;327(7422):1014.
- , , , et al. Successful implementation of a family and patient activated rapid response team in an adult level 1 trauma center. Resuscitation. 2010;81(12):1676–1681.
- , , , et al. Beyond rapid response teams: instituting a “Rover Team” improves the management of at‐risk patients, facilitates proactive interventions, and improves outcomes. In: Henriksen K, Battles JB, Keyes MA, Grady ML, eds. Advances in Patient Safety: New Directions and Alternative Approaches. Rockville, MD: Agency for Healthcare Research and Quality; 2008.
- , . The case‐crossover study design in pharmacoepidemiology. Stat Methods Med Res. 2009;18(1):53–65.
- , , , et al. Comparison of the statistical efficiency of case‐crossover and case‐control designs: application to severe cutaneous adverse reactions. J Clin Epidemiol. 2001;54(12):1218–1227.
- . The case‐crossover design: a method for studying transient effects on the risk of acute events. Am J Epidemiol. 1991;133(2):144–153.
- , , , , , . Development of a score to predict clinical deterioration in hospitalized children. J Hosp Med. 2012;7(4):345–349.
- Lexicomp. Available at: http://www.lexi.com. Accessed July 26, 2012.
- , , , , , . Sensitivity of the Pediatric Early Warning Score to identify patient deterioration. Pediatrics. 2010;125(4):e763–e769.
- . Detecting and managing deterioration in children. Paediatr Nurs. 2005;17(1):32–35.
- , , , , . Prospective evaluation of a pediatric inpatient early warning scoring system. J Spec Pediatr Nurs. 2009;14(2):79–85.
- , , . Promoting care for acutely ill children—development and evaluation of a Paediatric Early Warning Tool. Intensive Crit Care Nurs. 2006;22(2):73–81.
- , , . The Pediatric Early Warning System Score: a severity of illness score to predict urgent medical need in hospitalized children. J Crit Care. 2006;21(3):271–278.
- , , , , , . Performance of the maximum modified early warning score to predict the need for higher care utilization among admitted emergency department patients. J Hosp Med. 2010;5(1):E46–E52.
In recent years, many hospitals have implemented rapid response systems (RRSs) in efforts to reduce mortality outside the intensive care unit (ICU). Rapid response systems include 2 clinical components (efferent and afferent limbs) and 2 organizational components (process improvement and administrative limbs).[1, 2] The efferent limb includes medical emergency teams (METs) that can be summoned to hospital wards to rescue deteriorating patients. The afferent limb identifies patients at risk of deterioration using tools such as early warning scores and triggers a MET response when appropriate.[2] The process‐improvement limb evaluates and optimizes the RRS. The administrative limb implements the RRS and supports its ongoing operation. The effectiveness of most RRSs depends upon the ward team making the decision to escalate care by activating the MET. Barriers to activating the MET may include reduced situational awareness,[3, 4] hierarchical barriers to calling for help,[3, 4, 5, 6, 7, 8] fear of criticism,[3, 8, 9] and other hospital safety cultural barriers.[3, 4, 8]
Proactive critical‐care outreach[10, 11, 12, 13] or rover[14] teams seek to reduce barriers to activation and improve outcomes by systematically identifying and evaluating at‐risk patients without relying on requests for assistance from the ward team. Structured similarly to early warning scores, surveillance tools intended for rover teams might improve their ability to rapidly identify at‐risk patients throughout a hospital. They could combine vital signs with other variables, such as diagnostic and therapeutic interventions that reflect the ward team's early, evolving concern. In particular, the incorporation of medications associated with deterioration may enhance the performance of surveillance tools.
Medications may be associated with deterioration in one of several ways. They could play a causal role in deterioration (ie, opioids causing respiratory insufficiency), represent clinical worsening and anticipation of possible deterioration (ie, broad‐spectrum antibiotics for a positive blood culture), or represent rescue therapies for early deterioration (ie, antihistamines for allergic reactions). In each case, the associated therapeutic classes could be considered sentinel markers of clinical deterioration.
Combined with vital signs and other risk factors, therapeutic classes could serve as useful components of surveillance tools to detect signs of early, evolving deterioration and flag at‐risk patients for evaluation. As a first step, we sought to identify therapeutic classes associated with clinical deterioration. This effort to improve existing afferent tools falls within the process‐improvement limb of RRSs.
PATIENTS AND METHODS
Study Design
We performed a case‐crossover study of children who experienced clinical deterioration. An alternative to the matched case‐control design, the case‐crossover design involves longitudinal within‐subject comparisons exclusively of case subjects such that an individual serves as his or her own control. It is most effective when studying intermittent exposures that result in transient changes in the risk of an acute event,[15, 16, 17] making it appropriate for our study.
Using the case‐crossover design, we compared a discrete time period in close proximity to the deterioration event, called the hazard interval, with earlier time periods in the hospitalization, called the control intervals.[15, 16, 17] In our primary analysis (Figure 1B), we defined the durations of these intervals as follows: We first censored the 2 hours immediately preceding the clinical deterioration event (hours 0 to 2). We made this decision a priori to exclude medications used after deterioration was recognized and resuscitation had already begun. The 12‐hour period immediately preceding the censored interval was the hazard interval (hours 2 to 14). Each 12‐hour period immediately preceding the hazard interval was a control interval (hours 14 to 26, 26 to 38, 38 to 50, and 50 to 62). Depending on the child's length of stay prior to the deterioration event, each hazard interval had 14 control intervals for comparison. In sensitivity analysis, we altered the durations of these intervals (see below).
Study Setting and Participants
We performed this study among children age <18 years who experienced clinical deterioration between January 1, 2005, and December 31, 2008, after being hospitalized on a general medical or surgical unit at The Children's Hospital of Philadelphia for 24 hours. Clinical deterioration was a composite outcome defined as cardiopulmonary arrest (CPA), acute respiratory compromise (ARC), or urgent ICU transfer. Cardiopulmonary arrest events required either pulselessness or a pulse with inadequate perfusion treated with chest compressions and/or defibrillation. Acute respiratory compromise events required respiratory insufficiency treated with bag‐valve‐mask or invasive airway interventions. Urgent ICU transfers included 1 of the following outcomes in the 12 hours after transfer: death, CPA, intubation, initiation of noninvasive ventilation, or administration of a vasoactive medication infusion used for the treatment of shock. Time zero was the time of the CPA/ARC, or the time at which the child arrived in the ICU for urgent transfers. These subjects also served as the cases for a previously published case‐control study evaluating different risk factors for deterioration.[18] The institutional review board of The Children's Hospital of Philadelphia approved the study.
At the time of the study, the hospital did not have a formal RRS. An immediate‐response code‐blue team was available throughout the study period for emergencies occurring outside the ICU. Physicians could also page the pediatric ICU fellow to discuss patients who did not require immediate assistance from the code‐blue team but were clinically deteriorating. There were no established triggering criteria.
Medication Exposures
Intravenous (IV) medications administered in the 72 hours prior to clinical deterioration were considered the exposures of interest. Each medication was included in 1 therapeutic classes assigned in the hospital's formulary (Lexicomp, Hudson, OH).[19] In order to determine which therapeutic classes to evaluate, we performed a power calculation using the sampsi_mcc package for Stata 12 (StataCorp, College Station, TX). We estimated that we would have 3 matched control intervals per hazard interval. We found that, in order to detect a minimum odds ratio of 3.0 with 80% power, a therapeutic class had to be administered in 5% of control periods. All therapeutic classes meeting that requirement were included in the analysis and are listed in Table 1. (See lists of the individual medications comprising each class in the Supporting Information, Tables 124, in the online version of this article.)
| Therapeutic Class | No. of Control Intervals | % |
|---|---|---|
| ||
| Sedatives | 107 | 25 |
| Antiemetics | 92 | 22 |
| Third‐ and fourth‐generation cephalosporins | 83 | 20 |
| Antihistamines | 74 | 17 |
| Antidotes to hypersensitivity reactions (diphenhydramine) | 65 | 15 |
| Gastric acid secretion inhibitors | 62 | 15 |
| Loop diuretics | 62 | 15 |
| Anti‐inflammatory agents | 61 | 14 |
| Penicillin antibiotics | 61 | 14 |
| Benzodiazepines | 59 | 14 |
| Hypnotics | 58 | 14 |
| Narcotic analgesics (full opioid agonists) | 54 | 13 |
| Antianxiety agents | 53 | 13 |
| Systemic corticosteroids | 53 | 13 |
| Glycopeptide antibiotics (vancomycin) | 46 | 11 |
| Anaerobic antibiotics | 45 | 11 |
| Histamine H2 antagonists | 41 | 10 |
| Antifungal agents | 37 | 9 |
| Phenothiazine derivatives | 37 | 9 |
| Adrenal corticosteroids | 35 | 8 |
| Antiviral agents | 30 | 7 |
| Aminoglycoside antibiotics | 26 | 6 |
| Narcotic analgesics (partial opioid agonists) | 26 | 6 |
| PPIs | 26 | 6 |
Data Collection
Data were abstracted from the electronic medication administration record (Sunrise Clinical Manager; Allscripts, Chicago, IL) into a database. For each subject, we recorded the name and time of administration of each IV medication given in the 72 hours preceding deterioration, as well as demographic, event, and hospitalization characteristics.
Statistical Analysis
We used univariable conditional logistic regression to evaluate the association between each therapeutic class and the composite outcome of clinical deterioration in the primary analysis. Because cases serve as their own controls in the case‐crossover design, this method inherently adjusts for all subject‐specific time‐invariant confounding variables, such as patient demographics, disease, and hospital‐ward characteristics.[15]
Sensitivity Analysis
Our primary analysis used a 2‐hour censored interval and 12‐hour hazard and control intervals. Excluding the censored interval from analysis was a conservative approach that we chose because our goal was to identify therapeutic classes associated with deterioration during a phase in which adverse outcomes may be prevented with early intervention. In order to test whether our findings were stable across different lengths of censored, hazard, and control intervals, we performed a sensitivity analysis, also using conditional logistic regression, on all therapeutic classes that were significant (P<0.05) in primary analysis. In 6 iterations of the sensitivity analysis, we varied the length of the hazard and control intervals between 8 and 12 hours, and the length of the censored interval between 0 and 4 hours (Figure 1AF). In a seventh iteration, we used a variant of the primary analysis in which we censored the first control interval (Figure 1G).
RESULTS
We identified 12 CPAs, 41 ARCs, and 699 ICU transfers during the study period. Of these 752 events, 141 (19%) were eligible as cases according to our inclusion criteria.[18] (A flowchart demonstrating the identification of eligible cases is provided in Supporting Table 25 in the online version of this article.) Of the 81% excluded, 37% were ICU transfers who did not meet urgent criteria. Another 31% were excluded because they were hospitalized for <24 hours at the time of the event, making their analysis in a case‐crossover design using 12‐hour periods impossible. Event characteristics, demographics, and hospitalization characteristics are shown in Table 2.
| n | % | |
|---|---|---|
| ||
| Type of event | ||
| CPA | 4 | 3 |
| ARC | 29 | 20 |
| Urgent ICU transfer | 108 | 77 |
| Demographics | ||
| Age | ||
| 0<6 months | 17 | 12 |
| 6<12 months | 22 | 16 |
| 1<4 years | 34 | 24 |
| 4<10 years | 26 | 18 |
| 10<18 years | 42 | 30 |
| Sex | ||
| F | 60 | 43 |
| M | 81 | 57 |
| Race | ||
| White | 69 | 49 |
| Black/African American | 49 | 35 |
| Asian/Pacific Islander | 0 | 0 |
| Other | 23 | 16 |
| Ethnicity | ||
| Non‐Hispanic | 127 | 90 |
| Hispanic | 14 | 10 |
| Hospitalization | ||
| Surgical service | 4 | 3 |
| Survived to hospital discharge | 107 | 76 |
Primary Analysis
A total of 141 hazard intervals and 487 control intervals were included in the primary analysis, the results of which are shown in Table 3. Among the antimicrobial therapeutic classes, glycopeptide antibiotics (vancomycin), anaerobic antibiotics, third‐generation and fourth‐generation cephalosporins, and aminoglycoside antibiotics were significant. All of the anti‐inflammatory therapeutic classes, including systemic corticosteroids, anti‐inflammatory agents, and adrenal corticosteroids, were significant. All of the sedatives, hypnotics, and antianxiety therapeutic classes, including sedatives, benzodiazepines, hypnotics, and antianxiety agents, were significant. Among the narcotic analgesic therapeutic classes, only 1 class, narcotic analgesics (full opioid agonists), was significant. None of the gastrointestinal therapeutic classes were significant. Among the classes classified as other, loop diuretics and antidotes to hypersensitivity reactions (diphenhydramine) were significant.
| OR | LCI | UCI | P Value | |
|---|---|---|---|---|
| ||||
| Antimicrobial therapeutic classes | ||||
| Glycopeptide antibiotics (vancomycin) | 5.84 | 2.01 | 16.98 | 0.001 |
| Anaerobic antibiotics | 5.33 | 1.36 | 20.94 | 0.02 |
| Third‐ and fourth‐generation cephalosporins | 2.78 | 1.15 | 6.69 | 0.02 |
| Aminoglycoside antibiotics | 2.90 | 1.11 | 7.56 | 0.03 |
| Penicillin antibiotics | 2.40 | 0.9 | 6.4 | 0.08 |
| Antiviral agents | 1.52 | 0.20 | 11.46 | 0.68 |
| Antifungal agents | 1.06 | 0.44 | 2.58 | 0.89 |
| Corticosteroids and other anti‐inflammatory therapeutic classes* | ||||
| Systemic corticosteroids | 3.69 | 1.09 | 12.55 | 0.04 |
| Anti‐inflammatory agents | 3.69 | 1.09 | 12.55 | 0.04 |
| Adrenal corticosteroids | 3.69 | 1.09 | 12.55 | 0.04 |
| Sedatives, hypnotics, and antianxiety therapeutic classes | ||||
| Sedatives | 3.48 | 1.78 | 6.78 | <0.001 |
| Benzodiazepines | 2.71 | 1.36 | 5.40 | 0.01 |
| Hypnotics | 2.54 | 1.27 | 5.09 | 0.01 |
| Antianxiety agents | 2.28 | 1.06 | 4.91 | 0.04 |
| Narcotic analgesic therapeutic classes | ||||
| Narcotic analgesics (full opioid agonists) | 2.48 | 1.07 | 5.73 | 0.03 |
| Narcotic analgesics (partial opioid agonists) | 1.97 | 0.57 | 6.85 | 0.29 |
| GI therapeutic classes | ||||
| Antiemetics | 0.57 | 0.22 | 1.48 | 0.25 |
| PPIs | 2.05 | 0.58 | 7.25 | 0.26 |
| Phenothiazine derivatives | 0.47 | 0.12 | 1.83 | 0.27 |
| Gastric acid secretion inhibitors | 1.71 | 0.61 | 4.81 | 0.31 |
| Histamine H2 antagonists | 0.95 | 0.17 | 5.19 | 0.95 |
| Other therapeutic classes | ||||
| Loop diuretics | 2.87 | 1.28 | 6.47 | 0.01 |
| Antidotes to hypersensitivity reactions (diphenhydramine) | 2.45 | 1.15 | 5.23 | 0.02 |
| Antihistamines | 2.00 | 0.97 | 4.12 | 0.06 |
Sensitivity Analysis
Of the 14 classes that were significant in primary analysis, we carried 9 forward to sensitivity analysis. The 5 that were not carried forward overlapped substantially with other classes that were carried forward. The decision of which overlapping class to carry forward was based upon (1) parsimony and (2) clinical relevance. This is described briefly in the footnotes to Table 3 (see Supporting information in the online version of this article for a full description of this process). Figure 2 presents the odds ratios and their 95% confidence intervals for the sensitivity analysis of each therapeutic class that was significant in primary analysis. Loop diuretics remained significantly associated with deterioration in all 7 iterations. Glycopeptide antibiotics (vancomycin), third‐generation and fourth‐generation cephalosporins, systemic corticosteroids, and benzodiazepines were significant in 6. Anaerobic antibiotics and narcotic analgesics (full opioid agonists) were significant in 5, and aminoglycoside antibiotics and antidotes to hypersensitivity reactions (diphenhydramine) in 4.
DISCUSSION
We identified 9 therapeutic classes which were associated with a 2.5‐fold to 5.8‐fold increased risk of clinical deterioration. The results were robust to sensitivity analysis. Given their temporal association to the deterioration events, these therapeutic classes may serve as sentinels of early deterioration and are candidate variables to combine with vital signs and other risk factors in a surveillance tool for rover teams or an early warning score.
Although most early warning scores intended for use at the bedside are based upon vital signs and clinical observations, a few also include medications. Monaghan's Pediatric Early Warning Score, the basis for many modified scores used in children's hospitals throughout the world, assigns points for children requiring frequent doses of nebulized medication.[20, 21, 22] Nebulized epinephrine is a component of the Bristol Paediatric Early Warning Tool.[23] The number of medications administered in the preceding 24 hours was included in an early version of the Bedside Paediatric Early Warning System Score.[24] Adding IV antibiotics to the Maximum Modified Early Warning Score improved prediction of the need for higher care utilization among hospitalized adults.[25]
In order to determine the role of the IV medications we found to be associated with clinical deterioration, the necessary next step is to develop a multivariable predictive model to determine if they improve the performance of existing early warning scores in identifying deteriorating patients. Although simplicity is an important characteristic of hand‐calculated early warning scores, integration of a more complex scoring system with more variables, such as these medications, into the electronic health record would allow for automated scoring, eliminating the need to sacrifice score performance to keep the tool simple. Integration into the electronic health record would have the additional benefit of making the score available to clinicians who are not at the bedside. Such tools would be especially useful for remote surveillance for deterioration by critical‐care outreach or rover teams.
Our study has several limitations. First, the sample size was small, and although we sought to minimize the likelihood of chance associations by performing sensitivity analysis, these findings should be confirmed in a larger study. Second, we only evaluated IV medications. Medications administered by other routes could also be associated with clinical deterioration and should be analyzed in future studies. Third, we excluded children hospitalized for <24 hours, as well as transfers that did not meet urgent criteria. These may be limitations because (1) the first 24 hours of hospitalization may be a high‐risk period, and (2) patients who were on trajectories toward severe deterioration and received interventions that prevented further deterioration but did not meet urgent transfer criteria were excluded. It may be that the children we included as cases were at increased risk of deterioration that is either more difficult to recognize early, or more difficult to treat effectively without ICU interventions. Finally, we acknowledge that in some cases the therapeutic classes were associated with deterioration in a causal fashion, and in others the medications administered did not cause deterioration but were signs of therapeutic interventions that were initiated in response to clinical worsening. Identifying the specific indications for administration of drugs used in response to clinical worsening may have resulted in stronger associations with deterioration. However, these indications are often complex, multifactorial, and poorly documented in real time. This limits the ability to automate their detection using the electronic health record, the ultimate goal of this line of research.
CONCLUSION
We used a case‐crossover approach to identify therapeutic classes that are associated with increased risk of clinical deterioration in hospitalized children on pediatric wards. These sentinel therapeutic classes may serve as useful components of electronic health recordbased surveillance tools to detect signs of early, evolving deterioration and flag at‐risk patients for critical‐care outreach or rover team review. Future research should focus on evaluating whether including these therapeutic classes in early warning scores improves their accuracy in detecting signs of deterioration and determining if providing this information as clinical decision support improves patient outcomes.
Acknowledgments
Disclosures: This study was funded by The Children's Hospital of Philadelphia Center for Pediatric Clinical Effectiveness Pilot Grant and the University of Pennsylvania Provost's Undergraduate Research Mentoring Program. Drs. Bonafide and Keren also receive funding from the Pennsylvania Health Research Formula Fund Award from the Pennsylvania Department of Health for research in pediatric hospital quality, safety, and costs. The authors have no other conflicts of interest to report.
- , , , et al. Findings of the first consensus conference on medical emergency teams. Crit Care Med. 2006;34(9):2463–2478.
- , , , et al. “Identifying the hospitalised patient in crisis”—a consensus conference on the afferent limb of rapid response systems. Resuscitation. 2010;81(4):375–382.
- , , , . Attitudes and barriers to a medical emergency team system at a tertiary paediatric hospital. Resuscitation. 2011;82(2):167–174.
- , , , et al. Why don't hospital staff activate the rapid response system (RRS)? How frequently is it needed and can the process be improved? Implement Sci. 2011;6:39.
- , . Failure of the afferent limb: a persistent problem in rapid response systems. Resuscitation. 2011;82(7):797–798.
- , , . Understanding how rapid response systems may improve safety for the acutely ill patient: learning from the frontline. BMJ Qual Saf. 2012;21(2):135–144.
- , , . How RNs rescue patients: a qualitative study of RNs' perceived involvement in rapid response teams. Qual Saf Health Care. 2010;19(5):1–4.
- , , , et al. A survey of nurses' beliefs about the medical emergency team system in a Canadian tertiary hospital. Am J Crit Care. 2010;19(1):74–83.
- , , , et al. Nurses' attitudes to a medical emergency team service in a teaching hospital. Qual Saf Health Care. 2006;15(6):427–432.
- , , , et al. Introducing critical care outreach: a ward‐randomised trial of phased introduction in a general hospital. Intensive Care Med. 2004;30(7):1398–1404.
- . Out of our reach? Assessing the impact of introducing a critical care outreach service. Anaesthesia. 2003;58(9):882–885.
- , , . Effect of the critical care outreach team on patient survival to discharge from hospital and readmission to critical care: non‐randomised population based study. BMJ. 2003;327(7422):1014.
- , , , et al. Successful implementation of a family and patient activated rapid response team in an adult level 1 trauma center. Resuscitation. 2010;81(12):1676–1681.
- , , , et al. Beyond rapid response teams: instituting a “Rover Team” improves the management of at‐risk patients, facilitates proactive interventions, and improves outcomes. In: Henriksen K, Battles JB, Keyes MA, Grady ML, eds. Advances in Patient Safety: New Directions and Alternative Approaches. Rockville, MD: Agency for Healthcare Research and Quality; 2008.
- , . The case‐crossover study design in pharmacoepidemiology. Stat Methods Med Res. 2009;18(1):53–65.
- , , , et al. Comparison of the statistical efficiency of case‐crossover and case‐control designs: application to severe cutaneous adverse reactions. J Clin Epidemiol. 2001;54(12):1218–1227.
- . The case‐crossover design: a method for studying transient effects on the risk of acute events. Am J Epidemiol. 1991;133(2):144–153.
- , , , , , . Development of a score to predict clinical deterioration in hospitalized children. J Hosp Med. 2012;7(4):345–349.
- Lexicomp. Available at: http://www.lexi.com. Accessed July 26, 2012.
- , , , , , . Sensitivity of the Pediatric Early Warning Score to identify patient deterioration. Pediatrics. 2010;125(4):e763–e769.
- . Detecting and managing deterioration in children. Paediatr Nurs. 2005;17(1):32–35.
- , , , , . Prospective evaluation of a pediatric inpatient early warning scoring system. J Spec Pediatr Nurs. 2009;14(2):79–85.
- , , . Promoting care for acutely ill children—development and evaluation of a Paediatric Early Warning Tool. Intensive Crit Care Nurs. 2006;22(2):73–81.
- , , . The Pediatric Early Warning System Score: a severity of illness score to predict urgent medical need in hospitalized children. J Crit Care. 2006;21(3):271–278.
- , , , , , . Performance of the maximum modified early warning score to predict the need for higher care utilization among admitted emergency department patients. J Hosp Med. 2010;5(1):E46–E52.
Copyright © 2013 Society of Hospital Medicine

Early Warning Score Qualitative Study
Thousands of hospitals have recently implemented rapid response systems (RRSs), attempting to reduce mortality outside of intensive care units (ICUs).[1, 2] These systems have 2 clinical components, a response (efferent) arm and an identification (afferent) arm.[3] The response arm is usually composed of a medical emergency team (MET) that responds to calls for urgent assistance. The identification arm includes tools to help clinicians recognize patients who require assistance from the MET. In many hospitals, the identification arm includes an early warning score (EWS). In pediatric patients, EWSs assign point values to vital signs that fall outside of age‐based ranges, among other clinical observations. They then generate a total score intended to help clinicians identify patients exhibiting early signs of deterioration.[4, 5, 6, 7, 8, 9, 10, 11]
When experimentally applied to vital sign datasets, the test characteristics of pediatric EWSs in detecting clinical deterioration are highly variable across studies, with major tradeoffs between sensitivity, specificity, and predictive values that differ by outcome, score, and cut‐point (Table 1). This reflects the difficulty of identifying deteriorating patients using only objective measures. However, in real‐world settings, EWSs are used by clinicians in conjunction with their clinical judgment. We hypothesized that EWSs have benefits that extend beyond their ability to predict deterioration, and thus have value not demonstrated by test characteristics alone. In order to further explore this issue, we aimed to qualitatively evaluate mechanisms beyond their statistical ability to predict deterioration by which physicians and nurses use EWSs to support their decision making.
| Score and Citation | Outcome Measure | Score Cut‐point | Sens | Spec | PPV | NPV |
|---|---|---|---|---|---|---|
| ||||||
| Brighton Paediatric Early Warning Score[5] | RRT or code blue call | 4 | 86% | NR | NR | NR |
| Bristol Paediatric Early Warning Tool[6, 11] | Escalation to higher level of care | 1 | ER | ER | 63% | NR |
| Cardiff and Vale Paediatric Early Warning System[7] | Respiratory or cardiac arrest, HDU/ICU admission, or death | 1 | 89% | 64% | 2% | >99% |
| Bedside Paediatric Early Warning System score, original version[8] | Code blue call | 5 | 78% | 95% | 4% | NR |
| Bedside Paediatric Early Warning System score, simplified version[9] | Urgent ICU admission without a code blue call | 8 | 82% | 93% | NR | NR |
| Bedside Paediatric Early Warning System score, simplified version[10] | Urgent ICU admission or code blue call | 7 | 64% | 91% | 9% | NR |
METHODS
Overview
As 1 component of a larger study, we conducted semistructured interviews with nurses and physicians at The Children's Hospital of Philadelphia (CHOP) between May and October 2011. In separate subprojects using the same participants, the larger study also aimed to identify residual barriers to calling for urgent assistance and assess the role of families in the recognition of deterioration and MET activation.
Setting
The Children's Hospital of Philadelphia is an urban, tertiary‐care pediatric hospital with 504 beds. Surgical patients hospitalized outside of ICUs are cared for by surgeons and surgical nurses without pediatrician co‐management. Implementation of a RRS was prompted by serious safety events in which clinical deterioration was either not recognized or was recognized and not escalated. Prior to RRS implementation, a code blue team could be activated for patients in immediate need of resuscitation, or, for less‐urgent needs, a pediatric ICU fellow could be paged by physicians for informal consults.
A multidisciplinary team developed and pilot‐tested the RRS, then implemented it hospital‐wide in February 2010. Representing an aspect of a multipronged approach to improve safety culture, the RRS consisted of (1) an EWS based upon Parshuram's Bedside Paediatric Early Warning System,[8, 9, 10] calculated by hand on a paper form (see online supplementary content) at the same frequency as vital signs (usually every 4 hours), and (2) a 30‐minute response MET available for activation by any clinician for any concern, 24 hours per day, 7 days per week. Escalation guidelines included a prompt to activate the MET for a score that increased to the red zone (9). For concerns that could not wait 30 minutes, any hospital employee could activate the immediate‐response code blue team.
Utilization of the RRS at CHOP is high, with 23 calls to the MET per day and a combined MET/code‐blue team call rate of 27.8 per 1000 admissions.[12] Previously reported pediatric call rates range from 2.8 to 44.0, with a median of 9.6 per 1000 admissions across 6 studies.[13, 14, 15, 16, 17, 18, 19] Since implementation, there has been a statistically significant net reduction in critical deterioration events (unpublished data).
Participants
We recruited nurses and physicians who had recently cared for children age 18 years on general medical or surgical wards with false‐negative or false‐positive EWSs (instances when the score failed to predict deterioration). Recruitment ceased when we reached thematic data saturation (a qualitative research term for the point at which no new themes emerge with additional interviews).[20]
Data Collection
Through a detailed review of the relevant literature and consultation with experts, we developed a semistructured interview guide (see online supplementary content) to elicit nurses' and physicians' viewpoints regarding the mechanisms by which they use EWSs to support their decision making.
Experienced qualitative research scientists (F.K.B. and J.H.H.) trained 2 study interviewers (B.P. and K.M.T.). In order to minimize social‐desirability bias, the interviewers were not clinicians and were not involved in RRS operations. Each interview was recorded, professionally transcribed, and imported into NVivo 8.0 software for analysis (QSR International, Melbourne, Australia).
Data Analysis
We coded the interviews inductively, without using a predetermined set of themes. This approach is known as grounded theory methodology.[21] Two team members coded each interview independently. They then reviewed their coding together and discussed discrepancies until reaching consensus. In weekly meetings while the interviews were ongoing, we compared newly collected data with themes that had previously emerged in order to guide further thematic development and refinement (the constant comparative method).[22] After all of the interviews were completed and consensus had been reached for each individual interview, the study team convened a series of additional meetings to further refine and finalize the themes.
Human Subjects
The CHOP Institutional Review Board approved this study. All participants provided written informed consent.
RESULTS
Participants
We recruited 27 nurses and 30 physicians before reaching thematic data saturation. Because surgical patients are underrepresented relative to medical patients among the population with false‐positive and false‐negative scores in our hospital, this included 3 randomly selected surgical nurses and 7 randomly selected surgical physicians recruited to ensure thematic data saturation for surgical settings. Characteristics of the participants are displayed in Table 2.
| Physicians (n=30) | Nurses (n=27) | |||
|---|---|---|---|---|
| ||||
| N | % | N | % | |
| Race | ||||
| Asian | 2 | 6.7 | 1 | 3.7 |
| Black | 0 | 0.0 | 2 | 7.4 |
| White | 26 | 86.7 | 22 | 81.5 |
| Prefer not to say | 1 | 3.3 | 1 | 3.7 |
| >1 race | 1 | 3.3 | 1 | 3.7 |
| Ethnicity | ||||
| Hispanic/Latino | 2 | 6.7 | 1 | 3.7 |
| Not Hispanic/Latino | 23 | 76.7 | 25 | 92.6 |
| Prefer not to say | 5 | 16.7 | 1 | 3.7 |
| Sex | ||||
| F | 16 | 53.3 | 25 | 92.6 |
| M | 14 | 46.7 | 2 | 7.4 |
| Practice setting | ||||
| Medical | 21 | 70.0 | 22 | 81.5 |
| Surgical | 9 | 30.0 | 5 | 18.5 |
| Among physicians only, experience level | ||||
| Intern | 7 | 23.3 | ||
| Senior resident | 7 | 23.3 | ||
| Attending physician | 16 | 53.3 | ||
| Among attending physicians only, no. of years practicing | ||||
| <5 | 8 | 50.0 | ||
| 5<10 | 3 | 18.8 | ||
| 10 | 5 | 31.3 | ||
| Among nurses only, no. of years practicing | ||||
| <1 | 5 | 18.5 | ||
| 1<2 | 5 | 18.5 | ||
| 2<5 | 9 | 33.3 | ||
| 5<10 | 4 | 14.8 | ||
| 10<20 | 1 | 3.7 | ||
| 20 | 3 | 11.1 | ||
| Recruitment method | ||||
| Cared for patient with false‐positive score | 10 | 33.3 | 14 | 51.9 |
| Cared for patient with false‐negative score | 13 | 43.3 | 10 | 37.0 |
| Randomly selected to ensure data saturation for surgical settings | 7 | 23.3 | 3 | 11.1 |
Thematic Analysis
We provide the final themes, associated subthemes, and representative quotations below, with additional supporting quotations in Table 3. Because CHOP's MET is named the Critical Assessment Team, the term CAT appears in some quotations.
|
| Theme 1: The EWS facilitates patient safety by alerting nurses and physicians to concerning vital sign changes and prompting them to think critically about the possibility of deterioration. |
| I think [the EWS] helps us to be focused and gives us definite criteria to look for if there is an issue or change. It hopefully gives us a head start if there is going to be a change. They have a way of tracking it with the different color‐coding system they use Like, Oh geez, the heart rate is a little bit higher, that changes the color from yellow to orange, then I have to let the charge nurse know because that is a change from where they were earlier it kind of organizes it, I feel like, from where it was before. (medical nurse with 23 years of experience) |
| I think for myself, as a new clinician, one of our main goals is to help judge sick versus not sick. So to have a concrete system for thinking about that is helpful. (medical intern) |
| I think [the EWS] can help put things together for us. When you are really busy, you don't always get to focus on a lot of details. It is like another red flag to say you might have not realized that the child's heart rates went up further, but now here's some evidence that they did. (medical senior resident) |
| I think that the ability to use the EWS to watch the progression of a patient over time is really helpful. I've had a few patients that have gotten sicker from a respiratory standpoint. We can have multiple on the floor at the same time, and what's nice is that sometimes nurses have been able to come to me and we can really see through the score that we are at the point where a higher level of care is needed, whereas, in the old system, without that, we would have had to essentially wait for true clinical decompensation before the ICU would have been involved. I think that does help to deliver better care. (medical senior resident) |
| Theme 2: The EWS provides less‐experienced nurses with helpful age‐based reference ranges for vital signs that they use when caring for hospitalized children. |
| Sometimes you just write down the vitals and maybe you are not really thinking, and then when you go to do the EWS you looked at the score and it's really off in their age range. It kind of gives you 1 more step to recognize that there's a problem. (medical nurse with <1 year of experience) |
| I see the role [of the EWS] more broadly as a guide of where your patient should fall with their vital signs according to their age. I think that has been the biggest help for me, to be able to visualize, I have a 3‐year‐old; this is where they should be for their respiratory rate or heart rate. I think it has been good to be able to see that they are falling within the range appropriate for their age. (surgical nurse with 9 years of experience) |
| Theme 3: The EWS provides concrete evidence of clinical changes in the form of a score. This empowers nurses to overcome escalation barriers and communicate their concerns, helping them take action to rescue their deteriorating patients. |
| The times when I think the EWS helped me out the most are when there is a little bit of disagreement maybe the doctors and the nurses don't see eye‐to‐eye on how the patient is doing and so a higher score can sometimes be a way to say, I know there is nothing specifically going on, but if you take a look at the EWSs they are turning up very significantly. That might be enough to at least get a second opinion on that patient or to start some kind of change in their care. (medical nurse with <1 year of experience) |
| If we have the EWS to back us up, we can use that to say, Look, I don't feel comfortable with this patient, the EWS is 7 and I know you are saying they are okay, but I would feel more comfortable calling. Having that protocol in place I feel like it really gives us a voice it kind of gives us the, not that they don't trust us, but if they say, Oh, I think the child is fine but if I tell them Look, their EWS is an 8 or a 9, they are like, Oh, okay. It is not just you freaking out. There is an issue. (medical nurse with 3 years of experience) |
| I think that since it has been instituted nursing is coming to residents more than they did beforehand Can you reassess this patient? Do you think that we should call CAT? I think that it encourages residents to reevaluate patients at times when things are changing, and quicker than it did without the system in place. (medical senior resident) |
| I view [the EWS] as a tool, like if I have someone managing my patients when I am on service this would be a good tool because it mandates the nurses to notify and it also mandates the residents to understand what's going on. I think that was done on purpose. (medical attending physician in practice for 8 years) |
| Theme 4: In some patients, the EWS may not help with decision‐making. These include patients who are very stable and have a low likelihood of deterioration, and patients with abnormal physiology at baseline who consistently have very high EWSs. |
| The patient I took care of in this situation was a really sick kid to begin with, and it wasn't so much they were concerned about his EWS because, unless there was a really serious event, he would probably be staying on our floor anyway in some cases we just have some really sick kids whose scores may constantly be high all the time, so it wouldn't be helpful for the doctors or us to really bring it up. (medical nurse with 1 year of experience) |
Of note, after interviewing 9 surgeons, we found that they were not very familiar with the EWS and had little to say either positively or negatively about the system. For example, when asked what they thought about the EWS, a surgical intern said, I have no idea. I don't have enough experience with it. This is probably the first time that I ever had anybody telling me that the system is in place. Therefore, surgeons did not contribute meaningfully to the themes below.
Theme 1: The EWS facilitates patient safety by alerting nurses and physicians to concerning vital sign changes and prompting them to think critically about the possibility of deterioration
Nurses and physicians frequently discussed the direct role of the EWS in revealing changes consistent with early signs of deterioration. A medical nurse with <1 year of experience said, The higher the number gets, the more it sets off a red flag to you to kind of keep an eye on certain things. They are just as important as taking a set of vitals. When asked if the EWS had ever helped to identify deterioration, a medical attending physician in practice for 5 years said, I think sometimes we will blow off, so to speak, certain things, but when you look at the numbers and you see a big [EWS] change versus if you were [just] looking at individual vital signs, then yeah, I think it has made a difference.
Nurses and physicians also discussed the role of the EWSs in prompting them to closely examine individual vital signs and think critically about whether or not a patient is exhibiting early signs of deterioration. A surgical nurse with <1 year of experience said, Sometimes I feel like if you want things to be okay you can kind of write them off, but when you have to write [the EWS] down it kind of jogs you to think, maybe something is going on or maybe someone else needs to know about this. A medical senior resident commented, I think it has alerted me earlier to changes in vital signs that I might not necessarily have known. I think there are nurses that use it and they see that there is an elevation and they call you about it. Then it makes me go back and look through and see what their vital signs are and if it happens in timewe only go through and look at everyone's vital signs about twice a dayit can be very helpful.
Theme 2: The EWS provides less‐experienced nurses with helpful age‐based reference ranges for vital signs that they use when caring for hospitalized children
Although this theme did not appear among physicians, nurses frequently noted that they referred to the scoring sheet as a reference for vital signs appropriate for hospitalized children. A surgical nurse with <1 year of experience said, In nursing school, I mostly dealt with adults. So, to figure out the different ranges for normal vital signs, it helps to have it listed on paper so I can see, 'Oh, I didn't realize that this 10‐year‐old's heart rate is higher than it should be.' A medical nurse with 14 years of experience cited the benefits for less‐experienced nurses, noting, [The EWS helps] newer nurses who don't know the ranges. Where it's Oh, my kid's blood pressure is 81 [mm Hg] over something, then they can look at their age and say, Oh, that is completely normal for a 2‐month‐old. But [before the EWS] there was nowhere to look to see the ranges. Unless you were [Pediatric Advanced Life Support] certified where you would know that stuff, there was a lot of anxiety related to vital signs.
Theme 3: The EWS provides concrete evidence of clinical changes in the form of a score. This empowers nurses to overcome escalation barriers and communicate their concerns, helping them take action to rescue their deteriorating patients
Nurses and physicians often described the role of the EWS as a source of objective evidence that a patient was exhibiting a concerning change. They shared the ways in which the EWS was used to convey concerns, noting most commonly that this was used as a communication tool by nurses to raise their concerns with physicians. A medical nurse with 23 years of experience said, [With the EWS] you feel like you have concrete evidence. It's not just a feeling [that] they are not looking as well as they were it feels scientific. Building upon this concept, a medical attending physician in practice for 2 years said, The EWS is a number that certainly gives people a sense of Here's the data behind why I am really coming to you and insisting on this. It is not calling and saying, I just have a bad feeling, it is, I have a bad feeling and his EWS has gone to a 9.
Theme 4: In some patients, the EWS may not help with decision making. These include patients who are very stable and have a low likelihood of deterioration, patients with abnormal physiology at baseline who consistently have very high EWSs, and patients experiencing neurologic deterioration
Nurses and physicians described some patient scenarios in which the EWS may not help with decision making. Discussing postoperative patients, a surgical nurse with 1 year of experience said, I love doing [the EWS] for some patients. I think it makes perfect sense. Then there are some patients [for whom] I am doing it just to do it because they are only here for 24 hours. They are completely stable. They never had 1 vital sign that was even a little bit off. It's kind of like we are just filling it out to fill it out. Commenting on patients at the other end of the spectrum, a medical attending physician in practice for 2 years said, [The EWS] can be a useful composite tool, but for specialty patients with abnormal baselines, I think it is much more a question of making sure you pay attention to the specific changes, whether it is the EWS or heart rate or vital signs or pain score or any of those things. A final area in which nurses and physicians identified weaknesses in the EWS surrounded neurologic deterioration. Specifically, nurses and physicians described experiences when the EWS increased minimally or not at all in patients with sudden seizures or concerning mental status changes that warranted escalation of care.
DISCUSSION
This study is the first to analyze viewpoints on the mechanisms by which EWSs impact decision making among physicians and nurses who had recently experienced score failures. Our study, performed in a children's hospital, builds upon the findings of related studies performed in hospitals that care primarily for adults.[23, 24, 25, 26, 27, 28] Andrews and Waterman found that nurses consider the utility of EWSs to extend beyond detecting deterioration by providing quantifiable evidence, packaged in the form of a score that improves communication between nurses and physicians.[23] Mackintosh and colleagues found that a RRS that included an EWS helped to formalize the way nurses and physicians understand deterioration, enable them to overcome hierarchical boundaries through structured discussions, and empower them to call for help.[24] In a quasi‐experimental study, McDonnell and colleagues found that an EWS improved self‐assessed knowledge, skills, and confidence of nursing staff to detect and manage deteriorating patients.[25] In addition, we describe novel findings, including the use of EWS parameters as reference ranges independent of the score, and specific situations when the EWS fails to support decision making. The weaknesses we identified could be used to drive EWS optimization for low‐risk patients who are stable as well as higher‐risk patients with abnormal baseline physiology and those at risk of neurologic deterioration.
This study has several limitations. Although the interviewers were not involved in RRS operations, it is possible that social desirability bias influenced responses. Next, we identified a knowledge gap among surgeons, and they contributed minimally to our findings. This is most likely because (1) surgical patients deteriorate on the wards less often than medical patients in our hospital, so surgeons are rarely presented with EWSs; (2) surgeons spend less time on the wards compared with medical physicians; and (3) surgical residents rotate in short blocks interspersed with rotations at other hospitals and may be less engaged in hospital safety initiatives.
CONCLUSIONS
Although EWSs perform only marginally well as statistical tools to predict clinical deterioration, nurses and physicians who recently experienced score failures described substantial benefits in using them to help identify deteriorating patients and transcend barriers to escalation of care by serving as objective communication tools. Combining an EWS with a clinician's judgment may result in a system better equipped to respond to deterioration than previous EWS studies focused on their test characteristics alone suggest. Future research should seek to compare and prospectively evaluate the clinical effectiveness of EWSs in real‐world settings.
Acknowledgments
Disclosures: This project was funded by the Pennsylvania Health Research Formula Fund Award (awarded to Keren and Bonafide) and the CHOP Nursing Research and Evidence‐Based Practice Award (awarded to Roberts). The funders did not influence the study design; the collection, analysis, or interpretation of data; the writing of the report; or the decision to submit the article for publication. The authors have no other conflicts to report.
- Institute for Healthcare Improvement. Overview of the Institute for Healthcare Improvement Five Million Lives Campaign. Available at: http://www.ihi.org/offerings/Initiatives/PastStrategicInitiatives/5MillionLivesCampaign/Pages/default.aspx. Accessed June 21, 2012.
- UK National Institute for Health and Clinical Excellence (NICE). Acutely Ill Patients in Hospital: Recognition of and Response to Acute Illness in Adults in Hospital. Available at: http://publications.nice.org.uk/acutely‐ill‐patients‐in‐hospital‐cg50. Published July 2007. Accessed June 21, 2012.
- , , , et al. Findings of the first consensus conference on medical emergency teams. Crit Care Med. 2006; 34(9):2463–2478.
- . Detecting and managing deterioration in children. Paediatr Nurs. 2005;17(1):32–35.
- , , , , , . Sensitivity of the Pediatric Early Warning Score to identify patient deterioration. Pediatrics. 2010;125(4):e763–e769.
- , , . Promoting care for acutely ill children—development and evaluation of a paediatric early warning tool. Intensive Crit Care Nurs. 2006;22(2):73–81.
- , , , . Prospective cohort study to test the predictability of the Cardiff and Vale paediatric early warning system. Arch Dis Child. 2009;94(8):602–606.
- , , . The Pediatric Early Warning System Score: a severity of illness score to predict urgent medical need in hospitalized children. J Crit Care. 2006;21(3):271–278.
- , , . Development and initial validation of the Bedside Paediatric Early Warning System score. Crit Care. 2009;13(4):R135.
- , , , et al. Multi‐centre validation of the Bedside Paediatric Early Warning System Score: a severity of illness score to detect evolving critical illness in hospitalized children. Crit Care. 2011;15(4):R184.
- , . Evaluation of a paediatric early warning tool—claims unsubstantiated. Intensive Crit Care Nurs. 2006;22(6):315–316.
- , , , et al. Development of a pragmatic measure for evaluating and optimizing rapid response systems. Pediatrics. 2012;129(4):e874–e881.
- , , , et al. Implementation of a multicenter rapid response system in pediatric academic hospitals is effective. Pediatrics. 2011;128(1):72–78.
- , , , , . Rapid response teams: a systematic review and meta‐analysis. Arch Intern Med. 2010;170(1):18–26.
- , , , et al. Implementation of a medical emergency team in a large pediatric teaching hospital prevents respiratory and cardiopulmonary arrests outside the intensive care unit. Pediatr Crit Care Med. 2007;8(3):236–246.
- , , , et al. Transition from a traditional code team to a medical emergency team and categorization of cardiopulmonary arrests in a children's center. Arch Pediatr Adolesc Med. 2008;162(2):117–122.
- , , , et al. Effect of a rapid response team on hospital‐wide mortality and code rates outside the ICU in a children's hospital. JAMA. 2007;298(19):2267–2274.
- , . Reduction of hospital mortality and of preventable cardiac arrest and death on introduction of a pediatric medical emergency team. Pediatr Crit Care Med. 2009;10(3):306–312.
- , , , et al. Implementation and impact of a rapid response team in a children's hospital. Jt Comm J Qual Patient Saf. 2007;33(7):418–425.
- , , . How many interviews are enough? An experiment with data saturation and variability. Field Methods. 2006;18(1):59–82.
- . Different approaches in grounded theory. In: Bryant A, Charmaz K, eds. The Sage Handbook of Grounded Theory. Los Angeles, CA: Sage; 2007:191–213.
- , . The Discovery of Grounded Theory: Strategies for Qualitative Research. New York, NY: Aldine De Gruyter; 1967.
- , . Packaging: a grounded theory of how to report physiological deterioration effectively. J Adv Nurs. 2005;52(5):473–481.
- , , . Understanding how rapid response systems may improve safety for the acutely ill patient: learning from the frontline. BMJ Qual Saf. 2012;21(2):135–144.
- , , , , , . A before and after study assessing the impact of a new model for recognizing and responding to early signs of deterioration in an acute hospital. J Adv Nurs. 2013;69(1):41–52.
- , . Overcoming gendered and professional hierarchies in order to facilitate escalation of care in emergency situations: the role of standardised communication protocols. Soc Sci Med. 2010;71(9):1683–1686.
- , , , , . Defining impact of a rapid response team: qualitative study with nurses, physicians and hospital administrators. BMJ Qual Saf. 2012;21(5):391–398.
- , , , , . Leading successful rapid response teams: a multisite implementation evaluation. J Nurs Adm. 2009;39(4):176–181.
Thousands of hospitals have recently implemented rapid response systems (RRSs), attempting to reduce mortality outside of intensive care units (ICUs).[1, 2] These systems have 2 clinical components, a response (efferent) arm and an identification (afferent) arm.[3] The response arm is usually composed of a medical emergency team (MET) that responds to calls for urgent assistance. The identification arm includes tools to help clinicians recognize patients who require assistance from the MET. In many hospitals, the identification arm includes an early warning score (EWS). In pediatric patients, EWSs assign point values to vital signs that fall outside of age‐based ranges, among other clinical observations. They then generate a total score intended to help clinicians identify patients exhibiting early signs of deterioration.[4, 5, 6, 7, 8, 9, 10, 11]
When experimentally applied to vital sign datasets, the test characteristics of pediatric EWSs in detecting clinical deterioration are highly variable across studies, with major tradeoffs between sensitivity, specificity, and predictive values that differ by outcome, score, and cut‐point (Table 1). This reflects the difficulty of identifying deteriorating patients using only objective measures. However, in real‐world settings, EWSs are used by clinicians in conjunction with their clinical judgment. We hypothesized that EWSs have benefits that extend beyond their ability to predict deterioration, and thus have value not demonstrated by test characteristics alone. In order to further explore this issue, we aimed to qualitatively evaluate mechanisms beyond their statistical ability to predict deterioration by which physicians and nurses use EWSs to support their decision making.
| Score and Citation | Outcome Measure | Score Cut‐point | Sens | Spec | PPV | NPV |
|---|---|---|---|---|---|---|
| ||||||
| Brighton Paediatric Early Warning Score[5] | RRT or code blue call | 4 | 86% | NR | NR | NR |
| Bristol Paediatric Early Warning Tool[6, 11] | Escalation to higher level of care | 1 | ER | ER | 63% | NR |
| Cardiff and Vale Paediatric Early Warning System[7] | Respiratory or cardiac arrest, HDU/ICU admission, or death | 1 | 89% | 64% | 2% | >99% |
| Bedside Paediatric Early Warning System score, original version[8] | Code blue call | 5 | 78% | 95% | 4% | NR |
| Bedside Paediatric Early Warning System score, simplified version[9] | Urgent ICU admission without a code blue call | 8 | 82% | 93% | NR | NR |
| Bedside Paediatric Early Warning System score, simplified version[10] | Urgent ICU admission or code blue call | 7 | 64% | 91% | 9% | NR |
METHODS
Overview
As 1 component of a larger study, we conducted semistructured interviews with nurses and physicians at The Children's Hospital of Philadelphia (CHOP) between May and October 2011. In separate subprojects using the same participants, the larger study also aimed to identify residual barriers to calling for urgent assistance and assess the role of families in the recognition of deterioration and MET activation.
Setting
The Children's Hospital of Philadelphia is an urban, tertiary‐care pediatric hospital with 504 beds. Surgical patients hospitalized outside of ICUs are cared for by surgeons and surgical nurses without pediatrician co‐management. Implementation of a RRS was prompted by serious safety events in which clinical deterioration was either not recognized or was recognized and not escalated. Prior to RRS implementation, a code blue team could be activated for patients in immediate need of resuscitation, or, for less‐urgent needs, a pediatric ICU fellow could be paged by physicians for informal consults.
A multidisciplinary team developed and pilot‐tested the RRS, then implemented it hospital‐wide in February 2010. Representing an aspect of a multipronged approach to improve safety culture, the RRS consisted of (1) an EWS based upon Parshuram's Bedside Paediatric Early Warning System,[8, 9, 10] calculated by hand on a paper form (see online supplementary content) at the same frequency as vital signs (usually every 4 hours), and (2) a 30‐minute response MET available for activation by any clinician for any concern, 24 hours per day, 7 days per week. Escalation guidelines included a prompt to activate the MET for a score that increased to the red zone (9). For concerns that could not wait 30 minutes, any hospital employee could activate the immediate‐response code blue team.
Utilization of the RRS at CHOP is high, with 23 calls to the MET per day and a combined MET/code‐blue team call rate of 27.8 per 1000 admissions.[12] Previously reported pediatric call rates range from 2.8 to 44.0, with a median of 9.6 per 1000 admissions across 6 studies.[13, 14, 15, 16, 17, 18, 19] Since implementation, there has been a statistically significant net reduction in critical deterioration events (unpublished data).
Participants
We recruited nurses and physicians who had recently cared for children age 18 years on general medical or surgical wards with false‐negative or false‐positive EWSs (instances when the score failed to predict deterioration). Recruitment ceased when we reached thematic data saturation (a qualitative research term for the point at which no new themes emerge with additional interviews).[20]
Data Collection
Through a detailed review of the relevant literature and consultation with experts, we developed a semistructured interview guide (see online supplementary content) to elicit nurses' and physicians' viewpoints regarding the mechanisms by which they use EWSs to support their decision making.
Experienced qualitative research scientists (F.K.B. and J.H.H.) trained 2 study interviewers (B.P. and K.M.T.). In order to minimize social‐desirability bias, the interviewers were not clinicians and were not involved in RRS operations. Each interview was recorded, professionally transcribed, and imported into NVivo 8.0 software for analysis (QSR International, Melbourne, Australia).
Data Analysis
We coded the interviews inductively, without using a predetermined set of themes. This approach is known as grounded theory methodology.[21] Two team members coded each interview independently. They then reviewed their coding together and discussed discrepancies until reaching consensus. In weekly meetings while the interviews were ongoing, we compared newly collected data with themes that had previously emerged in order to guide further thematic development and refinement (the constant comparative method).[22] After all of the interviews were completed and consensus had been reached for each individual interview, the study team convened a series of additional meetings to further refine and finalize the themes.
Human Subjects
The CHOP Institutional Review Board approved this study. All participants provided written informed consent.
RESULTS
Participants
We recruited 27 nurses and 30 physicians before reaching thematic data saturation. Because surgical patients are underrepresented relative to medical patients among the population with false‐positive and false‐negative scores in our hospital, this included 3 randomly selected surgical nurses and 7 randomly selected surgical physicians recruited to ensure thematic data saturation for surgical settings. Characteristics of the participants are displayed in Table 2.
| Physicians (n=30) | Nurses (n=27) | |||
|---|---|---|---|---|
| ||||
| N | % | N | % | |
| Race | ||||
| Asian | 2 | 6.7 | 1 | 3.7 |
| Black | 0 | 0.0 | 2 | 7.4 |
| White | 26 | 86.7 | 22 | 81.5 |
| Prefer not to say | 1 | 3.3 | 1 | 3.7 |
| >1 race | 1 | 3.3 | 1 | 3.7 |
| Ethnicity | ||||
| Hispanic/Latino | 2 | 6.7 | 1 | 3.7 |
| Not Hispanic/Latino | 23 | 76.7 | 25 | 92.6 |
| Prefer not to say | 5 | 16.7 | 1 | 3.7 |
| Sex | ||||
| F | 16 | 53.3 | 25 | 92.6 |
| M | 14 | 46.7 | 2 | 7.4 |
| Practice setting | ||||
| Medical | 21 | 70.0 | 22 | 81.5 |
| Surgical | 9 | 30.0 | 5 | 18.5 |
| Among physicians only, experience level | ||||
| Intern | 7 | 23.3 | ||
| Senior resident | 7 | 23.3 | ||
| Attending physician | 16 | 53.3 | ||
| Among attending physicians only, no. of years practicing | ||||
| <5 | 8 | 50.0 | ||
| 5<10 | 3 | 18.8 | ||
| 10 | 5 | 31.3 | ||
| Among nurses only, no. of years practicing | ||||
| <1 | 5 | 18.5 | ||
| 1<2 | 5 | 18.5 | ||
| 2<5 | 9 | 33.3 | ||
| 5<10 | 4 | 14.8 | ||
| 10<20 | 1 | 3.7 | ||
| 20 | 3 | 11.1 | ||
| Recruitment method | ||||
| Cared for patient with false‐positive score | 10 | 33.3 | 14 | 51.9 |
| Cared for patient with false‐negative score | 13 | 43.3 | 10 | 37.0 |
| Randomly selected to ensure data saturation for surgical settings | 7 | 23.3 | 3 | 11.1 |
Thematic Analysis
We provide the final themes, associated subthemes, and representative quotations below, with additional supporting quotations in Table 3. Because CHOP's MET is named the Critical Assessment Team, the term CAT appears in some quotations.
|
| Theme 1: The EWS facilitates patient safety by alerting nurses and physicians to concerning vital sign changes and prompting them to think critically about the possibility of deterioration. |
| I think [the EWS] helps us to be focused and gives us definite criteria to look for if there is an issue or change. It hopefully gives us a head start if there is going to be a change. They have a way of tracking it with the different color‐coding system they use Like, Oh geez, the heart rate is a little bit higher, that changes the color from yellow to orange, then I have to let the charge nurse know because that is a change from where they were earlier it kind of organizes it, I feel like, from where it was before. (medical nurse with 23 years of experience) |
| I think for myself, as a new clinician, one of our main goals is to help judge sick versus not sick. So to have a concrete system for thinking about that is helpful. (medical intern) |
| I think [the EWS] can help put things together for us. When you are really busy, you don't always get to focus on a lot of details. It is like another red flag to say you might have not realized that the child's heart rates went up further, but now here's some evidence that they did. (medical senior resident) |
| I think that the ability to use the EWS to watch the progression of a patient over time is really helpful. I've had a few patients that have gotten sicker from a respiratory standpoint. We can have multiple on the floor at the same time, and what's nice is that sometimes nurses have been able to come to me and we can really see through the score that we are at the point where a higher level of care is needed, whereas, in the old system, without that, we would have had to essentially wait for true clinical decompensation before the ICU would have been involved. I think that does help to deliver better care. (medical senior resident) |
| Theme 2: The EWS provides less‐experienced nurses with helpful age‐based reference ranges for vital signs that they use when caring for hospitalized children. |
| Sometimes you just write down the vitals and maybe you are not really thinking, and then when you go to do the EWS you looked at the score and it's really off in their age range. It kind of gives you 1 more step to recognize that there's a problem. (medical nurse with <1 year of experience) |
| I see the role [of the EWS] more broadly as a guide of where your patient should fall with their vital signs according to their age. I think that has been the biggest help for me, to be able to visualize, I have a 3‐year‐old; this is where they should be for their respiratory rate or heart rate. I think it has been good to be able to see that they are falling within the range appropriate for their age. (surgical nurse with 9 years of experience) |
| Theme 3: The EWS provides concrete evidence of clinical changes in the form of a score. This empowers nurses to overcome escalation barriers and communicate their concerns, helping them take action to rescue their deteriorating patients. |
| The times when I think the EWS helped me out the most are when there is a little bit of disagreement maybe the doctors and the nurses don't see eye‐to‐eye on how the patient is doing and so a higher score can sometimes be a way to say, I know there is nothing specifically going on, but if you take a look at the EWSs they are turning up very significantly. That might be enough to at least get a second opinion on that patient or to start some kind of change in their care. (medical nurse with <1 year of experience) |
| If we have the EWS to back us up, we can use that to say, Look, I don't feel comfortable with this patient, the EWS is 7 and I know you are saying they are okay, but I would feel more comfortable calling. Having that protocol in place I feel like it really gives us a voice it kind of gives us the, not that they don't trust us, but if they say, Oh, I think the child is fine but if I tell them Look, their EWS is an 8 or a 9, they are like, Oh, okay. It is not just you freaking out. There is an issue. (medical nurse with 3 years of experience) |
| I think that since it has been instituted nursing is coming to residents more than they did beforehand Can you reassess this patient? Do you think that we should call CAT? I think that it encourages residents to reevaluate patients at times when things are changing, and quicker than it did without the system in place. (medical senior resident) |
| I view [the EWS] as a tool, like if I have someone managing my patients when I am on service this would be a good tool because it mandates the nurses to notify and it also mandates the residents to understand what's going on. I think that was done on purpose. (medical attending physician in practice for 8 years) |
| Theme 4: In some patients, the EWS may not help with decision‐making. These include patients who are very stable and have a low likelihood of deterioration, and patients with abnormal physiology at baseline who consistently have very high EWSs. |
| The patient I took care of in this situation was a really sick kid to begin with, and it wasn't so much they were concerned about his EWS because, unless there was a really serious event, he would probably be staying on our floor anyway in some cases we just have some really sick kids whose scores may constantly be high all the time, so it wouldn't be helpful for the doctors or us to really bring it up. (medical nurse with 1 year of experience) |
Of note, after interviewing 9 surgeons, we found that they were not very familiar with the EWS and had little to say either positively or negatively about the system. For example, when asked what they thought about the EWS, a surgical intern said, I have no idea. I don't have enough experience with it. This is probably the first time that I ever had anybody telling me that the system is in place. Therefore, surgeons did not contribute meaningfully to the themes below.
Theme 1: The EWS facilitates patient safety by alerting nurses and physicians to concerning vital sign changes and prompting them to think critically about the possibility of deterioration
Nurses and physicians frequently discussed the direct role of the EWS in revealing changes consistent with early signs of deterioration. A medical nurse with <1 year of experience said, The higher the number gets, the more it sets off a red flag to you to kind of keep an eye on certain things. They are just as important as taking a set of vitals. When asked if the EWS had ever helped to identify deterioration, a medical attending physician in practice for 5 years said, I think sometimes we will blow off, so to speak, certain things, but when you look at the numbers and you see a big [EWS] change versus if you were [just] looking at individual vital signs, then yeah, I think it has made a difference.
Nurses and physicians also discussed the role of the EWSs in prompting them to closely examine individual vital signs and think critically about whether or not a patient is exhibiting early signs of deterioration. A surgical nurse with <1 year of experience said, Sometimes I feel like if you want things to be okay you can kind of write them off, but when you have to write [the EWS] down it kind of jogs you to think, maybe something is going on or maybe someone else needs to know about this. A medical senior resident commented, I think it has alerted me earlier to changes in vital signs that I might not necessarily have known. I think there are nurses that use it and they see that there is an elevation and they call you about it. Then it makes me go back and look through and see what their vital signs are and if it happens in timewe only go through and look at everyone's vital signs about twice a dayit can be very helpful.
Theme 2: The EWS provides less‐experienced nurses with helpful age‐based reference ranges for vital signs that they use when caring for hospitalized children
Although this theme did not appear among physicians, nurses frequently noted that they referred to the scoring sheet as a reference for vital signs appropriate for hospitalized children. A surgical nurse with <1 year of experience said, In nursing school, I mostly dealt with adults. So, to figure out the different ranges for normal vital signs, it helps to have it listed on paper so I can see, 'Oh, I didn't realize that this 10‐year‐old's heart rate is higher than it should be.' A medical nurse with 14 years of experience cited the benefits for less‐experienced nurses, noting, [The EWS helps] newer nurses who don't know the ranges. Where it's Oh, my kid's blood pressure is 81 [mm Hg] over something, then they can look at their age and say, Oh, that is completely normal for a 2‐month‐old. But [before the EWS] there was nowhere to look to see the ranges. Unless you were [Pediatric Advanced Life Support] certified where you would know that stuff, there was a lot of anxiety related to vital signs.
Theme 3: The EWS provides concrete evidence of clinical changes in the form of a score. This empowers nurses to overcome escalation barriers and communicate their concerns, helping them take action to rescue their deteriorating patients
Nurses and physicians often described the role of the EWS as a source of objective evidence that a patient was exhibiting a concerning change. They shared the ways in which the EWS was used to convey concerns, noting most commonly that this was used as a communication tool by nurses to raise their concerns with physicians. A medical nurse with 23 years of experience said, [With the EWS] you feel like you have concrete evidence. It's not just a feeling [that] they are not looking as well as they were it feels scientific. Building upon this concept, a medical attending physician in practice for 2 years said, The EWS is a number that certainly gives people a sense of Here's the data behind why I am really coming to you and insisting on this. It is not calling and saying, I just have a bad feeling, it is, I have a bad feeling and his EWS has gone to a 9.
Theme 4: In some patients, the EWS may not help with decision making. These include patients who are very stable and have a low likelihood of deterioration, patients with abnormal physiology at baseline who consistently have very high EWSs, and patients experiencing neurologic deterioration
Nurses and physicians described some patient scenarios in which the EWS may not help with decision making. Discussing postoperative patients, a surgical nurse with 1 year of experience said, I love doing [the EWS] for some patients. I think it makes perfect sense. Then there are some patients [for whom] I am doing it just to do it because they are only here for 24 hours. They are completely stable. They never had 1 vital sign that was even a little bit off. It's kind of like we are just filling it out to fill it out. Commenting on patients at the other end of the spectrum, a medical attending physician in practice for 2 years said, [The EWS] can be a useful composite tool, but for specialty patients with abnormal baselines, I think it is much more a question of making sure you pay attention to the specific changes, whether it is the EWS or heart rate or vital signs or pain score or any of those things. A final area in which nurses and physicians identified weaknesses in the EWS surrounded neurologic deterioration. Specifically, nurses and physicians described experiences when the EWS increased minimally or not at all in patients with sudden seizures or concerning mental status changes that warranted escalation of care.
DISCUSSION
This study is the first to analyze viewpoints on the mechanisms by which EWSs impact decision making among physicians and nurses who had recently experienced score failures. Our study, performed in a children's hospital, builds upon the findings of related studies performed in hospitals that care primarily for adults.[23, 24, 25, 26, 27, 28] Andrews and Waterman found that nurses consider the utility of EWSs to extend beyond detecting deterioration by providing quantifiable evidence, packaged in the form of a score that improves communication between nurses and physicians.[23] Mackintosh and colleagues found that a RRS that included an EWS helped to formalize the way nurses and physicians understand deterioration, enable them to overcome hierarchical boundaries through structured discussions, and empower them to call for help.[24] In a quasi‐experimental study, McDonnell and colleagues found that an EWS improved self‐assessed knowledge, skills, and confidence of nursing staff to detect and manage deteriorating patients.[25] In addition, we describe novel findings, including the use of EWS parameters as reference ranges independent of the score, and specific situations when the EWS fails to support decision making. The weaknesses we identified could be used to drive EWS optimization for low‐risk patients who are stable as well as higher‐risk patients with abnormal baseline physiology and those at risk of neurologic deterioration.
This study has several limitations. Although the interviewers were not involved in RRS operations, it is possible that social desirability bias influenced responses. Next, we identified a knowledge gap among surgeons, and they contributed minimally to our findings. This is most likely because (1) surgical patients deteriorate on the wards less often than medical patients in our hospital, so surgeons are rarely presented with EWSs; (2) surgeons spend less time on the wards compared with medical physicians; and (3) surgical residents rotate in short blocks interspersed with rotations at other hospitals and may be less engaged in hospital safety initiatives.
CONCLUSIONS
Although EWSs perform only marginally well as statistical tools to predict clinical deterioration, nurses and physicians who recently experienced score failures described substantial benefits in using them to help identify deteriorating patients and transcend barriers to escalation of care by serving as objective communication tools. Combining an EWS with a clinician's judgment may result in a system better equipped to respond to deterioration than previous EWS studies focused on their test characteristics alone suggest. Future research should seek to compare and prospectively evaluate the clinical effectiveness of EWSs in real‐world settings.
Acknowledgments
Disclosures: This project was funded by the Pennsylvania Health Research Formula Fund Award (awarded to Keren and Bonafide) and the CHOP Nursing Research and Evidence‐Based Practice Award (awarded to Roberts). The funders did not influence the study design; the collection, analysis, or interpretation of data; the writing of the report; or the decision to submit the article for publication. The authors have no other conflicts to report.
- Institute for Healthcare Improvement. Overview of the Institute for Healthcare Improvement Five Million Lives Campaign. Available at: http://www.ihi.org/offerings/Initiatives/PastStrategicInitiatives/5MillionLivesCampaign/Pages/default.aspx. Accessed June 21, 2012.
- UK National Institute for Health and Clinical Excellence (NICE). Acutely Ill Patients in Hospital: Recognition of and Response to Acute Illness in Adults in Hospital. Available at: http://publications.nice.org.uk/acutely‐ill‐patients‐in‐hospital‐cg50. Published July 2007. Accessed June 21, 2012.
- , , , et al. Findings of the first consensus conference on medical emergency teams. Crit Care Med. 2006; 34(9):2463–2478.
- . Detecting and managing deterioration in children. Paediatr Nurs. 2005;17(1):32–35.
- , , , , , . Sensitivity of the Pediatric Early Warning Score to identify patient deterioration. Pediatrics. 2010;125(4):e763–e769.
- , , . Promoting care for acutely ill children—development and evaluation of a paediatric early warning tool. Intensive Crit Care Nurs. 2006;22(2):73–81.
- , , , . Prospective cohort study to test the predictability of the Cardiff and Vale paediatric early warning system. Arch Dis Child. 2009;94(8):602–606.
- , , . The Pediatric Early Warning System Score: a severity of illness score to predict urgent medical need in hospitalized children. J Crit Care. 2006;21(3):271–278.
- , , . Development and initial validation of the Bedside Paediatric Early Warning System score. Crit Care. 2009;13(4):R135.
- , , , et al. Multi‐centre validation of the Bedside Paediatric Early Warning System Score: a severity of illness score to detect evolving critical illness in hospitalized children. Crit Care. 2011;15(4):R184.
- , . Evaluation of a paediatric early warning tool—claims unsubstantiated. Intensive Crit Care Nurs. 2006;22(6):315–316.
- , , , et al. Development of a pragmatic measure for evaluating and optimizing rapid response systems. Pediatrics. 2012;129(4):e874–e881.
- , , , et al. Implementation of a multicenter rapid response system in pediatric academic hospitals is effective. Pediatrics. 2011;128(1):72–78.
- , , , , . Rapid response teams: a systematic review and meta‐analysis. Arch Intern Med. 2010;170(1):18–26.
- , , , et al. Implementation of a medical emergency team in a large pediatric teaching hospital prevents respiratory and cardiopulmonary arrests outside the intensive care unit. Pediatr Crit Care Med. 2007;8(3):236–246.
- , , , et al. Transition from a traditional code team to a medical emergency team and categorization of cardiopulmonary arrests in a children's center. Arch Pediatr Adolesc Med. 2008;162(2):117–122.
- , , , et al. Effect of a rapid response team on hospital‐wide mortality and code rates outside the ICU in a children's hospital. JAMA. 2007;298(19):2267–2274.
- , . Reduction of hospital mortality and of preventable cardiac arrest and death on introduction of a pediatric medical emergency team. Pediatr Crit Care Med. 2009;10(3):306–312.
- , , , et al. Implementation and impact of a rapid response team in a children's hospital. Jt Comm J Qual Patient Saf. 2007;33(7):418–425.
- , , . How many interviews are enough? An experiment with data saturation and variability. Field Methods. 2006;18(1):59–82.
- . Different approaches in grounded theory. In: Bryant A, Charmaz K, eds. The Sage Handbook of Grounded Theory. Los Angeles, CA: Sage; 2007:191–213.
- , . The Discovery of Grounded Theory: Strategies for Qualitative Research. New York, NY: Aldine De Gruyter; 1967.
- , . Packaging: a grounded theory of how to report physiological deterioration effectively. J Adv Nurs. 2005;52(5):473–481.
- , , . Understanding how rapid response systems may improve safety for the acutely ill patient: learning from the frontline. BMJ Qual Saf. 2012;21(2):135–144.
- , , , , , . A before and after study assessing the impact of a new model for recognizing and responding to early signs of deterioration in an acute hospital. J Adv Nurs. 2013;69(1):41–52.
- , . Overcoming gendered and professional hierarchies in order to facilitate escalation of care in emergency situations: the role of standardised communication protocols. Soc Sci Med. 2010;71(9):1683–1686.
- , , , , . Defining impact of a rapid response team: qualitative study with nurses, physicians and hospital administrators. BMJ Qual Saf. 2012;21(5):391–398.
- , , , , . Leading successful rapid response teams: a multisite implementation evaluation. J Nurs Adm. 2009;39(4):176–181.
Copyright © 2013 Society of Hospital Medicine
Pediatric Deterioration Risk Score
Thousands of hospitals have implemented rapid response systems in recent years in attempts to reduce mortality outside the intensive care unit (ICU).1 These systems have 2 components, a response arm and an identification arm. The response arm is usually comprised of a multidisciplinary critical care team that responds to calls for urgent assistance outside the ICU; this team is often called a rapid response team or a medical emergency team. The identification arm comes in 2 forms, predictive and detective. Predictive tools estimate a patient's risk of deterioration over time based on factors that are not rapidly changing, such as elements of the patient's history. In contrast, detective tools include highly time‐varying signs of active deterioration, such as vital sign abnormalities.2 To date, most pediatric studies have focused on developing detective tools, including several early warning scores.38
In this study, we sought to identify the characteristics that increase the probability that a hospitalized child will deteriorate, and combine these characteristics into a predictive score. Tools like this may be helpful in identifying and triaging the subset of high‐risk children who should be intensively monitored for early signs of deterioration at the time of admission, as well as in identifying very low‐risk children who, in the absence of other clinical concerns, may be monitored less intensively.
METHODS
Detailed methods, including the inclusion/exclusion criteria, the matching procedures, and a full description of the statistical analysis are provided as an appendix (see Supporting Online Appendix: Supplement to Methods Section in the online version of this article). An abbreviated version follows.
Design
We performed a case‐control study among children, younger than 18 years old, hospitalized for >24 hours between January 1, 2005 and December 31, 2008. The case group consisted of children who experienced clinical deterioration, a composite outcome defined as cardiopulmonary arrest (CPA), acute respiratory compromise (ARC), or urgent ICU transfer, while on a non‐ICU unit. ICU transfers were considered urgent if they included at least one of the following outcomes in the 12 hours after transfer: death, CPA, intubation, initiation of noninvasive ventilation, or administration of a vasoactive medication infusion used for the treatment of shock. The control group consisted of a random sample of patients matched 3:1 to cases if they met the criteria of being on a non‐ICU unit at the same time as their matched case.
Variables and Measurements
We collected data on demographics, complex chronic conditions (CCCs), other patient characteristics, and laboratory studies. CCCs were specific diagnoses divided into the following 9 categories according to an established framework: neuromuscular, cardiovascular, respiratory, renal, gastrointestinal, hematologic/emmmunologic, metabolic, malignancy, and genetic/congenital defects.9 Other patient characteristics evaluated included age, weight‐for‐age, gestational age, history of transplant, time from hospital admission to event, recent ICU stays, administration of total parenteral nutrition, use of a patient‐controlled analgesia pump, and presence of medical devices including central venous lines and enteral tubes (naso‐gastric, gastrostomy, or jejunostomy).
Laboratory studies evaluated included hemoglobin value, white blood cell count, and blood culture drawn in the preceding 72 hours. We included these laboratory studies in this predictive score because we hypothesized that they represented factors that increased a child's risk of deterioration over time, as opposed to signs of acute deterioration that would be more appropriate for a detective score.
Statistical Analysis
We used conditional logistic regression for the bivariable and multivariable analyses to account for the matching. We derived the predictive score using an established method10 in which the regression coefficients for each covariate were divided by the smallest coefficient, and then rounded to the nearest integer, to establish each variable's sub‐score. We grouped the total scores into very low, low, intermediate, and high‐risk groups, calculated overall stratum‐specific likelihood ratios (SSLRs), and estimated stratum‐specific probabilities of deterioration for each group.
RESULTS
Patient Characteristics
We identified 12 CPAs, 41 ARCs, and 699 urgent ICU transfers during the study period. A total of 141 cases met our strict criteria for inclusion (see Figure in Supporting Online Appendix: Supplement to Methods Section in the online version of this article) among approximately 96,000 admissions during the study period, making the baseline incidence of events (pre‐test probability) approximately 0.15%. The case and control groups were similar in age, sex, and family‐reported race/ethnicity. Cases had been hospitalized longer than controls at the time of their event, were less likely to have been on a surgical service, and were less likely to survive to hospital discharge (Table 1). There was a high prevalence of CCCs among both cases and controls; 78% of cases and 52% of controls had at least 1 CCC.
| Cases (n = 141) | Controls (n = 423) | ||
|---|---|---|---|
| n (%) | n (%) | P Value | |
| |||
| Type of event | |||
| Cardiopulmonary arrest | 4 (3) | 0 | NA |
| Acute respiratory compromise | 29 (20) | 0 | NA |
| Urgent ICU transfer | 108 (77) | 0 | NA |
| Demographics | |||
| Age | 0.34 | ||
| 0‐<6 mo | 17 (12) | 62 (15) | |
| 6‐<12 mo | 22 (16) | 41 (10) | |
| 1‐<4 yr | 34 (24) | 97 (23) | |
| 4‐<10 yr | 26 (18) | 78 (18) | |
| 10‐<18 yr | 42 (30) | 145 (34) | |
| Sex | 0.70 | ||
| Female | 60 (43) | 188 (44) | |
| Male | 81 (57) | 235 (56) | |
| Race | 0.40 | ||
| White | 69 (49) | 189 (45) | |
| Black/African‐American | 49 (35) | 163 (38) | |
| Asian/Pacific Islander | 0 (0) | 7 (2) | |
| Other | 23 (16) | 62 (15) | |
| Not reported | 0 (0) | 2 (<1) | |
| Ethnicity | 0.53 | ||
| Non‐Hispanic | 127 (90) | 388 (92) | |
| Hispanic | 14 (10) | 33 (8) | |
| Unknown/not reported | 0 (0) | 2 (<1) | |
| Hospitalization | |||
| Length of stay in days, median (interquartile range) | 7.8 (2.6‐18.2) | 3.9 (1.9‐11.2) | <0.001 |
| Surgical service | 4 (3) | 67 (16) | <0.001 |
| Survived to hospital discharge | 107 (76) | 421 (99.5) | <0.001 |
Unadjusted (Bivariable) Analysis
Results of bivariable analysis are shown in Table 2.
| Variable | Cases n (%) | Controls n (%) | OR* | 95% CI | P Value |
|---|---|---|---|---|---|
| |||||
| Complex chronic conditions categories | |||||
| Congenital/genetic | 19 (13) | 21 (5) | 3.0 | 1.6‐5.8 | 0.001 |
| Neuromuscular | 31 (22) | 48 (11) | 2.2 | 1.3‐3.7 | 0.002 |
| Respiratory | 18 (13) | 27 (6) | 2.0 | 1.1‐3.7 | 0.02 |
| Cardiovascular | 15 (10) | 24 (6) | 2.0 | 1.0‐3.9 | 0.05 |
| Metabolic | 5 (3) | 6 (1) | 2.5 | 0.8‐8.2 | 0.13 |
| Gastrointestinal | 10 (7) | 24 (6) | 1.3 | 0.6‐2.7 | 0.54 |
| Renal | 3 (2) | 8 (2) | 1.1 | 0.3‐4.2 | 0.86 |
| Hematology/emmmunodeficiency | 6 (4) | 19 (4) | 0.9 | 0.4‐2.4 | 0.91 |
| Specific conditions | |||||
| Mental retardation | 21 (15) | 25 (6) | 2.7 | 1.5‐4.9 | 0.001 |
| Malignancy | 49 (35) | 90 (21) | 1.9 | 1.3‐2.8 | 0.002 |
| Epilepsy | 22 (15) | 30 (7) | 2.4 | 1.3‐4.3 | 0.004 |
| Cardiac malformations | 14 (10) | 19 (4) | 2.2 | 1.1‐4.4 | 0.02 |
| Chronic respiratory disease arising in the perinatal period | 11 (8) | 15 (4) | 2.2 | 1.0‐4.8 | 0.05 |
| Cerebral palsy | 7 (5) | 13 (3) | 1.7 | 0.6‐4.2 | 0.30 |
| Cystic fibrosis | 1 (1) | 9 (2) | 0.3 | <0.1‐2.6 | 0.30 |
| Other patient characteristics | |||||
| Time from hospital admission to event 7 days | 74 (52) | 146 (35) | 2.1 | 1.4‐3.1 | <0.001 |
| History of any transplant | 27 (19) | 17 (4) | 5.7 | 2.9‐11.1 | <0.001 |
| Enteral tube | 65 (46) | 102 (24) | 2.6 | 1.8‐3.9 | <0.001 |
| Hospitalized in an intensive care unit during the same admission | 43 (31) | 77 (18) | 2.0 | 1.3‐3.1 | 0.002 |
| Administration of TPN in preceding 24 hr | 26 (18) | 36 (9) | 2.3 | 1.4‐3.9 | 0.002 |
| Administration of an opioid via a patient‐controlled analgesia pump in the preceding 24 hr | 14 (9) | 14 (3) | 3.6 | 1.6‐8.3 | 0.002 |
| Weight‐for‐age <5th percentile | 49 (35) | 94 (22) | 1.9 | 1.2‐2.9 | 0.003 |
| Central venous line | 55 (39) | 113 (27) | 1.8 | 1.2‐2.7 | 0.005 |
| Age <1 yr | 39 (28) | 103 (24) | 1.2 | 0.8‐1.9 | 0.42 |
| Gestational age <37 wk or documentation of prematurity | 21 (15) | 60 (14) | 1.1 | 0.6‐1.8 | 0.84 |
| Laboratory studies | |||||
| Hemoglobin in preceding 72 hr | |||||
| Not tested | 28 (20) | 190 (45) | 1.0 | [reference] | |
| 10 g/dL | 42 (30) | 144 (34) | 2.0 | 1.2‐3.5 | 0.01 |
| <10 g/dL | 71 (50) | 89 (21) | 5.6 | 3.3‐9.5 | <0.001 |
| White blood cell count in preceding 72 hr | |||||
| Not tested | 28 (20) | 190 (45) | 1.0 | [reference] | |
| 5000 to <15,000/l | 45 (32) | 131 (31) | 2.4 | 1.4‐4.1 | 0.001 |
| 15,000/l | 19 (13) | 25 (6) | 5.7 | 2.7‐12.0 | <0.001 |
| <5000/l | 49 (35) | 77 (18) | 4.5 | 2.6‐7.8 | <0.001 |
| Blood culture drawn in preceding 72 hr | 78 (55) | 85 (20) | 5.2 | 3.3‐8.1 | <0.001 |
Adjusted (Multivariable) Analysis
The multivariable conditional logistic regression model included 7 independent risk factors for deterioration (Table 3): age <1 year, epilepsy, congenital/genetic defects, history of transplant, enteral tubes, hemoglobin <10 g/dL, and blood culture drawn in the preceding 72 hours.
| Predictor | Adjusted OR (95% CI) | P Value | Regression Coefficient (95% CI) | Score* |
|---|---|---|---|---|
| ||||
| Age <1 yr | 1.9 (1.0‐3.4) | 0.038 | 0.6 (<0.1‐1.2) | 1 |
| Epilepsy | 4.4 (1.9‐9.8) | <0.001 | 1.5 (0.7‐2.3) | 2 |
| Congenital/genetic defects | 2.1 (0.9‐4.9) | 0.075 | 0.8 (0.1‐1.6) | 1 |
| History of any transplant | 3.0 (1.3‐6.9) | 0.010 | 1.1 (0.3‐1.9) | 2 |
| Enteral tube | 2.1 (1.3‐3.6) | 0.003 | 0.8 (0.3‐1.3) | 1 |
| Hemoglobin <10 g/dL in preceding 72 hr | 3.0 (1.8‐5.1) | <0.001 | 1.1 (0.6‐1.6) | 2 |
| Blood culture drawn in preceding 72 hr | 5.8 (3.3‐10.3) | <0.001 | 1.8 (1.2‐2.3) | 3 |
Predictive Score
The range of the resulting predictive score was 0 to 12. The median score among cases was 4, and the median score among controls was 1 (P < 0.001). The area under the receiver operating characteristic curve was 0.78 (95% confidence interval 0.74‐0.83).
We grouped the scores by SSLRs into 4 risk strata and calculated each group's estimated post‐test probability of deterioration based on the pre‐test probability of deterioration of 0.15% (Table 4). The very low‐risk group had a probability of deterioration of 0.06%, less than one‐half the pre‐test probability. The low‐risk group had a probability of deterioration of 0.18%, similar to the pre‐test probability. The intermediate‐risk group had a probability of deterioration of 0.39%, 2.6 times higher than the pre‐test probability. The high‐risk group had a probability of deterioration of 12.60%, 84 times higher than the pre‐test probability.
| Risk stratum | Score range | Cases in stratumn (%) | Controls in stratumn (%) | SSLR (95% CI) | Probability of deterioration (%)* |
|---|---|---|---|---|---|
| |||||
| Very low | 0‐2 | 37 (26) | 288 (68) | 0.4 (0.3‐0.5) | 0.06 |
| Low | 3‐4 | 37 (26) | 94 (22) | 1.2 (0.9‐1.6) | 0.2 |
| Intermediate | 5‐6 | 35 (25) | 40 (9) | 2.6 (1.7‐4.0) | 0.4 |
| High | 7‐12 | 32 (23) | 1 (<1) | 96.0 (13.2‐696.2) | 12.6 |
DISCUSSION
Despite the widespread adoption of rapid response systems, we know little about the optimal methods to identify patients whose clinical characteristics alone put them at increased risk of deterioration, and triage the care they receive based on this risk. Pediatric case series have suggested that younger children and those with chronic illnesses are more likely to require assistance from a medical emergency team,1112 but this is the first study to measure their association with this outcome in children.
Most studies with the objective of identifying patients at risk have focused on tools designed to detect symptoms of deterioration that have already begun, using single‐parameter medical emergency team calling criteria1316 or multi‐parameter early warning scores.38 Rather than create a tool to detect deterioration that has already begun, we developed a predictive score that incorporates patient characteristics independently associated with deterioration in hospitalized children, including age <1 year, epilepsy, congenital/genetic defects, history of transplant, enteral tube, hemoglobin <10 g/dL, and blood culture drawn in the preceding 72 hours. The score has the potential to help clinicians identify the children at highest risk of deterioration who might benefit most from the use of vital sign‐based methods to detect deterioration, as well as the children at lowest risk for whom monitoring may be unnecessary. For example, this score could be performed at the time of admission, and those at very low risk of deterioration and without other clinically concerning findings might be considered for a low‐intensity schedule of vital signs and monitoring (such as vital signs every 8 hours, no continuous cardiorespiratory monitoring or pulse oximetry, and early warning score calculation daily), while patients in the intermediate and high‐risk groups might be considered for a more intensive schedule of vital signs and monitoring (such as vital signs every 4 hours, continuous cardiorespiratory monitoring and pulse oximetry, and early warning score calculation every 4 hours). It should be noted, however, that 37 cases (26%) fell into the very low‐risk category, raising the importance of external validation at the point of admission from the emergency department, before the score can be implemented for the potential clinical use described above. If the score performs well in validation studies, then its use in tailoring monitoring parameters has the potential to reduce the amount of time nurses spend responding to false monitor alarms and calculating early warning scores on patients at very low risk of deterioration.
Of note, we excluded children hospitalized for fewer than 24 hours, resulting in the exclusion of 31% of the potentially eligible events. We also excluded 40% of the potentially eligible ICU transfers because they did not meet urgent criteria. These may be limitations because: (1) the first 24 hours of hospitalization may be a high‐risk period; and (2) patients who were on trajectories toward severe deterioration and received interventions that prevented further deterioration, but did not meet urgent criteria, were excluded. It may be that the children we included as cases were at increased risk of deterioration that is either more difficult to recognize early, or more difficult to treat effectively without ICU interventions. In addition, the population of patients meeting urgent criteria may vary across hospitals, limiting generalizability of this score.
In summary, we developed a predictive score and risk stratification tool that may be useful in triaging the intensity of monitoring and surveillance for deterioration that children receive when hospitalized on non‐ICU units. External validation using the setting and frequency of score measurement that would be most valuable clinically (for example, in the emergency department at the time of admission) is needed before clinical use can be recommended.
Acknowledgements
The authors thank Annie Chung, BA, Emily Huang, and Susan Lipsett, MD, for their assistance with data collection.
- Institute for Healthcare Improvement. About IHI. Available at: http://www.ihi.org/ihi/about. Accessed July 18,2010.
- ,,, et al.“Identifying the hospitalised patient in crisis”—a consensus conference on the afferent limb of Rapid Response Systems.Resuscitation.2010;81(4):375–382.
- ,,.The Pediatric Early Warning System score: a severity of illness score to predict urgent medical need in hospitalized children.J Crit Care.2006;21(3):271–278.
- ,,.Development and initial validation of the Bedside Paediatric Early Warning System score.Crit Care.2009;13(4):R135.
- .Detecting and managing deterioration in children.Paediatr Nurs.2005;17(1):32–35.
- ,,.Promoting care for acutely ill children—development and evaluation of a Paediatric Early Warning Tool.Intensive Crit Care Nurs.2006;22(2):73–81.
- ,,,,.Prospective evaluation of a pediatric inpatient early warning scoring system.J Spec Pediatr Nurs.2009;14(2):79–85.
- ,,,.Prospective cohort study to test the predictability of the Cardiff and Vale paediatric early warning system.Arch Dis Child.2009;94(8):602–606.
- ,,,,,.Deaths attributed to pediatric complex chronic conditions: national trends and implications for supportive care services.Pediatrics.2001;107(6):e99.
- ,,,,.Early prediction of neurological sequelae or death after bacterial meningitis.Acta Paediatr.2002;91(4):391–398.
- ,,,,.Retrospective review of emergency response activations during a 13‐year period at a tertiary care children's hospital.J Hosp Med.2011;6(3):131–135.
- ,,,.Clinical profile of hospitalized children provided with urgent assistance from a medical emergency team.Pediatrics.2008;121(6):e1577–e1584.
- ,,, et al.Implementation of a medical emergency team in a large pediatric teaching hospital prevents respiratory and cardiopulmonary arrests outside the intensive care unit.Pediatr Crit Care Med.2007;8(3):236–246.
- ,,, et al.Effect of a rapid response team on hospital‐wide mortality and code rates outside the ICU in a children's hospital.JAMA.2007;298(19):2267–2274.
- ,,, et al.Transition from a traditional code team to a medical emergency team and categorization of cardiopulmonary arrests in a children's center.Arch Pediatr Adolesc Med.2008;162(2):117–122.
- ,.Reduction of hospital mortality and of preventable cardiac arrest and death on introduction of a pediatric medical emergency team.Pediatr Crit Care Med.2009;10(3):306–312.
Thousands of hospitals have implemented rapid response systems in recent years in attempts to reduce mortality outside the intensive care unit (ICU).1 These systems have 2 components, a response arm and an identification arm. The response arm is usually comprised of a multidisciplinary critical care team that responds to calls for urgent assistance outside the ICU; this team is often called a rapid response team or a medical emergency team. The identification arm comes in 2 forms, predictive and detective. Predictive tools estimate a patient's risk of deterioration over time based on factors that are not rapidly changing, such as elements of the patient's history. In contrast, detective tools include highly time‐varying signs of active deterioration, such as vital sign abnormalities.2 To date, most pediatric studies have focused on developing detective tools, including several early warning scores.38
In this study, we sought to identify the characteristics that increase the probability that a hospitalized child will deteriorate, and combine these characteristics into a predictive score. Tools like this may be helpful in identifying and triaging the subset of high‐risk children who should be intensively monitored for early signs of deterioration at the time of admission, as well as in identifying very low‐risk children who, in the absence of other clinical concerns, may be monitored less intensively.
METHODS
Detailed methods, including the inclusion/exclusion criteria, the matching procedures, and a full description of the statistical analysis are provided as an appendix (see Supporting Online Appendix: Supplement to Methods Section in the online version of this article). An abbreviated version follows.
Design
We performed a case‐control study among children, younger than 18 years old, hospitalized for >24 hours between January 1, 2005 and December 31, 2008. The case group consisted of children who experienced clinical deterioration, a composite outcome defined as cardiopulmonary arrest (CPA), acute respiratory compromise (ARC), or urgent ICU transfer, while on a non‐ICU unit. ICU transfers were considered urgent if they included at least one of the following outcomes in the 12 hours after transfer: death, CPA, intubation, initiation of noninvasive ventilation, or administration of a vasoactive medication infusion used for the treatment of shock. The control group consisted of a random sample of patients matched 3:1 to cases if they met the criteria of being on a non‐ICU unit at the same time as their matched case.
Variables and Measurements
We collected data on demographics, complex chronic conditions (CCCs), other patient characteristics, and laboratory studies. CCCs were specific diagnoses divided into the following 9 categories according to an established framework: neuromuscular, cardiovascular, respiratory, renal, gastrointestinal, hematologic/emmmunologic, metabolic, malignancy, and genetic/congenital defects.9 Other patient characteristics evaluated included age, weight‐for‐age, gestational age, history of transplant, time from hospital admission to event, recent ICU stays, administration of total parenteral nutrition, use of a patient‐controlled analgesia pump, and presence of medical devices including central venous lines and enteral tubes (naso‐gastric, gastrostomy, or jejunostomy).
Laboratory studies evaluated included hemoglobin value, white blood cell count, and blood culture drawn in the preceding 72 hours. We included these laboratory studies in this predictive score because we hypothesized that they represented factors that increased a child's risk of deterioration over time, as opposed to signs of acute deterioration that would be more appropriate for a detective score.
Statistical Analysis
We used conditional logistic regression for the bivariable and multivariable analyses to account for the matching. We derived the predictive score using an established method10 in which the regression coefficients for each covariate were divided by the smallest coefficient, and then rounded to the nearest integer, to establish each variable's sub‐score. We grouped the total scores into very low, low, intermediate, and high‐risk groups, calculated overall stratum‐specific likelihood ratios (SSLRs), and estimated stratum‐specific probabilities of deterioration for each group.
RESULTS
Patient Characteristics
We identified 12 CPAs, 41 ARCs, and 699 urgent ICU transfers during the study period. A total of 141 cases met our strict criteria for inclusion (see Figure in Supporting Online Appendix: Supplement to Methods Section in the online version of this article) among approximately 96,000 admissions during the study period, making the baseline incidence of events (pre‐test probability) approximately 0.15%. The case and control groups were similar in age, sex, and family‐reported race/ethnicity. Cases had been hospitalized longer than controls at the time of their event, were less likely to have been on a surgical service, and were less likely to survive to hospital discharge (Table 1). There was a high prevalence of CCCs among both cases and controls; 78% of cases and 52% of controls had at least 1 CCC.
| Cases (n = 141) | Controls (n = 423) | ||
|---|---|---|---|
| n (%) | n (%) | P Value | |
| |||
| Type of event | |||
| Cardiopulmonary arrest | 4 (3) | 0 | NA |
| Acute respiratory compromise | 29 (20) | 0 | NA |
| Urgent ICU transfer | 108 (77) | 0 | NA |
| Demographics | |||
| Age | 0.34 | ||
| 0‐<6 mo | 17 (12) | 62 (15) | |
| 6‐<12 mo | 22 (16) | 41 (10) | |
| 1‐<4 yr | 34 (24) | 97 (23) | |
| 4‐<10 yr | 26 (18) | 78 (18) | |
| 10‐<18 yr | 42 (30) | 145 (34) | |
| Sex | 0.70 | ||
| Female | 60 (43) | 188 (44) | |
| Male | 81 (57) | 235 (56) | |
| Race | 0.40 | ||
| White | 69 (49) | 189 (45) | |
| Black/African‐American | 49 (35) | 163 (38) | |
| Asian/Pacific Islander | 0 (0) | 7 (2) | |
| Other | 23 (16) | 62 (15) | |
| Not reported | 0 (0) | 2 (<1) | |
| Ethnicity | 0.53 | ||
| Non‐Hispanic | 127 (90) | 388 (92) | |
| Hispanic | 14 (10) | 33 (8) | |
| Unknown/not reported | 0 (0) | 2 (<1) | |
| Hospitalization | |||
| Length of stay in days, median (interquartile range) | 7.8 (2.6‐18.2) | 3.9 (1.9‐11.2) | <0.001 |
| Surgical service | 4 (3) | 67 (16) | <0.001 |
| Survived to hospital discharge | 107 (76) | 421 (99.5) | <0.001 |
Unadjusted (Bivariable) Analysis
Results of bivariable analysis are shown in Table 2.
| Variable | Cases n (%) | Controls n (%) | OR* | 95% CI | P Value |
|---|---|---|---|---|---|
| |||||
| Complex chronic conditions categories | |||||
| Congenital/genetic | 19 (13) | 21 (5) | 3.0 | 1.6‐5.8 | 0.001 |
| Neuromuscular | 31 (22) | 48 (11) | 2.2 | 1.3‐3.7 | 0.002 |
| Respiratory | 18 (13) | 27 (6) | 2.0 | 1.1‐3.7 | 0.02 |
| Cardiovascular | 15 (10) | 24 (6) | 2.0 | 1.0‐3.9 | 0.05 |
| Metabolic | 5 (3) | 6 (1) | 2.5 | 0.8‐8.2 | 0.13 |
| Gastrointestinal | 10 (7) | 24 (6) | 1.3 | 0.6‐2.7 | 0.54 |
| Renal | 3 (2) | 8 (2) | 1.1 | 0.3‐4.2 | 0.86 |
| Hematology/emmmunodeficiency | 6 (4) | 19 (4) | 0.9 | 0.4‐2.4 | 0.91 |
| Specific conditions | |||||
| Mental retardation | 21 (15) | 25 (6) | 2.7 | 1.5‐4.9 | 0.001 |
| Malignancy | 49 (35) | 90 (21) | 1.9 | 1.3‐2.8 | 0.002 |
| Epilepsy | 22 (15) | 30 (7) | 2.4 | 1.3‐4.3 | 0.004 |
| Cardiac malformations | 14 (10) | 19 (4) | 2.2 | 1.1‐4.4 | 0.02 |
| Chronic respiratory disease arising in the perinatal period | 11 (8) | 15 (4) | 2.2 | 1.0‐4.8 | 0.05 |
| Cerebral palsy | 7 (5) | 13 (3) | 1.7 | 0.6‐4.2 | 0.30 |
| Cystic fibrosis | 1 (1) | 9 (2) | 0.3 | <0.1‐2.6 | 0.30 |
| Other patient characteristics | |||||
| Time from hospital admission to event 7 days | 74 (52) | 146 (35) | 2.1 | 1.4‐3.1 | <0.001 |
| History of any transplant | 27 (19) | 17 (4) | 5.7 | 2.9‐11.1 | <0.001 |
| Enteral tube | 65 (46) | 102 (24) | 2.6 | 1.8‐3.9 | <0.001 |
| Hospitalized in an intensive care unit during the same admission | 43 (31) | 77 (18) | 2.0 | 1.3‐3.1 | 0.002 |
| Administration of TPN in preceding 24 hr | 26 (18) | 36 (9) | 2.3 | 1.4‐3.9 | 0.002 |
| Administration of an opioid via a patient‐controlled analgesia pump in the preceding 24 hr | 14 (9) | 14 (3) | 3.6 | 1.6‐8.3 | 0.002 |
| Weight‐for‐age <5th percentile | 49 (35) | 94 (22) | 1.9 | 1.2‐2.9 | 0.003 |
| Central venous line | 55 (39) | 113 (27) | 1.8 | 1.2‐2.7 | 0.005 |
| Age <1 yr | 39 (28) | 103 (24) | 1.2 | 0.8‐1.9 | 0.42 |
| Gestational age <37 wk or documentation of prematurity | 21 (15) | 60 (14) | 1.1 | 0.6‐1.8 | 0.84 |
| Laboratory studies | |||||
| Hemoglobin in preceding 72 hr | |||||
| Not tested | 28 (20) | 190 (45) | 1.0 | [reference] | |
| 10 g/dL | 42 (30) | 144 (34) | 2.0 | 1.2‐3.5 | 0.01 |
| <10 g/dL | 71 (50) | 89 (21) | 5.6 | 3.3‐9.5 | <0.001 |
| White blood cell count in preceding 72 hr | |||||
| Not tested | 28 (20) | 190 (45) | 1.0 | [reference] | |
| 5000 to <15,000/l | 45 (32) | 131 (31) | 2.4 | 1.4‐4.1 | 0.001 |
| 15,000/l | 19 (13) | 25 (6) | 5.7 | 2.7‐12.0 | <0.001 |
| <5000/l | 49 (35) | 77 (18) | 4.5 | 2.6‐7.8 | <0.001 |
| Blood culture drawn in preceding 72 hr | 78 (55) | 85 (20) | 5.2 | 3.3‐8.1 | <0.001 |
Adjusted (Multivariable) Analysis
The multivariable conditional logistic regression model included 7 independent risk factors for deterioration (Table 3): age <1 year, epilepsy, congenital/genetic defects, history of transplant, enteral tubes, hemoglobin <10 g/dL, and blood culture drawn in the preceding 72 hours.
| Predictor | Adjusted OR (95% CI) | P Value | Regression Coefficient (95% CI) | Score* |
|---|---|---|---|---|
| ||||
| Age <1 yr | 1.9 (1.0‐3.4) | 0.038 | 0.6 (<0.1‐1.2) | 1 |
| Epilepsy | 4.4 (1.9‐9.8) | <0.001 | 1.5 (0.7‐2.3) | 2 |
| Congenital/genetic defects | 2.1 (0.9‐4.9) | 0.075 | 0.8 (0.1‐1.6) | 1 |
| History of any transplant | 3.0 (1.3‐6.9) | 0.010 | 1.1 (0.3‐1.9) | 2 |
| Enteral tube | 2.1 (1.3‐3.6) | 0.003 | 0.8 (0.3‐1.3) | 1 |
| Hemoglobin <10 g/dL in preceding 72 hr | 3.0 (1.8‐5.1) | <0.001 | 1.1 (0.6‐1.6) | 2 |
| Blood culture drawn in preceding 72 hr | 5.8 (3.3‐10.3) | <0.001 | 1.8 (1.2‐2.3) | 3 |
Predictive Score
The range of the resulting predictive score was 0 to 12. The median score among cases was 4, and the median score among controls was 1 (P < 0.001). The area under the receiver operating characteristic curve was 0.78 (95% confidence interval 0.74‐0.83).
We grouped the scores by SSLRs into 4 risk strata and calculated each group's estimated post‐test probability of deterioration based on the pre‐test probability of deterioration of 0.15% (Table 4). The very low‐risk group had a probability of deterioration of 0.06%, less than one‐half the pre‐test probability. The low‐risk group had a probability of deterioration of 0.18%, similar to the pre‐test probability. The intermediate‐risk group had a probability of deterioration of 0.39%, 2.6 times higher than the pre‐test probability. The high‐risk group had a probability of deterioration of 12.60%, 84 times higher than the pre‐test probability.
| Risk stratum | Score range | Cases in stratumn (%) | Controls in stratumn (%) | SSLR (95% CI) | Probability of deterioration (%)* |
|---|---|---|---|---|---|
| |||||
| Very low | 0‐2 | 37 (26) | 288 (68) | 0.4 (0.3‐0.5) | 0.06 |
| Low | 3‐4 | 37 (26) | 94 (22) | 1.2 (0.9‐1.6) | 0.2 |
| Intermediate | 5‐6 | 35 (25) | 40 (9) | 2.6 (1.7‐4.0) | 0.4 |
| High | 7‐12 | 32 (23) | 1 (<1) | 96.0 (13.2‐696.2) | 12.6 |
DISCUSSION
Despite the widespread adoption of rapid response systems, we know little about the optimal methods to identify patients whose clinical characteristics alone put them at increased risk of deterioration, and triage the care they receive based on this risk. Pediatric case series have suggested that younger children and those with chronic illnesses are more likely to require assistance from a medical emergency team,1112 but this is the first study to measure their association with this outcome in children.
Most studies with the objective of identifying patients at risk have focused on tools designed to detect symptoms of deterioration that have already begun, using single‐parameter medical emergency team calling criteria1316 or multi‐parameter early warning scores.38 Rather than create a tool to detect deterioration that has already begun, we developed a predictive score that incorporates patient characteristics independently associated with deterioration in hospitalized children, including age <1 year, epilepsy, congenital/genetic defects, history of transplant, enteral tube, hemoglobin <10 g/dL, and blood culture drawn in the preceding 72 hours. The score has the potential to help clinicians identify the children at highest risk of deterioration who might benefit most from the use of vital sign‐based methods to detect deterioration, as well as the children at lowest risk for whom monitoring may be unnecessary. For example, this score could be performed at the time of admission, and those at very low risk of deterioration and without other clinically concerning findings might be considered for a low‐intensity schedule of vital signs and monitoring (such as vital signs every 8 hours, no continuous cardiorespiratory monitoring or pulse oximetry, and early warning score calculation daily), while patients in the intermediate and high‐risk groups might be considered for a more intensive schedule of vital signs and monitoring (such as vital signs every 4 hours, continuous cardiorespiratory monitoring and pulse oximetry, and early warning score calculation every 4 hours). It should be noted, however, that 37 cases (26%) fell into the very low‐risk category, raising the importance of external validation at the point of admission from the emergency department, before the score can be implemented for the potential clinical use described above. If the score performs well in validation studies, then its use in tailoring monitoring parameters has the potential to reduce the amount of time nurses spend responding to false monitor alarms and calculating early warning scores on patients at very low risk of deterioration.
Of note, we excluded children hospitalized for fewer than 24 hours, resulting in the exclusion of 31% of the potentially eligible events. We also excluded 40% of the potentially eligible ICU transfers because they did not meet urgent criteria. These may be limitations because: (1) the first 24 hours of hospitalization may be a high‐risk period; and (2) patients who were on trajectories toward severe deterioration and received interventions that prevented further deterioration, but did not meet urgent criteria, were excluded. It may be that the children we included as cases were at increased risk of deterioration that is either more difficult to recognize early, or more difficult to treat effectively without ICU interventions. In addition, the population of patients meeting urgent criteria may vary across hospitals, limiting generalizability of this score.
In summary, we developed a predictive score and risk stratification tool that may be useful in triaging the intensity of monitoring and surveillance for deterioration that children receive when hospitalized on non‐ICU units. External validation using the setting and frequency of score measurement that would be most valuable clinically (for example, in the emergency department at the time of admission) is needed before clinical use can be recommended.
Acknowledgements
The authors thank Annie Chung, BA, Emily Huang, and Susan Lipsett, MD, for their assistance with data collection.
- Institute for Healthcare Improvement. About IHI. Available at: http://www.ihi.org/ihi/about. Accessed July 18,2010.
- ,,, et al.“Identifying the hospitalised patient in crisis”—a consensus conference on the afferent limb of Rapid Response Systems.Resuscitation.2010;81(4):375–382.
- ,,.The Pediatric Early Warning System score: a severity of illness score to predict urgent medical need in hospitalized children.J Crit Care.2006;21(3):271–278.
- ,,.Development and initial validation of the Bedside Paediatric Early Warning System score.Crit Care.2009;13(4):R135.
- .Detecting and managing deterioration in children.Paediatr Nurs.2005;17(1):32–35.
- ,,.Promoting care for acutely ill children—development and evaluation of a Paediatric Early Warning Tool.Intensive Crit Care Nurs.2006;22(2):73–81.
- ,,,,.Prospective evaluation of a pediatric inpatient early warning scoring system.J Spec Pediatr Nurs.2009;14(2):79–85.
- ,,,.Prospective cohort study to test the predictability of the Cardiff and Vale paediatric early warning system.Arch Dis Child.2009;94(8):602–606.
- ,,,,,.Deaths attributed to pediatric complex chronic conditions: national trends and implications for supportive care services.Pediatrics.2001;107(6):e99.
- ,,,,.Early prediction of neurological sequelae or death after bacterial meningitis.Acta Paediatr.2002;91(4):391–398.
- ,,,,.Retrospective review of emergency response activations during a 13‐year period at a tertiary care children's hospital.J Hosp Med.2011;6(3):131–135.
- ,,,.Clinical profile of hospitalized children provided with urgent assistance from a medical emergency team.Pediatrics.2008;121(6):e1577–e1584.
- ,,, et al.Implementation of a medical emergency team in a large pediatric teaching hospital prevents respiratory and cardiopulmonary arrests outside the intensive care unit.Pediatr Crit Care Med.2007;8(3):236–246.
- ,,, et al.Effect of a rapid response team on hospital‐wide mortality and code rates outside the ICU in a children's hospital.JAMA.2007;298(19):2267–2274.
- ,,, et al.Transition from a traditional code team to a medical emergency team and categorization of cardiopulmonary arrests in a children's center.Arch Pediatr Adolesc Med.2008;162(2):117–122.
- ,.Reduction of hospital mortality and of preventable cardiac arrest and death on introduction of a pediatric medical emergency team.Pediatr Crit Care Med.2009;10(3):306–312.