User login
Physiologic Monitor Alarm Rates at 5 Children’s Hospitals
Alarm fatigue is a patient safety hazard in hospitals1 that occurs when exposure to high rates of alarms leads clinicians to ignore or delay their responses to the alarms.2,3 To date, most studies of physiologic monitor alarms in hospitalized children have used data from single institutions and often only a few units within each institution.4 These limited studies have found that alarms in pediatric units are rarely actionable.2 They have also shown that physiologic monitor alarms occur frequently in children’s hospitals and that alarm rates can vary widely within a single institution,5 but the extent of variation between children’s hospitals is unknown. In this study, we aimed to describe and compare physiologic monitor alarm characteristics and the proportion of patients monitored in the inpatient units of 5 children’s hospitals.
METHODS
We performed a cross-sectional study using a point-prevalence design of physiologic monitor alarms and monitoring during a 24-hour period at 5 large, freestanding tertiary-care children’s hospitals. At the time of the study, each hospital had an alarm management committee in place and was working to address alarm fatigue. Each hospital’s institutional review board reviewed and approved the study.
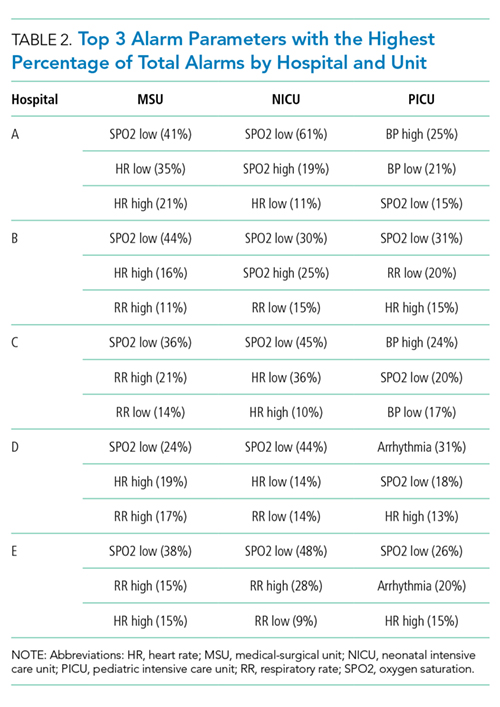
We collected 24 consecutive hours of data from the inpatient units of each hospital between March 24, 2015, and May 1, 2015. Each hospital selected the data collection date within that window based on the availability of staff to perform data collection.6 We excluded emergency departments, procedural areas, and inpatient psychiatry and rehabilitation units. By using existing central alarm-collection software that interfaced with bedside physiologic monitors, we collected data on audible alarms generated for apnea, arrhythmia, low and high oxygen saturation, heart rate, respiratory rate, blood pressure, and exhaled carbon dioxide. Bedside alarm systems and alarm collection software differed between centers; therefore, alarm types that were not consistently collected at every institution (eg, alarms for electrode and device malfunction, ventilators, intracranial and central venous pressure monitors, and temperatures probes) were excluded. To estimate alarm rates and to account for fluctuations in hospital census throughout the day,7 we collected census (to calculate the number of alarms per patient day) and the number of monitored patients (to calculate the number of alarms per monitored-patient day, including only monitored patients in the denominator) on each unit at 3 time points, 8 hours apart. Patients were considered continuously monitored if they had presence of a waveform and data for pulse oximetry, respiratory rate, and/or heart rate at the time of data collection. We then determined the rate of alarms by unit type—medical-surgical unit (MSU), neonatal intensive care unit (NICU), or pediatric intensive care unit (PICU)—and the alarm types. Based on prior literature demonstrating up to 95% of alarms contributed by a minority of patients on a single unit,8 we also calculated the percentage of alarms contributed by beds in the highest quartile of alarms. We also assessed the percentage of patients monitored by unit type. The Supplementary Appendix shows the alarm parameter thresholds in use at the time of the study.
RESULTS
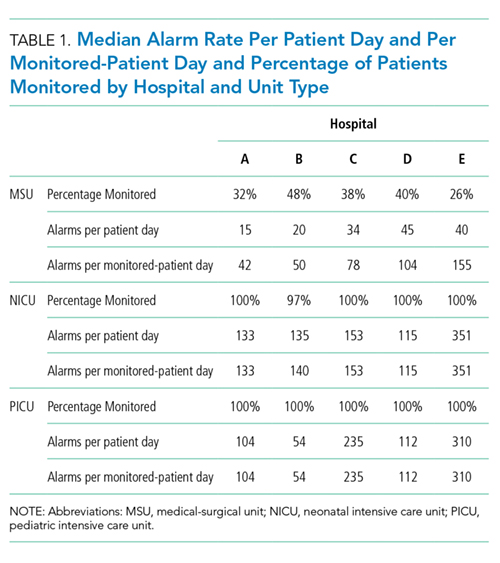
Averaged across study hospitals, one-quarter of the monitored beds were responsible for 71% of alarms in MSUs, 61% of alarms in NICUs, and 63% of alarms in PICUs.
DISCUSSION
Physiologic monitor alarm rates and the proportion of patients monitored varied widely between unit types and among the tertiary-care children’s hospitals in our study. We found that among MSUs, the hospital with the lowest proportion of beds monitored had the highest alarm rate, with over triple the rate seen at the hospital with the lowest alarm rate. Regardless of unit type, a small subgroup of patients at each hospital contributed a disproportionate share of alarms. These findings are concerning because of the patient morbidity and mortality associated with alarm fatigue1 and the studies suggesting that higher alarm rates may lead to delays in response to potentially critical alarms.2
We previously described alarm rates at a single children’s hospital and found that alarm rates were high both in and outside of the ICU areas.5 This study supports those findings and goes further to show that alarm rates on some MSUs approached rates seen in the ICU areas at other centers.4 However, our results should be considered in the context of several limitations. First, the 5 study hospitals utilized different bedside monitors, equipment, and software to collect alarm data. It is possible that this impacted how alarms were counted, though there were no technical specifications to suggest that results should have been biased in a specific way. Second, our data did not reflect alarm validity (ie, whether an alarm accurately reflected the physiologic state of the patient) or factors outside of the number of patients monitored—such as practices around ICU admission and transfer as well as monitor practices such as lead changes, the type of leads employed, and the degree to which alarm parameter thresholds could be customized, which may have also affected alarm rates. Finally, we excluded alarm types that were not consistently collected at all hospitals. We were also unable to capture alarms from other alarm-generating devices, including ventilators and infusion pumps, which have also been identified as sources of alarm-related safety issues in hospitals.9-11 This suggests that the alarm rates reported here underestimate the total number of audible alarms experienced by staff and by hospitalized patients and families.
While our data collection was limited in scope, the striking differences in alarm rates between hospitals and between similar units in the same hospitals suggest that unit- and hospital-level factors—including default alarm parameter threshold settings, types of monitors used, and monitoring practices such as the degree to which alarm parameters are customized to the patient’s physiologic state—likely contribute to the variability. It is also important to note that while there were clear outlier hospitals, no single hospital had the lowest alarm rate across all unit types. And while we found that a small number of patients contributed disproportionately to alarms, monitoring fewer patients overall was not consistently associated with lower alarm rates. While it is difficult to draw conclusions based on a limited study, these findings suggest that solutions to meaningfully lower alarm rates may be multifaceted. Standardization of care in multiple areas of medicine has shown the potential to decrease unnecessary utilization of testing and therapies while maintaining good patient outcomes.12-15 Our findings suggest that the concept of positive deviance,16 by which some organizations produce better outcomes than others despite similar limitations, may help identify successful alarm reduction strategies for further testing. Larger quantitative studies of alarm rates and ethnographic or qualitative studies of monitoring practices may reveal practices and policies that are associated with lower alarm rates with similar or improved monitoring outcomes.
CONCLUSION
We found wide variability in physiologic monitor alarm rates and the proportion of patients monitored across 5 children’s hospitals. Because alarm fatigue remains a pressing patient safety concern, further study of the features of high-performing (low-alarm) hospital systems may help identify barriers and facilitators of safe, effective monitoring and develop targeted interventions to reduce alarms.
ACKNOWLEDGEMENTS
The authors thank Melinda Egan, Matt MacMurchy, and Shannon Stemler for their assistance with data collection.
Disclosure
Dr. Bonafide is supported by the National Heart, Lung, and Blood Institute of the National Institutes of Health under Award Number K23HL116427. Dr. Brady is supported by the Agency for Healthcare Research and Quality under Award Number K08HS23827. The content is solely the responsibility of the authors and does not necessarily represent the official views of the National Institutes of Health or the Agency for Healthcare Research and Quality. There was no external funding obtained for this study. The authors have no conflicts of interest to disclose.
1. Sentinel Event Alert Issue 50: Medical device alarm safety in hospitals. The Joint Commission. April 8, 2013. www.jointcommission.org/sea_issue_50. Accessed December 16, 2017.
2. Bonafide CP, Lin R, Zander M, et al. Association between exposure to nonactionable physiologic monitor alarms and response time in a children’s hospital. J Hosp Med. 2015;10(6):345-351. PubMed
3. Voepel-Lewis T, Parker ML, Burke CN, et al. Pulse oximetry desaturation alarms on a general postoperative adult unit: A prospective observational study of nurse response time. Int J Nurs Stud. 2013;50(10):1351-1358. PubMed
4. Paine CW, Goel VV, Ely E, et al. Systematic review of physiologic monitor alarm characteristics and pragmatic interventions to reduce alarm frequency. J Hosp Med. 2016;11(2):136-144. PubMed
5. Schondelmeyer AC, Bonafide CP, Goel VV, et al. The frequency of physiologic monitor alarms in a children’s hospital. J Hosp Med. 2016;11(11):796-798. PubMed
6. Zingg W, Hopkins S, Gayet-Ageron A, et al. Health-care-associated infections in neonates, children, and adolescents: An analysis of paediatric data from the European Centre for Disease Prevention and Control point-prevalence survey. Lancet Infect Dis. 2017;17(4):381-389. PubMed
7. Fieldston E, Ragavan M, Jayaraman B, Metlay J, Pati S. Traditional measures of hospital utilization may not accurately reflect dynamic patient demand: Findings from a children’s hospital. Hosp Pediatr. 2012;2(1):10-18. PubMed
8. Cvach M, Kitchens M, Smith K, Harris P, Flack MN. Customizing alarm limits based on specific needs of patients. Biomed Instrum Technol. 2017;51(3):227-234. PubMed
9. Pham JC, Williams TL, Sparnon EM, Cillie TK, Scharen HF, Marella WM. Ventilator-related adverse events: A taxonomy and findings from 3 incident reporting systems. Respir Care. 2016;61(5):621-631. PubMed
10. Cho OM, Kim H, Lee YW, Cho I. Clinical alarms in intensive care units: Perceived obstacles of alarm management and alarm fatigue in nurses. Healthc Inform Res. 2016;22(1):46-53. PubMed
11. Edworthy J, Hellier E. Alarms and human behaviour: Implications for medical alarms. Br J Anaesth. 2006;97(1):12-17. PubMed
12. Fisher ES, Wennberg DE, Stukel TA, Gottlieb DJ, Lucas FL, Pinder EL. The implications of regional variations in medicare spending. Part 1: The content, quality, and accessibility of care. Ann Intern Med. 2003;138(4):273-287. PubMed
13. Fisher ES, Wennberg DE, Stukel TA, Gottlieb DJ, Lucas FL, Pinder EL. The implications of regional variations in medicare spending. Part 2: Health outcomes and satisfaction with care. Ann Intern Med. 2003;138(4):288-298. PubMed
14. Lion KC, Wright DR, Spencer S, Zhou C, Del Beccaro M, Mangione-Smith R. Standardized clinical pathways for hospitalized children and outcomes. Pediatrics. 2016;137(4) e20151202. PubMed
15. Goodman DC. Unwarranted variation in pediatric medical care. Pediatr Clin North Am. 2009;56(4):745-755. PubMed
16. Baxter R, Taylor N, Kellar I, Lawton R. What methods are used to apply positive deviance within healthcare organisations? A systematic review. BMJ Qual Saf. 2016;25(3):190-201. PubMed
Alarm fatigue is a patient safety hazard in hospitals1 that occurs when exposure to high rates of alarms leads clinicians to ignore or delay their responses to the alarms.2,3 To date, most studies of physiologic monitor alarms in hospitalized children have used data from single institutions and often only a few units within each institution.4 These limited studies have found that alarms in pediatric units are rarely actionable.2 They have also shown that physiologic monitor alarms occur frequently in children’s hospitals and that alarm rates can vary widely within a single institution,5 but the extent of variation between children’s hospitals is unknown. In this study, we aimed to describe and compare physiologic monitor alarm characteristics and the proportion of patients monitored in the inpatient units of 5 children’s hospitals.
METHODS
We performed a cross-sectional study using a point-prevalence design of physiologic monitor alarms and monitoring during a 24-hour period at 5 large, freestanding tertiary-care children’s hospitals. At the time of the study, each hospital had an alarm management committee in place and was working to address alarm fatigue. Each hospital’s institutional review board reviewed and approved the study.
We collected 24 consecutive hours of data from the inpatient units of each hospital between March 24, 2015, and May 1, 2015. Each hospital selected the data collection date within that window based on the availability of staff to perform data collection.6 We excluded emergency departments, procedural areas, and inpatient psychiatry and rehabilitation units. By using existing central alarm-collection software that interfaced with bedside physiologic monitors, we collected data on audible alarms generated for apnea, arrhythmia, low and high oxygen saturation, heart rate, respiratory rate, blood pressure, and exhaled carbon dioxide. Bedside alarm systems and alarm collection software differed between centers; therefore, alarm types that were not consistently collected at every institution (eg, alarms for electrode and device malfunction, ventilators, intracranial and central venous pressure monitors, and temperatures probes) were excluded. To estimate alarm rates and to account for fluctuations in hospital census throughout the day,7 we collected census (to calculate the number of alarms per patient day) and the number of monitored patients (to calculate the number of alarms per monitored-patient day, including only monitored patients in the denominator) on each unit at 3 time points, 8 hours apart. Patients were considered continuously monitored if they had presence of a waveform and data for pulse oximetry, respiratory rate, and/or heart rate at the time of data collection. We then determined the rate of alarms by unit type—medical-surgical unit (MSU), neonatal intensive care unit (NICU), or pediatric intensive care unit (PICU)—and the alarm types. Based on prior literature demonstrating up to 95% of alarms contributed by a minority of patients on a single unit,8 we also calculated the percentage of alarms contributed by beds in the highest quartile of alarms. We also assessed the percentage of patients monitored by unit type. The Supplementary Appendix shows the alarm parameter thresholds in use at the time of the study.
RESULTS
Averaged across study hospitals, one-quarter of the monitored beds were responsible for 71% of alarms in MSUs, 61% of alarms in NICUs, and 63% of alarms in PICUs.
DISCUSSION
Physiologic monitor alarm rates and the proportion of patients monitored varied widely between unit types and among the tertiary-care children’s hospitals in our study. We found that among MSUs, the hospital with the lowest proportion of beds monitored had the highest alarm rate, with over triple the rate seen at the hospital with the lowest alarm rate. Regardless of unit type, a small subgroup of patients at each hospital contributed a disproportionate share of alarms. These findings are concerning because of the patient morbidity and mortality associated with alarm fatigue1 and the studies suggesting that higher alarm rates may lead to delays in response to potentially critical alarms.2
We previously described alarm rates at a single children’s hospital and found that alarm rates were high both in and outside of the ICU areas.5 This study supports those findings and goes further to show that alarm rates on some MSUs approached rates seen in the ICU areas at other centers.4 However, our results should be considered in the context of several limitations. First, the 5 study hospitals utilized different bedside monitors, equipment, and software to collect alarm data. It is possible that this impacted how alarms were counted, though there were no technical specifications to suggest that results should have been biased in a specific way. Second, our data did not reflect alarm validity (ie, whether an alarm accurately reflected the physiologic state of the patient) or factors outside of the number of patients monitored—such as practices around ICU admission and transfer as well as monitor practices such as lead changes, the type of leads employed, and the degree to which alarm parameter thresholds could be customized, which may have also affected alarm rates. Finally, we excluded alarm types that were not consistently collected at all hospitals. We were also unable to capture alarms from other alarm-generating devices, including ventilators and infusion pumps, which have also been identified as sources of alarm-related safety issues in hospitals.9-11 This suggests that the alarm rates reported here underestimate the total number of audible alarms experienced by staff and by hospitalized patients and families.
While our data collection was limited in scope, the striking differences in alarm rates between hospitals and between similar units in the same hospitals suggest that unit- and hospital-level factors—including default alarm parameter threshold settings, types of monitors used, and monitoring practices such as the degree to which alarm parameters are customized to the patient’s physiologic state—likely contribute to the variability. It is also important to note that while there were clear outlier hospitals, no single hospital had the lowest alarm rate across all unit types. And while we found that a small number of patients contributed disproportionately to alarms, monitoring fewer patients overall was not consistently associated with lower alarm rates. While it is difficult to draw conclusions based on a limited study, these findings suggest that solutions to meaningfully lower alarm rates may be multifaceted. Standardization of care in multiple areas of medicine has shown the potential to decrease unnecessary utilization of testing and therapies while maintaining good patient outcomes.12-15 Our findings suggest that the concept of positive deviance,16 by which some organizations produce better outcomes than others despite similar limitations, may help identify successful alarm reduction strategies for further testing. Larger quantitative studies of alarm rates and ethnographic or qualitative studies of monitoring practices may reveal practices and policies that are associated with lower alarm rates with similar or improved monitoring outcomes.
CONCLUSION
We found wide variability in physiologic monitor alarm rates and the proportion of patients monitored across 5 children’s hospitals. Because alarm fatigue remains a pressing patient safety concern, further study of the features of high-performing (low-alarm) hospital systems may help identify barriers and facilitators of safe, effective monitoring and develop targeted interventions to reduce alarms.
ACKNOWLEDGEMENTS
The authors thank Melinda Egan, Matt MacMurchy, and Shannon Stemler for their assistance with data collection.
Disclosure
Dr. Bonafide is supported by the National Heart, Lung, and Blood Institute of the National Institutes of Health under Award Number K23HL116427. Dr. Brady is supported by the Agency for Healthcare Research and Quality under Award Number K08HS23827. The content is solely the responsibility of the authors and does not necessarily represent the official views of the National Institutes of Health or the Agency for Healthcare Research and Quality. There was no external funding obtained for this study. The authors have no conflicts of interest to disclose.
1. Sentinel Event Alert Issue 50: Medical device alarm safety in hospitals. The Joint Commission. April 8, 2013. www.jointcommission.org/sea_issue_50. Accessed December 16, 2017.
2. Bonafide CP, Lin R, Zander M, et al. Association between exposure to nonactionable physiologic monitor alarms and response time in a children’s hospital. J Hosp Med. 2015;10(6):345-351. PubMed
3. Voepel-Lewis T, Parker ML, Burke CN, et al. Pulse oximetry desaturation alarms on a general postoperative adult unit: A prospective observational study of nurse response time. Int J Nurs Stud. 2013;50(10):1351-1358. PubMed
4. Paine CW, Goel VV, Ely E, et al. Systematic review of physiologic monitor alarm characteristics and pragmatic interventions to reduce alarm frequency. J Hosp Med. 2016;11(2):136-144. PubMed
5. Schondelmeyer AC, Bonafide CP, Goel VV, et al. The frequency of physiologic monitor alarms in a children’s hospital. J Hosp Med. 2016;11(11):796-798. PubMed
6. Zingg W, Hopkins S, Gayet-Ageron A, et al. Health-care-associated infections in neonates, children, and adolescents: An analysis of paediatric data from the European Centre for Disease Prevention and Control point-prevalence survey. Lancet Infect Dis. 2017;17(4):381-389. PubMed
7. Fieldston E, Ragavan M, Jayaraman B, Metlay J, Pati S. Traditional measures of hospital utilization may not accurately reflect dynamic patient demand: Findings from a children’s hospital. Hosp Pediatr. 2012;2(1):10-18. PubMed
8. Cvach M, Kitchens M, Smith K, Harris P, Flack MN. Customizing alarm limits based on specific needs of patients. Biomed Instrum Technol. 2017;51(3):227-234. PubMed
9. Pham JC, Williams TL, Sparnon EM, Cillie TK, Scharen HF, Marella WM. Ventilator-related adverse events: A taxonomy and findings from 3 incident reporting systems. Respir Care. 2016;61(5):621-631. PubMed
10. Cho OM, Kim H, Lee YW, Cho I. Clinical alarms in intensive care units: Perceived obstacles of alarm management and alarm fatigue in nurses. Healthc Inform Res. 2016;22(1):46-53. PubMed
11. Edworthy J, Hellier E. Alarms and human behaviour: Implications for medical alarms. Br J Anaesth. 2006;97(1):12-17. PubMed
12. Fisher ES, Wennberg DE, Stukel TA, Gottlieb DJ, Lucas FL, Pinder EL. The implications of regional variations in medicare spending. Part 1: The content, quality, and accessibility of care. Ann Intern Med. 2003;138(4):273-287. PubMed
13. Fisher ES, Wennberg DE, Stukel TA, Gottlieb DJ, Lucas FL, Pinder EL. The implications of regional variations in medicare spending. Part 2: Health outcomes and satisfaction with care. Ann Intern Med. 2003;138(4):288-298. PubMed
14. Lion KC, Wright DR, Spencer S, Zhou C, Del Beccaro M, Mangione-Smith R. Standardized clinical pathways for hospitalized children and outcomes. Pediatrics. 2016;137(4) e20151202. PubMed
15. Goodman DC. Unwarranted variation in pediatric medical care. Pediatr Clin North Am. 2009;56(4):745-755. PubMed
16. Baxter R, Taylor N, Kellar I, Lawton R. What methods are used to apply positive deviance within healthcare organisations? A systematic review. BMJ Qual Saf. 2016;25(3):190-201. PubMed
© 2018 Society of Hospital Medicine
Data‐Driven Pediatric Alarm Limits
The management of alarms in the hospital setting is a significant patient safety issue. In 2013, the Joint Commission issued Sentinel Event Alert #50 to draw attention to the fact that tens of thousands of alarms occur daily throughout individual hospitals, and 85% to 99% are false or not clinically actionable.[1] These alarms, designed to be a safety net in patient care, have the unintended consequence of causing provider desensitization, also known as alarm fatigue, which contributes to adverse events as severe as patient mortality.[1, 2] For this reason, a 2014 Joint Commission National Patient Safety Goal urged hospitals to prioritize alarm system safety and to develop policies and procedures to manage alarms and alarm fatigue.[3]
Multiple efforts have been made to address alarm fatigue in hospitalized adults. Studies have quantified the frequency and types of medical device alarms,[4, 5, 6, 7, 8, 9] and some proposed solutions to decrease excess alarms.[10, 11, 12, 13, 14, 15] One such solution is to change alarm limit settings, an intervention shown to be efficacious in the literature.[5, 6, 16, 17] Although no adverse patient outcomes are reported in these studies, none of them included a formal safety evaluation to evaluate whether alarm rate reduction occurred at the expense of clinically significant alarms.
Specific to pediatrics, frameworks to address alarm fatigue have been proposed,[18] and the relationship between nurse response time and frequency of exposure to nonactionable alarms has been reported.[19] However, efforts to address alarm fatigue in the pediatric setting are less well studied overall, and there is little guidance regarding optimization of pediatric alarm parameters. Although multiple established reference ranges exist for pediatric vital signs,[20, 21, 22] a systematic review in 2011 found that only 2 of 5 published heart rate (HR) and 6 respiratory rate (RR) guidelines cited any references, and even these had weak underpinning evidence.[23] Consequently, ranges defining normal pediatric vital signs are derived either from small sample observational data in healthy outpatient children or consensus opinion. In a 2013 study by Bonafide et al.,[24] charted vital sign data from hospitalized children were used to develop percentile curves for HR and RR, and from these it was estimated that 54% of vital sign measurements in hospitalized children are out of range using currently accepted normal vital sign parameters.[24] Although these calculated vital sign parameters were not implemented clinically, they called into question reference ranges that are currently widely accepted and used as parameters for electronic health record (EHR) alerts, early warning scoring systems, and physiologic monitor alarms.
With the goal of safely decreasing the number of out‐of‐range vital sign measurements that result from current, often nonevidence‐based pediatric vital sign reference ranges, we used data from noncritically ill pediatric inpatients to derive HR and RR percentile charts for hospitalized children. In anticipation of local implementation of these data‐driven vital sign ranges as physiologic monitor parameters, we performed a retrospective safety analysis by evaluating the effect of data‐driven alarm limit modification on identification of cardiorespiratory arrests (CRA) and rapid response team (RRT) activations.
METHODS
We performed a cross‐sectional study of children less than 18 years of age hospitalized on general medical and surgical units at Lucile Packard Children's Hospital Stanford, a 311‐bed quaternary‐care academic hospital with a full complement of pediatric medical and surgical subspecialties and transplant programs. During the study period, the hospital used the Cerner EHR (Millennium; Cerner, Kansas City, MO) and Philips IntelliVue bedside monitors (Koninklijke Philips N.V., Amsterdam, the Netherlands). The Stanford University Institutional Review Board approved this study.
Establishing Data‐Driven HR and RR Parameters
Vital sign documentation in the EHR at our institution is performed primarily by nurses and facilitated by bedside monitor biomedical device integration. We extracted vital signs data from the institution's EHR for all general medical and surgical patients discharged between January 1, 2013 and May 3, 2014. To be most conservative in the definition of normal vital sign ranges for pediatric inpatients, we excluded critically ill children (those who spent any part of their hospitalization in an intensive care unit [ICU]). Physiologically implausible vital sign values were excluded as per the methods of Bonafide et al.[24] The data were separated into 2 different sets: a training set (patients discharged between January 1, 2013 and December 31, 2013) and a test set for validation (patients discharged between January 1, 2014 and May 3, 2014). To avoid oversampling from both particular time periods and individual patients in the training set, we randomly selected 1 HR and RR pair from each 4‐hour interval during a hospitalization, and then randomly sampled a maximum of 10 HR and RR pairs per patient. Using these vital sign measurements, we calculated age‐stratified 1st, 5th, 10th, 50th, 90th, 95th, and 99th percentiles for both HR and RR.
Based on a combination of expert opinion and local consensus from our Medical Executive and Patient Safety Committees, we selected the 5th and 95th percentile values as proposed data‐driven parameter limits and compared them to the 5th and 95th percentile values generated in the 2013 study[24] and to the 2004 National Institutes of Health (NIH)adapted vital sign reference ranges currently used at our hospital.[25] Using 1 randomly selected HR and RR pair from every 4‐hour interval in the validation set, we compared the proportion of out‐of‐range HR and RR observations with the proposed 5th and 95th percentile data‐driven parameters versus the current NIH reference ranges. We also calculated average differences between our data‐driven 5th and 95th percentile values and the calculated HR and RR values in the 2013 study.[24]
Safety Analysis
To assess the safety of the newly created 5th and 95th percentile HR and RR parameters prior to clinical adoption, we retrospectively reviewed data associated with all RRT and CRA events on the hospital's medical/surgical units from March 4, 2013 until March 3, 2014. The RRT/CRA event data were obtained from logs kept by the hospital's code committee. We excluded events that lacked a documented patient identifier, occurred in locations other than the acute medical/surgical units, or occurred in patients >18 years old. The resulting charts were manually reviewed to determine the date and time of RRT or CRA event activation. Because evidence exists that hospitalized pediatric patients with CRA show signs of vital sign decompensation as early as 12 hours prior to the event,[26, 27, 28, 29] we extracted all EHR‐charted HR and RR data in the 12 hours preceding RRT and CRA events from the institution's clinical data warehouse for analysis, excluding patients without charted vital sign data in this time period. The sets of patients with any out‐of‐range HR or RR measurements in the 12‐hours prior to an event were compared according to the current NIH reference ranges[25] versus data‐driven parameters. Additionally, manual chart review was performed to assess the reason for code or RRT activation, and to determine the role that out‐of‐range vital signs played in alerting clinical staff of patient decompensation.
Statistical Analysis
All analysis was performed using R statistical package software (version 0.98.1062 for Mac OS X 10_9_5; The R Foundation for Statistical Computing, Vienna, Austria) with an SQL database (MySQL 2015; Oracle Corp., Redwood City, CA).
RESULTS
Data‐Driven HR and RR Parameters
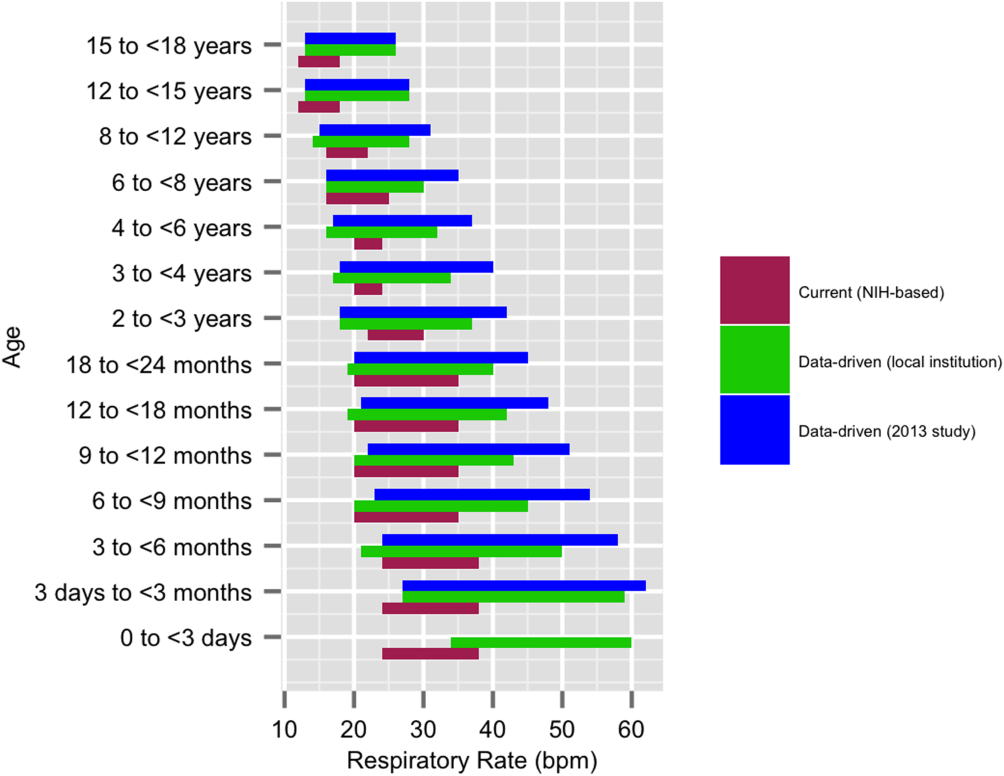
We established a training set of 62,508 vital sign measurements for 7202 unique patients to calculate 1st, 5th, 10th, 50th, 90th, 95th, and 99th percentiles for HR and RR among the 14 age groups (see Supporting Information, Appendix 1, in the online version of this article). Figures 1 and 2 compare the proposed data‐driven vital sign ranges with (1) our current HR and RR reference ranges and (2) the 5th and 95th percentile values created in the similar 2013 study.[24] The greatest difference between our study and the 2013 study was across data‐driven 95th percentile RR parameters, which were an average of 4.8 points lower in our study.

Our validation set consisted of 82,993 vital sign measurements for 2287 unique patients. Application of data‐driven HR and RR 5th and 95th percentile limits resulted in 24,045 (55.6%) fewer out‐of‐range measurements compared to current NIH reference ranges (19,240 vs 43,285). Forty‐five percent fewer HR values and 61% fewer RR values were considered out of range using the proposed data‐driven parameters (see Supporting Information, Appendix 2, in the online version of this article).
Safety
Of the 218 unique out‐of‐ICU RRT and CRA events logged from March 4, 2013 to March 3, 2014, 63 patients were excluded from analysis: 10 lacked identifying information, 33 occurred outside of medical/surgical units, and 20 occurred in patients >18 years of age. The remaining 155 patient charts were reviewed. Seven patients were subsequently excluded because they lacked EHR‐documented vital signs data in the 12 hours prior to RRT or CRA team activation, yielding a cohort of 148 patients (128 RRT events, 20 CRA events).
Table 1 describes the analysis of vital signs in the 12 hours leading up to the 148 RRT and CRA events. All 121 patients with out‐of‐range HR values using NIH reference ranges also had out‐of‐range HR values with the proposed data‐driven parameters; an additional 8 patients had low HR values using the data‐driven parameters. Of the 137 patients with an out‐of‐range RR value using NIH reference ranges, 33 (24.1%) were not considered out of range by the data‐driven parameters. Of these, 28 had high RR and 5 had low RR according to NIH reference ranges.
| No. Patients With HR Out of Range* | No. Patients With RR Out of Range* | No. Patients With HR or RR Out of Range* | |
|---|---|---|---|
| |||
| NIH ranges | 121 | 137 | 144 |
| Data‐driven ranges | 129 | 104 | 138 |
| Difference (causal threshold) | +8 (low HR) | 28 (high RR), 5 (low RR) | +2 (low HR), 8 (high RR) |
After evaluating out‐of‐range HR and RR individually, the 148 RRT and CRA events were analyzed for either out‐of‐range HR values or RR values. In doing so, 144 (97.3%) patients had either HR or RR measurements that were considered out of range using our current NIH reference ranges. One hundred thirty‐eight (93.2%) had either HR or RR measurements that were considered out of range with the proposed parameters. One hundred thirty‐six (94.4%) of the 144 patients with out‐of‐range HR or RR measurements according to NIH reference ranges were also considered out of range using proposed parameters. The data‐driven parameters identified 2 additional patients with low HR who did not have out‐of‐range HR or RR values using the current NIH reference ranges. Manual chart review of the RRT/CRA events in the 8 patients who had normal HR or RR using the data‐driven parameters revealed that RRT or CRA team interventions occurred for clinical indications that did not rely upon HR or RR measurement (eg, laboratory testing abnormalities, desaturation events) (Table 2).
| Indication for event | Patient Age |
|---|---|
| |
| 1. Desaturation and apnea | 10 months |
| 2. Hyperammonemia (abnormal lab result) | 5 years |
| 3. Acute hematemesis | 16 years |
| 4. Lightheadedness, feeling faint | 17 years |
| 5. Desaturation with significant oxygen requirement | 17 years |
| 6. Desaturation with significant oxygen requirement | 17 years |
| 7. Patient stated difficulty breathing | 18 years |
| 8. Difficulty breathing (anaphylactic shock)* | 18 years |
DISCUSSION
This is the first published study to analyze the safety of implementing data‐driven HR and RR parameters in hospitalized children. Based on retrospective analysis of a 12‐month cohort of patients requiring RRT or CRA team activation, our data‐driven HR and RR parameters were at least as safe as the NIH‐published reference ranges employed at our children's hospital. In addition to maintaining sensitivity to RRT and CRA events, the data‐driven parameters resulted in an estimated 55.6% fewer out‐of‐range measurements among medical/surgical pediatric inpatients.
Improper alarm settings are 1 of 4 major contributing factors to reported alarm‐related events,[1] and data‐driven HR and RR parameters provide a means by which to address the Joint Commission Sentinel Event Alert[1] and National Patient Safety Goal[3] regarding alarm management safety for hospitalized pediatric patients. Our results suggest that this evidence‐based approach may reduce the frequency of false alarms (thereby mitigating alarm fatigue), and should be studied prospectively for implementation in the clinical setting.
The selection of percentile values to define the new data‐driven parameter ranges involved various considerations. In an effort to minimize alarm fatigue, we considered using the 1st and 99th percentile values. However, our Medical Executive and Patient Safety Committees determined that the 99th percentile values for HR and RR for many of the age groups exceeded those that would raise clinical concern. A more conservative approach, applying the 5th and 95th percentile values, was deemed clinically appropriate and consistent with recommendations from the only other study to calculate data‐driven HR and RR parameters for hospitalized children.[24]
When taken in total, Bonafide et al.'s 2013 study demonstrated that up to 54% of vital sign values were abnormal according to textbook reference ranges.[24] Similarly, we estimated 55.6% fewer out‐of‐range HR and RR measurements with our data‐driven parameters. Although our 5th and 95th HR percentile and 5th percentile RR values are strikingly similar to those developed in the 2013 study,[24] the difference in 95th percentile RR values between the studies was potentially clinically significant, with our data‐driven upper RR values being 4.8 breaths per minute lower (more conservative) on average. Bonafide et al. transformed the RR values to fit a normal distribution, which might account for this difference. Ultimately, our safety analysis demonstrated that 24% fewer patients were considered out of range for high RR prior to RRT/CRA events with the data‐driven parameters compared to NIH norms. Even fewer RRT/CRA patients would have been considered out of range per Bonafide's less conservative 95% RR limits.
Importantly, all 8 patients in our safety analysis without abnormal vital sign measurements in the 12 hours preceding their clinical events according to the proposed data‐driven parameters (but identified as having high RR per current reference ranges) had RRT or CRA events triggered due to other significant clinical manifestations or vital sign abnormalities (eg, hypoxia). This finding is supported by the literature, which suggests that RRTs are rarely activated due to single vital sign abnormality alone. Prior analysis of RRT activations in our pediatric hospital demonstrated that only approximately 10% of RRTs were activated primarily on the basis of HR or RR vital sign abnormalities (5.6% tachycardia, 2.8% tachypnea, 1.4% bradycardia), whereas 36% were activated due to respiratory distress.[30] The clinical relevance of high RR in isolation is questionable given a recent pediatric study that raised all RR limits and decreased alarm frequency without adverse patient safety consequences.[31] Our results suggest that modifying HR and RR alarm parameters using data‐driven 5th and 95th percentile limits to decrease alarm frequency does not pose additional safety risk related to identification of RRT and CRA events. We encourage continued work toward development of multivariate or smart alarms that analyze multiple simultaneous vital sign measurements and trends to determine whether an alarm should be triggered.[32, 33]
The ability to demonstrate the safety of data‐driven HR and RR parameters is a precursor to hospital‐wide implementation. We believe it is crucial to perform a safety analysis prior to implementation due to the role vital signs play in clinical assessment and detection of patient deterioration.[30, 34, 35, 36, 37] Though a few studies have shown that modification of alarm parameters decreases alarm frequency,[5, 6, 10, 16, 17] to our knowledge no formal safety evaluations have ever been published. This study provides the first published safety evaluation of data‐driven HR and RR parameters.
By decreasing the quantity of out‐of‐range vital sign values while preserving the ability to detect patient deterioration, data‐driven vital sign alarm limits have the potential to decrease false monitor alarms, alarm‐generated noise, and alarm fatigue. Future work includes prospectively studying the impact of adoption of data‐driven vital sign parameters on monitor alarm burden and monitoring the safety of the changes. Additional safety analysis could include comparing the sensitivity and specificity of early warning score systems when data‐driven vital sign ranges are substituted for traditional physiologic parameters. Further personalization of vital sign parameters will involve incorporating patient‐specific characteristics (eg, demographics, diagnoses) into the data‐driven analysis to further decrease alarm burden while enhancing patient safety. Ultimately, using a patient's own physiologic data to define highly personalized vital sign parameter limits represents a truly precision approach, and could revolutionize the way hospitalized patients are monitored.
Numerous relevant issues are not yet addressed in this initial, single‐institution study. First, although the biomedical device integration facilitated the direct import of monitor data into the EHR (decreasing transcription errors), our analysis was performed using EHR‐charted data. As such, the effect on bedside monitor alarms was not directly evaluated in our study, including those due to technical alarms or patient artifact. Second, our overall sample size for the training set was quite large; however, in some cases the number of patients per age category was limited. Third, although we evaluated the identification of severe deterioration leading to RRT or CRA events, the sensitivity of the new limits to the need for other interventions (eg, fluid bolus for dehydration or escalation of respiratory support for asthma exacerbation) or unplanned transfers to the ICU was not assessed. Fourth, the analysis was retrospective, and so the impact of data‐driven alarm limits on length of stay and readmission could not be defined. Fifth, excluding all vital sign measurements from patients who spent any time in the ICU setting decreased the amount of data available for analysis. However, excluding sicker patients probably resulted in narrower data‐driven HR and RR ranges, leading to more conservative proposed parameters that are more likely to identify patient decompensation in our safety analysis. Finally, this was a single‐site study. We believe our data‐driven limits are applicable to other tertiary or quaternary care facilities given the similarity to those generated in a study performed in a comparable setting,[24] but generalizability to other settings may be limited if the local population is sufficiently different. Furthermore, because institutional policies (eg, indications for care escalation) differ, individual institutions should determine whether our analysis is applicable to their setting or if local safety evaluation is necessary.
CONCLUSION
A large proportion of HR and RR values for hospitalized children at our institution are out of range according to current vital sign reference ranges. Our new data‐driven alarm parameters for hospitalized children provide a potentially safe means by which to modify physiologic bedside monitor alarm limits, a first step toward customization of alarm limit settings in an effort to mitigate alarm fatigue.
Acknowledgements
The authors thank Debby Huang and Joshua Glandorf in the Information Services Department at Stanford Children's Health for assistance with data acquisition. No compensation was received for their contributions.
Disclosures: All authors gave approval of the final manuscript version submitted for publication and agreed to be accountable for all aspects of the work. Dr. Veena V. Goel conceptualized and designed the study; collected, managed, analyzed and interpreted the data; prepared and reviewed the initial manuscript; and approved the final manuscript as submitted. Ms. Sarah F. Poole contributed to the design of the study and performed the primary data analysis for the study. Ms. Poole critically revised the manuscript for important intellectual content and approved the final manuscript as submitted. Dr. Goel and Ms. Poole had full access to all of the data in the study and take responsibility for the integrity of the data and the accuracy of the data analysis. Dr. Paul J. Sharek and Dr. Jonathan P. Palma contributed to the study design and data interpretation. Drs. Sharek and Palma critically revised the manuscript for important intellectual content and approved the final manuscript as submitted. Dr. Terry S. Platchek, Dr. Natalie M. Pageler, and Dr. Christopher A. Longhurst contributed to the study design. Drs. Platchek, Pageler, and Longhurst critically revised the manuscript for important intellectual content and approved the final manuscript as submitted. Ms. Poole is supported by the Stanford Biosciences Graduate Program through a Fulbright New Zealand Science and Innovation Graduate Award and through the J.R. Templin Trust Scholarship. The authors report no conflicts of interest.
- The Joint Commission. Medical device alarm safety in hospitals. Sentinel Event Alert. 2013;(50):1–3. Available at: https://www.jointcommission.org/sea_issue_50/. Accessed October 12, 2013.
- . “Alarm fatigue” a factor in 2d death: UMass hospital cited for violations. The Boston Globe. September 21, 2011. Available at: https://www.bostonglobe.com/2011/09/20/umass/qSOhm8dYmmaq4uTHZb7FNM/story.html. Accessed December 19, 2014
- The Joint Commission. Alarm system safety. Available at: https://www.jointcommission.org/assets/1/18/R3_Report_Issue_5_12_2_13_Final.pdf. Published December 11, 2013. Accessed October 12, 2013.
- , , , , . ALARMED: adverse events in low‐risk patients with chest pain receiving continuous electrocardiographic monitoring in the emergency department. A pilot study. Am J Emerg Med. 2006;24(1):62–67.
- , . Monitor alarm fatigue: standardizing use of physiological monitors and decreasing nuisance alarms. Am J Crit Care. 2010;19(1):28–34; quiz 35.
- , , . Physiologic monitoring alarm load on medical/surgical floors of a community hospital. Biomed Instrum Technol. 2011;(suppl):29–36.
- , , , , , . Multicentric study of monitoring alarms in the adult intensive care unit (ICU): a descriptive analysis. Intensive Care Med. 1999;25(12):1360–1366.
- . Crying wolf: false alarms in a pediatric intensive care unit. Crit Care Med. 1994;22(6):981–985.
- , , , et al. Cardiopulmonary monitors and clinically significant events in critically ill children. Biomed Instrum Technol. 2011;(suppl):38–45.
- , , , et al. Systematic review of physiologic monitor alarm characteristics and pragmatic interventions to reduce alarm frequency. J Hosp Med. 2016;11(2):136–144.
- . Alarm fatigue. Nurs Clin North Am. 2012;47(3):375–382.
- . Monitor alarm fatigue: an integrative review. Biomed Instrum Technol. 2012;46(4):268–277.
- , , , . Use of pagers with an alarm escalation system to reduce cardiac monitor alarm signals. J Nurs Care Qual. 2014;29(1):9–18.
- . An evidence‐based approach to reduce nuisance alarms and alarm fatigue. Biomed Instrum Technol. 2011;(suppl):46–52.
- , , , et al. Insights into the problem of alarm fatigue with physiologic monitor devices: a comprehensive observational study of consecutive intensive care unit patients. PLoS One. 2014;9(10):e110274.
- , , , , , . Effect of altering alarm settings: a randomized controlled study. Biomed Instrum Technol. 2015;49(3):214–222.
- , , , , . Alarm limit settings for early warning systems to identify at‐risk patients. J Adv Nurs. 2009;65(9):1844–1852.
- , . A framework for reducing alarm fatigue on pediatric inpatient units. Hosp Pediatr. 2015;5(3):160–163.
- , , , et al. Association between exposure to nonactionable physiologic monitor alarms and response time in a children's hospital. J Hosp Med. 2015;10(6):345–351.
- The Johns Hopkins Hospital, , . The Harriet Lane Handbook. 20th ed. Philadelphia, PA: Elsevier Saunders; 2014.
- , . Nelson Textbook of Pediatrics. 19th ed. Philadelphia, PA.: Elsevier Saunders; 2011.
- , , , . Pediatric assessment. In: Pediatric Advanced Life Support: Provider Manual. Dallas, TX: American Heart Association; 2006:9–16.
- , , , et al. Normal ranges of heart rate and respiratory rate in children from birth to 18 years of age: a systematic review of observational studies. Lancet. 2011;377(9770):1011–1018.
- , , , , , . Development of heart and respiratory rate percentile curves for hospitalized children. Pediatrics. 2013;131(4):e1150–e1157.
- National Institutes of Health. Age‐appropriate vital signs. Available at: https://web.archive.org/web/20041101222327/http://www.cc.nih.gov/ccc/pedweb/pedsstaff/age.html. Accessed July 26, 2015.
- Guidelines 2000 for cardiopulmonary resuscitation and emergency cardiovascular care. Part 9: pediatric basic life support. The American Heart Association in collaboration with the International Liaison Committee on Resuscitation. Circulation. 2000;102(8 suppl):I253–I290.
- , , , , , . Recognising clinical instability in hospital patients before cardiac arrest or unplanned admission to intensive care. A pilot study in a tertiary‐care hospital. Med J Aust. 1999;171(1):22–25.
- , , , et al. Duration of life‐threatening antecedents prior to intensive care admission. Intensive Care Med. 2002;28(11):1629–1634.
- , . Pediatric cardiopulmonary resuscitation: a collective review. Ann Emerg Med. 1999;33(2):195–205.
- , , , et al. Effect of a rapid response team on hospital‐wide mortality and code rates outside the ICU in a Children's Hospital. JAMA. 2007;298(19):2267–2274.
- , , , et al. A team‐based approach to reducing cardiac monitor alarms. Pediatrics. 2014;134(6):e1686–e1694.
- , , , et al. Collection of annotated data in a clinical validation study for alarm algorithms in intensive care—a methodologic framework. J Crit Care. 2010;25(1):128–135.
- , , . Making ICU alarms meaningful: a comparison of traditional vs. trend‐based algorithms. Proc AMIA Symp. 1999:379–383.
- , , , et al. Implementation of a medical emergency team in a large pediatric teaching hospital prevents respiratory and cardiopulmonary arrests outside the intensive care unit. Pediatr Crit Care Med. 2007;8(3):236–246; quiz 247.
- . Centile‐based Early Warning Scores derived from statistical distributions of vital signs. Resuscitation. 2011;82(8):969–970.
- , , , , , . Centile‐based early warning scores derived from statistical distributions of vital signs. Resuscitation. 2011;82(8):1013–1018.
- , , , , . Reduction of paediatric in‐patient cardiac arrest and death with a medical emergency team: preliminary results. Arch Dis Child. 2005;90(11):1148–1152.
The management of alarms in the hospital setting is a significant patient safety issue. In 2013, the Joint Commission issued Sentinel Event Alert #50 to draw attention to the fact that tens of thousands of alarms occur daily throughout individual hospitals, and 85% to 99% are false or not clinically actionable.[1] These alarms, designed to be a safety net in patient care, have the unintended consequence of causing provider desensitization, also known as alarm fatigue, which contributes to adverse events as severe as patient mortality.[1, 2] For this reason, a 2014 Joint Commission National Patient Safety Goal urged hospitals to prioritize alarm system safety and to develop policies and procedures to manage alarms and alarm fatigue.[3]
Multiple efforts have been made to address alarm fatigue in hospitalized adults. Studies have quantified the frequency and types of medical device alarms,[4, 5, 6, 7, 8, 9] and some proposed solutions to decrease excess alarms.[10, 11, 12, 13, 14, 15] One such solution is to change alarm limit settings, an intervention shown to be efficacious in the literature.[5, 6, 16, 17] Although no adverse patient outcomes are reported in these studies, none of them included a formal safety evaluation to evaluate whether alarm rate reduction occurred at the expense of clinically significant alarms.
Specific to pediatrics, frameworks to address alarm fatigue have been proposed,[18] and the relationship between nurse response time and frequency of exposure to nonactionable alarms has been reported.[19] However, efforts to address alarm fatigue in the pediatric setting are less well studied overall, and there is little guidance regarding optimization of pediatric alarm parameters. Although multiple established reference ranges exist for pediatric vital signs,[20, 21, 22] a systematic review in 2011 found that only 2 of 5 published heart rate (HR) and 6 respiratory rate (RR) guidelines cited any references, and even these had weak underpinning evidence.[23] Consequently, ranges defining normal pediatric vital signs are derived either from small sample observational data in healthy outpatient children or consensus opinion. In a 2013 study by Bonafide et al.,[24] charted vital sign data from hospitalized children were used to develop percentile curves for HR and RR, and from these it was estimated that 54% of vital sign measurements in hospitalized children are out of range using currently accepted normal vital sign parameters.[24] Although these calculated vital sign parameters were not implemented clinically, they called into question reference ranges that are currently widely accepted and used as parameters for electronic health record (EHR) alerts, early warning scoring systems, and physiologic monitor alarms.
With the goal of safely decreasing the number of out‐of‐range vital sign measurements that result from current, often nonevidence‐based pediatric vital sign reference ranges, we used data from noncritically ill pediatric inpatients to derive HR and RR percentile charts for hospitalized children. In anticipation of local implementation of these data‐driven vital sign ranges as physiologic monitor parameters, we performed a retrospective safety analysis by evaluating the effect of data‐driven alarm limit modification on identification of cardiorespiratory arrests (CRA) and rapid response team (RRT) activations.
METHODS
We performed a cross‐sectional study of children less than 18 years of age hospitalized on general medical and surgical units at Lucile Packard Children's Hospital Stanford, a 311‐bed quaternary‐care academic hospital with a full complement of pediatric medical and surgical subspecialties and transplant programs. During the study period, the hospital used the Cerner EHR (Millennium; Cerner, Kansas City, MO) and Philips IntelliVue bedside monitors (Koninklijke Philips N.V., Amsterdam, the Netherlands). The Stanford University Institutional Review Board approved this study.
Establishing Data‐Driven HR and RR Parameters
Vital sign documentation in the EHR at our institution is performed primarily by nurses and facilitated by bedside monitor biomedical device integration. We extracted vital signs data from the institution's EHR for all general medical and surgical patients discharged between January 1, 2013 and May 3, 2014. To be most conservative in the definition of normal vital sign ranges for pediatric inpatients, we excluded critically ill children (those who spent any part of their hospitalization in an intensive care unit [ICU]). Physiologically implausible vital sign values were excluded as per the methods of Bonafide et al.[24] The data were separated into 2 different sets: a training set (patients discharged between January 1, 2013 and December 31, 2013) and a test set for validation (patients discharged between January 1, 2014 and May 3, 2014). To avoid oversampling from both particular time periods and individual patients in the training set, we randomly selected 1 HR and RR pair from each 4‐hour interval during a hospitalization, and then randomly sampled a maximum of 10 HR and RR pairs per patient. Using these vital sign measurements, we calculated age‐stratified 1st, 5th, 10th, 50th, 90th, 95th, and 99th percentiles for both HR and RR.
Based on a combination of expert opinion and local consensus from our Medical Executive and Patient Safety Committees, we selected the 5th and 95th percentile values as proposed data‐driven parameter limits and compared them to the 5th and 95th percentile values generated in the 2013 study[24] and to the 2004 National Institutes of Health (NIH)adapted vital sign reference ranges currently used at our hospital.[25] Using 1 randomly selected HR and RR pair from every 4‐hour interval in the validation set, we compared the proportion of out‐of‐range HR and RR observations with the proposed 5th and 95th percentile data‐driven parameters versus the current NIH reference ranges. We also calculated average differences between our data‐driven 5th and 95th percentile values and the calculated HR and RR values in the 2013 study.[24]
Safety Analysis
To assess the safety of the newly created 5th and 95th percentile HR and RR parameters prior to clinical adoption, we retrospectively reviewed data associated with all RRT and CRA events on the hospital's medical/surgical units from March 4, 2013 until March 3, 2014. The RRT/CRA event data were obtained from logs kept by the hospital's code committee. We excluded events that lacked a documented patient identifier, occurred in locations other than the acute medical/surgical units, or occurred in patients >18 years old. The resulting charts were manually reviewed to determine the date and time of RRT or CRA event activation. Because evidence exists that hospitalized pediatric patients with CRA show signs of vital sign decompensation as early as 12 hours prior to the event,[26, 27, 28, 29] we extracted all EHR‐charted HR and RR data in the 12 hours preceding RRT and CRA events from the institution's clinical data warehouse for analysis, excluding patients without charted vital sign data in this time period. The sets of patients with any out‐of‐range HR or RR measurements in the 12‐hours prior to an event were compared according to the current NIH reference ranges[25] versus data‐driven parameters. Additionally, manual chart review was performed to assess the reason for code or RRT activation, and to determine the role that out‐of‐range vital signs played in alerting clinical staff of patient decompensation.
Statistical Analysis
All analysis was performed using R statistical package software (version 0.98.1062 for Mac OS X 10_9_5; The R Foundation for Statistical Computing, Vienna, Austria) with an SQL database (MySQL 2015; Oracle Corp., Redwood City, CA).
RESULTS
Data‐Driven HR and RR Parameters
We established a training set of 62,508 vital sign measurements for 7202 unique patients to calculate 1st, 5th, 10th, 50th, 90th, 95th, and 99th percentiles for HR and RR among the 14 age groups (see Supporting Information, Appendix 1, in the online version of this article). Figures 1 and 2 compare the proposed data‐driven vital sign ranges with (1) our current HR and RR reference ranges and (2) the 5th and 95th percentile values created in the similar 2013 study.[24] The greatest difference between our study and the 2013 study was across data‐driven 95th percentile RR parameters, which were an average of 4.8 points lower in our study.
Our validation set consisted of 82,993 vital sign measurements for 2287 unique patients. Application of data‐driven HR and RR 5th and 95th percentile limits resulted in 24,045 (55.6%) fewer out‐of‐range measurements compared to current NIH reference ranges (19,240 vs 43,285). Forty‐five percent fewer HR values and 61% fewer RR values were considered out of range using the proposed data‐driven parameters (see Supporting Information, Appendix 2, in the online version of this article).
Safety
Of the 218 unique out‐of‐ICU RRT and CRA events logged from March 4, 2013 to March 3, 2014, 63 patients were excluded from analysis: 10 lacked identifying information, 33 occurred outside of medical/surgical units, and 20 occurred in patients >18 years of age. The remaining 155 patient charts were reviewed. Seven patients were subsequently excluded because they lacked EHR‐documented vital signs data in the 12 hours prior to RRT or CRA team activation, yielding a cohort of 148 patients (128 RRT events, 20 CRA events).
Table 1 describes the analysis of vital signs in the 12 hours leading up to the 148 RRT and CRA events. All 121 patients with out‐of‐range HR values using NIH reference ranges also had out‐of‐range HR values with the proposed data‐driven parameters; an additional 8 patients had low HR values using the data‐driven parameters. Of the 137 patients with an out‐of‐range RR value using NIH reference ranges, 33 (24.1%) were not considered out of range by the data‐driven parameters. Of these, 28 had high RR and 5 had low RR according to NIH reference ranges.
| No. Patients With HR Out of Range* | No. Patients With RR Out of Range* | No. Patients With HR or RR Out of Range* | |
|---|---|---|---|
| |||
| NIH ranges | 121 | 137 | 144 |
| Data‐driven ranges | 129 | 104 | 138 |
| Difference (causal threshold) | +8 (low HR) | 28 (high RR), 5 (low RR) | +2 (low HR), 8 (high RR) |
After evaluating out‐of‐range HR and RR individually, the 148 RRT and CRA events were analyzed for either out‐of‐range HR values or RR values. In doing so, 144 (97.3%) patients had either HR or RR measurements that were considered out of range using our current NIH reference ranges. One hundred thirty‐eight (93.2%) had either HR or RR measurements that were considered out of range with the proposed parameters. One hundred thirty‐six (94.4%) of the 144 patients with out‐of‐range HR or RR measurements according to NIH reference ranges were also considered out of range using proposed parameters. The data‐driven parameters identified 2 additional patients with low HR who did not have out‐of‐range HR or RR values using the current NIH reference ranges. Manual chart review of the RRT/CRA events in the 8 patients who had normal HR or RR using the data‐driven parameters revealed that RRT or CRA team interventions occurred for clinical indications that did not rely upon HR or RR measurement (eg, laboratory testing abnormalities, desaturation events) (Table 2).
| Indication for event | Patient Age |
|---|---|
| |
| 1. Desaturation and apnea | 10 months |
| 2. Hyperammonemia (abnormal lab result) | 5 years |
| 3. Acute hematemesis | 16 years |
| 4. Lightheadedness, feeling faint | 17 years |
| 5. Desaturation with significant oxygen requirement | 17 years |
| 6. Desaturation with significant oxygen requirement | 17 years |
| 7. Patient stated difficulty breathing | 18 years |
| 8. Difficulty breathing (anaphylactic shock)* | 18 years |
DISCUSSION
This is the first published study to analyze the safety of implementing data‐driven HR and RR parameters in hospitalized children. Based on retrospective analysis of a 12‐month cohort of patients requiring RRT or CRA team activation, our data‐driven HR and RR parameters were at least as safe as the NIH‐published reference ranges employed at our children's hospital. In addition to maintaining sensitivity to RRT and CRA events, the data‐driven parameters resulted in an estimated 55.6% fewer out‐of‐range measurements among medical/surgical pediatric inpatients.
Improper alarm settings are 1 of 4 major contributing factors to reported alarm‐related events,[1] and data‐driven HR and RR parameters provide a means by which to address the Joint Commission Sentinel Event Alert[1] and National Patient Safety Goal[3] regarding alarm management safety for hospitalized pediatric patients. Our results suggest that this evidence‐based approach may reduce the frequency of false alarms (thereby mitigating alarm fatigue), and should be studied prospectively for implementation in the clinical setting.
The selection of percentile values to define the new data‐driven parameter ranges involved various considerations. In an effort to minimize alarm fatigue, we considered using the 1st and 99th percentile values. However, our Medical Executive and Patient Safety Committees determined that the 99th percentile values for HR and RR for many of the age groups exceeded those that would raise clinical concern. A more conservative approach, applying the 5th and 95th percentile values, was deemed clinically appropriate and consistent with recommendations from the only other study to calculate data‐driven HR and RR parameters for hospitalized children.[24]
When taken in total, Bonafide et al.'s 2013 study demonstrated that up to 54% of vital sign values were abnormal according to textbook reference ranges.[24] Similarly, we estimated 55.6% fewer out‐of‐range HR and RR measurements with our data‐driven parameters. Although our 5th and 95th HR percentile and 5th percentile RR values are strikingly similar to those developed in the 2013 study,[24] the difference in 95th percentile RR values between the studies was potentially clinically significant, with our data‐driven upper RR values being 4.8 breaths per minute lower (more conservative) on average. Bonafide et al. transformed the RR values to fit a normal distribution, which might account for this difference. Ultimately, our safety analysis demonstrated that 24% fewer patients were considered out of range for high RR prior to RRT/CRA events with the data‐driven parameters compared to NIH norms. Even fewer RRT/CRA patients would have been considered out of range per Bonafide's less conservative 95% RR limits.
Importantly, all 8 patients in our safety analysis without abnormal vital sign measurements in the 12 hours preceding their clinical events according to the proposed data‐driven parameters (but identified as having high RR per current reference ranges) had RRT or CRA events triggered due to other significant clinical manifestations or vital sign abnormalities (eg, hypoxia). This finding is supported by the literature, which suggests that RRTs are rarely activated due to single vital sign abnormality alone. Prior analysis of RRT activations in our pediatric hospital demonstrated that only approximately 10% of RRTs were activated primarily on the basis of HR or RR vital sign abnormalities (5.6% tachycardia, 2.8% tachypnea, 1.4% bradycardia), whereas 36% were activated due to respiratory distress.[30] The clinical relevance of high RR in isolation is questionable given a recent pediatric study that raised all RR limits and decreased alarm frequency without adverse patient safety consequences.[31] Our results suggest that modifying HR and RR alarm parameters using data‐driven 5th and 95th percentile limits to decrease alarm frequency does not pose additional safety risk related to identification of RRT and CRA events. We encourage continued work toward development of multivariate or smart alarms that analyze multiple simultaneous vital sign measurements and trends to determine whether an alarm should be triggered.[32, 33]
The ability to demonstrate the safety of data‐driven HR and RR parameters is a precursor to hospital‐wide implementation. We believe it is crucial to perform a safety analysis prior to implementation due to the role vital signs play in clinical assessment and detection of patient deterioration.[30, 34, 35, 36, 37] Though a few studies have shown that modification of alarm parameters decreases alarm frequency,[5, 6, 10, 16, 17] to our knowledge no formal safety evaluations have ever been published. This study provides the first published safety evaluation of data‐driven HR and RR parameters.
By decreasing the quantity of out‐of‐range vital sign values while preserving the ability to detect patient deterioration, data‐driven vital sign alarm limits have the potential to decrease false monitor alarms, alarm‐generated noise, and alarm fatigue. Future work includes prospectively studying the impact of adoption of data‐driven vital sign parameters on monitor alarm burden and monitoring the safety of the changes. Additional safety analysis could include comparing the sensitivity and specificity of early warning score systems when data‐driven vital sign ranges are substituted for traditional physiologic parameters. Further personalization of vital sign parameters will involve incorporating patient‐specific characteristics (eg, demographics, diagnoses) into the data‐driven analysis to further decrease alarm burden while enhancing patient safety. Ultimately, using a patient's own physiologic data to define highly personalized vital sign parameter limits represents a truly precision approach, and could revolutionize the way hospitalized patients are monitored.
Numerous relevant issues are not yet addressed in this initial, single‐institution study. First, although the biomedical device integration facilitated the direct import of monitor data into the EHR (decreasing transcription errors), our analysis was performed using EHR‐charted data. As such, the effect on bedside monitor alarms was not directly evaluated in our study, including those due to technical alarms or patient artifact. Second, our overall sample size for the training set was quite large; however, in some cases the number of patients per age category was limited. Third, although we evaluated the identification of severe deterioration leading to RRT or CRA events, the sensitivity of the new limits to the need for other interventions (eg, fluid bolus for dehydration or escalation of respiratory support for asthma exacerbation) or unplanned transfers to the ICU was not assessed. Fourth, the analysis was retrospective, and so the impact of data‐driven alarm limits on length of stay and readmission could not be defined. Fifth, excluding all vital sign measurements from patients who spent any time in the ICU setting decreased the amount of data available for analysis. However, excluding sicker patients probably resulted in narrower data‐driven HR and RR ranges, leading to more conservative proposed parameters that are more likely to identify patient decompensation in our safety analysis. Finally, this was a single‐site study. We believe our data‐driven limits are applicable to other tertiary or quaternary care facilities given the similarity to those generated in a study performed in a comparable setting,[24] but generalizability to other settings may be limited if the local population is sufficiently different. Furthermore, because institutional policies (eg, indications for care escalation) differ, individual institutions should determine whether our analysis is applicable to their setting or if local safety evaluation is necessary.
CONCLUSION
A large proportion of HR and RR values for hospitalized children at our institution are out of range according to current vital sign reference ranges. Our new data‐driven alarm parameters for hospitalized children provide a potentially safe means by which to modify physiologic bedside monitor alarm limits, a first step toward customization of alarm limit settings in an effort to mitigate alarm fatigue.
Acknowledgements
The authors thank Debby Huang and Joshua Glandorf in the Information Services Department at Stanford Children's Health for assistance with data acquisition. No compensation was received for their contributions.
Disclosures: All authors gave approval of the final manuscript version submitted for publication and agreed to be accountable for all aspects of the work. Dr. Veena V. Goel conceptualized and designed the study; collected, managed, analyzed and interpreted the data; prepared and reviewed the initial manuscript; and approved the final manuscript as submitted. Ms. Sarah F. Poole contributed to the design of the study and performed the primary data analysis for the study. Ms. Poole critically revised the manuscript for important intellectual content and approved the final manuscript as submitted. Dr. Goel and Ms. Poole had full access to all of the data in the study and take responsibility for the integrity of the data and the accuracy of the data analysis. Dr. Paul J. Sharek and Dr. Jonathan P. Palma contributed to the study design and data interpretation. Drs. Sharek and Palma critically revised the manuscript for important intellectual content and approved the final manuscript as submitted. Dr. Terry S. Platchek, Dr. Natalie M. Pageler, and Dr. Christopher A. Longhurst contributed to the study design. Drs. Platchek, Pageler, and Longhurst critically revised the manuscript for important intellectual content and approved the final manuscript as submitted. Ms. Poole is supported by the Stanford Biosciences Graduate Program through a Fulbright New Zealand Science and Innovation Graduate Award and through the J.R. Templin Trust Scholarship. The authors report no conflicts of interest.
- The Joint Commission. Medical device alarm safety in hospitals. Sentinel Event Alert. 2013;(50):1–3. Available at: https://www.jointcommission.org/sea_issue_50/. Accessed October 12, 2013.
- . “Alarm fatigue” a factor in 2d death: UMass hospital cited for violations. The Boston Globe. September 21, 2011. Available at: https://www.bostonglobe.com/2011/09/20/umass/qSOhm8dYmmaq4uTHZb7FNM/story.html. Accessed December 19, 2014
- The Joint Commission. Alarm system safety. Available at: https://www.jointcommission.org/assets/1/18/R3_Report_Issue_5_12_2_13_Final.pdf. Published December 11, 2013. Accessed October 12, 2013.
- , , , , . ALARMED: adverse events in low‐risk patients with chest pain receiving continuous electrocardiographic monitoring in the emergency department. A pilot study. Am J Emerg Med. 2006;24(1):62–67.
- , . Monitor alarm fatigue: standardizing use of physiological monitors and decreasing nuisance alarms. Am J Crit Care. 2010;19(1):28–34; quiz 35.
- , , . Physiologic monitoring alarm load on medical/surgical floors of a community hospital. Biomed Instrum Technol. 2011;(suppl):29–36.
- , , , , , . Multicentric study of monitoring alarms in the adult intensive care unit (ICU): a descriptive analysis. Intensive Care Med. 1999;25(12):1360–1366.
- . Crying wolf: false alarms in a pediatric intensive care unit. Crit Care Med. 1994;22(6):981–985.
- , , , et al. Cardiopulmonary monitors and clinically significant events in critically ill children. Biomed Instrum Technol. 2011;(suppl):38–45.
- , , , et al. Systematic review of physiologic monitor alarm characteristics and pragmatic interventions to reduce alarm frequency. J Hosp Med. 2016;11(2):136–144.
- . Alarm fatigue. Nurs Clin North Am. 2012;47(3):375–382.
- . Monitor alarm fatigue: an integrative review. Biomed Instrum Technol. 2012;46(4):268–277.
- , , , . Use of pagers with an alarm escalation system to reduce cardiac monitor alarm signals. J Nurs Care Qual. 2014;29(1):9–18.
- . An evidence‐based approach to reduce nuisance alarms and alarm fatigue. Biomed Instrum Technol. 2011;(suppl):46–52.
- , , , et al. Insights into the problem of alarm fatigue with physiologic monitor devices: a comprehensive observational study of consecutive intensive care unit patients. PLoS One. 2014;9(10):e110274.
- , , , , , . Effect of altering alarm settings: a randomized controlled study. Biomed Instrum Technol. 2015;49(3):214–222.
- , , , , . Alarm limit settings for early warning systems to identify at‐risk patients. J Adv Nurs. 2009;65(9):1844–1852.
- , . A framework for reducing alarm fatigue on pediatric inpatient units. Hosp Pediatr. 2015;5(3):160–163.
- , , , et al. Association between exposure to nonactionable physiologic monitor alarms and response time in a children's hospital. J Hosp Med. 2015;10(6):345–351.
- The Johns Hopkins Hospital, , . The Harriet Lane Handbook. 20th ed. Philadelphia, PA: Elsevier Saunders; 2014.
- , . Nelson Textbook of Pediatrics. 19th ed. Philadelphia, PA.: Elsevier Saunders; 2011.
- , , , . Pediatric assessment. In: Pediatric Advanced Life Support: Provider Manual. Dallas, TX: American Heart Association; 2006:9–16.
- , , , et al. Normal ranges of heart rate and respiratory rate in children from birth to 18 years of age: a systematic review of observational studies. Lancet. 2011;377(9770):1011–1018.
- , , , , , . Development of heart and respiratory rate percentile curves for hospitalized children. Pediatrics. 2013;131(4):e1150–e1157.
- National Institutes of Health. Age‐appropriate vital signs. Available at: https://web.archive.org/web/20041101222327/http://www.cc.nih.gov/ccc/pedweb/pedsstaff/age.html. Accessed July 26, 2015.
- Guidelines 2000 for cardiopulmonary resuscitation and emergency cardiovascular care. Part 9: pediatric basic life support. The American Heart Association in collaboration with the International Liaison Committee on Resuscitation. Circulation. 2000;102(8 suppl):I253–I290.
- , , , , , . Recognising clinical instability in hospital patients before cardiac arrest or unplanned admission to intensive care. A pilot study in a tertiary‐care hospital. Med J Aust. 1999;171(1):22–25.
- , , , et al. Duration of life‐threatening antecedents prior to intensive care admission. Intensive Care Med. 2002;28(11):1629–1634.
- , . Pediatric cardiopulmonary resuscitation: a collective review. Ann Emerg Med. 1999;33(2):195–205.
- , , , et al. Effect of a rapid response team on hospital‐wide mortality and code rates outside the ICU in a Children's Hospital. JAMA. 2007;298(19):2267–2274.
- , , , et al. A team‐based approach to reducing cardiac monitor alarms. Pediatrics. 2014;134(6):e1686–e1694.
- , , , et al. Collection of annotated data in a clinical validation study for alarm algorithms in intensive care—a methodologic framework. J Crit Care. 2010;25(1):128–135.
- , , . Making ICU alarms meaningful: a comparison of traditional vs. trend‐based algorithms. Proc AMIA Symp. 1999:379–383.
- , , , et al. Implementation of a medical emergency team in a large pediatric teaching hospital prevents respiratory and cardiopulmonary arrests outside the intensive care unit. Pediatr Crit Care Med. 2007;8(3):236–246; quiz 247.
- . Centile‐based Early Warning Scores derived from statistical distributions of vital signs. Resuscitation. 2011;82(8):969–970.
- , , , , , . Centile‐based early warning scores derived from statistical distributions of vital signs. Resuscitation. 2011;82(8):1013–1018.
- , , , , . Reduction of paediatric in‐patient cardiac arrest and death with a medical emergency team: preliminary results. Arch Dis Child. 2005;90(11):1148–1152.
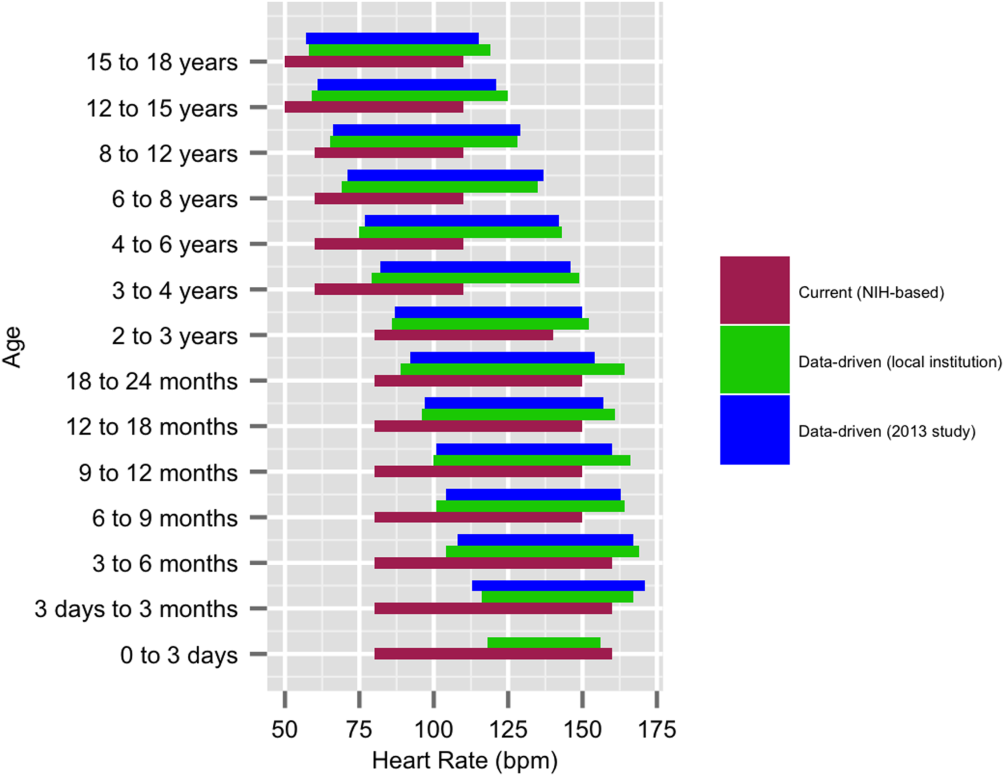
Monitor Alarms in a Children's Hospital
Physiologic monitor alarms are an inescapable part of the soundtrack for hospitals. Data from primarily adult hospitals have shown that alarms occur at high rates, and most alarms are not actionable.[1] Small studies have suggested that high alarm rates can lead to alarm fatigue.[2, 3] To prioritize alarm types to target in future intervention studies, in this study we aimed to investigate the alarm rates on all inpatient units and the most common causes of alarms at a children's hospital.
METHODS
This was a cross‐sectional study of audible physiologic monitor alarms at Cincinnati Children's Hospital Medical Center (CCHMC) over 7 consecutive days during August 2014. CCHMC is a 522‐bed free‐standing children's hospital. Inpatient beds are equipped with GE Healthcare (Little Chalfont, United Kingdom) bedside monitors (models Dash 3000, 4000, and 5000, and Solar 8000). Age‐specific vital sign parameters were employed for monitors on all units.
We obtained date, time, and type of alarm from bedside physiologic monitors using Connexall middleware (GlobeStar Systems, Toronto, Ontario, Canada).
We determined unit census using the electronic health records for the time period concurrent with the alarm data collection. Given previously described variation in hospital census over the day,[4] we used 4 daily census measurements (6:00 am, 12:00 pm, 6:00 pm, and 11:00 pm) rather than 1 single measurement to more accurately reflect the hospital census.
The CCHMC Institutional Review Board determined this work to be not human subjects research.
Statistical Analysis
For each unit and each census time interval, we generated a rate based on the number of occupied beds (alarms per patient‐day) resulting in a total of 28 rates (4 census measurement periods per/day 7 days) for each unit over the study period. We used descriptive statistics to summarize alarms per patient‐day by unit. Analysis of variance was used to compare alarm rates between units. For significant main effects, we used Tukey's multiple comparisons tests for all pairwise comparisons to control the type I experiment‐wise error rate. Alarms were then classified by alarm cause (eg, high heart rate). We summarized the cause for all alarms using counts and percentages.
RESULTS
There were a total of 220,813 audible alarms over 1 week. Median alarm rate per patient‐day by unit ranged from 30.4 to 228.5; the highest alarm rates occurred in the cardiac intensive care unit, with a median of 228.5 (interquartile range [IQR], 193275) followed by the pediatric intensive care unit (172.4; IQR, 141188) (Figure 1). The average alarm rate was significantly different among the units (P < 0.01).
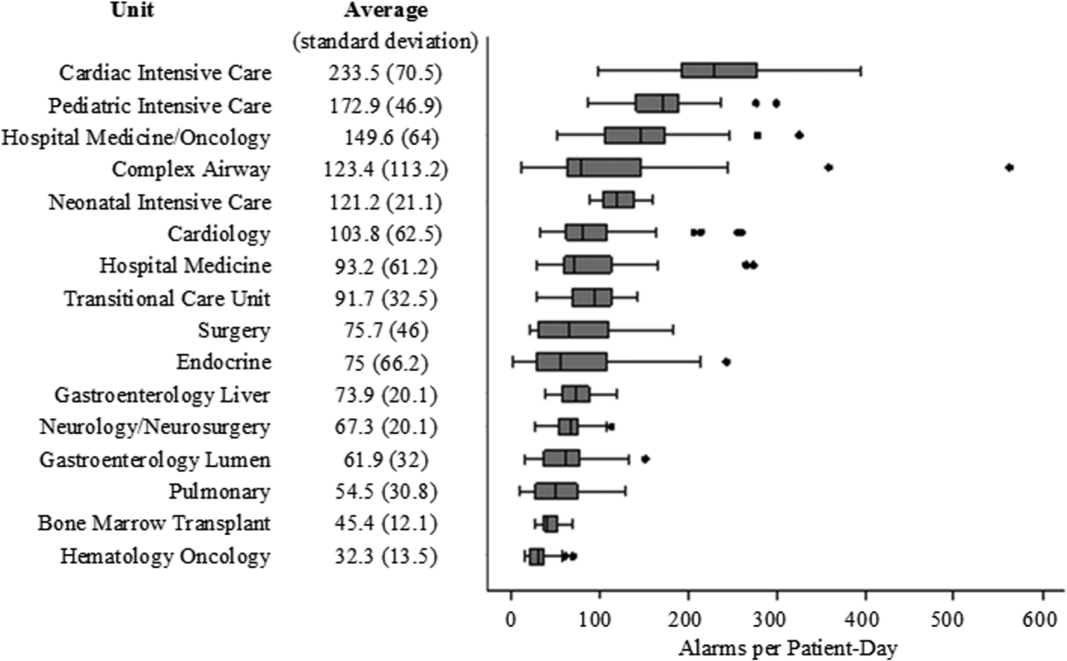
Technical alarms (eg, alarms for artifact, lead failure), comprised 33% of the total number of alarms. The remaining 67% of alarms were for clinical conditions, the most common of which was low oxygen saturation (30% of clinical alarms) (Figure 2).
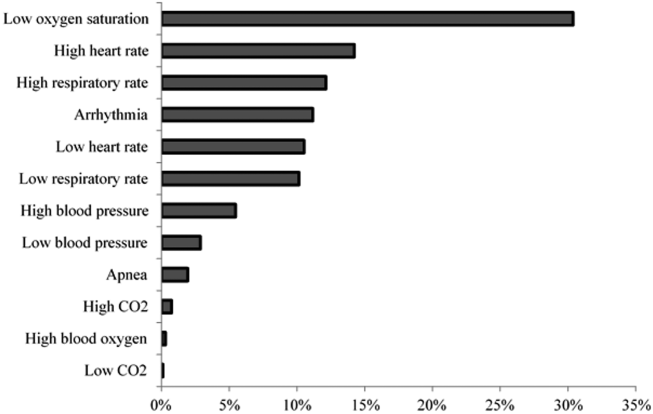
DISCUSSION
We described alarm rates and causes over multiple units at a large children's hospital. To our knowledge, this is the first description of alarm rates across multiple pediatric inpatient units. Alarm counts were high even for the general units, indicating that a nurse taking care of 4 monitored patients would need to process a physiologic monitor alarm every 4 minutes on average, in addition to other sources of alarms such as infusion pumps.
Alarm rates were highest in the intensive care unit areas, which may be attributable to both higher rates of monitoring and sicker patients. Importantly, however, alarms were quite high and variable on the acute care units. This suggests that factors other than patient acuity may have substantial influence on alarm rates.
Technical alarms, alarms that do not indicate a change in patient condition, accounted for the largest percentage of alarms during the study period. This is consistent with prior literature that has suggested that regular electrode replacement, which decreases technical alarms, can be effective in reducing alarm rates.[5, 6] The most common vital sign change to cause alarms was low oxygen saturation, followed by elevated heart rate and elevated respiratory rate. Whereas in most healthy patients, certain low oxygen levels would prompt initiation of supplemental oxygen, there are many conditions in which elevated heart rate and respiratory rate may not require titration of any particular therapy. These may be potential intervention targets for hospitals trying to improve alarm rates.
Limitations
There are several limitations to our study. First, our results are not necessarily generalizable to other types of hospitals or those utilizing monitors from other vendors. Second, we were unable to include other sources of alarms such as infusion pumps and ventilators. However, given the high alarm rates from physiologic monitors alone, these data add urgency to the need for further investigation in the pediatric setting.
CONCLUSION
Alarm rates at a single children's hospital varied depending on the unit. Strategies targeted at reducing technical alarms and reducing nonactionable clinical alarms for low oxygen saturation, high heart rate, and high respiratory rate may offer the greatest opportunity to reduce alarm rates.
Acknowledgements
The authors acknowledge Melinda Egan for her assistance in obtaining data for this study and Ting Sa for her assistance with data management.
Disclosures: Dr. Bonafide is supported by the National Heart, Lung, and Blood Institute of the National Institutes of Health under award number K23HL116427. Dr. Bonafide also holds a Young Investigator Award grant from the Academic Pediatric Association evaluating the impact of a data‐driven monitor alarm reduction strategy implemented in safety huddles. Dr. Brady is supported by the Agency for Healthcare Research and Quality under award number K08HS23827. The content is solely the responsibility of the authors and does not necessarily represent the official views of the National Institutes of Health or the Agency for Healthcare Research and Quality. This study was funded by the Arnold W. Strauss Fellow Grant, Cincinnati Children's Hospital Medical Center. The authors have no conflicts of interest to disclose.
- , , , et al. Systematic review of physiologic monitor alarm characteristics and pragmatic interventions to reduce alarm frequency. J Hosp Med. 2016;11(2):136–144.
- , , , et al. Association between exposure to nonactionable physiologic monitor alarms and response time in a children's hospital. J Hosp Med. 2015;10(6):345–351.
- , , , et al. Pulse oximetry desaturation alarms on a general postoperative adult unit: a prospective observational study of nurse response time. Int J Nurs Stud. 2013;50(10):1351–1358.
- , , , , . Traditional measures of hospital utilization may not accurately reflect dynamic patient demand: findings from a children's hospital. Hosp Pediatr. 2012;2(1):10–18.
- , , , et al. A team‐based approach to reducing cardiac monitor alarms. Pediatrics. 2014;134(6):e1686–e1694.
- , , , . Daily electrode change and effect on cardiac monitor alarms: an evidence‐based practice approach. J Nurs Care Qual. 2013;28(3):265–271.
Physiologic monitor alarms are an inescapable part of the soundtrack for hospitals. Data from primarily adult hospitals have shown that alarms occur at high rates, and most alarms are not actionable.[1] Small studies have suggested that high alarm rates can lead to alarm fatigue.[2, 3] To prioritize alarm types to target in future intervention studies, in this study we aimed to investigate the alarm rates on all inpatient units and the most common causes of alarms at a children's hospital.
METHODS
This was a cross‐sectional study of audible physiologic monitor alarms at Cincinnati Children's Hospital Medical Center (CCHMC) over 7 consecutive days during August 2014. CCHMC is a 522‐bed free‐standing children's hospital. Inpatient beds are equipped with GE Healthcare (Little Chalfont, United Kingdom) bedside monitors (models Dash 3000, 4000, and 5000, and Solar 8000). Age‐specific vital sign parameters were employed for monitors on all units.
We obtained date, time, and type of alarm from bedside physiologic monitors using Connexall middleware (GlobeStar Systems, Toronto, Ontario, Canada).
We determined unit census using the electronic health records for the time period concurrent with the alarm data collection. Given previously described variation in hospital census over the day,[4] we used 4 daily census measurements (6:00 am, 12:00 pm, 6:00 pm, and 11:00 pm) rather than 1 single measurement to more accurately reflect the hospital census.
The CCHMC Institutional Review Board determined this work to be not human subjects research.
Statistical Analysis
For each unit and each census time interval, we generated a rate based on the number of occupied beds (alarms per patient‐day) resulting in a total of 28 rates (4 census measurement periods per/day 7 days) for each unit over the study period. We used descriptive statistics to summarize alarms per patient‐day by unit. Analysis of variance was used to compare alarm rates between units. For significant main effects, we used Tukey's multiple comparisons tests for all pairwise comparisons to control the type I experiment‐wise error rate. Alarms were then classified by alarm cause (eg, high heart rate). We summarized the cause for all alarms using counts and percentages.
RESULTS
There were a total of 220,813 audible alarms over 1 week. Median alarm rate per patient‐day by unit ranged from 30.4 to 228.5; the highest alarm rates occurred in the cardiac intensive care unit, with a median of 228.5 (interquartile range [IQR], 193275) followed by the pediatric intensive care unit (172.4; IQR, 141188) (Figure 1). The average alarm rate was significantly different among the units (P < 0.01).
Technical alarms (eg, alarms for artifact, lead failure), comprised 33% of the total number of alarms. The remaining 67% of alarms were for clinical conditions, the most common of which was low oxygen saturation (30% of clinical alarms) (Figure 2).
DISCUSSION
We described alarm rates and causes over multiple units at a large children's hospital. To our knowledge, this is the first description of alarm rates across multiple pediatric inpatient units. Alarm counts were high even for the general units, indicating that a nurse taking care of 4 monitored patients would need to process a physiologic monitor alarm every 4 minutes on average, in addition to other sources of alarms such as infusion pumps.
Alarm rates were highest in the intensive care unit areas, which may be attributable to both higher rates of monitoring and sicker patients. Importantly, however, alarms were quite high and variable on the acute care units. This suggests that factors other than patient acuity may have substantial influence on alarm rates.
Technical alarms, alarms that do not indicate a change in patient condition, accounted for the largest percentage of alarms during the study period. This is consistent with prior literature that has suggested that regular electrode replacement, which decreases technical alarms, can be effective in reducing alarm rates.[5, 6] The most common vital sign change to cause alarms was low oxygen saturation, followed by elevated heart rate and elevated respiratory rate. Whereas in most healthy patients, certain low oxygen levels would prompt initiation of supplemental oxygen, there are many conditions in which elevated heart rate and respiratory rate may not require titration of any particular therapy. These may be potential intervention targets for hospitals trying to improve alarm rates.
Limitations
There are several limitations to our study. First, our results are not necessarily generalizable to other types of hospitals or those utilizing monitors from other vendors. Second, we were unable to include other sources of alarms such as infusion pumps and ventilators. However, given the high alarm rates from physiologic monitors alone, these data add urgency to the need for further investigation in the pediatric setting.
CONCLUSION
Alarm rates at a single children's hospital varied depending on the unit. Strategies targeted at reducing technical alarms and reducing nonactionable clinical alarms for low oxygen saturation, high heart rate, and high respiratory rate may offer the greatest opportunity to reduce alarm rates.
Acknowledgements
The authors acknowledge Melinda Egan for her assistance in obtaining data for this study and Ting Sa for her assistance with data management.
Disclosures: Dr. Bonafide is supported by the National Heart, Lung, and Blood Institute of the National Institutes of Health under award number K23HL116427. Dr. Bonafide also holds a Young Investigator Award grant from the Academic Pediatric Association evaluating the impact of a data‐driven monitor alarm reduction strategy implemented in safety huddles. Dr. Brady is supported by the Agency for Healthcare Research and Quality under award number K08HS23827. The content is solely the responsibility of the authors and does not necessarily represent the official views of the National Institutes of Health or the Agency for Healthcare Research and Quality. This study was funded by the Arnold W. Strauss Fellow Grant, Cincinnati Children's Hospital Medical Center. The authors have no conflicts of interest to disclose.
- , , , et al. Systematic review of physiologic monitor alarm characteristics and pragmatic interventions to reduce alarm frequency. J Hosp Med. 2016;11(2):136–144.
- , , , et al. Association between exposure to nonactionable physiologic monitor alarms and response time in a children's hospital. J Hosp Med. 2015;10(6):345–351.
- , , , et al. Pulse oximetry desaturation alarms on a general postoperative adult unit: a prospective observational study of nurse response time. Int J Nurs Stud. 2013;50(10):1351–1358.
- , , , , . Traditional measures of hospital utilization may not accurately reflect dynamic patient demand: findings from a children's hospital. Hosp Pediatr. 2012;2(1):10–18.
- , , , et al. A team‐based approach to reducing cardiac monitor alarms. Pediatrics. 2014;134(6):e1686–e1694.
- , , , . Daily electrode change and effect on cardiac monitor alarms: an evidence‐based practice approach. J Nurs Care Qual. 2013;28(3):265–271.

Review of Physiologic Monitor Alarms
Clinical alarm safety has become a recent target for improvement in many hospitals. In 2013, The Joint Commission released a National Patient Safety Goal prompting accredited hospitals to establish alarm safety as a hospital priority, identify the most important alarm signals to manage, and, by 2016, develop policies and procedures that address alarm management.[1] In addition, the Emergency Care Research Institute has named alarm hazards the top health technology hazard each year since 2012.[2]
The primary arguments supporting the elevation of alarm management to a national hospital priority in the United States include the following: (1) clinicians rely on alarms to notify them of important physiologic changes, (2) alarms occur frequently and usually do not warrant clinical intervention, and (3) alarm overload renders clinicians unable to respond to all alarms, resulting in alarm fatigue: responding more slowly or ignoring alarms that may represent actual clinical deterioration.[3, 4] These arguments are built largely on anecdotal data, reported safety event databases, and small studies that have not previously been systematically analyzed.
Despite the national focus on alarms, we still know very little about fundamental questions key to improving alarm safety. In this systematic review, we aimed to answer 3 key questions about physiologic monitor alarms: (1) What proportion of alarms warrant attention or clinical intervention (ie, actionable alarms), and how does this proportion vary between adult and pediatric populations and between intensive care unit (ICU) and ward settings? (2) What is the relationship between alarm exposure and clinician response time? (3) What interventions are effective in reducing the frequency of alarms?
We limited our scope to monitor alarms because few studies have evaluated the characteristics of alarms from other medical devices, and because missing relevant monitor alarms could adversely impact patient safety.
METHODS
We performed a systematic review of the literature in accordance with the Meta‐Analysis of Observational Studies in Epidemiology guidelines[5] and developed this manuscript using the Preferred Reporting Items for Systematic Reviews and Meta‐Analyses (PRISMA) statement.[6]
Eligibility Criteria
With help from an experienced biomedical librarian (C.D.S.), we searched PubMed, the Cumulative Index to Nursing and Allied Health Literature, Scopus, Cochrane Library,
We included peer‐reviewed, original research studies published in English, Spanish, or French that addressed the questions outlined above. Eligible patient populations were children and adults admitted to hospital inpatient units and emergency departments (EDs). We excluded alarms in procedural suites or operating rooms (typically responded to by anesthesiologists already with the patient) because of the differences in environment of care, staff‐to‐patient ratio, and equipment. We included observational studies reporting the actionability of physiologic monitor alarms (ie, alarms warranting special attention or clinical intervention), as well as nurse responses to these alarms. We excluded studies focused on the effects of alarms unrelated to patient safety, such as families' and patients' stress, noise, or sleep disturbance. We included only intervention studies evaluating pragmatic interventions ready for clinical implementation (ie, not experimental devices or software algorithms).
Selection Process and Data Extraction
First, 2 authors screened the titles and abstracts of articles for eligibility. To maximize sensitivity, if at least 1 author considered the article relevant, the article proceeded to full‐text review. Second, the full texts of articles screened were independently reviewed by 2 authors in an unblinded fashion to determine their eligibility. Any disagreements concerning eligibility were resolved by team consensus. To assure consistency in eligibility determinations across the team, a core group of the authors (C.W.P, C.P.B., E.E., and V.V.G.) held a series of meetings to review and discuss each potentially eligible article and reach consensus on the final list of included articles. Two authors independently extracted the following characteristics from included studies: alarm review methods, analytic design, fidelity measurement, consideration of unintended adverse safety consequences, and key results. Reviewers were not blinded to journal, authors, or affiliations.
Synthesis of Results and Risk Assessment
Given the high degree of heterogeneity in methodology, we were unable to generate summary proportions of the observational studies or perform a meta‐analysis of the intervention studies. Thus, we organized the studies into clinically relevant categories and presented key aspects in tables. Due to the heterogeneity of the studies and the controversy surrounding quality scores,[5] we did not generate summary scores of study quality. Instead, we evaluated and reported key design elements that had the potential to bias the results. To recognize the more comprehensive studies in the field, we developed by consensus a set of characteristics that distinguished studies with lower risk of bias. These characteristics are shown and defined in Table 1.
| First Author and Publication Year | Alarm Review Method | Indicators of Potential Bias for Observational Studies | Indicators of Potential Bias for Intervention Studies | |||||||||||||
|---|---|---|---|---|---|---|---|---|---|---|---|---|---|---|---|---|
| Monitor System | Direct Observation | Medical Record Review | Rhythm Annotation | Video Observation | Remote Monitoring Staff | Medical Device Industry Involved | Two Independent Reviewers | At Least 1 Reviewer Is a Clinical Expert | Reviewer Not Simultaneously in Patient Care | Clear Definition of Alarm Actionability | Census Included | Statistical Testing or QI SPC Methods | Fidelity Assessed | Safety Assessed | Lower Risk of Bias | |
| ||||||||||||||||
| Adult Observational | ||||||||||||||||
| Atzema 2006[7] | ✓* | ✓ | ✓ | |||||||||||||
| Billinghurst 2003[8] | ✓ | ✓ | ✓ | ✓ | ||||||||||||
| Biot 2000[9] | ✓ | ✓ | ✓ | ✓ | ||||||||||||
| Chambrin 1999[10] | ✓ | ✓ | ✓ | ✓ | ||||||||||||
| Drew 2014[11] | ✓ | ✓ | ✓ | ✓ | ✓ | ✓ | ✓ | ✓ | ||||||||
| Gazarian 2014[12] | ✓ | ✓ | ✓ | ✓ | ✓ | |||||||||||
| Grges 2009[13] | ✓ | ✓ | ✓ | ✓ | ||||||||||||
| Gross 2011[15] | ✓ | ✓ | ✓ | ✓ | ✓ | ✓ | ✓ | |||||||||
| Inokuchi 2013[14] | ✓ | ✓ | ✓ | ✓ | ✓ | ✓ | ✓ | |||||||||
| Koski 1990[16] | ✓ | ✓ | ✓ | ✓ | ||||||||||||
| Morales Snchez 2014[17] | ✓ | ✓ | ✓ | ✓ | ||||||||||||
| Pergher 2014[18] | ✓ | ✓ | ||||||||||||||
| Siebig 2010[19] | ✓ | ✓ | ✓ | ✓ | ✓ | ✓ | ||||||||||
| Voepel‐Lewis 2013[20] | ✓ | ✓ | ✓ | ✓ | ||||||||||||
| Way 2014[21] | ✓ | ✓ | ✓ | |||||||||||||
| Pediatric Observational | ||||||||||||||||
| Bonafide 2015[22] | ✓ | ✓ | ✓ | ✓ | ✓ | ✓ | ✓ | |||||||||
| Lawless 1994[23] | ✓ | ✓ | ||||||||||||||
| Rosman 2013[24] | ✓ | ✓ | ✓ | ✓ | ✓ | |||||||||||
| Talley 2011[25] | ✓ | ✓ | ✓ | ✓ | ✓ | |||||||||||
| Tsien 1997[26] | ✓ | ✓ | ✓ | ✓ | ||||||||||||
| van Pul 2015[27] | ✓ | |||||||||||||||
| Varpio 2012[28] | ✓ | ✓ | ✓ | ✓ | ||||||||||||
| Mixed Adult and Pediatric Observational | ||||||||||||||||
| O'Carroll 1986[29] | ✓ | |||||||||||||||
| Wiklund 1994[30] | ✓ | ✓ | ✓ | ✓ | ||||||||||||
| Adult Intervention | ||||||||||||||||
| Albert 2015[32] | ✓ | ✓ | ✓ | ✓ | ✓ | ✓ | ✓ | |||||||||
| Cvach 2013[33] | ✓ | ✓ | ||||||||||||||
| Cvach 2014[34] | ✓ | ✓ | ||||||||||||||
| Graham 2010[35] | ✓ | |||||||||||||||
| Rheineck‐Leyssius 1997[36] | ✓ | ✓ | ✓ | ✓ | ✓ | ✓ | ||||||||||
| Taenzer 2010[31] | ✓ | ✓ | ✓ | ✓ | ✓ | ✓ | ||||||||||
| Whalen 2014[37] | ✓ | ✓ | ✓ | |||||||||||||
| Pediatric Intervention | ||||||||||||||||
| Dandoy 2014[38] | ✓ | ✓ | ✓ | ✓ | ✓ | ✓ | ||||||||||
For the purposes of this review, we defined nonactionable alarms as including both invalid (false) alarms that do not that accurately represent the physiologic status of the patient and alarms that are valid but do not warrant special attention or clinical intervention (nuisance alarms). We did not separate out invalid alarms due to the tremendous variation between studies in how validity was measured.
RESULTS
Study Selection
Search results produced 4629 articles (see the flow diagram in the Supporting Information in the online version of this article), of which 32 articles were eligible: 24 observational studies describing alarm characteristics and 8 studies describing interventions to reduce alarm frequency.
Observational Study Characteristics
Characteristics of included studies are shown in Table 1. Of the 24 observational studies,[7, 8, 9, 10, 11, 12, 13, 14, 15, 16, 17, 18, 19, 20, 21, 22, 23, 24, 25, 26, 27, 28, 29, 30] 15 included adult patients,[7, 8, 9, 10, 11, 12, 13, 14, 15, 16, 17, 18, 19, 20, 21] 7 included pediatric patients,[22, 23, 24, 25, 26, 27, 28] and 2 included both adult and pediatric patients.[29, 30] All were single‐hospital studies, except for 1 study by Chambrin and colleagues[10] that included 5 sites. The number of patient‐hours examined in each study ranged from 60 to 113,880.[7, 8, 9, 10, 11, 13, 14, 15, 16, 18, 19, 20, 21, 22, 23, 24, 25, 26, 27, 29, 30] Hospital settings included ICUs (n = 16),[9, 10, 11, 13, 14, 16, 17, 18, 19, 22, 23, 24, 25, 26, 27, 29] general wards (n = 5),[12, 15, 20, 22, 28] EDs (n = 2),[7, 21] postanesthesia care unit (PACU) (n = 1),[30] and cardiac care unit (CCU) (n = 1).[8] Studies varied in the type of physiologic signals recorded and data collection methods, ranging from direct observation by a nurse who was simultaneously caring for patients[29] to video recording with expert review.[14, 19, 22] Four observational studies met the criteria for lower risk of bias.[11, 14, 15, 22]
Intervention Study Characteristics
Of the 8 intervention studies, 7 included adult patients,[31, 32, 33, 34, 35, 36, 37] and 1 included pediatric patients.[38] All were single‐hospital studies; 6 were quasi‐experimental[31, 33, 34, 35, 37, 38] and 2 were experimental.[32, 36] Settings included progressive care units (n = 3),[33, 34, 35] CCUs (n = 3),[32, 33, 37] wards (n = 2),[31, 38] PACU (n = 1),[36] and a step‐down unit (n = 1).[32] All except 1 study[32] used the monitoring system to record alarm data. Several studies evaluated multicomponent interventions that included combinations of the following: widening alarm parameters,[31, 35, 36, 37, 38] instituting alarm delays,[31, 34, 36, 38] reconfiguring alarm acuity,[35, 37] use of secondary notifications,[34] daily change of electrocardiographic electrodes or use of disposable electrocardiographic wires,[32, 33, 38] universal monitoring in high‐risk populations,[31] and timely discontinuation of monitoring in low‐risk populations.[38] Four intervention studies met our prespecified lower risk of bias criteria.[31, 32, 36, 38]
Proportion of Alarms Considered Actionable
Results of the observational studies are provided in Table 2. The proportion of alarms that were actionable was <1% to 26% in adult ICU settings,[9, 10, 11, 13, 14, 16, 17, 19] 20% to 36% in adult ward settings,[12, 15, 20] 17% in a mixed adult and pediatric PACU setting,[30] 3% to 13% in pediatric ICU settings,[22, 23, 24, 25, 26] and 1% in a pediatric ward setting.[22]
| Signals Included | ||||||||||
|---|---|---|---|---|---|---|---|---|---|---|
| First Author and Publication Year | Setting | Monitored Patient‐Hours | SpO2 | ECG Arrhythmia | ECG Parametersa | Blood Pressure | Total Alarms | Actionable Alarms | Alarm Response | Lower Risk of Bias |
| ||||||||||
| Adult | ||||||||||
| Atzema 2006[7] | ED | 371 | ✓ | 1,762 | 0.20% | |||||
| Billinghurst 2003[8] | CCU | 420 | ✓ | 751 | Not reported; 17% were valid | Nurses with higher acuity patients and smaller % of valid alarms had slower response rates | ||||
| Biot 2000[9] | ICU | 250 | ✓ | ✓ | ✓ | ✓ | 3,665 | 3% | ||
| Chambrin 1999[10] | ICU | 1,971 | ✓ | ✓ | ✓ | ✓ | 3,188 | 26% | ||
| Drew 2014[11] | ICU | 48,173 | ✓ | ✓ | ✓ | ✓ | 2,558,760 | 0.3% of 3,861 VT alarms | ✓ | |
| Gazarian 2014[12] | Ward | 54 nurse‐hours | ✓ | ✓ | ✓ | 205 | 22% | Response to 47% of alarms | ||
| Grges 2009[13] | ICU | 200 | ✓ | ✓ | ✓ | ✓ | 1,214 | 5% | ||
| Gross 2011[15] | Ward | 530 | ✓ | ✓ | ✓ | ✓ | 4,393 | 20% | ✓ | |
| Inokuchi 2013[14] | ICU | 2,697 | ✓ | ✓ | ✓ | ✓ | 11,591 | 6% | ✓ | |
| Koski 1990[16] | ICU | 400 | ✓ | ✓ | 2,322 | 12% | ||||
| Morales Snchez 2014[17] | ICU | 434 sessions | ✓ | ✓ | ✓ | 215 | 25% | Response to 93% of alarms, of which 50% were within 10 seconds | ||
| Pergher 2014[18] | ICU | 60 | ✓ | 76 | Not reported | 72% of alarms stopped before nurse response or had >10 minutes response time | ||||
| Siebig 2010[19] | ICU | 982 | ✓ | ✓ | ✓ | ✓ | 5,934 | 15% | ||
| Voepel‐Lewis 2013[20] | Ward | 1,616 | ✓ | 710 | 36% | Response time was longer for patients in highest quartile of total alarms | ||||
| Way 2014[21] | ED | 93 | ✓ | ✓ | ✓ | ✓ | 572 | Not reported; 75% were valid | Nurses responded to more alarms in resuscitation room vs acute care area, but response time was longer | |
| Pediatric | ||||||||||
| Bonafide 2015[22] | Ward + ICU | 210 | ✓ | ✓ | ✓ | ✓ | 5,070 | 13% PICU, 1% ward | Incremental increases in response time as number of nonactionable alarms in preceding 120 minutes increased | ✓ |
| Lawless 1994[23] | ICU | 928 | ✓ | ✓ | ✓ | 2,176 | 6% | |||
| Rosman 2013[24] | ICU | 8,232 | ✓ | ✓ | ✓ | ✓ | 54,656 | 4% of rhythm alarms true critical" | ||
| Talley 2011[25] | ICU | 1,470∥ | ✓ | ✓ | ✓ | ✓ | 2,245 | 3% | ||
| Tsien 1997[26] | ICU | 298 | ✓ | ✓ | ✓ | 2,942 | 8% | |||
| van Pul 2015[27] | ICU | 113,880∥ | ✓ | ✓ | ✓ | ✓ | 222,751 | Not reported | Assigned nurse did not respond to 6% of alarms within 45 seconds | |
| Varpio 2012[28] | Ward | 49 unit‐hours | ✓ | ✓ | ✓ | ✓ | 446 | Not reported | 70% of all alarms and 41% of crisis alarms were not responded to within 1 minute | |
| Both | ||||||||||
| O'Carroll 1986[29] | ICU | 2,258∥ | ✓ | 284 | 2% | |||||
| Wiklund 1994[30] | PACU | 207 | ✓ | ✓ | ✓ | 1,891 | 17% | |||
Relationship Between Alarm Exposure and Response Time
Whereas 9 studies addressed response time,[8, 12, 17, 18, 20, 21, 22, 27, 28] only 2 evaluated the relationship between alarm burden and nurse response time.[20, 22] Voepel‐Lewis and colleagues found that nurse responses were slower to patients with the highest quartile of alarms (57.6 seconds) compared to those with the lowest (45.4 seconds) or medium (42.3 seconds) quartiles of alarms on an adult ward (P = 0.046). They did not find an association between false alarm exposure and response time.[20] Bonafide and colleagues found incremental increases in response time as the number of nonactionable alarms in the preceding 120 minutes increased (P < 0.001 in the pediatric ICU, P = 0.009 on the pediatric ward).[22]
Interventions Effective in Reducing Alarms
Results of the 8 intervention studies are provided in Table 3. Three studies evaluated single interventions;[32, 33, 36] the remainder of the studies tested interventions with multiple components such that it was impossible to separate the effect of each component. Below, we have summarized study results, arranged by component. Because only 1 study focused on pediatric patients,[38] results from pediatric and adult settings are combined.
| First Author and Publication Year | Design | Setting | Main Intervention Components | Other/ Comments | Key Results | Results Statistically Significant? | Lower Risk of Bias | ||||
|---|---|---|---|---|---|---|---|---|---|---|---|
| Widen Default Settings | Alarm Delays | Reconfigure Alarm Acuity | Secondary Notification | ECG Changes | |||||||
| |||||||||||
| Adult | |||||||||||
| Albert 2015[32] | Experimental (cluster‐randomized) | CCU | ✓ | Disposable vs reusable wires | Disposable leads had 29% fewer no‐telemetry, leads‐fail, and leads‐off alarms and similar artifact alarms | ✓ | ✓ | ||||
| Cvach 2013[33] | Quasi‐experimental (before and after) | CCU and PCU | ✓ | Daily change of electrodes | 46% fewer alarms/bed/day | ||||||
| Cvach 2014[34] | Quasi‐experimental (ITS) | PCU | ✓* | ✓ | Slope of regression line suggests decrease of 0.75 alarms/bed/day | ||||||
| Graham 2010[35] | Quasi‐experimental (before and after) | PCU | ✓ | ✓ | 43% fewer crisis, warning, and system warning alarms on unit | ||||||
| Rheineck‐Leyssius 1997[36] | Experimental (RCT) | PACU | ✓ | ✓ | Alarm limit of 85% had fewer alarms/patient but higher incidence of true hypoxemia for >1 minute (6% vs 2%) | ✓ | ✓ | ||||
| Taenzer 2010[31] | Quasi‐experimental (before and after with concurrent controls) | Ward | ✓ | ✓ | Universal SpO2 monitoring | Rescue events decreased from 3.4 to 1.2 per 1,000 discharges; transfers to ICU decreased from 5.6 to 2.9 per 1,000 patient‐days, only 4 alarms/patient‐day | ✓ | ✓ | |||
| Whalen 2014[37] | Quasi‐experimental (before and after) | CCU | ✓ | ✓ | 89% fewer audible alarms on unit | ✓ | |||||
| Pediatric | |||||||||||
| Dandoy 2014[38] | Quasi‐experimental (ITS) | Ward | ✓ | ✓ | ✓ | Timely monitor discontinuation; daily change of ECG electrodes | Decrease in alarms/patient‐days from 180 to 40 | ✓ | |||
Widening alarm parameter default settings was evaluated in 5 studies:[31, 35, 36, 37, 38] 1 single intervention randomized controlled trial (RCT),[36] and 4 multiple‐intervention, quasi‐experimental studies.[31, 35, 37, 38] In the RCT, using a lower SpO2 limit of 85% instead of the standard 90% resulted in 61% fewer alarms. In the 4 multiple intervention studies, 1 study reported significant reductions in alarm rates (P < 0.001),[37] 1 study did not report preintervention alarm rates but reported a postintervention alarm rate of 4 alarms per patient‐day,[31] and 2 studies reported reductions in alarm rates but did not report any statistical testing.[35, 38] Of the 3 studies examining patient safety, 1 study with universal monitoring reported fewer rescue events and transfers to the ICU postimplementation,[31] 1 study reported no missed acute decompensations,[38] and 1 study (the RCT) reported significantly more true hypoxemia events (P = 0.001).[36]
Alarm delays were evaluated in 4 studies:[31, 34, 36, 38] 3 multiple‐intervention, quasi‐experimental studies[31, 34, 38] and 1 retrospective analysis of data from an RCT.[36] One study combined alarm delays with widening defaults in a universal monitoring strategy and reported a postintervention alarm rate of 4 alarms per patient.[31] Another study evaluated delays as part of a secondary notification pager system and found a negatively sloping regression line that suggested a decreasing alarm rate, but did not report statistical testing.[34] The third study reported a reduction in alarm rates but did not report statistical testing.[38] The RCT compared the impact of a hypothetical 15‐second alarm delay to that of a lower SpO2 limit reduction and reported a similar reduction in alarms.[36] Of the 4 studies examining patient safety, 1 study with universal monitoring reported improvements,[31] 2 studies reported no adverse outcomes,[35, 38] and the retrospective analysis of data from the RCT reported the theoretical adverse outcome of delayed detection of sudden, severe desaturations.[36]
Reconfiguring alarm acuity was evaluated in 2 studies, both of which were multiple‐intervention quasi‐experimental studies.[35, 37] Both showed reductions in alarm rates: 1 was significant without increasing adverse events (P < 0.001),[37] and the other did not report statistical testing or safety outcomes.[35]
Secondary notification of nurses using pagers was the main intervention component of 1 study incorporating delays between the alarms and the alarm pages.[34] As mentioned above, a negatively sloping regression line was displayed, but no statistical testing or safety outcomes were reported.
Disposable electrocardiographic lead wires or daily electrode changes were evaluated in 3 studies:[32, 33, 38] 1 single intervention cluster‐randomized trial[32] and 2 quasi‐experimental studies.[33, 38] In the cluster‐randomized trial, disposable lead wires were compared to reusable lead wires, with disposable lead wires having significantly fewer technical alarms for lead signal failures (P = 0.03) but a similar number of monitoring artifact alarms (P = 0.44).[32] In a single‐intervention, quasi‐experimental study, daily electrode change showed a reduction in alarms, but no statistical testing was reported.[33] One multiple‐intervention, quasi‐experimental study incorporating daily electrode change showed fewer alarms without statistical testing.[38] Of the 2 studies examining patient safety, both reported no adverse outcomes.[32, 38]
DISCUSSION
This systematic review of physiologic monitor alarms in the hospital yielded the following main findings: (1) between 74% and 99% of physiologic monitor alarms were not actionable, (2) a significant relationship between alarm exposure and nurse response time was demonstrated in 2 small observational studies, and (3) although interventions were most often studied in combination, results from the studies with lower risk of bias suggest that widening alarm parameters, implementing alarm delays, and using disposable electrocardiographic lead wires and/or changing electrodes daily are the most promising interventions for reducing alarms. Only 5 of 8 intervention studies measured intervention safety and found that widening alarm parameters and implementing alarm delays had mixed safety outcomes, whereas disposable electrocardiographic lead wires and daily electrode changes had no adverse safety outcomes.[29, 30, 34, 35, 36] Safety measures are crucial to ensuring the highest level of patient safety is met; interventions are rendered useless without ensuring actionable alarms are not disabled. The variation in results across studies likely reflects the wide range of care settings as well as differences in design and quality.
This field is still in its infancy, with 18 of the 32 articles published in the past 5 years. We anticipate improvements in quality and rigor as the field matures, as well as clinically tested interventions that incorporate smart alarms. Smart alarms integrate data from multiple physiologic signals and the patient's history to better detect physiologic changes in the patient and improve the positive predictive value of alarms. Academicindustry partnerships will be required to implement and rigorously test smart alarms and other emerging technologies in the hospital.
To our knowledge, this is the first systematic review focused on monitor alarms with specific review questions relevant to alarm fatigue. Cvach recently published an integrative review of alarm fatigue using research published through 2011.[39] Our review builds upon her work by contributing a more extensive and systematic search strategy with databases spanning nursing, medicine, and engineering, including additional languages, and including newer studies published through April 2015. In addition, we included multiple cross‐team checks in our eligibility review to ensure high sensitivity and specificity of the resulting set of studies.
Although we focused on interventions aiming to reduce alarms, there has also been important recent work focused on reducing telemetry utilization in adult hospital populations as well as work focused on reducing pulse oximetry utilization in children admitted with respiratory conditions. Dressler and colleagues reported an immediate and sustained reduction in telemetry utilization in hospitalized adults upon redesign of cardiac telemetry order sets to include the clinical indication, which defaulted to the American Heart Association guideline‐recommended telemetry duration.[40] Instructions for bedside nurses were also included in the order set to facilitate appropriate telemetry discontinuation. Schondelmeyer and colleagues reported reductions in continuous pulse oximetry utilization in hospitalized children with asthma and bronchiolitis upon introduction of a multifaceted quality improvement program that included provider education, a nurse handoff checklist, and discontinuation criteria incorporated into order sets.[41]
Limitations of This Review and the Underlying Body of Work
There are limitations to this systematic review and its underlying body of work. With respect to our approach to this systematic review, we focused only on monitor alarms. Numerous other medical devices generate alarms in the patient‐care environment that also can contribute to alarm fatigue and deserve equally rigorous evaluation. With respect to the underlying body of work, the quality of individual studies was generally low. For example, determinations of alarm actionability were often made by a single rater without evaluation of the reliability or validity of these determinations, and statistical testing was often missing. There were also limitations specific to intervention studies, including evaluation of nongeneralizable patient populations, failure to measure the fidelity of the interventions, inadequate measures of intervention safety, and failure to statistically evaluate alarm reductions. Finally, though not necessarily a limitation, several studies were conducted by authors involved in or funded by the medical device industry.[11, 15, 19, 31, 32] This has the potential to introduce bias, although we have no indication that the quality of the science was adversely impacted.
Moving forward, the research agenda for physiologic monitor alarms should include the following: (1) more intensive focus on evaluating the relationship between alarm exposure and response time with analysis of important mediating factors that may promote or prevent alarm fatigue, (2) emphasis on studying interventions aimed at improving alarm management using rigorous designs such as cluster‐randomized trials and trials randomized by individual participant, (3) monitoring and reporting clinically meaningful balancing measures that represent unintended consequences of disabling or delaying potentially important alarms and possibly reducing the clinicians' ability to detect true patient deterioration and intervene in a timely manner, and (4) support for transparent academicindustry partnerships to evaluate new alarm technology in real‐world settings. As evidence‐based interventions emerge, there will be new opportunities to study different implementation strategies of these interventions to optimize effectiveness.
CONCLUSIONS
The body of literature relevant to physiologic monitor alarm characteristics and alarm fatigue is limited but growing rapidly. Although we know that most alarms are not actionable and that there appears to be a relationship between alarm exposure and response time that could be caused by alarm fatigue, we cannot yet say with certainty that we know which interventions are most effective in safely reducing unnecessary alarms. Interventions that appear most promising and should be prioritized for intensive evaluation include widening alarm parameters, implementing alarm delays, and using disposable electrocardiographic lead wires and changing electrodes daily. Careful evaluation of these interventions must include systematically examining adverse patient safety consequences.
Acknowledgements
The authors thank Amogh Karnik and Micheal Sellars for their technical assistance during the review and extraction process.
Disclosures: Ms. Zander is supported by the Society of Hospital Medicine Student Hospitalist Scholar Grant. Dr. Bonafide and Ms. Stemler are supported by the National Heart, Lung, and Blood Institute of the National Institutes of Health under award number K23HL116427. The content is solely the responsibility of the authors and does not necessarily represent the official views of the National Institutes of Health. The authors report no conflicts of interest.
- National Patient Safety Goals Effective January 1, 2015. The Joint Commission Web site. http://www.jointcommission.org/assets/1/6/2015_NPSG_HAP.pdf. Accessed July 17, 2015.
- ECRI Institute. 2015 Top 10 Health Technology Hazards. Available at: https://www.ecri.org/Pages/2015‐Hazards.aspx. Accessed June 23, 2015.
- , . Alarm fatigue: a patient safety concern. AACN Adv Crit Care. 2013;24(4):378–386.
- , . Redesigning hospital alarms for patient safety: alarmed and potentially dangerous. JAMA. 2014;311(12):1199–1200.
- , , , et al. Meta‐analysis of observational studies in epidemiology: a proposal for reporting. Meta‐analysis Of Observational Studies in Epidemiology (MOOSE) Group. JAMA. 2000;283(15):2008–2012.
- , , , ; PRISMA Group. Preferred reporting items for systematic reviews and meta‐analyses: the PRISMA statement. Ann Intern Med. 2009;151(4):264–269, W64.
- , , , , . ALARMED: adverse events in low‐risk patients with chest pain receiving continuous electrocardiographic monitoring in the emergency department. A pilot study. Am J Emerg Med. 2006;24:62–67.
- , , . Patient and nurse‐related implications of remote cardiac telemetry. Clin Nurs Res. 2003;12(4):356–370.
- , , , , . Clinical evaluation of alarm efficiency in intensive care [in French]. Ann Fr Anesth Reanim. 2000;19:459–466.
- , , , , , . Multicentric study of monitoring alarms in the adult intensive care unit (ICU): a descriptive analysis. Intensive Care Med. 1999;25:1360–1366.
- , , , et al. Insights into the problem of alarm fatigue with physiologic monitor devices: a comprehensive observational study of consecutive intensive care unit patients. PloS One. 2014;9(10):e110274.
- . Nurses' response to frequency and types of electrocardiography alarms in a non‐ critical care setting: a descriptive study. Int J Nurs Stud. 2014;51(2):190–197.
- , , . Improving alarm performance in the medical intensive care unit using delays and clinical context. Anesth Analg. 2009;108:1546–1552.
- , , , et al. The proportion of clinically relevant alarms decreases as patient clinical severity decreases in intensive care units: a pilot study. BMJ Open. 2013;3(9):e003354–e003354.
- , , . Physiologic monitoring alarm load on medical/surgical floors of a community hospital. Biomed Instrum Technol. 2011;45:29–36.
- , , , . Frequency and reliability of alarms in the monitoring of cardiac postoperative patients. Int J Clin Monit Comput. 1990;7(2):129–133.
- , , , et al. Audit of the bedside monitor alarms in a critical care unit [in Spanish]. Enferm Intensiva. 2014;25(3):83–90.
- , . Stimulus‐response time to invasive blood pressure alarms: implications for the safety of critical‐care patients. Rev Gaúcha Enferm. 2014;35(2):135–141.
- , , , , , . Intensive care unit alarms— how many do we need? Crit Care Med. 2010;38:451–456.
- , , , et al. Pulse oximetry desaturation alarms on a general postoperative adult unit: a prospective observational study of nurse response time. Int J Nurs Stud. 2013;50(10):1351–1358.
- , , . Whats that noise? Bedside monitoring in the Emergency Department. Int Emerg Nurs. 2014;22(4):197–201.
- , , , et al. Association between exposure to nonactionable physiologic monitor alarms and response time in a children's hospital. J Hosp Med. 2015;10(6):345–351.
- . Crying wolf: false alarms in a pediatric intensive care unit. Crit Care Med. 1994;22(6):981–985.
- , , , , . What are we missing? Arrhythmia detection in the pediatric intensive care unit. J Pediatr. 2013;163(2):511–514.
- , , , et al. Cardiopulmonary monitors and clinically significant events in critically ill children. Biomed Instrum Technol. 2011;45(s1):38–45.
- , . Poor prognosis for existing monitors in the intensive care unit. Crit Care Med. 1997;25:614–619.
- , , , , . Safe patient monitoring is challenging but still feasible in a neonatal intensive care unit with single family rooms. Acta Paediatr Oslo Nor 1992. 2015;104(6):e247–e254.
- , , , . The helpful or hindering effects of in‐hospital patient monitor alarms on nurses: a qualitative analysis. CIN Comput Inform Nurs. 2012;30(4):210–217.
- . Survey of alarms in an intensive therapy unit. Anaesthesia. 1986;41(7):742–744.
- , , , . Postanesthesia monitoring revisited: frequency of true and false alarms from different monitoring devices. J Clin Anesth. 1994;6(3):182–188.
- , , , . Impact of pulse oximetry surveillance on rescue events and intensive care unit transfers: a before‐and‐after concurrence study. Anesthesiology. 2010;112(2):282–287.
- , , , et al. Differences in alarm events between disposable and reusable electrocardiography lead wires. Am J Crit Care. 2015;24(1):67–74.
- , , , . Daily electrode change and effect on cardiac monitor alarms: an evidence‐based practice approach. J Nurs Care Qual. 2013;28:265–271.
- , , , . Use of pagers with an alarm escalation system to reduce cardiac monitor alarm signals. J Nurs Care Qual. 2014;29(1):9–18.
- , . Monitor alarm fatigue: standardizing use of physiological monitors and decreasing nuisance alarms. Am J Crit Care. 2010;19:28–34.
- , . Influence of pulse oximeter lower alarm limit on the incidence of hypoxaemia in the recovery room. Br J Anaesth. 1997;79(4):460–464.
- , , , , , . Novel approach to cardiac alarm management on telemetry units. J Cardiovasc Nurs. 2014;29(5):E13–E22.
- , , , et al. A team‐based approach to reducing cardiac monitor alarms. Pediatrics. 2014;134(6):e1686–e1694.
- . Monitor alarm fatigue: an integrative review. Biomed Instrum Technol. 2012;46(4):268–277.
- , , , , . Altering overuse of cardiac telemetry in non‐intensive care unit settings by hardwiring the use of American Heart Association guidelines. JAMA Intern Med. 2014;174(11):1852–1854.
- , , , et al. Using quality improvement to reduce continuous pulse oximetry use in children with wheezing. Pediatrics. 2015;135(4):e1044–e1051.
- , . The feasibility of creating a checklist for the assessment of the methodological quality both of randomised and non‐randomised studies of health care interventions. J Epidemiol Community Health. 1998;52(6):377–384.
Clinical alarm safety has become a recent target for improvement in many hospitals. In 2013, The Joint Commission released a National Patient Safety Goal prompting accredited hospitals to establish alarm safety as a hospital priority, identify the most important alarm signals to manage, and, by 2016, develop policies and procedures that address alarm management.[1] In addition, the Emergency Care Research Institute has named alarm hazards the top health technology hazard each year since 2012.[2]
The primary arguments supporting the elevation of alarm management to a national hospital priority in the United States include the following: (1) clinicians rely on alarms to notify them of important physiologic changes, (2) alarms occur frequently and usually do not warrant clinical intervention, and (3) alarm overload renders clinicians unable to respond to all alarms, resulting in alarm fatigue: responding more slowly or ignoring alarms that may represent actual clinical deterioration.[3, 4] These arguments are built largely on anecdotal data, reported safety event databases, and small studies that have not previously been systematically analyzed.
Despite the national focus on alarms, we still know very little about fundamental questions key to improving alarm safety. In this systematic review, we aimed to answer 3 key questions about physiologic monitor alarms: (1) What proportion of alarms warrant attention or clinical intervention (ie, actionable alarms), and how does this proportion vary between adult and pediatric populations and between intensive care unit (ICU) and ward settings? (2) What is the relationship between alarm exposure and clinician response time? (3) What interventions are effective in reducing the frequency of alarms?
We limited our scope to monitor alarms because few studies have evaluated the characteristics of alarms from other medical devices, and because missing relevant monitor alarms could adversely impact patient safety.
METHODS
We performed a systematic review of the literature in accordance with the Meta‐Analysis of Observational Studies in Epidemiology guidelines[5] and developed this manuscript using the Preferred Reporting Items for Systematic Reviews and Meta‐Analyses (PRISMA) statement.[6]
Eligibility Criteria
With help from an experienced biomedical librarian (C.D.S.), we searched PubMed, the Cumulative Index to Nursing and Allied Health Literature, Scopus, Cochrane Library,
We included peer‐reviewed, original research studies published in English, Spanish, or French that addressed the questions outlined above. Eligible patient populations were children and adults admitted to hospital inpatient units and emergency departments (EDs). We excluded alarms in procedural suites or operating rooms (typically responded to by anesthesiologists already with the patient) because of the differences in environment of care, staff‐to‐patient ratio, and equipment. We included observational studies reporting the actionability of physiologic monitor alarms (ie, alarms warranting special attention or clinical intervention), as well as nurse responses to these alarms. We excluded studies focused on the effects of alarms unrelated to patient safety, such as families' and patients' stress, noise, or sleep disturbance. We included only intervention studies evaluating pragmatic interventions ready for clinical implementation (ie, not experimental devices or software algorithms).
Selection Process and Data Extraction
First, 2 authors screened the titles and abstracts of articles for eligibility. To maximize sensitivity, if at least 1 author considered the article relevant, the article proceeded to full‐text review. Second, the full texts of articles screened were independently reviewed by 2 authors in an unblinded fashion to determine their eligibility. Any disagreements concerning eligibility were resolved by team consensus. To assure consistency in eligibility determinations across the team, a core group of the authors (C.W.P, C.P.B., E.E., and V.V.G.) held a series of meetings to review and discuss each potentially eligible article and reach consensus on the final list of included articles. Two authors independently extracted the following characteristics from included studies: alarm review methods, analytic design, fidelity measurement, consideration of unintended adverse safety consequences, and key results. Reviewers were not blinded to journal, authors, or affiliations.
Synthesis of Results and Risk Assessment
Given the high degree of heterogeneity in methodology, we were unable to generate summary proportions of the observational studies or perform a meta‐analysis of the intervention studies. Thus, we organized the studies into clinically relevant categories and presented key aspects in tables. Due to the heterogeneity of the studies and the controversy surrounding quality scores,[5] we did not generate summary scores of study quality. Instead, we evaluated and reported key design elements that had the potential to bias the results. To recognize the more comprehensive studies in the field, we developed by consensus a set of characteristics that distinguished studies with lower risk of bias. These characteristics are shown and defined in Table 1.
| First Author and Publication Year | Alarm Review Method | Indicators of Potential Bias for Observational Studies | Indicators of Potential Bias for Intervention Studies | |||||||||||||
|---|---|---|---|---|---|---|---|---|---|---|---|---|---|---|---|---|
| Monitor System | Direct Observation | Medical Record Review | Rhythm Annotation | Video Observation | Remote Monitoring Staff | Medical Device Industry Involved | Two Independent Reviewers | At Least 1 Reviewer Is a Clinical Expert | Reviewer Not Simultaneously in Patient Care | Clear Definition of Alarm Actionability | Census Included | Statistical Testing or QI SPC Methods | Fidelity Assessed | Safety Assessed | Lower Risk of Bias | |
| ||||||||||||||||
| Adult Observational | ||||||||||||||||
| Atzema 2006[7] | ✓* | ✓ | ✓ | |||||||||||||
| Billinghurst 2003[8] | ✓ | ✓ | ✓ | ✓ | ||||||||||||
| Biot 2000[9] | ✓ | ✓ | ✓ | ✓ | ||||||||||||
| Chambrin 1999[10] | ✓ | ✓ | ✓ | ✓ | ||||||||||||
| Drew 2014[11] | ✓ | ✓ | ✓ | ✓ | ✓ | ✓ | ✓ | ✓ | ||||||||
| Gazarian 2014[12] | ✓ | ✓ | ✓ | ✓ | ✓ | |||||||||||
| Grges 2009[13] | ✓ | ✓ | ✓ | ✓ | ||||||||||||
| Gross 2011[15] | ✓ | ✓ | ✓ | ✓ | ✓ | ✓ | ✓ | |||||||||
| Inokuchi 2013[14] | ✓ | ✓ | ✓ | ✓ | ✓ | ✓ | ✓ | |||||||||
| Koski 1990[16] | ✓ | ✓ | ✓ | ✓ | ||||||||||||
| Morales Snchez 2014[17] | ✓ | ✓ | ✓ | ✓ | ||||||||||||
| Pergher 2014[18] | ✓ | ✓ | ||||||||||||||
| Siebig 2010[19] | ✓ | ✓ | ✓ | ✓ | ✓ | ✓ | ||||||||||
| Voepel‐Lewis 2013[20] | ✓ | ✓ | ✓ | ✓ | ||||||||||||
| Way 2014[21] | ✓ | ✓ | ✓ | |||||||||||||
| Pediatric Observational | ||||||||||||||||
| Bonafide 2015[22] | ✓ | ✓ | ✓ | ✓ | ✓ | ✓ | ✓ | |||||||||
| Lawless 1994[23] | ✓ | ✓ | ||||||||||||||
| Rosman 2013[24] | ✓ | ✓ | ✓ | ✓ | ✓ | |||||||||||
| Talley 2011[25] | ✓ | ✓ | ✓ | ✓ | ✓ | |||||||||||
| Tsien 1997[26] | ✓ | ✓ | ✓ | ✓ | ||||||||||||
| van Pul 2015[27] | ✓ | |||||||||||||||
| Varpio 2012[28] | ✓ | ✓ | ✓ | ✓ | ||||||||||||
| Mixed Adult and Pediatric Observational | ||||||||||||||||
| O'Carroll 1986[29] | ✓ | |||||||||||||||
| Wiklund 1994[30] | ✓ | ✓ | ✓ | ✓ | ||||||||||||
| Adult Intervention | ||||||||||||||||
| Albert 2015[32] | ✓ | ✓ | ✓ | ✓ | ✓ | ✓ | ✓ | |||||||||
| Cvach 2013[33] | ✓ | ✓ | ||||||||||||||
| Cvach 2014[34] | ✓ | ✓ | ||||||||||||||
| Graham 2010[35] | ✓ | |||||||||||||||
| Rheineck‐Leyssius 1997[36] | ✓ | ✓ | ✓ | ✓ | ✓ | ✓ | ||||||||||
| Taenzer 2010[31] | ✓ | ✓ | ✓ | ✓ | ✓ | ✓ | ||||||||||
| Whalen 2014[37] | ✓ | ✓ | ✓ | |||||||||||||
| Pediatric Intervention | ||||||||||||||||
| Dandoy 2014[38] | ✓ | ✓ | ✓ | ✓ | ✓ | ✓ | ||||||||||
For the purposes of this review, we defined nonactionable alarms as including both invalid (false) alarms that do not that accurately represent the physiologic status of the patient and alarms that are valid but do not warrant special attention or clinical intervention (nuisance alarms). We did not separate out invalid alarms due to the tremendous variation between studies in how validity was measured.
RESULTS
Study Selection
Search results produced 4629 articles (see the flow diagram in the Supporting Information in the online version of this article), of which 32 articles were eligible: 24 observational studies describing alarm characteristics and 8 studies describing interventions to reduce alarm frequency.
Observational Study Characteristics
Characteristics of included studies are shown in Table 1. Of the 24 observational studies,[7, 8, 9, 10, 11, 12, 13, 14, 15, 16, 17, 18, 19, 20, 21, 22, 23, 24, 25, 26, 27, 28, 29, 30] 15 included adult patients,[7, 8, 9, 10, 11, 12, 13, 14, 15, 16, 17, 18, 19, 20, 21] 7 included pediatric patients,[22, 23, 24, 25, 26, 27, 28] and 2 included both adult and pediatric patients.[29, 30] All were single‐hospital studies, except for 1 study by Chambrin and colleagues[10] that included 5 sites. The number of patient‐hours examined in each study ranged from 60 to 113,880.[7, 8, 9, 10, 11, 13, 14, 15, 16, 18, 19, 20, 21, 22, 23, 24, 25, 26, 27, 29, 30] Hospital settings included ICUs (n = 16),[9, 10, 11, 13, 14, 16, 17, 18, 19, 22, 23, 24, 25, 26, 27, 29] general wards (n = 5),[12, 15, 20, 22, 28] EDs (n = 2),[7, 21] postanesthesia care unit (PACU) (n = 1),[30] and cardiac care unit (CCU) (n = 1).[8] Studies varied in the type of physiologic signals recorded and data collection methods, ranging from direct observation by a nurse who was simultaneously caring for patients[29] to video recording with expert review.[14, 19, 22] Four observational studies met the criteria for lower risk of bias.[11, 14, 15, 22]
Intervention Study Characteristics
Of the 8 intervention studies, 7 included adult patients,[31, 32, 33, 34, 35, 36, 37] and 1 included pediatric patients.[38] All were single‐hospital studies; 6 were quasi‐experimental[31, 33, 34, 35, 37, 38] and 2 were experimental.[32, 36] Settings included progressive care units (n = 3),[33, 34, 35] CCUs (n = 3),[32, 33, 37] wards (n = 2),[31, 38] PACU (n = 1),[36] and a step‐down unit (n = 1).[32] All except 1 study[32] used the monitoring system to record alarm data. Several studies evaluated multicomponent interventions that included combinations of the following: widening alarm parameters,[31, 35, 36, 37, 38] instituting alarm delays,[31, 34, 36, 38] reconfiguring alarm acuity,[35, 37] use of secondary notifications,[34] daily change of electrocardiographic electrodes or use of disposable electrocardiographic wires,[32, 33, 38] universal monitoring in high‐risk populations,[31] and timely discontinuation of monitoring in low‐risk populations.[38] Four intervention studies met our prespecified lower risk of bias criteria.[31, 32, 36, 38]
Proportion of Alarms Considered Actionable
Results of the observational studies are provided in Table 2. The proportion of alarms that were actionable was <1% to 26% in adult ICU settings,[9, 10, 11, 13, 14, 16, 17, 19] 20% to 36% in adult ward settings,[12, 15, 20] 17% in a mixed adult and pediatric PACU setting,[30] 3% to 13% in pediatric ICU settings,[22, 23, 24, 25, 26] and 1% in a pediatric ward setting.[22]
| Signals Included | ||||||||||
|---|---|---|---|---|---|---|---|---|---|---|
| First Author and Publication Year | Setting | Monitored Patient‐Hours | SpO2 | ECG Arrhythmia | ECG Parametersa | Blood Pressure | Total Alarms | Actionable Alarms | Alarm Response | Lower Risk of Bias |
| ||||||||||
| Adult | ||||||||||
| Atzema 2006[7] | ED | 371 | ✓ | 1,762 | 0.20% | |||||
| Billinghurst 2003[8] | CCU | 420 | ✓ | 751 | Not reported; 17% were valid | Nurses with higher acuity patients and smaller % of valid alarms had slower response rates | ||||
| Biot 2000[9] | ICU | 250 | ✓ | ✓ | ✓ | ✓ | 3,665 | 3% | ||
| Chambrin 1999[10] | ICU | 1,971 | ✓ | ✓ | ✓ | ✓ | 3,188 | 26% | ||
| Drew 2014[11] | ICU | 48,173 | ✓ | ✓ | ✓ | ✓ | 2,558,760 | 0.3% of 3,861 VT alarms | ✓ | |
| Gazarian 2014[12] | Ward | 54 nurse‐hours | ✓ | ✓ | ✓ | 205 | 22% | Response to 47% of alarms | ||
| Grges 2009[13] | ICU | 200 | ✓ | ✓ | ✓ | ✓ | 1,214 | 5% | ||
| Gross 2011[15] | Ward | 530 | ✓ | ✓ | ✓ | ✓ | 4,393 | 20% | ✓ | |
| Inokuchi 2013[14] | ICU | 2,697 | ✓ | ✓ | ✓ | ✓ | 11,591 | 6% | ✓ | |
| Koski 1990[16] | ICU | 400 | ✓ | ✓ | 2,322 | 12% | ||||
| Morales Snchez 2014[17] | ICU | 434 sessions | ✓ | ✓ | ✓ | 215 | 25% | Response to 93% of alarms, of which 50% were within 10 seconds | ||
| Pergher 2014[18] | ICU | 60 | ✓ | 76 | Not reported | 72% of alarms stopped before nurse response or had >10 minutes response time | ||||
| Siebig 2010[19] | ICU | 982 | ✓ | ✓ | ✓ | ✓ | 5,934 | 15% | ||
| Voepel‐Lewis 2013[20] | Ward | 1,616 | ✓ | 710 | 36% | Response time was longer for patients in highest quartile of total alarms | ||||
| Way 2014[21] | ED | 93 | ✓ | ✓ | ✓ | ✓ | 572 | Not reported; 75% were valid | Nurses responded to more alarms in resuscitation room vs acute care area, but response time was longer | |
| Pediatric | ||||||||||
| Bonafide 2015[22] | Ward + ICU | 210 | ✓ | ✓ | ✓ | ✓ | 5,070 | 13% PICU, 1% ward | Incremental increases in response time as number of nonactionable alarms in preceding 120 minutes increased | ✓ |
| Lawless 1994[23] | ICU | 928 | ✓ | ✓ | ✓ | 2,176 | 6% | |||
| Rosman 2013[24] | ICU | 8,232 | ✓ | ✓ | ✓ | ✓ | 54,656 | 4% of rhythm alarms true critical" | ||
| Talley 2011[25] | ICU | 1,470∥ | ✓ | ✓ | ✓ | ✓ | 2,245 | 3% | ||
| Tsien 1997[26] | ICU | 298 | ✓ | ✓ | ✓ | 2,942 | 8% | |||
| van Pul 2015[27] | ICU | 113,880∥ | ✓ | ✓ | ✓ | ✓ | 222,751 | Not reported | Assigned nurse did not respond to 6% of alarms within 45 seconds | |
| Varpio 2012[28] | Ward | 49 unit‐hours | ✓ | ✓ | ✓ | ✓ | 446 | Not reported | 70% of all alarms and 41% of crisis alarms were not responded to within 1 minute | |
| Both | ||||||||||
| O'Carroll 1986[29] | ICU | 2,258∥ | ✓ | 284 | 2% | |||||
| Wiklund 1994[30] | PACU | 207 | ✓ | ✓ | ✓ | 1,891 | 17% | |||
Relationship Between Alarm Exposure and Response Time
Whereas 9 studies addressed response time,[8, 12, 17, 18, 20, 21, 22, 27, 28] only 2 evaluated the relationship between alarm burden and nurse response time.[20, 22] Voepel‐Lewis and colleagues found that nurse responses were slower to patients with the highest quartile of alarms (57.6 seconds) compared to those with the lowest (45.4 seconds) or medium (42.3 seconds) quartiles of alarms on an adult ward (P = 0.046). They did not find an association between false alarm exposure and response time.[20] Bonafide and colleagues found incremental increases in response time as the number of nonactionable alarms in the preceding 120 minutes increased (P < 0.001 in the pediatric ICU, P = 0.009 on the pediatric ward).[22]
Interventions Effective in Reducing Alarms
Results of the 8 intervention studies are provided in Table 3. Three studies evaluated single interventions;[32, 33, 36] the remainder of the studies tested interventions with multiple components such that it was impossible to separate the effect of each component. Below, we have summarized study results, arranged by component. Because only 1 study focused on pediatric patients,[38] results from pediatric and adult settings are combined.
| First Author and Publication Year | Design | Setting | Main Intervention Components | Other/ Comments | Key Results | Results Statistically Significant? | Lower Risk of Bias | ||||
|---|---|---|---|---|---|---|---|---|---|---|---|
| Widen Default Settings | Alarm Delays | Reconfigure Alarm Acuity | Secondary Notification | ECG Changes | |||||||
| |||||||||||
| Adult | |||||||||||
| Albert 2015[32] | Experimental (cluster‐randomized) | CCU | ✓ | Disposable vs reusable wires | Disposable leads had 29% fewer no‐telemetry, leads‐fail, and leads‐off alarms and similar artifact alarms | ✓ | ✓ | ||||
| Cvach 2013[33] | Quasi‐experimental (before and after) | CCU and PCU | ✓ | Daily change of electrodes | 46% fewer alarms/bed/day | ||||||
| Cvach 2014[34] | Quasi‐experimental (ITS) | PCU | ✓* | ✓ | Slope of regression line suggests decrease of 0.75 alarms/bed/day | ||||||
| Graham 2010[35] | Quasi‐experimental (before and after) | PCU | ✓ | ✓ | 43% fewer crisis, warning, and system warning alarms on unit | ||||||
| Rheineck‐Leyssius 1997[36] | Experimental (RCT) | PACU | ✓ | ✓ | Alarm limit of 85% had fewer alarms/patient but higher incidence of true hypoxemia for >1 minute (6% vs 2%) | ✓ | ✓ | ||||
| Taenzer 2010[31] | Quasi‐experimental (before and after with concurrent controls) | Ward | ✓ | ✓ | Universal SpO2 monitoring | Rescue events decreased from 3.4 to 1.2 per 1,000 discharges; transfers to ICU decreased from 5.6 to 2.9 per 1,000 patient‐days, only 4 alarms/patient‐day | ✓ | ✓ | |||
| Whalen 2014[37] | Quasi‐experimental (before and after) | CCU | ✓ | ✓ | 89% fewer audible alarms on unit | ✓ | |||||
| Pediatric | |||||||||||
| Dandoy 2014[38] | Quasi‐experimental (ITS) | Ward | ✓ | ✓ | ✓ | Timely monitor discontinuation; daily change of ECG electrodes | Decrease in alarms/patient‐days from 180 to 40 | ✓ | |||
Widening alarm parameter default settings was evaluated in 5 studies:[31, 35, 36, 37, 38] 1 single intervention randomized controlled trial (RCT),[36] and 4 multiple‐intervention, quasi‐experimental studies.[31, 35, 37, 38] In the RCT, using a lower SpO2 limit of 85% instead of the standard 90% resulted in 61% fewer alarms. In the 4 multiple intervention studies, 1 study reported significant reductions in alarm rates (P < 0.001),[37] 1 study did not report preintervention alarm rates but reported a postintervention alarm rate of 4 alarms per patient‐day,[31] and 2 studies reported reductions in alarm rates but did not report any statistical testing.[35, 38] Of the 3 studies examining patient safety, 1 study with universal monitoring reported fewer rescue events and transfers to the ICU postimplementation,[31] 1 study reported no missed acute decompensations,[38] and 1 study (the RCT) reported significantly more true hypoxemia events (P = 0.001).[36]
Alarm delays were evaluated in 4 studies:[31, 34, 36, 38] 3 multiple‐intervention, quasi‐experimental studies[31, 34, 38] and 1 retrospective analysis of data from an RCT.[36] One study combined alarm delays with widening defaults in a universal monitoring strategy and reported a postintervention alarm rate of 4 alarms per patient.[31] Another study evaluated delays as part of a secondary notification pager system and found a negatively sloping regression line that suggested a decreasing alarm rate, but did not report statistical testing.[34] The third study reported a reduction in alarm rates but did not report statistical testing.[38] The RCT compared the impact of a hypothetical 15‐second alarm delay to that of a lower SpO2 limit reduction and reported a similar reduction in alarms.[36] Of the 4 studies examining patient safety, 1 study with universal monitoring reported improvements,[31] 2 studies reported no adverse outcomes,[35, 38] and the retrospective analysis of data from the RCT reported the theoretical adverse outcome of delayed detection of sudden, severe desaturations.[36]
Reconfiguring alarm acuity was evaluated in 2 studies, both of which were multiple‐intervention quasi‐experimental studies.[35, 37] Both showed reductions in alarm rates: 1 was significant without increasing adverse events (P < 0.001),[37] and the other did not report statistical testing or safety outcomes.[35]
Secondary notification of nurses using pagers was the main intervention component of 1 study incorporating delays between the alarms and the alarm pages.[34] As mentioned above, a negatively sloping regression line was displayed, but no statistical testing or safety outcomes were reported.
Disposable electrocardiographic lead wires or daily electrode changes were evaluated in 3 studies:[32, 33, 38] 1 single intervention cluster‐randomized trial[32] and 2 quasi‐experimental studies.[33, 38] In the cluster‐randomized trial, disposable lead wires were compared to reusable lead wires, with disposable lead wires having significantly fewer technical alarms for lead signal failures (P = 0.03) but a similar number of monitoring artifact alarms (P = 0.44).[32] In a single‐intervention, quasi‐experimental study, daily electrode change showed a reduction in alarms, but no statistical testing was reported.[33] One multiple‐intervention, quasi‐experimental study incorporating daily electrode change showed fewer alarms without statistical testing.[38] Of the 2 studies examining patient safety, both reported no adverse outcomes.[32, 38]
DISCUSSION
This systematic review of physiologic monitor alarms in the hospital yielded the following main findings: (1) between 74% and 99% of physiologic monitor alarms were not actionable, (2) a significant relationship between alarm exposure and nurse response time was demonstrated in 2 small observational studies, and (3) although interventions were most often studied in combination, results from the studies with lower risk of bias suggest that widening alarm parameters, implementing alarm delays, and using disposable electrocardiographic lead wires and/or changing electrodes daily are the most promising interventions for reducing alarms. Only 5 of 8 intervention studies measured intervention safety and found that widening alarm parameters and implementing alarm delays had mixed safety outcomes, whereas disposable electrocardiographic lead wires and daily electrode changes had no adverse safety outcomes.[29, 30, 34, 35, 36] Safety measures are crucial to ensuring the highest level of patient safety is met; interventions are rendered useless without ensuring actionable alarms are not disabled. The variation in results across studies likely reflects the wide range of care settings as well as differences in design and quality.
This field is still in its infancy, with 18 of the 32 articles published in the past 5 years. We anticipate improvements in quality and rigor as the field matures, as well as clinically tested interventions that incorporate smart alarms. Smart alarms integrate data from multiple physiologic signals and the patient's history to better detect physiologic changes in the patient and improve the positive predictive value of alarms. Academicindustry partnerships will be required to implement and rigorously test smart alarms and other emerging technologies in the hospital.
To our knowledge, this is the first systematic review focused on monitor alarms with specific review questions relevant to alarm fatigue. Cvach recently published an integrative review of alarm fatigue using research published through 2011.[39] Our review builds upon her work by contributing a more extensive and systematic search strategy with databases spanning nursing, medicine, and engineering, including additional languages, and including newer studies published through April 2015. In addition, we included multiple cross‐team checks in our eligibility review to ensure high sensitivity and specificity of the resulting set of studies.
Although we focused on interventions aiming to reduce alarms, there has also been important recent work focused on reducing telemetry utilization in adult hospital populations as well as work focused on reducing pulse oximetry utilization in children admitted with respiratory conditions. Dressler and colleagues reported an immediate and sustained reduction in telemetry utilization in hospitalized adults upon redesign of cardiac telemetry order sets to include the clinical indication, which defaulted to the American Heart Association guideline‐recommended telemetry duration.[40] Instructions for bedside nurses were also included in the order set to facilitate appropriate telemetry discontinuation. Schondelmeyer and colleagues reported reductions in continuous pulse oximetry utilization in hospitalized children with asthma and bronchiolitis upon introduction of a multifaceted quality improvement program that included provider education, a nurse handoff checklist, and discontinuation criteria incorporated into order sets.[41]
Limitations of This Review and the Underlying Body of Work
There are limitations to this systematic review and its underlying body of work. With respect to our approach to this systematic review, we focused only on monitor alarms. Numerous other medical devices generate alarms in the patient‐care environment that also can contribute to alarm fatigue and deserve equally rigorous evaluation. With respect to the underlying body of work, the quality of individual studies was generally low. For example, determinations of alarm actionability were often made by a single rater without evaluation of the reliability or validity of these determinations, and statistical testing was often missing. There were also limitations specific to intervention studies, including evaluation of nongeneralizable patient populations, failure to measure the fidelity of the interventions, inadequate measures of intervention safety, and failure to statistically evaluate alarm reductions. Finally, though not necessarily a limitation, several studies were conducted by authors involved in or funded by the medical device industry.[11, 15, 19, 31, 32] This has the potential to introduce bias, although we have no indication that the quality of the science was adversely impacted.
Moving forward, the research agenda for physiologic monitor alarms should include the following: (1) more intensive focus on evaluating the relationship between alarm exposure and response time with analysis of important mediating factors that may promote or prevent alarm fatigue, (2) emphasis on studying interventions aimed at improving alarm management using rigorous designs such as cluster‐randomized trials and trials randomized by individual participant, (3) monitoring and reporting clinically meaningful balancing measures that represent unintended consequences of disabling or delaying potentially important alarms and possibly reducing the clinicians' ability to detect true patient deterioration and intervene in a timely manner, and (4) support for transparent academicindustry partnerships to evaluate new alarm technology in real‐world settings. As evidence‐based interventions emerge, there will be new opportunities to study different implementation strategies of these interventions to optimize effectiveness.
CONCLUSIONS
The body of literature relevant to physiologic monitor alarm characteristics and alarm fatigue is limited but growing rapidly. Although we know that most alarms are not actionable and that there appears to be a relationship between alarm exposure and response time that could be caused by alarm fatigue, we cannot yet say with certainty that we know which interventions are most effective in safely reducing unnecessary alarms. Interventions that appear most promising and should be prioritized for intensive evaluation include widening alarm parameters, implementing alarm delays, and using disposable electrocardiographic lead wires and changing electrodes daily. Careful evaluation of these interventions must include systematically examining adverse patient safety consequences.
Acknowledgements
The authors thank Amogh Karnik and Micheal Sellars for their technical assistance during the review and extraction process.
Disclosures: Ms. Zander is supported by the Society of Hospital Medicine Student Hospitalist Scholar Grant. Dr. Bonafide and Ms. Stemler are supported by the National Heart, Lung, and Blood Institute of the National Institutes of Health under award number K23HL116427. The content is solely the responsibility of the authors and does not necessarily represent the official views of the National Institutes of Health. The authors report no conflicts of interest.
- National Patient Safety Goals Effective January 1, 2015. The Joint Commission Web site. http://www.jointcommission.org/assets/1/6/2015_NPSG_HAP.pdf. Accessed July 17, 2015.
- ECRI Institute. 2015 Top 10 Health Technology Hazards. Available at: https://www.ecri.org/Pages/2015‐Hazards.aspx. Accessed June 23, 2015.
- , . Alarm fatigue: a patient safety concern. AACN Adv Crit Care. 2013;24(4):378–386.
- , . Redesigning hospital alarms for patient safety: alarmed and potentially dangerous. JAMA. 2014;311(12):1199–1200.
- , , , et al. Meta‐analysis of observational studies in epidemiology: a proposal for reporting. Meta‐analysis Of Observational Studies in Epidemiology (MOOSE) Group. JAMA. 2000;283(15):2008–2012.
- , , , ; PRISMA Group. Preferred reporting items for systematic reviews and meta‐analyses: the PRISMA statement. Ann Intern Med. 2009;151(4):264–269, W64.
- , , , , . ALARMED: adverse events in low‐risk patients with chest pain receiving continuous electrocardiographic monitoring in the emergency department. A pilot study. Am J Emerg Med. 2006;24:62–67.
- , , . Patient and nurse‐related implications of remote cardiac telemetry. Clin Nurs Res. 2003;12(4):356–370.
- , , , , . Clinical evaluation of alarm efficiency in intensive care [in French]. Ann Fr Anesth Reanim. 2000;19:459–466.
- , , , , , . Multicentric study of monitoring alarms in the adult intensive care unit (ICU): a descriptive analysis. Intensive Care Med. 1999;25:1360–1366.
- , , , et al. Insights into the problem of alarm fatigue with physiologic monitor devices: a comprehensive observational study of consecutive intensive care unit patients. PloS One. 2014;9(10):e110274.
- . Nurses' response to frequency and types of electrocardiography alarms in a non‐ critical care setting: a descriptive study. Int J Nurs Stud. 2014;51(2):190–197.
- , , . Improving alarm performance in the medical intensive care unit using delays and clinical context. Anesth Analg. 2009;108:1546–1552.
- , , , et al. The proportion of clinically relevant alarms decreases as patient clinical severity decreases in intensive care units: a pilot study. BMJ Open. 2013;3(9):e003354–e003354.
- , , . Physiologic monitoring alarm load on medical/surgical floors of a community hospital. Biomed Instrum Technol. 2011;45:29–36.
- , , , . Frequency and reliability of alarms in the monitoring of cardiac postoperative patients. Int J Clin Monit Comput. 1990;7(2):129–133.
- , , , et al. Audit of the bedside monitor alarms in a critical care unit [in Spanish]. Enferm Intensiva. 2014;25(3):83–90.
- , . Stimulus‐response time to invasive blood pressure alarms: implications for the safety of critical‐care patients. Rev Gaúcha Enferm. 2014;35(2):135–141.
- , , , , , . Intensive care unit alarms— how many do we need? Crit Care Med. 2010;38:451–456.
- , , , et al. Pulse oximetry desaturation alarms on a general postoperative adult unit: a prospective observational study of nurse response time. Int J Nurs Stud. 2013;50(10):1351–1358.
- , , . Whats that noise? Bedside monitoring in the Emergency Department. Int Emerg Nurs. 2014;22(4):197–201.
- , , , et al. Association between exposure to nonactionable physiologic monitor alarms and response time in a children's hospital. J Hosp Med. 2015;10(6):345–351.
- . Crying wolf: false alarms in a pediatric intensive care unit. Crit Care Med. 1994;22(6):981–985.
- , , , , . What are we missing? Arrhythmia detection in the pediatric intensive care unit. J Pediatr. 2013;163(2):511–514.
- , , , et al. Cardiopulmonary monitors and clinically significant events in critically ill children. Biomed Instrum Technol. 2011;45(s1):38–45.
- , . Poor prognosis for existing monitors in the intensive care unit. Crit Care Med. 1997;25:614–619.
- , , , , . Safe patient monitoring is challenging but still feasible in a neonatal intensive care unit with single family rooms. Acta Paediatr Oslo Nor 1992. 2015;104(6):e247–e254.
- , , , . The helpful or hindering effects of in‐hospital patient monitor alarms on nurses: a qualitative analysis. CIN Comput Inform Nurs. 2012;30(4):210–217.
- . Survey of alarms in an intensive therapy unit. Anaesthesia. 1986;41(7):742–744.
- , , , . Postanesthesia monitoring revisited: frequency of true and false alarms from different monitoring devices. J Clin Anesth. 1994;6(3):182–188.
- , , , . Impact of pulse oximetry surveillance on rescue events and intensive care unit transfers: a before‐and‐after concurrence study. Anesthesiology. 2010;112(2):282–287.
- , , , et al. Differences in alarm events between disposable and reusable electrocardiography lead wires. Am J Crit Care. 2015;24(1):67–74.
- , , , . Daily electrode change and effect on cardiac monitor alarms: an evidence‐based practice approach. J Nurs Care Qual. 2013;28:265–271.
- , , , . Use of pagers with an alarm escalation system to reduce cardiac monitor alarm signals. J Nurs Care Qual. 2014;29(1):9–18.
- , . Monitor alarm fatigue: standardizing use of physiological monitors and decreasing nuisance alarms. Am J Crit Care. 2010;19:28–34.
- , . Influence of pulse oximeter lower alarm limit on the incidence of hypoxaemia in the recovery room. Br J Anaesth. 1997;79(4):460–464.
- , , , , , . Novel approach to cardiac alarm management on telemetry units. J Cardiovasc Nurs. 2014;29(5):E13–E22.
- , , , et al. A team‐based approach to reducing cardiac monitor alarms. Pediatrics. 2014;134(6):e1686–e1694.
- . Monitor alarm fatigue: an integrative review. Biomed Instrum Technol. 2012;46(4):268–277.
- , , , , . Altering overuse of cardiac telemetry in non‐intensive care unit settings by hardwiring the use of American Heart Association guidelines. JAMA Intern Med. 2014;174(11):1852–1854.
- , , , et al. Using quality improvement to reduce continuous pulse oximetry use in children with wheezing. Pediatrics. 2015;135(4):e1044–e1051.
- , . The feasibility of creating a checklist for the assessment of the methodological quality both of randomised and non‐randomised studies of health care interventions. J Epidemiol Community Health. 1998;52(6):377–384.