User login
Fauci: Cautious optimism for COVID-19 vaccine by end of 2020
with distribution of first doses possible before the end of the year, according to Anthony S. Fauci, MD, director, National Institute of Allergy and Infectious Diseases, Bethesda, Md.

“Given the rate of infection that’s going on in this country, and the distribution of the clinical trial sites involving tens of thousands of volunteers, we project that we will have an answer as to whether or not we have a safe and effective vaccine by November or December,” Dr. Fauci said today in his virtual keynote address during the annual meeting of the American College of Chest Physicians.
“It may come earlier -- this month, in October,” he added in his remarks. “That is unlikely – it is more likely that we’ll have an answer in November and December.”
If that timing does come to pass, Dr. Fauci said, it’s possible that distribution of doses could start at the end of the year, continuing throughout the beginning and middle of 2021.
Although there are no guarantees, Dr. Fauci said he is “cautiously optimistic” regarding the timeline.
He said that his optimism is based in part on animal studies and phase 1 data that demonstrate robust neutralizing antibody responses to a vaccine that are equivalent to, if not greater than, natural infection with the SARS-CoV-2 virus that causes COVID-19.
Rapid development gives reason for hope
Ryan C. Maves, MD, FCCP, a critical care and infectious disease specialist at Naval Medical Center San Diego, said there is reason to be hopeful that a vaccine will be available by the end of the calendar year. He cautioned, however, that this timing is based on the assumption that one of the vaccines will be proven safe and effective very soon.
“We’re lucky to have multiple phase 3 trials using multiple vaccine technologies in different platforms,” Dr. Maves said in a panel discussion following Dr. Fauci’s remarks. “I think the odds are very high that one of them will be effective.”
“I’m hoping that multiple vaccines will be effective,” Dr. Maves added. “Then we’ll be in a good position of determining which is the best of several good options, as a society and as a world.”
COVID-19 vaccine development over the past year has been remarkably fast, especially given the previous record set by the mumps vaccine, which took about four years to go from initial steps to rollout, Dr. Maves noted.
Dr. Fauci said the federal government has taken a “strategic approach” to the COVID-19 vaccine that includes direct involvement in the research and development of six different vaccine candidates, five of which are now in phase 3 trials.
As part of that strategic approach, the study protocols are harmonized to have a common data and safety monitoring board, common primary and secondary endpoints, and an independent statistical group to determine correlates of protection, Dr. Fauci said.
Prioritizing COVID-19 vaccine distribution
Who gets COVID-19 vaccine first will be a challenge for governmental organizations as well as bioethicists, who have proposed different strategies for fairly prioritizing different groups for access.
Reaching communities of color will be an important consideration for prioritization, according to Dr. Maves, given the disproportionate burden of disease on Black and Hispanic individuals, among other such populations.
COVID-19–related hospitalization rates have been substantially higher in communities of color, Dr. Fauci said in his keynote address. Age-adjusted hospitalization rates for Hispanic/Latinx and Black populations are 375 to 368 per 100,000, respectively, compared with just 82 per 100,000 for White non-Hispanics, according to data from the Centers for Disease Control and Prevention.
Outreach to those communities should include building trust in those populations that they will benefit from a safe and effective vaccine, and making sure that the vaccine is available to those communities as quickly as possible, Dr. Maves said.
Dr. Fauci and Dr. Maves provided no disclosures related to their presentations.
with distribution of first doses possible before the end of the year, according to Anthony S. Fauci, MD, director, National Institute of Allergy and Infectious Diseases, Bethesda, Md.
“Given the rate of infection that’s going on in this country, and the distribution of the clinical trial sites involving tens of thousands of volunteers, we project that we will have an answer as to whether or not we have a safe and effective vaccine by November or December,” Dr. Fauci said today in his virtual keynote address during the annual meeting of the American College of Chest Physicians.
“It may come earlier -- this month, in October,” he added in his remarks. “That is unlikely – it is more likely that we’ll have an answer in November and December.”
If that timing does come to pass, Dr. Fauci said, it’s possible that distribution of doses could start at the end of the year, continuing throughout the beginning and middle of 2021.
Although there are no guarantees, Dr. Fauci said he is “cautiously optimistic” regarding the timeline.
He said that his optimism is based in part on animal studies and phase 1 data that demonstrate robust neutralizing antibody responses to a vaccine that are equivalent to, if not greater than, natural infection with the SARS-CoV-2 virus that causes COVID-19.
Rapid development gives reason for hope
Ryan C. Maves, MD, FCCP, a critical care and infectious disease specialist at Naval Medical Center San Diego, said there is reason to be hopeful that a vaccine will be available by the end of the calendar year. He cautioned, however, that this timing is based on the assumption that one of the vaccines will be proven safe and effective very soon.
“We’re lucky to have multiple phase 3 trials using multiple vaccine technologies in different platforms,” Dr. Maves said in a panel discussion following Dr. Fauci’s remarks. “I think the odds are very high that one of them will be effective.”
“I’m hoping that multiple vaccines will be effective,” Dr. Maves added. “Then we’ll be in a good position of determining which is the best of several good options, as a society and as a world.”
COVID-19 vaccine development over the past year has been remarkably fast, especially given the previous record set by the mumps vaccine, which took about four years to go from initial steps to rollout, Dr. Maves noted.
Dr. Fauci said the federal government has taken a “strategic approach” to the COVID-19 vaccine that includes direct involvement in the research and development of six different vaccine candidates, five of which are now in phase 3 trials.
As part of that strategic approach, the study protocols are harmonized to have a common data and safety monitoring board, common primary and secondary endpoints, and an independent statistical group to determine correlates of protection, Dr. Fauci said.
Prioritizing COVID-19 vaccine distribution
Who gets COVID-19 vaccine first will be a challenge for governmental organizations as well as bioethicists, who have proposed different strategies for fairly prioritizing different groups for access.
Reaching communities of color will be an important consideration for prioritization, according to Dr. Maves, given the disproportionate burden of disease on Black and Hispanic individuals, among other such populations.
COVID-19–related hospitalization rates have been substantially higher in communities of color, Dr. Fauci said in his keynote address. Age-adjusted hospitalization rates for Hispanic/Latinx and Black populations are 375 to 368 per 100,000, respectively, compared with just 82 per 100,000 for White non-Hispanics, according to data from the Centers for Disease Control and Prevention.
Outreach to those communities should include building trust in those populations that they will benefit from a safe and effective vaccine, and making sure that the vaccine is available to those communities as quickly as possible, Dr. Maves said.
Dr. Fauci and Dr. Maves provided no disclosures related to their presentations.
FROM CHEST 2020
Ruling out PE in pregnancy
ILLUSTRATIVE CASE
A 28-year-old G2P1001 at 28 weeks’ gestation presents to your clinic with 1 day of dyspnea and palpitations. Her pregnancy has been otherwise uncomplicated. She reports worsening dyspnea with mild exertion but denies other symptoms, including leg swelling.
The current incidence of venous thromboembolism (VTE) in pregnant women is estimated to be a relatively low 5 to 12 events per 10,000 pregnancies, yet the condition is the leading cause of maternal mortality in developed countries.2,3,4 Currently, there are conflicting recommendations among relevant organization guidelines regarding the use of D-dimer testing to aid in the diagnosis of pulmonary embolism (PE) during pregnancy. Both the Working Group in Women’s Health of the Society of Thrombosis and Haemostasis (GTH) and the European Society of Cardiology (ESC) recommend using D-dimer testing to rule out PE in pregnant women (ESC Class IIa, level of evidence B based on small studies, retrospective studies, and observational studies; GTH provides no grade).5,6
Conversely, the Royal College of Obstetricians and Gynaecologists (RCOG), the Society of Obstetricians and Gynaecologists of Canada (SOGC), and the American Thoracic Society (ATS)/Society of Thoracic Radiology recommend against the use of D-dimer testing in pregnant women because pregnant women were excluded from D-dimer validation studies (RCOG and SOGC Grade D; ATS weak recommendation).4,7,8 The American College of Obstetricians and Gynecologists does not have specific recommendations regarding the use of D-dimer testing during pregnancy, but has endorsed the ATS guidelines.4,9 In addition, SOGC recommends against the use of clinical prediction scores (Grade D), and RCOG states that there is no evidence to support their use (Grade C).7,8 The remaining societies do not make a recommendation for or against the use of clinical prediction scores because of the absence of high-quality evidence regarding their use in the pregnant patient population.4,5,6
STUDY SUMMARY
Prospective validation of a strategy to diagnose PE in pregnant women
This multicenter, multinational, prospective diagnostic study involving 395 pregnant women evaluated the accuracy of PE diagnosis across 11 centers in France and Switzerland from August 2008 through July 2016.1 Patients with clinically suspected PE were evaluated in emergency departments. Patients were tested according to a diagnostic algorithm that included pretest clinical probability using the revised Geneva Score for Pulmonary Embolism (www.mdcalc.com/geneva-score-revised-pulmonary-embolism), a clinical prediction tool that uses patient history, presenting symptoms, and clinical signs to classify patients as being at low (0-3/25), intermediate (4-10/25), or high (≥ 11/25) risk;10 high-sensitivity D-dimer testing; bilateral lower limb compression ultrasonography (CUS); computed tomography pulmonary angiography (CTPA); and a ventilation-perfusion (V/Q) scan.
PE was excluded in patients who had a low or intermediate pretest clinical probability score and a negative D-dimer test result (< 500 mcg/L). Patients with a high pretest probability score or positive D-dimer test result underwent CUS, and, if negative, subsequent CTPA. A V/Q scan was performed if the CTPA was inconclusive. If the work-up was negative, PE was excluded.
Untreated pregnant women had clinical follow-up at 3 months. Any cases of suspected VTE were evaluated by a 3-member independent adjudication committee blinded to the initial diagnostic work-up. The primary outcome was the rate of adjudicated VTE events during the 3-month follow-up period. PE was diagnosed in 28 patients (7.1%) and excluded in 367 (clinical probability score and negative D-dimer test result [n = 46], negative CTPA result [n = 290], normal or low-probability V/Q scan [n = 17], and other reason [n = 14]). Twenty-two women received anticoagulation during the follow-up period for other reasons (mainly history of previous VTE disease). No symptomatic VTE events occurred in any of the women after the diagnostic work-up was negative, including among those patients who were ruled out with only the clinical prediction tool and a negative D-dimer test result (rate 0.0%; 95% confidence interval [CI], 0.0%-1%).
WHAT’S NEW
Clinical probability and D-dimer rule out PE in pregnant women
This study ruled out PE in patients with low/intermediate risk as determined by the revised Geneva score and a D-dimer test, enabling patients to avoid further diagnostic testing. This low-cost strategy can be applied easily to the pregnant population.
CAVEATS
Additional research is still needed
From the results of this study, 11.6% of patients (n = 46) had a PE ruled out utilizing the revised Geneva score in conjunction with a D-dimer test result, with avoidance of chest imaging. However, this study was powered for the entire treatment algorithm and was not specifically powered for patients with low- or intermediate-risk pretest probability scores. Since this is the first published prospective diagnostic study of VTE in pregnancy, further research is needed to confirm the findings that a clinical prediction tool and a negative D-dimer test result can safely rule out PE in pregnant women.
In addition, further research is needed to determine pregnancy-adapted D-dimer cut-off values, as the researchers of this study noted that < 500 mcg/L was useful in the first and second trimester, but that levels increased as gestational age increased.
CHALLENGES TO IMPLEMENTATION
None to speak of
Implementing a diagnostic algorithm that incorporates sequential assessment of pretest clinical probability based on the revised Geneva score and a D-dimer measurement should be relatively easy to implement, as both methods are readily available and relatively inexpensive.
ACKNOWLEDGEMENT
The PURLs Surveillance System was supported in part by Grant Number UL1RR024999 from the National Center For Research Resources, a Clinical Translational Science Award to the University of Chicago. The content is solely the responsibility of the authors and does not necessarily represent the official views of the National Center For Research Resources or the National Institutes of Health.
1. Righini M, Robert-Ebadi H, Elias A, et al. Diagnosis of pulmonary embolism during pregnancy. A multicenter prospective management outcome study. Ann Intern Med. 2018;169:766-773.
2. Knight M, Kenyon S, Brocklehurst P, et al. Saving lives, improving mothers’ care: lessons learned to inform future maternity care from the UK and Ireland confidential enquiries into maternal deaths and morbidity 2009-2012. Oxford: National Perinatal Epidemiology Unit, University of Oxford; 2014.
3. Bourjeily G, Paidas M, Khalil H, et al. Pulmonary embolism in pregnancy. Lancet. 2010;375:500-512.
4. Leung AN, Bull TM, Jaeschke R, et al. An official American Thoracic Society/Society of Thoracic Radiology clinical practice guideline: evaluation of suspected pulmonary embolism in pregnancy. Am J Resp Crit Care Med. 2011;184:1200-1208.
5. Konstantinides SV, Meyer G, Becattini C, et al. 2019 ESC Guidelines for the diagnosis and management of acute pulmonary embolism developed in collaboration with the European Respiratory Society (ERS). Eur Heart J. 2020;41:543-603.
6. Linnemann B, Bauersachs R, Rott H, et al. Working Group in Women’s Health of the Society of Thrombosis and Haemostasis. Diagnosis of pregnancy-associated venous thromboembolism-position paper of the Working Group in Women’s Health of the Society of Thrombosis and Haemostasis (GTH). Vasa. 2016;45:87-101.
7. Royal College of Obstetricians & Gynaecologists. Thromboembolic disease in pregnancy and the puerperium: acute management. Green‐top Guideline No. 37b. April 2015.
8. Chan WS, Rey E, Kent NE, et al. Venous thromboembolism and antithrombotic therapy in pregnancy. J Obstet Gynaecol Can. 2014;36:527-553.
9. James A, Birsner M, Kaimal A, American College of Obstetricians and Gynecologists’ Committee on Practice Bulletins‐Obstetrics. ACOG Practice Bulletin No. 196: thromboembolism in pregnancy. Obstet Gynecol. 2018;132:e1-e17.
10. Le Gal G, Righini M, Roy PM, et al. Prediction of pulmonary embolism in the emergency department: the revised Geneva score. Ann Intern Med. 2006;144:165-171.
ILLUSTRATIVE CASE
A 28-year-old G2P1001 at 28 weeks’ gestation presents to your clinic with 1 day of dyspnea and palpitations. Her pregnancy has been otherwise uncomplicated. She reports worsening dyspnea with mild exertion but denies other symptoms, including leg swelling.
The current incidence of venous thromboembolism (VTE) in pregnant women is estimated to be a relatively low 5 to 12 events per 10,000 pregnancies, yet the condition is the leading cause of maternal mortality in developed countries.2,3,4 Currently, there are conflicting recommendations among relevant organization guidelines regarding the use of D-dimer testing to aid in the diagnosis of pulmonary embolism (PE) during pregnancy. Both the Working Group in Women’s Health of the Society of Thrombosis and Haemostasis (GTH) and the European Society of Cardiology (ESC) recommend using D-dimer testing to rule out PE in pregnant women (ESC Class IIa, level of evidence B based on small studies, retrospective studies, and observational studies; GTH provides no grade).5,6
Conversely, the Royal College of Obstetricians and Gynaecologists (RCOG), the Society of Obstetricians and Gynaecologists of Canada (SOGC), and the American Thoracic Society (ATS)/Society of Thoracic Radiology recommend against the use of D-dimer testing in pregnant women because pregnant women were excluded from D-dimer validation studies (RCOG and SOGC Grade D; ATS weak recommendation).4,7,8 The American College of Obstetricians and Gynecologists does not have specific recommendations regarding the use of D-dimer testing during pregnancy, but has endorsed the ATS guidelines.4,9 In addition, SOGC recommends against the use of clinical prediction scores (Grade D), and RCOG states that there is no evidence to support their use (Grade C).7,8 The remaining societies do not make a recommendation for or against the use of clinical prediction scores because of the absence of high-quality evidence regarding their use in the pregnant patient population.4,5,6
STUDY SUMMARY
Prospective validation of a strategy to diagnose PE in pregnant women
This multicenter, multinational, prospective diagnostic study involving 395 pregnant women evaluated the accuracy of PE diagnosis across 11 centers in France and Switzerland from August 2008 through July 2016.1 Patients with clinically suspected PE were evaluated in emergency departments. Patients were tested according to a diagnostic algorithm that included pretest clinical probability using the revised Geneva Score for Pulmonary Embolism (www.mdcalc.com/geneva-score-revised-pulmonary-embolism), a clinical prediction tool that uses patient history, presenting symptoms, and clinical signs to classify patients as being at low (0-3/25), intermediate (4-10/25), or high (≥ 11/25) risk;10 high-sensitivity D-dimer testing; bilateral lower limb compression ultrasonography (CUS); computed tomography pulmonary angiography (CTPA); and a ventilation-perfusion (V/Q) scan.
PE was excluded in patients who had a low or intermediate pretest clinical probability score and a negative D-dimer test result (< 500 mcg/L). Patients with a high pretest probability score or positive D-dimer test result underwent CUS, and, if negative, subsequent CTPA. A V/Q scan was performed if the CTPA was inconclusive. If the work-up was negative, PE was excluded.
Untreated pregnant women had clinical follow-up at 3 months. Any cases of suspected VTE were evaluated by a 3-member independent adjudication committee blinded to the initial diagnostic work-up. The primary outcome was the rate of adjudicated VTE events during the 3-month follow-up period. PE was diagnosed in 28 patients (7.1%) and excluded in 367 (clinical probability score and negative D-dimer test result [n = 46], negative CTPA result [n = 290], normal or low-probability V/Q scan [n = 17], and other reason [n = 14]). Twenty-two women received anticoagulation during the follow-up period for other reasons (mainly history of previous VTE disease). No symptomatic VTE events occurred in any of the women after the diagnostic work-up was negative, including among those patients who were ruled out with only the clinical prediction tool and a negative D-dimer test result (rate 0.0%; 95% confidence interval [CI], 0.0%-1%).
WHAT’S NEW
Clinical probability and D-dimer rule out PE in pregnant women
This study ruled out PE in patients with low/intermediate risk as determined by the revised Geneva score and a D-dimer test, enabling patients to avoid further diagnostic testing. This low-cost strategy can be applied easily to the pregnant population.
CAVEATS
Additional research is still needed
From the results of this study, 11.6% of patients (n = 46) had a PE ruled out utilizing the revised Geneva score in conjunction with a D-dimer test result, with avoidance of chest imaging. However, this study was powered for the entire treatment algorithm and was not specifically powered for patients with low- or intermediate-risk pretest probability scores. Since this is the first published prospective diagnostic study of VTE in pregnancy, further research is needed to confirm the findings that a clinical prediction tool and a negative D-dimer test result can safely rule out PE in pregnant women.
In addition, further research is needed to determine pregnancy-adapted D-dimer cut-off values, as the researchers of this study noted that < 500 mcg/L was useful in the first and second trimester, but that levels increased as gestational age increased.
CHALLENGES TO IMPLEMENTATION
None to speak of
Implementing a diagnostic algorithm that incorporates sequential assessment of pretest clinical probability based on the revised Geneva score and a D-dimer measurement should be relatively easy to implement, as both methods are readily available and relatively inexpensive.
ACKNOWLEDGEMENT
The PURLs Surveillance System was supported in part by Grant Number UL1RR024999 from the National Center For Research Resources, a Clinical Translational Science Award to the University of Chicago. The content is solely the responsibility of the authors and does not necessarily represent the official views of the National Center For Research Resources or the National Institutes of Health.
1. Righini M, Robert-Ebadi H, Elias A, et al. Diagnosis of pulmonary embolism during pregnancy. A multicenter prospective management outcome study. Ann Intern Med. 2018;169:766-773.
2. Knight M, Kenyon S, Brocklehurst P, et al. Saving lives, improving mothers’ care: lessons learned to inform future maternity care from the UK and Ireland confidential enquiries into maternal deaths and morbidity 2009-2012. Oxford: National Perinatal Epidemiology Unit, University of Oxford; 2014.
3. Bourjeily G, Paidas M, Khalil H, et al. Pulmonary embolism in pregnancy. Lancet. 2010;375:500-512.
4. Leung AN, Bull TM, Jaeschke R, et al. An official American Thoracic Society/Society of Thoracic Radiology clinical practice guideline: evaluation of suspected pulmonary embolism in pregnancy. Am J Resp Crit Care Med. 2011;184:1200-1208.
5. Konstantinides SV, Meyer G, Becattini C, et al. 2019 ESC Guidelines for the diagnosis and management of acute pulmonary embolism developed in collaboration with the European Respiratory Society (ERS). Eur Heart J. 2020;41:543-603.
6. Linnemann B, Bauersachs R, Rott H, et al. Working Group in Women’s Health of the Society of Thrombosis and Haemostasis. Diagnosis of pregnancy-associated venous thromboembolism-position paper of the Working Group in Women’s Health of the Society of Thrombosis and Haemostasis (GTH). Vasa. 2016;45:87-101.
7. Royal College of Obstetricians & Gynaecologists. Thromboembolic disease in pregnancy and the puerperium: acute management. Green‐top Guideline No. 37b. April 2015.
8. Chan WS, Rey E, Kent NE, et al. Venous thromboembolism and antithrombotic therapy in pregnancy. J Obstet Gynaecol Can. 2014;36:527-553.
9. James A, Birsner M, Kaimal A, American College of Obstetricians and Gynecologists’ Committee on Practice Bulletins‐Obstetrics. ACOG Practice Bulletin No. 196: thromboembolism in pregnancy. Obstet Gynecol. 2018;132:e1-e17.
10. Le Gal G, Righini M, Roy PM, et al. Prediction of pulmonary embolism in the emergency department: the revised Geneva score. Ann Intern Med. 2006;144:165-171.
PRACTICE CHANGER
Use a clinical probability score to identify patients at low or intermediate risk for pulmonary embolism (PE) and combine that with a high-sensitivity D-dimer test to rule out PE in pregnant women.
STRENGTH OF RECOMMENDATION
B: Prospective diagnostic management outcome study.1
Righini M, Robert-Ebadi H, Elias A, et al. Diagnosis of pulmonary embolism during pregnancy: a multicenter prospective management outcome study. Ann Intern Med. 2018;169:766-773.1

Fourteen-day sports hiatus recommended for children after COVID-19
Children should not return to sports for 14 days after exposure to COVID-19, and those with moderate symptoms should undergo an electrocardiogram before returning, according to the American Academy of Pediatrics.
said Susannah Briskin, MD, a pediatric sports medicine specialist at Rainbow Babies and Children’s Hospital in Cleveland.
“There has been emerging evidence about cases of myocarditis occurring in athletes, including athletes who are asymptomatic with COVID-19,” she said in an interview.
The update aligns the AAP recommendations with those from the American College of Cardiologists, she added.
Recent imaging studies have turned up signs of myocarditis in athletes recovering from mild or asymptomatic cases of COVID-19 and have prompted calls for clearer guidelines about imaging studies and return to play.
Viral myocarditis poses a risk to athletes because it can lead to potentially fatal arrhythmias, Dr. Briskin said.
Although children benefit from participating in sports, these activities also put them at risk of contracting COVID-19 and spreading it to others, the guidance noted.
To balance the risks and benefits, the academy proposed guidelines that vary depending on the severity of the presentation.
In the first category are patients with a severe presentation (hypotension, arrhythmias, need for intubation or extracorporeal membrane oxygenation support, kidney or cardiac failure) or with multisystem inflammatory syndrome. Clinicians should treat these patients as though they have myocarditis. Patients should be restricted from engaging in sports and other exercise for 3-6 months, the guidance stated.
The primary care physician and “appropriate pediatric medical subspecialist, preferably in consultation with a pediatric cardiologist,” should clear them before they return to activities. In examining patients for return to play, clinicians should focus on cardiac symptoms, including chest pain, shortness of breath, fatigue, palpitations, or syncope, the guidance said.
In another category are patients with cardiac symptoms, those with concerning findings on examination, and those with moderate symptoms of COVID-19, including prolonged fever. These patients should undergo an ECG and possibly be referred to a pediatric cardiologist, the guidelines said. These symptoms must be absent for at least 14 days before these patients can return to sports, and the athletes should obtain clearance from their primary care physicians before they resume.
In a third category are patients who have been infected with SARS-CoV-2 or who have had close contact with someone who was infected but who have not themselves experienced symptoms. These athletes should refrain from sports for at least 14 days, the guidelines said.
Children who don’t fall into any of these categories should not be tested for the virus or antibodies to it before participation in sports, the academy said.
The guidelines don’t vary depending on the sport. But the academy has issued separate guidance for parents and guardians to help them evaluate the risk for COVID-19 transmission by sport.
Athletes participating in “sports that have greater amount of contact time or proximity to people would be at higher risk for contracting COVID-19,” Dr. Briskin said. “But I think that’s all fairly common sense, given the recommendations for non–sport-related activity just in terms of social distancing and masking.”
The new guidance called on sports organizers to minimize contact by, for example, modifying drills and conditioning. It recommended that athletes wear masks except during vigorous exercise or when participating in water sports, as well as in other circumstances in which the mask could become a safety hazard.
They also recommended using handwashing stations or hand sanitizer, avoiding contact with shared surfaces, and avoiding small rooms and areas with poor ventilation.
Dr. Briskin disclosed no relevant financial relationships.
A version of this article originally appeared on Medscape.com.
More data on impact of corticosteroids on COVID-19 mortality in patients with COPD
, a study of almost 1 million individuals in the United Kingdom has shown.
Patients with chronic obstructive pulmonary disease or asthma who used ICS on a regular basis were more likely to die from COVID-19 than COPD or asthma patients who were prescribed non-ICS therapies, reported co-lead author Anna Schultze, PhD, of London School of Hygiene & Tropical Medicine and colleagues.
Of note, the increased risk of death among ICS users likely stemmed from greater severity of preexisting chronic respiratory conditions, instead of directly from ICS usage, which has little apparent impact on COVID-19 mortality, the investigators wrote in Lancet Respiratory Medicine.
These findings conflict with a hypothesis proposed early in the pandemic: that ICS may protect individuals from SARS-CoV-2 infection and poor outcomes with COVID-19.
According to Megan Conroy, MD, of the department of internal medicine at the Ohio State University Wexner Medical Center, Columbus, this hypothesis was based on some unexpected epidemiological findings.
“In general, we tend to think people with underlying lung disease – like COPD or asthma – to be at higher risk for severe forms of lower respiratory tract infections,” Dr. Conroy said. “Somewhat surprisingly, early data in the pandemic showed patients with COPD and asthma [were] underrepresented [among patients with COVID] when compared to the prevalence of these diseases in the population.”
This raised the possibility of an incidental protective effect from regular ICS therapy, which “had some strong theoretic pathophysiologic basis,” Dr. Conroy said, referring to research that demonstrated ICS-mediated downregulation of SARS-CoV-2 entry receptors ACE2 and TMPRSS2.
Dr. Schultze and colleagues noted that investigators for two ongoing randomized controlled trials (NCT04331054, NCT04330586) are studying ICS as an intervention for COVID-19; but neither trial includes individuals already taking ICS for chronic respiratory disease.
The present observational study therefore aimed to assess mortality risk within this population. Data were drawn from electronic health records and a U.K. national mortality database, with follow-up ranging from March 1 to May 6, 2020. Eligibility required a relevant prescription within 4 months of first follow-up. In the COPD group, patients were prescribed a long-acting beta agonist plus a long-acting muscarinic antagonist (LABA–LAMA), LABA alone, LABA plus ICS, LABA–LAMA plus ICS, or ICS alone (if prescribed LABA within 4 months).
In the asthma group, patients received low/medium-dose ICS, high-dose ICS, or a short-acting beta agonist (SABA) alone. Patients with COPD were at least 35 years of age, while those with asthma were 18 years or older. Hazard ratios were adjusted for a variety of covariates, including respiratory disease–exacerbation history, age, sex, body mass index, hypertension, diabetes, and others.
These eligibility criteria returned 148,557 patients with COPD and 818,490 with asthma.
Patients with COPD who were prescribed ICS plus LABA-LAMA or ICS plus LABA had an increased risk of COVID-19-related death, compared with those who did not receive ICS (adjusted hazard ratio, 1.39; 95% confidence interval, 1.10-1.76). Separate analyses of patients who received a triple combination (LABA–LAMA plus ICS) versus those who took a dual combination (LABA plus ICS) showed that triple-combination therapy was significantly associated with increased COVID-19-related mortality (aHR, 1.43; 95% CI, 1.12-1.83), while dual-combination therapy was less so (aHR, 1.29; 95% CI, 0.96-1.74). Non–COVID-19–related mortality was significantly increased for all COPD patients who were prescribed ICS, with or without adjustment for covariates.
Asthma patients prescribed high-dose ICS instead of SABA alone had a slightly greater risk of COVID-19–related death, based on an adjusted hazard ratio of 1.55 (95% CI, 1.10-2.18). Those with asthma who received low/medium–dose ICS demonstrated a slight trend toward increased mortality risk, but this was not significant (aHR, 1.14; 95% CI, 0.85-1.54). ICS usage in the asthma group was not linked with a significant increase in non–COVID-19–related death.
“In summary, we found no evidence of a beneficial effect of regular ICS use among people with COPD and asthma on COVID-19–related mortality,” the investigators concluded.
In agreement with the investigators, Dr. Conroy said that the increased mortality rate among ICS users should not be misconstrued as a medication-related risk.
“While the study found that those with COPD or asthma taking ICS and high-dose ICS were at an increased risk of death, this could easily be explained by the likelihood that those are the patients who are more likely to have more severe underlying lung disease,” Dr. Conroy said. “While this observational study did attempt to control for exacerbation history, the ability to do so by electronic health records data is certainly imperfect.”
With this in mind, patients with chronic respiratory disease should be encouraged to adhere to their usual treatment regimen, Dr. Conroy added.
“There isn’t evidence to increase or decrease medications just because of the pandemic,” she said. “A patient with asthma or COPD should continue to take the medications that are needed to achieve good control of their lung disease.”
The study was funded by the U.K. Medical Research Council. The investigators reported additional relationships with the Wellcome Trust, the Good Thinking Foundation, the Laura and John Arnold Foundation, and others. Dr. Conroy reported no conflicts of interest.
SOURCE: Schultze A et al. Lancet Respir Med. 2020 Sep 24. doi: 10.1016/ S2213-2600(20)30415-X.
FROM LANCET RESPIRATORY MEDICINE
COVID-19 may discourage pediatric flu vaccination
Parents who did not vaccinate their children against influenza last year were significantly less likely to do so this year than parents whose children were vaccinated last year, based on survey data from more than 2,000 parents with babies and young children.

“Pediatric vaccination will be an important component to mitigating a dual influenza/COVID-19 epidemic,” Rebeccah L. Sokol, PhD, of Wayne State University, Detroit, and Anna H. Grummon, PhD, of Harvard School of Public Health, Boston, reported in Pediatrics.
Although the pandemic has increased acceptance of some healthy behaviors including handwashing and social distancing, the impact on influenza vaccination rates remains unknown, they said.
To assess parents’ current intentions for flu vaccination of young children this season, the researchers conducted an online survey of 2,164 parents or guardians of children aged between 6 months and 5 years in the United States. The 15-minute online survey was conducted in May 2020 and participants received gift cards. The primary outcome was the impact of the COVID-19 pandemic on parental intentions for having their child vaccinated against seasonal flu this year.
“We measured change categorically, with response options ranging from 1 (I became much less likely to get my child the flu shot next year) to 5 (I became much more likely to get my child the flu shot next year),” the researchers said.
Pandemic changes some parents’ plans
Overall, 60% of parents said that the ongoing pandemic had altered their flu vaccination intentions for their children. About 34% percent of parents whose children did not receive flu vaccine last year said they would not seek the vaccine this year because of the pandemic, compared with 25% of parents whose children received last year’s flu vaccine, a statistically significant difference (P < .001).
Approximately 21% of parents whose children received no flu vaccine last year said the pandemic made them more likely to seek vaccination for the 2020-2021 season, compared with 38% of parents whose children received last year’s flu vaccine.
“These results suggest that overall seasonal influenza vaccination rates may not increase simply because of an ongoing infectious disease pandemic. Instead, a significant predictor of future behavior remains past behavior,” Dr. Sokol and Dr. Grummon said.
The study findings were limited by several factors including the use of a convenience sample and the timing of the survey in May 2020, meaning that survey results might not be generalizable this fall as the pandemic persists, they noted. “Additionally, we assessed intentions to vaccinate; future research will clarify the COVID-19 pandemic’s influence on actual vaccination behaviors.”
The challenge of how to increase uptake of the influenza vaccine during the era of COVID-19 remains, and targeted efforts could include social norms messaging through social media, mass media, or health care providers to increase parents’ intentions to vaccinate, as well as vaccination reminders and presumptive announcements from health care providers that present vaccination as the default option, the researchers added.
Potential for ‘twindemic’ is real
The uptake of flu vaccination is especially important this year, Christopher J. Harrison, MD, director of the vaccine and treatment evaluation unit and professor of pediatrics at the University of Missouri–Kansas City, said in an interview.
“This year we are entering a flu season where the certainty of the timing as well as the potential severity of the season are not known. That said, social distancing and wearing masks – to the extent that enough people conform to COVID-19 precautions – could delay or even blunt the usual influenza season,” he noted.
Unfortunately, the Centers for Disease Control and Prevention and the Food and Drug Administration have had their credibility damaged by the challenges of creating a successful response on the fly to a uniquely multifaceted virus to which previous rules do not apply, Dr. Harrison said. In addition, public confidence was eroded when information about testing and reopening policies were released by non-CDC nonscientists and labeled “CDC recommended,” with no opportunity for the scientific community to correct inaccuracies.
“The current study reveals that public trust in influenza vaccine and indirectly in health authorities has been affected by the pandemic,” said Dr. Harrison. “Vaccine hesitancy has increased somewhat even among previous vaccine accepters. One wonders if promises of a quick COVID-19 vaccine increased mistrust of the FDA because of safety concerns, even among the most ardent provaccine population, and whether these concerns are bleeding over into influenza vaccine concerns.
“This only adds to the anxiety that families feel about visiting any medical facility for routine vaccines while the pandemic rages, and we now are in a fall SARS-CoV-2 resurgence,” he added.
Although the current study data are concerning, “there could still be a net gain of pediatric influenza vaccine uptake this season because the 34% less likely to immunize among previously nonimmunizing families would be counterbalanced by 21% of the same group being more likely to immunize their children [theoretical net loss of 13%],” Dr. Harrison explained. “But the pandemic seems to have motivated previously influenza-immunizing families, i.e. while 24% were less likely, 39% are more likely to immunize [theoretical net gain of 15%]. That said, we would still be way short of the number needed to get to herd immunity.”
Dr. Harrison said he found the findings somewhat surprising, but perhaps he should not have. “I had hoped for more acceptance rather than most people staying in their prior vaccine ‘opinion lanes,’ ending up with likely little overall net change in plans to immunize despite increased health awareness caused by a pandemic.”
However, “the U.S. population has been polarized on vaccines and particularly influenza vaccines for more than 50 years, so why would a pandemic make us less polarized, particularly when the pandemic itself has been a polarizing event?” he questioned.
The greatest barriers to flu vaccination for children this year include a lack of motivation among families to visit immunization sites, given the ongoing need for social distancing and masks, Dr. Harrison said.
“Another barrier is the waning public confidence in our medical/scientific national leaders and organizations,” he emphasized. “This makes it crucial that primary care providers step up and be extra strong vaccine advocates, despite the fact that pandemic economics and necessary safety processes have stressed providers and devastated practices. Indeed, in times of medical stress, no one gets more trust from families than their own personal provider.”
Ultimately, avenues for future research include asking diverse groups of families what they feel they need to hear to be more engaged in immunizing children against influenza. But for now, the current study findings identify that “the public is not uniformly responding to the pandemic’s influence on their likelihood of immunizing their children against influenza,” Dr. Harrison said.
“We now know the size of the problem and hopefully governments, public health organizations, pediatric advocates and clinical care givers can find ways to magnify the message that a pandemic year is not a year to avoid seasonal influenza vaccine unless one has a true contraindication,” Dr. Harrison said.
In addition, “one wonders if the poll were taken today – post the president’s COVID-19 illness – would the answers be different?” he noted.
Dr. Sokol’s work was supported in part by the Eunice Kennedy Shriver National Institute of Child Health and Human Development but otherwise had no financial conflicts to disclose. Dr. Harrison disclosed that his institution receives grant funding from Merck, Pfizer, and GlaxoSmithKline for pediatric noninfluenza vaccine studies on which he is a subinvestigator, and support from the CDC for pediatric respiratory and gastrointestinal virus surveillance studies on which he is an investigator.
SOURCE: Sokol RL, Grummon AH. Pediatrics. 2020 Sep 30. doi: 10.1542/peds.2020-022871.
Parents who did not vaccinate their children against influenza last year were significantly less likely to do so this year than parents whose children were vaccinated last year, based on survey data from more than 2,000 parents with babies and young children.
“Pediatric vaccination will be an important component to mitigating a dual influenza/COVID-19 epidemic,” Rebeccah L. Sokol, PhD, of Wayne State University, Detroit, and Anna H. Grummon, PhD, of Harvard School of Public Health, Boston, reported in Pediatrics.
Although the pandemic has increased acceptance of some healthy behaviors including handwashing and social distancing, the impact on influenza vaccination rates remains unknown, they said.
To assess parents’ current intentions for flu vaccination of young children this season, the researchers conducted an online survey of 2,164 parents or guardians of children aged between 6 months and 5 years in the United States. The 15-minute online survey was conducted in May 2020 and participants received gift cards. The primary outcome was the impact of the COVID-19 pandemic on parental intentions for having their child vaccinated against seasonal flu this year.
“We measured change categorically, with response options ranging from 1 (I became much less likely to get my child the flu shot next year) to 5 (I became much more likely to get my child the flu shot next year),” the researchers said.
Pandemic changes some parents’ plans
Overall, 60% of parents said that the ongoing pandemic had altered their flu vaccination intentions for their children. About 34% percent of parents whose children did not receive flu vaccine last year said they would not seek the vaccine this year because of the pandemic, compared with 25% of parents whose children received last year’s flu vaccine, a statistically significant difference (P < .001).
Approximately 21% of parents whose children received no flu vaccine last year said the pandemic made them more likely to seek vaccination for the 2020-2021 season, compared with 38% of parents whose children received last year’s flu vaccine.
“These results suggest that overall seasonal influenza vaccination rates may not increase simply because of an ongoing infectious disease pandemic. Instead, a significant predictor of future behavior remains past behavior,” Dr. Sokol and Dr. Grummon said.
The study findings were limited by several factors including the use of a convenience sample and the timing of the survey in May 2020, meaning that survey results might not be generalizable this fall as the pandemic persists, they noted. “Additionally, we assessed intentions to vaccinate; future research will clarify the COVID-19 pandemic’s influence on actual vaccination behaviors.”
The challenge of how to increase uptake of the influenza vaccine during the era of COVID-19 remains, and targeted efforts could include social norms messaging through social media, mass media, or health care providers to increase parents’ intentions to vaccinate, as well as vaccination reminders and presumptive announcements from health care providers that present vaccination as the default option, the researchers added.
Potential for ‘twindemic’ is real
The uptake of flu vaccination is especially important this year, Christopher J. Harrison, MD, director of the vaccine and treatment evaluation unit and professor of pediatrics at the University of Missouri–Kansas City, said in an interview.
“This year we are entering a flu season where the certainty of the timing as well as the potential severity of the season are not known. That said, social distancing and wearing masks – to the extent that enough people conform to COVID-19 precautions – could delay or even blunt the usual influenza season,” he noted.
Unfortunately, the Centers for Disease Control and Prevention and the Food and Drug Administration have had their credibility damaged by the challenges of creating a successful response on the fly to a uniquely multifaceted virus to which previous rules do not apply, Dr. Harrison said. In addition, public confidence was eroded when information about testing and reopening policies were released by non-CDC nonscientists and labeled “CDC recommended,” with no opportunity for the scientific community to correct inaccuracies.
“The current study reveals that public trust in influenza vaccine and indirectly in health authorities has been affected by the pandemic,” said Dr. Harrison. “Vaccine hesitancy has increased somewhat even among previous vaccine accepters. One wonders if promises of a quick COVID-19 vaccine increased mistrust of the FDA because of safety concerns, even among the most ardent provaccine population, and whether these concerns are bleeding over into influenza vaccine concerns.
“This only adds to the anxiety that families feel about visiting any medical facility for routine vaccines while the pandemic rages, and we now are in a fall SARS-CoV-2 resurgence,” he added.
Although the current study data are concerning, “there could still be a net gain of pediatric influenza vaccine uptake this season because the 34% less likely to immunize among previously nonimmunizing families would be counterbalanced by 21% of the same group being more likely to immunize their children [theoretical net loss of 13%],” Dr. Harrison explained. “But the pandemic seems to have motivated previously influenza-immunizing families, i.e. while 24% were less likely, 39% are more likely to immunize [theoretical net gain of 15%]. That said, we would still be way short of the number needed to get to herd immunity.”
Dr. Harrison said he found the findings somewhat surprising, but perhaps he should not have. “I had hoped for more acceptance rather than most people staying in their prior vaccine ‘opinion lanes,’ ending up with likely little overall net change in plans to immunize despite increased health awareness caused by a pandemic.”
However, “the U.S. population has been polarized on vaccines and particularly influenza vaccines for more than 50 years, so why would a pandemic make us less polarized, particularly when the pandemic itself has been a polarizing event?” he questioned.
The greatest barriers to flu vaccination for children this year include a lack of motivation among families to visit immunization sites, given the ongoing need for social distancing and masks, Dr. Harrison said.
“Another barrier is the waning public confidence in our medical/scientific national leaders and organizations,” he emphasized. “This makes it crucial that primary care providers step up and be extra strong vaccine advocates, despite the fact that pandemic economics and necessary safety processes have stressed providers and devastated practices. Indeed, in times of medical stress, no one gets more trust from families than their own personal provider.”
Ultimately, avenues for future research include asking diverse groups of families what they feel they need to hear to be more engaged in immunizing children against influenza. But for now, the current study findings identify that “the public is not uniformly responding to the pandemic’s influence on their likelihood of immunizing their children against influenza,” Dr. Harrison said.
“We now know the size of the problem and hopefully governments, public health organizations, pediatric advocates and clinical care givers can find ways to magnify the message that a pandemic year is not a year to avoid seasonal influenza vaccine unless one has a true contraindication,” Dr. Harrison said.
In addition, “one wonders if the poll were taken today – post the president’s COVID-19 illness – would the answers be different?” he noted.
Dr. Sokol’s work was supported in part by the Eunice Kennedy Shriver National Institute of Child Health and Human Development but otherwise had no financial conflicts to disclose. Dr. Harrison disclosed that his institution receives grant funding from Merck, Pfizer, and GlaxoSmithKline for pediatric noninfluenza vaccine studies on which he is a subinvestigator, and support from the CDC for pediatric respiratory and gastrointestinal virus surveillance studies on which he is an investigator.
SOURCE: Sokol RL, Grummon AH. Pediatrics. 2020 Sep 30. doi: 10.1542/peds.2020-022871.
FROM PEDIATRICS
Children’s share of new COVID-19 cases is on the rise
The cumulative percentage of COVID-19 cases reported in children continues to climb, but “the history behind that cumulative number shows substantial change,” according to a new analysis of state health department data.
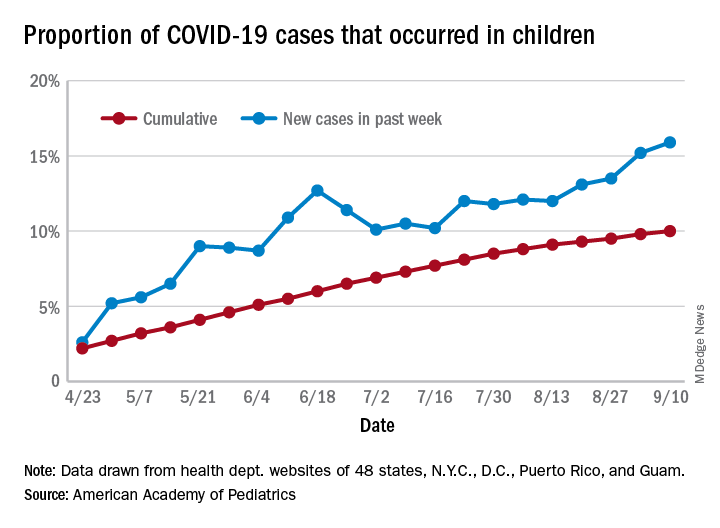
As of Sept. 10, the 549,432 cases in children represented 10.0% of all reported COVID-19 cases in the United States following a substantial rise over the course of the pandemic – the figure was 7.7% on July 16 and 3.2% on May 7, Blake Sisk, PhD, of the American Academy of Pediatrics and associates reported Sept. 29 in Pediatrics.
Unlike the cumulative number, the weekly proportion of cases in children fell early in the summer but then started climbing again in late July. Dr. Sisk and associates wrote.
Despite the increase, however, the proportion of pediatric COVID-19 cases is still well below children’s share of the overall population (22.6%). Also, “it is unclear how much of the increase in child cases is due to increased testing capacity, although CDC data from public and commercial laboratories show the share of all tests administered to children ages 0-17 has remained stable at 5%-7% since late April,” they said.
Data for the current report were drawn from 49 state health department websites (New York state does not report ages for COVID-19 cases), along with New York City, the District of Columbia, Puerto Rico, and Guam. Alabama changed its definition of a child case in August and was not included in the trend analysis (see graph), the investigators explained.
Those data show “substantial variation in case growth by region: in April, a preponderance of cases was in the Northeast. In June, cases surged in the South and West, followed by mid-July increases in the Midwest,” Dr. Sisk and associates said.
The increase among children in Midwest states is ongoing with the number of new cases reaching its highest level yet during the week ending Sept. 10, they reported.
SOURCE: Sisk B et al. Pediatrics. 2020 Sep 29. doi: 10.1542/peds.2020-027425.
The cumulative percentage of COVID-19 cases reported in children continues to climb, but “the history behind that cumulative number shows substantial change,” according to a new analysis of state health department data.
As of Sept. 10, the 549,432 cases in children represented 10.0% of all reported COVID-19 cases in the United States following a substantial rise over the course of the pandemic – the figure was 7.7% on July 16 and 3.2% on May 7, Blake Sisk, PhD, of the American Academy of Pediatrics and associates reported Sept. 29 in Pediatrics.
Unlike the cumulative number, the weekly proportion of cases in children fell early in the summer but then started climbing again in late July. Dr. Sisk and associates wrote.
Despite the increase, however, the proportion of pediatric COVID-19 cases is still well below children’s share of the overall population (22.6%). Also, “it is unclear how much of the increase in child cases is due to increased testing capacity, although CDC data from public and commercial laboratories show the share of all tests administered to children ages 0-17 has remained stable at 5%-7% since late April,” they said.
Data for the current report were drawn from 49 state health department websites (New York state does not report ages for COVID-19 cases), along with New York City, the District of Columbia, Puerto Rico, and Guam. Alabama changed its definition of a child case in August and was not included in the trend analysis (see graph), the investigators explained.
Those data show “substantial variation in case growth by region: in April, a preponderance of cases was in the Northeast. In June, cases surged in the South and West, followed by mid-July increases in the Midwest,” Dr. Sisk and associates said.
The increase among children in Midwest states is ongoing with the number of new cases reaching its highest level yet during the week ending Sept. 10, they reported.
SOURCE: Sisk B et al. Pediatrics. 2020 Sep 29. doi: 10.1542/peds.2020-027425.
FROM PEDIATRICS
CDC playbook prepares states for rollout of COVID-19 vaccine if one is approved
States have begun preparing to distribute a COVID-19 vaccine if one is approved, a CDC official said today.
The CDC released guidance for states on Sept. 16 titled COVID-19 Vaccination Program Interim Playbook for Jurisdiction Operations. The document discusses vaccine ordering, storage, and handling and says that states should submit their plans for vaccine distribution to the agency by Oct. 16.
“Every jurisdiction is heavily involved right now in their plan development,” CDC official Janell Routh, MD, told the Advisory Committee on Immunization Practices during its Sept. 22 meeting. “It was really impressive to me that, even though the playbook only went out last week, states and jurisdictions have been thinking about this for quite some time.”
However, one committee member suggested that setting a deadline before more safety, efficacy, and storage information is known may be premature.
“I cannot imagine that we will actually know the final storage requirements for this vaccine by Oct. 16, which makes me a little concerned about finalizing state plans,” said Helen “Keipp” Talbot, MD, MPH, associate professor of medicine at Vanderbilt University Medical Center in Nashville, Tenn. “We also don’t know the best populations yet when it comes to efficacy and safety.”
Dr. Routh said the CDC is asking states to plan on the basis of assumptions. “We know those plans will constantly be improving, changing, as we learn more information,” Dr. Routh said. States agreed to return a plan 30 days after the playbook was released, which is how the Oct. 16 deadline was established, she said.
States are encouraged to think broadly. Plans may include contingencies for a product that requires ultracold storage or for distributing more than one vaccine product, Dr. Routh said.
“One goal is to be ready on the first day that we can actually distribute vaccine,” Nancy Messonnier, MD, director of the National Center for Immunization and Respiratory Diseases, said during the meeting. “Our colleagues in Operation Warp Speed say that they expect there will be vaccine as early as November, and therefore we need to be ready so there is no delay in distributing that vaccine. And that phase, that early phase, is really close upon us.”
Many states have already developed plans, and the CDC is providing technical assistance as needed to monitor the plans regularly, Dr. Routh said.
Key issues identified
From holding pilot meetings with five jurisdictions, officials learned that public confidence in the vaccine is among states’ greatest concerns, Dr. Routh said. In addition, distribution is resource intensive, and social distancing adds logistical complexity.
Specific guidance on whom to vaccinate in the early stages will smooth the process, officials suggested during the pilot meetings. For the first several weeks, vaccine doses may be limited to priority populations, such as health care workers.
“This interim playbook is a living document,” Dr. Routh emphasized. “We definitely plan to update the content regularly as we learn more information about what vaccines and when they will be released.”
During the early stages of COVID-19 vaccination, officials plan to implement an enhanced monitoring program in which vaccine recipients would complete surveys about adverse events, in addition to the traditional vaccine safety monitoring programs that already exist, officials said.
A version of this article originally appeared on Medscape.com.
Clinical Utility of Methicillin-Resistant Staphylococcus aureus Polymerase Chain Reaction Nasal Swab Testing in Lower Respiratory Tract Infections
From the Hospital of Central Connecticut, New Britain, CT (Dr. Caulfield and Dr. Shepard); Hartford Hospital, Hartford, CT (Dr. Linder and Dr. Dempsey); and the Hartford HealthCare Research Program, Hartford, CT (Dr. O’Sullivan).
Abstract
- Objective: To assess the utility of methicillin-resistant Staphylococcus aureus (MRSA) polymerase chain reaction (PCR) nasal swab testing in patients with lower respiratory tract infections (LRTI).
- Design and setting: Multicenter, retrospective, electronic chart review conducted within the Hartford HealthCare system.
- Participants: Patients who were treated for LRTIs at the Hospital of Central Connecticut or Hartford Hospital between July 1, 2018, and June 30, 2019.
- Measurements: The primary outcome was anti-MRSA days of therapy (DOT) in patients who underwent MRSA PCR testing versus those who did not. In a subgroup analysis, we compared anti-MRSA DOT among patients with appropriate versus inappropriate utilization of the MRSA PCR test.
- Results: Of the 319 patients treated for LRTIs, 155 (48.6%) had a MRSA PCR ordered, and appropriate utilization occurred in 94 (60.6%) of these patients. Anti-MRSA DOT in the MRSA PCR group (n = 155) was shorter than in the group that did not undergo MRSA PCR testing (n = 164), but this difference did not reach statistical significance (1.68 days [interquartile range {IQR}, 0.80-2.74] vs 1.86 days [IQR, 0.56-3.33], P = 0.458). In the subgroup analysis, anti-MRSA DOT was significantly shorter in the MRSA PCR group with appropriate utilization compared to the inappropriate utilization group (1.16 [IQR, 0.44-1.88] vs 2.68 [IQR, 1.75-3.76], P < 0.001)
- Conclusion: Appropriate utilization of MRSA PCR nasal swab testing can reduce DOT in patients with LRTI. Further education is necessary to expand the appropriate use of the MRSA PCR test across our health system.
Keywords: MRSA; LRTI; pneumonia; antimicrobial stewardship; antibiotic resistance.
More than 300,000 patients were hospitalized with methicillin-resistant Staphylococcus aureus (MRSA) infections in the United States in 2017, and at least 10,000 of these cases resulted in mortality.1 While MRSA infections overall are decreasing, it is crucial to continue to employ antimicrobial stewardship tactics to keep these infections at bay. Recently, strains of S. aureus have become resistant to vancomycin, making this bacterium even more difficult to treat.2
A novel tactic in antimicrobial stewardship involves the use of MRSA polymerase chain reaction (PCR) nasal swab testing to rule out the presence of MRSA in patients with lower respiratory tract infections (LRTI). If used appropriately, this approach may decrease the number of days patients are treated with anti-MRSA antimicrobials. Waiting for cultures to speciate can take up to 72 hours,3 meaning that patients may be exposed to 3 days of unnecessary broad-spectrum antibiotics. Results of MRSA PCR assay of nasal swab specimens can be available in 1 to 2 hours,4 allowing for more rapid de-escalation of therapy. Numerous studies have shown that this test has a negative predictive value (NPV) greater than 95%, indicating that a negative nasal swab result may be useful to guide de-escalation of antibiotic therapy.5-8 The purpose of this study was to assess the utility of MRSA PCR nasal swab testing in patients with LRTI throughout the Hartford HealthCare system.
Methods
Design
This study was a multicenter, retrospective, electronic chart review. It was approved by the Hartford HealthCare Institutional Review Board (HHC-2019-0169).
Selection of Participants
Patients were identified through electronic medical record reports based on ICD-10 codes. Records were categorized into 2 groups: patients who received a MRSA PCR nasal swab testing and patients who did not. Patients who received the MRSA PCR were further categorized by appropriate or inappropriate utilization. Appropriate utilization of the MRSA PCR was defined as MRSA PCR ordered within 48 hours of a new vancomycin or linezolid order, and anti-MRSA therapy discontinued within 24 hours of a negative result. Inappropriate utilization of the MRSA PCR was defined as MRSA PCR ordered more than 48 hours after a new vancomycin or linezolid order, or continuation of anti-MRSA therapy despite a negative MRSA PCR and no other evidence of a MRSA infection.
Patients were included if they met all of the following criteria: age 18 years or older, with no upper age limit; treated for a LRTI, identified by ICD-10 codes (J13-22, J44, J85); treated with empiric antibiotics active against MRSA, specifically vancomycin or linezolid; and treated at the Hospital of Central Connecticut (HOCC) or Hartford Hospital (HH) between July 1, 2018, and June 30, 2019, inclusive. Patients were excluded if they met 1 or more of the following criteria: age less than 18 years old; admitted for 48 hours or fewer or discharged from the emergency department; not treated at either facility; treated before July 1, 2018, or after June 30, 2019; treated for ventilator-associated pneumonia; received anti-MRSA therapy within 30 days prior to admission; or treated for a concurrent bacterial infection requiring anti-MRSA therapy.
Outcome Measures
The primary outcome was anti-MRSA days of therapy (DOT) in patients who underwent MRSA PCR testing compared to patients who did not undergo MRSA PCR testing. A subgroup analysis was completed to compare anti-MRSA DOT within patients in the MRSA PCR group. Patients in the subgroup were categorized by appropriate or inappropriate utilization, and anti-MRSA DOT were compared between these groups. Secondary outcomes that were evaluated included length of stay (LOS), 30-day readmission rate, and incidence of acute kidney injury (AKI). Thirty-day readmission was defined as admission to HOCC, HH, or any institution within Hartford HealthCare within 30 days of discharge. AKI was defined as an increase in serum creatinine by ≥ 0.3 mg/dL in 48 hours, increase ≥ 1.5 times baseline, or a urine volume < 0.5 mL/kg/hr for 6 hours.
Statistical Analyses
The study was powered for the primary outcome, anti-MRSA DOT, with a clinically meaningful difference of 1 day. Group sample sizes of 240 in the MRSA PCR group and 160 in the no MRSA PCR group would have afforded 92% power to detect that difference, if the null hypothesis was that both group means were 4 days and the alternative hypothesis was that the mean of the MRSA PCR group was 3 days, with estimated group standard deviations of 80% of each mean. This estimate used an alpha level of 0.05 with a 2-sided t-test. Among those who received a MRSA PCR test, a clinically meaningful difference between appropriate and inappropriate utilization was 5%.
Descriptive statistics were provided for all variables as a function of the individual hospital and for the combined data set. Continuous data were summarized with means and standard deviations (SD), or with median and interquartile ranges (IQR), depending on distribution. Categorical variables were reported as frequencies, using percentages. All data were evaluated for normality of distribution. Inferential statistics comprised a Student’s t-test to compare normally distributed, continuous data between groups. Nonparametric distributions were compared using a Mann-Whitney U test. Categorical comparisons were made using a Fisher’s exact test for 2×2 tables and a Pearson chi-square test for comparisons involving more than 2 groups.
Since anti-MRSA DOT (primary outcome) and LOS (secondary outcome) are often non-normally distributed, they have been transformed (eg, log or square root, again depending on distribution). Whichever native variable or transformation variable was appropriate was used as the outcome measure in a linear regression model to account for the influence of factors (covariates) that show significant univariate differences. Given the relatively small sample size, a maximum of 10 variables were included in the model. All factors were iterated in a forward regression model (most influential first) until no significant changes were observed.
All calculations were performed with SPSS v. 21 (IBM; Armonk, NY) using an a priori alpha level of 0.05, such that all results yielding P < 0.05 were deemed statistically significant.
Results
Of the 561 patient records reviewed, 319 patients were included and 242 patients were excluded. Reasons for exclusion included 65 patients admitted for a duration of 48 hours or less or discharged from the emergency department; 61 patients having another infection requiring anti-MRSA therapy; 60 patients not having a diagnosis of a LRTI or not receiving anti-MRSA therapy; 52 patients having received anti-MRSA therapy within 30 days prior to admission; and 4 patients treated outside of the specified date range.
Of the 319 patients included, 155 (48.6%) were in the MRSA PCR group and 164 (51.4%) were in the group that did not undergo MRSA PCR (Table 1). Of the 155 patients with a MRSA PCR ordered, the test was utilized appropriately in 94 (60.6%) patients and inappropriately in 61 (39.4%) patients (Table 2). In the MRSA PCR group, 135 patients had a negative result on PCR assay, with 133 of those patients having negative respiratory cultures, resulting in a NPV of 98.5%. Differences in baseline characteristics between the MRSA PCR and no MRSA PCR groups were observed. The patients in the MRSA PCR group appeared to be significantly more ill than those in the no MRSA PCR group, as indicated by statistically significant differences in intensive care unit (ICU) admissions (P = 0.001), positive chest radiographs (P = 0.034), sepsis at time of anti-MRSA initiation (P = 0.013), pulmonary consults placed (P = 0.003), and carbapenem usage (P = 0.047).

In the subgroup analysis comparing appropriate and inappropriate utilization within the MRSA PCR group, the inappropriate utilization group had significantly higher numbers of infectious diseases consults placed, patients with hospital-acquired pneumonia, and patients with community-acquired pneumonia with risk factors.

Outcomes
Median anti-MRSA DOT in the MRSA PCR group was shorter than DOT in the no MRSA PCR group, but this difference did not reach statistical significance (1.68 [IQR, 0.80-2.74] vs 1.86 days [IQR, 0.56-3.33], P = 0.458; Table 3). LOS in the MRSA PCR group was longer than in the no MRSA PCR group (6.0 [IQR, 4.0-10.0] vs 5.0 [IQR, 3.0-7.0] days, P = 0.001). There was no difference in 30-day readmissions that were related to the previous visit or incidence of AKI between groups.

In the subgroup analysis, anti-MRSA DOT in the MRSA PCR group with appropriate utilization was shorter than DOT in the MRSA PCR group with inappropriate utilization (1.16 [IQR, 0.44-1.88] vs 2.68 [IQR, 1.75-3.76] days, P < 0.001; Table 4). LOS in the MRSA PCR group with appropriate utilization was shorter than LOS in the inappropriate utilization group (5.0 [IQR, 4.0-7.0] vs 7.0 [IQR, 5.0-12.0] days, P < 0.001). Thirty-day readmissions that were related to the previous visit were significantly higher in patients in the MRSA PCR group with appropriate utilization (13 vs 2, P = 0.030). There was no difference in incidence of AKI between the groups.

A multivariate analysis was completed to determine whether the sicker MRSA PCR population was confounding outcomes, particularly the secondary outcome of LOS, which was noted to be longer in the MRSA PCR group (Table 5). When comparing LOS in the MRSA PCR and the no MRSA PCR patients, the multivariate analysis showed that admission to the ICU and carbapenem use were associated with a longer LOS (P < 0.001 and P = 0.009, respectively). The incidence of admission to the ICU and carbapenem use were higher in the MRSA PCR group (P = 0.001 and P = 0.047). Therefore, longer LOS in the MRSA PCR patients could be a result of the higher prevalence of ICU admissions and infections requiring carbapenem therapy rather than the result of the MRSA PCR itself.

Discussion
A MRSA PCR nasal swab protocol can be used to minimize a patient’s exposure to unnecessary broad-spectrum antibiotics, thereby preventing antimicrobial resistance. Thus, it is important to assess how our health system is utilizing this antimicrobial stewardship tactic. With the MRSA PCR’s high NPV, providers can be confident that MRSA pneumonia is unlikely in the absence of MRSA colonization. Our study established a NPV of 98.5%, which is similar to other studies, all of which have shown NPVs greater than 95%.5-8 Despite the high NPV, this study demonstrated that only 51.4% of patients with LRTI had orders for a MRSA PCR. Of the 155 patients with a MRSA PCR, the test was utilized appropriately only 60.6% of the time. A majority of the inappropriately utilized tests were due to MRSA PCR orders placed more than 48 hours after anti-MRSA therapy initiation. To our knowledge, no other studies have assessed the clinical utility of MRSA PCR nasal swabs as an antimicrobial stewardship tool in a diverse health system; therefore, these results are useful to guide future practices at our institution. There is a clear need for provider and pharmacist education to increase the use of MRSA PCR nasal swab testing for patients with LRTI being treated with anti-MRSA therapy. Additionally, clinician education regarding the initial timing of the MRSA PCR order and the proper utilization of the results of the MRSA PCR likely will benefit patient outcomes at our institution.
When evaluating anti-MRSA DOT, this study demonstrated a reduction of only 0.18 days (about 4 hours) of anti-MRSA therapy in the patients who received MRSA PCR testing compared to the patients without a MRSA PCR ordered. Our anti-MRSA DOT reduction was lower than what has been reported in similar studies. For example, Baby et al found that the use of the MRSA PCR was associated with 46.6 fewer hours of unnecessary antimicrobial treatment. Willis et al evaluated a pharmacist-driven protocol that resulted in a reduction of 1.8 days of anti-MRSA therapy, despite a protocol compliance rate of only 55%.9,10 In our study, the patients in the MRSA PCR group appeared to be significantly more ill than those in the no MRSA PCR group, which may be the reason for the incongruences in our results compared to the current literature. Characteristics such as ICU admissions, positive chest radiographs, sepsis cases, pulmonary consults, and carbapenem usage—all of which are indicative of a sicker population—were more prevalent in the MRSA PCR group. This sicker population could have underestimated the reduction of DOT in the MRSA PCR group compared to the no MRSA PCR group.
After isolating the MRSA PCR patients in the subgroup analysis, anti-MRSA DOT was 1.5 days shorter when the test was appropriately utilized, which is more comparable to what has been reported in the literature.9,10 Only 60.6% of the MRSA PCR patients had their anti-MRSA therapy appropriately managed based on the MRSA PCR. Interestingly, a majority of patients in the inappropriate utilization group had MRSA PCR tests ordered more than 48 hours after beginning anti-MRSA therapy. More prompt and efficient ordering of the MRSA PCR may have resulted in more opportunities for earlier de-escalation of therapy. Due to these factors, the patients in the inappropriate utilization group could have further contributed to the underestimated difference in anti-MRSA DOT between the MRSA PCR and no MRSA PCR patients in the primary outcome. Additionally, there were no notable differences between the appropriate and inappropriate utilization groups, unlike in the MRSA PCR and no MRSA PCR groups, which is why we were able to draw more robust conclusions in the subgroup analysis. Therefore, the subgroup analysis confirmed that if the results of the MRSA PCR are used appropriately to guide anti-MRSA therapy, patients can potentially avoid 36 hours of broad-spectrum antibiotics.
Data on how the utilization of the MRSA PCR nasal swab can affect LOS are limited; however, one study did report a 2.8-day reduction in LOS after implementation of a pharmacist-driven MRSA PCR nasal swab protocol.11 Our study demonstrated that LOS was significantly longer in the MRSA PCR group than in the no MRSA PCR group. This result was likely affected by the aforementioned sicker MRSA PCR population. Our multivariate analysis further confirmed that ICU admissions were associated with a longer LOS, and, given that the MRSA PCR group had a significantly higher ICU population, this likely confounded these results. If our 2 groups had had more evenly distributed characteristics, it is possible that we could have found a shorter LOS in the MRSA PCR group, similar to what is reported in the literature. In the subgroup analysis, LOS was 2 days shorter in the appropriate utilization group compared to the inappropriate utilization group. This further affirms that the results of the MRSA PCR must be used appropriately in order for patient outcomes, like LOS, to benefit.
The effects of the MRSA PCR nasal swab on 30-day readmission rates and incidence of AKI are not well-documented in the literature. One study did report 30-day readmission rates as an outcome, but did not cite any difference after the implementation of a protocol that utilized MRSA PCR nasal swab testing.12 The outcome of AKI is slightly better represented in the literature, but the results are conflicting. Some studies report no difference after the implementation of a MRSA PCR-based protocol,11 and others report a significant decrease in AKI with the use of the MRSA PCR.9 Our study detected no difference in 30-day readmission rates related to the previous admission or in AKI between the MRSA PCR and no MRSA PCR populations. In the subgroup analysis, 30-day readmission rates were significantly higher in the MRSA PCR group with appropriate utilization than in the group with inappropriate utilization; however, our study was not powered to detect a difference in this secondary outcome.
This study had some limitations that may have affected our results. First, this study was a retrospective chart review. Additionally, the baseline characteristics were not well balanced across the different groups. There were sicker patients in the MRSA PCR group, which may have led to an underestimate of the reduction in DOT and LOS in these patients. Finally, we did not include enough patient records to reach power in the MRSA PCR group due to a higher than expected number of patients meeting exclusion criteria. Had we attained sufficient power, there may have been more profound reductions in DOT and LOS.
Conclusion
MRSA infections are a common cause for hospitalization, and there is a growing need for antimicrobial stewardship efforts to limit unnecessary antibiotic usage in order to prevent resistance. As illustrated in our study, appropriate utilization of the MRSA PCR can reduce DOT up to 1.5 days. However, our results suggest that there is room for provider and pharmacist education to increase the use of MRSA PCR nasal swab testing in patients with LRTI receiving anti-MRSA therapy. Further emphasis on the appropriate utilization of the MRSA PCR within our health care system is essential.
Corresponding author: Casey Dempsey, PharmD, BCIDP, 80 Seymour St., Hartford, CT 06106; casey.dempsey@hhchealth.org.
Financial disclosures: None.
1. Antimicrobial resistance threats. Centers for Disease Control and Prevention web site. www.cdc.gov/drugresistance/biggest-threats.html. Accessed September 9, 2020.
2. Biggest threats and data. Centers for Disease Control and Prevention web site. www.cdc.gov/drugresistance/biggest_threats.html#mrsa. Accessed September 9, 2020.
3. Smith MN, Erdman MJ, Ferreira JA, et al. Clinical utility of methicillin-resistant Staphylococcus aureus nasal polymerase chain reaction assay in critically ill patients with nosocomial pneumonia. J Crit Care. 2017;38:168-171.
4. Giancola SE, Nguyen AT, Le B, et al. Clinical utility of a nasal swab methicillin-resistant Staphylococcus aureus polymerase chain reaction test in intensive and intermediate care unit patients with pneumonia. Diagn Microbiol Infect Dis. 2016;86:307-310.
5. Dangerfield B, Chung A, Webb B, Seville MT. Predictive value of methicillin-resistant Staphylococcus aureus (MRSA) nasal swab PCR assay for MRSA pneumonia. Antimicrob Agents Chemother. 2014;58:859-864.
6. Johnson JA, Wright ME, Sheperd LA, et al. Nasal methicillin-resistant Staphylococcus aureus polymerase chain reaction: a potential use in guiding antibiotic therapy for pneumonia. Perm J. 2015;19: 34-36.
7. Dureau AF, Duclos G, Antonini F, et al. Rapid diagnostic test and use of antibiotic against methicillin-resistant Staphylococcus aureus in adult intensive care unit. Eur J Clin Microbiol Infect Dis. 2017;36:267-272.
8. Tilahun B, Faust AC, McCorstin P, Ortegon A. Nasal colonization and lower respiratory tract infections with methicillin-resistant Staphylococcus aureus. Am J Crit Care. 2015;24:8-12.
9. Baby N, Faust AC, Smith T, et al. Nasal methicillin-resistant Staphylococcus aureus (MRSA) PCR testing reduces the duration of MRSA-targeted therapy in patients with suspected MRSA pneumonia. Antimicrob Agents Chemother. 2017;61:e02432-16.
10. Willis C, Allen B, Tucker C, et al. Impact of a pharmacist-driven methicillin-resistant Staphylococcus aureus surveillance protocol. Am J Health-Syst Pharm. 2017;74:1765-1773.
11. Dadzie P, Dietrich T, Ashurst J. Impact of a pharmacist-driven methicillin-resistant Staphylococcus aureus polymerase chain reaction nasal swab protocol on the de-escalation of empiric vancomycin in patients with pneumonia in a rural healthcare setting. Cureus. 2019;11:e6378
12. Dunaway S, Orwig KW, Arbogast ZQ, et al. Evaluation of a pharmacy-driven methicillin-resistant Staphylococcus aureus surveillance protocol in pneumonia. Int J Clin Pharm. 2018;40;526-532.
From the Hospital of Central Connecticut, New Britain, CT (Dr. Caulfield and Dr. Shepard); Hartford Hospital, Hartford, CT (Dr. Linder and Dr. Dempsey); and the Hartford HealthCare Research Program, Hartford, CT (Dr. O’Sullivan).
Abstract
- Objective: To assess the utility of methicillin-resistant Staphylococcus aureus (MRSA) polymerase chain reaction (PCR) nasal swab testing in patients with lower respiratory tract infections (LRTI).
- Design and setting: Multicenter, retrospective, electronic chart review conducted within the Hartford HealthCare system.
- Participants: Patients who were treated for LRTIs at the Hospital of Central Connecticut or Hartford Hospital between July 1, 2018, and June 30, 2019.
- Measurements: The primary outcome was anti-MRSA days of therapy (DOT) in patients who underwent MRSA PCR testing versus those who did not. In a subgroup analysis, we compared anti-MRSA DOT among patients with appropriate versus inappropriate utilization of the MRSA PCR test.
- Results: Of the 319 patients treated for LRTIs, 155 (48.6%) had a MRSA PCR ordered, and appropriate utilization occurred in 94 (60.6%) of these patients. Anti-MRSA DOT in the MRSA PCR group (n = 155) was shorter than in the group that did not undergo MRSA PCR testing (n = 164), but this difference did not reach statistical significance (1.68 days [interquartile range {IQR}, 0.80-2.74] vs 1.86 days [IQR, 0.56-3.33], P = 0.458). In the subgroup analysis, anti-MRSA DOT was significantly shorter in the MRSA PCR group with appropriate utilization compared to the inappropriate utilization group (1.16 [IQR, 0.44-1.88] vs 2.68 [IQR, 1.75-3.76], P < 0.001)
- Conclusion: Appropriate utilization of MRSA PCR nasal swab testing can reduce DOT in patients with LRTI. Further education is necessary to expand the appropriate use of the MRSA PCR test across our health system.
Keywords: MRSA; LRTI; pneumonia; antimicrobial stewardship; antibiotic resistance.
More than 300,000 patients were hospitalized with methicillin-resistant Staphylococcus aureus (MRSA) infections in the United States in 2017, and at least 10,000 of these cases resulted in mortality.1 While MRSA infections overall are decreasing, it is crucial to continue to employ antimicrobial stewardship tactics to keep these infections at bay. Recently, strains of S. aureus have become resistant to vancomycin, making this bacterium even more difficult to treat.2
A novel tactic in antimicrobial stewardship involves the use of MRSA polymerase chain reaction (PCR) nasal swab testing to rule out the presence of MRSA in patients with lower respiratory tract infections (LRTI). If used appropriately, this approach may decrease the number of days patients are treated with anti-MRSA antimicrobials. Waiting for cultures to speciate can take up to 72 hours,3 meaning that patients may be exposed to 3 days of unnecessary broad-spectrum antibiotics. Results of MRSA PCR assay of nasal swab specimens can be available in 1 to 2 hours,4 allowing for more rapid de-escalation of therapy. Numerous studies have shown that this test has a negative predictive value (NPV) greater than 95%, indicating that a negative nasal swab result may be useful to guide de-escalation of antibiotic therapy.5-8 The purpose of this study was to assess the utility of MRSA PCR nasal swab testing in patients with LRTI throughout the Hartford HealthCare system.
Methods
Design
This study was a multicenter, retrospective, electronic chart review. It was approved by the Hartford HealthCare Institutional Review Board (HHC-2019-0169).
Selection of Participants
Patients were identified through electronic medical record reports based on ICD-10 codes. Records were categorized into 2 groups: patients who received a MRSA PCR nasal swab testing and patients who did not. Patients who received the MRSA PCR were further categorized by appropriate or inappropriate utilization. Appropriate utilization of the MRSA PCR was defined as MRSA PCR ordered within 48 hours of a new vancomycin or linezolid order, and anti-MRSA therapy discontinued within 24 hours of a negative result. Inappropriate utilization of the MRSA PCR was defined as MRSA PCR ordered more than 48 hours after a new vancomycin or linezolid order, or continuation of anti-MRSA therapy despite a negative MRSA PCR and no other evidence of a MRSA infection.
Patients were included if they met all of the following criteria: age 18 years or older, with no upper age limit; treated for a LRTI, identified by ICD-10 codes (J13-22, J44, J85); treated with empiric antibiotics active against MRSA, specifically vancomycin or linezolid; and treated at the Hospital of Central Connecticut (HOCC) or Hartford Hospital (HH) between July 1, 2018, and June 30, 2019, inclusive. Patients were excluded if they met 1 or more of the following criteria: age less than 18 years old; admitted for 48 hours or fewer or discharged from the emergency department; not treated at either facility; treated before July 1, 2018, or after June 30, 2019; treated for ventilator-associated pneumonia; received anti-MRSA therapy within 30 days prior to admission; or treated for a concurrent bacterial infection requiring anti-MRSA therapy.
Outcome Measures
The primary outcome was anti-MRSA days of therapy (DOT) in patients who underwent MRSA PCR testing compared to patients who did not undergo MRSA PCR testing. A subgroup analysis was completed to compare anti-MRSA DOT within patients in the MRSA PCR group. Patients in the subgroup were categorized by appropriate or inappropriate utilization, and anti-MRSA DOT were compared between these groups. Secondary outcomes that were evaluated included length of stay (LOS), 30-day readmission rate, and incidence of acute kidney injury (AKI). Thirty-day readmission was defined as admission to HOCC, HH, or any institution within Hartford HealthCare within 30 days of discharge. AKI was defined as an increase in serum creatinine by ≥ 0.3 mg/dL in 48 hours, increase ≥ 1.5 times baseline, or a urine volume < 0.5 mL/kg/hr for 6 hours.
Statistical Analyses
The study was powered for the primary outcome, anti-MRSA DOT, with a clinically meaningful difference of 1 day. Group sample sizes of 240 in the MRSA PCR group and 160 in the no MRSA PCR group would have afforded 92% power to detect that difference, if the null hypothesis was that both group means were 4 days and the alternative hypothesis was that the mean of the MRSA PCR group was 3 days, with estimated group standard deviations of 80% of each mean. This estimate used an alpha level of 0.05 with a 2-sided t-test. Among those who received a MRSA PCR test, a clinically meaningful difference between appropriate and inappropriate utilization was 5%.
Descriptive statistics were provided for all variables as a function of the individual hospital and for the combined data set. Continuous data were summarized with means and standard deviations (SD), or with median and interquartile ranges (IQR), depending on distribution. Categorical variables were reported as frequencies, using percentages. All data were evaluated for normality of distribution. Inferential statistics comprised a Student’s t-test to compare normally distributed, continuous data between groups. Nonparametric distributions were compared using a Mann-Whitney U test. Categorical comparisons were made using a Fisher’s exact test for 2×2 tables and a Pearson chi-square test for comparisons involving more than 2 groups.
Since anti-MRSA DOT (primary outcome) and LOS (secondary outcome) are often non-normally distributed, they have been transformed (eg, log or square root, again depending on distribution). Whichever native variable or transformation variable was appropriate was used as the outcome measure in a linear regression model to account for the influence of factors (covariates) that show significant univariate differences. Given the relatively small sample size, a maximum of 10 variables were included in the model. All factors were iterated in a forward regression model (most influential first) until no significant changes were observed.
All calculations were performed with SPSS v. 21 (IBM; Armonk, NY) using an a priori alpha level of 0.05, such that all results yielding P < 0.05 were deemed statistically significant.
Results
Of the 561 patient records reviewed, 319 patients were included and 242 patients were excluded. Reasons for exclusion included 65 patients admitted for a duration of 48 hours or less or discharged from the emergency department; 61 patients having another infection requiring anti-MRSA therapy; 60 patients not having a diagnosis of a LRTI or not receiving anti-MRSA therapy; 52 patients having received anti-MRSA therapy within 30 days prior to admission; and 4 patients treated outside of the specified date range.
Of the 319 patients included, 155 (48.6%) were in the MRSA PCR group and 164 (51.4%) were in the group that did not undergo MRSA PCR (Table 1). Of the 155 patients with a MRSA PCR ordered, the test was utilized appropriately in 94 (60.6%) patients and inappropriately in 61 (39.4%) patients (Table 2). In the MRSA PCR group, 135 patients had a negative result on PCR assay, with 133 of those patients having negative respiratory cultures, resulting in a NPV of 98.5%. Differences in baseline characteristics between the MRSA PCR and no MRSA PCR groups were observed. The patients in the MRSA PCR group appeared to be significantly more ill than those in the no MRSA PCR group, as indicated by statistically significant differences in intensive care unit (ICU) admissions (P = 0.001), positive chest radiographs (P = 0.034), sepsis at time of anti-MRSA initiation (P = 0.013), pulmonary consults placed (P = 0.003), and carbapenem usage (P = 0.047).
In the subgroup analysis comparing appropriate and inappropriate utilization within the MRSA PCR group, the inappropriate utilization group had significantly higher numbers of infectious diseases consults placed, patients with hospital-acquired pneumonia, and patients with community-acquired pneumonia with risk factors.
Outcomes
Median anti-MRSA DOT in the MRSA PCR group was shorter than DOT in the no MRSA PCR group, but this difference did not reach statistical significance (1.68 [IQR, 0.80-2.74] vs 1.86 days [IQR, 0.56-3.33], P = 0.458; Table 3). LOS in the MRSA PCR group was longer than in the no MRSA PCR group (6.0 [IQR, 4.0-10.0] vs 5.0 [IQR, 3.0-7.0] days, P = 0.001). There was no difference in 30-day readmissions that were related to the previous visit or incidence of AKI between groups.
In the subgroup analysis, anti-MRSA DOT in the MRSA PCR group with appropriate utilization was shorter than DOT in the MRSA PCR group with inappropriate utilization (1.16 [IQR, 0.44-1.88] vs 2.68 [IQR, 1.75-3.76] days, P < 0.001; Table 4). LOS in the MRSA PCR group with appropriate utilization was shorter than LOS in the inappropriate utilization group (5.0 [IQR, 4.0-7.0] vs 7.0 [IQR, 5.0-12.0] days, P < 0.001). Thirty-day readmissions that were related to the previous visit were significantly higher in patients in the MRSA PCR group with appropriate utilization (13 vs 2, P = 0.030). There was no difference in incidence of AKI between the groups.
A multivariate analysis was completed to determine whether the sicker MRSA PCR population was confounding outcomes, particularly the secondary outcome of LOS, which was noted to be longer in the MRSA PCR group (Table 5). When comparing LOS in the MRSA PCR and the no MRSA PCR patients, the multivariate analysis showed that admission to the ICU and carbapenem use were associated with a longer LOS (P < 0.001 and P = 0.009, respectively). The incidence of admission to the ICU and carbapenem use were higher in the MRSA PCR group (P = 0.001 and P = 0.047). Therefore, longer LOS in the MRSA PCR patients could be a result of the higher prevalence of ICU admissions and infections requiring carbapenem therapy rather than the result of the MRSA PCR itself.
Discussion
A MRSA PCR nasal swab protocol can be used to minimize a patient’s exposure to unnecessary broad-spectrum antibiotics, thereby preventing antimicrobial resistance. Thus, it is important to assess how our health system is utilizing this antimicrobial stewardship tactic. With the MRSA PCR’s high NPV, providers can be confident that MRSA pneumonia is unlikely in the absence of MRSA colonization. Our study established a NPV of 98.5%, which is similar to other studies, all of which have shown NPVs greater than 95%.5-8 Despite the high NPV, this study demonstrated that only 51.4% of patients with LRTI had orders for a MRSA PCR. Of the 155 patients with a MRSA PCR, the test was utilized appropriately only 60.6% of the time. A majority of the inappropriately utilized tests were due to MRSA PCR orders placed more than 48 hours after anti-MRSA therapy initiation. To our knowledge, no other studies have assessed the clinical utility of MRSA PCR nasal swabs as an antimicrobial stewardship tool in a diverse health system; therefore, these results are useful to guide future practices at our institution. There is a clear need for provider and pharmacist education to increase the use of MRSA PCR nasal swab testing for patients with LRTI being treated with anti-MRSA therapy. Additionally, clinician education regarding the initial timing of the MRSA PCR order and the proper utilization of the results of the MRSA PCR likely will benefit patient outcomes at our institution.
When evaluating anti-MRSA DOT, this study demonstrated a reduction of only 0.18 days (about 4 hours) of anti-MRSA therapy in the patients who received MRSA PCR testing compared to the patients without a MRSA PCR ordered. Our anti-MRSA DOT reduction was lower than what has been reported in similar studies. For example, Baby et al found that the use of the MRSA PCR was associated with 46.6 fewer hours of unnecessary antimicrobial treatment. Willis et al evaluated a pharmacist-driven protocol that resulted in a reduction of 1.8 days of anti-MRSA therapy, despite a protocol compliance rate of only 55%.9,10 In our study, the patients in the MRSA PCR group appeared to be significantly more ill than those in the no MRSA PCR group, which may be the reason for the incongruences in our results compared to the current literature. Characteristics such as ICU admissions, positive chest radiographs, sepsis cases, pulmonary consults, and carbapenem usage—all of which are indicative of a sicker population—were more prevalent in the MRSA PCR group. This sicker population could have underestimated the reduction of DOT in the MRSA PCR group compared to the no MRSA PCR group.
After isolating the MRSA PCR patients in the subgroup analysis, anti-MRSA DOT was 1.5 days shorter when the test was appropriately utilized, which is more comparable to what has been reported in the literature.9,10 Only 60.6% of the MRSA PCR patients had their anti-MRSA therapy appropriately managed based on the MRSA PCR. Interestingly, a majority of patients in the inappropriate utilization group had MRSA PCR tests ordered more than 48 hours after beginning anti-MRSA therapy. More prompt and efficient ordering of the MRSA PCR may have resulted in more opportunities for earlier de-escalation of therapy. Due to these factors, the patients in the inappropriate utilization group could have further contributed to the underestimated difference in anti-MRSA DOT between the MRSA PCR and no MRSA PCR patients in the primary outcome. Additionally, there were no notable differences between the appropriate and inappropriate utilization groups, unlike in the MRSA PCR and no MRSA PCR groups, which is why we were able to draw more robust conclusions in the subgroup analysis. Therefore, the subgroup analysis confirmed that if the results of the MRSA PCR are used appropriately to guide anti-MRSA therapy, patients can potentially avoid 36 hours of broad-spectrum antibiotics.
Data on how the utilization of the MRSA PCR nasal swab can affect LOS are limited; however, one study did report a 2.8-day reduction in LOS after implementation of a pharmacist-driven MRSA PCR nasal swab protocol.11 Our study demonstrated that LOS was significantly longer in the MRSA PCR group than in the no MRSA PCR group. This result was likely affected by the aforementioned sicker MRSA PCR population. Our multivariate analysis further confirmed that ICU admissions were associated with a longer LOS, and, given that the MRSA PCR group had a significantly higher ICU population, this likely confounded these results. If our 2 groups had had more evenly distributed characteristics, it is possible that we could have found a shorter LOS in the MRSA PCR group, similar to what is reported in the literature. In the subgroup analysis, LOS was 2 days shorter in the appropriate utilization group compared to the inappropriate utilization group. This further affirms that the results of the MRSA PCR must be used appropriately in order for patient outcomes, like LOS, to benefit.
The effects of the MRSA PCR nasal swab on 30-day readmission rates and incidence of AKI are not well-documented in the literature. One study did report 30-day readmission rates as an outcome, but did not cite any difference after the implementation of a protocol that utilized MRSA PCR nasal swab testing.12 The outcome of AKI is slightly better represented in the literature, but the results are conflicting. Some studies report no difference after the implementation of a MRSA PCR-based protocol,11 and others report a significant decrease in AKI with the use of the MRSA PCR.9 Our study detected no difference in 30-day readmission rates related to the previous admission or in AKI between the MRSA PCR and no MRSA PCR populations. In the subgroup analysis, 30-day readmission rates were significantly higher in the MRSA PCR group with appropriate utilization than in the group with inappropriate utilization; however, our study was not powered to detect a difference in this secondary outcome.
This study had some limitations that may have affected our results. First, this study was a retrospective chart review. Additionally, the baseline characteristics were not well balanced across the different groups. There were sicker patients in the MRSA PCR group, which may have led to an underestimate of the reduction in DOT and LOS in these patients. Finally, we did not include enough patient records to reach power in the MRSA PCR group due to a higher than expected number of patients meeting exclusion criteria. Had we attained sufficient power, there may have been more profound reductions in DOT and LOS.
Conclusion
MRSA infections are a common cause for hospitalization, and there is a growing need for antimicrobial stewardship efforts to limit unnecessary antibiotic usage in order to prevent resistance. As illustrated in our study, appropriate utilization of the MRSA PCR can reduce DOT up to 1.5 days. However, our results suggest that there is room for provider and pharmacist education to increase the use of MRSA PCR nasal swab testing in patients with LRTI receiving anti-MRSA therapy. Further emphasis on the appropriate utilization of the MRSA PCR within our health care system is essential.
Corresponding author: Casey Dempsey, PharmD, BCIDP, 80 Seymour St., Hartford, CT 06106; casey.dempsey@hhchealth.org.
Financial disclosures: None.
1. Antimicrobial resistance threats. Centers for Disease Control and Prevention web site. www.cdc.gov/drugresistance/biggest-threats.html. Accessed September 9, 2020.
2. Biggest threats and data. Centers for Disease Control and Prevention web site. www.cdc.gov/drugresistance/biggest_threats.html#mrsa. Accessed September 9, 2020.
3. Smith MN, Erdman MJ, Ferreira JA, et al. Clinical utility of methicillin-resistant Staphylococcus aureus nasal polymerase chain reaction assay in critically ill patients with nosocomial pneumonia. J Crit Care. 2017;38:168-171.
4. Giancola SE, Nguyen AT, Le B, et al. Clinical utility of a nasal swab methicillin-resistant Staphylococcus aureus polymerase chain reaction test in intensive and intermediate care unit patients with pneumonia. Diagn Microbiol Infect Dis. 2016;86:307-310.
5. Dangerfield B, Chung A, Webb B, Seville MT. Predictive value of methicillin-resistant Staphylococcus aureus (MRSA) nasal swab PCR assay for MRSA pneumonia. Antimicrob Agents Chemother. 2014;58:859-864.
6. Johnson JA, Wright ME, Sheperd LA, et al. Nasal methicillin-resistant Staphylococcus aureus polymerase chain reaction: a potential use in guiding antibiotic therapy for pneumonia. Perm J. 2015;19: 34-36.
7. Dureau AF, Duclos G, Antonini F, et al. Rapid diagnostic test and use of antibiotic against methicillin-resistant Staphylococcus aureus in adult intensive care unit. Eur J Clin Microbiol Infect Dis. 2017;36:267-272.
8. Tilahun B, Faust AC, McCorstin P, Ortegon A. Nasal colonization and lower respiratory tract infections with methicillin-resistant Staphylococcus aureus. Am J Crit Care. 2015;24:8-12.
9. Baby N, Faust AC, Smith T, et al. Nasal methicillin-resistant Staphylococcus aureus (MRSA) PCR testing reduces the duration of MRSA-targeted therapy in patients with suspected MRSA pneumonia. Antimicrob Agents Chemother. 2017;61:e02432-16.
10. Willis C, Allen B, Tucker C, et al. Impact of a pharmacist-driven methicillin-resistant Staphylococcus aureus surveillance protocol. Am J Health-Syst Pharm. 2017;74:1765-1773.
11. Dadzie P, Dietrich T, Ashurst J. Impact of a pharmacist-driven methicillin-resistant Staphylococcus aureus polymerase chain reaction nasal swab protocol on the de-escalation of empiric vancomycin in patients with pneumonia in a rural healthcare setting. Cureus. 2019;11:e6378
12. Dunaway S, Orwig KW, Arbogast ZQ, et al. Evaluation of a pharmacy-driven methicillin-resistant Staphylococcus aureus surveillance protocol in pneumonia. Int J Clin Pharm. 2018;40;526-532.
Study validates OSA phenotypes in Latinos
Three previously described clinical phenotypes of obstructive sleep apnea (OSA) have been validated in a large and diverse Hispanic/Latino community-based population for the first time, according to findings presented at the virtual annual meeting of the Associated Professional Sleep Societies.
The three OSA symptom profiles present in this population – labeled “minimally symptomatic,” “disturbed sleep,” and “daytime sleepiness” – are consistent with recent findings from the Sleep Apnea Global Interdisciplinary Consortium, which were published in Sleep, but there are notable differences in the prevalence of these clusters, with the minimally symptomatic cluster much more prevalent than in prior research, reported Kevin Gonzalez, of the University of California, San Diego.
“Other biopsychosocial factors may be contributing to OSA phenotypes among Hispanics and Latinos,” Mr. Gonzalez said in his presentation. Prior research to characterize the heterogeneity of sleep apnea has not included a diverse Latino population, he emphasized.
The adults studied were aged 18-74 years and participants in the multisite Hispanic Community Health Study/Study of Latinos (HCHS/SOL), a comprehensive study of Hispanic/Latino health and disease in the United States. Their respiratory events were measured overnight in HCHS/SOL sleep reading centers with an ARES Unicorder 5.2, B-Alert. Sleep patterns and risk factors were assessed using the Sleep Heart Health Study Sleep Habits Questionnaire and the Epworth Sleepiness Scale.
Participants meeting the criteria for moderate to severe OSA (with an Apnea Hypopnea Index of 15 or above) were included in the analysis (n = 1,623). Their average age was 52.4 ± 13.9 years, and 34.1% were female.
To identify phenotype clusters, investigators performed a latent class analysis using 15 common OSA symptoms and a survey weighted to adjust for selection bias. The three clusters offering the “best” fit for the data aligned with the previously reported phenotypes and identified daytime sleepiness in 15.3%, disturbed sleep (insomnia-like symptoms) in 37.7%, and minimally symptomatic (a low symptom profile) in 46.9%.
These phenotypes were reported in the European Respiratory Journal in 2014 in a cluster analysis of data from a sleep apnea cohort in Iceland and later replicated in the analysis of data from the Sleep Apnea Global Interdisciplinary Consortium published in Sleep in 2018. The consortium study also added two additional phenotypes, labeled “upper airway symptoms dominant” and “sleepiness dominant.”
The prevalence of a “minimally symptomatic group” in the new analysis of the Hispanics/Latinos in the United States is much higher than reported in these prior studies, at least partly, the investigators believed, because the “prior studies were clinical samples, and the people who were minimally symptomatic didn’t get to the sleep centers,” Mr. Gonzalez said in an interview after the meeting.
Patients with a phenotype of daytime sleepiness – the most common phenotype in prior research – constituted only a minority in the Hispanic/Latino population, he said.
Alberto Ramos, MD, of the University of Miami and the principal investigator, said in an interview that the research team is currently analyzing “if and how these different [phenotypic] clusters could affect the incidence of comorbidities” recorded in the HCHS/SOL study, such as hypertension, diabetes, cardiovascular disease, and cognitive decline.
For now, he said, the findings suggest that OSA may be especially underrecognized in Hispanics and Latinos and that there is more research to be done to better identify and stratify patients with varying symptomatology for more personalized treatment and for clinical trial selection. “Maybe we should expand our criteria ... broaden our [recognition] of the presentation of sleep apnea and the symptoms associated with it, not only in Hispanics but maybe in the general population,” Dr. Ramos said.
In commenting on the study, Krishna M. Sundar, MD, FCCP, director of the Sleep-Wake Center at the University of Utah, Salt Lake City, said that insomnia and daytime sleepiness are “key associations with obstructive sleep apnea and may predict different outcomes with untreated OSA.” Such heterogeneity is “only beginning to be appreciated,” he said. “The expression of OSA with these symptoms points to how OSA impacts quality of life” and how symptomatology in addition to Apnea Hypopnea Index “may be an important determinant of treatment benefit and compliance.”
The investigators reported no relevant disclosures. Dr. Sundar said that he is cofounder of Hypnoscure, software for population management of sleep apnea, but with no monies received.
REPORTING FROM SLEEP 2020
2020-2021 respiratory viral season: Onset, presentations, and testing likely to differ in pandemic
Respiratory virus seasons usually follow a fairly well-known pattern. Enterovirus 68 (EV-D68) is a summer-to-early fall virus with biennial peak years. Rhinovirus (HRv) and adenovirus (Adv) occur nearly year-round but may have small upticks in the first month or so that children return to school. Early in the school year, upper respiratory infections from both HRv and Adv and viral sore throats from Adv are common, with conjunctivitis from Adv outbreaks in some years. October to November is human parainfluenza (HPiV) 1 and 2 season, often presenting as croup. Human metapneumovirus infections span October through April. In late November to December, influenza begins, usually with an A type, later transitioning to a B type in February through April. Also in December, respiratory syncytial virus (RSV) starts, characteristically with bronchiolitis presentations, peaking in February to March and tapering off in May. In late March to April, HPiV 3 also appears for 4-6 weeks.

Will 2020-2021 be different?
Summer was remarkably free of expected enterovirus activity, suggesting that the seasonal parade may differ this year. Remember that the 2019-2020 respiratory season suddenly and nearly completely stopped in March because of social distancing and lockdowns needed to address the SARS-CoV-2 pandemic.
The mild influenza season in the southern hemisphere suggests that our influenza season also could be mild. But perhaps not – most southern hemisphere countries that are surveyed for influenza activities had the most intense SARS-CoV-2 mitigations, making the observed mildness potentially related more to social mitigation than less virulent influenza strains. If so, southern hemisphere influenza data may not apply to the United States, where social distancing and masks are ignored or used inconsistently by almost half the population.
Further, the stop-and-go pattern of in-person school/college attendance adds to uncertainties for the usual orderly virus-specific seasonality. The result may be multiple stop-and-go “pop-up” or “mini” outbreaks for any given virus potentially reflected as exaggerated local or regional differences in circulation of various viruses. The erratic seasonality also would increase coinfections, which could present with more severe or different symptoms.
SARS-CoV-2’s potential interaction
Will the relatively mild presentations for most children with SARS-CoV-2 hold up in the setting of coinfections or sequential respiratory viral infections? Could SARS-CoV-2 cause worse/more prolonged symptoms or more sequelae if paired simultaneously or in tandem with a traditional respiratory virus? To date, data on the frequency and severity of SARS-CoV-2 coinfections are conflicting and sparse, but it appears that non-SARS-CoV-2 viruses can be involved in 15%-50% pediatric acute respiratory infections.1,2
However, it may not be important to know about coinfecting viruses other than influenza (can be treated) or SARS-CoV-2 (needs quarantine and contact tracing), unless symptoms are atypical or more severe than usual. For example, a young child with bronchiolitis is most likely infected with RSV, but HPiV, influenza, metapneumovirus, HRv, and even SARS-CoV-2 can cause bronchiolitis. Even so, testing outpatients for RSV or non-influenza is not routine or even clinically helpful. Supportive treatment and restriction from daycare attendance are sufficient management for outpatient ARIs whether presenting as bronchiolitis or not.
Considerations for SARS-CoV-2 testing: Outpatient bronchiolitis
If a child presents with classic bronchiolitis but has above moderate to severe symptoms, is SARS-CoV-2 a consideration? Perhaps, if SARS-CoV-2 acts similarly to non-SARS-CoV-2s.
A recent report from the 30th Multicenter Airway Research Collaboration (MARC-30) surveillance study (2007-2014) of children hospitalized with clinical bronchiolitis evaluated respiratory viruses, including RSV and the four common non-SARS coronaviruses using molecular testing.3 Among 1,880 subjects, a CoV (alpha CoV: NL63 or 229E, or beta CoV: KKU1 or OC43) was detected in 12%. Yet most had only RSV (n = 1,661); 32 had only CoV (n = 32). But note that 219 had both.
Bronchiolitis subjects with CoV were older – median 3.7 (1.4-5.8) vs. 2.8 (1.9-7.2) years – and more likely male than were RSV subjects (68% vs. 58%). OC43 was most frequent followed by equal numbers of HKU1 and NL63, while 229E was the least frequent. Medical utilization and severity did not differ among the CoVs, or between RSV+CoV vs. RSV alone, unless one considered CoV viral load as a variable. ICU use increased when the polymerase chain reaction cycle threshold result indicated a high CoV viral load.
These data suggest CoVs are not infrequent coinfectors with RSV in bronchiolitis – and that SARS-CoV-2 is the same. Therefore, a bronchiolitis presentation doesn’t necessarily take us off the hook for the need to consider SARS-CoV-2 testing, particularly in the somewhat older bronchiolitis patient with more than mild symptoms.
Considerations for SARS-CoV-2 testing: Outpatient influenza-like illness
In 2020-2021, the Centers for Disease Control and Prevention recommends considering empiric antiviral treatment for ILIs (fever plus either cough or sore throat) based upon our clinical judgement, even in non-high-risk children.4
While pediatric COVID-19 illnesses are predominantly asymptomatic or mild, a febrile ARI is also a SARS-CoV-2 compatible presentation. So, if all we use is our clinical judgment, how do we know if the febrile ARI is due to influenza or SARS-CoV-2 or both? At least one study used a highly sensitive and specific molecular influenza test to show that the accuracy of clinically diagnosing influenza in children is not much better than flipping a coin and would lead to potential antiviral overuse.5
So, it seems ideal to test for influenza when possible. Point-of-care (POC) tests are frequently used for outpatients. Eight POC Clinical Laboratory Improvement Amendments (CLIA)–waived kits, some also detecting RSV, are available but most have modest sensitivity (60%-80%) compared with lab-based molecular tests.6 That said, if supplies and kits for one of the POC tests are available to us during these SARS-CoV-2 stressed times (back orders seem more common this year), a positive influenza test in the first 48 hours of symptoms confirms the option to prescribe an antiviral. Yet how will we have confidence that the febrile ARI is not also partly due to SARS-CoV-2? Currently febrile ARIs usually are considered SARS-CoV-2 and the children are sent for SARS-CoV-2 testing. During influenza season, it seems we will need to continue to send febrile outpatients for SARS-CoV-2 testing, even if POC influenza positive, via whatever mechanisms are available as time goes on.
We expect more rapid pediatric testing modalities for SARS-CoV-2 (maybe even saliva tests) to become available over the next months. Indeed, rapid antigen tests and rapid molecular tests are being evaluated in adults and seem destined for CLIA waivers as POC tests, and even home testing kits. Pediatric approvals hopefully also will occur. So, the pathways for SARS-CoV-2 testing available now will likely change over this winter. But be aware that supplies/kits will be prioritized to locations within high need areas and bulk purchase contracts. So POC kits may remain scarce for practices, meaning a reference laboratory still could be the way to go for SARS-CoV-2 for at least the rest of 2020. Reference labs are becoming creative as well; one combined detection of influenza A, influenza B, RSV, and SARS-CoV-2 into one test, and hopes to get approval for swab collection that can be done by families at home and mailed in.
Summary
Expect variations on the traditional parade of seasonal respiratory viruses, with increased numbers of coinfections. Choosing the outpatient who needs influenza testing is the same as in past years, although we have CDC permissive recommendations to prescribe antivirals for any outpatient ILI within the first 48 hours of symptoms. Still, POC testing for influenza remains potentially valuable in the ILI patient. The choice of whether and how to test for SARS-CoV-2 given its potential to be a primary or coinfecting agent in presentations linked more closely to a traditional virus (e.g. RSV bronchiolitis) will be a test of our clinical judgement until more data and easier testing are available. Further complicating coinfection recognition is the fact that many sick visits occur by telehealth and much testing is done at drive-through SARS-CoV-2 testing facilities with no clinician exam. Unless we are liberal in SARS-CoV-2 testing, detecting SARS-CoV-2 coinfections is easier said than done given its usually mild presentation being overshadowed by any coinfecting virus.
But understanding who has SARS-CoV-2, even as a coinfection, still is essential in controlling the pandemic. We will need to be vigilant for evolving approaches to SARS-CoV-2 testing in the context of symptomatic ARI presentations, knowing this will likely remain a moving target for the foreseeable future.
Dr. Harrison is professor of pediatrics and pediatric infectious diseases at Children’s Mercy Hospital-Kansas City, Mo. Children’s Mercy Hospital receives grant funding to study two candidate RSV vaccines. The hospital also receives CDC funding under the New Vaccine Surveillance Network for multicenter surveillance of acute respiratory infections, including influenza, RSV, and parainfluenza virus. Email Dr. Harrison at pdnews@mdedge.com.
References
1. Pediatrics. 2020;146(1):e20200961.
2. JAMA. 2020 May 26;323(20):2085-6.
3. Pediatrics. 2020. doi: 10.1542/peds.2020-1267.
4. www.cdc.gov/flu/professionals/antivirals/summary-clinicians.htm.
5. J. Pediatr. 2020. doi: 10.1016/j.jpeds.2020.08.007.
6. www.cdc.gov/flu/professionals/diagnosis/table-nucleic-acid-detection.html.
Respiratory virus seasons usually follow a fairly well-known pattern. Enterovirus 68 (EV-D68) is a summer-to-early fall virus with biennial peak years. Rhinovirus (HRv) and adenovirus (Adv) occur nearly year-round but may have small upticks in the first month or so that children return to school. Early in the school year, upper respiratory infections from both HRv and Adv and viral sore throats from Adv are common, with conjunctivitis from Adv outbreaks in some years. October to November is human parainfluenza (HPiV) 1 and 2 season, often presenting as croup. Human metapneumovirus infections span October through April. In late November to December, influenza begins, usually with an A type, later transitioning to a B type in February through April. Also in December, respiratory syncytial virus (RSV) starts, characteristically with bronchiolitis presentations, peaking in February to March and tapering off in May. In late March to April, HPiV 3 also appears for 4-6 weeks.
Will 2020-2021 be different?
Summer was remarkably free of expected enterovirus activity, suggesting that the seasonal parade may differ this year. Remember that the 2019-2020 respiratory season suddenly and nearly completely stopped in March because of social distancing and lockdowns needed to address the SARS-CoV-2 pandemic.
The mild influenza season in the southern hemisphere suggests that our influenza season also could be mild. But perhaps not – most southern hemisphere countries that are surveyed for influenza activities had the most intense SARS-CoV-2 mitigations, making the observed mildness potentially related more to social mitigation than less virulent influenza strains. If so, southern hemisphere influenza data may not apply to the United States, where social distancing and masks are ignored or used inconsistently by almost half the population.
Further, the stop-and-go pattern of in-person school/college attendance adds to uncertainties for the usual orderly virus-specific seasonality. The result may be multiple stop-and-go “pop-up” or “mini” outbreaks for any given virus potentially reflected as exaggerated local or regional differences in circulation of various viruses. The erratic seasonality also would increase coinfections, which could present with more severe or different symptoms.
SARS-CoV-2’s potential interaction
Will the relatively mild presentations for most children with SARS-CoV-2 hold up in the setting of coinfections or sequential respiratory viral infections? Could SARS-CoV-2 cause worse/more prolonged symptoms or more sequelae if paired simultaneously or in tandem with a traditional respiratory virus? To date, data on the frequency and severity of SARS-CoV-2 coinfections are conflicting and sparse, but it appears that non-SARS-CoV-2 viruses can be involved in 15%-50% pediatric acute respiratory infections.1,2
However, it may not be important to know about coinfecting viruses other than influenza (can be treated) or SARS-CoV-2 (needs quarantine and contact tracing), unless symptoms are atypical or more severe than usual. For example, a young child with bronchiolitis is most likely infected with RSV, but HPiV, influenza, metapneumovirus, HRv, and even SARS-CoV-2 can cause bronchiolitis. Even so, testing outpatients for RSV or non-influenza is not routine or even clinically helpful. Supportive treatment and restriction from daycare attendance are sufficient management for outpatient ARIs whether presenting as bronchiolitis or not.
Considerations for SARS-CoV-2 testing: Outpatient bronchiolitis
If a child presents with classic bronchiolitis but has above moderate to severe symptoms, is SARS-CoV-2 a consideration? Perhaps, if SARS-CoV-2 acts similarly to non-SARS-CoV-2s.
A recent report from the 30th Multicenter Airway Research Collaboration (MARC-30) surveillance study (2007-2014) of children hospitalized with clinical bronchiolitis evaluated respiratory viruses, including RSV and the four common non-SARS coronaviruses using molecular testing.3 Among 1,880 subjects, a CoV (alpha CoV: NL63 or 229E, or beta CoV: KKU1 or OC43) was detected in 12%. Yet most had only RSV (n = 1,661); 32 had only CoV (n = 32). But note that 219 had both.
Bronchiolitis subjects with CoV were older – median 3.7 (1.4-5.8) vs. 2.8 (1.9-7.2) years – and more likely male than were RSV subjects (68% vs. 58%). OC43 was most frequent followed by equal numbers of HKU1 and NL63, while 229E was the least frequent. Medical utilization and severity did not differ among the CoVs, or between RSV+CoV vs. RSV alone, unless one considered CoV viral load as a variable. ICU use increased when the polymerase chain reaction cycle threshold result indicated a high CoV viral load.
These data suggest CoVs are not infrequent coinfectors with RSV in bronchiolitis – and that SARS-CoV-2 is the same. Therefore, a bronchiolitis presentation doesn’t necessarily take us off the hook for the need to consider SARS-CoV-2 testing, particularly in the somewhat older bronchiolitis patient with more than mild symptoms.
Considerations for SARS-CoV-2 testing: Outpatient influenza-like illness
In 2020-2021, the Centers for Disease Control and Prevention recommends considering empiric antiviral treatment for ILIs (fever plus either cough or sore throat) based upon our clinical judgement, even in non-high-risk children.4
While pediatric COVID-19 illnesses are predominantly asymptomatic or mild, a febrile ARI is also a SARS-CoV-2 compatible presentation. So, if all we use is our clinical judgment, how do we know if the febrile ARI is due to influenza or SARS-CoV-2 or both? At least one study used a highly sensitive and specific molecular influenza test to show that the accuracy of clinically diagnosing influenza in children is not much better than flipping a coin and would lead to potential antiviral overuse.5
So, it seems ideal to test for influenza when possible. Point-of-care (POC) tests are frequently used for outpatients. Eight POC Clinical Laboratory Improvement Amendments (CLIA)–waived kits, some also detecting RSV, are available but most have modest sensitivity (60%-80%) compared with lab-based molecular tests.6 That said, if supplies and kits for one of the POC tests are available to us during these SARS-CoV-2 stressed times (back orders seem more common this year), a positive influenza test in the first 48 hours of symptoms confirms the option to prescribe an antiviral. Yet how will we have confidence that the febrile ARI is not also partly due to SARS-CoV-2? Currently febrile ARIs usually are considered SARS-CoV-2 and the children are sent for SARS-CoV-2 testing. During influenza season, it seems we will need to continue to send febrile outpatients for SARS-CoV-2 testing, even if POC influenza positive, via whatever mechanisms are available as time goes on.
We expect more rapid pediatric testing modalities for SARS-CoV-2 (maybe even saliva tests) to become available over the next months. Indeed, rapid antigen tests and rapid molecular tests are being evaluated in adults and seem destined for CLIA waivers as POC tests, and even home testing kits. Pediatric approvals hopefully also will occur. So, the pathways for SARS-CoV-2 testing available now will likely change over this winter. But be aware that supplies/kits will be prioritized to locations within high need areas and bulk purchase contracts. So POC kits may remain scarce for practices, meaning a reference laboratory still could be the way to go for SARS-CoV-2 for at least the rest of 2020. Reference labs are becoming creative as well; one combined detection of influenza A, influenza B, RSV, and SARS-CoV-2 into one test, and hopes to get approval for swab collection that can be done by families at home and mailed in.
Summary
Expect variations on the traditional parade of seasonal respiratory viruses, with increased numbers of coinfections. Choosing the outpatient who needs influenza testing is the same as in past years, although we have CDC permissive recommendations to prescribe antivirals for any outpatient ILI within the first 48 hours of symptoms. Still, POC testing for influenza remains potentially valuable in the ILI patient. The choice of whether and how to test for SARS-CoV-2 given its potential to be a primary or coinfecting agent in presentations linked more closely to a traditional virus (e.g. RSV bronchiolitis) will be a test of our clinical judgement until more data and easier testing are available. Further complicating coinfection recognition is the fact that many sick visits occur by telehealth and much testing is done at drive-through SARS-CoV-2 testing facilities with no clinician exam. Unless we are liberal in SARS-CoV-2 testing, detecting SARS-CoV-2 coinfections is easier said than done given its usually mild presentation being overshadowed by any coinfecting virus.
But understanding who has SARS-CoV-2, even as a coinfection, still is essential in controlling the pandemic. We will need to be vigilant for evolving approaches to SARS-CoV-2 testing in the context of symptomatic ARI presentations, knowing this will likely remain a moving target for the foreseeable future.
Dr. Harrison is professor of pediatrics and pediatric infectious diseases at Children’s Mercy Hospital-Kansas City, Mo. Children’s Mercy Hospital receives grant funding to study two candidate RSV vaccines. The hospital also receives CDC funding under the New Vaccine Surveillance Network for multicenter surveillance of acute respiratory infections, including influenza, RSV, and parainfluenza virus. Email Dr. Harrison at pdnews@mdedge.com.
References
1. Pediatrics. 2020;146(1):e20200961.
2. JAMA. 2020 May 26;323(20):2085-6.
3. Pediatrics. 2020. doi: 10.1542/peds.2020-1267.
4. www.cdc.gov/flu/professionals/antivirals/summary-clinicians.htm.
5. J. Pediatr. 2020. doi: 10.1016/j.jpeds.2020.08.007.
6. www.cdc.gov/flu/professionals/diagnosis/table-nucleic-acid-detection.html.