User login
Improving Respiratory Rate Accuracy in the Hospital: A Quality Improvement Initiative
Respiratory rate (RR) is an essential vital sign that is routinely measured for hospitalized adults. It is a strong predictor of adverse events.1,2 Therefore, RR is a key component of several widely used risk prediction scores, including the systemic inflammatory response syndrome (SIRS).3
Despite its clinical utility, RR is inaccurately measured.4-7 One reason for the inaccurate measurement of RR is that RR measurement, in contrast to that of other vital signs, is not automated. The gold-standard technique for measuring RR is the visual assessment of a resting patient. Thus, RR measurement is perceived as time-consuming. Clinical staff instead frequently approximate RR through brief observation.8-11
Given its clinical importance and widespread inaccuracy, we conducted a quality improvement (QI) initiative to improve RR accuracy.
METHODS
Design and Setting
We conducted an interdisciplinary QI initiative by using the plan–do–study–act (PDSA) methodology from July 2017 to February 2018. The initiative was set in a single adult 28-bed medical inpatient unit of a large, urban, safety-net hospital consisting of general internal medicine and hematology/oncology patients. Routine vital sign measurements on this unit occur at four- or six-hour intervals per physician orders and are performed by patient-care assistants (PCAs) who are nonregistered nursing support staff. PCAs use a vital signs cart equipped with automated tools to measure vital signs except for RR, which is manually assessed. PCAs are trained on vital sign measurements during a two-day onboarding orientation and four to six weeks of on-the-job training by experienced PCAs. PCAs are directly supervised by nursing operations managers. Formal continuing education programs for PCAs or performance audits of their clinical duties did not exist prior to our QI initiative.
Intervention
Intervention development addressing several important barriers and workflow inefficiencies was based on the direct observation of PCA workflow and information gathering by engaging stakeholders, including PCAs, nursing operations management, nursing leadership, and hospital administration (PDSA cycles 1-7 in Table). Our modified PCA vital sign workflow incorporated RR measurement during the approximate 30 seconds needed to complete automated blood pressure measurement as previously described.12 Nursing administration purchased three stopwatches (each $5 US) to attach to vital signs carts. One investigator (NK) participated in two monthly one-hour meetings, and three investigators (NK, KB, and SD) participated in 19 daily 15-minute huddles to conduct stakeholder engagement and educate and retrain PCAs on proper technique (total of 6.75 hours).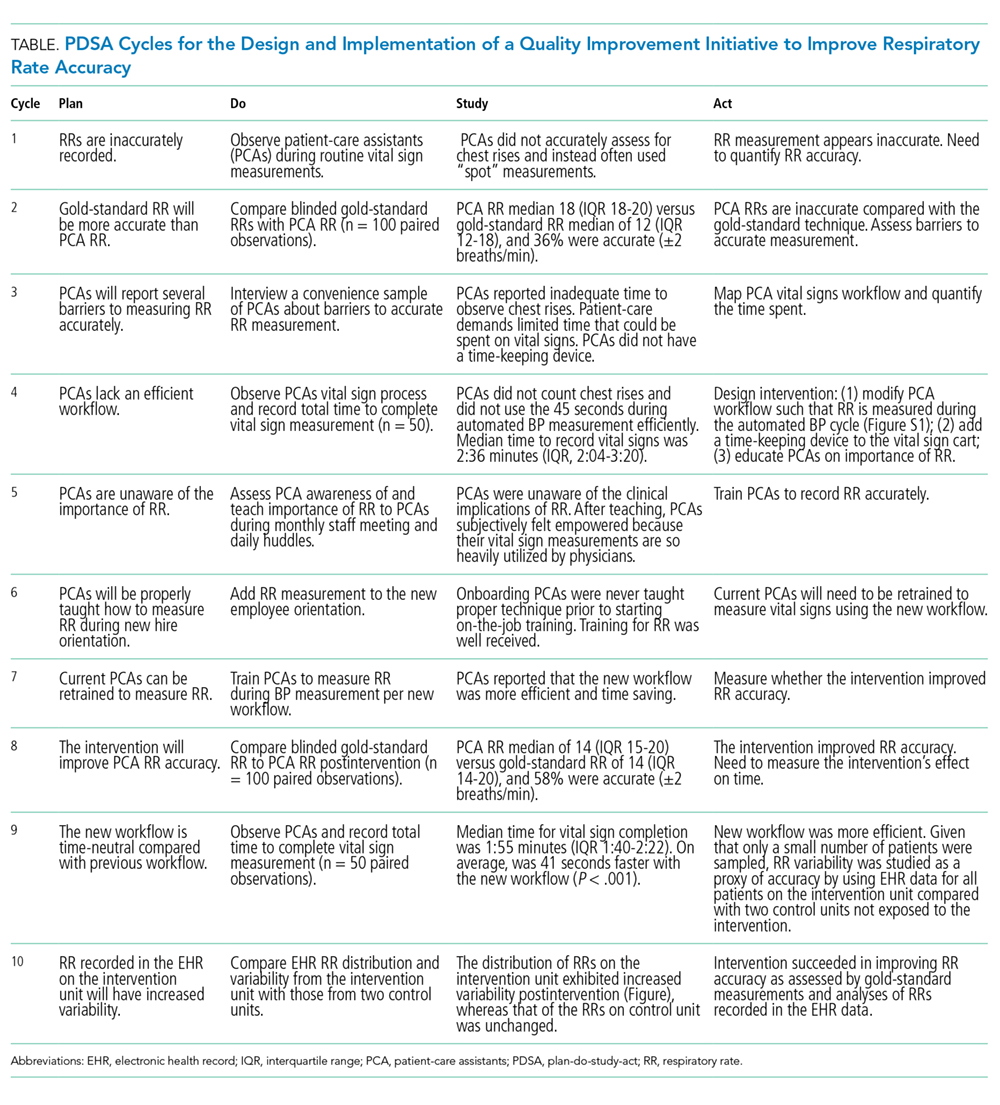
Evaluation
The primary aim of this QI initiative was to improve RR accuracy, which was evaluated using two distinct but complementary analyses: the prospective comparison of PCA-recorded RRs with gold-standard recorded RRs and the retrospective comparison of RRs recorded in electronic health records (EHR) on the intervention unit versus two control units. The secondary aims were to examine time to complete vital sign measurement and to assess whether the intervention was associated with a reduction in the incidence of SIRS specifically due to tachypnea.
Respiratory Rate Accuracy
PCA-recorded RRs were considered accurate if the RR was within ±2 breaths of a gold-standard RR measurement performed by a trained study member (NK or KB). We conducted gold-standard RR measurements for 100 observations pre- and postintervention within 30 minutes of PCA measurement to avoid Hawthorne bias.
We assessed the variability of recorded RRs in the EHR for all patients in the intervention unit as a proxy for accuracy. We hypothesized on the basis of prior research that improving the accuracy of RR measurement would increase the variability and normality of distribution in RRs.13 This is an approach that we have employed previously.7 The EHR cohort included consecutive hospitalizations by patients who were admitted to either the intervention unit or to one of two nonintervention general medicine inpatient units that served as concurrent controls. We grouped hospitalizations into a preintervention phase from March 1, 2017-July 22, 2017, a planning phase from July 23, 2017-December 3, 2017, and a postintervention phase from December 21, 2017-February 28, 2018. Hospitalizations during the two-week teaching phase from December 3, 2017-December 21, 2017 were excluded. We excluded vital signs obtained in the emergency department or in a location different from the patient’s admission unit. We qualitatively assessed RR distribution using histograms as we have done previously.7
We examined the distributions of RRs recorded in the EHR before and after intervention by individual PCAs on the intervention floor to assess for fidelity and adherence in the PCA uptake of the intervention.
Time
We compared the time to complete vital sign measurement among convenience samples of 50 unique observations pre- and postintervention using the Wilcoxon rank sum test.
SIRS Incidence
Since we hypothesized that improved RR accuracy would reduce falsely elevated RRs but have no impact on the other three SIRS criteria, we assessed changes in tachypnea-specific SIRS incidence, which was defined a priori as the presence of exactly two concurrent SIRS criteria, one of which was an elevated RR.3 We examined changes using a difference-in-differences approach with three different units of analysis (per vital sign measurement, hospital-day, and hospitalization; see footnote for Appendix Table 1 for methodological details. All analyses were conducted using STATA 12.0 (StataCorp, College Station, Texas).
RESULTS
Respiratory Rate Accuracy
Prior to the intervention, the median PCA RR was 18 (IQR 18-20) versus 12 (IQR 12-18) for the gold-standard RR (Appendix Figure 1), with only 36% of PCA measurements considered accurate. After the intervention, the median PCA-recorded RR was 14 (IQR 15-20) versus 14 (IQR 14-20) for the gold-standard RR and a RR accuracy of 58% (P < .001).
For our analyses on RR distribution using EHR data, we included 143,447 unique RRs (Appendix Table 2). After the intervention, the normality of the distribution of RRs on the intervention unit had increased, whereas those of RRs on the control units remained qualitatively similar pre- and postintervention (Appendix Figure 2).
Notable differences existed among the 11 individual PCAs (Figure) despite observing increased variability in PCA-recorded RRs postintervention. Some PCAs (numbers 2, 7, and 10) shifted their narrow RR interquartile range lower by several breaths/minute, whereas most other PCAs had a reduced median RR and widened interquartile range.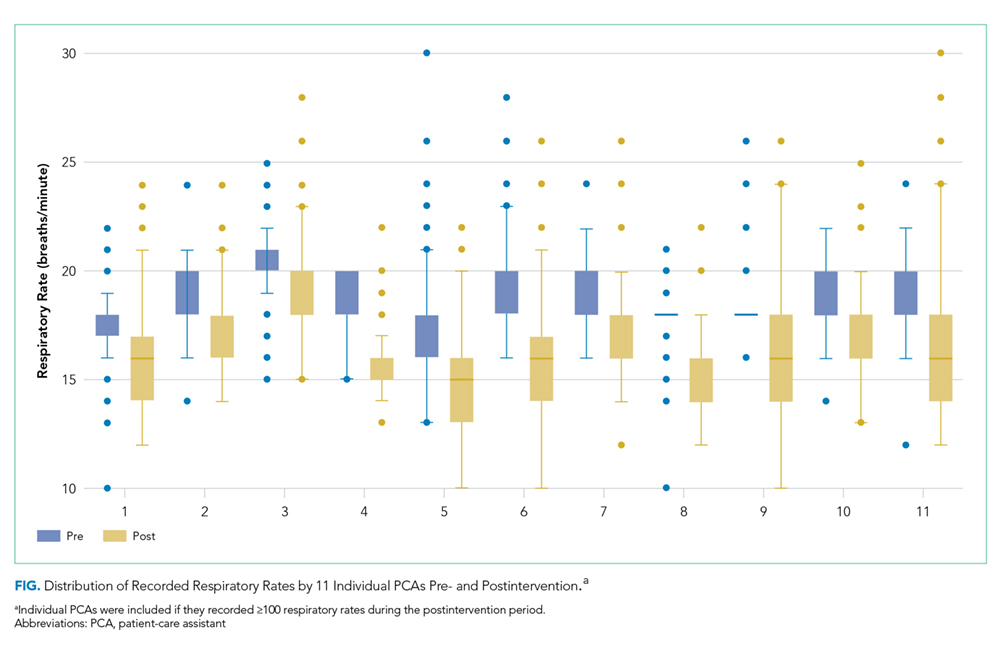
Time
Before the intervention, the median time to complete vital sign measurements was 2:36 (IQR 2:04-3:20). After the intervention, the time to complete vital signs decreased to 1:55 (IQR, 1:40-2:22; P < .001), which was 41 less seconds on average per vital sign set.
SIRS Incidence
The intervention was associated with a 3.3% reduction (95% CI, –6.4% to –0.005%) in tachypnea-specific SIRS incidence per hospital-day and a 7.8% reduction (95% CI, –13.5% to –2.2%) per hospitalization (Appendix Table 1). We also observed a modest reduction in overall SIRS incidence after the intervention (2.9% less per vital sign check, 4.6% less per hospital-day, and 3.2% less per hospitalization), although these reductions were not statistically significant.
DISCUSSION
Our QI initiative improved the absolute RR accuracy by 22%, saved PCAs 41 seconds on average per vital sign measurement, and decreased the absolute proportion of hospitalizations with tachypnea-specific SIRS by 7.8%. Our intervention is a novel, interdisciplinary, low-cost, low-effort, low-tech approach that addressed known challenges to accurate RR measurement,8,9,11 as well as the key barriers identified in our initial PDSA cycles. Our approach includes adding a time-keeping device to vital sign carts and standardizing a PCA vital sign workflow with increased efficiency. Lastly, this intervention is potentially scalable because stakeholder engagement, education, and retraining of the entire PCA staff for the unit required only 6.75 hours.
While our primary goal was to improve RR accuracy, our QI initiative also improved vital sign efficiency. By extrapolating our findings to an eight-hour PCA shift caring for eight patients who require vital sign checks every four hours, we estimated that our intervention would save approximately 16:24 minutes per PCA shift. This newfound time could be repurposed for other patient-care tasks or could be spent ensuring the accuracy of other vital signs given that accurate monitoring may be neglected because of time constraints.11 Additionally, the improvement in RR accuracy reduced falsely elevated RRs and thus lowered SIRS incidence specifically due to tachypnea. Given that EHR-based sepsis alerts are often based on SIRS criteria, improved RR accuracy may also improve alarm fatigue by reducing the rate of false-positive alerts.14
This initiative is not without limitations. Generalizability to other hospitals and even other units within the same hospital is uncertain. However, because this initiative was conducted within a safety-net hospital, we anticipate at least similar, if not increased, success in better-resourced hospitals. Second, the long-term durability of our intervention is unclear, although EHR RR variability remained steady for two months after our intervention (data not shown).
To ensure long-term sustainability and further improve RR accuracy, future PDSA cycles could include electing a PCA “vital signs champion” to reiterate the importance of RRs in clinical decision-making and ensure adherence to the modified workflow. Nursing champions act as persuasive change agents that disseminate and implement healthcare change,15 which may also be true of PCA champions. Additionally, future PDSA cycles can obviate the need for labor-intensive manual audits by leveraging EHR-based auditing to target education and retraining interventions to PCAs with minimal RR variability to optimize workflow adherence.
In conclusion, through a multipronged QI initiative we improved RR accuracy, increased the efficiency of vital sign measurement, and decreased SIRS incidence specifically due to tachypnea by reducing the number of falsely elevated RRs. This novel, low-cost, low-effort, low-tech approach can readily be implemented and disseminated in hospital inpatient settings.
Acknowledgments
The authors would like to acknowledge the meaningful contributions of Mr. Sudarshaan Pathak, RN, Ms. Shirly Koduvathu, RN, and Ms. Judy Herrington MSN, RN in this multidisciplinary initiative. We thank Mr. Christopher McKintosh, RN for his support in data acquisition. Lastly, the authors would like to acknowledge all of the patient-care assistants involved in this QI initiative.
Disclosures
Dr. Makam reports grants from NIA/NIH, during the conduct of the study. All other authors have nothing to disclose.
Funding
This work is supported in part by the Agency for Healthcare Research and Quality-funded UT Southwestern Center for Patient-Centered Outcomes Research (R24HS022418). OKN is funded by the National Heart, Lung, and Blood Institute (K23HL133441), and ANM is funded by the National Institute on Aging (K23AG052603).
1. Fieselmann JF, Hendryx MS, Helms CM, Wakefield DS. Respiratory rate predicts cardiopulmonary arrest for internal medicine inpatients. J Gen Intern Med. 1993;8(7):354-360. https://doi.org/10.1007/BF02600071.
2. Hodgetts TJ, Kenward G, Vlachonikolis IG, Payne S, Castle N. The identification of risk factors for cardiac arrest and formulation of activation criteria to alert a medical emergency team. Resuscitation. 2002;54(2):125-131. https://doi.org/10.1016/S0300-9572(02)00100-4.
3. Bone RC, Sibbald WJ, Sprung CL. The ACCP-SCCM consensus conference on sepsis and organ failure. Chest. 1992;101(6):1481-1483.
4. Lovett PB, Buchwald JM, Sturmann K, Bijur P. The vexatious vital: neither clinical measurements by nurses nor an electronic monitor provides accurate measurements of respiratory rate in triage. Ann Emerg Med. 2005;45(1):68-76. https://doi.org/10.1016/j.annemergmed.2004.06.016.
5. Chen J, Hillman K, Bellomo R, et al. The impact of introducing medical emergency team system on the documentations of vital signs. Resuscitation. 2009;80(1):35-43. https://doi.org/10.1016/j.resuscitation.2008.10.009.
6. Leuvan CH, Mitchell I. Missed opportunities? An observational study of vital sign measurements. Crit Care Resusc. 2008;10(2):111-115.
7. Badawy J, Nguyen OK, Clark C, Halm EA, Makam AN. Is everyone really breathing 20 times a minute? Assessing epidemiology and variation in recorded respiratory rate in hospitalised adults. BMJ Qual Saf. 2017;26(10):832-836. https://doi.org/10.1136/bmjqs-2017-006671.
8. Chua WL, Mackey S, Ng EK, Liaw SY. Front line nurses’ experiences with deteriorating ward patients: a qualitative study. Int Nurs Rev. 2013;60(4):501-509. https://doi.org/10.1111/inr.12061.
9. De Meester K, Van Bogaert P, Clarke SP, Bossaert L. In-hospital mortality after serious adverse events on medical and surgical nursing units: a mixed methods study. J Clin Nurs. 2013;22(15-16):2308-2317. https://doi.org/10.1111/j.1365-2702.2012.04154.x.
10. Cheng AC, Black JF, Buising KL. Respiratory rate: the neglected vital sign. Med J Aust. 2008;189(9):531. https://doi.org/10.5694/j.1326-5377.2008.tb02163.x.
11. Mok W, Wang W, Cooper S, Ang EN, Liaw SY. Attitudes towards vital signs monitoring in the detection of clinical deterioration: scale development and survey of ward nurses. Int J Qual Health Care. 2015;27(3):207-213. https://doi.org/10.1093/intqhc/mzv019.
12. Keshvani N, Berger K, Nguyen OK, Makam AN. Roadmap for improving the accuracy of respiratory rate measurements. BMJ Qual Saf. 2018;27(8):e5. https://doi.org/10.1136/bmjqs-2017-007516.
13. Semler MW, Stover DG, Copland AP, et al. Flash mob research: a single-day, multicenter, resident-directed study of respiratory rate. Chest. 2013;143(6):1740-1744. https://doi.org/10.1378/chest.12-1837.
14. Makam AN, Nguyen OK, Auerbach AD. Diagnostic accuracy and effectiveness of automated electronic sepsis alert systems: a systematic review. J Hosp Med. 2015;10(6):396-402. https://doi.org/10.1002/jhm.2347.
15. Ploeg J, Skelly J, Rowan M, et al. The role of nursing best practice champions in diffusing practice guidelines: a mixed methods study. Worldviews Evid Based Nurs. 2010;7(4):238-251. https://doi.org/10.1111/j.1741-6787.2010.00202.x.
Respiratory rate (RR) is an essential vital sign that is routinely measured for hospitalized adults. It is a strong predictor of adverse events.1,2 Therefore, RR is a key component of several widely used risk prediction scores, including the systemic inflammatory response syndrome (SIRS).3
Despite its clinical utility, RR is inaccurately measured.4-7 One reason for the inaccurate measurement of RR is that RR measurement, in contrast to that of other vital signs, is not automated. The gold-standard technique for measuring RR is the visual assessment of a resting patient. Thus, RR measurement is perceived as time-consuming. Clinical staff instead frequently approximate RR through brief observation.8-11
Given its clinical importance and widespread inaccuracy, we conducted a quality improvement (QI) initiative to improve RR accuracy.
METHODS
Design and Setting
We conducted an interdisciplinary QI initiative by using the plan–do–study–act (PDSA) methodology from July 2017 to February 2018. The initiative was set in a single adult 28-bed medical inpatient unit of a large, urban, safety-net hospital consisting of general internal medicine and hematology/oncology patients. Routine vital sign measurements on this unit occur at four- or six-hour intervals per physician orders and are performed by patient-care assistants (PCAs) who are nonregistered nursing support staff. PCAs use a vital signs cart equipped with automated tools to measure vital signs except for RR, which is manually assessed. PCAs are trained on vital sign measurements during a two-day onboarding orientation and four to six weeks of on-the-job training by experienced PCAs. PCAs are directly supervised by nursing operations managers. Formal continuing education programs for PCAs or performance audits of their clinical duties did not exist prior to our QI initiative.
Intervention
Intervention development addressing several important barriers and workflow inefficiencies was based on the direct observation of PCA workflow and information gathering by engaging stakeholders, including PCAs, nursing operations management, nursing leadership, and hospital administration (PDSA cycles 1-7 in Table). Our modified PCA vital sign workflow incorporated RR measurement during the approximate 30 seconds needed to complete automated blood pressure measurement as previously described.12 Nursing administration purchased three stopwatches (each $5 US) to attach to vital signs carts. One investigator (NK) participated in two monthly one-hour meetings, and three investigators (NK, KB, and SD) participated in 19 daily 15-minute huddles to conduct stakeholder engagement and educate and retrain PCAs on proper technique (total of 6.75 hours).
Evaluation
The primary aim of this QI initiative was to improve RR accuracy, which was evaluated using two distinct but complementary analyses: the prospective comparison of PCA-recorded RRs with gold-standard recorded RRs and the retrospective comparison of RRs recorded in electronic health records (EHR) on the intervention unit versus two control units. The secondary aims were to examine time to complete vital sign measurement and to assess whether the intervention was associated with a reduction in the incidence of SIRS specifically due to tachypnea.
Respiratory Rate Accuracy
PCA-recorded RRs were considered accurate if the RR was within ±2 breaths of a gold-standard RR measurement performed by a trained study member (NK or KB). We conducted gold-standard RR measurements for 100 observations pre- and postintervention within 30 minutes of PCA measurement to avoid Hawthorne bias.
We assessed the variability of recorded RRs in the EHR for all patients in the intervention unit as a proxy for accuracy. We hypothesized on the basis of prior research that improving the accuracy of RR measurement would increase the variability and normality of distribution in RRs.13 This is an approach that we have employed previously.7 The EHR cohort included consecutive hospitalizations by patients who were admitted to either the intervention unit or to one of two nonintervention general medicine inpatient units that served as concurrent controls. We grouped hospitalizations into a preintervention phase from March 1, 2017-July 22, 2017, a planning phase from July 23, 2017-December 3, 2017, and a postintervention phase from December 21, 2017-February 28, 2018. Hospitalizations during the two-week teaching phase from December 3, 2017-December 21, 2017 were excluded. We excluded vital signs obtained in the emergency department or in a location different from the patient’s admission unit. We qualitatively assessed RR distribution using histograms as we have done previously.7
We examined the distributions of RRs recorded in the EHR before and after intervention by individual PCAs on the intervention floor to assess for fidelity and adherence in the PCA uptake of the intervention.
Time
We compared the time to complete vital sign measurement among convenience samples of 50 unique observations pre- and postintervention using the Wilcoxon rank sum test.
SIRS Incidence
Since we hypothesized that improved RR accuracy would reduce falsely elevated RRs but have no impact on the other three SIRS criteria, we assessed changes in tachypnea-specific SIRS incidence, which was defined a priori as the presence of exactly two concurrent SIRS criteria, one of which was an elevated RR.3 We examined changes using a difference-in-differences approach with three different units of analysis (per vital sign measurement, hospital-day, and hospitalization; see footnote for Appendix Table 1 for methodological details. All analyses were conducted using STATA 12.0 (StataCorp, College Station, Texas).
RESULTS
Respiratory Rate Accuracy
Prior to the intervention, the median PCA RR was 18 (IQR 18-20) versus 12 (IQR 12-18) for the gold-standard RR (Appendix Figure 1), with only 36% of PCA measurements considered accurate. After the intervention, the median PCA-recorded RR was 14 (IQR 15-20) versus 14 (IQR 14-20) for the gold-standard RR and a RR accuracy of 58% (P < .001).
For our analyses on RR distribution using EHR data, we included 143,447 unique RRs (Appendix Table 2). After the intervention, the normality of the distribution of RRs on the intervention unit had increased, whereas those of RRs on the control units remained qualitatively similar pre- and postintervention (Appendix Figure 2).
Notable differences existed among the 11 individual PCAs (Figure) despite observing increased variability in PCA-recorded RRs postintervention. Some PCAs (numbers 2, 7, and 10) shifted their narrow RR interquartile range lower by several breaths/minute, whereas most other PCAs had a reduced median RR and widened interquartile range.
Time
Before the intervention, the median time to complete vital sign measurements was 2:36 (IQR 2:04-3:20). After the intervention, the time to complete vital signs decreased to 1:55 (IQR, 1:40-2:22; P < .001), which was 41 less seconds on average per vital sign set.
SIRS Incidence
The intervention was associated with a 3.3% reduction (95% CI, –6.4% to –0.005%) in tachypnea-specific SIRS incidence per hospital-day and a 7.8% reduction (95% CI, –13.5% to –2.2%) per hospitalization (Appendix Table 1). We also observed a modest reduction in overall SIRS incidence after the intervention (2.9% less per vital sign check, 4.6% less per hospital-day, and 3.2% less per hospitalization), although these reductions were not statistically significant.
DISCUSSION
Our QI initiative improved the absolute RR accuracy by 22%, saved PCAs 41 seconds on average per vital sign measurement, and decreased the absolute proportion of hospitalizations with tachypnea-specific SIRS by 7.8%. Our intervention is a novel, interdisciplinary, low-cost, low-effort, low-tech approach that addressed known challenges to accurate RR measurement,8,9,11 as well as the key barriers identified in our initial PDSA cycles. Our approach includes adding a time-keeping device to vital sign carts and standardizing a PCA vital sign workflow with increased efficiency. Lastly, this intervention is potentially scalable because stakeholder engagement, education, and retraining of the entire PCA staff for the unit required only 6.75 hours.
While our primary goal was to improve RR accuracy, our QI initiative also improved vital sign efficiency. By extrapolating our findings to an eight-hour PCA shift caring for eight patients who require vital sign checks every four hours, we estimated that our intervention would save approximately 16:24 minutes per PCA shift. This newfound time could be repurposed for other patient-care tasks or could be spent ensuring the accuracy of other vital signs given that accurate monitoring may be neglected because of time constraints.11 Additionally, the improvement in RR accuracy reduced falsely elevated RRs and thus lowered SIRS incidence specifically due to tachypnea. Given that EHR-based sepsis alerts are often based on SIRS criteria, improved RR accuracy may also improve alarm fatigue by reducing the rate of false-positive alerts.14
This initiative is not without limitations. Generalizability to other hospitals and even other units within the same hospital is uncertain. However, because this initiative was conducted within a safety-net hospital, we anticipate at least similar, if not increased, success in better-resourced hospitals. Second, the long-term durability of our intervention is unclear, although EHR RR variability remained steady for two months after our intervention (data not shown).
To ensure long-term sustainability and further improve RR accuracy, future PDSA cycles could include electing a PCA “vital signs champion” to reiterate the importance of RRs in clinical decision-making and ensure adherence to the modified workflow. Nursing champions act as persuasive change agents that disseminate and implement healthcare change,15 which may also be true of PCA champions. Additionally, future PDSA cycles can obviate the need for labor-intensive manual audits by leveraging EHR-based auditing to target education and retraining interventions to PCAs with minimal RR variability to optimize workflow adherence.
In conclusion, through a multipronged QI initiative we improved RR accuracy, increased the efficiency of vital sign measurement, and decreased SIRS incidence specifically due to tachypnea by reducing the number of falsely elevated RRs. This novel, low-cost, low-effort, low-tech approach can readily be implemented and disseminated in hospital inpatient settings.
Acknowledgments
The authors would like to acknowledge the meaningful contributions of Mr. Sudarshaan Pathak, RN, Ms. Shirly Koduvathu, RN, and Ms. Judy Herrington MSN, RN in this multidisciplinary initiative. We thank Mr. Christopher McKintosh, RN for his support in data acquisition. Lastly, the authors would like to acknowledge all of the patient-care assistants involved in this QI initiative.
Disclosures
Dr. Makam reports grants from NIA/NIH, during the conduct of the study. All other authors have nothing to disclose.
Funding
This work is supported in part by the Agency for Healthcare Research and Quality-funded UT Southwestern Center for Patient-Centered Outcomes Research (R24HS022418). OKN is funded by the National Heart, Lung, and Blood Institute (K23HL133441), and ANM is funded by the National Institute on Aging (K23AG052603).
1. Fieselmann JF, Hendryx MS, Helms CM, Wakefield DS. Respiratory rate predicts cardiopulmonary arrest for internal medicine inpatients. J Gen Intern Med. 1993;8(7):354-360. https://doi.org/10.1007/BF02600071.
2. Hodgetts TJ, Kenward G, Vlachonikolis IG, Payne S, Castle N. The identification of risk factors for cardiac arrest and formulation of activation criteria to alert a medical emergency team. Resuscitation. 2002;54(2):125-131. https://doi.org/10.1016/S0300-9572(02)00100-4.
3. Bone RC, Sibbald WJ, Sprung CL. The ACCP-SCCM consensus conference on sepsis and organ failure. Chest. 1992;101(6):1481-1483.
4. Lovett PB, Buchwald JM, Sturmann K, Bijur P. The vexatious vital: neither clinical measurements by nurses nor an electronic monitor provides accurate measurements of respiratory rate in triage. Ann Emerg Med. 2005;45(1):68-76. https://doi.org/10.1016/j.annemergmed.2004.06.016.
5. Chen J, Hillman K, Bellomo R, et al. The impact of introducing medical emergency team system on the documentations of vital signs. Resuscitation. 2009;80(1):35-43. https://doi.org/10.1016/j.resuscitation.2008.10.009.
6. Leuvan CH, Mitchell I. Missed opportunities? An observational study of vital sign measurements. Crit Care Resusc. 2008;10(2):111-115.
7. Badawy J, Nguyen OK, Clark C, Halm EA, Makam AN. Is everyone really breathing 20 times a minute? Assessing epidemiology and variation in recorded respiratory rate in hospitalised adults. BMJ Qual Saf. 2017;26(10):832-836. https://doi.org/10.1136/bmjqs-2017-006671.
8. Chua WL, Mackey S, Ng EK, Liaw SY. Front line nurses’ experiences with deteriorating ward patients: a qualitative study. Int Nurs Rev. 2013;60(4):501-509. https://doi.org/10.1111/inr.12061.
9. De Meester K, Van Bogaert P, Clarke SP, Bossaert L. In-hospital mortality after serious adverse events on medical and surgical nursing units: a mixed methods study. J Clin Nurs. 2013;22(15-16):2308-2317. https://doi.org/10.1111/j.1365-2702.2012.04154.x.
10. Cheng AC, Black JF, Buising KL. Respiratory rate: the neglected vital sign. Med J Aust. 2008;189(9):531. https://doi.org/10.5694/j.1326-5377.2008.tb02163.x.
11. Mok W, Wang W, Cooper S, Ang EN, Liaw SY. Attitudes towards vital signs monitoring in the detection of clinical deterioration: scale development and survey of ward nurses. Int J Qual Health Care. 2015;27(3):207-213. https://doi.org/10.1093/intqhc/mzv019.
12. Keshvani N, Berger K, Nguyen OK, Makam AN. Roadmap for improving the accuracy of respiratory rate measurements. BMJ Qual Saf. 2018;27(8):e5. https://doi.org/10.1136/bmjqs-2017-007516.
13. Semler MW, Stover DG, Copland AP, et al. Flash mob research: a single-day, multicenter, resident-directed study of respiratory rate. Chest. 2013;143(6):1740-1744. https://doi.org/10.1378/chest.12-1837.
14. Makam AN, Nguyen OK, Auerbach AD. Diagnostic accuracy and effectiveness of automated electronic sepsis alert systems: a systematic review. J Hosp Med. 2015;10(6):396-402. https://doi.org/10.1002/jhm.2347.
15. Ploeg J, Skelly J, Rowan M, et al. The role of nursing best practice champions in diffusing practice guidelines: a mixed methods study. Worldviews Evid Based Nurs. 2010;7(4):238-251. https://doi.org/10.1111/j.1741-6787.2010.00202.x.
© 2019 Society of Hospital Medicine
Predicting 30-day pneumonia readmissions using electronic health record data
Pneumonia is a leading cause of hospitalizations in the U.S., accounting for more than 1.1 million discharges annually.1 Pneumonia is frequently complicated by hospital readmission, which is costly and potentially avoidable.2,3 Due to financial penalties imposed on hospitals for higher than expected 30-day readmission rates, there is increasing attention to implementing interventions to reduce readmissions in this population.4,5 However, because these programs are resource-intensive, interventions are thought to be most cost-effective if they are targeted to high-risk individuals who are most likely to benefit.6-8
Current pneumonia-specific readmission risk-prediction models that could enable identification of high-risk patients suffer from poor predictive ability, greatly limiting their use, and most were validated among older adults or by using data from single academic medical centers, limiting their generalizability.9-14 A potential reason for poor predictive accuracy is the omission of known robust clinical predictors of pneumonia-related outcomes, including pneumonia severity of illness and stability on discharge.15-17 Approaches using electronic health record (EHR) data, which include this clinically granular data, could enable hospitals to more accurately and pragmatically identify high-risk patients during the index hospitalization and enable interventions to be initiated prior to discharge.
An alternative strategy to identifying high-risk patients for readmission is to use a multi-condition risk-prediction model. Developing and implementing models for every condition may be time-consuming and costly. We have derived and validated 2 multi-condition risk-prediction models using EHR data—1 using data from the first day of hospital admission (‘first-day’ model), and the second incorporating data from the entire hospitalization (‘full-stay’ model) to reflect in-hospital complications and clinical stability at discharge.18,19 However, it is unknown if a multi-condition model for pneumonia would perform as well as a disease-specific model.
This study aimed to develop 2 EHR-based pneumonia-specific readmission risk-prediction models using data routinely collected in clinical practice—a ‘first-day’ and a ‘full-stay’ model—and compare the performance of each model to: 1) one another; 2) the corresponding multi-condition EHR model; and 3) to other potentially useful models in predicting pneumonia readmissions (the Centers for Medicare and Medicaid Services [CMS] pneumonia model, and 2 commonly used pneumonia severity of illness scores validated for predicting mortality). We hypothesized that the pneumonia-specific EHR models would outperform other models; and the full-stay pneumonia-specific model would outperform the first-day pneumonia-specific model.
METHODS
Study Design, Population, and Data Sources
We conducted an observational study using EHR data collected from 6 hospitals (including safety net, community, teaching, and nonteaching hospitals) in north Texas between November 2009 and October 2010, All hospitals used the Epic EHR (Epic Systems Corporation, Verona, WI). Details of this cohort have been published.18,19
We included consecutive hospitalizations among adults 18 years and older discharged from any medicine service with principal discharge diagnoses of pneumonia (ICD-9-CM codes 480-483, 485, 486-487), sepsis (ICD-9-CM codes 038, 995.91, 995.92, 785.52), or respiratory failure (ICD-9-CM codes 518.81, 518.82, 518.84, 799.1) when the latter 2 were also accompanied by a secondary diagnosis of pneumonia.20 For individuals with multiple hospitalizations during the study period, we included only the first hospitalization. We excluded individuals who died during the index hospitalization or within 30 days of discharge, were transferred to another acute care facility, or left against medical advice.
Outcomes
The primary outcome was all-cause 30-day readmission, defined as a nonelective hospitalization within 30 days of discharge to any of 75 acute care hospitals within a 100-mile radius of Dallas, ascertained from an all-payer regional hospitalization database.
Predictor Variables for the Pneumonia-Specific Readmission Models
The selection of candidate predictors was informed by our validated multi-condition risk-prediction models using EHR data available within 24 hours of admission (‘first-day’ multi-condition EHR model) or during the entire hospitalization (‘full-stay’ multi-condition EHR model).18,19 For the pneumonia-specific models, we included all variables in our published multi-condition models as candidate predictors, including sociodemographics, prior utilization, Charlson Comorbidity Index, select laboratory and vital sign abnormalities, length of stay, hospital complications (eg, venous thromboembolism), vital sign instabilities, and disposition status (see Supplemental Table 1 for complete list of variables). We also assessed additional variables specific to pneumonia for inclusion that were: (1) available in the EHR of all participating hospitals; (2) routinely collected or available at the time of admission or discharge; and (3) plausible predictors of adverse outcomes based on literature and clinical expertise. These included select comorbidities (eg, psychiatric conditions, chronic lung disease, history of pneumonia),10,11,21,22 the pneumonia severity index (PSI),16,23,24 intensive care unit stay, and receipt of invasive or noninvasive ventilation. We used a modified PSI score because certain data elements were missing. The modified PSI (henceforth referred to as PSI) did not include nursing home residence and included diagnostic codes as proxies for the presence of pleural effusion (ICD-9-CM codes 510, 511.1, and 511.9) and altered mental status (ICD-9-CM codes 780.0X, 780.97, 293.0, 293.1, and 348.3X).
Statistical Analysis
Model Derivation. Candidate predictor variables were classified as available in the EHR within 24 hours of admission and/or at the time of discharge. For example, socioeconomic factors could be ascertained within the first day of hospitalization, whereas length of stay would not be available until the day of discharge. Predictors with missing values were assumed to be normal (less than 1% missing for each variable). Univariate relationships between readmission and each candidate predictor were assessed in the overall cohort using a pre-specified significance threshold of P ≤ 0.10. Significant variables were entered in the respective first-day and full-stay pneumonia-specific multivariable logistic regression models using stepwise-backward selection with a pre-specified significance threshold of P ≤ 0.05. In sensitivity analyses, we alternately derived our models using stepwise-forward selection, as well as stepwise-backward selection minimizing the Bayesian information criterion and Akaike information criterion separately. These alternate modeling strategies yielded identical predictors to our final models.
Model Validation. Model validation was performed using 5-fold cross-validation, with the overall cohort randomly divided into 5 equal-size subsets.25 For each cycle, 4 subsets were used for training to estimate model coefficients, and the fifth subset was used for validation. This cycle was repeated 5 times with each randomly-divided subset used once as the validation set. We repeated this entire process 50 times and averaged the C statistic estimates to derive an optimism-corrected C statistic. Model calibration was assessed qualitatively by comparing predicted to observed probabilities of readmission by quintiles of predicted risk, and with the Hosmer-Lemeshow goodness-of-fit test.
Comparison to Other Models. The main comparisons of the first-day and full-stay pneumonia-specific EHR model performance were to each other and the corresponding multi-condition EHR model.18,19 The multi-condition EHR models were separately derived and validated within the larger parent cohort from which this study cohort was derived, and outperformed the CMS all-cause model, the HOSPITAL model, and the LACE index.19 To further triangulate our findings, given the lack of other rigorously validated pneumonia-specific risk-prediction models for readmission,14 we compared the pneumonia-specific EHR models to the CMS pneumonia model derived from administrative claims data,10 and 2 commonly used risk-prediction scores for short-term mortality among patients with community-acquired pneumonia, the PSI and CURB-65 scores.16 Although derived and validated using patient-level data, the CMS model was developed to benchmark hospitals according to hospital-level readmission rates.10 The CURB-65 score in this study was also modified to include the same altered mental status diagnostic codes according to the modified PSI as a proxy for “confusion.” Both the PSI and CURB-65 scores were calculated using the most abnormal values within the first 24 hours of admission. The ‘updated’ PSI and the ‘updated’ CURB-65 were calculated using the most abnormal values within 24 hours prior to discharge, or the last known observation prior to discharge if no results were recorded within this time period. A complete list of variables for each of the comparison models are shown in Supplemental Table 1.
We assessed model performance by calculating the C statistic, integrated discrimination index, and net reclassification index (NRI) compared to our pneumonia-specific models. The integrated discrimination index is the difference in the mean predicted probability of readmission between patients who were and were not actually readmitted between 2 models, where more positive values suggest improvement in model performance compared to a reference model.26 The NRI is defined as the sum of the net proportions of correctly reclassified persons with and without the event of interest.27 Here, we calculated a category-based NRI to evaluate the performance of pneumonia-specific models in correctly classifying individuals with and without readmissions into the 2 highest readmission risk quintiles vs the lowest 3 risk quintiles compared to other models.27 This pre-specified cutoff is relevant for hospitals interested in identifying the highest risk individuals for targeted intervention.7 Finally, we assessed calibration of comparator models in our cohort by comparing predicted probability to observed probability of readmission by quintiles of risk for each model. We conducted all analyses using Stata 12.1 (StataCorp, College Station, Texas). This study was approved by the University of Texas Southwestern Medical Center Institutional Review Board.
RESULTS
Of 1463 index hospitalizations (Supplemental Figure 1), the 30-day all-cause readmission rate was 13.6%. Individuals with a 30-day readmission had markedly different sociodemographic and clinical characteristics compared to those not readmitted (Table 1; see Supplemental Table 2 for additional clinical characteristics).

Derivation, Validation, and Performance of the Pneumonia-Specific Readmission Risk-Prediction Models
The final first-day pneumonia-specific EHR model included 7 variables, including sociodemographic characteristics; prior hospitalizations; thrombocytosis, and PSI (Table 2). The first-day pneumonia-specific model had adequate discrimination (C statistic, 0.695; optimism-corrected C statistic 0.675, 95% confidence interval [CI], 0.667-0.685; Table 3). It also effectively stratified individuals across a broad range of risk (average predicted decile of risk ranged from 4% to 33%; Table 3) and was well calibrated (Supplemental Table 3).

The final full-stay pneumonia-specific EHR readmission model included 8 predictors, including 3 variables from the first-day model (median income, thrombocytosis, and prior hospitalizations; Table 2). The full-stay pneumonia-specific EHR model also included vital sign instabilities on discharge, updated PSI, and disposition status (ie, being discharged with home health or to a post-acute care facility was associated with greater odds of readmission, and hospice with lower odds). The full-stay pneumonia-specific EHR model had good discrimination (C statistic, 0.731; optimism-corrected C statistic, 0.714; 95% CI, 0.706-0.720), and stratified individuals across a broad range of risk (average predicted decile of risk ranged from 3% to 37%; Table 3), and was also well calibrated (Supplemental Table 3).

First-Day Pneumonia-Specific EHR Model vs First-Day Multi-Condition EHR Model
The first-day pneumonia-specific EHR model outperformed the first-day multi-condition EHR model with better discrimination (P = 0.029) and more correctly classified individuals in the top 2 highest risk quintiles vs the bottom 3 risk quintiles (Table 3, Supplemental Table 4, and Supplemental Figure 2A). With respect to calibration, the first-day multi-condition EHR model overestimated risk among the highest quintile risk group compared to the first-day pneumonia-specific EHR model (Figure 1A, 1B).

Full-Stay Pneumonia-Specific EHR Model vs Other Models
The full-stay pneumonia-specific EHR model comparatively outperformed the corresponding full-stay multi-condition EHR model, as well as the first-day pneumonia-specific EHR model, the CMS pneumonia model, the updated PSI, and the updated CURB-65 (Table 3, Supplemental Table 5, Supplemental Table 6, and Supplemental Figures 2B and 2C). Compared to the full-stay multi-condition and first-day pneumonia-specific EHR models, the full-stay pneumonia-specific EHR model had better discrimination, better reclassification (NRI, 0.09 and 0.08, respectively), and was able to stratify individuals across a broader range of readmission risk (Table 3). It also had better calibration in the highest quintile risk group compared to the full-stay multi-condition EHR model (Figure 1C and 1D).
Updated vs First-Day Modified PSI and CURB-65 Scores
The updated PSI was more strongly predictive of readmission than the PSI calculated on the day of admission (Wald test, 9.83; P = 0.002). Each 10-point increase in the updated PSI was associated with a 22% increased odds of readmission vs an 11% increase for the PSI calculated upon admission (Table 2). The improved predictive ability of the updated PSI and CURB-65 scores was also reflected in the superior discrimination and calibration vs the respective first-day pneumonia severity of illness scores (Table 3).
DISCUSSION
Using routinely available EHR data from 6 diverse hospitals, we developed 2 pneumonia-specific readmission risk-prediction models that aimed to allow hospitals to identify patients hospitalized with pneumonia at high risk for readmission. Overall, we found that a pneumonia-specific model using EHR data from the entire hospitalization outperformed all other models—including the first-day pneumonia-specific model using data present only on admission, our own multi-condition EHR models, and the CMS pneumonia model based on administrative claims data—in all aspects of model performance (discrimination, calibration, and reclassification). We found that socioeconomic status, prior hospitalizations, thrombocytosis, and measures of clinical severity and stability were important predictors of 30-day all-cause readmissions among patients hospitalized with pneumonia. Additionally, an updated discharge PSI score was a stronger independent predictor of readmissions compared to the PSI score calculated upon admission; and inclusion of the updated PSI in our full-stay pneumonia model led to improved prediction of 30-day readmissions.
The marked improvement in performance of the full-stay pneumonia-specific EHR model compared to the first-day pneumonia-specific model suggests that clinical stability and trajectory during hospitalization (as modeled through disposition status, updated PSI, and vital sign instabilities at discharge) are important predictors of 30-day readmission among patients hospitalized for pneumonia, which was not the case for our EHR-based multi-condition models.19 With the inclusion of these measures, the full-stay pneumonia-specific model correctly reclassified an additional 8% of patients according to their true risk compared to the first-day pneumonia-specific model. One implication of these findings is that hospitals interested in targeting their highest risk individuals with pneumonia for transitional care interventions could do so using the first-day pneumonia-specific EHR model and could refine their targeted strategy at the time of discharge by using the full-stay pneumonia model. This staged risk-prediction strategy would enable hospitals to initiate transitional care interventions for high-risk individuals in the inpatient setting (ie, patient education).7 Then, hospitals could enroll both persistent and newly identified high-risk individuals for outpatient interventions (ie, follow-up telephone call) in the immediate post-discharge period, an interval characterized by heightened vulnerability for adverse events,28 based on patients’ illness severity and stability at discharge. This approach can be implemented by hospitals by building these risk-prediction models directly into the EHR, or by extracting EHR data in near real time as our group has done successfully for heart failure.7
Another key implication of our study is that, for pneumonia, a disease-specific modeling approach has better predictive ability than using a multi-condition model. Compared to multi-condition models, the first-day and full-stay pneumonia-specific EHR models correctly reclassified an additional 6% and 9% of patients, respectively. Thus, hospitals interested in identifying the highest risk patients with pneumonia for targeted interventions should do so using the disease-specific models, if the costs and resources of doing so are within reach of the healthcare system.
An additional novel finding of our study is the added value of an updated PSI for predicting adverse events. Studies of pneumonia severity of illness scores have calculated the PSI and CURB-65 scores using data present only on admission.16,24 While our study also confirms that the PSI calculated upon admission is a significant predictor of readmission,23,29 this study extends this work by showing that an updated PSI score calculated at the time of discharge is an even stronger predictor for readmission, and its inclusion in the model significantly improves risk stratification and prognostication.
Our study was noteworthy for several strengths. First, we used data from a common EHR system, thus potentially allowing for the implementation of the pneumonia-specific models in real time across a number of hospitals. The use of routinely collected data for risk-prediction modeling makes this approach scalable and sustainable, because it obviates the need for burdensome data collection and entry. Second, to our knowledge, this is the first study to measure the additive influence of illness severity and stability at discharge on the readmission risk among patients hospitalized with pneumonia. Third, our study population was derived from 6 hospitals diverse in payer status, age, race/ethnicity, and socioeconomic status. Fourth, our models are less likely to be overfit to the idiosyncrasies of our data given that several predictors included in our final pneumonia-specific models have been associated with readmission in this population, including marital status,13,30 income,11,31 prior hospitalizations,11,13 thrombocytosis,32-34 and vital sign instabilities on discharge.17 Lastly, the discrimination of the CMS pneumonia model in our cohort (C statistic, 0.64) closely matched the discrimination observed in 4 independent cohorts (C statistic, 0.63), suggesting adequate generalizability of our study setting and population.10,12
Our results should be interpreted in the context of several limitations. First, generalizability to other regions beyond north Texas is unknown. Second, although we included a diverse cohort of safety net, community, teaching, and nonteaching hospitals, the pneumonia-specific models were not externally validated in a separate cohort, which may lead to more optimistic estimates of model performance. Third, PSI and CURB-65 scores were modified to use diagnostic codes for altered mental status and pleural effusion, and omitted nursing home residence. Thus, the independent associations for the PSI and CURB-65 scores and their predictive ability are likely attenuated. Fourth, we were unable to include data on medications (antibiotics and steroid use) and outpatient visits, which may influence readmission risk.2,9,13,35-40 Fifth, we included only the first pneumonia hospitalization per patient in this study. Had we included multiple hospitalizations per patient, we anticipate better model performance for the 2 pneumonia-specific EHR models since prior hospitalization was a robust predictor of readmission.
In conclusion, the full-stay pneumonia-specific EHR readmission risk-prediction model outperformed the first-day pneumonia-specific model, multi-condition EHR models, and the CMS pneumonia model. This suggests that: measures of clinical severity and stability at the time of discharge are important predictors for identifying patients at highest risk for readmission; and that EHR data routinely collected for clinical practice can be used to accurately predict risk of readmission among patients hospitalized for pneumonia.
Acknowledgments
The authors would like to acknowledge Ruben Amarasingham, MD, MBA, president and chief executive officer of Parkland Center for Clinical Innovation, and Ferdinand Velasco, MD, chief health information officer at Texas Health Resources for their assistance in assembling the 6-hospital cohort used in this study.
Disclosures
This work was supported by the Agency for Healthcare Research and Quality-funded UT Southwestern Center for Patient-Centered Outcomes Research (R24 HS022418-01); the Commonwealth Foundation (#20100323); the UT Southwestern KL2 Scholars Program supported by the National Institutes of Health (KL2 TR001103 to ANM and OKN); and the National Center for Advancing Translational Sciences at the National Institute of Health (U54 RFA-TR-12-006 to E.A.H.). The study sponsors had no role in design and conduct of the study; collection, management, analysis, and interpretation of the data; and preparation, review, or approval of the manuscript. The authors have no financial conflicts of interest to disclose
1. Centers for Disease Control and Prevention. Pneumonia. http://www.cdc.gov/nchs/fastats/pneumonia.htm. Accessed January 26, 2016.
33. Prina E, Ferrer M, Ranzani OT, et al. Thrombocytosis is a marker of poor outcome in community-acquired pneumonia. Chest. 2013;143(3):767-775. PubMed
34. Violi F, Cangemi R, Calvieri C. Pneumonia, thrombosis and vascular disease. J Thromb Haemost. 2014;12(9):1391-1400. PubMed
35. Weinberger M, Oddone EZ, Henderson WG. Does increased access to primary care reduce hospital readmissions? Veterans Affairs Cooperative Study Group on Primary Care and Hospital Readmission. N Engl J Med. 1996;334(22):1441-1447. PubMed
36. Field TS, Ogarek J, Garber L, Reed G, Gurwitz JH. Association of early post-discharge follow-up by a primary care physician and 30-day rehospitalization among older adults. J Gen Intern Med. 2015;30(5):565-571. PubMed
37. Spatz ES, Sheth SD, Gosch KL, et al. Usual source of care and outcomes following acute myocardial infarction. J Gen Intern Med. 2014;29(6):862-869. PubMed
38. Brooke BS, Stone DH, Cronenwett JL, et al. Early primary care provider follow-up and readmission after high-risk surgery. JAMA Surg. 2014;149(8):821-828. PubMed
39. Adamuz J, Viasus D, Campreciós-Rodriguez P, et al. A prospective cohort study of healthcare visits and rehospitalizations after discharge of patients with community-acquired pneumonia. Respirology. 2011;16(7):1119-1126. PubMed
40. Shorr AF, Zilberberg MD, Reichley R, et al. Readmission following hospitalization for pneumonia: the impact of pneumonia type and its implication for hospitals. Clin Infect Dis. 2013;57(3):362-367. PubMed
Pneumonia is a leading cause of hospitalizations in the U.S., accounting for more than 1.1 million discharges annually.1 Pneumonia is frequently complicated by hospital readmission, which is costly and potentially avoidable.2,3 Due to financial penalties imposed on hospitals for higher than expected 30-day readmission rates, there is increasing attention to implementing interventions to reduce readmissions in this population.4,5 However, because these programs are resource-intensive, interventions are thought to be most cost-effective if they are targeted to high-risk individuals who are most likely to benefit.6-8
Current pneumonia-specific readmission risk-prediction models that could enable identification of high-risk patients suffer from poor predictive ability, greatly limiting their use, and most were validated among older adults or by using data from single academic medical centers, limiting their generalizability.9-14 A potential reason for poor predictive accuracy is the omission of known robust clinical predictors of pneumonia-related outcomes, including pneumonia severity of illness and stability on discharge.15-17 Approaches using electronic health record (EHR) data, which include this clinically granular data, could enable hospitals to more accurately and pragmatically identify high-risk patients during the index hospitalization and enable interventions to be initiated prior to discharge.
An alternative strategy to identifying high-risk patients for readmission is to use a multi-condition risk-prediction model. Developing and implementing models for every condition may be time-consuming and costly. We have derived and validated 2 multi-condition risk-prediction models using EHR data—1 using data from the first day of hospital admission (‘first-day’ model), and the second incorporating data from the entire hospitalization (‘full-stay’ model) to reflect in-hospital complications and clinical stability at discharge.18,19 However, it is unknown if a multi-condition model for pneumonia would perform as well as a disease-specific model.
This study aimed to develop 2 EHR-based pneumonia-specific readmission risk-prediction models using data routinely collected in clinical practice—a ‘first-day’ and a ‘full-stay’ model—and compare the performance of each model to: 1) one another; 2) the corresponding multi-condition EHR model; and 3) to other potentially useful models in predicting pneumonia readmissions (the Centers for Medicare and Medicaid Services [CMS] pneumonia model, and 2 commonly used pneumonia severity of illness scores validated for predicting mortality). We hypothesized that the pneumonia-specific EHR models would outperform other models; and the full-stay pneumonia-specific model would outperform the first-day pneumonia-specific model.
METHODS
Study Design, Population, and Data Sources
We conducted an observational study using EHR data collected from 6 hospitals (including safety net, community, teaching, and nonteaching hospitals) in north Texas between November 2009 and October 2010, All hospitals used the Epic EHR (Epic Systems Corporation, Verona, WI). Details of this cohort have been published.18,19
We included consecutive hospitalizations among adults 18 years and older discharged from any medicine service with principal discharge diagnoses of pneumonia (ICD-9-CM codes 480-483, 485, 486-487), sepsis (ICD-9-CM codes 038, 995.91, 995.92, 785.52), or respiratory failure (ICD-9-CM codes 518.81, 518.82, 518.84, 799.1) when the latter 2 were also accompanied by a secondary diagnosis of pneumonia.20 For individuals with multiple hospitalizations during the study period, we included only the first hospitalization. We excluded individuals who died during the index hospitalization or within 30 days of discharge, were transferred to another acute care facility, or left against medical advice.
Outcomes
The primary outcome was all-cause 30-day readmission, defined as a nonelective hospitalization within 30 days of discharge to any of 75 acute care hospitals within a 100-mile radius of Dallas, ascertained from an all-payer regional hospitalization database.
Predictor Variables for the Pneumonia-Specific Readmission Models
The selection of candidate predictors was informed by our validated multi-condition risk-prediction models using EHR data available within 24 hours of admission (‘first-day’ multi-condition EHR model) or during the entire hospitalization (‘full-stay’ multi-condition EHR model).18,19 For the pneumonia-specific models, we included all variables in our published multi-condition models as candidate predictors, including sociodemographics, prior utilization, Charlson Comorbidity Index, select laboratory and vital sign abnormalities, length of stay, hospital complications (eg, venous thromboembolism), vital sign instabilities, and disposition status (see Supplemental Table 1 for complete list of variables). We also assessed additional variables specific to pneumonia for inclusion that were: (1) available in the EHR of all participating hospitals; (2) routinely collected or available at the time of admission or discharge; and (3) plausible predictors of adverse outcomes based on literature and clinical expertise. These included select comorbidities (eg, psychiatric conditions, chronic lung disease, history of pneumonia),10,11,21,22 the pneumonia severity index (PSI),16,23,24 intensive care unit stay, and receipt of invasive or noninvasive ventilation. We used a modified PSI score because certain data elements were missing. The modified PSI (henceforth referred to as PSI) did not include nursing home residence and included diagnostic codes as proxies for the presence of pleural effusion (ICD-9-CM codes 510, 511.1, and 511.9) and altered mental status (ICD-9-CM codes 780.0X, 780.97, 293.0, 293.1, and 348.3X).
Statistical Analysis
Model Derivation. Candidate predictor variables were classified as available in the EHR within 24 hours of admission and/or at the time of discharge. For example, socioeconomic factors could be ascertained within the first day of hospitalization, whereas length of stay would not be available until the day of discharge. Predictors with missing values were assumed to be normal (less than 1% missing for each variable). Univariate relationships between readmission and each candidate predictor were assessed in the overall cohort using a pre-specified significance threshold of P ≤ 0.10. Significant variables were entered in the respective first-day and full-stay pneumonia-specific multivariable logistic regression models using stepwise-backward selection with a pre-specified significance threshold of P ≤ 0.05. In sensitivity analyses, we alternately derived our models using stepwise-forward selection, as well as stepwise-backward selection minimizing the Bayesian information criterion and Akaike information criterion separately. These alternate modeling strategies yielded identical predictors to our final models.
Model Validation. Model validation was performed using 5-fold cross-validation, with the overall cohort randomly divided into 5 equal-size subsets.25 For each cycle, 4 subsets were used for training to estimate model coefficients, and the fifth subset was used for validation. This cycle was repeated 5 times with each randomly-divided subset used once as the validation set. We repeated this entire process 50 times and averaged the C statistic estimates to derive an optimism-corrected C statistic. Model calibration was assessed qualitatively by comparing predicted to observed probabilities of readmission by quintiles of predicted risk, and with the Hosmer-Lemeshow goodness-of-fit test.
Comparison to Other Models. The main comparisons of the first-day and full-stay pneumonia-specific EHR model performance were to each other and the corresponding multi-condition EHR model.18,19 The multi-condition EHR models were separately derived and validated within the larger parent cohort from which this study cohort was derived, and outperformed the CMS all-cause model, the HOSPITAL model, and the LACE index.19 To further triangulate our findings, given the lack of other rigorously validated pneumonia-specific risk-prediction models for readmission,14 we compared the pneumonia-specific EHR models to the CMS pneumonia model derived from administrative claims data,10 and 2 commonly used risk-prediction scores for short-term mortality among patients with community-acquired pneumonia, the PSI and CURB-65 scores.16 Although derived and validated using patient-level data, the CMS model was developed to benchmark hospitals according to hospital-level readmission rates.10 The CURB-65 score in this study was also modified to include the same altered mental status diagnostic codes according to the modified PSI as a proxy for “confusion.” Both the PSI and CURB-65 scores were calculated using the most abnormal values within the first 24 hours of admission. The ‘updated’ PSI and the ‘updated’ CURB-65 were calculated using the most abnormal values within 24 hours prior to discharge, or the last known observation prior to discharge if no results were recorded within this time period. A complete list of variables for each of the comparison models are shown in Supplemental Table 1.
We assessed model performance by calculating the C statistic, integrated discrimination index, and net reclassification index (NRI) compared to our pneumonia-specific models. The integrated discrimination index is the difference in the mean predicted probability of readmission between patients who were and were not actually readmitted between 2 models, where more positive values suggest improvement in model performance compared to a reference model.26 The NRI is defined as the sum of the net proportions of correctly reclassified persons with and without the event of interest.27 Here, we calculated a category-based NRI to evaluate the performance of pneumonia-specific models in correctly classifying individuals with and without readmissions into the 2 highest readmission risk quintiles vs the lowest 3 risk quintiles compared to other models.27 This pre-specified cutoff is relevant for hospitals interested in identifying the highest risk individuals for targeted intervention.7 Finally, we assessed calibration of comparator models in our cohort by comparing predicted probability to observed probability of readmission by quintiles of risk for each model. We conducted all analyses using Stata 12.1 (StataCorp, College Station, Texas). This study was approved by the University of Texas Southwestern Medical Center Institutional Review Board.
RESULTS
Of 1463 index hospitalizations (Supplemental Figure 1), the 30-day all-cause readmission rate was 13.6%. Individuals with a 30-day readmission had markedly different sociodemographic and clinical characteristics compared to those not readmitted (Table 1; see Supplemental Table 2 for additional clinical characteristics).
Derivation, Validation, and Performance of the Pneumonia-Specific Readmission Risk-Prediction Models
The final first-day pneumonia-specific EHR model included 7 variables, including sociodemographic characteristics; prior hospitalizations; thrombocytosis, and PSI (Table 2). The first-day pneumonia-specific model had adequate discrimination (C statistic, 0.695; optimism-corrected C statistic 0.675, 95% confidence interval [CI], 0.667-0.685; Table 3). It also effectively stratified individuals across a broad range of risk (average predicted decile of risk ranged from 4% to 33%; Table 3) and was well calibrated (Supplemental Table 3).
The final full-stay pneumonia-specific EHR readmission model included 8 predictors, including 3 variables from the first-day model (median income, thrombocytosis, and prior hospitalizations; Table 2). The full-stay pneumonia-specific EHR model also included vital sign instabilities on discharge, updated PSI, and disposition status (ie, being discharged with home health or to a post-acute care facility was associated with greater odds of readmission, and hospice with lower odds). The full-stay pneumonia-specific EHR model had good discrimination (C statistic, 0.731; optimism-corrected C statistic, 0.714; 95% CI, 0.706-0.720), and stratified individuals across a broad range of risk (average predicted decile of risk ranged from 3% to 37%; Table 3), and was also well calibrated (Supplemental Table 3).
First-Day Pneumonia-Specific EHR Model vs First-Day Multi-Condition EHR Model
The first-day pneumonia-specific EHR model outperformed the first-day multi-condition EHR model with better discrimination (P = 0.029) and more correctly classified individuals in the top 2 highest risk quintiles vs the bottom 3 risk quintiles (Table 3, Supplemental Table 4, and Supplemental Figure 2A). With respect to calibration, the first-day multi-condition EHR model overestimated risk among the highest quintile risk group compared to the first-day pneumonia-specific EHR model (Figure 1A, 1B).
Full-Stay Pneumonia-Specific EHR Model vs Other Models
The full-stay pneumonia-specific EHR model comparatively outperformed the corresponding full-stay multi-condition EHR model, as well as the first-day pneumonia-specific EHR model, the CMS pneumonia model, the updated PSI, and the updated CURB-65 (Table 3, Supplemental Table 5, Supplemental Table 6, and Supplemental Figures 2B and 2C). Compared to the full-stay multi-condition and first-day pneumonia-specific EHR models, the full-stay pneumonia-specific EHR model had better discrimination, better reclassification (NRI, 0.09 and 0.08, respectively), and was able to stratify individuals across a broader range of readmission risk (Table 3). It also had better calibration in the highest quintile risk group compared to the full-stay multi-condition EHR model (Figure 1C and 1D).
Updated vs First-Day Modified PSI and CURB-65 Scores
The updated PSI was more strongly predictive of readmission than the PSI calculated on the day of admission (Wald test, 9.83; P = 0.002). Each 10-point increase in the updated PSI was associated with a 22% increased odds of readmission vs an 11% increase for the PSI calculated upon admission (Table 2). The improved predictive ability of the updated PSI and CURB-65 scores was also reflected in the superior discrimination and calibration vs the respective first-day pneumonia severity of illness scores (Table 3).
DISCUSSION
Using routinely available EHR data from 6 diverse hospitals, we developed 2 pneumonia-specific readmission risk-prediction models that aimed to allow hospitals to identify patients hospitalized with pneumonia at high risk for readmission. Overall, we found that a pneumonia-specific model using EHR data from the entire hospitalization outperformed all other models—including the first-day pneumonia-specific model using data present only on admission, our own multi-condition EHR models, and the CMS pneumonia model based on administrative claims data—in all aspects of model performance (discrimination, calibration, and reclassification). We found that socioeconomic status, prior hospitalizations, thrombocytosis, and measures of clinical severity and stability were important predictors of 30-day all-cause readmissions among patients hospitalized with pneumonia. Additionally, an updated discharge PSI score was a stronger independent predictor of readmissions compared to the PSI score calculated upon admission; and inclusion of the updated PSI in our full-stay pneumonia model led to improved prediction of 30-day readmissions.
The marked improvement in performance of the full-stay pneumonia-specific EHR model compared to the first-day pneumonia-specific model suggests that clinical stability and trajectory during hospitalization (as modeled through disposition status, updated PSI, and vital sign instabilities at discharge) are important predictors of 30-day readmission among patients hospitalized for pneumonia, which was not the case for our EHR-based multi-condition models.19 With the inclusion of these measures, the full-stay pneumonia-specific model correctly reclassified an additional 8% of patients according to their true risk compared to the first-day pneumonia-specific model. One implication of these findings is that hospitals interested in targeting their highest risk individuals with pneumonia for transitional care interventions could do so using the first-day pneumonia-specific EHR model and could refine their targeted strategy at the time of discharge by using the full-stay pneumonia model. This staged risk-prediction strategy would enable hospitals to initiate transitional care interventions for high-risk individuals in the inpatient setting (ie, patient education).7 Then, hospitals could enroll both persistent and newly identified high-risk individuals for outpatient interventions (ie, follow-up telephone call) in the immediate post-discharge period, an interval characterized by heightened vulnerability for adverse events,28 based on patients’ illness severity and stability at discharge. This approach can be implemented by hospitals by building these risk-prediction models directly into the EHR, or by extracting EHR data in near real time as our group has done successfully for heart failure.7
Another key implication of our study is that, for pneumonia, a disease-specific modeling approach has better predictive ability than using a multi-condition model. Compared to multi-condition models, the first-day and full-stay pneumonia-specific EHR models correctly reclassified an additional 6% and 9% of patients, respectively. Thus, hospitals interested in identifying the highest risk patients with pneumonia for targeted interventions should do so using the disease-specific models, if the costs and resources of doing so are within reach of the healthcare system.
An additional novel finding of our study is the added value of an updated PSI for predicting adverse events. Studies of pneumonia severity of illness scores have calculated the PSI and CURB-65 scores using data present only on admission.16,24 While our study also confirms that the PSI calculated upon admission is a significant predictor of readmission,23,29 this study extends this work by showing that an updated PSI score calculated at the time of discharge is an even stronger predictor for readmission, and its inclusion in the model significantly improves risk stratification and prognostication.
Our study was noteworthy for several strengths. First, we used data from a common EHR system, thus potentially allowing for the implementation of the pneumonia-specific models in real time across a number of hospitals. The use of routinely collected data for risk-prediction modeling makes this approach scalable and sustainable, because it obviates the need for burdensome data collection and entry. Second, to our knowledge, this is the first study to measure the additive influence of illness severity and stability at discharge on the readmission risk among patients hospitalized with pneumonia. Third, our study population was derived from 6 hospitals diverse in payer status, age, race/ethnicity, and socioeconomic status. Fourth, our models are less likely to be overfit to the idiosyncrasies of our data given that several predictors included in our final pneumonia-specific models have been associated with readmission in this population, including marital status,13,30 income,11,31 prior hospitalizations,11,13 thrombocytosis,32-34 and vital sign instabilities on discharge.17 Lastly, the discrimination of the CMS pneumonia model in our cohort (C statistic, 0.64) closely matched the discrimination observed in 4 independent cohorts (C statistic, 0.63), suggesting adequate generalizability of our study setting and population.10,12
Our results should be interpreted in the context of several limitations. First, generalizability to other regions beyond north Texas is unknown. Second, although we included a diverse cohort of safety net, community, teaching, and nonteaching hospitals, the pneumonia-specific models were not externally validated in a separate cohort, which may lead to more optimistic estimates of model performance. Third, PSI and CURB-65 scores were modified to use diagnostic codes for altered mental status and pleural effusion, and omitted nursing home residence. Thus, the independent associations for the PSI and CURB-65 scores and their predictive ability are likely attenuated. Fourth, we were unable to include data on medications (antibiotics and steroid use) and outpatient visits, which may influence readmission risk.2,9,13,35-40 Fifth, we included only the first pneumonia hospitalization per patient in this study. Had we included multiple hospitalizations per patient, we anticipate better model performance for the 2 pneumonia-specific EHR models since prior hospitalization was a robust predictor of readmission.
In conclusion, the full-stay pneumonia-specific EHR readmission risk-prediction model outperformed the first-day pneumonia-specific model, multi-condition EHR models, and the CMS pneumonia model. This suggests that: measures of clinical severity and stability at the time of discharge are important predictors for identifying patients at highest risk for readmission; and that EHR data routinely collected for clinical practice can be used to accurately predict risk of readmission among patients hospitalized for pneumonia.
Acknowledgments
The authors would like to acknowledge Ruben Amarasingham, MD, MBA, president and chief executive officer of Parkland Center for Clinical Innovation, and Ferdinand Velasco, MD, chief health information officer at Texas Health Resources for their assistance in assembling the 6-hospital cohort used in this study.
Disclosures
This work was supported by the Agency for Healthcare Research and Quality-funded UT Southwestern Center for Patient-Centered Outcomes Research (R24 HS022418-01); the Commonwealth Foundation (#20100323); the UT Southwestern KL2 Scholars Program supported by the National Institutes of Health (KL2 TR001103 to ANM and OKN); and the National Center for Advancing Translational Sciences at the National Institute of Health (U54 RFA-TR-12-006 to E.A.H.). The study sponsors had no role in design and conduct of the study; collection, management, analysis, and interpretation of the data; and preparation, review, or approval of the manuscript. The authors have no financial conflicts of interest to disclose
1. Centers for Disease Control and Prevention. Pneumonia. http://www.cdc.gov/nchs/fastats/pneumonia.htm. Accessed January 26, 2016.
33. Prina E, Ferrer M, Ranzani OT, et al. Thrombocytosis is a marker of poor outcome in community-acquired pneumonia. Chest. 2013;143(3):767-775. PubMed
34. Violi F, Cangemi R, Calvieri C. Pneumonia, thrombosis and vascular disease. J Thromb Haemost. 2014;12(9):1391-1400. PubMed
35. Weinberger M, Oddone EZ, Henderson WG. Does increased access to primary care reduce hospital readmissions? Veterans Affairs Cooperative Study Group on Primary Care and Hospital Readmission. N Engl J Med. 1996;334(22):1441-1447. PubMed
36. Field TS, Ogarek J, Garber L, Reed G, Gurwitz JH. Association of early post-discharge follow-up by a primary care physician and 30-day rehospitalization among older adults. J Gen Intern Med. 2015;30(5):565-571. PubMed
37. Spatz ES, Sheth SD, Gosch KL, et al. Usual source of care and outcomes following acute myocardial infarction. J Gen Intern Med. 2014;29(6):862-869. PubMed
38. Brooke BS, Stone DH, Cronenwett JL, et al. Early primary care provider follow-up and readmission after high-risk surgery. JAMA Surg. 2014;149(8):821-828. PubMed
39. Adamuz J, Viasus D, Campreciós-Rodriguez P, et al. A prospective cohort study of healthcare visits and rehospitalizations after discharge of patients with community-acquired pneumonia. Respirology. 2011;16(7):1119-1126. PubMed
40. Shorr AF, Zilberberg MD, Reichley R, et al. Readmission following hospitalization for pneumonia: the impact of pneumonia type and its implication for hospitals. Clin Infect Dis. 2013;57(3):362-367. PubMed
© 2017 Society of Hospital Medicine
Sneak Peek: Journal of Hospital Medicine
BACKGROUND: Readmissions after hospitalization for pneumonia are common, but the few risk-prediction models have poor to modest predictive ability. Data routinely collected in the EHR may improve prediction.
DESIGN: Observational cohort study using backward-stepwise selection and cross validation.
SUBJECTS: Consecutive pneumonia hospitalizations from six diverse hospitals in north Texas from 2009 to 2010.
MEASURES: All-cause, nonelective, 30-day readmissions, ascertained from 75 regional hospitals.
RESULTS: Of 1,463 patients, 13.6% were readmitted. The first-day, pneumonia-specific model included sociodemographic factors, prior hospitalizations, thrombocytosis, and a modified pneumonia severity index. The full-stay model included disposition status, vital sign instabilities on discharge, and an updated pneumonia severity index calculated using values from the day of discharge as additional predictors. The full-stay, pneumonia-specific model outperformed the first-day model (C-statistic, 0.731 vs. 0.695; P = .02; net reclassification index = 0.08). Compared with a validated multicondition readmission model, the Centers for Medicare & Medicaid Services pneumonia model, and two commonly used pneumonia severity of illness scores, the full-stay pneumonia-specific model had better discrimination (C-statistic, 0.604-0.681; P less than 0.01 for all comparisons), predicted a broader range of risk, and better reclassified individuals by their true risk (net reclassification index range, 0.09-0.18).
CONCLUSIONS: EHR data collected from the entire hospitalization can accurately predict readmission risk among patients hospitalized for pneumonia. This approach outperforms a first-day, pneumonia-specific model, the Centers for Medicare & Medicaid Services pneumonia model, and two commonly used pneumonia severity of illness scores.
Also In JHM This Month
Evaluating automated rules for rapid response system alarm triggers in medical and surgical patients
AUTHORS: Santiago Romero-Brufau, MD; Bruce W. Morlan, MS; Matthew Johnson, MPH; Joel Hickman; Lisa L. Kirkland, MD; James M. Naessens, ScD; Jeanne Huddleston, MD, FACP, FHM
Prognosticating with the Hospital-Patient One-year Mortality Risk score using information abstracted from the medical record
AUTHORS: Genevieve Casey, MD, and Carl van Walraven, MD, FRCPC, MSc
Automating venous thromboembolism risk calculation using electronic health record data upon hospital admission: The Automated Padua Prediction Score
AUTHORS: Pierre Elias, MD; Raman Khanna, MD; Adams Dudley, MD, MBA; Jason Davies, MD, PhD; Ronald Jacolbia, MSN; Kara McArthur, BA; Andrew D. Auerbach, MD, MPH, SFHM
The value of ultrasound in cellulitis to rule out deep venous thrombosis
AUTHORS: Hyung J. Cho, MD, and Andrew S. Dunn, MD, SFHM
Hospital medicine and perioperative care: A framework for high quality, high value collaborative care
AUTHORS: Rachel E. Thompson, MD, MPH, SFHM; Kurt Pfeifer, MD, FHM; Paul Grant, MD, SFHM; Cornelia Taylor, MD; Barbara Slawski, MD, FACP, MS, SFHM; Christopher Whinney, MD, FACP, FHM; Laurence Wellikson, MD, MHM; Amir K. Jaffer, MD, MBA, SFHM

Predicting Readmissions from EHR Data
Unplanned hospital readmissions are frequent, costly, and potentially avoidable.[1, 2] Due to major federal financial readmissions penalties targeting excessive 30‐day readmissions, there is increasing attention to implementing hospital‐initiated interventions to reduce readmissions.[3, 4] However, universal enrollment of all hospitalized patients into such programs may be too resource intensive for many hospitals.[5] To optimize efficiency and effectiveness, interventions should be targeted to individuals most likely to benefit.[6, 7] However, existing readmission risk‐prediction models have achieved only modest discrimination, have largely used administrative claims data not available until months after discharge, or are limited to only a subset of patients with Medicare or a specific clinical condition.[8, 9, 10, 11, 12, 13, 14] These limitations have precluded accurate identification of high‐risk individuals in an all‐payer general medical inpatient population to provide actionable information for intervention prior to discharge.
Approaches using electronic health record (EHR) data could allow early identification of high‐risk patients during the index hospitalization to enable initiation of interventions prior to discharge. To date, such strategies have relied largely on EHR data from the day of admission.[15, 16] However, given that variation in 30‐day readmission rates are thought to reflect the quality of in‐hospital care, incorporating EHR data from the entire hospital stay to reflect hospital care processes and clinical trajectory may more accurately identify at‐risk patients.[17, 18, 19, 20] Improved accuracy in risk prediction would help better target intervention efforts in the immediate postdischarge period, an interval characterized by heightened vulnerability for adverse events.[21]
To help hospitals target transitional care interventions more effectively to high‐risk individuals prior to discharge, we derived and validated a readmissions risk‐prediction model incorporating EHR data from the entire course of the index hospitalization, which we termed the full‐stay EHR model. We also compared the full‐stay EHR model performance to our group's previously derived prediction model based on EHR data on the day of admission, termed the first‐day EHR model, as well as to 2 other validated readmission models similarly intended to yield near real‐time risk predictions prior to or shortly after hospital discharge.[9, 10, 15]
METHODS
Study Design, Population, and Data Sources
We conducted an observational cohort study using EHR data from 6 hospitals in the DallasFort Worth metroplex between November 1, 2009 and October 30, 2010 using the same EHR system (Epic Systems Corp., Verona, WI). One site was a university‐affiliated safety net hospital; the remaining 5 sites were teaching and nonteaching community sites.
We included consecutive hospitalizations among adults 18 years old discharged alive from any medicine inpatient service. For individuals with multiple hospitalizations during the study period, we included only the first hospitalization. We excluded individuals who died during the index hospitalization, were transferred to another acute care facility, left against medical advice, or who died outside of the hospital within 30 days of discharge. For model derivation, we randomly split the sample into separate derivation (50%) and validation cohorts (50%).
Outcomes
The primary outcome was 30‐day hospital readmission, defined as a nonelective hospitalization within 30 days of discharge to any of 75 acute care hospitals within a 100‐mile radius of Dallas, ascertained from an all‐payer regional hospitalization database. Nonelective hospitalizations included all hospitalizations classified as a emergency, urgent, or trauma, and excluded those classified as elective as per the Centers for Medicare and Medicaid Services Claim Inpatient Admission Type Code definitions.
Predictor Variables for the Full‐Stay EHR Model
The full‐stay EHR model was iteratively developed from our group's previously derived and validated risk‐prediction model using EHR data available on admission (first‐day EHR model).[15] For the full‐stay EHR model, we included all predictor variables included in our published first‐day EHR model as candidate risk factors. Based on prior literature, we additionally expanded candidate predictors available on admission to include marital status (proxy for social isolation) and socioeconomic disadvantage (percent poverty, unemployment, median income, and educational attainment by zip code of residence as proxy measures of the social and built environment).[22, 23, 24, 25, 26, 27] We also expanded the ascertainment of prior hospitalization to include admissions at both the index hospital and any of 75 acute care hospitals from the same, separate all‐payer regional hospitalization database used to ascertain 30‐day readmissions.
Candidate predictors from the remainder of the hospital stay (ie, following the first 24 hours of admission) were included if they were: (1) available in the EHR of all participating hospitals, (2) routinely collected or available at the time of hospital discharge, and (3) plausible predictors of adverse outcomes based on prior literature and clinical expertise. These included length of stay, in‐hospital complications, transfer to an intensive or coronary care unit, blood transfusions, vital sign instabilities within 24 hours of discharge, select laboratory values at time of discharge, and disposition status. We also assessed trajectories of vital signs and selected laboratory values (defined as changes in these measures from admission to discharge).
Statistical Analysis
Model Derivation
Univariate relationships between readmission and each of the candidate predictors were assessed in the derivation cohort using a prespecified significance threshold of P 0.05. We included all factors from our previously derived and validated first‐day EHR model as candidate predictors.[15] Continuous laboratory and vital sign values at the time of discharge were categorized based on clinically meaningful cutoffs; predictors with missing values were assumed to be normal (<1% missing for each variable). Significant univariate candidate variables were entered in a multivariate logistic regression model using stepwise backward selection with a prespecified significance threshold of P 0.05. We performed several sensitivity analyses to confirm the robustness of our model. First, we alternately derived the full‐stay model using stepwise forward selection. Second, we forced in all significant variables from our first‐day EHR model, and entered the candidate variables from the remainder of the hospital stay using both stepwise backward and forward selection separately. Third, prespecified interactions between variables were evaluated for inclusion. Though final predictors varied slightly between the different approaches, discrimination of each model was similar to the model derived using our primary analytic approach (C statistics 0.01, data not shown).
Model Validation
We assessed model discrimination and calibration of the derived full‐stay EHR model using the validation cohort. Model discrimination was estimated by the C statistic. The C statistic represents the probability that, given 2 hospitalized individuals (1 who was readmitted and the other who was not), the model will predict a higher risk for the readmitted patient than for the nonreadmitted patient. Model calibration was assessed by comparing predicted to observed probabilities of readmission by quintiles of risk, and with the Hosmer‐Lemeshow goodness‐of‐fit test.
Comparison to Existing Models
We compared the full‐stay EHR model performance to 3 previously published models: our group's first‐day EHR model, and the LACE (includes Length of stay, Acute (nonelective) admission status, Charlson Comorbidity Index, and Emergency department visits in the past year) and HOSPITAL (includes Hemoglobin at discharge, discharge from Oncology service, Sodium level at discharge, Procedure during index hospitalization, Index hospitalization Type (nonelective), number of Admissions in the past year, and Length of stay) models, which were both derived to predict 30‐day readmissions among general medical inpatients and were intended to help clinicians identify high‐risk patients to target for discharge interventions.[9, 10, 15] We assessed each model's performance in our validation cohort, calculating the C statistic, integrated discrimination index (IDI), and net reclassification index (NRI) compared to the full‐stay model. IDI is a summary measure of both discrimination and reclassification, where more positive values suggest improvement in model performance in both these domains compared to a reference model.[28] The NRI is defined as the sum of the net proportions of correctly reclassified persons with and without the event of interest.[29] The theoretical range of values is 2 to 2, with more positive values indicating improved net reclassification compared to a reference model. Here, we calculated a category‐based NRI to evaluate the performance of models in correctly classifying individuals with and without readmissions into the highest readmission risk quintile versus the lowest 4 risk quintiles compared to the full‐stay EHR model.[29] This prespecified cutoff is relevant for hospitals interested in identifying the highest‐risk individuals for targeted intervention.[6] Because some hospitals may be able to target a greater number of individuals for intervention, we performed a sensitivity analysis by assessing category‐based NRI for reclassification into the top 2 risk quintiles versus the lowest 3 risk quintiles and found no meaningful difference in our results (data not shown). Finally, we qualitatively assessed calibration of comparator models in our validation cohort by comparing predicted probability to observed probability of readmission by quintiles of risk for each model. We conducted all analyses using Stata 12.1 (StataCorp, College Station, TX). This study was approved by the UT Southwestern Medical Center institutional review board.
RESULTS
Overall, 32,922 index hospitalizations were included in our study cohort; 12.7% resulted in a 30‐day readmission (see Supporting Figure 1 in the online version of this article). Individuals had a mean age of 62 years and had diverse race/ethnicity and primary insurance status; half were female (Table 1). The study sample was randomly split into a derivation cohort (50%, n = 16,492) and validation cohort (50%, n = 16,430). Individuals in the derivation cohort with a 30‐day readmission had markedly different socioeconomic and clinical characteristics compared to those not readmitted (Table 1).
| Entire Cohort, N = 32,922 | Derivation Cohort, N = 16,492 | |||
|---|---|---|---|---|
|
No Readmission, N = 14,312 |
Readmission, N = 2,180 |
P Value | ||
| ||||
| Demographic characteristics | ||||
| Age, y, mean (SD) | 62 (17.3) | 61 (17.4) | 64 (17.0) | 0.001 |
| Female, n (%) | 17,715 (53.8) | 7,694 (53.8) | 1,163 (53.3) | 0.72 |
| Race/ethnicity | 0.001 | |||
| White | 21,359 (64.9) | 9,329 (65.2) | 1,361 (62.4) | |
| Black | 5,964 (18.1) | 2,520 (17.6) | 434 (19.9) | |
| Hispanic | 4,452 (13.5) | 1,931 (13.5) | 338 (15.5) | |
| Other | 1,147 (3.5) | 532 (3.7) | 47 (2.2) | |
| Marital status, n (%) | 0.001 | |||
| Single | 8,076 (24.5) | 3,516 (24.6) | 514 (23.6) | |
| Married | 13,394 (40.7) | 5,950 (41.6) | 812 (37.3) | |
| Separated/divorced | 3,468 (10.5) | 1,460 (10.2) | 251 (11.5) | |
| Widowed | 4,487 (13.7) | 1,868 (13.1) | 388 (17.8) | |
| Other | 3,497 (10.6) | 1,518 (10.6) | 215 (9.9) | |
| Primary payer, n (%) | 0.001 | |||
| Private | 13,090 (39.8) | 5,855 (40.9) | 726 (33.3) | |
| Medicare | 13,015 (39.5) | 5,597 (39.1) | 987 (45.3) | |
| Medicaid | 2,204 (6.7) | 852 (5.9) | 242 (11.1) | |
| Charity, self‐pay, or other | 4,613 (14.0) | 2,008 (14.0) | 225 (10.3) | |
| High‐poverty neighborhood, n (%)* | 7,468 (22.7) | 3,208 (22.4) | 548 (25.1) | 0.001 |
| Utilization history | ||||
| 1 ED visits in past year, n (%) | 9,299 (28.2) | 3,793 (26.5) | 823 (37.8) | 0.001 |
| 1 hospitalizations in past year, n (%) | 10,189 (30.9) | 4,074 (28.5) | 1,012 (46.4) | 0.001 |
| Clinical factors from first day of hospitalization | ||||
| Nonelective admission, n (%) | 27,818 (84.5) | 11,960 (83.6) | 1,960 (89.9) | 0.001 |
| Charlson Comorbidity Index, median (IQR)∥ | 0 (01) | 0 (00) | 0 (03) | 0.001 |
| Laboratory abnormalities within 24 hours of admission | ||||
| Albumin <2 g/dL | 355 (1.1) | 119 (0.8) | 46 (2.1) | 0.001 |
| Albumin 23 g/dL | 4,732 (14.4) | 1,956 (13.7) | 458 (21.0) | 0.001 |
| Aspartate aminotransferase >40 U/L | 4,610 (14.0) | 1,922 (13.4) | 383 (17.6) | 0.001 |
| Creatine phosphokinase <60 g/L | 3,728 (11.3) | 1,536 (10.7) | 330 (15.1) | 0.001 |
| Mean corpuscular volume >100 fL/red cell | 1,346 (4.1) | 537 (3.8) | 134 (6.2) | 0.001 |
| Platelets <90 103/L | 912 (2.8) | 357 (2.5) | 116 (5.3) | 0.001 |
| Platelets >350 103/L | 3,332 (10.1) | 1,433 (10.0) | 283 (13.0) | 0.001 |
| Prothrombin time >35 seconds | 248 (0.8) | 90 (0.6) | 35 (1.6) | 0.001 |
| Clinical factors from remainder of hospital stay | ||||
| Length of stay, d, median (IQR) | 4 (26) | 4 (26) | 5 (38) | 0.001 |
| ICU transfer after first 24 hours, n (%) | 988 (3.0) | 408 (2.9) | 94 (4.3) | 0.001 |
| Hospital complications, n (%) | ||||
| Clostridium difficile infection | 119 (0.4) | 44 (0.3) | 24 (1.1) | 0.001 |
| Pressure ulcer | 358 (1.1) | 126 (0.9) | 46 (2.1) | 0.001 |
| Venous thromboembolism | 301 (0.9) | 112 (0.8) | 34 (1.6) | 0.001 |
| Respiratory failure | 1,048 (3.2) | 463 (3.2) | 112 (5.1) | 0.001 |
| Central line‐associated bloodstream infection | 22 (0.07) | 6 (0.04) | 5 (0.23) | 0.005 |
| Catheter‐associated urinary tract infection | 47 (0.14) | 20 (0.14) | 6 (0.28) | 0.15 |
| Acute myocardial infarction | 293 (0.9) | 110 (0.8) | 32 (1.5) | 0.001 |
| Pneumonia | 1,754 (5.3) | 719 (5.0) | 154 (7.1) | 0.001 |
| Sepsis | 853 (2.6) | 368 (2.6) | 73 (3.4) | 0.04 |
| Blood transfusion during hospitalization, n (%) | 4,511 (13.7) | 1,837 (12.8) | 425 (19.5) | 0.001 |
| Laboratory abnormalities at discharge# | ||||
| Blood urea nitrogen >20 mg/dL, n (%) | 10,014 (30.4) | 4,077 (28.5) | 929 (42.6) | 0.001 |
| Sodium <135 mEq/L, n (%) | 4,583 (13.9) | 1,850 (12.9) | 440 (20.2) | 0.001 |
| Hematocrit 27 | 3,104 (9.4) | 1,231 (8.6) | 287 (13.2) | 0.001 |
| 1 vital sign instability at discharge, n (%)# | 6,192 (18.8) | 2,624 (18.3) | 525 (24.1) | 0.001 |
| Discharge location, n (%) | 0.001 | |||
| Home | 23,339 (70.9) | 10,282 (71.8) | 1,383 (63.4) | |
| Home health | 3,185 (9.7) | 1,356 (9.5) | 234 (10.7) | |
| Postacute care** | 5,990 (18.2) | 2,496 (17.4) | 549 (25.2) | |
| Hospice | 408 (1.2) | 178 (1.2) | 14 (0.6) | |
Derivation and Validation of the Full‐Stay EHR Model for 30‐Day Readmission
Our final model included 24 independent variables, including demographic characteristics, utilization history, clinical factors from the first day of admission, and clinical factors from the remainder of the hospital stay (Table 2). The strongest independent predictor of readmission was hospital‐acquired Clostridium difficile infection (adjusted odds ratio [AOR]: 2.03, 95% confidence interval [CI] 1.18‐3.48); other hospital‐acquired complications including pressure ulcers and venous thromboembolism were also significant predictors. Though having Medicaid was associated with increased odds of readmission (AOR: 1.55, 95% CI: 1.31‐1.83), other zip codelevel measures of socioeconomic disadvantage were not predictive and were not included in the final model. Being discharged to hospice was associated with markedly lower odds of readmission (AOR: 0.23, 95% CI: 0.13‐0.40).
| Odds Ratio (95% CI) | ||
|---|---|---|
| Univariate | Multivariate* | |
| ||
| Demographic characteristics | ||
| Age, per 10 years | 1.08 (1.051.11) | 1.07 (1.041.10) |
| Medicaid | 1.97 (1.702.29) | 1.55 (1.311.83) |
| Widow | 1.44 (1.281.63) | 1.27 (1.111.45) |
| Utilization history | ||
| Prior ED visit, per visit | 1.08 (1.061.10) | 1.04 (1.021.06) |
| Prior hospitalization, per hospitalization | 1.30 (1.271.34) | 1.16 (1.121.20) |
| Hospital and clinical factors from first day of hospitalization | ||
| Nonelective admission | 1.75 (1.512.03) | 1.42 (1.221.65) |
| Charlson Comorbidity Index, per point | 1.19 (1.171.21) | 1.06 (1.041.09) |
| Laboratory abnormalities within 24 hours of admission | ||
| Albumin <2 g/dL | 2.57 (1.823.62) | 1.52 (1.052.21) |
| Albumin 23 g/dL | 1.68 (1.501.88) | 1.20 (1.061.36) |
| Aspartate aminotransferase >40 U/L | 1.37 (1.221.55) | 1.21 (1.061.38) |
| Creatine phosphokinase <60 g/L | 1.48 (1.301.69) | 1.28 (1.111.46) |
| Mean corpuscular volume >100 fL/red cell | 1.68 (1.382.04) | 1.32 (1.071.62) |
| Platelets <90 103/L | 2.20 (1.772.72) | 1.56 (1.231.97) |
| Platelets >350 103/L | 1.34 (1.171.54) | 1.24 (1.081.44) |
| Prothrombin time >35 seconds | 2.58 (1.743.82) | 1.92 (1.272.90) |
| Hospital and clinical factors from remainder of hospital stay | ||
| Length of stay, per day | 1.08 (1.071.09) | 1.06 (1.041.07) |
| Hospital complications | ||
| Clostridium difficile infection | 3.61 (2.195.95) | 2.03 (1.183.48) |
| Pressure ulcer | 2.43 (1.733.41) | 1.64 (1.152.34) |
| Venous thromboembolism | 2.01 (1.362.96) | 1.55 (1.032.32) |
| Laboratory abnormalities at discharge | ||
| Blood urea nitrogen >20 mg/dL | 1.86 (1.702.04) | 1.37 (1.241.52) |
| Sodium <135 mEq/L | 1.70 (1.521.91) | 1.34 (1.181.51) |
| Hematocrit 27 | 1.61 (1.401.85) | 1.22 (1.051.41) |
| Vital sign instability at discharge, per instability | 1.29 (1.201.40) | 1.25 (1.151.36) |
| Discharged to hospice | 0.51 (0.300.89) | 0.23 (0.130.40) |
In our validation cohort, the full‐stay EHR model had fair discrimination, with a C statistic of 0.69 (95% CI: 0.68‐0.70) (Table 3). The full‐stay EHR model was well calibrated across all quintiles of risk, with slight overestimation of predicted risk in the lowest and highest quintiles (Figure 1a) (see Supporting Table 5 in the online version of this article). It also effectively stratified individuals across a broad range of predicted readmission risk from 4.1% in the lowest decile to 36.5% in the highest decile (Table 3).
| Model Name | C‐Statistic (95% CI) | IDI, % (95% CI) | NRI (95% CI) | Average Predicted Risk, % | |
|---|---|---|---|---|---|
| Lowest Decile | Highest Decile | ||||
| |||||
| Full‐stay EHR model | |||||
| Derivation cohort | 0.72 (0.70 to 0.73) | 4.1 | 36.5 | ||
| Validation cohort | 0.69 (0.68 to 0.70) | [Reference] | [Reference] | 4.1 | 36.5 |
| First‐day EHR model | 0.67 (0.66 to 0.68) | 1.2 (1.4 to 1.0) | 0.020 (0.038 to 0.002) | 5.8 | 31.9 |
| LACE model | 0.65 (0.64 to 0.66) | 2.6 (2.9 to 2.3) | 0.046 (0.067 to 0.024) | 6.1 | 27.5 |
| HOSPITAL model | 0.64 (0.62 to 0.65) | 3.2 (3.5 to 2.9) | 0.058 (0.080 to 0.035) | 6.7 | 26.6 |

Comparing the Performance of the Full‐Stay EHR Model to Other Models
The full‐stay EHR model had better discrimination compared to the first‐day EHR model and the LACE and HOSPITAL models, though the magnitude of improvement was modest (Table 3). The full‐stay EHR model also stratified individuals across a broader range of readmission risk, and was better able to discriminate and classify those in the highest quintile of risk from those in the lowest 4 quintiles of risk compared to other models as assessed by the IDI and NRI (Table 3) (see Supporting Tables 14 and Supporting Figure 2 in the online version of this article). In terms of model calibration, both the first‐day EHR and LACE models were also well calibrated, whereas the HOSPITAL model was less robust (Figure 1).
The diagnostic accuracy of the full‐stay EHR model in correctly predicting those in the highest quintile of risk was better than that of the first‐day, LACE, and HOSPITAL models, though overall improvements in the sensitivity, specificity, positive and negative predictive values, and positive and negative likelihood ratios were also modest (see Supporting Table 6 in the online version of this article).
DISCUSSION
In this study, we used clinically detailed EHR data from the entire hospitalization on 32,922 individuals treated in 6 diverse hospitals to develop an all‐payer, multicondition readmission risk‐prediction model. To our knowledge, this is the first 30‐day hospital readmission risk‐prediction model to use a comprehensive set of factors from EHR data from the entire hospital stay. Prior EHR‐based models have focused exclusively on data available on or prior to the first day of admission, which account for clinical severity on admission but do not account for factors uncovered during the inpatient stay that influence the chance of a postdischarge adverse outcome.[15, 30] We specifically assessed the prognostic impact of a comprehensive set of factors from the entire index hospitalization, including hospital‐acquired complications, clinical trajectory, and stability on discharge in predicting hospital readmissions. Our full‐stay EHR model had statistically better discrimination, calibration, and diagnostic accuracy than our existing all‐cause first‐day EHR model[15] and 2 previously published readmissions models that included more limited information from hospitalization (such as length of stay).[9, 10] However, although the more complicated full‐stay EHR model was statistically better than previously published models, we were surprised that the predictive performance was only modestly improved despite the inclusion of many additional clinically relevant prognostic factors.
Taken together, our study has several important implications. First, the added complexity and resource intensity of implementing a full‐stay EHR model yields only modestly improved readmission risk prediction. Thus, hospitals and healthcare systems interested in targeting their highest‐risk individuals for interventions to reduce 30‐day readmission should consider doing so within the first day of hospital admission. Our group's previously derived and validated first‐day EHR model, which used data only from the first day of admission, qualitatively performed nearly as well as the full‐stay EHR model.[15] Additionally, a recent study using only preadmission EHR data to predict 30‐day readmissions also achieved similar discrimination and diagnostic accuracy as our full‐stay model.[30]
Second, the field of readmissions risk‐prediction modeling may be reaching the maximum achievable model performance using data that are currently available in the EHR. Our limited ability to accurately predict all‐cause 30‐day readmission risk may reflect the influence of currently unmeasured patient, system, and community factors on readmissions.[31, 32, 33] Due to the constraints of data collected in the EHR, we were unable to include several patient‐level clinical characteristics associated with hospital readmission, including self‐perceived health status, functional impairment, and cognition.[33, 34, 35, 36] However, given their modest effect sizes (ORs ranging from 1.062.10), adequately measuring and including these risk factors in our model may not meaningfully improve model performance and diagnostic accuracy. Further, many social and behavioral patient‐level factors are also not consistently available in EHR data. Though we explored the role of several neighborhood‐level socioeconomic measuresincluding prevalence of poverty, median income, education, and unemploymentwe found that none were significantly associated with 30‐day readmissions. These particular measures may have been inadequate to characterize individual‐level social and behavioral factors, as several previous studies have demonstrated that patient‐level factors such as social support, substance abuse, and medication and visit adherence can influence readmission risk in heart failure and pneumonia.[11, 16, 22, 25] This underscores the need for more standardized routine collection of data across functional, social, and behavioral domains in clinical settings, as recently championed by the Institute of Medicine.[11, 37] Integrating data from outside the EHR on postdischarge health behaviors, self‐management, follow‐up care, recovery, and home environment may be another important but untapped strategy for further improving prediction of readmissions.[25, 38]
Third, a multicondition readmission risk‐prediction model may be a less effective strategy than more customized disease‐specific models for selected conditions associated with high 30‐day readmission rates. Our group's previously derived and internally validated models for heart failure and human immunodeficiency virus had superior discrimination compared to our full‐stay EHR model (C statistic of 0.72 for each).[11, 13] However, given differences in the included population and time periods studied, a head‐to‐head comparison of these different strategies is needed to assess differences in model performance and utility.
Our study had several strengths. To our knowledge, this is the first study to rigorously measure the additive influence of in‐hospital complications, clinical trajectory, and stability on discharge on the risk of 30‐day hospital readmission. Additionally, our study included a large, diverse study population that included all payers, all ages of adults, a mix of community, academic, and safety net hospitals, and individuals from a broad array of racial/ethnic and socioeconomic backgrounds.
Our results should be interpreted in light of several limitations. First, though we sought to represent a diverse group of hospitals, all study sites were located within north Texas and generalizability to other regions is uncertain. Second, our ascertainment of prior hospitalizations and readmissions was more inclusive than what could be typically accomplished in real time using only EHR data from a single clinical site. We performed a sensitivity analysis using only prior utilization data available within the EHR from the index hospital with no meaningful difference in our findings (data not shown). Additionally, a recent study found that 30‐day readmissions occur at the index hospital for over 75% of events, suggesting that 30‐day readmissions are fairly comprehensively captured even with only single‐site data.[39] Third, we were not able to include data on outpatient visits before or after the index hospitalization, which may influence the risk of readmission.[1, 40]
In conclusion, incorporating clinically granular EHR data from the entire course of hospitalization modestly improves prediction of 30‐day readmissions compared to models that only include information from the first 24 hours of hospital admission or models that use far fewer variables. However, given the limited improvement in prediction, our findings suggest that from the practical perspective of implementing real‐time models to identify those at highest risk for readmission, it may not be worth the added complexity of waiting until the end of a hospitalization to leverage additional data on hospital complications, and the trajectory of laboratory and vital sign values currently available in the EHR. Further improvement in prediction of readmissions will likely require accounting for psychosocial, functional, behavioral, and postdischarge factors not currently present in the inpatient EHR.
Disclosures: This study was presented at the Society of Hospital Medicine 2015 Annual Meeting in National Harbor, Maryland, and the Society of General Internal Medicine 2015 Annual Meeting in Toronto, Canada. This work was supported by the Agency for Healthcare Research and Qualityfunded UT Southwestern Center for Patient‐Centered Outcomes Research (1R24HS022418‐01) and the Commonwealth Foundation (#20100323). Drs. Nguyen and Makam received funding from the UT Southwestern KL2 Scholars Program (NIH/NCATS KL2 TR001103). Dr. Halm was also supported in part by NIH/NCATS U54 RFA‐TR‐12‐006. The study sponsors had no role in the design and conduct of the study; collection, management, analysis, and interpretation of the data; and preparation, review, or approval of the manuscript. The authors have no conflicts of interest to disclose.
- , , . Rehospitalizations among patients in the Medicare fee‐for‐service program. N Engl J Med. 2009;360(14):1418–1428.
- , , , , . Proportion of hospital readmissions deemed avoidable: a systematic review. CMAJ. 2011;183(7):E391–E402.
- , , , , , . Hospital‐initiated transitional care interventions as a patient safety strategy: a systematic review. Ann Intern Med. 2013;158(5 pt 2):433–440.
- , , , , . Interventions to reduce 30‐day rehospitalization: a systematic review. Ann Intern Med. 2011;155(8):520–528.
- , , , , , . Interventions to Improve Care Transitions at Hospital Discharge. Rockville, MD: Agency for Healthcare Research and Quality; 2013.
- , , , et al. Allocating scarce resources in real‐time to reduce heart failure readmissions: a prospective, controlled study. BMJ Qual Saf. 2013;22(12):998–1005.
- , , , , . Implementing electronic health care predictive analytics: considerations and challenges. Health Aff (Millwood). 2014;33(7):1148–1154.
- , , , et al. Risk prediction models for hospital readmission: a systematic review. JAMA. 2011;306(15):1688–1698.
- , , , et al. Derivation and validation of an index to predict early death or unplanned readmission after discharge from hospital to the community. CMAJ. 2010;182(6):551–557.
- , , , . Potentially avoidable 30‐day hospital readmissions in medical patients: derivation and validation of a prediction model. JAMA Intern Med. 2013;173(8):632–638.
- , , , et al. An automated model to identify heart failure patients at risk for 30‐day readmission or death using electronic medical record data. Med Care. 2010;48(11):981–988.
- , , , et al. An automated model using electronic medical record data identifies patients with cirrhosis at high risk for readmission. Clin Gastroenterol Hepatol. 2013;11(10):1335–1341.e1331.
- , , , , , . An electronic medical record‐based model to predict 30‐day risk of readmission and death among HIV‐infected inpatients. J Acquir Immune Defic Syndr. 2012;61(3):349–358.
- , , , et al. Development and use of an administrative claims measure for profiling hospital‐wide performance on 30‐day unplanned readmission. Ann Intern Med. 2014;161(10 suppl):S66–S75.
- , , , et al. Electronic medical record‐based multicondition models to predict the risk of 30 day readmission or death among adult medicine patients: validation and comparison to existing models. BMC Med Inform Decis Mak. 2015;15(1):39.
- , , , et al. Linking electronic health record‐extracted psychosocial data in real‐time to risk of readmission for heart failure. Psychosomatics. 2011;52(4):319–327.
- , . A conceptual framework for the study of early readmission as an indicator of quality of care. Soc Sci Med. 1996;43(11):1533–1541.
- , , , et al. Hospital readmission performance and patterns of readmission: retrospective cohort study of Medicare admissions. BMJ. 2013;347:f6571.
- , , , , , . Getting more performance from performance measurement. N Engl J Med. 2014;371(23):2145–2147.
- , , , et al. Hospital strategy uptake and reductions in unplanned readmission rates for patients with heart failure: a prospective study. J Gen Intern Med. 2015;30(5):605–611.
- . Post‐hospital syndrome—an acquired, transient condition of generalized risk. N Engl J Med. 2013;368(2):100–102.
- , , , et al. Impact of social factors on risk of readmission or mortality in pneumonia and heart failure: systematic review. J Gen Intern Med. 2013;28(2):269–282.
- , , , , , . Effect of clinical and social risk factors on hospital profiling for stroke readmission: a cohort study. Ann Intern Med. 2014;161(11):775–784.
- , , , et al. Neighborhood socioeconomic disadvantage and 30‐day rehospitalization: a retrospective cohort study. Ann Intern Med. 2014;161(11):765–774.
- , , , , , . Postdischarge environmental and socioeconomic factors and the likelihood of early hospital readmission among community‐dwelling Medicare beneficiaries. Gerontologist. 2008;48(4):495–504.
- , , . Socioeconomic status and readmissions: evidence from an urban teaching hospital. Health Aff (Millwood). 2014;33(5):778–785.
- , , , . Adding socioeconomic data to hospital readmissions calculations may produce more useful results. Health Aff (Millwood). 2014;33(5):786–791.
- , , , . Evaluating the added predictive ability of a new marker: from area under the ROC curve to reclassification and beyond. Stat Med. 2008;27(2):157–172; discussion 207–212.
- , , , , . Net reclassification improvement: computation, interpretation, and controversies: a literature review and clinician's guide. Ann Intern Med. 2014;160(2):122–131.
- , , , , , . Predicting 30‐day readmissions with preadmission electronic health record data. Med Care. 2015;53(3):283–289.
- , . Hospital readmissions—not just a measure of quality. JAMA. 2011;306(16):1796–1797.
- , . Thirty‐day readmissions—truth and consequences. N Engl J Med. 2012;366(15):1366–1369.
- , , , . Functional impairment and hospital readmission in medicare seniors. JAMA Intern Med. 2015;175(4):559–565.
- , , . Clinical and sociodemographic risk factors for readmission of Medicare beneficiaries. Health Care Financ Rev. 1988;10(1):27–36.
- , , , , , . Mini‐cog performance: novel marker of post discharge risk among patients hospitalized for heart failure. Circ Heart Fail. 2015;8(1):8–16.
- , , , , , . Association of impaired functional status at hospital discharge and subsequent rehospitalization. J Hosp Med. 2014;9(5):277–282.
- , . Patients in context—EHR capture of social and behavioral determinants of health. N Engl J Med. 2015;372(8):698–701.
- , , , , . Envisioning a social‐health information exchange as a platform to support a patient‐centered medical neighborhood: a feasibility study. J Gen Intern Med. 2015;30(1):60–67.
- , , , , , . Patient factors contributing to variation in same‐hospital readmission rate. Med Care Res Review. 2015;72(3):338–358.
- , , . Does increased access to primary care reduce hospital readmissions? Veterans Affairs Cooperative Study Group on Primary Care and Hospital Readmission. N Engl J Med. 1996;334(22):1441–1447.
Unplanned hospital readmissions are frequent, costly, and potentially avoidable.[1, 2] Due to major federal financial readmissions penalties targeting excessive 30‐day readmissions, there is increasing attention to implementing hospital‐initiated interventions to reduce readmissions.[3, 4] However, universal enrollment of all hospitalized patients into such programs may be too resource intensive for many hospitals.[5] To optimize efficiency and effectiveness, interventions should be targeted to individuals most likely to benefit.[6, 7] However, existing readmission risk‐prediction models have achieved only modest discrimination, have largely used administrative claims data not available until months after discharge, or are limited to only a subset of patients with Medicare or a specific clinical condition.[8, 9, 10, 11, 12, 13, 14] These limitations have precluded accurate identification of high‐risk individuals in an all‐payer general medical inpatient population to provide actionable information for intervention prior to discharge.
Approaches using electronic health record (EHR) data could allow early identification of high‐risk patients during the index hospitalization to enable initiation of interventions prior to discharge. To date, such strategies have relied largely on EHR data from the day of admission.[15, 16] However, given that variation in 30‐day readmission rates are thought to reflect the quality of in‐hospital care, incorporating EHR data from the entire hospital stay to reflect hospital care processes and clinical trajectory may more accurately identify at‐risk patients.[17, 18, 19, 20] Improved accuracy in risk prediction would help better target intervention efforts in the immediate postdischarge period, an interval characterized by heightened vulnerability for adverse events.[21]
To help hospitals target transitional care interventions more effectively to high‐risk individuals prior to discharge, we derived and validated a readmissions risk‐prediction model incorporating EHR data from the entire course of the index hospitalization, which we termed the full‐stay EHR model. We also compared the full‐stay EHR model performance to our group's previously derived prediction model based on EHR data on the day of admission, termed the first‐day EHR model, as well as to 2 other validated readmission models similarly intended to yield near real‐time risk predictions prior to or shortly after hospital discharge.[9, 10, 15]
METHODS
Study Design, Population, and Data Sources
We conducted an observational cohort study using EHR data from 6 hospitals in the DallasFort Worth metroplex between November 1, 2009 and October 30, 2010 using the same EHR system (Epic Systems Corp., Verona, WI). One site was a university‐affiliated safety net hospital; the remaining 5 sites were teaching and nonteaching community sites.
We included consecutive hospitalizations among adults 18 years old discharged alive from any medicine inpatient service. For individuals with multiple hospitalizations during the study period, we included only the first hospitalization. We excluded individuals who died during the index hospitalization, were transferred to another acute care facility, left against medical advice, or who died outside of the hospital within 30 days of discharge. For model derivation, we randomly split the sample into separate derivation (50%) and validation cohorts (50%).
Outcomes
The primary outcome was 30‐day hospital readmission, defined as a nonelective hospitalization within 30 days of discharge to any of 75 acute care hospitals within a 100‐mile radius of Dallas, ascertained from an all‐payer regional hospitalization database. Nonelective hospitalizations included all hospitalizations classified as a emergency, urgent, or trauma, and excluded those classified as elective as per the Centers for Medicare and Medicaid Services Claim Inpatient Admission Type Code definitions.
Predictor Variables for the Full‐Stay EHR Model
The full‐stay EHR model was iteratively developed from our group's previously derived and validated risk‐prediction model using EHR data available on admission (first‐day EHR model).[15] For the full‐stay EHR model, we included all predictor variables included in our published first‐day EHR model as candidate risk factors. Based on prior literature, we additionally expanded candidate predictors available on admission to include marital status (proxy for social isolation) and socioeconomic disadvantage (percent poverty, unemployment, median income, and educational attainment by zip code of residence as proxy measures of the social and built environment).[22, 23, 24, 25, 26, 27] We also expanded the ascertainment of prior hospitalization to include admissions at both the index hospital and any of 75 acute care hospitals from the same, separate all‐payer regional hospitalization database used to ascertain 30‐day readmissions.
Candidate predictors from the remainder of the hospital stay (ie, following the first 24 hours of admission) were included if they were: (1) available in the EHR of all participating hospitals, (2) routinely collected or available at the time of hospital discharge, and (3) plausible predictors of adverse outcomes based on prior literature and clinical expertise. These included length of stay, in‐hospital complications, transfer to an intensive or coronary care unit, blood transfusions, vital sign instabilities within 24 hours of discharge, select laboratory values at time of discharge, and disposition status. We also assessed trajectories of vital signs and selected laboratory values (defined as changes in these measures from admission to discharge).
Statistical Analysis
Model Derivation
Univariate relationships between readmission and each of the candidate predictors were assessed in the derivation cohort using a prespecified significance threshold of P 0.05. We included all factors from our previously derived and validated first‐day EHR model as candidate predictors.[15] Continuous laboratory and vital sign values at the time of discharge were categorized based on clinically meaningful cutoffs; predictors with missing values were assumed to be normal (<1% missing for each variable). Significant univariate candidate variables were entered in a multivariate logistic regression model using stepwise backward selection with a prespecified significance threshold of P 0.05. We performed several sensitivity analyses to confirm the robustness of our model. First, we alternately derived the full‐stay model using stepwise forward selection. Second, we forced in all significant variables from our first‐day EHR model, and entered the candidate variables from the remainder of the hospital stay using both stepwise backward and forward selection separately. Third, prespecified interactions between variables were evaluated for inclusion. Though final predictors varied slightly between the different approaches, discrimination of each model was similar to the model derived using our primary analytic approach (C statistics 0.01, data not shown).
Model Validation
We assessed model discrimination and calibration of the derived full‐stay EHR model using the validation cohort. Model discrimination was estimated by the C statistic. The C statistic represents the probability that, given 2 hospitalized individuals (1 who was readmitted and the other who was not), the model will predict a higher risk for the readmitted patient than for the nonreadmitted patient. Model calibration was assessed by comparing predicted to observed probabilities of readmission by quintiles of risk, and with the Hosmer‐Lemeshow goodness‐of‐fit test.
Comparison to Existing Models
We compared the full‐stay EHR model performance to 3 previously published models: our group's first‐day EHR model, and the LACE (includes Length of stay, Acute (nonelective) admission status, Charlson Comorbidity Index, and Emergency department visits in the past year) and HOSPITAL (includes Hemoglobin at discharge, discharge from Oncology service, Sodium level at discharge, Procedure during index hospitalization, Index hospitalization Type (nonelective), number of Admissions in the past year, and Length of stay) models, which were both derived to predict 30‐day readmissions among general medical inpatients and were intended to help clinicians identify high‐risk patients to target for discharge interventions.[9, 10, 15] We assessed each model's performance in our validation cohort, calculating the C statistic, integrated discrimination index (IDI), and net reclassification index (NRI) compared to the full‐stay model. IDI is a summary measure of both discrimination and reclassification, where more positive values suggest improvement in model performance in both these domains compared to a reference model.[28] The NRI is defined as the sum of the net proportions of correctly reclassified persons with and without the event of interest.[29] The theoretical range of values is 2 to 2, with more positive values indicating improved net reclassification compared to a reference model. Here, we calculated a category‐based NRI to evaluate the performance of models in correctly classifying individuals with and without readmissions into the highest readmission risk quintile versus the lowest 4 risk quintiles compared to the full‐stay EHR model.[29] This prespecified cutoff is relevant for hospitals interested in identifying the highest‐risk individuals for targeted intervention.[6] Because some hospitals may be able to target a greater number of individuals for intervention, we performed a sensitivity analysis by assessing category‐based NRI for reclassification into the top 2 risk quintiles versus the lowest 3 risk quintiles and found no meaningful difference in our results (data not shown). Finally, we qualitatively assessed calibration of comparator models in our validation cohort by comparing predicted probability to observed probability of readmission by quintiles of risk for each model. We conducted all analyses using Stata 12.1 (StataCorp, College Station, TX). This study was approved by the UT Southwestern Medical Center institutional review board.
RESULTS
Overall, 32,922 index hospitalizations were included in our study cohort; 12.7% resulted in a 30‐day readmission (see Supporting Figure 1 in the online version of this article). Individuals had a mean age of 62 years and had diverse race/ethnicity and primary insurance status; half were female (Table 1). The study sample was randomly split into a derivation cohort (50%, n = 16,492) and validation cohort (50%, n = 16,430). Individuals in the derivation cohort with a 30‐day readmission had markedly different socioeconomic and clinical characteristics compared to those not readmitted (Table 1).
| Entire Cohort, N = 32,922 | Derivation Cohort, N = 16,492 | |||
|---|---|---|---|---|
|
No Readmission, N = 14,312 |
Readmission, N = 2,180 |
P Value | ||
| ||||
| Demographic characteristics | ||||
| Age, y, mean (SD) | 62 (17.3) | 61 (17.4) | 64 (17.0) | 0.001 |
| Female, n (%) | 17,715 (53.8) | 7,694 (53.8) | 1,163 (53.3) | 0.72 |
| Race/ethnicity | 0.001 | |||
| White | 21,359 (64.9) | 9,329 (65.2) | 1,361 (62.4) | |
| Black | 5,964 (18.1) | 2,520 (17.6) | 434 (19.9) | |
| Hispanic | 4,452 (13.5) | 1,931 (13.5) | 338 (15.5) | |
| Other | 1,147 (3.5) | 532 (3.7) | 47 (2.2) | |
| Marital status, n (%) | 0.001 | |||
| Single | 8,076 (24.5) | 3,516 (24.6) | 514 (23.6) | |
| Married | 13,394 (40.7) | 5,950 (41.6) | 812 (37.3) | |
| Separated/divorced | 3,468 (10.5) | 1,460 (10.2) | 251 (11.5) | |
| Widowed | 4,487 (13.7) | 1,868 (13.1) | 388 (17.8) | |
| Other | 3,497 (10.6) | 1,518 (10.6) | 215 (9.9) | |
| Primary payer, n (%) | 0.001 | |||
| Private | 13,090 (39.8) | 5,855 (40.9) | 726 (33.3) | |
| Medicare | 13,015 (39.5) | 5,597 (39.1) | 987 (45.3) | |
| Medicaid | 2,204 (6.7) | 852 (5.9) | 242 (11.1) | |
| Charity, self‐pay, or other | 4,613 (14.0) | 2,008 (14.0) | 225 (10.3) | |
| High‐poverty neighborhood, n (%)* | 7,468 (22.7) | 3,208 (22.4) | 548 (25.1) | 0.001 |
| Utilization history | ||||
| 1 ED visits in past year, n (%) | 9,299 (28.2) | 3,793 (26.5) | 823 (37.8) | 0.001 |
| 1 hospitalizations in past year, n (%) | 10,189 (30.9) | 4,074 (28.5) | 1,012 (46.4) | 0.001 |
| Clinical factors from first day of hospitalization | ||||
| Nonelective admission, n (%) | 27,818 (84.5) | 11,960 (83.6) | 1,960 (89.9) | 0.001 |
| Charlson Comorbidity Index, median (IQR)∥ | 0 (01) | 0 (00) | 0 (03) | 0.001 |
| Laboratory abnormalities within 24 hours of admission | ||||
| Albumin <2 g/dL | 355 (1.1) | 119 (0.8) | 46 (2.1) | 0.001 |
| Albumin 23 g/dL | 4,732 (14.4) | 1,956 (13.7) | 458 (21.0) | 0.001 |
| Aspartate aminotransferase >40 U/L | 4,610 (14.0) | 1,922 (13.4) | 383 (17.6) | 0.001 |
| Creatine phosphokinase <60 g/L | 3,728 (11.3) | 1,536 (10.7) | 330 (15.1) | 0.001 |
| Mean corpuscular volume >100 fL/red cell | 1,346 (4.1) | 537 (3.8) | 134 (6.2) | 0.001 |
| Platelets <90 103/L | 912 (2.8) | 357 (2.5) | 116 (5.3) | 0.001 |
| Platelets >350 103/L | 3,332 (10.1) | 1,433 (10.0) | 283 (13.0) | 0.001 |
| Prothrombin time >35 seconds | 248 (0.8) | 90 (0.6) | 35 (1.6) | 0.001 |
| Clinical factors from remainder of hospital stay | ||||
| Length of stay, d, median (IQR) | 4 (26) | 4 (26) | 5 (38) | 0.001 |
| ICU transfer after first 24 hours, n (%) | 988 (3.0) | 408 (2.9) | 94 (4.3) | 0.001 |
| Hospital complications, n (%) | ||||
| Clostridium difficile infection | 119 (0.4) | 44 (0.3) | 24 (1.1) | 0.001 |
| Pressure ulcer | 358 (1.1) | 126 (0.9) | 46 (2.1) | 0.001 |
| Venous thromboembolism | 301 (0.9) | 112 (0.8) | 34 (1.6) | 0.001 |
| Respiratory failure | 1,048 (3.2) | 463 (3.2) | 112 (5.1) | 0.001 |
| Central line‐associated bloodstream infection | 22 (0.07) | 6 (0.04) | 5 (0.23) | 0.005 |
| Catheter‐associated urinary tract infection | 47 (0.14) | 20 (0.14) | 6 (0.28) | 0.15 |
| Acute myocardial infarction | 293 (0.9) | 110 (0.8) | 32 (1.5) | 0.001 |
| Pneumonia | 1,754 (5.3) | 719 (5.0) | 154 (7.1) | 0.001 |
| Sepsis | 853 (2.6) | 368 (2.6) | 73 (3.4) | 0.04 |
| Blood transfusion during hospitalization, n (%) | 4,511 (13.7) | 1,837 (12.8) | 425 (19.5) | 0.001 |
| Laboratory abnormalities at discharge# | ||||
| Blood urea nitrogen >20 mg/dL, n (%) | 10,014 (30.4) | 4,077 (28.5) | 929 (42.6) | 0.001 |
| Sodium <135 mEq/L, n (%) | 4,583 (13.9) | 1,850 (12.9) | 440 (20.2) | 0.001 |
| Hematocrit 27 | 3,104 (9.4) | 1,231 (8.6) | 287 (13.2) | 0.001 |
| 1 vital sign instability at discharge, n (%)# | 6,192 (18.8) | 2,624 (18.3) | 525 (24.1) | 0.001 |
| Discharge location, n (%) | 0.001 | |||
| Home | 23,339 (70.9) | 10,282 (71.8) | 1,383 (63.4) | |
| Home health | 3,185 (9.7) | 1,356 (9.5) | 234 (10.7) | |
| Postacute care** | 5,990 (18.2) | 2,496 (17.4) | 549 (25.2) | |
| Hospice | 408 (1.2) | 178 (1.2) | 14 (0.6) | |
Derivation and Validation of the Full‐Stay EHR Model for 30‐Day Readmission
Our final model included 24 independent variables, including demographic characteristics, utilization history, clinical factors from the first day of admission, and clinical factors from the remainder of the hospital stay (Table 2). The strongest independent predictor of readmission was hospital‐acquired Clostridium difficile infection (adjusted odds ratio [AOR]: 2.03, 95% confidence interval [CI] 1.18‐3.48); other hospital‐acquired complications including pressure ulcers and venous thromboembolism were also significant predictors. Though having Medicaid was associated with increased odds of readmission (AOR: 1.55, 95% CI: 1.31‐1.83), other zip codelevel measures of socioeconomic disadvantage were not predictive and were not included in the final model. Being discharged to hospice was associated with markedly lower odds of readmission (AOR: 0.23, 95% CI: 0.13‐0.40).
| Odds Ratio (95% CI) | ||
|---|---|---|
| Univariate | Multivariate* | |
| ||
| Demographic characteristics | ||
| Age, per 10 years | 1.08 (1.051.11) | 1.07 (1.041.10) |
| Medicaid | 1.97 (1.702.29) | 1.55 (1.311.83) |
| Widow | 1.44 (1.281.63) | 1.27 (1.111.45) |
| Utilization history | ||
| Prior ED visit, per visit | 1.08 (1.061.10) | 1.04 (1.021.06) |
| Prior hospitalization, per hospitalization | 1.30 (1.271.34) | 1.16 (1.121.20) |
| Hospital and clinical factors from first day of hospitalization | ||
| Nonelective admission | 1.75 (1.512.03) | 1.42 (1.221.65) |
| Charlson Comorbidity Index, per point | 1.19 (1.171.21) | 1.06 (1.041.09) |
| Laboratory abnormalities within 24 hours of admission | ||
| Albumin <2 g/dL | 2.57 (1.823.62) | 1.52 (1.052.21) |
| Albumin 23 g/dL | 1.68 (1.501.88) | 1.20 (1.061.36) |
| Aspartate aminotransferase >40 U/L | 1.37 (1.221.55) | 1.21 (1.061.38) |
| Creatine phosphokinase <60 g/L | 1.48 (1.301.69) | 1.28 (1.111.46) |
| Mean corpuscular volume >100 fL/red cell | 1.68 (1.382.04) | 1.32 (1.071.62) |
| Platelets <90 103/L | 2.20 (1.772.72) | 1.56 (1.231.97) |
| Platelets >350 103/L | 1.34 (1.171.54) | 1.24 (1.081.44) |
| Prothrombin time >35 seconds | 2.58 (1.743.82) | 1.92 (1.272.90) |
| Hospital and clinical factors from remainder of hospital stay | ||
| Length of stay, per day | 1.08 (1.071.09) | 1.06 (1.041.07) |
| Hospital complications | ||
| Clostridium difficile infection | 3.61 (2.195.95) | 2.03 (1.183.48) |
| Pressure ulcer | 2.43 (1.733.41) | 1.64 (1.152.34) |
| Venous thromboembolism | 2.01 (1.362.96) | 1.55 (1.032.32) |
| Laboratory abnormalities at discharge | ||
| Blood urea nitrogen >20 mg/dL | 1.86 (1.702.04) | 1.37 (1.241.52) |
| Sodium <135 mEq/L | 1.70 (1.521.91) | 1.34 (1.181.51) |
| Hematocrit 27 | 1.61 (1.401.85) | 1.22 (1.051.41) |
| Vital sign instability at discharge, per instability | 1.29 (1.201.40) | 1.25 (1.151.36) |
| Discharged to hospice | 0.51 (0.300.89) | 0.23 (0.130.40) |
In our validation cohort, the full‐stay EHR model had fair discrimination, with a C statistic of 0.69 (95% CI: 0.68‐0.70) (Table 3). The full‐stay EHR model was well calibrated across all quintiles of risk, with slight overestimation of predicted risk in the lowest and highest quintiles (Figure 1a) (see Supporting Table 5 in the online version of this article). It also effectively stratified individuals across a broad range of predicted readmission risk from 4.1% in the lowest decile to 36.5% in the highest decile (Table 3).
| Model Name | C‐Statistic (95% CI) | IDI, % (95% CI) | NRI (95% CI) | Average Predicted Risk, % | |
|---|---|---|---|---|---|
| Lowest Decile | Highest Decile | ||||
| |||||
| Full‐stay EHR model | |||||
| Derivation cohort | 0.72 (0.70 to 0.73) | 4.1 | 36.5 | ||
| Validation cohort | 0.69 (0.68 to 0.70) | [Reference] | [Reference] | 4.1 | 36.5 |
| First‐day EHR model | 0.67 (0.66 to 0.68) | 1.2 (1.4 to 1.0) | 0.020 (0.038 to 0.002) | 5.8 | 31.9 |
| LACE model | 0.65 (0.64 to 0.66) | 2.6 (2.9 to 2.3) | 0.046 (0.067 to 0.024) | 6.1 | 27.5 |
| HOSPITAL model | 0.64 (0.62 to 0.65) | 3.2 (3.5 to 2.9) | 0.058 (0.080 to 0.035) | 6.7 | 26.6 |
Comparing the Performance of the Full‐Stay EHR Model to Other Models
The full‐stay EHR model had better discrimination compared to the first‐day EHR model and the LACE and HOSPITAL models, though the magnitude of improvement was modest (Table 3). The full‐stay EHR model also stratified individuals across a broader range of readmission risk, and was better able to discriminate and classify those in the highest quintile of risk from those in the lowest 4 quintiles of risk compared to other models as assessed by the IDI and NRI (Table 3) (see Supporting Tables 14 and Supporting Figure 2 in the online version of this article). In terms of model calibration, both the first‐day EHR and LACE models were also well calibrated, whereas the HOSPITAL model was less robust (Figure 1).
The diagnostic accuracy of the full‐stay EHR model in correctly predicting those in the highest quintile of risk was better than that of the first‐day, LACE, and HOSPITAL models, though overall improvements in the sensitivity, specificity, positive and negative predictive values, and positive and negative likelihood ratios were also modest (see Supporting Table 6 in the online version of this article).
DISCUSSION
In this study, we used clinically detailed EHR data from the entire hospitalization on 32,922 individuals treated in 6 diverse hospitals to develop an all‐payer, multicondition readmission risk‐prediction model. To our knowledge, this is the first 30‐day hospital readmission risk‐prediction model to use a comprehensive set of factors from EHR data from the entire hospital stay. Prior EHR‐based models have focused exclusively on data available on or prior to the first day of admission, which account for clinical severity on admission but do not account for factors uncovered during the inpatient stay that influence the chance of a postdischarge adverse outcome.[15, 30] We specifically assessed the prognostic impact of a comprehensive set of factors from the entire index hospitalization, including hospital‐acquired complications, clinical trajectory, and stability on discharge in predicting hospital readmissions. Our full‐stay EHR model had statistically better discrimination, calibration, and diagnostic accuracy than our existing all‐cause first‐day EHR model[15] and 2 previously published readmissions models that included more limited information from hospitalization (such as length of stay).[9, 10] However, although the more complicated full‐stay EHR model was statistically better than previously published models, we were surprised that the predictive performance was only modestly improved despite the inclusion of many additional clinically relevant prognostic factors.
Taken together, our study has several important implications. First, the added complexity and resource intensity of implementing a full‐stay EHR model yields only modestly improved readmission risk prediction. Thus, hospitals and healthcare systems interested in targeting their highest‐risk individuals for interventions to reduce 30‐day readmission should consider doing so within the first day of hospital admission. Our group's previously derived and validated first‐day EHR model, which used data only from the first day of admission, qualitatively performed nearly as well as the full‐stay EHR model.[15] Additionally, a recent study using only preadmission EHR data to predict 30‐day readmissions also achieved similar discrimination and diagnostic accuracy as our full‐stay model.[30]
Second, the field of readmissions risk‐prediction modeling may be reaching the maximum achievable model performance using data that are currently available in the EHR. Our limited ability to accurately predict all‐cause 30‐day readmission risk may reflect the influence of currently unmeasured patient, system, and community factors on readmissions.[31, 32, 33] Due to the constraints of data collected in the EHR, we were unable to include several patient‐level clinical characteristics associated with hospital readmission, including self‐perceived health status, functional impairment, and cognition.[33, 34, 35, 36] However, given their modest effect sizes (ORs ranging from 1.062.10), adequately measuring and including these risk factors in our model may not meaningfully improve model performance and diagnostic accuracy. Further, many social and behavioral patient‐level factors are also not consistently available in EHR data. Though we explored the role of several neighborhood‐level socioeconomic measuresincluding prevalence of poverty, median income, education, and unemploymentwe found that none were significantly associated with 30‐day readmissions. These particular measures may have been inadequate to characterize individual‐level social and behavioral factors, as several previous studies have demonstrated that patient‐level factors such as social support, substance abuse, and medication and visit adherence can influence readmission risk in heart failure and pneumonia.[11, 16, 22, 25] This underscores the need for more standardized routine collection of data across functional, social, and behavioral domains in clinical settings, as recently championed by the Institute of Medicine.[11, 37] Integrating data from outside the EHR on postdischarge health behaviors, self‐management, follow‐up care, recovery, and home environment may be another important but untapped strategy for further improving prediction of readmissions.[25, 38]
Third, a multicondition readmission risk‐prediction model may be a less effective strategy than more customized disease‐specific models for selected conditions associated with high 30‐day readmission rates. Our group's previously derived and internally validated models for heart failure and human immunodeficiency virus had superior discrimination compared to our full‐stay EHR model (C statistic of 0.72 for each).[11, 13] However, given differences in the included population and time periods studied, a head‐to‐head comparison of these different strategies is needed to assess differences in model performance and utility.
Our study had several strengths. To our knowledge, this is the first study to rigorously measure the additive influence of in‐hospital complications, clinical trajectory, and stability on discharge on the risk of 30‐day hospital readmission. Additionally, our study included a large, diverse study population that included all payers, all ages of adults, a mix of community, academic, and safety net hospitals, and individuals from a broad array of racial/ethnic and socioeconomic backgrounds.
Our results should be interpreted in light of several limitations. First, though we sought to represent a diverse group of hospitals, all study sites were located within north Texas and generalizability to other regions is uncertain. Second, our ascertainment of prior hospitalizations and readmissions was more inclusive than what could be typically accomplished in real time using only EHR data from a single clinical site. We performed a sensitivity analysis using only prior utilization data available within the EHR from the index hospital with no meaningful difference in our findings (data not shown). Additionally, a recent study found that 30‐day readmissions occur at the index hospital for over 75% of events, suggesting that 30‐day readmissions are fairly comprehensively captured even with only single‐site data.[39] Third, we were not able to include data on outpatient visits before or after the index hospitalization, which may influence the risk of readmission.[1, 40]
In conclusion, incorporating clinically granular EHR data from the entire course of hospitalization modestly improves prediction of 30‐day readmissions compared to models that only include information from the first 24 hours of hospital admission or models that use far fewer variables. However, given the limited improvement in prediction, our findings suggest that from the practical perspective of implementing real‐time models to identify those at highest risk for readmission, it may not be worth the added complexity of waiting until the end of a hospitalization to leverage additional data on hospital complications, and the trajectory of laboratory and vital sign values currently available in the EHR. Further improvement in prediction of readmissions will likely require accounting for psychosocial, functional, behavioral, and postdischarge factors not currently present in the inpatient EHR.
Disclosures: This study was presented at the Society of Hospital Medicine 2015 Annual Meeting in National Harbor, Maryland, and the Society of General Internal Medicine 2015 Annual Meeting in Toronto, Canada. This work was supported by the Agency for Healthcare Research and Qualityfunded UT Southwestern Center for Patient‐Centered Outcomes Research (1R24HS022418‐01) and the Commonwealth Foundation (#20100323). Drs. Nguyen and Makam received funding from the UT Southwestern KL2 Scholars Program (NIH/NCATS KL2 TR001103). Dr. Halm was also supported in part by NIH/NCATS U54 RFA‐TR‐12‐006. The study sponsors had no role in the design and conduct of the study; collection, management, analysis, and interpretation of the data; and preparation, review, or approval of the manuscript. The authors have no conflicts of interest to disclose.
- , , . Rehospitalizations among patients in the Medicare fee‐for‐service program. N Engl J Med. 2009;360(14):1418–1428.
- , , , , . Proportion of hospital readmissions deemed avoidable: a systematic review. CMAJ. 2011;183(7):E391–E402.
- , , , , , . Hospital‐initiated transitional care interventions as a patient safety strategy: a systematic review. Ann Intern Med. 2013;158(5 pt 2):433–440.
- , , , , . Interventions to reduce 30‐day rehospitalization: a systematic review. Ann Intern Med. 2011;155(8):520–528.
- , , , , , . Interventions to Improve Care Transitions at Hospital Discharge. Rockville, MD: Agency for Healthcare Research and Quality; 2013.
- , , , et al. Allocating scarce resources in real‐time to reduce heart failure readmissions: a prospective, controlled study. BMJ Qual Saf. 2013;22(12):998–1005.
- , , , , . Implementing electronic health care predictive analytics: considerations and challenges. Health Aff (Millwood). 2014;33(7):1148–1154.
- , , , et al. Risk prediction models for hospital readmission: a systematic review. JAMA. 2011;306(15):1688–1698.
- , , , et al. Derivation and validation of an index to predict early death or unplanned readmission after discharge from hospital to the community. CMAJ. 2010;182(6):551–557.
- , , , . Potentially avoidable 30‐day hospital readmissions in medical patients: derivation and validation of a prediction model. JAMA Intern Med. 2013;173(8):632–638.
- , , , et al. An automated model to identify heart failure patients at risk for 30‐day readmission or death using electronic medical record data. Med Care. 2010;48(11):981–988.
- , , , et al. An automated model using electronic medical record data identifies patients with cirrhosis at high risk for readmission. Clin Gastroenterol Hepatol. 2013;11(10):1335–1341.e1331.
- , , , , , . An electronic medical record‐based model to predict 30‐day risk of readmission and death among HIV‐infected inpatients. J Acquir Immune Defic Syndr. 2012;61(3):349–358.
- , , , et al. Development and use of an administrative claims measure for profiling hospital‐wide performance on 30‐day unplanned readmission. Ann Intern Med. 2014;161(10 suppl):S66–S75.
- , , , et al. Electronic medical record‐based multicondition models to predict the risk of 30 day readmission or death among adult medicine patients: validation and comparison to existing models. BMC Med Inform Decis Mak. 2015;15(1):39.
- , , , et al. Linking electronic health record‐extracted psychosocial data in real‐time to risk of readmission for heart failure. Psychosomatics. 2011;52(4):319–327.
- , . A conceptual framework for the study of early readmission as an indicator of quality of care. Soc Sci Med. 1996;43(11):1533–1541.
- , , , et al. Hospital readmission performance and patterns of readmission: retrospective cohort study of Medicare admissions. BMJ. 2013;347:f6571.
- , , , , , . Getting more performance from performance measurement. N Engl J Med. 2014;371(23):2145–2147.
- , , , et al. Hospital strategy uptake and reductions in unplanned readmission rates for patients with heart failure: a prospective study. J Gen Intern Med. 2015;30(5):605–611.
- . Post‐hospital syndrome—an acquired, transient condition of generalized risk. N Engl J Med. 2013;368(2):100–102.
- , , , et al. Impact of social factors on risk of readmission or mortality in pneumonia and heart failure: systematic review. J Gen Intern Med. 2013;28(2):269–282.
- , , , , , . Effect of clinical and social risk factors on hospital profiling for stroke readmission: a cohort study. Ann Intern Med. 2014;161(11):775–784.
- , , , et al. Neighborhood socioeconomic disadvantage and 30‐day rehospitalization: a retrospective cohort study. Ann Intern Med. 2014;161(11):765–774.
- , , , , , . Postdischarge environmental and socioeconomic factors and the likelihood of early hospital readmission among community‐dwelling Medicare beneficiaries. Gerontologist. 2008;48(4):495–504.
- , , . Socioeconomic status and readmissions: evidence from an urban teaching hospital. Health Aff (Millwood). 2014;33(5):778–785.
- , , , . Adding socioeconomic data to hospital readmissions calculations may produce more useful results. Health Aff (Millwood). 2014;33(5):786–791.
- , , , . Evaluating the added predictive ability of a new marker: from area under the ROC curve to reclassification and beyond. Stat Med. 2008;27(2):157–172; discussion 207–212.
- , , , , . Net reclassification improvement: computation, interpretation, and controversies: a literature review and clinician's guide. Ann Intern Med. 2014;160(2):122–131.
- , , , , , . Predicting 30‐day readmissions with preadmission electronic health record data. Med Care. 2015;53(3):283–289.
- , . Hospital readmissions—not just a measure of quality. JAMA. 2011;306(16):1796–1797.
- , . Thirty‐day readmissions—truth and consequences. N Engl J Med. 2012;366(15):1366–1369.
- , , , . Functional impairment and hospital readmission in medicare seniors. JAMA Intern Med. 2015;175(4):559–565.
- , , . Clinical and sociodemographic risk factors for readmission of Medicare beneficiaries. Health Care Financ Rev. 1988;10(1):27–36.
- , , , , , . Mini‐cog performance: novel marker of post discharge risk among patients hospitalized for heart failure. Circ Heart Fail. 2015;8(1):8–16.
- , , , , , . Association of impaired functional status at hospital discharge and subsequent rehospitalization. J Hosp Med. 2014;9(5):277–282.
- , . Patients in context—EHR capture of social and behavioral determinants of health. N Engl J Med. 2015;372(8):698–701.
- , , , , . Envisioning a social‐health information exchange as a platform to support a patient‐centered medical neighborhood: a feasibility study. J Gen Intern Med. 2015;30(1):60–67.
- , , , , , . Patient factors contributing to variation in same‐hospital readmission rate. Med Care Res Review. 2015;72(3):338–358.
- , , . Does increased access to primary care reduce hospital readmissions? Veterans Affairs Cooperative Study Group on Primary Care and Hospital Readmission. N Engl J Med. 1996;334(22):1441–1447.
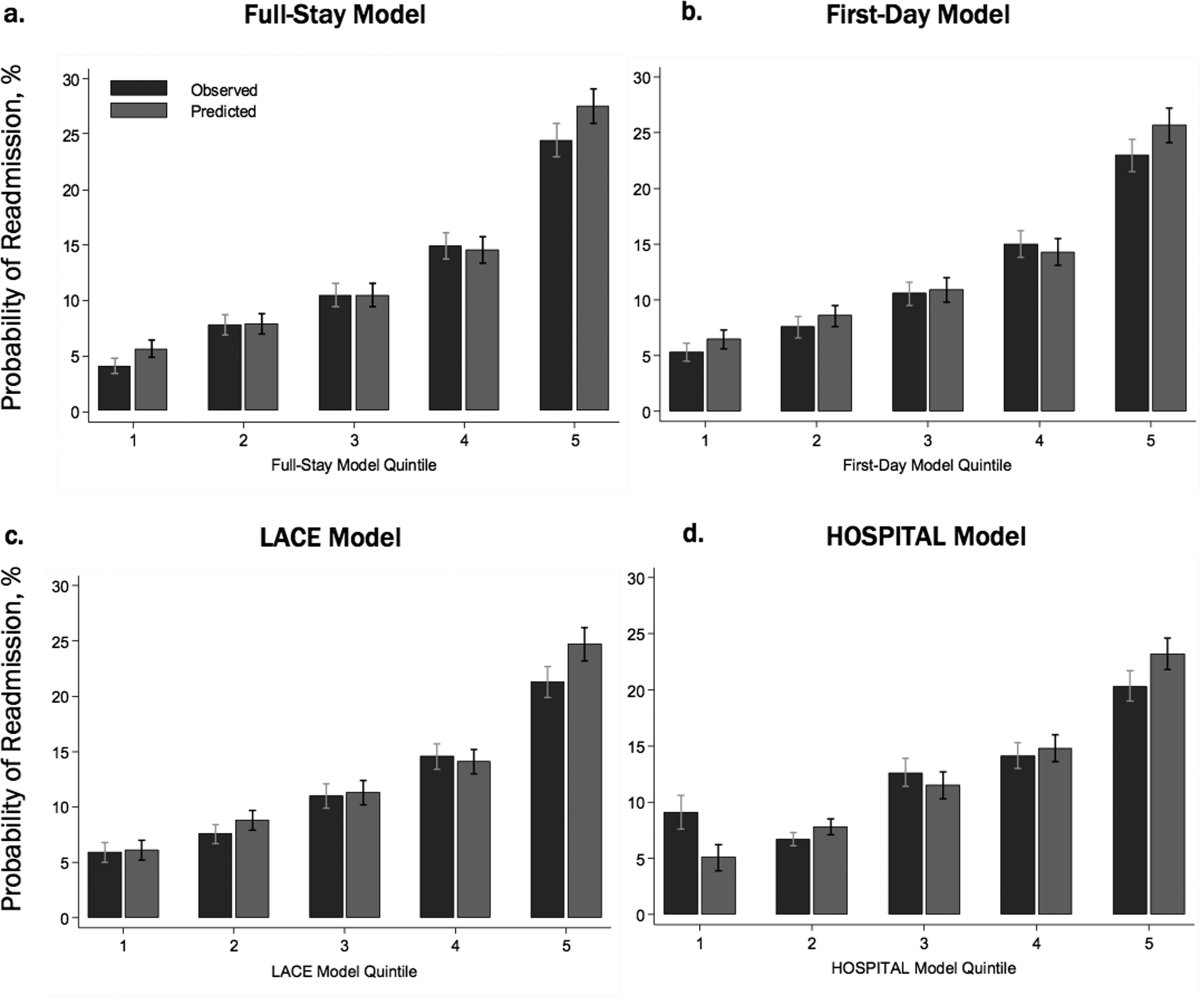
Financial Performance and Outcomes
Hospital care accounts for the single largest category of national healthcare expenditures, totaling $936.9 billion in 2013.[1] With ongoing scrutiny of US healthcare spending, hospitals are under increasing pressure to justify high costs and robust profits.[2] However, the dominant fee‐for‐service reimbursement model creates incentives for hospitals to prioritize high volume over high‐quality care to maximize profits.[3] Because hospitals may be reluctant to implement improvements if better quality is not accompanied by better payment or improved financial margins, an approach to stimulate quality improvement among hospitals has been to leverage consumer pressure through required public reporting of selected outcome metrics.[4, 5] Public reporting of outcomes is thought to influence hospital reputation; in turn, reputation affects patient perceptions and influences demand for hospital services, potentially enabling reputable hospitals to command higher prices for services to enhance hospital revenue.[6, 7]
Though improving outcomes is thought to reduce overall healthcare costs, it is unclear whether improving outcomes results in a hospital's financial return on investment.[4, 5, 8] Quality improvement can require substantial upfront investment, requiring that hospitals already have robust financial health to engage in such initiatives.[9, 10] Consequently, instead of stimulating broad efforts in quality improvement, public reporting may exacerbate existing disparities in hospital quality and finances, by rewarding already financially healthy hospitals, and by inadvertently penalizing hospitals without the means to invest in quality improvement.[11, 12, 13, 14, 15] Alternately, because fee‐for‐service remains the dominant reimbursement model for hospitals, loss of revenue through reducing readmissions may outweigh any financial gains from improved public reputation and result in worse overall financial performance, though robust evidence for this concern is lacking.[16, 17]
A small number of existing studies suggest a limited correlation between improved hospital financial performance and improved quality, patient safety, and lower readmission rates.[18, 19, 20] However, these studies had several limitations. They were conducted prior to public reporting of selected outcome metrics by the Centers for Medicare and Medicaid Services (CMS)[18, 19, 20]; used data from the Medicare Cost Report, which is not uniformly audited and thus prone to measurement error[19, 20]; used only relative measures of hospital financial performance (eg, operating margin), which do not capture the absolute amount of revenue potentially available for investment in quality improvement[18, 19]; or compared only hospitals at the extremes of financial performance, potentially exaggerating the magnitude of the relationship between hospital financial performance and quality outcomes.[19]
To address this gap in the literature, we sought to assess whether hospitals with robust financial performance have lower 30‐day risk‐standardized mortality and hospital readmission rates for acute myocardial infarction (AMI), congestive heart failure (CHF), and pneumonia (PNA). Given the concern that hospitals with the lowest mortality and readmission rates may experience a decrease in financial performance due to the lower volume of hospitalizations, we also assessed whether hospitals with the lowest readmission and mortality rates had a differential change in financial performance over time compared to hospitals with the highest rates.
METHODS
Data Sources and Study Population
This was an observational study using audited financial data from the 2008 and 2012 Hospital Annual Financial Data Files from the Office of Statewide Health Planning and Development (OSHPD) in the state of California, merged with data on outcome measures publicly reported by CMS via the Hospital Compare website for July 1, 2008 to June 30, 2011.[21, 22] We included all general acute care hospitals with available OSHPD data in 2008 and at least 1 publicly reported outcome from 2008 to 2011. We excluded hospitals without 1 year of audited financial data for 2008 and hospitals that closed during 2008 to 2011.
Measures of Financial Performance
Because we hypothesized that the absolute amount of revenue generated from clinical operations would influence investment in quality improvement programs more so than relative changes in revenue,[20] we used net revenue from operations (total operating revenue minus total operating expense) as our primary measure of hospital financial performance. We also performed 2 companion analyses using 2 commonly reported relative measures of financial performanceoperating margin (net revenue from operations divided by total operating revenue) and total margin (net total revenue divided by total revenue from all sources). Net revenue from operations for 2008 was adjusted to 2012 US dollars using the chained Consumer Price Index for all urban consumers.
Outcomes
For our primary analysis, the primary outcomes were publicly reported all‐cause 30‐day risk‐standardized mortality rates (RSMR) and readmission rates (RSRR) for AMI, CHF, and PNA aggregated over a 3‐year period. These measures were adjusted for key demographic and clinical characteristics available in Medicare data. CMS began publicly reporting 30‐day RSMR for AMI and CHF in June 2007, RSMR for PNA in June 2008, and RSRR for all 3 conditions in July 2009.[23, 24]
To assess whether public reporting had an effect on subsequent hospital financial performance, we conducted a companion analysis where the primary outcome of interest was change in hospital financial performance over time, using the same definitions of financial performance outlined above. For this companion analysis, publicly reported 30‐day RSMR and RSRR for AMI, CHF, and PNA were assessed as predictors of subsequent financial performance.
Hospital Characteristics
Hospital characteristics were ascertained from the OSHPD data. Safety‐net status was defined as hospitals with an annual Medicaid caseload (number of Medicaid discharges divided by the total number of discharges) 1 standard deviation above the mean Medicaid caseload, as defined in previous studies.[25]
Statistical Analyses
Effect of Baseline Financial Performance on Subsequent Publicly Reported Outcomes
To estimate the relationship between baseline hospital financial performance in 2008 and subsequent RSMR and RSRR for AMI, CHF, and PNA from 2008 to 2011, we used linear regression adjusted for the following hospital characteristics: teaching status, rural location, bed size, safety‐net status, ownership, Medicare caseload, and volume of cases reported for the respective outcome. We accounted for clustering of hospitals by ownership. We adjusted for hospital volume of reported cases for each condition given that the risk‐standardization models used by CMS shrink outcomes for small hospitals to the mean, and therefore do not account for a potential volume‐outcome relationship.[26] We conducted a sensitivity analysis excluding hospitals at the extremes of financial performance, defined as hospitals with extreme outlier values for each financial performance measure (eg, values more than 3 times the interquartile range above the first quartile or below the third quartile).[27] Nonlinearity of financial performance measures was assessed using restricted cubic splines. For ease of interpretation, we scaled the estimated change in RSMR and RSRR per $50 million increase in net revenue from operations, and graphed nonparametric relationships using restricted cubic splines.
Effect of Public Reporting on Subsequent Hospital Financial Performance
To assess whether public reporting had an effect on subsequent hospital financial performance, we conducted a companion hospital‐level difference‐in‐differences analysis to assess for differential changes in hospital financial performance between 2008 and 2012, stratified by tertiles of RSMR and RSRR rates from 2008 to 2011. This approach compares differences in an outcome of interest (hospital financial performance) within each group (where each group is a tertile of publicly reported rates of RSMR or RSRR), and then compares the difference in these differences between groups. Therefore, these analyses use each group as their own historical control and the opposite group as a concurrent control to account for potential secular trends. To conduct our difference‐in‐differences analysis, we compared the change in financial performance over time in the top tertile of hospitals to the change in financial performance over time in the bottom tertile of hospitals with respect to AMI, CHF, and PNA RSMR and RSRR. Our models therefore included year (2008 vs 2012), tertile of publicly reported rates for RSMR or RSRR, and the interaction between them as predictors, where the interaction was the difference‐in‐differences term and the primary predictor of interest. In addition to adjusting for hospital characteristics and accounting for clustering as mentioned above, we also included 3 separate interaction terms for year with bed size, safety‐net status, and Medicare caseload, to account for potential changes in the hospitals over time that may have independently influenced financial performance and publicly reported 30‐day measures. For sensitivity analyses, we repeated our difference‐in‐differences analyses excluding hospitals with a change in ownership and extreme outliers with respect to financial performance in 2008. We performed model diagnostics including assessment of functional form, linearity, normality, constant variance, and model misspecification. All analyses were conducted using Stata version 12.1 (StataCorp, College Station, TX). This study was deemed exempt from review by the UT Southwestern Medical Center institutional review board.
RESULTS
Among the 279 included hospitals (see Supporting Figure 1 in the online version of this article), 278 also had financial data available for 2012. In 2008, the median net revenue from operations was $1.6 million (interquartile range [IQR], $2.4 to $10.3 million), the median operating margin was 1.5% (IQR, 4.6% to 6%), and the median total margin was 2.5% (IQR, 2.2% to 7.5% (Table 1). The number of hospitals reporting each outcome, and median outcome rates, are shown in Table 2.
| 2008, n = 279 | 2012, n = 278 | |
|---|---|---|
| ||
| Hospital characteristics | ||
| Teaching, n (%) | 28 (10.0) | 28 (10.0) |
| Rural, n (%) | 55 (19.7) | 55 (19.7) |
| Bed size, n (%) | ||
| 099 (small) | 57 (20.4) | 55 (19.8) |
| 100299 (medium) | 130 (46.6) | 132 (47.5) |
| 300 (large) | 92 (33.0) | 91 (32.7) |
| Safety‐net hospital, n (%)* | 46 (16.5) | 48 (17.3) |
| Hospital ownership, n (%) | ||
| City or county | 15 (5.4) | 16 (5.8) |
| District | 42 (15.1) | 39 (14.0) |
| Investor | 66 (23.7) | 66 (23.7) |
| Private nonprofit | 156 (55.9) | 157 (56.5) |
| Medicare caseload, mean % (SD) | 41.6 (14.7) | 43.6 (14.7) |
| Financial performance measures | ||
| Net revenue from operations, median $ in millions (IQR; range) | 1.6 (2.4 to 10.3; 495.9 to 144.1) | 3.2 (2.9 to 15.4; 396.2 to 276.8) |
| Operating margin, median % (IQR; range) | 1.5 (4.6 to 6.8; 77.8 to 26.4) | 2.3 (3.9 to 8.2; 134.8 to 21.1) |
| Total margin, median % (IQR; range) | 2.5 (2.2 to 7.5; 101.0 to 26.3) | 4.5 (0.7 to 9.8; 132.2 to 31.1) |
| No. | Median % (IQR) | Adjusted % Change (95% CI) per $50 Million Increase in Net Revenue From Operations | ||
|---|---|---|---|---|
| Overall | Extreme Outliers Excluded | |||
| ||||
| Myocardial infarction | ||||
| Mortality rate | 211 | 15.2 (14.216.2) | 0.07 (0.10 to 0.24) | 0.63 (0.21 to 1.48) |
| Readmission rate | 184 | 19.4 (18.520.2) | Nonlinear | 0.34 (1.17 to 0.50) |
| Congestive heart failure | ||||
| Mortality rate | 259 | 11.1 (10.112.1) | 0.17 (0.01 to 0.35) | Nonlinear∥ |
| Readmission rate | 264 | 24.5 (23.525.6) | 0.07 (0.27 to 0.14) | 0.45 (1.36 to 0.47) |
| Pneumonia | ||||
| Mortality rate | 268 | 11.6 (10.413.2) | 0.17 (0.42 to 0.07) | 0.35 (1.19 to 0.49) |
| Readmission rate | 268 | 18.2 (17.319.1) | 0.04 (0.20 to 0.11) | 0.56 (1.27 to 0.16) |
Relationship Between Financial Performance and Publicly Reported Outcomes
Acute Myocardial Infarction
We did not observe a consistent relationship between hospital financial performance and AMI mortality and readmission rates. In our overall adjusted analyses, net revenue from operations was not associated with mortality, but was significantly associated with a decrease in AMI readmissions among hospitals with net revenue from operations between approximately $5 million to $145 million (nonlinear relationship, F statistic = 4.8, P < 0.001 (Table 2, Figure 1A). However, after excluding 23 extreme outlying hospitals by net revenue from operations (10 underperformers with net revenue <$49.4 million and 13 overperformers with net revenue >$52.1 million), this relationship was no longer observed. Using operating margin instead of net revenue from operations as the measure of hospital financial performance, we observed a 0.2% increase in AMI mortality (95% confidence interval [CI]: 0.06%‐0.35%) (see Supporting Table 1 and Supporting Figure 2 in the online version of this article) for each 10% increase in operating margin, which persisted with the exclusion of 5 outlying hospitals by operating margin (all 5 were underperformers, with operating margins <38.6%). However, using total margin as the measure of financial performance, there was no significant relationship with either mortality or readmissions (see Supporting Table 2 and Supporting Figure 3 in the online version of this article).
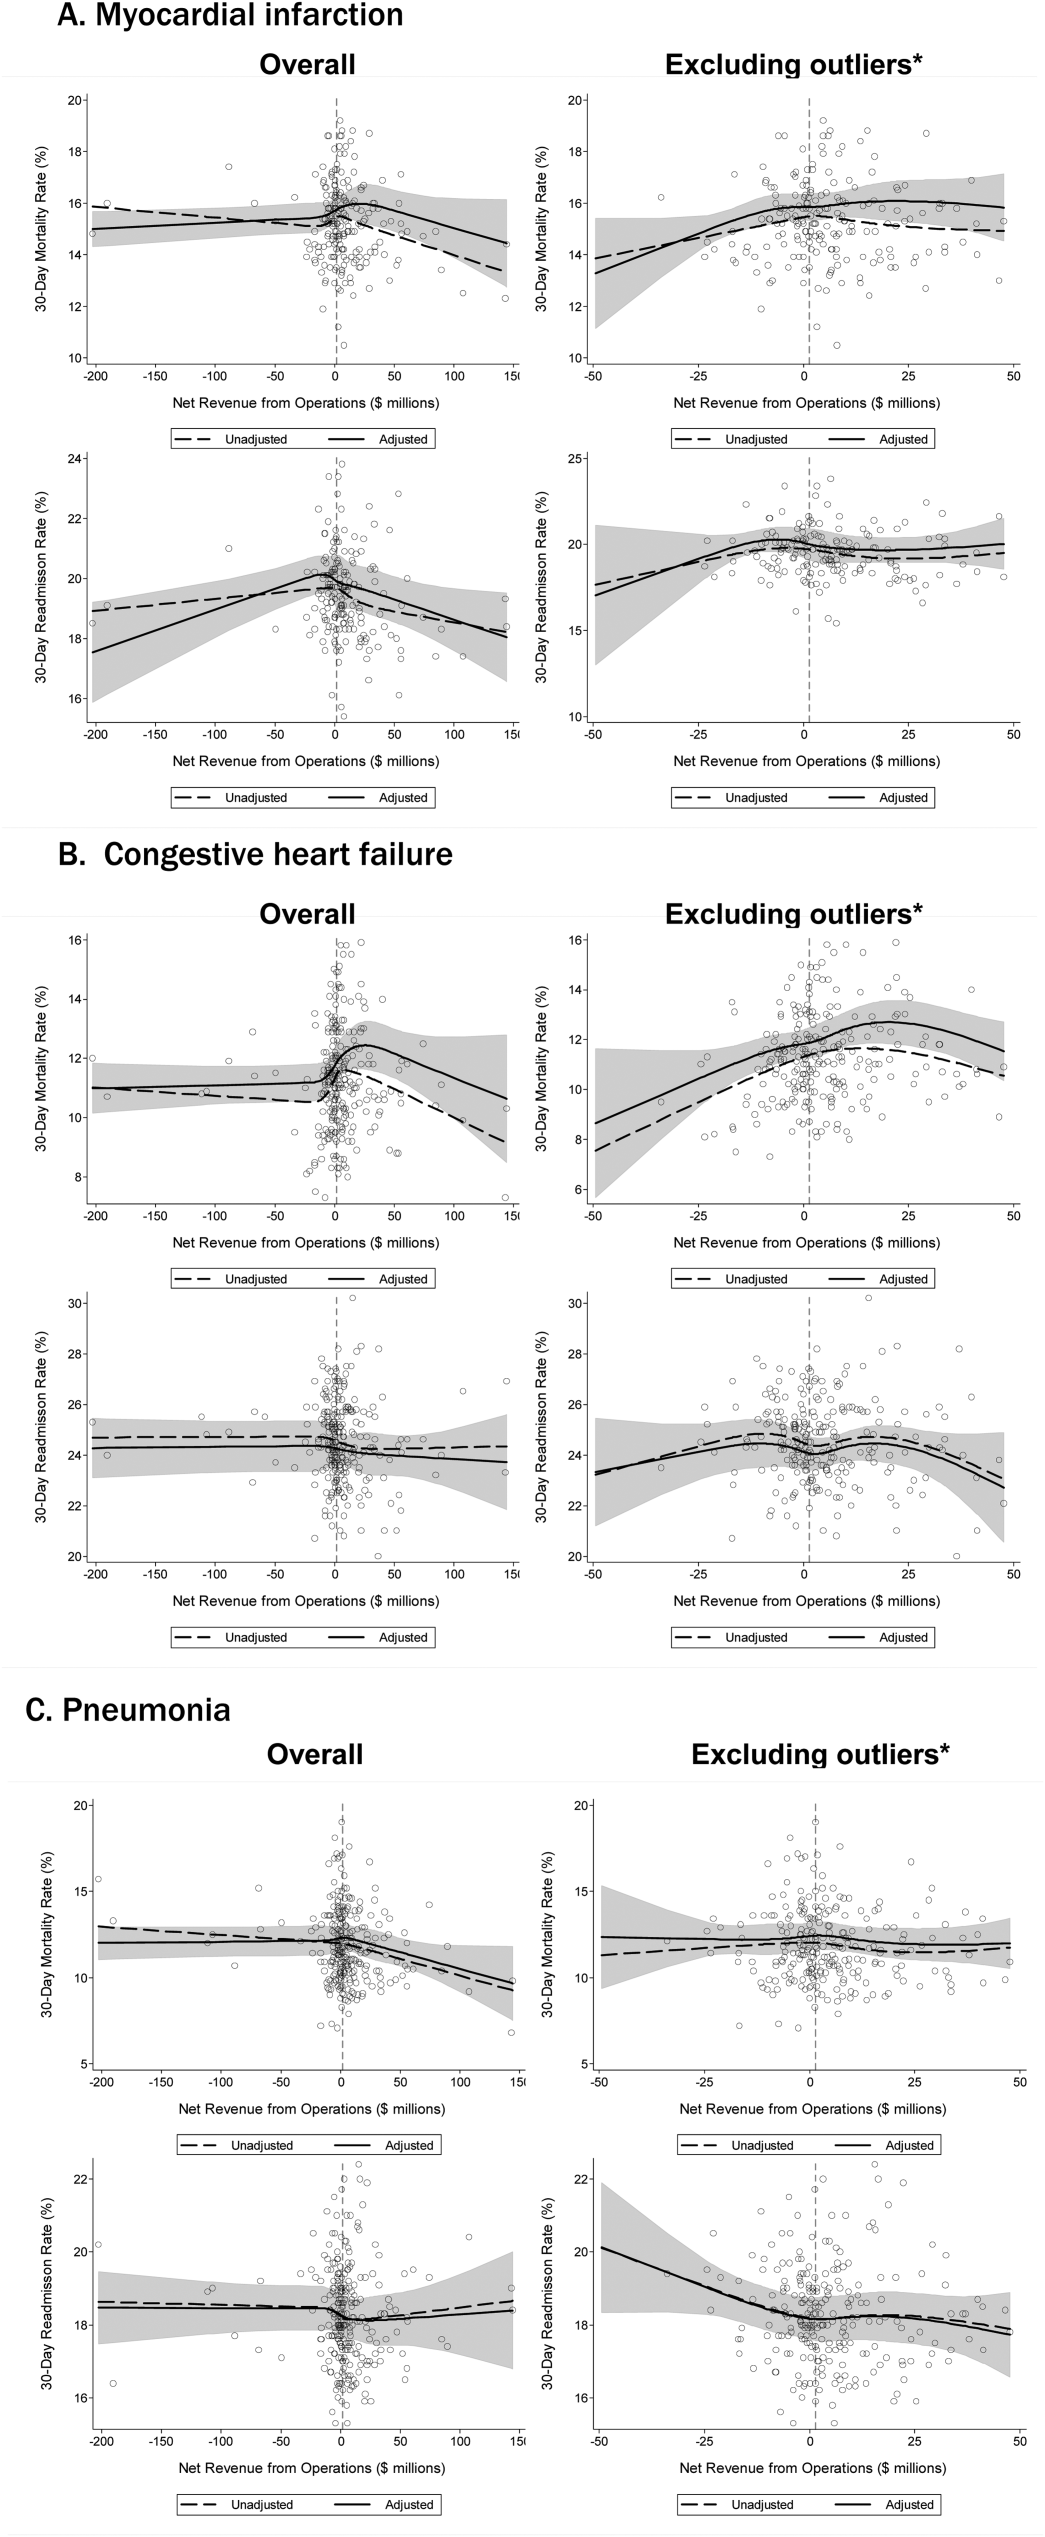
Congestive Heart Failure
In our primary analyses, we did not observe a significant relationship between net revenue from operations and CHF mortality and readmission rates. However, after excluding 23 extreme outliers, increasing net revenue from operations was associated with a modest increase in CHF mortality among hospitals, with net revenue between approximately $35 million and $20 million (nonlinear relationship, F statistic = 3.6, P = 0.008 (Table 2, Figure 1B). Using alternate measures of financial performance, we observed a consistent relationship between increasing hospital financial performance and higher 30‐day CHF mortality rate. Using operating margin, we observed a slight increase in the mortality rate for CHF (0.26% increase in CHF RSMR for every 10% increase in operating margin) (95% CI: 0.07%‐0.45%) (see Supporting Table 1 and Supporting Figure 2 in the online version of this article), which persisted after the exclusion of 5 extreme outliers. Using total margin, we observed a significant but modest association between improved hospital financial performance and increased mortality rate for CHF (nonlinear relationship, F statistic = 2.9, P = 0.03) (see Supporting Table 2 and Supporting Figure 3 in the online version of this article), which persisted after the exclusion of 3 extreme outliers (0.32% increase in CHF RSMR for every 10% increase in total margin) (95% CI: 0.03%‐0.62%).
Pneumonia
Hospital financial performance (using net revenue, operating margin, or total margin) was not associated with 30‐day PNA mortality or readmission rates.
Relationship of Readmission and Mortality Rates on Subsequent Hospital Financial Performance
Compared to hospitals in the highest tertile of readmission and mortality rates (ie, those with the worst rates), hospitals in the lowest tertile of readmission and mortality rates (ie, those with the best rates) had a similar magnitude of increase in net revenue from operations from 2008 to 2012 (Table 3). The difference‐in‐differences analyses showed no relationship between readmission or mortality rates for AMI, CHF, and PNA and changes in net revenue from operations from 2008 to 2012 (difference‐in‐differences estimates ranged from $8.61 to $6.77 million, P > 0.3 for all). These results were robust to the exclusion of hospitals with a change in ownership and extreme outliers by net revenue from operations (data not reported).
| Outcome | Tertile With Highest Outcome Rates (Worst Hospitals) | Tertile With Lowest Outcome Rates (Best Hospitals) | Difference in Net From Operations Differences Between Highest and Lowest Outcome Rate Tertiles, $ Million (95% CI) | P | ||
|---|---|---|---|---|---|---|
| Outcome, Median % (IQR) | Gain/Loss in Net Revenue From Operations From 2008 to 2012, $ Million* | Outcome, Median % (IQR) | Gain/Loss in Net Revenue from Operations From 2008 to 2012, $ Million* | |||
| ||||||
| AMI mortality | 16.7 (16.217.4) | +65.62 | 13.8 (13.314.2) | +74.23 | 8.61 (27.95 to 10.73) | 0.38 |
| AMI readmit | 20.7 (20.321.5) | +38.62 | 18.3 (17.718.6) | +31.85 | +6.77 (13.24 to 26.77) | 0.50 |
| CHF mortality | 13.0 (12.313.9) | +45.66 | 9.6 (8.910.1) | +48.60 | 2.94 (11.61 to 5.73) | 0.50 |
| CHF readmit | 26.2 (25.726.9) | +47.08 | 23.0 (22.323.5) | +46.08 | +0.99 (10.51 to 12.50) | 0.87 |
| PNA mortality | 13.9 (13.314.7) | +43.46 | 9.9 (9.310.4) | +38.28 | +5.18 (7.01 to 17.37) | 0.40 |
| PNA readmit | 19.4 (19.120.1) | +47.21 | 17.0 (16.517.3) | +45.45 | +1.76 (8.34 to 11.86) | 0.73 |
DISCUSSION
Using audited financial data from California hospitals in 2008 and 2012, and CMS data on publicly reported outcomes from 2008 to 2011, we found no consistent relationship between hospital financial performance and publicly reported outcomes for AMI and PNA. However, better hospital financial performance was associated with a modest increase in 30‐day risk‐standardized CHF mortality rates, which was consistent across all 3 measures of hospital financial performance. Reassuringly, there was no difference in the change in net revenue from operations between 2008 and 2012 between hospitals in the highest and lowest tertiles of readmission and mortality rates for AMI, CHF, and PNA. In other words, hospitals with the lowest rates of 30‐day readmissions and mortality for AMI, CHF, and PNA did not experience a loss in net revenue from operations over time, compared to hospitals with the highest readmission and mortality rates.
Our study differs in several important ways from Ly et al., the only other study to our knowledge that investigated the relationship between hospital financial performance and outcomes for patients with AMI, CHF, and PNA.[19] First, outcomes in the Ly et al. study were ascertained in 2007, which preceded public reporting of outcomes. Second, the primary comparison was between hospitals in the bottom versus top decile of operating margin. Although Ly and colleagues also found no association between hospital financial performance and mortality rates for these 3 conditions, they found a significant absolute decrease of approximately 3% in readmission rates among hospitals in the top decile of operating margin versus those in bottom decile. However, readmission rates were comparable among the remaining 80% of hospitals, suggesting that these findings primarily reflected the influence of a few outlier hospitals. Third, the use of nonuniformly audited hospital financial data may have resulted in misclassification of financial performance. Our findings also differ from 2 previous studies that identified a modest association between improved hospital financial performance and decreased adverse patient safety events.[18, 20] However, publicly reported outcomes may not be fully representative of hospital quality and patient safety.[28, 29]
The limited association between hospital financial performance and publicly reported outcomes for AMI and PNA is noteworthy for several reasons. First, publicly reporting outcomes alone without concomitant changes to reimbursement may be inadequate to create strong financial incentives for hospital investment in quality improvement initiatives. Hospitals participating in both public reporting of outcomes and pay‐for‐performance have been shown to achieve greater improvements in outcomes than hospitals engaged only in public reporting.[30] Our time interval for ascertainment of outcomes preceded CMS implementation of the Hospital Readmissions Reduction Program (HRRP) in October 2012, which withholds up to 3% of Medicare hospital reimbursements for higher than expected mortality and readmission rates for AMI, CHF, and PNA. Once outcomes data become available for a 3‐year post‐HRRP implementation period, the impact of this combined approach can be assessed. Second, because adherence to many evidence‐based process measures for these conditions (ie, aspirin use in AMI) is already high, there may be a ceiling effect present that obviates the need for further hospital financial investment to optimize delivery of best practices.[31, 32] Third, hospitals themselves may contribute little to variation in mortality and readmission risk. Of the total variation in mortality and readmission rates among Texas Medicare beneficiaries, only about 1% is attributable to hospitals, whereas 42% to 56% of the variation is explained by differences in patient characteristics.[33, 34] Fourth, there is either low‐quality or insufficient evidence that transitional care interventions specifically targeted to patients with AMI or PNA result in better outcomes.[35] Thus, greater financial investment in hospital‐initiated and postdischarge transitional care interventions for these specific conditions may result in less than the desired effect. Lastly, many hospitalizations for these conditions are emergency hospitalizations that occur after patients present to the emergency department with unexpected and potentially life‐threatening symptoms. Thus, patients may not be able to incorporate the reputation or performance metrics of a hospital in their decisions for where they are hospitalized for AMI, CHF, or PNA despite the public reporting of outcomes.
Given the strong evidence that transitional care interventions reduce readmissions and mortality among patients hospitalized with CHF, we were surprised to find that improved hospital financial performance was associated with an increased risk‐adjusted CHF mortality rate.[36] This association held true for all 3 different measures of hospital financial performance, suggesting that this unexpected finding is unlikely to be the result of statistical chance, though potential reasons for this association remain unclear. One possibility is that the CMS model for CHF mortality may not adequately risk adjust for severity of illness.[37, 38] Thus, robust financial performance may be a marker for hospitals with more advanced heart failure services that care for more patients with severe illness.
Our findings should be interpreted in the context of certain limitations. Our study only included an analysis of outcomes for AMI, CHF, and PNA among older fee‐for‐service Medicare beneficiaries aggregated at the hospital level in California between 2008 and 2012, so generalizability to other populations, conditions, states, and time periods is uncertain. The observational design precludes a robust causal inference between financial performance and outcomes. For readmissions, rates were publicly reported for only the last 2 years of the 3‐year reporting period; thus, our findings may underestimate the association between hospital financial performance and publicly reported readmission rates.
CONCLUSION
There is no consistent relationship between hospital financial performance and subsequent publicly reported outcomes for AMI and PNA. However, for unclear reasons, hospitals with better financial performance had modestly higher CHF mortality rates. Given this limited association, public reporting of outcomes may have had less than the intended impact in motivating hospitals to invest in quality improvement. Additional financial incentives in addition to public reporting, such as readmissions penalties, may help motivate hospitals with robust financial performance to further improve outcomes. This would be a key area for future investigation once outcomes data are available for the 3‐year period following CMS implementation of readmissions penalties in 2012. Reassuringly, there was no association between low 30‐day mortality and readmissions rates and subsequent poor financial performance, suggesting that improved outcomes do not necessarily lead to loss of revenue.
Disclosures
Drs. Nguyen, Halm, and Makam were supported in part by the Agency for Healthcare Research and Quality University of Texas Southwestern Center for Patient‐Centered Outcomes Research (1R24HS022418‐01). Drs. Nguyen and Makam received funding from the University of Texas Southwestern KL2 Scholars Program (NIH/NCATS KL2 TR001103). The study sponsors had no role in design and conduct of the study; collection, management, analysis, and interpretation of the data; and preparation, review, or approval of the manuscript. The authors have no conflicts of interest to disclose.
- Centers for Medicare and Medicaid Services. Office of the Actuary. National Health Statistics Group. National Healthcare Expenditures Data. Baltimore, MD; 2013. https://www.cms.gov/Research-Statistics-Data-and-Systems/Statistics-Trends-and-Reports/NationalHealthExpendData/NationalHealthAccountsHistorical.html. Accessed February 16, 2016.
- . Bitter pill: why medical bills are killing us. Time Magazine. February 20, 2013:16–55.
- . Fee‐for‐service will remain a feature of major payment reforms, requiring more changes in Medicare physician payment. Health Aff (Millwood). 2012;31(9):1977–1983.
- , , , et al. The business case for quality: case studies and an analysis. Health Aff (Millwood). 2003;22(2):17–30.
- , , , . Public reporting on quality in the United States and the United Kingdom. Health Aff (Millwood). 2003;22(3):134–148.
- , , , , . The business case for health‐care quality improvement. J Patient Saf. 2013;9(1):44–52.
- , , . Hospital performance reports: impact on quality, market share, and reputation. Health Aff (Millwood). 2005;24(4):1150–1160.
- , , , . The savings illusion—why clinical quality improvement fails to deliver bottom‐line results. N Engl J Med. 2011;365(26):e48.
- , , , , . Hospital Quality: Ingredients for Success—Overview and Lessons Learned. New York, NY: Commonwealth Fund; 2004.
- , , . Hospital Quality Improvement: Strategies and Lessons from U.S. Hospitals. New York, NY: Commonwealth Fund; 2007.
- , , , et al. Hospital financial condition and operational decisions related to the quality of hospital care. Med Care Res Rev. 2007;64(2):148–168.
- , , , , , . Will pay‐for‐performance and quality reporting affect health care disparities? Health Aff (Millwood). 2007;26(3):w405–w414.
- , , . Comparison of change in quality of care between safety‐net and non‐safety‐net hospitals. JAMA. 2008;299(18):2180–2187.
- , . Could Medicare readmission policy exacerbate health care system inequity? Ann Intern Med. 2010;152(2):114–117.
- , . Minding the gap between efforts to reduce readmissions and disparities. JAMA. 2011;305(7):715–716.
- , . Medicare Health Support Pilot Program. N Engl J Med. 2012;366(7):666; author reply 667–668.
- , . Revisiting hospital readmissions. JAMA. 2013;309(4):398–400.
- , . Hospital finances and patient safety outcomes. Inquiry. 2005;42(1):60–72.
- , , . The association between hospital margins, quality of care, and closure or other change in operating status. J Gen Intern Med. 2011;26(11):1291–1296.
- , , , . Hospital financial condition and the quality of patient care. Health Econ. 2008;17(8):977–995.
- State of California Office of Statewide Health Planning and Development. Healthcare Information Division. Annual financial data. Available at: http://www.oshpd.ca.gov/HID/Products/Hospitals/AnnFinanData/PivotProfles/default.asp. Accessed June 23, 2015.
- Centers for Medicare 4(1):11–13.
- , , , et al. Quality of care for acute myocardial infarction at urban safety‐net hospitals. Health Aff (Millwood). 2007;26(1):238–248.
- , , , et al. The Hospital Compare mortality model and the volume‐outcome relationship. Health Serv Res. 2010;45(5 Pt 1):1148–1167.
- . Exploratory Data Analysis. Boston, MA: Addison‐Wesley; 1977.
- , , , et al. Limits of readmission rates in measuring hospital quality suggest the need for added metrics. Health Aff (Millwood). 2013;32(6):1083–1091.
- , , , et al. Hospital performance measures and 30‐day readmission rates. J Gen Intern Med. 2013;28(3):377–385.
- , , , et al. Public reporting and pay for performance in hospital quality improvement. N Engl J Med. 2007;356(5):486–496.
- , , , et al. Usual source of care and outcomes following acute myocardial infarction. J Gen Intern Med. 2014;29(6):862–869.
- , . Public reporting on hospital process improvements is linked to better patient outcomes. Health Aff (Millwood). 2010;29(7):1319–1324.
- , , , . Variation in length of stay and outcomes among hospitalized patients attributable to hospitals and hospitalists. J Gen Intern Med. 2013;28(3):370–376.
- , , , , . Variation in the risk of readmission among hospitals: the relative contribution of patient, hospital and inpatient provider characteristics. J Gen Intern Med. 2014;29(4):572–578.
- , , , et al. Transitional care after hospitalization for acute stroke or myocardial infarction: a systematic review. Ann Intern Med. 2012;157(6):407–416.
- , , , . The inverse relationship between mortality rates and performance in the Hospital Quality Alliance measures. Health Aff (Millwood). 2007;26(4):1104–1110.
- , , , et al. An automated model to identify heart failure patients at risk for 30‐day readmission or death using electronic medical record data. Med Care. 2010;48(11):981–988.
- , , . Indications of biased risk adjustment in the hospital readmission reduction program. J Ambul Care Manage. 2015;38(1):39–47.
Hospital care accounts for the single largest category of national healthcare expenditures, totaling $936.9 billion in 2013.[1] With ongoing scrutiny of US healthcare spending, hospitals are under increasing pressure to justify high costs and robust profits.[2] However, the dominant fee‐for‐service reimbursement model creates incentives for hospitals to prioritize high volume over high‐quality care to maximize profits.[3] Because hospitals may be reluctant to implement improvements if better quality is not accompanied by better payment or improved financial margins, an approach to stimulate quality improvement among hospitals has been to leverage consumer pressure through required public reporting of selected outcome metrics.[4, 5] Public reporting of outcomes is thought to influence hospital reputation; in turn, reputation affects patient perceptions and influences demand for hospital services, potentially enabling reputable hospitals to command higher prices for services to enhance hospital revenue.[6, 7]
Though improving outcomes is thought to reduce overall healthcare costs, it is unclear whether improving outcomes results in a hospital's financial return on investment.[4, 5, 8] Quality improvement can require substantial upfront investment, requiring that hospitals already have robust financial health to engage in such initiatives.[9, 10] Consequently, instead of stimulating broad efforts in quality improvement, public reporting may exacerbate existing disparities in hospital quality and finances, by rewarding already financially healthy hospitals, and by inadvertently penalizing hospitals without the means to invest in quality improvement.[11, 12, 13, 14, 15] Alternately, because fee‐for‐service remains the dominant reimbursement model for hospitals, loss of revenue through reducing readmissions may outweigh any financial gains from improved public reputation and result in worse overall financial performance, though robust evidence for this concern is lacking.[16, 17]
A small number of existing studies suggest a limited correlation between improved hospital financial performance and improved quality, patient safety, and lower readmission rates.[18, 19, 20] However, these studies had several limitations. They were conducted prior to public reporting of selected outcome metrics by the Centers for Medicare and Medicaid Services (CMS)[18, 19, 20]; used data from the Medicare Cost Report, which is not uniformly audited and thus prone to measurement error[19, 20]; used only relative measures of hospital financial performance (eg, operating margin), which do not capture the absolute amount of revenue potentially available for investment in quality improvement[18, 19]; or compared only hospitals at the extremes of financial performance, potentially exaggerating the magnitude of the relationship between hospital financial performance and quality outcomes.[19]
To address this gap in the literature, we sought to assess whether hospitals with robust financial performance have lower 30‐day risk‐standardized mortality and hospital readmission rates for acute myocardial infarction (AMI), congestive heart failure (CHF), and pneumonia (PNA). Given the concern that hospitals with the lowest mortality and readmission rates may experience a decrease in financial performance due to the lower volume of hospitalizations, we also assessed whether hospitals with the lowest readmission and mortality rates had a differential change in financial performance over time compared to hospitals with the highest rates.
METHODS
Data Sources and Study Population
This was an observational study using audited financial data from the 2008 and 2012 Hospital Annual Financial Data Files from the Office of Statewide Health Planning and Development (OSHPD) in the state of California, merged with data on outcome measures publicly reported by CMS via the Hospital Compare website for July 1, 2008 to June 30, 2011.[21, 22] We included all general acute care hospitals with available OSHPD data in 2008 and at least 1 publicly reported outcome from 2008 to 2011. We excluded hospitals without 1 year of audited financial data for 2008 and hospitals that closed during 2008 to 2011.
Measures of Financial Performance
Because we hypothesized that the absolute amount of revenue generated from clinical operations would influence investment in quality improvement programs more so than relative changes in revenue,[20] we used net revenue from operations (total operating revenue minus total operating expense) as our primary measure of hospital financial performance. We also performed 2 companion analyses using 2 commonly reported relative measures of financial performanceoperating margin (net revenue from operations divided by total operating revenue) and total margin (net total revenue divided by total revenue from all sources). Net revenue from operations for 2008 was adjusted to 2012 US dollars using the chained Consumer Price Index for all urban consumers.
Outcomes
For our primary analysis, the primary outcomes were publicly reported all‐cause 30‐day risk‐standardized mortality rates (RSMR) and readmission rates (RSRR) for AMI, CHF, and PNA aggregated over a 3‐year period. These measures were adjusted for key demographic and clinical characteristics available in Medicare data. CMS began publicly reporting 30‐day RSMR for AMI and CHF in June 2007, RSMR for PNA in June 2008, and RSRR for all 3 conditions in July 2009.[23, 24]
To assess whether public reporting had an effect on subsequent hospital financial performance, we conducted a companion analysis where the primary outcome of interest was change in hospital financial performance over time, using the same definitions of financial performance outlined above. For this companion analysis, publicly reported 30‐day RSMR and RSRR for AMI, CHF, and PNA were assessed as predictors of subsequent financial performance.
Hospital Characteristics
Hospital characteristics were ascertained from the OSHPD data. Safety‐net status was defined as hospitals with an annual Medicaid caseload (number of Medicaid discharges divided by the total number of discharges) 1 standard deviation above the mean Medicaid caseload, as defined in previous studies.[25]
Statistical Analyses
Effect of Baseline Financial Performance on Subsequent Publicly Reported Outcomes
To estimate the relationship between baseline hospital financial performance in 2008 and subsequent RSMR and RSRR for AMI, CHF, and PNA from 2008 to 2011, we used linear regression adjusted for the following hospital characteristics: teaching status, rural location, bed size, safety‐net status, ownership, Medicare caseload, and volume of cases reported for the respective outcome. We accounted for clustering of hospitals by ownership. We adjusted for hospital volume of reported cases for each condition given that the risk‐standardization models used by CMS shrink outcomes for small hospitals to the mean, and therefore do not account for a potential volume‐outcome relationship.[26] We conducted a sensitivity analysis excluding hospitals at the extremes of financial performance, defined as hospitals with extreme outlier values for each financial performance measure (eg, values more than 3 times the interquartile range above the first quartile or below the third quartile).[27] Nonlinearity of financial performance measures was assessed using restricted cubic splines. For ease of interpretation, we scaled the estimated change in RSMR and RSRR per $50 million increase in net revenue from operations, and graphed nonparametric relationships using restricted cubic splines.
Effect of Public Reporting on Subsequent Hospital Financial Performance
To assess whether public reporting had an effect on subsequent hospital financial performance, we conducted a companion hospital‐level difference‐in‐differences analysis to assess for differential changes in hospital financial performance between 2008 and 2012, stratified by tertiles of RSMR and RSRR rates from 2008 to 2011. This approach compares differences in an outcome of interest (hospital financial performance) within each group (where each group is a tertile of publicly reported rates of RSMR or RSRR), and then compares the difference in these differences between groups. Therefore, these analyses use each group as their own historical control and the opposite group as a concurrent control to account for potential secular trends. To conduct our difference‐in‐differences analysis, we compared the change in financial performance over time in the top tertile of hospitals to the change in financial performance over time in the bottom tertile of hospitals with respect to AMI, CHF, and PNA RSMR and RSRR. Our models therefore included year (2008 vs 2012), tertile of publicly reported rates for RSMR or RSRR, and the interaction between them as predictors, where the interaction was the difference‐in‐differences term and the primary predictor of interest. In addition to adjusting for hospital characteristics and accounting for clustering as mentioned above, we also included 3 separate interaction terms for year with bed size, safety‐net status, and Medicare caseload, to account for potential changes in the hospitals over time that may have independently influenced financial performance and publicly reported 30‐day measures. For sensitivity analyses, we repeated our difference‐in‐differences analyses excluding hospitals with a change in ownership and extreme outliers with respect to financial performance in 2008. We performed model diagnostics including assessment of functional form, linearity, normality, constant variance, and model misspecification. All analyses were conducted using Stata version 12.1 (StataCorp, College Station, TX). This study was deemed exempt from review by the UT Southwestern Medical Center institutional review board.
RESULTS
Among the 279 included hospitals (see Supporting Figure 1 in the online version of this article), 278 also had financial data available for 2012. In 2008, the median net revenue from operations was $1.6 million (interquartile range [IQR], $2.4 to $10.3 million), the median operating margin was 1.5% (IQR, 4.6% to 6%), and the median total margin was 2.5% (IQR, 2.2% to 7.5% (Table 1). The number of hospitals reporting each outcome, and median outcome rates, are shown in Table 2.
| 2008, n = 279 | 2012, n = 278 | |
|---|---|---|
| ||
| Hospital characteristics | ||
| Teaching, n (%) | 28 (10.0) | 28 (10.0) |
| Rural, n (%) | 55 (19.7) | 55 (19.7) |
| Bed size, n (%) | ||
| 099 (small) | 57 (20.4) | 55 (19.8) |
| 100299 (medium) | 130 (46.6) | 132 (47.5) |
| 300 (large) | 92 (33.0) | 91 (32.7) |
| Safety‐net hospital, n (%)* | 46 (16.5) | 48 (17.3) |
| Hospital ownership, n (%) | ||
| City or county | 15 (5.4) | 16 (5.8) |
| District | 42 (15.1) | 39 (14.0) |
| Investor | 66 (23.7) | 66 (23.7) |
| Private nonprofit | 156 (55.9) | 157 (56.5) |
| Medicare caseload, mean % (SD) | 41.6 (14.7) | 43.6 (14.7) |
| Financial performance measures | ||
| Net revenue from operations, median $ in millions (IQR; range) | 1.6 (2.4 to 10.3; 495.9 to 144.1) | 3.2 (2.9 to 15.4; 396.2 to 276.8) |
| Operating margin, median % (IQR; range) | 1.5 (4.6 to 6.8; 77.8 to 26.4) | 2.3 (3.9 to 8.2; 134.8 to 21.1) |
| Total margin, median % (IQR; range) | 2.5 (2.2 to 7.5; 101.0 to 26.3) | 4.5 (0.7 to 9.8; 132.2 to 31.1) |
| No. | Median % (IQR) | Adjusted % Change (95% CI) per $50 Million Increase in Net Revenue From Operations | ||
|---|---|---|---|---|
| Overall | Extreme Outliers Excluded | |||
| ||||
| Myocardial infarction | ||||
| Mortality rate | 211 | 15.2 (14.216.2) | 0.07 (0.10 to 0.24) | 0.63 (0.21 to 1.48) |
| Readmission rate | 184 | 19.4 (18.520.2) | Nonlinear | 0.34 (1.17 to 0.50) |
| Congestive heart failure | ||||
| Mortality rate | 259 | 11.1 (10.112.1) | 0.17 (0.01 to 0.35) | Nonlinear∥ |
| Readmission rate | 264 | 24.5 (23.525.6) | 0.07 (0.27 to 0.14) | 0.45 (1.36 to 0.47) |
| Pneumonia | ||||
| Mortality rate | 268 | 11.6 (10.413.2) | 0.17 (0.42 to 0.07) | 0.35 (1.19 to 0.49) |
| Readmission rate | 268 | 18.2 (17.319.1) | 0.04 (0.20 to 0.11) | 0.56 (1.27 to 0.16) |
Relationship Between Financial Performance and Publicly Reported Outcomes
Acute Myocardial Infarction
We did not observe a consistent relationship between hospital financial performance and AMI mortality and readmission rates. In our overall adjusted analyses, net revenue from operations was not associated with mortality, but was significantly associated with a decrease in AMI readmissions among hospitals with net revenue from operations between approximately $5 million to $145 million (nonlinear relationship, F statistic = 4.8, P < 0.001 (Table 2, Figure 1A). However, after excluding 23 extreme outlying hospitals by net revenue from operations (10 underperformers with net revenue <$49.4 million and 13 overperformers with net revenue >$52.1 million), this relationship was no longer observed. Using operating margin instead of net revenue from operations as the measure of hospital financial performance, we observed a 0.2% increase in AMI mortality (95% confidence interval [CI]: 0.06%‐0.35%) (see Supporting Table 1 and Supporting Figure 2 in the online version of this article) for each 10% increase in operating margin, which persisted with the exclusion of 5 outlying hospitals by operating margin (all 5 were underperformers, with operating margins <38.6%). However, using total margin as the measure of financial performance, there was no significant relationship with either mortality or readmissions (see Supporting Table 2 and Supporting Figure 3 in the online version of this article).
Congestive Heart Failure
In our primary analyses, we did not observe a significant relationship between net revenue from operations and CHF mortality and readmission rates. However, after excluding 23 extreme outliers, increasing net revenue from operations was associated with a modest increase in CHF mortality among hospitals, with net revenue between approximately $35 million and $20 million (nonlinear relationship, F statistic = 3.6, P = 0.008 (Table 2, Figure 1B). Using alternate measures of financial performance, we observed a consistent relationship between increasing hospital financial performance and higher 30‐day CHF mortality rate. Using operating margin, we observed a slight increase in the mortality rate for CHF (0.26% increase in CHF RSMR for every 10% increase in operating margin) (95% CI: 0.07%‐0.45%) (see Supporting Table 1 and Supporting Figure 2 in the online version of this article), which persisted after the exclusion of 5 extreme outliers. Using total margin, we observed a significant but modest association between improved hospital financial performance and increased mortality rate for CHF (nonlinear relationship, F statistic = 2.9, P = 0.03) (see Supporting Table 2 and Supporting Figure 3 in the online version of this article), which persisted after the exclusion of 3 extreme outliers (0.32% increase in CHF RSMR for every 10% increase in total margin) (95% CI: 0.03%‐0.62%).
Pneumonia
Hospital financial performance (using net revenue, operating margin, or total margin) was not associated with 30‐day PNA mortality or readmission rates.
Relationship of Readmission and Mortality Rates on Subsequent Hospital Financial Performance
Compared to hospitals in the highest tertile of readmission and mortality rates (ie, those with the worst rates), hospitals in the lowest tertile of readmission and mortality rates (ie, those with the best rates) had a similar magnitude of increase in net revenue from operations from 2008 to 2012 (Table 3). The difference‐in‐differences analyses showed no relationship between readmission or mortality rates for AMI, CHF, and PNA and changes in net revenue from operations from 2008 to 2012 (difference‐in‐differences estimates ranged from $8.61 to $6.77 million, P > 0.3 for all). These results were robust to the exclusion of hospitals with a change in ownership and extreme outliers by net revenue from operations (data not reported).
| Outcome | Tertile With Highest Outcome Rates (Worst Hospitals) | Tertile With Lowest Outcome Rates (Best Hospitals) | Difference in Net From Operations Differences Between Highest and Lowest Outcome Rate Tertiles, $ Million (95% CI) | P | ||
|---|---|---|---|---|---|---|
| Outcome, Median % (IQR) | Gain/Loss in Net Revenue From Operations From 2008 to 2012, $ Million* | Outcome, Median % (IQR) | Gain/Loss in Net Revenue from Operations From 2008 to 2012, $ Million* | |||
| ||||||
| AMI mortality | 16.7 (16.217.4) | +65.62 | 13.8 (13.314.2) | +74.23 | 8.61 (27.95 to 10.73) | 0.38 |
| AMI readmit | 20.7 (20.321.5) | +38.62 | 18.3 (17.718.6) | +31.85 | +6.77 (13.24 to 26.77) | 0.50 |
| CHF mortality | 13.0 (12.313.9) | +45.66 | 9.6 (8.910.1) | +48.60 | 2.94 (11.61 to 5.73) | 0.50 |
| CHF readmit | 26.2 (25.726.9) | +47.08 | 23.0 (22.323.5) | +46.08 | +0.99 (10.51 to 12.50) | 0.87 |
| PNA mortality | 13.9 (13.314.7) | +43.46 | 9.9 (9.310.4) | +38.28 | +5.18 (7.01 to 17.37) | 0.40 |
| PNA readmit | 19.4 (19.120.1) | +47.21 | 17.0 (16.517.3) | +45.45 | +1.76 (8.34 to 11.86) | 0.73 |
DISCUSSION
Using audited financial data from California hospitals in 2008 and 2012, and CMS data on publicly reported outcomes from 2008 to 2011, we found no consistent relationship between hospital financial performance and publicly reported outcomes for AMI and PNA. However, better hospital financial performance was associated with a modest increase in 30‐day risk‐standardized CHF mortality rates, which was consistent across all 3 measures of hospital financial performance. Reassuringly, there was no difference in the change in net revenue from operations between 2008 and 2012 between hospitals in the highest and lowest tertiles of readmission and mortality rates for AMI, CHF, and PNA. In other words, hospitals with the lowest rates of 30‐day readmissions and mortality for AMI, CHF, and PNA did not experience a loss in net revenue from operations over time, compared to hospitals with the highest readmission and mortality rates.
Our study differs in several important ways from Ly et al., the only other study to our knowledge that investigated the relationship between hospital financial performance and outcomes for patients with AMI, CHF, and PNA.[19] First, outcomes in the Ly et al. study were ascertained in 2007, which preceded public reporting of outcomes. Second, the primary comparison was between hospitals in the bottom versus top decile of operating margin. Although Ly and colleagues also found no association between hospital financial performance and mortality rates for these 3 conditions, they found a significant absolute decrease of approximately 3% in readmission rates among hospitals in the top decile of operating margin versus those in bottom decile. However, readmission rates were comparable among the remaining 80% of hospitals, suggesting that these findings primarily reflected the influence of a few outlier hospitals. Third, the use of nonuniformly audited hospital financial data may have resulted in misclassification of financial performance. Our findings also differ from 2 previous studies that identified a modest association between improved hospital financial performance and decreased adverse patient safety events.[18, 20] However, publicly reported outcomes may not be fully representative of hospital quality and patient safety.[28, 29]
The limited association between hospital financial performance and publicly reported outcomes for AMI and PNA is noteworthy for several reasons. First, publicly reporting outcomes alone without concomitant changes to reimbursement may be inadequate to create strong financial incentives for hospital investment in quality improvement initiatives. Hospitals participating in both public reporting of outcomes and pay‐for‐performance have been shown to achieve greater improvements in outcomes than hospitals engaged only in public reporting.[30] Our time interval for ascertainment of outcomes preceded CMS implementation of the Hospital Readmissions Reduction Program (HRRP) in October 2012, which withholds up to 3% of Medicare hospital reimbursements for higher than expected mortality and readmission rates for AMI, CHF, and PNA. Once outcomes data become available for a 3‐year post‐HRRP implementation period, the impact of this combined approach can be assessed. Second, because adherence to many evidence‐based process measures for these conditions (ie, aspirin use in AMI) is already high, there may be a ceiling effect present that obviates the need for further hospital financial investment to optimize delivery of best practices.[31, 32] Third, hospitals themselves may contribute little to variation in mortality and readmission risk. Of the total variation in mortality and readmission rates among Texas Medicare beneficiaries, only about 1% is attributable to hospitals, whereas 42% to 56% of the variation is explained by differences in patient characteristics.[33, 34] Fourth, there is either low‐quality or insufficient evidence that transitional care interventions specifically targeted to patients with AMI or PNA result in better outcomes.[35] Thus, greater financial investment in hospital‐initiated and postdischarge transitional care interventions for these specific conditions may result in less than the desired effect. Lastly, many hospitalizations for these conditions are emergency hospitalizations that occur after patients present to the emergency department with unexpected and potentially life‐threatening symptoms. Thus, patients may not be able to incorporate the reputation or performance metrics of a hospital in their decisions for where they are hospitalized for AMI, CHF, or PNA despite the public reporting of outcomes.
Given the strong evidence that transitional care interventions reduce readmissions and mortality among patients hospitalized with CHF, we were surprised to find that improved hospital financial performance was associated with an increased risk‐adjusted CHF mortality rate.[36] This association held true for all 3 different measures of hospital financial performance, suggesting that this unexpected finding is unlikely to be the result of statistical chance, though potential reasons for this association remain unclear. One possibility is that the CMS model for CHF mortality may not adequately risk adjust for severity of illness.[37, 38] Thus, robust financial performance may be a marker for hospitals with more advanced heart failure services that care for more patients with severe illness.
Our findings should be interpreted in the context of certain limitations. Our study only included an analysis of outcomes for AMI, CHF, and PNA among older fee‐for‐service Medicare beneficiaries aggregated at the hospital level in California between 2008 and 2012, so generalizability to other populations, conditions, states, and time periods is uncertain. The observational design precludes a robust causal inference between financial performance and outcomes. For readmissions, rates were publicly reported for only the last 2 years of the 3‐year reporting period; thus, our findings may underestimate the association between hospital financial performance and publicly reported readmission rates.
CONCLUSION
There is no consistent relationship between hospital financial performance and subsequent publicly reported outcomes for AMI and PNA. However, for unclear reasons, hospitals with better financial performance had modestly higher CHF mortality rates. Given this limited association, public reporting of outcomes may have had less than the intended impact in motivating hospitals to invest in quality improvement. Additional financial incentives in addition to public reporting, such as readmissions penalties, may help motivate hospitals with robust financial performance to further improve outcomes. This would be a key area for future investigation once outcomes data are available for the 3‐year period following CMS implementation of readmissions penalties in 2012. Reassuringly, there was no association between low 30‐day mortality and readmissions rates and subsequent poor financial performance, suggesting that improved outcomes do not necessarily lead to loss of revenue.
Disclosures
Drs. Nguyen, Halm, and Makam were supported in part by the Agency for Healthcare Research and Quality University of Texas Southwestern Center for Patient‐Centered Outcomes Research (1R24HS022418‐01). Drs. Nguyen and Makam received funding from the University of Texas Southwestern KL2 Scholars Program (NIH/NCATS KL2 TR001103). The study sponsors had no role in design and conduct of the study; collection, management, analysis, and interpretation of the data; and preparation, review, or approval of the manuscript. The authors have no conflicts of interest to disclose.
- Centers for Medicare and Medicaid Services. Office of the Actuary. National Health Statistics Group. National Healthcare Expenditures Data. Baltimore, MD; 2013. https://www.cms.gov/Research-Statistics-Data-and-Systems/Statistics-Trends-and-Reports/NationalHealthExpendData/NationalHealthAccountsHistorical.html. Accessed February 16, 2016.
- . Bitter pill: why medical bills are killing us. Time Magazine. February 20, 2013:16–55.
- . Fee‐for‐service will remain a feature of major payment reforms, requiring more changes in Medicare physician payment. Health Aff (Millwood). 2012;31(9):1977–1983.
- , , , et al. The business case for quality: case studies and an analysis. Health Aff (Millwood). 2003;22(2):17–30.
- , , , . Public reporting on quality in the United States and the United Kingdom. Health Aff (Millwood). 2003;22(3):134–148.
- , , , , . The business case for health‐care quality improvement. J Patient Saf. 2013;9(1):44–52.
- , , . Hospital performance reports: impact on quality, market share, and reputation. Health Aff (Millwood). 2005;24(4):1150–1160.
- , , , . The savings illusion—why clinical quality improvement fails to deliver bottom‐line results. N Engl J Med. 2011;365(26):e48.
- , , , , . Hospital Quality: Ingredients for Success—Overview and Lessons Learned. New York, NY: Commonwealth Fund; 2004.
- , , . Hospital Quality Improvement: Strategies and Lessons from U.S. Hospitals. New York, NY: Commonwealth Fund; 2007.
- , , , et al. Hospital financial condition and operational decisions related to the quality of hospital care. Med Care Res Rev. 2007;64(2):148–168.
- , , , , , . Will pay‐for‐performance and quality reporting affect health care disparities? Health Aff (Millwood). 2007;26(3):w405–w414.
- , , . Comparison of change in quality of care between safety‐net and non‐safety‐net hospitals. JAMA. 2008;299(18):2180–2187.
- , . Could Medicare readmission policy exacerbate health care system inequity? Ann Intern Med. 2010;152(2):114–117.
- , . Minding the gap between efforts to reduce readmissions and disparities. JAMA. 2011;305(7):715–716.
- , . Medicare Health Support Pilot Program. N Engl J Med. 2012;366(7):666; author reply 667–668.
- , . Revisiting hospital readmissions. JAMA. 2013;309(4):398–400.
- , . Hospital finances and patient safety outcomes. Inquiry. 2005;42(1):60–72.
- , , . The association between hospital margins, quality of care, and closure or other change in operating status. J Gen Intern Med. 2011;26(11):1291–1296.
- , , , . Hospital financial condition and the quality of patient care. Health Econ. 2008;17(8):977–995.
- State of California Office of Statewide Health Planning and Development. Healthcare Information Division. Annual financial data. Available at: http://www.oshpd.ca.gov/HID/Products/Hospitals/AnnFinanData/PivotProfles/default.asp. Accessed June 23, 2015.
- Centers for Medicare 4(1):11–13.
- , , , et al. Quality of care for acute myocardial infarction at urban safety‐net hospitals. Health Aff (Millwood). 2007;26(1):238–248.
- , , , et al. The Hospital Compare mortality model and the volume‐outcome relationship. Health Serv Res. 2010;45(5 Pt 1):1148–1167.
- . Exploratory Data Analysis. Boston, MA: Addison‐Wesley; 1977.
- , , , et al. Limits of readmission rates in measuring hospital quality suggest the need for added metrics. Health Aff (Millwood). 2013;32(6):1083–1091.
- , , , et al. Hospital performance measures and 30‐day readmission rates. J Gen Intern Med. 2013;28(3):377–385.
- , , , et al. Public reporting and pay for performance in hospital quality improvement. N Engl J Med. 2007;356(5):486–496.
- , , , et al. Usual source of care and outcomes following acute myocardial infarction. J Gen Intern Med. 2014;29(6):862–869.
- , . Public reporting on hospital process improvements is linked to better patient outcomes. Health Aff (Millwood). 2010;29(7):1319–1324.
- , , , . Variation in length of stay and outcomes among hospitalized patients attributable to hospitals and hospitalists. J Gen Intern Med. 2013;28(3):370–376.
- , , , , . Variation in the risk of readmission among hospitals: the relative contribution of patient, hospital and inpatient provider characteristics. J Gen Intern Med. 2014;29(4):572–578.
- , , , et al. Transitional care after hospitalization for acute stroke or myocardial infarction: a systematic review. Ann Intern Med. 2012;157(6):407–416.
- , , , . The inverse relationship between mortality rates and performance in the Hospital Quality Alliance measures. Health Aff (Millwood). 2007;26(4):1104–1110.
- , , , et al. An automated model to identify heart failure patients at risk for 30‐day readmission or death using electronic medical record data. Med Care. 2010;48(11):981–988.
- , , . Indications of biased risk adjustment in the hospital readmission reduction program. J Ambul Care Manage. 2015;38(1):39–47.

Hospital and Primary Care Collaboration
Poorly coordinated care between hospital and outpatient settings contributes to medical errors, poor outcomes, and high costs.[1, 2, 3] Recent policy has sought to motivate better care coordination after hospital discharge. Financial penalties for excessive hospital readmissionsa perceived marker of poorly coordinated carehave motivated hospitals to adopt transitional care programs to improve postdischarge care coordination.[4] However, the success of hospital‐initiated transitional care strategies in reducing hospital readmissions has been limited.[5] This may be due to the fact that many factors driving hospital readmissions, such as chronic medical illness, patient education, and availability of outpatient care, are outside of a hospital's control.[5, 6] Even among the most comprehensive hospital‐based transitional care intervention strategies, there is little evidence of active engagement of primary care providers or collaboration between hospitals and primary care practices in the transitional care planning process.[5] Better engagement of primary care into transitional care strategies may improve postdischarge care coordination.[7, 8]
The potential benefits of collaboration are particularly salient in healthcare safety nets.[9] The US health safety net is a patchwork of providers, funding, and programs unified by a shared missiondelivering care to patients regardless of ability to payrather than a coordinated system with shared governance.[9] Safety‐net hospitals are at risk for higher‐than‐average readmissions penalties.[10, 11] Medicaid expansion under the Affordable Care Act will likely increase demand for services in these settings, which could worsen fragmentation of care as a result of strained capacity.[12] Collaboration between hospitals and primary care clinics in the safety net could help overcome fragmentation, improve efficiencies in care, and reduce costs and readmissions.[12, 13, 14, 15]
Despite the potential benefits, we found no studies on how to enable collaboration between hospitals and primary care. We sought to understand systems‐level factors limiting and facilitating collaboration between hospitals and primary care practices around coordinating inpatient‐to‐outpatient care transitions by conducting a qualitative study, focusing on the perspective of primary care leaders in the safety net.
STUDY DATA AND METHODS
We conducted semistructured telephone interviews with primary care leaders in health safety nets across California from August 2012 through October 2012, prior to the implementation of the federal hospital readmissions penalties program. Primary care leaders were defined as clinicians or nonclinicians holding leadership positions, including chief executive officers, clinic medical directors, and local experts in care coordination or quality improvement. We defined safety‐net clinics as federally qualified health centers (FQHCs) and/or FQHC Look‐Alikes (clinics that meet eligibility requirements and receive the same benefits as FQHCs, except for Public Health Service Section 330 grants), community health centers, and public hospital‐affiliated clinics operating under a traditional fee‐for‐service model and serving a high proportion of Medicaid and uninsured patients.[9, 16] We defined public hospitals as government‐owned hospitals that provide care for individuals with limited access elsewhere.[17]
Sampling and Recruitment
We purposefully sampled participants to maximize diversity in geographic region, metropolitan status,[18] and type of county health delivery system to enable identification of common themes across different settings and contexts. Delivery systems were defined as per the Insure the Uninsured Project, a 501(c)(3) nonprofit organization that conducts research on the uninsured in California.[19] Provider systems are counties with a public hospital; payer systems are counties that contract with private hospitals to deliver uncompensated care in place of a public hospital; and County Medical Services Program is a state program that administers county health care in participating small counties, in lieu of a provider or payer system. We used the county delivery system type as a composite proxy of available county resources and market context given variations in funding, access, and eligibility by system type.
Participants were identified through online public directories, community clinic consortiums, and departments of public health websites. Additional participants were sought using snowball sampling. Potential participants were e‐mailed a recruitment letter describing the study, its purpose, topics to be covered, and confidentiality assurance. Participants who did not respond were called or e‐mailed within 1 week. When initial recruitment was unsuccessful, we attempted to recruit another participant within the same organization when possible. We recruited participants until reaching thematic saturation (i.e., no further new themes emerged from our interviews).[20] No participants were recruited through snowballing.
Data Collection and Interview Guides
We conducted in‐depth, semistructured interviews using interview guides informed by existing literature on collaboration and integration across healthcare systems[21, 22, 23] (see Supporting Information, Appendix 1, in the online version of this article). Interviews were digitally recorded and professionally transcribed verbatim.
We obtained contextual information for settings represented by each respondent, such as number of clinics and annual visits, through the California Primary Care Annual Utilization Data Report and clinic websites.[24]
Analysis
We employed thematic analysis[25] using an inductive framework to identify emergent and recurring themes. We developed and refined a coding template iteratively. Our multidisciplinary team included 2 general internists (O.K.N., L.E.G), 1 hospitalist (S.R.G.), a clinical nurse specialist with a doctorate in nursing (A.L.), and research staff with a public health background (J.K.). Two team members (O.K.N., J.K.) systematically coded all transcripts. Disagreements in coding were resolved through negotiated consensus. All investigators reviewed and discussed identified themes. We emailed summary findings to participants for confirmation to enhance the reliability of our findings.
The institutional review board at the University of California, San Francisco approved the study protocol.
RESULTS
Of 52 individuals contacted from 39 different organizations, 23 did not respond, 4 declined to participate, and 25 were scheduled for an interview. We interviewed 22 primary care leaders across 11 California counties (Table 1) and identified themes around factors influencing collaboration with hospitals (Table 2). Most respondents had prior positive experiences collaborating with hospitals on small, focused projects. However, they asserted the need for better hospitalclinic collaboration, and thought collaboration was critical to achieving high‐quality care transitions. We did not observe any differences in perspectives expressed by clinician versus nonclinician leaders. Nonparticipants were more likely than participants to be from northern rural or central counties, FQHCs, and smaller clinic settings.
| |
| Leadership position | No. (%) |
| Chief executive officer or equivalent* | 9 (41) |
| Chief medical officer or medical director | 7 (32) |
| Other | 6 (27) |
| Clinical experience | |
| Physician (MD or DO) | 15 (68) |
| Registered nurse | 1 (5) |
| Nonclinician | 6 (27) |
| Clinic setting | |
| Clinic type | |
| FQHC and FQHC Look‐Alikes | 15 (68) |
| Hospital based | 2 (9) |
| Other | 5 (23) |
| No. of clinics in system | |
| 14 | 9 (41) |
| 59 | 6 (27) |
| 10 | 7 (32) |
| Annual no. of visits | |
| <100,000 | 9 (41) |
| 100,000499,999 | 11 (50) |
| 500,000 | 2 (9) |
| County characteristics | |
| Health delivery system type | |
| Provider | 13 (59) |
| Payer | 2 (9) |
| County Medical Services Program∥ | 7 (32) |
| Rural county | 7 (32) |
| Theme | Subtheme | Quote |
|---|---|---|
| ||
| Lack of institutional financial incentives for collaboration. | Collaboration may lead to increased responsibility without reimbursement for clinic. | Where the [payment] model breaks down is that the savings is only to the hospital; and there's an expectation on our part to go ahead and take on those additional patients. If that $400,000 savings doesn't at least have a portion to the team that's going to help keep the people out of the hospital, then it won't work. (Participant 17) |
| Collaboration may lead to competition from the hospital for primary care patients. | Our biggest issues with working with the hospital[are] that we have a finite number of [Medicaid] patients [in our catchment area for whom] you get larger reimbursement. For a federally qualified health center, it is [crucial] to ensure we have a revenue stream that helps us take care of the uninsured. So you can see the natural kind of conflict when your pool of patients is very small. (Participant 10) | |
| Collaboration may lead to increased financial risk for the hospital. | 70% to 80% of our adult patients have no insurance and the fact is that none of these hospitals want those patients. They do get disproportionate hospital savings and other thingsbut they don't have a strong business model when they have uninsured patients coming in their doors. That's just the reality. (Participant 21) | |
| Collaboration may lead to decreased financial risk for the hospital. | Most of these patients either have very low reimbursement or no reimbursement, and so [the hospital doesn't] really want these people to end up in very expensive care because it's a burden on their systemphilosophically, everyone agrees that if we keep people well in the outpatient setting, that would be better for everyone. No, there is no financial incentive whatsoever for [the hospital] to not work with us. [emphasis added] (Participant 18) | |
| Competing priorities limit primary care's ability to focus on care transitions. | I wouldn't say [improving care transitions is a high priority]. It's not because we don't want to do the job. We have other priorities. [T]he big issue is access. There's a massive demand for primary care in our communityand we're just trying to make sure we have enough capacity. [There are] requirements HRSA has been asking of health centers and other priorities. We're starting up a residency program. We're recruiting more doctors. We're upping our quality improvement processes internally. We're making a reinvestment in our [electronic medical record]. It never stops. (Participant 22) | |
| The multitude of [care transitions and other quality] improvement imperatives makes it difficult to focus. It's not that any one of these things necessarily represents a flawed approach. It's just that when you have a variety of folks from the national, state, and local levels who all have different ideas about what constitutes appropriate improvement, it's very hard to respond to it all at once. (Participant 6) | ||
| Mismatched expectations about the role and capacity of primary care in care transitions limit collaboration. | Perception of primary care being undervalued by hospitals as a key stakeholder in care transitions. | They just make sure the paperwork is set up.and they have it written down, See doctor in 7 days. And I think they [the hospitals] think that's where their responsibility stops. They don't actually look at our records or talk to us. (Participant 2) |
| Perceived unrealistic expectations of primary care capacity to deliver postdischarge care. | [The hospital will] send anyone that's poor to us whether they are our patient or not. [T]hey say go to [our clinic] and they'll give you your outpatient medications. [But] we're at capacity. [W]e have a 79 month wait for a [new] primary care appointment. So then, we're stuck with the ethical dilemma of [do we send the patient back to the ER/hospital] for their medication or do we just [try to] take them in? (Participant 13) | |
| The hospitals feel every undoctored patient must be ours. [But] it's not like we're sitting on our hands. We have more than enough patients. (Participant 22) | ||
| Informal affiliations and partnerships, formed through personal relationships and interpersonal networking, facilitate collaboration. | Informal affiliations arise from existing personal relationships and/or interpersonal networking. | Our CEO [has been here] for the past 40 years, and has had very deep and ongoing relationships with the [hospital]. Those doors are very wide open. (Participant 18) |
| Informal partnerships are particularly important for FQHCs. | As an FQHC we can't have any ties financially or politically, but there's a traditional connection. (Participant 2) | |
| Increasing demands on clinical productivity lead to a loss of networking opportunities. | We're one of the few clinics that has their own inpatient service. I would say that the transitions between the hospital and [our] clinic start from a much higher level than anybody else. [However] we're about to close our hospital service. It's just too much work for our [clinic] doctors. (Participant 8) | |
| There used to be a meeting once a month where quality improvement programs and issues were discussed. Our administration eliminated these in favor of productivity, to increase our numbers of patients seen. (Participant 12) | ||
| Loss of relationships with hospital personnel amplifies challenges to collaboration. | Because the primary care docs are not visible in the hospital[quality improvement] projects [become] hospital‐based. Usually they forget that we exist. (Participant 11) | |
| External funding and support can enable opportunities for networking and relationship building. | The [national stakeholder organization] has done a lot of work with us to bring us together and figure out what we're doing [across] different counties, settings, providers. (Participant 20) | |
| Electronic health records enable collaboration by improving communication between hospitals and primary care. | Lack of timely communication between inpatient and outpatient settings is a major obstacle to postdischarge care coordination. | It's a lot of effort to get medical records back. It is often not timely. Patients are going to cycle in and out of more costly acute care because we don't know that it's happening. Communication between [outpatient and inpatient] facilities is one of the most challenging issues. (Participant 13) |
| Optimism about potential of EHRs. | A lot of people are depending on [the EHR] to make a lot of communication changes [where there was] a disconnect in the past. (Participant 7) | |
| Lack of EHR interoperability. | We have an EHR that's pieced together. The [emergency department] has their own [system]. The clinics have their own. The inpatient has their own. They're all electronic but they don't all talk to each other that well. (Participant 20) | |
| Our system has reached our maximum capacity and we've had to rely on our community partners to see the overflow. [T]he difficult communication [is] magnified. (Participant 11) | ||
| Privacy and legal concerns (nonuniform application of HIPAA standards). | There is a very different view from hospital to hospital about what it is they feel that they can share legally under HIPAA or not. It's a very strange thing and it almost depends more on the chief information officer at [each] hospital and less on what the [regulations] actually say. (Participant 21) | |
| Yes, [the EHR] does communicate with the hospitals and the hospitals [communicate] back [with us]. [T]here are some technical issues, butthe biggest impediments to making the technology work are new issues around confidentiality and access. (Participant 17) | ||
| Interpersonal contact is still needed even with robust EHRs. | I think [communication between systems is] getting better [due to the EHR], but there's still quite a few holes and a sense of the loop not being completely closed. It's like when you pick up the phoneyou don't want the automated system, you want to actually talk to somebody. (Participant 18) | |
Lack of Institutional Financial Incentives for Collaboration
Primary care leaders felt that current reimbursement strategies rewarded hospitals for reducing readmissions rather than promoting shared savings with primary care. Seeking collaboration with hospitals would potentially increase clinic responsibility for postdischarge patient care without reimbursement for additional work.
In counties without public hospitals, leaders worried that collaboration with hospitals could lead to active loss of Medicaid patients from their practices. Developing closer relationships with local hospitals would enable those hospitals to redirect Medicaid patients to hospital‐owned primary care clinics, leading to a loss of important revenue and financial stability for their clinics.
A subset of these leaders also perceived that nonpublic hospitals were reluctant to collaborate with their clinics. They hypothesized that hospital leaders worried that collaborating with their primary care practices would lead to more uninsured patients at their hospitals, leading to an increase in uncompensated hospital care and reduced reimbursement. However, a second subset of leaders thought that nonpublic hospitals had increased financial incentives to collaborate with safety‐net clinics, because improved coordination with outpatient care could prevent uncompensated hospital care.
Competing Clinic Priorities Limit Primary Care Ability to Focus on Care Transitions
Clinic leaders struggled to balance competing priorities, including strained clinic capacity, regulatory/accreditation requirements, and financial strain. New patient‐centered medical home initiatives, which improve primary care financial incentives for postdischarge care coordination, were perceived as well intentioned but added to an overwhelming burden of ongoing quality improvement efforts.
Mismatched Expectations About the Role and Capacity of Primary Care in Care Transitions Limits Collaboration
Many leaders felt that hospitals undervalued the role of primary care as stakeholders in improving care transitions. They perceived that hospitals made little effort to directly contact primary care physicians about their patients' hospitalizations and discharges. Leaders were frustrated that hospitals had unrealistic expectations of primary care to deliver timely postdischarge care, given their strained capacity. Consequently, some were reluctant to seek opportunities to collaborate with hospitals to improve care transitions.
Informal Affiliations and Partnerships, Formed Through Personal Relationships and Interpersonal Networking, Facilitate Collaboration
Informal affiliations between hospitals and primary care clinics helped improve awareness of organizational roles and capacity and create a sense of shared mission, thus enabling collaboration in spite of other barriers. Such affiliations arose from existing, longstanding personal relationships and/or interpersonal networking between individual providers across settings. These informal affiliations were important for safety‐net clinics that were FQHCs or FQHC Look‐Alikes, because formal hospital affiliations are discouraged by federal regulations.[26]
Opportunities for building relationships and networking with hospital personnel arose when clinic physicians had hospital admitting privileges. This on‐site presence facilitated personal relationships and communication between clinic and hospital physicians, thus enabling better collaboration. However, increasing demands on outpatient clinical productivity often made a hospital presence infeasible. One health system promoted interpersonal networking through regular meetings between the clinic and the local hospital to foster collaboration on quality improvement and care delivery; however, clinical productivity demands ultimately took priority over these meetings. Although delegating inpatient care to hospitalists enabled clinics to maximize their productivity, it also decreased opportunities for networking, and consequently, clinic physicians felt their voices and opinions were not represented in improvement initiatives.
Outside funding and support, such as incentive programs and conferences sponsored by local health plans, clinic consortiums, or national stakeholder organizations, enabled the most successful networking. These successes were independent of whether the clinic staff rounded in the hospital.
Electronic Health Records Enable Collaboration By Improving Communication Between Hospitals And Primary Care
Challenges in communication and information flow were also challenges to collaboration with hospitals. No respondents reported receiving routine notification of patient hospitalizations at the time of admission. Many clinics were dedicating significant attention to implementing electronic health record (EHR) systems to receive financial incentives associated with meaningful use.[27] Implementation of EHRs helped mitigate issues with communication with hospitals, though to a lesser degree than expected. Clinics early in the process of EHR adoption were optimistic about the potential of EHRs to improve communication with hospitals. However, clinic leaders in settings with greater EHR experience were more guarded in their enthusiasm. They observed that lack of interoperability between clinic and hospital EHRs was a persistent and major issue in spite of meaningful use standards, limiting timely flow of information across settings. Even when hospitals and their associated clinics had integrated or interoperable EHRs (n=3), or were working toward EHR integration (n=5), the need to expand networks to include other community healthcare settings using different systems presented ongoing challenges to achieving seamless communication due to a lack of interoperability.
When information sharing was technically feasible, leaders noted that inconsistent understanding and application of privacy rules dictated by the Health Insurance Portability and Accountability Act (HIPAA) limited information sharing. The quality and types of information shared varied widely across settings, depending on how HIPAA regulations were interpreted.
Even with robust EHRs, interpersonal contact was still perceived as crucial to enabling collaboration. EHRs were perceived to help with information flow, but did not facilitate relationship building across settings.
DISCUSSION
We found that safety‐net primary care leaders identified several barriers to collaboration with hospitals: (1) lack of financial incentives for collaboration, (2) competing priorities, (3) mismatched expectations about the role and capacity of primary care, and (4) poor communication infrastructure. Interpersonal networking and use of EHRs helped overcome these obstacles to a limited extent.
Prior studies demonstrate that early follow‐up, timely communication, and continuity with primary care after hospital discharge are associated with improved postdischarge outcomes.[8, 28, 29, 30] Despite evidence that collaboration between primary care and hospitals may help optimize postdischarge outcomes, our study is the first to describe primary care leaders' perspectives on potential targets for improving collaboration between hospitals and primary care to improve care transitions.
Our results highlight the need to modify payment models to align financial incentives across settings for collaboration. Otherwise, it may be difficult for hospitals to engage primary care in collaborative efforts to improve care transitions. Recent pilot payment models aim to motivate improved postdischarge care coordination. The Centers for Medicare and Medicaid Services implemented two new Current Procedural Terminology Transitional Care Management codes to enable reimbursement of outpatient physicians for management of patients transitioning from the hospital to the community. This model does not require communication between accepting (outpatient) and discharging (hospital) physicians or other hospital staff.[31] Another pilot program pays primary care clinics $6 per beneficiary per month if they become level 3 patient‐centered medical homes, which have stringent requirements for communication and coordination with hospitals for postdischarge care.[32] Capitated payment models, such as expansion of Medicaid managed care, and shared‐savings models, such accountable care organizations, aim to promote shared responsibility between hospitals and primary care by creating financial incentives to prevent hospitalizations through effective use of outpatient resources. The effectiveness of these strategies to improve care transitions is not yet established.
Many tout the adoption of EHRs as a means to improve communication and collaboration across settings.[33] However, policies narrowly focused on EHR adoption fail to address broader issues regarding lack of EHR interoperability and inconsistently applied privacy regulations under HIPAA, which were substantial barriers to information sharing. Stage 2 meaningful use criteria will address some interoperability issues by implementing standards for exchange of laboratory data and summary care records for care transitions.[34] Additional regulatory policies should promote uniform application of privacy regulations to enable more fluid sharing of electronic data across various healthcare settings. Locally and regionally negotiated data sharing agreements, as well as arrangements such as regional health information exchanges, could temporize these issues until broader policies are enacted.
EHRs did not obviate the need for meaningful interpersonal communication between providers. Hospital‐based quality improvement teams could create networking opportunities to foster relationship‐building and communication across settings. Leadership should consider scheduling protected time to facilitate attendance. Colocation of outpatient staff, such as nurse coordinators and office managers, in the hospital may also improve relationship building and care coordination.[35] Such measures would bridge the perceived divide between inpatient and outpatient care, and create avenues to find mutually beneficial solutions to improving postdischarge care transitions.[36]
Our results should be interpreted in light of several limitations. This study focused on primary care practices in the California safety net; given variations in safety nets across different contexts, the transferability of our findings may be limited. Second, rural perspectives were relatively under‐represented in our study sample; there may be additional unidentified issues specific to rural areas or specific to other nonparticipants that may have not been captured in this study. For this hypothesis‐generating study, we focused on the perspectives of primary care leaders. Triangulating perspectives of other stakeholders, including hospital leadership, mental health, social services, and payer organizations, will offer a more comprehensive analysis of barriers and enablers to hospitalprimary care collaboration. We were unable to collect data on the payer mix of each facility, which may influence the perceived financial barriers to collaboration among facilities. However, we anticipate that the broader theme of lack of financial incentives for collaboration will resonate across many settings, as collaboration between inpatient and outpatient providers in general has been largely unfunded by payers.[37, 38, 39] Further, most primary care providers (PCPs) in and outside of safety‐net settings operate on slim margins that cannot support additional time by PCPs or staff to coordinate care transitions.[39, 40] Because our study was completed prior to the implementation of several new payment models motivating postdischarge care coordination, we were unable to assess their effect on clinics' collaboration with hospitals.
In conclusion, efforts to improve collaboration between clinical settings around postdischarge care transitions will require targeted policy and quality improvement efforts in 3 specific areas. Policy makers and administrators with the power to negotiate payment schemes and regulatory policies should first align financial incentives across settings to support postdischarge transitions and care coordination, and second, improve EHR interoperability and uniform application of HIPAA regulations. Third, clinic and hospital leaders, and front‐line providers should enhance opportunities for interpersonal networking between providers in hospital and primary care settings. With the expansion of insurance coverage and increased demand for primary care in the safety net and other settings, policies to promote care coordination should consider the perspective of both hospital and clinic incentives and mechanisms for coordinating care across settings.
Disclosures
Preliminary results from this study were presented at the Society of General Internal Medicine 36th Annual Meeting in Denver, Colorado, April 2013. Dr. Nguyen's work on this project was funded by a federal training grant from the National Research Service Award (NRSA T32HP19025‐07‐00). Dr. Goldman is the recipient of grants from the Agency for Health Care Research and Quality (K08 HS018090‐01). Drs. Goldman, Greysen, and Lyndon are supported by the National Institutes of Health, National Center for Research Resources, Office of the Director (UCSF‐CTSI grant no. KL2 RR024130). The authors report no conflicts of interest.
- Crossing the Quality Chasm: A New Health System for the 21st Century. Washington, DC: The National Academies Press; 2001.
- , , , , , . Deficits in communication and information transfer between hospital‐based and primary care physicians: implications for patient safety and continuity of care. JAMA. 2007;297(8):831–841.
- , , , . Medical errors related to discontinuity of care from an inpatient to an outpatient setting. J Gen Intern Med. 2003;18(8):646–651.
- Medicare Payment Advisory Commission. Report to the Congress: Promoting Greater Efficiency in Medicare. Washington, DC: Medicare Payment Advisory Commission; 2007.
- , , , , , . Hospital‐initiated transitional care interventions as a patient safety strategy: a systematic review. Ann Intern Med. 2013;158(5 pt 2):433–440.
- , , . Thirty‐day readmission rates for Medicare beneficiaries by race and site of care. JAMA. 2011;305(7):675–681.
- , . Improving care transitions: hospitalists partnering with primary care. J Hosp Med. 2010;5(7):375–377.
- , , , , . Primary care physician communication at hospital discharge reduces medication discrepancies. J Hosp Med. 2013;8(12):672–677.
- Institute of Medicine. America's Health Care Safety Net: Intact but Endangered. Washington, DC: Institute of Medicine; 2000.
- , . Higher readmissions at safety‐net hospitals and potential policy solutions. Issue Brief (Commonw Fund). 2012;34:1–16.
- , . Characteristics of hospitals receiving penalties under the hospital readmissions reduction program. JAMA. 2013;309(4):342–343.
- , , , et al. Ensuring Equity: A Post‐Reform Framework to Achieve High Performance Health Care for Vulnerable Populations. New York, NY: The Commonwealth Fund; 2011.
- , , , , . Enhancing the Capacity of Community Centers to Achieve High Performance: Findings from the 2009 Commonwealth Fund National Survey of Federally Qualified Health Centers. New York, NY: The Commonwealth Fund; 2010.
- , , . Integration mechanisms and hospital efficiency in integrated health care delivery systems. J Med Syst. 2002;26(2):127–143.
- , , . Effect of physician collaboration network on hospitalization cost and readmission rate. Eur J Public Health. 2012;22(5):629–633.
- Health Resources and Services Administration. Health Center Look‐Alikes Program. Available at: http://bphc.hrsa.gov/about/lookalike/index.html?IsPopUp=true. Accessed on September 5, 2014.
- , , , . Public hospitals in the United States, 2008. Healthcare Cost and Utilization Project. Agency for Healthcare Research and Quality, Rockville, MD. Available at: http://www.hcup‐us.ahrq.gov/reports/statbriefs/sb95.jsp. Published September 2010. Accessed on September 5, 2014.
- U.S. Department of Health and Human Services. Health Resources and Services Administration. Available at: http://www.hrsa.gov/shortage/. Accessed on September 5, 2014.
- , . California's Safety Net and The Need to Improve Local Collaboration in Care for the Uninsured: Counties, Clinics, Hospitals, and Local Health Plans. Available at: http://www.itup.org/Reports/Statewide/Safetynet_Report_Final.pdf. Published October 2008. Accessed on September 5, 2014.
- , . Unsatisfactory saturation: a critical exploration of the notion of saturated sample sizes in qualitative research. Qual Res. 2013;13(2):190–197.
- . Leading successful interinstitutional collaborations using the collaboration success measurement model. Paper presented at: The Chair Academy's 16th Annual International Conference: Navigating the Future through Authentic Leadership; 2007; Jacksonville, FL. Available at http://www.chairacademy.com/conference/2007/papers/leading_successful_interinstitutional_collaborations.pdf. Accessed on September 5, 2014.
- , , , , . The difference between integration and collaboration in patient care: results from key informant interviews working in multiprofessional health care teams. J Manipulative Physiol Ther. 2009;32(9):715–722.
- , , , , , . Implementing organized delivery systems: an integration scorecard. Health Care Manag Rev. 1994;19(3):7–20.
- State of California Office of Statewide Health Planning 3(2):77–101.
- Health Resources and Services Administration Primary Care: The Health Center Program. Affiliation agreements of community 303(17):1716–1722.
- , , , , . Reducing hospital readmissions through primary care practice transformation. Journal Fam Pract. 2014;63(2):67–73.
- , , . Post‐hospitalization transitions: Examining the effects of timing of primary care provider follow‐up. J Hosp Med. 2010;5(7):392–397.
- U.S. Department of Health and Human Services. Centers for Medicare 2009.
- , , , . Hospitalists and care transitions: the divorce of inpatient and outpatient care. Health Aff (Millwood). 2008;27(5):1315–1327.
- , , . Reducing hospital readmissions: lessons from top‐performing hospitals. Available at: http://www.commonwealthfund.org/publications/case‐studies/2011/apr/reducing‐hospital‐readmissions. Published April 2011. Accessed on September 5, 2014.
- , , . Recasting readmissions by placing the hospital role in community context. JAMA. 2013;309(4):351–352.
- . A primary care physician's ideal transitions of care—where's the evidence? J Hosp Med. 2013;8(8):472–477.
- , . Primary care: current problems and proposed solutions. Health Aff (Millwood). 2010;29(5):799–805.
Poorly coordinated care between hospital and outpatient settings contributes to medical errors, poor outcomes, and high costs.[1, 2, 3] Recent policy has sought to motivate better care coordination after hospital discharge. Financial penalties for excessive hospital readmissionsa perceived marker of poorly coordinated carehave motivated hospitals to adopt transitional care programs to improve postdischarge care coordination.[4] However, the success of hospital‐initiated transitional care strategies in reducing hospital readmissions has been limited.[5] This may be due to the fact that many factors driving hospital readmissions, such as chronic medical illness, patient education, and availability of outpatient care, are outside of a hospital's control.[5, 6] Even among the most comprehensive hospital‐based transitional care intervention strategies, there is little evidence of active engagement of primary care providers or collaboration between hospitals and primary care practices in the transitional care planning process.[5] Better engagement of primary care into transitional care strategies may improve postdischarge care coordination.[7, 8]
The potential benefits of collaboration are particularly salient in healthcare safety nets.[9] The US health safety net is a patchwork of providers, funding, and programs unified by a shared missiondelivering care to patients regardless of ability to payrather than a coordinated system with shared governance.[9] Safety‐net hospitals are at risk for higher‐than‐average readmissions penalties.[10, 11] Medicaid expansion under the Affordable Care Act will likely increase demand for services in these settings, which could worsen fragmentation of care as a result of strained capacity.[12] Collaboration between hospitals and primary care clinics in the safety net could help overcome fragmentation, improve efficiencies in care, and reduce costs and readmissions.[12, 13, 14, 15]
Despite the potential benefits, we found no studies on how to enable collaboration between hospitals and primary care. We sought to understand systems‐level factors limiting and facilitating collaboration between hospitals and primary care practices around coordinating inpatient‐to‐outpatient care transitions by conducting a qualitative study, focusing on the perspective of primary care leaders in the safety net.
STUDY DATA AND METHODS
We conducted semistructured telephone interviews with primary care leaders in health safety nets across California from August 2012 through October 2012, prior to the implementation of the federal hospital readmissions penalties program. Primary care leaders were defined as clinicians or nonclinicians holding leadership positions, including chief executive officers, clinic medical directors, and local experts in care coordination or quality improvement. We defined safety‐net clinics as federally qualified health centers (FQHCs) and/or FQHC Look‐Alikes (clinics that meet eligibility requirements and receive the same benefits as FQHCs, except for Public Health Service Section 330 grants), community health centers, and public hospital‐affiliated clinics operating under a traditional fee‐for‐service model and serving a high proportion of Medicaid and uninsured patients.[9, 16] We defined public hospitals as government‐owned hospitals that provide care for individuals with limited access elsewhere.[17]
Sampling and Recruitment
We purposefully sampled participants to maximize diversity in geographic region, metropolitan status,[18] and type of county health delivery system to enable identification of common themes across different settings and contexts. Delivery systems were defined as per the Insure the Uninsured Project, a 501(c)(3) nonprofit organization that conducts research on the uninsured in California.[19] Provider systems are counties with a public hospital; payer systems are counties that contract with private hospitals to deliver uncompensated care in place of a public hospital; and County Medical Services Program is a state program that administers county health care in participating small counties, in lieu of a provider or payer system. We used the county delivery system type as a composite proxy of available county resources and market context given variations in funding, access, and eligibility by system type.
Participants were identified through online public directories, community clinic consortiums, and departments of public health websites. Additional participants were sought using snowball sampling. Potential participants were e‐mailed a recruitment letter describing the study, its purpose, topics to be covered, and confidentiality assurance. Participants who did not respond were called or e‐mailed within 1 week. When initial recruitment was unsuccessful, we attempted to recruit another participant within the same organization when possible. We recruited participants until reaching thematic saturation (i.e., no further new themes emerged from our interviews).[20] No participants were recruited through snowballing.
Data Collection and Interview Guides
We conducted in‐depth, semistructured interviews using interview guides informed by existing literature on collaboration and integration across healthcare systems[21, 22, 23] (see Supporting Information, Appendix 1, in the online version of this article). Interviews were digitally recorded and professionally transcribed verbatim.
We obtained contextual information for settings represented by each respondent, such as number of clinics and annual visits, through the California Primary Care Annual Utilization Data Report and clinic websites.[24]
Analysis
We employed thematic analysis[25] using an inductive framework to identify emergent and recurring themes. We developed and refined a coding template iteratively. Our multidisciplinary team included 2 general internists (O.K.N., L.E.G), 1 hospitalist (S.R.G.), a clinical nurse specialist with a doctorate in nursing (A.L.), and research staff with a public health background (J.K.). Two team members (O.K.N., J.K.) systematically coded all transcripts. Disagreements in coding were resolved through negotiated consensus. All investigators reviewed and discussed identified themes. We emailed summary findings to participants for confirmation to enhance the reliability of our findings.
The institutional review board at the University of California, San Francisco approved the study protocol.
RESULTS
Of 52 individuals contacted from 39 different organizations, 23 did not respond, 4 declined to participate, and 25 were scheduled for an interview. We interviewed 22 primary care leaders across 11 California counties (Table 1) and identified themes around factors influencing collaboration with hospitals (Table 2). Most respondents had prior positive experiences collaborating with hospitals on small, focused projects. However, they asserted the need for better hospitalclinic collaboration, and thought collaboration was critical to achieving high‐quality care transitions. We did not observe any differences in perspectives expressed by clinician versus nonclinician leaders. Nonparticipants were more likely than participants to be from northern rural or central counties, FQHCs, and smaller clinic settings.
| |
| Leadership position | No. (%) |
| Chief executive officer or equivalent* | 9 (41) |
| Chief medical officer or medical director | 7 (32) |
| Other | 6 (27) |
| Clinical experience | |
| Physician (MD or DO) | 15 (68) |
| Registered nurse | 1 (5) |
| Nonclinician | 6 (27) |
| Clinic setting | |
| Clinic type | |
| FQHC and FQHC Look‐Alikes | 15 (68) |
| Hospital based | 2 (9) |
| Other | 5 (23) |
| No. of clinics in system | |
| 14 | 9 (41) |
| 59 | 6 (27) |
| 10 | 7 (32) |
| Annual no. of visits | |
| <100,000 | 9 (41) |
| 100,000499,999 | 11 (50) |
| 500,000 | 2 (9) |
| County characteristics | |
| Health delivery system type | |
| Provider | 13 (59) |
| Payer | 2 (9) |
| County Medical Services Program∥ | 7 (32) |
| Rural county | 7 (32) |
| Theme | Subtheme | Quote |
|---|---|---|
| ||
| Lack of institutional financial incentives for collaboration. | Collaboration may lead to increased responsibility without reimbursement for clinic. | Where the [payment] model breaks down is that the savings is only to the hospital; and there's an expectation on our part to go ahead and take on those additional patients. If that $400,000 savings doesn't at least have a portion to the team that's going to help keep the people out of the hospital, then it won't work. (Participant 17) |
| Collaboration may lead to competition from the hospital for primary care patients. | Our biggest issues with working with the hospital[are] that we have a finite number of [Medicaid] patients [in our catchment area for whom] you get larger reimbursement. For a federally qualified health center, it is [crucial] to ensure we have a revenue stream that helps us take care of the uninsured. So you can see the natural kind of conflict when your pool of patients is very small. (Participant 10) | |
| Collaboration may lead to increased financial risk for the hospital. | 70% to 80% of our adult patients have no insurance and the fact is that none of these hospitals want those patients. They do get disproportionate hospital savings and other thingsbut they don't have a strong business model when they have uninsured patients coming in their doors. That's just the reality. (Participant 21) | |
| Collaboration may lead to decreased financial risk for the hospital. | Most of these patients either have very low reimbursement or no reimbursement, and so [the hospital doesn't] really want these people to end up in very expensive care because it's a burden on their systemphilosophically, everyone agrees that if we keep people well in the outpatient setting, that would be better for everyone. No, there is no financial incentive whatsoever for [the hospital] to not work with us. [emphasis added] (Participant 18) | |
| Competing priorities limit primary care's ability to focus on care transitions. | I wouldn't say [improving care transitions is a high priority]. It's not because we don't want to do the job. We have other priorities. [T]he big issue is access. There's a massive demand for primary care in our communityand we're just trying to make sure we have enough capacity. [There are] requirements HRSA has been asking of health centers and other priorities. We're starting up a residency program. We're recruiting more doctors. We're upping our quality improvement processes internally. We're making a reinvestment in our [electronic medical record]. It never stops. (Participant 22) | |
| The multitude of [care transitions and other quality] improvement imperatives makes it difficult to focus. It's not that any one of these things necessarily represents a flawed approach. It's just that when you have a variety of folks from the national, state, and local levels who all have different ideas about what constitutes appropriate improvement, it's very hard to respond to it all at once. (Participant 6) | ||
| Mismatched expectations about the role and capacity of primary care in care transitions limit collaboration. | Perception of primary care being undervalued by hospitals as a key stakeholder in care transitions. | They just make sure the paperwork is set up.and they have it written down, See doctor in 7 days. And I think they [the hospitals] think that's where their responsibility stops. They don't actually look at our records or talk to us. (Participant 2) |
| Perceived unrealistic expectations of primary care capacity to deliver postdischarge care. | [The hospital will] send anyone that's poor to us whether they are our patient or not. [T]hey say go to [our clinic] and they'll give you your outpatient medications. [But] we're at capacity. [W]e have a 79 month wait for a [new] primary care appointment. So then, we're stuck with the ethical dilemma of [do we send the patient back to the ER/hospital] for their medication or do we just [try to] take them in? (Participant 13) | |
| The hospitals feel every undoctored patient must be ours. [But] it's not like we're sitting on our hands. We have more than enough patients. (Participant 22) | ||
| Informal affiliations and partnerships, formed through personal relationships and interpersonal networking, facilitate collaboration. | Informal affiliations arise from existing personal relationships and/or interpersonal networking. | Our CEO [has been here] for the past 40 years, and has had very deep and ongoing relationships with the [hospital]. Those doors are very wide open. (Participant 18) |
| Informal partnerships are particularly important for FQHCs. | As an FQHC we can't have any ties financially or politically, but there's a traditional connection. (Participant 2) | |
| Increasing demands on clinical productivity lead to a loss of networking opportunities. | We're one of the few clinics that has their own inpatient service. I would say that the transitions between the hospital and [our] clinic start from a much higher level than anybody else. [However] we're about to close our hospital service. It's just too much work for our [clinic] doctors. (Participant 8) | |
| There used to be a meeting once a month where quality improvement programs and issues were discussed. Our administration eliminated these in favor of productivity, to increase our numbers of patients seen. (Participant 12) | ||
| Loss of relationships with hospital personnel amplifies challenges to collaboration. | Because the primary care docs are not visible in the hospital[quality improvement] projects [become] hospital‐based. Usually they forget that we exist. (Participant 11) | |
| External funding and support can enable opportunities for networking and relationship building. | The [national stakeholder organization] has done a lot of work with us to bring us together and figure out what we're doing [across] different counties, settings, providers. (Participant 20) | |
| Electronic health records enable collaboration by improving communication between hospitals and primary care. | Lack of timely communication between inpatient and outpatient settings is a major obstacle to postdischarge care coordination. | It's a lot of effort to get medical records back. It is often not timely. Patients are going to cycle in and out of more costly acute care because we don't know that it's happening. Communication between [outpatient and inpatient] facilities is one of the most challenging issues. (Participant 13) |
| Optimism about potential of EHRs. | A lot of people are depending on [the EHR] to make a lot of communication changes [where there was] a disconnect in the past. (Participant 7) | |
| Lack of EHR interoperability. | We have an EHR that's pieced together. The [emergency department] has their own [system]. The clinics have their own. The inpatient has their own. They're all electronic but they don't all talk to each other that well. (Participant 20) | |
| Our system has reached our maximum capacity and we've had to rely on our community partners to see the overflow. [T]he difficult communication [is] magnified. (Participant 11) | ||
| Privacy and legal concerns (nonuniform application of HIPAA standards). | There is a very different view from hospital to hospital about what it is they feel that they can share legally under HIPAA or not. It's a very strange thing and it almost depends more on the chief information officer at [each] hospital and less on what the [regulations] actually say. (Participant 21) | |
| Yes, [the EHR] does communicate with the hospitals and the hospitals [communicate] back [with us]. [T]here are some technical issues, butthe biggest impediments to making the technology work are new issues around confidentiality and access. (Participant 17) | ||
| Interpersonal contact is still needed even with robust EHRs. | I think [communication between systems is] getting better [due to the EHR], but there's still quite a few holes and a sense of the loop not being completely closed. It's like when you pick up the phoneyou don't want the automated system, you want to actually talk to somebody. (Participant 18) | |
Lack of Institutional Financial Incentives for Collaboration
Primary care leaders felt that current reimbursement strategies rewarded hospitals for reducing readmissions rather than promoting shared savings with primary care. Seeking collaboration with hospitals would potentially increase clinic responsibility for postdischarge patient care without reimbursement for additional work.
In counties without public hospitals, leaders worried that collaboration with hospitals could lead to active loss of Medicaid patients from their practices. Developing closer relationships with local hospitals would enable those hospitals to redirect Medicaid patients to hospital‐owned primary care clinics, leading to a loss of important revenue and financial stability for their clinics.
A subset of these leaders also perceived that nonpublic hospitals were reluctant to collaborate with their clinics. They hypothesized that hospital leaders worried that collaborating with their primary care practices would lead to more uninsured patients at their hospitals, leading to an increase in uncompensated hospital care and reduced reimbursement. However, a second subset of leaders thought that nonpublic hospitals had increased financial incentives to collaborate with safety‐net clinics, because improved coordination with outpatient care could prevent uncompensated hospital care.
Competing Clinic Priorities Limit Primary Care Ability to Focus on Care Transitions
Clinic leaders struggled to balance competing priorities, including strained clinic capacity, regulatory/accreditation requirements, and financial strain. New patient‐centered medical home initiatives, which improve primary care financial incentives for postdischarge care coordination, were perceived as well intentioned but added to an overwhelming burden of ongoing quality improvement efforts.
Mismatched Expectations About the Role and Capacity of Primary Care in Care Transitions Limits Collaboration
Many leaders felt that hospitals undervalued the role of primary care as stakeholders in improving care transitions. They perceived that hospitals made little effort to directly contact primary care physicians about their patients' hospitalizations and discharges. Leaders were frustrated that hospitals had unrealistic expectations of primary care to deliver timely postdischarge care, given their strained capacity. Consequently, some were reluctant to seek opportunities to collaborate with hospitals to improve care transitions.
Informal Affiliations and Partnerships, Formed Through Personal Relationships and Interpersonal Networking, Facilitate Collaboration
Informal affiliations between hospitals and primary care clinics helped improve awareness of organizational roles and capacity and create a sense of shared mission, thus enabling collaboration in spite of other barriers. Such affiliations arose from existing, longstanding personal relationships and/or interpersonal networking between individual providers across settings. These informal affiliations were important for safety‐net clinics that were FQHCs or FQHC Look‐Alikes, because formal hospital affiliations are discouraged by federal regulations.[26]
Opportunities for building relationships and networking with hospital personnel arose when clinic physicians had hospital admitting privileges. This on‐site presence facilitated personal relationships and communication between clinic and hospital physicians, thus enabling better collaboration. However, increasing demands on outpatient clinical productivity often made a hospital presence infeasible. One health system promoted interpersonal networking through regular meetings between the clinic and the local hospital to foster collaboration on quality improvement and care delivery; however, clinical productivity demands ultimately took priority over these meetings. Although delegating inpatient care to hospitalists enabled clinics to maximize their productivity, it also decreased opportunities for networking, and consequently, clinic physicians felt their voices and opinions were not represented in improvement initiatives.
Outside funding and support, such as incentive programs and conferences sponsored by local health plans, clinic consortiums, or national stakeholder organizations, enabled the most successful networking. These successes were independent of whether the clinic staff rounded in the hospital.
Electronic Health Records Enable Collaboration By Improving Communication Between Hospitals And Primary Care
Challenges in communication and information flow were also challenges to collaboration with hospitals. No respondents reported receiving routine notification of patient hospitalizations at the time of admission. Many clinics were dedicating significant attention to implementing electronic health record (EHR) systems to receive financial incentives associated with meaningful use.[27] Implementation of EHRs helped mitigate issues with communication with hospitals, though to a lesser degree than expected. Clinics early in the process of EHR adoption were optimistic about the potential of EHRs to improve communication with hospitals. However, clinic leaders in settings with greater EHR experience were more guarded in their enthusiasm. They observed that lack of interoperability between clinic and hospital EHRs was a persistent and major issue in spite of meaningful use standards, limiting timely flow of information across settings. Even when hospitals and their associated clinics had integrated or interoperable EHRs (n=3), or were working toward EHR integration (n=5), the need to expand networks to include other community healthcare settings using different systems presented ongoing challenges to achieving seamless communication due to a lack of interoperability.
When information sharing was technically feasible, leaders noted that inconsistent understanding and application of privacy rules dictated by the Health Insurance Portability and Accountability Act (HIPAA) limited information sharing. The quality and types of information shared varied widely across settings, depending on how HIPAA regulations were interpreted.
Even with robust EHRs, interpersonal contact was still perceived as crucial to enabling collaboration. EHRs were perceived to help with information flow, but did not facilitate relationship building across settings.
DISCUSSION
We found that safety‐net primary care leaders identified several barriers to collaboration with hospitals: (1) lack of financial incentives for collaboration, (2) competing priorities, (3) mismatched expectations about the role and capacity of primary care, and (4) poor communication infrastructure. Interpersonal networking and use of EHRs helped overcome these obstacles to a limited extent.
Prior studies demonstrate that early follow‐up, timely communication, and continuity with primary care after hospital discharge are associated with improved postdischarge outcomes.[8, 28, 29, 30] Despite evidence that collaboration between primary care and hospitals may help optimize postdischarge outcomes, our study is the first to describe primary care leaders' perspectives on potential targets for improving collaboration between hospitals and primary care to improve care transitions.
Our results highlight the need to modify payment models to align financial incentives across settings for collaboration. Otherwise, it may be difficult for hospitals to engage primary care in collaborative efforts to improve care transitions. Recent pilot payment models aim to motivate improved postdischarge care coordination. The Centers for Medicare and Medicaid Services implemented two new Current Procedural Terminology Transitional Care Management codes to enable reimbursement of outpatient physicians for management of patients transitioning from the hospital to the community. This model does not require communication between accepting (outpatient) and discharging (hospital) physicians or other hospital staff.[31] Another pilot program pays primary care clinics $6 per beneficiary per month if they become level 3 patient‐centered medical homes, which have stringent requirements for communication and coordination with hospitals for postdischarge care.[32] Capitated payment models, such as expansion of Medicaid managed care, and shared‐savings models, such accountable care organizations, aim to promote shared responsibility between hospitals and primary care by creating financial incentives to prevent hospitalizations through effective use of outpatient resources. The effectiveness of these strategies to improve care transitions is not yet established.
Many tout the adoption of EHRs as a means to improve communication and collaboration across settings.[33] However, policies narrowly focused on EHR adoption fail to address broader issues regarding lack of EHR interoperability and inconsistently applied privacy regulations under HIPAA, which were substantial barriers to information sharing. Stage 2 meaningful use criteria will address some interoperability issues by implementing standards for exchange of laboratory data and summary care records for care transitions.[34] Additional regulatory policies should promote uniform application of privacy regulations to enable more fluid sharing of electronic data across various healthcare settings. Locally and regionally negotiated data sharing agreements, as well as arrangements such as regional health information exchanges, could temporize these issues until broader policies are enacted.
EHRs did not obviate the need for meaningful interpersonal communication between providers. Hospital‐based quality improvement teams could create networking opportunities to foster relationship‐building and communication across settings. Leadership should consider scheduling protected time to facilitate attendance. Colocation of outpatient staff, such as nurse coordinators and office managers, in the hospital may also improve relationship building and care coordination.[35] Such measures would bridge the perceived divide between inpatient and outpatient care, and create avenues to find mutually beneficial solutions to improving postdischarge care transitions.[36]
Our results should be interpreted in light of several limitations. This study focused on primary care practices in the California safety net; given variations in safety nets across different contexts, the transferability of our findings may be limited. Second, rural perspectives were relatively under‐represented in our study sample; there may be additional unidentified issues specific to rural areas or specific to other nonparticipants that may have not been captured in this study. For this hypothesis‐generating study, we focused on the perspectives of primary care leaders. Triangulating perspectives of other stakeholders, including hospital leadership, mental health, social services, and payer organizations, will offer a more comprehensive analysis of barriers and enablers to hospitalprimary care collaboration. We were unable to collect data on the payer mix of each facility, which may influence the perceived financial barriers to collaboration among facilities. However, we anticipate that the broader theme of lack of financial incentives for collaboration will resonate across many settings, as collaboration between inpatient and outpatient providers in general has been largely unfunded by payers.[37, 38, 39] Further, most primary care providers (PCPs) in and outside of safety‐net settings operate on slim margins that cannot support additional time by PCPs or staff to coordinate care transitions.[39, 40] Because our study was completed prior to the implementation of several new payment models motivating postdischarge care coordination, we were unable to assess their effect on clinics' collaboration with hospitals.
In conclusion, efforts to improve collaboration between clinical settings around postdischarge care transitions will require targeted policy and quality improvement efforts in 3 specific areas. Policy makers and administrators with the power to negotiate payment schemes and regulatory policies should first align financial incentives across settings to support postdischarge transitions and care coordination, and second, improve EHR interoperability and uniform application of HIPAA regulations. Third, clinic and hospital leaders, and front‐line providers should enhance opportunities for interpersonal networking between providers in hospital and primary care settings. With the expansion of insurance coverage and increased demand for primary care in the safety net and other settings, policies to promote care coordination should consider the perspective of both hospital and clinic incentives and mechanisms for coordinating care across settings.
Disclosures
Preliminary results from this study were presented at the Society of General Internal Medicine 36th Annual Meeting in Denver, Colorado, April 2013. Dr. Nguyen's work on this project was funded by a federal training grant from the National Research Service Award (NRSA T32HP19025‐07‐00). Dr. Goldman is the recipient of grants from the Agency for Health Care Research and Quality (K08 HS018090‐01). Drs. Goldman, Greysen, and Lyndon are supported by the National Institutes of Health, National Center for Research Resources, Office of the Director (UCSF‐CTSI grant no. KL2 RR024130). The authors report no conflicts of interest.
- Crossing the Quality Chasm: A New Health System for the 21st Century. Washington, DC: The National Academies Press; 2001.
- , , , , , . Deficits in communication and information transfer between hospital‐based and primary care physicians: implications for patient safety and continuity of care. JAMA. 2007;297(8):831–841.
- , , , . Medical errors related to discontinuity of care from an inpatient to an outpatient setting. J Gen Intern Med. 2003;18(8):646–651.
- Medicare Payment Advisory Commission. Report to the Congress: Promoting Greater Efficiency in Medicare. Washington, DC: Medicare Payment Advisory Commission; 2007.
- , , , , , . Hospital‐initiated transitional care interventions as a patient safety strategy: a systematic review. Ann Intern Med. 2013;158(5 pt 2):433–440.
- , , . Thirty‐day readmission rates for Medicare beneficiaries by race and site of care. JAMA. 2011;305(7):675–681.
- , . Improving care transitions: hospitalists partnering with primary care. J Hosp Med. 2010;5(7):375–377.
- , , , , . Primary care physician communication at hospital discharge reduces medication discrepancies. J Hosp Med. 2013;8(12):672–677.
- Institute of Medicine. America's Health Care Safety Net: Intact but Endangered. Washington, DC: Institute of Medicine; 2000.
- , . Higher readmissions at safety‐net hospitals and potential policy solutions. Issue Brief (Commonw Fund). 2012;34:1–16.
- , . Characteristics of hospitals receiving penalties under the hospital readmissions reduction program. JAMA. 2013;309(4):342–343.
- , , , et al. Ensuring Equity: A Post‐Reform Framework to Achieve High Performance Health Care for Vulnerable Populations. New York, NY: The Commonwealth Fund; 2011.
- , , , , . Enhancing the Capacity of Community Centers to Achieve High Performance: Findings from the 2009 Commonwealth Fund National Survey of Federally Qualified Health Centers. New York, NY: The Commonwealth Fund; 2010.
- , , . Integration mechanisms and hospital efficiency in integrated health care delivery systems. J Med Syst. 2002;26(2):127–143.
- , , . Effect of physician collaboration network on hospitalization cost and readmission rate. Eur J Public Health. 2012;22(5):629–633.
- Health Resources and Services Administration. Health Center Look‐Alikes Program. Available at: http://bphc.hrsa.gov/about/lookalike/index.html?IsPopUp=true. Accessed on September 5, 2014.
- , , , . Public hospitals in the United States, 2008. Healthcare Cost and Utilization Project. Agency for Healthcare Research and Quality, Rockville, MD. Available at: http://www.hcup‐us.ahrq.gov/reports/statbriefs/sb95.jsp. Published September 2010. Accessed on September 5, 2014.
- U.S. Department of Health and Human Services. Health Resources and Services Administration. Available at: http://www.hrsa.gov/shortage/. Accessed on September 5, 2014.
- , . California's Safety Net and The Need to Improve Local Collaboration in Care for the Uninsured: Counties, Clinics, Hospitals, and Local Health Plans. Available at: http://www.itup.org/Reports/Statewide/Safetynet_Report_Final.pdf. Published October 2008. Accessed on September 5, 2014.
- , . Unsatisfactory saturation: a critical exploration of the notion of saturated sample sizes in qualitative research. Qual Res. 2013;13(2):190–197.
- . Leading successful interinstitutional collaborations using the collaboration success measurement model. Paper presented at: The Chair Academy's 16th Annual International Conference: Navigating the Future through Authentic Leadership; 2007; Jacksonville, FL. Available at http://www.chairacademy.com/conference/2007/papers/leading_successful_interinstitutional_collaborations.pdf. Accessed on September 5, 2014.
- , , , , . The difference between integration and collaboration in patient care: results from key informant interviews working in multiprofessional health care teams. J Manipulative Physiol Ther. 2009;32(9):715–722.
- , , , , , . Implementing organized delivery systems: an integration scorecard. Health Care Manag Rev. 1994;19(3):7–20.
- State of California Office of Statewide Health Planning 3(2):77–101.
- Health Resources and Services Administration Primary Care: The Health Center Program. Affiliation agreements of community 303(17):1716–1722.
- , , , , . Reducing hospital readmissions through primary care practice transformation. Journal Fam Pract. 2014;63(2):67–73.
- , , . Post‐hospitalization transitions: Examining the effects of timing of primary care provider follow‐up. J Hosp Med. 2010;5(7):392–397.
- U.S. Department of Health and Human Services. Centers for Medicare 2009.
- , , , . Hospitalists and care transitions: the divorce of inpatient and outpatient care. Health Aff (Millwood). 2008;27(5):1315–1327.
- , , . Reducing hospital readmissions: lessons from top‐performing hospitals. Available at: http://www.commonwealthfund.org/publications/case‐studies/2011/apr/reducing‐hospital‐readmissions. Published April 2011. Accessed on September 5, 2014.
- , , . Recasting readmissions by placing the hospital role in community context. JAMA. 2013;309(4):351–352.
- . A primary care physician's ideal transitions of care—where's the evidence? J Hosp Med. 2013;8(8):472–477.
- , . Primary care: current problems and proposed solutions. Health Aff (Millwood). 2010;29(5):799–805.
© 2014 Society of Hospital Medicine