User login
Predicting 30-day pneumonia readmissions using electronic health record data
Pneumonia is a leading cause of hospitalizations in the U.S., accounting for more than 1.1 million discharges annually.1 Pneumonia is frequently complicated by hospital readmission, which is costly and potentially avoidable.2,3 Due to financial penalties imposed on hospitals for higher than expected 30-day readmission rates, there is increasing attention to implementing interventions to reduce readmissions in this population.4,5 However, because these programs are resource-intensive, interventions are thought to be most cost-effective if they are targeted to high-risk individuals who are most likely to benefit.6-8
Current pneumonia-specific readmission risk-prediction models that could enable identification of high-risk patients suffer from poor predictive ability, greatly limiting their use, and most were validated among older adults or by using data from single academic medical centers, limiting their generalizability.9-14 A potential reason for poor predictive accuracy is the omission of known robust clinical predictors of pneumonia-related outcomes, including pneumonia severity of illness and stability on discharge.15-17 Approaches using electronic health record (EHR) data, which include this clinically granular data, could enable hospitals to more accurately and pragmatically identify high-risk patients during the index hospitalization and enable interventions to be initiated prior to discharge.
An alternative strategy to identifying high-risk patients for readmission is to use a multi-condition risk-prediction model. Developing and implementing models for every condition may be time-consuming and costly. We have derived and validated 2 multi-condition risk-prediction models using EHR data—1 using data from the first day of hospital admission (‘first-day’ model), and the second incorporating data from the entire hospitalization (‘full-stay’ model) to reflect in-hospital complications and clinical stability at discharge.18,19 However, it is unknown if a multi-condition model for pneumonia would perform as well as a disease-specific model.
This study aimed to develop 2 EHR-based pneumonia-specific readmission risk-prediction models using data routinely collected in clinical practice—a ‘first-day’ and a ‘full-stay’ model—and compare the performance of each model to: 1) one another; 2) the corresponding multi-condition EHR model; and 3) to other potentially useful models in predicting pneumonia readmissions (the Centers for Medicare and Medicaid Services [CMS] pneumonia model, and 2 commonly used pneumonia severity of illness scores validated for predicting mortality). We hypothesized that the pneumonia-specific EHR models would outperform other models; and the full-stay pneumonia-specific model would outperform the first-day pneumonia-specific model.
METHODS
Study Design, Population, and Data Sources
We conducted an observational study using EHR data collected from 6 hospitals (including safety net, community, teaching, and nonteaching hospitals) in north Texas between November 2009 and October 2010, All hospitals used the Epic EHR (Epic Systems Corporation, Verona, WI). Details of this cohort have been published.18,19
We included consecutive hospitalizations among adults 18 years and older discharged from any medicine service with principal discharge diagnoses of pneumonia (ICD-9-CM codes 480-483, 485, 486-487), sepsis (ICD-9-CM codes 038, 995.91, 995.92, 785.52), or respiratory failure (ICD-9-CM codes 518.81, 518.82, 518.84, 799.1) when the latter 2 were also accompanied by a secondary diagnosis of pneumonia.20 For individuals with multiple hospitalizations during the study period, we included only the first hospitalization. We excluded individuals who died during the index hospitalization or within 30 days of discharge, were transferred to another acute care facility, or left against medical advice.
Outcomes
The primary outcome was all-cause 30-day readmission, defined as a nonelective hospitalization within 30 days of discharge to any of 75 acute care hospitals within a 100-mile radius of Dallas, ascertained from an all-payer regional hospitalization database.
Predictor Variables for the Pneumonia-Specific Readmission Models
The selection of candidate predictors was informed by our validated multi-condition risk-prediction models using EHR data available within 24 hours of admission (‘first-day’ multi-condition EHR model) or during the entire hospitalization (‘full-stay’ multi-condition EHR model).18,19 For the pneumonia-specific models, we included all variables in our published multi-condition models as candidate predictors, including sociodemographics, prior utilization, Charlson Comorbidity Index, select laboratory and vital sign abnormalities, length of stay, hospital complications (eg, venous thromboembolism), vital sign instabilities, and disposition status (see Supplemental Table 1 for complete list of variables). We also assessed additional variables specific to pneumonia for inclusion that were: (1) available in the EHR of all participating hospitals; (2) routinely collected or available at the time of admission or discharge; and (3) plausible predictors of adverse outcomes based on literature and clinical expertise. These included select comorbidities (eg, psychiatric conditions, chronic lung disease, history of pneumonia),10,11,21,22 the pneumonia severity index (PSI),16,23,24 intensive care unit stay, and receipt of invasive or noninvasive ventilation. We used a modified PSI score because certain data elements were missing. The modified PSI (henceforth referred to as PSI) did not include nursing home residence and included diagnostic codes as proxies for the presence of pleural effusion (ICD-9-CM codes 510, 511.1, and 511.9) and altered mental status (ICD-9-CM codes 780.0X, 780.97, 293.0, 293.1, and 348.3X).
Statistical Analysis
Model Derivation. Candidate predictor variables were classified as available in the EHR within 24 hours of admission and/or at the time of discharge. For example, socioeconomic factors could be ascertained within the first day of hospitalization, whereas length of stay would not be available until the day of discharge. Predictors with missing values were assumed to be normal (less than 1% missing for each variable). Univariate relationships between readmission and each candidate predictor were assessed in the overall cohort using a pre-specified significance threshold of P ≤ 0.10. Significant variables were entered in the respective first-day and full-stay pneumonia-specific multivariable logistic regression models using stepwise-backward selection with a pre-specified significance threshold of P ≤ 0.05. In sensitivity analyses, we alternately derived our models using stepwise-forward selection, as well as stepwise-backward selection minimizing the Bayesian information criterion and Akaike information criterion separately. These alternate modeling strategies yielded identical predictors to our final models.
Model Validation. Model validation was performed using 5-fold cross-validation, with the overall cohort randomly divided into 5 equal-size subsets.25 For each cycle, 4 subsets were used for training to estimate model coefficients, and the fifth subset was used for validation. This cycle was repeated 5 times with each randomly-divided subset used once as the validation set. We repeated this entire process 50 times and averaged the C statistic estimates to derive an optimism-corrected C statistic. Model calibration was assessed qualitatively by comparing predicted to observed probabilities of readmission by quintiles of predicted risk, and with the Hosmer-Lemeshow goodness-of-fit test.
Comparison to Other Models. The main comparisons of the first-day and full-stay pneumonia-specific EHR model performance were to each other and the corresponding multi-condition EHR model.18,19 The multi-condition EHR models were separately derived and validated within the larger parent cohort from which this study cohort was derived, and outperformed the CMS all-cause model, the HOSPITAL model, and the LACE index.19 To further triangulate our findings, given the lack of other rigorously validated pneumonia-specific risk-prediction models for readmission,14 we compared the pneumonia-specific EHR models to the CMS pneumonia model derived from administrative claims data,10 and 2 commonly used risk-prediction scores for short-term mortality among patients with community-acquired pneumonia, the PSI and CURB-65 scores.16 Although derived and validated using patient-level data, the CMS model was developed to benchmark hospitals according to hospital-level readmission rates.10 The CURB-65 score in this study was also modified to include the same altered mental status diagnostic codes according to the modified PSI as a proxy for “confusion.” Both the PSI and CURB-65 scores were calculated using the most abnormal values within the first 24 hours of admission. The ‘updated’ PSI and the ‘updated’ CURB-65 were calculated using the most abnormal values within 24 hours prior to discharge, or the last known observation prior to discharge if no results were recorded within this time period. A complete list of variables for each of the comparison models are shown in Supplemental Table 1.
We assessed model performance by calculating the C statistic, integrated discrimination index, and net reclassification index (NRI) compared to our pneumonia-specific models. The integrated discrimination index is the difference in the mean predicted probability of readmission between patients who were and were not actually readmitted between 2 models, where more positive values suggest improvement in model performance compared to a reference model.26 The NRI is defined as the sum of the net proportions of correctly reclassified persons with and without the event of interest.27 Here, we calculated a category-based NRI to evaluate the performance of pneumonia-specific models in correctly classifying individuals with and without readmissions into the 2 highest readmission risk quintiles vs the lowest 3 risk quintiles compared to other models.27 This pre-specified cutoff is relevant for hospitals interested in identifying the highest risk individuals for targeted intervention.7 Finally, we assessed calibration of comparator models in our cohort by comparing predicted probability to observed probability of readmission by quintiles of risk for each model. We conducted all analyses using Stata 12.1 (StataCorp, College Station, Texas). This study was approved by the University of Texas Southwestern Medical Center Institutional Review Board.
RESULTS
Of 1463 index hospitalizations (Supplemental Figure 1), the 30-day all-cause readmission rate was 13.6%. Individuals with a 30-day readmission had markedly different sociodemographic and clinical characteristics compared to those not readmitted (Table 1; see Supplemental Table 2 for additional clinical characteristics).

Derivation, Validation, and Performance of the Pneumonia-Specific Readmission Risk-Prediction Models
The final first-day pneumonia-specific EHR model included 7 variables, including sociodemographic characteristics; prior hospitalizations; thrombocytosis, and PSI (Table 2). The first-day pneumonia-specific model had adequate discrimination (C statistic, 0.695; optimism-corrected C statistic 0.675, 95% confidence interval [CI], 0.667-0.685; Table 3). It also effectively stratified individuals across a broad range of risk (average predicted decile of risk ranged from 4% to 33%; Table 3) and was well calibrated (Supplemental Table 3).

The final full-stay pneumonia-specific EHR readmission model included 8 predictors, including 3 variables from the first-day model (median income, thrombocytosis, and prior hospitalizations; Table 2). The full-stay pneumonia-specific EHR model also included vital sign instabilities on discharge, updated PSI, and disposition status (ie, being discharged with home health or to a post-acute care facility was associated with greater odds of readmission, and hospice with lower odds). The full-stay pneumonia-specific EHR model had good discrimination (C statistic, 0.731; optimism-corrected C statistic, 0.714; 95% CI, 0.706-0.720), and stratified individuals across a broad range of risk (average predicted decile of risk ranged from 3% to 37%; Table 3), and was also well calibrated (Supplemental Table 3).

First-Day Pneumonia-Specific EHR Model vs First-Day Multi-Condition EHR Model
The first-day pneumonia-specific EHR model outperformed the first-day multi-condition EHR model with better discrimination (P = 0.029) and more correctly classified individuals in the top 2 highest risk quintiles vs the bottom 3 risk quintiles (Table 3, Supplemental Table 4, and Supplemental Figure 2A). With respect to calibration, the first-day multi-condition EHR model overestimated risk among the highest quintile risk group compared to the first-day pneumonia-specific EHR model (Figure 1A, 1B).

Full-Stay Pneumonia-Specific EHR Model vs Other Models
The full-stay pneumonia-specific EHR model comparatively outperformed the corresponding full-stay multi-condition EHR model, as well as the first-day pneumonia-specific EHR model, the CMS pneumonia model, the updated PSI, and the updated CURB-65 (Table 3, Supplemental Table 5, Supplemental Table 6, and Supplemental Figures 2B and 2C). Compared to the full-stay multi-condition and first-day pneumonia-specific EHR models, the full-stay pneumonia-specific EHR model had better discrimination, better reclassification (NRI, 0.09 and 0.08, respectively), and was able to stratify individuals across a broader range of readmission risk (Table 3). It also had better calibration in the highest quintile risk group compared to the full-stay multi-condition EHR model (Figure 1C and 1D).
Updated vs First-Day Modified PSI and CURB-65 Scores
The updated PSI was more strongly predictive of readmission than the PSI calculated on the day of admission (Wald test, 9.83; P = 0.002). Each 10-point increase in the updated PSI was associated with a 22% increased odds of readmission vs an 11% increase for the PSI calculated upon admission (Table 2). The improved predictive ability of the updated PSI and CURB-65 scores was also reflected in the superior discrimination and calibration vs the respective first-day pneumonia severity of illness scores (Table 3).
DISCUSSION
Using routinely available EHR data from 6 diverse hospitals, we developed 2 pneumonia-specific readmission risk-prediction models that aimed to allow hospitals to identify patients hospitalized with pneumonia at high risk for readmission. Overall, we found that a pneumonia-specific model using EHR data from the entire hospitalization outperformed all other models—including the first-day pneumonia-specific model using data present only on admission, our own multi-condition EHR models, and the CMS pneumonia model based on administrative claims data—in all aspects of model performance (discrimination, calibration, and reclassification). We found that socioeconomic status, prior hospitalizations, thrombocytosis, and measures of clinical severity and stability were important predictors of 30-day all-cause readmissions among patients hospitalized with pneumonia. Additionally, an updated discharge PSI score was a stronger independent predictor of readmissions compared to the PSI score calculated upon admission; and inclusion of the updated PSI in our full-stay pneumonia model led to improved prediction of 30-day readmissions.
The marked improvement in performance of the full-stay pneumonia-specific EHR model compared to the first-day pneumonia-specific model suggests that clinical stability and trajectory during hospitalization (as modeled through disposition status, updated PSI, and vital sign instabilities at discharge) are important predictors of 30-day readmission among patients hospitalized for pneumonia, which was not the case for our EHR-based multi-condition models.19 With the inclusion of these measures, the full-stay pneumonia-specific model correctly reclassified an additional 8% of patients according to their true risk compared to the first-day pneumonia-specific model. One implication of these findings is that hospitals interested in targeting their highest risk individuals with pneumonia for transitional care interventions could do so using the first-day pneumonia-specific EHR model and could refine their targeted strategy at the time of discharge by using the full-stay pneumonia model. This staged risk-prediction strategy would enable hospitals to initiate transitional care interventions for high-risk individuals in the inpatient setting (ie, patient education).7 Then, hospitals could enroll both persistent and newly identified high-risk individuals for outpatient interventions (ie, follow-up telephone call) in the immediate post-discharge period, an interval characterized by heightened vulnerability for adverse events,28 based on patients’ illness severity and stability at discharge. This approach can be implemented by hospitals by building these risk-prediction models directly into the EHR, or by extracting EHR data in near real time as our group has done successfully for heart failure.7
Another key implication of our study is that, for pneumonia, a disease-specific modeling approach has better predictive ability than using a multi-condition model. Compared to multi-condition models, the first-day and full-stay pneumonia-specific EHR models correctly reclassified an additional 6% and 9% of patients, respectively. Thus, hospitals interested in identifying the highest risk patients with pneumonia for targeted interventions should do so using the disease-specific models, if the costs and resources of doing so are within reach of the healthcare system.
An additional novel finding of our study is the added value of an updated PSI for predicting adverse events. Studies of pneumonia severity of illness scores have calculated the PSI and CURB-65 scores using data present only on admission.16,24 While our study also confirms that the PSI calculated upon admission is a significant predictor of readmission,23,29 this study extends this work by showing that an updated PSI score calculated at the time of discharge is an even stronger predictor for readmission, and its inclusion in the model significantly improves risk stratification and prognostication.
Our study was noteworthy for several strengths. First, we used data from a common EHR system, thus potentially allowing for the implementation of the pneumonia-specific models in real time across a number of hospitals. The use of routinely collected data for risk-prediction modeling makes this approach scalable and sustainable, because it obviates the need for burdensome data collection and entry. Second, to our knowledge, this is the first study to measure the additive influence of illness severity and stability at discharge on the readmission risk among patients hospitalized with pneumonia. Third, our study population was derived from 6 hospitals diverse in payer status, age, race/ethnicity, and socioeconomic status. Fourth, our models are less likely to be overfit to the idiosyncrasies of our data given that several predictors included in our final pneumonia-specific models have been associated with readmission in this population, including marital status,13,30 income,11,31 prior hospitalizations,11,13 thrombocytosis,32-34 and vital sign instabilities on discharge.17 Lastly, the discrimination of the CMS pneumonia model in our cohort (C statistic, 0.64) closely matched the discrimination observed in 4 independent cohorts (C statistic, 0.63), suggesting adequate generalizability of our study setting and population.10,12
Our results should be interpreted in the context of several limitations. First, generalizability to other regions beyond north Texas is unknown. Second, although we included a diverse cohort of safety net, community, teaching, and nonteaching hospitals, the pneumonia-specific models were not externally validated in a separate cohort, which may lead to more optimistic estimates of model performance. Third, PSI and CURB-65 scores were modified to use diagnostic codes for altered mental status and pleural effusion, and omitted nursing home residence. Thus, the independent associations for the PSI and CURB-65 scores and their predictive ability are likely attenuated. Fourth, we were unable to include data on medications (antibiotics and steroid use) and outpatient visits, which may influence readmission risk.2,9,13,35-40 Fifth, we included only the first pneumonia hospitalization per patient in this study. Had we included multiple hospitalizations per patient, we anticipate better model performance for the 2 pneumonia-specific EHR models since prior hospitalization was a robust predictor of readmission.
In conclusion, the full-stay pneumonia-specific EHR readmission risk-prediction model outperformed the first-day pneumonia-specific model, multi-condition EHR models, and the CMS pneumonia model. This suggests that: measures of clinical severity and stability at the time of discharge are important predictors for identifying patients at highest risk for readmission; and that EHR data routinely collected for clinical practice can be used to accurately predict risk of readmission among patients hospitalized for pneumonia.
Acknowledgments
The authors would like to acknowledge Ruben Amarasingham, MD, MBA, president and chief executive officer of Parkland Center for Clinical Innovation, and Ferdinand Velasco, MD, chief health information officer at Texas Health Resources for their assistance in assembling the 6-hospital cohort used in this study.
Disclosures
This work was supported by the Agency for Healthcare Research and Quality-funded UT Southwestern Center for Patient-Centered Outcomes Research (R24 HS022418-01); the Commonwealth Foundation (#20100323); the UT Southwestern KL2 Scholars Program supported by the National Institutes of Health (KL2 TR001103 to ANM and OKN); and the National Center for Advancing Translational Sciences at the National Institute of Health (U54 RFA-TR-12-006 to E.A.H.). The study sponsors had no role in design and conduct of the study; collection, management, analysis, and interpretation of the data; and preparation, review, or approval of the manuscript. The authors have no financial conflicts of interest to disclose
1. Centers for Disease Control and Prevention. Pneumonia. http://www.cdc.gov/nchs/fastats/pneumonia.htm. Accessed January 26, 2016.
33. Prina E, Ferrer M, Ranzani OT, et al. Thrombocytosis is a marker of poor outcome in community-acquired pneumonia. Chest. 2013;143(3):767-775. PubMed
34. Violi F, Cangemi R, Calvieri C. Pneumonia, thrombosis and vascular disease. J Thromb Haemost. 2014;12(9):1391-1400. PubMed
35. Weinberger M, Oddone EZ, Henderson WG. Does increased access to primary care reduce hospital readmissions? Veterans Affairs Cooperative Study Group on Primary Care and Hospital Readmission. N Engl J Med. 1996;334(22):1441-1447. PubMed
36. Field TS, Ogarek J, Garber L, Reed G, Gurwitz JH. Association of early post-discharge follow-up by a primary care physician and 30-day rehospitalization among older adults. J Gen Intern Med. 2015;30(5):565-571. PubMed
37. Spatz ES, Sheth SD, Gosch KL, et al. Usual source of care and outcomes following acute myocardial infarction. J Gen Intern Med. 2014;29(6):862-869. PubMed
38. Brooke BS, Stone DH, Cronenwett JL, et al. Early primary care provider follow-up and readmission after high-risk surgery. JAMA Surg. 2014;149(8):821-828. PubMed
39. Adamuz J, Viasus D, Campreciós-Rodriguez P, et al. A prospective cohort study of healthcare visits and rehospitalizations after discharge of patients with community-acquired pneumonia. Respirology. 2011;16(7):1119-1126. PubMed
40. Shorr AF, Zilberberg MD, Reichley R, et al. Readmission following hospitalization for pneumonia: the impact of pneumonia type and its implication for hospitals. Clin Infect Dis. 2013;57(3):362-367. PubMed
Pneumonia is a leading cause of hospitalizations in the U.S., accounting for more than 1.1 million discharges annually.1 Pneumonia is frequently complicated by hospital readmission, which is costly and potentially avoidable.2,3 Due to financial penalties imposed on hospitals for higher than expected 30-day readmission rates, there is increasing attention to implementing interventions to reduce readmissions in this population.4,5 However, because these programs are resource-intensive, interventions are thought to be most cost-effective if they are targeted to high-risk individuals who are most likely to benefit.6-8
Current pneumonia-specific readmission risk-prediction models that could enable identification of high-risk patients suffer from poor predictive ability, greatly limiting their use, and most were validated among older adults or by using data from single academic medical centers, limiting their generalizability.9-14 A potential reason for poor predictive accuracy is the omission of known robust clinical predictors of pneumonia-related outcomes, including pneumonia severity of illness and stability on discharge.15-17 Approaches using electronic health record (EHR) data, which include this clinically granular data, could enable hospitals to more accurately and pragmatically identify high-risk patients during the index hospitalization and enable interventions to be initiated prior to discharge.
An alternative strategy to identifying high-risk patients for readmission is to use a multi-condition risk-prediction model. Developing and implementing models for every condition may be time-consuming and costly. We have derived and validated 2 multi-condition risk-prediction models using EHR data—1 using data from the first day of hospital admission (‘first-day’ model), and the second incorporating data from the entire hospitalization (‘full-stay’ model) to reflect in-hospital complications and clinical stability at discharge.18,19 However, it is unknown if a multi-condition model for pneumonia would perform as well as a disease-specific model.
This study aimed to develop 2 EHR-based pneumonia-specific readmission risk-prediction models using data routinely collected in clinical practice—a ‘first-day’ and a ‘full-stay’ model—and compare the performance of each model to: 1) one another; 2) the corresponding multi-condition EHR model; and 3) to other potentially useful models in predicting pneumonia readmissions (the Centers for Medicare and Medicaid Services [CMS] pneumonia model, and 2 commonly used pneumonia severity of illness scores validated for predicting mortality). We hypothesized that the pneumonia-specific EHR models would outperform other models; and the full-stay pneumonia-specific model would outperform the first-day pneumonia-specific model.
METHODS
Study Design, Population, and Data Sources
We conducted an observational study using EHR data collected from 6 hospitals (including safety net, community, teaching, and nonteaching hospitals) in north Texas between November 2009 and October 2010, All hospitals used the Epic EHR (Epic Systems Corporation, Verona, WI). Details of this cohort have been published.18,19
We included consecutive hospitalizations among adults 18 years and older discharged from any medicine service with principal discharge diagnoses of pneumonia (ICD-9-CM codes 480-483, 485, 486-487), sepsis (ICD-9-CM codes 038, 995.91, 995.92, 785.52), or respiratory failure (ICD-9-CM codes 518.81, 518.82, 518.84, 799.1) when the latter 2 were also accompanied by a secondary diagnosis of pneumonia.20 For individuals with multiple hospitalizations during the study period, we included only the first hospitalization. We excluded individuals who died during the index hospitalization or within 30 days of discharge, were transferred to another acute care facility, or left against medical advice.
Outcomes
The primary outcome was all-cause 30-day readmission, defined as a nonelective hospitalization within 30 days of discharge to any of 75 acute care hospitals within a 100-mile radius of Dallas, ascertained from an all-payer regional hospitalization database.
Predictor Variables for the Pneumonia-Specific Readmission Models
The selection of candidate predictors was informed by our validated multi-condition risk-prediction models using EHR data available within 24 hours of admission (‘first-day’ multi-condition EHR model) or during the entire hospitalization (‘full-stay’ multi-condition EHR model).18,19 For the pneumonia-specific models, we included all variables in our published multi-condition models as candidate predictors, including sociodemographics, prior utilization, Charlson Comorbidity Index, select laboratory and vital sign abnormalities, length of stay, hospital complications (eg, venous thromboembolism), vital sign instabilities, and disposition status (see Supplemental Table 1 for complete list of variables). We also assessed additional variables specific to pneumonia for inclusion that were: (1) available in the EHR of all participating hospitals; (2) routinely collected or available at the time of admission or discharge; and (3) plausible predictors of adverse outcomes based on literature and clinical expertise. These included select comorbidities (eg, psychiatric conditions, chronic lung disease, history of pneumonia),10,11,21,22 the pneumonia severity index (PSI),16,23,24 intensive care unit stay, and receipt of invasive or noninvasive ventilation. We used a modified PSI score because certain data elements were missing. The modified PSI (henceforth referred to as PSI) did not include nursing home residence and included diagnostic codes as proxies for the presence of pleural effusion (ICD-9-CM codes 510, 511.1, and 511.9) and altered mental status (ICD-9-CM codes 780.0X, 780.97, 293.0, 293.1, and 348.3X).
Statistical Analysis
Model Derivation. Candidate predictor variables were classified as available in the EHR within 24 hours of admission and/or at the time of discharge. For example, socioeconomic factors could be ascertained within the first day of hospitalization, whereas length of stay would not be available until the day of discharge. Predictors with missing values were assumed to be normal (less than 1% missing for each variable). Univariate relationships between readmission and each candidate predictor were assessed in the overall cohort using a pre-specified significance threshold of P ≤ 0.10. Significant variables were entered in the respective first-day and full-stay pneumonia-specific multivariable logistic regression models using stepwise-backward selection with a pre-specified significance threshold of P ≤ 0.05. In sensitivity analyses, we alternately derived our models using stepwise-forward selection, as well as stepwise-backward selection minimizing the Bayesian information criterion and Akaike information criterion separately. These alternate modeling strategies yielded identical predictors to our final models.
Model Validation. Model validation was performed using 5-fold cross-validation, with the overall cohort randomly divided into 5 equal-size subsets.25 For each cycle, 4 subsets were used for training to estimate model coefficients, and the fifth subset was used for validation. This cycle was repeated 5 times with each randomly-divided subset used once as the validation set. We repeated this entire process 50 times and averaged the C statistic estimates to derive an optimism-corrected C statistic. Model calibration was assessed qualitatively by comparing predicted to observed probabilities of readmission by quintiles of predicted risk, and with the Hosmer-Lemeshow goodness-of-fit test.
Comparison to Other Models. The main comparisons of the first-day and full-stay pneumonia-specific EHR model performance were to each other and the corresponding multi-condition EHR model.18,19 The multi-condition EHR models were separately derived and validated within the larger parent cohort from which this study cohort was derived, and outperformed the CMS all-cause model, the HOSPITAL model, and the LACE index.19 To further triangulate our findings, given the lack of other rigorously validated pneumonia-specific risk-prediction models for readmission,14 we compared the pneumonia-specific EHR models to the CMS pneumonia model derived from administrative claims data,10 and 2 commonly used risk-prediction scores for short-term mortality among patients with community-acquired pneumonia, the PSI and CURB-65 scores.16 Although derived and validated using patient-level data, the CMS model was developed to benchmark hospitals according to hospital-level readmission rates.10 The CURB-65 score in this study was also modified to include the same altered mental status diagnostic codes according to the modified PSI as a proxy for “confusion.” Both the PSI and CURB-65 scores were calculated using the most abnormal values within the first 24 hours of admission. The ‘updated’ PSI and the ‘updated’ CURB-65 were calculated using the most abnormal values within 24 hours prior to discharge, or the last known observation prior to discharge if no results were recorded within this time period. A complete list of variables for each of the comparison models are shown in Supplemental Table 1.
We assessed model performance by calculating the C statistic, integrated discrimination index, and net reclassification index (NRI) compared to our pneumonia-specific models. The integrated discrimination index is the difference in the mean predicted probability of readmission between patients who were and were not actually readmitted between 2 models, where more positive values suggest improvement in model performance compared to a reference model.26 The NRI is defined as the sum of the net proportions of correctly reclassified persons with and without the event of interest.27 Here, we calculated a category-based NRI to evaluate the performance of pneumonia-specific models in correctly classifying individuals with and without readmissions into the 2 highest readmission risk quintiles vs the lowest 3 risk quintiles compared to other models.27 This pre-specified cutoff is relevant for hospitals interested in identifying the highest risk individuals for targeted intervention.7 Finally, we assessed calibration of comparator models in our cohort by comparing predicted probability to observed probability of readmission by quintiles of risk for each model. We conducted all analyses using Stata 12.1 (StataCorp, College Station, Texas). This study was approved by the University of Texas Southwestern Medical Center Institutional Review Board.
RESULTS
Of 1463 index hospitalizations (Supplemental Figure 1), the 30-day all-cause readmission rate was 13.6%. Individuals with a 30-day readmission had markedly different sociodemographic and clinical characteristics compared to those not readmitted (Table 1; see Supplemental Table 2 for additional clinical characteristics).
Derivation, Validation, and Performance of the Pneumonia-Specific Readmission Risk-Prediction Models
The final first-day pneumonia-specific EHR model included 7 variables, including sociodemographic characteristics; prior hospitalizations; thrombocytosis, and PSI (Table 2). The first-day pneumonia-specific model had adequate discrimination (C statistic, 0.695; optimism-corrected C statistic 0.675, 95% confidence interval [CI], 0.667-0.685; Table 3). It also effectively stratified individuals across a broad range of risk (average predicted decile of risk ranged from 4% to 33%; Table 3) and was well calibrated (Supplemental Table 3).
The final full-stay pneumonia-specific EHR readmission model included 8 predictors, including 3 variables from the first-day model (median income, thrombocytosis, and prior hospitalizations; Table 2). The full-stay pneumonia-specific EHR model also included vital sign instabilities on discharge, updated PSI, and disposition status (ie, being discharged with home health or to a post-acute care facility was associated with greater odds of readmission, and hospice with lower odds). The full-stay pneumonia-specific EHR model had good discrimination (C statistic, 0.731; optimism-corrected C statistic, 0.714; 95% CI, 0.706-0.720), and stratified individuals across a broad range of risk (average predicted decile of risk ranged from 3% to 37%; Table 3), and was also well calibrated (Supplemental Table 3).
First-Day Pneumonia-Specific EHR Model vs First-Day Multi-Condition EHR Model
The first-day pneumonia-specific EHR model outperformed the first-day multi-condition EHR model with better discrimination (P = 0.029) and more correctly classified individuals in the top 2 highest risk quintiles vs the bottom 3 risk quintiles (Table 3, Supplemental Table 4, and Supplemental Figure 2A). With respect to calibration, the first-day multi-condition EHR model overestimated risk among the highest quintile risk group compared to the first-day pneumonia-specific EHR model (Figure 1A, 1B).
Full-Stay Pneumonia-Specific EHR Model vs Other Models
The full-stay pneumonia-specific EHR model comparatively outperformed the corresponding full-stay multi-condition EHR model, as well as the first-day pneumonia-specific EHR model, the CMS pneumonia model, the updated PSI, and the updated CURB-65 (Table 3, Supplemental Table 5, Supplemental Table 6, and Supplemental Figures 2B and 2C). Compared to the full-stay multi-condition and first-day pneumonia-specific EHR models, the full-stay pneumonia-specific EHR model had better discrimination, better reclassification (NRI, 0.09 and 0.08, respectively), and was able to stratify individuals across a broader range of readmission risk (Table 3). It also had better calibration in the highest quintile risk group compared to the full-stay multi-condition EHR model (Figure 1C and 1D).
Updated vs First-Day Modified PSI and CURB-65 Scores
The updated PSI was more strongly predictive of readmission than the PSI calculated on the day of admission (Wald test, 9.83; P = 0.002). Each 10-point increase in the updated PSI was associated with a 22% increased odds of readmission vs an 11% increase for the PSI calculated upon admission (Table 2). The improved predictive ability of the updated PSI and CURB-65 scores was also reflected in the superior discrimination and calibration vs the respective first-day pneumonia severity of illness scores (Table 3).
DISCUSSION
Using routinely available EHR data from 6 diverse hospitals, we developed 2 pneumonia-specific readmission risk-prediction models that aimed to allow hospitals to identify patients hospitalized with pneumonia at high risk for readmission. Overall, we found that a pneumonia-specific model using EHR data from the entire hospitalization outperformed all other models—including the first-day pneumonia-specific model using data present only on admission, our own multi-condition EHR models, and the CMS pneumonia model based on administrative claims data—in all aspects of model performance (discrimination, calibration, and reclassification). We found that socioeconomic status, prior hospitalizations, thrombocytosis, and measures of clinical severity and stability were important predictors of 30-day all-cause readmissions among patients hospitalized with pneumonia. Additionally, an updated discharge PSI score was a stronger independent predictor of readmissions compared to the PSI score calculated upon admission; and inclusion of the updated PSI in our full-stay pneumonia model led to improved prediction of 30-day readmissions.
The marked improvement in performance of the full-stay pneumonia-specific EHR model compared to the first-day pneumonia-specific model suggests that clinical stability and trajectory during hospitalization (as modeled through disposition status, updated PSI, and vital sign instabilities at discharge) are important predictors of 30-day readmission among patients hospitalized for pneumonia, which was not the case for our EHR-based multi-condition models.19 With the inclusion of these measures, the full-stay pneumonia-specific model correctly reclassified an additional 8% of patients according to their true risk compared to the first-day pneumonia-specific model. One implication of these findings is that hospitals interested in targeting their highest risk individuals with pneumonia for transitional care interventions could do so using the first-day pneumonia-specific EHR model and could refine their targeted strategy at the time of discharge by using the full-stay pneumonia model. This staged risk-prediction strategy would enable hospitals to initiate transitional care interventions for high-risk individuals in the inpatient setting (ie, patient education).7 Then, hospitals could enroll both persistent and newly identified high-risk individuals for outpatient interventions (ie, follow-up telephone call) in the immediate post-discharge period, an interval characterized by heightened vulnerability for adverse events,28 based on patients’ illness severity and stability at discharge. This approach can be implemented by hospitals by building these risk-prediction models directly into the EHR, or by extracting EHR data in near real time as our group has done successfully for heart failure.7
Another key implication of our study is that, for pneumonia, a disease-specific modeling approach has better predictive ability than using a multi-condition model. Compared to multi-condition models, the first-day and full-stay pneumonia-specific EHR models correctly reclassified an additional 6% and 9% of patients, respectively. Thus, hospitals interested in identifying the highest risk patients with pneumonia for targeted interventions should do so using the disease-specific models, if the costs and resources of doing so are within reach of the healthcare system.
An additional novel finding of our study is the added value of an updated PSI for predicting adverse events. Studies of pneumonia severity of illness scores have calculated the PSI and CURB-65 scores using data present only on admission.16,24 While our study also confirms that the PSI calculated upon admission is a significant predictor of readmission,23,29 this study extends this work by showing that an updated PSI score calculated at the time of discharge is an even stronger predictor for readmission, and its inclusion in the model significantly improves risk stratification and prognostication.
Our study was noteworthy for several strengths. First, we used data from a common EHR system, thus potentially allowing for the implementation of the pneumonia-specific models in real time across a number of hospitals. The use of routinely collected data for risk-prediction modeling makes this approach scalable and sustainable, because it obviates the need for burdensome data collection and entry. Second, to our knowledge, this is the first study to measure the additive influence of illness severity and stability at discharge on the readmission risk among patients hospitalized with pneumonia. Third, our study population was derived from 6 hospitals diverse in payer status, age, race/ethnicity, and socioeconomic status. Fourth, our models are less likely to be overfit to the idiosyncrasies of our data given that several predictors included in our final pneumonia-specific models have been associated with readmission in this population, including marital status,13,30 income,11,31 prior hospitalizations,11,13 thrombocytosis,32-34 and vital sign instabilities on discharge.17 Lastly, the discrimination of the CMS pneumonia model in our cohort (C statistic, 0.64) closely matched the discrimination observed in 4 independent cohorts (C statistic, 0.63), suggesting adequate generalizability of our study setting and population.10,12
Our results should be interpreted in the context of several limitations. First, generalizability to other regions beyond north Texas is unknown. Second, although we included a diverse cohort of safety net, community, teaching, and nonteaching hospitals, the pneumonia-specific models were not externally validated in a separate cohort, which may lead to more optimistic estimates of model performance. Third, PSI and CURB-65 scores were modified to use diagnostic codes for altered mental status and pleural effusion, and omitted nursing home residence. Thus, the independent associations for the PSI and CURB-65 scores and their predictive ability are likely attenuated. Fourth, we were unable to include data on medications (antibiotics and steroid use) and outpatient visits, which may influence readmission risk.2,9,13,35-40 Fifth, we included only the first pneumonia hospitalization per patient in this study. Had we included multiple hospitalizations per patient, we anticipate better model performance for the 2 pneumonia-specific EHR models since prior hospitalization was a robust predictor of readmission.
In conclusion, the full-stay pneumonia-specific EHR readmission risk-prediction model outperformed the first-day pneumonia-specific model, multi-condition EHR models, and the CMS pneumonia model. This suggests that: measures of clinical severity and stability at the time of discharge are important predictors for identifying patients at highest risk for readmission; and that EHR data routinely collected for clinical practice can be used to accurately predict risk of readmission among patients hospitalized for pneumonia.
Acknowledgments
The authors would like to acknowledge Ruben Amarasingham, MD, MBA, president and chief executive officer of Parkland Center for Clinical Innovation, and Ferdinand Velasco, MD, chief health information officer at Texas Health Resources for their assistance in assembling the 6-hospital cohort used in this study.
Disclosures
This work was supported by the Agency for Healthcare Research and Quality-funded UT Southwestern Center for Patient-Centered Outcomes Research (R24 HS022418-01); the Commonwealth Foundation (#20100323); the UT Southwestern KL2 Scholars Program supported by the National Institutes of Health (KL2 TR001103 to ANM and OKN); and the National Center for Advancing Translational Sciences at the National Institute of Health (U54 RFA-TR-12-006 to E.A.H.). The study sponsors had no role in design and conduct of the study; collection, management, analysis, and interpretation of the data; and preparation, review, or approval of the manuscript. The authors have no financial conflicts of interest to disclose
1. Centers for Disease Control and Prevention. Pneumonia. http://www.cdc.gov/nchs/fastats/pneumonia.htm. Accessed January 26, 2016.
33. Prina E, Ferrer M, Ranzani OT, et al. Thrombocytosis is a marker of poor outcome in community-acquired pneumonia. Chest. 2013;143(3):767-775. PubMed
34. Violi F, Cangemi R, Calvieri C. Pneumonia, thrombosis and vascular disease. J Thromb Haemost. 2014;12(9):1391-1400. PubMed
35. Weinberger M, Oddone EZ, Henderson WG. Does increased access to primary care reduce hospital readmissions? Veterans Affairs Cooperative Study Group on Primary Care and Hospital Readmission. N Engl J Med. 1996;334(22):1441-1447. PubMed
36. Field TS, Ogarek J, Garber L, Reed G, Gurwitz JH. Association of early post-discharge follow-up by a primary care physician and 30-day rehospitalization among older adults. J Gen Intern Med. 2015;30(5):565-571. PubMed
37. Spatz ES, Sheth SD, Gosch KL, et al. Usual source of care and outcomes following acute myocardial infarction. J Gen Intern Med. 2014;29(6):862-869. PubMed
38. Brooke BS, Stone DH, Cronenwett JL, et al. Early primary care provider follow-up and readmission after high-risk surgery. JAMA Surg. 2014;149(8):821-828. PubMed
39. Adamuz J, Viasus D, Campreciós-Rodriguez P, et al. A prospective cohort study of healthcare visits and rehospitalizations after discharge of patients with community-acquired pneumonia. Respirology. 2011;16(7):1119-1126. PubMed
40. Shorr AF, Zilberberg MD, Reichley R, et al. Readmission following hospitalization for pneumonia: the impact of pneumonia type and its implication for hospitals. Clin Infect Dis. 2013;57(3):362-367. PubMed
© 2017 Society of Hospital Medicine
Sneak Peek: Journal of Hospital Medicine
BACKGROUND: Readmissions after hospitalization for pneumonia are common, but the few risk-prediction models have poor to modest predictive ability. Data routinely collected in the EHR may improve prediction.
DESIGN: Observational cohort study using backward-stepwise selection and cross validation.
SUBJECTS: Consecutive pneumonia hospitalizations from six diverse hospitals in north Texas from 2009 to 2010.
MEASURES: All-cause, nonelective, 30-day readmissions, ascertained from 75 regional hospitals.
RESULTS: Of 1,463 patients, 13.6% were readmitted. The first-day, pneumonia-specific model included sociodemographic factors, prior hospitalizations, thrombocytosis, and a modified pneumonia severity index. The full-stay model included disposition status, vital sign instabilities on discharge, and an updated pneumonia severity index calculated using values from the day of discharge as additional predictors. The full-stay, pneumonia-specific model outperformed the first-day model (C-statistic, 0.731 vs. 0.695; P = .02; net reclassification index = 0.08). Compared with a validated multicondition readmission model, the Centers for Medicare & Medicaid Services pneumonia model, and two commonly used pneumonia severity of illness scores, the full-stay pneumonia-specific model had better discrimination (C-statistic, 0.604-0.681; P less than 0.01 for all comparisons), predicted a broader range of risk, and better reclassified individuals by their true risk (net reclassification index range, 0.09-0.18).
CONCLUSIONS: EHR data collected from the entire hospitalization can accurately predict readmission risk among patients hospitalized for pneumonia. This approach outperforms a first-day, pneumonia-specific model, the Centers for Medicare & Medicaid Services pneumonia model, and two commonly used pneumonia severity of illness scores.
Also In JHM This Month
Evaluating automated rules for rapid response system alarm triggers in medical and surgical patients
AUTHORS: Santiago Romero-Brufau, MD; Bruce W. Morlan, MS; Matthew Johnson, MPH; Joel Hickman; Lisa L. Kirkland, MD; James M. Naessens, ScD; Jeanne Huddleston, MD, FACP, FHM
Prognosticating with the Hospital-Patient One-year Mortality Risk score using information abstracted from the medical record
AUTHORS: Genevieve Casey, MD, and Carl van Walraven, MD, FRCPC, MSc
Automating venous thromboembolism risk calculation using electronic health record data upon hospital admission: The Automated Padua Prediction Score
AUTHORS: Pierre Elias, MD; Raman Khanna, MD; Adams Dudley, MD, MBA; Jason Davies, MD, PhD; Ronald Jacolbia, MSN; Kara McArthur, BA; Andrew D. Auerbach, MD, MPH, SFHM
The value of ultrasound in cellulitis to rule out deep venous thrombosis
AUTHORS: Hyung J. Cho, MD, and Andrew S. Dunn, MD, SFHM
Hospital medicine and perioperative care: A framework for high quality, high value collaborative care
AUTHORS: Rachel E. Thompson, MD, MPH, SFHM; Kurt Pfeifer, MD, FHM; Paul Grant, MD, SFHM; Cornelia Taylor, MD; Barbara Slawski, MD, FACP, MS, SFHM; Christopher Whinney, MD, FACP, FHM; Laurence Wellikson, MD, MHM; Amir K. Jaffer, MD, MBA, SFHM

Rehospitalization after Pneumonia
Pneumonia remains a significant problem in the United States, both in terms of mortality as well as cost to the healthcare system. Each year, over 1 million patients are hospitalized for pneumonia, with costs conservatively estimated at more than $7 billion in 2010.[1] One contributing factor for these costs is that pneumonia is the second most frequent reason for rehospitalization.[2] Rehospitalization after admission for pneumonia is now used as a marker for quality of care.
Given the cost and adverse outcomes of pneumonia, it is important to examine early rehospitalization to better understand what factors play a role. Studies have examined factors associated with readmission following an initial pneumonia‐related hospitalization. Adamuz et al. showed that additional healthcare visits and rehospitalizations within 30 days of discharge from the hospital were common and were associated with worsening of signs or symptoms of pneumonia and/or comorbidities.[3] Other studies demonstrated that instability on hospital discharge, as well as treatment failure, were associated with increased risk of rehospitalization.[4, 5] Jasti et al. found rehospitalizations following pneumonia were usually comorbidity related, primarily cardiopulmonary and/or neurologic disease, rather than due to the index pneumonia.[6] Many of these studies, and others looking at age, activity of daily living score, socioeconomic status, and comorbidity characteristics, were performed in relatively small cohorts. Predictors of rehospitalization have not been studied in a large cohort of patients in an integrated healthcare system.
Our study looks at factors not addressed in prior studies that have used administrative claims data to identify factors associated with early readmission. We also evaluated these admission risk factors in a veteran population, whereas prior studies have primarily focused on those who receive Medicare. The purpose of this study was to examine predictors of early (30 days) readmission in the Veterans Affairs (VA) healthcare system for patients age 65 years and older hospitalized for pneumonia. Our a priori hypothesis was that comorbid illnesses, such as congestive heart failure and chronic obstructive pulmonary disease, and patients with high medical complexity, such as high number of medications and/or prior hospitalizations and nursing home residence, are the primary factors associated with increased risk of rehospitalization.
METHODS
For this national cohort study, we used data from the VA healthcare system administrative and clinical databases that serve as repositories of clinical data from more than 150 VA hospitals and 850 outpatient clinics throughout the United States. The institutional review boards of the University of Texas Health Science Center at San Antonio and VA North Texas Health Care System approved this study. Details regarding the study design and methods were previously published.[7]
Inclusion Criteria
Patients included in this study were hospitalized between October 2001 and September 2007, had a primary diagnosis of pneumonia/emnfluenza (International Classification of Diseases, 9th Revision [ICD‐9] codes 480.0483.99 or 485487) or a secondary discharge diagnosis of pneumonia with a primary diagnosis of respiratory failure (ICD‐9 code 518.81) or sepsis (ICD‐9 code 038.xx),[8] and were aged 65 years or older on the date of admission. To ensure patients obtained their care primarily at the VA, at least 1 VA outpatient clinic visit in the year preceding the index admission and at least 1 active and filled outpatient medication from a VA pharmacy within 90 days of admission were required for inclusion.
If a patient was admitted more than once during the study period, only the first hospitalization was included as the index admission.
Exclusion Criteria
Patients who died during the initial hospitalization were not included in this study. Patients admitted to hospitals with fewer than 25 reported hospitalizations during October 2001 to September 2007 were excluded, as these hospitals are neither representative nor generalizable. This resulted in the removal of 59 patients from 5 different hospitals.
Data Sources and Definitions
We used inpatient and outpatient demographic, utilization, and comorbidity data from the National Patient Care Database. Pharmacy data were extracted from the Decision Support System National Data Extracts and Pharmacy Benefits Management. Vital status information was obtained from the Vital Status file, which incorporates data from veterans' death benefits claims, inpatient deaths, Medicare Vital Status files, and the Social Security Administration's death master file. We used encrypted patient identifiers link to information across these databases.
We obtained demographic information (age, sex, race, marital status) from inpatient and outpatient data. We categorized race as white, black, Hispanic, and other/unknown. To infer active smoking and/or tobacco cessation attempts, we identified ICD‐9 codes for tobacco use (305.1, V15.82), smoking cessation clinic use, and/or use of medications for the treatment of nicotine dependence (Zyban, nicotine replacement, or varenicline). We used VA priority status as a proxy for socioeconomic and disability status. VA priority groups are a way for the VA to focus limited funds to those veterans most in need. The highest group (priority group 1) must have at least a 50% service‐connected disability. Priority groups 2 through 6 include veterans with up to 40% service‐connected disability, former prisoners of war, those awarded certain honors, veterans with lower incomes, and the catastrophically disabled. The lowest groups (priority groups 7 and 8) include veterans with relatively higher incomes who agree to pay copayments.[9]
We also obtained information on comorbid conditions from inpatient and outpatient administrative data. We defined alcohol abuse using ICD‐9 codes 291, 303, 305.0, and illicit drug use with ICD‐9 codes 292, 304, 305 excluding 305.0‐.1. We used the Charlson Comorbidity Index to quantify levels of preexisting comorbidity[10] adapted for administrative databases, using ICD‐9 codes for 19 comorbid conditions from prior outpatient and inpatient encounters. We defined cardiovascular events and lung cancer that were diagnosed during the hospitalization as previously described.[11, 12]
Outcomes
Our primary study outcome was readmission within 30 days of hospital discharge for pneumonia from any VA acute care hospital only. Medicare has used 30‐day readmission as a quality indicator, as readmissions that occur closer to discharge are believed to be more likely due to events during the index hospitalization.[13]
Statistical Analyses
We randomly divided patients from our initial cohort into equal derivation or validation cohorts. We assessed differences between the 2 groups using the Student t test for continuous variables and 2 test for categorical variables. We performed univariate logistic regression analyses in the derivation cohort to examine the relationship between 30‐day rehospitalization and each of our potential covariates. We entered covariates that were significant at P<0.10 in the univariate analyses into a multiple regression model. Significant covariates at P<0.10 were then entered into the final model. For this model, we used bootstrapping with replacement in 1000 replications to obtain standard errors of our coefficients and associated P values. Because some subjects had more than 1 index admission, we used robust variancecovariance matrix estimators to compute standard errors for model coefficients.
We used the C statistic to assess the discrimination of our model. Calibration of this model was measured using the Hosmer‐Lemeshow 2 goodness of fit test, using 10 quantiles to group the data. We evaluated differences in discrimination between the derivation and validation cohorts by comparing C statistics.
Last, using the final model in the derivation cohort, 5 categories of severity were created based on subjects' predicted risk values for readmission. Severity categories in both the derivation and validation cohorts were then graphically evaluated.
We defined statistical significance as a 2‐tailed P value of <0.05. We used Stata 12 (StataCorp, College Station, TX) for all analyses.
RESULTS
Patient Characteristics
Of the 45,134 eligible patients, 13.2% were rehospitalized within 30 days, and rates by hospital ranged from 1.6% to 20.7%. Table 1 presents the comparison of baseline difference between the derivation and validation cohorts. There were no statistically significant differences between the 2 groups. Overall, the mean age was 77 years, 98% were male, and 54% were married. Over 90% of the patients received guideline‐concordant antibiotics, and only 10% required a stay in the intensive care unit (ICU). The average length of stay was 7 days (standard deviation of 11 days).
| Characteristics | Derivation Cohort, N=22,567 | Validation Cohort, N=22,567 | P Value |
|---|---|---|---|
| |||
| Sociodemographics | |||
| Age, mean (SD) | 77.3 (6.5) | 77.2 (6.5) | 0.30 |
| Male, no (%) | 22,133 (98.1) | 22,175 (98.3) | 0.14 |
| White, no (%) | 18,858 (83.6) | 18,719 (83.0) | 0.08 |
| Black, no (%) | 2,562 (11.4) | 2,583 (11.5) | 0.76 |
| Hispanic, no (%) | 1,337 (5.9) | 1,414 (6.3) | 0.13 |
| Married, no (%) | 12,166 (53.9) | 12,258 (54.3) | 0.39 |
| VA priority group, no (%) | 0.28 | ||
| 1 | 4,286 (19.0) | 4,281 (19.0) | |
| 26 | 16,306 (72.3) | 16,399 (72.8) | |
| 78 | 1,954 (8.7) | 1,860 (8.3) | |
| Nursing home residence, no (%) | 199 (0.9) | 216 (1.0) | 0.41 |
| Smoker status, no (%) | 8,579 (38.0) | 8,677 (38.5) | 0.34 |
| Index hospitalization factors | |||
| Myocardial infarction during hospitalization, no (%) | 469 (2.1) | 452 (2.0) | 0.57 |
| Heart failure during hospitalization, no (%) | 4,817 (21.4) | 4,772 (21.2) | 0.61 |
| Arrhythmia during hospitalization, no (%) | 4,356 (19.3) | 4,287 (19.0) | 0.41 |
| Length of stay, mean (SD) | 7.2 (10.4) | 7.2 (11.7) | 0.76 |
| Lung cancer diagnosis during hospitalization, no (%) | 31 (0.1) | 31 (0.1) | 1.00 |
| ICU admission, no (%) | 2,282 (10.1) | 2,336 (10.4) | 0.40 |
| Guideline concordant antibiotics, no (%) | 20,724 (91.8) | 20,643 (91.5) | 0.17 |
| Invasive mechanical ventilation, no (%) | 793 (3.5) | 832 (3.7) | 0.32 |
| Vasopressor use, no (%) | 495 (2.2) | 489 (2.2) | 0.85 |
| Hospital complications, no (%) | |||
| Renal organ failure | 2,671 (11.8) | 2,640 (11.7) | 0.65 |
| Cardiac organ failure | 1,004 (4.5) | 959 (4.3) | 0.30 |
| Hepatic organ failure | 33 (0.2) | 40 (0.2) | 0.41 |
| Respiratory organ failure | 1,623 (7.2) | 1,583 (7.0) | 0.46 |
| Comorbid illnesses | |||
| Medical, no (%) | |||
| Myocardial infarction | 1,528 (6.8) | 1,542 (6.8) | 0.79 |
| Congestive heart failure | 5,815 (25.8) | 5,697 (25.2) | 0.20 |
| Peripheral vascular disease | 3,413 (15.1) | 3,454 (15.3) | 0.59 |
| Cerebrovascular disease | 3,993 (17.7) | 4,078 (18.1) | 0.30 |
| Dementia | 1,141 (5.1) | 1,110 (4.9) | 0.50 |
| COPD | 12,168 (53.9) | 12,076 (53.5) | 0.39 |
| Rheumatologic disease | 646 (2.9) | 660 (2.9) | 0.69 |
| Peptic ulcer disease | 795 (3.5) | 723 (3.2) | 0.06 |
| Severe liver disease | 169 (0.8) | 169 (0.8) | 1.00 |
| Mild liver disease | 78 (0.4) | 80 (0.4) | 0.87 |
| Diabetes | 7,310 (32.4) | 7,410 (32.8) | 0.32 |
| Diabetes with complications | 2,229 (9.9) | 2,248 (10.0) | 0.77 |
| Chronic renal disease | 2,836 (12.6) | 2,745 (12.2) | 0.19 |
| Hemi/paraplegia | 319 (1.4) | 338 (1.5) | 0.46 |
| Any prior malignancy | 5,226 (23.2) | 5,269 (23.4) | 0.63 |
| Metastatic solid tumor | 748 (3.3) | 795 (3.5) | 0.22 |
| AIDS | 56 (0.3) | 49 (0.2) | 0.49 |
| HIV | 23 (0.1) | 13 (0.1) | 0.10 |
| Alcohol abuse | 897 (4.0) | 934 (4.1) | 0.38 |
| Drug abuse | 254 (1.1) | 255 (1.1) | 0.96 |
| Psychiatric, no (%) | |||
| Anxiety disorder | 1,692 (7.5) | 1,722 (7.6) | 0.59 |
| Depression indicator | 3,655 (16.2) | 3,718 (16.5) | 0.42 |
| Bipolar disorder | 430 (1.9) | 433 (1.9) | 0.92 |
| Cataract indicator | 6,106 (27.1) | 6,180 (27.4) | 0.43 |
| Prostatitis indicator | 4,680 (20.7) | 4,593 (20.4) | 0.31 |
| Schizophrenia indicator | 685 (3.0) | 676 (3.0) | 0.80 |
| Post‐traumatic stress disorder | 844 (3.7) | 862 (3.8) | 0.66 |
| Medication history within 90 days | |||
| Cardiovascular drugs, mean (SD) | 1.8 (1.6) | 1.8 (1.6) | 0.65 |
| Diabetes drugs, mean (SD) | 0.3 (0.7) | 0.3 (0.7) | 0.60 |
| Inhaled corticosteroids, mean (SD) | 0.4 (0.9) | 0.4 (0.9) | 0.28 |
| Pulmonary drug, mean (SD) | 1.3 (2.0) | 1.3 (2.0) | 0.36 |
| Oral corticosteroids, no (%) | 5,363 (23.8) | 5,505 (24.4) | 0.12 |
| Prior medical utilization | |||
| Number of primary care clinic visits within 1 year, mean (SD) | 4.9 (4.2) | 4.9 (4.2) | 0.67 |
| Number of emergency department visits within 1 year, mean (SD) | 1.2 (2.0) | 1.2 (2.0) | 0.86 |
| Number of outpatient clinic visits within 1 year, mean (SD) | 14.7 (13.1) | 14.6 (13.0) | 0.33 |
| Number of specialty clinic visits within 1 year, mean (SD) | 3.4 (5.5) | 3.3 (5.4) | 0.50 |
| Prior hospital admission within 90 days, no (%) | 5,062 (22.4) | 5,141 (22.8) | 0.37 |
Predictors of 30‐Day Readmission
All variables listed in Table 1 were evaluated. The derivation logistic regression model is shown in Table 2, and only includes predictors associated with rehospitalization. Antibiotic concordance and time in the ICU were evaluated and did not predict readmission. Variables that were significantly associated with rehospitalization in the models included age, marital status, the number of emergency department clinic visits a year prior, prior admission within 90 days, number of nonpharmacy clinic visits in a year prior, and hospital length of stay. The increasing age and number of emergency department and clinic visits were associated with higher odds of readmission. The longer the length of stay and those patients who were married had a lower odds of subsequent readmission. Other variables included were the presence of chronic renal disease, prior malignancy, nursing home residence, congestive heart failure, and prior use of oral corticosteroids. The C statistics for the derivation and validation models were 0.615 and 0.613, respectively. There were no significant differences in any of the variables between the derivation and validation cohorts.
| Predictors | OR | 95% CI | P Value | |
|---|---|---|---|---|
| Lower | Upper | |||
| ||||
| Sociodemographics | ||||
| Age at admission | 1.01 | 1.00 | 1.02 | <0.01 |
| White | 1.14 | 1.02 | 1.28 | 0.02 |
| Nonwhiteb | 1.00 | |||
| Hispanic | 1.26 | 1.07 | 1.47 | 0.01 |
| Not Hispanicc | 1.00 | |||
| Married | 0.89 | 0.82 | 0.96 | <0.01 |
| Not marriedd | 1.00 | |||
| Nursing home residence | 1.68 | 1.18 | 2.39 | <0.01 |
| Comorbid illnesses | ||||
| Peptic ulcer disease | 1.24 | 1.02 | 1.50 | 0.03 |
| Chronic renal disease | 1.18 | 1.06 | 1.33 | <0.01 |
| Any prior malignancy | 1.17 | 1.06 | 1.28 | <0.01 |
| Metastatic solid tumor | 1.20 | 0.98 | 1.47 | 0.08 |
| AIDS | 1.99 | 1.06 | 3.74 | 0.03 |
| Index admission factors | ||||
| Heart failure on initial admission | 1.18 | 1.07 | 1.29 | <0.01 |
| Length of stay (per day) | 0.97 | 0.97 | 0.98 | <0.01 |
| Medication history | ||||
| Cardiovascular drug count 90 days prior | 1.03 | 1.00 | 1.06 | 0.02 |
| Oral corticosteroids 90 days prior | 1.16 | 1.06 | 1.27 | <0.01 |
| Prior medical utilization | ||||
| Number of emergency department visits within 1 year | 1.04 | 1.02 | 1.06 | <0.01 |
| Number of specialty clinic visits within 1 year | 1.01 | 1.00 | 1.02 | 0.01 |
| Prior hospital admission within 90 days | 1.60 | 1.46 | 1.75 | <0.01 |
| Number of nonpharmacy clinic visits within 1 year | 1.00 | 1.00 | 1.01 | <0.01 |
Figure 1 shows that the derivation and validation models are similar in percent rehospitalization group in all severity groups.
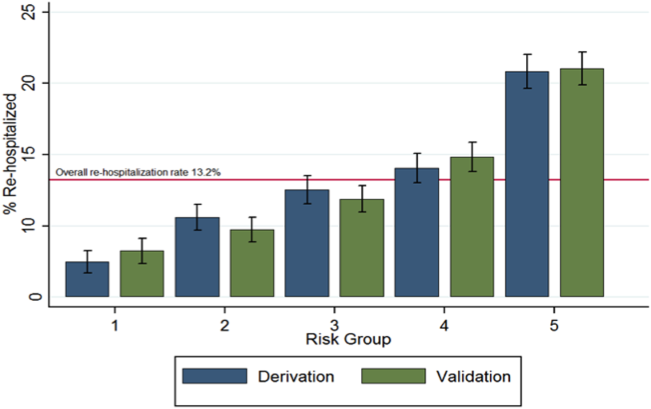
DISCUSSION
Sociodemographics and comorbidities, which are host factors, were significantly associated with rehospitalization of elderly patients admitted for pneumonia and length of hospital stay, the only pneumonia‐specific variable associated with readmission.[6, 14, 15, 16] Higher rates of all types of prior utilization (inpatient, outpatient, emergency department visits) were also associated with higher risk of rehospitalization. Our findings highlight the role that host factors play in rehospitalization of elderly patients with pneumonia and that there are few potentially modifiable targets to help reduce readmissions after pneumonia.
These findings may indicate 2 things: patients in this cohort are sicker than the general population at baseline and therefore require more medical care, and/or they are being evaluated by more providers increasing the chance they will be readmitted. For the former, an example is the association of prior use of oral corticosteroids with rehospitalization, which may demonstrate poorly controlled comorbidities (eg, chronic obstructive lung disease with recent exacerbation) that require steroid use. Given the VA's integrated healthcare system, greater access to primary care providers may lead to more opportunities for patients to voice their complaints, which can lead to more readmissions among severely ill patients. Weinberger et al. found an increase in hospital readmissions with increased access to primary care.[17] The association of readmission and length of stay is less likely related to pneumonia‐related clinical instabilities on discharge, but rather to the ability to address other potential issues related to the patient's underlying comorbidities.[5]
Our study presents a model looking at rehospitalization of patients with pneumonia, including factors not addressed in a prior publication by Lindenauer et al., the model Centers for Medicare and Medicaid Services (CMS) uses to predict early rehospitalization.[18] Lindenauer's model included 39 variables (of which 37 were clinical variables), including vertebral fractures, other injuries, other gastrointestinal disorders, other urinary tract disorders, as well as demographic and comorbidity factors that were similar to some of those included in our study. Their 30‐day rehospitalization medical record and administrative models had a C statistic of 0.59 and 0.63, respectively. A major difference between our presented model and the latter are the data on utilization of medical care. Despite these additional data, the resulting C statistics of 0.615 and 0.613 were not qualitatively better.
The similar C statistics demonstrates that factors playing a significant role in determining rehospitalization have yet to be identified, and it is not clear if researchers will be able to identify potentially modifiable risk factors for rehospitalization. Examples of other potential factors that should be examined in future studies include family/community support, quality of the transition of care back to their residence, and quality of inpatient care. Calvillo‐King et al. found a broad range of social factors that potentially affect the risk of postdischarge readmission for chronic heart failure.[19] For pneumonia, there were few studies that assessed the risk of social factors on readmission, and these were most commonly rather broad categories such as race/ethnicity or nursing home residence. In the publications that studied social factors and readmissions, there were inconsistent associations between hospital readmission with lower education, low income, and unemployment. Future articles may benefit from taking these additional factors into account.
Potential limitations to our study include the overwhelming majority of patients being male and in a VA population, which may limit generalizability. In addition, no data were available on the quality of the transition of care. Furthermore, limitations include the age of the data and the lack of evaluation of outpatient follow‐up and antibiotics on discharge. Though our data are up to 10 years old, this study evaluates risk factors that are still relevant. Finally, some variables noted in the CMS model were not evaluated in our study, such as protein‐calorie malnutrition, skin ulcers, and fracture history. Given these differences, we were unable to directly compare the performance of the 2 models.
Despite examining novel factors related to prior healthcare utilization, our model still performed suboptimally in identifying subjects at risk for rehospitalization after pneumonia. Future studies need to examine other social factors and patient frailty that may increase the risk of readmissions, as well as examine the impact of clinical stability on discharge. It remains to be determined if readmissions after pneumonia are truly preventable or mostly attributable to the patient's prior health status.
Disclosures: The project described was supported by grant number R01NR010828 from the National Institute of Nursing Research. The content is solely the responsibility of the authors and does not necessarily represent the official views of the National Institute of Nursing Research or the National Institutes of Health. This material is the result of work supported with resources and the use of facilities at the VA North Texas Health Care System. Funding agencies had no role in conducting the study, or role in the preparation, review, or approval of the manuscript. The views expressed in this article are those of the authors and do not necessarily represent the views of the Department of Veterans Affairs.
- , , , et al. Incidence and cost of pneumonia in Medicare beneficiaries. Chest. 2012;142(4):973–981.
- , , . Rehospitalizations among patients in the Medicare fee‐for‐service program. N Engl J Med. 2009;360(14):1418–1428.
- , , , et al. A prospective cohort study of healthcare visits and rehospitalizations after discharge of patients with community‐acquired pneumonia. Respirology. 2011;16(7):1119–1126.
- , , , et al. Pneumonia: criteria for patient instability on hospital discharge. Chest. 2008;134(3):595–600.
- , , , et al. Instability on hospital discharge and the risk of adverse outcomes in patients with pneumonia. Arch Intern Med. 2002;162(11):1278–1284.
- , , , et al. Causes and risk factors for rehospitalization of patients hospitalized with community‐acquired pneumonia. Clin Infect Dis. 2008;46(4):550–556.
- , , , et al. Population‐based study of statins, angiotensin II receptor blockers, and angiotensin‐converting enzyme inhibitors on pneumonia‐related outcomes. Clin Infect Dis. 2012;55(11):1466–1473.
- , , , et al. Quality of care, process, and outcomes in elderly patients with pneumonia. JAMA. 1997;278(23):2080–2084.
- U.S. Department of Veterans Affairs. Health benefits. Priority groups table. Available at: http://www.va.gov/healthbenefits/resources/priority_groups.asp. Accessed July 1, 2013.
- , , , et al. Validation of a combined comorbidity index. J Clin Epidemiol. 1994;47(11):1245–1251.
- , , , et al. Incidence of cardiovascular events after hospital admission for pneumonia. Am J Med. 2011;124(3):244–251.
- , , , et al. Diagnosis of pulmonary malignancy after hospitalization for pneumonia. Am J Med. 2010;123(1):66–71.
- MedPAC. 2013 [cited 2013 June 11]; Available from: http://www.hospitalcompare.gov.
- , , . The relationship between hospital admission rates and rehospitalizations. N Engl J Med. 2011;365(24):2287–2295.
- , , , et al. Predictors of short‐term rehospitalization following discharge of patients hospitalized with community‐acquired pneumonia. Chest. 2009;136(4):1079–1085.
- , , , et al. Effects of previous influenza vaccination on subsequent readmission and mortality in elderly patients hospitalized with pneumonia. Am J Med. 2003;115(6):454–461.
- , , . Does increased access to primary care reduce hospital readmissions? N Engl J Med. 1996;334(22):1441–1447.
- , , , et al. Development, validation, and results of a measure of 30‐day readmission following hospitalization for pneumonia. J Hosp Med. 2011;6(3):142–150.
- , , , et al. Impact of social factors on risk of readmission or mortality in pneumonia and heart failure: systematic review. J Gen Intern Med. 2013;28(2):269–282.
Pneumonia remains a significant problem in the United States, both in terms of mortality as well as cost to the healthcare system. Each year, over 1 million patients are hospitalized for pneumonia, with costs conservatively estimated at more than $7 billion in 2010.[1] One contributing factor for these costs is that pneumonia is the second most frequent reason for rehospitalization.[2] Rehospitalization after admission for pneumonia is now used as a marker for quality of care.
Given the cost and adverse outcomes of pneumonia, it is important to examine early rehospitalization to better understand what factors play a role. Studies have examined factors associated with readmission following an initial pneumonia‐related hospitalization. Adamuz et al. showed that additional healthcare visits and rehospitalizations within 30 days of discharge from the hospital were common and were associated with worsening of signs or symptoms of pneumonia and/or comorbidities.[3] Other studies demonstrated that instability on hospital discharge, as well as treatment failure, were associated with increased risk of rehospitalization.[4, 5] Jasti et al. found rehospitalizations following pneumonia were usually comorbidity related, primarily cardiopulmonary and/or neurologic disease, rather than due to the index pneumonia.[6] Many of these studies, and others looking at age, activity of daily living score, socioeconomic status, and comorbidity characteristics, were performed in relatively small cohorts. Predictors of rehospitalization have not been studied in a large cohort of patients in an integrated healthcare system.
Our study looks at factors not addressed in prior studies that have used administrative claims data to identify factors associated with early readmission. We also evaluated these admission risk factors in a veteran population, whereas prior studies have primarily focused on those who receive Medicare. The purpose of this study was to examine predictors of early (30 days) readmission in the Veterans Affairs (VA) healthcare system for patients age 65 years and older hospitalized for pneumonia. Our a priori hypothesis was that comorbid illnesses, such as congestive heart failure and chronic obstructive pulmonary disease, and patients with high medical complexity, such as high number of medications and/or prior hospitalizations and nursing home residence, are the primary factors associated with increased risk of rehospitalization.
METHODS
For this national cohort study, we used data from the VA healthcare system administrative and clinical databases that serve as repositories of clinical data from more than 150 VA hospitals and 850 outpatient clinics throughout the United States. The institutional review boards of the University of Texas Health Science Center at San Antonio and VA North Texas Health Care System approved this study. Details regarding the study design and methods were previously published.[7]
Inclusion Criteria
Patients included in this study were hospitalized between October 2001 and September 2007, had a primary diagnosis of pneumonia/emnfluenza (International Classification of Diseases, 9th Revision [ICD‐9] codes 480.0483.99 or 485487) or a secondary discharge diagnosis of pneumonia with a primary diagnosis of respiratory failure (ICD‐9 code 518.81) or sepsis (ICD‐9 code 038.xx),[8] and were aged 65 years or older on the date of admission. To ensure patients obtained their care primarily at the VA, at least 1 VA outpatient clinic visit in the year preceding the index admission and at least 1 active and filled outpatient medication from a VA pharmacy within 90 days of admission were required for inclusion.
If a patient was admitted more than once during the study period, only the first hospitalization was included as the index admission.
Exclusion Criteria
Patients who died during the initial hospitalization were not included in this study. Patients admitted to hospitals with fewer than 25 reported hospitalizations during October 2001 to September 2007 were excluded, as these hospitals are neither representative nor generalizable. This resulted in the removal of 59 patients from 5 different hospitals.
Data Sources and Definitions
We used inpatient and outpatient demographic, utilization, and comorbidity data from the National Patient Care Database. Pharmacy data were extracted from the Decision Support System National Data Extracts and Pharmacy Benefits Management. Vital status information was obtained from the Vital Status file, which incorporates data from veterans' death benefits claims, inpatient deaths, Medicare Vital Status files, and the Social Security Administration's death master file. We used encrypted patient identifiers link to information across these databases.
We obtained demographic information (age, sex, race, marital status) from inpatient and outpatient data. We categorized race as white, black, Hispanic, and other/unknown. To infer active smoking and/or tobacco cessation attempts, we identified ICD‐9 codes for tobacco use (305.1, V15.82), smoking cessation clinic use, and/or use of medications for the treatment of nicotine dependence (Zyban, nicotine replacement, or varenicline). We used VA priority status as a proxy for socioeconomic and disability status. VA priority groups are a way for the VA to focus limited funds to those veterans most in need. The highest group (priority group 1) must have at least a 50% service‐connected disability. Priority groups 2 through 6 include veterans with up to 40% service‐connected disability, former prisoners of war, those awarded certain honors, veterans with lower incomes, and the catastrophically disabled. The lowest groups (priority groups 7 and 8) include veterans with relatively higher incomes who agree to pay copayments.[9]
We also obtained information on comorbid conditions from inpatient and outpatient administrative data. We defined alcohol abuse using ICD‐9 codes 291, 303, 305.0, and illicit drug use with ICD‐9 codes 292, 304, 305 excluding 305.0‐.1. We used the Charlson Comorbidity Index to quantify levels of preexisting comorbidity[10] adapted for administrative databases, using ICD‐9 codes for 19 comorbid conditions from prior outpatient and inpatient encounters. We defined cardiovascular events and lung cancer that were diagnosed during the hospitalization as previously described.[11, 12]
Outcomes
Our primary study outcome was readmission within 30 days of hospital discharge for pneumonia from any VA acute care hospital only. Medicare has used 30‐day readmission as a quality indicator, as readmissions that occur closer to discharge are believed to be more likely due to events during the index hospitalization.[13]
Statistical Analyses
We randomly divided patients from our initial cohort into equal derivation or validation cohorts. We assessed differences between the 2 groups using the Student t test for continuous variables and 2 test for categorical variables. We performed univariate logistic regression analyses in the derivation cohort to examine the relationship between 30‐day rehospitalization and each of our potential covariates. We entered covariates that were significant at P<0.10 in the univariate analyses into a multiple regression model. Significant covariates at P<0.10 were then entered into the final model. For this model, we used bootstrapping with replacement in 1000 replications to obtain standard errors of our coefficients and associated P values. Because some subjects had more than 1 index admission, we used robust variancecovariance matrix estimators to compute standard errors for model coefficients.
We used the C statistic to assess the discrimination of our model. Calibration of this model was measured using the Hosmer‐Lemeshow 2 goodness of fit test, using 10 quantiles to group the data. We evaluated differences in discrimination between the derivation and validation cohorts by comparing C statistics.
Last, using the final model in the derivation cohort, 5 categories of severity were created based on subjects' predicted risk values for readmission. Severity categories in both the derivation and validation cohorts were then graphically evaluated.
We defined statistical significance as a 2‐tailed P value of <0.05. We used Stata 12 (StataCorp, College Station, TX) for all analyses.
RESULTS
Patient Characteristics
Of the 45,134 eligible patients, 13.2% were rehospitalized within 30 days, and rates by hospital ranged from 1.6% to 20.7%. Table 1 presents the comparison of baseline difference between the derivation and validation cohorts. There were no statistically significant differences between the 2 groups. Overall, the mean age was 77 years, 98% were male, and 54% were married. Over 90% of the patients received guideline‐concordant antibiotics, and only 10% required a stay in the intensive care unit (ICU). The average length of stay was 7 days (standard deviation of 11 days).
| Characteristics | Derivation Cohort, N=22,567 | Validation Cohort, N=22,567 | P Value |
|---|---|---|---|
| |||
| Sociodemographics | |||
| Age, mean (SD) | 77.3 (6.5) | 77.2 (6.5) | 0.30 |
| Male, no (%) | 22,133 (98.1) | 22,175 (98.3) | 0.14 |
| White, no (%) | 18,858 (83.6) | 18,719 (83.0) | 0.08 |
| Black, no (%) | 2,562 (11.4) | 2,583 (11.5) | 0.76 |
| Hispanic, no (%) | 1,337 (5.9) | 1,414 (6.3) | 0.13 |
| Married, no (%) | 12,166 (53.9) | 12,258 (54.3) | 0.39 |
| VA priority group, no (%) | 0.28 | ||
| 1 | 4,286 (19.0) | 4,281 (19.0) | |
| 26 | 16,306 (72.3) | 16,399 (72.8) | |
| 78 | 1,954 (8.7) | 1,860 (8.3) | |
| Nursing home residence, no (%) | 199 (0.9) | 216 (1.0) | 0.41 |
| Smoker status, no (%) | 8,579 (38.0) | 8,677 (38.5) | 0.34 |
| Index hospitalization factors | |||
| Myocardial infarction during hospitalization, no (%) | 469 (2.1) | 452 (2.0) | 0.57 |
| Heart failure during hospitalization, no (%) | 4,817 (21.4) | 4,772 (21.2) | 0.61 |
| Arrhythmia during hospitalization, no (%) | 4,356 (19.3) | 4,287 (19.0) | 0.41 |
| Length of stay, mean (SD) | 7.2 (10.4) | 7.2 (11.7) | 0.76 |
| Lung cancer diagnosis during hospitalization, no (%) | 31 (0.1) | 31 (0.1) | 1.00 |
| ICU admission, no (%) | 2,282 (10.1) | 2,336 (10.4) | 0.40 |
| Guideline concordant antibiotics, no (%) | 20,724 (91.8) | 20,643 (91.5) | 0.17 |
| Invasive mechanical ventilation, no (%) | 793 (3.5) | 832 (3.7) | 0.32 |
| Vasopressor use, no (%) | 495 (2.2) | 489 (2.2) | 0.85 |
| Hospital complications, no (%) | |||
| Renal organ failure | 2,671 (11.8) | 2,640 (11.7) | 0.65 |
| Cardiac organ failure | 1,004 (4.5) | 959 (4.3) | 0.30 |
| Hepatic organ failure | 33 (0.2) | 40 (0.2) | 0.41 |
| Respiratory organ failure | 1,623 (7.2) | 1,583 (7.0) | 0.46 |
| Comorbid illnesses | |||
| Medical, no (%) | |||
| Myocardial infarction | 1,528 (6.8) | 1,542 (6.8) | 0.79 |
| Congestive heart failure | 5,815 (25.8) | 5,697 (25.2) | 0.20 |
| Peripheral vascular disease | 3,413 (15.1) | 3,454 (15.3) | 0.59 |
| Cerebrovascular disease | 3,993 (17.7) | 4,078 (18.1) | 0.30 |
| Dementia | 1,141 (5.1) | 1,110 (4.9) | 0.50 |
| COPD | 12,168 (53.9) | 12,076 (53.5) | 0.39 |
| Rheumatologic disease | 646 (2.9) | 660 (2.9) | 0.69 |
| Peptic ulcer disease | 795 (3.5) | 723 (3.2) | 0.06 |
| Severe liver disease | 169 (0.8) | 169 (0.8) | 1.00 |
| Mild liver disease | 78 (0.4) | 80 (0.4) | 0.87 |
| Diabetes | 7,310 (32.4) | 7,410 (32.8) | 0.32 |
| Diabetes with complications | 2,229 (9.9) | 2,248 (10.0) | 0.77 |
| Chronic renal disease | 2,836 (12.6) | 2,745 (12.2) | 0.19 |
| Hemi/paraplegia | 319 (1.4) | 338 (1.5) | 0.46 |
| Any prior malignancy | 5,226 (23.2) | 5,269 (23.4) | 0.63 |
| Metastatic solid tumor | 748 (3.3) | 795 (3.5) | 0.22 |
| AIDS | 56 (0.3) | 49 (0.2) | 0.49 |
| HIV | 23 (0.1) | 13 (0.1) | 0.10 |
| Alcohol abuse | 897 (4.0) | 934 (4.1) | 0.38 |
| Drug abuse | 254 (1.1) | 255 (1.1) | 0.96 |
| Psychiatric, no (%) | |||
| Anxiety disorder | 1,692 (7.5) | 1,722 (7.6) | 0.59 |
| Depression indicator | 3,655 (16.2) | 3,718 (16.5) | 0.42 |
| Bipolar disorder | 430 (1.9) | 433 (1.9) | 0.92 |
| Cataract indicator | 6,106 (27.1) | 6,180 (27.4) | 0.43 |
| Prostatitis indicator | 4,680 (20.7) | 4,593 (20.4) | 0.31 |
| Schizophrenia indicator | 685 (3.0) | 676 (3.0) | 0.80 |
| Post‐traumatic stress disorder | 844 (3.7) | 862 (3.8) | 0.66 |
| Medication history within 90 days | |||
| Cardiovascular drugs, mean (SD) | 1.8 (1.6) | 1.8 (1.6) | 0.65 |
| Diabetes drugs, mean (SD) | 0.3 (0.7) | 0.3 (0.7) | 0.60 |
| Inhaled corticosteroids, mean (SD) | 0.4 (0.9) | 0.4 (0.9) | 0.28 |
| Pulmonary drug, mean (SD) | 1.3 (2.0) | 1.3 (2.0) | 0.36 |
| Oral corticosteroids, no (%) | 5,363 (23.8) | 5,505 (24.4) | 0.12 |
| Prior medical utilization | |||
| Number of primary care clinic visits within 1 year, mean (SD) | 4.9 (4.2) | 4.9 (4.2) | 0.67 |
| Number of emergency department visits within 1 year, mean (SD) | 1.2 (2.0) | 1.2 (2.0) | 0.86 |
| Number of outpatient clinic visits within 1 year, mean (SD) | 14.7 (13.1) | 14.6 (13.0) | 0.33 |
| Number of specialty clinic visits within 1 year, mean (SD) | 3.4 (5.5) | 3.3 (5.4) | 0.50 |
| Prior hospital admission within 90 days, no (%) | 5,062 (22.4) | 5,141 (22.8) | 0.37 |
Predictors of 30‐Day Readmission
All variables listed in Table 1 were evaluated. The derivation logistic regression model is shown in Table 2, and only includes predictors associated with rehospitalization. Antibiotic concordance and time in the ICU were evaluated and did not predict readmission. Variables that were significantly associated with rehospitalization in the models included age, marital status, the number of emergency department clinic visits a year prior, prior admission within 90 days, number of nonpharmacy clinic visits in a year prior, and hospital length of stay. The increasing age and number of emergency department and clinic visits were associated with higher odds of readmission. The longer the length of stay and those patients who were married had a lower odds of subsequent readmission. Other variables included were the presence of chronic renal disease, prior malignancy, nursing home residence, congestive heart failure, and prior use of oral corticosteroids. The C statistics for the derivation and validation models were 0.615 and 0.613, respectively. There were no significant differences in any of the variables between the derivation and validation cohorts.
| Predictors | OR | 95% CI | P Value | |
|---|---|---|---|---|
| Lower | Upper | |||
| ||||
| Sociodemographics | ||||
| Age at admission | 1.01 | 1.00 | 1.02 | <0.01 |
| White | 1.14 | 1.02 | 1.28 | 0.02 |
| Nonwhiteb | 1.00 | |||
| Hispanic | 1.26 | 1.07 | 1.47 | 0.01 |
| Not Hispanicc | 1.00 | |||
| Married | 0.89 | 0.82 | 0.96 | <0.01 |
| Not marriedd | 1.00 | |||
| Nursing home residence | 1.68 | 1.18 | 2.39 | <0.01 |
| Comorbid illnesses | ||||
| Peptic ulcer disease | 1.24 | 1.02 | 1.50 | 0.03 |
| Chronic renal disease | 1.18 | 1.06 | 1.33 | <0.01 |
| Any prior malignancy | 1.17 | 1.06 | 1.28 | <0.01 |
| Metastatic solid tumor | 1.20 | 0.98 | 1.47 | 0.08 |
| AIDS | 1.99 | 1.06 | 3.74 | 0.03 |
| Index admission factors | ||||
| Heart failure on initial admission | 1.18 | 1.07 | 1.29 | <0.01 |
| Length of stay (per day) | 0.97 | 0.97 | 0.98 | <0.01 |
| Medication history | ||||
| Cardiovascular drug count 90 days prior | 1.03 | 1.00 | 1.06 | 0.02 |
| Oral corticosteroids 90 days prior | 1.16 | 1.06 | 1.27 | <0.01 |
| Prior medical utilization | ||||
| Number of emergency department visits within 1 year | 1.04 | 1.02 | 1.06 | <0.01 |
| Number of specialty clinic visits within 1 year | 1.01 | 1.00 | 1.02 | 0.01 |
| Prior hospital admission within 90 days | 1.60 | 1.46 | 1.75 | <0.01 |
| Number of nonpharmacy clinic visits within 1 year | 1.00 | 1.00 | 1.01 | <0.01 |
Figure 1 shows that the derivation and validation models are similar in percent rehospitalization group in all severity groups.
DISCUSSION
Sociodemographics and comorbidities, which are host factors, were significantly associated with rehospitalization of elderly patients admitted for pneumonia and length of hospital stay, the only pneumonia‐specific variable associated with readmission.[6, 14, 15, 16] Higher rates of all types of prior utilization (inpatient, outpatient, emergency department visits) were also associated with higher risk of rehospitalization. Our findings highlight the role that host factors play in rehospitalization of elderly patients with pneumonia and that there are few potentially modifiable targets to help reduce readmissions after pneumonia.
These findings may indicate 2 things: patients in this cohort are sicker than the general population at baseline and therefore require more medical care, and/or they are being evaluated by more providers increasing the chance they will be readmitted. For the former, an example is the association of prior use of oral corticosteroids with rehospitalization, which may demonstrate poorly controlled comorbidities (eg, chronic obstructive lung disease with recent exacerbation) that require steroid use. Given the VA's integrated healthcare system, greater access to primary care providers may lead to more opportunities for patients to voice their complaints, which can lead to more readmissions among severely ill patients. Weinberger et al. found an increase in hospital readmissions with increased access to primary care.[17] The association of readmission and length of stay is less likely related to pneumonia‐related clinical instabilities on discharge, but rather to the ability to address other potential issues related to the patient's underlying comorbidities.[5]
Our study presents a model looking at rehospitalization of patients with pneumonia, including factors not addressed in a prior publication by Lindenauer et al., the model Centers for Medicare and Medicaid Services (CMS) uses to predict early rehospitalization.[18] Lindenauer's model included 39 variables (of which 37 were clinical variables), including vertebral fractures, other injuries, other gastrointestinal disorders, other urinary tract disorders, as well as demographic and comorbidity factors that were similar to some of those included in our study. Their 30‐day rehospitalization medical record and administrative models had a C statistic of 0.59 and 0.63, respectively. A major difference between our presented model and the latter are the data on utilization of medical care. Despite these additional data, the resulting C statistics of 0.615 and 0.613 were not qualitatively better.
The similar C statistics demonstrates that factors playing a significant role in determining rehospitalization have yet to be identified, and it is not clear if researchers will be able to identify potentially modifiable risk factors for rehospitalization. Examples of other potential factors that should be examined in future studies include family/community support, quality of the transition of care back to their residence, and quality of inpatient care. Calvillo‐King et al. found a broad range of social factors that potentially affect the risk of postdischarge readmission for chronic heart failure.[19] For pneumonia, there were few studies that assessed the risk of social factors on readmission, and these were most commonly rather broad categories such as race/ethnicity or nursing home residence. In the publications that studied social factors and readmissions, there were inconsistent associations between hospital readmission with lower education, low income, and unemployment. Future articles may benefit from taking these additional factors into account.
Potential limitations to our study include the overwhelming majority of patients being male and in a VA population, which may limit generalizability. In addition, no data were available on the quality of the transition of care. Furthermore, limitations include the age of the data and the lack of evaluation of outpatient follow‐up and antibiotics on discharge. Though our data are up to 10 years old, this study evaluates risk factors that are still relevant. Finally, some variables noted in the CMS model were not evaluated in our study, such as protein‐calorie malnutrition, skin ulcers, and fracture history. Given these differences, we were unable to directly compare the performance of the 2 models.
Despite examining novel factors related to prior healthcare utilization, our model still performed suboptimally in identifying subjects at risk for rehospitalization after pneumonia. Future studies need to examine other social factors and patient frailty that may increase the risk of readmissions, as well as examine the impact of clinical stability on discharge. It remains to be determined if readmissions after pneumonia are truly preventable or mostly attributable to the patient's prior health status.
Disclosures: The project described was supported by grant number R01NR010828 from the National Institute of Nursing Research. The content is solely the responsibility of the authors and does not necessarily represent the official views of the National Institute of Nursing Research or the National Institutes of Health. This material is the result of work supported with resources and the use of facilities at the VA North Texas Health Care System. Funding agencies had no role in conducting the study, or role in the preparation, review, or approval of the manuscript. The views expressed in this article are those of the authors and do not necessarily represent the views of the Department of Veterans Affairs.
- , , , et al. Incidence and cost of pneumonia in Medicare beneficiaries. Chest. 2012;142(4):973–981.
- , , . Rehospitalizations among patients in the Medicare fee‐for‐service program. N Engl J Med. 2009;360(14):1418–1428.
- , , , et al. A prospective cohort study of healthcare visits and rehospitalizations after discharge of patients with community‐acquired pneumonia. Respirology. 2011;16(7):1119–1126.
- , , , et al. Pneumonia: criteria for patient instability on hospital discharge. Chest. 2008;134(3):595–600.
- , , , et al. Instability on hospital discharge and the risk of adverse outcomes in patients with pneumonia. Arch Intern Med. 2002;162(11):1278–1284.
- , , , et al. Causes and risk factors for rehospitalization of patients hospitalized with community‐acquired pneumonia. Clin Infect Dis. 2008;46(4):550–556.
- , , , et al. Population‐based study of statins, angiotensin II receptor blockers, and angiotensin‐converting enzyme inhibitors on pneumonia‐related outcomes. Clin Infect Dis. 2012;55(11):1466–1473.
- , , , et al. Quality of care, process, and outcomes in elderly patients with pneumonia. JAMA. 1997;278(23):2080–2084.
- U.S. Department of Veterans Affairs. Health benefits. Priority groups table. Available at: http://www.va.gov/healthbenefits/resources/priority_groups.asp. Accessed July 1, 2013.
- , , , et al. Validation of a combined comorbidity index. J Clin Epidemiol. 1994;47(11):1245–1251.
- , , , et al. Incidence of cardiovascular events after hospital admission for pneumonia. Am J Med. 2011;124(3):244–251.
- , , , et al. Diagnosis of pulmonary malignancy after hospitalization for pneumonia. Am J Med. 2010;123(1):66–71.
- MedPAC. 2013 [cited 2013 June 11]; Available from: http://www.hospitalcompare.gov.
- , , . The relationship between hospital admission rates and rehospitalizations. N Engl J Med. 2011;365(24):2287–2295.
- , , , et al. Predictors of short‐term rehospitalization following discharge of patients hospitalized with community‐acquired pneumonia. Chest. 2009;136(4):1079–1085.
- , , , et al. Effects of previous influenza vaccination on subsequent readmission and mortality in elderly patients hospitalized with pneumonia. Am J Med. 2003;115(6):454–461.
- , , . Does increased access to primary care reduce hospital readmissions? N Engl J Med. 1996;334(22):1441–1447.
- , , , et al. Development, validation, and results of a measure of 30‐day readmission following hospitalization for pneumonia. J Hosp Med. 2011;6(3):142–150.
- , , , et al. Impact of social factors on risk of readmission or mortality in pneumonia and heart failure: systematic review. J Gen Intern Med. 2013;28(2):269–282.
2014 Society of Hospital Medicine. This article is a US government work and, as such, is in the public domain in the United States of America.
