User login
Incidence, predictors, and outcomes of hospital-acquired anemia
Hospital-acquired anemia (HAA) is defined as having a normal hemoglobin value upon admission but developing anemia during the course of hospitalization. The condition is common, with an incidence ranging from approximately 25% when defined by using the hemoglobin value prior to discharge to 74% when using the nadir hemoglobin value during hospitalization.1-5 While there are many potential etiologies for HAA, given that iatrogenic blood loss from phlebotomy may lead to its development,6,7 HAA has been postulated to be a hazard of hospitalization that is potentially preventable.8 However, it is unclear whether the development of HAA portends worse outcomes after hospital discharge.
The limited number of studies on the association between HAA and postdischarge outcomes has been restricted to patients hospitalized for acute myocardial infarction (AMI).3,9,10 Among this subpopulation, HAA is independently associated with greater morbidity and mortality following hospital discharge.3,9,10 In a more broadly representative population of hospitalized adults, Koch et al.2 found that the development of HAA is associated with greater length of stay (LOS), hospital charges, and inpatient mortality. However, given that HAA was defined by the lowest hemoglobin level during hospitalization (and not necessarily the last value prior to discharge), it is unclear if the worse outcomes observed were the cause of the HAA, rather than its effect, since hospital LOS is a robust predictor for the development of HAA, as well as a major driver of hospital costs and a prognostic marker for inpatient mortality.3,9 Furthermore, this study evaluated outcomes only during the index hospitalization, so it is unclear if patients who develop HAA have worse clinical outcomes after discharge.
Therefore, in this study, we used clinically granular electronic health record (EHR) data from a diverse cohort of consecutive medicine inpatients hospitalized for any reason at 1 of 6 hospitals to: 1) describe the epidemiology of HAA; 2) identify predictors of its development; and 3) examine its association with 30-day postdischarge adverse outcomes. We hypothesized that the development of HAA would be independently associated with 30-day readmission and mortality in a dose-dependent fashion, with increasing severity of HAA associated with worse outcomes.
METHODS
Study Design, Population, and Data Sources
We conducted a retrospective observational cohort study using EHR data collected from November 1, 2009 to October 30, 2010 from 6 hospitals in the north Texas region. One site was a university-affiliated safety-net hospital; the remaining 5 community hospitals were a mix of teaching and nonteaching sites. All hospitals used the Epic EHR system (Epic Systems Corporation, Verona, Wisconsin). Details of this cohort have been published.11,12This study included consecutive hospitalizations among adults age 18 years or older who were discharged from a medicine inpatient service with any diagnosis. We excluded hospitalizations by individuals who were anemic within the first 24 hours of admission (hematocrit less than 36% for women and less than 40% for men), were missing a hematocrit value within the first 24 hours of hospitalization or a repeat hematocrit value prior to discharge, had a hospitalization in the preceding 30 days (ie, index hospitalization was considered a readmission), died in the hospital, were transferred to another hospital, or left against medical advice. For individuals with multiple eligible hospitalizations during the study period, we included only the first hospitalization. We also excluded those discharged to hospice, given that this population of individuals may have intentionally desired less aggressive care.
Definition of Hospital-Acquired Anemia
HAA was defined as having a normal hematocrit value (36% or greater for women and 40% or greater for men) within the first 24 hours of admission and a hematocrit value at the time of hospital discharge lower than the World Health Organization’s sex-specific cut points.13 If there was more than 1 hematocrit value on the same day, we chose the lowest value. Based on prior studies, HAA was further categorized by severity as mild (hematocrit greater than 33% and less than 36% in women; and greater than 33% and less than 40% in men), moderate (hematocrit greater than 27% and 33% or less for all), or severe (hematocrit 27% or less for all).2,14
Characteristics
We extracted information on sociodemographic characteristics, comorbidities, LOS, procedures, blood transfusions, and laboratory values from the EHR. Hospitalizations in the 12 months preceding the index hospitalization were ascertained from the EHR and from an all-payer regional hospitalization database that captures hospitalizations from 75 acute care hospitals within a 100-mile radius of Dallas-Fort Worth. International Classification of Diseases, Ninth Revision, Clinical Modification (ICD-9-CM) discharge diagnosis codes were categorized according to the Agency for Healthcare Research and Quality (AHRQ) Clinical Classifications Software (CCS).15 We defined a diagnosis for hemorrhage and coagulation, and hemorrhagic disorder as the presence of any ICD-9-CM code (primary or secondary) that mapped to the AHRQ CCS diagnoses 60 and 153, and 62, respectively. Procedures were categorized as minor diagnostic, minor therapeutic, major diagnostic, and major therapeutic using the AHRQ Healthcare Cost and Utilization Procedure Classes tool.16
Outcomes
The primary outcome was a composite of death or readmission within 30 days of hospital discharge. Hospital readmissions were ascertained at the index hospital and at any of 75 acute care hospitals in the region as described earlier. Death was ascertained from each of the hospitals’ EHR and administrative data and the Social Security Death Index. Individuals who had both outcomes (eg, a 30-day readmission and death) were considered to have only 1 occurrence of the composite primary outcome measure. Our secondary outcomes were death and readmission within 30 days of discharge, considered as separate outcomes.
Statistical Analysis
We used logistic regression models to evaluate predictors of HAA and to estimate the association of HAA on subsequent 30-day adverse outcomes after hospital discharge. All models accounted for clustering of patients by hospital. For the outcomes analyses, models were adjusted for potential confounders based on prior literature and our group’s expertise, which included age, sex, race/ethnicity, Charlson comorbidity index, prior hospitalizations, nonelective admission status, creatinine level on admission, blood urea nitrogen (BUN) to creatinine ratio of more than 20:1 on admission, LOS, receipt of a major diagnostic or therapeutic procedure during the index hospitalization, a discharge diagnosis for hemorrhage, and a discharge diagnosis for a coagulation or hemorrhagic disorder. For the mortality analyses, given the limited number of 30-day deaths after hospital discharge in our cohort, we collapsed moderate and severe HAA into a single category. In sensitivity analyses, we repeated the adjusted model, but excluded patients in our cohort who had received at least 1 blood transfusion during the index hospitalization (2.6%) given its potential for harm, and patients with a primary discharge diagnosis for AMI (3.1%).17
The functional forms of continuous variables were assessed using restricted cubic splines and locally weighted scatterplot smoothing techniques. All analyses were performed using STATA statistical software version 12.0 (StataCorp, College Station, Texas). The University of Texas Southwestern Medical Center institutional review board approved this study.

RESULTS
Of 53,995 consecutive medicine hospitalizations among adults age 18 years or older during our study period, 11,309 index hospitalizations were included in our study cohort (Supplemental Figure 1). The majority of patients excluded were because of having documented anemia within the first 24 hours of admission (n=24,950). With increasing severity of HAA, patients were older, more likely to be female, non-Hispanic white, electively admitted, have fewer comorbidities, less likely to be hospitalized in the past year, more likely to have had a major procedure, receive a blood transfusion, have a longer LOS, and have a primary or secondary discharge diagnosis for a hemorrhage or a coagulation or hemorrhagic disorder (Table 1).

Epidemiology of HAA
Among this cohort of patients without anemia on admission, the median hematocrit value on admission was 40.6 g/dL and on discharge was 38.9 g/dL. One-third of patients with normal hematocrit value at admission developed HAA, with 21.6% developing mild HAA, 10.1% developing moderate HAA, and 1.4% developing severe HAA. The median discharge hematocrit value was 36 g/dL (interquartile range [IQR]), 35-38 g/dL) for the group of patients who developed mild HAA, 31 g/dL (IQR, 30-32 g/dL) for moderate HAA, and 26 g/dL (IQR, 25-27 g/dL) for severe HAA (Supplemental Figure 2). Among the severe HAA group, 135 of the 159 patients (85%) had a major procedure (n=123, accounting for 219 unique major procedures), a diagnosis for hemorrhage (n=30), and/or a diagnosis for a coagulation or hemorrhagic disorder (n=23) during the index hospitalization. Of the 219 major procedures among patients with severe HAA, most were musculoskeletal (92 procedures), cardiovascular (61 procedures), or digestive system-related (41 procedures). The most common types of procedures were coronary artery bypass graft (36 procedures), hip replacement (25 procedures), knee replacement (17 procedures), and femur fracture reduction (15 procedures). The 10 most common principal discharge diagnoses of the index hospitalization by HAA group are shown in Supplemental Table 1. For the severe HAA group, the most common diagnosis was hip fracture (20.8%).
Predictors of HAA
Compared to no or mild HAA, female sex, elective admission status, serum creatinine on admission, BUN to creatinine ratio greater than 20 to 1, hospital LOS, and undergoing a major diagnostic or therapeutic procedure were predictors for the development of moderate or severe HAA (Table 2). The model explained 23% of the variance (McFadden’s pseudo R2).

Incidence of Postdischarge Outcomes by Severity of HAA
The severity of HAA was associated with a dose-dependent increase in the incidence of 30-day adverse outcomes, such that patients with increasing severity of HAA had greater 30-day composite, mortality, and readmission outcomes (P < 0.001; Figure). The 30-day postdischarge composite outcome was primarily driven by hospital readmissions given the low mortality rate in our cohort. Patients who did not develop HAA had an incidence of 9.7% for the composite outcome, whereas patients with severe HAA had an incidence of 16.4%. Among the 24 patients with severe HAA but who had not undergone a major procedure or had a discharge diagnosis for hemorrhage or for a coagulation or hemorrhagic disorder, only 3 (12.5%) had a composite postdischarge adverse outcome (2 readmissions and 1 death). The median time to readmission was similar between groups, but more patients with severe HAA had an early readmission within 7 days of hospital discharge than patients who did not develop HAA (6.9% vs. 2.9%, P = 0.001; Supplemental Table 2).
Association of HAA and Postdischarge Outcomes
In unadjusted analyses, compared to not developing HAA, mild, moderate, and severe HAA were associated with a 29%, 61%, and 81% increase in the odds for a composite outcome, respectively (Table 3). After adjustment for confounders, the effect size for HAA attenuated and was no longer statistically significant for mild and moderate HAA. However, severe HAA was significantly associated with a 39% increase in the odds for the composite outcome and a 41% increase in the odds for 30-day readmission (P = 0.008 and P = 0.02, respectively).

In sensitivity analyses, the exclusion of individuals who received at least 1 blood transfusion during the index hospitalization (n=298) and individuals who had a primary discharge diagnosis for AMI (n=353) did not substantively change the estimates of the association between severe HAA and postdischarge outcomes (Supplemental Tables 3 and 4). However, because of the fewer number of adverse events for each analysis, the confidence intervals were wider and the association of severe HAA and the composite outcome and readmission were no longer statistically significant in these subcohorts.
DISCUSSION
In this large and diverse sample of medical inpatients, we found that HAA occurs in one-third of adults with normal hematocrit value at admission, where 10.1% of the cohort developed moderately severe HAA and 1.4% developed severe HAA by the time of discharge. Length of stay and undergoing a major diagnostic or therapeutic procedure were the 2 strongest potentially modifiable predictors of developing moderate or severe HAA. Severe HAA was independently associated with a 39% increase in the odds of being readmitted or dying within 30 days after hospital discharge compared to not developing HAA. However, the associations between mild or moderate HAA with adverse outcomes were attenuated after adjusting for confounders and were no longer statistically significant.
To our knowledge, this is the first study on the postdischarge adverse outcomes of HAA among a diverse cohort of medical inpatients hospitalized for any reason. In a more restricted population, Salisbury et al.3 found that patients hospitalized for AMI who developed moderate to severe HAA (hemoglobin value at discharge of 11 g/dL or less) had greater 1-year mortality than those without HAA (8.4% vs. 2.6%, P < 0.001), and had an 82% increase in the hazard for mortality (95% confidence interval, hazard ratio 1.11-2.98). Others have similarly shown that HAA is common among patients hospitalized with AMI and is associated with greater mortality.5,9,18 Our study extends upon this prior research by showing that severe HAA increases the risk for adverse outcomes for all adult inpatients, not only those hospitalized for AMI or among those receiving blood transfusions.
Despite the increased harm associated with severe HAA, it is unclear whether HAA is a preventable hazard of hospitalization, as suggested by others.6,8 Most patients in our cohort who developed severe HAA underwent a major procedure, had a discharge diagnosis for hemorrhage, and/or had a discharge diagnosis for a coagulation or hemorrhagic disorder. Thus, blood loss due to phlebotomy, 1 of the more modifiable etiologies of HAA, was unlikely to have been the primary driver for most patients who developed severe HAA. Since it has been estimated to take 15 days of daily phlebotomy of 53 mL of whole blood in females of average body weight (and 20 days for average weight males) with no bone marrow synthesis for severe anemia to develop, it is even less likely that phlebotomy was the principal etiology given an 8-day median LOS among patients with severe HAA.19,20 However, since the etiology of HAA can be multifactorial, limiting blood loss due to phlebotomy by using smaller volume tubes, blood conservation devices, or reducing unnecessary testing may mitigate the development of severe HAA.21,22 Additionally, since more than three-quarters of patients who developed severe HAA underwent a major procedure, more care and attention to minimizing operative blood loss could lessen the severity of HAA and facilitate better recovery. If minimizing blood loss is not feasible, in the absence of symptoms related to anemia or ongoing blood loss, randomized controlled trials overwhelmingly support a restrictive transfusion strategy using a hemoglobin value threshold of 7 mg/dL, even in the postoperative setting.23-25
The implications of mild to moderate HAA are less clear. The odds ratios for mild and moderate HAA, while not statistically significant, suggest a small increase in harm compared to not developing HAA. Furthermore, the upper boundary of the confidence intervals for mild and moderate HAA cannot exclude a possible 30% and 56% increase in the odds for the 30-day composite outcome, respectively. Thus, a better powered study, including more patients and extending the time interval for ascertaining postdischarge adverse events beyond 30 days, may reveal a harmful association. Lastly, our study assessed only the association of HAA with 30-day readmission and mortality. Examining the association between HAA and other patient-centered outcomes such as fatigue, functional impairment, and prolonged posthospitalization recovery time may uncover other important adverse effects of mild and moderate HAA, both of which occur far more frequently than severe HAA.
Our findings should be interpreted in the context of several limitations. First, although we included a diverse group of patients from a multihospital cohort, generalizability to other settings is uncertain. Second, as this was a retrospective study using EHR data, we had limited information to infer the precise mechanism of HAA for each patient. However, procedure codes and discharge diagnoses enabled us to assess which patients underwent a major procedure or had a hemorrhage or hemorrhagic disorder during the hospitalization. Third, given the relatively few number of patients with severe HAA in our cohort, we were unable to assess if the association of severe HAA differed by suspected etiology. Lastly, because we were unable to ascertain the timing of the hematocrit values within the first 24 hours of admission, we excluded both patients with preexisting anemia on admission and those who developed HAA within the first 24 hours of admission, which is not uncommon.26 Thus, we were unable to assess the effect of acute on chronic anemia arising during hospitalization and HAA that develops within the first 24 hours, both of which may also be harmful.18,27,28
In conclusion, severe HAA occurs in 1.4% of all medical hospitalizations and is associated with increased odds of death or readmission within 30 days. Since most patients with severe HAA had undergone a major procedure or had a discharge diagnosis of hemorrhage or a coagulation or hemorrhagic disorder, it is unclear if severe HAA is potentially preventable through preventing blood loss from phlebotomy or by reducing iatrogenic injury during procedures. Future research should assess the potential preventability of severe HAA, and examine other patient-centered outcomes potentially related to anemia, including fatigue, functional impairment, and trajectory of posthospital recovery.
Acknowledgments
The authors would like to acknowledge Ruben Amarasingham, MD, MBA, President and Chief Executive Officer of the Parkland Center for Clinical Innovation, and Ferdinand Velasco, MD, Chief Health Information Officer at Texas Health Resources, for their assistance in assembling the 6 hospital cohort used in this study. The authors would also like to thank Valy Fontil, MD, MAS, Assistant Professor of Medicine at the University of California San Francisco School of Medicine, and Elizabeth Rogers, MD, MAS, Assistant Professor of Internal Medicine and Pediatrics at the University of Minnesota Medical School, for their constructive feedback on an earlier version of this manuscript.
Disclosures
This work was supported by the Agency for Healthcare Research and Quality-funded UT Southwestern Center for Patient-Centered Outcomes Research (R24 HS022418-01); the Commonwealth Foundation (#20100323); the UT Southwestern KL2 Scholars Program supported by the National Institutes of Health (KL2 TR001103); the National Center for Advancing Translational Sciences at the National Institute of Health (U54 RFA-TR-12-006); and the National Institute on Aging (K23AG052603). The study sponsors had no role in design and conduct of the study; collection, management, analysis, and interpretation of the data; and preparation, review, or approval of the manuscript. The authors have no financial conflicts of interest to disclose.
1. Kurniali PC, Curry S, Brennan KW, et al. A retrospective study investigating the incidence and predisposing factors of hospital-acquired anemia. Anemia. 2014;2014:634582. PubMed
2. Koch CG, Li L, Sun Z, et al. Hospital-acquired anemia: prevalence, outcomes, and healthcare implications. J Hosp Med. 2013;8(9):506-512. PubMed
3. Salisbury AC, Alexander KP, Reid KJ, et al. Incidence, correlates, and outcomes of acute, hospital-acquired anemia in patients with acute myocardial infarction. Circ Cardiovasc Qual Outcomes. 2010;3(4):337-346. PubMed
4. Salisbury AC, Amin AP, Reid KJ, et al. Hospital-acquired anemia and in-hospital mortality in patients with acute myocardial infarction. Am Heart J. 2011;162(2):300-309 e303. PubMed
5. Meroño O, Cladellas M, Recasens L, et al. In-hospital acquired anemia in acute coronary syndrome. Predictors, in-hospital prognosis and one-year mortality. Rev Esp Cardiol (Engl Ed). 2012;65(8):742-748. PubMed
6. Salisbury AC, Reid KJ, Alexander KP, et al. Diagnostic blood loss from phlebotomy and hospital-acquired anemia during acute myocardial infarction. Arch Intern Med. 2011;171(18):1646-1653. PubMed
7. Thavendiranathan P, Bagai A, Ebidia A, Detsky AS, Choudhry NK. Do blood tests cause anemia in hospitalized patients? The effect of diagnostic phlebotomy on hemoglobin and hematocrit levels. J Gen Intern Med. 2005;20(6):520-524. PubMed
8. Rennke S, Fang MC. Hazards of hospitalization: more than just “never events”. Arch Intern Med. 2011;171(18):1653-1654. PubMed
9. Choi JS, Kim YA, Kang YU, et al. Clinical impact of hospital-acquired anemia in association with acute kidney injury and chronic kidney disease in patients with acute myocardial infarction. PLoS One. 2013;8(9):e75583. PubMed
10. Salisbury AC, Kosiborod M, Amin AP, et al. Recovery from hospital-acquired anemia after acute myocardial infarction and effect on outcomes. Am J Cardiol. 2011;108(7):949-954. PubMed
11. Nguyen OK, Makam AN, Clark C, et al. Predicting all-cause readmissions using electronic health record data from the entire hospitalization: Model development and comparison. J Hosp Med. 2016;11(7):473-480. PubMed
12. Amarasingham R, Velasco F, Xie B, et al. Electronic medical record-based multicondition models to predict the risk of 30 day readmission or death among adult medicine patients: validation and comparison to existing models. BMC Med Inform Decis Mak. 2015;15:39. PubMed
13. World Health Organization. Hemoglobin concentrations for the diagnosis of anaemia and assessment of severity. http://www.who.int/vmnis/indicators/haemoglobin.pdf. Accessed March 15, 2016.
14. Martin ND, Scantling D. Hospital-acquired anemia: a contemporary review of etiologies and prevention strategies. J Infus Nurs. 2015;38(5):330-338. PubMed
15. Agency for Healthcare Research and Quality, Rockville, MD. Clinical classification software (CCS) for ICD-9-CM. Healthcare Cost and Utilization Project. 2015 http://www.hcup-us.ahrq.gov/toolssoftware/ccs/ccs.jsp. Accessed November 18, 2015.
16. Agency for Healthcare Research and Quality, Rockville, MD. Procedure classes2015. Healthcare Cost and Utilization Project. 2015. https://www.hcup-us.ahrq.gov/toolssoftware/procedure/procedure.jsp. Accessed November 18, 2015.
17. Corwin HL, Gettinger A, Pearl RG, et al. The CRIT Study: Anemia and blood transfusion in the critically ill--current clinical practice in the United States. Crit Care Med. 2004;32(1):39-52. PubMed
18. Aronson D, Suleiman M, Agmon Y, et al. Changes in haemoglobin levels during hospital course and long-term outcome after acute myocardial infarction. Eur Heart J. 2007;28(11):1289-1296. PubMed
19. Lyon AW, Chin AC, Slotsve GA, Lyon ME. Simulation of repetitive diagnostic blood loss and onset of iatrogenic anemia in critical care patients with a mathematical model. Comput Biol Med. 2013;43(2):84-90. PubMed
20. van der Bom JG, Cannegieter SC. Hospital-acquired anemia: the contribution of diagnostic blood loss. J Thromb Haemost. 2015;13(6):1157-1159. PubMed
21. Sanchez-Giron F, Alvarez-Mora F. Reduction of blood loss from laboratory testing in hospitalized adult patients using small-volume (pediatric) tubes. Arch Pathol Lab Med. 2008;132(12):1916-1919. PubMed
22. Smoller BR, Kruskall MS. Phlebotomy for diagnostic laboratory tests in adults. Pattern of use and effect on transfusion requirements. N Engl J Med. 1986;314(19):1233-1235. PubMed
23. Carson JL, Carless PA, Hebert PC. Transfusion thresholds and other strategies for guiding allogeneic red blood cell transfusion. Cochrane Database Syst Rev. 2012(4):CD002042. PubMed
24. Carson JL, Carless PA, Hébert PC. Outcomes using lower vs higher hemoglobin thresholds for red blood cell transfusion. JAMA. 2013;309(1):83-84. PubMed
25. Carson JL, Sieber F, Cook DR, et al. Liberal versus restrictive blood transfusion strategy: 3-year survival and cause of death results from the FOCUS randomised controlled trial. Lancet. 2015;385(9974):1183-1189. PubMed
26. Rajkomar A, McCulloch CE, Fang MC. Low diagnostic utility of rechecking hemoglobins within 24 hours in hospitalized patients. Am J Med. 2016;129(11):1194-1197. PubMed
27. Reade MC, Weissfeld L, Angus DC, Kellum JA, Milbrandt EB. The prevalence of anemia and its association with 90-day mortality in hospitalized community-acquired pneumonia. BMC Pulm Med. 2010;10:15. PubMed
28. Halm EA, Wang JJ, Boockvar K, et al. The effect of perioperative anemia on clinical and functional outcomes in patients with hip fracture. J Orthop Trauma. 2004;18(6):369-374. PubMed
Hospital-acquired anemia (HAA) is defined as having a normal hemoglobin value upon admission but developing anemia during the course of hospitalization. The condition is common, with an incidence ranging from approximately 25% when defined by using the hemoglobin value prior to discharge to 74% when using the nadir hemoglobin value during hospitalization.1-5 While there are many potential etiologies for HAA, given that iatrogenic blood loss from phlebotomy may lead to its development,6,7 HAA has been postulated to be a hazard of hospitalization that is potentially preventable.8 However, it is unclear whether the development of HAA portends worse outcomes after hospital discharge.
The limited number of studies on the association between HAA and postdischarge outcomes has been restricted to patients hospitalized for acute myocardial infarction (AMI).3,9,10 Among this subpopulation, HAA is independently associated with greater morbidity and mortality following hospital discharge.3,9,10 In a more broadly representative population of hospitalized adults, Koch et al.2 found that the development of HAA is associated with greater length of stay (LOS), hospital charges, and inpatient mortality. However, given that HAA was defined by the lowest hemoglobin level during hospitalization (and not necessarily the last value prior to discharge), it is unclear if the worse outcomes observed were the cause of the HAA, rather than its effect, since hospital LOS is a robust predictor for the development of HAA, as well as a major driver of hospital costs and a prognostic marker for inpatient mortality.3,9 Furthermore, this study evaluated outcomes only during the index hospitalization, so it is unclear if patients who develop HAA have worse clinical outcomes after discharge.
Therefore, in this study, we used clinically granular electronic health record (EHR) data from a diverse cohort of consecutive medicine inpatients hospitalized for any reason at 1 of 6 hospitals to: 1) describe the epidemiology of HAA; 2) identify predictors of its development; and 3) examine its association with 30-day postdischarge adverse outcomes. We hypothesized that the development of HAA would be independently associated with 30-day readmission and mortality in a dose-dependent fashion, with increasing severity of HAA associated with worse outcomes.
METHODS
Study Design, Population, and Data Sources
We conducted a retrospective observational cohort study using EHR data collected from November 1, 2009 to October 30, 2010 from 6 hospitals in the north Texas region. One site was a university-affiliated safety-net hospital; the remaining 5 community hospitals were a mix of teaching and nonteaching sites. All hospitals used the Epic EHR system (Epic Systems Corporation, Verona, Wisconsin). Details of this cohort have been published.11,12This study included consecutive hospitalizations among adults age 18 years or older who were discharged from a medicine inpatient service with any diagnosis. We excluded hospitalizations by individuals who were anemic within the first 24 hours of admission (hematocrit less than 36% for women and less than 40% for men), were missing a hematocrit value within the first 24 hours of hospitalization or a repeat hematocrit value prior to discharge, had a hospitalization in the preceding 30 days (ie, index hospitalization was considered a readmission), died in the hospital, were transferred to another hospital, or left against medical advice. For individuals with multiple eligible hospitalizations during the study period, we included only the first hospitalization. We also excluded those discharged to hospice, given that this population of individuals may have intentionally desired less aggressive care.
Definition of Hospital-Acquired Anemia
HAA was defined as having a normal hematocrit value (36% or greater for women and 40% or greater for men) within the first 24 hours of admission and a hematocrit value at the time of hospital discharge lower than the World Health Organization’s sex-specific cut points.13 If there was more than 1 hematocrit value on the same day, we chose the lowest value. Based on prior studies, HAA was further categorized by severity as mild (hematocrit greater than 33% and less than 36% in women; and greater than 33% and less than 40% in men), moderate (hematocrit greater than 27% and 33% or less for all), or severe (hematocrit 27% or less for all).2,14
Characteristics
We extracted information on sociodemographic characteristics, comorbidities, LOS, procedures, blood transfusions, and laboratory values from the EHR. Hospitalizations in the 12 months preceding the index hospitalization were ascertained from the EHR and from an all-payer regional hospitalization database that captures hospitalizations from 75 acute care hospitals within a 100-mile radius of Dallas-Fort Worth. International Classification of Diseases, Ninth Revision, Clinical Modification (ICD-9-CM) discharge diagnosis codes were categorized according to the Agency for Healthcare Research and Quality (AHRQ) Clinical Classifications Software (CCS).15 We defined a diagnosis for hemorrhage and coagulation, and hemorrhagic disorder as the presence of any ICD-9-CM code (primary or secondary) that mapped to the AHRQ CCS diagnoses 60 and 153, and 62, respectively. Procedures were categorized as minor diagnostic, minor therapeutic, major diagnostic, and major therapeutic using the AHRQ Healthcare Cost and Utilization Procedure Classes tool.16
Outcomes
The primary outcome was a composite of death or readmission within 30 days of hospital discharge. Hospital readmissions were ascertained at the index hospital and at any of 75 acute care hospitals in the region as described earlier. Death was ascertained from each of the hospitals’ EHR and administrative data and the Social Security Death Index. Individuals who had both outcomes (eg, a 30-day readmission and death) were considered to have only 1 occurrence of the composite primary outcome measure. Our secondary outcomes were death and readmission within 30 days of discharge, considered as separate outcomes.
Statistical Analysis
We used logistic regression models to evaluate predictors of HAA and to estimate the association of HAA on subsequent 30-day adverse outcomes after hospital discharge. All models accounted for clustering of patients by hospital. For the outcomes analyses, models were adjusted for potential confounders based on prior literature and our group’s expertise, which included age, sex, race/ethnicity, Charlson comorbidity index, prior hospitalizations, nonelective admission status, creatinine level on admission, blood urea nitrogen (BUN) to creatinine ratio of more than 20:1 on admission, LOS, receipt of a major diagnostic or therapeutic procedure during the index hospitalization, a discharge diagnosis for hemorrhage, and a discharge diagnosis for a coagulation or hemorrhagic disorder. For the mortality analyses, given the limited number of 30-day deaths after hospital discharge in our cohort, we collapsed moderate and severe HAA into a single category. In sensitivity analyses, we repeated the adjusted model, but excluded patients in our cohort who had received at least 1 blood transfusion during the index hospitalization (2.6%) given its potential for harm, and patients with a primary discharge diagnosis for AMI (3.1%).17
The functional forms of continuous variables were assessed using restricted cubic splines and locally weighted scatterplot smoothing techniques. All analyses were performed using STATA statistical software version 12.0 (StataCorp, College Station, Texas). The University of Texas Southwestern Medical Center institutional review board approved this study.
RESULTS
Of 53,995 consecutive medicine hospitalizations among adults age 18 years or older during our study period, 11,309 index hospitalizations were included in our study cohort (Supplemental Figure 1). The majority of patients excluded were because of having documented anemia within the first 24 hours of admission (n=24,950). With increasing severity of HAA, patients were older, more likely to be female, non-Hispanic white, electively admitted, have fewer comorbidities, less likely to be hospitalized in the past year, more likely to have had a major procedure, receive a blood transfusion, have a longer LOS, and have a primary or secondary discharge diagnosis for a hemorrhage or a coagulation or hemorrhagic disorder (Table 1).
Epidemiology of HAA
Among this cohort of patients without anemia on admission, the median hematocrit value on admission was 40.6 g/dL and on discharge was 38.9 g/dL. One-third of patients with normal hematocrit value at admission developed HAA, with 21.6% developing mild HAA, 10.1% developing moderate HAA, and 1.4% developing severe HAA. The median discharge hematocrit value was 36 g/dL (interquartile range [IQR]), 35-38 g/dL) for the group of patients who developed mild HAA, 31 g/dL (IQR, 30-32 g/dL) for moderate HAA, and 26 g/dL (IQR, 25-27 g/dL) for severe HAA (Supplemental Figure 2). Among the severe HAA group, 135 of the 159 patients (85%) had a major procedure (n=123, accounting for 219 unique major procedures), a diagnosis for hemorrhage (n=30), and/or a diagnosis for a coagulation or hemorrhagic disorder (n=23) during the index hospitalization. Of the 219 major procedures among patients with severe HAA, most were musculoskeletal (92 procedures), cardiovascular (61 procedures), or digestive system-related (41 procedures). The most common types of procedures were coronary artery bypass graft (36 procedures), hip replacement (25 procedures), knee replacement (17 procedures), and femur fracture reduction (15 procedures). The 10 most common principal discharge diagnoses of the index hospitalization by HAA group are shown in Supplemental Table 1. For the severe HAA group, the most common diagnosis was hip fracture (20.8%).
Predictors of HAA
Compared to no or mild HAA, female sex, elective admission status, serum creatinine on admission, BUN to creatinine ratio greater than 20 to 1, hospital LOS, and undergoing a major diagnostic or therapeutic procedure were predictors for the development of moderate or severe HAA (Table 2). The model explained 23% of the variance (McFadden’s pseudo R2).
Incidence of Postdischarge Outcomes by Severity of HAA
The severity of HAA was associated with a dose-dependent increase in the incidence of 30-day adverse outcomes, such that patients with increasing severity of HAA had greater 30-day composite, mortality, and readmission outcomes (P < 0.001; Figure). The 30-day postdischarge composite outcome was primarily driven by hospital readmissions given the low mortality rate in our cohort. Patients who did not develop HAA had an incidence of 9.7% for the composite outcome, whereas patients with severe HAA had an incidence of 16.4%. Among the 24 patients with severe HAA but who had not undergone a major procedure or had a discharge diagnosis for hemorrhage or for a coagulation or hemorrhagic disorder, only 3 (12.5%) had a composite postdischarge adverse outcome (2 readmissions and 1 death). The median time to readmission was similar between groups, but more patients with severe HAA had an early readmission within 7 days of hospital discharge than patients who did not develop HAA (6.9% vs. 2.9%, P = 0.001; Supplemental Table 2).
Association of HAA and Postdischarge Outcomes
In unadjusted analyses, compared to not developing HAA, mild, moderate, and severe HAA were associated with a 29%, 61%, and 81% increase in the odds for a composite outcome, respectively (Table 3). After adjustment for confounders, the effect size for HAA attenuated and was no longer statistically significant for mild and moderate HAA. However, severe HAA was significantly associated with a 39% increase in the odds for the composite outcome and a 41% increase in the odds for 30-day readmission (P = 0.008 and P = 0.02, respectively).
In sensitivity analyses, the exclusion of individuals who received at least 1 blood transfusion during the index hospitalization (n=298) and individuals who had a primary discharge diagnosis for AMI (n=353) did not substantively change the estimates of the association between severe HAA and postdischarge outcomes (Supplemental Tables 3 and 4). However, because of the fewer number of adverse events for each analysis, the confidence intervals were wider and the association of severe HAA and the composite outcome and readmission were no longer statistically significant in these subcohorts.
DISCUSSION
In this large and diverse sample of medical inpatients, we found that HAA occurs in one-third of adults with normal hematocrit value at admission, where 10.1% of the cohort developed moderately severe HAA and 1.4% developed severe HAA by the time of discharge. Length of stay and undergoing a major diagnostic or therapeutic procedure were the 2 strongest potentially modifiable predictors of developing moderate or severe HAA. Severe HAA was independently associated with a 39% increase in the odds of being readmitted or dying within 30 days after hospital discharge compared to not developing HAA. However, the associations between mild or moderate HAA with adverse outcomes were attenuated after adjusting for confounders and were no longer statistically significant.
To our knowledge, this is the first study on the postdischarge adverse outcomes of HAA among a diverse cohort of medical inpatients hospitalized for any reason. In a more restricted population, Salisbury et al.3 found that patients hospitalized for AMI who developed moderate to severe HAA (hemoglobin value at discharge of 11 g/dL or less) had greater 1-year mortality than those without HAA (8.4% vs. 2.6%, P < 0.001), and had an 82% increase in the hazard for mortality (95% confidence interval, hazard ratio 1.11-2.98). Others have similarly shown that HAA is common among patients hospitalized with AMI and is associated with greater mortality.5,9,18 Our study extends upon this prior research by showing that severe HAA increases the risk for adverse outcomes for all adult inpatients, not only those hospitalized for AMI or among those receiving blood transfusions.
Despite the increased harm associated with severe HAA, it is unclear whether HAA is a preventable hazard of hospitalization, as suggested by others.6,8 Most patients in our cohort who developed severe HAA underwent a major procedure, had a discharge diagnosis for hemorrhage, and/or had a discharge diagnosis for a coagulation or hemorrhagic disorder. Thus, blood loss due to phlebotomy, 1 of the more modifiable etiologies of HAA, was unlikely to have been the primary driver for most patients who developed severe HAA. Since it has been estimated to take 15 days of daily phlebotomy of 53 mL of whole blood in females of average body weight (and 20 days for average weight males) with no bone marrow synthesis for severe anemia to develop, it is even less likely that phlebotomy was the principal etiology given an 8-day median LOS among patients with severe HAA.19,20 However, since the etiology of HAA can be multifactorial, limiting blood loss due to phlebotomy by using smaller volume tubes, blood conservation devices, or reducing unnecessary testing may mitigate the development of severe HAA.21,22 Additionally, since more than three-quarters of patients who developed severe HAA underwent a major procedure, more care and attention to minimizing operative blood loss could lessen the severity of HAA and facilitate better recovery. If minimizing blood loss is not feasible, in the absence of symptoms related to anemia or ongoing blood loss, randomized controlled trials overwhelmingly support a restrictive transfusion strategy using a hemoglobin value threshold of 7 mg/dL, even in the postoperative setting.23-25
The implications of mild to moderate HAA are less clear. The odds ratios for mild and moderate HAA, while not statistically significant, suggest a small increase in harm compared to not developing HAA. Furthermore, the upper boundary of the confidence intervals for mild and moderate HAA cannot exclude a possible 30% and 56% increase in the odds for the 30-day composite outcome, respectively. Thus, a better powered study, including more patients and extending the time interval for ascertaining postdischarge adverse events beyond 30 days, may reveal a harmful association. Lastly, our study assessed only the association of HAA with 30-day readmission and mortality. Examining the association between HAA and other patient-centered outcomes such as fatigue, functional impairment, and prolonged posthospitalization recovery time may uncover other important adverse effects of mild and moderate HAA, both of which occur far more frequently than severe HAA.
Our findings should be interpreted in the context of several limitations. First, although we included a diverse group of patients from a multihospital cohort, generalizability to other settings is uncertain. Second, as this was a retrospective study using EHR data, we had limited information to infer the precise mechanism of HAA for each patient. However, procedure codes and discharge diagnoses enabled us to assess which patients underwent a major procedure or had a hemorrhage or hemorrhagic disorder during the hospitalization. Third, given the relatively few number of patients with severe HAA in our cohort, we were unable to assess if the association of severe HAA differed by suspected etiology. Lastly, because we were unable to ascertain the timing of the hematocrit values within the first 24 hours of admission, we excluded both patients with preexisting anemia on admission and those who developed HAA within the first 24 hours of admission, which is not uncommon.26 Thus, we were unable to assess the effect of acute on chronic anemia arising during hospitalization and HAA that develops within the first 24 hours, both of which may also be harmful.18,27,28
In conclusion, severe HAA occurs in 1.4% of all medical hospitalizations and is associated with increased odds of death or readmission within 30 days. Since most patients with severe HAA had undergone a major procedure or had a discharge diagnosis of hemorrhage or a coagulation or hemorrhagic disorder, it is unclear if severe HAA is potentially preventable through preventing blood loss from phlebotomy or by reducing iatrogenic injury during procedures. Future research should assess the potential preventability of severe HAA, and examine other patient-centered outcomes potentially related to anemia, including fatigue, functional impairment, and trajectory of posthospital recovery.
Acknowledgments
The authors would like to acknowledge Ruben Amarasingham, MD, MBA, President and Chief Executive Officer of the Parkland Center for Clinical Innovation, and Ferdinand Velasco, MD, Chief Health Information Officer at Texas Health Resources, for their assistance in assembling the 6 hospital cohort used in this study. The authors would also like to thank Valy Fontil, MD, MAS, Assistant Professor of Medicine at the University of California San Francisco School of Medicine, and Elizabeth Rogers, MD, MAS, Assistant Professor of Internal Medicine and Pediatrics at the University of Minnesota Medical School, for their constructive feedback on an earlier version of this manuscript.
Disclosures
This work was supported by the Agency for Healthcare Research and Quality-funded UT Southwestern Center for Patient-Centered Outcomes Research (R24 HS022418-01); the Commonwealth Foundation (#20100323); the UT Southwestern KL2 Scholars Program supported by the National Institutes of Health (KL2 TR001103); the National Center for Advancing Translational Sciences at the National Institute of Health (U54 RFA-TR-12-006); and the National Institute on Aging (K23AG052603). The study sponsors had no role in design and conduct of the study; collection, management, analysis, and interpretation of the data; and preparation, review, or approval of the manuscript. The authors have no financial conflicts of interest to disclose.
1. Kurniali PC, Curry S, Brennan KW, et al. A retrospective study investigating the incidence and predisposing factors of hospital-acquired anemia. Anemia. 2014;2014:634582. PubMed
2. Koch CG, Li L, Sun Z, et al. Hospital-acquired anemia: prevalence, outcomes, and healthcare implications. J Hosp Med. 2013;8(9):506-512. PubMed
3. Salisbury AC, Alexander KP, Reid KJ, et al. Incidence, correlates, and outcomes of acute, hospital-acquired anemia in patients with acute myocardial infarction. Circ Cardiovasc Qual Outcomes. 2010;3(4):337-346. PubMed
4. Salisbury AC, Amin AP, Reid KJ, et al. Hospital-acquired anemia and in-hospital mortality in patients with acute myocardial infarction. Am Heart J. 2011;162(2):300-309 e303. PubMed
5. Meroño O, Cladellas M, Recasens L, et al. In-hospital acquired anemia in acute coronary syndrome. Predictors, in-hospital prognosis and one-year mortality. Rev Esp Cardiol (Engl Ed). 2012;65(8):742-748. PubMed
6. Salisbury AC, Reid KJ, Alexander KP, et al. Diagnostic blood loss from phlebotomy and hospital-acquired anemia during acute myocardial infarction. Arch Intern Med. 2011;171(18):1646-1653. PubMed
7. Thavendiranathan P, Bagai A, Ebidia A, Detsky AS, Choudhry NK. Do blood tests cause anemia in hospitalized patients? The effect of diagnostic phlebotomy on hemoglobin and hematocrit levels. J Gen Intern Med. 2005;20(6):520-524. PubMed
8. Rennke S, Fang MC. Hazards of hospitalization: more than just “never events”. Arch Intern Med. 2011;171(18):1653-1654. PubMed
9. Choi JS, Kim YA, Kang YU, et al. Clinical impact of hospital-acquired anemia in association with acute kidney injury and chronic kidney disease in patients with acute myocardial infarction. PLoS One. 2013;8(9):e75583. PubMed
10. Salisbury AC, Kosiborod M, Amin AP, et al. Recovery from hospital-acquired anemia after acute myocardial infarction and effect on outcomes. Am J Cardiol. 2011;108(7):949-954. PubMed
11. Nguyen OK, Makam AN, Clark C, et al. Predicting all-cause readmissions using electronic health record data from the entire hospitalization: Model development and comparison. J Hosp Med. 2016;11(7):473-480. PubMed
12. Amarasingham R, Velasco F, Xie B, et al. Electronic medical record-based multicondition models to predict the risk of 30 day readmission or death among adult medicine patients: validation and comparison to existing models. BMC Med Inform Decis Mak. 2015;15:39. PubMed
13. World Health Organization. Hemoglobin concentrations for the diagnosis of anaemia and assessment of severity. http://www.who.int/vmnis/indicators/haemoglobin.pdf. Accessed March 15, 2016.
14. Martin ND, Scantling D. Hospital-acquired anemia: a contemporary review of etiologies and prevention strategies. J Infus Nurs. 2015;38(5):330-338. PubMed
15. Agency for Healthcare Research and Quality, Rockville, MD. Clinical classification software (CCS) for ICD-9-CM. Healthcare Cost and Utilization Project. 2015 http://www.hcup-us.ahrq.gov/toolssoftware/ccs/ccs.jsp. Accessed November 18, 2015.
16. Agency for Healthcare Research and Quality, Rockville, MD. Procedure classes2015. Healthcare Cost and Utilization Project. 2015. https://www.hcup-us.ahrq.gov/toolssoftware/procedure/procedure.jsp. Accessed November 18, 2015.
17. Corwin HL, Gettinger A, Pearl RG, et al. The CRIT Study: Anemia and blood transfusion in the critically ill--current clinical practice in the United States. Crit Care Med. 2004;32(1):39-52. PubMed
18. Aronson D, Suleiman M, Agmon Y, et al. Changes in haemoglobin levels during hospital course and long-term outcome after acute myocardial infarction. Eur Heart J. 2007;28(11):1289-1296. PubMed
19. Lyon AW, Chin AC, Slotsve GA, Lyon ME. Simulation of repetitive diagnostic blood loss and onset of iatrogenic anemia in critical care patients with a mathematical model. Comput Biol Med. 2013;43(2):84-90. PubMed
20. van der Bom JG, Cannegieter SC. Hospital-acquired anemia: the contribution of diagnostic blood loss. J Thromb Haemost. 2015;13(6):1157-1159. PubMed
21. Sanchez-Giron F, Alvarez-Mora F. Reduction of blood loss from laboratory testing in hospitalized adult patients using small-volume (pediatric) tubes. Arch Pathol Lab Med. 2008;132(12):1916-1919. PubMed
22. Smoller BR, Kruskall MS. Phlebotomy for diagnostic laboratory tests in adults. Pattern of use and effect on transfusion requirements. N Engl J Med. 1986;314(19):1233-1235. PubMed
23. Carson JL, Carless PA, Hebert PC. Transfusion thresholds and other strategies for guiding allogeneic red blood cell transfusion. Cochrane Database Syst Rev. 2012(4):CD002042. PubMed
24. Carson JL, Carless PA, Hébert PC. Outcomes using lower vs higher hemoglobin thresholds for red blood cell transfusion. JAMA. 2013;309(1):83-84. PubMed
25. Carson JL, Sieber F, Cook DR, et al. Liberal versus restrictive blood transfusion strategy: 3-year survival and cause of death results from the FOCUS randomised controlled trial. Lancet. 2015;385(9974):1183-1189. PubMed
26. Rajkomar A, McCulloch CE, Fang MC. Low diagnostic utility of rechecking hemoglobins within 24 hours in hospitalized patients. Am J Med. 2016;129(11):1194-1197. PubMed
27. Reade MC, Weissfeld L, Angus DC, Kellum JA, Milbrandt EB. The prevalence of anemia and its association with 90-day mortality in hospitalized community-acquired pneumonia. BMC Pulm Med. 2010;10:15. PubMed
28. Halm EA, Wang JJ, Boockvar K, et al. The effect of perioperative anemia on clinical and functional outcomes in patients with hip fracture. J Orthop Trauma. 2004;18(6):369-374. PubMed
© 2017 Society of Hospital Medicine
Predicting 30-day pneumonia readmissions using electronic health record data
Pneumonia is a leading cause of hospitalizations in the U.S., accounting for more than 1.1 million discharges annually.1 Pneumonia is frequently complicated by hospital readmission, which is costly and potentially avoidable.2,3 Due to financial penalties imposed on hospitals for higher than expected 30-day readmission rates, there is increasing attention to implementing interventions to reduce readmissions in this population.4,5 However, because these programs are resource-intensive, interventions are thought to be most cost-effective if they are targeted to high-risk individuals who are most likely to benefit.6-8
Current pneumonia-specific readmission risk-prediction models that could enable identification of high-risk patients suffer from poor predictive ability, greatly limiting their use, and most were validated among older adults or by using data from single academic medical centers, limiting their generalizability.9-14 A potential reason for poor predictive accuracy is the omission of known robust clinical predictors of pneumonia-related outcomes, including pneumonia severity of illness and stability on discharge.15-17 Approaches using electronic health record (EHR) data, which include this clinically granular data, could enable hospitals to more accurately and pragmatically identify high-risk patients during the index hospitalization and enable interventions to be initiated prior to discharge.
An alternative strategy to identifying high-risk patients for readmission is to use a multi-condition risk-prediction model. Developing and implementing models for every condition may be time-consuming and costly. We have derived and validated 2 multi-condition risk-prediction models using EHR data—1 using data from the first day of hospital admission (‘first-day’ model), and the second incorporating data from the entire hospitalization (‘full-stay’ model) to reflect in-hospital complications and clinical stability at discharge.18,19 However, it is unknown if a multi-condition model for pneumonia would perform as well as a disease-specific model.
This study aimed to develop 2 EHR-based pneumonia-specific readmission risk-prediction models using data routinely collected in clinical practice—a ‘first-day’ and a ‘full-stay’ model—and compare the performance of each model to: 1) one another; 2) the corresponding multi-condition EHR model; and 3) to other potentially useful models in predicting pneumonia readmissions (the Centers for Medicare and Medicaid Services [CMS] pneumonia model, and 2 commonly used pneumonia severity of illness scores validated for predicting mortality). We hypothesized that the pneumonia-specific EHR models would outperform other models; and the full-stay pneumonia-specific model would outperform the first-day pneumonia-specific model.
METHODS
Study Design, Population, and Data Sources
We conducted an observational study using EHR data collected from 6 hospitals (including safety net, community, teaching, and nonteaching hospitals) in north Texas between November 2009 and October 2010, All hospitals used the Epic EHR (Epic Systems Corporation, Verona, WI). Details of this cohort have been published.18,19
We included consecutive hospitalizations among adults 18 years and older discharged from any medicine service with principal discharge diagnoses of pneumonia (ICD-9-CM codes 480-483, 485, 486-487), sepsis (ICD-9-CM codes 038, 995.91, 995.92, 785.52), or respiratory failure (ICD-9-CM codes 518.81, 518.82, 518.84, 799.1) when the latter 2 were also accompanied by a secondary diagnosis of pneumonia.20 For individuals with multiple hospitalizations during the study period, we included only the first hospitalization. We excluded individuals who died during the index hospitalization or within 30 days of discharge, were transferred to another acute care facility, or left against medical advice.
Outcomes
The primary outcome was all-cause 30-day readmission, defined as a nonelective hospitalization within 30 days of discharge to any of 75 acute care hospitals within a 100-mile radius of Dallas, ascertained from an all-payer regional hospitalization database.
Predictor Variables for the Pneumonia-Specific Readmission Models
The selection of candidate predictors was informed by our validated multi-condition risk-prediction models using EHR data available within 24 hours of admission (‘first-day’ multi-condition EHR model) or during the entire hospitalization (‘full-stay’ multi-condition EHR model).18,19 For the pneumonia-specific models, we included all variables in our published multi-condition models as candidate predictors, including sociodemographics, prior utilization, Charlson Comorbidity Index, select laboratory and vital sign abnormalities, length of stay, hospital complications (eg, venous thromboembolism), vital sign instabilities, and disposition status (see Supplemental Table 1 for complete list of variables). We also assessed additional variables specific to pneumonia for inclusion that were: (1) available in the EHR of all participating hospitals; (2) routinely collected or available at the time of admission or discharge; and (3) plausible predictors of adverse outcomes based on literature and clinical expertise. These included select comorbidities (eg, psychiatric conditions, chronic lung disease, history of pneumonia),10,11,21,22 the pneumonia severity index (PSI),16,23,24 intensive care unit stay, and receipt of invasive or noninvasive ventilation. We used a modified PSI score because certain data elements were missing. The modified PSI (henceforth referred to as PSI) did not include nursing home residence and included diagnostic codes as proxies for the presence of pleural effusion (ICD-9-CM codes 510, 511.1, and 511.9) and altered mental status (ICD-9-CM codes 780.0X, 780.97, 293.0, 293.1, and 348.3X).
Statistical Analysis
Model Derivation. Candidate predictor variables were classified as available in the EHR within 24 hours of admission and/or at the time of discharge. For example, socioeconomic factors could be ascertained within the first day of hospitalization, whereas length of stay would not be available until the day of discharge. Predictors with missing values were assumed to be normal (less than 1% missing for each variable). Univariate relationships between readmission and each candidate predictor were assessed in the overall cohort using a pre-specified significance threshold of P ≤ 0.10. Significant variables were entered in the respective first-day and full-stay pneumonia-specific multivariable logistic regression models using stepwise-backward selection with a pre-specified significance threshold of P ≤ 0.05. In sensitivity analyses, we alternately derived our models using stepwise-forward selection, as well as stepwise-backward selection minimizing the Bayesian information criterion and Akaike information criterion separately. These alternate modeling strategies yielded identical predictors to our final models.
Model Validation. Model validation was performed using 5-fold cross-validation, with the overall cohort randomly divided into 5 equal-size subsets.25 For each cycle, 4 subsets were used for training to estimate model coefficients, and the fifth subset was used for validation. This cycle was repeated 5 times with each randomly-divided subset used once as the validation set. We repeated this entire process 50 times and averaged the C statistic estimates to derive an optimism-corrected C statistic. Model calibration was assessed qualitatively by comparing predicted to observed probabilities of readmission by quintiles of predicted risk, and with the Hosmer-Lemeshow goodness-of-fit test.
Comparison to Other Models. The main comparisons of the first-day and full-stay pneumonia-specific EHR model performance were to each other and the corresponding multi-condition EHR model.18,19 The multi-condition EHR models were separately derived and validated within the larger parent cohort from which this study cohort was derived, and outperformed the CMS all-cause model, the HOSPITAL model, and the LACE index.19 To further triangulate our findings, given the lack of other rigorously validated pneumonia-specific risk-prediction models for readmission,14 we compared the pneumonia-specific EHR models to the CMS pneumonia model derived from administrative claims data,10 and 2 commonly used risk-prediction scores for short-term mortality among patients with community-acquired pneumonia, the PSI and CURB-65 scores.16 Although derived and validated using patient-level data, the CMS model was developed to benchmark hospitals according to hospital-level readmission rates.10 The CURB-65 score in this study was also modified to include the same altered mental status diagnostic codes according to the modified PSI as a proxy for “confusion.” Both the PSI and CURB-65 scores were calculated using the most abnormal values within the first 24 hours of admission. The ‘updated’ PSI and the ‘updated’ CURB-65 were calculated using the most abnormal values within 24 hours prior to discharge, or the last known observation prior to discharge if no results were recorded within this time period. A complete list of variables for each of the comparison models are shown in Supplemental Table 1.
We assessed model performance by calculating the C statistic, integrated discrimination index, and net reclassification index (NRI) compared to our pneumonia-specific models. The integrated discrimination index is the difference in the mean predicted probability of readmission between patients who were and were not actually readmitted between 2 models, where more positive values suggest improvement in model performance compared to a reference model.26 The NRI is defined as the sum of the net proportions of correctly reclassified persons with and without the event of interest.27 Here, we calculated a category-based NRI to evaluate the performance of pneumonia-specific models in correctly classifying individuals with and without readmissions into the 2 highest readmission risk quintiles vs the lowest 3 risk quintiles compared to other models.27 This pre-specified cutoff is relevant for hospitals interested in identifying the highest risk individuals for targeted intervention.7 Finally, we assessed calibration of comparator models in our cohort by comparing predicted probability to observed probability of readmission by quintiles of risk for each model. We conducted all analyses using Stata 12.1 (StataCorp, College Station, Texas). This study was approved by the University of Texas Southwestern Medical Center Institutional Review Board.
RESULTS
Of 1463 index hospitalizations (Supplemental Figure 1), the 30-day all-cause readmission rate was 13.6%. Individuals with a 30-day readmission had markedly different sociodemographic and clinical characteristics compared to those not readmitted (Table 1; see Supplemental Table 2 for additional clinical characteristics).

Derivation, Validation, and Performance of the Pneumonia-Specific Readmission Risk-Prediction Models
The final first-day pneumonia-specific EHR model included 7 variables, including sociodemographic characteristics; prior hospitalizations; thrombocytosis, and PSI (Table 2). The first-day pneumonia-specific model had adequate discrimination (C statistic, 0.695; optimism-corrected C statistic 0.675, 95% confidence interval [CI], 0.667-0.685; Table 3). It also effectively stratified individuals across a broad range of risk (average predicted decile of risk ranged from 4% to 33%; Table 3) and was well calibrated (Supplemental Table 3).

The final full-stay pneumonia-specific EHR readmission model included 8 predictors, including 3 variables from the first-day model (median income, thrombocytosis, and prior hospitalizations; Table 2). The full-stay pneumonia-specific EHR model also included vital sign instabilities on discharge, updated PSI, and disposition status (ie, being discharged with home health or to a post-acute care facility was associated with greater odds of readmission, and hospice with lower odds). The full-stay pneumonia-specific EHR model had good discrimination (C statistic, 0.731; optimism-corrected C statistic, 0.714; 95% CI, 0.706-0.720), and stratified individuals across a broad range of risk (average predicted decile of risk ranged from 3% to 37%; Table 3), and was also well calibrated (Supplemental Table 3).

First-Day Pneumonia-Specific EHR Model vs First-Day Multi-Condition EHR Model
The first-day pneumonia-specific EHR model outperformed the first-day multi-condition EHR model with better discrimination (P = 0.029) and more correctly classified individuals in the top 2 highest risk quintiles vs the bottom 3 risk quintiles (Table 3, Supplemental Table 4, and Supplemental Figure 2A). With respect to calibration, the first-day multi-condition EHR model overestimated risk among the highest quintile risk group compared to the first-day pneumonia-specific EHR model (Figure 1A, 1B).

Full-Stay Pneumonia-Specific EHR Model vs Other Models
The full-stay pneumonia-specific EHR model comparatively outperformed the corresponding full-stay multi-condition EHR model, as well as the first-day pneumonia-specific EHR model, the CMS pneumonia model, the updated PSI, and the updated CURB-65 (Table 3, Supplemental Table 5, Supplemental Table 6, and Supplemental Figures 2B and 2C). Compared to the full-stay multi-condition and first-day pneumonia-specific EHR models, the full-stay pneumonia-specific EHR model had better discrimination, better reclassification (NRI, 0.09 and 0.08, respectively), and was able to stratify individuals across a broader range of readmission risk (Table 3). It also had better calibration in the highest quintile risk group compared to the full-stay multi-condition EHR model (Figure 1C and 1D).
Updated vs First-Day Modified PSI and CURB-65 Scores
The updated PSI was more strongly predictive of readmission than the PSI calculated on the day of admission (Wald test, 9.83; P = 0.002). Each 10-point increase in the updated PSI was associated with a 22% increased odds of readmission vs an 11% increase for the PSI calculated upon admission (Table 2). The improved predictive ability of the updated PSI and CURB-65 scores was also reflected in the superior discrimination and calibration vs the respective first-day pneumonia severity of illness scores (Table 3).
DISCUSSION
Using routinely available EHR data from 6 diverse hospitals, we developed 2 pneumonia-specific readmission risk-prediction models that aimed to allow hospitals to identify patients hospitalized with pneumonia at high risk for readmission. Overall, we found that a pneumonia-specific model using EHR data from the entire hospitalization outperformed all other models—including the first-day pneumonia-specific model using data present only on admission, our own multi-condition EHR models, and the CMS pneumonia model based on administrative claims data—in all aspects of model performance (discrimination, calibration, and reclassification). We found that socioeconomic status, prior hospitalizations, thrombocytosis, and measures of clinical severity and stability were important predictors of 30-day all-cause readmissions among patients hospitalized with pneumonia. Additionally, an updated discharge PSI score was a stronger independent predictor of readmissions compared to the PSI score calculated upon admission; and inclusion of the updated PSI in our full-stay pneumonia model led to improved prediction of 30-day readmissions.
The marked improvement in performance of the full-stay pneumonia-specific EHR model compared to the first-day pneumonia-specific model suggests that clinical stability and trajectory during hospitalization (as modeled through disposition status, updated PSI, and vital sign instabilities at discharge) are important predictors of 30-day readmission among patients hospitalized for pneumonia, which was not the case for our EHR-based multi-condition models.19 With the inclusion of these measures, the full-stay pneumonia-specific model correctly reclassified an additional 8% of patients according to their true risk compared to the first-day pneumonia-specific model. One implication of these findings is that hospitals interested in targeting their highest risk individuals with pneumonia for transitional care interventions could do so using the first-day pneumonia-specific EHR model and could refine their targeted strategy at the time of discharge by using the full-stay pneumonia model. This staged risk-prediction strategy would enable hospitals to initiate transitional care interventions for high-risk individuals in the inpatient setting (ie, patient education).7 Then, hospitals could enroll both persistent and newly identified high-risk individuals for outpatient interventions (ie, follow-up telephone call) in the immediate post-discharge period, an interval characterized by heightened vulnerability for adverse events,28 based on patients’ illness severity and stability at discharge. This approach can be implemented by hospitals by building these risk-prediction models directly into the EHR, or by extracting EHR data in near real time as our group has done successfully for heart failure.7
Another key implication of our study is that, for pneumonia, a disease-specific modeling approach has better predictive ability than using a multi-condition model. Compared to multi-condition models, the first-day and full-stay pneumonia-specific EHR models correctly reclassified an additional 6% and 9% of patients, respectively. Thus, hospitals interested in identifying the highest risk patients with pneumonia for targeted interventions should do so using the disease-specific models, if the costs and resources of doing so are within reach of the healthcare system.
An additional novel finding of our study is the added value of an updated PSI for predicting adverse events. Studies of pneumonia severity of illness scores have calculated the PSI and CURB-65 scores using data present only on admission.16,24 While our study also confirms that the PSI calculated upon admission is a significant predictor of readmission,23,29 this study extends this work by showing that an updated PSI score calculated at the time of discharge is an even stronger predictor for readmission, and its inclusion in the model significantly improves risk stratification and prognostication.
Our study was noteworthy for several strengths. First, we used data from a common EHR system, thus potentially allowing for the implementation of the pneumonia-specific models in real time across a number of hospitals. The use of routinely collected data for risk-prediction modeling makes this approach scalable and sustainable, because it obviates the need for burdensome data collection and entry. Second, to our knowledge, this is the first study to measure the additive influence of illness severity and stability at discharge on the readmission risk among patients hospitalized with pneumonia. Third, our study population was derived from 6 hospitals diverse in payer status, age, race/ethnicity, and socioeconomic status. Fourth, our models are less likely to be overfit to the idiosyncrasies of our data given that several predictors included in our final pneumonia-specific models have been associated with readmission in this population, including marital status,13,30 income,11,31 prior hospitalizations,11,13 thrombocytosis,32-34 and vital sign instabilities on discharge.17 Lastly, the discrimination of the CMS pneumonia model in our cohort (C statistic, 0.64) closely matched the discrimination observed in 4 independent cohorts (C statistic, 0.63), suggesting adequate generalizability of our study setting and population.10,12
Our results should be interpreted in the context of several limitations. First, generalizability to other regions beyond north Texas is unknown. Second, although we included a diverse cohort of safety net, community, teaching, and nonteaching hospitals, the pneumonia-specific models were not externally validated in a separate cohort, which may lead to more optimistic estimates of model performance. Third, PSI and CURB-65 scores were modified to use diagnostic codes for altered mental status and pleural effusion, and omitted nursing home residence. Thus, the independent associations for the PSI and CURB-65 scores and their predictive ability are likely attenuated. Fourth, we were unable to include data on medications (antibiotics and steroid use) and outpatient visits, which may influence readmission risk.2,9,13,35-40 Fifth, we included only the first pneumonia hospitalization per patient in this study. Had we included multiple hospitalizations per patient, we anticipate better model performance for the 2 pneumonia-specific EHR models since prior hospitalization was a robust predictor of readmission.
In conclusion, the full-stay pneumonia-specific EHR readmission risk-prediction model outperformed the first-day pneumonia-specific model, multi-condition EHR models, and the CMS pneumonia model. This suggests that: measures of clinical severity and stability at the time of discharge are important predictors for identifying patients at highest risk for readmission; and that EHR data routinely collected for clinical practice can be used to accurately predict risk of readmission among patients hospitalized for pneumonia.
Acknowledgments
The authors would like to acknowledge Ruben Amarasingham, MD, MBA, president and chief executive officer of Parkland Center for Clinical Innovation, and Ferdinand Velasco, MD, chief health information officer at Texas Health Resources for their assistance in assembling the 6-hospital cohort used in this study.
Disclosures
This work was supported by the Agency for Healthcare Research and Quality-funded UT Southwestern Center for Patient-Centered Outcomes Research (R24 HS022418-01); the Commonwealth Foundation (#20100323); the UT Southwestern KL2 Scholars Program supported by the National Institutes of Health (KL2 TR001103 to ANM and OKN); and the National Center for Advancing Translational Sciences at the National Institute of Health (U54 RFA-TR-12-006 to E.A.H.). The study sponsors had no role in design and conduct of the study; collection, management, analysis, and interpretation of the data; and preparation, review, or approval of the manuscript. The authors have no financial conflicts of interest to disclose
1. Centers for Disease Control and Prevention. Pneumonia. http://www.cdc.gov/nchs/fastats/pneumonia.htm. Accessed January 26, 2016.
33. Prina E, Ferrer M, Ranzani OT, et al. Thrombocytosis is a marker of poor outcome in community-acquired pneumonia. Chest. 2013;143(3):767-775. PubMed
34. Violi F, Cangemi R, Calvieri C. Pneumonia, thrombosis and vascular disease. J Thromb Haemost. 2014;12(9):1391-1400. PubMed
35. Weinberger M, Oddone EZ, Henderson WG. Does increased access to primary care reduce hospital readmissions? Veterans Affairs Cooperative Study Group on Primary Care and Hospital Readmission. N Engl J Med. 1996;334(22):1441-1447. PubMed
36. Field TS, Ogarek J, Garber L, Reed G, Gurwitz JH. Association of early post-discharge follow-up by a primary care physician and 30-day rehospitalization among older adults. J Gen Intern Med. 2015;30(5):565-571. PubMed
37. Spatz ES, Sheth SD, Gosch KL, et al. Usual source of care and outcomes following acute myocardial infarction. J Gen Intern Med. 2014;29(6):862-869. PubMed
38. Brooke BS, Stone DH, Cronenwett JL, et al. Early primary care provider follow-up and readmission after high-risk surgery. JAMA Surg. 2014;149(8):821-828. PubMed
39. Adamuz J, Viasus D, Campreciós-Rodriguez P, et al. A prospective cohort study of healthcare visits and rehospitalizations after discharge of patients with community-acquired pneumonia. Respirology. 2011;16(7):1119-1126. PubMed
40. Shorr AF, Zilberberg MD, Reichley R, et al. Readmission following hospitalization for pneumonia: the impact of pneumonia type and its implication for hospitals. Clin Infect Dis. 2013;57(3):362-367. PubMed
Pneumonia is a leading cause of hospitalizations in the U.S., accounting for more than 1.1 million discharges annually.1 Pneumonia is frequently complicated by hospital readmission, which is costly and potentially avoidable.2,3 Due to financial penalties imposed on hospitals for higher than expected 30-day readmission rates, there is increasing attention to implementing interventions to reduce readmissions in this population.4,5 However, because these programs are resource-intensive, interventions are thought to be most cost-effective if they are targeted to high-risk individuals who are most likely to benefit.6-8
Current pneumonia-specific readmission risk-prediction models that could enable identification of high-risk patients suffer from poor predictive ability, greatly limiting their use, and most were validated among older adults or by using data from single academic medical centers, limiting their generalizability.9-14 A potential reason for poor predictive accuracy is the omission of known robust clinical predictors of pneumonia-related outcomes, including pneumonia severity of illness and stability on discharge.15-17 Approaches using electronic health record (EHR) data, which include this clinically granular data, could enable hospitals to more accurately and pragmatically identify high-risk patients during the index hospitalization and enable interventions to be initiated prior to discharge.
An alternative strategy to identifying high-risk patients for readmission is to use a multi-condition risk-prediction model. Developing and implementing models for every condition may be time-consuming and costly. We have derived and validated 2 multi-condition risk-prediction models using EHR data—1 using data from the first day of hospital admission (‘first-day’ model), and the second incorporating data from the entire hospitalization (‘full-stay’ model) to reflect in-hospital complications and clinical stability at discharge.18,19 However, it is unknown if a multi-condition model for pneumonia would perform as well as a disease-specific model.
This study aimed to develop 2 EHR-based pneumonia-specific readmission risk-prediction models using data routinely collected in clinical practice—a ‘first-day’ and a ‘full-stay’ model—and compare the performance of each model to: 1) one another; 2) the corresponding multi-condition EHR model; and 3) to other potentially useful models in predicting pneumonia readmissions (the Centers for Medicare and Medicaid Services [CMS] pneumonia model, and 2 commonly used pneumonia severity of illness scores validated for predicting mortality). We hypothesized that the pneumonia-specific EHR models would outperform other models; and the full-stay pneumonia-specific model would outperform the first-day pneumonia-specific model.
METHODS
Study Design, Population, and Data Sources
We conducted an observational study using EHR data collected from 6 hospitals (including safety net, community, teaching, and nonteaching hospitals) in north Texas between November 2009 and October 2010, All hospitals used the Epic EHR (Epic Systems Corporation, Verona, WI). Details of this cohort have been published.18,19
We included consecutive hospitalizations among adults 18 years and older discharged from any medicine service with principal discharge diagnoses of pneumonia (ICD-9-CM codes 480-483, 485, 486-487), sepsis (ICD-9-CM codes 038, 995.91, 995.92, 785.52), or respiratory failure (ICD-9-CM codes 518.81, 518.82, 518.84, 799.1) when the latter 2 were also accompanied by a secondary diagnosis of pneumonia.20 For individuals with multiple hospitalizations during the study period, we included only the first hospitalization. We excluded individuals who died during the index hospitalization or within 30 days of discharge, were transferred to another acute care facility, or left against medical advice.
Outcomes
The primary outcome was all-cause 30-day readmission, defined as a nonelective hospitalization within 30 days of discharge to any of 75 acute care hospitals within a 100-mile radius of Dallas, ascertained from an all-payer regional hospitalization database.
Predictor Variables for the Pneumonia-Specific Readmission Models
The selection of candidate predictors was informed by our validated multi-condition risk-prediction models using EHR data available within 24 hours of admission (‘first-day’ multi-condition EHR model) or during the entire hospitalization (‘full-stay’ multi-condition EHR model).18,19 For the pneumonia-specific models, we included all variables in our published multi-condition models as candidate predictors, including sociodemographics, prior utilization, Charlson Comorbidity Index, select laboratory and vital sign abnormalities, length of stay, hospital complications (eg, venous thromboembolism), vital sign instabilities, and disposition status (see Supplemental Table 1 for complete list of variables). We also assessed additional variables specific to pneumonia for inclusion that were: (1) available in the EHR of all participating hospitals; (2) routinely collected or available at the time of admission or discharge; and (3) plausible predictors of adverse outcomes based on literature and clinical expertise. These included select comorbidities (eg, psychiatric conditions, chronic lung disease, history of pneumonia),10,11,21,22 the pneumonia severity index (PSI),16,23,24 intensive care unit stay, and receipt of invasive or noninvasive ventilation. We used a modified PSI score because certain data elements were missing. The modified PSI (henceforth referred to as PSI) did not include nursing home residence and included diagnostic codes as proxies for the presence of pleural effusion (ICD-9-CM codes 510, 511.1, and 511.9) and altered mental status (ICD-9-CM codes 780.0X, 780.97, 293.0, 293.1, and 348.3X).
Statistical Analysis
Model Derivation. Candidate predictor variables were classified as available in the EHR within 24 hours of admission and/or at the time of discharge. For example, socioeconomic factors could be ascertained within the first day of hospitalization, whereas length of stay would not be available until the day of discharge. Predictors with missing values were assumed to be normal (less than 1% missing for each variable). Univariate relationships between readmission and each candidate predictor were assessed in the overall cohort using a pre-specified significance threshold of P ≤ 0.10. Significant variables were entered in the respective first-day and full-stay pneumonia-specific multivariable logistic regression models using stepwise-backward selection with a pre-specified significance threshold of P ≤ 0.05. In sensitivity analyses, we alternately derived our models using stepwise-forward selection, as well as stepwise-backward selection minimizing the Bayesian information criterion and Akaike information criterion separately. These alternate modeling strategies yielded identical predictors to our final models.
Model Validation. Model validation was performed using 5-fold cross-validation, with the overall cohort randomly divided into 5 equal-size subsets.25 For each cycle, 4 subsets were used for training to estimate model coefficients, and the fifth subset was used for validation. This cycle was repeated 5 times with each randomly-divided subset used once as the validation set. We repeated this entire process 50 times and averaged the C statistic estimates to derive an optimism-corrected C statistic. Model calibration was assessed qualitatively by comparing predicted to observed probabilities of readmission by quintiles of predicted risk, and with the Hosmer-Lemeshow goodness-of-fit test.
Comparison to Other Models. The main comparisons of the first-day and full-stay pneumonia-specific EHR model performance were to each other and the corresponding multi-condition EHR model.18,19 The multi-condition EHR models were separately derived and validated within the larger parent cohort from which this study cohort was derived, and outperformed the CMS all-cause model, the HOSPITAL model, and the LACE index.19 To further triangulate our findings, given the lack of other rigorously validated pneumonia-specific risk-prediction models for readmission,14 we compared the pneumonia-specific EHR models to the CMS pneumonia model derived from administrative claims data,10 and 2 commonly used risk-prediction scores for short-term mortality among patients with community-acquired pneumonia, the PSI and CURB-65 scores.16 Although derived and validated using patient-level data, the CMS model was developed to benchmark hospitals according to hospital-level readmission rates.10 The CURB-65 score in this study was also modified to include the same altered mental status diagnostic codes according to the modified PSI as a proxy for “confusion.” Both the PSI and CURB-65 scores were calculated using the most abnormal values within the first 24 hours of admission. The ‘updated’ PSI and the ‘updated’ CURB-65 were calculated using the most abnormal values within 24 hours prior to discharge, or the last known observation prior to discharge if no results were recorded within this time period. A complete list of variables for each of the comparison models are shown in Supplemental Table 1.
We assessed model performance by calculating the C statistic, integrated discrimination index, and net reclassification index (NRI) compared to our pneumonia-specific models. The integrated discrimination index is the difference in the mean predicted probability of readmission between patients who were and were not actually readmitted between 2 models, where more positive values suggest improvement in model performance compared to a reference model.26 The NRI is defined as the sum of the net proportions of correctly reclassified persons with and without the event of interest.27 Here, we calculated a category-based NRI to evaluate the performance of pneumonia-specific models in correctly classifying individuals with and without readmissions into the 2 highest readmission risk quintiles vs the lowest 3 risk quintiles compared to other models.27 This pre-specified cutoff is relevant for hospitals interested in identifying the highest risk individuals for targeted intervention.7 Finally, we assessed calibration of comparator models in our cohort by comparing predicted probability to observed probability of readmission by quintiles of risk for each model. We conducted all analyses using Stata 12.1 (StataCorp, College Station, Texas). This study was approved by the University of Texas Southwestern Medical Center Institutional Review Board.
RESULTS
Of 1463 index hospitalizations (Supplemental Figure 1), the 30-day all-cause readmission rate was 13.6%. Individuals with a 30-day readmission had markedly different sociodemographic and clinical characteristics compared to those not readmitted (Table 1; see Supplemental Table 2 for additional clinical characteristics).
Derivation, Validation, and Performance of the Pneumonia-Specific Readmission Risk-Prediction Models
The final first-day pneumonia-specific EHR model included 7 variables, including sociodemographic characteristics; prior hospitalizations; thrombocytosis, and PSI (Table 2). The first-day pneumonia-specific model had adequate discrimination (C statistic, 0.695; optimism-corrected C statistic 0.675, 95% confidence interval [CI], 0.667-0.685; Table 3). It also effectively stratified individuals across a broad range of risk (average predicted decile of risk ranged from 4% to 33%; Table 3) and was well calibrated (Supplemental Table 3).
The final full-stay pneumonia-specific EHR readmission model included 8 predictors, including 3 variables from the first-day model (median income, thrombocytosis, and prior hospitalizations; Table 2). The full-stay pneumonia-specific EHR model also included vital sign instabilities on discharge, updated PSI, and disposition status (ie, being discharged with home health or to a post-acute care facility was associated with greater odds of readmission, and hospice with lower odds). The full-stay pneumonia-specific EHR model had good discrimination (C statistic, 0.731; optimism-corrected C statistic, 0.714; 95% CI, 0.706-0.720), and stratified individuals across a broad range of risk (average predicted decile of risk ranged from 3% to 37%; Table 3), and was also well calibrated (Supplemental Table 3).
First-Day Pneumonia-Specific EHR Model vs First-Day Multi-Condition EHR Model
The first-day pneumonia-specific EHR model outperformed the first-day multi-condition EHR model with better discrimination (P = 0.029) and more correctly classified individuals in the top 2 highest risk quintiles vs the bottom 3 risk quintiles (Table 3, Supplemental Table 4, and Supplemental Figure 2A). With respect to calibration, the first-day multi-condition EHR model overestimated risk among the highest quintile risk group compared to the first-day pneumonia-specific EHR model (Figure 1A, 1B).
Full-Stay Pneumonia-Specific EHR Model vs Other Models
The full-stay pneumonia-specific EHR model comparatively outperformed the corresponding full-stay multi-condition EHR model, as well as the first-day pneumonia-specific EHR model, the CMS pneumonia model, the updated PSI, and the updated CURB-65 (Table 3, Supplemental Table 5, Supplemental Table 6, and Supplemental Figures 2B and 2C). Compared to the full-stay multi-condition and first-day pneumonia-specific EHR models, the full-stay pneumonia-specific EHR model had better discrimination, better reclassification (NRI, 0.09 and 0.08, respectively), and was able to stratify individuals across a broader range of readmission risk (Table 3). It also had better calibration in the highest quintile risk group compared to the full-stay multi-condition EHR model (Figure 1C and 1D).
Updated vs First-Day Modified PSI and CURB-65 Scores
The updated PSI was more strongly predictive of readmission than the PSI calculated on the day of admission (Wald test, 9.83; P = 0.002). Each 10-point increase in the updated PSI was associated with a 22% increased odds of readmission vs an 11% increase for the PSI calculated upon admission (Table 2). The improved predictive ability of the updated PSI and CURB-65 scores was also reflected in the superior discrimination and calibration vs the respective first-day pneumonia severity of illness scores (Table 3).
DISCUSSION
Using routinely available EHR data from 6 diverse hospitals, we developed 2 pneumonia-specific readmission risk-prediction models that aimed to allow hospitals to identify patients hospitalized with pneumonia at high risk for readmission. Overall, we found that a pneumonia-specific model using EHR data from the entire hospitalization outperformed all other models—including the first-day pneumonia-specific model using data present only on admission, our own multi-condition EHR models, and the CMS pneumonia model based on administrative claims data—in all aspects of model performance (discrimination, calibration, and reclassification). We found that socioeconomic status, prior hospitalizations, thrombocytosis, and measures of clinical severity and stability were important predictors of 30-day all-cause readmissions among patients hospitalized with pneumonia. Additionally, an updated discharge PSI score was a stronger independent predictor of readmissions compared to the PSI score calculated upon admission; and inclusion of the updated PSI in our full-stay pneumonia model led to improved prediction of 30-day readmissions.
The marked improvement in performance of the full-stay pneumonia-specific EHR model compared to the first-day pneumonia-specific model suggests that clinical stability and trajectory during hospitalization (as modeled through disposition status, updated PSI, and vital sign instabilities at discharge) are important predictors of 30-day readmission among patients hospitalized for pneumonia, which was not the case for our EHR-based multi-condition models.19 With the inclusion of these measures, the full-stay pneumonia-specific model correctly reclassified an additional 8% of patients according to their true risk compared to the first-day pneumonia-specific model. One implication of these findings is that hospitals interested in targeting their highest risk individuals with pneumonia for transitional care interventions could do so using the first-day pneumonia-specific EHR model and could refine their targeted strategy at the time of discharge by using the full-stay pneumonia model. This staged risk-prediction strategy would enable hospitals to initiate transitional care interventions for high-risk individuals in the inpatient setting (ie, patient education).7 Then, hospitals could enroll both persistent and newly identified high-risk individuals for outpatient interventions (ie, follow-up telephone call) in the immediate post-discharge period, an interval characterized by heightened vulnerability for adverse events,28 based on patients’ illness severity and stability at discharge. This approach can be implemented by hospitals by building these risk-prediction models directly into the EHR, or by extracting EHR data in near real time as our group has done successfully for heart failure.7
Another key implication of our study is that, for pneumonia, a disease-specific modeling approach has better predictive ability than using a multi-condition model. Compared to multi-condition models, the first-day and full-stay pneumonia-specific EHR models correctly reclassified an additional 6% and 9% of patients, respectively. Thus, hospitals interested in identifying the highest risk patients with pneumonia for targeted interventions should do so using the disease-specific models, if the costs and resources of doing so are within reach of the healthcare system.
An additional novel finding of our study is the added value of an updated PSI for predicting adverse events. Studies of pneumonia severity of illness scores have calculated the PSI and CURB-65 scores using data present only on admission.16,24 While our study also confirms that the PSI calculated upon admission is a significant predictor of readmission,23,29 this study extends this work by showing that an updated PSI score calculated at the time of discharge is an even stronger predictor for readmission, and its inclusion in the model significantly improves risk stratification and prognostication.
Our study was noteworthy for several strengths. First, we used data from a common EHR system, thus potentially allowing for the implementation of the pneumonia-specific models in real time across a number of hospitals. The use of routinely collected data for risk-prediction modeling makes this approach scalable and sustainable, because it obviates the need for burdensome data collection and entry. Second, to our knowledge, this is the first study to measure the additive influence of illness severity and stability at discharge on the readmission risk among patients hospitalized with pneumonia. Third, our study population was derived from 6 hospitals diverse in payer status, age, race/ethnicity, and socioeconomic status. Fourth, our models are less likely to be overfit to the idiosyncrasies of our data given that several predictors included in our final pneumonia-specific models have been associated with readmission in this population, including marital status,13,30 income,11,31 prior hospitalizations,11,13 thrombocytosis,32-34 and vital sign instabilities on discharge.17 Lastly, the discrimination of the CMS pneumonia model in our cohort (C statistic, 0.64) closely matched the discrimination observed in 4 independent cohorts (C statistic, 0.63), suggesting adequate generalizability of our study setting and population.10,12
Our results should be interpreted in the context of several limitations. First, generalizability to other regions beyond north Texas is unknown. Second, although we included a diverse cohort of safety net, community, teaching, and nonteaching hospitals, the pneumonia-specific models were not externally validated in a separate cohort, which may lead to more optimistic estimates of model performance. Third, PSI and CURB-65 scores were modified to use diagnostic codes for altered mental status and pleural effusion, and omitted nursing home residence. Thus, the independent associations for the PSI and CURB-65 scores and their predictive ability are likely attenuated. Fourth, we were unable to include data on medications (antibiotics and steroid use) and outpatient visits, which may influence readmission risk.2,9,13,35-40 Fifth, we included only the first pneumonia hospitalization per patient in this study. Had we included multiple hospitalizations per patient, we anticipate better model performance for the 2 pneumonia-specific EHR models since prior hospitalization was a robust predictor of readmission.
In conclusion, the full-stay pneumonia-specific EHR readmission risk-prediction model outperformed the first-day pneumonia-specific model, multi-condition EHR models, and the CMS pneumonia model. This suggests that: measures of clinical severity and stability at the time of discharge are important predictors for identifying patients at highest risk for readmission; and that EHR data routinely collected for clinical practice can be used to accurately predict risk of readmission among patients hospitalized for pneumonia.
Acknowledgments
The authors would like to acknowledge Ruben Amarasingham, MD, MBA, president and chief executive officer of Parkland Center for Clinical Innovation, and Ferdinand Velasco, MD, chief health information officer at Texas Health Resources for their assistance in assembling the 6-hospital cohort used in this study.
Disclosures
This work was supported by the Agency for Healthcare Research and Quality-funded UT Southwestern Center for Patient-Centered Outcomes Research (R24 HS022418-01); the Commonwealth Foundation (#20100323); the UT Southwestern KL2 Scholars Program supported by the National Institutes of Health (KL2 TR001103 to ANM and OKN); and the National Center for Advancing Translational Sciences at the National Institute of Health (U54 RFA-TR-12-006 to E.A.H.). The study sponsors had no role in design and conduct of the study; collection, management, analysis, and interpretation of the data; and preparation, review, or approval of the manuscript. The authors have no financial conflicts of interest to disclose
1. Centers for Disease Control and Prevention. Pneumonia. http://www.cdc.gov/nchs/fastats/pneumonia.htm. Accessed January 26, 2016.
33. Prina E, Ferrer M, Ranzani OT, et al. Thrombocytosis is a marker of poor outcome in community-acquired pneumonia. Chest. 2013;143(3):767-775. PubMed
34. Violi F, Cangemi R, Calvieri C. Pneumonia, thrombosis and vascular disease. J Thromb Haemost. 2014;12(9):1391-1400. PubMed
35. Weinberger M, Oddone EZ, Henderson WG. Does increased access to primary care reduce hospital readmissions? Veterans Affairs Cooperative Study Group on Primary Care and Hospital Readmission. N Engl J Med. 1996;334(22):1441-1447. PubMed
36. Field TS, Ogarek J, Garber L, Reed G, Gurwitz JH. Association of early post-discharge follow-up by a primary care physician and 30-day rehospitalization among older adults. J Gen Intern Med. 2015;30(5):565-571. PubMed
37. Spatz ES, Sheth SD, Gosch KL, et al. Usual source of care and outcomes following acute myocardial infarction. J Gen Intern Med. 2014;29(6):862-869. PubMed
38. Brooke BS, Stone DH, Cronenwett JL, et al. Early primary care provider follow-up and readmission after high-risk surgery. JAMA Surg. 2014;149(8):821-828. PubMed
39. Adamuz J, Viasus D, Campreciós-Rodriguez P, et al. A prospective cohort study of healthcare visits and rehospitalizations after discharge of patients with community-acquired pneumonia. Respirology. 2011;16(7):1119-1126. PubMed
40. Shorr AF, Zilberberg MD, Reichley R, et al. Readmission following hospitalization for pneumonia: the impact of pneumonia type and its implication for hospitals. Clin Infect Dis. 2013;57(3):362-367. PubMed
© 2017 Society of Hospital Medicine
Sneak Peek: Journal of Hospital Medicine
BACKGROUND: Readmissions after hospitalization for pneumonia are common, but the few risk-prediction models have poor to modest predictive ability. Data routinely collected in the EHR may improve prediction.
DESIGN: Observational cohort study using backward-stepwise selection and cross validation.
SUBJECTS: Consecutive pneumonia hospitalizations from six diverse hospitals in north Texas from 2009 to 2010.
MEASURES: All-cause, nonelective, 30-day readmissions, ascertained from 75 regional hospitals.
RESULTS: Of 1,463 patients, 13.6% were readmitted. The first-day, pneumonia-specific model included sociodemographic factors, prior hospitalizations, thrombocytosis, and a modified pneumonia severity index. The full-stay model included disposition status, vital sign instabilities on discharge, and an updated pneumonia severity index calculated using values from the day of discharge as additional predictors. The full-stay, pneumonia-specific model outperformed the first-day model (C-statistic, 0.731 vs. 0.695; P = .02; net reclassification index = 0.08). Compared with a validated multicondition readmission model, the Centers for Medicare & Medicaid Services pneumonia model, and two commonly used pneumonia severity of illness scores, the full-stay pneumonia-specific model had better discrimination (C-statistic, 0.604-0.681; P less than 0.01 for all comparisons), predicted a broader range of risk, and better reclassified individuals by their true risk (net reclassification index range, 0.09-0.18).
CONCLUSIONS: EHR data collected from the entire hospitalization can accurately predict readmission risk among patients hospitalized for pneumonia. This approach outperforms a first-day, pneumonia-specific model, the Centers for Medicare & Medicaid Services pneumonia model, and two commonly used pneumonia severity of illness scores.
Also In JHM This Month
Evaluating automated rules for rapid response system alarm triggers in medical and surgical patients
AUTHORS: Santiago Romero-Brufau, MD; Bruce W. Morlan, MS; Matthew Johnson, MPH; Joel Hickman; Lisa L. Kirkland, MD; James M. Naessens, ScD; Jeanne Huddleston, MD, FACP, FHM
Prognosticating with the Hospital-Patient One-year Mortality Risk score using information abstracted from the medical record
AUTHORS: Genevieve Casey, MD, and Carl van Walraven, MD, FRCPC, MSc
Automating venous thromboembolism risk calculation using electronic health record data upon hospital admission: The Automated Padua Prediction Score
AUTHORS: Pierre Elias, MD; Raman Khanna, MD; Adams Dudley, MD, MBA; Jason Davies, MD, PhD; Ronald Jacolbia, MSN; Kara McArthur, BA; Andrew D. Auerbach, MD, MPH, SFHM
The value of ultrasound in cellulitis to rule out deep venous thrombosis
AUTHORS: Hyung J. Cho, MD, and Andrew S. Dunn, MD, SFHM
Hospital medicine and perioperative care: A framework for high quality, high value collaborative care
AUTHORS: Rachel E. Thompson, MD, MPH, SFHM; Kurt Pfeifer, MD, FHM; Paul Grant, MD, SFHM; Cornelia Taylor, MD; Barbara Slawski, MD, FACP, MS, SFHM; Christopher Whinney, MD, FACP, FHM; Laurence Wellikson, MD, MHM; Amir K. Jaffer, MD, MBA, SFHM

Predicting Readmissions from EHR Data
Unplanned hospital readmissions are frequent, costly, and potentially avoidable.[1, 2] Due to major federal financial readmissions penalties targeting excessive 30‐day readmissions, there is increasing attention to implementing hospital‐initiated interventions to reduce readmissions.[3, 4] However, universal enrollment of all hospitalized patients into such programs may be too resource intensive for many hospitals.[5] To optimize efficiency and effectiveness, interventions should be targeted to individuals most likely to benefit.[6, 7] However, existing readmission risk‐prediction models have achieved only modest discrimination, have largely used administrative claims data not available until months after discharge, or are limited to only a subset of patients with Medicare or a specific clinical condition.[8, 9, 10, 11, 12, 13, 14] These limitations have precluded accurate identification of high‐risk individuals in an all‐payer general medical inpatient population to provide actionable information for intervention prior to discharge.
Approaches using electronic health record (EHR) data could allow early identification of high‐risk patients during the index hospitalization to enable initiation of interventions prior to discharge. To date, such strategies have relied largely on EHR data from the day of admission.[15, 16] However, given that variation in 30‐day readmission rates are thought to reflect the quality of in‐hospital care, incorporating EHR data from the entire hospital stay to reflect hospital care processes and clinical trajectory may more accurately identify at‐risk patients.[17, 18, 19, 20] Improved accuracy in risk prediction would help better target intervention efforts in the immediate postdischarge period, an interval characterized by heightened vulnerability for adverse events.[21]
To help hospitals target transitional care interventions more effectively to high‐risk individuals prior to discharge, we derived and validated a readmissions risk‐prediction model incorporating EHR data from the entire course of the index hospitalization, which we termed the full‐stay EHR model. We also compared the full‐stay EHR model performance to our group's previously derived prediction model based on EHR data on the day of admission, termed the first‐day EHR model, as well as to 2 other validated readmission models similarly intended to yield near real‐time risk predictions prior to or shortly after hospital discharge.[9, 10, 15]
METHODS
Study Design, Population, and Data Sources
We conducted an observational cohort study using EHR data from 6 hospitals in the DallasFort Worth metroplex between November 1, 2009 and October 30, 2010 using the same EHR system (Epic Systems Corp., Verona, WI). One site was a university‐affiliated safety net hospital; the remaining 5 sites were teaching and nonteaching community sites.
We included consecutive hospitalizations among adults 18 years old discharged alive from any medicine inpatient service. For individuals with multiple hospitalizations during the study period, we included only the first hospitalization. We excluded individuals who died during the index hospitalization, were transferred to another acute care facility, left against medical advice, or who died outside of the hospital within 30 days of discharge. For model derivation, we randomly split the sample into separate derivation (50%) and validation cohorts (50%).
Outcomes
The primary outcome was 30‐day hospital readmission, defined as a nonelective hospitalization within 30 days of discharge to any of 75 acute care hospitals within a 100‐mile radius of Dallas, ascertained from an all‐payer regional hospitalization database. Nonelective hospitalizations included all hospitalizations classified as a emergency, urgent, or trauma, and excluded those classified as elective as per the Centers for Medicare and Medicaid Services Claim Inpatient Admission Type Code definitions.
Predictor Variables for the Full‐Stay EHR Model
The full‐stay EHR model was iteratively developed from our group's previously derived and validated risk‐prediction model using EHR data available on admission (first‐day EHR model).[15] For the full‐stay EHR model, we included all predictor variables included in our published first‐day EHR model as candidate risk factors. Based on prior literature, we additionally expanded candidate predictors available on admission to include marital status (proxy for social isolation) and socioeconomic disadvantage (percent poverty, unemployment, median income, and educational attainment by zip code of residence as proxy measures of the social and built environment).[22, 23, 24, 25, 26, 27] We also expanded the ascertainment of prior hospitalization to include admissions at both the index hospital and any of 75 acute care hospitals from the same, separate all‐payer regional hospitalization database used to ascertain 30‐day readmissions.
Candidate predictors from the remainder of the hospital stay (ie, following the first 24 hours of admission) were included if they were: (1) available in the EHR of all participating hospitals, (2) routinely collected or available at the time of hospital discharge, and (3) plausible predictors of adverse outcomes based on prior literature and clinical expertise. These included length of stay, in‐hospital complications, transfer to an intensive or coronary care unit, blood transfusions, vital sign instabilities within 24 hours of discharge, select laboratory values at time of discharge, and disposition status. We also assessed trajectories of vital signs and selected laboratory values (defined as changes in these measures from admission to discharge).
Statistical Analysis
Model Derivation
Univariate relationships between readmission and each of the candidate predictors were assessed in the derivation cohort using a prespecified significance threshold of P 0.05. We included all factors from our previously derived and validated first‐day EHR model as candidate predictors.[15] Continuous laboratory and vital sign values at the time of discharge were categorized based on clinically meaningful cutoffs; predictors with missing values were assumed to be normal (<1% missing for each variable). Significant univariate candidate variables were entered in a multivariate logistic regression model using stepwise backward selection with a prespecified significance threshold of P 0.05. We performed several sensitivity analyses to confirm the robustness of our model. First, we alternately derived the full‐stay model using stepwise forward selection. Second, we forced in all significant variables from our first‐day EHR model, and entered the candidate variables from the remainder of the hospital stay using both stepwise backward and forward selection separately. Third, prespecified interactions between variables were evaluated for inclusion. Though final predictors varied slightly between the different approaches, discrimination of each model was similar to the model derived using our primary analytic approach (C statistics 0.01, data not shown).
Model Validation
We assessed model discrimination and calibration of the derived full‐stay EHR model using the validation cohort. Model discrimination was estimated by the C statistic. The C statistic represents the probability that, given 2 hospitalized individuals (1 who was readmitted and the other who was not), the model will predict a higher risk for the readmitted patient than for the nonreadmitted patient. Model calibration was assessed by comparing predicted to observed probabilities of readmission by quintiles of risk, and with the Hosmer‐Lemeshow goodness‐of‐fit test.
Comparison to Existing Models
We compared the full‐stay EHR model performance to 3 previously published models: our group's first‐day EHR model, and the LACE (includes Length of stay, Acute (nonelective) admission status, Charlson Comorbidity Index, and Emergency department visits in the past year) and HOSPITAL (includes Hemoglobin at discharge, discharge from Oncology service, Sodium level at discharge, Procedure during index hospitalization, Index hospitalization Type (nonelective), number of Admissions in the past year, and Length of stay) models, which were both derived to predict 30‐day readmissions among general medical inpatients and were intended to help clinicians identify high‐risk patients to target for discharge interventions.[9, 10, 15] We assessed each model's performance in our validation cohort, calculating the C statistic, integrated discrimination index (IDI), and net reclassification index (NRI) compared to the full‐stay model. IDI is a summary measure of both discrimination and reclassification, where more positive values suggest improvement in model performance in both these domains compared to a reference model.[28] The NRI is defined as the sum of the net proportions of correctly reclassified persons with and without the event of interest.[29] The theoretical range of values is 2 to 2, with more positive values indicating improved net reclassification compared to a reference model. Here, we calculated a category‐based NRI to evaluate the performance of models in correctly classifying individuals with and without readmissions into the highest readmission risk quintile versus the lowest 4 risk quintiles compared to the full‐stay EHR model.[29] This prespecified cutoff is relevant for hospitals interested in identifying the highest‐risk individuals for targeted intervention.[6] Because some hospitals may be able to target a greater number of individuals for intervention, we performed a sensitivity analysis by assessing category‐based NRI for reclassification into the top 2 risk quintiles versus the lowest 3 risk quintiles and found no meaningful difference in our results (data not shown). Finally, we qualitatively assessed calibration of comparator models in our validation cohort by comparing predicted probability to observed probability of readmission by quintiles of risk for each model. We conducted all analyses using Stata 12.1 (StataCorp, College Station, TX). This study was approved by the UT Southwestern Medical Center institutional review board.
RESULTS
Overall, 32,922 index hospitalizations were included in our study cohort; 12.7% resulted in a 30‐day readmission (see Supporting Figure 1 in the online version of this article). Individuals had a mean age of 62 years and had diverse race/ethnicity and primary insurance status; half were female (Table 1). The study sample was randomly split into a derivation cohort (50%, n = 16,492) and validation cohort (50%, n = 16,430). Individuals in the derivation cohort with a 30‐day readmission had markedly different socioeconomic and clinical characteristics compared to those not readmitted (Table 1).
| Entire Cohort, N = 32,922 | Derivation Cohort, N = 16,492 | |||
|---|---|---|---|---|
|
No Readmission, N = 14,312 |
Readmission, N = 2,180 |
P Value | ||
| ||||
| Demographic characteristics | ||||
| Age, y, mean (SD) | 62 (17.3) | 61 (17.4) | 64 (17.0) | 0.001 |
| Female, n (%) | 17,715 (53.8) | 7,694 (53.8) | 1,163 (53.3) | 0.72 |
| Race/ethnicity | 0.001 | |||
| White | 21,359 (64.9) | 9,329 (65.2) | 1,361 (62.4) | |
| Black | 5,964 (18.1) | 2,520 (17.6) | 434 (19.9) | |
| Hispanic | 4,452 (13.5) | 1,931 (13.5) | 338 (15.5) | |
| Other | 1,147 (3.5) | 532 (3.7) | 47 (2.2) | |
| Marital status, n (%) | 0.001 | |||
| Single | 8,076 (24.5) | 3,516 (24.6) | 514 (23.6) | |
| Married | 13,394 (40.7) | 5,950 (41.6) | 812 (37.3) | |
| Separated/divorced | 3,468 (10.5) | 1,460 (10.2) | 251 (11.5) | |
| Widowed | 4,487 (13.7) | 1,868 (13.1) | 388 (17.8) | |
| Other | 3,497 (10.6) | 1,518 (10.6) | 215 (9.9) | |
| Primary payer, n (%) | 0.001 | |||
| Private | 13,090 (39.8) | 5,855 (40.9) | 726 (33.3) | |
| Medicare | 13,015 (39.5) | 5,597 (39.1) | 987 (45.3) | |
| Medicaid | 2,204 (6.7) | 852 (5.9) | 242 (11.1) | |
| Charity, self‐pay, or other | 4,613 (14.0) | 2,008 (14.0) | 225 (10.3) | |
| High‐poverty neighborhood, n (%)* | 7,468 (22.7) | 3,208 (22.4) | 548 (25.1) | 0.001 |
| Utilization history | ||||
| 1 ED visits in past year, n (%) | 9,299 (28.2) | 3,793 (26.5) | 823 (37.8) | 0.001 |
| 1 hospitalizations in past year, n (%) | 10,189 (30.9) | 4,074 (28.5) | 1,012 (46.4) | 0.001 |
| Clinical factors from first day of hospitalization | ||||
| Nonelective admission, n (%) | 27,818 (84.5) | 11,960 (83.6) | 1,960 (89.9) | 0.001 |
| Charlson Comorbidity Index, median (IQR)∥ | 0 (01) | 0 (00) | 0 (03) | 0.001 |
| Laboratory abnormalities within 24 hours of admission | ||||
| Albumin <2 g/dL | 355 (1.1) | 119 (0.8) | 46 (2.1) | 0.001 |
| Albumin 23 g/dL | 4,732 (14.4) | 1,956 (13.7) | 458 (21.0) | 0.001 |
| Aspartate aminotransferase >40 U/L | 4,610 (14.0) | 1,922 (13.4) | 383 (17.6) | 0.001 |
| Creatine phosphokinase <60 g/L | 3,728 (11.3) | 1,536 (10.7) | 330 (15.1) | 0.001 |
| Mean corpuscular volume >100 fL/red cell | 1,346 (4.1) | 537 (3.8) | 134 (6.2) | 0.001 |
| Platelets <90 103/L | 912 (2.8) | 357 (2.5) | 116 (5.3) | 0.001 |
| Platelets >350 103/L | 3,332 (10.1) | 1,433 (10.0) | 283 (13.0) | 0.001 |
| Prothrombin time >35 seconds | 248 (0.8) | 90 (0.6) | 35 (1.6) | 0.001 |
| Clinical factors from remainder of hospital stay | ||||
| Length of stay, d, median (IQR) | 4 (26) | 4 (26) | 5 (38) | 0.001 |
| ICU transfer after first 24 hours, n (%) | 988 (3.0) | 408 (2.9) | 94 (4.3) | 0.001 |
| Hospital complications, n (%) | ||||
| Clostridium difficile infection | 119 (0.4) | 44 (0.3) | 24 (1.1) | 0.001 |
| Pressure ulcer | 358 (1.1) | 126 (0.9) | 46 (2.1) | 0.001 |
| Venous thromboembolism | 301 (0.9) | 112 (0.8) | 34 (1.6) | 0.001 |
| Respiratory failure | 1,048 (3.2) | 463 (3.2) | 112 (5.1) | 0.001 |
| Central line‐associated bloodstream infection | 22 (0.07) | 6 (0.04) | 5 (0.23) | 0.005 |
| Catheter‐associated urinary tract infection | 47 (0.14) | 20 (0.14) | 6 (0.28) | 0.15 |
| Acute myocardial infarction | 293 (0.9) | 110 (0.8) | 32 (1.5) | 0.001 |
| Pneumonia | 1,754 (5.3) | 719 (5.0) | 154 (7.1) | 0.001 |
| Sepsis | 853 (2.6) | 368 (2.6) | 73 (3.4) | 0.04 |
| Blood transfusion during hospitalization, n (%) | 4,511 (13.7) | 1,837 (12.8) | 425 (19.5) | 0.001 |
| Laboratory abnormalities at discharge# | ||||
| Blood urea nitrogen >20 mg/dL, n (%) | 10,014 (30.4) | 4,077 (28.5) | 929 (42.6) | 0.001 |
| Sodium <135 mEq/L, n (%) | 4,583 (13.9) | 1,850 (12.9) | 440 (20.2) | 0.001 |
| Hematocrit 27 | 3,104 (9.4) | 1,231 (8.6) | 287 (13.2) | 0.001 |
| 1 vital sign instability at discharge, n (%)# | 6,192 (18.8) | 2,624 (18.3) | 525 (24.1) | 0.001 |
| Discharge location, n (%) | 0.001 | |||
| Home | 23,339 (70.9) | 10,282 (71.8) | 1,383 (63.4) | |
| Home health | 3,185 (9.7) | 1,356 (9.5) | 234 (10.7) | |
| Postacute care** | 5,990 (18.2) | 2,496 (17.4) | 549 (25.2) | |
| Hospice | 408 (1.2) | 178 (1.2) | 14 (0.6) | |
Derivation and Validation of the Full‐Stay EHR Model for 30‐Day Readmission
Our final model included 24 independent variables, including demographic characteristics, utilization history, clinical factors from the first day of admission, and clinical factors from the remainder of the hospital stay (Table 2). The strongest independent predictor of readmission was hospital‐acquired Clostridium difficile infection (adjusted odds ratio [AOR]: 2.03, 95% confidence interval [CI] 1.18‐3.48); other hospital‐acquired complications including pressure ulcers and venous thromboembolism were also significant predictors. Though having Medicaid was associated with increased odds of readmission (AOR: 1.55, 95% CI: 1.31‐1.83), other zip codelevel measures of socioeconomic disadvantage were not predictive and were not included in the final model. Being discharged to hospice was associated with markedly lower odds of readmission (AOR: 0.23, 95% CI: 0.13‐0.40).
| Odds Ratio (95% CI) | ||
|---|---|---|
| Univariate | Multivariate* | |
| ||
| Demographic characteristics | ||
| Age, per 10 years | 1.08 (1.051.11) | 1.07 (1.041.10) |
| Medicaid | 1.97 (1.702.29) | 1.55 (1.311.83) |
| Widow | 1.44 (1.281.63) | 1.27 (1.111.45) |
| Utilization history | ||
| Prior ED visit, per visit | 1.08 (1.061.10) | 1.04 (1.021.06) |
| Prior hospitalization, per hospitalization | 1.30 (1.271.34) | 1.16 (1.121.20) |
| Hospital and clinical factors from first day of hospitalization | ||
| Nonelective admission | 1.75 (1.512.03) | 1.42 (1.221.65) |
| Charlson Comorbidity Index, per point | 1.19 (1.171.21) | 1.06 (1.041.09) |
| Laboratory abnormalities within 24 hours of admission | ||
| Albumin <2 g/dL | 2.57 (1.823.62) | 1.52 (1.052.21) |
| Albumin 23 g/dL | 1.68 (1.501.88) | 1.20 (1.061.36) |
| Aspartate aminotransferase >40 U/L | 1.37 (1.221.55) | 1.21 (1.061.38) |
| Creatine phosphokinase <60 g/L | 1.48 (1.301.69) | 1.28 (1.111.46) |
| Mean corpuscular volume >100 fL/red cell | 1.68 (1.382.04) | 1.32 (1.071.62) |
| Platelets <90 103/L | 2.20 (1.772.72) | 1.56 (1.231.97) |
| Platelets >350 103/L | 1.34 (1.171.54) | 1.24 (1.081.44) |
| Prothrombin time >35 seconds | 2.58 (1.743.82) | 1.92 (1.272.90) |
| Hospital and clinical factors from remainder of hospital stay | ||
| Length of stay, per day | 1.08 (1.071.09) | 1.06 (1.041.07) |
| Hospital complications | ||
| Clostridium difficile infection | 3.61 (2.195.95) | 2.03 (1.183.48) |
| Pressure ulcer | 2.43 (1.733.41) | 1.64 (1.152.34) |
| Venous thromboembolism | 2.01 (1.362.96) | 1.55 (1.032.32) |
| Laboratory abnormalities at discharge | ||
| Blood urea nitrogen >20 mg/dL | 1.86 (1.702.04) | 1.37 (1.241.52) |
| Sodium <135 mEq/L | 1.70 (1.521.91) | 1.34 (1.181.51) |
| Hematocrit 27 | 1.61 (1.401.85) | 1.22 (1.051.41) |
| Vital sign instability at discharge, per instability | 1.29 (1.201.40) | 1.25 (1.151.36) |
| Discharged to hospice | 0.51 (0.300.89) | 0.23 (0.130.40) |
In our validation cohort, the full‐stay EHR model had fair discrimination, with a C statistic of 0.69 (95% CI: 0.68‐0.70) (Table 3). The full‐stay EHR model was well calibrated across all quintiles of risk, with slight overestimation of predicted risk in the lowest and highest quintiles (Figure 1a) (see Supporting Table 5 in the online version of this article). It also effectively stratified individuals across a broad range of predicted readmission risk from 4.1% in the lowest decile to 36.5% in the highest decile (Table 3).
| Model Name | C‐Statistic (95% CI) | IDI, % (95% CI) | NRI (95% CI) | Average Predicted Risk, % | |
|---|---|---|---|---|---|
| Lowest Decile | Highest Decile | ||||
| |||||
| Full‐stay EHR model | |||||
| Derivation cohort | 0.72 (0.70 to 0.73) | 4.1 | 36.5 | ||
| Validation cohort | 0.69 (0.68 to 0.70) | [Reference] | [Reference] | 4.1 | 36.5 |
| First‐day EHR model | 0.67 (0.66 to 0.68) | 1.2 (1.4 to 1.0) | 0.020 (0.038 to 0.002) | 5.8 | 31.9 |
| LACE model | 0.65 (0.64 to 0.66) | 2.6 (2.9 to 2.3) | 0.046 (0.067 to 0.024) | 6.1 | 27.5 |
| HOSPITAL model | 0.64 (0.62 to 0.65) | 3.2 (3.5 to 2.9) | 0.058 (0.080 to 0.035) | 6.7 | 26.6 |

Comparing the Performance of the Full‐Stay EHR Model to Other Models
The full‐stay EHR model had better discrimination compared to the first‐day EHR model and the LACE and HOSPITAL models, though the magnitude of improvement was modest (Table 3). The full‐stay EHR model also stratified individuals across a broader range of readmission risk, and was better able to discriminate and classify those in the highest quintile of risk from those in the lowest 4 quintiles of risk compared to other models as assessed by the IDI and NRI (Table 3) (see Supporting Tables 14 and Supporting Figure 2 in the online version of this article). In terms of model calibration, both the first‐day EHR and LACE models were also well calibrated, whereas the HOSPITAL model was less robust (Figure 1).
The diagnostic accuracy of the full‐stay EHR model in correctly predicting those in the highest quintile of risk was better than that of the first‐day, LACE, and HOSPITAL models, though overall improvements in the sensitivity, specificity, positive and negative predictive values, and positive and negative likelihood ratios were also modest (see Supporting Table 6 in the online version of this article).
DISCUSSION
In this study, we used clinically detailed EHR data from the entire hospitalization on 32,922 individuals treated in 6 diverse hospitals to develop an all‐payer, multicondition readmission risk‐prediction model. To our knowledge, this is the first 30‐day hospital readmission risk‐prediction model to use a comprehensive set of factors from EHR data from the entire hospital stay. Prior EHR‐based models have focused exclusively on data available on or prior to the first day of admission, which account for clinical severity on admission but do not account for factors uncovered during the inpatient stay that influence the chance of a postdischarge adverse outcome.[15, 30] We specifically assessed the prognostic impact of a comprehensive set of factors from the entire index hospitalization, including hospital‐acquired complications, clinical trajectory, and stability on discharge in predicting hospital readmissions. Our full‐stay EHR model had statistically better discrimination, calibration, and diagnostic accuracy than our existing all‐cause first‐day EHR model[15] and 2 previously published readmissions models that included more limited information from hospitalization (such as length of stay).[9, 10] However, although the more complicated full‐stay EHR model was statistically better than previously published models, we were surprised that the predictive performance was only modestly improved despite the inclusion of many additional clinically relevant prognostic factors.
Taken together, our study has several important implications. First, the added complexity and resource intensity of implementing a full‐stay EHR model yields only modestly improved readmission risk prediction. Thus, hospitals and healthcare systems interested in targeting their highest‐risk individuals for interventions to reduce 30‐day readmission should consider doing so within the first day of hospital admission. Our group's previously derived and validated first‐day EHR model, which used data only from the first day of admission, qualitatively performed nearly as well as the full‐stay EHR model.[15] Additionally, a recent study using only preadmission EHR data to predict 30‐day readmissions also achieved similar discrimination and diagnostic accuracy as our full‐stay model.[30]
Second, the field of readmissions risk‐prediction modeling may be reaching the maximum achievable model performance using data that are currently available in the EHR. Our limited ability to accurately predict all‐cause 30‐day readmission risk may reflect the influence of currently unmeasured patient, system, and community factors on readmissions.[31, 32, 33] Due to the constraints of data collected in the EHR, we were unable to include several patient‐level clinical characteristics associated with hospital readmission, including self‐perceived health status, functional impairment, and cognition.[33, 34, 35, 36] However, given their modest effect sizes (ORs ranging from 1.062.10), adequately measuring and including these risk factors in our model may not meaningfully improve model performance and diagnostic accuracy. Further, many social and behavioral patient‐level factors are also not consistently available in EHR data. Though we explored the role of several neighborhood‐level socioeconomic measuresincluding prevalence of poverty, median income, education, and unemploymentwe found that none were significantly associated with 30‐day readmissions. These particular measures may have been inadequate to characterize individual‐level social and behavioral factors, as several previous studies have demonstrated that patient‐level factors such as social support, substance abuse, and medication and visit adherence can influence readmission risk in heart failure and pneumonia.[11, 16, 22, 25] This underscores the need for more standardized routine collection of data across functional, social, and behavioral domains in clinical settings, as recently championed by the Institute of Medicine.[11, 37] Integrating data from outside the EHR on postdischarge health behaviors, self‐management, follow‐up care, recovery, and home environment may be another important but untapped strategy for further improving prediction of readmissions.[25, 38]
Third, a multicondition readmission risk‐prediction model may be a less effective strategy than more customized disease‐specific models for selected conditions associated with high 30‐day readmission rates. Our group's previously derived and internally validated models for heart failure and human immunodeficiency virus had superior discrimination compared to our full‐stay EHR model (C statistic of 0.72 for each).[11, 13] However, given differences in the included population and time periods studied, a head‐to‐head comparison of these different strategies is needed to assess differences in model performance and utility.
Our study had several strengths. To our knowledge, this is the first study to rigorously measure the additive influence of in‐hospital complications, clinical trajectory, and stability on discharge on the risk of 30‐day hospital readmission. Additionally, our study included a large, diverse study population that included all payers, all ages of adults, a mix of community, academic, and safety net hospitals, and individuals from a broad array of racial/ethnic and socioeconomic backgrounds.
Our results should be interpreted in light of several limitations. First, though we sought to represent a diverse group of hospitals, all study sites were located within north Texas and generalizability to other regions is uncertain. Second, our ascertainment of prior hospitalizations and readmissions was more inclusive than what could be typically accomplished in real time using only EHR data from a single clinical site. We performed a sensitivity analysis using only prior utilization data available within the EHR from the index hospital with no meaningful difference in our findings (data not shown). Additionally, a recent study found that 30‐day readmissions occur at the index hospital for over 75% of events, suggesting that 30‐day readmissions are fairly comprehensively captured even with only single‐site data.[39] Third, we were not able to include data on outpatient visits before or after the index hospitalization, which may influence the risk of readmission.[1, 40]
In conclusion, incorporating clinically granular EHR data from the entire course of hospitalization modestly improves prediction of 30‐day readmissions compared to models that only include information from the first 24 hours of hospital admission or models that use far fewer variables. However, given the limited improvement in prediction, our findings suggest that from the practical perspective of implementing real‐time models to identify those at highest risk for readmission, it may not be worth the added complexity of waiting until the end of a hospitalization to leverage additional data on hospital complications, and the trajectory of laboratory and vital sign values currently available in the EHR. Further improvement in prediction of readmissions will likely require accounting for psychosocial, functional, behavioral, and postdischarge factors not currently present in the inpatient EHR.
Disclosures: This study was presented at the Society of Hospital Medicine 2015 Annual Meeting in National Harbor, Maryland, and the Society of General Internal Medicine 2015 Annual Meeting in Toronto, Canada. This work was supported by the Agency for Healthcare Research and Qualityfunded UT Southwestern Center for Patient‐Centered Outcomes Research (1R24HS022418‐01) and the Commonwealth Foundation (#20100323). Drs. Nguyen and Makam received funding from the UT Southwestern KL2 Scholars Program (NIH/NCATS KL2 TR001103). Dr. Halm was also supported in part by NIH/NCATS U54 RFA‐TR‐12‐006. The study sponsors had no role in the design and conduct of the study; collection, management, analysis, and interpretation of the data; and preparation, review, or approval of the manuscript. The authors have no conflicts of interest to disclose.
- , , . Rehospitalizations among patients in the Medicare fee‐for‐service program. N Engl J Med. 2009;360(14):1418–1428.
- , , , , . Proportion of hospital readmissions deemed avoidable: a systematic review. CMAJ. 2011;183(7):E391–E402.
- , , , , , . Hospital‐initiated transitional care interventions as a patient safety strategy: a systematic review. Ann Intern Med. 2013;158(5 pt 2):433–440.
- , , , , . Interventions to reduce 30‐day rehospitalization: a systematic review. Ann Intern Med. 2011;155(8):520–528.
- , , , , , . Interventions to Improve Care Transitions at Hospital Discharge. Rockville, MD: Agency for Healthcare Research and Quality; 2013.
- , , , et al. Allocating scarce resources in real‐time to reduce heart failure readmissions: a prospective, controlled study. BMJ Qual Saf. 2013;22(12):998–1005.
- , , , , . Implementing electronic health care predictive analytics: considerations and challenges. Health Aff (Millwood). 2014;33(7):1148–1154.
- , , , et al. Risk prediction models for hospital readmission: a systematic review. JAMA. 2011;306(15):1688–1698.
- , , , et al. Derivation and validation of an index to predict early death or unplanned readmission after discharge from hospital to the community. CMAJ. 2010;182(6):551–557.
- , , , . Potentially avoidable 30‐day hospital readmissions in medical patients: derivation and validation of a prediction model. JAMA Intern Med. 2013;173(8):632–638.
- , , , et al. An automated model to identify heart failure patients at risk for 30‐day readmission or death using electronic medical record data. Med Care. 2010;48(11):981–988.
- , , , et al. An automated model using electronic medical record data identifies patients with cirrhosis at high risk for readmission. Clin Gastroenterol Hepatol. 2013;11(10):1335–1341.e1331.
- , , , , , . An electronic medical record‐based model to predict 30‐day risk of readmission and death among HIV‐infected inpatients. J Acquir Immune Defic Syndr. 2012;61(3):349–358.
- , , , et al. Development and use of an administrative claims measure for profiling hospital‐wide performance on 30‐day unplanned readmission. Ann Intern Med. 2014;161(10 suppl):S66–S75.
- , , , et al. Electronic medical record‐based multicondition models to predict the risk of 30 day readmission or death among adult medicine patients: validation and comparison to existing models. BMC Med Inform Decis Mak. 2015;15(1):39.
- , , , et al. Linking electronic health record‐extracted psychosocial data in real‐time to risk of readmission for heart failure. Psychosomatics. 2011;52(4):319–327.
- , . A conceptual framework for the study of early readmission as an indicator of quality of care. Soc Sci Med. 1996;43(11):1533–1541.
- , , , et al. Hospital readmission performance and patterns of readmission: retrospective cohort study of Medicare admissions. BMJ. 2013;347:f6571.
- , , , , , . Getting more performance from performance measurement. N Engl J Med. 2014;371(23):2145–2147.
- , , , et al. Hospital strategy uptake and reductions in unplanned readmission rates for patients with heart failure: a prospective study. J Gen Intern Med. 2015;30(5):605–611.
- . Post‐hospital syndrome—an acquired, transient condition of generalized risk. N Engl J Med. 2013;368(2):100–102.
- , , , et al. Impact of social factors on risk of readmission or mortality in pneumonia and heart failure: systematic review. J Gen Intern Med. 2013;28(2):269–282.
- , , , , , . Effect of clinical and social risk factors on hospital profiling for stroke readmission: a cohort study. Ann Intern Med. 2014;161(11):775–784.
- , , , et al. Neighborhood socioeconomic disadvantage and 30‐day rehospitalization: a retrospective cohort study. Ann Intern Med. 2014;161(11):765–774.
- , , , , , . Postdischarge environmental and socioeconomic factors and the likelihood of early hospital readmission among community‐dwelling Medicare beneficiaries. Gerontologist. 2008;48(4):495–504.
- , , . Socioeconomic status and readmissions: evidence from an urban teaching hospital. Health Aff (Millwood). 2014;33(5):778–785.
- , , , . Adding socioeconomic data to hospital readmissions calculations may produce more useful results. Health Aff (Millwood). 2014;33(5):786–791.
- , , , . Evaluating the added predictive ability of a new marker: from area under the ROC curve to reclassification and beyond. Stat Med. 2008;27(2):157–172; discussion 207–212.
- , , , , . Net reclassification improvement: computation, interpretation, and controversies: a literature review and clinician's guide. Ann Intern Med. 2014;160(2):122–131.
- , , , , , . Predicting 30‐day readmissions with preadmission electronic health record data. Med Care. 2015;53(3):283–289.
- , . Hospital readmissions—not just a measure of quality. JAMA. 2011;306(16):1796–1797.
- , . Thirty‐day readmissions—truth and consequences. N Engl J Med. 2012;366(15):1366–1369.
- , , , . Functional impairment and hospital readmission in medicare seniors. JAMA Intern Med. 2015;175(4):559–565.
- , , . Clinical and sociodemographic risk factors for readmission of Medicare beneficiaries. Health Care Financ Rev. 1988;10(1):27–36.
- , , , , , . Mini‐cog performance: novel marker of post discharge risk among patients hospitalized for heart failure. Circ Heart Fail. 2015;8(1):8–16.
- , , , , , . Association of impaired functional status at hospital discharge and subsequent rehospitalization. J Hosp Med. 2014;9(5):277–282.
- , . Patients in context—EHR capture of social and behavioral determinants of health. N Engl J Med. 2015;372(8):698–701.
- , , , , . Envisioning a social‐health information exchange as a platform to support a patient‐centered medical neighborhood: a feasibility study. J Gen Intern Med. 2015;30(1):60–67.
- , , , , , . Patient factors contributing to variation in same‐hospital readmission rate. Med Care Res Review. 2015;72(3):338–358.
- , , . Does increased access to primary care reduce hospital readmissions? Veterans Affairs Cooperative Study Group on Primary Care and Hospital Readmission. N Engl J Med. 1996;334(22):1441–1447.
Unplanned hospital readmissions are frequent, costly, and potentially avoidable.[1, 2] Due to major federal financial readmissions penalties targeting excessive 30‐day readmissions, there is increasing attention to implementing hospital‐initiated interventions to reduce readmissions.[3, 4] However, universal enrollment of all hospitalized patients into such programs may be too resource intensive for many hospitals.[5] To optimize efficiency and effectiveness, interventions should be targeted to individuals most likely to benefit.[6, 7] However, existing readmission risk‐prediction models have achieved only modest discrimination, have largely used administrative claims data not available until months after discharge, or are limited to only a subset of patients with Medicare or a specific clinical condition.[8, 9, 10, 11, 12, 13, 14] These limitations have precluded accurate identification of high‐risk individuals in an all‐payer general medical inpatient population to provide actionable information for intervention prior to discharge.
Approaches using electronic health record (EHR) data could allow early identification of high‐risk patients during the index hospitalization to enable initiation of interventions prior to discharge. To date, such strategies have relied largely on EHR data from the day of admission.[15, 16] However, given that variation in 30‐day readmission rates are thought to reflect the quality of in‐hospital care, incorporating EHR data from the entire hospital stay to reflect hospital care processes and clinical trajectory may more accurately identify at‐risk patients.[17, 18, 19, 20] Improved accuracy in risk prediction would help better target intervention efforts in the immediate postdischarge period, an interval characterized by heightened vulnerability for adverse events.[21]
To help hospitals target transitional care interventions more effectively to high‐risk individuals prior to discharge, we derived and validated a readmissions risk‐prediction model incorporating EHR data from the entire course of the index hospitalization, which we termed the full‐stay EHR model. We also compared the full‐stay EHR model performance to our group's previously derived prediction model based on EHR data on the day of admission, termed the first‐day EHR model, as well as to 2 other validated readmission models similarly intended to yield near real‐time risk predictions prior to or shortly after hospital discharge.[9, 10, 15]
METHODS
Study Design, Population, and Data Sources
We conducted an observational cohort study using EHR data from 6 hospitals in the DallasFort Worth metroplex between November 1, 2009 and October 30, 2010 using the same EHR system (Epic Systems Corp., Verona, WI). One site was a university‐affiliated safety net hospital; the remaining 5 sites were teaching and nonteaching community sites.
We included consecutive hospitalizations among adults 18 years old discharged alive from any medicine inpatient service. For individuals with multiple hospitalizations during the study period, we included only the first hospitalization. We excluded individuals who died during the index hospitalization, were transferred to another acute care facility, left against medical advice, or who died outside of the hospital within 30 days of discharge. For model derivation, we randomly split the sample into separate derivation (50%) and validation cohorts (50%).
Outcomes
The primary outcome was 30‐day hospital readmission, defined as a nonelective hospitalization within 30 days of discharge to any of 75 acute care hospitals within a 100‐mile radius of Dallas, ascertained from an all‐payer regional hospitalization database. Nonelective hospitalizations included all hospitalizations classified as a emergency, urgent, or trauma, and excluded those classified as elective as per the Centers for Medicare and Medicaid Services Claim Inpatient Admission Type Code definitions.
Predictor Variables for the Full‐Stay EHR Model
The full‐stay EHR model was iteratively developed from our group's previously derived and validated risk‐prediction model using EHR data available on admission (first‐day EHR model).[15] For the full‐stay EHR model, we included all predictor variables included in our published first‐day EHR model as candidate risk factors. Based on prior literature, we additionally expanded candidate predictors available on admission to include marital status (proxy for social isolation) and socioeconomic disadvantage (percent poverty, unemployment, median income, and educational attainment by zip code of residence as proxy measures of the social and built environment).[22, 23, 24, 25, 26, 27] We also expanded the ascertainment of prior hospitalization to include admissions at both the index hospital and any of 75 acute care hospitals from the same, separate all‐payer regional hospitalization database used to ascertain 30‐day readmissions.
Candidate predictors from the remainder of the hospital stay (ie, following the first 24 hours of admission) were included if they were: (1) available in the EHR of all participating hospitals, (2) routinely collected or available at the time of hospital discharge, and (3) plausible predictors of adverse outcomes based on prior literature and clinical expertise. These included length of stay, in‐hospital complications, transfer to an intensive or coronary care unit, blood transfusions, vital sign instabilities within 24 hours of discharge, select laboratory values at time of discharge, and disposition status. We also assessed trajectories of vital signs and selected laboratory values (defined as changes in these measures from admission to discharge).
Statistical Analysis
Model Derivation
Univariate relationships between readmission and each of the candidate predictors were assessed in the derivation cohort using a prespecified significance threshold of P 0.05. We included all factors from our previously derived and validated first‐day EHR model as candidate predictors.[15] Continuous laboratory and vital sign values at the time of discharge were categorized based on clinically meaningful cutoffs; predictors with missing values were assumed to be normal (<1% missing for each variable). Significant univariate candidate variables were entered in a multivariate logistic regression model using stepwise backward selection with a prespecified significance threshold of P 0.05. We performed several sensitivity analyses to confirm the robustness of our model. First, we alternately derived the full‐stay model using stepwise forward selection. Second, we forced in all significant variables from our first‐day EHR model, and entered the candidate variables from the remainder of the hospital stay using both stepwise backward and forward selection separately. Third, prespecified interactions between variables were evaluated for inclusion. Though final predictors varied slightly between the different approaches, discrimination of each model was similar to the model derived using our primary analytic approach (C statistics 0.01, data not shown).
Model Validation
We assessed model discrimination and calibration of the derived full‐stay EHR model using the validation cohort. Model discrimination was estimated by the C statistic. The C statistic represents the probability that, given 2 hospitalized individuals (1 who was readmitted and the other who was not), the model will predict a higher risk for the readmitted patient than for the nonreadmitted patient. Model calibration was assessed by comparing predicted to observed probabilities of readmission by quintiles of risk, and with the Hosmer‐Lemeshow goodness‐of‐fit test.
Comparison to Existing Models
We compared the full‐stay EHR model performance to 3 previously published models: our group's first‐day EHR model, and the LACE (includes Length of stay, Acute (nonelective) admission status, Charlson Comorbidity Index, and Emergency department visits in the past year) and HOSPITAL (includes Hemoglobin at discharge, discharge from Oncology service, Sodium level at discharge, Procedure during index hospitalization, Index hospitalization Type (nonelective), number of Admissions in the past year, and Length of stay) models, which were both derived to predict 30‐day readmissions among general medical inpatients and were intended to help clinicians identify high‐risk patients to target for discharge interventions.[9, 10, 15] We assessed each model's performance in our validation cohort, calculating the C statistic, integrated discrimination index (IDI), and net reclassification index (NRI) compared to the full‐stay model. IDI is a summary measure of both discrimination and reclassification, where more positive values suggest improvement in model performance in both these domains compared to a reference model.[28] The NRI is defined as the sum of the net proportions of correctly reclassified persons with and without the event of interest.[29] The theoretical range of values is 2 to 2, with more positive values indicating improved net reclassification compared to a reference model. Here, we calculated a category‐based NRI to evaluate the performance of models in correctly classifying individuals with and without readmissions into the highest readmission risk quintile versus the lowest 4 risk quintiles compared to the full‐stay EHR model.[29] This prespecified cutoff is relevant for hospitals interested in identifying the highest‐risk individuals for targeted intervention.[6] Because some hospitals may be able to target a greater number of individuals for intervention, we performed a sensitivity analysis by assessing category‐based NRI for reclassification into the top 2 risk quintiles versus the lowest 3 risk quintiles and found no meaningful difference in our results (data not shown). Finally, we qualitatively assessed calibration of comparator models in our validation cohort by comparing predicted probability to observed probability of readmission by quintiles of risk for each model. We conducted all analyses using Stata 12.1 (StataCorp, College Station, TX). This study was approved by the UT Southwestern Medical Center institutional review board.
RESULTS
Overall, 32,922 index hospitalizations were included in our study cohort; 12.7% resulted in a 30‐day readmission (see Supporting Figure 1 in the online version of this article). Individuals had a mean age of 62 years and had diverse race/ethnicity and primary insurance status; half were female (Table 1). The study sample was randomly split into a derivation cohort (50%, n = 16,492) and validation cohort (50%, n = 16,430). Individuals in the derivation cohort with a 30‐day readmission had markedly different socioeconomic and clinical characteristics compared to those not readmitted (Table 1).
| Entire Cohort, N = 32,922 | Derivation Cohort, N = 16,492 | |||
|---|---|---|---|---|
|
No Readmission, N = 14,312 |
Readmission, N = 2,180 |
P Value | ||
| ||||
| Demographic characteristics | ||||
| Age, y, mean (SD) | 62 (17.3) | 61 (17.4) | 64 (17.0) | 0.001 |
| Female, n (%) | 17,715 (53.8) | 7,694 (53.8) | 1,163 (53.3) | 0.72 |
| Race/ethnicity | 0.001 | |||
| White | 21,359 (64.9) | 9,329 (65.2) | 1,361 (62.4) | |
| Black | 5,964 (18.1) | 2,520 (17.6) | 434 (19.9) | |
| Hispanic | 4,452 (13.5) | 1,931 (13.5) | 338 (15.5) | |
| Other | 1,147 (3.5) | 532 (3.7) | 47 (2.2) | |
| Marital status, n (%) | 0.001 | |||
| Single | 8,076 (24.5) | 3,516 (24.6) | 514 (23.6) | |
| Married | 13,394 (40.7) | 5,950 (41.6) | 812 (37.3) | |
| Separated/divorced | 3,468 (10.5) | 1,460 (10.2) | 251 (11.5) | |
| Widowed | 4,487 (13.7) | 1,868 (13.1) | 388 (17.8) | |
| Other | 3,497 (10.6) | 1,518 (10.6) | 215 (9.9) | |
| Primary payer, n (%) | 0.001 | |||
| Private | 13,090 (39.8) | 5,855 (40.9) | 726 (33.3) | |
| Medicare | 13,015 (39.5) | 5,597 (39.1) | 987 (45.3) | |
| Medicaid | 2,204 (6.7) | 852 (5.9) | 242 (11.1) | |
| Charity, self‐pay, or other | 4,613 (14.0) | 2,008 (14.0) | 225 (10.3) | |
| High‐poverty neighborhood, n (%)* | 7,468 (22.7) | 3,208 (22.4) | 548 (25.1) | 0.001 |
| Utilization history | ||||
| 1 ED visits in past year, n (%) | 9,299 (28.2) | 3,793 (26.5) | 823 (37.8) | 0.001 |
| 1 hospitalizations in past year, n (%) | 10,189 (30.9) | 4,074 (28.5) | 1,012 (46.4) | 0.001 |
| Clinical factors from first day of hospitalization | ||||
| Nonelective admission, n (%) | 27,818 (84.5) | 11,960 (83.6) | 1,960 (89.9) | 0.001 |
| Charlson Comorbidity Index, median (IQR)∥ | 0 (01) | 0 (00) | 0 (03) | 0.001 |
| Laboratory abnormalities within 24 hours of admission | ||||
| Albumin <2 g/dL | 355 (1.1) | 119 (0.8) | 46 (2.1) | 0.001 |
| Albumin 23 g/dL | 4,732 (14.4) | 1,956 (13.7) | 458 (21.0) | 0.001 |
| Aspartate aminotransferase >40 U/L | 4,610 (14.0) | 1,922 (13.4) | 383 (17.6) | 0.001 |
| Creatine phosphokinase <60 g/L | 3,728 (11.3) | 1,536 (10.7) | 330 (15.1) | 0.001 |
| Mean corpuscular volume >100 fL/red cell | 1,346 (4.1) | 537 (3.8) | 134 (6.2) | 0.001 |
| Platelets <90 103/L | 912 (2.8) | 357 (2.5) | 116 (5.3) | 0.001 |
| Platelets >350 103/L | 3,332 (10.1) | 1,433 (10.0) | 283 (13.0) | 0.001 |
| Prothrombin time >35 seconds | 248 (0.8) | 90 (0.6) | 35 (1.6) | 0.001 |
| Clinical factors from remainder of hospital stay | ||||
| Length of stay, d, median (IQR) | 4 (26) | 4 (26) | 5 (38) | 0.001 |
| ICU transfer after first 24 hours, n (%) | 988 (3.0) | 408 (2.9) | 94 (4.3) | 0.001 |
| Hospital complications, n (%) | ||||
| Clostridium difficile infection | 119 (0.4) | 44 (0.3) | 24 (1.1) | 0.001 |
| Pressure ulcer | 358 (1.1) | 126 (0.9) | 46 (2.1) | 0.001 |
| Venous thromboembolism | 301 (0.9) | 112 (0.8) | 34 (1.6) | 0.001 |
| Respiratory failure | 1,048 (3.2) | 463 (3.2) | 112 (5.1) | 0.001 |
| Central line‐associated bloodstream infection | 22 (0.07) | 6 (0.04) | 5 (0.23) | 0.005 |
| Catheter‐associated urinary tract infection | 47 (0.14) | 20 (0.14) | 6 (0.28) | 0.15 |
| Acute myocardial infarction | 293 (0.9) | 110 (0.8) | 32 (1.5) | 0.001 |
| Pneumonia | 1,754 (5.3) | 719 (5.0) | 154 (7.1) | 0.001 |
| Sepsis | 853 (2.6) | 368 (2.6) | 73 (3.4) | 0.04 |
| Blood transfusion during hospitalization, n (%) | 4,511 (13.7) | 1,837 (12.8) | 425 (19.5) | 0.001 |
| Laboratory abnormalities at discharge# | ||||
| Blood urea nitrogen >20 mg/dL, n (%) | 10,014 (30.4) | 4,077 (28.5) | 929 (42.6) | 0.001 |
| Sodium <135 mEq/L, n (%) | 4,583 (13.9) | 1,850 (12.9) | 440 (20.2) | 0.001 |
| Hematocrit 27 | 3,104 (9.4) | 1,231 (8.6) | 287 (13.2) | 0.001 |
| 1 vital sign instability at discharge, n (%)# | 6,192 (18.8) | 2,624 (18.3) | 525 (24.1) | 0.001 |
| Discharge location, n (%) | 0.001 | |||
| Home | 23,339 (70.9) | 10,282 (71.8) | 1,383 (63.4) | |
| Home health | 3,185 (9.7) | 1,356 (9.5) | 234 (10.7) | |
| Postacute care** | 5,990 (18.2) | 2,496 (17.4) | 549 (25.2) | |
| Hospice | 408 (1.2) | 178 (1.2) | 14 (0.6) | |
Derivation and Validation of the Full‐Stay EHR Model for 30‐Day Readmission
Our final model included 24 independent variables, including demographic characteristics, utilization history, clinical factors from the first day of admission, and clinical factors from the remainder of the hospital stay (Table 2). The strongest independent predictor of readmission was hospital‐acquired Clostridium difficile infection (adjusted odds ratio [AOR]: 2.03, 95% confidence interval [CI] 1.18‐3.48); other hospital‐acquired complications including pressure ulcers and venous thromboembolism were also significant predictors. Though having Medicaid was associated with increased odds of readmission (AOR: 1.55, 95% CI: 1.31‐1.83), other zip codelevel measures of socioeconomic disadvantage were not predictive and were not included in the final model. Being discharged to hospice was associated with markedly lower odds of readmission (AOR: 0.23, 95% CI: 0.13‐0.40).
| Odds Ratio (95% CI) | ||
|---|---|---|
| Univariate | Multivariate* | |
| ||
| Demographic characteristics | ||
| Age, per 10 years | 1.08 (1.051.11) | 1.07 (1.041.10) |
| Medicaid | 1.97 (1.702.29) | 1.55 (1.311.83) |
| Widow | 1.44 (1.281.63) | 1.27 (1.111.45) |
| Utilization history | ||
| Prior ED visit, per visit | 1.08 (1.061.10) | 1.04 (1.021.06) |
| Prior hospitalization, per hospitalization | 1.30 (1.271.34) | 1.16 (1.121.20) |
| Hospital and clinical factors from first day of hospitalization | ||
| Nonelective admission | 1.75 (1.512.03) | 1.42 (1.221.65) |
| Charlson Comorbidity Index, per point | 1.19 (1.171.21) | 1.06 (1.041.09) |
| Laboratory abnormalities within 24 hours of admission | ||
| Albumin <2 g/dL | 2.57 (1.823.62) | 1.52 (1.052.21) |
| Albumin 23 g/dL | 1.68 (1.501.88) | 1.20 (1.061.36) |
| Aspartate aminotransferase >40 U/L | 1.37 (1.221.55) | 1.21 (1.061.38) |
| Creatine phosphokinase <60 g/L | 1.48 (1.301.69) | 1.28 (1.111.46) |
| Mean corpuscular volume >100 fL/red cell | 1.68 (1.382.04) | 1.32 (1.071.62) |
| Platelets <90 103/L | 2.20 (1.772.72) | 1.56 (1.231.97) |
| Platelets >350 103/L | 1.34 (1.171.54) | 1.24 (1.081.44) |
| Prothrombin time >35 seconds | 2.58 (1.743.82) | 1.92 (1.272.90) |
| Hospital and clinical factors from remainder of hospital stay | ||
| Length of stay, per day | 1.08 (1.071.09) | 1.06 (1.041.07) |
| Hospital complications | ||
| Clostridium difficile infection | 3.61 (2.195.95) | 2.03 (1.183.48) |
| Pressure ulcer | 2.43 (1.733.41) | 1.64 (1.152.34) |
| Venous thromboembolism | 2.01 (1.362.96) | 1.55 (1.032.32) |
| Laboratory abnormalities at discharge | ||
| Blood urea nitrogen >20 mg/dL | 1.86 (1.702.04) | 1.37 (1.241.52) |
| Sodium <135 mEq/L | 1.70 (1.521.91) | 1.34 (1.181.51) |
| Hematocrit 27 | 1.61 (1.401.85) | 1.22 (1.051.41) |
| Vital sign instability at discharge, per instability | 1.29 (1.201.40) | 1.25 (1.151.36) |
| Discharged to hospice | 0.51 (0.300.89) | 0.23 (0.130.40) |
In our validation cohort, the full‐stay EHR model had fair discrimination, with a C statistic of 0.69 (95% CI: 0.68‐0.70) (Table 3). The full‐stay EHR model was well calibrated across all quintiles of risk, with slight overestimation of predicted risk in the lowest and highest quintiles (Figure 1a) (see Supporting Table 5 in the online version of this article). It also effectively stratified individuals across a broad range of predicted readmission risk from 4.1% in the lowest decile to 36.5% in the highest decile (Table 3).
| Model Name | C‐Statistic (95% CI) | IDI, % (95% CI) | NRI (95% CI) | Average Predicted Risk, % | |
|---|---|---|---|---|---|
| Lowest Decile | Highest Decile | ||||
| |||||
| Full‐stay EHR model | |||||
| Derivation cohort | 0.72 (0.70 to 0.73) | 4.1 | 36.5 | ||
| Validation cohort | 0.69 (0.68 to 0.70) | [Reference] | [Reference] | 4.1 | 36.5 |
| First‐day EHR model | 0.67 (0.66 to 0.68) | 1.2 (1.4 to 1.0) | 0.020 (0.038 to 0.002) | 5.8 | 31.9 |
| LACE model | 0.65 (0.64 to 0.66) | 2.6 (2.9 to 2.3) | 0.046 (0.067 to 0.024) | 6.1 | 27.5 |
| HOSPITAL model | 0.64 (0.62 to 0.65) | 3.2 (3.5 to 2.9) | 0.058 (0.080 to 0.035) | 6.7 | 26.6 |
Comparing the Performance of the Full‐Stay EHR Model to Other Models
The full‐stay EHR model had better discrimination compared to the first‐day EHR model and the LACE and HOSPITAL models, though the magnitude of improvement was modest (Table 3). The full‐stay EHR model also stratified individuals across a broader range of readmission risk, and was better able to discriminate and classify those in the highest quintile of risk from those in the lowest 4 quintiles of risk compared to other models as assessed by the IDI and NRI (Table 3) (see Supporting Tables 14 and Supporting Figure 2 in the online version of this article). In terms of model calibration, both the first‐day EHR and LACE models were also well calibrated, whereas the HOSPITAL model was less robust (Figure 1).
The diagnostic accuracy of the full‐stay EHR model in correctly predicting those in the highest quintile of risk was better than that of the first‐day, LACE, and HOSPITAL models, though overall improvements in the sensitivity, specificity, positive and negative predictive values, and positive and negative likelihood ratios were also modest (see Supporting Table 6 in the online version of this article).
DISCUSSION
In this study, we used clinically detailed EHR data from the entire hospitalization on 32,922 individuals treated in 6 diverse hospitals to develop an all‐payer, multicondition readmission risk‐prediction model. To our knowledge, this is the first 30‐day hospital readmission risk‐prediction model to use a comprehensive set of factors from EHR data from the entire hospital stay. Prior EHR‐based models have focused exclusively on data available on or prior to the first day of admission, which account for clinical severity on admission but do not account for factors uncovered during the inpatient stay that influence the chance of a postdischarge adverse outcome.[15, 30] We specifically assessed the prognostic impact of a comprehensive set of factors from the entire index hospitalization, including hospital‐acquired complications, clinical trajectory, and stability on discharge in predicting hospital readmissions. Our full‐stay EHR model had statistically better discrimination, calibration, and diagnostic accuracy than our existing all‐cause first‐day EHR model[15] and 2 previously published readmissions models that included more limited information from hospitalization (such as length of stay).[9, 10] However, although the more complicated full‐stay EHR model was statistically better than previously published models, we were surprised that the predictive performance was only modestly improved despite the inclusion of many additional clinically relevant prognostic factors.
Taken together, our study has several important implications. First, the added complexity and resource intensity of implementing a full‐stay EHR model yields only modestly improved readmission risk prediction. Thus, hospitals and healthcare systems interested in targeting their highest‐risk individuals for interventions to reduce 30‐day readmission should consider doing so within the first day of hospital admission. Our group's previously derived and validated first‐day EHR model, which used data only from the first day of admission, qualitatively performed nearly as well as the full‐stay EHR model.[15] Additionally, a recent study using only preadmission EHR data to predict 30‐day readmissions also achieved similar discrimination and diagnostic accuracy as our full‐stay model.[30]
Second, the field of readmissions risk‐prediction modeling may be reaching the maximum achievable model performance using data that are currently available in the EHR. Our limited ability to accurately predict all‐cause 30‐day readmission risk may reflect the influence of currently unmeasured patient, system, and community factors on readmissions.[31, 32, 33] Due to the constraints of data collected in the EHR, we were unable to include several patient‐level clinical characteristics associated with hospital readmission, including self‐perceived health status, functional impairment, and cognition.[33, 34, 35, 36] However, given their modest effect sizes (ORs ranging from 1.062.10), adequately measuring and including these risk factors in our model may not meaningfully improve model performance and diagnostic accuracy. Further, many social and behavioral patient‐level factors are also not consistently available in EHR data. Though we explored the role of several neighborhood‐level socioeconomic measuresincluding prevalence of poverty, median income, education, and unemploymentwe found that none were significantly associated with 30‐day readmissions. These particular measures may have been inadequate to characterize individual‐level social and behavioral factors, as several previous studies have demonstrated that patient‐level factors such as social support, substance abuse, and medication and visit adherence can influence readmission risk in heart failure and pneumonia.[11, 16, 22, 25] This underscores the need for more standardized routine collection of data across functional, social, and behavioral domains in clinical settings, as recently championed by the Institute of Medicine.[11, 37] Integrating data from outside the EHR on postdischarge health behaviors, self‐management, follow‐up care, recovery, and home environment may be another important but untapped strategy for further improving prediction of readmissions.[25, 38]
Third, a multicondition readmission risk‐prediction model may be a less effective strategy than more customized disease‐specific models for selected conditions associated with high 30‐day readmission rates. Our group's previously derived and internally validated models for heart failure and human immunodeficiency virus had superior discrimination compared to our full‐stay EHR model (C statistic of 0.72 for each).[11, 13] However, given differences in the included population and time periods studied, a head‐to‐head comparison of these different strategies is needed to assess differences in model performance and utility.
Our study had several strengths. To our knowledge, this is the first study to rigorously measure the additive influence of in‐hospital complications, clinical trajectory, and stability on discharge on the risk of 30‐day hospital readmission. Additionally, our study included a large, diverse study population that included all payers, all ages of adults, a mix of community, academic, and safety net hospitals, and individuals from a broad array of racial/ethnic and socioeconomic backgrounds.
Our results should be interpreted in light of several limitations. First, though we sought to represent a diverse group of hospitals, all study sites were located within north Texas and generalizability to other regions is uncertain. Second, our ascertainment of prior hospitalizations and readmissions was more inclusive than what could be typically accomplished in real time using only EHR data from a single clinical site. We performed a sensitivity analysis using only prior utilization data available within the EHR from the index hospital with no meaningful difference in our findings (data not shown). Additionally, a recent study found that 30‐day readmissions occur at the index hospital for over 75% of events, suggesting that 30‐day readmissions are fairly comprehensively captured even with only single‐site data.[39] Third, we were not able to include data on outpatient visits before or after the index hospitalization, which may influence the risk of readmission.[1, 40]
In conclusion, incorporating clinically granular EHR data from the entire course of hospitalization modestly improves prediction of 30‐day readmissions compared to models that only include information from the first 24 hours of hospital admission or models that use far fewer variables. However, given the limited improvement in prediction, our findings suggest that from the practical perspective of implementing real‐time models to identify those at highest risk for readmission, it may not be worth the added complexity of waiting until the end of a hospitalization to leverage additional data on hospital complications, and the trajectory of laboratory and vital sign values currently available in the EHR. Further improvement in prediction of readmissions will likely require accounting for psychosocial, functional, behavioral, and postdischarge factors not currently present in the inpatient EHR.
Disclosures: This study was presented at the Society of Hospital Medicine 2015 Annual Meeting in National Harbor, Maryland, and the Society of General Internal Medicine 2015 Annual Meeting in Toronto, Canada. This work was supported by the Agency for Healthcare Research and Qualityfunded UT Southwestern Center for Patient‐Centered Outcomes Research (1R24HS022418‐01) and the Commonwealth Foundation (#20100323). Drs. Nguyen and Makam received funding from the UT Southwestern KL2 Scholars Program (NIH/NCATS KL2 TR001103). Dr. Halm was also supported in part by NIH/NCATS U54 RFA‐TR‐12‐006. The study sponsors had no role in the design and conduct of the study; collection, management, analysis, and interpretation of the data; and preparation, review, or approval of the manuscript. The authors have no conflicts of interest to disclose.
- , , . Rehospitalizations among patients in the Medicare fee‐for‐service program. N Engl J Med. 2009;360(14):1418–1428.
- , , , , . Proportion of hospital readmissions deemed avoidable: a systematic review. CMAJ. 2011;183(7):E391–E402.
- , , , , , . Hospital‐initiated transitional care interventions as a patient safety strategy: a systematic review. Ann Intern Med. 2013;158(5 pt 2):433–440.
- , , , , . Interventions to reduce 30‐day rehospitalization: a systematic review. Ann Intern Med. 2011;155(8):520–528.
- , , , , , . Interventions to Improve Care Transitions at Hospital Discharge. Rockville, MD: Agency for Healthcare Research and Quality; 2013.
- , , , et al. Allocating scarce resources in real‐time to reduce heart failure readmissions: a prospective, controlled study. BMJ Qual Saf. 2013;22(12):998–1005.
- , , , , . Implementing electronic health care predictive analytics: considerations and challenges. Health Aff (Millwood). 2014;33(7):1148–1154.
- , , , et al. Risk prediction models for hospital readmission: a systematic review. JAMA. 2011;306(15):1688–1698.
- , , , et al. Derivation and validation of an index to predict early death or unplanned readmission after discharge from hospital to the community. CMAJ. 2010;182(6):551–557.
- , , , . Potentially avoidable 30‐day hospital readmissions in medical patients: derivation and validation of a prediction model. JAMA Intern Med. 2013;173(8):632–638.
- , , , et al. An automated model to identify heart failure patients at risk for 30‐day readmission or death using electronic medical record data. Med Care. 2010;48(11):981–988.
- , , , et al. An automated model using electronic medical record data identifies patients with cirrhosis at high risk for readmission. Clin Gastroenterol Hepatol. 2013;11(10):1335–1341.e1331.
- , , , , , . An electronic medical record‐based model to predict 30‐day risk of readmission and death among HIV‐infected inpatients. J Acquir Immune Defic Syndr. 2012;61(3):349–358.
- , , , et al. Development and use of an administrative claims measure for profiling hospital‐wide performance on 30‐day unplanned readmission. Ann Intern Med. 2014;161(10 suppl):S66–S75.
- , , , et al. Electronic medical record‐based multicondition models to predict the risk of 30 day readmission or death among adult medicine patients: validation and comparison to existing models. BMC Med Inform Decis Mak. 2015;15(1):39.
- , , , et al. Linking electronic health record‐extracted psychosocial data in real‐time to risk of readmission for heart failure. Psychosomatics. 2011;52(4):319–327.
- , . A conceptual framework for the study of early readmission as an indicator of quality of care. Soc Sci Med. 1996;43(11):1533–1541.
- , , , et al. Hospital readmission performance and patterns of readmission: retrospective cohort study of Medicare admissions. BMJ. 2013;347:f6571.
- , , , , , . Getting more performance from performance measurement. N Engl J Med. 2014;371(23):2145–2147.
- , , , et al. Hospital strategy uptake and reductions in unplanned readmission rates for patients with heart failure: a prospective study. J Gen Intern Med. 2015;30(5):605–611.
- . Post‐hospital syndrome—an acquired, transient condition of generalized risk. N Engl J Med. 2013;368(2):100–102.
- , , , et al. Impact of social factors on risk of readmission or mortality in pneumonia and heart failure: systematic review. J Gen Intern Med. 2013;28(2):269–282.
- , , , , , . Effect of clinical and social risk factors on hospital profiling for stroke readmission: a cohort study. Ann Intern Med. 2014;161(11):775–784.
- , , , et al. Neighborhood socioeconomic disadvantage and 30‐day rehospitalization: a retrospective cohort study. Ann Intern Med. 2014;161(11):765–774.
- , , , , , . Postdischarge environmental and socioeconomic factors and the likelihood of early hospital readmission among community‐dwelling Medicare beneficiaries. Gerontologist. 2008;48(4):495–504.
- , , . Socioeconomic status and readmissions: evidence from an urban teaching hospital. Health Aff (Millwood). 2014;33(5):778–785.
- , , , . Adding socioeconomic data to hospital readmissions calculations may produce more useful results. Health Aff (Millwood). 2014;33(5):786–791.
- , , , . Evaluating the added predictive ability of a new marker: from area under the ROC curve to reclassification and beyond. Stat Med. 2008;27(2):157–172; discussion 207–212.
- , , , , . Net reclassification improvement: computation, interpretation, and controversies: a literature review and clinician's guide. Ann Intern Med. 2014;160(2):122–131.
- , , , , , . Predicting 30‐day readmissions with preadmission electronic health record data. Med Care. 2015;53(3):283–289.
- , . Hospital readmissions—not just a measure of quality. JAMA. 2011;306(16):1796–1797.
- , . Thirty‐day readmissions—truth and consequences. N Engl J Med. 2012;366(15):1366–1369.
- , , , . Functional impairment and hospital readmission in medicare seniors. JAMA Intern Med. 2015;175(4):559–565.
- , , . Clinical and sociodemographic risk factors for readmission of Medicare beneficiaries. Health Care Financ Rev. 1988;10(1):27–36.
- , , , , , . Mini‐cog performance: novel marker of post discharge risk among patients hospitalized for heart failure. Circ Heart Fail. 2015;8(1):8–16.
- , , , , , . Association of impaired functional status at hospital discharge and subsequent rehospitalization. J Hosp Med. 2014;9(5):277–282.
- , . Patients in context—EHR capture of social and behavioral determinants of health. N Engl J Med. 2015;372(8):698–701.
- , , , , . Envisioning a social‐health information exchange as a platform to support a patient‐centered medical neighborhood: a feasibility study. J Gen Intern Med. 2015;30(1):60–67.
- , , , , , . Patient factors contributing to variation in same‐hospital readmission rate. Med Care Res Review. 2015;72(3):338–358.
- , , . Does increased access to primary care reduce hospital readmissions? Veterans Affairs Cooperative Study Group on Primary Care and Hospital Readmission. N Engl J Med. 1996;334(22):1441–1447.
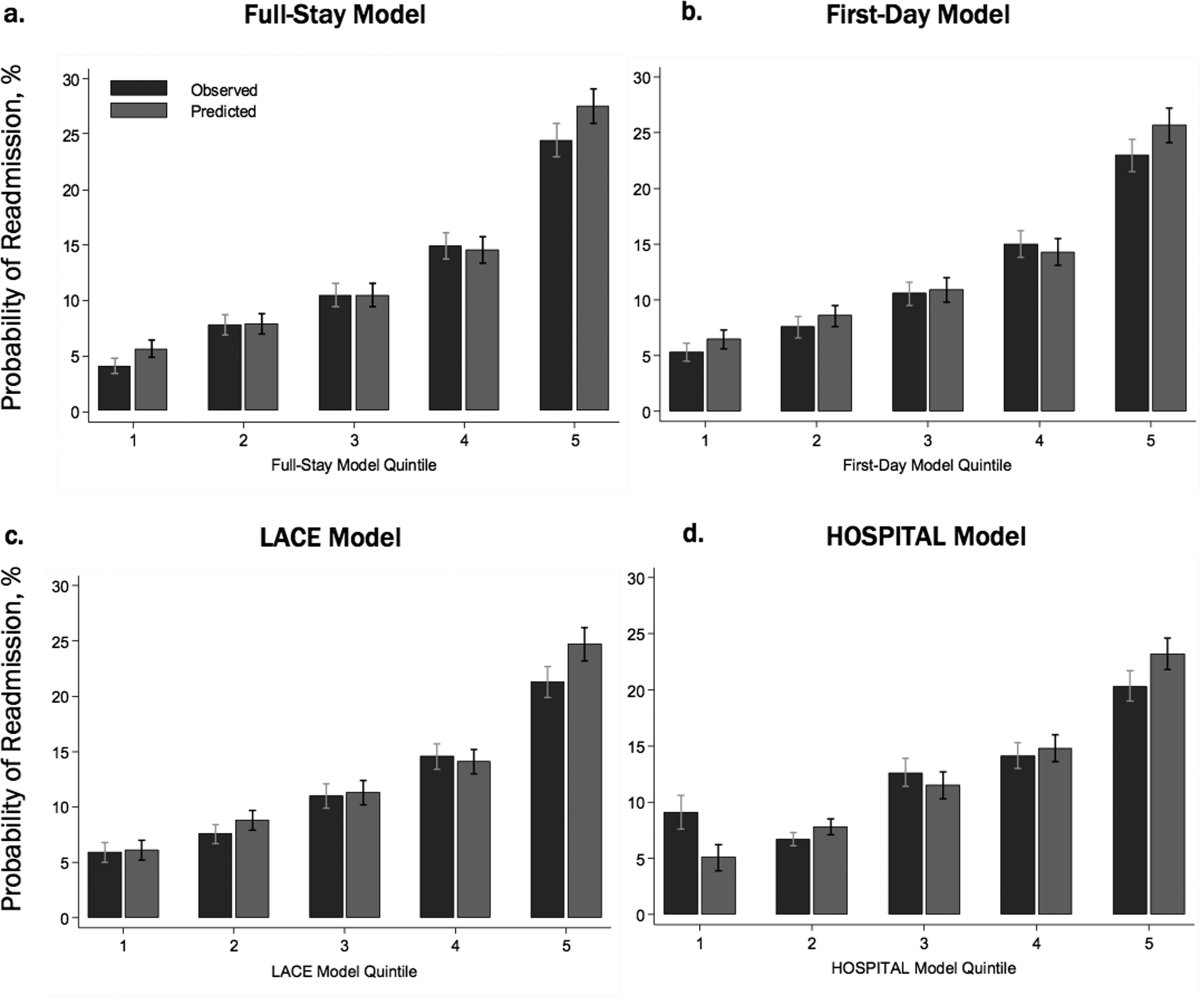
Financial Performance and Outcomes
Hospital care accounts for the single largest category of national healthcare expenditures, totaling $936.9 billion in 2013.[1] With ongoing scrutiny of US healthcare spending, hospitals are under increasing pressure to justify high costs and robust profits.[2] However, the dominant fee‐for‐service reimbursement model creates incentives for hospitals to prioritize high volume over high‐quality care to maximize profits.[3] Because hospitals may be reluctant to implement improvements if better quality is not accompanied by better payment or improved financial margins, an approach to stimulate quality improvement among hospitals has been to leverage consumer pressure through required public reporting of selected outcome metrics.[4, 5] Public reporting of outcomes is thought to influence hospital reputation; in turn, reputation affects patient perceptions and influences demand for hospital services, potentially enabling reputable hospitals to command higher prices for services to enhance hospital revenue.[6, 7]
Though improving outcomes is thought to reduce overall healthcare costs, it is unclear whether improving outcomes results in a hospital's financial return on investment.[4, 5, 8] Quality improvement can require substantial upfront investment, requiring that hospitals already have robust financial health to engage in such initiatives.[9, 10] Consequently, instead of stimulating broad efforts in quality improvement, public reporting may exacerbate existing disparities in hospital quality and finances, by rewarding already financially healthy hospitals, and by inadvertently penalizing hospitals without the means to invest in quality improvement.[11, 12, 13, 14, 15] Alternately, because fee‐for‐service remains the dominant reimbursement model for hospitals, loss of revenue through reducing readmissions may outweigh any financial gains from improved public reputation and result in worse overall financial performance, though robust evidence for this concern is lacking.[16, 17]
A small number of existing studies suggest a limited correlation between improved hospital financial performance and improved quality, patient safety, and lower readmission rates.[18, 19, 20] However, these studies had several limitations. They were conducted prior to public reporting of selected outcome metrics by the Centers for Medicare and Medicaid Services (CMS)[18, 19, 20]; used data from the Medicare Cost Report, which is not uniformly audited and thus prone to measurement error[19, 20]; used only relative measures of hospital financial performance (eg, operating margin), which do not capture the absolute amount of revenue potentially available for investment in quality improvement[18, 19]; or compared only hospitals at the extremes of financial performance, potentially exaggerating the magnitude of the relationship between hospital financial performance and quality outcomes.[19]
To address this gap in the literature, we sought to assess whether hospitals with robust financial performance have lower 30‐day risk‐standardized mortality and hospital readmission rates for acute myocardial infarction (AMI), congestive heart failure (CHF), and pneumonia (PNA). Given the concern that hospitals with the lowest mortality and readmission rates may experience a decrease in financial performance due to the lower volume of hospitalizations, we also assessed whether hospitals with the lowest readmission and mortality rates had a differential change in financial performance over time compared to hospitals with the highest rates.
METHODS
Data Sources and Study Population
This was an observational study using audited financial data from the 2008 and 2012 Hospital Annual Financial Data Files from the Office of Statewide Health Planning and Development (OSHPD) in the state of California, merged with data on outcome measures publicly reported by CMS via the Hospital Compare website for July 1, 2008 to June 30, 2011.[21, 22] We included all general acute care hospitals with available OSHPD data in 2008 and at least 1 publicly reported outcome from 2008 to 2011. We excluded hospitals without 1 year of audited financial data for 2008 and hospitals that closed during 2008 to 2011.
Measures of Financial Performance
Because we hypothesized that the absolute amount of revenue generated from clinical operations would influence investment in quality improvement programs more so than relative changes in revenue,[20] we used net revenue from operations (total operating revenue minus total operating expense) as our primary measure of hospital financial performance. We also performed 2 companion analyses using 2 commonly reported relative measures of financial performanceoperating margin (net revenue from operations divided by total operating revenue) and total margin (net total revenue divided by total revenue from all sources). Net revenue from operations for 2008 was adjusted to 2012 US dollars using the chained Consumer Price Index for all urban consumers.
Outcomes
For our primary analysis, the primary outcomes were publicly reported all‐cause 30‐day risk‐standardized mortality rates (RSMR) and readmission rates (RSRR) for AMI, CHF, and PNA aggregated over a 3‐year period. These measures were adjusted for key demographic and clinical characteristics available in Medicare data. CMS began publicly reporting 30‐day RSMR for AMI and CHF in June 2007, RSMR for PNA in June 2008, and RSRR for all 3 conditions in July 2009.[23, 24]
To assess whether public reporting had an effect on subsequent hospital financial performance, we conducted a companion analysis where the primary outcome of interest was change in hospital financial performance over time, using the same definitions of financial performance outlined above. For this companion analysis, publicly reported 30‐day RSMR and RSRR for AMI, CHF, and PNA were assessed as predictors of subsequent financial performance.
Hospital Characteristics
Hospital characteristics were ascertained from the OSHPD data. Safety‐net status was defined as hospitals with an annual Medicaid caseload (number of Medicaid discharges divided by the total number of discharges) 1 standard deviation above the mean Medicaid caseload, as defined in previous studies.[25]
Statistical Analyses
Effect of Baseline Financial Performance on Subsequent Publicly Reported Outcomes
To estimate the relationship between baseline hospital financial performance in 2008 and subsequent RSMR and RSRR for AMI, CHF, and PNA from 2008 to 2011, we used linear regression adjusted for the following hospital characteristics: teaching status, rural location, bed size, safety‐net status, ownership, Medicare caseload, and volume of cases reported for the respective outcome. We accounted for clustering of hospitals by ownership. We adjusted for hospital volume of reported cases for each condition given that the risk‐standardization models used by CMS shrink outcomes for small hospitals to the mean, and therefore do not account for a potential volume‐outcome relationship.[26] We conducted a sensitivity analysis excluding hospitals at the extremes of financial performance, defined as hospitals with extreme outlier values for each financial performance measure (eg, values more than 3 times the interquartile range above the first quartile or below the third quartile).[27] Nonlinearity of financial performance measures was assessed using restricted cubic splines. For ease of interpretation, we scaled the estimated change in RSMR and RSRR per $50 million increase in net revenue from operations, and graphed nonparametric relationships using restricted cubic splines.
Effect of Public Reporting on Subsequent Hospital Financial Performance
To assess whether public reporting had an effect on subsequent hospital financial performance, we conducted a companion hospital‐level difference‐in‐differences analysis to assess for differential changes in hospital financial performance between 2008 and 2012, stratified by tertiles of RSMR and RSRR rates from 2008 to 2011. This approach compares differences in an outcome of interest (hospital financial performance) within each group (where each group is a tertile of publicly reported rates of RSMR or RSRR), and then compares the difference in these differences between groups. Therefore, these analyses use each group as their own historical control and the opposite group as a concurrent control to account for potential secular trends. To conduct our difference‐in‐differences analysis, we compared the change in financial performance over time in the top tertile of hospitals to the change in financial performance over time in the bottom tertile of hospitals with respect to AMI, CHF, and PNA RSMR and RSRR. Our models therefore included year (2008 vs 2012), tertile of publicly reported rates for RSMR or RSRR, and the interaction between them as predictors, where the interaction was the difference‐in‐differences term and the primary predictor of interest. In addition to adjusting for hospital characteristics and accounting for clustering as mentioned above, we also included 3 separate interaction terms for year with bed size, safety‐net status, and Medicare caseload, to account for potential changes in the hospitals over time that may have independently influenced financial performance and publicly reported 30‐day measures. For sensitivity analyses, we repeated our difference‐in‐differences analyses excluding hospitals with a change in ownership and extreme outliers with respect to financial performance in 2008. We performed model diagnostics including assessment of functional form, linearity, normality, constant variance, and model misspecification. All analyses were conducted using Stata version 12.1 (StataCorp, College Station, TX). This study was deemed exempt from review by the UT Southwestern Medical Center institutional review board.
RESULTS
Among the 279 included hospitals (see Supporting Figure 1 in the online version of this article), 278 also had financial data available for 2012. In 2008, the median net revenue from operations was $1.6 million (interquartile range [IQR], $2.4 to $10.3 million), the median operating margin was 1.5% (IQR, 4.6% to 6%), and the median total margin was 2.5% (IQR, 2.2% to 7.5% (Table 1). The number of hospitals reporting each outcome, and median outcome rates, are shown in Table 2.
| 2008, n = 279 | 2012, n = 278 | |
|---|---|---|
| ||
| Hospital characteristics | ||
| Teaching, n (%) | 28 (10.0) | 28 (10.0) |
| Rural, n (%) | 55 (19.7) | 55 (19.7) |
| Bed size, n (%) | ||
| 099 (small) | 57 (20.4) | 55 (19.8) |
| 100299 (medium) | 130 (46.6) | 132 (47.5) |
| 300 (large) | 92 (33.0) | 91 (32.7) |
| Safety‐net hospital, n (%)* | 46 (16.5) | 48 (17.3) |
| Hospital ownership, n (%) | ||
| City or county | 15 (5.4) | 16 (5.8) |
| District | 42 (15.1) | 39 (14.0) |
| Investor | 66 (23.7) | 66 (23.7) |
| Private nonprofit | 156 (55.9) | 157 (56.5) |
| Medicare caseload, mean % (SD) | 41.6 (14.7) | 43.6 (14.7) |
| Financial performance measures | ||
| Net revenue from operations, median $ in millions (IQR; range) | 1.6 (2.4 to 10.3; 495.9 to 144.1) | 3.2 (2.9 to 15.4; 396.2 to 276.8) |
| Operating margin, median % (IQR; range) | 1.5 (4.6 to 6.8; 77.8 to 26.4) | 2.3 (3.9 to 8.2; 134.8 to 21.1) |
| Total margin, median % (IQR; range) | 2.5 (2.2 to 7.5; 101.0 to 26.3) | 4.5 (0.7 to 9.8; 132.2 to 31.1) |
| No. | Median % (IQR) | Adjusted % Change (95% CI) per $50 Million Increase in Net Revenue From Operations | ||
|---|---|---|---|---|
| Overall | Extreme Outliers Excluded | |||
| ||||
| Myocardial infarction | ||||
| Mortality rate | 211 | 15.2 (14.216.2) | 0.07 (0.10 to 0.24) | 0.63 (0.21 to 1.48) |
| Readmission rate | 184 | 19.4 (18.520.2) | Nonlinear | 0.34 (1.17 to 0.50) |
| Congestive heart failure | ||||
| Mortality rate | 259 | 11.1 (10.112.1) | 0.17 (0.01 to 0.35) | Nonlinear∥ |
| Readmission rate | 264 | 24.5 (23.525.6) | 0.07 (0.27 to 0.14) | 0.45 (1.36 to 0.47) |
| Pneumonia | ||||
| Mortality rate | 268 | 11.6 (10.413.2) | 0.17 (0.42 to 0.07) | 0.35 (1.19 to 0.49) |
| Readmission rate | 268 | 18.2 (17.319.1) | 0.04 (0.20 to 0.11) | 0.56 (1.27 to 0.16) |
Relationship Between Financial Performance and Publicly Reported Outcomes
Acute Myocardial Infarction
We did not observe a consistent relationship between hospital financial performance and AMI mortality and readmission rates. In our overall adjusted analyses, net revenue from operations was not associated with mortality, but was significantly associated with a decrease in AMI readmissions among hospitals with net revenue from operations between approximately $5 million to $145 million (nonlinear relationship, F statistic = 4.8, P < 0.001 (Table 2, Figure 1A). However, after excluding 23 extreme outlying hospitals by net revenue from operations (10 underperformers with net revenue <$49.4 million and 13 overperformers with net revenue >$52.1 million), this relationship was no longer observed. Using operating margin instead of net revenue from operations as the measure of hospital financial performance, we observed a 0.2% increase in AMI mortality (95% confidence interval [CI]: 0.06%‐0.35%) (see Supporting Table 1 and Supporting Figure 2 in the online version of this article) for each 10% increase in operating margin, which persisted with the exclusion of 5 outlying hospitals by operating margin (all 5 were underperformers, with operating margins <38.6%). However, using total margin as the measure of financial performance, there was no significant relationship with either mortality or readmissions (see Supporting Table 2 and Supporting Figure 3 in the online version of this article).
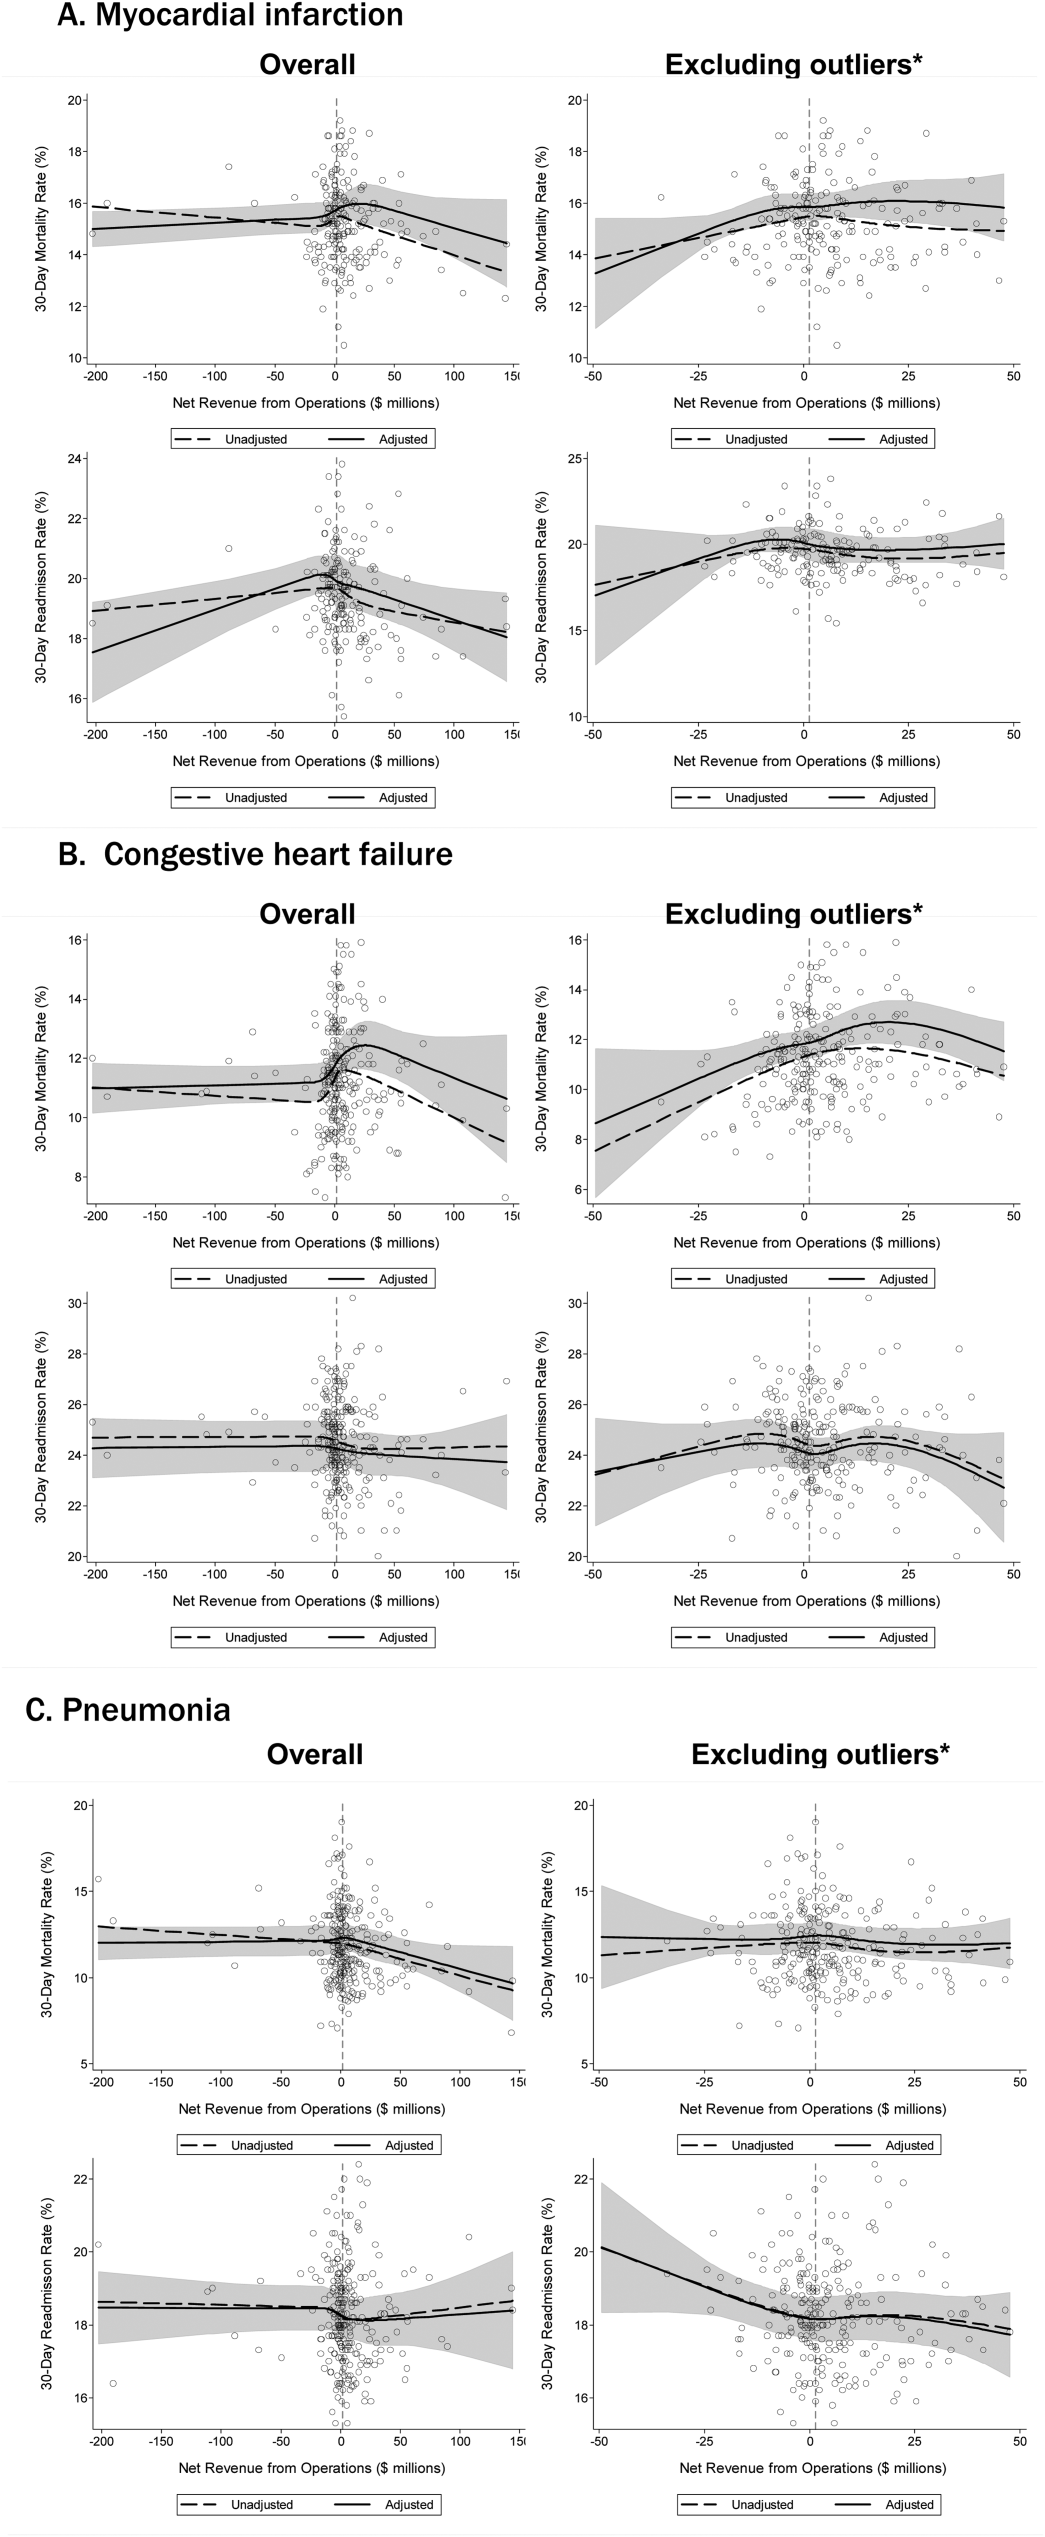
Congestive Heart Failure
In our primary analyses, we did not observe a significant relationship between net revenue from operations and CHF mortality and readmission rates. However, after excluding 23 extreme outliers, increasing net revenue from operations was associated with a modest increase in CHF mortality among hospitals, with net revenue between approximately $35 million and $20 million (nonlinear relationship, F statistic = 3.6, P = 0.008 (Table 2, Figure 1B). Using alternate measures of financial performance, we observed a consistent relationship between increasing hospital financial performance and higher 30‐day CHF mortality rate. Using operating margin, we observed a slight increase in the mortality rate for CHF (0.26% increase in CHF RSMR for every 10% increase in operating margin) (95% CI: 0.07%‐0.45%) (see Supporting Table 1 and Supporting Figure 2 in the online version of this article), which persisted after the exclusion of 5 extreme outliers. Using total margin, we observed a significant but modest association between improved hospital financial performance and increased mortality rate for CHF (nonlinear relationship, F statistic = 2.9, P = 0.03) (see Supporting Table 2 and Supporting Figure 3 in the online version of this article), which persisted after the exclusion of 3 extreme outliers (0.32% increase in CHF RSMR for every 10% increase in total margin) (95% CI: 0.03%‐0.62%).
Pneumonia
Hospital financial performance (using net revenue, operating margin, or total margin) was not associated with 30‐day PNA mortality or readmission rates.
Relationship of Readmission and Mortality Rates on Subsequent Hospital Financial Performance
Compared to hospitals in the highest tertile of readmission and mortality rates (ie, those with the worst rates), hospitals in the lowest tertile of readmission and mortality rates (ie, those with the best rates) had a similar magnitude of increase in net revenue from operations from 2008 to 2012 (Table 3). The difference‐in‐differences analyses showed no relationship between readmission or mortality rates for AMI, CHF, and PNA and changes in net revenue from operations from 2008 to 2012 (difference‐in‐differences estimates ranged from $8.61 to $6.77 million, P > 0.3 for all). These results were robust to the exclusion of hospitals with a change in ownership and extreme outliers by net revenue from operations (data not reported).
| Outcome | Tertile With Highest Outcome Rates (Worst Hospitals) | Tertile With Lowest Outcome Rates (Best Hospitals) | Difference in Net From Operations Differences Between Highest and Lowest Outcome Rate Tertiles, $ Million (95% CI) | P | ||
|---|---|---|---|---|---|---|
| Outcome, Median % (IQR) | Gain/Loss in Net Revenue From Operations From 2008 to 2012, $ Million* | Outcome, Median % (IQR) | Gain/Loss in Net Revenue from Operations From 2008 to 2012, $ Million* | |||
| ||||||
| AMI mortality | 16.7 (16.217.4) | +65.62 | 13.8 (13.314.2) | +74.23 | 8.61 (27.95 to 10.73) | 0.38 |
| AMI readmit | 20.7 (20.321.5) | +38.62 | 18.3 (17.718.6) | +31.85 | +6.77 (13.24 to 26.77) | 0.50 |
| CHF mortality | 13.0 (12.313.9) | +45.66 | 9.6 (8.910.1) | +48.60 | 2.94 (11.61 to 5.73) | 0.50 |
| CHF readmit | 26.2 (25.726.9) | +47.08 | 23.0 (22.323.5) | +46.08 | +0.99 (10.51 to 12.50) | 0.87 |
| PNA mortality | 13.9 (13.314.7) | +43.46 | 9.9 (9.310.4) | +38.28 | +5.18 (7.01 to 17.37) | 0.40 |
| PNA readmit | 19.4 (19.120.1) | +47.21 | 17.0 (16.517.3) | +45.45 | +1.76 (8.34 to 11.86) | 0.73 |
DISCUSSION
Using audited financial data from California hospitals in 2008 and 2012, and CMS data on publicly reported outcomes from 2008 to 2011, we found no consistent relationship between hospital financial performance and publicly reported outcomes for AMI and PNA. However, better hospital financial performance was associated with a modest increase in 30‐day risk‐standardized CHF mortality rates, which was consistent across all 3 measures of hospital financial performance. Reassuringly, there was no difference in the change in net revenue from operations between 2008 and 2012 between hospitals in the highest and lowest tertiles of readmission and mortality rates for AMI, CHF, and PNA. In other words, hospitals with the lowest rates of 30‐day readmissions and mortality for AMI, CHF, and PNA did not experience a loss in net revenue from operations over time, compared to hospitals with the highest readmission and mortality rates.
Our study differs in several important ways from Ly et al., the only other study to our knowledge that investigated the relationship between hospital financial performance and outcomes for patients with AMI, CHF, and PNA.[19] First, outcomes in the Ly et al. study were ascertained in 2007, which preceded public reporting of outcomes. Second, the primary comparison was between hospitals in the bottom versus top decile of operating margin. Although Ly and colleagues also found no association between hospital financial performance and mortality rates for these 3 conditions, they found a significant absolute decrease of approximately 3% in readmission rates among hospitals in the top decile of operating margin versus those in bottom decile. However, readmission rates were comparable among the remaining 80% of hospitals, suggesting that these findings primarily reflected the influence of a few outlier hospitals. Third, the use of nonuniformly audited hospital financial data may have resulted in misclassification of financial performance. Our findings also differ from 2 previous studies that identified a modest association between improved hospital financial performance and decreased adverse patient safety events.[18, 20] However, publicly reported outcomes may not be fully representative of hospital quality and patient safety.[28, 29]
The limited association between hospital financial performance and publicly reported outcomes for AMI and PNA is noteworthy for several reasons. First, publicly reporting outcomes alone without concomitant changes to reimbursement may be inadequate to create strong financial incentives for hospital investment in quality improvement initiatives. Hospitals participating in both public reporting of outcomes and pay‐for‐performance have been shown to achieve greater improvements in outcomes than hospitals engaged only in public reporting.[30] Our time interval for ascertainment of outcomes preceded CMS implementation of the Hospital Readmissions Reduction Program (HRRP) in October 2012, which withholds up to 3% of Medicare hospital reimbursements for higher than expected mortality and readmission rates for AMI, CHF, and PNA. Once outcomes data become available for a 3‐year post‐HRRP implementation period, the impact of this combined approach can be assessed. Second, because adherence to many evidence‐based process measures for these conditions (ie, aspirin use in AMI) is already high, there may be a ceiling effect present that obviates the need for further hospital financial investment to optimize delivery of best practices.[31, 32] Third, hospitals themselves may contribute little to variation in mortality and readmission risk. Of the total variation in mortality and readmission rates among Texas Medicare beneficiaries, only about 1% is attributable to hospitals, whereas 42% to 56% of the variation is explained by differences in patient characteristics.[33, 34] Fourth, there is either low‐quality or insufficient evidence that transitional care interventions specifically targeted to patients with AMI or PNA result in better outcomes.[35] Thus, greater financial investment in hospital‐initiated and postdischarge transitional care interventions for these specific conditions may result in less than the desired effect. Lastly, many hospitalizations for these conditions are emergency hospitalizations that occur after patients present to the emergency department with unexpected and potentially life‐threatening symptoms. Thus, patients may not be able to incorporate the reputation or performance metrics of a hospital in their decisions for where they are hospitalized for AMI, CHF, or PNA despite the public reporting of outcomes.
Given the strong evidence that transitional care interventions reduce readmissions and mortality among patients hospitalized with CHF, we were surprised to find that improved hospital financial performance was associated with an increased risk‐adjusted CHF mortality rate.[36] This association held true for all 3 different measures of hospital financial performance, suggesting that this unexpected finding is unlikely to be the result of statistical chance, though potential reasons for this association remain unclear. One possibility is that the CMS model for CHF mortality may not adequately risk adjust for severity of illness.[37, 38] Thus, robust financial performance may be a marker for hospitals with more advanced heart failure services that care for more patients with severe illness.
Our findings should be interpreted in the context of certain limitations. Our study only included an analysis of outcomes for AMI, CHF, and PNA among older fee‐for‐service Medicare beneficiaries aggregated at the hospital level in California between 2008 and 2012, so generalizability to other populations, conditions, states, and time periods is uncertain. The observational design precludes a robust causal inference between financial performance and outcomes. For readmissions, rates were publicly reported for only the last 2 years of the 3‐year reporting period; thus, our findings may underestimate the association between hospital financial performance and publicly reported readmission rates.
CONCLUSION
There is no consistent relationship between hospital financial performance and subsequent publicly reported outcomes for AMI and PNA. However, for unclear reasons, hospitals with better financial performance had modestly higher CHF mortality rates. Given this limited association, public reporting of outcomes may have had less than the intended impact in motivating hospitals to invest in quality improvement. Additional financial incentives in addition to public reporting, such as readmissions penalties, may help motivate hospitals with robust financial performance to further improve outcomes. This would be a key area for future investigation once outcomes data are available for the 3‐year period following CMS implementation of readmissions penalties in 2012. Reassuringly, there was no association between low 30‐day mortality and readmissions rates and subsequent poor financial performance, suggesting that improved outcomes do not necessarily lead to loss of revenue.
Disclosures
Drs. Nguyen, Halm, and Makam were supported in part by the Agency for Healthcare Research and Quality University of Texas Southwestern Center for Patient‐Centered Outcomes Research (1R24HS022418‐01). Drs. Nguyen and Makam received funding from the University of Texas Southwestern KL2 Scholars Program (NIH/NCATS KL2 TR001103). The study sponsors had no role in design and conduct of the study; collection, management, analysis, and interpretation of the data; and preparation, review, or approval of the manuscript. The authors have no conflicts of interest to disclose.
- Centers for Medicare and Medicaid Services. Office of the Actuary. National Health Statistics Group. National Healthcare Expenditures Data. Baltimore, MD; 2013. https://www.cms.gov/Research-Statistics-Data-and-Systems/Statistics-Trends-and-Reports/NationalHealthExpendData/NationalHealthAccountsHistorical.html. Accessed February 16, 2016.
- . Bitter pill: why medical bills are killing us. Time Magazine. February 20, 2013:16–55.
- . Fee‐for‐service will remain a feature of major payment reforms, requiring more changes in Medicare physician payment. Health Aff (Millwood). 2012;31(9):1977–1983.
- , , , et al. The business case for quality: case studies and an analysis. Health Aff (Millwood). 2003;22(2):17–30.
- , , , . Public reporting on quality in the United States and the United Kingdom. Health Aff (Millwood). 2003;22(3):134–148.
- , , , , . The business case for health‐care quality improvement. J Patient Saf. 2013;9(1):44–52.
- , , . Hospital performance reports: impact on quality, market share, and reputation. Health Aff (Millwood). 2005;24(4):1150–1160.
- , , , . The savings illusion—why clinical quality improvement fails to deliver bottom‐line results. N Engl J Med. 2011;365(26):e48.
- , , , , . Hospital Quality: Ingredients for Success—Overview and Lessons Learned. New York, NY: Commonwealth Fund; 2004.
- , , . Hospital Quality Improvement: Strategies and Lessons from U.S. Hospitals. New York, NY: Commonwealth Fund; 2007.
- , , , et al. Hospital financial condition and operational decisions related to the quality of hospital care. Med Care Res Rev. 2007;64(2):148–168.
- , , , , , . Will pay‐for‐performance and quality reporting affect health care disparities? Health Aff (Millwood). 2007;26(3):w405–w414.
- , , . Comparison of change in quality of care between safety‐net and non‐safety‐net hospitals. JAMA. 2008;299(18):2180–2187.
- , . Could Medicare readmission policy exacerbate health care system inequity? Ann Intern Med. 2010;152(2):114–117.
- , . Minding the gap between efforts to reduce readmissions and disparities. JAMA. 2011;305(7):715–716.
- , . Medicare Health Support Pilot Program. N Engl J Med. 2012;366(7):666; author reply 667–668.
- , . Revisiting hospital readmissions. JAMA. 2013;309(4):398–400.
- , . Hospital finances and patient safety outcomes. Inquiry. 2005;42(1):60–72.
- , , . The association between hospital margins, quality of care, and closure or other change in operating status. J Gen Intern Med. 2011;26(11):1291–1296.
- , , , . Hospital financial condition and the quality of patient care. Health Econ. 2008;17(8):977–995.
- State of California Office of Statewide Health Planning and Development. Healthcare Information Division. Annual financial data. Available at: http://www.oshpd.ca.gov/HID/Products/Hospitals/AnnFinanData/PivotProfles/default.asp. Accessed June 23, 2015.
- Centers for Medicare 4(1):11–13.
- , , , et al. Quality of care for acute myocardial infarction at urban safety‐net hospitals. Health Aff (Millwood). 2007;26(1):238–248.
- , , , et al. The Hospital Compare mortality model and the volume‐outcome relationship. Health Serv Res. 2010;45(5 Pt 1):1148–1167.
- . Exploratory Data Analysis. Boston, MA: Addison‐Wesley; 1977.
- , , , et al. Limits of readmission rates in measuring hospital quality suggest the need for added metrics. Health Aff (Millwood). 2013;32(6):1083–1091.
- , , , et al. Hospital performance measures and 30‐day readmission rates. J Gen Intern Med. 2013;28(3):377–385.
- , , , et al. Public reporting and pay for performance in hospital quality improvement. N Engl J Med. 2007;356(5):486–496.
- , , , et al. Usual source of care and outcomes following acute myocardial infarction. J Gen Intern Med. 2014;29(6):862–869.
- , . Public reporting on hospital process improvements is linked to better patient outcomes. Health Aff (Millwood). 2010;29(7):1319–1324.
- , , , . Variation in length of stay and outcomes among hospitalized patients attributable to hospitals and hospitalists. J Gen Intern Med. 2013;28(3):370–376.
- , , , , . Variation in the risk of readmission among hospitals: the relative contribution of patient, hospital and inpatient provider characteristics. J Gen Intern Med. 2014;29(4):572–578.
- , , , et al. Transitional care after hospitalization for acute stroke or myocardial infarction: a systematic review. Ann Intern Med. 2012;157(6):407–416.
- , , , . The inverse relationship between mortality rates and performance in the Hospital Quality Alliance measures. Health Aff (Millwood). 2007;26(4):1104–1110.
- , , , et al. An automated model to identify heart failure patients at risk for 30‐day readmission or death using electronic medical record data. Med Care. 2010;48(11):981–988.
- , , . Indications of biased risk adjustment in the hospital readmission reduction program. J Ambul Care Manage. 2015;38(1):39–47.
Hospital care accounts for the single largest category of national healthcare expenditures, totaling $936.9 billion in 2013.[1] With ongoing scrutiny of US healthcare spending, hospitals are under increasing pressure to justify high costs and robust profits.[2] However, the dominant fee‐for‐service reimbursement model creates incentives for hospitals to prioritize high volume over high‐quality care to maximize profits.[3] Because hospitals may be reluctant to implement improvements if better quality is not accompanied by better payment or improved financial margins, an approach to stimulate quality improvement among hospitals has been to leverage consumer pressure through required public reporting of selected outcome metrics.[4, 5] Public reporting of outcomes is thought to influence hospital reputation; in turn, reputation affects patient perceptions and influences demand for hospital services, potentially enabling reputable hospitals to command higher prices for services to enhance hospital revenue.[6, 7]
Though improving outcomes is thought to reduce overall healthcare costs, it is unclear whether improving outcomes results in a hospital's financial return on investment.[4, 5, 8] Quality improvement can require substantial upfront investment, requiring that hospitals already have robust financial health to engage in such initiatives.[9, 10] Consequently, instead of stimulating broad efforts in quality improvement, public reporting may exacerbate existing disparities in hospital quality and finances, by rewarding already financially healthy hospitals, and by inadvertently penalizing hospitals without the means to invest in quality improvement.[11, 12, 13, 14, 15] Alternately, because fee‐for‐service remains the dominant reimbursement model for hospitals, loss of revenue through reducing readmissions may outweigh any financial gains from improved public reputation and result in worse overall financial performance, though robust evidence for this concern is lacking.[16, 17]
A small number of existing studies suggest a limited correlation between improved hospital financial performance and improved quality, patient safety, and lower readmission rates.[18, 19, 20] However, these studies had several limitations. They were conducted prior to public reporting of selected outcome metrics by the Centers for Medicare and Medicaid Services (CMS)[18, 19, 20]; used data from the Medicare Cost Report, which is not uniformly audited and thus prone to measurement error[19, 20]; used only relative measures of hospital financial performance (eg, operating margin), which do not capture the absolute amount of revenue potentially available for investment in quality improvement[18, 19]; or compared only hospitals at the extremes of financial performance, potentially exaggerating the magnitude of the relationship between hospital financial performance and quality outcomes.[19]
To address this gap in the literature, we sought to assess whether hospitals with robust financial performance have lower 30‐day risk‐standardized mortality and hospital readmission rates for acute myocardial infarction (AMI), congestive heart failure (CHF), and pneumonia (PNA). Given the concern that hospitals with the lowest mortality and readmission rates may experience a decrease in financial performance due to the lower volume of hospitalizations, we also assessed whether hospitals with the lowest readmission and mortality rates had a differential change in financial performance over time compared to hospitals with the highest rates.
METHODS
Data Sources and Study Population
This was an observational study using audited financial data from the 2008 and 2012 Hospital Annual Financial Data Files from the Office of Statewide Health Planning and Development (OSHPD) in the state of California, merged with data on outcome measures publicly reported by CMS via the Hospital Compare website for July 1, 2008 to June 30, 2011.[21, 22] We included all general acute care hospitals with available OSHPD data in 2008 and at least 1 publicly reported outcome from 2008 to 2011. We excluded hospitals without 1 year of audited financial data for 2008 and hospitals that closed during 2008 to 2011.
Measures of Financial Performance
Because we hypothesized that the absolute amount of revenue generated from clinical operations would influence investment in quality improvement programs more so than relative changes in revenue,[20] we used net revenue from operations (total operating revenue minus total operating expense) as our primary measure of hospital financial performance. We also performed 2 companion analyses using 2 commonly reported relative measures of financial performanceoperating margin (net revenue from operations divided by total operating revenue) and total margin (net total revenue divided by total revenue from all sources). Net revenue from operations for 2008 was adjusted to 2012 US dollars using the chained Consumer Price Index for all urban consumers.
Outcomes
For our primary analysis, the primary outcomes were publicly reported all‐cause 30‐day risk‐standardized mortality rates (RSMR) and readmission rates (RSRR) for AMI, CHF, and PNA aggregated over a 3‐year period. These measures were adjusted for key demographic and clinical characteristics available in Medicare data. CMS began publicly reporting 30‐day RSMR for AMI and CHF in June 2007, RSMR for PNA in June 2008, and RSRR for all 3 conditions in July 2009.[23, 24]
To assess whether public reporting had an effect on subsequent hospital financial performance, we conducted a companion analysis where the primary outcome of interest was change in hospital financial performance over time, using the same definitions of financial performance outlined above. For this companion analysis, publicly reported 30‐day RSMR and RSRR for AMI, CHF, and PNA were assessed as predictors of subsequent financial performance.
Hospital Characteristics
Hospital characteristics were ascertained from the OSHPD data. Safety‐net status was defined as hospitals with an annual Medicaid caseload (number of Medicaid discharges divided by the total number of discharges) 1 standard deviation above the mean Medicaid caseload, as defined in previous studies.[25]
Statistical Analyses
Effect of Baseline Financial Performance on Subsequent Publicly Reported Outcomes
To estimate the relationship between baseline hospital financial performance in 2008 and subsequent RSMR and RSRR for AMI, CHF, and PNA from 2008 to 2011, we used linear regression adjusted for the following hospital characteristics: teaching status, rural location, bed size, safety‐net status, ownership, Medicare caseload, and volume of cases reported for the respective outcome. We accounted for clustering of hospitals by ownership. We adjusted for hospital volume of reported cases for each condition given that the risk‐standardization models used by CMS shrink outcomes for small hospitals to the mean, and therefore do not account for a potential volume‐outcome relationship.[26] We conducted a sensitivity analysis excluding hospitals at the extremes of financial performance, defined as hospitals with extreme outlier values for each financial performance measure (eg, values more than 3 times the interquartile range above the first quartile or below the third quartile).[27] Nonlinearity of financial performance measures was assessed using restricted cubic splines. For ease of interpretation, we scaled the estimated change in RSMR and RSRR per $50 million increase in net revenue from operations, and graphed nonparametric relationships using restricted cubic splines.
Effect of Public Reporting on Subsequent Hospital Financial Performance
To assess whether public reporting had an effect on subsequent hospital financial performance, we conducted a companion hospital‐level difference‐in‐differences analysis to assess for differential changes in hospital financial performance between 2008 and 2012, stratified by tertiles of RSMR and RSRR rates from 2008 to 2011. This approach compares differences in an outcome of interest (hospital financial performance) within each group (where each group is a tertile of publicly reported rates of RSMR or RSRR), and then compares the difference in these differences between groups. Therefore, these analyses use each group as their own historical control and the opposite group as a concurrent control to account for potential secular trends. To conduct our difference‐in‐differences analysis, we compared the change in financial performance over time in the top tertile of hospitals to the change in financial performance over time in the bottom tertile of hospitals with respect to AMI, CHF, and PNA RSMR and RSRR. Our models therefore included year (2008 vs 2012), tertile of publicly reported rates for RSMR or RSRR, and the interaction between them as predictors, where the interaction was the difference‐in‐differences term and the primary predictor of interest. In addition to adjusting for hospital characteristics and accounting for clustering as mentioned above, we also included 3 separate interaction terms for year with bed size, safety‐net status, and Medicare caseload, to account for potential changes in the hospitals over time that may have independently influenced financial performance and publicly reported 30‐day measures. For sensitivity analyses, we repeated our difference‐in‐differences analyses excluding hospitals with a change in ownership and extreme outliers with respect to financial performance in 2008. We performed model diagnostics including assessment of functional form, linearity, normality, constant variance, and model misspecification. All analyses were conducted using Stata version 12.1 (StataCorp, College Station, TX). This study was deemed exempt from review by the UT Southwestern Medical Center institutional review board.
RESULTS
Among the 279 included hospitals (see Supporting Figure 1 in the online version of this article), 278 also had financial data available for 2012. In 2008, the median net revenue from operations was $1.6 million (interquartile range [IQR], $2.4 to $10.3 million), the median operating margin was 1.5% (IQR, 4.6% to 6%), and the median total margin was 2.5% (IQR, 2.2% to 7.5% (Table 1). The number of hospitals reporting each outcome, and median outcome rates, are shown in Table 2.
| 2008, n = 279 | 2012, n = 278 | |
|---|---|---|
| ||
| Hospital characteristics | ||
| Teaching, n (%) | 28 (10.0) | 28 (10.0) |
| Rural, n (%) | 55 (19.7) | 55 (19.7) |
| Bed size, n (%) | ||
| 099 (small) | 57 (20.4) | 55 (19.8) |
| 100299 (medium) | 130 (46.6) | 132 (47.5) |
| 300 (large) | 92 (33.0) | 91 (32.7) |
| Safety‐net hospital, n (%)* | 46 (16.5) | 48 (17.3) |
| Hospital ownership, n (%) | ||
| City or county | 15 (5.4) | 16 (5.8) |
| District | 42 (15.1) | 39 (14.0) |
| Investor | 66 (23.7) | 66 (23.7) |
| Private nonprofit | 156 (55.9) | 157 (56.5) |
| Medicare caseload, mean % (SD) | 41.6 (14.7) | 43.6 (14.7) |
| Financial performance measures | ||
| Net revenue from operations, median $ in millions (IQR; range) | 1.6 (2.4 to 10.3; 495.9 to 144.1) | 3.2 (2.9 to 15.4; 396.2 to 276.8) |
| Operating margin, median % (IQR; range) | 1.5 (4.6 to 6.8; 77.8 to 26.4) | 2.3 (3.9 to 8.2; 134.8 to 21.1) |
| Total margin, median % (IQR; range) | 2.5 (2.2 to 7.5; 101.0 to 26.3) | 4.5 (0.7 to 9.8; 132.2 to 31.1) |
| No. | Median % (IQR) | Adjusted % Change (95% CI) per $50 Million Increase in Net Revenue From Operations | ||
|---|---|---|---|---|
| Overall | Extreme Outliers Excluded | |||
| ||||
| Myocardial infarction | ||||
| Mortality rate | 211 | 15.2 (14.216.2) | 0.07 (0.10 to 0.24) | 0.63 (0.21 to 1.48) |
| Readmission rate | 184 | 19.4 (18.520.2) | Nonlinear | 0.34 (1.17 to 0.50) |
| Congestive heart failure | ||||
| Mortality rate | 259 | 11.1 (10.112.1) | 0.17 (0.01 to 0.35) | Nonlinear∥ |
| Readmission rate | 264 | 24.5 (23.525.6) | 0.07 (0.27 to 0.14) | 0.45 (1.36 to 0.47) |
| Pneumonia | ||||
| Mortality rate | 268 | 11.6 (10.413.2) | 0.17 (0.42 to 0.07) | 0.35 (1.19 to 0.49) |
| Readmission rate | 268 | 18.2 (17.319.1) | 0.04 (0.20 to 0.11) | 0.56 (1.27 to 0.16) |
Relationship Between Financial Performance and Publicly Reported Outcomes
Acute Myocardial Infarction
We did not observe a consistent relationship between hospital financial performance and AMI mortality and readmission rates. In our overall adjusted analyses, net revenue from operations was not associated with mortality, but was significantly associated with a decrease in AMI readmissions among hospitals with net revenue from operations between approximately $5 million to $145 million (nonlinear relationship, F statistic = 4.8, P < 0.001 (Table 2, Figure 1A). However, after excluding 23 extreme outlying hospitals by net revenue from operations (10 underperformers with net revenue <$49.4 million and 13 overperformers with net revenue >$52.1 million), this relationship was no longer observed. Using operating margin instead of net revenue from operations as the measure of hospital financial performance, we observed a 0.2% increase in AMI mortality (95% confidence interval [CI]: 0.06%‐0.35%) (see Supporting Table 1 and Supporting Figure 2 in the online version of this article) for each 10% increase in operating margin, which persisted with the exclusion of 5 outlying hospitals by operating margin (all 5 were underperformers, with operating margins <38.6%). However, using total margin as the measure of financial performance, there was no significant relationship with either mortality or readmissions (see Supporting Table 2 and Supporting Figure 3 in the online version of this article).
Congestive Heart Failure
In our primary analyses, we did not observe a significant relationship between net revenue from operations and CHF mortality and readmission rates. However, after excluding 23 extreme outliers, increasing net revenue from operations was associated with a modest increase in CHF mortality among hospitals, with net revenue between approximately $35 million and $20 million (nonlinear relationship, F statistic = 3.6, P = 0.008 (Table 2, Figure 1B). Using alternate measures of financial performance, we observed a consistent relationship between increasing hospital financial performance and higher 30‐day CHF mortality rate. Using operating margin, we observed a slight increase in the mortality rate for CHF (0.26% increase in CHF RSMR for every 10% increase in operating margin) (95% CI: 0.07%‐0.45%) (see Supporting Table 1 and Supporting Figure 2 in the online version of this article), which persisted after the exclusion of 5 extreme outliers. Using total margin, we observed a significant but modest association between improved hospital financial performance and increased mortality rate for CHF (nonlinear relationship, F statistic = 2.9, P = 0.03) (see Supporting Table 2 and Supporting Figure 3 in the online version of this article), which persisted after the exclusion of 3 extreme outliers (0.32% increase in CHF RSMR for every 10% increase in total margin) (95% CI: 0.03%‐0.62%).
Pneumonia
Hospital financial performance (using net revenue, operating margin, or total margin) was not associated with 30‐day PNA mortality or readmission rates.
Relationship of Readmission and Mortality Rates on Subsequent Hospital Financial Performance
Compared to hospitals in the highest tertile of readmission and mortality rates (ie, those with the worst rates), hospitals in the lowest tertile of readmission and mortality rates (ie, those with the best rates) had a similar magnitude of increase in net revenue from operations from 2008 to 2012 (Table 3). The difference‐in‐differences analyses showed no relationship between readmission or mortality rates for AMI, CHF, and PNA and changes in net revenue from operations from 2008 to 2012 (difference‐in‐differences estimates ranged from $8.61 to $6.77 million, P > 0.3 for all). These results were robust to the exclusion of hospitals with a change in ownership and extreme outliers by net revenue from operations (data not reported).
| Outcome | Tertile With Highest Outcome Rates (Worst Hospitals) | Tertile With Lowest Outcome Rates (Best Hospitals) | Difference in Net From Operations Differences Between Highest and Lowest Outcome Rate Tertiles, $ Million (95% CI) | P | ||
|---|---|---|---|---|---|---|
| Outcome, Median % (IQR) | Gain/Loss in Net Revenue From Operations From 2008 to 2012, $ Million* | Outcome, Median % (IQR) | Gain/Loss in Net Revenue from Operations From 2008 to 2012, $ Million* | |||
| ||||||
| AMI mortality | 16.7 (16.217.4) | +65.62 | 13.8 (13.314.2) | +74.23 | 8.61 (27.95 to 10.73) | 0.38 |
| AMI readmit | 20.7 (20.321.5) | +38.62 | 18.3 (17.718.6) | +31.85 | +6.77 (13.24 to 26.77) | 0.50 |
| CHF mortality | 13.0 (12.313.9) | +45.66 | 9.6 (8.910.1) | +48.60 | 2.94 (11.61 to 5.73) | 0.50 |
| CHF readmit | 26.2 (25.726.9) | +47.08 | 23.0 (22.323.5) | +46.08 | +0.99 (10.51 to 12.50) | 0.87 |
| PNA mortality | 13.9 (13.314.7) | +43.46 | 9.9 (9.310.4) | +38.28 | +5.18 (7.01 to 17.37) | 0.40 |
| PNA readmit | 19.4 (19.120.1) | +47.21 | 17.0 (16.517.3) | +45.45 | +1.76 (8.34 to 11.86) | 0.73 |
DISCUSSION
Using audited financial data from California hospitals in 2008 and 2012, and CMS data on publicly reported outcomes from 2008 to 2011, we found no consistent relationship between hospital financial performance and publicly reported outcomes for AMI and PNA. However, better hospital financial performance was associated with a modest increase in 30‐day risk‐standardized CHF mortality rates, which was consistent across all 3 measures of hospital financial performance. Reassuringly, there was no difference in the change in net revenue from operations between 2008 and 2012 between hospitals in the highest and lowest tertiles of readmission and mortality rates for AMI, CHF, and PNA. In other words, hospitals with the lowest rates of 30‐day readmissions and mortality for AMI, CHF, and PNA did not experience a loss in net revenue from operations over time, compared to hospitals with the highest readmission and mortality rates.
Our study differs in several important ways from Ly et al., the only other study to our knowledge that investigated the relationship between hospital financial performance and outcomes for patients with AMI, CHF, and PNA.[19] First, outcomes in the Ly et al. study were ascertained in 2007, which preceded public reporting of outcomes. Second, the primary comparison was between hospitals in the bottom versus top decile of operating margin. Although Ly and colleagues also found no association between hospital financial performance and mortality rates for these 3 conditions, they found a significant absolute decrease of approximately 3% in readmission rates among hospitals in the top decile of operating margin versus those in bottom decile. However, readmission rates were comparable among the remaining 80% of hospitals, suggesting that these findings primarily reflected the influence of a few outlier hospitals. Third, the use of nonuniformly audited hospital financial data may have resulted in misclassification of financial performance. Our findings also differ from 2 previous studies that identified a modest association between improved hospital financial performance and decreased adverse patient safety events.[18, 20] However, publicly reported outcomes may not be fully representative of hospital quality and patient safety.[28, 29]
The limited association between hospital financial performance and publicly reported outcomes for AMI and PNA is noteworthy for several reasons. First, publicly reporting outcomes alone without concomitant changes to reimbursement may be inadequate to create strong financial incentives for hospital investment in quality improvement initiatives. Hospitals participating in both public reporting of outcomes and pay‐for‐performance have been shown to achieve greater improvements in outcomes than hospitals engaged only in public reporting.[30] Our time interval for ascertainment of outcomes preceded CMS implementation of the Hospital Readmissions Reduction Program (HRRP) in October 2012, which withholds up to 3% of Medicare hospital reimbursements for higher than expected mortality and readmission rates for AMI, CHF, and PNA. Once outcomes data become available for a 3‐year post‐HRRP implementation period, the impact of this combined approach can be assessed. Second, because adherence to many evidence‐based process measures for these conditions (ie, aspirin use in AMI) is already high, there may be a ceiling effect present that obviates the need for further hospital financial investment to optimize delivery of best practices.[31, 32] Third, hospitals themselves may contribute little to variation in mortality and readmission risk. Of the total variation in mortality and readmission rates among Texas Medicare beneficiaries, only about 1% is attributable to hospitals, whereas 42% to 56% of the variation is explained by differences in patient characteristics.[33, 34] Fourth, there is either low‐quality or insufficient evidence that transitional care interventions specifically targeted to patients with AMI or PNA result in better outcomes.[35] Thus, greater financial investment in hospital‐initiated and postdischarge transitional care interventions for these specific conditions may result in less than the desired effect. Lastly, many hospitalizations for these conditions are emergency hospitalizations that occur after patients present to the emergency department with unexpected and potentially life‐threatening symptoms. Thus, patients may not be able to incorporate the reputation or performance metrics of a hospital in their decisions for where they are hospitalized for AMI, CHF, or PNA despite the public reporting of outcomes.
Given the strong evidence that transitional care interventions reduce readmissions and mortality among patients hospitalized with CHF, we were surprised to find that improved hospital financial performance was associated with an increased risk‐adjusted CHF mortality rate.[36] This association held true for all 3 different measures of hospital financial performance, suggesting that this unexpected finding is unlikely to be the result of statistical chance, though potential reasons for this association remain unclear. One possibility is that the CMS model for CHF mortality may not adequately risk adjust for severity of illness.[37, 38] Thus, robust financial performance may be a marker for hospitals with more advanced heart failure services that care for more patients with severe illness.
Our findings should be interpreted in the context of certain limitations. Our study only included an analysis of outcomes for AMI, CHF, and PNA among older fee‐for‐service Medicare beneficiaries aggregated at the hospital level in California between 2008 and 2012, so generalizability to other populations, conditions, states, and time periods is uncertain. The observational design precludes a robust causal inference between financial performance and outcomes. For readmissions, rates were publicly reported for only the last 2 years of the 3‐year reporting period; thus, our findings may underestimate the association between hospital financial performance and publicly reported readmission rates.
CONCLUSION
There is no consistent relationship between hospital financial performance and subsequent publicly reported outcomes for AMI and PNA. However, for unclear reasons, hospitals with better financial performance had modestly higher CHF mortality rates. Given this limited association, public reporting of outcomes may have had less than the intended impact in motivating hospitals to invest in quality improvement. Additional financial incentives in addition to public reporting, such as readmissions penalties, may help motivate hospitals with robust financial performance to further improve outcomes. This would be a key area for future investigation once outcomes data are available for the 3‐year period following CMS implementation of readmissions penalties in 2012. Reassuringly, there was no association between low 30‐day mortality and readmissions rates and subsequent poor financial performance, suggesting that improved outcomes do not necessarily lead to loss of revenue.
Disclosures
Drs. Nguyen, Halm, and Makam were supported in part by the Agency for Healthcare Research and Quality University of Texas Southwestern Center for Patient‐Centered Outcomes Research (1R24HS022418‐01). Drs. Nguyen and Makam received funding from the University of Texas Southwestern KL2 Scholars Program (NIH/NCATS KL2 TR001103). The study sponsors had no role in design and conduct of the study; collection, management, analysis, and interpretation of the data; and preparation, review, or approval of the manuscript. The authors have no conflicts of interest to disclose.
- Centers for Medicare and Medicaid Services. Office of the Actuary. National Health Statistics Group. National Healthcare Expenditures Data. Baltimore, MD; 2013. https://www.cms.gov/Research-Statistics-Data-and-Systems/Statistics-Trends-and-Reports/NationalHealthExpendData/NationalHealthAccountsHistorical.html. Accessed February 16, 2016.
- . Bitter pill: why medical bills are killing us. Time Magazine. February 20, 2013:16–55.
- . Fee‐for‐service will remain a feature of major payment reforms, requiring more changes in Medicare physician payment. Health Aff (Millwood). 2012;31(9):1977–1983.
- , , , et al. The business case for quality: case studies and an analysis. Health Aff (Millwood). 2003;22(2):17–30.
- , , , . Public reporting on quality in the United States and the United Kingdom. Health Aff (Millwood). 2003;22(3):134–148.
- , , , , . The business case for health‐care quality improvement. J Patient Saf. 2013;9(1):44–52.
- , , . Hospital performance reports: impact on quality, market share, and reputation. Health Aff (Millwood). 2005;24(4):1150–1160.
- , , , . The savings illusion—why clinical quality improvement fails to deliver bottom‐line results. N Engl J Med. 2011;365(26):e48.
- , , , , . Hospital Quality: Ingredients for Success—Overview and Lessons Learned. New York, NY: Commonwealth Fund; 2004.
- , , . Hospital Quality Improvement: Strategies and Lessons from U.S. Hospitals. New York, NY: Commonwealth Fund; 2007.
- , , , et al. Hospital financial condition and operational decisions related to the quality of hospital care. Med Care Res Rev. 2007;64(2):148–168.
- , , , , , . Will pay‐for‐performance and quality reporting affect health care disparities? Health Aff (Millwood). 2007;26(3):w405–w414.
- , , . Comparison of change in quality of care between safety‐net and non‐safety‐net hospitals. JAMA. 2008;299(18):2180–2187.
- , . Could Medicare readmission policy exacerbate health care system inequity? Ann Intern Med. 2010;152(2):114–117.
- , . Minding the gap between efforts to reduce readmissions and disparities. JAMA. 2011;305(7):715–716.
- , . Medicare Health Support Pilot Program. N Engl J Med. 2012;366(7):666; author reply 667–668.
- , . Revisiting hospital readmissions. JAMA. 2013;309(4):398–400.
- , . Hospital finances and patient safety outcomes. Inquiry. 2005;42(1):60–72.
- , , . The association between hospital margins, quality of care, and closure or other change in operating status. J Gen Intern Med. 2011;26(11):1291–1296.
- , , , . Hospital financial condition and the quality of patient care. Health Econ. 2008;17(8):977–995.
- State of California Office of Statewide Health Planning and Development. Healthcare Information Division. Annual financial data. Available at: http://www.oshpd.ca.gov/HID/Products/Hospitals/AnnFinanData/PivotProfles/default.asp. Accessed June 23, 2015.
- Centers for Medicare 4(1):11–13.
- , , , et al. Quality of care for acute myocardial infarction at urban safety‐net hospitals. Health Aff (Millwood). 2007;26(1):238–248.
- , , , et al. The Hospital Compare mortality model and the volume‐outcome relationship. Health Serv Res. 2010;45(5 Pt 1):1148–1167.
- . Exploratory Data Analysis. Boston, MA: Addison‐Wesley; 1977.
- , , , et al. Limits of readmission rates in measuring hospital quality suggest the need for added metrics. Health Aff (Millwood). 2013;32(6):1083–1091.
- , , , et al. Hospital performance measures and 30‐day readmission rates. J Gen Intern Med. 2013;28(3):377–385.
- , , , et al. Public reporting and pay for performance in hospital quality improvement. N Engl J Med. 2007;356(5):486–496.
- , , , et al. Usual source of care and outcomes following acute myocardial infarction. J Gen Intern Med. 2014;29(6):862–869.
- , . Public reporting on hospital process improvements is linked to better patient outcomes. Health Aff (Millwood). 2010;29(7):1319–1324.
- , , , . Variation in length of stay and outcomes among hospitalized patients attributable to hospitals and hospitalists. J Gen Intern Med. 2013;28(3):370–376.
- , , , , . Variation in the risk of readmission among hospitals: the relative contribution of patient, hospital and inpatient provider characteristics. J Gen Intern Med. 2014;29(4):572–578.
- , , , et al. Transitional care after hospitalization for acute stroke or myocardial infarction: a systematic review. Ann Intern Med. 2012;157(6):407–416.
- , , , . The inverse relationship between mortality rates and performance in the Hospital Quality Alliance measures. Health Aff (Millwood). 2007;26(4):1104–1110.
- , , , et al. An automated model to identify heart failure patients at risk for 30‐day readmission or death using electronic medical record data. Med Care. 2010;48(11):981–988.
- , , . Indications of biased risk adjustment in the hospital readmission reduction program. J Ambul Care Manage. 2015;38(1):39–47.

Rehospitalization after Pneumonia
Pneumonia remains a significant problem in the United States, both in terms of mortality as well as cost to the healthcare system. Each year, over 1 million patients are hospitalized for pneumonia, with costs conservatively estimated at more than $7 billion in 2010.[1] One contributing factor for these costs is that pneumonia is the second most frequent reason for rehospitalization.[2] Rehospitalization after admission for pneumonia is now used as a marker for quality of care.
Given the cost and adverse outcomes of pneumonia, it is important to examine early rehospitalization to better understand what factors play a role. Studies have examined factors associated with readmission following an initial pneumonia‐related hospitalization. Adamuz et al. showed that additional healthcare visits and rehospitalizations within 30 days of discharge from the hospital were common and were associated with worsening of signs or symptoms of pneumonia and/or comorbidities.[3] Other studies demonstrated that instability on hospital discharge, as well as treatment failure, were associated with increased risk of rehospitalization.[4, 5] Jasti et al. found rehospitalizations following pneumonia were usually comorbidity related, primarily cardiopulmonary and/or neurologic disease, rather than due to the index pneumonia.[6] Many of these studies, and others looking at age, activity of daily living score, socioeconomic status, and comorbidity characteristics, were performed in relatively small cohorts. Predictors of rehospitalization have not been studied in a large cohort of patients in an integrated healthcare system.
Our study looks at factors not addressed in prior studies that have used administrative claims data to identify factors associated with early readmission. We also evaluated these admission risk factors in a veteran population, whereas prior studies have primarily focused on those who receive Medicare. The purpose of this study was to examine predictors of early (30 days) readmission in the Veterans Affairs (VA) healthcare system for patients age 65 years and older hospitalized for pneumonia. Our a priori hypothesis was that comorbid illnesses, such as congestive heart failure and chronic obstructive pulmonary disease, and patients with high medical complexity, such as high number of medications and/or prior hospitalizations and nursing home residence, are the primary factors associated with increased risk of rehospitalization.
METHODS
For this national cohort study, we used data from the VA healthcare system administrative and clinical databases that serve as repositories of clinical data from more than 150 VA hospitals and 850 outpatient clinics throughout the United States. The institutional review boards of the University of Texas Health Science Center at San Antonio and VA North Texas Health Care System approved this study. Details regarding the study design and methods were previously published.[7]
Inclusion Criteria
Patients included in this study were hospitalized between October 2001 and September 2007, had a primary diagnosis of pneumonia/emnfluenza (International Classification of Diseases, 9th Revision [ICD‐9] codes 480.0483.99 or 485487) or a secondary discharge diagnosis of pneumonia with a primary diagnosis of respiratory failure (ICD‐9 code 518.81) or sepsis (ICD‐9 code 038.xx),[8] and were aged 65 years or older on the date of admission. To ensure patients obtained their care primarily at the VA, at least 1 VA outpatient clinic visit in the year preceding the index admission and at least 1 active and filled outpatient medication from a VA pharmacy within 90 days of admission were required for inclusion.
If a patient was admitted more than once during the study period, only the first hospitalization was included as the index admission.
Exclusion Criteria
Patients who died during the initial hospitalization were not included in this study. Patients admitted to hospitals with fewer than 25 reported hospitalizations during October 2001 to September 2007 were excluded, as these hospitals are neither representative nor generalizable. This resulted in the removal of 59 patients from 5 different hospitals.
Data Sources and Definitions
We used inpatient and outpatient demographic, utilization, and comorbidity data from the National Patient Care Database. Pharmacy data were extracted from the Decision Support System National Data Extracts and Pharmacy Benefits Management. Vital status information was obtained from the Vital Status file, which incorporates data from veterans' death benefits claims, inpatient deaths, Medicare Vital Status files, and the Social Security Administration's death master file. We used encrypted patient identifiers link to information across these databases.
We obtained demographic information (age, sex, race, marital status) from inpatient and outpatient data. We categorized race as white, black, Hispanic, and other/unknown. To infer active smoking and/or tobacco cessation attempts, we identified ICD‐9 codes for tobacco use (305.1, V15.82), smoking cessation clinic use, and/or use of medications for the treatment of nicotine dependence (Zyban, nicotine replacement, or varenicline). We used VA priority status as a proxy for socioeconomic and disability status. VA priority groups are a way for the VA to focus limited funds to those veterans most in need. The highest group (priority group 1) must have at least a 50% service‐connected disability. Priority groups 2 through 6 include veterans with up to 40% service‐connected disability, former prisoners of war, those awarded certain honors, veterans with lower incomes, and the catastrophically disabled. The lowest groups (priority groups 7 and 8) include veterans with relatively higher incomes who agree to pay copayments.[9]
We also obtained information on comorbid conditions from inpatient and outpatient administrative data. We defined alcohol abuse using ICD‐9 codes 291, 303, 305.0, and illicit drug use with ICD‐9 codes 292, 304, 305 excluding 305.0‐.1. We used the Charlson Comorbidity Index to quantify levels of preexisting comorbidity[10] adapted for administrative databases, using ICD‐9 codes for 19 comorbid conditions from prior outpatient and inpatient encounters. We defined cardiovascular events and lung cancer that were diagnosed during the hospitalization as previously described.[11, 12]
Outcomes
Our primary study outcome was readmission within 30 days of hospital discharge for pneumonia from any VA acute care hospital only. Medicare has used 30‐day readmission as a quality indicator, as readmissions that occur closer to discharge are believed to be more likely due to events during the index hospitalization.[13]
Statistical Analyses
We randomly divided patients from our initial cohort into equal derivation or validation cohorts. We assessed differences between the 2 groups using the Student t test for continuous variables and 2 test for categorical variables. We performed univariate logistic regression analyses in the derivation cohort to examine the relationship between 30‐day rehospitalization and each of our potential covariates. We entered covariates that were significant at P<0.10 in the univariate analyses into a multiple regression model. Significant covariates at P<0.10 were then entered into the final model. For this model, we used bootstrapping with replacement in 1000 replications to obtain standard errors of our coefficients and associated P values. Because some subjects had more than 1 index admission, we used robust variancecovariance matrix estimators to compute standard errors for model coefficients.
We used the C statistic to assess the discrimination of our model. Calibration of this model was measured using the Hosmer‐Lemeshow 2 goodness of fit test, using 10 quantiles to group the data. We evaluated differences in discrimination between the derivation and validation cohorts by comparing C statistics.
Last, using the final model in the derivation cohort, 5 categories of severity were created based on subjects' predicted risk values for readmission. Severity categories in both the derivation and validation cohorts were then graphically evaluated.
We defined statistical significance as a 2‐tailed P value of <0.05. We used Stata 12 (StataCorp, College Station, TX) for all analyses.
RESULTS
Patient Characteristics
Of the 45,134 eligible patients, 13.2% were rehospitalized within 30 days, and rates by hospital ranged from 1.6% to 20.7%. Table 1 presents the comparison of baseline difference between the derivation and validation cohorts. There were no statistically significant differences between the 2 groups. Overall, the mean age was 77 years, 98% were male, and 54% were married. Over 90% of the patients received guideline‐concordant antibiotics, and only 10% required a stay in the intensive care unit (ICU). The average length of stay was 7 days (standard deviation of 11 days).
| Characteristics | Derivation Cohort, N=22,567 | Validation Cohort, N=22,567 | P Value |
|---|---|---|---|
| |||
| Sociodemographics | |||
| Age, mean (SD) | 77.3 (6.5) | 77.2 (6.5) | 0.30 |
| Male, no (%) | 22,133 (98.1) | 22,175 (98.3) | 0.14 |
| White, no (%) | 18,858 (83.6) | 18,719 (83.0) | 0.08 |
| Black, no (%) | 2,562 (11.4) | 2,583 (11.5) | 0.76 |
| Hispanic, no (%) | 1,337 (5.9) | 1,414 (6.3) | 0.13 |
| Married, no (%) | 12,166 (53.9) | 12,258 (54.3) | 0.39 |
| VA priority group, no (%) | 0.28 | ||
| 1 | 4,286 (19.0) | 4,281 (19.0) | |
| 26 | 16,306 (72.3) | 16,399 (72.8) | |
| 78 | 1,954 (8.7) | 1,860 (8.3) | |
| Nursing home residence, no (%) | 199 (0.9) | 216 (1.0) | 0.41 |
| Smoker status, no (%) | 8,579 (38.0) | 8,677 (38.5) | 0.34 |
| Index hospitalization factors | |||
| Myocardial infarction during hospitalization, no (%) | 469 (2.1) | 452 (2.0) | 0.57 |
| Heart failure during hospitalization, no (%) | 4,817 (21.4) | 4,772 (21.2) | 0.61 |
| Arrhythmia during hospitalization, no (%) | 4,356 (19.3) | 4,287 (19.0) | 0.41 |
| Length of stay, mean (SD) | 7.2 (10.4) | 7.2 (11.7) | 0.76 |
| Lung cancer diagnosis during hospitalization, no (%) | 31 (0.1) | 31 (0.1) | 1.00 |
| ICU admission, no (%) | 2,282 (10.1) | 2,336 (10.4) | 0.40 |
| Guideline concordant antibiotics, no (%) | 20,724 (91.8) | 20,643 (91.5) | 0.17 |
| Invasive mechanical ventilation, no (%) | 793 (3.5) | 832 (3.7) | 0.32 |
| Vasopressor use, no (%) | 495 (2.2) | 489 (2.2) | 0.85 |
| Hospital complications, no (%) | |||
| Renal organ failure | 2,671 (11.8) | 2,640 (11.7) | 0.65 |
| Cardiac organ failure | 1,004 (4.5) | 959 (4.3) | 0.30 |
| Hepatic organ failure | 33 (0.2) | 40 (0.2) | 0.41 |
| Respiratory organ failure | 1,623 (7.2) | 1,583 (7.0) | 0.46 |
| Comorbid illnesses | |||
| Medical, no (%) | |||
| Myocardial infarction | 1,528 (6.8) | 1,542 (6.8) | 0.79 |
| Congestive heart failure | 5,815 (25.8) | 5,697 (25.2) | 0.20 |
| Peripheral vascular disease | 3,413 (15.1) | 3,454 (15.3) | 0.59 |
| Cerebrovascular disease | 3,993 (17.7) | 4,078 (18.1) | 0.30 |
| Dementia | 1,141 (5.1) | 1,110 (4.9) | 0.50 |
| COPD | 12,168 (53.9) | 12,076 (53.5) | 0.39 |
| Rheumatologic disease | 646 (2.9) | 660 (2.9) | 0.69 |
| Peptic ulcer disease | 795 (3.5) | 723 (3.2) | 0.06 |
| Severe liver disease | 169 (0.8) | 169 (0.8) | 1.00 |
| Mild liver disease | 78 (0.4) | 80 (0.4) | 0.87 |
| Diabetes | 7,310 (32.4) | 7,410 (32.8) | 0.32 |
| Diabetes with complications | 2,229 (9.9) | 2,248 (10.0) | 0.77 |
| Chronic renal disease | 2,836 (12.6) | 2,745 (12.2) | 0.19 |
| Hemi/paraplegia | 319 (1.4) | 338 (1.5) | 0.46 |
| Any prior malignancy | 5,226 (23.2) | 5,269 (23.4) | 0.63 |
| Metastatic solid tumor | 748 (3.3) | 795 (3.5) | 0.22 |
| AIDS | 56 (0.3) | 49 (0.2) | 0.49 |
| HIV | 23 (0.1) | 13 (0.1) | 0.10 |
| Alcohol abuse | 897 (4.0) | 934 (4.1) | 0.38 |
| Drug abuse | 254 (1.1) | 255 (1.1) | 0.96 |
| Psychiatric, no (%) | |||
| Anxiety disorder | 1,692 (7.5) | 1,722 (7.6) | 0.59 |
| Depression indicator | 3,655 (16.2) | 3,718 (16.5) | 0.42 |
| Bipolar disorder | 430 (1.9) | 433 (1.9) | 0.92 |
| Cataract indicator | 6,106 (27.1) | 6,180 (27.4) | 0.43 |
| Prostatitis indicator | 4,680 (20.7) | 4,593 (20.4) | 0.31 |
| Schizophrenia indicator | 685 (3.0) | 676 (3.0) | 0.80 |
| Post‐traumatic stress disorder | 844 (3.7) | 862 (3.8) | 0.66 |
| Medication history within 90 days | |||
| Cardiovascular drugs, mean (SD) | 1.8 (1.6) | 1.8 (1.6) | 0.65 |
| Diabetes drugs, mean (SD) | 0.3 (0.7) | 0.3 (0.7) | 0.60 |
| Inhaled corticosteroids, mean (SD) | 0.4 (0.9) | 0.4 (0.9) | 0.28 |
| Pulmonary drug, mean (SD) | 1.3 (2.0) | 1.3 (2.0) | 0.36 |
| Oral corticosteroids, no (%) | 5,363 (23.8) | 5,505 (24.4) | 0.12 |
| Prior medical utilization | |||
| Number of primary care clinic visits within 1 year, mean (SD) | 4.9 (4.2) | 4.9 (4.2) | 0.67 |
| Number of emergency department visits within 1 year, mean (SD) | 1.2 (2.0) | 1.2 (2.0) | 0.86 |
| Number of outpatient clinic visits within 1 year, mean (SD) | 14.7 (13.1) | 14.6 (13.0) | 0.33 |
| Number of specialty clinic visits within 1 year, mean (SD) | 3.4 (5.5) | 3.3 (5.4) | 0.50 |
| Prior hospital admission within 90 days, no (%) | 5,062 (22.4) | 5,141 (22.8) | 0.37 |
Predictors of 30‐Day Readmission
All variables listed in Table 1 were evaluated. The derivation logistic regression model is shown in Table 2, and only includes predictors associated with rehospitalization. Antibiotic concordance and time in the ICU were evaluated and did not predict readmission. Variables that were significantly associated with rehospitalization in the models included age, marital status, the number of emergency department clinic visits a year prior, prior admission within 90 days, number of nonpharmacy clinic visits in a year prior, and hospital length of stay. The increasing age and number of emergency department and clinic visits were associated with higher odds of readmission. The longer the length of stay and those patients who were married had a lower odds of subsequent readmission. Other variables included were the presence of chronic renal disease, prior malignancy, nursing home residence, congestive heart failure, and prior use of oral corticosteroids. The C statistics for the derivation and validation models were 0.615 and 0.613, respectively. There were no significant differences in any of the variables between the derivation and validation cohorts.
| Predictors | OR | 95% CI | P Value | |
|---|---|---|---|---|
| Lower | Upper | |||
| ||||
| Sociodemographics | ||||
| Age at admission | 1.01 | 1.00 | 1.02 | <0.01 |
| White | 1.14 | 1.02 | 1.28 | 0.02 |
| Nonwhiteb | 1.00 | |||
| Hispanic | 1.26 | 1.07 | 1.47 | 0.01 |
| Not Hispanicc | 1.00 | |||
| Married | 0.89 | 0.82 | 0.96 | <0.01 |
| Not marriedd | 1.00 | |||
| Nursing home residence | 1.68 | 1.18 | 2.39 | <0.01 |
| Comorbid illnesses | ||||
| Peptic ulcer disease | 1.24 | 1.02 | 1.50 | 0.03 |
| Chronic renal disease | 1.18 | 1.06 | 1.33 | <0.01 |
| Any prior malignancy | 1.17 | 1.06 | 1.28 | <0.01 |
| Metastatic solid tumor | 1.20 | 0.98 | 1.47 | 0.08 |
| AIDS | 1.99 | 1.06 | 3.74 | 0.03 |
| Index admission factors | ||||
| Heart failure on initial admission | 1.18 | 1.07 | 1.29 | <0.01 |
| Length of stay (per day) | 0.97 | 0.97 | 0.98 | <0.01 |
| Medication history | ||||
| Cardiovascular drug count 90 days prior | 1.03 | 1.00 | 1.06 | 0.02 |
| Oral corticosteroids 90 days prior | 1.16 | 1.06 | 1.27 | <0.01 |
| Prior medical utilization | ||||
| Number of emergency department visits within 1 year | 1.04 | 1.02 | 1.06 | <0.01 |
| Number of specialty clinic visits within 1 year | 1.01 | 1.00 | 1.02 | 0.01 |
| Prior hospital admission within 90 days | 1.60 | 1.46 | 1.75 | <0.01 |
| Number of nonpharmacy clinic visits within 1 year | 1.00 | 1.00 | 1.01 | <0.01 |
Figure 1 shows that the derivation and validation models are similar in percent rehospitalization group in all severity groups.
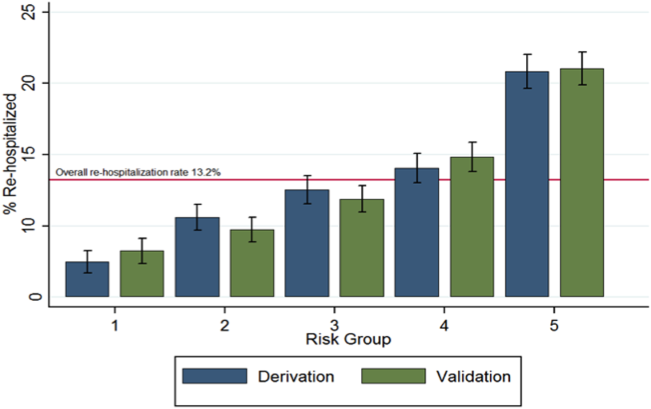
DISCUSSION
Sociodemographics and comorbidities, which are host factors, were significantly associated with rehospitalization of elderly patients admitted for pneumonia and length of hospital stay, the only pneumonia‐specific variable associated with readmission.[6, 14, 15, 16] Higher rates of all types of prior utilization (inpatient, outpatient, emergency department visits) were also associated with higher risk of rehospitalization. Our findings highlight the role that host factors play in rehospitalization of elderly patients with pneumonia and that there are few potentially modifiable targets to help reduce readmissions after pneumonia.
These findings may indicate 2 things: patients in this cohort are sicker than the general population at baseline and therefore require more medical care, and/or they are being evaluated by more providers increasing the chance they will be readmitted. For the former, an example is the association of prior use of oral corticosteroids with rehospitalization, which may demonstrate poorly controlled comorbidities (eg, chronic obstructive lung disease with recent exacerbation) that require steroid use. Given the VA's integrated healthcare system, greater access to primary care providers may lead to more opportunities for patients to voice their complaints, which can lead to more readmissions among severely ill patients. Weinberger et al. found an increase in hospital readmissions with increased access to primary care.[17] The association of readmission and length of stay is less likely related to pneumonia‐related clinical instabilities on discharge, but rather to the ability to address other potential issues related to the patient's underlying comorbidities.[5]
Our study presents a model looking at rehospitalization of patients with pneumonia, including factors not addressed in a prior publication by Lindenauer et al., the model Centers for Medicare and Medicaid Services (CMS) uses to predict early rehospitalization.[18] Lindenauer's model included 39 variables (of which 37 were clinical variables), including vertebral fractures, other injuries, other gastrointestinal disorders, other urinary tract disorders, as well as demographic and comorbidity factors that were similar to some of those included in our study. Their 30‐day rehospitalization medical record and administrative models had a C statistic of 0.59 and 0.63, respectively. A major difference between our presented model and the latter are the data on utilization of medical care. Despite these additional data, the resulting C statistics of 0.615 and 0.613 were not qualitatively better.
The similar C statistics demonstrates that factors playing a significant role in determining rehospitalization have yet to be identified, and it is not clear if researchers will be able to identify potentially modifiable risk factors for rehospitalization. Examples of other potential factors that should be examined in future studies include family/community support, quality of the transition of care back to their residence, and quality of inpatient care. Calvillo‐King et al. found a broad range of social factors that potentially affect the risk of postdischarge readmission for chronic heart failure.[19] For pneumonia, there were few studies that assessed the risk of social factors on readmission, and these were most commonly rather broad categories such as race/ethnicity or nursing home residence. In the publications that studied social factors and readmissions, there were inconsistent associations between hospital readmission with lower education, low income, and unemployment. Future articles may benefit from taking these additional factors into account.
Potential limitations to our study include the overwhelming majority of patients being male and in a VA population, which may limit generalizability. In addition, no data were available on the quality of the transition of care. Furthermore, limitations include the age of the data and the lack of evaluation of outpatient follow‐up and antibiotics on discharge. Though our data are up to 10 years old, this study evaluates risk factors that are still relevant. Finally, some variables noted in the CMS model were not evaluated in our study, such as protein‐calorie malnutrition, skin ulcers, and fracture history. Given these differences, we were unable to directly compare the performance of the 2 models.
Despite examining novel factors related to prior healthcare utilization, our model still performed suboptimally in identifying subjects at risk for rehospitalization after pneumonia. Future studies need to examine other social factors and patient frailty that may increase the risk of readmissions, as well as examine the impact of clinical stability on discharge. It remains to be determined if readmissions after pneumonia are truly preventable or mostly attributable to the patient's prior health status.
Disclosures: The project described was supported by grant number R01NR010828 from the National Institute of Nursing Research. The content is solely the responsibility of the authors and does not necessarily represent the official views of the National Institute of Nursing Research or the National Institutes of Health. This material is the result of work supported with resources and the use of facilities at the VA North Texas Health Care System. Funding agencies had no role in conducting the study, or role in the preparation, review, or approval of the manuscript. The views expressed in this article are those of the authors and do not necessarily represent the views of the Department of Veterans Affairs.
- , , , et al. Incidence and cost of pneumonia in Medicare beneficiaries. Chest. 2012;142(4):973–981.
- , , . Rehospitalizations among patients in the Medicare fee‐for‐service program. N Engl J Med. 2009;360(14):1418–1428.
- , , , et al. A prospective cohort study of healthcare visits and rehospitalizations after discharge of patients with community‐acquired pneumonia. Respirology. 2011;16(7):1119–1126.
- , , , et al. Pneumonia: criteria for patient instability on hospital discharge. Chest. 2008;134(3):595–600.
- , , , et al. Instability on hospital discharge and the risk of adverse outcomes in patients with pneumonia. Arch Intern Med. 2002;162(11):1278–1284.
- , , , et al. Causes and risk factors for rehospitalization of patients hospitalized with community‐acquired pneumonia. Clin Infect Dis. 2008;46(4):550–556.
- , , , et al. Population‐based study of statins, angiotensin II receptor blockers, and angiotensin‐converting enzyme inhibitors on pneumonia‐related outcomes. Clin Infect Dis. 2012;55(11):1466–1473.
- , , , et al. Quality of care, process, and outcomes in elderly patients with pneumonia. JAMA. 1997;278(23):2080–2084.
- U.S. Department of Veterans Affairs. Health benefits. Priority groups table. Available at: http://www.va.gov/healthbenefits/resources/priority_groups.asp. Accessed July 1, 2013.
- , , , et al. Validation of a combined comorbidity index. J Clin Epidemiol. 1994;47(11):1245–1251.
- , , , et al. Incidence of cardiovascular events after hospital admission for pneumonia. Am J Med. 2011;124(3):244–251.
- , , , et al. Diagnosis of pulmonary malignancy after hospitalization for pneumonia. Am J Med. 2010;123(1):66–71.
- MedPAC. 2013 [cited 2013 June 11]; Available from: http://www.hospitalcompare.gov.
- , , . The relationship between hospital admission rates and rehospitalizations. N Engl J Med. 2011;365(24):2287–2295.
- , , , et al. Predictors of short‐term rehospitalization following discharge of patients hospitalized with community‐acquired pneumonia. Chest. 2009;136(4):1079–1085.
- , , , et al. Effects of previous influenza vaccination on subsequent readmission and mortality in elderly patients hospitalized with pneumonia. Am J Med. 2003;115(6):454–461.
- , , . Does increased access to primary care reduce hospital readmissions? N Engl J Med. 1996;334(22):1441–1447.
- , , , et al. Development, validation, and results of a measure of 30‐day readmission following hospitalization for pneumonia. J Hosp Med. 2011;6(3):142–150.
- , , , et al. Impact of social factors on risk of readmission or mortality in pneumonia and heart failure: systematic review. J Gen Intern Med. 2013;28(2):269–282.
Pneumonia remains a significant problem in the United States, both in terms of mortality as well as cost to the healthcare system. Each year, over 1 million patients are hospitalized for pneumonia, with costs conservatively estimated at more than $7 billion in 2010.[1] One contributing factor for these costs is that pneumonia is the second most frequent reason for rehospitalization.[2] Rehospitalization after admission for pneumonia is now used as a marker for quality of care.
Given the cost and adverse outcomes of pneumonia, it is important to examine early rehospitalization to better understand what factors play a role. Studies have examined factors associated with readmission following an initial pneumonia‐related hospitalization. Adamuz et al. showed that additional healthcare visits and rehospitalizations within 30 days of discharge from the hospital were common and were associated with worsening of signs or symptoms of pneumonia and/or comorbidities.[3] Other studies demonstrated that instability on hospital discharge, as well as treatment failure, were associated with increased risk of rehospitalization.[4, 5] Jasti et al. found rehospitalizations following pneumonia were usually comorbidity related, primarily cardiopulmonary and/or neurologic disease, rather than due to the index pneumonia.[6] Many of these studies, and others looking at age, activity of daily living score, socioeconomic status, and comorbidity characteristics, were performed in relatively small cohorts. Predictors of rehospitalization have not been studied in a large cohort of patients in an integrated healthcare system.
Our study looks at factors not addressed in prior studies that have used administrative claims data to identify factors associated with early readmission. We also evaluated these admission risk factors in a veteran population, whereas prior studies have primarily focused on those who receive Medicare. The purpose of this study was to examine predictors of early (30 days) readmission in the Veterans Affairs (VA) healthcare system for patients age 65 years and older hospitalized for pneumonia. Our a priori hypothesis was that comorbid illnesses, such as congestive heart failure and chronic obstructive pulmonary disease, and patients with high medical complexity, such as high number of medications and/or prior hospitalizations and nursing home residence, are the primary factors associated with increased risk of rehospitalization.
METHODS
For this national cohort study, we used data from the VA healthcare system administrative and clinical databases that serve as repositories of clinical data from more than 150 VA hospitals and 850 outpatient clinics throughout the United States. The institutional review boards of the University of Texas Health Science Center at San Antonio and VA North Texas Health Care System approved this study. Details regarding the study design and methods were previously published.[7]
Inclusion Criteria
Patients included in this study were hospitalized between October 2001 and September 2007, had a primary diagnosis of pneumonia/emnfluenza (International Classification of Diseases, 9th Revision [ICD‐9] codes 480.0483.99 or 485487) or a secondary discharge diagnosis of pneumonia with a primary diagnosis of respiratory failure (ICD‐9 code 518.81) or sepsis (ICD‐9 code 038.xx),[8] and were aged 65 years or older on the date of admission. To ensure patients obtained their care primarily at the VA, at least 1 VA outpatient clinic visit in the year preceding the index admission and at least 1 active and filled outpatient medication from a VA pharmacy within 90 days of admission were required for inclusion.
If a patient was admitted more than once during the study period, only the first hospitalization was included as the index admission.
Exclusion Criteria
Patients who died during the initial hospitalization were not included in this study. Patients admitted to hospitals with fewer than 25 reported hospitalizations during October 2001 to September 2007 were excluded, as these hospitals are neither representative nor generalizable. This resulted in the removal of 59 patients from 5 different hospitals.
Data Sources and Definitions
We used inpatient and outpatient demographic, utilization, and comorbidity data from the National Patient Care Database. Pharmacy data were extracted from the Decision Support System National Data Extracts and Pharmacy Benefits Management. Vital status information was obtained from the Vital Status file, which incorporates data from veterans' death benefits claims, inpatient deaths, Medicare Vital Status files, and the Social Security Administration's death master file. We used encrypted patient identifiers link to information across these databases.
We obtained demographic information (age, sex, race, marital status) from inpatient and outpatient data. We categorized race as white, black, Hispanic, and other/unknown. To infer active smoking and/or tobacco cessation attempts, we identified ICD‐9 codes for tobacco use (305.1, V15.82), smoking cessation clinic use, and/or use of medications for the treatment of nicotine dependence (Zyban, nicotine replacement, or varenicline). We used VA priority status as a proxy for socioeconomic and disability status. VA priority groups are a way for the VA to focus limited funds to those veterans most in need. The highest group (priority group 1) must have at least a 50% service‐connected disability. Priority groups 2 through 6 include veterans with up to 40% service‐connected disability, former prisoners of war, those awarded certain honors, veterans with lower incomes, and the catastrophically disabled. The lowest groups (priority groups 7 and 8) include veterans with relatively higher incomes who agree to pay copayments.[9]
We also obtained information on comorbid conditions from inpatient and outpatient administrative data. We defined alcohol abuse using ICD‐9 codes 291, 303, 305.0, and illicit drug use with ICD‐9 codes 292, 304, 305 excluding 305.0‐.1. We used the Charlson Comorbidity Index to quantify levels of preexisting comorbidity[10] adapted for administrative databases, using ICD‐9 codes for 19 comorbid conditions from prior outpatient and inpatient encounters. We defined cardiovascular events and lung cancer that were diagnosed during the hospitalization as previously described.[11, 12]
Outcomes
Our primary study outcome was readmission within 30 days of hospital discharge for pneumonia from any VA acute care hospital only. Medicare has used 30‐day readmission as a quality indicator, as readmissions that occur closer to discharge are believed to be more likely due to events during the index hospitalization.[13]
Statistical Analyses
We randomly divided patients from our initial cohort into equal derivation or validation cohorts. We assessed differences between the 2 groups using the Student t test for continuous variables and 2 test for categorical variables. We performed univariate logistic regression analyses in the derivation cohort to examine the relationship between 30‐day rehospitalization and each of our potential covariates. We entered covariates that were significant at P<0.10 in the univariate analyses into a multiple regression model. Significant covariates at P<0.10 were then entered into the final model. For this model, we used bootstrapping with replacement in 1000 replications to obtain standard errors of our coefficients and associated P values. Because some subjects had more than 1 index admission, we used robust variancecovariance matrix estimators to compute standard errors for model coefficients.
We used the C statistic to assess the discrimination of our model. Calibration of this model was measured using the Hosmer‐Lemeshow 2 goodness of fit test, using 10 quantiles to group the data. We evaluated differences in discrimination between the derivation and validation cohorts by comparing C statistics.
Last, using the final model in the derivation cohort, 5 categories of severity were created based on subjects' predicted risk values for readmission. Severity categories in both the derivation and validation cohorts were then graphically evaluated.
We defined statistical significance as a 2‐tailed P value of <0.05. We used Stata 12 (StataCorp, College Station, TX) for all analyses.
RESULTS
Patient Characteristics
Of the 45,134 eligible patients, 13.2% were rehospitalized within 30 days, and rates by hospital ranged from 1.6% to 20.7%. Table 1 presents the comparison of baseline difference between the derivation and validation cohorts. There were no statistically significant differences between the 2 groups. Overall, the mean age was 77 years, 98% were male, and 54% were married. Over 90% of the patients received guideline‐concordant antibiotics, and only 10% required a stay in the intensive care unit (ICU). The average length of stay was 7 days (standard deviation of 11 days).
| Characteristics | Derivation Cohort, N=22,567 | Validation Cohort, N=22,567 | P Value |
|---|---|---|---|
| |||
| Sociodemographics | |||
| Age, mean (SD) | 77.3 (6.5) | 77.2 (6.5) | 0.30 |
| Male, no (%) | 22,133 (98.1) | 22,175 (98.3) | 0.14 |
| White, no (%) | 18,858 (83.6) | 18,719 (83.0) | 0.08 |
| Black, no (%) | 2,562 (11.4) | 2,583 (11.5) | 0.76 |
| Hispanic, no (%) | 1,337 (5.9) | 1,414 (6.3) | 0.13 |
| Married, no (%) | 12,166 (53.9) | 12,258 (54.3) | 0.39 |
| VA priority group, no (%) | 0.28 | ||
| 1 | 4,286 (19.0) | 4,281 (19.0) | |
| 26 | 16,306 (72.3) | 16,399 (72.8) | |
| 78 | 1,954 (8.7) | 1,860 (8.3) | |
| Nursing home residence, no (%) | 199 (0.9) | 216 (1.0) | 0.41 |
| Smoker status, no (%) | 8,579 (38.0) | 8,677 (38.5) | 0.34 |
| Index hospitalization factors | |||
| Myocardial infarction during hospitalization, no (%) | 469 (2.1) | 452 (2.0) | 0.57 |
| Heart failure during hospitalization, no (%) | 4,817 (21.4) | 4,772 (21.2) | 0.61 |
| Arrhythmia during hospitalization, no (%) | 4,356 (19.3) | 4,287 (19.0) | 0.41 |
| Length of stay, mean (SD) | 7.2 (10.4) | 7.2 (11.7) | 0.76 |
| Lung cancer diagnosis during hospitalization, no (%) | 31 (0.1) | 31 (0.1) | 1.00 |
| ICU admission, no (%) | 2,282 (10.1) | 2,336 (10.4) | 0.40 |
| Guideline concordant antibiotics, no (%) | 20,724 (91.8) | 20,643 (91.5) | 0.17 |
| Invasive mechanical ventilation, no (%) | 793 (3.5) | 832 (3.7) | 0.32 |
| Vasopressor use, no (%) | 495 (2.2) | 489 (2.2) | 0.85 |
| Hospital complications, no (%) | |||
| Renal organ failure | 2,671 (11.8) | 2,640 (11.7) | 0.65 |
| Cardiac organ failure | 1,004 (4.5) | 959 (4.3) | 0.30 |
| Hepatic organ failure | 33 (0.2) | 40 (0.2) | 0.41 |
| Respiratory organ failure | 1,623 (7.2) | 1,583 (7.0) | 0.46 |
| Comorbid illnesses | |||
| Medical, no (%) | |||
| Myocardial infarction | 1,528 (6.8) | 1,542 (6.8) | 0.79 |
| Congestive heart failure | 5,815 (25.8) | 5,697 (25.2) | 0.20 |
| Peripheral vascular disease | 3,413 (15.1) | 3,454 (15.3) | 0.59 |
| Cerebrovascular disease | 3,993 (17.7) | 4,078 (18.1) | 0.30 |
| Dementia | 1,141 (5.1) | 1,110 (4.9) | 0.50 |
| COPD | 12,168 (53.9) | 12,076 (53.5) | 0.39 |
| Rheumatologic disease | 646 (2.9) | 660 (2.9) | 0.69 |
| Peptic ulcer disease | 795 (3.5) | 723 (3.2) | 0.06 |
| Severe liver disease | 169 (0.8) | 169 (0.8) | 1.00 |
| Mild liver disease | 78 (0.4) | 80 (0.4) | 0.87 |
| Diabetes | 7,310 (32.4) | 7,410 (32.8) | 0.32 |
| Diabetes with complications | 2,229 (9.9) | 2,248 (10.0) | 0.77 |
| Chronic renal disease | 2,836 (12.6) | 2,745 (12.2) | 0.19 |
| Hemi/paraplegia | 319 (1.4) | 338 (1.5) | 0.46 |
| Any prior malignancy | 5,226 (23.2) | 5,269 (23.4) | 0.63 |
| Metastatic solid tumor | 748 (3.3) | 795 (3.5) | 0.22 |
| AIDS | 56 (0.3) | 49 (0.2) | 0.49 |
| HIV | 23 (0.1) | 13 (0.1) | 0.10 |
| Alcohol abuse | 897 (4.0) | 934 (4.1) | 0.38 |
| Drug abuse | 254 (1.1) | 255 (1.1) | 0.96 |
| Psychiatric, no (%) | |||
| Anxiety disorder | 1,692 (7.5) | 1,722 (7.6) | 0.59 |
| Depression indicator | 3,655 (16.2) | 3,718 (16.5) | 0.42 |
| Bipolar disorder | 430 (1.9) | 433 (1.9) | 0.92 |
| Cataract indicator | 6,106 (27.1) | 6,180 (27.4) | 0.43 |
| Prostatitis indicator | 4,680 (20.7) | 4,593 (20.4) | 0.31 |
| Schizophrenia indicator | 685 (3.0) | 676 (3.0) | 0.80 |
| Post‐traumatic stress disorder | 844 (3.7) | 862 (3.8) | 0.66 |
| Medication history within 90 days | |||
| Cardiovascular drugs, mean (SD) | 1.8 (1.6) | 1.8 (1.6) | 0.65 |
| Diabetes drugs, mean (SD) | 0.3 (0.7) | 0.3 (0.7) | 0.60 |
| Inhaled corticosteroids, mean (SD) | 0.4 (0.9) | 0.4 (0.9) | 0.28 |
| Pulmonary drug, mean (SD) | 1.3 (2.0) | 1.3 (2.0) | 0.36 |
| Oral corticosteroids, no (%) | 5,363 (23.8) | 5,505 (24.4) | 0.12 |
| Prior medical utilization | |||
| Number of primary care clinic visits within 1 year, mean (SD) | 4.9 (4.2) | 4.9 (4.2) | 0.67 |
| Number of emergency department visits within 1 year, mean (SD) | 1.2 (2.0) | 1.2 (2.0) | 0.86 |
| Number of outpatient clinic visits within 1 year, mean (SD) | 14.7 (13.1) | 14.6 (13.0) | 0.33 |
| Number of specialty clinic visits within 1 year, mean (SD) | 3.4 (5.5) | 3.3 (5.4) | 0.50 |
| Prior hospital admission within 90 days, no (%) | 5,062 (22.4) | 5,141 (22.8) | 0.37 |
Predictors of 30‐Day Readmission
All variables listed in Table 1 were evaluated. The derivation logistic regression model is shown in Table 2, and only includes predictors associated with rehospitalization. Antibiotic concordance and time in the ICU were evaluated and did not predict readmission. Variables that were significantly associated with rehospitalization in the models included age, marital status, the number of emergency department clinic visits a year prior, prior admission within 90 days, number of nonpharmacy clinic visits in a year prior, and hospital length of stay. The increasing age and number of emergency department and clinic visits were associated with higher odds of readmission. The longer the length of stay and those patients who were married had a lower odds of subsequent readmission. Other variables included were the presence of chronic renal disease, prior malignancy, nursing home residence, congestive heart failure, and prior use of oral corticosteroids. The C statistics for the derivation and validation models were 0.615 and 0.613, respectively. There were no significant differences in any of the variables between the derivation and validation cohorts.
| Predictors | OR | 95% CI | P Value | |
|---|---|---|---|---|
| Lower | Upper | |||
| ||||
| Sociodemographics | ||||
| Age at admission | 1.01 | 1.00 | 1.02 | <0.01 |
| White | 1.14 | 1.02 | 1.28 | 0.02 |
| Nonwhiteb | 1.00 | |||
| Hispanic | 1.26 | 1.07 | 1.47 | 0.01 |
| Not Hispanicc | 1.00 | |||
| Married | 0.89 | 0.82 | 0.96 | <0.01 |
| Not marriedd | 1.00 | |||
| Nursing home residence | 1.68 | 1.18 | 2.39 | <0.01 |
| Comorbid illnesses | ||||
| Peptic ulcer disease | 1.24 | 1.02 | 1.50 | 0.03 |
| Chronic renal disease | 1.18 | 1.06 | 1.33 | <0.01 |
| Any prior malignancy | 1.17 | 1.06 | 1.28 | <0.01 |
| Metastatic solid tumor | 1.20 | 0.98 | 1.47 | 0.08 |
| AIDS | 1.99 | 1.06 | 3.74 | 0.03 |
| Index admission factors | ||||
| Heart failure on initial admission | 1.18 | 1.07 | 1.29 | <0.01 |
| Length of stay (per day) | 0.97 | 0.97 | 0.98 | <0.01 |
| Medication history | ||||
| Cardiovascular drug count 90 days prior | 1.03 | 1.00 | 1.06 | 0.02 |
| Oral corticosteroids 90 days prior | 1.16 | 1.06 | 1.27 | <0.01 |
| Prior medical utilization | ||||
| Number of emergency department visits within 1 year | 1.04 | 1.02 | 1.06 | <0.01 |
| Number of specialty clinic visits within 1 year | 1.01 | 1.00 | 1.02 | 0.01 |
| Prior hospital admission within 90 days | 1.60 | 1.46 | 1.75 | <0.01 |
| Number of nonpharmacy clinic visits within 1 year | 1.00 | 1.00 | 1.01 | <0.01 |
Figure 1 shows that the derivation and validation models are similar in percent rehospitalization group in all severity groups.
DISCUSSION
Sociodemographics and comorbidities, which are host factors, were significantly associated with rehospitalization of elderly patients admitted for pneumonia and length of hospital stay, the only pneumonia‐specific variable associated with readmission.[6, 14, 15, 16] Higher rates of all types of prior utilization (inpatient, outpatient, emergency department visits) were also associated with higher risk of rehospitalization. Our findings highlight the role that host factors play in rehospitalization of elderly patients with pneumonia and that there are few potentially modifiable targets to help reduce readmissions after pneumonia.
These findings may indicate 2 things: patients in this cohort are sicker than the general population at baseline and therefore require more medical care, and/or they are being evaluated by more providers increasing the chance they will be readmitted. For the former, an example is the association of prior use of oral corticosteroids with rehospitalization, which may demonstrate poorly controlled comorbidities (eg, chronic obstructive lung disease with recent exacerbation) that require steroid use. Given the VA's integrated healthcare system, greater access to primary care providers may lead to more opportunities for patients to voice their complaints, which can lead to more readmissions among severely ill patients. Weinberger et al. found an increase in hospital readmissions with increased access to primary care.[17] The association of readmission and length of stay is less likely related to pneumonia‐related clinical instabilities on discharge, but rather to the ability to address other potential issues related to the patient's underlying comorbidities.[5]
Our study presents a model looking at rehospitalization of patients with pneumonia, including factors not addressed in a prior publication by Lindenauer et al., the model Centers for Medicare and Medicaid Services (CMS) uses to predict early rehospitalization.[18] Lindenauer's model included 39 variables (of which 37 were clinical variables), including vertebral fractures, other injuries, other gastrointestinal disorders, other urinary tract disorders, as well as demographic and comorbidity factors that were similar to some of those included in our study. Their 30‐day rehospitalization medical record and administrative models had a C statistic of 0.59 and 0.63, respectively. A major difference between our presented model and the latter are the data on utilization of medical care. Despite these additional data, the resulting C statistics of 0.615 and 0.613 were not qualitatively better.
The similar C statistics demonstrates that factors playing a significant role in determining rehospitalization have yet to be identified, and it is not clear if researchers will be able to identify potentially modifiable risk factors for rehospitalization. Examples of other potential factors that should be examined in future studies include family/community support, quality of the transition of care back to their residence, and quality of inpatient care. Calvillo‐King et al. found a broad range of social factors that potentially affect the risk of postdischarge readmission for chronic heart failure.[19] For pneumonia, there were few studies that assessed the risk of social factors on readmission, and these were most commonly rather broad categories such as race/ethnicity or nursing home residence. In the publications that studied social factors and readmissions, there were inconsistent associations between hospital readmission with lower education, low income, and unemployment. Future articles may benefit from taking these additional factors into account.
Potential limitations to our study include the overwhelming majority of patients being male and in a VA population, which may limit generalizability. In addition, no data were available on the quality of the transition of care. Furthermore, limitations include the age of the data and the lack of evaluation of outpatient follow‐up and antibiotics on discharge. Though our data are up to 10 years old, this study evaluates risk factors that are still relevant. Finally, some variables noted in the CMS model were not evaluated in our study, such as protein‐calorie malnutrition, skin ulcers, and fracture history. Given these differences, we were unable to directly compare the performance of the 2 models.
Despite examining novel factors related to prior healthcare utilization, our model still performed suboptimally in identifying subjects at risk for rehospitalization after pneumonia. Future studies need to examine other social factors and patient frailty that may increase the risk of readmissions, as well as examine the impact of clinical stability on discharge. It remains to be determined if readmissions after pneumonia are truly preventable or mostly attributable to the patient's prior health status.
Disclosures: The project described was supported by grant number R01NR010828 from the National Institute of Nursing Research. The content is solely the responsibility of the authors and does not necessarily represent the official views of the National Institute of Nursing Research or the National Institutes of Health. This material is the result of work supported with resources and the use of facilities at the VA North Texas Health Care System. Funding agencies had no role in conducting the study, or role in the preparation, review, or approval of the manuscript. The views expressed in this article are those of the authors and do not necessarily represent the views of the Department of Veterans Affairs.
- , , , et al. Incidence and cost of pneumonia in Medicare beneficiaries. Chest. 2012;142(4):973–981.
- , , . Rehospitalizations among patients in the Medicare fee‐for‐service program. N Engl J Med. 2009;360(14):1418–1428.
- , , , et al. A prospective cohort study of healthcare visits and rehospitalizations after discharge of patients with community‐acquired pneumonia. Respirology. 2011;16(7):1119–1126.
- , , , et al. Pneumonia: criteria for patient instability on hospital discharge. Chest. 2008;134(3):595–600.
- , , , et al. Instability on hospital discharge and the risk of adverse outcomes in patients with pneumonia. Arch Intern Med. 2002;162(11):1278–1284.
- , , , et al. Causes and risk factors for rehospitalization of patients hospitalized with community‐acquired pneumonia. Clin Infect Dis. 2008;46(4):550–556.
- , , , et al. Population‐based study of statins, angiotensin II receptor blockers, and angiotensin‐converting enzyme inhibitors on pneumonia‐related outcomes. Clin Infect Dis. 2012;55(11):1466–1473.
- , , , et al. Quality of care, process, and outcomes in elderly patients with pneumonia. JAMA. 1997;278(23):2080–2084.
- U.S. Department of Veterans Affairs. Health benefits. Priority groups table. Available at: http://www.va.gov/healthbenefits/resources/priority_groups.asp. Accessed July 1, 2013.
- , , , et al. Validation of a combined comorbidity index. J Clin Epidemiol. 1994;47(11):1245–1251.
- , , , et al. Incidence of cardiovascular events after hospital admission for pneumonia. Am J Med. 2011;124(3):244–251.
- , , , et al. Diagnosis of pulmonary malignancy after hospitalization for pneumonia. Am J Med. 2010;123(1):66–71.
- MedPAC. 2013 [cited 2013 June 11]; Available from: http://www.hospitalcompare.gov.
- , , . The relationship between hospital admission rates and rehospitalizations. N Engl J Med. 2011;365(24):2287–2295.
- , , , et al. Predictors of short‐term rehospitalization following discharge of patients hospitalized with community‐acquired pneumonia. Chest. 2009;136(4):1079–1085.
- , , , et al. Effects of previous influenza vaccination on subsequent readmission and mortality in elderly patients hospitalized with pneumonia. Am J Med. 2003;115(6):454–461.
- , , . Does increased access to primary care reduce hospital readmissions? N Engl J Med. 1996;334(22):1441–1447.
- , , , et al. Development, validation, and results of a measure of 30‐day readmission following hospitalization for pneumonia. J Hosp Med. 2011;6(3):142–150.
- , , , et al. Impact of social factors on risk of readmission or mortality in pneumonia and heart failure: systematic review. J Gen Intern Med. 2013;28(2):269–282.
2014 Society of Hospital Medicine. This article is a US government work and, as such, is in the public domain in the United States of America.
