User login
Predicting Readmissions from EHR Data
Unplanned hospital readmissions are frequent, costly, and potentially avoidable.[1, 2] Due to major federal financial readmissions penalties targeting excessive 30‐day readmissions, there is increasing attention to implementing hospital‐initiated interventions to reduce readmissions.[3, 4] However, universal enrollment of all hospitalized patients into such programs may be too resource intensive for many hospitals.[5] To optimize efficiency and effectiveness, interventions should be targeted to individuals most likely to benefit.[6, 7] However, existing readmission risk‐prediction models have achieved only modest discrimination, have largely used administrative claims data not available until months after discharge, or are limited to only a subset of patients with Medicare or a specific clinical condition.[8, 9, 10, 11, 12, 13, 14] These limitations have precluded accurate identification of high‐risk individuals in an all‐payer general medical inpatient population to provide actionable information for intervention prior to discharge.
Approaches using electronic health record (EHR) data could allow early identification of high‐risk patients during the index hospitalization to enable initiation of interventions prior to discharge. To date, such strategies have relied largely on EHR data from the day of admission.[15, 16] However, given that variation in 30‐day readmission rates are thought to reflect the quality of in‐hospital care, incorporating EHR data from the entire hospital stay to reflect hospital care processes and clinical trajectory may more accurately identify at‐risk patients.[17, 18, 19, 20] Improved accuracy in risk prediction would help better target intervention efforts in the immediate postdischarge period, an interval characterized by heightened vulnerability for adverse events.[21]
To help hospitals target transitional care interventions more effectively to high‐risk individuals prior to discharge, we derived and validated a readmissions risk‐prediction model incorporating EHR data from the entire course of the index hospitalization, which we termed the full‐stay EHR model. We also compared the full‐stay EHR model performance to our group's previously derived prediction model based on EHR data on the day of admission, termed the first‐day EHR model, as well as to 2 other validated readmission models similarly intended to yield near real‐time risk predictions prior to or shortly after hospital discharge.[9, 10, 15]
METHODS
Study Design, Population, and Data Sources
We conducted an observational cohort study using EHR data from 6 hospitals in the DallasFort Worth metroplex between November 1, 2009 and October 30, 2010 using the same EHR system (Epic Systems Corp., Verona, WI). One site was a university‐affiliated safety net hospital; the remaining 5 sites were teaching and nonteaching community sites.
We included consecutive hospitalizations among adults 18 years old discharged alive from any medicine inpatient service. For individuals with multiple hospitalizations during the study period, we included only the first hospitalization. We excluded individuals who died during the index hospitalization, were transferred to another acute care facility, left against medical advice, or who died outside of the hospital within 30 days of discharge. For model derivation, we randomly split the sample into separate derivation (50%) and validation cohorts (50%).
Outcomes
The primary outcome was 30‐day hospital readmission, defined as a nonelective hospitalization within 30 days of discharge to any of 75 acute care hospitals within a 100‐mile radius of Dallas, ascertained from an all‐payer regional hospitalization database. Nonelective hospitalizations included all hospitalizations classified as a emergency, urgent, or trauma, and excluded those classified as elective as per the Centers for Medicare and Medicaid Services Claim Inpatient Admission Type Code definitions.
Predictor Variables for the Full‐Stay EHR Model
The full‐stay EHR model was iteratively developed from our group's previously derived and validated risk‐prediction model using EHR data available on admission (first‐day EHR model).[15] For the full‐stay EHR model, we included all predictor variables included in our published first‐day EHR model as candidate risk factors. Based on prior literature, we additionally expanded candidate predictors available on admission to include marital status (proxy for social isolation) and socioeconomic disadvantage (percent poverty, unemployment, median income, and educational attainment by zip code of residence as proxy measures of the social and built environment).[22, 23, 24, 25, 26, 27] We also expanded the ascertainment of prior hospitalization to include admissions at both the index hospital and any of 75 acute care hospitals from the same, separate all‐payer regional hospitalization database used to ascertain 30‐day readmissions.
Candidate predictors from the remainder of the hospital stay (ie, following the first 24 hours of admission) were included if they were: (1) available in the EHR of all participating hospitals, (2) routinely collected or available at the time of hospital discharge, and (3) plausible predictors of adverse outcomes based on prior literature and clinical expertise. These included length of stay, in‐hospital complications, transfer to an intensive or coronary care unit, blood transfusions, vital sign instabilities within 24 hours of discharge, select laboratory values at time of discharge, and disposition status. We also assessed trajectories of vital signs and selected laboratory values (defined as changes in these measures from admission to discharge).
Statistical Analysis
Model Derivation
Univariate relationships between readmission and each of the candidate predictors were assessed in the derivation cohort using a prespecified significance threshold of P 0.05. We included all factors from our previously derived and validated first‐day EHR model as candidate predictors.[15] Continuous laboratory and vital sign values at the time of discharge were categorized based on clinically meaningful cutoffs; predictors with missing values were assumed to be normal (<1% missing for each variable). Significant univariate candidate variables were entered in a multivariate logistic regression model using stepwise backward selection with a prespecified significance threshold of P 0.05. We performed several sensitivity analyses to confirm the robustness of our model. First, we alternately derived the full‐stay model using stepwise forward selection. Second, we forced in all significant variables from our first‐day EHR model, and entered the candidate variables from the remainder of the hospital stay using both stepwise backward and forward selection separately. Third, prespecified interactions between variables were evaluated for inclusion. Though final predictors varied slightly between the different approaches, discrimination of each model was similar to the model derived using our primary analytic approach (C statistics 0.01, data not shown).
Model Validation
We assessed model discrimination and calibration of the derived full‐stay EHR model using the validation cohort. Model discrimination was estimated by the C statistic. The C statistic represents the probability that, given 2 hospitalized individuals (1 who was readmitted and the other who was not), the model will predict a higher risk for the readmitted patient than for the nonreadmitted patient. Model calibration was assessed by comparing predicted to observed probabilities of readmission by quintiles of risk, and with the Hosmer‐Lemeshow goodness‐of‐fit test.
Comparison to Existing Models
We compared the full‐stay EHR model performance to 3 previously published models: our group's first‐day EHR model, and the LACE (includes Length of stay, Acute (nonelective) admission status, Charlson Comorbidity Index, and Emergency department visits in the past year) and HOSPITAL (includes Hemoglobin at discharge, discharge from Oncology service, Sodium level at discharge, Procedure during index hospitalization, Index hospitalization Type (nonelective), number of Admissions in the past year, and Length of stay) models, which were both derived to predict 30‐day readmissions among general medical inpatients and were intended to help clinicians identify high‐risk patients to target for discharge interventions.[9, 10, 15] We assessed each model's performance in our validation cohort, calculating the C statistic, integrated discrimination index (IDI), and net reclassification index (NRI) compared to the full‐stay model. IDI is a summary measure of both discrimination and reclassification, where more positive values suggest improvement in model performance in both these domains compared to a reference model.[28] The NRI is defined as the sum of the net proportions of correctly reclassified persons with and without the event of interest.[29] The theoretical range of values is 2 to 2, with more positive values indicating improved net reclassification compared to a reference model. Here, we calculated a category‐based NRI to evaluate the performance of models in correctly classifying individuals with and without readmissions into the highest readmission risk quintile versus the lowest 4 risk quintiles compared to the full‐stay EHR model.[29] This prespecified cutoff is relevant for hospitals interested in identifying the highest‐risk individuals for targeted intervention.[6] Because some hospitals may be able to target a greater number of individuals for intervention, we performed a sensitivity analysis by assessing category‐based NRI for reclassification into the top 2 risk quintiles versus the lowest 3 risk quintiles and found no meaningful difference in our results (data not shown). Finally, we qualitatively assessed calibration of comparator models in our validation cohort by comparing predicted probability to observed probability of readmission by quintiles of risk for each model. We conducted all analyses using Stata 12.1 (StataCorp, College Station, TX). This study was approved by the UT Southwestern Medical Center institutional review board.
RESULTS
Overall, 32,922 index hospitalizations were included in our study cohort; 12.7% resulted in a 30‐day readmission (see Supporting Figure 1 in the online version of this article). Individuals had a mean age of 62 years and had diverse race/ethnicity and primary insurance status; half were female (Table 1). The study sample was randomly split into a derivation cohort (50%, n = 16,492) and validation cohort (50%, n = 16,430). Individuals in the derivation cohort with a 30‐day readmission had markedly different socioeconomic and clinical characteristics compared to those not readmitted (Table 1).
| Entire Cohort, N = 32,922 | Derivation Cohort, N = 16,492 | |||
|---|---|---|---|---|
|
No Readmission, N = 14,312 |
Readmission, N = 2,180 |
P Value | ||
| ||||
| Demographic characteristics | ||||
| Age, y, mean (SD) | 62 (17.3) | 61 (17.4) | 64 (17.0) | 0.001 |
| Female, n (%) | 17,715 (53.8) | 7,694 (53.8) | 1,163 (53.3) | 0.72 |
| Race/ethnicity | 0.001 | |||
| White | 21,359 (64.9) | 9,329 (65.2) | 1,361 (62.4) | |
| Black | 5,964 (18.1) | 2,520 (17.6) | 434 (19.9) | |
| Hispanic | 4,452 (13.5) | 1,931 (13.5) | 338 (15.5) | |
| Other | 1,147 (3.5) | 532 (3.7) | 47 (2.2) | |
| Marital status, n (%) | 0.001 | |||
| Single | 8,076 (24.5) | 3,516 (24.6) | 514 (23.6) | |
| Married | 13,394 (40.7) | 5,950 (41.6) | 812 (37.3) | |
| Separated/divorced | 3,468 (10.5) | 1,460 (10.2) | 251 (11.5) | |
| Widowed | 4,487 (13.7) | 1,868 (13.1) | 388 (17.8) | |
| Other | 3,497 (10.6) | 1,518 (10.6) | 215 (9.9) | |
| Primary payer, n (%) | 0.001 | |||
| Private | 13,090 (39.8) | 5,855 (40.9) | 726 (33.3) | |
| Medicare | 13,015 (39.5) | 5,597 (39.1) | 987 (45.3) | |
| Medicaid | 2,204 (6.7) | 852 (5.9) | 242 (11.1) | |
| Charity, self‐pay, or other | 4,613 (14.0) | 2,008 (14.0) | 225 (10.3) | |
| High‐poverty neighborhood, n (%)* | 7,468 (22.7) | 3,208 (22.4) | 548 (25.1) | 0.001 |
| Utilization history | ||||
| 1 ED visits in past year, n (%) | 9,299 (28.2) | 3,793 (26.5) | 823 (37.8) | 0.001 |
| 1 hospitalizations in past year, n (%) | 10,189 (30.9) | 4,074 (28.5) | 1,012 (46.4) | 0.001 |
| Clinical factors from first day of hospitalization | ||||
| Nonelective admission, n (%) | 27,818 (84.5) | 11,960 (83.6) | 1,960 (89.9) | 0.001 |
| Charlson Comorbidity Index, median (IQR)∥ | 0 (01) | 0 (00) | 0 (03) | 0.001 |
| Laboratory abnormalities within 24 hours of admission | ||||
| Albumin <2 g/dL | 355 (1.1) | 119 (0.8) | 46 (2.1) | 0.001 |
| Albumin 23 g/dL | 4,732 (14.4) | 1,956 (13.7) | 458 (21.0) | 0.001 |
| Aspartate aminotransferase >40 U/L | 4,610 (14.0) | 1,922 (13.4) | 383 (17.6) | 0.001 |
| Creatine phosphokinase <60 g/L | 3,728 (11.3) | 1,536 (10.7) | 330 (15.1) | 0.001 |
| Mean corpuscular volume >100 fL/red cell | 1,346 (4.1) | 537 (3.8) | 134 (6.2) | 0.001 |
| Platelets <90 103/L | 912 (2.8) | 357 (2.5) | 116 (5.3) | 0.001 |
| Platelets >350 103/L | 3,332 (10.1) | 1,433 (10.0) | 283 (13.0) | 0.001 |
| Prothrombin time >35 seconds | 248 (0.8) | 90 (0.6) | 35 (1.6) | 0.001 |
| Clinical factors from remainder of hospital stay | ||||
| Length of stay, d, median (IQR) | 4 (26) | 4 (26) | 5 (38) | 0.001 |
| ICU transfer after first 24 hours, n (%) | 988 (3.0) | 408 (2.9) | 94 (4.3) | 0.001 |
| Hospital complications, n (%) | ||||
| Clostridium difficile infection | 119 (0.4) | 44 (0.3) | 24 (1.1) | 0.001 |
| Pressure ulcer | 358 (1.1) | 126 (0.9) | 46 (2.1) | 0.001 |
| Venous thromboembolism | 301 (0.9) | 112 (0.8) | 34 (1.6) | 0.001 |
| Respiratory failure | 1,048 (3.2) | 463 (3.2) | 112 (5.1) | 0.001 |
| Central line‐associated bloodstream infection | 22 (0.07) | 6 (0.04) | 5 (0.23) | 0.005 |
| Catheter‐associated urinary tract infection | 47 (0.14) | 20 (0.14) | 6 (0.28) | 0.15 |
| Acute myocardial infarction | 293 (0.9) | 110 (0.8) | 32 (1.5) | 0.001 |
| Pneumonia | 1,754 (5.3) | 719 (5.0) | 154 (7.1) | 0.001 |
| Sepsis | 853 (2.6) | 368 (2.6) | 73 (3.4) | 0.04 |
| Blood transfusion during hospitalization, n (%) | 4,511 (13.7) | 1,837 (12.8) | 425 (19.5) | 0.001 |
| Laboratory abnormalities at discharge# | ||||
| Blood urea nitrogen >20 mg/dL, n (%) | 10,014 (30.4) | 4,077 (28.5) | 929 (42.6) | 0.001 |
| Sodium <135 mEq/L, n (%) | 4,583 (13.9) | 1,850 (12.9) | 440 (20.2) | 0.001 |
| Hematocrit 27 | 3,104 (9.4) | 1,231 (8.6) | 287 (13.2) | 0.001 |
| 1 vital sign instability at discharge, n (%)# | 6,192 (18.8) | 2,624 (18.3) | 525 (24.1) | 0.001 |
| Discharge location, n (%) | 0.001 | |||
| Home | 23,339 (70.9) | 10,282 (71.8) | 1,383 (63.4) | |
| Home health | 3,185 (9.7) | 1,356 (9.5) | 234 (10.7) | |
| Postacute care** | 5,990 (18.2) | 2,496 (17.4) | 549 (25.2) | |
| Hospice | 408 (1.2) | 178 (1.2) | 14 (0.6) | |
Derivation and Validation of the Full‐Stay EHR Model for 30‐Day Readmission
Our final model included 24 independent variables, including demographic characteristics, utilization history, clinical factors from the first day of admission, and clinical factors from the remainder of the hospital stay (Table 2). The strongest independent predictor of readmission was hospital‐acquired Clostridium difficile infection (adjusted odds ratio [AOR]: 2.03, 95% confidence interval [CI] 1.18‐3.48); other hospital‐acquired complications including pressure ulcers and venous thromboembolism were also significant predictors. Though having Medicaid was associated with increased odds of readmission (AOR: 1.55, 95% CI: 1.31‐1.83), other zip codelevel measures of socioeconomic disadvantage were not predictive and were not included in the final model. Being discharged to hospice was associated with markedly lower odds of readmission (AOR: 0.23, 95% CI: 0.13‐0.40).
| Odds Ratio (95% CI) | ||
|---|---|---|
| Univariate | Multivariate* | |
| ||
| Demographic characteristics | ||
| Age, per 10 years | 1.08 (1.051.11) | 1.07 (1.041.10) |
| Medicaid | 1.97 (1.702.29) | 1.55 (1.311.83) |
| Widow | 1.44 (1.281.63) | 1.27 (1.111.45) |
| Utilization history | ||
| Prior ED visit, per visit | 1.08 (1.061.10) | 1.04 (1.021.06) |
| Prior hospitalization, per hospitalization | 1.30 (1.271.34) | 1.16 (1.121.20) |
| Hospital and clinical factors from first day of hospitalization | ||
| Nonelective admission | 1.75 (1.512.03) | 1.42 (1.221.65) |
| Charlson Comorbidity Index, per point | 1.19 (1.171.21) | 1.06 (1.041.09) |
| Laboratory abnormalities within 24 hours of admission | ||
| Albumin <2 g/dL | 2.57 (1.823.62) | 1.52 (1.052.21) |
| Albumin 23 g/dL | 1.68 (1.501.88) | 1.20 (1.061.36) |
| Aspartate aminotransferase >40 U/L | 1.37 (1.221.55) | 1.21 (1.061.38) |
| Creatine phosphokinase <60 g/L | 1.48 (1.301.69) | 1.28 (1.111.46) |
| Mean corpuscular volume >100 fL/red cell | 1.68 (1.382.04) | 1.32 (1.071.62) |
| Platelets <90 103/L | 2.20 (1.772.72) | 1.56 (1.231.97) |
| Platelets >350 103/L | 1.34 (1.171.54) | 1.24 (1.081.44) |
| Prothrombin time >35 seconds | 2.58 (1.743.82) | 1.92 (1.272.90) |
| Hospital and clinical factors from remainder of hospital stay | ||
| Length of stay, per day | 1.08 (1.071.09) | 1.06 (1.041.07) |
| Hospital complications | ||
| Clostridium difficile infection | 3.61 (2.195.95) | 2.03 (1.183.48) |
| Pressure ulcer | 2.43 (1.733.41) | 1.64 (1.152.34) |
| Venous thromboembolism | 2.01 (1.362.96) | 1.55 (1.032.32) |
| Laboratory abnormalities at discharge | ||
| Blood urea nitrogen >20 mg/dL | 1.86 (1.702.04) | 1.37 (1.241.52) |
| Sodium <135 mEq/L | 1.70 (1.521.91) | 1.34 (1.181.51) |
| Hematocrit 27 | 1.61 (1.401.85) | 1.22 (1.051.41) |
| Vital sign instability at discharge, per instability | 1.29 (1.201.40) | 1.25 (1.151.36) |
| Discharged to hospice | 0.51 (0.300.89) | 0.23 (0.130.40) |
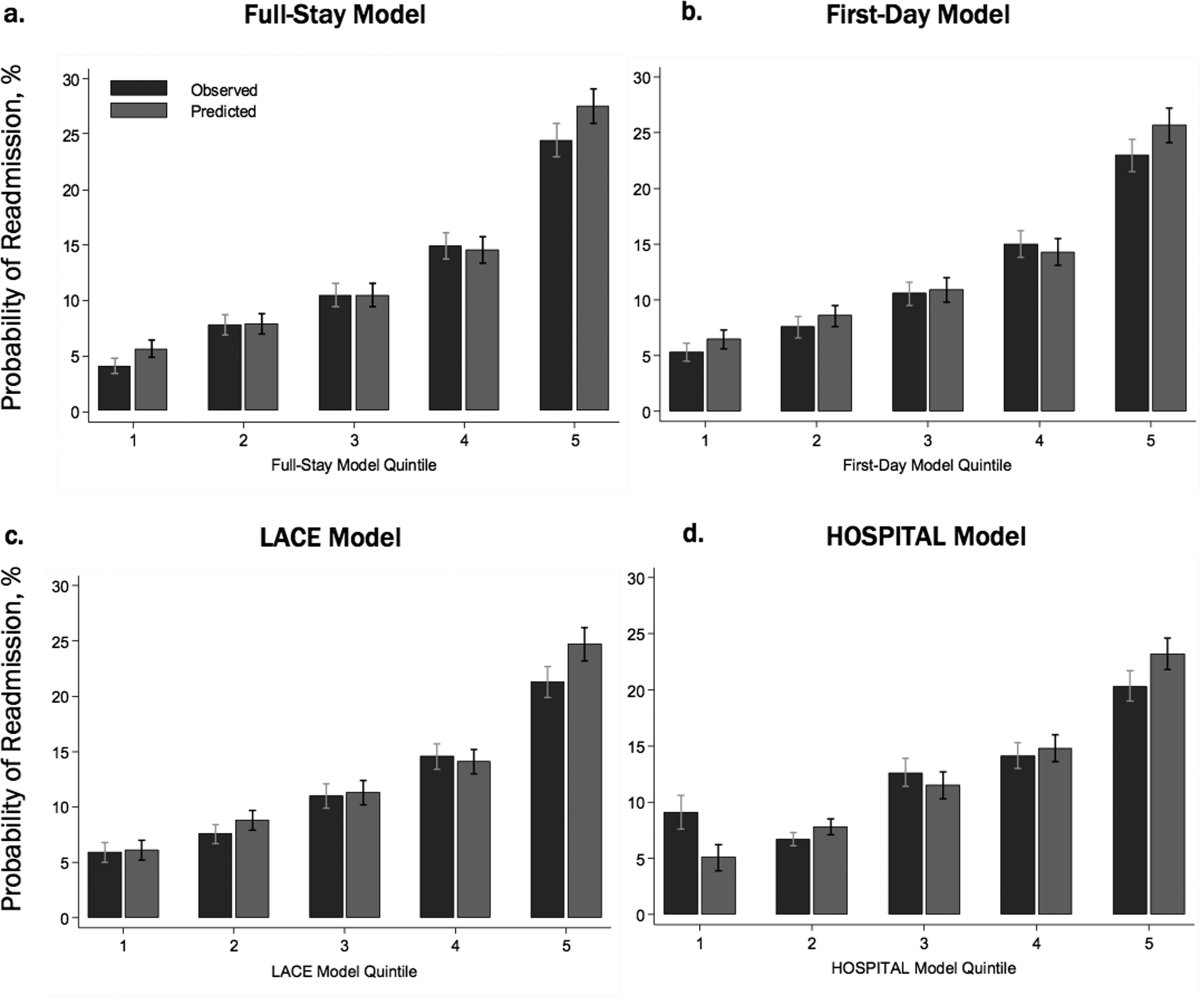
In our validation cohort, the full‐stay EHR model had fair discrimination, with a C statistic of 0.69 (95% CI: 0.68‐0.70) (Table 3). The full‐stay EHR model was well calibrated across all quintiles of risk, with slight overestimation of predicted risk in the lowest and highest quintiles (Figure 1a) (see Supporting Table 5 in the online version of this article). It also effectively stratified individuals across a broad range of predicted readmission risk from 4.1% in the lowest decile to 36.5% in the highest decile (Table 3).
| Model Name | C‐Statistic (95% CI) | IDI, % (95% CI) | NRI (95% CI) | Average Predicted Risk, % | |
|---|---|---|---|---|---|
| Lowest Decile | Highest Decile | ||||
| |||||
| Full‐stay EHR model | |||||
| Derivation cohort | 0.72 (0.70 to 0.73) | 4.1 | 36.5 | ||
| Validation cohort | 0.69 (0.68 to 0.70) | [Reference] | [Reference] | 4.1 | 36.5 |
| First‐day EHR model | 0.67 (0.66 to 0.68) | 1.2 (1.4 to 1.0) | 0.020 (0.038 to 0.002) | 5.8 | 31.9 |
| LACE model | 0.65 (0.64 to 0.66) | 2.6 (2.9 to 2.3) | 0.046 (0.067 to 0.024) | 6.1 | 27.5 |
| HOSPITAL model | 0.64 (0.62 to 0.65) | 3.2 (3.5 to 2.9) | 0.058 (0.080 to 0.035) | 6.7 | 26.6 |

Comparing the Performance of the Full‐Stay EHR Model to Other Models
The full‐stay EHR model had better discrimination compared to the first‐day EHR model and the LACE and HOSPITAL models, though the magnitude of improvement was modest (Table 3). The full‐stay EHR model also stratified individuals across a broader range of readmission risk, and was better able to discriminate and classify those in the highest quintile of risk from those in the lowest 4 quintiles of risk compared to other models as assessed by the IDI and NRI (Table 3) (see Supporting Tables 14 and Supporting Figure 2 in the online version of this article). In terms of model calibration, both the first‐day EHR and LACE models were also well calibrated, whereas the HOSPITAL model was less robust (Figure 1).
The diagnostic accuracy of the full‐stay EHR model in correctly predicting those in the highest quintile of risk was better than that of the first‐day, LACE, and HOSPITAL models, though overall improvements in the sensitivity, specificity, positive and negative predictive values, and positive and negative likelihood ratios were also modest (see Supporting Table 6 in the online version of this article).
DISCUSSION
In this study, we used clinically detailed EHR data from the entire hospitalization on 32,922 individuals treated in 6 diverse hospitals to develop an all‐payer, multicondition readmission risk‐prediction model. To our knowledge, this is the first 30‐day hospital readmission risk‐prediction model to use a comprehensive set of factors from EHR data from the entire hospital stay. Prior EHR‐based models have focused exclusively on data available on or prior to the first day of admission, which account for clinical severity on admission but do not account for factors uncovered during the inpatient stay that influence the chance of a postdischarge adverse outcome.[15, 30] We specifically assessed the prognostic impact of a comprehensive set of factors from the entire index hospitalization, including hospital‐acquired complications, clinical trajectory, and stability on discharge in predicting hospital readmissions. Our full‐stay EHR model had statistically better discrimination, calibration, and diagnostic accuracy than our existing all‐cause first‐day EHR model[15] and 2 previously published readmissions models that included more limited information from hospitalization (such as length of stay).[9, 10] However, although the more complicated full‐stay EHR model was statistically better than previously published models, we were surprised that the predictive performance was only modestly improved despite the inclusion of many additional clinically relevant prognostic factors.
Taken together, our study has several important implications. First, the added complexity and resource intensity of implementing a full‐stay EHR model yields only modestly improved readmission risk prediction. Thus, hospitals and healthcare systems interested in targeting their highest‐risk individuals for interventions to reduce 30‐day readmission should consider doing so within the first day of hospital admission. Our group's previously derived and validated first‐day EHR model, which used data only from the first day of admission, qualitatively performed nearly as well as the full‐stay EHR model.[15] Additionally, a recent study using only preadmission EHR data to predict 30‐day readmissions also achieved similar discrimination and diagnostic accuracy as our full‐stay model.[30]
Second, the field of readmissions risk‐prediction modeling may be reaching the maximum achievable model performance using data that are currently available in the EHR. Our limited ability to accurately predict all‐cause 30‐day readmission risk may reflect the influence of currently unmeasured patient, system, and community factors on readmissions.[31, 32, 33] Due to the constraints of data collected in the EHR, we were unable to include several patient‐level clinical characteristics associated with hospital readmission, including self‐perceived health status, functional impairment, and cognition.[33, 34, 35, 36] However, given their modest effect sizes (ORs ranging from 1.062.10), adequately measuring and including these risk factors in our model may not meaningfully improve model performance and diagnostic accuracy. Further, many social and behavioral patient‐level factors are also not consistently available in EHR data. Though we explored the role of several neighborhood‐level socioeconomic measuresincluding prevalence of poverty, median income, education, and unemploymentwe found that none were significantly associated with 30‐day readmissions. These particular measures may have been inadequate to characterize individual‐level social and behavioral factors, as several previous studies have demonstrated that patient‐level factors such as social support, substance abuse, and medication and visit adherence can influence readmission risk in heart failure and pneumonia.[11, 16, 22, 25] This underscores the need for more standardized routine collection of data across functional, social, and behavioral domains in clinical settings, as recently championed by the Institute of Medicine.[11, 37] Integrating data from outside the EHR on postdischarge health behaviors, self‐management, follow‐up care, recovery, and home environment may be another important but untapped strategy for further improving prediction of readmissions.[25, 38]
Third, a multicondition readmission risk‐prediction model may be a less effective strategy than more customized disease‐specific models for selected conditions associated with high 30‐day readmission rates. Our group's previously derived and internally validated models for heart failure and human immunodeficiency virus had superior discrimination compared to our full‐stay EHR model (C statistic of 0.72 for each).[11, 13] However, given differences in the included population and time periods studied, a head‐to‐head comparison of these different strategies is needed to assess differences in model performance and utility.
Our study had several strengths. To our knowledge, this is the first study to rigorously measure the additive influence of in‐hospital complications, clinical trajectory, and stability on discharge on the risk of 30‐day hospital readmission. Additionally, our study included a large, diverse study population that included all payers, all ages of adults, a mix of community, academic, and safety net hospitals, and individuals from a broad array of racial/ethnic and socioeconomic backgrounds.
Our results should be interpreted in light of several limitations. First, though we sought to represent a diverse group of hospitals, all study sites were located within north Texas and generalizability to other regions is uncertain. Second, our ascertainment of prior hospitalizations and readmissions was more inclusive than what could be typically accomplished in real time using only EHR data from a single clinical site. We performed a sensitivity analysis using only prior utilization data available within the EHR from the index hospital with no meaningful difference in our findings (data not shown). Additionally, a recent study found that 30‐day readmissions occur at the index hospital for over 75% of events, suggesting that 30‐day readmissions are fairly comprehensively captured even with only single‐site data.[39] Third, we were not able to include data on outpatient visits before or after the index hospitalization, which may influence the risk of readmission.[1, 40]
In conclusion, incorporating clinically granular EHR data from the entire course of hospitalization modestly improves prediction of 30‐day readmissions compared to models that only include information from the first 24 hours of hospital admission or models that use far fewer variables. However, given the limited improvement in prediction, our findings suggest that from the practical perspective of implementing real‐time models to identify those at highest risk for readmission, it may not be worth the added complexity of waiting until the end of a hospitalization to leverage additional data on hospital complications, and the trajectory of laboratory and vital sign values currently available in the EHR. Further improvement in prediction of readmissions will likely require accounting for psychosocial, functional, behavioral, and postdischarge factors not currently present in the inpatient EHR.
Disclosures: This study was presented at the Society of Hospital Medicine 2015 Annual Meeting in National Harbor, Maryland, and the Society of General Internal Medicine 2015 Annual Meeting in Toronto, Canada. This work was supported by the Agency for Healthcare Research and Qualityfunded UT Southwestern Center for Patient‐Centered Outcomes Research (1R24HS022418‐01) and the Commonwealth Foundation (#20100323). Drs. Nguyen and Makam received funding from the UT Southwestern KL2 Scholars Program (NIH/NCATS KL2 TR001103). Dr. Halm was also supported in part by NIH/NCATS U54 RFA‐TR‐12‐006. The study sponsors had no role in the design and conduct of the study; collection, management, analysis, and interpretation of the data; and preparation, review, or approval of the manuscript. The authors have no conflicts of interest to disclose.
- , , . Rehospitalizations among patients in the Medicare fee‐for‐service program. N Engl J Med. 2009;360(14):1418–1428.
- , , , , . Proportion of hospital readmissions deemed avoidable: a systematic review. CMAJ. 2011;183(7):E391–E402.
- , , , , , . Hospital‐initiated transitional care interventions as a patient safety strategy: a systematic review. Ann Intern Med. 2013;158(5 pt 2):433–440.
- , , , , . Interventions to reduce 30‐day rehospitalization: a systematic review. Ann Intern Med. 2011;155(8):520–528.
- , , , , , . Interventions to Improve Care Transitions at Hospital Discharge. Rockville, MD: Agency for Healthcare Research and Quality; 2013.
- , , , et al. Allocating scarce resources in real‐time to reduce heart failure readmissions: a prospective, controlled study. BMJ Qual Saf. 2013;22(12):998–1005.
- , , , , . Implementing electronic health care predictive analytics: considerations and challenges. Health Aff (Millwood). 2014;33(7):1148–1154.
- , , , et al. Risk prediction models for hospital readmission: a systematic review. JAMA. 2011;306(15):1688–1698.
- , , , et al. Derivation and validation of an index to predict early death or unplanned readmission after discharge from hospital to the community. CMAJ. 2010;182(6):551–557.
- , , , . Potentially avoidable 30‐day hospital readmissions in medical patients: derivation and validation of a prediction model. JAMA Intern Med. 2013;173(8):632–638.
- , , , et al. An automated model to identify heart failure patients at risk for 30‐day readmission or death using electronic medical record data. Med Care. 2010;48(11):981–988.
- , , , et al. An automated model using electronic medical record data identifies patients with cirrhosis at high risk for readmission. Clin Gastroenterol Hepatol. 2013;11(10):1335–1341.e1331.
- , , , , , . An electronic medical record‐based model to predict 30‐day risk of readmission and death among HIV‐infected inpatients. J Acquir Immune Defic Syndr. 2012;61(3):349–358.
- , , , et al. Development and use of an administrative claims measure for profiling hospital‐wide performance on 30‐day unplanned readmission. Ann Intern Med. 2014;161(10 suppl):S66–S75.
- , , , et al. Electronic medical record‐based multicondition models to predict the risk of 30 day readmission or death among adult medicine patients: validation and comparison to existing models. BMC Med Inform Decis Mak. 2015;15(1):39.
- , , , et al. Linking electronic health record‐extracted psychosocial data in real‐time to risk of readmission for heart failure. Psychosomatics. 2011;52(4):319–327.
- , . A conceptual framework for the study of early readmission as an indicator of quality of care. Soc Sci Med. 1996;43(11):1533–1541.
- , , , et al. Hospital readmission performance and patterns of readmission: retrospective cohort study of Medicare admissions. BMJ. 2013;347:f6571.
- , , , , , . Getting more performance from performance measurement. N Engl J Med. 2014;371(23):2145–2147.
- , , , et al. Hospital strategy uptake and reductions in unplanned readmission rates for patients with heart failure: a prospective study. J Gen Intern Med. 2015;30(5):605–611.
- . Post‐hospital syndrome—an acquired, transient condition of generalized risk. N Engl J Med. 2013;368(2):100–102.
- , , , et al. Impact of social factors on risk of readmission or mortality in pneumonia and heart failure: systematic review. J Gen Intern Med. 2013;28(2):269–282.
- , , , , , . Effect of clinical and social risk factors on hospital profiling for stroke readmission: a cohort study. Ann Intern Med. 2014;161(11):775–784.
- , , , et al. Neighborhood socioeconomic disadvantage and 30‐day rehospitalization: a retrospective cohort study. Ann Intern Med. 2014;161(11):765–774.
- , , , , , . Postdischarge environmental and socioeconomic factors and the likelihood of early hospital readmission among community‐dwelling Medicare beneficiaries. Gerontologist. 2008;48(4):495–504.
- , , . Socioeconomic status and readmissions: evidence from an urban teaching hospital. Health Aff (Millwood). 2014;33(5):778–785.
- , , , . Adding socioeconomic data to hospital readmissions calculations may produce more useful results. Health Aff (Millwood). 2014;33(5):786–791.
- , , , . Evaluating the added predictive ability of a new marker: from area under the ROC curve to reclassification and beyond. Stat Med. 2008;27(2):157–172; discussion 207–212.
- , , , , . Net reclassification improvement: computation, interpretation, and controversies: a literature review and clinician's guide. Ann Intern Med. 2014;160(2):122–131.
- , , , , , . Predicting 30‐day readmissions with preadmission electronic health record data. Med Care. 2015;53(3):283–289.
- , . Hospital readmissions—not just a measure of quality. JAMA. 2011;306(16):1796–1797.
- , . Thirty‐day readmissions—truth and consequences. N Engl J Med. 2012;366(15):1366–1369.
- , , , . Functional impairment and hospital readmission in medicare seniors. JAMA Intern Med. 2015;175(4):559–565.
- , , . Clinical and sociodemographic risk factors for readmission of Medicare beneficiaries. Health Care Financ Rev. 1988;10(1):27–36.
- , , , , , . Mini‐cog performance: novel marker of post discharge risk among patients hospitalized for heart failure. Circ Heart Fail. 2015;8(1):8–16.
- , , , , , . Association of impaired functional status at hospital discharge and subsequent rehospitalization. J Hosp Med. 2014;9(5):277–282.
- , . Patients in context—EHR capture of social and behavioral determinants of health. N Engl J Med. 2015;372(8):698–701.
- , , , , . Envisioning a social‐health information exchange as a platform to support a patient‐centered medical neighborhood: a feasibility study. J Gen Intern Med. 2015;30(1):60–67.
- , , , , , . Patient factors contributing to variation in same‐hospital readmission rate. Med Care Res Review. 2015;72(3):338–358.
- , , . Does increased access to primary care reduce hospital readmissions? Veterans Affairs Cooperative Study Group on Primary Care and Hospital Readmission. N Engl J Med. 1996;334(22):1441–1447.
Unplanned hospital readmissions are frequent, costly, and potentially avoidable.[1, 2] Due to major federal financial readmissions penalties targeting excessive 30‐day readmissions, there is increasing attention to implementing hospital‐initiated interventions to reduce readmissions.[3, 4] However, universal enrollment of all hospitalized patients into such programs may be too resource intensive for many hospitals.[5] To optimize efficiency and effectiveness, interventions should be targeted to individuals most likely to benefit.[6, 7] However, existing readmission risk‐prediction models have achieved only modest discrimination, have largely used administrative claims data not available until months after discharge, or are limited to only a subset of patients with Medicare or a specific clinical condition.[8, 9, 10, 11, 12, 13, 14] These limitations have precluded accurate identification of high‐risk individuals in an all‐payer general medical inpatient population to provide actionable information for intervention prior to discharge.
Approaches using electronic health record (EHR) data could allow early identification of high‐risk patients during the index hospitalization to enable initiation of interventions prior to discharge. To date, such strategies have relied largely on EHR data from the day of admission.[15, 16] However, given that variation in 30‐day readmission rates are thought to reflect the quality of in‐hospital care, incorporating EHR data from the entire hospital stay to reflect hospital care processes and clinical trajectory may more accurately identify at‐risk patients.[17, 18, 19, 20] Improved accuracy in risk prediction would help better target intervention efforts in the immediate postdischarge period, an interval characterized by heightened vulnerability for adverse events.[21]
To help hospitals target transitional care interventions more effectively to high‐risk individuals prior to discharge, we derived and validated a readmissions risk‐prediction model incorporating EHR data from the entire course of the index hospitalization, which we termed the full‐stay EHR model. We also compared the full‐stay EHR model performance to our group's previously derived prediction model based on EHR data on the day of admission, termed the first‐day EHR model, as well as to 2 other validated readmission models similarly intended to yield near real‐time risk predictions prior to or shortly after hospital discharge.[9, 10, 15]
METHODS
Study Design, Population, and Data Sources
We conducted an observational cohort study using EHR data from 6 hospitals in the DallasFort Worth metroplex between November 1, 2009 and October 30, 2010 using the same EHR system (Epic Systems Corp., Verona, WI). One site was a university‐affiliated safety net hospital; the remaining 5 sites were teaching and nonteaching community sites.
We included consecutive hospitalizations among adults 18 years old discharged alive from any medicine inpatient service. For individuals with multiple hospitalizations during the study period, we included only the first hospitalization. We excluded individuals who died during the index hospitalization, were transferred to another acute care facility, left against medical advice, or who died outside of the hospital within 30 days of discharge. For model derivation, we randomly split the sample into separate derivation (50%) and validation cohorts (50%).
Outcomes
The primary outcome was 30‐day hospital readmission, defined as a nonelective hospitalization within 30 days of discharge to any of 75 acute care hospitals within a 100‐mile radius of Dallas, ascertained from an all‐payer regional hospitalization database. Nonelective hospitalizations included all hospitalizations classified as a emergency, urgent, or trauma, and excluded those classified as elective as per the Centers for Medicare and Medicaid Services Claim Inpatient Admission Type Code definitions.
Predictor Variables for the Full‐Stay EHR Model
The full‐stay EHR model was iteratively developed from our group's previously derived and validated risk‐prediction model using EHR data available on admission (first‐day EHR model).[15] For the full‐stay EHR model, we included all predictor variables included in our published first‐day EHR model as candidate risk factors. Based on prior literature, we additionally expanded candidate predictors available on admission to include marital status (proxy for social isolation) and socioeconomic disadvantage (percent poverty, unemployment, median income, and educational attainment by zip code of residence as proxy measures of the social and built environment).[22, 23, 24, 25, 26, 27] We also expanded the ascertainment of prior hospitalization to include admissions at both the index hospital and any of 75 acute care hospitals from the same, separate all‐payer regional hospitalization database used to ascertain 30‐day readmissions.
Candidate predictors from the remainder of the hospital stay (ie, following the first 24 hours of admission) were included if they were: (1) available in the EHR of all participating hospitals, (2) routinely collected or available at the time of hospital discharge, and (3) plausible predictors of adverse outcomes based on prior literature and clinical expertise. These included length of stay, in‐hospital complications, transfer to an intensive or coronary care unit, blood transfusions, vital sign instabilities within 24 hours of discharge, select laboratory values at time of discharge, and disposition status. We also assessed trajectories of vital signs and selected laboratory values (defined as changes in these measures from admission to discharge).
Statistical Analysis
Model Derivation
Univariate relationships between readmission and each of the candidate predictors were assessed in the derivation cohort using a prespecified significance threshold of P 0.05. We included all factors from our previously derived and validated first‐day EHR model as candidate predictors.[15] Continuous laboratory and vital sign values at the time of discharge were categorized based on clinically meaningful cutoffs; predictors with missing values were assumed to be normal (<1% missing for each variable). Significant univariate candidate variables were entered in a multivariate logistic regression model using stepwise backward selection with a prespecified significance threshold of P 0.05. We performed several sensitivity analyses to confirm the robustness of our model. First, we alternately derived the full‐stay model using stepwise forward selection. Second, we forced in all significant variables from our first‐day EHR model, and entered the candidate variables from the remainder of the hospital stay using both stepwise backward and forward selection separately. Third, prespecified interactions between variables were evaluated for inclusion. Though final predictors varied slightly between the different approaches, discrimination of each model was similar to the model derived using our primary analytic approach (C statistics 0.01, data not shown).
Model Validation
We assessed model discrimination and calibration of the derived full‐stay EHR model using the validation cohort. Model discrimination was estimated by the C statistic. The C statistic represents the probability that, given 2 hospitalized individuals (1 who was readmitted and the other who was not), the model will predict a higher risk for the readmitted patient than for the nonreadmitted patient. Model calibration was assessed by comparing predicted to observed probabilities of readmission by quintiles of risk, and with the Hosmer‐Lemeshow goodness‐of‐fit test.
Comparison to Existing Models
We compared the full‐stay EHR model performance to 3 previously published models: our group's first‐day EHR model, and the LACE (includes Length of stay, Acute (nonelective) admission status, Charlson Comorbidity Index, and Emergency department visits in the past year) and HOSPITAL (includes Hemoglobin at discharge, discharge from Oncology service, Sodium level at discharge, Procedure during index hospitalization, Index hospitalization Type (nonelective), number of Admissions in the past year, and Length of stay) models, which were both derived to predict 30‐day readmissions among general medical inpatients and were intended to help clinicians identify high‐risk patients to target for discharge interventions.[9, 10, 15] We assessed each model's performance in our validation cohort, calculating the C statistic, integrated discrimination index (IDI), and net reclassification index (NRI) compared to the full‐stay model. IDI is a summary measure of both discrimination and reclassification, where more positive values suggest improvement in model performance in both these domains compared to a reference model.[28] The NRI is defined as the sum of the net proportions of correctly reclassified persons with and without the event of interest.[29] The theoretical range of values is 2 to 2, with more positive values indicating improved net reclassification compared to a reference model. Here, we calculated a category‐based NRI to evaluate the performance of models in correctly classifying individuals with and without readmissions into the highest readmission risk quintile versus the lowest 4 risk quintiles compared to the full‐stay EHR model.[29] This prespecified cutoff is relevant for hospitals interested in identifying the highest‐risk individuals for targeted intervention.[6] Because some hospitals may be able to target a greater number of individuals for intervention, we performed a sensitivity analysis by assessing category‐based NRI for reclassification into the top 2 risk quintiles versus the lowest 3 risk quintiles and found no meaningful difference in our results (data not shown). Finally, we qualitatively assessed calibration of comparator models in our validation cohort by comparing predicted probability to observed probability of readmission by quintiles of risk for each model. We conducted all analyses using Stata 12.1 (StataCorp, College Station, TX). This study was approved by the UT Southwestern Medical Center institutional review board.
RESULTS
Overall, 32,922 index hospitalizations were included in our study cohort; 12.7% resulted in a 30‐day readmission (see Supporting Figure 1 in the online version of this article). Individuals had a mean age of 62 years and had diverse race/ethnicity and primary insurance status; half were female (Table 1). The study sample was randomly split into a derivation cohort (50%, n = 16,492) and validation cohort (50%, n = 16,430). Individuals in the derivation cohort with a 30‐day readmission had markedly different socioeconomic and clinical characteristics compared to those not readmitted (Table 1).
| Entire Cohort, N = 32,922 | Derivation Cohort, N = 16,492 | |||
|---|---|---|---|---|
|
No Readmission, N = 14,312 |
Readmission, N = 2,180 |
P Value | ||
| ||||
| Demographic characteristics | ||||
| Age, y, mean (SD) | 62 (17.3) | 61 (17.4) | 64 (17.0) | 0.001 |
| Female, n (%) | 17,715 (53.8) | 7,694 (53.8) | 1,163 (53.3) | 0.72 |
| Race/ethnicity | 0.001 | |||
| White | 21,359 (64.9) | 9,329 (65.2) | 1,361 (62.4) | |
| Black | 5,964 (18.1) | 2,520 (17.6) | 434 (19.9) | |
| Hispanic | 4,452 (13.5) | 1,931 (13.5) | 338 (15.5) | |
| Other | 1,147 (3.5) | 532 (3.7) | 47 (2.2) | |
| Marital status, n (%) | 0.001 | |||
| Single | 8,076 (24.5) | 3,516 (24.6) | 514 (23.6) | |
| Married | 13,394 (40.7) | 5,950 (41.6) | 812 (37.3) | |
| Separated/divorced | 3,468 (10.5) | 1,460 (10.2) | 251 (11.5) | |
| Widowed | 4,487 (13.7) | 1,868 (13.1) | 388 (17.8) | |
| Other | 3,497 (10.6) | 1,518 (10.6) | 215 (9.9) | |
| Primary payer, n (%) | 0.001 | |||
| Private | 13,090 (39.8) | 5,855 (40.9) | 726 (33.3) | |
| Medicare | 13,015 (39.5) | 5,597 (39.1) | 987 (45.3) | |
| Medicaid | 2,204 (6.7) | 852 (5.9) | 242 (11.1) | |
| Charity, self‐pay, or other | 4,613 (14.0) | 2,008 (14.0) | 225 (10.3) | |
| High‐poverty neighborhood, n (%)* | 7,468 (22.7) | 3,208 (22.4) | 548 (25.1) | 0.001 |
| Utilization history | ||||
| 1 ED visits in past year, n (%) | 9,299 (28.2) | 3,793 (26.5) | 823 (37.8) | 0.001 |
| 1 hospitalizations in past year, n (%) | 10,189 (30.9) | 4,074 (28.5) | 1,012 (46.4) | 0.001 |
| Clinical factors from first day of hospitalization | ||||
| Nonelective admission, n (%) | 27,818 (84.5) | 11,960 (83.6) | 1,960 (89.9) | 0.001 |
| Charlson Comorbidity Index, median (IQR)∥ | 0 (01) | 0 (00) | 0 (03) | 0.001 |
| Laboratory abnormalities within 24 hours of admission | ||||
| Albumin <2 g/dL | 355 (1.1) | 119 (0.8) | 46 (2.1) | 0.001 |
| Albumin 23 g/dL | 4,732 (14.4) | 1,956 (13.7) | 458 (21.0) | 0.001 |
| Aspartate aminotransferase >40 U/L | 4,610 (14.0) | 1,922 (13.4) | 383 (17.6) | 0.001 |
| Creatine phosphokinase <60 g/L | 3,728 (11.3) | 1,536 (10.7) | 330 (15.1) | 0.001 |
| Mean corpuscular volume >100 fL/red cell | 1,346 (4.1) | 537 (3.8) | 134 (6.2) | 0.001 |
| Platelets <90 103/L | 912 (2.8) | 357 (2.5) | 116 (5.3) | 0.001 |
| Platelets >350 103/L | 3,332 (10.1) | 1,433 (10.0) | 283 (13.0) | 0.001 |
| Prothrombin time >35 seconds | 248 (0.8) | 90 (0.6) | 35 (1.6) | 0.001 |
| Clinical factors from remainder of hospital stay | ||||
| Length of stay, d, median (IQR) | 4 (26) | 4 (26) | 5 (38) | 0.001 |
| ICU transfer after first 24 hours, n (%) | 988 (3.0) | 408 (2.9) | 94 (4.3) | 0.001 |
| Hospital complications, n (%) | ||||
| Clostridium difficile infection | 119 (0.4) | 44 (0.3) | 24 (1.1) | 0.001 |
| Pressure ulcer | 358 (1.1) | 126 (0.9) | 46 (2.1) | 0.001 |
| Venous thromboembolism | 301 (0.9) | 112 (0.8) | 34 (1.6) | 0.001 |
| Respiratory failure | 1,048 (3.2) | 463 (3.2) | 112 (5.1) | 0.001 |
| Central line‐associated bloodstream infection | 22 (0.07) | 6 (0.04) | 5 (0.23) | 0.005 |
| Catheter‐associated urinary tract infection | 47 (0.14) | 20 (0.14) | 6 (0.28) | 0.15 |
| Acute myocardial infarction | 293 (0.9) | 110 (0.8) | 32 (1.5) | 0.001 |
| Pneumonia | 1,754 (5.3) | 719 (5.0) | 154 (7.1) | 0.001 |
| Sepsis | 853 (2.6) | 368 (2.6) | 73 (3.4) | 0.04 |
| Blood transfusion during hospitalization, n (%) | 4,511 (13.7) | 1,837 (12.8) | 425 (19.5) | 0.001 |
| Laboratory abnormalities at discharge# | ||||
| Blood urea nitrogen >20 mg/dL, n (%) | 10,014 (30.4) | 4,077 (28.5) | 929 (42.6) | 0.001 |
| Sodium <135 mEq/L, n (%) | 4,583 (13.9) | 1,850 (12.9) | 440 (20.2) | 0.001 |
| Hematocrit 27 | 3,104 (9.4) | 1,231 (8.6) | 287 (13.2) | 0.001 |
| 1 vital sign instability at discharge, n (%)# | 6,192 (18.8) | 2,624 (18.3) | 525 (24.1) | 0.001 |
| Discharge location, n (%) | 0.001 | |||
| Home | 23,339 (70.9) | 10,282 (71.8) | 1,383 (63.4) | |
| Home health | 3,185 (9.7) | 1,356 (9.5) | 234 (10.7) | |
| Postacute care** | 5,990 (18.2) | 2,496 (17.4) | 549 (25.2) | |
| Hospice | 408 (1.2) | 178 (1.2) | 14 (0.6) | |
Derivation and Validation of the Full‐Stay EHR Model for 30‐Day Readmission
Our final model included 24 independent variables, including demographic characteristics, utilization history, clinical factors from the first day of admission, and clinical factors from the remainder of the hospital stay (Table 2). The strongest independent predictor of readmission was hospital‐acquired Clostridium difficile infection (adjusted odds ratio [AOR]: 2.03, 95% confidence interval [CI] 1.18‐3.48); other hospital‐acquired complications including pressure ulcers and venous thromboembolism were also significant predictors. Though having Medicaid was associated with increased odds of readmission (AOR: 1.55, 95% CI: 1.31‐1.83), other zip codelevel measures of socioeconomic disadvantage were not predictive and were not included in the final model. Being discharged to hospice was associated with markedly lower odds of readmission (AOR: 0.23, 95% CI: 0.13‐0.40).
| Odds Ratio (95% CI) | ||
|---|---|---|
| Univariate | Multivariate* | |
| ||
| Demographic characteristics | ||
| Age, per 10 years | 1.08 (1.051.11) | 1.07 (1.041.10) |
| Medicaid | 1.97 (1.702.29) | 1.55 (1.311.83) |
| Widow | 1.44 (1.281.63) | 1.27 (1.111.45) |
| Utilization history | ||
| Prior ED visit, per visit | 1.08 (1.061.10) | 1.04 (1.021.06) |
| Prior hospitalization, per hospitalization | 1.30 (1.271.34) | 1.16 (1.121.20) |
| Hospital and clinical factors from first day of hospitalization | ||
| Nonelective admission | 1.75 (1.512.03) | 1.42 (1.221.65) |
| Charlson Comorbidity Index, per point | 1.19 (1.171.21) | 1.06 (1.041.09) |
| Laboratory abnormalities within 24 hours of admission | ||
| Albumin <2 g/dL | 2.57 (1.823.62) | 1.52 (1.052.21) |
| Albumin 23 g/dL | 1.68 (1.501.88) | 1.20 (1.061.36) |
| Aspartate aminotransferase >40 U/L | 1.37 (1.221.55) | 1.21 (1.061.38) |
| Creatine phosphokinase <60 g/L | 1.48 (1.301.69) | 1.28 (1.111.46) |
| Mean corpuscular volume >100 fL/red cell | 1.68 (1.382.04) | 1.32 (1.071.62) |
| Platelets <90 103/L | 2.20 (1.772.72) | 1.56 (1.231.97) |
| Platelets >350 103/L | 1.34 (1.171.54) | 1.24 (1.081.44) |
| Prothrombin time >35 seconds | 2.58 (1.743.82) | 1.92 (1.272.90) |
| Hospital and clinical factors from remainder of hospital stay | ||
| Length of stay, per day | 1.08 (1.071.09) | 1.06 (1.041.07) |
| Hospital complications | ||
| Clostridium difficile infection | 3.61 (2.195.95) | 2.03 (1.183.48) |
| Pressure ulcer | 2.43 (1.733.41) | 1.64 (1.152.34) |
| Venous thromboembolism | 2.01 (1.362.96) | 1.55 (1.032.32) |
| Laboratory abnormalities at discharge | ||
| Blood urea nitrogen >20 mg/dL | 1.86 (1.702.04) | 1.37 (1.241.52) |
| Sodium <135 mEq/L | 1.70 (1.521.91) | 1.34 (1.181.51) |
| Hematocrit 27 | 1.61 (1.401.85) | 1.22 (1.051.41) |
| Vital sign instability at discharge, per instability | 1.29 (1.201.40) | 1.25 (1.151.36) |
| Discharged to hospice | 0.51 (0.300.89) | 0.23 (0.130.40) |
In our validation cohort, the full‐stay EHR model had fair discrimination, with a C statistic of 0.69 (95% CI: 0.68‐0.70) (Table 3). The full‐stay EHR model was well calibrated across all quintiles of risk, with slight overestimation of predicted risk in the lowest and highest quintiles (Figure 1a) (see Supporting Table 5 in the online version of this article). It also effectively stratified individuals across a broad range of predicted readmission risk from 4.1% in the lowest decile to 36.5% in the highest decile (Table 3).
| Model Name | C‐Statistic (95% CI) | IDI, % (95% CI) | NRI (95% CI) | Average Predicted Risk, % | |
|---|---|---|---|---|---|
| Lowest Decile | Highest Decile | ||||
| |||||
| Full‐stay EHR model | |||||
| Derivation cohort | 0.72 (0.70 to 0.73) | 4.1 | 36.5 | ||
| Validation cohort | 0.69 (0.68 to 0.70) | [Reference] | [Reference] | 4.1 | 36.5 |
| First‐day EHR model | 0.67 (0.66 to 0.68) | 1.2 (1.4 to 1.0) | 0.020 (0.038 to 0.002) | 5.8 | 31.9 |
| LACE model | 0.65 (0.64 to 0.66) | 2.6 (2.9 to 2.3) | 0.046 (0.067 to 0.024) | 6.1 | 27.5 |
| HOSPITAL model | 0.64 (0.62 to 0.65) | 3.2 (3.5 to 2.9) | 0.058 (0.080 to 0.035) | 6.7 | 26.6 |
Comparing the Performance of the Full‐Stay EHR Model to Other Models
The full‐stay EHR model had better discrimination compared to the first‐day EHR model and the LACE and HOSPITAL models, though the magnitude of improvement was modest (Table 3). The full‐stay EHR model also stratified individuals across a broader range of readmission risk, and was better able to discriminate and classify those in the highest quintile of risk from those in the lowest 4 quintiles of risk compared to other models as assessed by the IDI and NRI (Table 3) (see Supporting Tables 14 and Supporting Figure 2 in the online version of this article). In terms of model calibration, both the first‐day EHR and LACE models were also well calibrated, whereas the HOSPITAL model was less robust (Figure 1).
The diagnostic accuracy of the full‐stay EHR model in correctly predicting those in the highest quintile of risk was better than that of the first‐day, LACE, and HOSPITAL models, though overall improvements in the sensitivity, specificity, positive and negative predictive values, and positive and negative likelihood ratios were also modest (see Supporting Table 6 in the online version of this article).
DISCUSSION
In this study, we used clinically detailed EHR data from the entire hospitalization on 32,922 individuals treated in 6 diverse hospitals to develop an all‐payer, multicondition readmission risk‐prediction model. To our knowledge, this is the first 30‐day hospital readmission risk‐prediction model to use a comprehensive set of factors from EHR data from the entire hospital stay. Prior EHR‐based models have focused exclusively on data available on or prior to the first day of admission, which account for clinical severity on admission but do not account for factors uncovered during the inpatient stay that influence the chance of a postdischarge adverse outcome.[15, 30] We specifically assessed the prognostic impact of a comprehensive set of factors from the entire index hospitalization, including hospital‐acquired complications, clinical trajectory, and stability on discharge in predicting hospital readmissions. Our full‐stay EHR model had statistically better discrimination, calibration, and diagnostic accuracy than our existing all‐cause first‐day EHR model[15] and 2 previously published readmissions models that included more limited information from hospitalization (such as length of stay).[9, 10] However, although the more complicated full‐stay EHR model was statistically better than previously published models, we were surprised that the predictive performance was only modestly improved despite the inclusion of many additional clinically relevant prognostic factors.
Taken together, our study has several important implications. First, the added complexity and resource intensity of implementing a full‐stay EHR model yields only modestly improved readmission risk prediction. Thus, hospitals and healthcare systems interested in targeting their highest‐risk individuals for interventions to reduce 30‐day readmission should consider doing so within the first day of hospital admission. Our group's previously derived and validated first‐day EHR model, which used data only from the first day of admission, qualitatively performed nearly as well as the full‐stay EHR model.[15] Additionally, a recent study using only preadmission EHR data to predict 30‐day readmissions also achieved similar discrimination and diagnostic accuracy as our full‐stay model.[30]
Second, the field of readmissions risk‐prediction modeling may be reaching the maximum achievable model performance using data that are currently available in the EHR. Our limited ability to accurately predict all‐cause 30‐day readmission risk may reflect the influence of currently unmeasured patient, system, and community factors on readmissions.[31, 32, 33] Due to the constraints of data collected in the EHR, we were unable to include several patient‐level clinical characteristics associated with hospital readmission, including self‐perceived health status, functional impairment, and cognition.[33, 34, 35, 36] However, given their modest effect sizes (ORs ranging from 1.062.10), adequately measuring and including these risk factors in our model may not meaningfully improve model performance and diagnostic accuracy. Further, many social and behavioral patient‐level factors are also not consistently available in EHR data. Though we explored the role of several neighborhood‐level socioeconomic measuresincluding prevalence of poverty, median income, education, and unemploymentwe found that none were significantly associated with 30‐day readmissions. These particular measures may have been inadequate to characterize individual‐level social and behavioral factors, as several previous studies have demonstrated that patient‐level factors such as social support, substance abuse, and medication and visit adherence can influence readmission risk in heart failure and pneumonia.[11, 16, 22, 25] This underscores the need for more standardized routine collection of data across functional, social, and behavioral domains in clinical settings, as recently championed by the Institute of Medicine.[11, 37] Integrating data from outside the EHR on postdischarge health behaviors, self‐management, follow‐up care, recovery, and home environment may be another important but untapped strategy for further improving prediction of readmissions.[25, 38]
Third, a multicondition readmission risk‐prediction model may be a less effective strategy than more customized disease‐specific models for selected conditions associated with high 30‐day readmission rates. Our group's previously derived and internally validated models for heart failure and human immunodeficiency virus had superior discrimination compared to our full‐stay EHR model (C statistic of 0.72 for each).[11, 13] However, given differences in the included population and time periods studied, a head‐to‐head comparison of these different strategies is needed to assess differences in model performance and utility.
Our study had several strengths. To our knowledge, this is the first study to rigorously measure the additive influence of in‐hospital complications, clinical trajectory, and stability on discharge on the risk of 30‐day hospital readmission. Additionally, our study included a large, diverse study population that included all payers, all ages of adults, a mix of community, academic, and safety net hospitals, and individuals from a broad array of racial/ethnic and socioeconomic backgrounds.
Our results should be interpreted in light of several limitations. First, though we sought to represent a diverse group of hospitals, all study sites were located within north Texas and generalizability to other regions is uncertain. Second, our ascertainment of prior hospitalizations and readmissions was more inclusive than what could be typically accomplished in real time using only EHR data from a single clinical site. We performed a sensitivity analysis using only prior utilization data available within the EHR from the index hospital with no meaningful difference in our findings (data not shown). Additionally, a recent study found that 30‐day readmissions occur at the index hospital for over 75% of events, suggesting that 30‐day readmissions are fairly comprehensively captured even with only single‐site data.[39] Third, we were not able to include data on outpatient visits before or after the index hospitalization, which may influence the risk of readmission.[1, 40]
In conclusion, incorporating clinically granular EHR data from the entire course of hospitalization modestly improves prediction of 30‐day readmissions compared to models that only include information from the first 24 hours of hospital admission or models that use far fewer variables. However, given the limited improvement in prediction, our findings suggest that from the practical perspective of implementing real‐time models to identify those at highest risk for readmission, it may not be worth the added complexity of waiting until the end of a hospitalization to leverage additional data on hospital complications, and the trajectory of laboratory and vital sign values currently available in the EHR. Further improvement in prediction of readmissions will likely require accounting for psychosocial, functional, behavioral, and postdischarge factors not currently present in the inpatient EHR.
Disclosures: This study was presented at the Society of Hospital Medicine 2015 Annual Meeting in National Harbor, Maryland, and the Society of General Internal Medicine 2015 Annual Meeting in Toronto, Canada. This work was supported by the Agency for Healthcare Research and Qualityfunded UT Southwestern Center for Patient‐Centered Outcomes Research (1R24HS022418‐01) and the Commonwealth Foundation (#20100323). Drs. Nguyen and Makam received funding from the UT Southwestern KL2 Scholars Program (NIH/NCATS KL2 TR001103). Dr. Halm was also supported in part by NIH/NCATS U54 RFA‐TR‐12‐006. The study sponsors had no role in the design and conduct of the study; collection, management, analysis, and interpretation of the data; and preparation, review, or approval of the manuscript. The authors have no conflicts of interest to disclose.
- , , . Rehospitalizations among patients in the Medicare fee‐for‐service program. N Engl J Med. 2009;360(14):1418–1428.
- , , , , . Proportion of hospital readmissions deemed avoidable: a systematic review. CMAJ. 2011;183(7):E391–E402.
- , , , , , . Hospital‐initiated transitional care interventions as a patient safety strategy: a systematic review. Ann Intern Med. 2013;158(5 pt 2):433–440.
- , , , , . Interventions to reduce 30‐day rehospitalization: a systematic review. Ann Intern Med. 2011;155(8):520–528.
- , , , , , . Interventions to Improve Care Transitions at Hospital Discharge. Rockville, MD: Agency for Healthcare Research and Quality; 2013.
- , , , et al. Allocating scarce resources in real‐time to reduce heart failure readmissions: a prospective, controlled study. BMJ Qual Saf. 2013;22(12):998–1005.
- , , , , . Implementing electronic health care predictive analytics: considerations and challenges. Health Aff (Millwood). 2014;33(7):1148–1154.
- , , , et al. Risk prediction models for hospital readmission: a systematic review. JAMA. 2011;306(15):1688–1698.
- , , , et al. Derivation and validation of an index to predict early death or unplanned readmission after discharge from hospital to the community. CMAJ. 2010;182(6):551–557.
- , , , . Potentially avoidable 30‐day hospital readmissions in medical patients: derivation and validation of a prediction model. JAMA Intern Med. 2013;173(8):632–638.
- , , , et al. An automated model to identify heart failure patients at risk for 30‐day readmission or death using electronic medical record data. Med Care. 2010;48(11):981–988.
- , , , et al. An automated model using electronic medical record data identifies patients with cirrhosis at high risk for readmission. Clin Gastroenterol Hepatol. 2013;11(10):1335–1341.e1331.
- , , , , , . An electronic medical record‐based model to predict 30‐day risk of readmission and death among HIV‐infected inpatients. J Acquir Immune Defic Syndr. 2012;61(3):349–358.
- , , , et al. Development and use of an administrative claims measure for profiling hospital‐wide performance on 30‐day unplanned readmission. Ann Intern Med. 2014;161(10 suppl):S66–S75.
- , , , et al. Electronic medical record‐based multicondition models to predict the risk of 30 day readmission or death among adult medicine patients: validation and comparison to existing models. BMC Med Inform Decis Mak. 2015;15(1):39.
- , , , et al. Linking electronic health record‐extracted psychosocial data in real‐time to risk of readmission for heart failure. Psychosomatics. 2011;52(4):319–327.
- , . A conceptual framework for the study of early readmission as an indicator of quality of care. Soc Sci Med. 1996;43(11):1533–1541.
- , , , et al. Hospital readmission performance and patterns of readmission: retrospective cohort study of Medicare admissions. BMJ. 2013;347:f6571.
- , , , , , . Getting more performance from performance measurement. N Engl J Med. 2014;371(23):2145–2147.
- , , , et al. Hospital strategy uptake and reductions in unplanned readmission rates for patients with heart failure: a prospective study. J Gen Intern Med. 2015;30(5):605–611.
- . Post‐hospital syndrome—an acquired, transient condition of generalized risk. N Engl J Med. 2013;368(2):100–102.
- , , , et al. Impact of social factors on risk of readmission or mortality in pneumonia and heart failure: systematic review. J Gen Intern Med. 2013;28(2):269–282.
- , , , , , . Effect of clinical and social risk factors on hospital profiling for stroke readmission: a cohort study. Ann Intern Med. 2014;161(11):775–784.
- , , , et al. Neighborhood socioeconomic disadvantage and 30‐day rehospitalization: a retrospective cohort study. Ann Intern Med. 2014;161(11):765–774.
- , , , , , . Postdischarge environmental and socioeconomic factors and the likelihood of early hospital readmission among community‐dwelling Medicare beneficiaries. Gerontologist. 2008;48(4):495–504.
- , , . Socioeconomic status and readmissions: evidence from an urban teaching hospital. Health Aff (Millwood). 2014;33(5):778–785.
- , , , . Adding socioeconomic data to hospital readmissions calculations may produce more useful results. Health Aff (Millwood). 2014;33(5):786–791.
- , , , . Evaluating the added predictive ability of a new marker: from area under the ROC curve to reclassification and beyond. Stat Med. 2008;27(2):157–172; discussion 207–212.
- , , , , . Net reclassification improvement: computation, interpretation, and controversies: a literature review and clinician's guide. Ann Intern Med. 2014;160(2):122–131.
- , , , , , . Predicting 30‐day readmissions with preadmission electronic health record data. Med Care. 2015;53(3):283–289.
- , . Hospital readmissions—not just a measure of quality. JAMA. 2011;306(16):1796–1797.
- , . Thirty‐day readmissions—truth and consequences. N Engl J Med. 2012;366(15):1366–1369.
- , , , . Functional impairment and hospital readmission in medicare seniors. JAMA Intern Med. 2015;175(4):559–565.
- , , . Clinical and sociodemographic risk factors for readmission of Medicare beneficiaries. Health Care Financ Rev. 1988;10(1):27–36.
- , , , , , . Mini‐cog performance: novel marker of post discharge risk among patients hospitalized for heart failure. Circ Heart Fail. 2015;8(1):8–16.
- , , , , , . Association of impaired functional status at hospital discharge and subsequent rehospitalization. J Hosp Med. 2014;9(5):277–282.
- , . Patients in context—EHR capture of social and behavioral determinants of health. N Engl J Med. 2015;372(8):698–701.
- , , , , . Envisioning a social‐health information exchange as a platform to support a patient‐centered medical neighborhood: a feasibility study. J Gen Intern Med. 2015;30(1):60–67.
- , , , , , . Patient factors contributing to variation in same‐hospital readmission rate. Med Care Res Review. 2015;72(3):338–358.
- , , . Does increased access to primary care reduce hospital readmissions? Veterans Affairs Cooperative Study Group on Primary Care and Hospital Readmission. N Engl J Med. 1996;334(22):1441–1447.