User login
Hospital care accounts for the single largest category of national healthcare expenditures, totaling $936.9 billion in 2013.[1] With ongoing scrutiny of US healthcare spending, hospitals are under increasing pressure to justify high costs and robust profits.[2] However, the dominant fee‐for‐service reimbursement model creates incentives for hospitals to prioritize high volume over high‐quality care to maximize profits.[3] Because hospitals may be reluctant to implement improvements if better quality is not accompanied by better payment or improved financial margins, an approach to stimulate quality improvement among hospitals has been to leverage consumer pressure through required public reporting of selected outcome metrics.[4, 5] Public reporting of outcomes is thought to influence hospital reputation; in turn, reputation affects patient perceptions and influences demand for hospital services, potentially enabling reputable hospitals to command higher prices for services to enhance hospital revenue.[6, 7]
Though improving outcomes is thought to reduce overall healthcare costs, it is unclear whether improving outcomes results in a hospital's financial return on investment.[4, 5, 8] Quality improvement can require substantial upfront investment, requiring that hospitals already have robust financial health to engage in such initiatives.[9, 10] Consequently, instead of stimulating broad efforts in quality improvement, public reporting may exacerbate existing disparities in hospital quality and finances, by rewarding already financially healthy hospitals, and by inadvertently penalizing hospitals without the means to invest in quality improvement.[11, 12, 13, 14, 15] Alternately, because fee‐for‐service remains the dominant reimbursement model for hospitals, loss of revenue through reducing readmissions may outweigh any financial gains from improved public reputation and result in worse overall financial performance, though robust evidence for this concern is lacking.[16, 17]
A small number of existing studies suggest a limited correlation between improved hospital financial performance and improved quality, patient safety, and lower readmission rates.[18, 19, 20] However, these studies had several limitations. They were conducted prior to public reporting of selected outcome metrics by the Centers for Medicare and Medicaid Services (CMS)[18, 19, 20]; used data from the Medicare Cost Report, which is not uniformly audited and thus prone to measurement error[19, 20]; used only relative measures of hospital financial performance (eg, operating margin), which do not capture the absolute amount of revenue potentially available for investment in quality improvement[18, 19]; or compared only hospitals at the extremes of financial performance, potentially exaggerating the magnitude of the relationship between hospital financial performance and quality outcomes.[19]
To address this gap in the literature, we sought to assess whether hospitals with robust financial performance have lower 30‐day risk‐standardized mortality and hospital readmission rates for acute myocardial infarction (AMI), congestive heart failure (CHF), and pneumonia (PNA). Given the concern that hospitals with the lowest mortality and readmission rates may experience a decrease in financial performance due to the lower volume of hospitalizations, we also assessed whether hospitals with the lowest readmission and mortality rates had a differential change in financial performance over time compared to hospitals with the highest rates.
METHODS
Data Sources and Study Population
This was an observational study using audited financial data from the 2008 and 2012 Hospital Annual Financial Data Files from the Office of Statewide Health Planning and Development (OSHPD) in the state of California, merged with data on outcome measures publicly reported by CMS via the Hospital Compare website for July 1, 2008 to June 30, 2011.[21, 22] We included all general acute care hospitals with available OSHPD data in 2008 and at least 1 publicly reported outcome from 2008 to 2011. We excluded hospitals without 1 year of audited financial data for 2008 and hospitals that closed during 2008 to 2011.
Measures of Financial Performance
Because we hypothesized that the absolute amount of revenue generated from clinical operations would influence investment in quality improvement programs more so than relative changes in revenue,[20] we used net revenue from operations (total operating revenue minus total operating expense) as our primary measure of hospital financial performance. We also performed 2 companion analyses using 2 commonly reported relative measures of financial performanceoperating margin (net revenue from operations divided by total operating revenue) and total margin (net total revenue divided by total revenue from all sources). Net revenue from operations for 2008 was adjusted to 2012 US dollars using the chained Consumer Price Index for all urban consumers.
Outcomes
For our primary analysis, the primary outcomes were publicly reported all‐cause 30‐day risk‐standardized mortality rates (RSMR) and readmission rates (RSRR) for AMI, CHF, and PNA aggregated over a 3‐year period. These measures were adjusted for key demographic and clinical characteristics available in Medicare data. CMS began publicly reporting 30‐day RSMR for AMI and CHF in June 2007, RSMR for PNA in June 2008, and RSRR for all 3 conditions in July 2009.[23, 24]
To assess whether public reporting had an effect on subsequent hospital financial performance, we conducted a companion analysis where the primary outcome of interest was change in hospital financial performance over time, using the same definitions of financial performance outlined above. For this companion analysis, publicly reported 30‐day RSMR and RSRR for AMI, CHF, and PNA were assessed as predictors of subsequent financial performance.
Hospital Characteristics
Hospital characteristics were ascertained from the OSHPD data. Safety‐net status was defined as hospitals with an annual Medicaid caseload (number of Medicaid discharges divided by the total number of discharges) 1 standard deviation above the mean Medicaid caseload, as defined in previous studies.[25]
Statistical Analyses
Effect of Baseline Financial Performance on Subsequent Publicly Reported Outcomes
To estimate the relationship between baseline hospital financial performance in 2008 and subsequent RSMR and RSRR for AMI, CHF, and PNA from 2008 to 2011, we used linear regression adjusted for the following hospital characteristics: teaching status, rural location, bed size, safety‐net status, ownership, Medicare caseload, and volume of cases reported for the respective outcome. We accounted for clustering of hospitals by ownership. We adjusted for hospital volume of reported cases for each condition given that the risk‐standardization models used by CMS shrink outcomes for small hospitals to the mean, and therefore do not account for a potential volume‐outcome relationship.[26] We conducted a sensitivity analysis excluding hospitals at the extremes of financial performance, defined as hospitals with extreme outlier values for each financial performance measure (eg, values more than 3 times the interquartile range above the first quartile or below the third quartile).[27] Nonlinearity of financial performance measures was assessed using restricted cubic splines. For ease of interpretation, we scaled the estimated change in RSMR and RSRR per $50 million increase in net revenue from operations, and graphed nonparametric relationships using restricted cubic splines.
Effect of Public Reporting on Subsequent Hospital Financial Performance
To assess whether public reporting had an effect on subsequent hospital financial performance, we conducted a companion hospital‐level difference‐in‐differences analysis to assess for differential changes in hospital financial performance between 2008 and 2012, stratified by tertiles of RSMR and RSRR rates from 2008 to 2011. This approach compares differences in an outcome of interest (hospital financial performance) within each group (where each group is a tertile of publicly reported rates of RSMR or RSRR), and then compares the difference in these differences between groups. Therefore, these analyses use each group as their own historical control and the opposite group as a concurrent control to account for potential secular trends. To conduct our difference‐in‐differences analysis, we compared the change in financial performance over time in the top tertile of hospitals to the change in financial performance over time in the bottom tertile of hospitals with respect to AMI, CHF, and PNA RSMR and RSRR. Our models therefore included year (2008 vs 2012), tertile of publicly reported rates for RSMR or RSRR, and the interaction between them as predictors, where the interaction was the difference‐in‐differences term and the primary predictor of interest. In addition to adjusting for hospital characteristics and accounting for clustering as mentioned above, we also included 3 separate interaction terms for year with bed size, safety‐net status, and Medicare caseload, to account for potential changes in the hospitals over time that may have independently influenced financial performance and publicly reported 30‐day measures. For sensitivity analyses, we repeated our difference‐in‐differences analyses excluding hospitals with a change in ownership and extreme outliers with respect to financial performance in 2008. We performed model diagnostics including assessment of functional form, linearity, normality, constant variance, and model misspecification. All analyses were conducted using Stata version 12.1 (StataCorp, College Station, TX). This study was deemed exempt from review by the UT Southwestern Medical Center institutional review board.
RESULTS
Among the 279 included hospitals (see Supporting Figure 1 in the online version of this article), 278 also had financial data available for 2012. In 2008, the median net revenue from operations was $1.6 million (interquartile range [IQR], $2.4 to $10.3 million), the median operating margin was 1.5% (IQR, 4.6% to 6%), and the median total margin was 2.5% (IQR, 2.2% to 7.5% (Table 1). The number of hospitals reporting each outcome, and median outcome rates, are shown in Table 2.
| 2008, n = 279 | 2012, n = 278 | |
|---|---|---|
| ||
| Hospital characteristics | ||
| Teaching, n (%) | 28 (10.0) | 28 (10.0) |
| Rural, n (%) | 55 (19.7) | 55 (19.7) |
| Bed size, n (%) | ||
| 099 (small) | 57 (20.4) | 55 (19.8) |
| 100299 (medium) | 130 (46.6) | 132 (47.5) |
| 300 (large) | 92 (33.0) | 91 (32.7) |
| Safety‐net hospital, n (%)* | 46 (16.5) | 48 (17.3) |
| Hospital ownership, n (%) | ||
| City or county | 15 (5.4) | 16 (5.8) |
| District | 42 (15.1) | 39 (14.0) |
| Investor | 66 (23.7) | 66 (23.7) |
| Private nonprofit | 156 (55.9) | 157 (56.5) |
| Medicare caseload, mean % (SD) | 41.6 (14.7) | 43.6 (14.7) |
| Financial performance measures | ||
| Net revenue from operations, median $ in millions (IQR; range) | 1.6 (2.4 to 10.3; 495.9 to 144.1) | 3.2 (2.9 to 15.4; 396.2 to 276.8) |
| Operating margin, median % (IQR; range) | 1.5 (4.6 to 6.8; 77.8 to 26.4) | 2.3 (3.9 to 8.2; 134.8 to 21.1) |
| Total margin, median % (IQR; range) | 2.5 (2.2 to 7.5; 101.0 to 26.3) | 4.5 (0.7 to 9.8; 132.2 to 31.1) |
| No. | Median % (IQR) | Adjusted % Change (95% CI) per $50 Million Increase in Net Revenue From Operations | ||
|---|---|---|---|---|
| Overall | Extreme Outliers Excluded | |||
| ||||
| Myocardial infarction | ||||
| Mortality rate | 211 | 15.2 (14.216.2) | 0.07 (0.10 to 0.24) | 0.63 (0.21 to 1.48) |
| Readmission rate | 184 | 19.4 (18.520.2) | Nonlinear | 0.34 (1.17 to 0.50) |
| Congestive heart failure | ||||
| Mortality rate | 259 | 11.1 (10.112.1) | 0.17 (0.01 to 0.35) | Nonlinear∥ |
| Readmission rate | 264 | 24.5 (23.525.6) | 0.07 (0.27 to 0.14) | 0.45 (1.36 to 0.47) |
| Pneumonia | ||||
| Mortality rate | 268 | 11.6 (10.413.2) | 0.17 (0.42 to 0.07) | 0.35 (1.19 to 0.49) |
| Readmission rate | 268 | 18.2 (17.319.1) | 0.04 (0.20 to 0.11) | 0.56 (1.27 to 0.16) |
Relationship Between Financial Performance and Publicly Reported Outcomes
Acute Myocardial Infarction
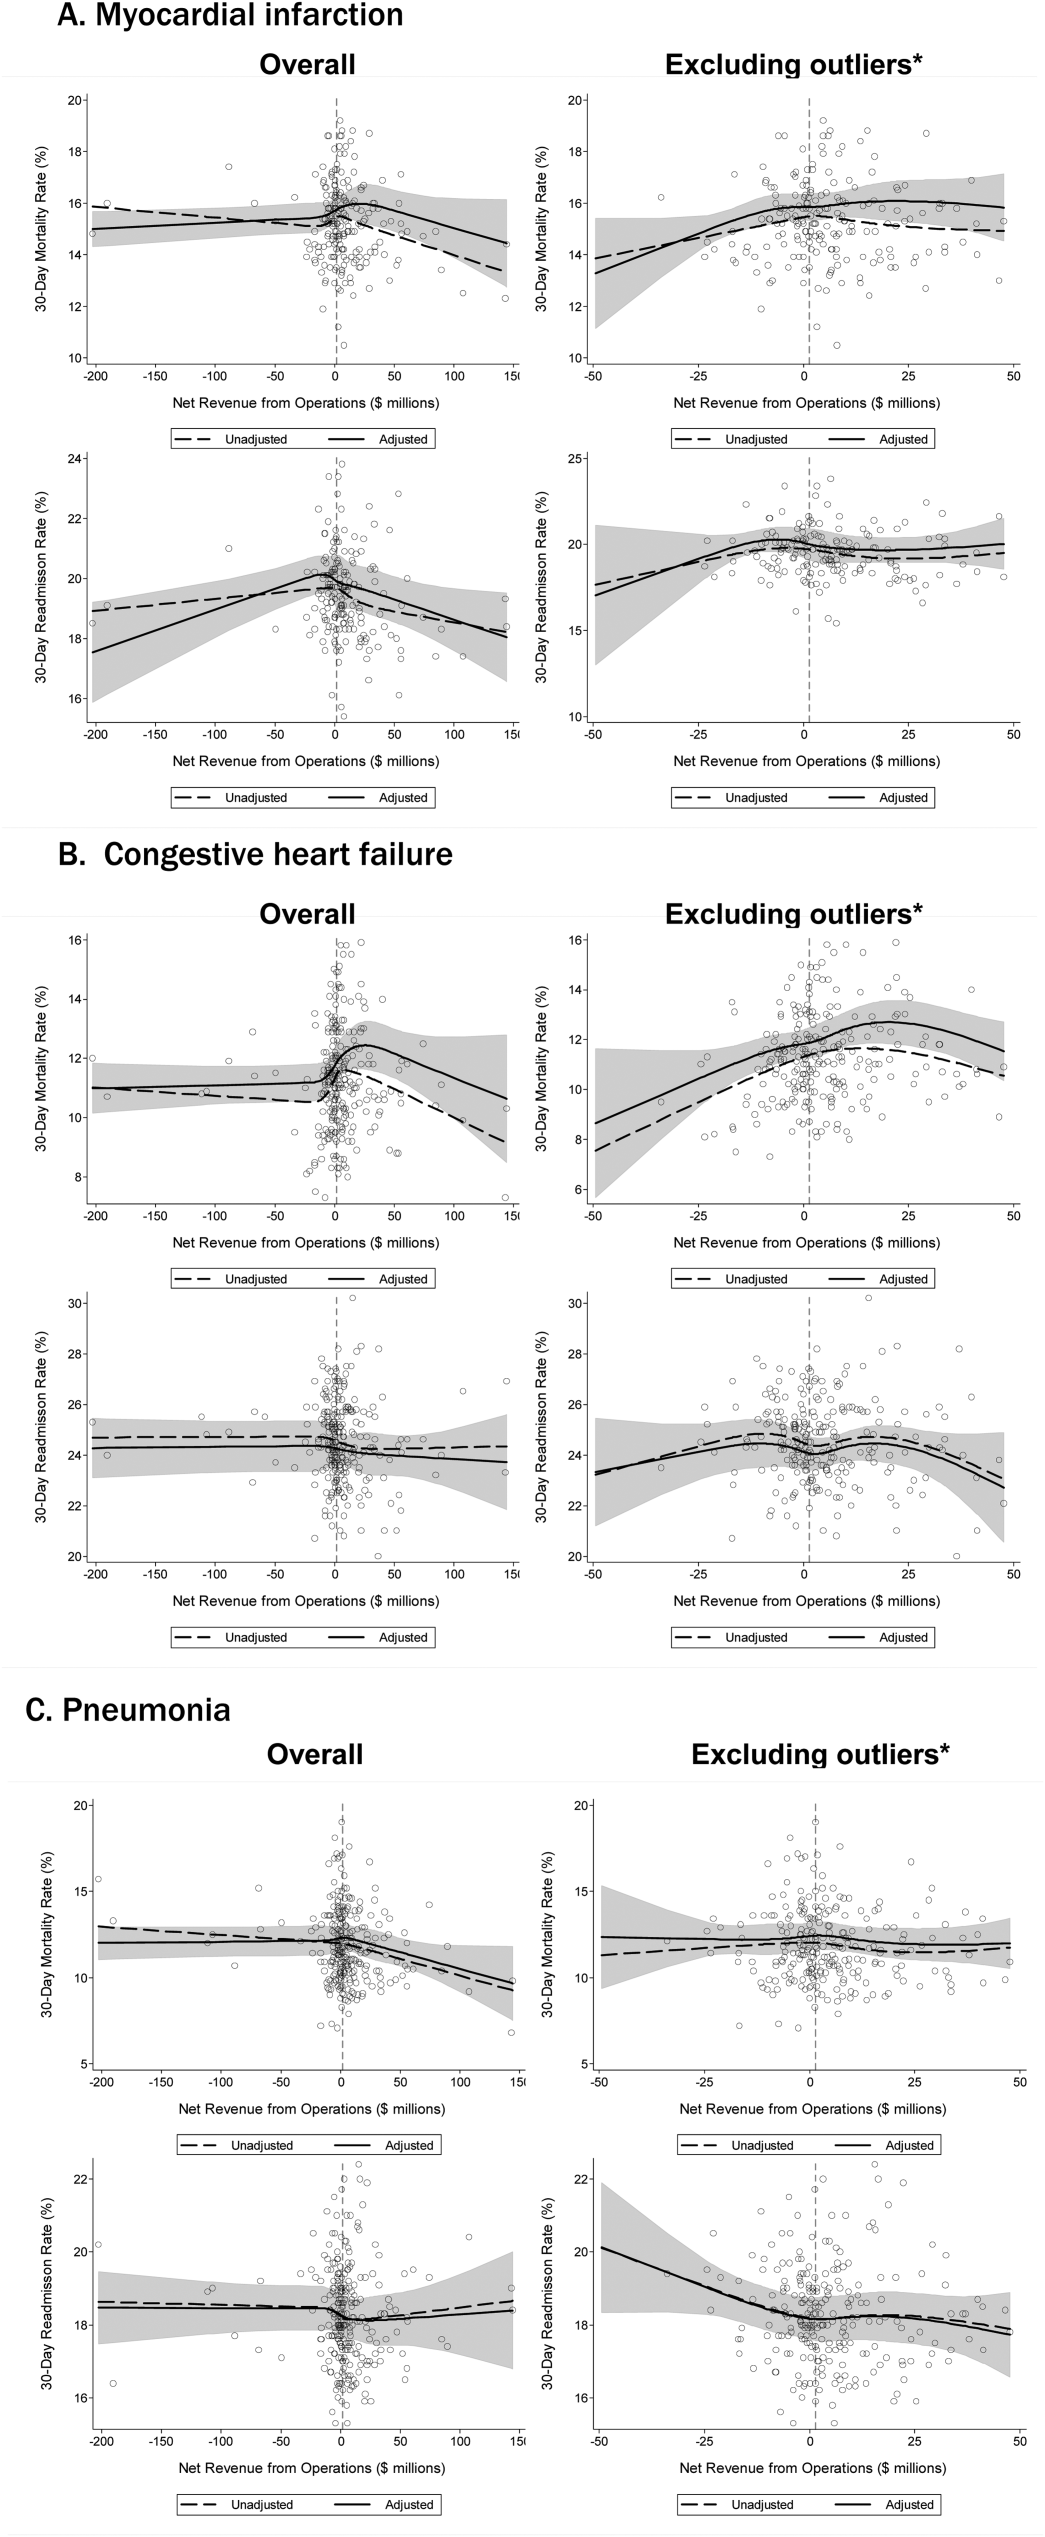
We did not observe a consistent relationship between hospital financial performance and AMI mortality and readmission rates. In our overall adjusted analyses, net revenue from operations was not associated with mortality, but was significantly associated with a decrease in AMI readmissions among hospitals with net revenue from operations between approximately $5 million to $145 million (nonlinear relationship, F statistic = 4.8, P < 0.001 (Table 2, Figure 1A). However, after excluding 23 extreme outlying hospitals by net revenue from operations (10 underperformers with net revenue <$49.4 million and 13 overperformers with net revenue >$52.1 million), this relationship was no longer observed. Using operating margin instead of net revenue from operations as the measure of hospital financial performance, we observed a 0.2% increase in AMI mortality (95% confidence interval [CI]: 0.06%‐0.35%) (see Supporting Table 1 and Supporting Figure 2 in the online version of this article) for each 10% increase in operating margin, which persisted with the exclusion of 5 outlying hospitals by operating margin (all 5 were underperformers, with operating margins <38.6%). However, using total margin as the measure of financial performance, there was no significant relationship with either mortality or readmissions (see Supporting Table 2 and Supporting Figure 3 in the online version of this article).
Congestive Heart Failure
In our primary analyses, we did not observe a significant relationship between net revenue from operations and CHF mortality and readmission rates. However, after excluding 23 extreme outliers, increasing net revenue from operations was associated with a modest increase in CHF mortality among hospitals, with net revenue between approximately $35 million and $20 million (nonlinear relationship, F statistic = 3.6, P = 0.008 (Table 2, Figure 1B). Using alternate measures of financial performance, we observed a consistent relationship between increasing hospital financial performance and higher 30‐day CHF mortality rate. Using operating margin, we observed a slight increase in the mortality rate for CHF (0.26% increase in CHF RSMR for every 10% increase in operating margin) (95% CI: 0.07%‐0.45%) (see Supporting Table 1 and Supporting Figure 2 in the online version of this article), which persisted after the exclusion of 5 extreme outliers. Using total margin, we observed a significant but modest association between improved hospital financial performance and increased mortality rate for CHF (nonlinear relationship, F statistic = 2.9, P = 0.03) (see Supporting Table 2 and Supporting Figure 3 in the online version of this article), which persisted after the exclusion of 3 extreme outliers (0.32% increase in CHF RSMR for every 10% increase in total margin) (95% CI: 0.03%‐0.62%).
Pneumonia
Hospital financial performance (using net revenue, operating margin, or total margin) was not associated with 30‐day PNA mortality or readmission rates.
Relationship of Readmission and Mortality Rates on Subsequent Hospital Financial Performance
Compared to hospitals in the highest tertile of readmission and mortality rates (ie, those with the worst rates), hospitals in the lowest tertile of readmission and mortality rates (ie, those with the best rates) had a similar magnitude of increase in net revenue from operations from 2008 to 2012 (Table 3). The difference‐in‐differences analyses showed no relationship between readmission or mortality rates for AMI, CHF, and PNA and changes in net revenue from operations from 2008 to 2012 (difference‐in‐differences estimates ranged from $8.61 to $6.77 million, P > 0.3 for all). These results were robust to the exclusion of hospitals with a change in ownership and extreme outliers by net revenue from operations (data not reported).
| Outcome | Tertile With Highest Outcome Rates (Worst Hospitals) | Tertile With Lowest Outcome Rates (Best Hospitals) | Difference in Net From Operations Differences Between Highest and Lowest Outcome Rate Tertiles, $ Million (95% CI) | P | ||
|---|---|---|---|---|---|---|
| Outcome, Median % (IQR) | Gain/Loss in Net Revenue From Operations From 2008 to 2012, $ Million* | Outcome, Median % (IQR) | Gain/Loss in Net Revenue from Operations From 2008 to 2012, $ Million* | |||
| ||||||
| AMI mortality | 16.7 (16.217.4) | +65.62 | 13.8 (13.314.2) | +74.23 | 8.61 (27.95 to 10.73) | 0.38 |
| AMI readmit | 20.7 (20.321.5) | +38.62 | 18.3 (17.718.6) | +31.85 | +6.77 (13.24 to 26.77) | 0.50 |
| CHF mortality | 13.0 (12.313.9) | +45.66 | 9.6 (8.910.1) | +48.60 | 2.94 (11.61 to 5.73) | 0.50 |
| CHF readmit | 26.2 (25.726.9) | +47.08 | 23.0 (22.323.5) | +46.08 | +0.99 (10.51 to 12.50) | 0.87 |
| PNA mortality | 13.9 (13.314.7) | +43.46 | 9.9 (9.310.4) | +38.28 | +5.18 (7.01 to 17.37) | 0.40 |
| PNA readmit | 19.4 (19.120.1) | +47.21 | 17.0 (16.517.3) | +45.45 | +1.76 (8.34 to 11.86) | 0.73 |
DISCUSSION
Using audited financial data from California hospitals in 2008 and 2012, and CMS data on publicly reported outcomes from 2008 to 2011, we found no consistent relationship between hospital financial performance and publicly reported outcomes for AMI and PNA. However, better hospital financial performance was associated with a modest increase in 30‐day risk‐standardized CHF mortality rates, which was consistent across all 3 measures of hospital financial performance. Reassuringly, there was no difference in the change in net revenue from operations between 2008 and 2012 between hospitals in the highest and lowest tertiles of readmission and mortality rates for AMI, CHF, and PNA. In other words, hospitals with the lowest rates of 30‐day readmissions and mortality for AMI, CHF, and PNA did not experience a loss in net revenue from operations over time, compared to hospitals with the highest readmission and mortality rates.
Our study differs in several important ways from Ly et al., the only other study to our knowledge that investigated the relationship between hospital financial performance and outcomes for patients with AMI, CHF, and PNA.[19] First, outcomes in the Ly et al. study were ascertained in 2007, which preceded public reporting of outcomes. Second, the primary comparison was between hospitals in the bottom versus top decile of operating margin. Although Ly and colleagues also found no association between hospital financial performance and mortality rates for these 3 conditions, they found a significant absolute decrease of approximately 3% in readmission rates among hospitals in the top decile of operating margin versus those in bottom decile. However, readmission rates were comparable among the remaining 80% of hospitals, suggesting that these findings primarily reflected the influence of a few outlier hospitals. Third, the use of nonuniformly audited hospital financial data may have resulted in misclassification of financial performance. Our findings also differ from 2 previous studies that identified a modest association between improved hospital financial performance and decreased adverse patient safety events.[18, 20] However, publicly reported outcomes may not be fully representative of hospital quality and patient safety.[28, 29]
The limited association between hospital financial performance and publicly reported outcomes for AMI and PNA is noteworthy for several reasons. First, publicly reporting outcomes alone without concomitant changes to reimbursement may be inadequate to create strong financial incentives for hospital investment in quality improvement initiatives. Hospitals participating in both public reporting of outcomes and pay‐for‐performance have been shown to achieve greater improvements in outcomes than hospitals engaged only in public reporting.[30] Our time interval for ascertainment of outcomes preceded CMS implementation of the Hospital Readmissions Reduction Program (HRRP) in October 2012, which withholds up to 3% of Medicare hospital reimbursements for higher than expected mortality and readmission rates for AMI, CHF, and PNA. Once outcomes data become available for a 3‐year post‐HRRP implementation period, the impact of this combined approach can be assessed. Second, because adherence to many evidence‐based process measures for these conditions (ie, aspirin use in AMI) is already high, there may be a ceiling effect present that obviates the need for further hospital financial investment to optimize delivery of best practices.[31, 32] Third, hospitals themselves may contribute little to variation in mortality and readmission risk. Of the total variation in mortality and readmission rates among Texas Medicare beneficiaries, only about 1% is attributable to hospitals, whereas 42% to 56% of the variation is explained by differences in patient characteristics.[33, 34] Fourth, there is either low‐quality or insufficient evidence that transitional care interventions specifically targeted to patients with AMI or PNA result in better outcomes.[35] Thus, greater financial investment in hospital‐initiated and postdischarge transitional care interventions for these specific conditions may result in less than the desired effect. Lastly, many hospitalizations for these conditions are emergency hospitalizations that occur after patients present to the emergency department with unexpected and potentially life‐threatening symptoms. Thus, patients may not be able to incorporate the reputation or performance metrics of a hospital in their decisions for where they are hospitalized for AMI, CHF, or PNA despite the public reporting of outcomes.
Given the strong evidence that transitional care interventions reduce readmissions and mortality among patients hospitalized with CHF, we were surprised to find that improved hospital financial performance was associated with an increased risk‐adjusted CHF mortality rate.[36] This association held true for all 3 different measures of hospital financial performance, suggesting that this unexpected finding is unlikely to be the result of statistical chance, though potential reasons for this association remain unclear. One possibility is that the CMS model for CHF mortality may not adequately risk adjust for severity of illness.[37, 38] Thus, robust financial performance may be a marker for hospitals with more advanced heart failure services that care for more patients with severe illness.
Our findings should be interpreted in the context of certain limitations. Our study only included an analysis of outcomes for AMI, CHF, and PNA among older fee‐for‐service Medicare beneficiaries aggregated at the hospital level in California between 2008 and 2012, so generalizability to other populations, conditions, states, and time periods is uncertain. The observational design precludes a robust causal inference between financial performance and outcomes. For readmissions, rates were publicly reported for only the last 2 years of the 3‐year reporting period; thus, our findings may underestimate the association between hospital financial performance and publicly reported readmission rates.
CONCLUSION
There is no consistent relationship between hospital financial performance and subsequent publicly reported outcomes for AMI and PNA. However, for unclear reasons, hospitals with better financial performance had modestly higher CHF mortality rates. Given this limited association, public reporting of outcomes may have had less than the intended impact in motivating hospitals to invest in quality improvement. Additional financial incentives in addition to public reporting, such as readmissions penalties, may help motivate hospitals with robust financial performance to further improve outcomes. This would be a key area for future investigation once outcomes data are available for the 3‐year period following CMS implementation of readmissions penalties in 2012. Reassuringly, there was no association between low 30‐day mortality and readmissions rates and subsequent poor financial performance, suggesting that improved outcomes do not necessarily lead to loss of revenue.
Disclosures
Drs. Nguyen, Halm, and Makam were supported in part by the Agency for Healthcare Research and Quality University of Texas Southwestern Center for Patient‐Centered Outcomes Research (1R24HS022418‐01). Drs. Nguyen and Makam received funding from the University of Texas Southwestern KL2 Scholars Program (NIH/NCATS KL2 TR001103). The study sponsors had no role in design and conduct of the study; collection, management, analysis, and interpretation of the data; and preparation, review, or approval of the manuscript. The authors have no conflicts of interest to disclose.
- Centers for Medicare and Medicaid Services. Office of the Actuary. National Health Statistics Group. National Healthcare Expenditures Data. Baltimore, MD; 2013. https://www.cms.gov/Research-Statistics-Data-and-Systems/Statistics-Trends-and-Reports/NationalHealthExpendData/NationalHealthAccountsHistorical.html. Accessed February 16, 2016.
- . Bitter pill: why medical bills are killing us. Time Magazine. February 20, 2013:16–55.
- . Fee‐for‐service will remain a feature of major payment reforms, requiring more changes in Medicare physician payment. Health Aff (Millwood). 2012;31(9):1977–1983.
- , , , et al. The business case for quality: case studies and an analysis. Health Aff (Millwood). 2003;22(2):17–30.
- , , , . Public reporting on quality in the United States and the United Kingdom. Health Aff (Millwood). 2003;22(3):134–148.
- , , , , . The business case for health‐care quality improvement. J Patient Saf. 2013;9(1):44–52.
- , , . Hospital performance reports: impact on quality, market share, and reputation. Health Aff (Millwood). 2005;24(4):1150–1160.
- , , , . The savings illusion—why clinical quality improvement fails to deliver bottom‐line results. N Engl J Med. 2011;365(26):e48.
- , , , , . Hospital Quality: Ingredients for Success—Overview and Lessons Learned. New York, NY: Commonwealth Fund; 2004.
- , , . Hospital Quality Improvement: Strategies and Lessons from U.S. Hospitals. New York, NY: Commonwealth Fund; 2007.
- , , , et al. Hospital financial condition and operational decisions related to the quality of hospital care. Med Care Res Rev. 2007;64(2):148–168.
- , , , , , . Will pay‐for‐performance and quality reporting affect health care disparities? Health Aff (Millwood). 2007;26(3):w405–w414.
- , , . Comparison of change in quality of care between safety‐net and non‐safety‐net hospitals. JAMA. 2008;299(18):2180–2187.
- , . Could Medicare readmission policy exacerbate health care system inequity? Ann Intern Med. 2010;152(2):114–117.
- , . Minding the gap between efforts to reduce readmissions and disparities. JAMA. 2011;305(7):715–716.
- , . Medicare Health Support Pilot Program. N Engl J Med. 2012;366(7):666; author reply 667–668.
- , . Revisiting hospital readmissions. JAMA. 2013;309(4):398–400.
- , . Hospital finances and patient safety outcomes. Inquiry. 2005;42(1):60–72.
- , , . The association between hospital margins, quality of care, and closure or other change in operating status. J Gen Intern Med. 2011;26(11):1291–1296.
- , , , . Hospital financial condition and the quality of patient care. Health Econ. 2008;17(8):977–995.
- State of California Office of Statewide Health Planning and Development. Healthcare Information Division. Annual financial data. Available at: http://www.oshpd.ca.gov/HID/Products/Hospitals/AnnFinanData/PivotProfles/default.asp. Accessed June 23, 2015.
- Centers for Medicare 4(1):11–13.
- , , , et al. Quality of care for acute myocardial infarction at urban safety‐net hospitals. Health Aff (Millwood). 2007;26(1):238–248.
- , , , et al. The Hospital Compare mortality model and the volume‐outcome relationship. Health Serv Res. 2010;45(5 Pt 1):1148–1167.
- . Exploratory Data Analysis. Boston, MA: Addison‐Wesley; 1977.
- , , , et al. Limits of readmission rates in measuring hospital quality suggest the need for added metrics. Health Aff (Millwood). 2013;32(6):1083–1091.
- , , , et al. Hospital performance measures and 30‐day readmission rates. J Gen Intern Med. 2013;28(3):377–385.
- , , , et al. Public reporting and pay for performance in hospital quality improvement. N Engl J Med. 2007;356(5):486–496.
- , , , et al. Usual source of care and outcomes following acute myocardial infarction. J Gen Intern Med. 2014;29(6):862–869.
- , . Public reporting on hospital process improvements is linked to better patient outcomes. Health Aff (Millwood). 2010;29(7):1319–1324.
- , , , . Variation in length of stay and outcomes among hospitalized patients attributable to hospitals and hospitalists. J Gen Intern Med. 2013;28(3):370–376.
- , , , , . Variation in the risk of readmission among hospitals: the relative contribution of patient, hospital and inpatient provider characteristics. J Gen Intern Med. 2014;29(4):572–578.
- , , , et al. Transitional care after hospitalization for acute stroke or myocardial infarction: a systematic review. Ann Intern Med. 2012;157(6):407–416.
- , , , . The inverse relationship between mortality rates and performance in the Hospital Quality Alliance measures. Health Aff (Millwood). 2007;26(4):1104–1110.
- , , , et al. An automated model to identify heart failure patients at risk for 30‐day readmission or death using electronic medical record data. Med Care. 2010;48(11):981–988.
- , , . Indications of biased risk adjustment in the hospital readmission reduction program. J Ambul Care Manage. 2015;38(1):39–47.
Hospital care accounts for the single largest category of national healthcare expenditures, totaling $936.9 billion in 2013.[1] With ongoing scrutiny of US healthcare spending, hospitals are under increasing pressure to justify high costs and robust profits.[2] However, the dominant fee‐for‐service reimbursement model creates incentives for hospitals to prioritize high volume over high‐quality care to maximize profits.[3] Because hospitals may be reluctant to implement improvements if better quality is not accompanied by better payment or improved financial margins, an approach to stimulate quality improvement among hospitals has been to leverage consumer pressure through required public reporting of selected outcome metrics.[4, 5] Public reporting of outcomes is thought to influence hospital reputation; in turn, reputation affects patient perceptions and influences demand for hospital services, potentially enabling reputable hospitals to command higher prices for services to enhance hospital revenue.[6, 7]
Though improving outcomes is thought to reduce overall healthcare costs, it is unclear whether improving outcomes results in a hospital's financial return on investment.[4, 5, 8] Quality improvement can require substantial upfront investment, requiring that hospitals already have robust financial health to engage in such initiatives.[9, 10] Consequently, instead of stimulating broad efforts in quality improvement, public reporting may exacerbate existing disparities in hospital quality and finances, by rewarding already financially healthy hospitals, and by inadvertently penalizing hospitals without the means to invest in quality improvement.[11, 12, 13, 14, 15] Alternately, because fee‐for‐service remains the dominant reimbursement model for hospitals, loss of revenue through reducing readmissions may outweigh any financial gains from improved public reputation and result in worse overall financial performance, though robust evidence for this concern is lacking.[16, 17]
A small number of existing studies suggest a limited correlation between improved hospital financial performance and improved quality, patient safety, and lower readmission rates.[18, 19, 20] However, these studies had several limitations. They were conducted prior to public reporting of selected outcome metrics by the Centers for Medicare and Medicaid Services (CMS)[18, 19, 20]; used data from the Medicare Cost Report, which is not uniformly audited and thus prone to measurement error[19, 20]; used only relative measures of hospital financial performance (eg, operating margin), which do not capture the absolute amount of revenue potentially available for investment in quality improvement[18, 19]; or compared only hospitals at the extremes of financial performance, potentially exaggerating the magnitude of the relationship between hospital financial performance and quality outcomes.[19]
To address this gap in the literature, we sought to assess whether hospitals with robust financial performance have lower 30‐day risk‐standardized mortality and hospital readmission rates for acute myocardial infarction (AMI), congestive heart failure (CHF), and pneumonia (PNA). Given the concern that hospitals with the lowest mortality and readmission rates may experience a decrease in financial performance due to the lower volume of hospitalizations, we also assessed whether hospitals with the lowest readmission and mortality rates had a differential change in financial performance over time compared to hospitals with the highest rates.
METHODS
Data Sources and Study Population
This was an observational study using audited financial data from the 2008 and 2012 Hospital Annual Financial Data Files from the Office of Statewide Health Planning and Development (OSHPD) in the state of California, merged with data on outcome measures publicly reported by CMS via the Hospital Compare website for July 1, 2008 to June 30, 2011.[21, 22] We included all general acute care hospitals with available OSHPD data in 2008 and at least 1 publicly reported outcome from 2008 to 2011. We excluded hospitals without 1 year of audited financial data for 2008 and hospitals that closed during 2008 to 2011.
Measures of Financial Performance
Because we hypothesized that the absolute amount of revenue generated from clinical operations would influence investment in quality improvement programs more so than relative changes in revenue,[20] we used net revenue from operations (total operating revenue minus total operating expense) as our primary measure of hospital financial performance. We also performed 2 companion analyses using 2 commonly reported relative measures of financial performanceoperating margin (net revenue from operations divided by total operating revenue) and total margin (net total revenue divided by total revenue from all sources). Net revenue from operations for 2008 was adjusted to 2012 US dollars using the chained Consumer Price Index for all urban consumers.
Outcomes
For our primary analysis, the primary outcomes were publicly reported all‐cause 30‐day risk‐standardized mortality rates (RSMR) and readmission rates (RSRR) for AMI, CHF, and PNA aggregated over a 3‐year period. These measures were adjusted for key demographic and clinical characteristics available in Medicare data. CMS began publicly reporting 30‐day RSMR for AMI and CHF in June 2007, RSMR for PNA in June 2008, and RSRR for all 3 conditions in July 2009.[23, 24]
To assess whether public reporting had an effect on subsequent hospital financial performance, we conducted a companion analysis where the primary outcome of interest was change in hospital financial performance over time, using the same definitions of financial performance outlined above. For this companion analysis, publicly reported 30‐day RSMR and RSRR for AMI, CHF, and PNA were assessed as predictors of subsequent financial performance.
Hospital Characteristics
Hospital characteristics were ascertained from the OSHPD data. Safety‐net status was defined as hospitals with an annual Medicaid caseload (number of Medicaid discharges divided by the total number of discharges) 1 standard deviation above the mean Medicaid caseload, as defined in previous studies.[25]
Statistical Analyses
Effect of Baseline Financial Performance on Subsequent Publicly Reported Outcomes
To estimate the relationship between baseline hospital financial performance in 2008 and subsequent RSMR and RSRR for AMI, CHF, and PNA from 2008 to 2011, we used linear regression adjusted for the following hospital characteristics: teaching status, rural location, bed size, safety‐net status, ownership, Medicare caseload, and volume of cases reported for the respective outcome. We accounted for clustering of hospitals by ownership. We adjusted for hospital volume of reported cases for each condition given that the risk‐standardization models used by CMS shrink outcomes for small hospitals to the mean, and therefore do not account for a potential volume‐outcome relationship.[26] We conducted a sensitivity analysis excluding hospitals at the extremes of financial performance, defined as hospitals with extreme outlier values for each financial performance measure (eg, values more than 3 times the interquartile range above the first quartile or below the third quartile).[27] Nonlinearity of financial performance measures was assessed using restricted cubic splines. For ease of interpretation, we scaled the estimated change in RSMR and RSRR per $50 million increase in net revenue from operations, and graphed nonparametric relationships using restricted cubic splines.
Effect of Public Reporting on Subsequent Hospital Financial Performance
To assess whether public reporting had an effect on subsequent hospital financial performance, we conducted a companion hospital‐level difference‐in‐differences analysis to assess for differential changes in hospital financial performance between 2008 and 2012, stratified by tertiles of RSMR and RSRR rates from 2008 to 2011. This approach compares differences in an outcome of interest (hospital financial performance) within each group (where each group is a tertile of publicly reported rates of RSMR or RSRR), and then compares the difference in these differences between groups. Therefore, these analyses use each group as their own historical control and the opposite group as a concurrent control to account for potential secular trends. To conduct our difference‐in‐differences analysis, we compared the change in financial performance over time in the top tertile of hospitals to the change in financial performance over time in the bottom tertile of hospitals with respect to AMI, CHF, and PNA RSMR and RSRR. Our models therefore included year (2008 vs 2012), tertile of publicly reported rates for RSMR or RSRR, and the interaction between them as predictors, where the interaction was the difference‐in‐differences term and the primary predictor of interest. In addition to adjusting for hospital characteristics and accounting for clustering as mentioned above, we also included 3 separate interaction terms for year with bed size, safety‐net status, and Medicare caseload, to account for potential changes in the hospitals over time that may have independently influenced financial performance and publicly reported 30‐day measures. For sensitivity analyses, we repeated our difference‐in‐differences analyses excluding hospitals with a change in ownership and extreme outliers with respect to financial performance in 2008. We performed model diagnostics including assessment of functional form, linearity, normality, constant variance, and model misspecification. All analyses were conducted using Stata version 12.1 (StataCorp, College Station, TX). This study was deemed exempt from review by the UT Southwestern Medical Center institutional review board.
RESULTS
Among the 279 included hospitals (see Supporting Figure 1 in the online version of this article), 278 also had financial data available for 2012. In 2008, the median net revenue from operations was $1.6 million (interquartile range [IQR], $2.4 to $10.3 million), the median operating margin was 1.5% (IQR, 4.6% to 6%), and the median total margin was 2.5% (IQR, 2.2% to 7.5% (Table 1). The number of hospitals reporting each outcome, and median outcome rates, are shown in Table 2.
| 2008, n = 279 | 2012, n = 278 | |
|---|---|---|
| ||
| Hospital characteristics | ||
| Teaching, n (%) | 28 (10.0) | 28 (10.0) |
| Rural, n (%) | 55 (19.7) | 55 (19.7) |
| Bed size, n (%) | ||
| 099 (small) | 57 (20.4) | 55 (19.8) |
| 100299 (medium) | 130 (46.6) | 132 (47.5) |
| 300 (large) | 92 (33.0) | 91 (32.7) |
| Safety‐net hospital, n (%)* | 46 (16.5) | 48 (17.3) |
| Hospital ownership, n (%) | ||
| City or county | 15 (5.4) | 16 (5.8) |
| District | 42 (15.1) | 39 (14.0) |
| Investor | 66 (23.7) | 66 (23.7) |
| Private nonprofit | 156 (55.9) | 157 (56.5) |
| Medicare caseload, mean % (SD) | 41.6 (14.7) | 43.6 (14.7) |
| Financial performance measures | ||
| Net revenue from operations, median $ in millions (IQR; range) | 1.6 (2.4 to 10.3; 495.9 to 144.1) | 3.2 (2.9 to 15.4; 396.2 to 276.8) |
| Operating margin, median % (IQR; range) | 1.5 (4.6 to 6.8; 77.8 to 26.4) | 2.3 (3.9 to 8.2; 134.8 to 21.1) |
| Total margin, median % (IQR; range) | 2.5 (2.2 to 7.5; 101.0 to 26.3) | 4.5 (0.7 to 9.8; 132.2 to 31.1) |
| No. | Median % (IQR) | Adjusted % Change (95% CI) per $50 Million Increase in Net Revenue From Operations | ||
|---|---|---|---|---|
| Overall | Extreme Outliers Excluded | |||
| ||||
| Myocardial infarction | ||||
| Mortality rate | 211 | 15.2 (14.216.2) | 0.07 (0.10 to 0.24) | 0.63 (0.21 to 1.48) |
| Readmission rate | 184 | 19.4 (18.520.2) | Nonlinear | 0.34 (1.17 to 0.50) |
| Congestive heart failure | ||||
| Mortality rate | 259 | 11.1 (10.112.1) | 0.17 (0.01 to 0.35) | Nonlinear∥ |
| Readmission rate | 264 | 24.5 (23.525.6) | 0.07 (0.27 to 0.14) | 0.45 (1.36 to 0.47) |
| Pneumonia | ||||
| Mortality rate | 268 | 11.6 (10.413.2) | 0.17 (0.42 to 0.07) | 0.35 (1.19 to 0.49) |
| Readmission rate | 268 | 18.2 (17.319.1) | 0.04 (0.20 to 0.11) | 0.56 (1.27 to 0.16) |
Relationship Between Financial Performance and Publicly Reported Outcomes
Acute Myocardial Infarction
We did not observe a consistent relationship between hospital financial performance and AMI mortality and readmission rates. In our overall adjusted analyses, net revenue from operations was not associated with mortality, but was significantly associated with a decrease in AMI readmissions among hospitals with net revenue from operations between approximately $5 million to $145 million (nonlinear relationship, F statistic = 4.8, P < 0.001 (Table 2, Figure 1A). However, after excluding 23 extreme outlying hospitals by net revenue from operations (10 underperformers with net revenue <$49.4 million and 13 overperformers with net revenue >$52.1 million), this relationship was no longer observed. Using operating margin instead of net revenue from operations as the measure of hospital financial performance, we observed a 0.2% increase in AMI mortality (95% confidence interval [CI]: 0.06%‐0.35%) (see Supporting Table 1 and Supporting Figure 2 in the online version of this article) for each 10% increase in operating margin, which persisted with the exclusion of 5 outlying hospitals by operating margin (all 5 were underperformers, with operating margins <38.6%). However, using total margin as the measure of financial performance, there was no significant relationship with either mortality or readmissions (see Supporting Table 2 and Supporting Figure 3 in the online version of this article).
Congestive Heart Failure
In our primary analyses, we did not observe a significant relationship between net revenue from operations and CHF mortality and readmission rates. However, after excluding 23 extreme outliers, increasing net revenue from operations was associated with a modest increase in CHF mortality among hospitals, with net revenue between approximately $35 million and $20 million (nonlinear relationship, F statistic = 3.6, P = 0.008 (Table 2, Figure 1B). Using alternate measures of financial performance, we observed a consistent relationship between increasing hospital financial performance and higher 30‐day CHF mortality rate. Using operating margin, we observed a slight increase in the mortality rate for CHF (0.26% increase in CHF RSMR for every 10% increase in operating margin) (95% CI: 0.07%‐0.45%) (see Supporting Table 1 and Supporting Figure 2 in the online version of this article), which persisted after the exclusion of 5 extreme outliers. Using total margin, we observed a significant but modest association between improved hospital financial performance and increased mortality rate for CHF (nonlinear relationship, F statistic = 2.9, P = 0.03) (see Supporting Table 2 and Supporting Figure 3 in the online version of this article), which persisted after the exclusion of 3 extreme outliers (0.32% increase in CHF RSMR for every 10% increase in total margin) (95% CI: 0.03%‐0.62%).
Pneumonia
Hospital financial performance (using net revenue, operating margin, or total margin) was not associated with 30‐day PNA mortality or readmission rates.
Relationship of Readmission and Mortality Rates on Subsequent Hospital Financial Performance
Compared to hospitals in the highest tertile of readmission and mortality rates (ie, those with the worst rates), hospitals in the lowest tertile of readmission and mortality rates (ie, those with the best rates) had a similar magnitude of increase in net revenue from operations from 2008 to 2012 (Table 3). The difference‐in‐differences analyses showed no relationship between readmission or mortality rates for AMI, CHF, and PNA and changes in net revenue from operations from 2008 to 2012 (difference‐in‐differences estimates ranged from $8.61 to $6.77 million, P > 0.3 for all). These results were robust to the exclusion of hospitals with a change in ownership and extreme outliers by net revenue from operations (data not reported).
| Outcome | Tertile With Highest Outcome Rates (Worst Hospitals) | Tertile With Lowest Outcome Rates (Best Hospitals) | Difference in Net From Operations Differences Between Highest and Lowest Outcome Rate Tertiles, $ Million (95% CI) | P | ||
|---|---|---|---|---|---|---|
| Outcome, Median % (IQR) | Gain/Loss in Net Revenue From Operations From 2008 to 2012, $ Million* | Outcome, Median % (IQR) | Gain/Loss in Net Revenue from Operations From 2008 to 2012, $ Million* | |||
| ||||||
| AMI mortality | 16.7 (16.217.4) | +65.62 | 13.8 (13.314.2) | +74.23 | 8.61 (27.95 to 10.73) | 0.38 |
| AMI readmit | 20.7 (20.321.5) | +38.62 | 18.3 (17.718.6) | +31.85 | +6.77 (13.24 to 26.77) | 0.50 |
| CHF mortality | 13.0 (12.313.9) | +45.66 | 9.6 (8.910.1) | +48.60 | 2.94 (11.61 to 5.73) | 0.50 |
| CHF readmit | 26.2 (25.726.9) | +47.08 | 23.0 (22.323.5) | +46.08 | +0.99 (10.51 to 12.50) | 0.87 |
| PNA mortality | 13.9 (13.314.7) | +43.46 | 9.9 (9.310.4) | +38.28 | +5.18 (7.01 to 17.37) | 0.40 |
| PNA readmit | 19.4 (19.120.1) | +47.21 | 17.0 (16.517.3) | +45.45 | +1.76 (8.34 to 11.86) | 0.73 |
DISCUSSION
Using audited financial data from California hospitals in 2008 and 2012, and CMS data on publicly reported outcomes from 2008 to 2011, we found no consistent relationship between hospital financial performance and publicly reported outcomes for AMI and PNA. However, better hospital financial performance was associated with a modest increase in 30‐day risk‐standardized CHF mortality rates, which was consistent across all 3 measures of hospital financial performance. Reassuringly, there was no difference in the change in net revenue from operations between 2008 and 2012 between hospitals in the highest and lowest tertiles of readmission and mortality rates for AMI, CHF, and PNA. In other words, hospitals with the lowest rates of 30‐day readmissions and mortality for AMI, CHF, and PNA did not experience a loss in net revenue from operations over time, compared to hospitals with the highest readmission and mortality rates.
Our study differs in several important ways from Ly et al., the only other study to our knowledge that investigated the relationship between hospital financial performance and outcomes for patients with AMI, CHF, and PNA.[19] First, outcomes in the Ly et al. study were ascertained in 2007, which preceded public reporting of outcomes. Second, the primary comparison was between hospitals in the bottom versus top decile of operating margin. Although Ly and colleagues also found no association between hospital financial performance and mortality rates for these 3 conditions, they found a significant absolute decrease of approximately 3% in readmission rates among hospitals in the top decile of operating margin versus those in bottom decile. However, readmission rates were comparable among the remaining 80% of hospitals, suggesting that these findings primarily reflected the influence of a few outlier hospitals. Third, the use of nonuniformly audited hospital financial data may have resulted in misclassification of financial performance. Our findings also differ from 2 previous studies that identified a modest association between improved hospital financial performance and decreased adverse patient safety events.[18, 20] However, publicly reported outcomes may not be fully representative of hospital quality and patient safety.[28, 29]
The limited association between hospital financial performance and publicly reported outcomes for AMI and PNA is noteworthy for several reasons. First, publicly reporting outcomes alone without concomitant changes to reimbursement may be inadequate to create strong financial incentives for hospital investment in quality improvement initiatives. Hospitals participating in both public reporting of outcomes and pay‐for‐performance have been shown to achieve greater improvements in outcomes than hospitals engaged only in public reporting.[30] Our time interval for ascertainment of outcomes preceded CMS implementation of the Hospital Readmissions Reduction Program (HRRP) in October 2012, which withholds up to 3% of Medicare hospital reimbursements for higher than expected mortality and readmission rates for AMI, CHF, and PNA. Once outcomes data become available for a 3‐year post‐HRRP implementation period, the impact of this combined approach can be assessed. Second, because adherence to many evidence‐based process measures for these conditions (ie, aspirin use in AMI) is already high, there may be a ceiling effect present that obviates the need for further hospital financial investment to optimize delivery of best practices.[31, 32] Third, hospitals themselves may contribute little to variation in mortality and readmission risk. Of the total variation in mortality and readmission rates among Texas Medicare beneficiaries, only about 1% is attributable to hospitals, whereas 42% to 56% of the variation is explained by differences in patient characteristics.[33, 34] Fourth, there is either low‐quality or insufficient evidence that transitional care interventions specifically targeted to patients with AMI or PNA result in better outcomes.[35] Thus, greater financial investment in hospital‐initiated and postdischarge transitional care interventions for these specific conditions may result in less than the desired effect. Lastly, many hospitalizations for these conditions are emergency hospitalizations that occur after patients present to the emergency department with unexpected and potentially life‐threatening symptoms. Thus, patients may not be able to incorporate the reputation or performance metrics of a hospital in their decisions for where they are hospitalized for AMI, CHF, or PNA despite the public reporting of outcomes.
Given the strong evidence that transitional care interventions reduce readmissions and mortality among patients hospitalized with CHF, we were surprised to find that improved hospital financial performance was associated with an increased risk‐adjusted CHF mortality rate.[36] This association held true for all 3 different measures of hospital financial performance, suggesting that this unexpected finding is unlikely to be the result of statistical chance, though potential reasons for this association remain unclear. One possibility is that the CMS model for CHF mortality may not adequately risk adjust for severity of illness.[37, 38] Thus, robust financial performance may be a marker for hospitals with more advanced heart failure services that care for more patients with severe illness.
Our findings should be interpreted in the context of certain limitations. Our study only included an analysis of outcomes for AMI, CHF, and PNA among older fee‐for‐service Medicare beneficiaries aggregated at the hospital level in California between 2008 and 2012, so generalizability to other populations, conditions, states, and time periods is uncertain. The observational design precludes a robust causal inference between financial performance and outcomes. For readmissions, rates were publicly reported for only the last 2 years of the 3‐year reporting period; thus, our findings may underestimate the association between hospital financial performance and publicly reported readmission rates.
CONCLUSION
There is no consistent relationship between hospital financial performance and subsequent publicly reported outcomes for AMI and PNA. However, for unclear reasons, hospitals with better financial performance had modestly higher CHF mortality rates. Given this limited association, public reporting of outcomes may have had less than the intended impact in motivating hospitals to invest in quality improvement. Additional financial incentives in addition to public reporting, such as readmissions penalties, may help motivate hospitals with robust financial performance to further improve outcomes. This would be a key area for future investigation once outcomes data are available for the 3‐year period following CMS implementation of readmissions penalties in 2012. Reassuringly, there was no association between low 30‐day mortality and readmissions rates and subsequent poor financial performance, suggesting that improved outcomes do not necessarily lead to loss of revenue.
Disclosures
Drs. Nguyen, Halm, and Makam were supported in part by the Agency for Healthcare Research and Quality University of Texas Southwestern Center for Patient‐Centered Outcomes Research (1R24HS022418‐01). Drs. Nguyen and Makam received funding from the University of Texas Southwestern KL2 Scholars Program (NIH/NCATS KL2 TR001103). The study sponsors had no role in design and conduct of the study; collection, management, analysis, and interpretation of the data; and preparation, review, or approval of the manuscript. The authors have no conflicts of interest to disclose.
- Centers for Medicare and Medicaid Services. Office of the Actuary. National Health Statistics Group. National Healthcare Expenditures Data. Baltimore, MD; 2013. https://www.cms.gov/Research-Statistics-Data-and-Systems/Statistics-Trends-and-Reports/NationalHealthExpendData/NationalHealthAccountsHistorical.html. Accessed February 16, 2016.
- . Bitter pill: why medical bills are killing us. Time Magazine. February 20, 2013:16–55.
- . Fee‐for‐service will remain a feature of major payment reforms, requiring more changes in Medicare physician payment. Health Aff (Millwood). 2012;31(9):1977–1983.
- , , , et al. The business case for quality: case studies and an analysis. Health Aff (Millwood). 2003;22(2):17–30.
- , , , . Public reporting on quality in the United States and the United Kingdom. Health Aff (Millwood). 2003;22(3):134–148.
- , , , , . The business case for health‐care quality improvement. J Patient Saf. 2013;9(1):44–52.
- , , . Hospital performance reports: impact on quality, market share, and reputation. Health Aff (Millwood). 2005;24(4):1150–1160.
- , , , . The savings illusion—why clinical quality improvement fails to deliver bottom‐line results. N Engl J Med. 2011;365(26):e48.
- , , , , . Hospital Quality: Ingredients for Success—Overview and Lessons Learned. New York, NY: Commonwealth Fund; 2004.
- , , . Hospital Quality Improvement: Strategies and Lessons from U.S. Hospitals. New York, NY: Commonwealth Fund; 2007.
- , , , et al. Hospital financial condition and operational decisions related to the quality of hospital care. Med Care Res Rev. 2007;64(2):148–168.
- , , , , , . Will pay‐for‐performance and quality reporting affect health care disparities? Health Aff (Millwood). 2007;26(3):w405–w414.
- , , . Comparison of change in quality of care between safety‐net and non‐safety‐net hospitals. JAMA. 2008;299(18):2180–2187.
- , . Could Medicare readmission policy exacerbate health care system inequity? Ann Intern Med. 2010;152(2):114–117.
- , . Minding the gap between efforts to reduce readmissions and disparities. JAMA. 2011;305(7):715–716.
- , . Medicare Health Support Pilot Program. N Engl J Med. 2012;366(7):666; author reply 667–668.
- , . Revisiting hospital readmissions. JAMA. 2013;309(4):398–400.
- , . Hospital finances and patient safety outcomes. Inquiry. 2005;42(1):60–72.
- , , . The association between hospital margins, quality of care, and closure or other change in operating status. J Gen Intern Med. 2011;26(11):1291–1296.
- , , , . Hospital financial condition and the quality of patient care. Health Econ. 2008;17(8):977–995.
- State of California Office of Statewide Health Planning and Development. Healthcare Information Division. Annual financial data. Available at: http://www.oshpd.ca.gov/HID/Products/Hospitals/AnnFinanData/PivotProfles/default.asp. Accessed June 23, 2015.
- Centers for Medicare 4(1):11–13.
- , , , et al. Quality of care for acute myocardial infarction at urban safety‐net hospitals. Health Aff (Millwood). 2007;26(1):238–248.
- , , , et al. The Hospital Compare mortality model and the volume‐outcome relationship. Health Serv Res. 2010;45(5 Pt 1):1148–1167.
- . Exploratory Data Analysis. Boston, MA: Addison‐Wesley; 1977.
- , , , et al. Limits of readmission rates in measuring hospital quality suggest the need for added metrics. Health Aff (Millwood). 2013;32(6):1083–1091.
- , , , et al. Hospital performance measures and 30‐day readmission rates. J Gen Intern Med. 2013;28(3):377–385.
- , , , et al. Public reporting and pay for performance in hospital quality improvement. N Engl J Med. 2007;356(5):486–496.
- , , , et al. Usual source of care and outcomes following acute myocardial infarction. J Gen Intern Med. 2014;29(6):862–869.
- , . Public reporting on hospital process improvements is linked to better patient outcomes. Health Aff (Millwood). 2010;29(7):1319–1324.
- , , , . Variation in length of stay and outcomes among hospitalized patients attributable to hospitals and hospitalists. J Gen Intern Med. 2013;28(3):370–376.
- , , , , . Variation in the risk of readmission among hospitals: the relative contribution of patient, hospital and inpatient provider characteristics. J Gen Intern Med. 2014;29(4):572–578.
- , , , et al. Transitional care after hospitalization for acute stroke or myocardial infarction: a systematic review. Ann Intern Med. 2012;157(6):407–416.
- , , , . The inverse relationship between mortality rates and performance in the Hospital Quality Alliance measures. Health Aff (Millwood). 2007;26(4):1104–1110.
- , , , et al. An automated model to identify heart failure patients at risk for 30‐day readmission or death using electronic medical record data. Med Care. 2010;48(11):981–988.
- , , . Indications of biased risk adjustment in the hospital readmission reduction program. J Ambul Care Manage. 2015;38(1):39–47.
