User login
Catheter Use Among Teaching Hospitals
Urinary catheter use can be associated with urinary tract infections, delirium, trauma, and immobility.[1] Evidence‐based strategies to reduce inappropriate use are available[2]; however, their application across centers is variable.[3] We aimed to characterize the prevalence and indication for catheters among Canadian teaching hospitals with and without catheter reduction programs.
METHODS
Twelve of 17 postgraduate internal medicine training program directors agreed to participate, and 9 Canadian teaching hospitals enrolled in this prevalence study of urinary catheter use among medical inpatients. Data collection used a standardized form and took place over 5 consecutive weekdays during August 2015. Each site anonymously collected the total number of catheters, total number of inpatient‐days, and indications for use from either the bedside nurse or physician. Appropriate clinical indications were based on the 2009 guidelines from the Healthcare Infection Control Practice Advisory Committee.[4] Potentially inappropriate indications included urine output measurement in noncritically ill patients, and other or unknown indications.[4, 5] A catheter reduction program was defined as the presence of a structured system to monitor and reduce use via: nurse‐directed catheter removal, audit‐feedback of use to providers, physician reminders, and/or automatic stop orders.
The primary outcome was the number of catheter days per 100 inpatient‐days. We used generalized estimating equations to adjust the 95% confidence interval (CI) and P value to account for hospital‐level clustering of the responses. The P values are from a 2‐tailed Wald test against the true log scale parameter being equal to zero. The analysis was performed using R version 3.0.2 using the geepack package (Free Software Foundation, Boston, MA).
The McGill University Health Centre Research Ethics Board approved this study with concomitant authorization at participating sites.
RESULTS
The characteristics of participating hospitals are displayed in Table 1. Those with active catheter reduction programs reported established systems for monitoring catheter placement, duration, and catheter‐associated urinary tract infections. More than half of the hospitals lacked a catheter reduction program. Overall, catheters were present on 13.6% of patient‐days (range, 2.3%32.4%). Centers without reduction programs reported higher rates of catheter use both overall and for potentially inappropriate indications. After adjustment for clustering, those with a formal intervention had 8.8 fewer catheter days per 100 patient‐days as compared to those without (9.8 [95% CI: 6.0‐15.6] vs 18.6 [95% CI: 13.0‐26.1], P = 0.03). This meant that the odds of a urinary catheter being present were 2 times (95% CI: 1.0‐3.4) greater in hospitals without reduction programs. Differences in appropriate catheter use did not reach statistical significance.
| Characteristic | Hospital | Overall, n (%)* | ||||||||
|---|---|---|---|---|---|---|---|---|---|---|
| A | B | C | D | E | F | G | H | I | ||
| ||||||||||
| Total beds, n | 442 | 533 | 824 | 505 | 272 | 925 | 650 | 777 | 446 | 5,374 |
| Has system in place to monitor urinary catheter placement | Yes | Yes | Yes | Yes | No | No | No | No | No | N/A |
| Has system in place to monitor duration and/or discontinuation of urinary catheters | Yes | Yes | Yes | No | No | No | No | No | No | N/A |
| Has a system in place for monitoring catheter associated urinary tract infection rates | Yes | Yes | Yes | Yes | Yes | Yes | Yes | No | No | N/A |
| Presence of a UC reduction program | Active | Active | Active | Active | No | No | No | No | No | N/A |
| Duration of UC reduction program, y | 1 | 2 | 1 | 1 | N/A | N/A | N/A | N/A | N/A | N/A |
| Total patient‐days | 425 | 455 | 527 | 405 | 87 | 311 | 285 | 394 | 253 | 3142 |
| Total UC days | 27 | 32 | 42 | 77 | 2 | 36 | 48 | 80 | 82 | 426 |
| UC rate per 100 patient‐days | 6.4 | 7.0 | 8.0 | 19.0 | 2.3 | 11.6 | 16.8 | 20.3 | 32.4 | 13.6 |
| Reported historical UC rate per 100 patient‐days∥ | 12.0 | 16.5 | 18.8 | N/A | N/A | N/A | N/A | N/A | N/A | N/A |
| Potentially appropriate indications, n (%) | 19 (70) | 25 (78) | 30 (71) | 36 (47) | 0 | 33 (92) | 27 (56) | 32 (40) | 59 (72) | 261 (61) |
| Obstruction | 5 (19) | 11 (34) | 19 (45) | 7 (9) | 0 | 1 (3) | 10 (21) | 20 (25) | 2 (2) | 75 (17.6) |
| Retention | 10 (37) | 9 (28) | 7 (17) | 21 (27) | 0 | 22 (61) | 9 (19) | 11 (14) | 23 (28) | 112 (26.3) |
| Palliative | 4 (15) | 0 | 4 (10) | 8 (10) | 0 | 10 (28) | 5 (10) | 1 (1) | 16 (20) | 93 (21.8) |
| Sacral ulcer | 0 | 5 (16) | 0 | 0 | 0 | 0 | 3 (6) | 0 | 18 (22) | 26 (6.1) |
| Potentially inappropriate indications, n (%) | 8 (30) | 8 (25) | 12 (28) | 50 (65) | 2 (100) | 3 (8) | 21 (44) | 70 (88) | 16 (20) | 190 (45) |
| Urine output | 2 (7) | 0 | 1 (2) | 22 (14) | 2 (100) | 3 (8) | 11 (23) | 50 (35) | 8 (10) | 96 (22.5) |
| Other | 6 (22) | 8 (25) | 10 (24) | 26 (32) | 0 | 0 | 5 (10) | 13 (16) | 0 | 68 (16.0) |
| Unknown | 0 | 0 | 1 (2) | 2 (3) | 0 | 0 | 5 (10) | 7 (9) | 8 (10) | 23 (5.3) |
DISCUSSION
Despite the availability of consensus guidelines for appropriate use and the efforts of movements like Choosing Wisely, many Canadian teaching hospitals have not yet established a urinary catheter reduction program for medical inpatients. Our findings are similar to 2 non‐Canadian studies, which demonstrated that fewer than half of hospitals had implemented control measures.[4, 6] In contrast to those other studies, our study demonstrated that hospitals that employed control measures had reduced rates of catheter use suggesting that systematic, structured efforts are necessary to improve practice.[7, 8]
Ours is the first nation‐wide study in Canada to report urinary catheter rates and the effect of associated reduction programs. Data from the National Healthcare Safety Network suggest our Canadian estimates of urinary catheter rates in medical inpatients are similar to those of the United States (13.6 vs 14.8 catheter days per 100 inpatient‐days, respectively, for general medical inpatients).[9, 10]
Several limitations of this study warrant discussion. First, we sampled only academic institutions at 1 time point, which may not represent annualized rates or rates in community hospitals. However, our findings are similar to those reported in previous studies.[10] Second, our method of consecutive daily audits may have caused individuals to change their behavior knowing that they were being observed, resulting in lower catheter utilization than would have been otherwise present and biasing our estimates of catheter overuse downward. Third, we collected point prevalence data, limiting our ability to make inferences on causality. The key factor(s) contributing to observed differences between hospitals remains unknown. However, pre‐post intervention data available for 3 hospitals suggest that improvements followed active catheter reduction efforts.[7, 8] Fourth, we were unable to obtain outcome data such as catheter‐associated urinary tract infection, delirium, or fall rates. However, catheter reduction is widely recognized as an important first step to reducing preventable harm for hospital patients.
We suggest that the broader uptake of structured models of care that promote early discontinuation of urinary catheters on medical wards is needed to improve their appropriateness. Fortunately, it appears as though a variety of models are effective. Therefore, when it comes to adopting Choosing Wisely's less is more philosophy toward urinary catheter utilization, we suggest that less time be allowed to pass before more proven and structured interventions are universally implemented.
Acknowledgements
The authors are indebted to John Matelski, MSc, for statistical analyses.
Disclosures: The Canadian Society of Internal Medicine and its Choosing Wisely Canada Subcommittee supported this work. The authors report no conflicts of interest.
- , , , et al. Diagnosis, prevention, and treatment of catheter‐associated urinary tract infection in adults: 2009 international clinical practice guidelines from the Infectious Diseases Society of America. Clin Infect Dis. 2010;50(5):625–663.
- , , , et al. Strategies to prevent catheter‐associated urinary tract infections in acute care hospitals: 2014 update. Infect Control Hosp Epidemiol. 2014;35(5):464–479.
- , , , et al. Preventing catheter‐associated urinary tract infection in the United States: a national comparative study. JAMA Intern Med. 2013;173(10):874–879.
- , , , et al, Healthcare Infection Control Practices Advisory Committee. Guideline for prevention of catheter‐associated urinary tract infections 2009. Infect Control Hosp Epidemiol. 2010;31(4):319–326.
- , , , et al. Are physicians aware of which of their patients have indwelling urinary catheters? Am J Med. 2000;109(6):476–480.
- , , , et al. Adoption of policies to prevent catheter‐associated urinary tract infections in United States intensive care units. Am J Infect Control. 2012;40(8):705–710.
- , , , et al. Medical directive for urinary catheter removal by nurses on general medical wards. JAMA Intern Med. 2016;176(1):113–115.
- , , , et al. Novel low‐resource intervention reduces urinary catheter use and associated urinary tract infections: role of outcome measure bias? Am J Infect Control. 2015;43(4):348–353.
- , , , et al. National Healthcare Safety Network report, data summary for 2013, Device-associated Module. Am J Infect Control. 2015;43(3):206–221.
- , , , et al. Regional variation in urinary catheter use and catheter‐associated urinary tract infection: results from a national collaborative. Infect Control Hosp Epidemiol. 2014;35(suppl 3):S99–S106.
Urinary catheter use can be associated with urinary tract infections, delirium, trauma, and immobility.[1] Evidence‐based strategies to reduce inappropriate use are available[2]; however, their application across centers is variable.[3] We aimed to characterize the prevalence and indication for catheters among Canadian teaching hospitals with and without catheter reduction programs.
METHODS
Twelve of 17 postgraduate internal medicine training program directors agreed to participate, and 9 Canadian teaching hospitals enrolled in this prevalence study of urinary catheter use among medical inpatients. Data collection used a standardized form and took place over 5 consecutive weekdays during August 2015. Each site anonymously collected the total number of catheters, total number of inpatient‐days, and indications for use from either the bedside nurse or physician. Appropriate clinical indications were based on the 2009 guidelines from the Healthcare Infection Control Practice Advisory Committee.[4] Potentially inappropriate indications included urine output measurement in noncritically ill patients, and other or unknown indications.[4, 5] A catheter reduction program was defined as the presence of a structured system to monitor and reduce use via: nurse‐directed catheter removal, audit‐feedback of use to providers, physician reminders, and/or automatic stop orders.
The primary outcome was the number of catheter days per 100 inpatient‐days. We used generalized estimating equations to adjust the 95% confidence interval (CI) and P value to account for hospital‐level clustering of the responses. The P values are from a 2‐tailed Wald test against the true log scale parameter being equal to zero. The analysis was performed using R version 3.0.2 using the geepack package (Free Software Foundation, Boston, MA).
The McGill University Health Centre Research Ethics Board approved this study with concomitant authorization at participating sites.
RESULTS
The characteristics of participating hospitals are displayed in Table 1. Those with active catheter reduction programs reported established systems for monitoring catheter placement, duration, and catheter‐associated urinary tract infections. More than half of the hospitals lacked a catheter reduction program. Overall, catheters were present on 13.6% of patient‐days (range, 2.3%32.4%). Centers without reduction programs reported higher rates of catheter use both overall and for potentially inappropriate indications. After adjustment for clustering, those with a formal intervention had 8.8 fewer catheter days per 100 patient‐days as compared to those without (9.8 [95% CI: 6.0‐15.6] vs 18.6 [95% CI: 13.0‐26.1], P = 0.03). This meant that the odds of a urinary catheter being present were 2 times (95% CI: 1.0‐3.4) greater in hospitals without reduction programs. Differences in appropriate catheter use did not reach statistical significance.
| Characteristic | Hospital | Overall, n (%)* | ||||||||
|---|---|---|---|---|---|---|---|---|---|---|
| A | B | C | D | E | F | G | H | I | ||
| ||||||||||
| Total beds, n | 442 | 533 | 824 | 505 | 272 | 925 | 650 | 777 | 446 | 5,374 |
| Has system in place to monitor urinary catheter placement | Yes | Yes | Yes | Yes | No | No | No | No | No | N/A |
| Has system in place to monitor duration and/or discontinuation of urinary catheters | Yes | Yes | Yes | No | No | No | No | No | No | N/A |
| Has a system in place for monitoring catheter associated urinary tract infection rates | Yes | Yes | Yes | Yes | Yes | Yes | Yes | No | No | N/A |
| Presence of a UC reduction program | Active | Active | Active | Active | No | No | No | No | No | N/A |
| Duration of UC reduction program, y | 1 | 2 | 1 | 1 | N/A | N/A | N/A | N/A | N/A | N/A |
| Total patient‐days | 425 | 455 | 527 | 405 | 87 | 311 | 285 | 394 | 253 | 3142 |
| Total UC days | 27 | 32 | 42 | 77 | 2 | 36 | 48 | 80 | 82 | 426 |
| UC rate per 100 patient‐days | 6.4 | 7.0 | 8.0 | 19.0 | 2.3 | 11.6 | 16.8 | 20.3 | 32.4 | 13.6 |
| Reported historical UC rate per 100 patient‐days∥ | 12.0 | 16.5 | 18.8 | N/A | N/A | N/A | N/A | N/A | N/A | N/A |
| Potentially appropriate indications, n (%) | 19 (70) | 25 (78) | 30 (71) | 36 (47) | 0 | 33 (92) | 27 (56) | 32 (40) | 59 (72) | 261 (61) |
| Obstruction | 5 (19) | 11 (34) | 19 (45) | 7 (9) | 0 | 1 (3) | 10 (21) | 20 (25) | 2 (2) | 75 (17.6) |
| Retention | 10 (37) | 9 (28) | 7 (17) | 21 (27) | 0 | 22 (61) | 9 (19) | 11 (14) | 23 (28) | 112 (26.3) |
| Palliative | 4 (15) | 0 | 4 (10) | 8 (10) | 0 | 10 (28) | 5 (10) | 1 (1) | 16 (20) | 93 (21.8) |
| Sacral ulcer | 0 | 5 (16) | 0 | 0 | 0 | 0 | 3 (6) | 0 | 18 (22) | 26 (6.1) |
| Potentially inappropriate indications, n (%) | 8 (30) | 8 (25) | 12 (28) | 50 (65) | 2 (100) | 3 (8) | 21 (44) | 70 (88) | 16 (20) | 190 (45) |
| Urine output | 2 (7) | 0 | 1 (2) | 22 (14) | 2 (100) | 3 (8) | 11 (23) | 50 (35) | 8 (10) | 96 (22.5) |
| Other | 6 (22) | 8 (25) | 10 (24) | 26 (32) | 0 | 0 | 5 (10) | 13 (16) | 0 | 68 (16.0) |
| Unknown | 0 | 0 | 1 (2) | 2 (3) | 0 | 0 | 5 (10) | 7 (9) | 8 (10) | 23 (5.3) |
DISCUSSION
Despite the availability of consensus guidelines for appropriate use and the efforts of movements like Choosing Wisely, many Canadian teaching hospitals have not yet established a urinary catheter reduction program for medical inpatients. Our findings are similar to 2 non‐Canadian studies, which demonstrated that fewer than half of hospitals had implemented control measures.[4, 6] In contrast to those other studies, our study demonstrated that hospitals that employed control measures had reduced rates of catheter use suggesting that systematic, structured efforts are necessary to improve practice.[7, 8]
Ours is the first nation‐wide study in Canada to report urinary catheter rates and the effect of associated reduction programs. Data from the National Healthcare Safety Network suggest our Canadian estimates of urinary catheter rates in medical inpatients are similar to those of the United States (13.6 vs 14.8 catheter days per 100 inpatient‐days, respectively, for general medical inpatients).[9, 10]
Several limitations of this study warrant discussion. First, we sampled only academic institutions at 1 time point, which may not represent annualized rates or rates in community hospitals. However, our findings are similar to those reported in previous studies.[10] Second, our method of consecutive daily audits may have caused individuals to change their behavior knowing that they were being observed, resulting in lower catheter utilization than would have been otherwise present and biasing our estimates of catheter overuse downward. Third, we collected point prevalence data, limiting our ability to make inferences on causality. The key factor(s) contributing to observed differences between hospitals remains unknown. However, pre‐post intervention data available for 3 hospitals suggest that improvements followed active catheter reduction efforts.[7, 8] Fourth, we were unable to obtain outcome data such as catheter‐associated urinary tract infection, delirium, or fall rates. However, catheter reduction is widely recognized as an important first step to reducing preventable harm for hospital patients.
We suggest that the broader uptake of structured models of care that promote early discontinuation of urinary catheters on medical wards is needed to improve their appropriateness. Fortunately, it appears as though a variety of models are effective. Therefore, when it comes to adopting Choosing Wisely's less is more philosophy toward urinary catheter utilization, we suggest that less time be allowed to pass before more proven and structured interventions are universally implemented.
Acknowledgements
The authors are indebted to John Matelski, MSc, for statistical analyses.
Disclosures: The Canadian Society of Internal Medicine and its Choosing Wisely Canada Subcommittee supported this work. The authors report no conflicts of interest.
- , , , et al. Diagnosis, prevention, and treatment of catheter‐associated urinary tract infection in adults: 2009 international clinical practice guidelines from the Infectious Diseases Society of America. Clin Infect Dis. 2010;50(5):625–663.
- , , , et al. Strategies to prevent catheter‐associated urinary tract infections in acute care hospitals: 2014 update. Infect Control Hosp Epidemiol. 2014;35(5):464–479.
- , , , et al. Preventing catheter‐associated urinary tract infection in the United States: a national comparative study. JAMA Intern Med. 2013;173(10):874–879.
- , , , et al, Healthcare Infection Control Practices Advisory Committee. Guideline for prevention of catheter‐associated urinary tract infections 2009. Infect Control Hosp Epidemiol. 2010;31(4):319–326.
- , , , et al. Are physicians aware of which of their patients have indwelling urinary catheters? Am J Med. 2000;109(6):476–480.
- , , , et al. Adoption of policies to prevent catheter‐associated urinary tract infections in United States intensive care units. Am J Infect Control. 2012;40(8):705–710.
- , , , et al. Medical directive for urinary catheter removal by nurses on general medical wards. JAMA Intern Med. 2016;176(1):113–115.
- , , , et al. Novel low‐resource intervention reduces urinary catheter use and associated urinary tract infections: role of outcome measure bias? Am J Infect Control. 2015;43(4):348–353.
- , , , et al. National Healthcare Safety Network report, data summary for 2013, Device-associated Module. Am J Infect Control. 2015;43(3):206–221.
- , , , et al. Regional variation in urinary catheter use and catheter‐associated urinary tract infection: results from a national collaborative. Infect Control Hosp Epidemiol. 2014;35(suppl 3):S99–S106.
© 2016 Society of Hospital Medicine
Monitor Alarms in a Children's Hospital
Physiologic monitor alarms are an inescapable part of the soundtrack for hospitals. Data from primarily adult hospitals have shown that alarms occur at high rates, and most alarms are not actionable.[1] Small studies have suggested that high alarm rates can lead to alarm fatigue.[2, 3] To prioritize alarm types to target in future intervention studies, in this study we aimed to investigate the alarm rates on all inpatient units and the most common causes of alarms at a children's hospital.
METHODS
This was a cross‐sectional study of audible physiologic monitor alarms at Cincinnati Children's Hospital Medical Center (CCHMC) over 7 consecutive days during August 2014. CCHMC is a 522‐bed free‐standing children's hospital. Inpatient beds are equipped with GE Healthcare (Little Chalfont, United Kingdom) bedside monitors (models Dash 3000, 4000, and 5000, and Solar 8000). Age‐specific vital sign parameters were employed for monitors on all units.
We obtained date, time, and type of alarm from bedside physiologic monitors using Connexall middleware (GlobeStar Systems, Toronto, Ontario, Canada).
We determined unit census using the electronic health records for the time period concurrent with the alarm data collection. Given previously described variation in hospital census over the day,[4] we used 4 daily census measurements (6:00 am, 12:00 pm, 6:00 pm, and 11:00 pm) rather than 1 single measurement to more accurately reflect the hospital census.
The CCHMC Institutional Review Board determined this work to be not human subjects research.
Statistical Analysis
For each unit and each census time interval, we generated a rate based on the number of occupied beds (alarms per patient‐day) resulting in a total of 28 rates (4 census measurement periods per/day 7 days) for each unit over the study period. We used descriptive statistics to summarize alarms per patient‐day by unit. Analysis of variance was used to compare alarm rates between units. For significant main effects, we used Tukey's multiple comparisons tests for all pairwise comparisons to control the type I experiment‐wise error rate. Alarms were then classified by alarm cause (eg, high heart rate). We summarized the cause for all alarms using counts and percentages.
RESULTS
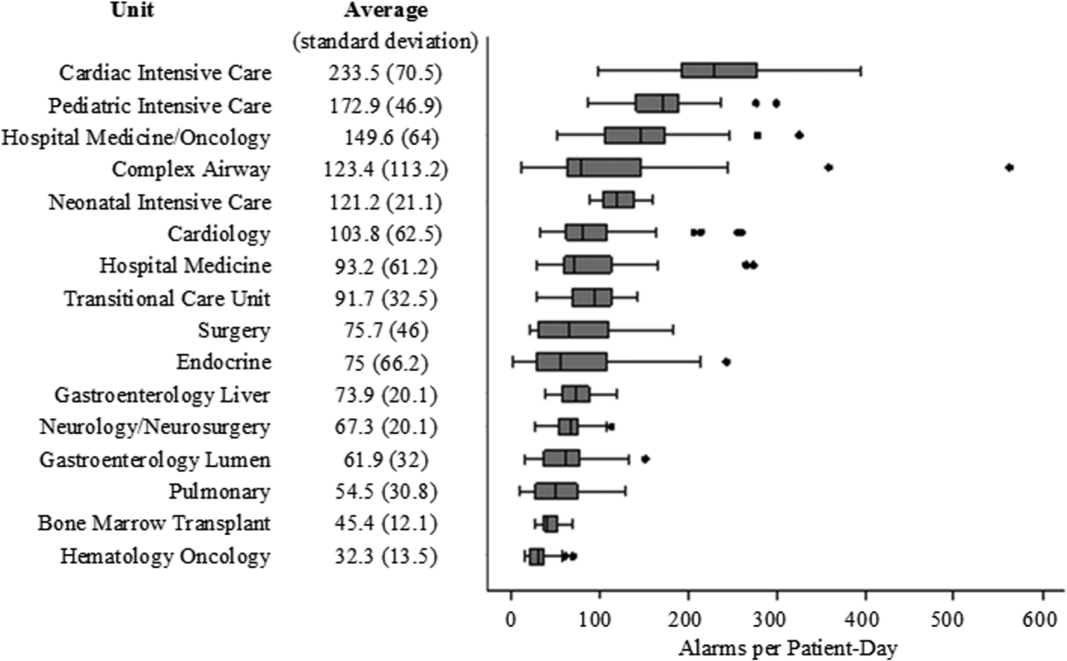
There were a total of 220,813 audible alarms over 1 week. Median alarm rate per patient‐day by unit ranged from 30.4 to 228.5; the highest alarm rates occurred in the cardiac intensive care unit, with a median of 228.5 (interquartile range [IQR], 193275) followed by the pediatric intensive care unit (172.4; IQR, 141188) (Figure 1). The average alarm rate was significantly different among the units (P < 0.01).
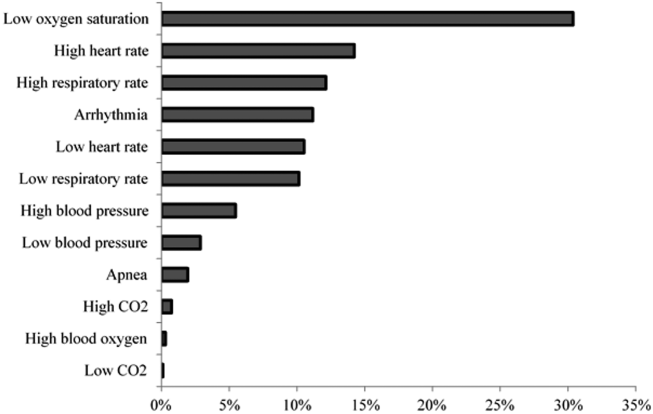
Technical alarms (eg, alarms for artifact, lead failure), comprised 33% of the total number of alarms. The remaining 67% of alarms were for clinical conditions, the most common of which was low oxygen saturation (30% of clinical alarms) (Figure 2).
DISCUSSION
We described alarm rates and causes over multiple units at a large children's hospital. To our knowledge, this is the first description of alarm rates across multiple pediatric inpatient units. Alarm counts were high even for the general units, indicating that a nurse taking care of 4 monitored patients would need to process a physiologic monitor alarm every 4 minutes on average, in addition to other sources of alarms such as infusion pumps.
Alarm rates were highest in the intensive care unit areas, which may be attributable to both higher rates of monitoring and sicker patients. Importantly, however, alarms were quite high and variable on the acute care units. This suggests that factors other than patient acuity may have substantial influence on alarm rates.
Technical alarms, alarms that do not indicate a change in patient condition, accounted for the largest percentage of alarms during the study period. This is consistent with prior literature that has suggested that regular electrode replacement, which decreases technical alarms, can be effective in reducing alarm rates.[5, 6] The most common vital sign change to cause alarms was low oxygen saturation, followed by elevated heart rate and elevated respiratory rate. Whereas in most healthy patients, certain low oxygen levels would prompt initiation of supplemental oxygen, there are many conditions in which elevated heart rate and respiratory rate may not require titration of any particular therapy. These may be potential intervention targets for hospitals trying to improve alarm rates.
Limitations
There are several limitations to our study. First, our results are not necessarily generalizable to other types of hospitals or those utilizing monitors from other vendors. Second, we were unable to include other sources of alarms such as infusion pumps and ventilators. However, given the high alarm rates from physiologic monitors alone, these data add urgency to the need for further investigation in the pediatric setting.
CONCLUSION
Alarm rates at a single children's hospital varied depending on the unit. Strategies targeted at reducing technical alarms and reducing nonactionable clinical alarms for low oxygen saturation, high heart rate, and high respiratory rate may offer the greatest opportunity to reduce alarm rates.
Acknowledgements
The authors acknowledge Melinda Egan for her assistance in obtaining data for this study and Ting Sa for her assistance with data management.
Disclosures: Dr. Bonafide is supported by the National Heart, Lung, and Blood Institute of the National Institutes of Health under award number K23HL116427. Dr. Bonafide also holds a Young Investigator Award grant from the Academic Pediatric Association evaluating the impact of a data‐driven monitor alarm reduction strategy implemented in safety huddles. Dr. Brady is supported by the Agency for Healthcare Research and Quality under award number K08HS23827. The content is solely the responsibility of the authors and does not necessarily represent the official views of the National Institutes of Health or the Agency for Healthcare Research and Quality. This study was funded by the Arnold W. Strauss Fellow Grant, Cincinnati Children's Hospital Medical Center. The authors have no conflicts of interest to disclose.
- , , , et al. Systematic review of physiologic monitor alarm characteristics and pragmatic interventions to reduce alarm frequency. J Hosp Med. 2016;11(2):136–144.
- , , , et al. Association between exposure to nonactionable physiologic monitor alarms and response time in a children's hospital. J Hosp Med. 2015;10(6):345–351.
- , , , et al. Pulse oximetry desaturation alarms on a general postoperative adult unit: a prospective observational study of nurse response time. Int J Nurs Stud. 2013;50(10):1351–1358.
- , , , , . Traditional measures of hospital utilization may not accurately reflect dynamic patient demand: findings from a children's hospital. Hosp Pediatr. 2012;2(1):10–18.
- , , , et al. A team‐based approach to reducing cardiac monitor alarms. Pediatrics. 2014;134(6):e1686–e1694.
- , , , . Daily electrode change and effect on cardiac monitor alarms: an evidence‐based practice approach. J Nurs Care Qual. 2013;28(3):265–271.
Physiologic monitor alarms are an inescapable part of the soundtrack for hospitals. Data from primarily adult hospitals have shown that alarms occur at high rates, and most alarms are not actionable.[1] Small studies have suggested that high alarm rates can lead to alarm fatigue.[2, 3] To prioritize alarm types to target in future intervention studies, in this study we aimed to investigate the alarm rates on all inpatient units and the most common causes of alarms at a children's hospital.
METHODS
This was a cross‐sectional study of audible physiologic monitor alarms at Cincinnati Children's Hospital Medical Center (CCHMC) over 7 consecutive days during August 2014. CCHMC is a 522‐bed free‐standing children's hospital. Inpatient beds are equipped with GE Healthcare (Little Chalfont, United Kingdom) bedside monitors (models Dash 3000, 4000, and 5000, and Solar 8000). Age‐specific vital sign parameters were employed for monitors on all units.
We obtained date, time, and type of alarm from bedside physiologic monitors using Connexall middleware (GlobeStar Systems, Toronto, Ontario, Canada).
We determined unit census using the electronic health records for the time period concurrent with the alarm data collection. Given previously described variation in hospital census over the day,[4] we used 4 daily census measurements (6:00 am, 12:00 pm, 6:00 pm, and 11:00 pm) rather than 1 single measurement to more accurately reflect the hospital census.
The CCHMC Institutional Review Board determined this work to be not human subjects research.
Statistical Analysis
For each unit and each census time interval, we generated a rate based on the number of occupied beds (alarms per patient‐day) resulting in a total of 28 rates (4 census measurement periods per/day 7 days) for each unit over the study period. We used descriptive statistics to summarize alarms per patient‐day by unit. Analysis of variance was used to compare alarm rates between units. For significant main effects, we used Tukey's multiple comparisons tests for all pairwise comparisons to control the type I experiment‐wise error rate. Alarms were then classified by alarm cause (eg, high heart rate). We summarized the cause for all alarms using counts and percentages.
RESULTS
There were a total of 220,813 audible alarms over 1 week. Median alarm rate per patient‐day by unit ranged from 30.4 to 228.5; the highest alarm rates occurred in the cardiac intensive care unit, with a median of 228.5 (interquartile range [IQR], 193275) followed by the pediatric intensive care unit (172.4; IQR, 141188) (Figure 1). The average alarm rate was significantly different among the units (P < 0.01).
Technical alarms (eg, alarms for artifact, lead failure), comprised 33% of the total number of alarms. The remaining 67% of alarms were for clinical conditions, the most common of which was low oxygen saturation (30% of clinical alarms) (Figure 2).
DISCUSSION
We described alarm rates and causes over multiple units at a large children's hospital. To our knowledge, this is the first description of alarm rates across multiple pediatric inpatient units. Alarm counts were high even for the general units, indicating that a nurse taking care of 4 monitored patients would need to process a physiologic monitor alarm every 4 minutes on average, in addition to other sources of alarms such as infusion pumps.
Alarm rates were highest in the intensive care unit areas, which may be attributable to both higher rates of monitoring and sicker patients. Importantly, however, alarms were quite high and variable on the acute care units. This suggests that factors other than patient acuity may have substantial influence on alarm rates.
Technical alarms, alarms that do not indicate a change in patient condition, accounted for the largest percentage of alarms during the study period. This is consistent with prior literature that has suggested that regular electrode replacement, which decreases technical alarms, can be effective in reducing alarm rates.[5, 6] The most common vital sign change to cause alarms was low oxygen saturation, followed by elevated heart rate and elevated respiratory rate. Whereas in most healthy patients, certain low oxygen levels would prompt initiation of supplemental oxygen, there are many conditions in which elevated heart rate and respiratory rate may not require titration of any particular therapy. These may be potential intervention targets for hospitals trying to improve alarm rates.
Limitations
There are several limitations to our study. First, our results are not necessarily generalizable to other types of hospitals or those utilizing monitors from other vendors. Second, we were unable to include other sources of alarms such as infusion pumps and ventilators. However, given the high alarm rates from physiologic monitors alone, these data add urgency to the need for further investigation in the pediatric setting.
CONCLUSION
Alarm rates at a single children's hospital varied depending on the unit. Strategies targeted at reducing technical alarms and reducing nonactionable clinical alarms for low oxygen saturation, high heart rate, and high respiratory rate may offer the greatest opportunity to reduce alarm rates.
Acknowledgements
The authors acknowledge Melinda Egan for her assistance in obtaining data for this study and Ting Sa for her assistance with data management.
Disclosures: Dr. Bonafide is supported by the National Heart, Lung, and Blood Institute of the National Institutes of Health under award number K23HL116427. Dr. Bonafide also holds a Young Investigator Award grant from the Academic Pediatric Association evaluating the impact of a data‐driven monitor alarm reduction strategy implemented in safety huddles. Dr. Brady is supported by the Agency for Healthcare Research and Quality under award number K08HS23827. The content is solely the responsibility of the authors and does not necessarily represent the official views of the National Institutes of Health or the Agency for Healthcare Research and Quality. This study was funded by the Arnold W. Strauss Fellow Grant, Cincinnati Children's Hospital Medical Center. The authors have no conflicts of interest to disclose.
- , , , et al. Systematic review of physiologic monitor alarm characteristics and pragmatic interventions to reduce alarm frequency. J Hosp Med. 2016;11(2):136–144.
- , , , et al. Association between exposure to nonactionable physiologic monitor alarms and response time in a children's hospital. J Hosp Med. 2015;10(6):345–351.
- , , , et al. Pulse oximetry desaturation alarms on a general postoperative adult unit: a prospective observational study of nurse response time. Int J Nurs Stud. 2013;50(10):1351–1358.
- , , , , . Traditional measures of hospital utilization may not accurately reflect dynamic patient demand: findings from a children's hospital. Hosp Pediatr. 2012;2(1):10–18.
- , , , et al. A team‐based approach to reducing cardiac monitor alarms. Pediatrics. 2014;134(6):e1686–e1694.
- , , , . Daily electrode change and effect on cardiac monitor alarms: an evidence‐based practice approach. J Nurs Care Qual. 2013;28(3):265–271.

Readmission Rates and Mortality Measures
The Centers for Medicare & Medicaid Services (CMS) have sought to reduce readmissions in the 30 days following hospital discharge through penalties applied to hospitals with readmission rates that are higher than expected. Expected readmission rates for Medicare fee‐for‐service beneficiaries are calculated from models that use patient‐level administrative data to account for patient morbidities. Readmitted patients are defined as those who are discharged from the hospital alive and then rehospitalized at any acute care facility within 30 days of discharge. These models explicitly exclude sociodemographic variables that may impact quality of and access to outpatient care. Specific exclusions are also applied based on diagnosis codes so as to avoid penalizing hospitals for rehospitalizations that are likely to have been planned.
More recently, a hospital‐wide readmission measure has been developed, which seeks to provide a comprehensive view of each hospital's readmission rate by including the vast majority of Medicare patients. Like the condition‐specific readmission measures, the hospital‐wide readmission measure also excludes sociodemographic variables and incorporates specific condition‐based exclusions so as to avoid counting planned rehospitalizations (e.g., an admission for cholecystectomy following an admission for biliary sepsis). Although not currently used for pay‐for‐performance, this measure has been included in the CMS Star Report along with other readmission measures.[1] CMS does not currently disseminate a hospital‐wide mortality measure, but does disseminate hospital‐level adjusted 30‐day mortality rates for Medicare beneficiaries with discharge diagnoses of stroke, heart failure, myocardial infarction (MI), chronic obstructive pulmonary disease (COPD) and pneumonia, and principal procedure of coronary artery bypass grafting (CABG).
It is conceivable that aggressive efforts to reduce readmissions might delay life‐saving acute care in some scenarios,[2] and there is prior evidence that heart failure readmissions are inversely (but weakly) related to heart failure mortality.[3] It is also plausible that keeping tenuous patients alive until discharge might result in higher readmission rates. We sought to examine the relationship between hospital‐wide adjusted 30‐day readmissions and death rates across the acute care hospitals in the United States. Lacking a measure of hospital‐wide death rates, we examined the relation between hospital‐wide readmissions and each of the 6 condition‐specific mortality measures. For comparison, we also examined the relationships between condition‐specific readmission rates and mortality rates.
METHODS
We used publically available data published by CMS from July 1, 2011 through June 30, 2014.[4] These data are provided at the hospital level, without any patient‐level data. We included 4452 acute care facilities based on having hospital‐wide readmission rates, but not all facilities contributed data for each mortality measure. We excluded from analysis on a measure‐by‐measure basis those facilities for which outcomes were absent, without imputing missing outcome measures, because low volume of a given condition was the main reason for not reporting a measure. For each mortality measure, we constructed a logistic regression model to quantify the odds of performing in the lowest (best) mortality tertile as a function of hospital‐wide readmission tertile. To account for patient volumes, we included in each model the number of eligible patients at each hospital with the specified condition. We repeated these analyses using condition‐specific readmission rates (rather than the hospital‐wide readmission rates) as the independent variable. Specifications for CMS models for mortality and readmissions are publically available.[5]
RESULTS
After adjustment for patient volumes, hospitals in the highest hospital‐wide readmission tertile were more likely to perform in the lowest (best) mortality tertile for 3 of the 6 mortality measures: heart failure, COPD, and stroke (P < 0.001 for all). For MI, CABG and pneumonia, there was no significant association between high hospital‐wide readmission rates and low mortality (Table 1). Using condition‐specific readmission rates, there remained an inverse association between readmissions and mortality for heart failure and stroke, but not for COPD. In contrast, hospitals with the highest CABG‐specific readmission rates were significantly less likely to have low CABG‐specific mortality (P < 0.001).
| Hospital‐Wide Readmission Rate Tertile [Range of Adjusted Readmission Rates, %]* | |||
|---|---|---|---|
|
1st Tertile, n = 1359 [11.3%‐14.8%], Adjusted Odds Ratio (95% CI) |
2nd Tertile, n = 1785 [14.9%‐15.5%], Adjusted Odds Ratio (95% CI) |
3rd Tertile, n = 1308 [15.6%‐19.8%], Adjusted Odds Ratio (95% CI) |
|
| |||
| Mortality measure (no. of hospitals reporting) | |||
| Acute myocardial infarction (n = 2415) | 1.00 (referent) | 0.88 (0.711.09) | 1.02 (0.831.25) |
| Pneumonia (n = 4067) | 1.00 (referent) | 0.83 (0.710.98) | 1.11 (0.941.31) |
| Heart failure (n = 3668) | 1.00 (referent) | 1.21 (1.021.45) | 1.94 (1.632.30) |
| Stroke (n = 2754) | 1.00 (referent) | 1.13 (0.931.38) | 1.48 (1.221.79) |
| Chronic obstructive pulmonary disease (n = 3633) | 1.00 (referent) | 1.12 (0.951.33) | 1.73 (1.462.05) |
| Coronary artery bypass (n = 1058) | 1.00 (referent) | 0.87 (0.631.19) | 0.99 (0.741.34) |
| Condition‐specific readmission rate tertile | |||
| Mortality measure | |||
| Acute myocardial infarction | 1.00 (referent) | 0.88 (0.711.08) | 0.79 (0.640.99) |
| Pneumonia | 1.00 (referent) | 0.91 (0.781.07) | 0.89 (0.761.04) |
| Heart failure | 1.00 (referent) | 1.15 (0.961.36) | 1.56 (1.311.86) |
| Stroke | 1.00 (referent) | 1.65 (1.342.03) | 1.70 (1.232.35) |
| Chronic obstructive pulmonary disease | 1.00 (referent) | 0.83 (0.700.98) | 0.84 (0.710.99) |
| Coronary artery bypass | 1.00 (referent) | 0.59 (0.440.80) | 0.47 (0.340.64) |
DISCUSSION
We found that higher hospital‐wide readmission rates were associated with lower mortality at the hospital level for 3 of the 6 mortality measures we examined. The findings for heart failure parallel the findings of Krumholz and colleagues who examined 3 of these 6 measures (MI, pneumonia, and heart failure) in relation to readmissions for these specific populations.[3] This prior analysis, however, did not include the 3 more recently reported mortality measures (COPD, stroke, and CABG) and did not use hospital‐wide readmissions.
Causal mechanisms underlying the associations between mortality and readmission at the hospital level deserve further exploration. It is certainly possible that global efforts to keep patients out of the hospital might, in some instances, place patients at risk by delaying necessary acute care.[2] It is also possible that unmeasured variables, particularly access to hospice and palliative care services that might facilitate good deaths, could be associated with both reduced readmissions and higher death rates. Additionally, because deceased patients cannot be readmitted, one might expect that readmissions and mortality might be inversely associated, particularly for conditions with a high postdischarge mortality rate. Similarly, a hospital that does a particularly good job keeping chronically ill patients alive until discharge might exhibit a higher readmission rate than a hospital that is less adept at keeping tenuous patients alive until discharge.
Regardless of the mechanisms of these findings, we present these data to raise the concern that using readmission rates, particularly hospital‐wide readmission rates, as a measure of hospital quality is inherently problematic. It is particularly problematic that CMS has applied equal weight to readmissions and mortality in the Star Report.[1] High readmission rates may result from complications and poor handoffs, but may also stem from the legitimate need to care for chronically ill patients in a high‐intensity setting, particularly fragile patients who have been kept alive against the odds. In conclusion, caution is warranted in viewing readmissions as a quality metric until the associations we describe are better explained using patient‐level data and more robust adjustment than is possible with these publically available data.
Disclosures: Dr. Daniel J. Brotman had full access to the data in the study and takes responsibility for the integrity of the data and the accuracy of the data analysis. There was no financial support for this work. Contributions of the authors are as follows: drafting manuscript (Brotman), revision of manuscript for important intellectual content (brotman, Hoyer, Lepley, Deutschendorf, Leung), acquisition of data (Deutschendorf, Leung, Lepley), interpretation of data (Brotman, Hoyer, Lepley, Deutschendorf, Leung), data analysis (Brotman, Hoyer).
- Centers for Medicare and Medicaid Services. Available at: https://www.cms.gov/Outreach-and-Education/Outreach/NPC/Downloads/2015-08-13-Star-Ratings-Presentation.pdf. Accessed September 2015.
- , , , et al. A comprehensive care management program to prevent chronic obstructive pulmonary disease hospitalizations: a randomized, controlled trial. Ann Intern Med. 2012;156(10):673–683.
- , , , et al. Relationship between hospital readmission and mortality rates for patients hospitalized with acute myocardial infarction, heart failure, or pneumonia. JAMA. 2013;309(6):587–593.
- Centers for Medicare and Medicaid Services. Hospital compare datasets. Available at: https://data.medicare.gov/data/hospital‐compare. Accessed September 2015.
- Centers for Medicare and Medicaid Services. Hospital quality initiative. Available at: https://www.cms.gov/Medicare/Quality‐Initiatives‐Patient‐Assessment‐Instruments/HospitalQualityInits. Accessed September 2015.
The Centers for Medicare & Medicaid Services (CMS) have sought to reduce readmissions in the 30 days following hospital discharge through penalties applied to hospitals with readmission rates that are higher than expected. Expected readmission rates for Medicare fee‐for‐service beneficiaries are calculated from models that use patient‐level administrative data to account for patient morbidities. Readmitted patients are defined as those who are discharged from the hospital alive and then rehospitalized at any acute care facility within 30 days of discharge. These models explicitly exclude sociodemographic variables that may impact quality of and access to outpatient care. Specific exclusions are also applied based on diagnosis codes so as to avoid penalizing hospitals for rehospitalizations that are likely to have been planned.
More recently, a hospital‐wide readmission measure has been developed, which seeks to provide a comprehensive view of each hospital's readmission rate by including the vast majority of Medicare patients. Like the condition‐specific readmission measures, the hospital‐wide readmission measure also excludes sociodemographic variables and incorporates specific condition‐based exclusions so as to avoid counting planned rehospitalizations (e.g., an admission for cholecystectomy following an admission for biliary sepsis). Although not currently used for pay‐for‐performance, this measure has been included in the CMS Star Report along with other readmission measures.[1] CMS does not currently disseminate a hospital‐wide mortality measure, but does disseminate hospital‐level adjusted 30‐day mortality rates for Medicare beneficiaries with discharge diagnoses of stroke, heart failure, myocardial infarction (MI), chronic obstructive pulmonary disease (COPD) and pneumonia, and principal procedure of coronary artery bypass grafting (CABG).
It is conceivable that aggressive efforts to reduce readmissions might delay life‐saving acute care in some scenarios,[2] and there is prior evidence that heart failure readmissions are inversely (but weakly) related to heart failure mortality.[3] It is also plausible that keeping tenuous patients alive until discharge might result in higher readmission rates. We sought to examine the relationship between hospital‐wide adjusted 30‐day readmissions and death rates across the acute care hospitals in the United States. Lacking a measure of hospital‐wide death rates, we examined the relation between hospital‐wide readmissions and each of the 6 condition‐specific mortality measures. For comparison, we also examined the relationships between condition‐specific readmission rates and mortality rates.
METHODS
We used publically available data published by CMS from July 1, 2011 through June 30, 2014.[4] These data are provided at the hospital level, without any patient‐level data. We included 4452 acute care facilities based on having hospital‐wide readmission rates, but not all facilities contributed data for each mortality measure. We excluded from analysis on a measure‐by‐measure basis those facilities for which outcomes were absent, without imputing missing outcome measures, because low volume of a given condition was the main reason for not reporting a measure. For each mortality measure, we constructed a logistic regression model to quantify the odds of performing in the lowest (best) mortality tertile as a function of hospital‐wide readmission tertile. To account for patient volumes, we included in each model the number of eligible patients at each hospital with the specified condition. We repeated these analyses using condition‐specific readmission rates (rather than the hospital‐wide readmission rates) as the independent variable. Specifications for CMS models for mortality and readmissions are publically available.[5]
RESULTS
After adjustment for patient volumes, hospitals in the highest hospital‐wide readmission tertile were more likely to perform in the lowest (best) mortality tertile for 3 of the 6 mortality measures: heart failure, COPD, and stroke (P < 0.001 for all). For MI, CABG and pneumonia, there was no significant association between high hospital‐wide readmission rates and low mortality (Table 1). Using condition‐specific readmission rates, there remained an inverse association between readmissions and mortality for heart failure and stroke, but not for COPD. In contrast, hospitals with the highest CABG‐specific readmission rates were significantly less likely to have low CABG‐specific mortality (P < 0.001).
| Hospital‐Wide Readmission Rate Tertile [Range of Adjusted Readmission Rates, %]* | |||
|---|---|---|---|
|
1st Tertile, n = 1359 [11.3%‐14.8%], Adjusted Odds Ratio (95% CI) |
2nd Tertile, n = 1785 [14.9%‐15.5%], Adjusted Odds Ratio (95% CI) |
3rd Tertile, n = 1308 [15.6%‐19.8%], Adjusted Odds Ratio (95% CI) |
|
| |||
| Mortality measure (no. of hospitals reporting) | |||
| Acute myocardial infarction (n = 2415) | 1.00 (referent) | 0.88 (0.711.09) | 1.02 (0.831.25) |
| Pneumonia (n = 4067) | 1.00 (referent) | 0.83 (0.710.98) | 1.11 (0.941.31) |
| Heart failure (n = 3668) | 1.00 (referent) | 1.21 (1.021.45) | 1.94 (1.632.30) |
| Stroke (n = 2754) | 1.00 (referent) | 1.13 (0.931.38) | 1.48 (1.221.79) |
| Chronic obstructive pulmonary disease (n = 3633) | 1.00 (referent) | 1.12 (0.951.33) | 1.73 (1.462.05) |
| Coronary artery bypass (n = 1058) | 1.00 (referent) | 0.87 (0.631.19) | 0.99 (0.741.34) |
| Condition‐specific readmission rate tertile | |||
| Mortality measure | |||
| Acute myocardial infarction | 1.00 (referent) | 0.88 (0.711.08) | 0.79 (0.640.99) |
| Pneumonia | 1.00 (referent) | 0.91 (0.781.07) | 0.89 (0.761.04) |
| Heart failure | 1.00 (referent) | 1.15 (0.961.36) | 1.56 (1.311.86) |
| Stroke | 1.00 (referent) | 1.65 (1.342.03) | 1.70 (1.232.35) |
| Chronic obstructive pulmonary disease | 1.00 (referent) | 0.83 (0.700.98) | 0.84 (0.710.99) |
| Coronary artery bypass | 1.00 (referent) | 0.59 (0.440.80) | 0.47 (0.340.64) |
DISCUSSION
We found that higher hospital‐wide readmission rates were associated with lower mortality at the hospital level for 3 of the 6 mortality measures we examined. The findings for heart failure parallel the findings of Krumholz and colleagues who examined 3 of these 6 measures (MI, pneumonia, and heart failure) in relation to readmissions for these specific populations.[3] This prior analysis, however, did not include the 3 more recently reported mortality measures (COPD, stroke, and CABG) and did not use hospital‐wide readmissions.
Causal mechanisms underlying the associations between mortality and readmission at the hospital level deserve further exploration. It is certainly possible that global efforts to keep patients out of the hospital might, in some instances, place patients at risk by delaying necessary acute care.[2] It is also possible that unmeasured variables, particularly access to hospice and palliative care services that might facilitate good deaths, could be associated with both reduced readmissions and higher death rates. Additionally, because deceased patients cannot be readmitted, one might expect that readmissions and mortality might be inversely associated, particularly for conditions with a high postdischarge mortality rate. Similarly, a hospital that does a particularly good job keeping chronically ill patients alive until discharge might exhibit a higher readmission rate than a hospital that is less adept at keeping tenuous patients alive until discharge.
Regardless of the mechanisms of these findings, we present these data to raise the concern that using readmission rates, particularly hospital‐wide readmission rates, as a measure of hospital quality is inherently problematic. It is particularly problematic that CMS has applied equal weight to readmissions and mortality in the Star Report.[1] High readmission rates may result from complications and poor handoffs, but may also stem from the legitimate need to care for chronically ill patients in a high‐intensity setting, particularly fragile patients who have been kept alive against the odds. In conclusion, caution is warranted in viewing readmissions as a quality metric until the associations we describe are better explained using patient‐level data and more robust adjustment than is possible with these publically available data.
Disclosures: Dr. Daniel J. Brotman had full access to the data in the study and takes responsibility for the integrity of the data and the accuracy of the data analysis. There was no financial support for this work. Contributions of the authors are as follows: drafting manuscript (Brotman), revision of manuscript for important intellectual content (brotman, Hoyer, Lepley, Deutschendorf, Leung), acquisition of data (Deutschendorf, Leung, Lepley), interpretation of data (Brotman, Hoyer, Lepley, Deutschendorf, Leung), data analysis (Brotman, Hoyer).
- Centers for Medicare and Medicaid Services. Available at: https://www.cms.gov/Outreach-and-Education/Outreach/NPC/Downloads/2015-08-13-Star-Ratings-Presentation.pdf. Accessed September 2015.
- , , , et al. A comprehensive care management program to prevent chronic obstructive pulmonary disease hospitalizations: a randomized, controlled trial. Ann Intern Med. 2012;156(10):673–683.
- , , , et al. Relationship between hospital readmission and mortality rates for patients hospitalized with acute myocardial infarction, heart failure, or pneumonia. JAMA. 2013;309(6):587–593.
- Centers for Medicare and Medicaid Services. Hospital compare datasets. Available at: https://data.medicare.gov/data/hospital‐compare. Accessed September 2015.
- Centers for Medicare and Medicaid Services. Hospital quality initiative. Available at: https://www.cms.gov/Medicare/Quality‐Initiatives‐Patient‐Assessment‐Instruments/HospitalQualityInits. Accessed September 2015.
Medicare Insurance Reduces Cost
Up to 10% of the acutely ill patients in hospitals today are not admitted, but cared for under outpatient observation.[1, 2] Hospitals use observation services to replace inpatient services for patients who do not meet inpatient illness standards. Use of this technique for Medicare beneficiaries has grown in recent years, and future policy changes may further increase the percentage of hospital stays classified as observation.[3, 4]
Increased use of observation services has cost‐sharing implications for Medicare beneficiaries. Because hospital observation stays are paid through Medicare's outpatient (Part B) rather than inpatient (Part A) benefit, beneficiaries do not have an out‐of‐pocket maximum per hospital stay.[3] Although prior analyses documented mean out‐of‐pocket costs of $400 to $600 per stay, out‐of‐pocket costs may exceed the Part A deductible and leave beneficiaries responsible for hospital costs that may have been reimbursed by Part A in an inpatient stay.[5, 6, 7] Approximately 6% to 10% of Medicare observation stays result in out‐of‐pocket costs exceeding the Part A deductible nationally, and recent work in this journal documented that 26.6% of beneficiaries with repeat observation stays within a 60‐day period may pay more than the 1‐time deductible‐based payment that beneficiaries are responsible for under Medicare Part A.[5, 6, 7]
However, prior analyses of beneficiary out‐of‐pocket costs did not account for supplemental insurance payments. Approximately 80% to 90% of fee‐for‐service Medicare beneficiaries who use either a private (Medigap or employer based) or state‐based (Medicaid or other plans) supplemental insurance plan.[8, 9, 10] The effect of supplemental insurance on out‐of‐pocket costs has been documented for inpatient stays, yet has not been explored for observation stays.[9] We sought to describe Medicare beneficiaries' out‐of‐pocket costs by accounting for payments from all insurers.
METHODS
We obtained payment data from 2 affiliated hospitals for all Medicare observation hospital stays between April 2013 and March 2014. Stays insured by Medicare Advantage plans (Part C) were excluded, and charges from skilled nursing facility (SNF) stays were not available. Although the exact origin of each stay was not available, the majority of stays at these hospitals came from emergency visits, direct placement from outpatient providers, and postoutpatient procedural monitoring. The dataset included charges, insurance adjustments and payments from all sources, diagnoses, and demographics. Insurance adjustments represented the reductions applied to total stay charges by each insurer in congruence with their contract with the health system. Our dataset included charges for all hospital materials and services usually billed under Part A, including medications. Out‐of‐pocket costs were calculated by subtracting insurance adjustments and payments from the total charges for each stay. To identify potential cost‐shifting from Medicare to beneficiaries, we compared out‐of‐pocket costs to the Part A deductible ($1184 for stays in 2013 and $1216 for 2014). Household income data were estimated using zip code and Internal Revenue Service data for 2013.[11]
The University of California Los Angeles institutional review board approved this study. Statistical significance was calculated using a 2‐tailed unpaired t test for means and 2 for percentages.
RESULTS
There were 2029 total observation stays during the study period, representing 5.0% of all discharges from both hospitals. Medicare beneficiaries accounted for 722 of those observation stays. Among the 498 finalized Medicare observation stays, the median patient age was 73 years, and median household income was $50,591. The median length of stay was 25 hours, with 1.8% of stays lasting longer than 2 midnights. Seventy percent of beneficiaries had private supplemental insurance, whereas 6% had state‐based supplemental plans. Table 1 presents detailed costs. Out‐of‐pocket costs ranged from $0 to $16,196. Stays without supplemental insurance had mean and median out of pocket costs of $537 and $286, respectively. The mean out‐of‐pocket costs for stays with private supplemental insurance decreased to $45 (P < 0.01) and $168 (P = 0.21) for stays with state‐based supplemental insurance, with a median below $1 for both. On average, beneficiaries without supplemental insurance were responsible for $654 less than the Part A deductible. Thirteen beneficiaries had multiple finalized stays within 60 days, with a mean out‐of‐pocket cost of $119, median of $20, and 1 stay produced an out‐of‐pocket cost exceeding the Part A deductible. An additional 224 Medicare stays not finalized because of missing supplemental payments had a mean out‐of‐pocket cost of $125 (P < 0.01) and median of $5 after applying supplemental insurer adjustments (not shown in Table 1).
| Medicare Stays, N = 498 | |||
|---|---|---|---|
| Mean (SD) | Median (IQR) | Range | |
| |||
| Payments by Medicare | $2,533 (2,883) | $1521 (1,898) | $4$29,633 |
| Payments by supplemental insurers | |||
| Private insurers (N = 351) | $454 (384) | $324 (332) | $0$2,590 |
| State‐based insurers (N = 29) | $222(402) | $43 (102) | $2$1,229 |
| Beneficiary out‐of‐pocket costs | |||
| Without supplemental insurer (N = 118) | $537 (1,557) | $286 (440) | $0$16,196* |
| With private supplemental insurer (N = 351) | $45 (414) | $0.39 (16) | $0$7,670* |
| With state‐based supplemental insurer (N = 29) | $168 (412) | $0.15 (27) | $01,870* |
A minority of observation stays produced out‐of‐pocket costs exceeding the Part A deductible. Those percentages were 7.6% for stays without a supplemental insurer, 3.5% (P < 0.01) for stays with a state‐based supplemental insurer, and 0.3% (P < 0.01) for stays with a private supplemental insurer. Of the 224 nonfinalized Medicare stays, 1.3% (P < 0.01) exceeded the Part A deductible after supplemental insurer adjustments.
DISCUSSION
This study demonstrates that supplemental insurance can dramatically reduce Medicare beneficiaries' out‐of‐pocket costs in observation services. Mean out‐of‐pocket costs of $45 and $168 for stays with private and state‐based supplemental insurer plans are significantly lower than prior estimates calculated without supplemental insurance information, as are the percentages of stays with out‐of‐pocket costs exceeding the Part A deductible, at 0.3% and 3.5%, respectively.[5, 6, 7] Because the majority of Medicare beneficiaries use supplemental insurance, excessive out‐of‐pockets in observation services may occur less frequently than previously reported.[9, 10] Clinicians concerned about excessive out‐of‐pocket costs for Medicare beneficiaries can be reassured they are usually modest for beneficiaries with supplemental insurance.
This study's mean out‐of‐pocket cost and percentage of stays with out‐of‐pocket costs exceeding the Part A deductible for beneficiaries without supplemental insurance are similar to results from prior national analyses performed without supplemental insurer information.[5, 6, 7] But this study was limited by a small sample size from 2 affiliated hospitals, with few repeat observation stays within a 60‐day period. In addition, posthospitalization SNF fees were not included, which traditionally have been a significant source of out‐of‐pocket costs in observation services.[3, 7] Populations with supplemental insurance treated elsewhere may incur hospital out‐of‐pocket costs differing from these results due to dissimilarities in the presence and quality of supplemental insurance.
However, most Medigap plans are federally regulated to cover the majority of out‐of‐pockets unpaid by Medicare.[12] Medicaid plans usually place limits on out‐of‐pocket costs, and any other state or employer‐based supplemental plans will also reduce out‐of‐pocket costs.[13] Thus, it is likely accurate to assume mean observation services out‐of‐pocket costs for hospital fees are lower than previously reported by national analyses performed without supplemental insurance information. Attempts at estimating beneficiary out‐of‐pocket costs in the future should account for supplemental insurance adjustments and payments.
Acknowledgements
The authors thank Andrew Kaufman for his work in obtaining these data.
Disclosures: Dr. Doyle's time was supported by a National Research Service Award from the National Institutes of Health and administered through the University of California Los Angeles. Drs. Ettner and Nuckols received no support for this work. There are no conflicts of interest to report.
- , , , et al. Hospitalized but not admitted: characteristics of patients with “observation status” at an academic medical center. JAMA Intern Med. 2013;173(21):1991–1998.
- , , . Final report observation status related to hospital records. Available at: https://www.hcup‐us.ahrq.gov/reports/methods/FinalReportonObservationStatus_v2Final.pdf. Published September 27, 2002.
- . The two‐midnight rule. Health Policy Briefs. Health Affairs website. Available at: http://www.healthaffairs.org/healthpolicybriefs/brief.php?brief_id=133. Published January 22, 2015.
- , , . Sharp rise in Medicare enrollees being held in hospitals for observation raises concerns about causes and consequences. Health Aff (Millwood). 2012;31(6):1251–1259.
- , , , , . Patient financial responsibility for observation care. J Hosp Med. 2015;10(11):718–723.
- , , L. . Observation status: Financial Implications for Medicare Beneficiaries. AARP Public Policy Institute. Available at: http://www.aarp.org/content/dam/aarp/ppi/2015/Hosp Obs Financial Impact Paper.pdf. Published April 2015.
- . Hospitals' use of observation stays and short inpatient stays for Medicare beneficiaries. Department of Health and Human Services. Office of Inspector General. Available at: https://oig.hhs.gov/oei/reports/oei‐02‐12‐00040.pdf. Published July 29, 2013.
- . Trends in Medicare supplemental insurance and prescription drug benefits, 1996–2001: Data update. Available at: http://www.kff.org/medicare/upload/Trends‐in‐Medicare‐Supplemental‐Insurance‐and‐Prescription‐Drug‐Benefits‐1996–2001Data‐Update.pdf.
- . Medicare beneficiaries' out‐of‐pocket spending for health care. AARP Public Policy Institute. Available at: http://www.aarp.org/content/dam/aarp/research/public_policy_institute/health/medicare‐beneficiaries‐out‐of‐pocket‐spending‐AARP‐ppi‐health.pdf. Published May 2012.
- , , , et al. A primer on Medicare: key facts about the Medicare program and the people it covers. What types of supplemental insurance do beneficiaries have? Kaiser Family Foundation website. Available at: http://kff.org/report‐section/a‐primer‐on‐medicare‐what‐types‐of‐supplemental‐insurance‐do‐beneficiaries‐have. Published March 20, 2015.
- SOI tax stats—individual income tax statistics—ZIP code data (SOI). Available at: https://www.irs.gov/uac/SOI‐Tax‐Stats‐Individual‐Income‐Tax‐Statistics‐ZIP‐Code‐Data‐(SOI). Accessed January 1, 2016.
- How to compare Medigap policies. Medicare.gov website. Available at: https://www.medicare.gov/supplement‐other‐insurance/compare‐medigap/compare‐medigap.html.
- Cost sharing out of pocket costs. Medicaid.gov website. Available at: https://www.medicaid.gov/medicaid‐chip‐program‐information/by‐topics/cost‐sharing/cost‐sharing‐out‐of‐pocket‐costs.html. Accessed January 26, 2016.
- , , . Balancing margin and mission: hospitals alter billing and collection practices for uninsured patients. Issue Brief Cent Stud Health Syst Change. 2005;(99):1–4.
Up to 10% of the acutely ill patients in hospitals today are not admitted, but cared for under outpatient observation.[1, 2] Hospitals use observation services to replace inpatient services for patients who do not meet inpatient illness standards. Use of this technique for Medicare beneficiaries has grown in recent years, and future policy changes may further increase the percentage of hospital stays classified as observation.[3, 4]
Increased use of observation services has cost‐sharing implications for Medicare beneficiaries. Because hospital observation stays are paid through Medicare's outpatient (Part B) rather than inpatient (Part A) benefit, beneficiaries do not have an out‐of‐pocket maximum per hospital stay.[3] Although prior analyses documented mean out‐of‐pocket costs of $400 to $600 per stay, out‐of‐pocket costs may exceed the Part A deductible and leave beneficiaries responsible for hospital costs that may have been reimbursed by Part A in an inpatient stay.[5, 6, 7] Approximately 6% to 10% of Medicare observation stays result in out‐of‐pocket costs exceeding the Part A deductible nationally, and recent work in this journal documented that 26.6% of beneficiaries with repeat observation stays within a 60‐day period may pay more than the 1‐time deductible‐based payment that beneficiaries are responsible for under Medicare Part A.[5, 6, 7]
However, prior analyses of beneficiary out‐of‐pocket costs did not account for supplemental insurance payments. Approximately 80% to 90% of fee‐for‐service Medicare beneficiaries who use either a private (Medigap or employer based) or state‐based (Medicaid or other plans) supplemental insurance plan.[8, 9, 10] The effect of supplemental insurance on out‐of‐pocket costs has been documented for inpatient stays, yet has not been explored for observation stays.[9] We sought to describe Medicare beneficiaries' out‐of‐pocket costs by accounting for payments from all insurers.
METHODS
We obtained payment data from 2 affiliated hospitals for all Medicare observation hospital stays between April 2013 and March 2014. Stays insured by Medicare Advantage plans (Part C) were excluded, and charges from skilled nursing facility (SNF) stays were not available. Although the exact origin of each stay was not available, the majority of stays at these hospitals came from emergency visits, direct placement from outpatient providers, and postoutpatient procedural monitoring. The dataset included charges, insurance adjustments and payments from all sources, diagnoses, and demographics. Insurance adjustments represented the reductions applied to total stay charges by each insurer in congruence with their contract with the health system. Our dataset included charges for all hospital materials and services usually billed under Part A, including medications. Out‐of‐pocket costs were calculated by subtracting insurance adjustments and payments from the total charges for each stay. To identify potential cost‐shifting from Medicare to beneficiaries, we compared out‐of‐pocket costs to the Part A deductible ($1184 for stays in 2013 and $1216 for 2014). Household income data were estimated using zip code and Internal Revenue Service data for 2013.[11]
The University of California Los Angeles institutional review board approved this study. Statistical significance was calculated using a 2‐tailed unpaired t test for means and 2 for percentages.
RESULTS
There were 2029 total observation stays during the study period, representing 5.0% of all discharges from both hospitals. Medicare beneficiaries accounted for 722 of those observation stays. Among the 498 finalized Medicare observation stays, the median patient age was 73 years, and median household income was $50,591. The median length of stay was 25 hours, with 1.8% of stays lasting longer than 2 midnights. Seventy percent of beneficiaries had private supplemental insurance, whereas 6% had state‐based supplemental plans. Table 1 presents detailed costs. Out‐of‐pocket costs ranged from $0 to $16,196. Stays without supplemental insurance had mean and median out of pocket costs of $537 and $286, respectively. The mean out‐of‐pocket costs for stays with private supplemental insurance decreased to $45 (P < 0.01) and $168 (P = 0.21) for stays with state‐based supplemental insurance, with a median below $1 for both. On average, beneficiaries without supplemental insurance were responsible for $654 less than the Part A deductible. Thirteen beneficiaries had multiple finalized stays within 60 days, with a mean out‐of‐pocket cost of $119, median of $20, and 1 stay produced an out‐of‐pocket cost exceeding the Part A deductible. An additional 224 Medicare stays not finalized because of missing supplemental payments had a mean out‐of‐pocket cost of $125 (P < 0.01) and median of $5 after applying supplemental insurer adjustments (not shown in Table 1).
| Medicare Stays, N = 498 | |||
|---|---|---|---|
| Mean (SD) | Median (IQR) | Range | |
| |||
| Payments by Medicare | $2,533 (2,883) | $1521 (1,898) | $4$29,633 |
| Payments by supplemental insurers | |||
| Private insurers (N = 351) | $454 (384) | $324 (332) | $0$2,590 |
| State‐based insurers (N = 29) | $222(402) | $43 (102) | $2$1,229 |
| Beneficiary out‐of‐pocket costs | |||
| Without supplemental insurer (N = 118) | $537 (1,557) | $286 (440) | $0$16,196* |
| With private supplemental insurer (N = 351) | $45 (414) | $0.39 (16) | $0$7,670* |
| With state‐based supplemental insurer (N = 29) | $168 (412) | $0.15 (27) | $01,870* |
A minority of observation stays produced out‐of‐pocket costs exceeding the Part A deductible. Those percentages were 7.6% for stays without a supplemental insurer, 3.5% (P < 0.01) for stays with a state‐based supplemental insurer, and 0.3% (P < 0.01) for stays with a private supplemental insurer. Of the 224 nonfinalized Medicare stays, 1.3% (P < 0.01) exceeded the Part A deductible after supplemental insurer adjustments.
DISCUSSION
This study demonstrates that supplemental insurance can dramatically reduce Medicare beneficiaries' out‐of‐pocket costs in observation services. Mean out‐of‐pocket costs of $45 and $168 for stays with private and state‐based supplemental insurer plans are significantly lower than prior estimates calculated without supplemental insurance information, as are the percentages of stays with out‐of‐pocket costs exceeding the Part A deductible, at 0.3% and 3.5%, respectively.[5, 6, 7] Because the majority of Medicare beneficiaries use supplemental insurance, excessive out‐of‐pockets in observation services may occur less frequently than previously reported.[9, 10] Clinicians concerned about excessive out‐of‐pocket costs for Medicare beneficiaries can be reassured they are usually modest for beneficiaries with supplemental insurance.
This study's mean out‐of‐pocket cost and percentage of stays with out‐of‐pocket costs exceeding the Part A deductible for beneficiaries without supplemental insurance are similar to results from prior national analyses performed without supplemental insurer information.[5, 6, 7] But this study was limited by a small sample size from 2 affiliated hospitals, with few repeat observation stays within a 60‐day period. In addition, posthospitalization SNF fees were not included, which traditionally have been a significant source of out‐of‐pocket costs in observation services.[3, 7] Populations with supplemental insurance treated elsewhere may incur hospital out‐of‐pocket costs differing from these results due to dissimilarities in the presence and quality of supplemental insurance.
However, most Medigap plans are federally regulated to cover the majority of out‐of‐pockets unpaid by Medicare.[12] Medicaid plans usually place limits on out‐of‐pocket costs, and any other state or employer‐based supplemental plans will also reduce out‐of‐pocket costs.[13] Thus, it is likely accurate to assume mean observation services out‐of‐pocket costs for hospital fees are lower than previously reported by national analyses performed without supplemental insurance information. Attempts at estimating beneficiary out‐of‐pocket costs in the future should account for supplemental insurance adjustments and payments.
Acknowledgements
The authors thank Andrew Kaufman for his work in obtaining these data.
Disclosures: Dr. Doyle's time was supported by a National Research Service Award from the National Institutes of Health and administered through the University of California Los Angeles. Drs. Ettner and Nuckols received no support for this work. There are no conflicts of interest to report.
- , , , et al. Hospitalized but not admitted: characteristics of patients with “observation status” at an academic medical center. JAMA Intern Med. 2013;173(21):1991–1998.
- , , . Final report observation status related to hospital records. Available at: https://www.hcup‐us.ahrq.gov/reports/methods/FinalReportonObservationStatus_v2Final.pdf. Published September 27, 2002.
- . The two‐midnight rule. Health Policy Briefs. Health Affairs website. Available at: http://www.healthaffairs.org/healthpolicybriefs/brief.php?brief_id=133. Published January 22, 2015.
- , , . Sharp rise in Medicare enrollees being held in hospitals for observation raises concerns about causes and consequences. Health Aff (Millwood). 2012;31(6):1251–1259.
- , , , , . Patient financial responsibility for observation care. J Hosp Med. 2015;10(11):718–723.
- , , L. . Observation status: Financial Implications for Medicare Beneficiaries. AARP Public Policy Institute. Available at: http://www.aarp.org/content/dam/aarp/ppi/2015/Hosp Obs Financial Impact Paper.pdf. Published April 2015.
- . Hospitals' use of observation stays and short inpatient stays for Medicare beneficiaries. Department of Health and Human Services. Office of Inspector General. Available at: https://oig.hhs.gov/oei/reports/oei‐02‐12‐00040.pdf. Published July 29, 2013.
- . Trends in Medicare supplemental insurance and prescription drug benefits, 1996–2001: Data update. Available at: http://www.kff.org/medicare/upload/Trends‐in‐Medicare‐Supplemental‐Insurance‐and‐Prescription‐Drug‐Benefits‐1996–2001Data‐Update.pdf.
- . Medicare beneficiaries' out‐of‐pocket spending for health care. AARP Public Policy Institute. Available at: http://www.aarp.org/content/dam/aarp/research/public_policy_institute/health/medicare‐beneficiaries‐out‐of‐pocket‐spending‐AARP‐ppi‐health.pdf. Published May 2012.
- , , , et al. A primer on Medicare: key facts about the Medicare program and the people it covers. What types of supplemental insurance do beneficiaries have? Kaiser Family Foundation website. Available at: http://kff.org/report‐section/a‐primer‐on‐medicare‐what‐types‐of‐supplemental‐insurance‐do‐beneficiaries‐have. Published March 20, 2015.
- SOI tax stats—individual income tax statistics—ZIP code data (SOI). Available at: https://www.irs.gov/uac/SOI‐Tax‐Stats‐Individual‐Income‐Tax‐Statistics‐ZIP‐Code‐Data‐(SOI). Accessed January 1, 2016.
- How to compare Medigap policies. Medicare.gov website. Available at: https://www.medicare.gov/supplement‐other‐insurance/compare‐medigap/compare‐medigap.html.
- Cost sharing out of pocket costs. Medicaid.gov website. Available at: https://www.medicaid.gov/medicaid‐chip‐program‐information/by‐topics/cost‐sharing/cost‐sharing‐out‐of‐pocket‐costs.html. Accessed January 26, 2016.
- , , . Balancing margin and mission: hospitals alter billing and collection practices for uninsured patients. Issue Brief Cent Stud Health Syst Change. 2005;(99):1–4.
Outpatient Parenteral Therapy in PWID
Injection drug use (IDU) is a major public health problem leading to increased morbidity, mortality, and healthcare expenditures.[1, 2, 3] Persons who inject drugs (PWID) are often hospitalized with severe infections, such as endocarditis,[4, 5] which typically require prolonged courses of intravenous (IV) antibiotics. Outpatient parenteral antibiotic therapy (OPAT) via a peripherally inserted central catheter (PICC) is the standard of care for continuing IV medications once patients are medically stable and ready for discharge.[6] PWID have been excluded from OPAT studies,[6] leaving little evidence to guide care.[7] Furthermore, likely due to fears of ongoing IDU, PWID are often kept in the hospital for the full duration of their antibiotic courses. This practice is costly and may not be optimal, especially considering that hospitalized PWID have high rates of discharges against medical advice.[8, 9]
In 2012, as part of a quality‐improvement effort focused on hospitalized PWID requiring long courses of IV antibiotics, UKHealthCare in Lexington, Kentucky, established a protocol for OPAT in PWID meeting specific criteria. As this protocol was not widely adopted, we sought to formally assess attitudes, practices, and mediating factors impacting the decision making about discharging PWID on OPAT to inform future efforts. This study was approved by the University of Kentucky (UK) Institutional Review Board.
METHODS
A 14‐item survey (see Supporting Information, Appendix, in the online version of this article) with multiple‐choice and open‐ended response items was developed based on the existing protocol, and themes were confirmed through semistructured interviews with 10 attending physicians in hospital medicine (HM) and infectious disease (ID). Questions were designed to elucidate the role that IDU played in the decision to discharge patients on OPAT, identify barriers to discharging PWID on OPAT, as well as elicit recommendations for requisite services or programs. The first question excluded providers not caring for patients requiring long‐term IV antibiotics. Questions that allowed for open‐ended responses were categorized thematically initially by 1 researcher (L.F.), then refined and confirmed by another team member (J.L.). The survey was distributed over email through Qualtrics (Provo, Utah) software to attending physicians in HM, ID, cardiology, and surgery at UK. Qualtrics software was used to generate descriptive statistics.
RESULTS
In January 2015, the survey was emailed to 66 physicians, and the response rate was 83%, with 91% reporting caring for patients requiring long‐term IV antibiotics. Of those, 41 (82%) completed all items; 66% of completers were in HM, 12% ID, 10% surgery, and 2% cardiology. Sixty percent were male and in practice an average of 7.2 years. Thirty‐nine (95%) use OPAT for patients without IDU, but only 12 (29%) would consider OPAT in PWID. If the patient has a remote history of IDU, then 33 (79%) would consider OPAT. There was no agreed‐upon definition of remote history of IDU (range, 2120 months; median, 12 months).
The most common physician‐identified barriers to discharging PWID on OPAT, as well as recommendations for services or processes to be in place to allow PWID to be discharged with OPAT, are listed in Table 1.
| Identified Barriers to Discharging PWID on OPAT (41 Responses) | % (No.) |
|---|---|
| |
| Socioeconomic factors (stable housing, transportation, living with responsible adult) | 66 (27) |
| Potential risk of the patient misusing PICC line for IDU | 66 (27) |
| Willingness of ID physician to follow the patient as an outpatient | 59 (24) |
| Potential risk of not completing IV antibiotic therapy | 49 (20) |
| Positive urine drug screen on admission | 44 (18) |
| Patient willingness to sign behavioral contract* | 39 (16) |
| Patient willingness to enter mental health or substance use disorder treatment | 39 (16) |
| Lack of a tamper‐evident mechanism that discourages misuse of the PICC line | 27 (11) |
| Lack of data on outcomes for OPAT in PWID | 24 (10) |
| Potential risk of being sued by a patient or family | 20 (8) |
| Other | |
| Recommendations for services or processes among providers who do not currently consider discharging PWID on OPAT (28 responses) | |
| Outpatient or ID follow‐up | 32 (9) |
| Monitoring mechanism including random urine drug screens | |
| Substance use disorder and mental health services and treatment | |
| Home health services | |
| Institutional placement (eg, inpatient rehab, extended‐care facility) | |
| More explicit legal protection | |
| Screening criteria to identify high risk for PICC line misuse | |
| Designated coordinator for this patient population | |
DISCUSSION
This survey illustrates the extremely complex barriers present when treating hospitalized PWID requiring long courses of IV antibiotics, and supports the anecdotal evidence that physicians often keep PWID in the hospital for weeks to administer IV antibiotics. The majority of our sample of physicians believe that the largest barriers to OPAT in PWID are socioeconomic factors and the potential risk of the patient misusing the PICC line. Although the overall response rate of our physician survey was robust,[10] our results reflect the opinions of HM and ID physicians at a single site. The low response rate among cardiologists in particular limits the generalizability of this survey. We suspect, however, that our results pertain to HM in other US hospitals, as nearly three‐fourths of 37 HM physicians surveyed at the University of California, Irvine were very concerned about PWIDs potentially misusing the PICC line, and approximately half reported they usually or always kept PWID in the hospital for prolonged treatment due to concern of substance use (personal and email communication: Lloyd Rucker, MD, unpublished data, November 6, 2015).
We were surprised that fewer than half of respondents identified substance use disorder (SUD) treatment as essential to the OPAT decision. The reasons that may explain this observation are likely multifactorial, and may include gaps in knowledge about and resources to provide evidence‐based addiction medicine. Further research is warranted to explore this observation, including the effect of enrollment into medication‐assisted treatment programs (eg, methadone, buprenorphine).
This survey suggests that although there is variability, OPAT may be an option in PWID, if outpatient follow‐up and ancillary services (ie, home health and possibly intensive case management) were well established. We believe the comorbid SUD must be also addressed. Based on the survey results and recommendations, we have begun relationships with community SUD treatment providers willing to monitor IV antibiotics with PICC lines, and dedicated additional case management staff to this population. We are evaluating these programs with the goal of contributing to an evidence base for this high‐risk population.
Acknowledgements
The authors thank Inski Yu, MD, for assistance with survey development, and Lloyd Rucker, MD, for data sharing.
Disclosure: Nothing to report.
- , , , et al. Increases in hepatitis C virus infection related to injection drug use among persons aged ≤30 years—Kentucky, Tennessee, Virginia, and West Virginia, 2006–2012. MMWR Morb Mortal Wkly Rep. 2015;64(17):453–458.
- , , , . Increases in drug and opioid overdose deaths—United States, 2000‐2014. MMWR Morb Mortal Wkly Rep. 2016;64(50–51):1378–1382.
- , , , , , . Understanding patterns of high‐cost health care use across different substance user groups. Health Aff (Millwood). 2016;35(1):12–19.
- , , , et al. Determinants of hospitalization for a cutaneous injection‐related infection among injection drug users: a cohort study. BMC Public Health. 2010;10:327.
- , . Bacterial infections in drug users. N Engl J Med. 2005;353(18):1945–1954.
- , , , et al. Practice guidelines for outpatient parenteral antimicrobial therapy. Clin Infect Dis. 2004 2004;38(12):1651–1671.
- , , , . Safe and successful treatment of intravenous drug users with a peripherally inserted central catheter in an outpatient parenteral antibiotic treatment service. J Antimicrob Chemother. 2010;65(12):2641–2644.
- , , , . Hospitals as a ‘risk environment’: an ethno‐epidemiological study of voluntary and involuntary discharge from hospital against medical advice among people who inject drugs. Soc Sci Med. 2014;105:59–66.
- , , . Leaving against medical advice (AMA): risk of 30‐day mortality and hospital readmission. J Gen Intern Med. 2010;25(9):926–929.
- , , . Do additional recontacts to increase response rate improve physician survey data quality? Med Care. 2013;51(10):945–948.
Injection drug use (IDU) is a major public health problem leading to increased morbidity, mortality, and healthcare expenditures.[1, 2, 3] Persons who inject drugs (PWID) are often hospitalized with severe infections, such as endocarditis,[4, 5] which typically require prolonged courses of intravenous (IV) antibiotics. Outpatient parenteral antibiotic therapy (OPAT) via a peripherally inserted central catheter (PICC) is the standard of care for continuing IV medications once patients are medically stable and ready for discharge.[6] PWID have been excluded from OPAT studies,[6] leaving little evidence to guide care.[7] Furthermore, likely due to fears of ongoing IDU, PWID are often kept in the hospital for the full duration of their antibiotic courses. This practice is costly and may not be optimal, especially considering that hospitalized PWID have high rates of discharges against medical advice.[8, 9]
In 2012, as part of a quality‐improvement effort focused on hospitalized PWID requiring long courses of IV antibiotics, UKHealthCare in Lexington, Kentucky, established a protocol for OPAT in PWID meeting specific criteria. As this protocol was not widely adopted, we sought to formally assess attitudes, practices, and mediating factors impacting the decision making about discharging PWID on OPAT to inform future efforts. This study was approved by the University of Kentucky (UK) Institutional Review Board.
METHODS
A 14‐item survey (see Supporting Information, Appendix, in the online version of this article) with multiple‐choice and open‐ended response items was developed based on the existing protocol, and themes were confirmed through semistructured interviews with 10 attending physicians in hospital medicine (HM) and infectious disease (ID). Questions were designed to elucidate the role that IDU played in the decision to discharge patients on OPAT, identify barriers to discharging PWID on OPAT, as well as elicit recommendations for requisite services or programs. The first question excluded providers not caring for patients requiring long‐term IV antibiotics. Questions that allowed for open‐ended responses were categorized thematically initially by 1 researcher (L.F.), then refined and confirmed by another team member (J.L.). The survey was distributed over email through Qualtrics (Provo, Utah) software to attending physicians in HM, ID, cardiology, and surgery at UK. Qualtrics software was used to generate descriptive statistics.
RESULTS
In January 2015, the survey was emailed to 66 physicians, and the response rate was 83%, with 91% reporting caring for patients requiring long‐term IV antibiotics. Of those, 41 (82%) completed all items; 66% of completers were in HM, 12% ID, 10% surgery, and 2% cardiology. Sixty percent were male and in practice an average of 7.2 years. Thirty‐nine (95%) use OPAT for patients without IDU, but only 12 (29%) would consider OPAT in PWID. If the patient has a remote history of IDU, then 33 (79%) would consider OPAT. There was no agreed‐upon definition of remote history of IDU (range, 2120 months; median, 12 months).
The most common physician‐identified barriers to discharging PWID on OPAT, as well as recommendations for services or processes to be in place to allow PWID to be discharged with OPAT, are listed in Table 1.
| Identified Barriers to Discharging PWID on OPAT (41 Responses) | % (No.) |
|---|---|
| |
| Socioeconomic factors (stable housing, transportation, living with responsible adult) | 66 (27) |
| Potential risk of the patient misusing PICC line for IDU | 66 (27) |
| Willingness of ID physician to follow the patient as an outpatient | 59 (24) |
| Potential risk of not completing IV antibiotic therapy | 49 (20) |
| Positive urine drug screen on admission | 44 (18) |
| Patient willingness to sign behavioral contract* | 39 (16) |
| Patient willingness to enter mental health or substance use disorder treatment | 39 (16) |
| Lack of a tamper‐evident mechanism that discourages misuse of the PICC line | 27 (11) |
| Lack of data on outcomes for OPAT in PWID | 24 (10) |
| Potential risk of being sued by a patient or family | 20 (8) |
| Other | |
| Recommendations for services or processes among providers who do not currently consider discharging PWID on OPAT (28 responses) | |
| Outpatient or ID follow‐up | 32 (9) |
| Monitoring mechanism including random urine drug screens | |
| Substance use disorder and mental health services and treatment | |
| Home health services | |
| Institutional placement (eg, inpatient rehab, extended‐care facility) | |
| More explicit legal protection | |
| Screening criteria to identify high risk for PICC line misuse | |
| Designated coordinator for this patient population | |
DISCUSSION
This survey illustrates the extremely complex barriers present when treating hospitalized PWID requiring long courses of IV antibiotics, and supports the anecdotal evidence that physicians often keep PWID in the hospital for weeks to administer IV antibiotics. The majority of our sample of physicians believe that the largest barriers to OPAT in PWID are socioeconomic factors and the potential risk of the patient misusing the PICC line. Although the overall response rate of our physician survey was robust,[10] our results reflect the opinions of HM and ID physicians at a single site. The low response rate among cardiologists in particular limits the generalizability of this survey. We suspect, however, that our results pertain to HM in other US hospitals, as nearly three‐fourths of 37 HM physicians surveyed at the University of California, Irvine were very concerned about PWIDs potentially misusing the PICC line, and approximately half reported they usually or always kept PWID in the hospital for prolonged treatment due to concern of substance use (personal and email communication: Lloyd Rucker, MD, unpublished data, November 6, 2015).
We were surprised that fewer than half of respondents identified substance use disorder (SUD) treatment as essential to the OPAT decision. The reasons that may explain this observation are likely multifactorial, and may include gaps in knowledge about and resources to provide evidence‐based addiction medicine. Further research is warranted to explore this observation, including the effect of enrollment into medication‐assisted treatment programs (eg, methadone, buprenorphine).
This survey suggests that although there is variability, OPAT may be an option in PWID, if outpatient follow‐up and ancillary services (ie, home health and possibly intensive case management) were well established. We believe the comorbid SUD must be also addressed. Based on the survey results and recommendations, we have begun relationships with community SUD treatment providers willing to monitor IV antibiotics with PICC lines, and dedicated additional case management staff to this population. We are evaluating these programs with the goal of contributing to an evidence base for this high‐risk population.
Acknowledgements
The authors thank Inski Yu, MD, for assistance with survey development, and Lloyd Rucker, MD, for data sharing.
Disclosure: Nothing to report.
- , , , et al. Increases in hepatitis C virus infection related to injection drug use among persons aged ≤30 years—Kentucky, Tennessee, Virginia, and West Virginia, 2006–2012. MMWR Morb Mortal Wkly Rep. 2015;64(17):453–458.
- , , , . Increases in drug and opioid overdose deaths—United States, 2000‐2014. MMWR Morb Mortal Wkly Rep. 2016;64(50–51):1378–1382.
- , , , , , . Understanding patterns of high‐cost health care use across different substance user groups. Health Aff (Millwood). 2016;35(1):12–19.
- , , , et al. Determinants of hospitalization for a cutaneous injection‐related infection among injection drug users: a cohort study. BMC Public Health. 2010;10:327.
- , . Bacterial infections in drug users. N Engl J Med. 2005;353(18):1945–1954.
- , , , et al. Practice guidelines for outpatient parenteral antimicrobial therapy. Clin Infect Dis. 2004 2004;38(12):1651–1671.
- , , , . Safe and successful treatment of intravenous drug users with a peripherally inserted central catheter in an outpatient parenteral antibiotic treatment service. J Antimicrob Chemother. 2010;65(12):2641–2644.
- , , , . Hospitals as a ‘risk environment’: an ethno‐epidemiological study of voluntary and involuntary discharge from hospital against medical advice among people who inject drugs. Soc Sci Med. 2014;105:59–66.
- , , . Leaving against medical advice (AMA): risk of 30‐day mortality and hospital readmission. J Gen Intern Med. 2010;25(9):926–929.
- , , . Do additional recontacts to increase response rate improve physician survey data quality? Med Care. 2013;51(10):945–948.
Controlling Medicare Spending
Payers, providers, and policymakers are testing several major approaches to reducing US healthcare spending without harming quality. One strategy is to bundle payments for a longitudinal episode of care, as in Medicare's popular Bundled Payments for Care Improvement initiative.[1] A second approach is to decrease rates of inappropriate care, through programs such as Choosing Wisely, that discourage use of low‐value services.[2] Finally, a third approach adopted by the Medicare Shared Savings Program strives to reduce both episode costs and rates of inappropriate care, by incorporating annual per capita Medicare spending into performance benchmarks.[3] Given these ongoing efforts, it would be important to compare the potential impact of reducing episode payments versus rates of care on total costs of care.
METHODS
For 3 common surgical procedures, we compared the relative influence of procedure rates versus episode payments (among those with procedures) on total Medicare expenditures.
We used complete Part A and B Medicare claims data for: coronary artery bypass grafting (CABG), prostatectomy, and hip replacement. We used International Classification of Diseases, Ninth Revision codes to identify the procedures (CABG: 361.0, 361.1, 361.2, 361.3, 361.4, 361.5, 361.6, 361.7, 361.9, 36.2; prostatectomy: 60.4, 60.5, 60.62 with a prostate cancer diagnosis code of 185 or 233.4; and hip replacement: 81.51, 81.52 excluding hip fracture codes 820.0, 820.1, 820.2, 820.3, 820.8, 820.9).
For each procedure, we estimated age‐ and sex‐adjusted episode rates for each hospital referral region (HRR). The numerator was the number of admissions to an acute care hospital for CABG (total n = 118,185), prostatectomy (total n = 18,328), or hip replacement (total n = 178,982) from January 2009 to June 2010. The denominator was fee‐for‐service Medicare beneficiaries age 65 years or older. We excluded those without continuous Part A and B enrollment (total denominator n = 23,403,051). Females were also excluded from the prostatectomy cohort.
For each of the 306 HRRs, we next calculated average HRR‐level episode payments. Using CABG as an example, we aggregated up the risk‐adjusted (age, sex, race, admission type, Elixhauser[4] comorbidities), price‐standardized[5] episode payments for all CABG patients residing in an HRR, and divided this by the number of CABG patients living in that HRR.
Finally, we obtained baseline per capita spending by multiplying the age‐ and sex‐adjusted CABG episode rate by the average CABG episode payment in that HRR. All payments were standardized to 2010 dollars using the Consumer Price Index.
We simulated changes in per capita Medicare spending for CABG across all HRRs under 2 scenarios: (1) reducing HRR‐level rates to the median versus (2) reducing HRR‐level episode payments to the median. We repeated this for prostatectomy and hip replacement.
RESULTS
Age‐ and sex‐adjusted rates of CABG varied more than risk‐adjusted, price‐standardized episode payments (90th:10th percentile of 2.0 for rates vs 1.2 for payments) (see Supporting Information, Appendix, in the online version of this article). Reducing rates of CABG to the 50th percentile decreased per capita episode payments by 11.1%. In contrast, reducing CABG episode payments to the 50th percentile decreased per capita episode payments by 3.6%. The absolute difference between the 2 simulations was 7.5% (95% confidence interval [CI]: 5.6%‐9.4%) (Figure 1). Results were similar for prostatectomy and hip replacement. In sensitivity analyses, reducing hospital‐level episode payments (rather than HRR‐level episode payments) produced similar findings. Employing the 90th percentile as a cutoff (instead of the median) also produced qualitatively similar results.

For CABG, the absolute difference between the simulated decrease in per capita Medicare spending due to reducing rates versus reducing payments was 7.5% (95% confidence interval [CI]: 5.6%‐9.4%). For hip replacement, the absolute difference was 3.2% (95% CI: 1.9%‐4.4%). For prostatectomy, the absolute difference was 14.3% (95% CI: 11.0%‐17.6%). The effect of doing both is additive in this simulation, as we did not model possible complex interdependencies between reducing payments and rates. Abbreviations: CABG, coronary artery bypass grafting.
DISCUSSION
For 3 common surgical procedures, reducing procedure rates lowers total Medicare spending substantially more than reducing episode payments. These findings are attributable to a much greater variation in procedure rates compared to episode‐based payments. Prior research has documented wide variation in rates of surgical procedures.[6] This may be due to a number of factors, including physician beliefs about indications for surgery, as well as the degree to which patient preferences are incorporated into decision making.[6]
Our findings suggest that it would be important to incorporate population‐based episode rates into efforts aimed at incentivizing higher value care. Incentives tied to population‐based episode rates are difficult to design well. They may need to be paired with appropriateness criteria to avoid stinting on care. Attribution of a population to a hospital (including those who are not admitted to a hospital) is also complex.[7] Finally, hospitals are not solely responsible for rates of care, because the decision to admit a patient is sometimes made in the emergency department (eg, for chronic medical conditions), but at other times is made in the outpatient arena (eg, for elective surgery). Nevertheless, a narrow focus on per episode spending limits the potential impact of efforts to control Medicare spending.
Acknowledgements
The authors thank Mary Oerline, MS, Yubraj Acharya, MPA, and Haiyin Liu, MA, for the analytic support they provided. They were compensated for their work.
Disclosures: Dr. John Birkmeyer has equity interest in ArborMetrix, a company that profiles hospital quality and episode cost efficiency. The company played no role in the preparation of this article. This work was supported by funding from the National Institute of Aging (grant no. P01AG019783). Dr. Lena Chen is supported by a Career Development Grant Award (K08HS020671) from the Agency for Healthcare Research and Quality. The funders had no role in the design and conduct of the study, in the collection, analysis, and interpretation of the data, and in the preparation, review, or approval of the manuscript.
- Centers for Medicare 370(7):589–592.
- Centers for Medicare 36(1):8–27.
- , , , , , . Prices don't drive regional Medicare spending variations. Health Aff (Millwood). 2010;29(3):537–543.
- , , , , , . Understanding of regional variation in the use of surgery. Lancet. 2013;382(9898):1121–1129.
- , , , . Assigning ambulatory patients and their physicians to hospitals: a method for obtaining population‐based provider performance measurements. Health Serv Res. 2007;42(1 pt 1):45–62.
Payers, providers, and policymakers are testing several major approaches to reducing US healthcare spending without harming quality. One strategy is to bundle payments for a longitudinal episode of care, as in Medicare's popular Bundled Payments for Care Improvement initiative.[1] A second approach is to decrease rates of inappropriate care, through programs such as Choosing Wisely, that discourage use of low‐value services.[2] Finally, a third approach adopted by the Medicare Shared Savings Program strives to reduce both episode costs and rates of inappropriate care, by incorporating annual per capita Medicare spending into performance benchmarks.[3] Given these ongoing efforts, it would be important to compare the potential impact of reducing episode payments versus rates of care on total costs of care.
METHODS
For 3 common surgical procedures, we compared the relative influence of procedure rates versus episode payments (among those with procedures) on total Medicare expenditures.
We used complete Part A and B Medicare claims data for: coronary artery bypass grafting (CABG), prostatectomy, and hip replacement. We used International Classification of Diseases, Ninth Revision codes to identify the procedures (CABG: 361.0, 361.1, 361.2, 361.3, 361.4, 361.5, 361.6, 361.7, 361.9, 36.2; prostatectomy: 60.4, 60.5, 60.62 with a prostate cancer diagnosis code of 185 or 233.4; and hip replacement: 81.51, 81.52 excluding hip fracture codes 820.0, 820.1, 820.2, 820.3, 820.8, 820.9).
For each procedure, we estimated age‐ and sex‐adjusted episode rates for each hospital referral region (HRR). The numerator was the number of admissions to an acute care hospital for CABG (total n = 118,185), prostatectomy (total n = 18,328), or hip replacement (total n = 178,982) from January 2009 to June 2010. The denominator was fee‐for‐service Medicare beneficiaries age 65 years or older. We excluded those without continuous Part A and B enrollment (total denominator n = 23,403,051). Females were also excluded from the prostatectomy cohort.
For each of the 306 HRRs, we next calculated average HRR‐level episode payments. Using CABG as an example, we aggregated up the risk‐adjusted (age, sex, race, admission type, Elixhauser[4] comorbidities), price‐standardized[5] episode payments for all CABG patients residing in an HRR, and divided this by the number of CABG patients living in that HRR.
Finally, we obtained baseline per capita spending by multiplying the age‐ and sex‐adjusted CABG episode rate by the average CABG episode payment in that HRR. All payments were standardized to 2010 dollars using the Consumer Price Index.
We simulated changes in per capita Medicare spending for CABG across all HRRs under 2 scenarios: (1) reducing HRR‐level rates to the median versus (2) reducing HRR‐level episode payments to the median. We repeated this for prostatectomy and hip replacement.
RESULTS
Age‐ and sex‐adjusted rates of CABG varied more than risk‐adjusted, price‐standardized episode payments (90th:10th percentile of 2.0 for rates vs 1.2 for payments) (see Supporting Information, Appendix, in the online version of this article). Reducing rates of CABG to the 50th percentile decreased per capita episode payments by 11.1%. In contrast, reducing CABG episode payments to the 50th percentile decreased per capita episode payments by 3.6%. The absolute difference between the 2 simulations was 7.5% (95% confidence interval [CI]: 5.6%‐9.4%) (Figure 1). Results were similar for prostatectomy and hip replacement. In sensitivity analyses, reducing hospital‐level episode payments (rather than HRR‐level episode payments) produced similar findings. Employing the 90th percentile as a cutoff (instead of the median) also produced qualitatively similar results.
For CABG, the absolute difference between the simulated decrease in per capita Medicare spending due to reducing rates versus reducing payments was 7.5% (95% confidence interval [CI]: 5.6%‐9.4%). For hip replacement, the absolute difference was 3.2% (95% CI: 1.9%‐4.4%). For prostatectomy, the absolute difference was 14.3% (95% CI: 11.0%‐17.6%). The effect of doing both is additive in this simulation, as we did not model possible complex interdependencies between reducing payments and rates. Abbreviations: CABG, coronary artery bypass grafting.
DISCUSSION
For 3 common surgical procedures, reducing procedure rates lowers total Medicare spending substantially more than reducing episode payments. These findings are attributable to a much greater variation in procedure rates compared to episode‐based payments. Prior research has documented wide variation in rates of surgical procedures.[6] This may be due to a number of factors, including physician beliefs about indications for surgery, as well as the degree to which patient preferences are incorporated into decision making.[6]
Our findings suggest that it would be important to incorporate population‐based episode rates into efforts aimed at incentivizing higher value care. Incentives tied to population‐based episode rates are difficult to design well. They may need to be paired with appropriateness criteria to avoid stinting on care. Attribution of a population to a hospital (including those who are not admitted to a hospital) is also complex.[7] Finally, hospitals are not solely responsible for rates of care, because the decision to admit a patient is sometimes made in the emergency department (eg, for chronic medical conditions), but at other times is made in the outpatient arena (eg, for elective surgery). Nevertheless, a narrow focus on per episode spending limits the potential impact of efforts to control Medicare spending.
Acknowledgements
The authors thank Mary Oerline, MS, Yubraj Acharya, MPA, and Haiyin Liu, MA, for the analytic support they provided. They were compensated for their work.
Disclosures: Dr. John Birkmeyer has equity interest in ArborMetrix, a company that profiles hospital quality and episode cost efficiency. The company played no role in the preparation of this article. This work was supported by funding from the National Institute of Aging (grant no. P01AG019783). Dr. Lena Chen is supported by a Career Development Grant Award (K08HS020671) from the Agency for Healthcare Research and Quality. The funders had no role in the design and conduct of the study, in the collection, analysis, and interpretation of the data, and in the preparation, review, or approval of the manuscript.
- Centers for Medicare 370(7):589–592.
- Centers for Medicare 36(1):8–27.
- , , , , , . Prices don't drive regional Medicare spending variations. Health Aff (Millwood). 2010;29(3):537–543.
- , , , , , . Understanding of regional variation in the use of surgery. Lancet. 2013;382(9898):1121–1129.
- , , , . Assigning ambulatory patients and their physicians to hospitals: a method for obtaining population‐based provider performance measurements. Health Serv Res. 2007;42(1 pt 1):45–62.
Use of Smartphones and Mobile Devices
Over 90% of Americans own mobile phones, and their use for internet access is rising rapidly (31% in 2009, 63% in 2013).[1] This has prompted growth in mobile health (mHealth) programs for outpatient settings,[2] and similar growth is anticipated for inpatient settings.[3] Hospitals and the healthcare systems they operate within are increasingly tied to patient experience scores (eg, Hospital Consumer Assessment of Healthcare Providers and Systems, Press Ganey) for both reputation and reimbursement.[4, 5] As a result, hospitals will need to invest future resources in a consumer‐facing digital experience. Despite these trends, basic information on mobile device ownership and usage by hospitalized patients is limited. This knowledge is needed to guide successful mHealth approaches to engage patients in acute care settings.
METHODS
We administered a 27‐question survey about mobile device use to all adult inpatients at a large urban California teaching hospital over 2 dates (October 27, 2013 and November 11, 2013) to create a cross‐sectional view of mobile device use at a hospital that offers free wireless Internet (WiFi) and personal health records (Internet‐accessible individualized medical records). Average census was 447, and we excluded patients for: age under 18 years (98), admission for neurological problems (75), altered mental status (35), nonEnglish speaking (30), or unavailable if patients were not in their room after 2 attempts spaced 30 to 60 minutes apart (36), leaving 173 eligible. We performed descriptive statistics and unadjusted associations ([2] test) to explore patterns of mobile device use.
RESULTS
We enrolled 152 patients (88% response rate): 77 (51%) male, average age 53 years (1992 years), 84 (56%) white, 115 (75%) with Medicare or commercial insurance. We found 85 (56%) patients brought a smartphone, and 82/85 (95%) used it during their hospital stay. Additionally, 41 (27%) patients brought a tablet, and 29 (19%) brought a laptop; usage was 37/41 (90%) for tablets and 24/29 (83%) for laptops. One hundred three (68%) patients brought at least 1 mobile computing device (smartphone, tablet, laptop) during their hospital stay. Overall device usage was highest among oncology patients (85%) and lowest among medicine patients (54%) (Table 1). Device usage also varied by age (<65 years old: 79% vs 65 years old: 27%), insurance status (private/Medicare: 70% vs Medicaid/other: 59%), and race/ethnicity (white: 73% vs non‐white: 62%), although only age was statistically significant (P<0.01; all others >0.05).
| Total, N=152 | Medicine, n=39 | Surgery, n=47 | Oncology, n=34 | All Others, n=32* | |
|---|---|---|---|---|---|
| |||||
| Demographics | |||||
| Average age, y (range) | 53.2 (1992) | 55.7 (2092) | 51.7 (1979) | 51.2 (2377) | 53.9 (2584) |
| Medicare or commercial insurance | 75% (115) | 64% (25) | 87% (41) | 76% (26) | 72% (23) |
| Medicaid, other, or no insurance | 25% (37) | 36% (14) | 13% (6) | 24% (8) | 28% (9) |
| Non‐white race/ethnicity | 44% (68) | 56% (22) | 36% (17) | 38% (13) | 50%(16) |
| Female gender | 49% (75) | 49% (19) | 45% (21) | 47% (16) | 59% (19) |
| Device ownership/usage | |||||
| Own smartphone | 62% (94) | 54% (21) | 66% (31) | 74% (25) | 53% (17) |
| Brought smartphone | 55% (83) | 41% (16) | 60% (28) | 71% (24) | 48% (15) |
| Brought laptop | 19% (29) | 18% (7) | 11% (5) | 41% (14) | 10% (3) |
| Brought tablet | 27% (41) | 18% (7) | 26% (12) | 50% (17) | 16% (5) |
| Brought 1 above devices | 68% (103) | 54% (21) | 68% (32) | 85% (29) | 68% (21) |
| Ever used an app | 63% (95) | 51% (20) | 72% (34) | 79% (27) | 45% (14) |
| Ever used an app for health purposes | 22% (34) | 18% (7) | 21% (10) | 24% (8) | 29% (9) |
| Accessed PHR with mobile device | 31% (47) | 26% (10) | 26% (12) | 47% (16) | 29% (9) |
Of the patients with mobile devices (smartphone, tablet, laptop), 97/103 (94%) used them during their hospitalization and for a wide array of activities (Figure 1): 47/97 (48%) accessed their personal health record (PHR), and most of these patients (38/47, 81%) reported this improved their inpatient experience. Additionally, 43/97 (44%) patients used their mobile devices to search for information about doctors, conditions, or treatments; most of these patients (39/43, 91%) used Google to search for this information, and most 29/43 (67%) felt this information made them more confident in their care.
COMMENT
Over two‐thirds of patients in our study brought and used 1 or more mobile devices to the hospital. Despite this level of engagement with mobile devices, relatively few inpatients used their device to access their online PHR, which suggests information technology access is not the leading barrier to PHR access or mHealth engagement during hospitalization. In light of growing patient enthusiasm for PHRs,[6, 7] this represents an untapped opportunity to deliver personalized, patient‐centered care at the hospital bedside.
We also found that among the patients who did access their PHR on their mobile device, the vast majority (38/47, 81%) felt it improved their inpatient experience. Our PHR provides information such as test results and medications, but our survey suggests a number of patients look for health information, such as patient education tools, medication references, and provider information, outside of the PHR. For those patients, 29/43 (67%) felt these health‐related searches improved their experience. Although we did not ask patients why they used Web searches outside their PHR, we believe this suggests that patients desire more information than currently available via the PHR. Although this information might be difficult to incorporate into the PHR, at minimum, hospitals could develop mobile applications to provide patients with basic information about their providers and conditions. Beyond this, hospitals could develop or adopt mobile applications that align with strategic priorities such as improved physician‐provider communication, reduced hospital readmissions, and improved accuracy of medication reconciliation.
Our study has limitations. First, although we used a cross‐sectional, point‐in‐time approach to canvas the entire adult population in our hospital on 2 separate dates, our study was limited to 1 large urban hospital in California; device ownership and usage may vary in other settings. Second, although our hospital provides free WiFi, we did not assess whether patients experienced any connectivity issues that influenced their device usage patterns. Finally, we did not explore questions of access, ownership, and usage of mobile computing devices for family and friends who visited inpatients in our study. These questions are ripe for future research in this emerging area of mHeath.
In summary, our study suggests a role for hospitals to provide universal WiFi access to patients, and a role for both hospitals and healthcare providers to promote digital health programs. Our findings on mobile device use in the hospital are consistent with the growing popularity of mobile device usage nationwide. Patients are increasingly wired for new opportunities to both engage in their care and optimize their hospital experience through use of their mobile computing devices. Hospitals and providers should explore this potential for engagement, but may need to explore local trends in usage to target specific service lines and patient populations given differences in access and use.
Acknowledgements
The authors acknowledge contributions by Christina Quist, MD, and Emily Gottenborg, MD, who assisted in data collection.
Disclosures: Data from this project were presented at the 2014 Annual Scientific Meeting of the Society of Hospital Medicine, March 25, 2014 in Las Vegas, Nevada. The authors have no conflicts of interest to declare relative to this study. Dr. Ludwin, MD had full access to all data in the study and takes responsibility for the integrity of the data and the accuracy of the data analysis. This project by Drs. Ludwin and Greysen was supported by grants from the University of California, San Francisco (UCSF) Partners in Care (Ronald Rankin Award) and the UCSF Mount Zion Health Fund. Dr. Greysen is also funded by a Pilot Award for Junior Investigators in Digital Health from the UCSF Dean's Office, Research Evaluation and Allocation Committee (REAC). Additionally, Dr. Greysen receives career development support from the National Institutes of Health (NIH)National Institute of Aging (NIA) through the Claude D. Pepper Older Americans Independence Center at UCSF Division of Geriatric Medicine (#P30AG021342 NIH/NIA), a Career Development Award (1K23AG045338‐01), and the NIH‐NIA Loan Repayment Program.
- Device ownership over time. Pew Research Center. Available at: http://www.pewinternet.org/data‐trend/mobile/device‐ownership. Accessed April 3, 2014.
- , , , et al. The effectiveness of mobile‐health technologies to improve health care service delivery processes: a systematic review and meta‐analysis. PLoS Med. 2013;10(1):e1001363.
- , , . Can mobile health technologies transform health care? JAMA. 2013;310(22):2395–2396.
- Look ahead to succeed under VBP. Hosp Case Manag. 2014;22(7):92–93.
- , , , . The relationship between commercial website ratings and traditional hospital performance measures in the USA. BMJ Qual Saf. 2013;22(3):194–202.
- , , , , . Consumers' perceptions of patient‐accessible electronic medical records. J Med Internet Res. 2013;15(8):e168.
- , , , et al. Access, interest, and attitudes toward electronic communication for health care among patients in the medical safety net. J Gen Intern Med. 2013;28(7):914–920.
Over 90% of Americans own mobile phones, and their use for internet access is rising rapidly (31% in 2009, 63% in 2013).[1] This has prompted growth in mobile health (mHealth) programs for outpatient settings,[2] and similar growth is anticipated for inpatient settings.[3] Hospitals and the healthcare systems they operate within are increasingly tied to patient experience scores (eg, Hospital Consumer Assessment of Healthcare Providers and Systems, Press Ganey) for both reputation and reimbursement.[4, 5] As a result, hospitals will need to invest future resources in a consumer‐facing digital experience. Despite these trends, basic information on mobile device ownership and usage by hospitalized patients is limited. This knowledge is needed to guide successful mHealth approaches to engage patients in acute care settings.
METHODS
We administered a 27‐question survey about mobile device use to all adult inpatients at a large urban California teaching hospital over 2 dates (October 27, 2013 and November 11, 2013) to create a cross‐sectional view of mobile device use at a hospital that offers free wireless Internet (WiFi) and personal health records (Internet‐accessible individualized medical records). Average census was 447, and we excluded patients for: age under 18 years (98), admission for neurological problems (75), altered mental status (35), nonEnglish speaking (30), or unavailable if patients were not in their room after 2 attempts spaced 30 to 60 minutes apart (36), leaving 173 eligible. We performed descriptive statistics and unadjusted associations ([2] test) to explore patterns of mobile device use.
RESULTS
We enrolled 152 patients (88% response rate): 77 (51%) male, average age 53 years (1992 years), 84 (56%) white, 115 (75%) with Medicare or commercial insurance. We found 85 (56%) patients brought a smartphone, and 82/85 (95%) used it during their hospital stay. Additionally, 41 (27%) patients brought a tablet, and 29 (19%) brought a laptop; usage was 37/41 (90%) for tablets and 24/29 (83%) for laptops. One hundred three (68%) patients brought at least 1 mobile computing device (smartphone, tablet, laptop) during their hospital stay. Overall device usage was highest among oncology patients (85%) and lowest among medicine patients (54%) (Table 1). Device usage also varied by age (<65 years old: 79% vs 65 years old: 27%), insurance status (private/Medicare: 70% vs Medicaid/other: 59%), and race/ethnicity (white: 73% vs non‐white: 62%), although only age was statistically significant (P<0.01; all others >0.05).
| Total, N=152 | Medicine, n=39 | Surgery, n=47 | Oncology, n=34 | All Others, n=32* | |
|---|---|---|---|---|---|
| |||||
| Demographics | |||||
| Average age, y (range) | 53.2 (1992) | 55.7 (2092) | 51.7 (1979) | 51.2 (2377) | 53.9 (2584) |
| Medicare or commercial insurance | 75% (115) | 64% (25) | 87% (41) | 76% (26) | 72% (23) |
| Medicaid, other, or no insurance | 25% (37) | 36% (14) | 13% (6) | 24% (8) | 28% (9) |
| Non‐white race/ethnicity | 44% (68) | 56% (22) | 36% (17) | 38% (13) | 50%(16) |
| Female gender | 49% (75) | 49% (19) | 45% (21) | 47% (16) | 59% (19) |
| Device ownership/usage | |||||
| Own smartphone | 62% (94) | 54% (21) | 66% (31) | 74% (25) | 53% (17) |
| Brought smartphone | 55% (83) | 41% (16) | 60% (28) | 71% (24) | 48% (15) |
| Brought laptop | 19% (29) | 18% (7) | 11% (5) | 41% (14) | 10% (3) |
| Brought tablet | 27% (41) | 18% (7) | 26% (12) | 50% (17) | 16% (5) |
| Brought 1 above devices | 68% (103) | 54% (21) | 68% (32) | 85% (29) | 68% (21) |
| Ever used an app | 63% (95) | 51% (20) | 72% (34) | 79% (27) | 45% (14) |
| Ever used an app for health purposes | 22% (34) | 18% (7) | 21% (10) | 24% (8) | 29% (9) |
| Accessed PHR with mobile device | 31% (47) | 26% (10) | 26% (12) | 47% (16) | 29% (9) |
Of the patients with mobile devices (smartphone, tablet, laptop), 97/103 (94%) used them during their hospitalization and for a wide array of activities (Figure 1): 47/97 (48%) accessed their personal health record (PHR), and most of these patients (38/47, 81%) reported this improved their inpatient experience. Additionally, 43/97 (44%) patients used their mobile devices to search for information about doctors, conditions, or treatments; most of these patients (39/43, 91%) used Google to search for this information, and most 29/43 (67%) felt this information made them more confident in their care.
COMMENT
Over two‐thirds of patients in our study brought and used 1 or more mobile devices to the hospital. Despite this level of engagement with mobile devices, relatively few inpatients used their device to access their online PHR, which suggests information technology access is not the leading barrier to PHR access or mHealth engagement during hospitalization. In light of growing patient enthusiasm for PHRs,[6, 7] this represents an untapped opportunity to deliver personalized, patient‐centered care at the hospital bedside.
We also found that among the patients who did access their PHR on their mobile device, the vast majority (38/47, 81%) felt it improved their inpatient experience. Our PHR provides information such as test results and medications, but our survey suggests a number of patients look for health information, such as patient education tools, medication references, and provider information, outside of the PHR. For those patients, 29/43 (67%) felt these health‐related searches improved their experience. Although we did not ask patients why they used Web searches outside their PHR, we believe this suggests that patients desire more information than currently available via the PHR. Although this information might be difficult to incorporate into the PHR, at minimum, hospitals could develop mobile applications to provide patients with basic information about their providers and conditions. Beyond this, hospitals could develop or adopt mobile applications that align with strategic priorities such as improved physician‐provider communication, reduced hospital readmissions, and improved accuracy of medication reconciliation.
Our study has limitations. First, although we used a cross‐sectional, point‐in‐time approach to canvas the entire adult population in our hospital on 2 separate dates, our study was limited to 1 large urban hospital in California; device ownership and usage may vary in other settings. Second, although our hospital provides free WiFi, we did not assess whether patients experienced any connectivity issues that influenced their device usage patterns. Finally, we did not explore questions of access, ownership, and usage of mobile computing devices for family and friends who visited inpatients in our study. These questions are ripe for future research in this emerging area of mHeath.
In summary, our study suggests a role for hospitals to provide universal WiFi access to patients, and a role for both hospitals and healthcare providers to promote digital health programs. Our findings on mobile device use in the hospital are consistent with the growing popularity of mobile device usage nationwide. Patients are increasingly wired for new opportunities to both engage in their care and optimize their hospital experience through use of their mobile computing devices. Hospitals and providers should explore this potential for engagement, but may need to explore local trends in usage to target specific service lines and patient populations given differences in access and use.
Acknowledgements
The authors acknowledge contributions by Christina Quist, MD, and Emily Gottenborg, MD, who assisted in data collection.
Disclosures: Data from this project were presented at the 2014 Annual Scientific Meeting of the Society of Hospital Medicine, March 25, 2014 in Las Vegas, Nevada. The authors have no conflicts of interest to declare relative to this study. Dr. Ludwin, MD had full access to all data in the study and takes responsibility for the integrity of the data and the accuracy of the data analysis. This project by Drs. Ludwin and Greysen was supported by grants from the University of California, San Francisco (UCSF) Partners in Care (Ronald Rankin Award) and the UCSF Mount Zion Health Fund. Dr. Greysen is also funded by a Pilot Award for Junior Investigators in Digital Health from the UCSF Dean's Office, Research Evaluation and Allocation Committee (REAC). Additionally, Dr. Greysen receives career development support from the National Institutes of Health (NIH)National Institute of Aging (NIA) through the Claude D. Pepper Older Americans Independence Center at UCSF Division of Geriatric Medicine (#P30AG021342 NIH/NIA), a Career Development Award (1K23AG045338‐01), and the NIH‐NIA Loan Repayment Program.
- Device ownership over time. Pew Research Center. Available at: http://www.pewinternet.org/data‐trend/mobile/device‐ownership. Accessed April 3, 2014.
- , , , et al. The effectiveness of mobile‐health technologies to improve health care service delivery processes: a systematic review and meta‐analysis. PLoS Med. 2013;10(1):e1001363.
- , , . Can mobile health technologies transform health care? JAMA. 2013;310(22):2395–2396.
- Look ahead to succeed under VBP. Hosp Case Manag. 2014;22(7):92–93.
- , , , . The relationship between commercial website ratings and traditional hospital performance measures in the USA. BMJ Qual Saf. 2013;22(3):194–202.
- , , , , . Consumers' perceptions of patient‐accessible electronic medical records. J Med Internet Res. 2013;15(8):e168.
- , , , et al. Access, interest, and attitudes toward electronic communication for health care among patients in the medical safety net. J Gen Intern Med. 2013;28(7):914–920.

Low Rates of Stethoscope Hygiene
Hand hygiene is a proven and guideline‐recommended safety practice, although clinicians and particularly physicians are unreliable at performing it.[1] Like hands, stethoscopes can carry pathogens from patient to patient. In 1 study, stethoscopes were as likely to be contaminated after use with methicillin‐resistant Staphylococcus aureuspositive patients as the provider's hands.[2] Furthermore, like hands, stethoscopes can be effectively decolonized with alcohol.[3, 4] However, although hand hygiene rates have been extensively studied,[1] and hand hygiene has been linked to reductions in nosocomial infection,[5] stethoscope hygiene is less well studied and emphasized less by guidelines.[6] Several surveys have documented low self‐reported compliance with stethoscope hygiene.[7, 8, 9, 10] Of 150 healthcare workers, 48% reported stethoscope hygiene between daily and weekly, 37% did stethoscope hygiene monthly, and 7% did stethoscope hygiene annually or never.[8] Of 1401 doctors asked about their stethoscope hygiene beliefs and practices, 76% believed that stethoscopes could transmit infection, but only 24% reported cleaning their scopes regularly.[9] Moreover, of 308 students, 22% had never done stethoscope hygiene, and <4% did it consistently.[10] However, we were unable to find any data on observed rates of stethoscope hygiene. Thus, we observed student and trainee physician stethoscope hygiene performance during hospital medicine rotations as part of the baseline data‐collection phase of a quality‐improvement effort linked to hand hygiene efforts.
METHODS
Attending hospitalists (I.H.J., B.M., and A.A.) and 1 graduate assistant (J.W.) at 3 sites observed stethoscope hygiene opportunities over an 11‐month period. Stethoscope hygiene was counted as performed if a patient‐specific stethoscope was used in an isolation room, or if any type of cleaning (alcohol gel, alcohol wipe, or cleansing cloth) was performed on a stethoscope carried out of the room. Observers also recorded whether stethoscope hygiene opportunities occurred in isolation rooms or nonisolation rooms, and noted if stethoscope hygiene was obviously triggered by an attending's stethoscope hygiene behavior (eg, a trainee asked an attending why he performed stethoscope hygiene, then performed it him or herself). Trainees were not aware that their stethoscope hygiene behaviors were being recorded.
RESULTS
We observed 352 opportunities for stethoscope hygiene, in which doctors or students used stethoscope hygiene in 58 encounters (16%). Twenty of the 58 stethoscope hygiene events occurred only after a trainee observed an attending physician perform stethoscope hygiene. Eliminating stethoscope hygiene events that were triggered by attending physicians, stethoscope hygiene was performed in 38 of 332 opportunities (11%). There was a significant difference between the rate of stethoscope hygiene performed in isolation versus nonisolation rooms: 24/29 (82.7%) versus 14 of 303 (4.6%) (P<0.001 by Pearson 2 statistic). In isolation room stethoscope hygiene, in which the type of hygiene was recorded, 18 of 20 (90%) involved use of an isolation stethoscope, and 2 of 20 (10%) involved cleaning of a personal stethoscope.
DISCUSSION
Stethoscope hygiene is rarely performed by trainees. Stethoscope hygiene performance depends on the isolation status of the patient, with more than 80% performance in isolated patients and <5% in nonisolated patients.
Although little is known about the rate of infection related to stethoscopes, colonization of stethoscopes with nosocomial bacteria is well described.[2] Transmission of pathogens from patient to patient by stethoscopes could undermine the benefits of hand hygiene programs, as patients are commonly exposed to unclean stethoscopes.
Our observations are limited by several factors. We used a convenience sample of general medicine trainee behavior at academic medical centers; the behavior of attending physicians, ancillary staff, and nonacademic physicians may be different. Moreover, attending behavior may have prompted more episodes of stethoscope hygiene performance than we recorded, because we only noted when stethoscope hygiene was clearly related to attending behavior. The very low rate of stethoscope hygiene after contact with nonisolation patients represents a current and potentially serious safety threat. Future research might be able to quantify the risk associated with uncleaned stethoscopes or demonstrate the effectiveness of stethoscope hygiene programs. The effect of modeling on hand hygiene and stethoscope hygiene[10, 11] and on stethoscope hygiene in our data suggests a method for improving stethoscope hygiene.
Disclosure
Nothing to report.
- World Health Organization. WHO Guidelines on Hand Hygiene in HealthCare. Global Patient Safety Challenge 2005‐2006: Clean Care Is Safer Care. Geneva, Switzerland: WHO Press; 2009.
- , , , et al. Contamination of stethoscopes and physicians' hands after a physical examination. Mayo Clin Proc. 2014;89:291–299.
- , , , et al. Bacterial contamination of hospital physicians’ stethoscopes. Infect Control Hosp Epidemiol. 1999;20:626–628.
- , , What's growing on your stethoscope? (and what you can do about it). J Fam Pract. 2009;58(8):404–409.
- , , , et al. Effectiveness of a hospital wide program aimed at improving compliance with hand hygiene. Lancet. 2000;356:1307–1312.
- , , , et al. Healthcare personnel attire in non‐operating‐room settings. Infect Control Hosp Epidemiol. 2014;35:107–121.
- , , Stethoscopes as possible vectors of infection by staphylococci. BMJ. 1992;305:1573–1574.
- , , Stethoscopes: a potential vector of infection? Ann Emerg Med. 1995;26:296–299.
- , , , , Predictors of stethoscope disinfection among pediatric health care providers. Am J Infect Control. 2012;40:922–925.
- , , Factors influencing stethoscope cleanliness among clinical medical students. J Hosp Infect. 2013;84(3):242–244.
- Hand hygiene: simple and complex. Int J Infect Dis. 2005;9:3–14.
Hand hygiene is a proven and guideline‐recommended safety practice, although clinicians and particularly physicians are unreliable at performing it.[1] Like hands, stethoscopes can carry pathogens from patient to patient. In 1 study, stethoscopes were as likely to be contaminated after use with methicillin‐resistant Staphylococcus aureuspositive patients as the provider's hands.[2] Furthermore, like hands, stethoscopes can be effectively decolonized with alcohol.[3, 4] However, although hand hygiene rates have been extensively studied,[1] and hand hygiene has been linked to reductions in nosocomial infection,[5] stethoscope hygiene is less well studied and emphasized less by guidelines.[6] Several surveys have documented low self‐reported compliance with stethoscope hygiene.[7, 8, 9, 10] Of 150 healthcare workers, 48% reported stethoscope hygiene between daily and weekly, 37% did stethoscope hygiene monthly, and 7% did stethoscope hygiene annually or never.[8] Of 1401 doctors asked about their stethoscope hygiene beliefs and practices, 76% believed that stethoscopes could transmit infection, but only 24% reported cleaning their scopes regularly.[9] Moreover, of 308 students, 22% had never done stethoscope hygiene, and <4% did it consistently.[10] However, we were unable to find any data on observed rates of stethoscope hygiene. Thus, we observed student and trainee physician stethoscope hygiene performance during hospital medicine rotations as part of the baseline data‐collection phase of a quality‐improvement effort linked to hand hygiene efforts.
METHODS
Attending hospitalists (I.H.J., B.M., and A.A.) and 1 graduate assistant (J.W.) at 3 sites observed stethoscope hygiene opportunities over an 11‐month period. Stethoscope hygiene was counted as performed if a patient‐specific stethoscope was used in an isolation room, or if any type of cleaning (alcohol gel, alcohol wipe, or cleansing cloth) was performed on a stethoscope carried out of the room. Observers also recorded whether stethoscope hygiene opportunities occurred in isolation rooms or nonisolation rooms, and noted if stethoscope hygiene was obviously triggered by an attending's stethoscope hygiene behavior (eg, a trainee asked an attending why he performed stethoscope hygiene, then performed it him or herself). Trainees were not aware that their stethoscope hygiene behaviors were being recorded.
RESULTS
We observed 352 opportunities for stethoscope hygiene, in which doctors or students used stethoscope hygiene in 58 encounters (16%). Twenty of the 58 stethoscope hygiene events occurred only after a trainee observed an attending physician perform stethoscope hygiene. Eliminating stethoscope hygiene events that were triggered by attending physicians, stethoscope hygiene was performed in 38 of 332 opportunities (11%). There was a significant difference between the rate of stethoscope hygiene performed in isolation versus nonisolation rooms: 24/29 (82.7%) versus 14 of 303 (4.6%) (P<0.001 by Pearson 2 statistic). In isolation room stethoscope hygiene, in which the type of hygiene was recorded, 18 of 20 (90%) involved use of an isolation stethoscope, and 2 of 20 (10%) involved cleaning of a personal stethoscope.
DISCUSSION
Stethoscope hygiene is rarely performed by trainees. Stethoscope hygiene performance depends on the isolation status of the patient, with more than 80% performance in isolated patients and <5% in nonisolated patients.
Although little is known about the rate of infection related to stethoscopes, colonization of stethoscopes with nosocomial bacteria is well described.[2] Transmission of pathogens from patient to patient by stethoscopes could undermine the benefits of hand hygiene programs, as patients are commonly exposed to unclean stethoscopes.
Our observations are limited by several factors. We used a convenience sample of general medicine trainee behavior at academic medical centers; the behavior of attending physicians, ancillary staff, and nonacademic physicians may be different. Moreover, attending behavior may have prompted more episodes of stethoscope hygiene performance than we recorded, because we only noted when stethoscope hygiene was clearly related to attending behavior. The very low rate of stethoscope hygiene after contact with nonisolation patients represents a current and potentially serious safety threat. Future research might be able to quantify the risk associated with uncleaned stethoscopes or demonstrate the effectiveness of stethoscope hygiene programs. The effect of modeling on hand hygiene and stethoscope hygiene[10, 11] and on stethoscope hygiene in our data suggests a method for improving stethoscope hygiene.
Disclosure
Nothing to report.
- World Health Organization. WHO Guidelines on Hand Hygiene in HealthCare. Global Patient Safety Challenge 2005‐2006: Clean Care Is Safer Care. Geneva, Switzerland: WHO Press; 2009.
- , , , et al. Contamination of stethoscopes and physicians' hands after a physical examination. Mayo Clin Proc. 2014;89:291–299.
- , , , et al. Bacterial contamination of hospital physicians’ stethoscopes. Infect Control Hosp Epidemiol. 1999;20:626–628.
- , , What's growing on your stethoscope? (and what you can do about it). J Fam Pract. 2009;58(8):404–409.
- , , , et al. Effectiveness of a hospital wide program aimed at improving compliance with hand hygiene. Lancet. 2000;356:1307–1312.
- , , , et al. Healthcare personnel attire in non‐operating‐room settings. Infect Control Hosp Epidemiol. 2014;35:107–121.
- , , Stethoscopes as possible vectors of infection by staphylococci. BMJ. 1992;305:1573–1574.
- , , Stethoscopes: a potential vector of infection? Ann Emerg Med. 1995;26:296–299.
- , , , , Predictors of stethoscope disinfection among pediatric health care providers. Am J Infect Control. 2012;40:922–925.
- , , Factors influencing stethoscope cleanliness among clinical medical students. J Hosp Infect. 2013;84(3):242–244.
- Hand hygiene: simple and complex. Int J Infect Dis. 2005;9:3–14.
Inpatients With Poor Vision
Vision impairment is an under‐recognized risk factor for adverse events among hospitalized patients.[1, 2, 3] Inpatients with poor vision are at increased risk for falls and delirium[1, 3] and have more difficulty taking medications.[4, 5] They may also be at risk for being unable to read critical health information, including consent forms and discharge instructions, or decreased quality of life such as simply ordering food from menus. However, vision is neither routinely tested nor documented for inpatients. Low‐cost ($8 and up) nonprescription reading glasses, known as readers may be a simple, high‐value intervention to improve inpatients' vision. We aimed to study initial feasibility and efficacy of screening and correcting inpatients' vision.
METHODS
From June 2012 through January 2014, research assistants (RAs) identified eligible (adults [18 years], English speaking) participants daily from electronic medical records as part of an ongoing study of general medicine inpatients measuring quality‐of‐care at the University of Chicago Medicine.[6] RAs tested visual acuity using Snellen pocket charts (participants wore corrective lenses if available). For eligible participants, readers were tested with sequential fitting (+2/+2.25/+2.75/+3.25) until vision was corrected (sufficient vision: at least 20/50 acuity in at least 1 eye).[7] Eligible participants included those with insufficient vision who were not already wearing corrective lenses and had no documented blindness or medically severe vision loss, for whom nonprescription readers would be unlikely to correct vision deficiencies such as cataracts or glaucoma. The study was approved by the University of Chicago Institutional Review Board (IRB #9967).
Of note, although readers are typically used in populations over 40 years of age, readers were fitted for all participants to assess their utility for any hospitalized adult patient. Upon completing the vision screening and readers interventions, participants received instruction on how to access vision care and how to obtain readers (if they corrected vision) after hospital discharge.
Descriptive statistics and tests of comparison, including t tests and [2] tests, were used when appropriate. All analyses were performed using Stata version 12 (StataCorp, College Station, TX).
RESULTS
Over 800 participants' vision was screened (n=853); the majority were female (56%, 480/853), African American (76%, 650/853), with a mean age of 53.4 years (standard deviation 18.7), consistent with our study site's demographics. Over one‐third (36%, 304/853) of participants had insufficient vision. Older (65 years) participants (56%, 136/244) were more likely to have insufficient vision than younger participants (28%, 168/608; P<0.001).
Participants with insufficient vision were wearing their own corrective lenses during the testing (150/304, 49%), did not use corrective lenses (53/304, 17%), or were without available corrective lenses (99/304, 33%) (Figure 1A).

One‐hundred sixteen of 304 participants approached for the readers intervention were eligible (112 reported medical eye disease, 65 were wearing lenses, and 11 refused or were discharged before intervention implementation).
Nonprescription readers corrected the majority of eligible participants' vision (82%, 95/116). Most participants' (81/116, 70%) vision was corrected using the 2 lowest calibration readers (+2/+2.25); another 14 participants' (12%) vision was corrected with higher‐strength lenses (+2.75/+3.25) (Figure 1B)
DISCUSSION
We found that over one‐third of the inpatients we examined have poor vision. Furthermore, among an easily identified subgroup of inpatients with poor vision, low‐cost readers successfully corrected most participants' vision. Although preventive health is not commonly considered an inpatient issue, hospitalists and other clinicians working in the inpatient setting can play an important role in identifying opportunities to provide high‐value care related to patients' vision.
Several important ethical, safety, and cost considerations related to these findings exist. Hospitalized patients commonly sign written informed consent; therefore, due diligence to ensure patients' ability to read and understand the forms is imperative. Further, inpatient delirium is common, particularly among older patients.[8] Existing or new onset delirium occurs in up to 24% to 35% of elderly inpatients.[8] Vision is an important risk factor for multifactorial inpatient delirium, and early vision correction has been shown to improve delirium rates, as part of a multicomponent intervention.[9] Hospital‐related patient costs per delirium episode have been estimated at $16,303 to $64,421.[10] The cost of a multicomponent intervention was $6341 per case of delirium prevented,[9] whereas only 1 potentially critical component, the cost of readers ($8+), would pale in comparison.[1] Vision screening takes approximately 2.25 minutes plus 2 to 6 minutes for the readers' assessment, with little training and high fidelity. Therefore, this easily implemented, potentially cost saving, intervention targeting inpatients with poor vision may improve patient safety and quality of life in the hospital and even after discharge.
Limitations of the study include considerations of generalizability, as participants were from a single, urban, academic medical center. Additionally, long‐term benefits of the readers intervention were not assessed in this study. Finally, RAs provided the assessments; therefore, further work is required to determine costs of efficient large‐scale clinical implementation through nurse‐led programs.
Despite these study limitations, the surprisingly high prevalence of poor vision among inpatients is a call to action for hospitalists. Future work should investigate the impact and cost of vision correction on hospital outcomes such as patient satisfaction, reduced rehospitalizations, and decreased delirium.[11]
Acknowledgements
The authors thank several individuals for their assistance with this project. Andrea Flores, MA, Senior Programmer, helped with programming and data support. Kristin Constantine, BA, Project Manager, helped with developing and implementing the database for this project. Edward Kim, BA, Project Manager, helped with management of the database and data collection. The authors also thank Ainoa Coltri and the Hospitalist Project research assistants for assistance with data collection, Frank Zadravecz, MPH, for assistance with the creation of figures, and Nicole Twu, MS, for assistance with the project. The authors thank other students who helped to collect data for this project, including Allison Louis, Victoria Moreira, and Esther Schoenfeld.
Disclosures: Dr. Press is supported by a career development award from the National Heart Lung and Blood Institute (NIH K23HL118151). A pilot award from The Center on the Demography and Economics of Aging (CoA, National Institute of Aging P30 AG012857) supported this project. Dr. Matthiesen and Ms. Ranadive received support from the Summer Research Program funded by the National Institutes on Aging Short‐Term Aging‐Related Research Program (T35AG029795). Dr. Matthiesen also received funding from the Calvin Fentress Fellowship Program. Dr. Hariprasad reports being a consultant or participating on a speaker's bureau for Alcon, Allergan, Regeneron, Genentech, Optos, OD‐OS, Bayer, Clearside Biomedical, and Ocular Therapeutix. Dr. Meltzer received funding from the National Institutes on Aging Short‐Term Aging‐Related Research Program (T35AG029795), and from the Agency for Healthcare Quality and Research through the Hospital Medicine and Economics Center for Education and Research in Therapeutics (U18 HS016967‐01), and from the National Institute of Aging through a Midcareer Career Development Award (K24 AG031326‐01), from the National Cancer Institute (KM1 CA156717), and from the National Center for Advancing Translational Science (2UL1TR000430‐06). Dr. Arora received funding from the National Institutes on Aging Short‐Term Aging‐Related Research Program (T35AG029795) and National Institutes on Aging (K23AG033763).
- , , , . Risk factors and risk assessment tools for falls in hospital in‐patients: a systematic review. Age Ageing. 2004;33(2):122–130.
- , , , , . More than meets the eye: relationship between low health literacy and poor vision in hospitalized patients. J Health Commun. 2013;18(suppl 1):197–204.
- , , , , , . Risk factors for delirium at discharge: development and validation of a predictive model. Arch Intern Med. 2007;167(13):1406–1413.
- , , , et al. Misuse of respiratory inhalers in hospitalized patients with asthma or COPD. J Gen Intern Med. 2011;26(6):635–642.
- , , . Can elderly people take their medicine? Patient Educ Couns. 2005;59(2):186–191.
- , , , et al. Effects of physician experience on costs and outcomes on an academic general medicine service: results of a trial of hospitalists. Ann Intern Med. 2002;137(11):866–874.
- . Prospective evaluation of visual acuity assessment: a comparison of Snellen versus ETDRS charts in clinical practice (An AOS Thesis). Trans Am Ophthalmol Soc. 2009;107:311–324.
- , , , et al. Delirium. The occurrence and persistence of symptoms among elderly hospitalized patients. Arch Intern Med. 1992;152(2):334–340.
- , , , et al. A multicomponent intervention to prevent delirium in hospitalized older patients. N Engl J Med. 1999;340(9):669–676.
- , , , , . One‐year health care costs associated with delirium in the elderly population. Arch Intern Med. 2008;168(1):27–32.
- , , , et al. A low‐vision rehabilitation program for patients with mild cognitive deficits. JAMA Ophthalmol. 2013;131(7):912–919.
Vision impairment is an under‐recognized risk factor for adverse events among hospitalized patients.[1, 2, 3] Inpatients with poor vision are at increased risk for falls and delirium[1, 3] and have more difficulty taking medications.[4, 5] They may also be at risk for being unable to read critical health information, including consent forms and discharge instructions, or decreased quality of life such as simply ordering food from menus. However, vision is neither routinely tested nor documented for inpatients. Low‐cost ($8 and up) nonprescription reading glasses, known as readers may be a simple, high‐value intervention to improve inpatients' vision. We aimed to study initial feasibility and efficacy of screening and correcting inpatients' vision.
METHODS
From June 2012 through January 2014, research assistants (RAs) identified eligible (adults [18 years], English speaking) participants daily from electronic medical records as part of an ongoing study of general medicine inpatients measuring quality‐of‐care at the University of Chicago Medicine.[6] RAs tested visual acuity using Snellen pocket charts (participants wore corrective lenses if available). For eligible participants, readers were tested with sequential fitting (+2/+2.25/+2.75/+3.25) until vision was corrected (sufficient vision: at least 20/50 acuity in at least 1 eye).[7] Eligible participants included those with insufficient vision who were not already wearing corrective lenses and had no documented blindness or medically severe vision loss, for whom nonprescription readers would be unlikely to correct vision deficiencies such as cataracts or glaucoma. The study was approved by the University of Chicago Institutional Review Board (IRB #9967).
Of note, although readers are typically used in populations over 40 years of age, readers were fitted for all participants to assess their utility for any hospitalized adult patient. Upon completing the vision screening and readers interventions, participants received instruction on how to access vision care and how to obtain readers (if they corrected vision) after hospital discharge.
Descriptive statistics and tests of comparison, including t tests and [2] tests, were used when appropriate. All analyses were performed using Stata version 12 (StataCorp, College Station, TX).
RESULTS
Over 800 participants' vision was screened (n=853); the majority were female (56%, 480/853), African American (76%, 650/853), with a mean age of 53.4 years (standard deviation 18.7), consistent with our study site's demographics. Over one‐third (36%, 304/853) of participants had insufficient vision. Older (65 years) participants (56%, 136/244) were more likely to have insufficient vision than younger participants (28%, 168/608; P<0.001).
Participants with insufficient vision were wearing their own corrective lenses during the testing (150/304, 49%), did not use corrective lenses (53/304, 17%), or were without available corrective lenses (99/304, 33%) (Figure 1A).
One‐hundred sixteen of 304 participants approached for the readers intervention were eligible (112 reported medical eye disease, 65 were wearing lenses, and 11 refused or were discharged before intervention implementation).
Nonprescription readers corrected the majority of eligible participants' vision (82%, 95/116). Most participants' (81/116, 70%) vision was corrected using the 2 lowest calibration readers (+2/+2.25); another 14 participants' (12%) vision was corrected with higher‐strength lenses (+2.75/+3.25) (Figure 1B)
DISCUSSION
We found that over one‐third of the inpatients we examined have poor vision. Furthermore, among an easily identified subgroup of inpatients with poor vision, low‐cost readers successfully corrected most participants' vision. Although preventive health is not commonly considered an inpatient issue, hospitalists and other clinicians working in the inpatient setting can play an important role in identifying opportunities to provide high‐value care related to patients' vision.
Several important ethical, safety, and cost considerations related to these findings exist. Hospitalized patients commonly sign written informed consent; therefore, due diligence to ensure patients' ability to read and understand the forms is imperative. Further, inpatient delirium is common, particularly among older patients.[8] Existing or new onset delirium occurs in up to 24% to 35% of elderly inpatients.[8] Vision is an important risk factor for multifactorial inpatient delirium, and early vision correction has been shown to improve delirium rates, as part of a multicomponent intervention.[9] Hospital‐related patient costs per delirium episode have been estimated at $16,303 to $64,421.[10] The cost of a multicomponent intervention was $6341 per case of delirium prevented,[9] whereas only 1 potentially critical component, the cost of readers ($8+), would pale in comparison.[1] Vision screening takes approximately 2.25 minutes plus 2 to 6 minutes for the readers' assessment, with little training and high fidelity. Therefore, this easily implemented, potentially cost saving, intervention targeting inpatients with poor vision may improve patient safety and quality of life in the hospital and even after discharge.
Limitations of the study include considerations of generalizability, as participants were from a single, urban, academic medical center. Additionally, long‐term benefits of the readers intervention were not assessed in this study. Finally, RAs provided the assessments; therefore, further work is required to determine costs of efficient large‐scale clinical implementation through nurse‐led programs.
Despite these study limitations, the surprisingly high prevalence of poor vision among inpatients is a call to action for hospitalists. Future work should investigate the impact and cost of vision correction on hospital outcomes such as patient satisfaction, reduced rehospitalizations, and decreased delirium.[11]
Acknowledgements
The authors thank several individuals for their assistance with this project. Andrea Flores, MA, Senior Programmer, helped with programming and data support. Kristin Constantine, BA, Project Manager, helped with developing and implementing the database for this project. Edward Kim, BA, Project Manager, helped with management of the database and data collection. The authors also thank Ainoa Coltri and the Hospitalist Project research assistants for assistance with data collection, Frank Zadravecz, MPH, for assistance with the creation of figures, and Nicole Twu, MS, for assistance with the project. The authors thank other students who helped to collect data for this project, including Allison Louis, Victoria Moreira, and Esther Schoenfeld.
Disclosures: Dr. Press is supported by a career development award from the National Heart Lung and Blood Institute (NIH K23HL118151). A pilot award from The Center on the Demography and Economics of Aging (CoA, National Institute of Aging P30 AG012857) supported this project. Dr. Matthiesen and Ms. Ranadive received support from the Summer Research Program funded by the National Institutes on Aging Short‐Term Aging‐Related Research Program (T35AG029795). Dr. Matthiesen also received funding from the Calvin Fentress Fellowship Program. Dr. Hariprasad reports being a consultant or participating on a speaker's bureau for Alcon, Allergan, Regeneron, Genentech, Optos, OD‐OS, Bayer, Clearside Biomedical, and Ocular Therapeutix. Dr. Meltzer received funding from the National Institutes on Aging Short‐Term Aging‐Related Research Program (T35AG029795), and from the Agency for Healthcare Quality and Research through the Hospital Medicine and Economics Center for Education and Research in Therapeutics (U18 HS016967‐01), and from the National Institute of Aging through a Midcareer Career Development Award (K24 AG031326‐01), from the National Cancer Institute (KM1 CA156717), and from the National Center for Advancing Translational Science (2UL1TR000430‐06). Dr. Arora received funding from the National Institutes on Aging Short‐Term Aging‐Related Research Program (T35AG029795) and National Institutes on Aging (K23AG033763).
- , , , . Risk factors and risk assessment tools for falls in hospital in‐patients: a systematic review. Age Ageing. 2004;33(2):122–130.
- , , , , . More than meets the eye: relationship between low health literacy and poor vision in hospitalized patients. J Health Commun. 2013;18(suppl 1):197–204.
- , , , , , . Risk factors for delirium at discharge: development and validation of a predictive model. Arch Intern Med. 2007;167(13):1406–1413.
- , , , et al. Misuse of respiratory inhalers in hospitalized patients with asthma or COPD. J Gen Intern Med. 2011;26(6):635–642.
- , , . Can elderly people take their medicine? Patient Educ Couns. 2005;59(2):186–191.
- , , , et al. Effects of physician experience on costs and outcomes on an academic general medicine service: results of a trial of hospitalists. Ann Intern Med. 2002;137(11):866–874.
- . Prospective evaluation of visual acuity assessment: a comparison of Snellen versus ETDRS charts in clinical practice (An AOS Thesis). Trans Am Ophthalmol Soc. 2009;107:311–324.
- , , , et al. Delirium. The occurrence and persistence of symptoms among elderly hospitalized patients. Arch Intern Med. 1992;152(2):334–340.
- , , , et al. A multicomponent intervention to prevent delirium in hospitalized older patients. N Engl J Med. 1999;340(9):669–676.
- , , , , . One‐year health care costs associated with delirium in the elderly population. Arch Intern Med. 2008;168(1):27–32.
- , , , et al. A low‐vision rehabilitation program for patients with mild cognitive deficits. JAMA Ophthalmol. 2013;131(7):912–919.
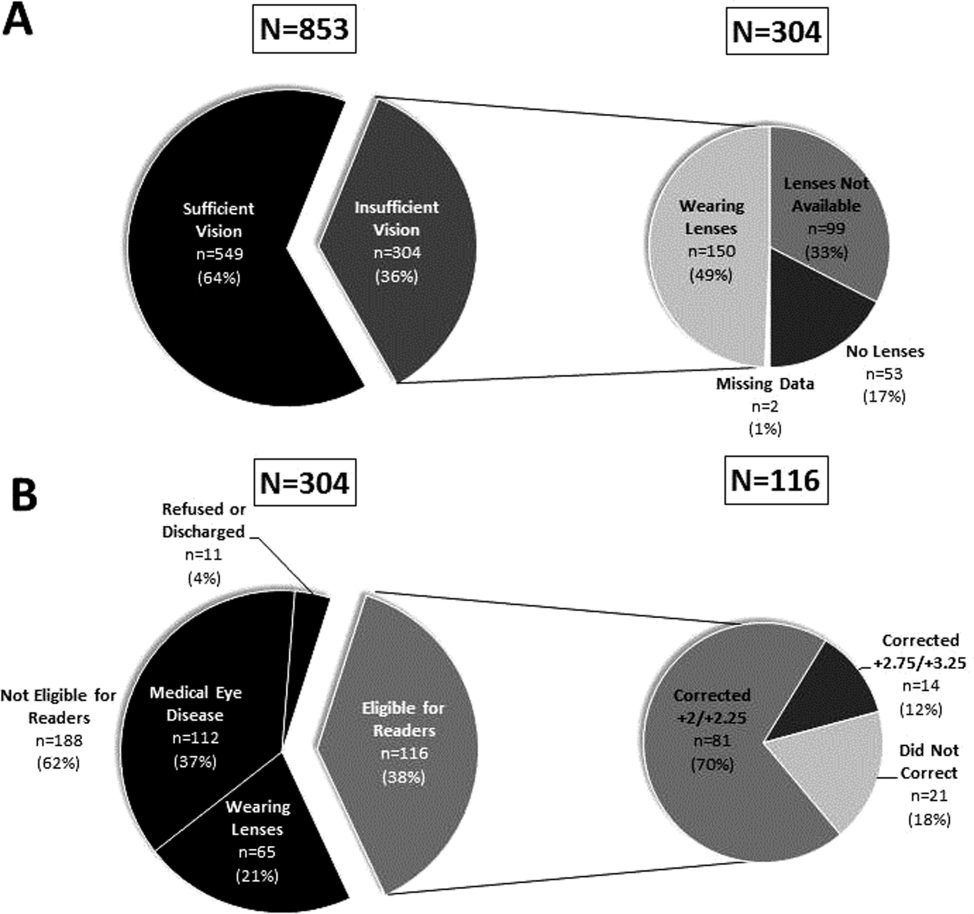
Barriers to Establishing a PCS
Palliative care (PC) focuses on relieving distressing symptoms such as pain, dyspnea, fatigue, and depression; providing psychological, social, emotional, and spiritual support; and helping patients choose treatments consistent with their values.[1] Palliative care consultation services (PCSs) increase patient and family satisfaction,[2, 3] improve quality of life,[4] reduce resource utilization,[5] and decrease hospital expenditure.[2, 6] Hospitals that fund a PCS typically realize a sizable return on investment and good value, as these services provide better care at lower cost.[7] These benefits provide a strong rationale for all hospitals to establish a PCS. However, only 53% of acute care hospitals in California offer PC services, and only 37% have a hospital‐based PCS.[7] To increase access for patients with serious illness, it is necessary to understand the barriers that hinder the development of PCS. In this study, we asked leaders from hospitals without a PCS to describe these barriers and identify strategies that could overcome them and promote PCSs.
METHODS
In 2011, we surveyed all acute care hospitals in California to assess the prevalence of PCSs in the state. We defined a PCS as an interdisciplinary team that sees patients, identifies needs, makes treatment recommendations, facilitates patient and/or family decision making, and/or directly provides palliative care for patients with life‐threatening illness and their families. Hospitals that did not have a PCS were asked questions regarding plans to establish one (Is there an effort underway to establish a palliative care program in your hospital?), perceived barriers to starting one (What are 3 significant barriers or circumstances that have prevented your hospital from creating a palliative care program?), and ideas for overcoming barriers (What resources, training, policy changes would be most helpful in overcoming those barriers?). Questions that allowed for open‐ended responses were analyzed using a thematic approach.[8] Themes were initially reviewed by 1 researcher (C.J.B.), then refined and confirmed at each stage using an iterative process with other research team members (D.L.O., S.Z.P.) to reduce potential biases. Questions assessing hospital characteristics and status toward establishing a PCS provided a list of possible answers. Frequencies to these responses are reported accordingly.
RESULTS
Surveys were distributed to 376 acute care hospitals in California, of which 360 responded to the survey, resulting in a 96% response rate. Of the 360 hospitals surveyed, 46% (n=166) reported not offering any PCS. Out of the 166 that did not have PCS, 7 stated they had a PCS at some point in the last 5 years, but the program was discontinued. Hospitals without a PCS were largely for profit (75%, n=125), small with <150 beds (72%, n=120), and not affiliated with a system (63%, n=105). Overall, 34% (43/128) of hospitals reported that they had efforts underway to establish one, with 21% (9/43) expecting to start seeing patients within a year. Seventy‐two hospitals (56%, 72/128) reported that providers from local hospices aided them in providing their patients with PC, and that this approach met the needs of their patients. A total of 93 hospitals identified multiple barriers (n=186) to establishing a PCS, of which 162 responses could be categorized into 5 meaningful themes. Regarding strategies to overcome these barriers, 65 hospitals provided 72 responses that could be categorized into 5 meaningful themes (Table 1).
| Barriers and Strategies | Responses, % (n) |
|---|---|
| |
| Main barriers to establishing a PCS | 93 hospitals provided 186 barriers |
| Insufficient funding and/or resources | 31 (58) |
| Insufficient staff to support a PCS | 20 (37) |
| Perceived lack of need for a PCS | 14 (27) |
| Lack of support among nonpalliative care physicians | 13 (25) |
| Competing priorities | 8 (15) |
| Don't know/unsure | 14 (24) |
| Main strategies to overcome barriers to establishing a PCS | 65 hospitals provided 72 strategies |
| Reroute funding to establish a PCS | 28 (20) |
| Explain benefits of PCS to staff and community | 24 (17) |
| Provide a framework for how to establish a PCS | 21 (15) |
| Staff for a PCS | 18 (13) |
| Physician support | 10 (7) |
DISCUSSION
Despite citing obstacles to providing PCSs, one‐third of hospitals surveyed report that they are planning to establish a program. As an alternative, many hospitals without a PCS reported that they provide their patients with PC through partnerships with local hospice services. This approach may provide some hospitals with a practical alternative to having a PCS, especially in smaller institutions where budgets and the need for PC are proportionally small. Future surveys should account for this approach to providing PCS to patients. Sharing the strong evidence of return on investment from PCS[6, 7] with hospital leaders could help overcome the perceived barrier of cost and garner financial support. Training programs and technical assistance provided by the Palliative Care Leadership Center initiative and the Center to Advance Palliative Care have a proven track record in helping hospitals establish a PCS through mentored training,[9] and the End‐of‐Life Nursing Education Consortium has demonstrated effectiveness with nursing education.[10] These programs could provide the resources that many hospitals seek. Educating hospital leaders and clinicians about the evidence for PCSs improving care for patients with serious illness may further help to engender support for PCSs. One barrier that may be more difficult to overcome is the lack of trained PC clinicians. Efforts to educate and train generalist clinicians in primary PC may mitigate this shortfall.[1] Increasing the number of trained primary PC clinicians may also reduce fragmentation in patient care and reduce burden on specialist PC clinicians.[11] Specialty PC clinicians can also lend their expertise to hospitals seeking to start a PCS to achieve the goal of universal access to PCS.
Acknowledgements
The authors thank the Hospital Council of Northern and Central California, the Hospital Council of Southern California, and the Hospital Council of San Diego and Imperial Counties for their support in encouraging their members to participate. The authors also thank all of the respondents for their diligence and care in responding to the survey.
Disclosures
The California HealthCare Foundation provided funding to support the administration of the survey and analysis of findings, as well as limited dissemination of results though the foundation's communication venues. The authors report no conflicts of interest.
- Institute of Medicine. Dying in America: Improving Quality and Honoring Individual Preferences Near the End of Life. Washington, DC: The National Academies Press; 2014.
- , , , et al. Impact of an inpatient palliative care team: a randomized control trial. J Palliat Med. 2008;11(2):180–190.
- , , , , . A systematic review of satisfaction with care at the end of life. J Am Geriatr Soc. 2008;56(1):124–129.
- . Health care system factors affecting end‐of‐life care. J Palliat Med. 2005;8(suppl 1):S79–S87.
- , , . Impact of palliative care case management on resource use by patients dying of cancer at a Veterans Affairs medical center. J Palliat Med. 2005;8(1):26–35.
- , , , et al. Cost savings associated with US hospital palliative care consultation programs. Arch Intern Med. 2008;168(16):1783–1790.
- , , . Two steps forward, one step back: changes in palliative care consultation services in California hospitals from 2007 to 2011. J Palliat Med. 2014;17(11):1214–1220.
- , . Using qualitative methods to explore key questions in palliative care. J Palliat Med. 2009;12(8):725–730.
- , , . Center to Advance Palliative Care palliative care consultation service metrics: consensus recommendations. J Palliat Med. 2008;11(10):1294–1298.
- , , , et al. Evaluation of the End‐of‐Life Nursing Education Consortium undergraduate faculty training program. J Palliat Med. 2005;8(1):107–114.
- , . Generalist plus specialist palliative care–creating a more sustainable model. N Engl J Med. 2013;368(13):1173–1175.
Palliative care (PC) focuses on relieving distressing symptoms such as pain, dyspnea, fatigue, and depression; providing psychological, social, emotional, and spiritual support; and helping patients choose treatments consistent with their values.[1] Palliative care consultation services (PCSs) increase patient and family satisfaction,[2, 3] improve quality of life,[4] reduce resource utilization,[5] and decrease hospital expenditure.[2, 6] Hospitals that fund a PCS typically realize a sizable return on investment and good value, as these services provide better care at lower cost.[7] These benefits provide a strong rationale for all hospitals to establish a PCS. However, only 53% of acute care hospitals in California offer PC services, and only 37% have a hospital‐based PCS.[7] To increase access for patients with serious illness, it is necessary to understand the barriers that hinder the development of PCS. In this study, we asked leaders from hospitals without a PCS to describe these barriers and identify strategies that could overcome them and promote PCSs.
METHODS
In 2011, we surveyed all acute care hospitals in California to assess the prevalence of PCSs in the state. We defined a PCS as an interdisciplinary team that sees patients, identifies needs, makes treatment recommendations, facilitates patient and/or family decision making, and/or directly provides palliative care for patients with life‐threatening illness and their families. Hospitals that did not have a PCS were asked questions regarding plans to establish one (Is there an effort underway to establish a palliative care program in your hospital?), perceived barriers to starting one (What are 3 significant barriers or circumstances that have prevented your hospital from creating a palliative care program?), and ideas for overcoming barriers (What resources, training, policy changes would be most helpful in overcoming those barriers?). Questions that allowed for open‐ended responses were analyzed using a thematic approach.[8] Themes were initially reviewed by 1 researcher (C.J.B.), then refined and confirmed at each stage using an iterative process with other research team members (D.L.O., S.Z.P.) to reduce potential biases. Questions assessing hospital characteristics and status toward establishing a PCS provided a list of possible answers. Frequencies to these responses are reported accordingly.
RESULTS
Surveys were distributed to 376 acute care hospitals in California, of which 360 responded to the survey, resulting in a 96% response rate. Of the 360 hospitals surveyed, 46% (n=166) reported not offering any PCS. Out of the 166 that did not have PCS, 7 stated they had a PCS at some point in the last 5 years, but the program was discontinued. Hospitals without a PCS were largely for profit (75%, n=125), small with <150 beds (72%, n=120), and not affiliated with a system (63%, n=105). Overall, 34% (43/128) of hospitals reported that they had efforts underway to establish one, with 21% (9/43) expecting to start seeing patients within a year. Seventy‐two hospitals (56%, 72/128) reported that providers from local hospices aided them in providing their patients with PC, and that this approach met the needs of their patients. A total of 93 hospitals identified multiple barriers (n=186) to establishing a PCS, of which 162 responses could be categorized into 5 meaningful themes. Regarding strategies to overcome these barriers, 65 hospitals provided 72 responses that could be categorized into 5 meaningful themes (Table 1).
| Barriers and Strategies | Responses, % (n) |
|---|---|
| |
| Main barriers to establishing a PCS | 93 hospitals provided 186 barriers |
| Insufficient funding and/or resources | 31 (58) |
| Insufficient staff to support a PCS | 20 (37) |
| Perceived lack of need for a PCS | 14 (27) |
| Lack of support among nonpalliative care physicians | 13 (25) |
| Competing priorities | 8 (15) |
| Don't know/unsure | 14 (24) |
| Main strategies to overcome barriers to establishing a PCS | 65 hospitals provided 72 strategies |
| Reroute funding to establish a PCS | 28 (20) |
| Explain benefits of PCS to staff and community | 24 (17) |
| Provide a framework for how to establish a PCS | 21 (15) |
| Staff for a PCS | 18 (13) |
| Physician support | 10 (7) |
DISCUSSION
Despite citing obstacles to providing PCSs, one‐third of hospitals surveyed report that they are planning to establish a program. As an alternative, many hospitals without a PCS reported that they provide their patients with PC through partnerships with local hospice services. This approach may provide some hospitals with a practical alternative to having a PCS, especially in smaller institutions where budgets and the need for PC are proportionally small. Future surveys should account for this approach to providing PCS to patients. Sharing the strong evidence of return on investment from PCS[6, 7] with hospital leaders could help overcome the perceived barrier of cost and garner financial support. Training programs and technical assistance provided by the Palliative Care Leadership Center initiative and the Center to Advance Palliative Care have a proven track record in helping hospitals establish a PCS through mentored training,[9] and the End‐of‐Life Nursing Education Consortium has demonstrated effectiveness with nursing education.[10] These programs could provide the resources that many hospitals seek. Educating hospital leaders and clinicians about the evidence for PCSs improving care for patients with serious illness may further help to engender support for PCSs. One barrier that may be more difficult to overcome is the lack of trained PC clinicians. Efforts to educate and train generalist clinicians in primary PC may mitigate this shortfall.[1] Increasing the number of trained primary PC clinicians may also reduce fragmentation in patient care and reduce burden on specialist PC clinicians.[11] Specialty PC clinicians can also lend their expertise to hospitals seeking to start a PCS to achieve the goal of universal access to PCS.
Acknowledgements
The authors thank the Hospital Council of Northern and Central California, the Hospital Council of Southern California, and the Hospital Council of San Diego and Imperial Counties for their support in encouraging their members to participate. The authors also thank all of the respondents for their diligence and care in responding to the survey.
Disclosures
The California HealthCare Foundation provided funding to support the administration of the survey and analysis of findings, as well as limited dissemination of results though the foundation's communication venues. The authors report no conflicts of interest.
- Institute of Medicine. Dying in America: Improving Quality and Honoring Individual Preferences Near the End of Life. Washington, DC: The National Academies Press; 2014.
- , , , et al. Impact of an inpatient palliative care team: a randomized control trial. J Palliat Med. 2008;11(2):180–190.
- , , , , . A systematic review of satisfaction with care at the end of life. J Am Geriatr Soc. 2008;56(1):124–129.
- . Health care system factors affecting end‐of‐life care. J Palliat Med. 2005;8(suppl 1):S79–S87.
- , , . Impact of palliative care case management on resource use by patients dying of cancer at a Veterans Affairs medical center. J Palliat Med. 2005;8(1):26–35.
- , , , et al. Cost savings associated with US hospital palliative care consultation programs. Arch Intern Med. 2008;168(16):1783–1790.
- , , . Two steps forward, one step back: changes in palliative care consultation services in California hospitals from 2007 to 2011. J Palliat Med. 2014;17(11):1214–1220.
- , . Using qualitative methods to explore key questions in palliative care. J Palliat Med. 2009;12(8):725–730.
- , , . Center to Advance Palliative Care palliative care consultation service metrics: consensus recommendations. J Palliat Med. 2008;11(10):1294–1298.
- , , , et al. Evaluation of the End‐of‐Life Nursing Education Consortium undergraduate faculty training program. J Palliat Med. 2005;8(1):107–114.
- , . Generalist plus specialist palliative care–creating a more sustainable model. N Engl J Med. 2013;368(13):1173–1175.