User login
Barriers to Early Hospital Discharge: A Cross-Sectional Study at Five Academic Hospitals
Hospital discharges frequently occur in the afternoon or evening hours.1-5 Late discharges can adversely affect patient flow throughout the hospital,3,6-9 which, in turn, can result in delays in care,10-16 more medication errors,17 increased mortality,18-20 longer lengths of stay,20-22 higher costs,23 and lower patient satisfaction.24
Various interventions have been employed in the attempts to find ways of moving discharge times to earlier in the day, including preparing the discharge paperwork and medications the previous night,25 using checklists,1,25 team huddles,2 providing real-time feedback to unit staff,1 and employing multidisciplinary teamwork.1,2,6,25,26
The purpose of this study was to identify and determine the relative frequency of barriers to writing discharge orders in the hopes of identifying issues that might be addressed by targeted interventions. We also assessed the effects of daily team census, patients being on teaching versus nonteaching services, and how daily rounds were structured at the time that the discharge orders were written.
METHODS
Study Design, Setting, and Participants
We conducted a prospective, cross-sectional survey of house-staff and attending physicians on general medicine teaching and nonteaching services from November 13, 2014, through May 31, 2016. The study was conducted at the following five hospitals: Denver Health Medical Center (DHMC) and Presbyterian/Saint Luke’s Medical Center (PSL) in Denver, Colorado; Ronald Reagan University (UCLA) and Los Angeles County/University of Southern California Medical Center (LAC+USC) in Los Angeles, California; and Harborview Medical Center (HMC) in Seattle, Washington. The study was approved by the Colorado Multi-Institutional Review Board as well as by the review boards of the other participating sites.
Data Collection
The results of the focus groups composed of attending physicians at DHMC were used to develop our initial data collection template. Additional sites joining the study provided feedback, leading to modifications (Appendix 1).
Physicians were surveyed at three different time points on study days that were selected according to the convenience of the investigators. The sampling occurred only on weekdays and was done based on the investigators’ availability. Investigators would attempt to survey as many teams as they were able to but, secondary to feasibility, not all teams could be surveyed on study days. The specific time points varied as a function of physician workflows but were standardized as much as possible to occur in the early morning, around noon, and midafternoon on weekdays. Physicians were contacted either in person or by telephone for verbal consent prior to administering the first survey. All general medicine teams were eligible. For teaching teams, the order of contact was resident, intern, and then attending based on which physician was available at the time of the survey and on which member of the team was thought to know the patients the best. For the nonteaching services, the attending physicians were contacted.
During the initial survey, the investigators assessed the provider role (ie, attending or housestaff), whether the service was a teaching or a nonteaching service, and the starting patient census on that service primarily based on interviewing the provider of record for the team and looking at team census lists. Physicians were asked about their rounding style (ie, sickest patients first, patients likely to be discharged first, room-by-room, most recently admitted patients first, patients on the team the longest, or other) and then to identify all patients they thought would be definite discharges sometime during the day of the survey. Definite discharges were defined as patients whom the provider thought were either currently ready for discharge or who had only minor barriers that, if unresolved, would not prevent same-day discharge. They were asked if the discharge order had been entered and, if not, what was preventing them from doing so, if the discharge could in their opinion have occurred the day prior and, if so, why this did not occur. We also obtained the date and time of the admission and discharge orders, the actual discharge time, as well as the length of stay either through chart review (majority of sites) or from data warehouses (Denver Health and Presbyterian St. Lukes had length of stay data retrieved from their data warehouse).
Physicians were also asked to identify all patients whom they thought might possibly be discharged that day. Possible discharges were defined as patients with barriers to discharge that, if unresolved, would prevent same-day discharge. For each of these, the physicians were asked to list whatever issues needed to be resolved prior to placing the discharge order (Appendix 1).
The second survey was administered late morning on the same day, typically between 11
The third survey was administered midafternoon, typically around 3 PM similar to the first two surveys, with the exception that the third survey did not attempt to identify new definite or possible discharges.
Sample Size
We stopped collecting data after obtaining a convenience sample of 5% of total discharges at each study site or on the study end date, which was May 31, 2016, whichever came first.
Data Analysis
Data were collected and managed using a secure, web-based application electronic data capture tool (REDCap), hosted at Denver Health. REDCap (Research Electronic Data Capture, Nashville, Tennessee) is designed to support data collection for research studies.27 Data were then analyzed using SAS Enterprise Guide 5.1 (SAS Institute, Inc., Cary, North Carolina). All data entered into REDCap were reviewed by the principal investigator to ensure that data were not missing, and when there were missing data, a query was sent to verify if the data were retrievable. If retrievable, then the data would be entered. The volume of missing data that remained is described in our results.
Continuous variables were described using means and standard deviations (SD) or medians and interquartile ranges (IQR) based on tests of normality. Differences in the time that the discharge orders were placed in the electronic medical record according to morning patient census, teaching versus nonteaching service, and rounding style were compared using the Wilcoxon rank sum test. Linear regression was used to evaluate the effect of patient census on discharge order time. P < .05 was considered as significant.
RESULTS
We conducted 1,584 patient evaluations through surveys of 254 physicians over 156 days. Given surveys coincided with the existing work we had full participation (ie, 100% participation) and no dropout during the study days. Median (IQR) survey time points were 8:30
The characteristics of the five hospitals participating in the study, the patients’ final discharge status, the types of physicians surveyed, the services on which they were working, the rounding styles employed, and the median starting daily census are summarized in Table 1. The majority of the physicians surveyed were housestaff working on teaching services, and only a small minority structured rounds such that patients ready for discharge were seen first.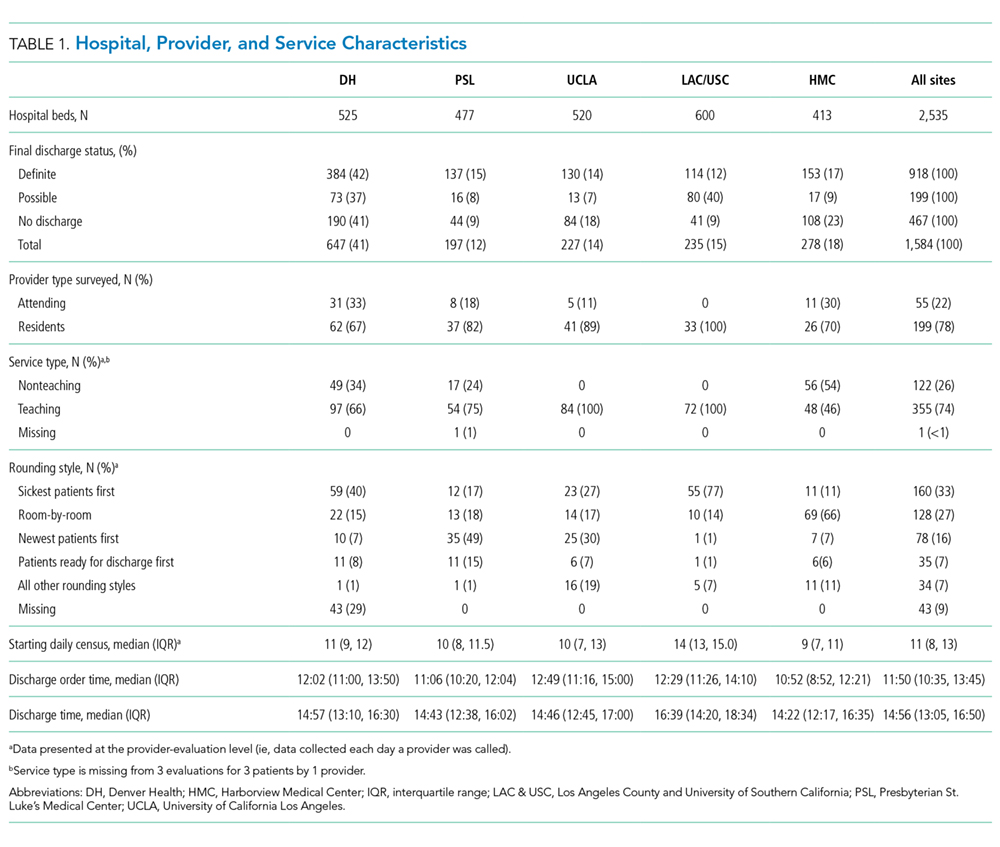
Over the course of the three surveys, 949 patients were identified as being definite discharges at any time point, and the large majority of these (863, 91%) were discharged on the day of the survey. The median (IQR) time that the discharge orders were written was 11:50
During the initial morning survey, 314 patients were identified as being definite discharges for that day (representing approximately 6% of the total number of patients being cared for, or 33% of the patients identified as definite discharges throughout the day). Of these, the physicians thought that 44 (<1% of the total number of patients being cared for on the services) could have been discharged on the previous day. The most frequent reasons cited for why these patients were not discharged on the previous day were “Patient did not want to leave” (n = 15, 34%), “Too late in the day” (n = 10, 23%), and “No ride” (n = 9, 20%). The remaining 10 patients (23%) had a variety of reasons related to system or social issues (ie, shelter not available, miscommunication).
At the morning time point, the most common barriers to discharge identified were that the physicians had not finished rounding on their team of patients and that the housestaff needed to staff their patients with their attending. At noon, caring for other patients and tending to the discharge processes were most commonly cited, and in the afternoon, the most common barriers were that the physicians were in the process of completing the discharge paperwork for those patients or were discharging other patients (Table 2). When comparing barriers on teaching to nonteaching teams, a higher proportion of teaching teams were still rounding on all patients and were working on discharge paperwork at the second survey. Barriers cited by sites were similar; however, the frequency at which the barriers were mentioned varied (data not shown).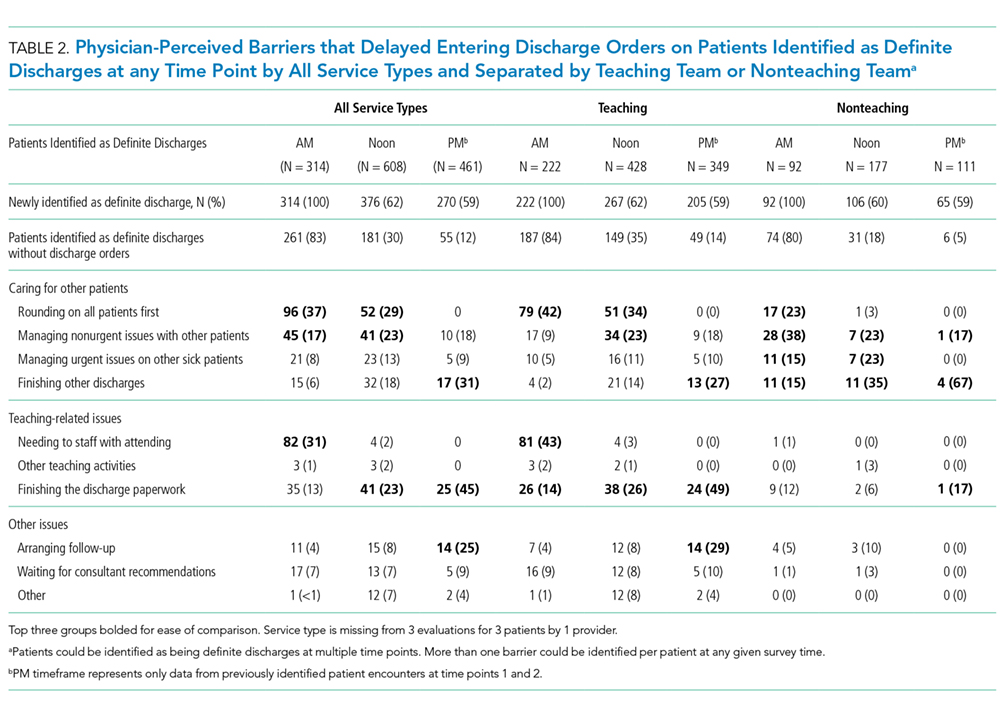
The physicians identified 1,237 patients at any time point as being possible discharges during the day of the survey and these had a mean (±SD) of 1.3 (±0.5) barriers cited for why these patients were possible rather than definite discharges. The most common were that clinical improvement was needed, one or more pending issues related to their care needed to be resolved, and/or awaiting pending test results. The need to see clinical improvement generally decreased throughout the day as did the need to staff patients with an attending physician, but barriers related to consultant recommendations or completing procedures increased (Table 3). Of the 1,237 patients ever identified as possible discharges, 594 (48%) became a definite discharge by the third call and 444 (36%) became a no discharge as their final status. As with definite discharges, barriers cited by sites were similar; however, the frequency at which the barriers were mentioned varied.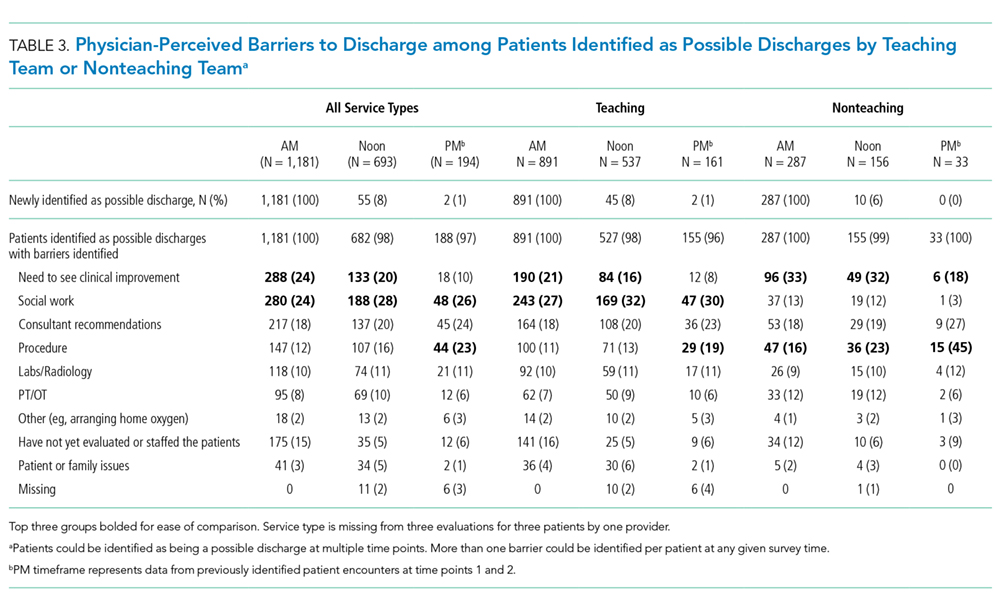
Among the 949 and 1,237 patients who were ever identified as definite or possible discharges, respectively, at any time point during the study day, 28 (3%) and 444 (36%), respectively, had their discharge status changed to no discharge, most commonly because their clinical condition either worsened or expected improvements did not occur or that barriers pertaining to social work, physical therapy, or occupational therapy were not resolved.
The median time that the discharge orders were entered into the electronic medical record was 43 minutes earlier if patients were on teams with a lower versus a higher starting census (P = .0003), 48 minutes earlier if they were seen by physicians whose rounding style was to see patients first who potentially could be discharged (P = .0026), and 58 minutes earlier if they were on nonteaching versus teaching services (P < .0001; Table 4). For every one-person increase in census, the discharge order time increased by 6 minutes (β = 5.6, SE = 1.6, P = .0003).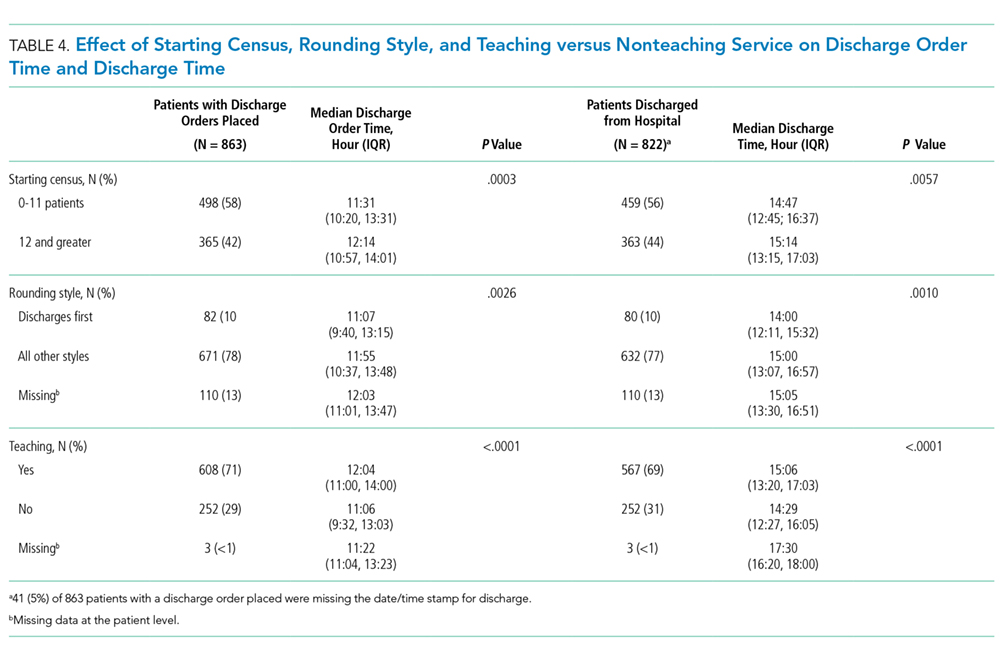
DISCUSSION
The important findings of this study are that (1) the large majority of issues thought to delay discharging patients identified as definite discharges were related to physicians caring for other patients on their team, (2) although 91% of patients ever identified as being definite discharges were discharged on the day of the survey, only 48% of those identified as possible discharges became definite discharges by the afternoon time point, largely because the anticipated clinical improvement did not occur or care being provided by ancillary services had not been completed, and (3) discharge orders on patients identified as definite discharges were written on average 50 minutes earlier by physicians on teams with a smaller starting patient census, on nonteaching services, or when the rounding style was to see patients ready for discharges first.
Previous research has reported that physician-perceived barriers to discharge were extrinsic to providers and even extrinsic to the hospital setting (eg, awaiting subacute nursing placement and transportation).28,29 However, many of the barriers that we identified were related directly to the providers’ workload and rounding styles and whether the patients were on teaching versus nonteaching services. We also found that delays in the ability of hospital services to complete care also contributed to delayed discharges.
Our observational data suggest that delays resulting from caring for other patients might be reduced by changing rounding styles such that patients ready for discharge are seen first and are discharged prior to seeing other patients on the team, as previously reported by Beck et al.30 Intuitively, this would seem to be a straightforward way of freeing up beds earlier in the day, but such a change will, of necessity, lead to delaying care for other patients, which, in turn, could increase their length of stays. Durvasula et al. suggested that discharges could be moved to earlier in the day by completing orders and paperwork the day prior to discharge.25 Such an approach might be effective on an Obstetrical or elective Orthopedic service on which patients predictably are hospitalized for a fixed number of days (or even hours) but may be less relevant to patients on internal medicine services where lengths of stay are less predictable. Interventions to improve discharge times have resulted in earlier discharge times in some studies,2,4 but the overall length of stay either did not decrease25 or increased31 in others. Werthheimer et al.1 did find earlier discharge times, but other interventions also occurred during the study period (eg, extending social work services to include weekends).1,32
We found that discharge times were approximately 50 minutes earlier on teams with a smaller starting census, on nonteaching compared with teaching services, or when the attending’s rounding style was to see patients ready for discharges first. Although 50 minutes may seem like a small change in discharge time, Khanna et al.33 found that when discharges occur even 1 hour earlier, hospital overcrowding is reduced. To have a lower team census would require having more teams and more providers to staff these teams, raising cost-effectiveness concerns. Moving to more nonteaching services could represent a conflict with respect to one of the missions of teaching hospitals and raises a cost-benefit issue as several teaching hospitals receive substantial funding in support of their teaching activities and housestaff would have to be replaced with more expensive providers.
Delays attributable to ancillary services indicate imbalances between demand and availability of these services. Inappropriate demand and inefficiencies could be reduced by systems redesign, but in at least some instances, additional resources will be needed to add staff, increase space, or add additional equipment.
Our study has several limitations. First, we surveyed only physicians working in university-affiliated hospitals, and three of these were public safety-net hospitals. Accordingly, our results may not be generalizable to different patient populations. Second, we surveyed only physicians, and Minichiello et al.29 found that barriers to discharge perceived by physicians were different from those of other staff. Third, our data were observational and were collected only on weekdays. Fourth, we did not differentiate interns from residents, and thus, potentially the level of training could have affected these results. Similarly, the decision for a “possible” and a “definite” discharge is likely dependent on the knowledge base of the participant, such that less experienced participants may have had differing perspectives than someone with more experience. Fifth, the sites did vary based on the infrastructure and support but also had several similarities. All sites had social work and case management involved in care, although at some sites, they were assigned according to team and at others according to geographic location. Similarly, rounding times varied. Most of the services surveyed did not utilize advanced practice providers (the exception was the nonteaching services at Denver Health, and their presence was variable). These differences in staffing models could also have affected these results.
Our study also has a number of strengths. First, we assessed the barriers at five different hospitals. Second, we collected real-time data related to specific barriers at multiple time points throughout the day, allowing us to assess the dynamic nature of identifying patients as being ready or nearly ready for discharge. Third, we assessed the perceptions of barriers to discharge from physicians working on teaching as well as nonteaching services and from physicians utilizing a variety of rounding styles. Fourth, we had a very high participation rate (100%), probably due to the fact that our study was strategically aligned with participants’ daily work activities.
In conclusion, we found two distinct categories of issues that physicians perceived as most commonly delaying writing discharge orders on their patients. The first pertained to patients thought to definitely be ready for discharge and was related to the physicians having to care for other patients on their team. The second pertained to patients identified as possibly ready for discharge and was related to the need for care to be completed by a variety of ancillary services. Addressing each of these barriers would require different interventions and a need to weigh the potential improvements that could be achieved against the increased costs and/or delays in care for other patients that may result.
Disclosures
The authors report no conflicts of interest relevant to this work.
1. Wertheimer B, Jacobs RE, Bailey M, et al. Discharge before noon: an achievable hospital goal. J Hosp Med. 2014;9(4):210-214. doi: 10.1002/jhm.2154. PubMed
2. Kane M, Weinacker A, Arthofer R, et al. A multidisciplinary initiative to increase inpatient discharges before noon. J Nurs Adm. 2016;46(12):630-635. doi: 10.1097/NNA.0000000000000418. PubMed
3. Khanna S, Sier D, Boyle J, Zeitz K. Discharge timeliness and its impact on hospital crowding and emergency department flow performance. Emerg Med Australas. 2016;28(2):164-170. doi: 10.1111/1742-6723.12543. PubMed
4. Kravet SJ, Levine RB, Rubin HR, Wright SM. Discharging patients earlier in the day: a concept worth evaluating. Health Care Manag (Frederick). 2007;26:142-146. doi: 10.1097/01.HCM.0000268617.33491.60. PubMed
5. Khanna S, Boyle J, Good N, Lind J. Impact of admission and discharge peak times on hospital overcrowding. Stud Health Technol Inform. 2011;168:82-88. doi: 10.3233/978-1-60750-791-8-82. PubMed
6. McGowan JE, Truwit JD, Cipriano P, et al. Operating room efficiency and hospital capacity: factors affecting operating room use during maximum hospital census. J Am Coll Surg. 2007;204(5):865-871; discussion 71-72. doi: 10.1016/j.jamcollsurg.2007.01.052 PubMed
7. Khanna S, Boyle J, Good N, Lind J. Early discharge and its effect on ED length of stay and access block. Stud Health Technol Inform. 2012;178:92-98. doi: 10.3233/978-1-61499-078-9-92 PubMed
8. Powell ES, Khare RK, Venkatesh AK, Van Roo BD, Adams JG, Reinhardt G. The relationship between inpatient discharge timing and emergency department boarding. J Emerg Med. 2012;42(2):186-196. doi: 10.1016/j.jemermed.2010.06.028. PubMed
9. Wertheimer B, Jacobs RE, Iturrate E, Bailey M, Hochman K. Discharge before noon: Effect on throughput and sustainability. J Hosp Med. 2015;10(10):664-669. doi: 10.1002/jhm.2412. PubMed
10. Sikka R, Mehta S, Kaucky C, Kulstad EB. ED crowding is associated with an increased time to pneumonia treatment. Am J Emerg Med. 2010;28(7):809-812. doi: 10.1016/j.ajem.2009.06.023. PubMed
11. Coil CJ, Flood JD, Belyeu BM, Young P, Kaji AH, Lewis RJ. The effect of emergency department boarding on order completion. Ann Emerg Med. 2016;67:730-736 e2. doi: 10.1016/j.annemergmed.2015.09.018. PubMed
12. Gaieski DF, Agarwal AK, Mikkelsen ME, et al. The impact of ED crowding on early interventions and mortality in patients with severe sepsis. Am J Emerg Med. 2017;35:953-960. doi: 10.1016/j.ajem.2017.01.061. PubMed
13. Pines JM, Localio AR, Hollander JE, et al. The impact of emergency department crowding measures on time to antibiotics for patients with community-acquired pneumonia. Ann Emerg Med. 2007;50(5):510-516. doi: 10.1016/j.annemergmed.2007.07.021. PubMed
14. Hwang U, Richardson L, Livote E, Harris B, Spencer N, Sean Morrison R. Emergency department crowding and decreased quality of pain care. Acad Emerg Med. 2008;15:1248-1255. doi: 10.1111/j.1553-2712.2008.00267.x. PubMed
15. Mills AM, Shofer FS, Chen EH, Hollander JE, Pines JM. The association between emergency department crowding and analgesia administration in acute abdominal pain patients. Acad Emerg Med. 2009;16:603-608. doi: 10.1111/j.1553-2712.2009.00441.x. PubMed
16. Pines JM, Shofer FS, Isserman JA, Abbuhl SB, Mills AM. The effect of emergency department crowding on analgesia in patients with back pain in two hospitals. Acad Emerg Med. 2010;17(3):276-283. doi: 10.1111/j.1553-2712.2009.00676.x. PubMed
17. Kulstad EB, Sikka R, Sweis RT, Kelley KM, Rzechula KH. ED overcrowding is associated with an increased frequency of medication errors. Am J Emerg Med. 2010;28:304-309. doi: 10.1016/j.ajem.2008.12.014. PubMed
18. Richardson DB. Increase in patient mortality at 10 days associated with emergency department overcrowding. Med J Aust. 2006;184(5):213-216. PubMed
19. Hoot NR, Aronsky D. Systematic review of emergency department crowding: causes, effects, and solutions. Ann Emerg Med. 2008;52(2):126-136. doi: 10.1016/j.annemergmed.2008.03.014. PubMed
20. Singer AJ, Thode HC, Jr., Viccellio P, Pines JM. The association between length of emergency department boarding and mortality. Acad Emerg Med. 2011;18(12):1324-1329. doi: 10.1111/j.1553-2712.2011.01236.x. PubMed
21. White BA, Biddinger PD, Chang Y, Grabowski B, Carignan S, Brown DF. Boarding inpatients in the emergency department increases discharged patient length of stay. J Emerg Med. 2013;44(1):230-235. doi: 10.1016/j.jemermed.2012.05.007. PubMed
22. Forster AJ, Stiell I, Wells G, Lee AJ, van Walraven C. The effect of hospital occupancy on emergency department length of stay and patient disposition. Acad Emerg Med. 2003;10(2):127-133. doi: 10.1197/aemj.10.2.127. PubMed
23. Foley M, Kifaieh N, Mallon WK. Financial impact of emergency department crowding. West J Emerg Med. 2011;12(2):192-197. PubMed
24. Pines JM, Iyer S, Disbot M, Hollander JE, Shofer FS, Datner EM. The effect of emergency department crowding on patient satisfaction for admitted patients. Acad Emerg Med. 2008;15(9):825-831. doi: 10.1111/j.1553-2712.2008.00200.x. PubMed
25. Durvasula R, Kayihan A, Del Bene S, et al. A multidisciplinary care pathway significantly increases the number of early morning discharges in a large academic medical center. Qual Manag Health Care. 2015;24:45-51. doi: 10.1097/QMH.0000000000000049. PubMed
26. Cho HJ, Desai N, Florendo A, et al. E-DIP: Early Discharge Project. A Model for Throughput and Early Discharge for 1-Day Admissions. BMJ Qual Improv Rep. 2016;5(1): pii: u210035.w4128. doi: 10.1136/bmjquality.u210035.w4128. PubMed
27. Harris PA, Taylor R, Thielke R, Payne J, Gonzalez N, Conde JG. Research electronic data capture (REDCap)--a metadata-driven methodology and workflow process for providing translational research informatics support. J Biomed Inform. 2009;42(2):377-381. doi: 10.1016/j.jbi.2008.08.010. PubMed
28. Patel H, Fang MC, Mourad M, et al. Hospitalist and internal medicine leaders’ perspectives of early discharge challenges at academic medical centers. J Hosp Med. 2018;13(6):388-391. doi: 10.12788/jhm.2885. PubMed
29. Minichiello TM, Auerbach AD, Wachter RM. Caregiver perceptions of the reasons for delayed hospital discharge. Eff Clin Pract. 2001;4(6):250-255. PubMed
30. Beck MJ, Okerblom D, Kumar A, Bandyopadhyay S, Scalzi LV. Lean intervention improves patient discharge times, improves emergency department throughput and reduces congestion. Hosp Pract (1995). 2016;44(5):252-259. doi: 10.1080/21548331.2016.1254559. PubMed
31. Rajkomar A, Valencia V, Novelero M, Mourad M, Auerbach A. The association between discharge before noon and length of stay in medical and surgical patients. J Hosp Med. 2016;11(12):859-861. doi: 10.1002/jhm.2529. PubMed
32. Shine D. Discharge before noon: an urban legend. Am J Med. 2015;128(5):445-446. doi: 10.1016/j.amjmed.2014.12.011. PubMed 33. Khanna S, Boyle J, Good N, Lind J. Unravelling relationships: Hospital occupancy levels, discharge timing and emergency department access block. Emerg Med Australas. 2012;24(5):510-517. doi: 10.1111/j.1742-6723.2012.01587.x. PubMed
Hospital discharges frequently occur in the afternoon or evening hours.1-5 Late discharges can adversely affect patient flow throughout the hospital,3,6-9 which, in turn, can result in delays in care,10-16 more medication errors,17 increased mortality,18-20 longer lengths of stay,20-22 higher costs,23 and lower patient satisfaction.24
Various interventions have been employed in the attempts to find ways of moving discharge times to earlier in the day, including preparing the discharge paperwork and medications the previous night,25 using checklists,1,25 team huddles,2 providing real-time feedback to unit staff,1 and employing multidisciplinary teamwork.1,2,6,25,26
The purpose of this study was to identify and determine the relative frequency of barriers to writing discharge orders in the hopes of identifying issues that might be addressed by targeted interventions. We also assessed the effects of daily team census, patients being on teaching versus nonteaching services, and how daily rounds were structured at the time that the discharge orders were written.
METHODS
Study Design, Setting, and Participants
We conducted a prospective, cross-sectional survey of house-staff and attending physicians on general medicine teaching and nonteaching services from November 13, 2014, through May 31, 2016. The study was conducted at the following five hospitals: Denver Health Medical Center (DHMC) and Presbyterian/Saint Luke’s Medical Center (PSL) in Denver, Colorado; Ronald Reagan University (UCLA) and Los Angeles County/University of Southern California Medical Center (LAC+USC) in Los Angeles, California; and Harborview Medical Center (HMC) in Seattle, Washington. The study was approved by the Colorado Multi-Institutional Review Board as well as by the review boards of the other participating sites.
Data Collection
The results of the focus groups composed of attending physicians at DHMC were used to develop our initial data collection template. Additional sites joining the study provided feedback, leading to modifications (Appendix 1).
Physicians were surveyed at three different time points on study days that were selected according to the convenience of the investigators. The sampling occurred only on weekdays and was done based on the investigators’ availability. Investigators would attempt to survey as many teams as they were able to but, secondary to feasibility, not all teams could be surveyed on study days. The specific time points varied as a function of physician workflows but were standardized as much as possible to occur in the early morning, around noon, and midafternoon on weekdays. Physicians were contacted either in person or by telephone for verbal consent prior to administering the first survey. All general medicine teams were eligible. For teaching teams, the order of contact was resident, intern, and then attending based on which physician was available at the time of the survey and on which member of the team was thought to know the patients the best. For the nonteaching services, the attending physicians were contacted.
During the initial survey, the investigators assessed the provider role (ie, attending or housestaff), whether the service was a teaching or a nonteaching service, and the starting patient census on that service primarily based on interviewing the provider of record for the team and looking at team census lists. Physicians were asked about their rounding style (ie, sickest patients first, patients likely to be discharged first, room-by-room, most recently admitted patients first, patients on the team the longest, or other) and then to identify all patients they thought would be definite discharges sometime during the day of the survey. Definite discharges were defined as patients whom the provider thought were either currently ready for discharge or who had only minor barriers that, if unresolved, would not prevent same-day discharge. They were asked if the discharge order had been entered and, if not, what was preventing them from doing so, if the discharge could in their opinion have occurred the day prior and, if so, why this did not occur. We also obtained the date and time of the admission and discharge orders, the actual discharge time, as well as the length of stay either through chart review (majority of sites) or from data warehouses (Denver Health and Presbyterian St. Lukes had length of stay data retrieved from their data warehouse).
Physicians were also asked to identify all patients whom they thought might possibly be discharged that day. Possible discharges were defined as patients with barriers to discharge that, if unresolved, would prevent same-day discharge. For each of these, the physicians were asked to list whatever issues needed to be resolved prior to placing the discharge order (Appendix 1).
The second survey was administered late morning on the same day, typically between 11
The third survey was administered midafternoon, typically around 3 PM similar to the first two surveys, with the exception that the third survey did not attempt to identify new definite or possible discharges.
Sample Size
We stopped collecting data after obtaining a convenience sample of 5% of total discharges at each study site or on the study end date, which was May 31, 2016, whichever came first.
Data Analysis
Data were collected and managed using a secure, web-based application electronic data capture tool (REDCap), hosted at Denver Health. REDCap (Research Electronic Data Capture, Nashville, Tennessee) is designed to support data collection for research studies.27 Data were then analyzed using SAS Enterprise Guide 5.1 (SAS Institute, Inc., Cary, North Carolina). All data entered into REDCap were reviewed by the principal investigator to ensure that data were not missing, and when there were missing data, a query was sent to verify if the data were retrievable. If retrievable, then the data would be entered. The volume of missing data that remained is described in our results.
Continuous variables were described using means and standard deviations (SD) or medians and interquartile ranges (IQR) based on tests of normality. Differences in the time that the discharge orders were placed in the electronic medical record according to morning patient census, teaching versus nonteaching service, and rounding style were compared using the Wilcoxon rank sum test. Linear regression was used to evaluate the effect of patient census on discharge order time. P < .05 was considered as significant.
RESULTS
We conducted 1,584 patient evaluations through surveys of 254 physicians over 156 days. Given surveys coincided with the existing work we had full participation (ie, 100% participation) and no dropout during the study days. Median (IQR) survey time points were 8:30
The characteristics of the five hospitals participating in the study, the patients’ final discharge status, the types of physicians surveyed, the services on which they were working, the rounding styles employed, and the median starting daily census are summarized in Table 1. The majority of the physicians surveyed were housestaff working on teaching services, and only a small minority structured rounds such that patients ready for discharge were seen first.
Over the course of the three surveys, 949 patients were identified as being definite discharges at any time point, and the large majority of these (863, 91%) were discharged on the day of the survey. The median (IQR) time that the discharge orders were written was 11:50
During the initial morning survey, 314 patients were identified as being definite discharges for that day (representing approximately 6% of the total number of patients being cared for, or 33% of the patients identified as definite discharges throughout the day). Of these, the physicians thought that 44 (<1% of the total number of patients being cared for on the services) could have been discharged on the previous day. The most frequent reasons cited for why these patients were not discharged on the previous day were “Patient did not want to leave” (n = 15, 34%), “Too late in the day” (n = 10, 23%), and “No ride” (n = 9, 20%). The remaining 10 patients (23%) had a variety of reasons related to system or social issues (ie, shelter not available, miscommunication).
At the morning time point, the most common barriers to discharge identified were that the physicians had not finished rounding on their team of patients and that the housestaff needed to staff their patients with their attending. At noon, caring for other patients and tending to the discharge processes were most commonly cited, and in the afternoon, the most common barriers were that the physicians were in the process of completing the discharge paperwork for those patients or were discharging other patients (Table 2). When comparing barriers on teaching to nonteaching teams, a higher proportion of teaching teams were still rounding on all patients and were working on discharge paperwork at the second survey. Barriers cited by sites were similar; however, the frequency at which the barriers were mentioned varied (data not shown).
The physicians identified 1,237 patients at any time point as being possible discharges during the day of the survey and these had a mean (±SD) of 1.3 (±0.5) barriers cited for why these patients were possible rather than definite discharges. The most common were that clinical improvement was needed, one or more pending issues related to their care needed to be resolved, and/or awaiting pending test results. The need to see clinical improvement generally decreased throughout the day as did the need to staff patients with an attending physician, but barriers related to consultant recommendations or completing procedures increased (Table 3). Of the 1,237 patients ever identified as possible discharges, 594 (48%) became a definite discharge by the third call and 444 (36%) became a no discharge as their final status. As with definite discharges, barriers cited by sites were similar; however, the frequency at which the barriers were mentioned varied.
Among the 949 and 1,237 patients who were ever identified as definite or possible discharges, respectively, at any time point during the study day, 28 (3%) and 444 (36%), respectively, had their discharge status changed to no discharge, most commonly because their clinical condition either worsened or expected improvements did not occur or that barriers pertaining to social work, physical therapy, or occupational therapy were not resolved.
The median time that the discharge orders were entered into the electronic medical record was 43 minutes earlier if patients were on teams with a lower versus a higher starting census (P = .0003), 48 minutes earlier if they were seen by physicians whose rounding style was to see patients first who potentially could be discharged (P = .0026), and 58 minutes earlier if they were on nonteaching versus teaching services (P < .0001; Table 4). For every one-person increase in census, the discharge order time increased by 6 minutes (β = 5.6, SE = 1.6, P = .0003).
DISCUSSION
The important findings of this study are that (1) the large majority of issues thought to delay discharging patients identified as definite discharges were related to physicians caring for other patients on their team, (2) although 91% of patients ever identified as being definite discharges were discharged on the day of the survey, only 48% of those identified as possible discharges became definite discharges by the afternoon time point, largely because the anticipated clinical improvement did not occur or care being provided by ancillary services had not been completed, and (3) discharge orders on patients identified as definite discharges were written on average 50 minutes earlier by physicians on teams with a smaller starting patient census, on nonteaching services, or when the rounding style was to see patients ready for discharges first.
Previous research has reported that physician-perceived barriers to discharge were extrinsic to providers and even extrinsic to the hospital setting (eg, awaiting subacute nursing placement and transportation).28,29 However, many of the barriers that we identified were related directly to the providers’ workload and rounding styles and whether the patients were on teaching versus nonteaching services. We also found that delays in the ability of hospital services to complete care also contributed to delayed discharges.
Our observational data suggest that delays resulting from caring for other patients might be reduced by changing rounding styles such that patients ready for discharge are seen first and are discharged prior to seeing other patients on the team, as previously reported by Beck et al.30 Intuitively, this would seem to be a straightforward way of freeing up beds earlier in the day, but such a change will, of necessity, lead to delaying care for other patients, which, in turn, could increase their length of stays. Durvasula et al. suggested that discharges could be moved to earlier in the day by completing orders and paperwork the day prior to discharge.25 Such an approach might be effective on an Obstetrical or elective Orthopedic service on which patients predictably are hospitalized for a fixed number of days (or even hours) but may be less relevant to patients on internal medicine services where lengths of stay are less predictable. Interventions to improve discharge times have resulted in earlier discharge times in some studies,2,4 but the overall length of stay either did not decrease25 or increased31 in others. Werthheimer et al.1 did find earlier discharge times, but other interventions also occurred during the study period (eg, extending social work services to include weekends).1,32
We found that discharge times were approximately 50 minutes earlier on teams with a smaller starting census, on nonteaching compared with teaching services, or when the attending’s rounding style was to see patients ready for discharges first. Although 50 minutes may seem like a small change in discharge time, Khanna et al.33 found that when discharges occur even 1 hour earlier, hospital overcrowding is reduced. To have a lower team census would require having more teams and more providers to staff these teams, raising cost-effectiveness concerns. Moving to more nonteaching services could represent a conflict with respect to one of the missions of teaching hospitals and raises a cost-benefit issue as several teaching hospitals receive substantial funding in support of their teaching activities and housestaff would have to be replaced with more expensive providers.
Delays attributable to ancillary services indicate imbalances between demand and availability of these services. Inappropriate demand and inefficiencies could be reduced by systems redesign, but in at least some instances, additional resources will be needed to add staff, increase space, or add additional equipment.
Our study has several limitations. First, we surveyed only physicians working in university-affiliated hospitals, and three of these were public safety-net hospitals. Accordingly, our results may not be generalizable to different patient populations. Second, we surveyed only physicians, and Minichiello et al.29 found that barriers to discharge perceived by physicians were different from those of other staff. Third, our data were observational and were collected only on weekdays. Fourth, we did not differentiate interns from residents, and thus, potentially the level of training could have affected these results. Similarly, the decision for a “possible” and a “definite” discharge is likely dependent on the knowledge base of the participant, such that less experienced participants may have had differing perspectives than someone with more experience. Fifth, the sites did vary based on the infrastructure and support but also had several similarities. All sites had social work and case management involved in care, although at some sites, they were assigned according to team and at others according to geographic location. Similarly, rounding times varied. Most of the services surveyed did not utilize advanced practice providers (the exception was the nonteaching services at Denver Health, and their presence was variable). These differences in staffing models could also have affected these results.
Our study also has a number of strengths. First, we assessed the barriers at five different hospitals. Second, we collected real-time data related to specific barriers at multiple time points throughout the day, allowing us to assess the dynamic nature of identifying patients as being ready or nearly ready for discharge. Third, we assessed the perceptions of barriers to discharge from physicians working on teaching as well as nonteaching services and from physicians utilizing a variety of rounding styles. Fourth, we had a very high participation rate (100%), probably due to the fact that our study was strategically aligned with participants’ daily work activities.
In conclusion, we found two distinct categories of issues that physicians perceived as most commonly delaying writing discharge orders on their patients. The first pertained to patients thought to definitely be ready for discharge and was related to the physicians having to care for other patients on their team. The second pertained to patients identified as possibly ready for discharge and was related to the need for care to be completed by a variety of ancillary services. Addressing each of these barriers would require different interventions and a need to weigh the potential improvements that could be achieved against the increased costs and/or delays in care for other patients that may result.
Disclosures
The authors report no conflicts of interest relevant to this work.
1. Wertheimer B, Jacobs RE, Bailey M, et al. Discharge before noon: an achievable hospital goal. J Hosp Med. 2014;9(4):210-214. doi: 10.1002/jhm.2154. PubMed
2. Kane M, Weinacker A, Arthofer R, et al. A multidisciplinary initiative to increase inpatient discharges before noon. J Nurs Adm. 2016;46(12):630-635. doi: 10.1097/NNA.0000000000000418. PubMed
3. Khanna S, Sier D, Boyle J, Zeitz K. Discharge timeliness and its impact on hospital crowding and emergency department flow performance. Emerg Med Australas. 2016;28(2):164-170. doi: 10.1111/1742-6723.12543. PubMed
4. Kravet SJ, Levine RB, Rubin HR, Wright SM. Discharging patients earlier in the day: a concept worth evaluating. Health Care Manag (Frederick). 2007;26:142-146. doi: 10.1097/01.HCM.0000268617.33491.60. PubMed
5. Khanna S, Boyle J, Good N, Lind J. Impact of admission and discharge peak times on hospital overcrowding. Stud Health Technol Inform. 2011;168:82-88. doi: 10.3233/978-1-60750-791-8-82. PubMed
6. McGowan JE, Truwit JD, Cipriano P, et al. Operating room efficiency and hospital capacity: factors affecting operating room use during maximum hospital census. J Am Coll Surg. 2007;204(5):865-871; discussion 71-72. doi: 10.1016/j.jamcollsurg.2007.01.052 PubMed
7. Khanna S, Boyle J, Good N, Lind J. Early discharge and its effect on ED length of stay and access block. Stud Health Technol Inform. 2012;178:92-98. doi: 10.3233/978-1-61499-078-9-92 PubMed
8. Powell ES, Khare RK, Venkatesh AK, Van Roo BD, Adams JG, Reinhardt G. The relationship between inpatient discharge timing and emergency department boarding. J Emerg Med. 2012;42(2):186-196. doi: 10.1016/j.jemermed.2010.06.028. PubMed
9. Wertheimer B, Jacobs RE, Iturrate E, Bailey M, Hochman K. Discharge before noon: Effect on throughput and sustainability. J Hosp Med. 2015;10(10):664-669. doi: 10.1002/jhm.2412. PubMed
10. Sikka R, Mehta S, Kaucky C, Kulstad EB. ED crowding is associated with an increased time to pneumonia treatment. Am J Emerg Med. 2010;28(7):809-812. doi: 10.1016/j.ajem.2009.06.023. PubMed
11. Coil CJ, Flood JD, Belyeu BM, Young P, Kaji AH, Lewis RJ. The effect of emergency department boarding on order completion. Ann Emerg Med. 2016;67:730-736 e2. doi: 10.1016/j.annemergmed.2015.09.018. PubMed
12. Gaieski DF, Agarwal AK, Mikkelsen ME, et al. The impact of ED crowding on early interventions and mortality in patients with severe sepsis. Am J Emerg Med. 2017;35:953-960. doi: 10.1016/j.ajem.2017.01.061. PubMed
13. Pines JM, Localio AR, Hollander JE, et al. The impact of emergency department crowding measures on time to antibiotics for patients with community-acquired pneumonia. Ann Emerg Med. 2007;50(5):510-516. doi: 10.1016/j.annemergmed.2007.07.021. PubMed
14. Hwang U, Richardson L, Livote E, Harris B, Spencer N, Sean Morrison R. Emergency department crowding and decreased quality of pain care. Acad Emerg Med. 2008;15:1248-1255. doi: 10.1111/j.1553-2712.2008.00267.x. PubMed
15. Mills AM, Shofer FS, Chen EH, Hollander JE, Pines JM. The association between emergency department crowding and analgesia administration in acute abdominal pain patients. Acad Emerg Med. 2009;16:603-608. doi: 10.1111/j.1553-2712.2009.00441.x. PubMed
16. Pines JM, Shofer FS, Isserman JA, Abbuhl SB, Mills AM. The effect of emergency department crowding on analgesia in patients with back pain in two hospitals. Acad Emerg Med. 2010;17(3):276-283. doi: 10.1111/j.1553-2712.2009.00676.x. PubMed
17. Kulstad EB, Sikka R, Sweis RT, Kelley KM, Rzechula KH. ED overcrowding is associated with an increased frequency of medication errors. Am J Emerg Med. 2010;28:304-309. doi: 10.1016/j.ajem.2008.12.014. PubMed
18. Richardson DB. Increase in patient mortality at 10 days associated with emergency department overcrowding. Med J Aust. 2006;184(5):213-216. PubMed
19. Hoot NR, Aronsky D. Systematic review of emergency department crowding: causes, effects, and solutions. Ann Emerg Med. 2008;52(2):126-136. doi: 10.1016/j.annemergmed.2008.03.014. PubMed
20. Singer AJ, Thode HC, Jr., Viccellio P, Pines JM. The association between length of emergency department boarding and mortality. Acad Emerg Med. 2011;18(12):1324-1329. doi: 10.1111/j.1553-2712.2011.01236.x. PubMed
21. White BA, Biddinger PD, Chang Y, Grabowski B, Carignan S, Brown DF. Boarding inpatients in the emergency department increases discharged patient length of stay. J Emerg Med. 2013;44(1):230-235. doi: 10.1016/j.jemermed.2012.05.007. PubMed
22. Forster AJ, Stiell I, Wells G, Lee AJ, van Walraven C. The effect of hospital occupancy on emergency department length of stay and patient disposition. Acad Emerg Med. 2003;10(2):127-133. doi: 10.1197/aemj.10.2.127. PubMed
23. Foley M, Kifaieh N, Mallon WK. Financial impact of emergency department crowding. West J Emerg Med. 2011;12(2):192-197. PubMed
24. Pines JM, Iyer S, Disbot M, Hollander JE, Shofer FS, Datner EM. The effect of emergency department crowding on patient satisfaction for admitted patients. Acad Emerg Med. 2008;15(9):825-831. doi: 10.1111/j.1553-2712.2008.00200.x. PubMed
25. Durvasula R, Kayihan A, Del Bene S, et al. A multidisciplinary care pathway significantly increases the number of early morning discharges in a large academic medical center. Qual Manag Health Care. 2015;24:45-51. doi: 10.1097/QMH.0000000000000049. PubMed
26. Cho HJ, Desai N, Florendo A, et al. E-DIP: Early Discharge Project. A Model for Throughput and Early Discharge for 1-Day Admissions. BMJ Qual Improv Rep. 2016;5(1): pii: u210035.w4128. doi: 10.1136/bmjquality.u210035.w4128. PubMed
27. Harris PA, Taylor R, Thielke R, Payne J, Gonzalez N, Conde JG. Research electronic data capture (REDCap)--a metadata-driven methodology and workflow process for providing translational research informatics support. J Biomed Inform. 2009;42(2):377-381. doi: 10.1016/j.jbi.2008.08.010. PubMed
28. Patel H, Fang MC, Mourad M, et al. Hospitalist and internal medicine leaders’ perspectives of early discharge challenges at academic medical centers. J Hosp Med. 2018;13(6):388-391. doi: 10.12788/jhm.2885. PubMed
29. Minichiello TM, Auerbach AD, Wachter RM. Caregiver perceptions of the reasons for delayed hospital discharge. Eff Clin Pract. 2001;4(6):250-255. PubMed
30. Beck MJ, Okerblom D, Kumar A, Bandyopadhyay S, Scalzi LV. Lean intervention improves patient discharge times, improves emergency department throughput and reduces congestion. Hosp Pract (1995). 2016;44(5):252-259. doi: 10.1080/21548331.2016.1254559. PubMed
31. Rajkomar A, Valencia V, Novelero M, Mourad M, Auerbach A. The association between discharge before noon and length of stay in medical and surgical patients. J Hosp Med. 2016;11(12):859-861. doi: 10.1002/jhm.2529. PubMed
32. Shine D. Discharge before noon: an urban legend. Am J Med. 2015;128(5):445-446. doi: 10.1016/j.amjmed.2014.12.011. PubMed33. Khanna S, Boyle J, Good N, Lind J. Unravelling relationships: Hospital occupancy levels, discharge timing and emergency department access block. Emerg Med Australas. 2012;24(5):510-517. doi: 10.1111/j.1742-6723.2012.01587.x. PubMed

Real‐Time Patient Experience Surveys
In 2010, the Centers for Medicare and Medicaid Services implemented value‐based purchasing, a payment model that incentivizes hospitals for reaching certain quality and patient experience thresholds and penalizes those that do not, in part on the basis of patient satisfaction scores.[1] Although low patient satisfaction scores will adversely affect institutions financially, they also reflect patients' perceptions of their care. Some studies suggest that hospitals with higher patient satisfaction scores score higher overall on clinical care processes such as core measures compliance, readmission rates, lower mortality rates, and other quality‐of‐care metrics.[2, 3, 4, 5, 6, 7, 8, 9, 10, 11]
The Hospital Consumer Assessment of Healthcare Providers and Systems (HCAHPS) survey assesses patients' experience following their hospital stay.[1] The percent of top box scores (ie, response of always on a four point scale, or scores of 9 or 10 on a 10‐point scale) are utilized to compare hospitals and determine the reimbursement or penalty a hospital will receive. Although these scores are available to the public on the Hospital Compare website,[12] physicians may not know how their hospital is ranked or how they are individually perceived by their patients. Additionally, these surveys are typically conducted 48 hours to 6 weeks after patients are discharged, and the results are distributed back to the hospitals well after the time that care was provided, thereby offering providers no chance of improving patient satisfaction during a given hospital stay.
Institutions across the country are trying to improve their HCAHPS scores, but there is limited research identifying specific measures providers can implement. Some studies have suggested that utilizing etiquette‐based communication and sitting at the bedside[13, 14] may help improve patient experience with their providers, and more recently, it has been suggested that providing real‐time deidentified patient experience survey results with education and a rewards/emncentive system to residents may help as well.[15]
Surveys conducted during a patient's hospitalization can offer real‐time actionable feedback to providers. We performed a quality‐improvement project that was designed to determine if real‐time feedback to hospitalist physicians, followed by coaching, and revisits to the patients' bedside could improve the results recorded on provider‐specific patient surveys and/or patients' HCAHPS scores or percentile rankings.
METHODS
Design
This was a prospective, randomized quality‐improvement initiative that was approved by the Colorado Multiple Institutional Review Board and conducted at Denver Health, a 525‐bed university‐affiliated public safety net hospital. The initiative was conducted on both teaching and nonteaching general internal medicine services, which typically have a daily census of between 10 and 15 patients. No protocol changes occurred during the study.
Participants
Participants included all English‐ or Spanish‐speaking patients who were hospitalized on a general internal medicine service, had been admitted within the 2 days prior to enrollment, and had a hospitalist as their attending physician. Patients were excluded if they were enrolled in the study during a previous hospitalization, refused to participate, lacked capacity to participate, had hearing or speech impediments precluding regular conversation, were prisoners, if their clinical condition precluded participation, or their attending was an investigator in the project.
Intervention
Participants were prescreened by investigators by reviewing team sign‐outs to determine if patients had any exclusion criteria. Investigators attempted to survey each patient who met inclusion criteria on a daily basis between 9:00 am and 11:00 am. An investigator administered the survey to each patient verbally using scripted language. Patients were asked to rate how well their doctors were listening to them, explaining what they wanted to know, and whether the doctors were being friendly and helpful, all questions taken from a survey that was available on the US Department of Health and Human Services website (to be referred to as here forward daily survey).[16] We converted the original 5‐point Likert scale used in this survey to a 4‐point scale by removing the option of ok, leaving participants the options of poor, fair, good, or great. Patients were also asked to provide any personalized feedback they had, and these comments were recorded in writing by the investigator.
After being surveyed on day 1, patients were randomized to an intervention or control group using an automated randomization module in Research Electronic Data Capture (REDCap).[17] Patients in both groups who did not provide answers to all 3 questions that qualified as being top box (ie, great) were resurveyed on a daily basis until their responses were all top box or they were discharged, met exclusion criteria, or had been surveyed for a total of 4 consecutive days. In the pilot phase of this study, we found that if patients reported all top box scores on the initial survey their responses typically did not change over time, and the patients became frustrated if asked the same questions again when the patient felt there was not room for improvement. Accordingly, we elected to stop surveying patients when all top box responses were reported.
The attending hospitalist caring for each patient in the intervention group was given feedback about their patients' survey results (both their scores and any specific comments) on a daily basis. Feedback was provided in person by 1 of the investigators. The hospitalist also received an automatically generated electronic mail message with the survey results at 11:00 am on each study day. After informing the hospitalists of the patients' scores, the investigator provided a brief education session that included discussing Denver Health's most recent HCAHPS scores, value‐based purchasing, and the financial consequences of poor patient satisfaction scores. The investigator then coached the hospitalist on etiquette‐based communication,[18, 19] suggested that they sit down when communicating with their patients,[19, 20] and then asked the hospitalist to revisit each patient to discuss how the team could improve in any of the 3 areas where the patient did not give a top box score. These educational sessions were conducted in person and lasted a maximum of 5 minutes. An investigator followed up with each hospitalist the following day to determine whether the revisit occurred. Hospitalists caring for patients who were randomized to the control group were not given real‐time feedback or coaching and were not asked to revisit patients.
A random sample of patients surveyed for this initiative also received HCAHPS surveys 48 hours to 6 weeks following their hospital discharge, according to the standard methodology used to acquire HCAHPS data,[21] by an outside vendor contracted by Denver Health. Our vendor conducted these surveys via telephone in English or Spanish.
Outcomes
The primary outcome was the proportion of patients in each group who reported top box scores on the daily surveys. Secondary outcomes included the percent change for the scores recorded for 3 provider‐specific questions from the daily survey, the median top box HCAHPS scores for the 3 provider related questions and overall hospital rating, and the HCAHPS percentiles of top box scores for these questions.
Sample Size
The sample size for this intervention assumed that the proportion of patients whose treating physicians did not receive real‐time feedback who rated their providers as top box would be 75%, and that the effect of providing real‐time feedback would increase this proportion to 85% on the daily surveys. To have 80% power with a type 1 error of 0.05, we estimated a need to enroll 430 patients, 215 in each group.
Statistics
Data were collected and managed using a secure, Web‐based electronic data capture tool hosted at Denver Health (REDCap), which is designed to support data collection for research studies providing: (1) an intuitive interface for validated data entry, (2) audit trails for tracking data manipulation and export procedures, (3) automated export procedures for seamless data downloads to common statistical packages, and (4) procedures for importing data from external sources.[17]
A 2 test was used to compare the proportion of patients in the 2 groups who reported great scores for each question on the study survey on the first and last day. With the intent of providing a framework for understanding the effect real‐time feedback could have on patient experience, a secondary analysis of HCAHPS results was conducted using several different methods.
First, the proportion of patients in the 2 groups who reported scores of 9 or 10 for the overall hospital rating question or reported always for each doctor communication question on the HCHAPS survey was compared using a 2. Second, to allow for detection of differences in a sample with a smaller N, the median overall hospital rating scores from the HCAHPS survey reported by patients in the 2 groups who completed a survey following discharge were compared using a Wilcoxon rank sum test. Lastly, to place changes in proportion into a larger context (ie, how these changes would relate to value‐based purchasing), HCAHPS scores were converted to percentiles of national performance using the 2014 percentile rankings obtained from the external vendor that conducts the HCAHPS surveys for our hospital and compared between the intervention and control groups using a Wilcoxon rank sum test.
All comments collected from patients during their daily surveys were reviewed, and key words were abstracted from each comment. These key words were sorted and reviewed to categorize recurring key words into themes. Exemplars were then selected for each theme derived from patient comments.
RESULTS
From April 14, 2014 to September 19, 2014, we enrolled 227 patients in the control group and 228 in the intervention group (Figure 1). Patient demographics are summarized in Table 1. Of the 132 patients in the intervention group who reported anything less than top box scores for any of the 3 questions (thus prompting a revisit by their provider), 106 (80%) were revisited by their provider at least once during their hospitalization.
| All Patients | HCAHPS Patients | |||
|---|---|---|---|---|
| Control, N = 227 | Intervention, N = 228 | Control, N = 35 | Intervention, N = 30 | |
| ||||
| Age, mean SD | 55 14 | 55 15 | 55 15 | 57 16 |
| Gender | ||||
| Male | 126 (60) | 121 (55) | 20 (57) | 12 (40) |
| Female | 85 (40) | 98 (45) | 15(43) | 18 (60) |
| Race/ethnicity | ||||
| Hispanic | 84 (40) | 90 (41) | 17 (49) | 12 (40) |
| Black | 38 (18) | 28 (13) | 6 (17) | 7 (23) |
| White | 87 (41) | 97 (44) | 12 (34) | 10 (33) |
| Other | 2 (1) | 4 (2) | 0 (0) | 1 (3) |
| Payer | ||||
| Medicare | 65 (29) | 82 (36) | 15 (43) | 12 (40) |
| Medicaid | 122 (54) | 108 (47) | 17 (49) | 14 (47) |
| Commercial | 12 (5) | 15 (7) | 1 (3) | 1 (3) |
| Medically indigent | 4 (2) | 7 (3) | 0 (0) | 3 (10) |
| Self‐pay | 5 (2) | 4 (2) | 1 (3) | 0 (0) |
| Other/unknown | 19 (8) | 12 (5) | 0 (0) | 0 (0) |
| Team | ||||
| Teaching | 187 (82) | 196 (86) | 27 (77) | 24 (80) |
| Nonteaching | 40 (18) | 32 (14) | 8 (23) | 6 (20) |
| Top 5 primary discharge diagnoses* | ||||
| Septicemia | 26 (11) | 34 (15) | 3 (9) | 5 (17) |
| Heart failure | 14 (6) | 13 (6) | 2 (6) | |
| Acute pancreatitis | 12 (5) | 9 (4) | 3 (9) | 2 (7) |
| Diabetes mellitus | 11 (5) | 8 (4) | 2 (6) | |
| Alcohol withdrawal | 9 (4) | |||
| Cellulitis | 7 (3) | 2 (7) | ||
| Pulmonary embolism | 2 (7) | |||
| Chest pain | 2 (7) | |||
| Atrial fibrillation | 2 (6) | |||
| Length of stay, median (IQR) | 3 (2, 5) | 3 (2, 5) | 3 (2, 5) | 3 (2, 4) |
| Charlson Comorbidity Index, median (IQR) | 1 (0, 3) | 2 (0, 3) | 1 (0, 3) | 1.5 (1, 3) |
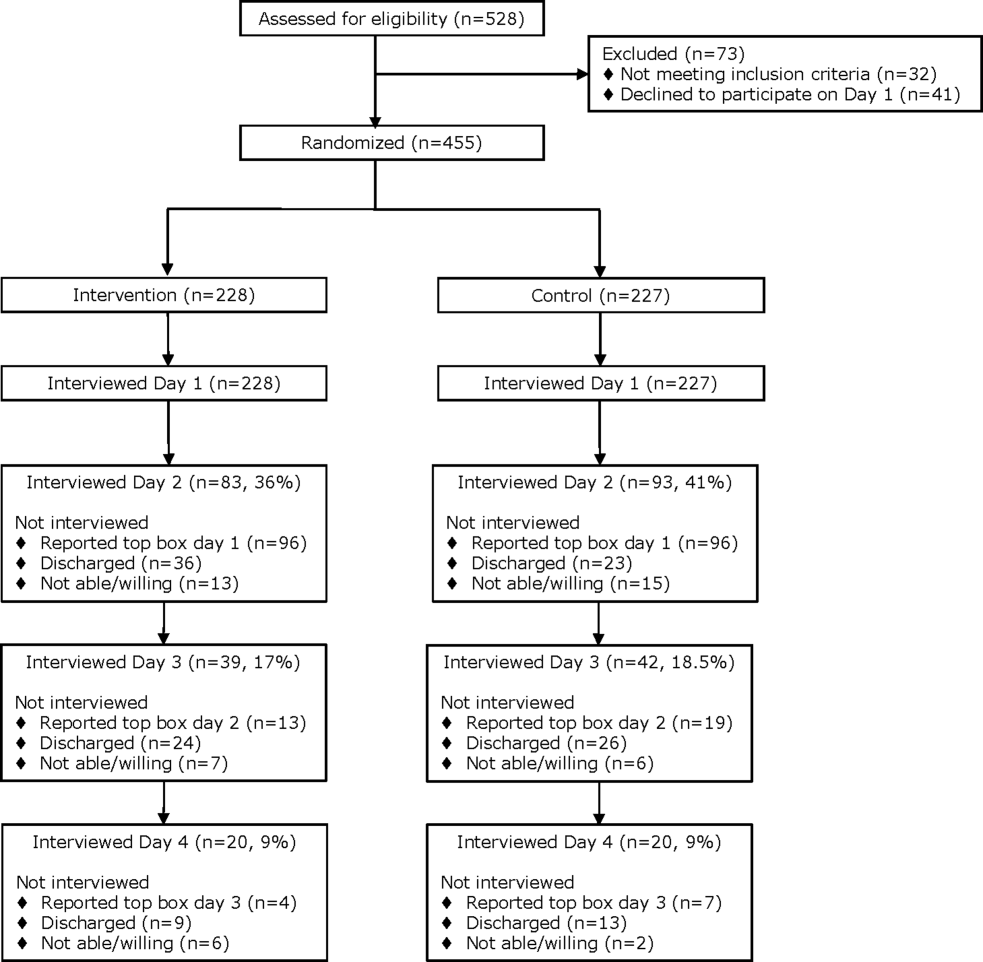
Daily Surveys
The proportion of patients in both study groups reporting top box scores tended to increase from the first day to the last day of the survey (Figure 2); however, we found no statistically significant differences between the proportion of patients who reported top box scores on first day or last day in the intervention group compared to the control group. The comments made by the patients are summarized in Supporting Table 1 in the online version of this article.
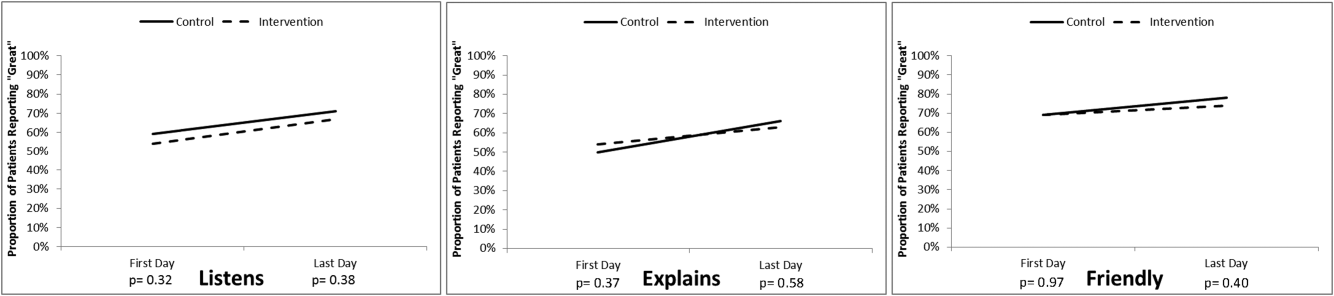
HCAHPS Scores
The proportion of top box scores from the HCAHPS surveys were higher, though not statistically significant, for all 3 provider‐specific questions and for the overall hospital rating for patients whose hospitalists received real‐time feedback (Table 2). The median [interquartile range] score for the overall hospital rating was higher for patients in the intervention group compared with those in the control group, (10 [9, 10] vs 9 [8, 10], P = 0.04]. After converting the HCAHPS scores to percentiles, we found considerably higher rankings for all 3 provider‐related questions and for the overall hospital rating in the intervention group compared to the control group (P = 0.02 for overall differences in percentiles [Table 2]).
| HCAHPS Questions | Proportion Top Box* | Percentile Rank | ||
|---|---|---|---|---|
| Control, N = 35 | Intervention, N = 30 | Control, N = 35 | Intervention, N = 30 | |
| ||||
| Overall hospital rating | 61% | 80% | 6 | 87 |
| Courtesy/respect | 86% | 93% | 23 | 88 |
| Clear communication | 77% | 80% | 39 | 60 |
| Listening | 83% | 90% | 57 | 95 |
No adverse events occurred during the course of the study in either group.
DISCUSSION
The important findings of this study were that (1) daily patient satisfaction scores improved from first day to last day regardless of study group, (2) patients whose providers received real‐time feedback had a trend toward higher HCAHPS proportions for the 3 provider‐related questions as well as the overall rating of the hospital but were not statistically significant, (3) the percentile differences in these 3 questions as well as the overall rating of the hospital were significantly higher in the intervention group as was the median score for the overall hospital rating.
Our original sample size calculation was based upon our own preliminary data, indicating that our baseline top box scores for the daily survey was around 75%. The daily survey top box score on the first day was, however, much lower (Figure 2). Accordingly, although we did not find a significant difference in these daily scores, we were underpowered to find such a difference. Additionally, because only a small percentage of patients are selected for the HCAHPS survey, our ability to detect a difference in this secondary outcome was also limited. We felt that it was important to analyze the percentile comparisons in addition to the proportion of top box scores on the HCAHPS, because the metrics for value‐based purchasing are based upon, in part, how a hospital system compares to other systems. Finally, to improve our power to detect a difference given a small sample size, we converted the scoring system for overall hospital ranking to a continuous variable, which again was noted to be significant.
To our knowledge, this is the first randomized investigation designed to assess the effect of real‐time, patient‐specific feedback to physicians. Real‐time feedback is increasingly being incorporated into medical practice, but there is only limited information available describing how this type of feedback affects outcomes.[22, 23, 24] Banka et al.[15] found that HCAHPS scores improved as a result of real‐time feedback given to residents, but the study was not randomized, utilized a pre‐post design that resulted in there being differences between the patients studied before and after the intervention, and did not provide patient‐specific data to the residents. Tabib et al.[25] found that operating costs decreased 17% after instituting real‐time feedback to providers about these costs. Reeves et al.[26] conducted a cluster randomized trial of a patient feedback survey that was designed to improve nursing care, but the results were reviewed by the nurses several months after patients had been discharged.
The differences in median top box scores and percentile rank that we observed could have resulted from the real‐time feedback, the educational coaching, the fact that the providers revisited the majority of the patients, or a combination of all of the above. Gross et al.[27] found that longer visits lead to higher satisfaction, though others have not found this to necessarily be the case.[28, 29] Lin et al.[30] found that patient satisfaction was affected by the perceived duration of the visit as well as whether expectations on visit length were met and/or exceeded. Brown et al.[31] found that training providers in communication skills improved the providers perception of their communication skills, although patient experience scores did not improve. We feel that the results seen are more likely a combination thereof as opposed to any 1 component of the intervention.
The most commonly reported complaints or concerns in patients' undirected comments often related to communication issues. Comments on subsequent surveys suggested that patient satisfaction improved over time in the intervention group, indicating that perhaps physicians did try to improve in areas that were highlighted by the real‐time feedback, and that patients perceived the physician efforts to do so (eg, They're doing better than the last time you asked. They sat down and talked to me and listened better. They came back and explained to me about my care. They listened better. They should do this survey at the clinic. See Supporting Table 1 in the online version of this article).
Our study has several limitations. First, we did not randomize providers, and many of our providers (approximately 65%) participated in both the control group and also in the intervention group, and thus received real‐time feedback at some point during the study, which could have affected their overall practice and limited our ability to find a difference between the 2 groups. In an attempt to control for this possibility, the study was conducted on an intermittent basis during the study time frame. Furthermore, the proportion of patients who reported top box scores at the beginning of the study did not have a clear trend of change by the end of the study, suggesting that overall clinician practices with respect to patient satisfaction did not change during this short time period.
Second, only a small number of our patients were randomly selected for the HCAHPS survey, which limited our ability to detect significant differences in HCAHPS proportions. Third, the HCAHPS percentiles at our institution at that time were low. Accordingly, the improvements that we observed in patient satisfaction scores might not be reproducible at institutions with higher satisfactions scores. Fourth, time and resources were needed to obtain patient feedback to provide to providers during this study. There are, however, other ways to obtain feedback that are less resource intensive (eg, electronic feedback, the utilization of volunteers, or partnering this with manager rounding). Finally, the study was conducted at a single, university‐affiliated public teaching hospital and was a quality‐improvement initiative, and thus our results are not generalizable to other institutions.
In conclusion, real‐time feedback of patient experience to their providers, coupled with provider education, coaching, and revisits, seems to improve satisfaction of patients hospitalized on general internal medicine units who were cared for by hospitalists.
Acknowledgements
The authors thank Kate Fagan, MPH, for her excellent technical assistance.
Disclosure: Nothing to report.
- HCAHPS Fact Sheet. 2015. Available at: http://www.hcahpsonline.org/Files/HCAHPS_Fact_Sheet_June_2015.pdf. Accessed August 25, 2015.
- , , , . The relationship between commercial website ratings and traditional hospital performance measures in the USA. BMJ Qual Saf. 2013;22:194–202.
- , , , . Patients' perception of hospital care in the United States. N Engl J Med. 2008;359:1921–1931.
- , , , . The relationship between patients' perception of care and measures of hospital quality and safety. Health Serv Res. 2010;45:1024–1040.
- , , , et al. Relationship between quality of diabetes care and patient satisfaction. J Natl Med Assoc. 2003;95:64–70.
- , , , , . Relationship between patient satisfaction with inpatient care and hospital readmission within 30 days. Am J Manag Care. 2011;17:41–48.
- , , . A systematic review of evidence on the links between patient experience and clinical safety and effectiveness. BMJ Open. 2013;3(1).
- , . The association between satisfaction with services provided in primary care and outcomes in type 2 diabetes mellitus. Diabet Med. 2003;20:486–490.
- , , , et al. Associations between Web‐based patient ratings and objective measures of hospital quality. Arch Intern Med. 2012;172:435–436.
- , , , et al. Patient satisfaction and its relationship with clinical quality and inpatient mortality in acute myocardial infarction. Circ Cardiovasc Qual Outcomes. 2010;3:188–195.
- , , , , . Patients' perceptions of care are associated with quality of hospital care: a survey of 4605 hospitals. Am J Med Qual. 2015;30(4):382–388.
- Centers for Medicare 28:908–913.
- , , , , , . Effect of sitting vs. standing on perception of provider time at bedside: a pilot study. Patient Educ Couns. 2012;86:166–171.
- , , , et al. Improving patient satisfaction through physician education, feedback, and incentives. J Hosp Med. 2015;10:497–502.
- US Department of Health and Human Services. Patient satisfaction survey. Available at: http://bphc.hrsa.gov/policiesregulations/performancemeasures/patientsurvey/surveyform.html. Accessed November 15, 2013.
- , , , , , . Research electronic data capture (REDCap)—a metadata‐driven methodology and workflow process for providing translational research informatics support. J Biomed Inform. 2009;42:377–381.
- . The HCAHPS Handbook. Gulf Breeze, FL: Fire Starter; 2010.
- . Etiquette‐based medicine. N Engl J Med. 2008;358:1988–1989.
- . 5 years after the Kahn's etiquette‐based medicine: a brief checklist proposal for a functional second meeting with the patient. Front Psychol. 2013;4:723.
- Frequently Asked Questions. Hospital Value‐Based Purchasing Program. Available at: http://www.cms.gov/Medicare/Quality‐Initiatives‐Patient‐Assessment‐Instruments/hospital‐value‐based‐purchasing/Downloads/FY‐2013‐Program‐Frequently‐Asked‐Questions‐about‐Hospital‐VBP‐3‐9‐12.pdf. Accessed February 8, 2014.
- , , , . Real‐time patient survey data during routine clinical activities for rapid‐cycle quality improvement. JMIR Med Inform. 2015;3:e13.
- . Mount Sinai launches real‐time patient‐feedback survey tool. Healthcare Informatics website. Available at: http://www.healthcare‐informatics.com/news‐item/mount‐sinai‐launches‐real‐time‐patient‐feedback‐survey‐tool. Accessed August 25, 2015.
- , . Hospitals are finally starting to put real‐time data to use. Harvard Business Review website. Available at: https://hbr.org/2014/11/hospitals‐are‐finally‐starting‐to‐put‐real‐time‐data‐to‐use. Published November 12, 2014. Accessed August 25, 2015.
- , , , , . Reducing operating room costs through real‐time cost information feedback: a pilot study. J Endourol. 2015;29:963–968.
- , , . Facilitated patient experience feedback can improve nursing care: a pilot study for a phase III cluster randomised controlled trial. BMC Health Serv Res. 2013;13:259.
- , , , , . Patient satisfaction with time spent with their physician. J Fam Pract. 1998;47:133–137.
- , , , , , . The relationship between time spent communicating and communication outcomes on a hospital medicine service. J Gen Intern Med. 2012;27:185–189.
- , . Cognitive interview techniques reveal specific behaviors and issues that could affect patient satisfaction relative to hospitalists. J Hosp Med. 2009;4:E1–E6.
- , , , et al. Is patients' perception of time spent with the physician a determinant of ambulatory patient satisfaction? Arch Intern Med. 2001;161:1437–1442.
- , , , . Effect of clinician communication skills training on patient satisfaction. A randomized, controlled trial. Ann Intern Med. 1999;131:822–829.
In 2010, the Centers for Medicare and Medicaid Services implemented value‐based purchasing, a payment model that incentivizes hospitals for reaching certain quality and patient experience thresholds and penalizes those that do not, in part on the basis of patient satisfaction scores.[1] Although low patient satisfaction scores will adversely affect institutions financially, they also reflect patients' perceptions of their care. Some studies suggest that hospitals with higher patient satisfaction scores score higher overall on clinical care processes such as core measures compliance, readmission rates, lower mortality rates, and other quality‐of‐care metrics.[2, 3, 4, 5, 6, 7, 8, 9, 10, 11]
The Hospital Consumer Assessment of Healthcare Providers and Systems (HCAHPS) survey assesses patients' experience following their hospital stay.[1] The percent of top box scores (ie, response of always on a four point scale, or scores of 9 or 10 on a 10‐point scale) are utilized to compare hospitals and determine the reimbursement or penalty a hospital will receive. Although these scores are available to the public on the Hospital Compare website,[12] physicians may not know how their hospital is ranked or how they are individually perceived by their patients. Additionally, these surveys are typically conducted 48 hours to 6 weeks after patients are discharged, and the results are distributed back to the hospitals well after the time that care was provided, thereby offering providers no chance of improving patient satisfaction during a given hospital stay.
Institutions across the country are trying to improve their HCAHPS scores, but there is limited research identifying specific measures providers can implement. Some studies have suggested that utilizing etiquette‐based communication and sitting at the bedside[13, 14] may help improve patient experience with their providers, and more recently, it has been suggested that providing real‐time deidentified patient experience survey results with education and a rewards/emncentive system to residents may help as well.[15]
Surveys conducted during a patient's hospitalization can offer real‐time actionable feedback to providers. We performed a quality‐improvement project that was designed to determine if real‐time feedback to hospitalist physicians, followed by coaching, and revisits to the patients' bedside could improve the results recorded on provider‐specific patient surveys and/or patients' HCAHPS scores or percentile rankings.
METHODS
Design
This was a prospective, randomized quality‐improvement initiative that was approved by the Colorado Multiple Institutional Review Board and conducted at Denver Health, a 525‐bed university‐affiliated public safety net hospital. The initiative was conducted on both teaching and nonteaching general internal medicine services, which typically have a daily census of between 10 and 15 patients. No protocol changes occurred during the study.
Participants
Participants included all English‐ or Spanish‐speaking patients who were hospitalized on a general internal medicine service, had been admitted within the 2 days prior to enrollment, and had a hospitalist as their attending physician. Patients were excluded if they were enrolled in the study during a previous hospitalization, refused to participate, lacked capacity to participate, had hearing or speech impediments precluding regular conversation, were prisoners, if their clinical condition precluded participation, or their attending was an investigator in the project.
Intervention
Participants were prescreened by investigators by reviewing team sign‐outs to determine if patients had any exclusion criteria. Investigators attempted to survey each patient who met inclusion criteria on a daily basis between 9:00 am and 11:00 am. An investigator administered the survey to each patient verbally using scripted language. Patients were asked to rate how well their doctors were listening to them, explaining what they wanted to know, and whether the doctors were being friendly and helpful, all questions taken from a survey that was available on the US Department of Health and Human Services website (to be referred to as here forward daily survey).[16] We converted the original 5‐point Likert scale used in this survey to a 4‐point scale by removing the option of ok, leaving participants the options of poor, fair, good, or great. Patients were also asked to provide any personalized feedback they had, and these comments were recorded in writing by the investigator.
After being surveyed on day 1, patients were randomized to an intervention or control group using an automated randomization module in Research Electronic Data Capture (REDCap).[17] Patients in both groups who did not provide answers to all 3 questions that qualified as being top box (ie, great) were resurveyed on a daily basis until their responses were all top box or they were discharged, met exclusion criteria, or had been surveyed for a total of 4 consecutive days. In the pilot phase of this study, we found that if patients reported all top box scores on the initial survey their responses typically did not change over time, and the patients became frustrated if asked the same questions again when the patient felt there was not room for improvement. Accordingly, we elected to stop surveying patients when all top box responses were reported.
The attending hospitalist caring for each patient in the intervention group was given feedback about their patients' survey results (both their scores and any specific comments) on a daily basis. Feedback was provided in person by 1 of the investigators. The hospitalist also received an automatically generated electronic mail message with the survey results at 11:00 am on each study day. After informing the hospitalists of the patients' scores, the investigator provided a brief education session that included discussing Denver Health's most recent HCAHPS scores, value‐based purchasing, and the financial consequences of poor patient satisfaction scores. The investigator then coached the hospitalist on etiquette‐based communication,[18, 19] suggested that they sit down when communicating with their patients,[19, 20] and then asked the hospitalist to revisit each patient to discuss how the team could improve in any of the 3 areas where the patient did not give a top box score. These educational sessions were conducted in person and lasted a maximum of 5 minutes. An investigator followed up with each hospitalist the following day to determine whether the revisit occurred. Hospitalists caring for patients who were randomized to the control group were not given real‐time feedback or coaching and were not asked to revisit patients.
A random sample of patients surveyed for this initiative also received HCAHPS surveys 48 hours to 6 weeks following their hospital discharge, according to the standard methodology used to acquire HCAHPS data,[21] by an outside vendor contracted by Denver Health. Our vendor conducted these surveys via telephone in English or Spanish.
Outcomes
The primary outcome was the proportion of patients in each group who reported top box scores on the daily surveys. Secondary outcomes included the percent change for the scores recorded for 3 provider‐specific questions from the daily survey, the median top box HCAHPS scores for the 3 provider related questions and overall hospital rating, and the HCAHPS percentiles of top box scores for these questions.
Sample Size
The sample size for this intervention assumed that the proportion of patients whose treating physicians did not receive real‐time feedback who rated their providers as top box would be 75%, and that the effect of providing real‐time feedback would increase this proportion to 85% on the daily surveys. To have 80% power with a type 1 error of 0.05, we estimated a need to enroll 430 patients, 215 in each group.
Statistics
Data were collected and managed using a secure, Web‐based electronic data capture tool hosted at Denver Health (REDCap), which is designed to support data collection for research studies providing: (1) an intuitive interface for validated data entry, (2) audit trails for tracking data manipulation and export procedures, (3) automated export procedures for seamless data downloads to common statistical packages, and (4) procedures for importing data from external sources.[17]
A 2 test was used to compare the proportion of patients in the 2 groups who reported great scores for each question on the study survey on the first and last day. With the intent of providing a framework for understanding the effect real‐time feedback could have on patient experience, a secondary analysis of HCAHPS results was conducted using several different methods.
First, the proportion of patients in the 2 groups who reported scores of 9 or 10 for the overall hospital rating question or reported always for each doctor communication question on the HCHAPS survey was compared using a 2. Second, to allow for detection of differences in a sample with a smaller N, the median overall hospital rating scores from the HCAHPS survey reported by patients in the 2 groups who completed a survey following discharge were compared using a Wilcoxon rank sum test. Lastly, to place changes in proportion into a larger context (ie, how these changes would relate to value‐based purchasing), HCAHPS scores were converted to percentiles of national performance using the 2014 percentile rankings obtained from the external vendor that conducts the HCAHPS surveys for our hospital and compared between the intervention and control groups using a Wilcoxon rank sum test.
All comments collected from patients during their daily surveys were reviewed, and key words were abstracted from each comment. These key words were sorted and reviewed to categorize recurring key words into themes. Exemplars were then selected for each theme derived from patient comments.
RESULTS
From April 14, 2014 to September 19, 2014, we enrolled 227 patients in the control group and 228 in the intervention group (Figure 1). Patient demographics are summarized in Table 1. Of the 132 patients in the intervention group who reported anything less than top box scores for any of the 3 questions (thus prompting a revisit by their provider), 106 (80%) were revisited by their provider at least once during their hospitalization.
| All Patients | HCAHPS Patients | |||
|---|---|---|---|---|
| Control, N = 227 | Intervention, N = 228 | Control, N = 35 | Intervention, N = 30 | |
| ||||
| Age, mean SD | 55 14 | 55 15 | 55 15 | 57 16 |
| Gender | ||||
| Male | 126 (60) | 121 (55) | 20 (57) | 12 (40) |
| Female | 85 (40) | 98 (45) | 15(43) | 18 (60) |
| Race/ethnicity | ||||
| Hispanic | 84 (40) | 90 (41) | 17 (49) | 12 (40) |
| Black | 38 (18) | 28 (13) | 6 (17) | 7 (23) |
| White | 87 (41) | 97 (44) | 12 (34) | 10 (33) |
| Other | 2 (1) | 4 (2) | 0 (0) | 1 (3) |
| Payer | ||||
| Medicare | 65 (29) | 82 (36) | 15 (43) | 12 (40) |
| Medicaid | 122 (54) | 108 (47) | 17 (49) | 14 (47) |
| Commercial | 12 (5) | 15 (7) | 1 (3) | 1 (3) |
| Medically indigent | 4 (2) | 7 (3) | 0 (0) | 3 (10) |
| Self‐pay | 5 (2) | 4 (2) | 1 (3) | 0 (0) |
| Other/unknown | 19 (8) | 12 (5) | 0 (0) | 0 (0) |
| Team | ||||
| Teaching | 187 (82) | 196 (86) | 27 (77) | 24 (80) |
| Nonteaching | 40 (18) | 32 (14) | 8 (23) | 6 (20) |
| Top 5 primary discharge diagnoses* | ||||
| Septicemia | 26 (11) | 34 (15) | 3 (9) | 5 (17) |
| Heart failure | 14 (6) | 13 (6) | 2 (6) | |
| Acute pancreatitis | 12 (5) | 9 (4) | 3 (9) | 2 (7) |
| Diabetes mellitus | 11 (5) | 8 (4) | 2 (6) | |
| Alcohol withdrawal | 9 (4) | |||
| Cellulitis | 7 (3) | 2 (7) | ||
| Pulmonary embolism | 2 (7) | |||
| Chest pain | 2 (7) | |||
| Atrial fibrillation | 2 (6) | |||
| Length of stay, median (IQR) | 3 (2, 5) | 3 (2, 5) | 3 (2, 5) | 3 (2, 4) |
| Charlson Comorbidity Index, median (IQR) | 1 (0, 3) | 2 (0, 3) | 1 (0, 3) | 1.5 (1, 3) |
Daily Surveys
The proportion of patients in both study groups reporting top box scores tended to increase from the first day to the last day of the survey (Figure 2); however, we found no statistically significant differences between the proportion of patients who reported top box scores on first day or last day in the intervention group compared to the control group. The comments made by the patients are summarized in Supporting Table 1 in the online version of this article.
HCAHPS Scores
The proportion of top box scores from the HCAHPS surveys were higher, though not statistically significant, for all 3 provider‐specific questions and for the overall hospital rating for patients whose hospitalists received real‐time feedback (Table 2). The median [interquartile range] score for the overall hospital rating was higher for patients in the intervention group compared with those in the control group, (10 [9, 10] vs 9 [8, 10], P = 0.04]. After converting the HCAHPS scores to percentiles, we found considerably higher rankings for all 3 provider‐related questions and for the overall hospital rating in the intervention group compared to the control group (P = 0.02 for overall differences in percentiles [Table 2]).
| HCAHPS Questions | Proportion Top Box* | Percentile Rank | ||
|---|---|---|---|---|
| Control, N = 35 | Intervention, N = 30 | Control, N = 35 | Intervention, N = 30 | |
| ||||
| Overall hospital rating | 61% | 80% | 6 | 87 |
| Courtesy/respect | 86% | 93% | 23 | 88 |
| Clear communication | 77% | 80% | 39 | 60 |
| Listening | 83% | 90% | 57 | 95 |
No adverse events occurred during the course of the study in either group.
DISCUSSION
The important findings of this study were that (1) daily patient satisfaction scores improved from first day to last day regardless of study group, (2) patients whose providers received real‐time feedback had a trend toward higher HCAHPS proportions for the 3 provider‐related questions as well as the overall rating of the hospital but were not statistically significant, (3) the percentile differences in these 3 questions as well as the overall rating of the hospital were significantly higher in the intervention group as was the median score for the overall hospital rating.
Our original sample size calculation was based upon our own preliminary data, indicating that our baseline top box scores for the daily survey was around 75%. The daily survey top box score on the first day was, however, much lower (Figure 2). Accordingly, although we did not find a significant difference in these daily scores, we were underpowered to find such a difference. Additionally, because only a small percentage of patients are selected for the HCAHPS survey, our ability to detect a difference in this secondary outcome was also limited. We felt that it was important to analyze the percentile comparisons in addition to the proportion of top box scores on the HCAHPS, because the metrics for value‐based purchasing are based upon, in part, how a hospital system compares to other systems. Finally, to improve our power to detect a difference given a small sample size, we converted the scoring system for overall hospital ranking to a continuous variable, which again was noted to be significant.
To our knowledge, this is the first randomized investigation designed to assess the effect of real‐time, patient‐specific feedback to physicians. Real‐time feedback is increasingly being incorporated into medical practice, but there is only limited information available describing how this type of feedback affects outcomes.[22, 23, 24] Banka et al.[15] found that HCAHPS scores improved as a result of real‐time feedback given to residents, but the study was not randomized, utilized a pre‐post design that resulted in there being differences between the patients studied before and after the intervention, and did not provide patient‐specific data to the residents. Tabib et al.[25] found that operating costs decreased 17% after instituting real‐time feedback to providers about these costs. Reeves et al.[26] conducted a cluster randomized trial of a patient feedback survey that was designed to improve nursing care, but the results were reviewed by the nurses several months after patients had been discharged.
The differences in median top box scores and percentile rank that we observed could have resulted from the real‐time feedback, the educational coaching, the fact that the providers revisited the majority of the patients, or a combination of all of the above. Gross et al.[27] found that longer visits lead to higher satisfaction, though others have not found this to necessarily be the case.[28, 29] Lin et al.[30] found that patient satisfaction was affected by the perceived duration of the visit as well as whether expectations on visit length were met and/or exceeded. Brown et al.[31] found that training providers in communication skills improved the providers perception of their communication skills, although patient experience scores did not improve. We feel that the results seen are more likely a combination thereof as opposed to any 1 component of the intervention.
The most commonly reported complaints or concerns in patients' undirected comments often related to communication issues. Comments on subsequent surveys suggested that patient satisfaction improved over time in the intervention group, indicating that perhaps physicians did try to improve in areas that were highlighted by the real‐time feedback, and that patients perceived the physician efforts to do so (eg, They're doing better than the last time you asked. They sat down and talked to me and listened better. They came back and explained to me about my care. They listened better. They should do this survey at the clinic. See Supporting Table 1 in the online version of this article).
Our study has several limitations. First, we did not randomize providers, and many of our providers (approximately 65%) participated in both the control group and also in the intervention group, and thus received real‐time feedback at some point during the study, which could have affected their overall practice and limited our ability to find a difference between the 2 groups. In an attempt to control for this possibility, the study was conducted on an intermittent basis during the study time frame. Furthermore, the proportion of patients who reported top box scores at the beginning of the study did not have a clear trend of change by the end of the study, suggesting that overall clinician practices with respect to patient satisfaction did not change during this short time period.
Second, only a small number of our patients were randomly selected for the HCAHPS survey, which limited our ability to detect significant differences in HCAHPS proportions. Third, the HCAHPS percentiles at our institution at that time were low. Accordingly, the improvements that we observed in patient satisfaction scores might not be reproducible at institutions with higher satisfactions scores. Fourth, time and resources were needed to obtain patient feedback to provide to providers during this study. There are, however, other ways to obtain feedback that are less resource intensive (eg, electronic feedback, the utilization of volunteers, or partnering this with manager rounding). Finally, the study was conducted at a single, university‐affiliated public teaching hospital and was a quality‐improvement initiative, and thus our results are not generalizable to other institutions.
In conclusion, real‐time feedback of patient experience to their providers, coupled with provider education, coaching, and revisits, seems to improve satisfaction of patients hospitalized on general internal medicine units who were cared for by hospitalists.
Acknowledgements
The authors thank Kate Fagan, MPH, for her excellent technical assistance.
Disclosure: Nothing to report.
- HCAHPS Fact Sheet. 2015. Available at: http://www.hcahpsonline.org/Files/HCAHPS_Fact_Sheet_June_2015.pdf. Accessed August 25, 2015.
- , , , . The relationship between commercial website ratings and traditional hospital performance measures in the USA. BMJ Qual Saf. 2013;22:194–202.
- , , , . Patients' perception of hospital care in the United States. N Engl J Med. 2008;359:1921–1931.
- , , , . The relationship between patients' perception of care and measures of hospital quality and safety. Health Serv Res. 2010;45:1024–1040.
- , , , et al. Relationship between quality of diabetes care and patient satisfaction. J Natl Med Assoc. 2003;95:64–70.
- , , , , . Relationship between patient satisfaction with inpatient care and hospital readmission within 30 days. Am J Manag Care. 2011;17:41–48.
- , , . A systematic review of evidence on the links between patient experience and clinical safety and effectiveness. BMJ Open. 2013;3(1).
- , . The association between satisfaction with services provided in primary care and outcomes in type 2 diabetes mellitus. Diabet Med. 2003;20:486–490.
- , , , et al. Associations between Web‐based patient ratings and objective measures of hospital quality. Arch Intern Med. 2012;172:435–436.
- , , , et al. Patient satisfaction and its relationship with clinical quality and inpatient mortality in acute myocardial infarction. Circ Cardiovasc Qual Outcomes. 2010;3:188–195.
- , , , , . Patients' perceptions of care are associated with quality of hospital care: a survey of 4605 hospitals. Am J Med Qual. 2015;30(4):382–388.
- Centers for Medicare 28:908–913.
- , , , , , . Effect of sitting vs. standing on perception of provider time at bedside: a pilot study. Patient Educ Couns. 2012;86:166–171.
- , , , et al. Improving patient satisfaction through physician education, feedback, and incentives. J Hosp Med. 2015;10:497–502.
- US Department of Health and Human Services. Patient satisfaction survey. Available at: http://bphc.hrsa.gov/policiesregulations/performancemeasures/patientsurvey/surveyform.html. Accessed November 15, 2013.
- , , , , , . Research electronic data capture (REDCap)—a metadata‐driven methodology and workflow process for providing translational research informatics support. J Biomed Inform. 2009;42:377–381.
- . The HCAHPS Handbook. Gulf Breeze, FL: Fire Starter; 2010.
- . Etiquette‐based medicine. N Engl J Med. 2008;358:1988–1989.
- . 5 years after the Kahn's etiquette‐based medicine: a brief checklist proposal for a functional second meeting with the patient. Front Psychol. 2013;4:723.
- Frequently Asked Questions. Hospital Value‐Based Purchasing Program. Available at: http://www.cms.gov/Medicare/Quality‐Initiatives‐Patient‐Assessment‐Instruments/hospital‐value‐based‐purchasing/Downloads/FY‐2013‐Program‐Frequently‐Asked‐Questions‐about‐Hospital‐VBP‐3‐9‐12.pdf. Accessed February 8, 2014.
- , , , . Real‐time patient survey data during routine clinical activities for rapid‐cycle quality improvement. JMIR Med Inform. 2015;3:e13.
- . Mount Sinai launches real‐time patient‐feedback survey tool. Healthcare Informatics website. Available at: http://www.healthcare‐informatics.com/news‐item/mount‐sinai‐launches‐real‐time‐patient‐feedback‐survey‐tool. Accessed August 25, 2015.
- , . Hospitals are finally starting to put real‐time data to use. Harvard Business Review website. Available at: https://hbr.org/2014/11/hospitals‐are‐finally‐starting‐to‐put‐real‐time‐data‐to‐use. Published November 12, 2014. Accessed August 25, 2015.
- , , , , . Reducing operating room costs through real‐time cost information feedback: a pilot study. J Endourol. 2015;29:963–968.
- , , . Facilitated patient experience feedback can improve nursing care: a pilot study for a phase III cluster randomised controlled trial. BMC Health Serv Res. 2013;13:259.
- , , , , . Patient satisfaction with time spent with their physician. J Fam Pract. 1998;47:133–137.
- , , , , , . The relationship between time spent communicating and communication outcomes on a hospital medicine service. J Gen Intern Med. 2012;27:185–189.
- , . Cognitive interview techniques reveal specific behaviors and issues that could affect patient satisfaction relative to hospitalists. J Hosp Med. 2009;4:E1–E6.
- , , , et al. Is patients' perception of time spent with the physician a determinant of ambulatory patient satisfaction? Arch Intern Med. 2001;161:1437–1442.
- , , , . Effect of clinician communication skills training on patient satisfaction. A randomized, controlled trial. Ann Intern Med. 1999;131:822–829.
© 2016 Society of Hospital Medicine

Gender Disparities for Academic Hospitalists
Gender disparities still exist for women in academic medicine.[1, 2, 3, 4, 5, 6, 7, 8, 9] The most recent data from the Association of American Medical Colleges (AAMC) show that although gender disparities are decreasing, women are still under‐represented in the assistant, associate, and full‐professor ranks as well as in leadership positions.[1]
Some studies indicate that gender differences are less evident when examining younger cohorts.[1, 10, 11, 12, 13] Hospital medicine emerged around 1996, when the term hospitalist was first coined.[14] The gender distribution of academic hospitalists is likely nearly equal,[15, 16] and they are generally younger physicians.[15, 17, 18, 19, 20] Accordingly, we questioned whether gender disparities existed in academic hospital medicine (HM) and, if so, whether these disparities were greater than those that might exist in academic general internal medicine (GIM).
METHODS
This study consisted of both prospective and retrospective observation of data collected for academic adult hospitalists and general internists who practice in the United States. It was approved by the Colorado Multiple Institutional Review Board.
Gender distribution was assessed with respect to: (1) academic HM and GIM faculty, (2) leadership (ie, division or section heads), and (3) scholarly work (ie, speaking opportunities and publications). Data were collected between October 1, 2012 and August 31, 2014.
Gender Distribution of Faculty and Division/Section Heads
All US internal medicine residency programs were identified from the list of members or affiliates of the AAMC that were fully accredited by the Liaison Committee on Medical Education[21] using the Graduate Medical Education Directory.[22] We then determined the primary training hospital(s) affiliated with each program and selected those that were considered to be university hospitals and eliminated those that did not have divisions or sections of HM or GIM. We determined the gender of the respective division/section heads on the basis of the faculty member's first name (and often from accompanying photos) as well as from information obtained via Internet searches and, if necessary, contacted the individual institutions via email or phone call(s). We also determined the number and gender of all of the HM and GIM faculty members in a random sample of 25% of these hospitals from information on their respective websites.
Gender Distribution for Scholarly Productivity
We determined the gender and specialty of all speakers at the Society of Hospital Medicine and the Society of General Internal Medicine national conferences from 2006 to 2012. A list of speakers at each conference was obtained from conference pamphlets or agendas that were available via Internet searches or obtained directly from the organization. We also determined whether each presenter was a featured speaker (defined as one whose talk was unopposed by other sessions), plenary speaker (defined as such in the conference pamphlets), or if they spoke in a group format (also as indicated in the conference pamphlets). Because of the low number of featured and plenary speakers, these data were combined. Faculty labeled as additional faculty when presenting in a group format were excluded as were speakers at precourses, those presenting abstracts, and those participating in interest group sessions.
For authorship, a PubMed search was used to identify all articles published in the Journal of Hospital Medicine (JHM) and the Journal of General Internal Medicine (JGIM) from January 1, 2006 through December 31, 2012, and the gender and specialty of all the first and last authors were determined as described above. Specialty was determined from the division, section or department affiliation indicated for each author and by Internet searches. In some instances, it was necessary to contact the authors or their departments directly to verify their specialty. When articles had only 1 author, the author was considered a first author.
Duplicate records (eg, same author, same journal) and articles without an author were excluded, as were authors who did not have an MD, DO, or MBBS degree and those who were not affiliated with an institution in the United States. All manuscripts, with the exception of errata, were analyzed together as well as in 3 subgroups: original research, editorials, and others.
A second investigator corroborated data regarding gender and specialty for all speakers and authors to strengthen data integrity. On the rare occasion when discrepancies were found, a third investigator adjudicated the results.
Definitions
Physicians were defined as being hospitalists if they were listed as a member of a division or section of HM on their publications or if Internet searches indicated that they were a hospitalist or primarily worked on inpatient medical services. Physicians were considered to be general internists if they were listed as such on their publications and their specialty could be verified in Web‐based searches. If physicians appeared to have changing roles over time, we attempted to assign their specialty based upon their role at the time the article was published or the presentation was delivered. If necessary, phone calls and/or emails were also done to determine the physician's specialty.
Analysis
REDCap, a secure, Web‐based application for building and managing online surveys and databases, was used to collect and manage all study data.[23] All analyses were performed using SAS Enterprise Guide 4.3 (SAS Institute, Inc., Cary, NC). A [2] test was used to compare proportions of male versus female physicians, and data from hospitalists versus general internists. Because we performed multiple comparisons when analyzing presentations and publications, a Bonferroni adjustment was made such that a P<0.0125 for presentations and P<0.006 (within specialty) or P<0.0125 (between specialty) for the publication analyses were considered significant. P<0.05 was considered significant for all other comparisons.
RESULTS
Gender Distribution of Faculty
Eighteen HM and 20 GIM programs from university hospitals were randomly selected for review (see Supporting Figure 1 in the online version of this article). Seven of the HM programs and 1 of the GIM programs did not have a website, did not differentiate hospitalists from other faculty, or did not list their faculty on the website and were excluded from the analysis. In the remaining 11 HM programs and 19 GIM programs, women made up 277/568 (49%) and 555/1099 (51%) of the faculty, respectively (P=0.50).
Gender Distribution of Division/Section Heads
Eighty‐six of the programs were classified as university hospitals (see Supporting Figure 1 in the online version of this article), and in these, women led 11/69 (16%) of the HM divisions or sections and 28/80 (35%) of the GIM divisions (P=0.008).
Gender Distribution for Scholarly Productivity
Speaking Opportunities
A total of 1227 presentations were given at the 2 conferences from 2006 to 2012, with 1343 of the speakers meeting inclusion criteria (see Supporting Figure 2 in the online version of this article). Hospitalists accounted for 557 of the speakers, of which 146 (26%) were women. General internists accounted for 580 of the speakers, of which 291 (50%) were women (P<0.0001) (Table 1).
| Male, N (%) | Female, N (%) | |
|---|---|---|
| ||
| Hospitalists | ||
| All presentations | 411 (74) | 146 (26)* |
| Featured or plenary presentations | 49 (91) | 5 (9)* |
| General internists | ||
| All presentations | 289 (50) | 291 (50) |
| Featured or plenary presentations | 27 (55) | 22 (45) |
Of the 117 featured or plenary speakers, 54 were hospitalists and 5 (9%) of these were women. Of the 49 who were general internists, 22 (45%) were women (P<0.0001).
Authorship
The PubMed search identified a total of 3285 articles published in the JHM and the JGIM from 2006 to 2012, and 2172 first authors and 1869 last authors met inclusion criteria (see Supporting Figure 3 in the online version of this article). Hospitalists were listed as first or last authors on 464 and 305 articles, respectively, and of these, women were first authors on 153 (33%) and last authors on 63 (21%). General internists were listed as first or last authors on 895 and 769 articles, respectively, with women as first authors on 423 (47%) and last authors on 265 (34%). Compared with general internists, fewer women hospitalists were listed as either first or last authors (both P<0.0001) (Table 2).
| First Author | Last Author | |||
|---|---|---|---|---|
| Male, N (%) | Female, N (%) | Male, N (%) | Female, N (%) | |
| ||||
| Hospitalists | ||||
| All publications | 311 (67) | 153 (33)* | 242 (79) | 63 (21)* |
| Original investigations/brief reports | 124 (61) | 79 (39)* | 96 (76) | 30 (24)* |
| Editorials | 34 (77) | 10 (23)* | 18 (86) | 3 (14)* |
| Other | 153 (71) | 64 (29)* | 128 (81) | 30 (19)* |
| General internists | ||||
| All publications | 472 (53) | 423 (47) | 504 (66) | 265 (34)* |
| Original investigations/brief reports | 218 (46) | 261 (54) | 310 (65) | 170 (35)* |
| Editorial | 98 (68) | 46 (32)* | 43 (73) | 16 (27)* |
| Other | 156 (57) | 116 (43) | 151 (66) | 79 (34)* |
Fewer women hospitalists were listed as first or last authors on all article types. For original research articles written by general internists, there was a trend for more women to be listed as first authors than men (261/479, 54%), but this difference was not statistically significant.
DISCUSSION
The important findings of this study are that, despite an equal gender distribution of academic HM and GIM faculty, fewer women were HM division/section chiefs, fewer women were speakers at the 2 selected national meetings, and fewer women were first or last authors of publications in 2 selected journals in comparison with general internists.
Previous studies have found that women lag behind their male counterparts with respect to academic productivity, leadership, and promotion.[1, 5, 7] Some studies suggest, however, that gender differences are reduced when younger cohorts are examined.[1, 10, 11, 12, 13] Surveys indicate that that the mean age of hospitalists is younger than most other specialties.[15, 19, 20, 24] The mean age of academic GIM physicians is unknown, but surveys of GIM (not differentiating academic from nonacademic) suggest that it is an older cohort than that of HM.[24] Despite hospitalists being a younger cohort, we found gender disparities in all areas investigated.
Our findings with respect to gender disparities in HM division or section leadership are consistent with the annual AAMC Women in US Academic Medicine and Science Benchmarking Report that found only 22% of all permanent division or section heads were women.[1]
Gender disparities with respect to authorship of medical publications have been previously noted,[3, 6, 15, 25] but to our knowledge, this is the first study to investigate the gender of authors who were hospitalists. Although we found a higher proportion of women hospitalists who were first or last authors than was observed by Jagsi and colleagues,[3] women hospitalists were still under‐represented with respect to this measure of academic productivity. Erren et al. reviewed 6 major journals from 2010 and 2011, and found that first authorship of original research by women ranged from 23.7% to 46.7%, and for last authorship from 18.3% to 28.8%.[25] Interestingly, we found no significant gender difference for first authors who were general internists, and there was a trend toward more women general internists being first authors than men for original research, reviews, and brief reports (data not shown).
Our study did not attempt to answer the question of why gender disparities persist, but many previous studies have explored this issue.[4, 8, 12, 26, 27, 28, 29, 30, 31, 32, 33, 34, 35, 36, 37, 38, 39, 40, 41, 42] Issues raised by others include the quantity of academic work (ie, publications and grants obtained), differences in hours worked and allocation of time, lack of mentorship, family responsibilities, discrimination, differences in career motivation, and levels of institutional support, to name a few.
The under‐representation of women hospitalists in leadership, authorship, and speaking opportunities may be consistent with gender‐related differences in research productivity. Fewer publications could lead to fewer national presentations, which could lead to fewer leadership opportunities. Our findings with respect to general internists are not consistent with this idea, however, as whereas women were under‐represented in GIM leadership positions, we found no disparities with respect to the gender of first authors or speakers at national meetings for general internists. The finding that hospitalists had gender disparities with respect to first authors and national speakers but general internists did not, argues against several hypotheses (ie, that women lack mentorship, have less career motivation, fewer career building opportunities).
One notable hypothesis, and perhaps one that is often discussed in the literature, is that women shoulder the majority of family responsibilities, and this may result in women having less time for their careers. Jolly and colleagues studied physician‐researchers and noted that women were more likely than men to have spouses or domestic partners who were fully employed, spent 8.5 more hours per week on domestic activities, and were more likely to take time off during disruptions of usual child care.[33] Carr and colleagues found that women with children (compared to men with children) had fewer publications, slower self‐perceived career progress, and lower career satisfaction, but having children had little effect on faculty aspirations and goals.[2] Kaplan et al., however, found that family responsibilities do not appear to account for sex differences in academic advancement.[4] Interestingly, in a study comparing physicians from Generation X to those of the Baby Boomer age, Generation X women reported working more than their male Generation X counterparts, and both had more of a focus on worklife balance than the older generation.[12]
The nature the of 2 specialties' work environment and job requirements could have also resulted in some of the differences seen. Primary care clinical work is typically conducted Monday through Friday, and hospitalist work frequently includes some weekend, evening, night, and holiday coverage. Although these are known differences, both specialties have also been noted to offer many advantages to women and men alike, including collaborative working environments and flexible work hours.[16]
Finally, finding disparity in leadership positions in both specialties supports the possibility that those responsible for hiring could have implicit gender biases. Under‐representation in entry‐level positions is also not a likely explanation for the differences we observed, because nearly an equal number of men and women graduate from medical school, pursue residency training in internal medicine, and become either academic hospitalists or general internists at university settings.[1, 15, 24] This hypothesis could, however, explain why disparities exist with respect to senior authorship and leadership positions, as typically, these individuals have been in practice longer and the current trends of improved gender equality have not always been the case.
Our study has a number of limitations. First, we only examined publications in 2 journals and presentations at 2 national conferences, although the journals and conferences selected are considered to be the major ones in the 2 specialties. Second, using Internet searches may have resulted in inaccurate gender and specialty assignment, but previous studies have used similar methodology.[3, 43] Additionally, we also attempted to contact individuals for direct confirmation when the information we obtained was not clear and had a second investigator independently verify the gender and specialty data. Third, we utilized division/department websites when available to determine the gender of HM divisions/sections. If not recently updated, these websites may not have reflected the most current leader of the unit, but this concern would seemingly pertain to both hospitalists and general internists. Fourth, we opted to only study faculty and division/section heads at university hospitals, as typically these institutions had GIM and hospitalist groups and also typically had websites. Because we only studied faculty and leadership at university hospitals, our data are not generalizable to all hospitalist and GIM groups. Finally, we excluded pediatric hospitalists, and thus, this study is representative of adult hospitalists only. Including pediatric hospitalists was out of the scope of this project.
Our study also had a number of strengths. To our knowledge, this is the first study to provide an estimate of the gender distribution in academic HM, of hospitalists as speakers at national meetings, as first and last authors, and of HM division or section heads, and is the first to compare these results with those observed for general internists. In addition, we examined 7 years of data from 2 of the major journals and national conferences for these specialties.
In summary, despite HM being a newer field with a younger cohort of physicians, we found that gender disparities exist for women with respect to authorship, national speaking opportunities, and division or section leadership. Identifying why these gender differences exist presents an important next step.
Disclosures: Nothing to report. Marisha Burden, MD and Maria G. Frank, MD are coprincipal authors.
- Association of American Medical Colleges. Women in U.S. academic medicine and science: Statistics and benchmarking report. 2012. Available at: https://members.aamc.org/eweb/upload/Women%20in%20U%20S%20%20Academic%20Medicine%20Statistics%20and%20Benchmarking%20Report%202011-20123.pdf. Accessed September 1, 2014.
- , , , et al. Relation of family responsibilities and gender to the productivity and career satisfaction of medical faculty. Ann Intern Med. 1998;129:532–538.
- , , , et al. The “gender gap” in authorship of academic medical literature—a 35‐year perspective. N Engl J Med. 2006;355:281–287.
- , , , , , . Sex differences in academic advancement. Results of a national study of pediatricians. N Engl J Med. 1996;335:1282–1289.
- . Women physicians in academic medicine: new insights from cohort studies. N Engl J Med. 2000;342:399–405.
- , , , , . Gender differences in academic productivity and leadership appointments of physicians throughout academic careers. Acad Med. 2011;86:43–47.
- , , , . Promotion of women physicians in academic medicine. Glass ceiling or sticky floor? JAMA. 1995;273:1022–1025.
- , , , . Compensation and advancement of women in academic medicine: is there equity? Ann Intern Med. 2004;141:205–212.
- , , . Women physicians: choosing a career in academic medicine. Acad Med. 2012;87:105–114.
- , , , . The status of women at one academic medical center. Breaking through the glass ceiling. JAMA. 1990;264:1813–1817.
- , . Status of women in academic anesthesiology. Anesthesiology. 1986;64:496–500.
- , , . The generation and gender shifts in medicine: an exploratory survey of internal medicine physicians. BMC Health Serv Res. 2006;6:55.
- Pew Research Center. On pay gap, millenial women near parity—for now. December 2013. Available at: http://www.pewsocialtrends.org/files/2013/12/gender-and-work_final.pdf. Published December 11, 2013. Accessed February 5, 2015.
- , . The emerging role of "hospitalists" in the American health care system. N Engl J Med. 1996;335:514–517.
- , , , , , . Mentorship, productivity, and promotion among academic hospitalists. J Gen Intern Med. 2012;27:23–27.
- . The gender factor. The Hospitalist. Available at: http://www.the‐hospitalist.org/article/the‐gender‐factor. Published March 1, 2006. Accessed September 1, 2014.
- Association of American Medical Colleges. Analysis in brief: Supplemental information for estimating the number and characteristics of hospitalist physicians in the United States and their possible workforce implications. Available at: https://www.aamc.org/download/300686/data/aibvol12_no3-supplemental.pdf. Published August 2012. Accessed September 1, 2014.
- , , , . Survey of US academic hospitalist leaders about mentorship and academic activities in hospitalist groups. J Hosp Med. 2011;6:5–9.
- State of Hospital Medicine: 2011 Report Based on 2010 Data. Medical Group Management Association and Society of Hospital Medicine. www.mgma.com, www.hospitalmedicine.org.
- Today's Hospitalist Survey. Compensation and Career Survey Results. 2013. Available at: http://www.todayshospitalist.com/index.php?b=salary_survey_results. Accessed January 11, 2015.
- Association of American Medical Colleges. Women in U.S. Academic Medicine: Statistics and Benchmarking Report. 2009–2010. Available at: https://www.aamc.org/download/182674/data/gwims_stats_2009‐2010.pdf. Accessed September 1, 2014.
- American Medical Association. Graduate Medical Education Directory 2012–2013. Chicago, IL: American Medical Association; 2012:182–203.
- , , , , , . Research electronic data capture (REDCap)—a metadata‐driven methodology and workflow process for providing translational research informatics support. J Biomed Inform. 2009;42:377–381.
- Association of American Medical Colleges. 2012 Physician Specialty Data Book. Center for Workforce Studies. Available at: https://www.aamc.org/download/313228/data/2012physicianspecialtydatabook.pdf. Published November 2012. Accessed September 1, 2014.
- , , , . Representation of women as authors, reviewers, editors in chief, and editorial board members at 6 general medical journals in 2010 and 2011. JAMA Intern Med. 2014;174:633–635.
- , , , et al. Relationships of gender and career motivation to medical faculty members' production of academic publications. Acad Med. 1998;73:180–186.
- , , , et al. Faculty perceptions of gender discrimination and sexual harassment in academic medicine. Ann Intern Med. 2000;132:889–896.
- , , , . Attitudes of clinical faculty about career progress, career success and recognition, and commitment to academic medicine. Results of a survey. Arch Intern Med. 2000;160:2625–2629.
- , , , , . A "ton of feathers": gender discrimination in academic medical careers and how to manage it. J Womens Health (Larchmt). 2003;12:1009–1018.
- , , . Perceived obstacles to career success for women in academic surgery. Arch Surg. 2000;135:972–977.
- , , , . Career satisfaction of US women physicians: results from the Women Physicians' Health Study. Society of General Internal Medicine Career Satisfaction Study Group. Arch Intern Med. 1999;159:1417–1426.
- . Doing the same and earning less: male and female physicians in a new medical specialty. Inquiry. 2004;41:301–315.
- , , , , , . Gender differences in time spent on parenting and domestic responsibilities by high‐achieving young physician‐researchers. Ann Intern Med. 2014;160:344–353.
- , , , , . Stories from early‐career women physicians who have left academic medicine: a qualitative study at a single institution. Acad Med. 2011;86:752–758.
- , , , . The $16,819 pay gap for newly trained physicians: the unexplained trend of men earning more than women. Health Aff (Millwood). 2011;30:193–201.
- , , , , . Experiencing the culture of academic medicine: gender matters, a national study. J Gen Intern Med. 2013;28:201–207.
- . Gender pay gaps in hospital medicine. The Hospitalist. Available at: http://www.the‐hospitalist.org/article/gender‐pay‐gaps‐in‐hospital‐medicine. Published February 29, 2012. Accessed September 1, 2014.
- , , . Mentoring in academic medicine: a systematic review. JAMA. 2006;296:1103–1115.
- . Inequality quantified: mind the gender gap. Nature. 2013;495:22–24.
- , , , et al. Gender differences in academic advancement: patterns, causes, and potential solutions in one US College of Medicine. Acad Med. 2003;78:500–508.
- , . Why aren't there more women leaders in academic medicine? The views of clinical department chairs. Acad Med. 2001;76:453–465.
- . Gender factors in reviewer recommendations for manuscript publication. J Appl Behav Anal. 1990;23:539–543.
- , , , . Scientific impact of women in academic surgery. J Surg Res. 2008;148:13–16.
Gender disparities still exist for women in academic medicine.[1, 2, 3, 4, 5, 6, 7, 8, 9] The most recent data from the Association of American Medical Colleges (AAMC) show that although gender disparities are decreasing, women are still under‐represented in the assistant, associate, and full‐professor ranks as well as in leadership positions.[1]
Some studies indicate that gender differences are less evident when examining younger cohorts.[1, 10, 11, 12, 13] Hospital medicine emerged around 1996, when the term hospitalist was first coined.[14] The gender distribution of academic hospitalists is likely nearly equal,[15, 16] and they are generally younger physicians.[15, 17, 18, 19, 20] Accordingly, we questioned whether gender disparities existed in academic hospital medicine (HM) and, if so, whether these disparities were greater than those that might exist in academic general internal medicine (GIM).
METHODS
This study consisted of both prospective and retrospective observation of data collected for academic adult hospitalists and general internists who practice in the United States. It was approved by the Colorado Multiple Institutional Review Board.
Gender distribution was assessed with respect to: (1) academic HM and GIM faculty, (2) leadership (ie, division or section heads), and (3) scholarly work (ie, speaking opportunities and publications). Data were collected between October 1, 2012 and August 31, 2014.
Gender Distribution of Faculty and Division/Section Heads
All US internal medicine residency programs were identified from the list of members or affiliates of the AAMC that were fully accredited by the Liaison Committee on Medical Education[21] using the Graduate Medical Education Directory.[22] We then determined the primary training hospital(s) affiliated with each program and selected those that were considered to be university hospitals and eliminated those that did not have divisions or sections of HM or GIM. We determined the gender of the respective division/section heads on the basis of the faculty member's first name (and often from accompanying photos) as well as from information obtained via Internet searches and, if necessary, contacted the individual institutions via email or phone call(s). We also determined the number and gender of all of the HM and GIM faculty members in a random sample of 25% of these hospitals from information on their respective websites.
Gender Distribution for Scholarly Productivity
We determined the gender and specialty of all speakers at the Society of Hospital Medicine and the Society of General Internal Medicine national conferences from 2006 to 2012. A list of speakers at each conference was obtained from conference pamphlets or agendas that were available via Internet searches or obtained directly from the organization. We also determined whether each presenter was a featured speaker (defined as one whose talk was unopposed by other sessions), plenary speaker (defined as such in the conference pamphlets), or if they spoke in a group format (also as indicated in the conference pamphlets). Because of the low number of featured and plenary speakers, these data were combined. Faculty labeled as additional faculty when presenting in a group format were excluded as were speakers at precourses, those presenting abstracts, and those participating in interest group sessions.
For authorship, a PubMed search was used to identify all articles published in the Journal of Hospital Medicine (JHM) and the Journal of General Internal Medicine (JGIM) from January 1, 2006 through December 31, 2012, and the gender and specialty of all the first and last authors were determined as described above. Specialty was determined from the division, section or department affiliation indicated for each author and by Internet searches. In some instances, it was necessary to contact the authors or their departments directly to verify their specialty. When articles had only 1 author, the author was considered a first author.
Duplicate records (eg, same author, same journal) and articles without an author were excluded, as were authors who did not have an MD, DO, or MBBS degree and those who were not affiliated with an institution in the United States. All manuscripts, with the exception of errata, were analyzed together as well as in 3 subgroups: original research, editorials, and others.
A second investigator corroborated data regarding gender and specialty for all speakers and authors to strengthen data integrity. On the rare occasion when discrepancies were found, a third investigator adjudicated the results.
Definitions
Physicians were defined as being hospitalists if they were listed as a member of a division or section of HM on their publications or if Internet searches indicated that they were a hospitalist or primarily worked on inpatient medical services. Physicians were considered to be general internists if they were listed as such on their publications and their specialty could be verified in Web‐based searches. If physicians appeared to have changing roles over time, we attempted to assign their specialty based upon their role at the time the article was published or the presentation was delivered. If necessary, phone calls and/or emails were also done to determine the physician's specialty.
Analysis
REDCap, a secure, Web‐based application for building and managing online surveys and databases, was used to collect and manage all study data.[23] All analyses were performed using SAS Enterprise Guide 4.3 (SAS Institute, Inc., Cary, NC). A [2] test was used to compare proportions of male versus female physicians, and data from hospitalists versus general internists. Because we performed multiple comparisons when analyzing presentations and publications, a Bonferroni adjustment was made such that a P<0.0125 for presentations and P<0.006 (within specialty) or P<0.0125 (between specialty) for the publication analyses were considered significant. P<0.05 was considered significant for all other comparisons.
RESULTS
Gender Distribution of Faculty
Eighteen HM and 20 GIM programs from university hospitals were randomly selected for review (see Supporting Figure 1 in the online version of this article). Seven of the HM programs and 1 of the GIM programs did not have a website, did not differentiate hospitalists from other faculty, or did not list their faculty on the website and were excluded from the analysis. In the remaining 11 HM programs and 19 GIM programs, women made up 277/568 (49%) and 555/1099 (51%) of the faculty, respectively (P=0.50).
Gender Distribution of Division/Section Heads
Eighty‐six of the programs were classified as university hospitals (see Supporting Figure 1 in the online version of this article), and in these, women led 11/69 (16%) of the HM divisions or sections and 28/80 (35%) of the GIM divisions (P=0.008).
Gender Distribution for Scholarly Productivity
Speaking Opportunities
A total of 1227 presentations were given at the 2 conferences from 2006 to 2012, with 1343 of the speakers meeting inclusion criteria (see Supporting Figure 2 in the online version of this article). Hospitalists accounted for 557 of the speakers, of which 146 (26%) were women. General internists accounted for 580 of the speakers, of which 291 (50%) were women (P<0.0001) (Table 1).
| Male, N (%) | Female, N (%) | |
|---|---|---|
| ||
| Hospitalists | ||
| All presentations | 411 (74) | 146 (26)* |
| Featured or plenary presentations | 49 (91) | 5 (9)* |
| General internists | ||
| All presentations | 289 (50) | 291 (50) |
| Featured or plenary presentations | 27 (55) | 22 (45) |
Of the 117 featured or plenary speakers, 54 were hospitalists and 5 (9%) of these were women. Of the 49 who were general internists, 22 (45%) were women (P<0.0001).
Authorship
The PubMed search identified a total of 3285 articles published in the JHM and the JGIM from 2006 to 2012, and 2172 first authors and 1869 last authors met inclusion criteria (see Supporting Figure 3 in the online version of this article). Hospitalists were listed as first or last authors on 464 and 305 articles, respectively, and of these, women were first authors on 153 (33%) and last authors on 63 (21%). General internists were listed as first or last authors on 895 and 769 articles, respectively, with women as first authors on 423 (47%) and last authors on 265 (34%). Compared with general internists, fewer women hospitalists were listed as either first or last authors (both P<0.0001) (Table 2).
| First Author | Last Author | |||
|---|---|---|---|---|
| Male, N (%) | Female, N (%) | Male, N (%) | Female, N (%) | |
| ||||
| Hospitalists | ||||
| All publications | 311 (67) | 153 (33)* | 242 (79) | 63 (21)* |
| Original investigations/brief reports | 124 (61) | 79 (39)* | 96 (76) | 30 (24)* |
| Editorials | 34 (77) | 10 (23)* | 18 (86) | 3 (14)* |
| Other | 153 (71) | 64 (29)* | 128 (81) | 30 (19)* |
| General internists | ||||
| All publications | 472 (53) | 423 (47) | 504 (66) | 265 (34)* |
| Original investigations/brief reports | 218 (46) | 261 (54) | 310 (65) | 170 (35)* |
| Editorial | 98 (68) | 46 (32)* | 43 (73) | 16 (27)* |
| Other | 156 (57) | 116 (43) | 151 (66) | 79 (34)* |
Fewer women hospitalists were listed as first or last authors on all article types. For original research articles written by general internists, there was a trend for more women to be listed as first authors than men (261/479, 54%), but this difference was not statistically significant.
DISCUSSION
The important findings of this study are that, despite an equal gender distribution of academic HM and GIM faculty, fewer women were HM division/section chiefs, fewer women were speakers at the 2 selected national meetings, and fewer women were first or last authors of publications in 2 selected journals in comparison with general internists.
Previous studies have found that women lag behind their male counterparts with respect to academic productivity, leadership, and promotion.[1, 5, 7] Some studies suggest, however, that gender differences are reduced when younger cohorts are examined.[1, 10, 11, 12, 13] Surveys indicate that that the mean age of hospitalists is younger than most other specialties.[15, 19, 20, 24] The mean age of academic GIM physicians is unknown, but surveys of GIM (not differentiating academic from nonacademic) suggest that it is an older cohort than that of HM.[24] Despite hospitalists being a younger cohort, we found gender disparities in all areas investigated.
Our findings with respect to gender disparities in HM division or section leadership are consistent with the annual AAMC Women in US Academic Medicine and Science Benchmarking Report that found only 22% of all permanent division or section heads were women.[1]
Gender disparities with respect to authorship of medical publications have been previously noted,[3, 6, 15, 25] but to our knowledge, this is the first study to investigate the gender of authors who were hospitalists. Although we found a higher proportion of women hospitalists who were first or last authors than was observed by Jagsi and colleagues,[3] women hospitalists were still under‐represented with respect to this measure of academic productivity. Erren et al. reviewed 6 major journals from 2010 and 2011, and found that first authorship of original research by women ranged from 23.7% to 46.7%, and for last authorship from 18.3% to 28.8%.[25] Interestingly, we found no significant gender difference for first authors who were general internists, and there was a trend toward more women general internists being first authors than men for original research, reviews, and brief reports (data not shown).
Our study did not attempt to answer the question of why gender disparities persist, but many previous studies have explored this issue.[4, 8, 12, 26, 27, 28, 29, 30, 31, 32, 33, 34, 35, 36, 37, 38, 39, 40, 41, 42] Issues raised by others include the quantity of academic work (ie, publications and grants obtained), differences in hours worked and allocation of time, lack of mentorship, family responsibilities, discrimination, differences in career motivation, and levels of institutional support, to name a few.
The under‐representation of women hospitalists in leadership, authorship, and speaking opportunities may be consistent with gender‐related differences in research productivity. Fewer publications could lead to fewer national presentations, which could lead to fewer leadership opportunities. Our findings with respect to general internists are not consistent with this idea, however, as whereas women were under‐represented in GIM leadership positions, we found no disparities with respect to the gender of first authors or speakers at national meetings for general internists. The finding that hospitalists had gender disparities with respect to first authors and national speakers but general internists did not, argues against several hypotheses (ie, that women lack mentorship, have less career motivation, fewer career building opportunities).
One notable hypothesis, and perhaps one that is often discussed in the literature, is that women shoulder the majority of family responsibilities, and this may result in women having less time for their careers. Jolly and colleagues studied physician‐researchers and noted that women were more likely than men to have spouses or domestic partners who were fully employed, spent 8.5 more hours per week on domestic activities, and were more likely to take time off during disruptions of usual child care.[33] Carr and colleagues found that women with children (compared to men with children) had fewer publications, slower self‐perceived career progress, and lower career satisfaction, but having children had little effect on faculty aspirations and goals.[2] Kaplan et al., however, found that family responsibilities do not appear to account for sex differences in academic advancement.[4] Interestingly, in a study comparing physicians from Generation X to those of the Baby Boomer age, Generation X women reported working more than their male Generation X counterparts, and both had more of a focus on worklife balance than the older generation.[12]
The nature the of 2 specialties' work environment and job requirements could have also resulted in some of the differences seen. Primary care clinical work is typically conducted Monday through Friday, and hospitalist work frequently includes some weekend, evening, night, and holiday coverage. Although these are known differences, both specialties have also been noted to offer many advantages to women and men alike, including collaborative working environments and flexible work hours.[16]
Finally, finding disparity in leadership positions in both specialties supports the possibility that those responsible for hiring could have implicit gender biases. Under‐representation in entry‐level positions is also not a likely explanation for the differences we observed, because nearly an equal number of men and women graduate from medical school, pursue residency training in internal medicine, and become either academic hospitalists or general internists at university settings.[1, 15, 24] This hypothesis could, however, explain why disparities exist with respect to senior authorship and leadership positions, as typically, these individuals have been in practice longer and the current trends of improved gender equality have not always been the case.
Our study has a number of limitations. First, we only examined publications in 2 journals and presentations at 2 national conferences, although the journals and conferences selected are considered to be the major ones in the 2 specialties. Second, using Internet searches may have resulted in inaccurate gender and specialty assignment, but previous studies have used similar methodology.[3, 43] Additionally, we also attempted to contact individuals for direct confirmation when the information we obtained was not clear and had a second investigator independently verify the gender and specialty data. Third, we utilized division/department websites when available to determine the gender of HM divisions/sections. If not recently updated, these websites may not have reflected the most current leader of the unit, but this concern would seemingly pertain to both hospitalists and general internists. Fourth, we opted to only study faculty and division/section heads at university hospitals, as typically these institutions had GIM and hospitalist groups and also typically had websites. Because we only studied faculty and leadership at university hospitals, our data are not generalizable to all hospitalist and GIM groups. Finally, we excluded pediatric hospitalists, and thus, this study is representative of adult hospitalists only. Including pediatric hospitalists was out of the scope of this project.
Our study also had a number of strengths. To our knowledge, this is the first study to provide an estimate of the gender distribution in academic HM, of hospitalists as speakers at national meetings, as first and last authors, and of HM division or section heads, and is the first to compare these results with those observed for general internists. In addition, we examined 7 years of data from 2 of the major journals and national conferences for these specialties.
In summary, despite HM being a newer field with a younger cohort of physicians, we found that gender disparities exist for women with respect to authorship, national speaking opportunities, and division or section leadership. Identifying why these gender differences exist presents an important next step.
Disclosures: Nothing to report. Marisha Burden, MD and Maria G. Frank, MD are coprincipal authors.
- Association of American Medical Colleges. Women in U.S. academic medicine and science: Statistics and benchmarking report. 2012. Available at: https://members.aamc.org/eweb/upload/Women%20in%20U%20S%20%20Academic%20Medicine%20Statistics%20and%20Benchmarking%20Report%202011-20123.pdf. Accessed September 1, 2014.
- , , , et al. Relation of family responsibilities and gender to the productivity and career satisfaction of medical faculty. Ann Intern Med. 1998;129:532–538.
- , , , et al. The “gender gap” in authorship of academic medical literature—a 35‐year perspective. N Engl J Med. 2006;355:281–287.
- , , , , , . Sex differences in academic advancement. Results of a national study of pediatricians. N Engl J Med. 1996;335:1282–1289.
- . Women physicians in academic medicine: new insights from cohort studies. N Engl J Med. 2000;342:399–405.
- , , , , . Gender differences in academic productivity and leadership appointments of physicians throughout academic careers. Acad Med. 2011;86:43–47.
- , , , . Promotion of women physicians in academic medicine. Glass ceiling or sticky floor? JAMA. 1995;273:1022–1025.
- , , , . Compensation and advancement of women in academic medicine: is there equity? Ann Intern Med. 2004;141:205–212.
- , , . Women physicians: choosing a career in academic medicine. Acad Med. 2012;87:105–114.
- , , , . The status of women at one academic medical center. Breaking through the glass ceiling. JAMA. 1990;264:1813–1817.
- , . Status of women in academic anesthesiology. Anesthesiology. 1986;64:496–500.
- , , . The generation and gender shifts in medicine: an exploratory survey of internal medicine physicians. BMC Health Serv Res. 2006;6:55.
- Pew Research Center. On pay gap, millenial women near parity—for now. December 2013. Available at: http://www.pewsocialtrends.org/files/2013/12/gender-and-work_final.pdf. Published December 11, 2013. Accessed February 5, 2015.
- , . The emerging role of "hospitalists" in the American health care system. N Engl J Med. 1996;335:514–517.
- , , , , , . Mentorship, productivity, and promotion among academic hospitalists. J Gen Intern Med. 2012;27:23–27.
- . The gender factor. The Hospitalist. Available at: http://www.the‐hospitalist.org/article/the‐gender‐factor. Published March 1, 2006. Accessed September 1, 2014.
- Association of American Medical Colleges. Analysis in brief: Supplemental information for estimating the number and characteristics of hospitalist physicians in the United States and their possible workforce implications. Available at: https://www.aamc.org/download/300686/data/aibvol12_no3-supplemental.pdf. Published August 2012. Accessed September 1, 2014.
- , , , . Survey of US academic hospitalist leaders about mentorship and academic activities in hospitalist groups. J Hosp Med. 2011;6:5–9.
- State of Hospital Medicine: 2011 Report Based on 2010 Data. Medical Group Management Association and Society of Hospital Medicine. www.mgma.com, www.hospitalmedicine.org.
- Today's Hospitalist Survey. Compensation and Career Survey Results. 2013. Available at: http://www.todayshospitalist.com/index.php?b=salary_survey_results. Accessed January 11, 2015.
- Association of American Medical Colleges. Women in U.S. Academic Medicine: Statistics and Benchmarking Report. 2009–2010. Available at: https://www.aamc.org/download/182674/data/gwims_stats_2009‐2010.pdf. Accessed September 1, 2014.
- American Medical Association. Graduate Medical Education Directory 2012–2013. Chicago, IL: American Medical Association; 2012:182–203.
- , , , , , . Research electronic data capture (REDCap)—a metadata‐driven methodology and workflow process for providing translational research informatics support. J Biomed Inform. 2009;42:377–381.
- Association of American Medical Colleges. 2012 Physician Specialty Data Book. Center for Workforce Studies. Available at: https://www.aamc.org/download/313228/data/2012physicianspecialtydatabook.pdf. Published November 2012. Accessed September 1, 2014.
- , , , . Representation of women as authors, reviewers, editors in chief, and editorial board members at 6 general medical journals in 2010 and 2011. JAMA Intern Med. 2014;174:633–635.
- , , , et al. Relationships of gender and career motivation to medical faculty members' production of academic publications. Acad Med. 1998;73:180–186.
- , , , et al. Faculty perceptions of gender discrimination and sexual harassment in academic medicine. Ann Intern Med. 2000;132:889–896.
- , , , . Attitudes of clinical faculty about career progress, career success and recognition, and commitment to academic medicine. Results of a survey. Arch Intern Med. 2000;160:2625–2629.
- , , , , . A "ton of feathers": gender discrimination in academic medical careers and how to manage it. J Womens Health (Larchmt). 2003;12:1009–1018.
- , , . Perceived obstacles to career success for women in academic surgery. Arch Surg. 2000;135:972–977.
- , , , . Career satisfaction of US women physicians: results from the Women Physicians' Health Study. Society of General Internal Medicine Career Satisfaction Study Group. Arch Intern Med. 1999;159:1417–1426.
- . Doing the same and earning less: male and female physicians in a new medical specialty. Inquiry. 2004;41:301–315.
- , , , , , . Gender differences in time spent on parenting and domestic responsibilities by high‐achieving young physician‐researchers. Ann Intern Med. 2014;160:344–353.
- , , , , . Stories from early‐career women physicians who have left academic medicine: a qualitative study at a single institution. Acad Med. 2011;86:752–758.
- , , , . The $16,819 pay gap for newly trained physicians: the unexplained trend of men earning more than women. Health Aff (Millwood). 2011;30:193–201.
- , , , , . Experiencing the culture of academic medicine: gender matters, a national study. J Gen Intern Med. 2013;28:201–207.
- . Gender pay gaps in hospital medicine. The Hospitalist. Available at: http://www.the‐hospitalist.org/article/gender‐pay‐gaps‐in‐hospital‐medicine. Published February 29, 2012. Accessed September 1, 2014.
- , , . Mentoring in academic medicine: a systematic review. JAMA. 2006;296:1103–1115.
- . Inequality quantified: mind the gender gap. Nature. 2013;495:22–24.
- , , , et al. Gender differences in academic advancement: patterns, causes, and potential solutions in one US College of Medicine. Acad Med. 2003;78:500–508.
- , . Why aren't there more women leaders in academic medicine? The views of clinical department chairs. Acad Med. 2001;76:453–465.
- . Gender factors in reviewer recommendations for manuscript publication. J Appl Behav Anal. 1990;23:539–543.
- , , , . Scientific impact of women in academic surgery. J Surg Res. 2008;148:13–16.
© 2015 Society of Hospital Medicine
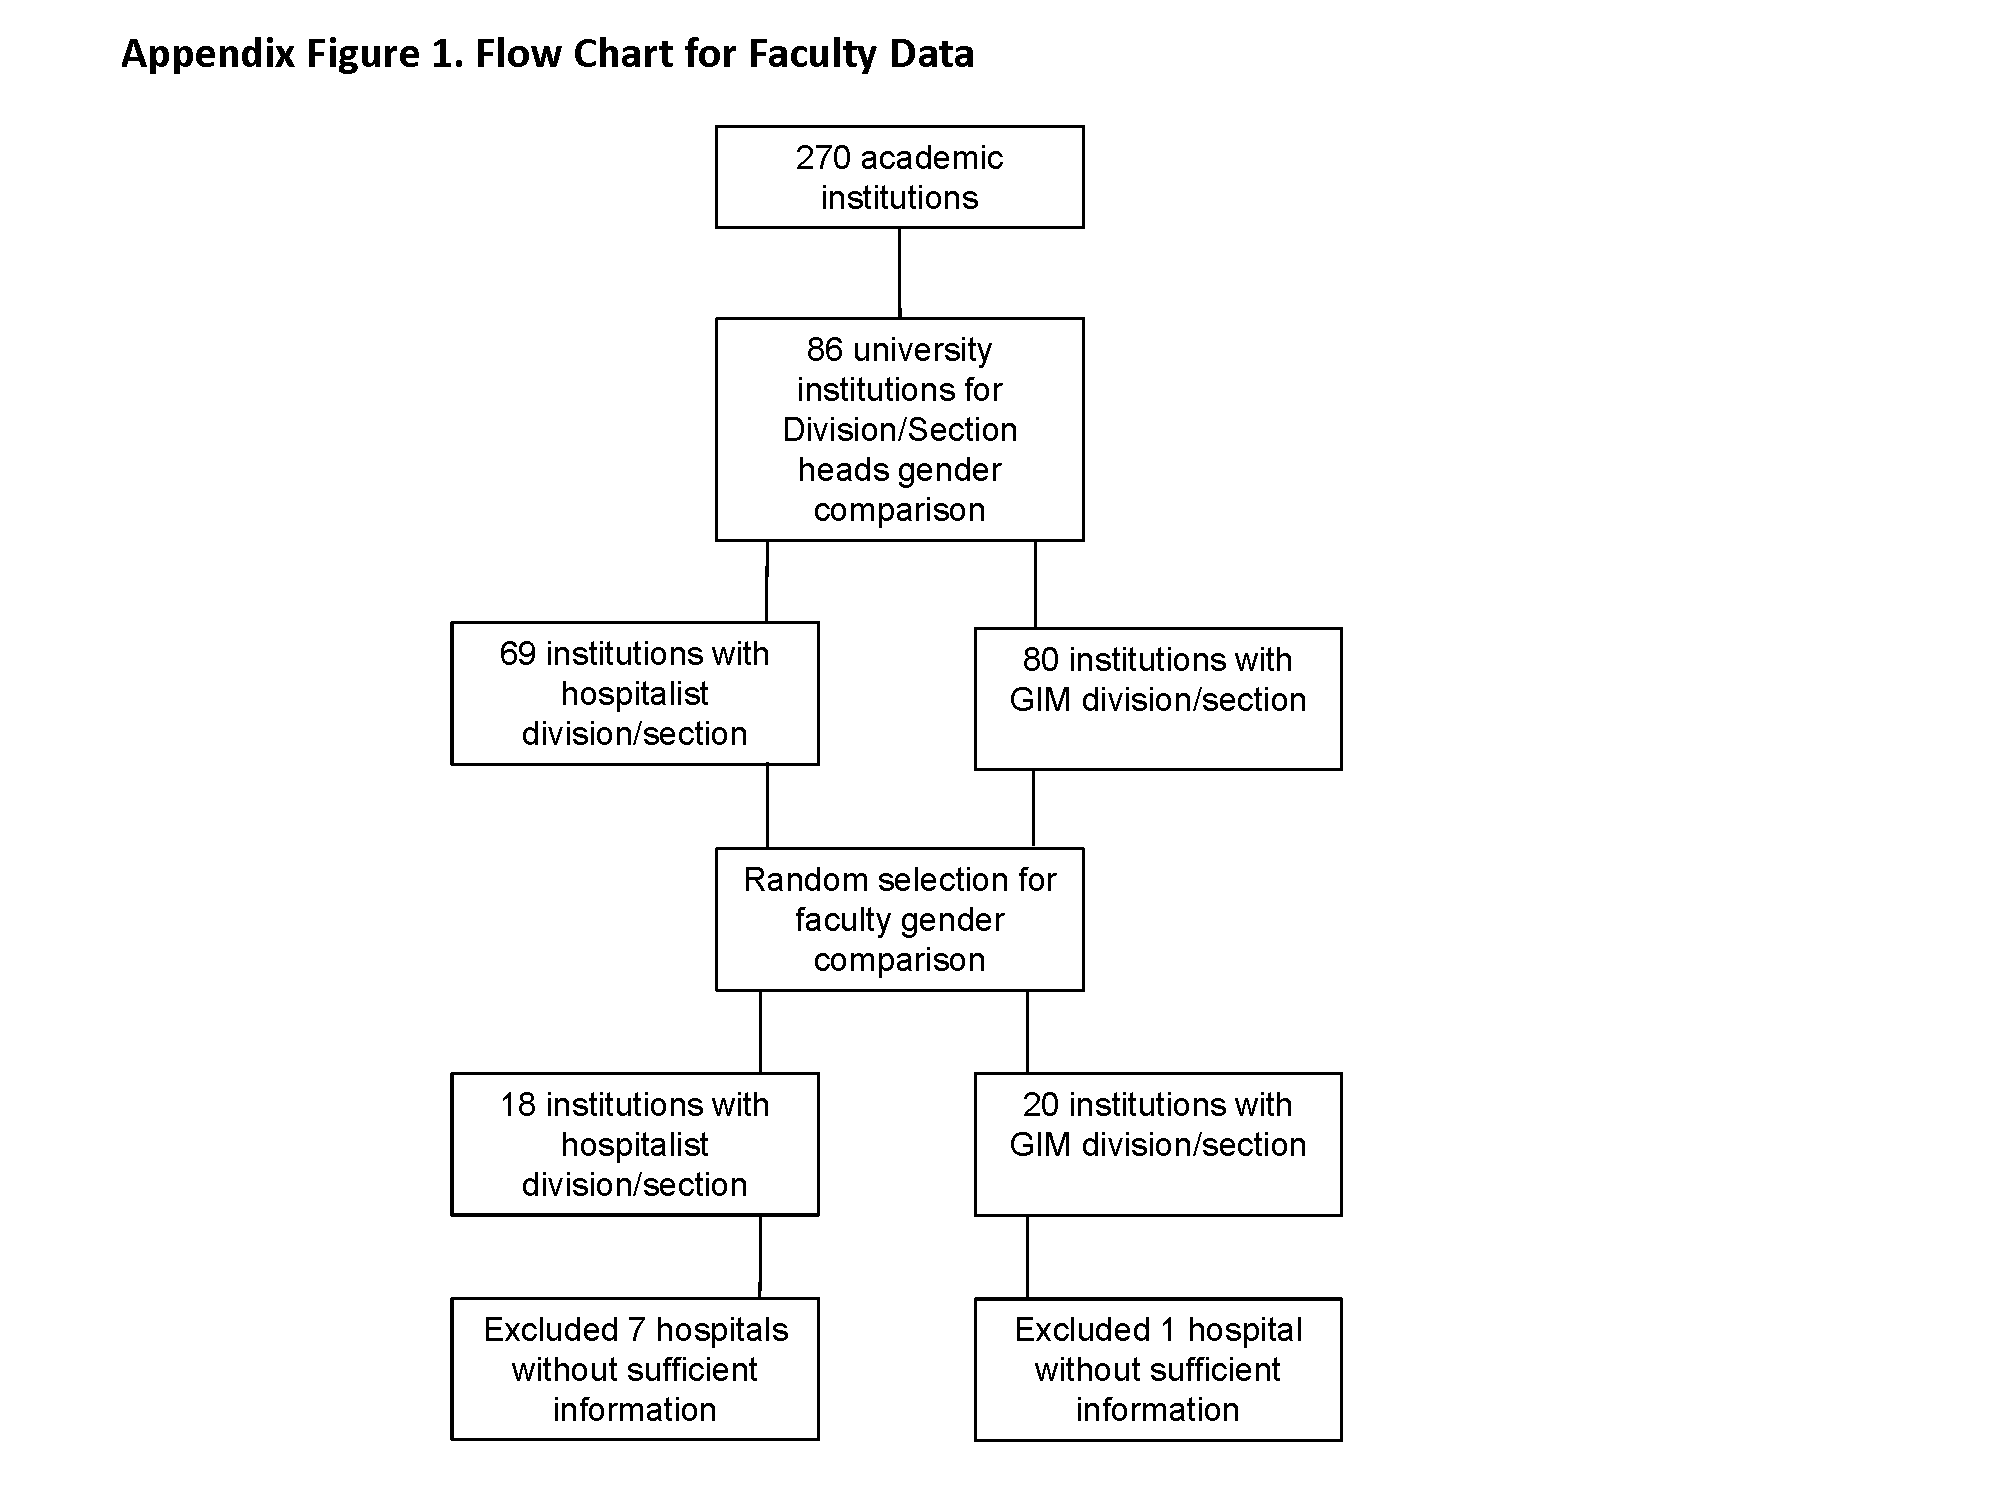


Problems Identified by Advice Line Calls
The period immediately following hospital discharge is particularly hazardous for patients.[1, 2, 3, 4, 5] Problems occurring after discharge may result in high rates of rehospitalization and unscheduled visits to healthcare providers.[6, 7, 8, 9, 10] Numerous investigators have tried to identify patients who are at increased risk for rehospitalizations within 30 days of discharge, and many studies have examined whether various interventions could decrease these adverse events (summarized in Hansen et al.[11]). An increasing fraction of patients discharged by medicine and surgery services have some or all of their care supervised by hospitalists. Thus, hospitals increasingly look to hospitalists for ways to reduce rehospitalizations.
Patients discharged from our hospital are instructed to call an advice line (AL) if and when questions or concerns arise. Accordingly, we examined when these calls were made and what issues were raised, with the idea that the information collected might identify aspects of our discharge processes that needed improvement.
METHODS
Study Design
We conducted a prospective study of a cohort consisting of all unduplicated patients with a matching medical record number in our data warehouse who called our AL between September 1, 2011 and September 1, 2012, and reported being hospitalized or having surgery (inpatient or outpatient) within 30 days preceding their call. We excluded patients who were incarcerated, those who were transferred from other hospitals, those admitted for routine chemotherapy or emergent dialysis, and those discharged to a skilled nursing facility or hospice. The study involved no intervention. It was approved by the Colorado Multiple Institutional Review Board.
Setting
The study was conducted at Denver Health Medical Center, a 525‐bed, university‐affiliated, public safety‐net hospital. At the time of discharge, all patients were given paperwork that listed the telephone number of the AL and written instructions in English or Spanish telling them to call the AL or their primary care physician if they had any of a list of symptoms that was selected by their discharging physician as being relevant to that specific patient's condition(s).
The AL was established in 1997 to provide medical triage to patients of Denver Health. It operates 24 hours a day, 7 days per week, and receives approximately 100,000 calls per year. A language line service is used with nonEnglish‐speaking callers. Calls are handled by a nurse who, with the assistance of a commercial software program (E‐Centaurus; LVM Systems, Phoenix, AZ) containing clinical algorithms (Schmitt‐Thompson Clinical Content, Windsor, CO), makes a triage recommendation. Nurses rarely contact hospital or clinic physicians to assist with triage decisions.
Variables Assessed
We categorized the nature of the callers' reported problem(s) to the AL using the taxonomy summarized in the online appendix (see Supporting Appendix in the online version of this article). We then queried our data warehouse for each patient's demographic information, patient‐level comorbidities, discharging service, discharge date and diagnoses, hospital length of stay, discharge disposition, and whether they had been hospitalized or sought care in our urgent care center or emergency department within 30 days of discharge. The same variables were collected for all unduplicated patients who met the same inclusion and exclusion criteria and were discharged from Denver Health during the same time period but did not call the AL.
Statistics
Data were analyzed using SAS Enterprise Guide 4.1 (SAS Institute, Inc., Cary, NC). Because we made multiple statistical comparisons, we applied the Bonferroni correction when comparing patients calling the AL with those who did not, such that P<0.004 indicated statistical significance. A Student t test or a Wilcoxon rank sum test was used to compare continuous variables depending on results of normality tests. 2 tests were used to compare categorical variables. The intervals between hospital discharge and the call to the AL for patients discharged from medicine versus surgery services were compared using a log‐rank test, with P<0.05 indicating statistical significance.
RESULTS
During the 1‐year study period, 19,303 unique patients were discharged home with instructions regarding the use of the AL. A total of 310 patients called the AL and reported being hospitalized or having surgery within the preceding 30 days. Of these, 2 were excluded (1 who was incarcerated and 1 who was discharged to a skilled nursing facility), leaving 308 patients in the cohort. This represented 1.5% of the total number of unduplicated patients discharged during this same time period (minus the exclusions described above). The large majority of the calls (277/308, 90%) came directly from patients. The remaining 10% came from a proxy, usually a patient's family member. Compared with patients who were discharged during the same time period who did not call the AL, those who called were more likely to speak English, less likely to speak Spanish, more likely to be medically indigent, had slightly longer lengths of stays for their index hospitalization, and were more likely to be discharged from surgery than medicine services (particularly following inpatient surgery) (Table 1).
| Patient Characteristics | Patients Calling Advice Line After Discharge, N=308 | Patients Not Calling Advice Line After Discharge, N=18,995 | P Valuea |
|---|---|---|---|
| |||
| Age, y (meanSD) | 4217 | 3921 | 0.0210 |
| Gender, female, n (%) | 162 (53) | 10,655 (56) | |
| Race/ethnicity, n (%) | 0.1208 | ||
| Hispanic/Latino/Spanish | 129 (42) | 8,896 (47) | |
| African American | 44 (14) | 2,674 (14) | |
| White | 125 (41) | 6,569 (35) | |
| Language, n (%) | <0.0001 | ||
| English | 273 (89) | 14,236 (79) | |
| Spanish | 32 (10) | 3,744 (21) | |
| Payer, n (%) | |||
| Medicare | 45 (15) | 3,013 (16) | |
| Medicaid | 105 (34) | 7,777 (41) | 0.0152 |
| Commercial | 49 (16) | 2,863 (15) | |
| Medically indigentb | 93 (30) | 3,442 (18) | <0.0001 |
| Self‐pay | 5 (1) | 1,070 (5) | |
| Primary care provider, n (%)c | 168 (55) | 10,136 (53) | 0.6794 |
| Psychiatric comorbidity, n (%) | 81 (26) | 4,528 (24) | 0.3149 |
| Alcohol or substance abuse comorbidity, n (%) | 65 (21) | 3,178 (17) | 0.0417 |
| Discharging service, n (%) | <0.0001 | ||
| Surgery | 193 (63) | 7,247 (38) | |
| Inpatient | 123 (40) | 3,425 (18) | |
| Ambulatory | 70 (23) | 3,822 (20) | |
| Medicine | 93 (30) | 6,038 (32) | |
| Pediatric | 4 (1) | 1,315 (7) | |
| Obstetric | 11 (4) | 3,333 (18) | |
| Length of stay, median (IQR) | 2 (04.5) | 1 (03) | 0.0003 |
| Inpatient medicine | 4 (26) | 3 (15) | 0.0020 |
| Inpatient surgery | 3 (16) | 2 (14) | 0.0019 |
| Charlson Comorbidity Index, median (IQR) | |||
| Inpatient medicine | 1 (04) | 1 (02) | 0.0435 |
| Inpatient surgery | 0 (01) | 0 (01) | 0.0240 |
The median time from hospital discharge to the call was 3 days (interquartile range [IQR], 16), but 31% and 47% of calls occurred within 24 or 48 hours of discharge, respectively. Ten percent of patients called the AL the same day of discharge (Figure 1). We found no difference in timing of the calls as a function of discharging service.

The 308 patients reported a total of 612 problems or concerns (meanstandard deviation number of complaints per caller=21), the large majority of which (71%) were symptom‐related (Table 2). The most common symptom was uncontrolled pain, reported by 33% and 40% of patients discharged from medicine and surgery services, respectively. The next most common symptoms related to the gastrointestinal system and to surgical site issues in medicine and surgery patients, respectively (data not shown).
| Total Cohort, n (%) | Patients Discharged From Medicine, n (%) | Patients Discharged From Surgery, n (%) | ||||
|---|---|---|---|---|---|---|
| Patients | Complaints | Patients | Complaints | Patients | Complaints | |
| Symptom related | 280 (91) | 433 (71) | 89 (96) | 166 (77) | 171 (89) | 234 (66) |
| Discharge instructions | 65 (21) | 81 (13) | 18 (19) | 21 (10) | 43 (22) | 56 (16) |
| Medication related | 65 (21) | 87 (14) | 19 (20) | 25 (11) | 39 (20) | 54 (15) |
| Other | 10 (3) | 11 (2) | 4 (4) | 4 (2) | 6 (3) | 7 (2) |
| Total | 612 (100) | 216 (100) | 351 (100) | |||
Sixty‐five patients, representing 21% of the cohort, reported 81 problems understanding or executing discharge instructions. No difference was observed between the fraction of these problems reported by patients from medicine versus surgery (19% and 22%, respectively, P=0.54).
Sixty‐five patients, again representing 21% of the cohort, reported 87 medication‐related problems, 20% from both the medicine and surgery services (P=0.99). Medicine patients more frequently reported difficulties understanding their medication instructions, whereas surgery patients more frequently reported lack of efficacy of medications, particularly with respect to pain control (data not shown).
Thirty percent of patients who called the AL were advised by the nurse to go to the emergency department immediately. Medicine patients were more likely to be triaged to the emergency department compared with surgery patients (45% vs 22%, P<0.0001).
The 30‐day readmission rates and the rates of unscheduled urgent or emergent care visits were higher for patients calling the AL compared with those who did not call (46/308, 15% vs 706/18,995, 4%, and 92/308, 30% vs 1303/18,995, 7%, respectively, both P<0.0001). Similar differences were found for patients discharged from medicine or surgery services who called the AL compared with those who did not (data not shown, both P<0.0001). The median number of days between AL call and rehospitalization was 0 (IQR, 02) and 1 (IQR, 08) for medicine and surgery patients, respectively. Ninety‐three percent of rehospitalizations were related to the index hospitalization, and 78% of patients who were readmitted had no outpatient encounter in the interim between discharge and rehospitalization.
DISCUSSION
We investigated the source and nature of patient telephone calls to an AL following a hospitalization or surgery, and our data revealed the following important findings: (1) nearly one‐half of the calls to the AL occurred within the first 48 hours following discharge; (2) the majority of the calls came from surgery patients, and a greater fraction of patients discharged from surgery services called the AL than patients discharged from medicine services; (3) the most common issues were uncontrolled pain, questions about medications, and problems understanding or executing aftercare instructions (particularly pertaining to the care of surgical wounds); and (4) patients calling the AL had higher rates of 30‐day rehospitalization and of unscheduled urgent or emergent care visits.
The utilization of our patient‐initiated call line was only 1.5%, which was on the low end of the 1% to 10% reported in the literature.[7, 12] This can be attributed to a number of issues that are specific to our system. First, the discharge instructions provided to our patients stated that they should call their primary care provider or the AL if they had questions. Accordingly, because approximately 50% of our patients had a primary care provider in our system, some may have preferentially contacted their primary care provider rather than the AL. Second, the instructions stated that the patients should call if they were experiencing the symptoms listed on the instruction sheet, so those with other problems/complaints may not have called. Third, AL personnel identified patients as being in our cohort by asking if they had been discharged or underwent a surgical procedure within 30‐days of their call. This may have resulted in the under‐reporting of patients who were hospitalized or had outpatient surgical procedures. Fourth, there may have been a number of characteristics specific to patients in our system that reduced the frequency with which they utilized the AL (eg, access to telephones or other community providers).
Most previous studies of patient‐initiated call lines have included them as part of multi‐intervention pre‐ and/or postdischarge strategies.[7, 8, 9, 10, 11, 12, 13] One prior small study compared the information reported by 37 patients who called an AL with that elicited by nurse‐initiated patient contact.[12] The most frequently reported problems in this study were medication‐related issues (43%). However, this study only included medicine patients and did not document the proportion of calls occurring at various time intervals.
The problems we identified (in both medicine and surgery patients) have previously been described,[2, 3, 4, 13, 14, 15, 16] but all of the studies reporting these problems utilized calls that were initiated by health care providers to patients at various fixed intervals following discharge (ie, 730 days). Most of these used a scripted approach seeking responses to specific questions or outcomes, and the specific timing at which the problems arose was not addressed. In contrast, we examined unsolicited concerns expressed by patients calling an AL following discharge whenever they felt sufficient urgency to address whatever problems or questions arose. We found that a large fraction of calls occurred on the day of or within the first 48 hours following discharge, much earlier than when provider‐initiated calls in the studies cited above occurred. Accordingly, our results cannot be used to compare the utility of patient‐ versus provider‐initiated calls, or to suggest that other hospitals should create an AL system. Rather, we suggest that our findings might be complementary to those reported in studies of provider‐initiated calls and only propose that by examining calls placed by patients to ALs, problems with hospital discharge processes (some of which may result in increased rates of readmission) may be discovered.
The observation that such a large fraction of calls to our AL occurred within the first 48 hours following discharge, together with the fact that many of the questions asked or concerns raised pertained to issues that should have been discussed during the discharge process (eg, pain control, care of surgical wounds), suggests that suboptimal patient education was occurring prior to discharge as was suggested by Henderson and Zernike.[17] This finding has led us to expand our patient education processes prior to discharge on both medicine and surgery services. Because our hospitalists care for approximately 90% of the patients admitted to medicine services and are increasingly involved in the care of patients on surgery services, they are integrally involved with such quality improvement initiatives.
To our knowledge this is the first study in the literature that describes both medicine and surgery patients who call an AL because of problems or questions following hospital discharge, categorizes these problems, determines when the patients called following their discharge, and identifies those who called as being at increased risk for early rehospitalizations and unscheduled urgent or emergent care visits. Given the financial penalties issued to hospitals with high 30‐day readmission rates, these patients may warrant more attention than is customarily available from telephone call lines or during routine outpatient follow‐up. The majority of patients who called our AL had Medicare, Medicaid, or a commercial insurance, and, accordingly, may have been eligible for additional services such as home visits and/or expedited follow‐up appointments.
Our study has a number of limitations. First, it is a single‐center study, so the results might not generalize to other institutions. Second, because the study was performed in a university‐affiliated, public safety‐net hospital, patient characteristics and the rates and types of postdischarge concerns that we observed might differ from those encountered in different types of hospitals and/or from those in nonteaching institutions. We would suggest, however, that the idea of using concerns raised by patients discharged from any type of hospital in calls to ALs may similarly identify problems with that specific hospital's discharge processes. Third, the information collected from the AL came from summaries provided by nurses answering the calls rather than from actual transcripts. This could have resulted in insufficient or incorrect information pertaining to some of the variables assessed in Table 2. The information presented in Table 1, however, was obtained from our data warehouse after matching medical record numbers. Fourth, we could have underestimated the number of patients who had 30‐day rehospitalizations and/or unplanned for urgent or emergent care visits if patients sought care at other hospitals. Fifth, the number of patients calling the AL was too small to allow us to do any type of robust matching or multivariable analysis. Accordingly, the differences that appeared between patients who called and those who did not (ie, English speakers, being medically indigent, the length of stay for the index hospitalization and the discharging service) could be the result of inadequate matching or interactions among the variables. Although matching or multivariate analysis might have yielded different associations between patients who called the AL versus those who did not, those who called the AL still had an increased risk of readmission and urgent or emergent visits and may still benefit from targeted interventions. Finally, the fact that only 1.5% of unique patients who were discharged called the AL could have biased our results. Because only 55% and 53% of the patients who did or did not call the AL, respectively, saw primary care physicians within our system within the 3 years prior to their index hospitalization (P=0.679), the frequency of calls to the AL that we observed could have underestimated the frequency with which patients had contact with other care providers in the community.
In summary, information collected from patient‐initiated calls to our AL identified several aspects of our discharge processes that needed improvement. We concluded that our predischarge educational processes for both medicine and surgery services needed modification, especially with respect to pain management, which problems to expect after hospitalization or surgery, and how to deal with them. The high rates of 30‐day rehospitalization and of unscheduled urgent or emergent care visits among patients calling the AL identifies them as being at increased risk for these outcomes, although the likelihood of these events may be related to factors other than just calling the AL.
- , , , , . Implementation of the care transitions intervention: sustainability and lessons learned. Prof Case Manag. 2009;14(6):282–293.
- , , , et al. Problems after discharge and understanding of communication with their primary care physicians among hospitalized seniors: a mixed methods study. J Hosp Med. 2010;5(7):385–391.
- , , , et al. Adverse events among medical patients after discharge from hospital. CMAJ. 2004;170(3):345–349.
- , , , , . The incidence and severity of adverse events affecting patients after discharge from the hospital. Ann Intern Med. 2003;138(3):161–167.
- , , . Post‐hospitalization transitions: examining the effects of timing of primary care provider follow‐up. J Hosp Med. 2010;5(7):392–397.
- , , , . Telephone follow‐up after discharge from the hospital: does it make a difference? Appl Nurs Res. 1996;9(2) 47–52.
- , , , et al. The effect of real‐time teleconsultations between hospital‐based nurses and patients with severe COPD discharged after an exacerbation. J Telemed Telecare. 2013;19(8):466–474.
- , , , , , . A randomized, controlled trial of an intensive community nurse‐supported discharge program in preventing hospital readmissions of older patients with chronic lung disease. J Am Geriatr Soc. 2004;52(8):1240–1246.
- , , , et al. Effects of education and support on self‐care and resource utilization in patients with heart failure. Eur Heart J. 1999;20(9):673–682.
- , , , et al. Comprehensive discharge planning and home follow‐up of hospitalized elders: a randomized clinical trial. JAMA. 1999;281(7):613–620.
- , , , , . Interventions to reduce 30‐day rehospitalization: a systematic review. Ann Intern Med. 2011;155(8):520–528.
- , , , . Complementary telephone strategies to improve postdischarge communication. Am J Med. 2012;125(1):28–30.
- , , , , , . Integrated postdischarge transitional care in a hospitalist system to improve discharge outcome: an experimental study. BMC Med. 2011;9:96.
- , , , , , . Patient experiences after hospitalizations for elective surgery. Am J Surg. 2014;207(6):855–862.
- , , . Complications after discharge for surgical patients. ANZ J Surg. 2004;74(3):92–97.
- , , , . Surgeons are overlooking post‐discharge complications: a prospective cohort study. World J Surg. 2014;38(5):1019–1025.
- , . A study of the impact of discharge information for surgical patients. J Adv Nurs. 2001;35(3):435–441.
The period immediately following hospital discharge is particularly hazardous for patients.[1, 2, 3, 4, 5] Problems occurring after discharge may result in high rates of rehospitalization and unscheduled visits to healthcare providers.[6, 7, 8, 9, 10] Numerous investigators have tried to identify patients who are at increased risk for rehospitalizations within 30 days of discharge, and many studies have examined whether various interventions could decrease these adverse events (summarized in Hansen et al.[11]). An increasing fraction of patients discharged by medicine and surgery services have some or all of their care supervised by hospitalists. Thus, hospitals increasingly look to hospitalists for ways to reduce rehospitalizations.
Patients discharged from our hospital are instructed to call an advice line (AL) if and when questions or concerns arise. Accordingly, we examined when these calls were made and what issues were raised, with the idea that the information collected might identify aspects of our discharge processes that needed improvement.
METHODS
Study Design
We conducted a prospective study of a cohort consisting of all unduplicated patients with a matching medical record number in our data warehouse who called our AL between September 1, 2011 and September 1, 2012, and reported being hospitalized or having surgery (inpatient or outpatient) within 30 days preceding their call. We excluded patients who were incarcerated, those who were transferred from other hospitals, those admitted for routine chemotherapy or emergent dialysis, and those discharged to a skilled nursing facility or hospice. The study involved no intervention. It was approved by the Colorado Multiple Institutional Review Board.
Setting
The study was conducted at Denver Health Medical Center, a 525‐bed, university‐affiliated, public safety‐net hospital. At the time of discharge, all patients were given paperwork that listed the telephone number of the AL and written instructions in English or Spanish telling them to call the AL or their primary care physician if they had any of a list of symptoms that was selected by their discharging physician as being relevant to that specific patient's condition(s).
The AL was established in 1997 to provide medical triage to patients of Denver Health. It operates 24 hours a day, 7 days per week, and receives approximately 100,000 calls per year. A language line service is used with nonEnglish‐speaking callers. Calls are handled by a nurse who, with the assistance of a commercial software program (E‐Centaurus; LVM Systems, Phoenix, AZ) containing clinical algorithms (Schmitt‐Thompson Clinical Content, Windsor, CO), makes a triage recommendation. Nurses rarely contact hospital or clinic physicians to assist with triage decisions.
Variables Assessed
We categorized the nature of the callers' reported problem(s) to the AL using the taxonomy summarized in the online appendix (see Supporting Appendix in the online version of this article). We then queried our data warehouse for each patient's demographic information, patient‐level comorbidities, discharging service, discharge date and diagnoses, hospital length of stay, discharge disposition, and whether they had been hospitalized or sought care in our urgent care center or emergency department within 30 days of discharge. The same variables were collected for all unduplicated patients who met the same inclusion and exclusion criteria and were discharged from Denver Health during the same time period but did not call the AL.
Statistics
Data were analyzed using SAS Enterprise Guide 4.1 (SAS Institute, Inc., Cary, NC). Because we made multiple statistical comparisons, we applied the Bonferroni correction when comparing patients calling the AL with those who did not, such that P<0.004 indicated statistical significance. A Student t test or a Wilcoxon rank sum test was used to compare continuous variables depending on results of normality tests. 2 tests were used to compare categorical variables. The intervals between hospital discharge and the call to the AL for patients discharged from medicine versus surgery services were compared using a log‐rank test, with P<0.05 indicating statistical significance.
RESULTS
During the 1‐year study period, 19,303 unique patients were discharged home with instructions regarding the use of the AL. A total of 310 patients called the AL and reported being hospitalized or having surgery within the preceding 30 days. Of these, 2 were excluded (1 who was incarcerated and 1 who was discharged to a skilled nursing facility), leaving 308 patients in the cohort. This represented 1.5% of the total number of unduplicated patients discharged during this same time period (minus the exclusions described above). The large majority of the calls (277/308, 90%) came directly from patients. The remaining 10% came from a proxy, usually a patient's family member. Compared with patients who were discharged during the same time period who did not call the AL, those who called were more likely to speak English, less likely to speak Spanish, more likely to be medically indigent, had slightly longer lengths of stays for their index hospitalization, and were more likely to be discharged from surgery than medicine services (particularly following inpatient surgery) (Table 1).
| Patient Characteristics | Patients Calling Advice Line After Discharge, N=308 | Patients Not Calling Advice Line After Discharge, N=18,995 | P Valuea |
|---|---|---|---|
| |||
| Age, y (meanSD) | 4217 | 3921 | 0.0210 |
| Gender, female, n (%) | 162 (53) | 10,655 (56) | |
| Race/ethnicity, n (%) | 0.1208 | ||
| Hispanic/Latino/Spanish | 129 (42) | 8,896 (47) | |
| African American | 44 (14) | 2,674 (14) | |
| White | 125 (41) | 6,569 (35) | |
| Language, n (%) | <0.0001 | ||
| English | 273 (89) | 14,236 (79) | |
| Spanish | 32 (10) | 3,744 (21) | |
| Payer, n (%) | |||
| Medicare | 45 (15) | 3,013 (16) | |
| Medicaid | 105 (34) | 7,777 (41) | 0.0152 |
| Commercial | 49 (16) | 2,863 (15) | |
| Medically indigentb | 93 (30) | 3,442 (18) | <0.0001 |
| Self‐pay | 5 (1) | 1,070 (5) | |
| Primary care provider, n (%)c | 168 (55) | 10,136 (53) | 0.6794 |
| Psychiatric comorbidity, n (%) | 81 (26) | 4,528 (24) | 0.3149 |
| Alcohol or substance abuse comorbidity, n (%) | 65 (21) | 3,178 (17) | 0.0417 |
| Discharging service, n (%) | <0.0001 | ||
| Surgery | 193 (63) | 7,247 (38) | |
| Inpatient | 123 (40) | 3,425 (18) | |
| Ambulatory | 70 (23) | 3,822 (20) | |
| Medicine | 93 (30) | 6,038 (32) | |
| Pediatric | 4 (1) | 1,315 (7) | |
| Obstetric | 11 (4) | 3,333 (18) | |
| Length of stay, median (IQR) | 2 (04.5) | 1 (03) | 0.0003 |
| Inpatient medicine | 4 (26) | 3 (15) | 0.0020 |
| Inpatient surgery | 3 (16) | 2 (14) | 0.0019 |
| Charlson Comorbidity Index, median (IQR) | |||
| Inpatient medicine | 1 (04) | 1 (02) | 0.0435 |
| Inpatient surgery | 0 (01) | 0 (01) | 0.0240 |
The median time from hospital discharge to the call was 3 days (interquartile range [IQR], 16), but 31% and 47% of calls occurred within 24 or 48 hours of discharge, respectively. Ten percent of patients called the AL the same day of discharge (Figure 1). We found no difference in timing of the calls as a function of discharging service.
The 308 patients reported a total of 612 problems or concerns (meanstandard deviation number of complaints per caller=21), the large majority of which (71%) were symptom‐related (Table 2). The most common symptom was uncontrolled pain, reported by 33% and 40% of patients discharged from medicine and surgery services, respectively. The next most common symptoms related to the gastrointestinal system and to surgical site issues in medicine and surgery patients, respectively (data not shown).
| Total Cohort, n (%) | Patients Discharged From Medicine, n (%) | Patients Discharged From Surgery, n (%) | ||||
|---|---|---|---|---|---|---|
| Patients | Complaints | Patients | Complaints | Patients | Complaints | |
| Symptom related | 280 (91) | 433 (71) | 89 (96) | 166 (77) | 171 (89) | 234 (66) |
| Discharge instructions | 65 (21) | 81 (13) | 18 (19) | 21 (10) | 43 (22) | 56 (16) |
| Medication related | 65 (21) | 87 (14) | 19 (20) | 25 (11) | 39 (20) | 54 (15) |
| Other | 10 (3) | 11 (2) | 4 (4) | 4 (2) | 6 (3) | 7 (2) |
| Total | 612 (100) | 216 (100) | 351 (100) | |||
Sixty‐five patients, representing 21% of the cohort, reported 81 problems understanding or executing discharge instructions. No difference was observed between the fraction of these problems reported by patients from medicine versus surgery (19% and 22%, respectively, P=0.54).
Sixty‐five patients, again representing 21% of the cohort, reported 87 medication‐related problems, 20% from both the medicine and surgery services (P=0.99). Medicine patients more frequently reported difficulties understanding their medication instructions, whereas surgery patients more frequently reported lack of efficacy of medications, particularly with respect to pain control (data not shown).
Thirty percent of patients who called the AL were advised by the nurse to go to the emergency department immediately. Medicine patients were more likely to be triaged to the emergency department compared with surgery patients (45% vs 22%, P<0.0001).
The 30‐day readmission rates and the rates of unscheduled urgent or emergent care visits were higher for patients calling the AL compared with those who did not call (46/308, 15% vs 706/18,995, 4%, and 92/308, 30% vs 1303/18,995, 7%, respectively, both P<0.0001). Similar differences were found for patients discharged from medicine or surgery services who called the AL compared with those who did not (data not shown, both P<0.0001). The median number of days between AL call and rehospitalization was 0 (IQR, 02) and 1 (IQR, 08) for medicine and surgery patients, respectively. Ninety‐three percent of rehospitalizations were related to the index hospitalization, and 78% of patients who were readmitted had no outpatient encounter in the interim between discharge and rehospitalization.
DISCUSSION
We investigated the source and nature of patient telephone calls to an AL following a hospitalization or surgery, and our data revealed the following important findings: (1) nearly one‐half of the calls to the AL occurred within the first 48 hours following discharge; (2) the majority of the calls came from surgery patients, and a greater fraction of patients discharged from surgery services called the AL than patients discharged from medicine services; (3) the most common issues were uncontrolled pain, questions about medications, and problems understanding or executing aftercare instructions (particularly pertaining to the care of surgical wounds); and (4) patients calling the AL had higher rates of 30‐day rehospitalization and of unscheduled urgent or emergent care visits.
The utilization of our patient‐initiated call line was only 1.5%, which was on the low end of the 1% to 10% reported in the literature.[7, 12] This can be attributed to a number of issues that are specific to our system. First, the discharge instructions provided to our patients stated that they should call their primary care provider or the AL if they had questions. Accordingly, because approximately 50% of our patients had a primary care provider in our system, some may have preferentially contacted their primary care provider rather than the AL. Second, the instructions stated that the patients should call if they were experiencing the symptoms listed on the instruction sheet, so those with other problems/complaints may not have called. Third, AL personnel identified patients as being in our cohort by asking if they had been discharged or underwent a surgical procedure within 30‐days of their call. This may have resulted in the under‐reporting of patients who were hospitalized or had outpatient surgical procedures. Fourth, there may have been a number of characteristics specific to patients in our system that reduced the frequency with which they utilized the AL (eg, access to telephones or other community providers).
Most previous studies of patient‐initiated call lines have included them as part of multi‐intervention pre‐ and/or postdischarge strategies.[7, 8, 9, 10, 11, 12, 13] One prior small study compared the information reported by 37 patients who called an AL with that elicited by nurse‐initiated patient contact.[12] The most frequently reported problems in this study were medication‐related issues (43%). However, this study only included medicine patients and did not document the proportion of calls occurring at various time intervals.
The problems we identified (in both medicine and surgery patients) have previously been described,[2, 3, 4, 13, 14, 15, 16] but all of the studies reporting these problems utilized calls that were initiated by health care providers to patients at various fixed intervals following discharge (ie, 730 days). Most of these used a scripted approach seeking responses to specific questions or outcomes, and the specific timing at which the problems arose was not addressed. In contrast, we examined unsolicited concerns expressed by patients calling an AL following discharge whenever they felt sufficient urgency to address whatever problems or questions arose. We found that a large fraction of calls occurred on the day of or within the first 48 hours following discharge, much earlier than when provider‐initiated calls in the studies cited above occurred. Accordingly, our results cannot be used to compare the utility of patient‐ versus provider‐initiated calls, or to suggest that other hospitals should create an AL system. Rather, we suggest that our findings might be complementary to those reported in studies of provider‐initiated calls and only propose that by examining calls placed by patients to ALs, problems with hospital discharge processes (some of which may result in increased rates of readmission) may be discovered.
The observation that such a large fraction of calls to our AL occurred within the first 48 hours following discharge, together with the fact that many of the questions asked or concerns raised pertained to issues that should have been discussed during the discharge process (eg, pain control, care of surgical wounds), suggests that suboptimal patient education was occurring prior to discharge as was suggested by Henderson and Zernike.[17] This finding has led us to expand our patient education processes prior to discharge on both medicine and surgery services. Because our hospitalists care for approximately 90% of the patients admitted to medicine services and are increasingly involved in the care of patients on surgery services, they are integrally involved with such quality improvement initiatives.
To our knowledge this is the first study in the literature that describes both medicine and surgery patients who call an AL because of problems or questions following hospital discharge, categorizes these problems, determines when the patients called following their discharge, and identifies those who called as being at increased risk for early rehospitalizations and unscheduled urgent or emergent care visits. Given the financial penalties issued to hospitals with high 30‐day readmission rates, these patients may warrant more attention than is customarily available from telephone call lines or during routine outpatient follow‐up. The majority of patients who called our AL had Medicare, Medicaid, or a commercial insurance, and, accordingly, may have been eligible for additional services such as home visits and/or expedited follow‐up appointments.
Our study has a number of limitations. First, it is a single‐center study, so the results might not generalize to other institutions. Second, because the study was performed in a university‐affiliated, public safety‐net hospital, patient characteristics and the rates and types of postdischarge concerns that we observed might differ from those encountered in different types of hospitals and/or from those in nonteaching institutions. We would suggest, however, that the idea of using concerns raised by patients discharged from any type of hospital in calls to ALs may similarly identify problems with that specific hospital's discharge processes. Third, the information collected from the AL came from summaries provided by nurses answering the calls rather than from actual transcripts. This could have resulted in insufficient or incorrect information pertaining to some of the variables assessed in Table 2. The information presented in Table 1, however, was obtained from our data warehouse after matching medical record numbers. Fourth, we could have underestimated the number of patients who had 30‐day rehospitalizations and/or unplanned for urgent or emergent care visits if patients sought care at other hospitals. Fifth, the number of patients calling the AL was too small to allow us to do any type of robust matching or multivariable analysis. Accordingly, the differences that appeared between patients who called and those who did not (ie, English speakers, being medically indigent, the length of stay for the index hospitalization and the discharging service) could be the result of inadequate matching or interactions among the variables. Although matching or multivariate analysis might have yielded different associations between patients who called the AL versus those who did not, those who called the AL still had an increased risk of readmission and urgent or emergent visits and may still benefit from targeted interventions. Finally, the fact that only 1.5% of unique patients who were discharged called the AL could have biased our results. Because only 55% and 53% of the patients who did or did not call the AL, respectively, saw primary care physicians within our system within the 3 years prior to their index hospitalization (P=0.679), the frequency of calls to the AL that we observed could have underestimated the frequency with which patients had contact with other care providers in the community.
In summary, information collected from patient‐initiated calls to our AL identified several aspects of our discharge processes that needed improvement. We concluded that our predischarge educational processes for both medicine and surgery services needed modification, especially with respect to pain management, which problems to expect after hospitalization or surgery, and how to deal with them. The high rates of 30‐day rehospitalization and of unscheduled urgent or emergent care visits among patients calling the AL identifies them as being at increased risk for these outcomes, although the likelihood of these events may be related to factors other than just calling the AL.
- , , , , . Implementation of the care transitions intervention: sustainability and lessons learned. Prof Case Manag. 2009;14(6):282–293.
- , , , et al. Problems after discharge and understanding of communication with their primary care physicians among hospitalized seniors: a mixed methods study. J Hosp Med. 2010;5(7):385–391.
- , , , et al. Adverse events among medical patients after discharge from hospital. CMAJ. 2004;170(3):345–349.
- , , , , . The incidence and severity of adverse events affecting patients after discharge from the hospital. Ann Intern Med. 2003;138(3):161–167.
- , , . Post‐hospitalization transitions: examining the effects of timing of primary care provider follow‐up. J Hosp Med. 2010;5(7):392–397.
- , , , . Telephone follow‐up after discharge from the hospital: does it make a difference? Appl Nurs Res. 1996;9(2) 47–52.
- , , , et al. The effect of real‐time teleconsultations between hospital‐based nurses and patients with severe COPD discharged after an exacerbation. J Telemed Telecare. 2013;19(8):466–474.
- , , , , , . A randomized, controlled trial of an intensive community nurse‐supported discharge program in preventing hospital readmissions of older patients with chronic lung disease. J Am Geriatr Soc. 2004;52(8):1240–1246.
- , , , et al. Effects of education and support on self‐care and resource utilization in patients with heart failure. Eur Heart J. 1999;20(9):673–682.
- , , , et al. Comprehensive discharge planning and home follow‐up of hospitalized elders: a randomized clinical trial. JAMA. 1999;281(7):613–620.
- , , , , . Interventions to reduce 30‐day rehospitalization: a systematic review. Ann Intern Med. 2011;155(8):520–528.
- , , , . Complementary telephone strategies to improve postdischarge communication. Am J Med. 2012;125(1):28–30.
- , , , , , . Integrated postdischarge transitional care in a hospitalist system to improve discharge outcome: an experimental study. BMC Med. 2011;9:96.
- , , , , , . Patient experiences after hospitalizations for elective surgery. Am J Surg. 2014;207(6):855–862.
- , , . Complications after discharge for surgical patients. ANZ J Surg. 2004;74(3):92–97.
- , , , . Surgeons are overlooking post‐discharge complications: a prospective cohort study. World J Surg. 2014;38(5):1019–1025.
- , . A study of the impact of discharge information for surgical patients. J Adv Nurs. 2001;35(3):435–441.
© 2014 Society of Hospital Medicine
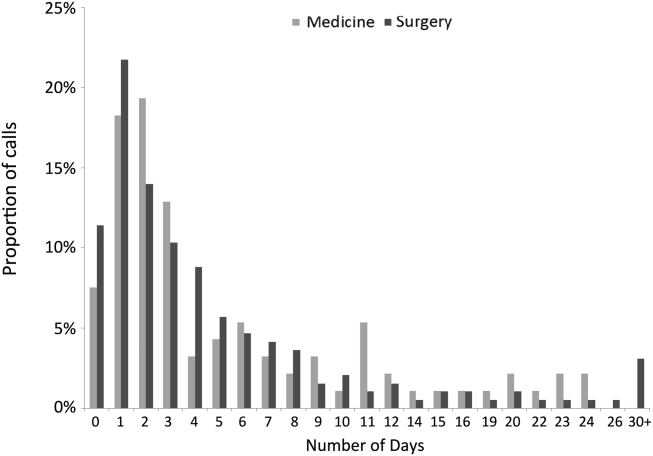
Hospitalist Minority Mentoring Program
The fraction of the US population identifying themselves as ethnic minorities was 36% in 2010 and will exceed 50% by 2050.[1, 2] This has resulted in an increasing gap in healthcare, as minorities have well‐documented disparities in access to healthcare and a disproportionately high morbidity and mortality.[3] In 2008, only 12.3% of US physicians were from under‐represented minority (URM) groups (see Figure in Castillo‐Page 4) (ie, those racial and ethnic populations that are underrepresented in the medical profession relative to their numbers in the general population as defined by the American Association of Medical Colleges[4, 5]). Diversifying the healthcare workforce may be an effective approach to reducing healthcare disparities, as URM physicians are more likely to choose primary care specialties,[6] work in underserved communities with socioeconomic or racial mixes similar to their own, thereby increasing access to care,[6, 7, 8] increasing minority patient satisfaction, and improving the quality of care received by minorities.[9, 10, 11]
The number of URM students attending medical school is slowly increasing, but in 2011, only 15% of the matriculating medical school students were URMs (see Figure 12 and Table 10 in Castillo‐Page[12]), and medical schools actively compete for this limited number of applicants. To increase the pool of qualified candidates, more URM students need to graduate college and pursue postgraduate healthcare training.[12]
URM undergraduate freshmen with intentions to enter medical school are 50% less likely to apply to medical school by the time they are seniors than their non‐Latino, white, and Asian counterparts.[13] Higher attrition rates have been linked to students having negative experiences in the basic science courses and with a lack of role models and exposure to careers in healthcare.[13, 14, 15, 16] We developed a hospitalist‐led mentoring program that was focused on overcoming these perceived limitations. This report describes the program and follow‐up data from our first year cohort documenting its success.
METHODS
The Healthcare Interest Program (HIP) was developed by 2 hospitalists (L. C., E. C.) and a physician's assistant (C. N.) who worked at Denver Health (DH), a university‐affiliated public hospital. We worked in conjunction with the chief diversity officer of the University of Colorado, Denver (UCD), primarily a commuter university in metropolitan Denver, where URMs composed 51% of the 2011 freshmen class. We reviewed articles describing mentoring programs for undergraduate students, and by consensus, designed a 7‐component program, each of which was intended to address a specific barrier identified in the literature as possibly contributing to reduced interest of minority students in pursuing medical careers (Table 1).[13, 14, 15, 16]
| Component | Goal |
|---|---|
| Clinical shadowing | |
| Student meets with their mentor and/or with other healthcare providers (eg, pharmacist, nurse) 4 hours per day, 1 or 2 times per month. | Expose students to various healthcare careers and to care for underserved patients. |
| Mentoring | |
| Student meets with their mentor for life coaching, career counseling, and to learn interviewing techniques 4 hours per month | Expand ideas of opportunity, address barriers or concerns before they affect grades, write letter of recommendation |
| Books to Bedside lectures | |
| One lecture per month designed to integrate clinical medicine with the undergraduate basic sciences. Sample lectures include: The Physics of Electrocardiograms and The Biochemistry of Diabetic Ketoacidosis | Improve the undergraduate experience in the basic science courses |
| Book club | |
| Group discussions of books selected for their focus on healthcare disparities and cultural diversity; 2 or 3 books per year (eg, The Spirit Catches You and You Fall Down by Ann Fadiman, Just Like Us by Helen Thorpe) | Socialize, begin to understand and discuss health disparities and caring for the underserved. |
| Diversity lectures | |
| Three speakers per term, each discussing different aspects of health disparities research being conducted in the Denver metropolitan area | Understand the disparities affecting the students' communities. Inspire interest in becoming involved with research. |
| Social events | |
| Kickoff, winter, and end‐of‐year gatherings | Socializing, peer group support |
| Journaling and reflection essay | |
| Summary of hospital experience with mentor and thoughts regarding healthcare career goals and plans. | Formalize career goals |
During the 2009 to 2010 academic year, information about the program, together with an application, was e‐mailed to all students at UCD who self‐identified as having interest in healthcare careers. This information was also distributed at all prehealth clubs and gatherings (ie, to students expressing interest in graduate and professional programs in healthcare‐related fields). All sophomore and junior students who submitted an application and had grade point averages (GPA) 2.8 were interviewed by the program director. Twenty‐three students were selected on the basis of their GPAs (attempting to include those with a range of GPAs), interviews, and the essays prepared as part of their applications.
An e‐mail soliciting mentors was sent to all hospitalists physicians and midlevels working at DH; 25/30 volunteered, and 20 were selected on the basis of their gender (as mentors were matched to students based on gender). The HIP director met with the mentors in person to introduce the program and its goals. All mentors had been practicing hospital medicine for 10 years after their training, and all but 3 were non‐Latino white. Each student accepted into the program was paired with a hospitalist who served as their mentor for the year.
The mentors were instructed in life coaching in both e‐mails and individual discussions. Every 2 or 3 months each hospitalist was contacted by e‐mail to see if questions or problems had arisen and to emphasize the need to meet with their mentees monthly.
Students filled out a written survey after each Books‐to‐Bedside (described in Table 1) discussion. The HIP director met with each student for at least 1 hour per semester and gathered feedback regarding mentor‐mentee success, shadowing experience, and the quality of the book club. At the end of the academic year, students completed a written, anonymous survey assessing their impressions of the program and their intentions of pursuing additional training in healthcare careers (Table 2). We used descriptive statistics to analyze the data including frequencies and mean tests.
|
| Open‐ended questions: |
| 1. How did HIP or your HIP mentor affect your application to your healthcare field of interest (eg, letter of recommendation, clinical hours, change in healthcare career of interest)? |
| 2. How did the Books to Bedside presentation affect you? |
| 3. My healthcare professional school of interest is (eg, medical school, nursing school, physician assistant school, pharmacy school, physical therapy school, dental school). |
| 4. How many times per month were you able to shadow at Denver Health? |
| 5. How would you revise the program to improve it? |
| Yes/no questions: |
| 1. English is my primary language. |
| 2. I am the first in my immediate family to attend college |
| 3. Did you work while in school? |
| 4. Did you receive scholarships while in school? |
| 5. Prior to participating in this program, I had a role model in my healthcare field of interest. |
| 6. My role model is my HIP mentor. |
| 7. May we contact you in 2 to 3 years to obtain information regarding your acceptance into your healthcare field of interest? |
| Likert 5‐point questions: |
| 1. Participation in HIP expanded my perceptions of what I could accomplish in the healthcare field. |
| 2. Participation in HIP has increased my confidence that I will be accepted into my healthcare field of choice. |
| 3. I intend to go to my healthcare school in the state of Colorado. |
| 4. One of my long‐term goals is to work with people with health disparities (eg, underserved). |
| 5. One of my long‐term goals is to work in a rural environment. |
| 6. I have access to my prehealth advisors. |
| 7. I have access to my HIP mentor. |
| 8. Outside of the HIP, I have had access to clinical experience shadowing with a physician or physician assistant. |
| 9. If not accepted the first time, I will reapply to my healthcare field of interest. |
| 10. I would recommend HIP to my colleagues. |
Two years after completing the program, each student was contacted via e‐mail and/or phone to determine whether they were still pursuing healthcare careers.
RESULTS
Twenty‐three students were accepted into the program (14 female, 9 male, mean age 19 [standard deviation1]). Their GPAs ranged from 2.8 to 4.0. Eleven (48%) were the first in their family to attend college, 6 (26%) indicated that English was not their primary language, and 16 (70%) were working while attending school. All 23 students stayed in the HIP program for the full academic year.
Nineteen of the 23 students (83%) completed the survey at the end of the year. Of these, 19 (100%) strongly agreed that the HIP expanded their perceptions of what they might accomplish and increased their confidence in being able to succeed in a healthcare profession. All 19 (100%) stated that they hoped to care for underserved minority patients in the future. Sixteen (84%) strongly agreed that their role model in life was their HIP mentor. These findings suggest that many of the HIP components successfully accomplished their goals (Table 1).
Two‐year follow‐up was available for 21 of the 23 students (91%). Twenty (95%) remained committed to a career in healthcare, 18 (86%) had graduated college, 6 (29%) were enrolled in graduate training in the healthcare professions (2 in medical school, 1 in nursing school, and 3 in a master's programs in public health, counseling, and medical science, respectively), and 9 (43%) were in the process of applying to postgraduate healthcare training programs (7 to medical school, 1 to dental school, and 1 to nursing school, respectively). Five students were preparing to take the Medical College Admissions Test, and 7 were working at various jobs in the healthcare field (eg, phlebotomists, certified nurse assistants, research assistants). Of the 16 students who expressed an interest in attending medical school at the beginning of the program, 15 (94%) maintained that interest.
DISCUSSION
HIP was extremely well‐received by the participating students, the majority graduated college and remained committed to a career in healthcare, and 29% were enrolled in postgraduate training in healthcare professions 2 years after graduation.
The 86% graduation rate that we observed compares highly favorably to the UCD campus‐wide graduation rates for minority students of 12.5% at 4 years and 30.8% at 5 years. Although there may be selection bias in the students participating in HIP, the extremely high graduation rate is consistent with HIP meeting 1 or more of its stated objectives.
Many universities have prehealthcare pipeline programs that are designed to provide short‐term summer medical experiences, research opportunities, and assistance with the Medical College Admissions Test.[17, 18, 19] We believe, however, that several aspects of our program are unique. First, we designed HIP to be year‐long, rather than a summertime program. Continuing the mentoring and life coaching throughout the year may allow stronger relationships to develop between the mentor and the student. In addition, ongoing student‐mentor interactions during the time when a student may be encountering problems with their undergraduate basic science courses may be beneficial. Second, the Books‐to‐Bedside lectures series, which was designed to link the students' basic science training with clinical medicine, has not previously been described and may contribute to a higher rate of completion of their basic science training. Third, those aspects of the program resulting in increased peer interactions (eg, book club discussions, diversity lectures, and social gatherings) provided an important venue for students with similar interests to interact, an opportunity that is limited at UCD as it is primarily a commuter university.
A number of lessons were learned during the first year of the program. First, a program such as ours must include rigorous evaluation from the start to make a case for support to the university and key stakeholders. With this in mind, it is possible to obtain funding and ensure long‐term sustainability. Second, by involving UCD's chief diversity officer in the development, the program fostered a strong partnership between DH and UCD and facilitated growing the program. Third, the hospitalists who attended the diversity‐training aspects of the program stated through informal feedback that they felt better equipped to care for the underserved and felt that providing mentorship increased their personal job satisfaction. Fourth, the students requested more opportunities for them to participate in health disparities research and in shadowing in subspecialties in addition to internal medicine. In response to this feedback, we now offer research opportunities, lectures on health disparities research, and interactions with community leaders working in improving healthcare for the underserved.
Although influencing the graduation rate from graduate level schooling is beyond the scope of HIP, we can conclude that the large majority of students participating in HIP maintained their interest in the healthcare professions, graduated college, and that many went on to postgraduate healthcare training. The data we present pertain to the cohort of students in the first year of the HIP. As the program matures, we will continue to evaluate the long‐term outcomes of our students and hospitalist mentors. This may provide opportunities for other academic hospitalists to replicate our program in their own communities.
ACKNOWLEDGMENTS
Disclosure: The authors report no conflicts of interest.
- United States Census Bureau. An older and more diverse nation by midcentury. Available at: https://www.census.gov/newsroom/releases/archives/population/cb08–123.html. Accessed February 28, 2013.
- United States Census Bureau. State and county quick facts. Available at: http://quickfacts.census.gov/qfd/states/00000.html. Accessed February 28, 2013.
- Centers for Disease Control and Prevention. Surveillance of health status in minority communities—racial and ethnic approaches to community health across the U.S. (REACH US) risk factor survey, United States, 2009. Available at: http://cdc.gov/mmwr/preview/mmwrhtml/ss6006a1.htm. Accessed February 28, 2013.
- Association of American Medical Colleges. Diversity in the physician workforce: facts and figures 2010. Available at: https://members.aamc.org/eweb/upload/Diversity%20in%20the%20 Physician%20Workforce%20Facts%20and%20Figures%202010.pdf. Accessed April 29, 2014.
- Association of American Medical Colleges Executive Committee. The status of the new AAMC definition of “underrepresented in medicine” following the Supreme Court's decision in Grutter. Available at: https://www.aamc.org/download/54278/data/urm.pdf. Accessed May 25, 2014.
- . Physician Characteristics and Distribution in the US. 2013 ed. Chicago, IL: American Medical Association; 2013.
- , , , et al. The role of black and Hispanic physicians in providing health care for underserved populations. N Engl J Med. 1996;334:1305–1310.
- , , . The association among specialty, race, ethnicity, and practice location among California physicians in diverse Specialties. J Natl Med Assoc. 2012;104:46–52.
- , , , , Patient‐physician racial concordance and the perceived quality and use of health care. Arch Intern Med. 1999;159:997–1004.
- , . Race of physician and satisfaction with care among African‐American patients. J Natl Med Assoc. 2002;94:937–943.
- U.S. Department of Health and Human Services Health Resources and Services Administration Bureau of Health Professions. The rational for diversity in health professions: a review of the evidence. 2006. Available at: http://bhpr.hrsa.gov/healthworkforce/reports/diversityreviewevidence.pdf. Accessed March 30, 2014.
- . Association of American Medical Colleges. Diversity in medical education: facts and figures 2012. Available at: https://members.aamc.org/eweb/upload/Diversity%20in%20Medical%20Ed ucation%20Facts%20and%20Figures%202012.pdf. Accessed February 28, 2013.
- , , . The leaky pipeline: factors associated with early decline in interest in premedical studies among underrepresented minority undergraduate students. Acad Med. 2008;83:503–511.
- , . Perspective: adopting an asset bundles model to support and advance minority students' careers in academic medicine and the scientific pipeline. Acad Med. 2012;87:1488–1495.
- , , , . Contributors of black men's success in admission to and graduation from medical school. Acad Med. 2011;86:892–900.
- , . Premed survival: understanding the culling process in premedical undergraduate education. Acad Med. 2002;77:719–724.
- , , , . A novel enrichment program using cascading mentorship to increase diversity in the health care professions. Acad Med. 2013;88:1232–1238.
- , . A social and academic enrichment program promotes medical school matriculation and graduation for disadvantaged students. Educ Health. 2012;25:55–63.
- , , , . Addressing medical school diversity through an undergraduate partnership at Texas A83:512–515.
The fraction of the US population identifying themselves as ethnic minorities was 36% in 2010 and will exceed 50% by 2050.[1, 2] This has resulted in an increasing gap in healthcare, as minorities have well‐documented disparities in access to healthcare and a disproportionately high morbidity and mortality.[3] In 2008, only 12.3% of US physicians were from under‐represented minority (URM) groups (see Figure in Castillo‐Page 4) (ie, those racial and ethnic populations that are underrepresented in the medical profession relative to their numbers in the general population as defined by the American Association of Medical Colleges[4, 5]). Diversifying the healthcare workforce may be an effective approach to reducing healthcare disparities, as URM physicians are more likely to choose primary care specialties,[6] work in underserved communities with socioeconomic or racial mixes similar to their own, thereby increasing access to care,[6, 7, 8] increasing minority patient satisfaction, and improving the quality of care received by minorities.[9, 10, 11]
The number of URM students attending medical school is slowly increasing, but in 2011, only 15% of the matriculating medical school students were URMs (see Figure 12 and Table 10 in Castillo‐Page[12]), and medical schools actively compete for this limited number of applicants. To increase the pool of qualified candidates, more URM students need to graduate college and pursue postgraduate healthcare training.[12]
URM undergraduate freshmen with intentions to enter medical school are 50% less likely to apply to medical school by the time they are seniors than their non‐Latino, white, and Asian counterparts.[13] Higher attrition rates have been linked to students having negative experiences in the basic science courses and with a lack of role models and exposure to careers in healthcare.[13, 14, 15, 16] We developed a hospitalist‐led mentoring program that was focused on overcoming these perceived limitations. This report describes the program and follow‐up data from our first year cohort documenting its success.
METHODS
The Healthcare Interest Program (HIP) was developed by 2 hospitalists (L. C., E. C.) and a physician's assistant (C. N.) who worked at Denver Health (DH), a university‐affiliated public hospital. We worked in conjunction with the chief diversity officer of the University of Colorado, Denver (UCD), primarily a commuter university in metropolitan Denver, where URMs composed 51% of the 2011 freshmen class. We reviewed articles describing mentoring programs for undergraduate students, and by consensus, designed a 7‐component program, each of which was intended to address a specific barrier identified in the literature as possibly contributing to reduced interest of minority students in pursuing medical careers (Table 1).[13, 14, 15, 16]
| Component | Goal |
|---|---|
| Clinical shadowing | |
| Student meets with their mentor and/or with other healthcare providers (eg, pharmacist, nurse) 4 hours per day, 1 or 2 times per month. | Expose students to various healthcare careers and to care for underserved patients. |
| Mentoring | |
| Student meets with their mentor for life coaching, career counseling, and to learn interviewing techniques 4 hours per month | Expand ideas of opportunity, address barriers or concerns before they affect grades, write letter of recommendation |
| Books to Bedside lectures | |
| One lecture per month designed to integrate clinical medicine with the undergraduate basic sciences. Sample lectures include: The Physics of Electrocardiograms and The Biochemistry of Diabetic Ketoacidosis | Improve the undergraduate experience in the basic science courses |
| Book club | |
| Group discussions of books selected for their focus on healthcare disparities and cultural diversity; 2 or 3 books per year (eg, The Spirit Catches You and You Fall Down by Ann Fadiman, Just Like Us by Helen Thorpe) | Socialize, begin to understand and discuss health disparities and caring for the underserved. |
| Diversity lectures | |
| Three speakers per term, each discussing different aspects of health disparities research being conducted in the Denver metropolitan area | Understand the disparities affecting the students' communities. Inspire interest in becoming involved with research. |
| Social events | |
| Kickoff, winter, and end‐of‐year gatherings | Socializing, peer group support |
| Journaling and reflection essay | |
| Summary of hospital experience with mentor and thoughts regarding healthcare career goals and plans. | Formalize career goals |
During the 2009 to 2010 academic year, information about the program, together with an application, was e‐mailed to all students at UCD who self‐identified as having interest in healthcare careers. This information was also distributed at all prehealth clubs and gatherings (ie, to students expressing interest in graduate and professional programs in healthcare‐related fields). All sophomore and junior students who submitted an application and had grade point averages (GPA) 2.8 were interviewed by the program director. Twenty‐three students were selected on the basis of their GPAs (attempting to include those with a range of GPAs), interviews, and the essays prepared as part of their applications.
An e‐mail soliciting mentors was sent to all hospitalists physicians and midlevels working at DH; 25/30 volunteered, and 20 were selected on the basis of their gender (as mentors were matched to students based on gender). The HIP director met with the mentors in person to introduce the program and its goals. All mentors had been practicing hospital medicine for 10 years after their training, and all but 3 were non‐Latino white. Each student accepted into the program was paired with a hospitalist who served as their mentor for the year.
The mentors were instructed in life coaching in both e‐mails and individual discussions. Every 2 or 3 months each hospitalist was contacted by e‐mail to see if questions or problems had arisen and to emphasize the need to meet with their mentees monthly.
Students filled out a written survey after each Books‐to‐Bedside (described in Table 1) discussion. The HIP director met with each student for at least 1 hour per semester and gathered feedback regarding mentor‐mentee success, shadowing experience, and the quality of the book club. At the end of the academic year, students completed a written, anonymous survey assessing their impressions of the program and their intentions of pursuing additional training in healthcare careers (Table 2). We used descriptive statistics to analyze the data including frequencies and mean tests.
|
| Open‐ended questions: |
| 1. How did HIP or your HIP mentor affect your application to your healthcare field of interest (eg, letter of recommendation, clinical hours, change in healthcare career of interest)? |
| 2. How did the Books to Bedside presentation affect you? |
| 3. My healthcare professional school of interest is (eg, medical school, nursing school, physician assistant school, pharmacy school, physical therapy school, dental school). |
| 4. How many times per month were you able to shadow at Denver Health? |
| 5. How would you revise the program to improve it? |
| Yes/no questions: |
| 1. English is my primary language. |
| 2. I am the first in my immediate family to attend college |
| 3. Did you work while in school? |
| 4. Did you receive scholarships while in school? |
| 5. Prior to participating in this program, I had a role model in my healthcare field of interest. |
| 6. My role model is my HIP mentor. |
| 7. May we contact you in 2 to 3 years to obtain information regarding your acceptance into your healthcare field of interest? |
| Likert 5‐point questions: |
| 1. Participation in HIP expanded my perceptions of what I could accomplish in the healthcare field. |
| 2. Participation in HIP has increased my confidence that I will be accepted into my healthcare field of choice. |
| 3. I intend to go to my healthcare school in the state of Colorado. |
| 4. One of my long‐term goals is to work with people with health disparities (eg, underserved). |
| 5. One of my long‐term goals is to work in a rural environment. |
| 6. I have access to my prehealth advisors. |
| 7. I have access to my HIP mentor. |
| 8. Outside of the HIP, I have had access to clinical experience shadowing with a physician or physician assistant. |
| 9. If not accepted the first time, I will reapply to my healthcare field of interest. |
| 10. I would recommend HIP to my colleagues. |
Two years after completing the program, each student was contacted via e‐mail and/or phone to determine whether they were still pursuing healthcare careers.
RESULTS
Twenty‐three students were accepted into the program (14 female, 9 male, mean age 19 [standard deviation1]). Their GPAs ranged from 2.8 to 4.0. Eleven (48%) were the first in their family to attend college, 6 (26%) indicated that English was not their primary language, and 16 (70%) were working while attending school. All 23 students stayed in the HIP program for the full academic year.
Nineteen of the 23 students (83%) completed the survey at the end of the year. Of these, 19 (100%) strongly agreed that the HIP expanded their perceptions of what they might accomplish and increased their confidence in being able to succeed in a healthcare profession. All 19 (100%) stated that they hoped to care for underserved minority patients in the future. Sixteen (84%) strongly agreed that their role model in life was their HIP mentor. These findings suggest that many of the HIP components successfully accomplished their goals (Table 1).
Two‐year follow‐up was available for 21 of the 23 students (91%). Twenty (95%) remained committed to a career in healthcare, 18 (86%) had graduated college, 6 (29%) were enrolled in graduate training in the healthcare professions (2 in medical school, 1 in nursing school, and 3 in a master's programs in public health, counseling, and medical science, respectively), and 9 (43%) were in the process of applying to postgraduate healthcare training programs (7 to medical school, 1 to dental school, and 1 to nursing school, respectively). Five students were preparing to take the Medical College Admissions Test, and 7 were working at various jobs in the healthcare field (eg, phlebotomists, certified nurse assistants, research assistants). Of the 16 students who expressed an interest in attending medical school at the beginning of the program, 15 (94%) maintained that interest.
DISCUSSION
HIP was extremely well‐received by the participating students, the majority graduated college and remained committed to a career in healthcare, and 29% were enrolled in postgraduate training in healthcare professions 2 years after graduation.
The 86% graduation rate that we observed compares highly favorably to the UCD campus‐wide graduation rates for minority students of 12.5% at 4 years and 30.8% at 5 years. Although there may be selection bias in the students participating in HIP, the extremely high graduation rate is consistent with HIP meeting 1 or more of its stated objectives.
Many universities have prehealthcare pipeline programs that are designed to provide short‐term summer medical experiences, research opportunities, and assistance with the Medical College Admissions Test.[17, 18, 19] We believe, however, that several aspects of our program are unique. First, we designed HIP to be year‐long, rather than a summertime program. Continuing the mentoring and life coaching throughout the year may allow stronger relationships to develop between the mentor and the student. In addition, ongoing student‐mentor interactions during the time when a student may be encountering problems with their undergraduate basic science courses may be beneficial. Second, the Books‐to‐Bedside lectures series, which was designed to link the students' basic science training with clinical medicine, has not previously been described and may contribute to a higher rate of completion of their basic science training. Third, those aspects of the program resulting in increased peer interactions (eg, book club discussions, diversity lectures, and social gatherings) provided an important venue for students with similar interests to interact, an opportunity that is limited at UCD as it is primarily a commuter university.
A number of lessons were learned during the first year of the program. First, a program such as ours must include rigorous evaluation from the start to make a case for support to the university and key stakeholders. With this in mind, it is possible to obtain funding and ensure long‐term sustainability. Second, by involving UCD's chief diversity officer in the development, the program fostered a strong partnership between DH and UCD and facilitated growing the program. Third, the hospitalists who attended the diversity‐training aspects of the program stated through informal feedback that they felt better equipped to care for the underserved and felt that providing mentorship increased their personal job satisfaction. Fourth, the students requested more opportunities for them to participate in health disparities research and in shadowing in subspecialties in addition to internal medicine. In response to this feedback, we now offer research opportunities, lectures on health disparities research, and interactions with community leaders working in improving healthcare for the underserved.
Although influencing the graduation rate from graduate level schooling is beyond the scope of HIP, we can conclude that the large majority of students participating in HIP maintained their interest in the healthcare professions, graduated college, and that many went on to postgraduate healthcare training. The data we present pertain to the cohort of students in the first year of the HIP. As the program matures, we will continue to evaluate the long‐term outcomes of our students and hospitalist mentors. This may provide opportunities for other academic hospitalists to replicate our program in their own communities.
ACKNOWLEDGMENTS
Disclosure: The authors report no conflicts of interest.
- United States Census Bureau. An older and more diverse nation by midcentury. Available at: https://www.census.gov/newsroom/releases/archives/population/cb08–123.html. Accessed February 28, 2013.
- United States Census Bureau. State and county quick facts. Available at: http://quickfacts.census.gov/qfd/states/00000.html. Accessed February 28, 2013.
- Centers for Disease Control and Prevention. Surveillance of health status in minority communities—racial and ethnic approaches to community health across the U.S. (REACH US) risk factor survey, United States, 2009. Available at: http://cdc.gov/mmwr/preview/mmwrhtml/ss6006a1.htm. Accessed February 28, 2013.
- Association of American Medical Colleges. Diversity in the physician workforce: facts and figures 2010. Available at: https://members.aamc.org/eweb/upload/Diversity%20in%20the%20 Physician%20Workforce%20Facts%20and%20Figures%202010.pdf. Accessed April 29, 2014.
- Association of American Medical Colleges Executive Committee. The status of the new AAMC definition of “underrepresented in medicine” following the Supreme Court's decision in Grutter. Available at: https://www.aamc.org/download/54278/data/urm.pdf. Accessed May 25, 2014.
- . Physician Characteristics and Distribution in the US. 2013 ed. Chicago, IL: American Medical Association; 2013.
- , , , et al. The role of black and Hispanic physicians in providing health care for underserved populations. N Engl J Med. 1996;334:1305–1310.
- , , . The association among specialty, race, ethnicity, and practice location among California physicians in diverse Specialties. J Natl Med Assoc. 2012;104:46–52.
- , , , , Patient‐physician racial concordance and the perceived quality and use of health care. Arch Intern Med. 1999;159:997–1004.
- , . Race of physician and satisfaction with care among African‐American patients. J Natl Med Assoc. 2002;94:937–943.
- U.S. Department of Health and Human Services Health Resources and Services Administration Bureau of Health Professions. The rational for diversity in health professions: a review of the evidence. 2006. Available at: http://bhpr.hrsa.gov/healthworkforce/reports/diversityreviewevidence.pdf. Accessed March 30, 2014.
- . Association of American Medical Colleges. Diversity in medical education: facts and figures 2012. Available at: https://members.aamc.org/eweb/upload/Diversity%20in%20Medical%20Ed ucation%20Facts%20and%20Figures%202012.pdf. Accessed February 28, 2013.
- , , . The leaky pipeline: factors associated with early decline in interest in premedical studies among underrepresented minority undergraduate students. Acad Med. 2008;83:503–511.
- , . Perspective: adopting an asset bundles model to support and advance minority students' careers in academic medicine and the scientific pipeline. Acad Med. 2012;87:1488–1495.
- , , , . Contributors of black men's success in admission to and graduation from medical school. Acad Med. 2011;86:892–900.
- , . Premed survival: understanding the culling process in premedical undergraduate education. Acad Med. 2002;77:719–724.
- , , , . A novel enrichment program using cascading mentorship to increase diversity in the health care professions. Acad Med. 2013;88:1232–1238.
- , . A social and academic enrichment program promotes medical school matriculation and graduation for disadvantaged students. Educ Health. 2012;25:55–63.
- , , , . Addressing medical school diversity through an undergraduate partnership at Texas A83:512–515.
Study of Antimicrobial Scrubs
Healthcare workers' (HCWs) attire becomes contaminated with bacterial pathogens during the course of the workday,[1, 2, 3, 4, 5, 6, 7, 8, 9, 10, 11, 12] and Munoz‐Price et al.[13] recently demonstrated that finding bacterial pathogens on HCWs' white coats correlated with finding the same pathogens on their hands. Because of concern for an association between attire colonization and nosocomial infection, governmental agencies in England and Scotland banned HCWs from wearing white coats or long‐sleeve garments,[14, 15] despite evidence that such an approach does not reduce contamination.[12]
Newly developed antimicrobial textiles have been incorporated into HCW scrubs,[16, 17, 18, 19, 20] and commercial Web sites and product inserts report that these products can reduce bacterial contamination by 80.9% at 8 hours to greater than 99% under laboratory conditions depending on the product and microbe studied.[16, 17, 19] Because there are limited clinical data pertaining to the effectiveness of antimicrobial scrubs, we performed a prospective study designed to determine whether wearing these products reduced bacterial contamination of HCWs' scrubs or skin at the end of an 8‐hour workday.
METHODS
Design
The study was a prospective, unblinded, randomized, controlled trial that was approved by the Colorado Multiple Institutional Review Board and conducted at Denver Health, a university‐affiliated public safety net hospital. No protocol changes occurred during the study.
Participants
Participants included hospitalist physicians, internal medicine residents, physician assistants, nurse practitioners, and nurses who directly cared for patients hospitalized on internal medicine units between March 12, 2012 and August 28, 2012. Participants known to be pregnant or those who refused to participate in the study were excluded.
Intervention
Standard scrubs issued by the hospital were tested along with 2 different antimicrobial scrubs (scrub A and scrub B). Scrub A was made with a polyester microfiber material embedded with a proprietary antimicrobial chemical. Scrub B was a polyestercotton blend scrub that included 2 proprietary antimicrobial chemicals and silver embedded into the fabric. The standard scrub was made of a polyestercotton blend with no antimicrobial properties. All scrubs consisted of pants and a short‐sleeved shirt, with either a pocket at the left breast or lower front surface, and all were tested new prior to any washing or wear. Preliminary cultures were done on 2 scrubs in each group to assess the extent of preuse contamination. All providers were instructed not to wear white coats at any time during the day that they were wearing the scrubs. Providers were not told the type of scrub they received, but the antimicrobial scrubs had a different appearance and texture than the standard scrubs, so blinding was not possible.
Outcomes
The primary end point was the total bacterial colony count of samples obtained from the breast or lower front pocket, the sleeve cuff of the dominant hand, and the pant leg at the midthigh of the dominant leg on all scrubs after an 8‐hour workday. Secondary outcomes were the bacterial colony counts of cultures obtained from the volar surface of the wrists of the HCWs' dominant arm, and the colony counts of methicillin‐resistant Staphylococcus aureus (MRSA), vancomycin‐resistant enterococci (VRE), and resistant Gram‐negative bacteria on the 3 scrub types, all obtained after the 8‐hour workday.
Cultures were collected using a standardized RODAC imprint method[21] with BBL RODAC plates containing blood agar (Becton Dickinson, Sparks, MD). Cultures were incubated in ambient air at 35 to 37C for 18 to 22 hours. After incubation, visible colonies were counted using a dissecting microscope to a maximum of 200 colonies as recommended by the manufacturer. Colonies morphologically consistent with Staphylococcus species were subsequently tested for coagulase using a BactiStaph rapid latex agglutination test (Remel, Lenexa, KS). If positive, these colonies were subcultured to sheep blood agar (Remel) and BBL MRSA CHROMagar (Becton Dickinson) and incubated for an additional 18 to 24 hours. Characteristic growth on blood agar that also produced mauve‐colored colonies on CHROMagar was taken to indicate MRSA. Colonies morphologically suspicious for being VRE were identified and confirmed as VRE using a positive identification and susceptibility panel (Microscan; Siemens, Deerfield, IL). A negative combination panel (Microscan, Siemens) was also used to identify and confirm resistant Gram‐negative rods.
Each participant completed a survey that included questions that identified their occupation, whether they had had contact with patients who were known to be colonized or infected with MRSA, VRE, or resistant Gram‐negative rods during the testing period, and whether they experienced any adverse events that might relate to wearing the uniform.
Sample Size
We assumed that cultures taken from the sleeve of the control scrubs would have a mean ( standard deviation) colony count of 69 (67) based on data from our previous study.[12] Although the companies making the antimicrobial scrubs indicated that their respective products provided between 80.9% at 8 hours and >99% reduction in bacterial colony counts in laboratory settings, we assumed that a 70% decrease in colony count compared with standard scrubs could be clinically important. After adjusting for multiple comparisons and accounting for using nonparametric analyses with an unknown distribution, we estimated a need to recruit 35 subjects in each of 3 groups.
Randomization
The principal investigator and coinvestigators enrolled and consented participants. After obtaining consent, block randomization, stratified by occupation, occurred 1 day prior to the study using a computer‐generated table of random numbers.
Statistics
Data were collected and managed using REDCap (Research Electronic Data Capture; Vanderbilt UniversityThe Institute for Medicine and Public Health, Nashville, TN) electronic data capture tools hosted at Denver Health. REDCap is a secure Web‐based application designed to support data collection for research studies, providing: (1) an intuitive interface for validated data entry, (2) audit trails for tracking data manipulation and export procedures, (3) automated export procedures for seamless data downloads to common statistical packages, and (4) procedures for importing data from external sources.[22]
Colony counts were compared using a Kruskal‐Wallis 1‐way analysis of variance by ranks. Bonferroni's correction for multiple comparisons resulted in a P<0.01 as indicating statistical significance. Proportions were compared using [2] analysis. All data are presented as medians with interquartile range (IQR) or proportions.
RESULTS
We screened 118 HCWs for participation and randomized 109, 37 in the control and antimicrobial scrub group A, and 35 in antimicrobial scrub group B (during the course of the study we neglected to culture the pockets of 2 participants in the standard scrub group and 2 in antimicrobial scrub group A). Because our primary end point was total colony count from cultures taken from 3 sites, data from these 4 subjects could not be used, and all the data from these 4 subjects were excluded from the primary analysis; 4 additional subjects were subsequently recruited allowing us to meet our block enrollment target (Figure 1). The first and last participants were studied on March 12, 2012 and August 28, 2012, respectively. The trial ended once the defined number of participants was enrolled. The occupations of the 105 participants are summarized in Table 1.

| All Subjects, N=105 | Standard Scrub, n=35 | Antimicrobial Scrub A, n=35 | Antimicrobial Scrub B, n=35 | |
|---|---|---|---|---|
| Healthcare worker type, n (%) | ||||
| Attending physician | 11 (10) | 5 (14) | 3 (9) | 3 (9) |
| Intern/resident | 51 (49) | 17 (49) | 16 (46) | 18 (51) |
| Midlevels | 6 (6) | 2 (6) | 2 (6) | 2 (6) |
| Nurse | 37 (35) | 11 (31) | 14 (40) | 12 (34) |
| Cared for colonized or infected patient with antibiotic resistant organism, n (%) | 55 (52) | 16 (46) | 20 (57) | 19 (54) |
| Number of colonized or infected patients cared for, n (%) | ||||
| 1 | 37 (67) | 10 (63) | 13 (65) | 14 (74) |
| 2 | 11 (20) | 4 (25) | 6 (30) | 1 (5) |
| 3 or more | 6 (11) | 2 (12) | 1 (5) | 3 (16) |
| Unknown | 1 (2) | 0 (0) | 0 (0) | 1 (5) |
Colony counts of all scrubs cultured prior to use never exceeded 10 colonies. The median (IQR) total colony counts from all sites on the scrubs was 99 (66182) for standard scrubs, 137 (84289) for antimicrobial scrub type A, and 138 (62274) for antimicrobial scrub type B (P=0.36). We found no significant differences between the colony counts cultured from any of the individual sites among the 3 groups, regardless of occupation (Table 2). No significant difference was observed with respect to colony counts cultured from the wrist among the 3 study groups (Table 2). Comparisons between groups were planned a priori if a difference across all groups was found. Given the nonsignificant P values across all scrub groups, no further comparisons were made.
| Total (From All Sites on Scrubs) | Sleeve Cuff | Thigh | Wrist | ||
|---|---|---|---|---|---|
| |||||
| All subjects, N=105 | |||||
| Standard scrub | 99 (66182) | 41 (2070) | 20 (944) | 32 (2161) | 16 (540) |
| Antimicrobial scrub A | 137 (84289) | 65 (35117) | 33 (16124) | 41 (1586) | 23 (442) |
| Antimicrobial scrub B | 138 (62274) | 41 (2299) | 21 (941) | 40 (18107) | 15 (654) |
| P value | 0.36 | 0.17 | 0.07 | 0.57 | 0.92 |
| Physicians and midlevels, n=68 | |||||
| Standard scrub | 115.5 (72.5173.5) | 44.5 (2270.5) | 27.5 (10.538.5) | 35 (2362.5) | 24.5 (755) |
| Antimicrobial scrub A | 210 (114289) | 86 (64120) | 39 (18129) | 49 (2486) | 24 (342) |
| Antimicrobial scrub B | 149 (68295) | 52 (26126) | 21 (1069) | 37 (18141) | 19 (872) |
| P value | 0.21 | 0.08 | 0.19 | 0.85 | 0.76 |
| Nurses, n=37 | |||||
| Standard scrub | 89 (31236) | 37 (1348) | 13 (552) | 28 (1342) | 9 (321) |
| Antimicrobial scrub A | 105 (43256) | 45.5 (2258) | 21.5 (1654) | 38.5 (1268) | 17 (643) |
| Antimicrobial scrub B | 91.5 (60174.5) | 27 (1340) | 16 (7.526) | 51 (2186.5) | 10 (3.543.5) |
| P value | 0.86 | 0.39 | 0.19 | 0.49 | 0.41 |
Fifty‐five participants (52%) reported caring for patients who were known to be colonized or infected with an antibiotic‐resistant organism, 16 (46%) randomized to wear standard scrubs, and 20 (57%) and 19 (54%) randomized to wear antimicrobial scrub A or B, respectively (P=0.61). Of these, however, antibiotic‐resistant organisms were only cultured from the scrubs of 2 providers (1 with 1 colony of MRSA from the breast pocket of antimicrobial scrub A, 1 with 1 colony of MRSA cultured from the pocket of antimicrobial scrub B [P=0.55]), and from the wrist of only 1 provider (a multiresistant Gram‐negative rod who wore antimicrobial scrub B).
Adverse Events
Six subjects (5.7%) reported adverse events, all of whom were wearing antimicrobial scrubs (P=0.18). For participants wearing antimicrobial scrub A, 1 (3%) reported itchiness and 2 (6%) reported heaviness or poor breathability. For participants wearing antimicrobial scrub B, 1 (3%) reported redness, 1 (3%) reported itchiness, and 1 (3%) reported heaviness or poor breathability.
DISCUSSION
The important findings of this study are that we found no evidence indicating that either of the 2 antimicrobial scrubs tested reduced bacterial contamination or antibiotic‐resistant contamination on HCWs' scrubs or wrists compared with standard scrubs at the end of an 8‐hour workday, and that despite many HCWs being exposed to patients who were colonized or infected with antibiotic‐resistant bacteria, these organisms were only rarely cultured from their uniforms.
We found that HCWs in all 3 arms of the study had bacterial contamination on their scrubs and skin, consistent with previous studies showing that HCWs' uniforms are frequently contaminated with bacteria, including MRSA, VRE, and other pathogens.[1, 2, 3, 4, 5, 6, 7, 8, 9, 10, 11, 12] We previously found that bacterial contamination of HCWs' uniforms occurs within hours of putting on newly laundered uniforms.[12]
Literature on the effectiveness of antimicrobial HCW uniforms when tested in clinical settings is limited. Bearman and colleagues[23] recently published the results of a study of 31 subjects who wore either standard or antimicrobial scrubs, crossing over every 4 weeks for 4 months, with random culturing done weekly at the beginning and end of a work shift. Scrubs were laundered an average of 1.5 times/week, but the timing of the laundering relative to when cultures were obtained was not reported. Very few isolates of MRSA, Gram‐negative rods, or VRE were found (only 3.9%, 0.4%, and 0.05% of the 2000 samples obtained, respectively), and no differences were observed with respect to the number of HCWs who had antibiotic‐resistant organisms cultured when they were wearing standard versus antimicrobial scrubs. Those who had MRSA cultured, however, had lower mean log colony counts when they were wearing the antimicrobial scrubs. The small number of samples with positive isolates, together with differences in the extent of before‐shift contamination among groups complicates interpreting these data. The authors concluded that a prospective trial was needed. We attempted to include the scrub studied by Bearman and colleagues[23] in our study, but the company had insufficient stock available at the time we tried to purchase the product.
Gross and colleagues[24] found no difference in the mean colony counts of cultures taken from silver‐impregnated versus standard scrubs in a pilot crossover study done with 10 HCWs (although there were trends toward higher colony counts when the subjects wore antimicrobial scrubs).
Antibiotic‐resistant bacteria were only cultured from 3 participants (2.9%) in our current study, compared to 16% of those randomized to wearing white coats in our previous study and 20% of those randomized to wearing standard scrubs.[12] This difference may be explained by several recent studies reporting that rates of MRSA infections in hospitals are decreasing.[25, 26] The rate of hospital‐acquired MRSA infection or colonization at our own institution decreased 80% from 2007 to 2012. At the times of our previous and current studies, providers were expected to wear gowns and gloves when caring for patients as per standard contact precautions. Rates of infection and colonization of VRE and resistant Gram‐negative rods have remained low at our hospital, and our data are consistent with the rates reported on HCWs' uniforms in other studies.[2, 5, 10]
Only 6 of our subjects reported adverse reactions, but all were wearing antimicrobial scrubs (P=0.18). Several of the participants described that the fabrics of the 2 antimicrobial scrubs were heavier and less breathable than the standard scrubs. We believe this difference is more likely to explain the adverse reactions reported than is any type of reaction to the specific chemicals in the fabrics.
Our study has several limitations. Because it was conducted on the general internal medicine units of a single university‐affiliated public hospital, the results may not generalize to other types of institutions or other inpatient services.
As we previously described,[12] the RODAC imprint method only samples a small area of HCWs' uniforms and thus does not represent total bacterial contamination.[21] We specifically cultured areas that are known to be highly contaminated (ie, sleeve cuffs and pockets). Although imprint methods have limitations (as do other methods for culturing clothing), they have been commonly utilized in studies assessing bacterial contamination of HCW clothing.[2, 3, 5]
Although some of the bacterial load we cultured could have come from the providers themselves, previous studies have shown that 80% to 90% of the resistant bacteria cultured from HCWs' attire come from other sources.[1, 2]
Because our sample size was calculated on the basis of being able to detect a difference of 70% in total bacterial colony count, our study was not large enough to exclude a lower level of effectiveness. However, we saw no trends suggesting the antimicrobial products might have a lower level of effectiveness.
We did not observe the hand‐washing practices of the participants, and accordingly, cannot confirm that these practices were the same in each of our 3 study groups. Intermittent, surreptitious monitoring of hand‐washing practices on our internal medicine units over the last several years has found compliance with hand hygiene recommendations varying from 70% to 90%.
Although the participants in our study were not explicitly told to which scrub they were randomized, the colors, appearances, and textures of the antimicrobial fabrics were different from the standard scrubs such that blinding was impossible. Participants wearing antimicrobial scrubs could have changed their hand hygiene practices (ie, less careful hand hygiene). Lack of blinding could also have led to over‐reporting of adverse events by the subjects randomized to wear the antimicrobial scrubs.
In an effort to treat all the scrubs in the same fashion, all were tested new, prior to being washed or previously worn. Studying the scrubs prior to washing or wearing could have increased the reports of adverse effects, as the fabrics could have been stiffer and more uncomfortable than they might have been at a later stage in their use.
Our study also has some strengths. Our participants included physicians, residents, nurses, nurse practitioners, and physician assistants. Accordingly, our results should be generalizable to most HCWs. We also confirmed that the scrubs that were tested were nearly sterile prior to use.
In conclusion, we found no evidence suggesting that either of 2 antimicrobial scrubs tested decreased bacterial contamination of HCWs' scrubs or skin after an 8‐hour workday compared to standard scrubs. We also found that, although HCWs are frequently exposed to patients harboring antibiotic‐resistant bacteria, these bacteria were only rarely cultured from HCWs' scrubs or skin.
- , , , . Contamination of nurses' uniforms with Staphylococcus aureus. Lancet. 1969;2:233–235.
- , , . Contamination of protective clothing and nurses' uniforms in an isolation ward. J Hosp Infect. 1983;4:149–157.
- , , . Microbial flora on doctors' white coats. BMJ. 1991;303:1602–1604.
- . Bacterial contamination of nurses' uniforms: a study. Nursing Stand. 1998;13:37–42.
- , , . Bacterial flora on the white coats of medical students. J Hosp Infect. 2000;45:65–68.
- , , . Bacterial contamination of uniforms. J Hosp Infect. 2001;48:238–241.
- , , , et al. Significance of methicillin‐resistant Staphylococcus aureus (MRSA) survey in a university teaching hospital. J Infect Chemother. 2003;9:172–177.
- . Environmental contamination makes an important contribution to hospital infection. J Hosp Infect. 2007;65(suppl 2):50–54.
- , , , et al. Detection of methicillin‐resistant Staphylococcus aureus and vancomycin‐resistant enterococci on the gowns and gloves of healthcare workers. Infect Control Hosp Epidemiol. 2008;29:583–589.
- , , , , , . Bacterial contamination of health care workers' white coats. Am J Infect Control. 2009;37:101–105.
- , , , , , . Nursing and physician attire as possible source of nosocomial infections. Am J Infect Control. 2011;39:555–559.
- , , , , , . Newly cleaned physician uniforms and infrequently washed white coats have similar rates of bacterial contamination after an 8‐hour workday: a randomized controlled trial. J Hosp Med. 2011;6:177–182.
- , , , et al. Associations between bacterial contamination of health care workers' hands and contamination of white coats and scrubs. Am J Infect Control. 2012;40:e245–e248.
- Department of Health. Uniforms and workwear: an evidence base for developing local policy. National Health Service, 17 September 2007. Available at: http://www.dh.gov.uk/en/Publicationsandstatistics/Publications/Publicationspolicyandguidance/DH_078433. Accessed January 29, 2010.
- Scottish Government Health Directorates. NHS Scotland dress code. Available at: http://www.sehd.scot.nhs.uk/mels/CEL2008_53.pdf. Accessed February 10, 2010.
- Bio Shield Tech Web site. Bio Gardz–unisex scrub top–antimicrobial treatment. Available at: http://www.bioshieldtech.com/Bio_Gardz_Unisex_Scrub_Top_Antimicrobial_Tre_p/sbt01‐r‐p.htm. Accessed January 9, 2013.
- Doc Froc Web site and informational packet. Available at: http://www.docfroc.com. Accessed July 22, 2011.
- Vestagen Web site and informational packet. Available at: http://www.vestagen.com. Accessed July 22, 2011.
- Under Scrub apparel Web site. Testing. Available at: http://underscrub.com/testing. Accessed March 21, 2013.
- MediThreads Web site. Microban FAQ's. Available at: http://medithreads.com/faq/microban‐faqs. Accessed March 21, 2013.
- , , , , . Comparison of the Rodac imprint method to selective enrichment broth for recovery of vancomycin‐resistant enterococci and drug‐resistant Enterobacteriaceae from environmental surfaces. J Clin Microbiol. 2000;38:4646–4648.
- , , , , , . Research electronic data capture (REDCap)—a metadata‐driven methodology and workflow process for providing translational research informatics support. J Biomed Inform. 2009;42:377–381.
- , , , et al. A crossover trial of antimicrobial scrubs to reduce methicillin‐resistant Staphylococcus aureus burden on healthcare worker apparel. Infect Control Hosp Epidemiol. 2012;33:268–275.
- , , , , . Pilot study on the microbial contamination of conventional vs. silver‐impregnated uniforms worn by ambulance personnel during one week of emergency medical service. GMS Krankenhhyg Interdiszip. 2010;5.pii: Doc09.
- , , , et al. Epidemiology of Staphylococcus aureus blood and skin and soft tissue infections in the US military health system, 2005–2010. JAMA. 2012;308:50–59.
- , , , et al. Health care‐associated invasive MRSA infections, 2005–2008. JAMA. 2010;304:641–648.
Healthcare workers' (HCWs) attire becomes contaminated with bacterial pathogens during the course of the workday,[1, 2, 3, 4, 5, 6, 7, 8, 9, 10, 11, 12] and Munoz‐Price et al.[13] recently demonstrated that finding bacterial pathogens on HCWs' white coats correlated with finding the same pathogens on their hands. Because of concern for an association between attire colonization and nosocomial infection, governmental agencies in England and Scotland banned HCWs from wearing white coats or long‐sleeve garments,[14, 15] despite evidence that such an approach does not reduce contamination.[12]
Newly developed antimicrobial textiles have been incorporated into HCW scrubs,[16, 17, 18, 19, 20] and commercial Web sites and product inserts report that these products can reduce bacterial contamination by 80.9% at 8 hours to greater than 99% under laboratory conditions depending on the product and microbe studied.[16, 17, 19] Because there are limited clinical data pertaining to the effectiveness of antimicrobial scrubs, we performed a prospective study designed to determine whether wearing these products reduced bacterial contamination of HCWs' scrubs or skin at the end of an 8‐hour workday.
METHODS
Design
The study was a prospective, unblinded, randomized, controlled trial that was approved by the Colorado Multiple Institutional Review Board and conducted at Denver Health, a university‐affiliated public safety net hospital. No protocol changes occurred during the study.
Participants
Participants included hospitalist physicians, internal medicine residents, physician assistants, nurse practitioners, and nurses who directly cared for patients hospitalized on internal medicine units between March 12, 2012 and August 28, 2012. Participants known to be pregnant or those who refused to participate in the study were excluded.
Intervention
Standard scrubs issued by the hospital were tested along with 2 different antimicrobial scrubs (scrub A and scrub B). Scrub A was made with a polyester microfiber material embedded with a proprietary antimicrobial chemical. Scrub B was a polyestercotton blend scrub that included 2 proprietary antimicrobial chemicals and silver embedded into the fabric. The standard scrub was made of a polyestercotton blend with no antimicrobial properties. All scrubs consisted of pants and a short‐sleeved shirt, with either a pocket at the left breast or lower front surface, and all were tested new prior to any washing or wear. Preliminary cultures were done on 2 scrubs in each group to assess the extent of preuse contamination. All providers were instructed not to wear white coats at any time during the day that they were wearing the scrubs. Providers were not told the type of scrub they received, but the antimicrobial scrubs had a different appearance and texture than the standard scrubs, so blinding was not possible.
Outcomes
The primary end point was the total bacterial colony count of samples obtained from the breast or lower front pocket, the sleeve cuff of the dominant hand, and the pant leg at the midthigh of the dominant leg on all scrubs after an 8‐hour workday. Secondary outcomes were the bacterial colony counts of cultures obtained from the volar surface of the wrists of the HCWs' dominant arm, and the colony counts of methicillin‐resistant Staphylococcus aureus (MRSA), vancomycin‐resistant enterococci (VRE), and resistant Gram‐negative bacteria on the 3 scrub types, all obtained after the 8‐hour workday.
Cultures were collected using a standardized RODAC imprint method[21] with BBL RODAC plates containing blood agar (Becton Dickinson, Sparks, MD). Cultures were incubated in ambient air at 35 to 37C for 18 to 22 hours. After incubation, visible colonies were counted using a dissecting microscope to a maximum of 200 colonies as recommended by the manufacturer. Colonies morphologically consistent with Staphylococcus species were subsequently tested for coagulase using a BactiStaph rapid latex agglutination test (Remel, Lenexa, KS). If positive, these colonies were subcultured to sheep blood agar (Remel) and BBL MRSA CHROMagar (Becton Dickinson) and incubated for an additional 18 to 24 hours. Characteristic growth on blood agar that also produced mauve‐colored colonies on CHROMagar was taken to indicate MRSA. Colonies morphologically suspicious for being VRE were identified and confirmed as VRE using a positive identification and susceptibility panel (Microscan; Siemens, Deerfield, IL). A negative combination panel (Microscan, Siemens) was also used to identify and confirm resistant Gram‐negative rods.
Each participant completed a survey that included questions that identified their occupation, whether they had had contact with patients who were known to be colonized or infected with MRSA, VRE, or resistant Gram‐negative rods during the testing period, and whether they experienced any adverse events that might relate to wearing the uniform.
Sample Size
We assumed that cultures taken from the sleeve of the control scrubs would have a mean ( standard deviation) colony count of 69 (67) based on data from our previous study.[12] Although the companies making the antimicrobial scrubs indicated that their respective products provided between 80.9% at 8 hours and >99% reduction in bacterial colony counts in laboratory settings, we assumed that a 70% decrease in colony count compared with standard scrubs could be clinically important. After adjusting for multiple comparisons and accounting for using nonparametric analyses with an unknown distribution, we estimated a need to recruit 35 subjects in each of 3 groups.
Randomization
The principal investigator and coinvestigators enrolled and consented participants. After obtaining consent, block randomization, stratified by occupation, occurred 1 day prior to the study using a computer‐generated table of random numbers.
Statistics
Data were collected and managed using REDCap (Research Electronic Data Capture; Vanderbilt UniversityThe Institute for Medicine and Public Health, Nashville, TN) electronic data capture tools hosted at Denver Health. REDCap is a secure Web‐based application designed to support data collection for research studies, providing: (1) an intuitive interface for validated data entry, (2) audit trails for tracking data manipulation and export procedures, (3) automated export procedures for seamless data downloads to common statistical packages, and (4) procedures for importing data from external sources.[22]
Colony counts were compared using a Kruskal‐Wallis 1‐way analysis of variance by ranks. Bonferroni's correction for multiple comparisons resulted in a P<0.01 as indicating statistical significance. Proportions were compared using [2] analysis. All data are presented as medians with interquartile range (IQR) or proportions.
RESULTS
We screened 118 HCWs for participation and randomized 109, 37 in the control and antimicrobial scrub group A, and 35 in antimicrobial scrub group B (during the course of the study we neglected to culture the pockets of 2 participants in the standard scrub group and 2 in antimicrobial scrub group A). Because our primary end point was total colony count from cultures taken from 3 sites, data from these 4 subjects could not be used, and all the data from these 4 subjects were excluded from the primary analysis; 4 additional subjects were subsequently recruited allowing us to meet our block enrollment target (Figure 1). The first and last participants were studied on March 12, 2012 and August 28, 2012, respectively. The trial ended once the defined number of participants was enrolled. The occupations of the 105 participants are summarized in Table 1.
| All Subjects, N=105 | Standard Scrub, n=35 | Antimicrobial Scrub A, n=35 | Antimicrobial Scrub B, n=35 | |
|---|---|---|---|---|
| Healthcare worker type, n (%) | ||||
| Attending physician | 11 (10) | 5 (14) | 3 (9) | 3 (9) |
| Intern/resident | 51 (49) | 17 (49) | 16 (46) | 18 (51) |
| Midlevels | 6 (6) | 2 (6) | 2 (6) | 2 (6) |
| Nurse | 37 (35) | 11 (31) | 14 (40) | 12 (34) |
| Cared for colonized or infected patient with antibiotic resistant organism, n (%) | 55 (52) | 16 (46) | 20 (57) | 19 (54) |
| Number of colonized or infected patients cared for, n (%) | ||||
| 1 | 37 (67) | 10 (63) | 13 (65) | 14 (74) |
| 2 | 11 (20) | 4 (25) | 6 (30) | 1 (5) |
| 3 or more | 6 (11) | 2 (12) | 1 (5) | 3 (16) |
| Unknown | 1 (2) | 0 (0) | 0 (0) | 1 (5) |
Colony counts of all scrubs cultured prior to use never exceeded 10 colonies. The median (IQR) total colony counts from all sites on the scrubs was 99 (66182) for standard scrubs, 137 (84289) for antimicrobial scrub type A, and 138 (62274) for antimicrobial scrub type B (P=0.36). We found no significant differences between the colony counts cultured from any of the individual sites among the 3 groups, regardless of occupation (Table 2). No significant difference was observed with respect to colony counts cultured from the wrist among the 3 study groups (Table 2). Comparisons between groups were planned a priori if a difference across all groups was found. Given the nonsignificant P values across all scrub groups, no further comparisons were made.
| Total (From All Sites on Scrubs) | Sleeve Cuff | Thigh | Wrist | ||
|---|---|---|---|---|---|
| |||||
| All subjects, N=105 | |||||
| Standard scrub | 99 (66182) | 41 (2070) | 20 (944) | 32 (2161) | 16 (540) |
| Antimicrobial scrub A | 137 (84289) | 65 (35117) | 33 (16124) | 41 (1586) | 23 (442) |
| Antimicrobial scrub B | 138 (62274) | 41 (2299) | 21 (941) | 40 (18107) | 15 (654) |
| P value | 0.36 | 0.17 | 0.07 | 0.57 | 0.92 |
| Physicians and midlevels, n=68 | |||||
| Standard scrub | 115.5 (72.5173.5) | 44.5 (2270.5) | 27.5 (10.538.5) | 35 (2362.5) | 24.5 (755) |
| Antimicrobial scrub A | 210 (114289) | 86 (64120) | 39 (18129) | 49 (2486) | 24 (342) |
| Antimicrobial scrub B | 149 (68295) | 52 (26126) | 21 (1069) | 37 (18141) | 19 (872) |
| P value | 0.21 | 0.08 | 0.19 | 0.85 | 0.76 |
| Nurses, n=37 | |||||
| Standard scrub | 89 (31236) | 37 (1348) | 13 (552) | 28 (1342) | 9 (321) |
| Antimicrobial scrub A | 105 (43256) | 45.5 (2258) | 21.5 (1654) | 38.5 (1268) | 17 (643) |
| Antimicrobial scrub B | 91.5 (60174.5) | 27 (1340) | 16 (7.526) | 51 (2186.5) | 10 (3.543.5) |
| P value | 0.86 | 0.39 | 0.19 | 0.49 | 0.41 |
Fifty‐five participants (52%) reported caring for patients who were known to be colonized or infected with an antibiotic‐resistant organism, 16 (46%) randomized to wear standard scrubs, and 20 (57%) and 19 (54%) randomized to wear antimicrobial scrub A or B, respectively (P=0.61). Of these, however, antibiotic‐resistant organisms were only cultured from the scrubs of 2 providers (1 with 1 colony of MRSA from the breast pocket of antimicrobial scrub A, 1 with 1 colony of MRSA cultured from the pocket of antimicrobial scrub B [P=0.55]), and from the wrist of only 1 provider (a multiresistant Gram‐negative rod who wore antimicrobial scrub B).
Adverse Events
Six subjects (5.7%) reported adverse events, all of whom were wearing antimicrobial scrubs (P=0.18). For participants wearing antimicrobial scrub A, 1 (3%) reported itchiness and 2 (6%) reported heaviness or poor breathability. For participants wearing antimicrobial scrub B, 1 (3%) reported redness, 1 (3%) reported itchiness, and 1 (3%) reported heaviness or poor breathability.
DISCUSSION
The important findings of this study are that we found no evidence indicating that either of the 2 antimicrobial scrubs tested reduced bacterial contamination or antibiotic‐resistant contamination on HCWs' scrubs or wrists compared with standard scrubs at the end of an 8‐hour workday, and that despite many HCWs being exposed to patients who were colonized or infected with antibiotic‐resistant bacteria, these organisms were only rarely cultured from their uniforms.
We found that HCWs in all 3 arms of the study had bacterial contamination on their scrubs and skin, consistent with previous studies showing that HCWs' uniforms are frequently contaminated with bacteria, including MRSA, VRE, and other pathogens.[1, 2, 3, 4, 5, 6, 7, 8, 9, 10, 11, 12] We previously found that bacterial contamination of HCWs' uniforms occurs within hours of putting on newly laundered uniforms.[12]
Literature on the effectiveness of antimicrobial HCW uniforms when tested in clinical settings is limited. Bearman and colleagues[23] recently published the results of a study of 31 subjects who wore either standard or antimicrobial scrubs, crossing over every 4 weeks for 4 months, with random culturing done weekly at the beginning and end of a work shift. Scrubs were laundered an average of 1.5 times/week, but the timing of the laundering relative to when cultures were obtained was not reported. Very few isolates of MRSA, Gram‐negative rods, or VRE were found (only 3.9%, 0.4%, and 0.05% of the 2000 samples obtained, respectively), and no differences were observed with respect to the number of HCWs who had antibiotic‐resistant organisms cultured when they were wearing standard versus antimicrobial scrubs. Those who had MRSA cultured, however, had lower mean log colony counts when they were wearing the antimicrobial scrubs. The small number of samples with positive isolates, together with differences in the extent of before‐shift contamination among groups complicates interpreting these data. The authors concluded that a prospective trial was needed. We attempted to include the scrub studied by Bearman and colleagues[23] in our study, but the company had insufficient stock available at the time we tried to purchase the product.
Gross and colleagues[24] found no difference in the mean colony counts of cultures taken from silver‐impregnated versus standard scrubs in a pilot crossover study done with 10 HCWs (although there were trends toward higher colony counts when the subjects wore antimicrobial scrubs).
Antibiotic‐resistant bacteria were only cultured from 3 participants (2.9%) in our current study, compared to 16% of those randomized to wearing white coats in our previous study and 20% of those randomized to wearing standard scrubs.[12] This difference may be explained by several recent studies reporting that rates of MRSA infections in hospitals are decreasing.[25, 26] The rate of hospital‐acquired MRSA infection or colonization at our own institution decreased 80% from 2007 to 2012. At the times of our previous and current studies, providers were expected to wear gowns and gloves when caring for patients as per standard contact precautions. Rates of infection and colonization of VRE and resistant Gram‐negative rods have remained low at our hospital, and our data are consistent with the rates reported on HCWs' uniforms in other studies.[2, 5, 10]
Only 6 of our subjects reported adverse reactions, but all were wearing antimicrobial scrubs (P=0.18). Several of the participants described that the fabrics of the 2 antimicrobial scrubs were heavier and less breathable than the standard scrubs. We believe this difference is more likely to explain the adverse reactions reported than is any type of reaction to the specific chemicals in the fabrics.
Our study has several limitations. Because it was conducted on the general internal medicine units of a single university‐affiliated public hospital, the results may not generalize to other types of institutions or other inpatient services.
As we previously described,[12] the RODAC imprint method only samples a small area of HCWs' uniforms and thus does not represent total bacterial contamination.[21] We specifically cultured areas that are known to be highly contaminated (ie, sleeve cuffs and pockets). Although imprint methods have limitations (as do other methods for culturing clothing), they have been commonly utilized in studies assessing bacterial contamination of HCW clothing.[2, 3, 5]
Although some of the bacterial load we cultured could have come from the providers themselves, previous studies have shown that 80% to 90% of the resistant bacteria cultured from HCWs' attire come from other sources.[1, 2]
Because our sample size was calculated on the basis of being able to detect a difference of 70% in total bacterial colony count, our study was not large enough to exclude a lower level of effectiveness. However, we saw no trends suggesting the antimicrobial products might have a lower level of effectiveness.
We did not observe the hand‐washing practices of the participants, and accordingly, cannot confirm that these practices were the same in each of our 3 study groups. Intermittent, surreptitious monitoring of hand‐washing practices on our internal medicine units over the last several years has found compliance with hand hygiene recommendations varying from 70% to 90%.
Although the participants in our study were not explicitly told to which scrub they were randomized, the colors, appearances, and textures of the antimicrobial fabrics were different from the standard scrubs such that blinding was impossible. Participants wearing antimicrobial scrubs could have changed their hand hygiene practices (ie, less careful hand hygiene). Lack of blinding could also have led to over‐reporting of adverse events by the subjects randomized to wear the antimicrobial scrubs.
In an effort to treat all the scrubs in the same fashion, all were tested new, prior to being washed or previously worn. Studying the scrubs prior to washing or wearing could have increased the reports of adverse effects, as the fabrics could have been stiffer and more uncomfortable than they might have been at a later stage in their use.
Our study also has some strengths. Our participants included physicians, residents, nurses, nurse practitioners, and physician assistants. Accordingly, our results should be generalizable to most HCWs. We also confirmed that the scrubs that were tested were nearly sterile prior to use.
In conclusion, we found no evidence suggesting that either of 2 antimicrobial scrubs tested decreased bacterial contamination of HCWs' scrubs or skin after an 8‐hour workday compared to standard scrubs. We also found that, although HCWs are frequently exposed to patients harboring antibiotic‐resistant bacteria, these bacteria were only rarely cultured from HCWs' scrubs or skin.
- , , , . Contamination of nurses' uniforms with Staphylococcus aureus. Lancet. 1969;2:233–235.
- , , . Contamination of protective clothing and nurses' uniforms in an isolation ward. J Hosp Infect. 1983;4:149–157.
- , , . Microbial flora on doctors' white coats. BMJ. 1991;303:1602–1604.
- . Bacterial contamination of nurses' uniforms: a study. Nursing Stand. 1998;13:37–42.
- , , . Bacterial flora on the white coats of medical students. J Hosp Infect. 2000;45:65–68.
- , , . Bacterial contamination of uniforms. J Hosp Infect. 2001;48:238–241.
- , , , et al. Significance of methicillin‐resistant Staphylococcus aureus (MRSA) survey in a university teaching hospital. J Infect Chemother. 2003;9:172–177.
- . Environmental contamination makes an important contribution to hospital infection. J Hosp Infect. 2007;65(suppl 2):50–54.
- , , , et al. Detection of methicillin‐resistant Staphylococcus aureus and vancomycin‐resistant enterococci on the gowns and gloves of healthcare workers. Infect Control Hosp Epidemiol. 2008;29:583–589.
- , , , , , . Bacterial contamination of health care workers' white coats. Am J Infect Control. 2009;37:101–105.
- , , , , , . Nursing and physician attire as possible source of nosocomial infections. Am J Infect Control. 2011;39:555–559.
- , , , , , . Newly cleaned physician uniforms and infrequently washed white coats have similar rates of bacterial contamination after an 8‐hour workday: a randomized controlled trial. J Hosp Med. 2011;6:177–182.
- , , , et al. Associations between bacterial contamination of health care workers' hands and contamination of white coats and scrubs. Am J Infect Control. 2012;40:e245–e248.
- Department of Health. Uniforms and workwear: an evidence base for developing local policy. National Health Service, 17 September 2007. Available at: http://www.dh.gov.uk/en/Publicationsandstatistics/Publications/Publicationspolicyandguidance/DH_078433. Accessed January 29, 2010.
- Scottish Government Health Directorates. NHS Scotland dress code. Available at: http://www.sehd.scot.nhs.uk/mels/CEL2008_53.pdf. Accessed February 10, 2010.
- Bio Shield Tech Web site. Bio Gardz–unisex scrub top–antimicrobial treatment. Available at: http://www.bioshieldtech.com/Bio_Gardz_Unisex_Scrub_Top_Antimicrobial_Tre_p/sbt01‐r‐p.htm. Accessed January 9, 2013.
- Doc Froc Web site and informational packet. Available at: http://www.docfroc.com. Accessed July 22, 2011.
- Vestagen Web site and informational packet. Available at: http://www.vestagen.com. Accessed July 22, 2011.
- Under Scrub apparel Web site. Testing. Available at: http://underscrub.com/testing. Accessed March 21, 2013.
- MediThreads Web site. Microban FAQ's. Available at: http://medithreads.com/faq/microban‐faqs. Accessed March 21, 2013.
- , , , , . Comparison of the Rodac imprint method to selective enrichment broth for recovery of vancomycin‐resistant enterococci and drug‐resistant Enterobacteriaceae from environmental surfaces. J Clin Microbiol. 2000;38:4646–4648.
- , , , , , . Research electronic data capture (REDCap)—a metadata‐driven methodology and workflow process for providing translational research informatics support. J Biomed Inform. 2009;42:377–381.
- , , , et al. A crossover trial of antimicrobial scrubs to reduce methicillin‐resistant Staphylococcus aureus burden on healthcare worker apparel. Infect Control Hosp Epidemiol. 2012;33:268–275.
- , , , , . Pilot study on the microbial contamination of conventional vs. silver‐impregnated uniforms worn by ambulance personnel during one week of emergency medical service. GMS Krankenhhyg Interdiszip. 2010;5.pii: Doc09.
- , , , et al. Epidemiology of Staphylococcus aureus blood and skin and soft tissue infections in the US military health system, 2005–2010. JAMA. 2012;308:50–59.
- , , , et al. Health care‐associated invasive MRSA infections, 2005–2008. JAMA. 2010;304:641–648.
© 2013 Society of Hospital Medicine
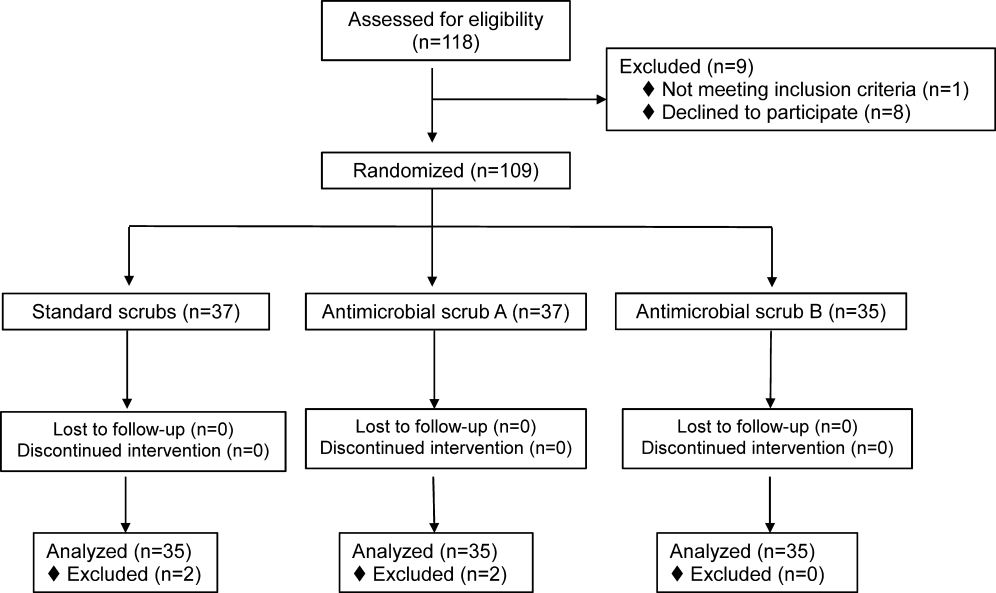
Curbside vs Formal Consultation
A curbside consultation is an informal process whereby a consultant is asked to provide information or advice about a patient's care without doing a formal assessment of the patient.14 Curbside consultations are common in the practice of medicine2, 3, 5 and are frequently requested by physicians caring for hospitalized patients. Several surveys have documented the quantity of curbside consultations requested of various subspecialties, the types of questions asked, the time it takes to respond, and physicians' perceptions about the quality of the information exchanged.111 While curbside consultations have a number of advantages, physicians' perceptions are that the information conveyed may be inaccurate or incomplete and that the advice offered may be erroneous.13, 5, 10, 12, 13
Cartmill and White14 performed a random audit of 10% of the telephone referrals they received for neurosurgical consultation over a 1‐year period and noted discrepancies between the Glascow Coma Scores reported during the telephone referrals and those noted in the medical records, but the frequency of these discrepancies was not reported. To our knowledge, no studies have compared the quality of the information provided in curbside consultations with that obtained in formal consultations that included direct face‐to‐face patient evaluations and primary data collection, and whether the advice provided in curbside and formal consultations on the same patient differed.
We performed a prospective cohort study to compare the information received by hospitalists during curbside consultations on hospitalized patients, with that obtained from formal consultations done the same day on the same patients, by different hospitalists who were unaware of any details regarding the curbside consultation. We also compared the advice provided by the 2 hospitalists following their curbside and formal consultations. Our hypotheses were that the information received during curbside consultations was frequently inaccurate or incomplete, that the recommendations made after the formal consultation would frequently differ from those made in the curbside consultation, and that these differences would have important implications on patient care.
METHODS
This was a quality improvement study conducted at Denver Health, a 500‐bed university‐affiliated urban safety net hospital from January 10, 2011 to January 9, 2012. The study design was a prospective cohort that included all curbside consultations on hospitalized patients received between 7 AM and 3 PM, on intermittently selected weekdays, by the Internal Medicine Consultation Service that was staffed by 18 hospitalists. Data were collected intermittently based upon hospitalist availability and was done to limit potential alterations in the consulting practices of the providers requesting consultations.
Consultations were defined as being curbside when the consulting provider asked for advice, suggestions, or opinions about a patient's care but did not ask the hospitalist to see the patient.15, 15 Consultations pertaining to administrative issues (eg, whether a patient should be admitted to an intensive care bed as opposed to an acute care floor bed) or on patients who were already being followed by a hospitalist were excluded.
The hospitalist receiving the curbside consultation was allowed to ask questions as they normally would, but could not verify the accuracy of the information received (eg, could not review any portion of the patient's medical record, such as notes or lab data). A standardized data collection sheet was used to record the service and level of training of the requesting provider, the medical issue(s) of concern, all clinical data offered by the provider, the number of questions asked by the hospitalist of the provider, and whether, on the basis of the information provided, the hospitalist felt that the question(s) being asked was (were) of sufficient complexity that a formal consultation should occur. The hospitalist then offered advice based upon the information given during the curbside consultation.
After completing the curbside consultation, the hospitalist requested verbal permission from the requesting provider to perform a formal consultation. If the request was approved, the hospitalist performing the curbside consultation contacted a different hospitalist who performed the formal consultation within the next few hours. The only information given to the second hospitalist was the patient's identifiers and the clinical question(s) being asked. The formal consultation included a complete face‐to‐face history and physical examination, a review of the patient's medical record, documentation of the provider's findings, and recommendations for care.
Upon completion of the formal consultation, the hospitalists who performed the curbside and the formal consultations met to review the advice each gave to the requesting provider and the information on which this advice was based. The 2 hospitalists jointly determined the following: (a) whether the information received during the curbside consultation was correct and complete, (b) whether the advice provided in the formal consultation differed from that provided in the curbside consultation, (c) whether the advice provided in the formal consultation dealt with issues other than one(s) leading to the curbside consultation, (d) whether differences in the recommendations given in the curbside versus the formal consultation changed patient management in a meaningful way, and (e) whether the curbside consultation alone was felt to be sufficient.
Information obtained by the hospitalist performing the formal consultation that was different from, or not included in, the information recorded during the curbside consultation was considered to be incorrect or incomplete, respectively. A change in management was defined as an alteration in the direction or type of care that the patient would have received as a result of the advice being given. A pulmonary and critical care physician, with >35 years of experience in inpatient medicine, reviewed the information provided in the curbside and formal consultations, and independently assessed whether the curbside consultation alone would have been sufficient and whether the formal consultation changed management.
Curbside consultations were neither solicited nor discouraged during the course of the study. The provider requesting the curbside consultation was not informed or debriefed about the study in an attempt to avoid affecting future consultation practices from that provider or service.
Associations were sought between the frequency of inaccurate or incomplete data and the requesting service and provider, the consultative category and medical issue, the number of questions asked by the hospitalist during the curbside consultation, and whether the hospitalist doing the curbside consultation thought that formal consultation was needed. A chi‐square test was used to analyze all associations. A P value of <0.05 was considered significant. All analyses were performed using SAS Enterprise Guide 4.3 (SAS Institute, Inc, Cary, NC) software. The study was approved by the Colorado Multiple Institutional Review Board.
RESULTS
Fifty curbside consultations were requested on a total of 215 study days. The requesting service declined formal consultation in 3 instances, leaving 47 curbside consultations that had a formal consultation. Curbside consultations came from a variety of services and providers, and addressed a variety of issues and concerns (Table 1).
| Curbside Consultations, N (%) | |
|---|---|
| 47 (100) | |
| |
| Requesting service | |
| Psychiatry | 21 (45) |
| Emergency Department | 9 (19) |
| Obstetrics/Gynecology | 5 (11) |
| Neurology | 4 (8) |
| Other (Orthopedics, Anesthesia, General Surgery, Neurosurgery, and Interventional Radiology) | 8 (17) |
| Requesting provider | |
| Resident | 25 (53) |
| Intern | 8 (17) |
| Attending | 9 (19) |
| Other | 5 (11) |
| Consultative issue* | |
| Diagnosis | 10 (21) |
| Treatment | 29 (62) |
| Evaluation | 20 (43) |
| Discharge | 13 (28) |
| Lab interpretation | 4 (9) |
| Medical concern* | |
| Cardiac | 27 (57) |
| Endocrine | 17 (36) |
| Infectious disease | 9 (19) |
| Pulmonary | 8 (17) |
| Gastroenterology | 6 (13) |
| Fluid and electrolyte | 6 (13) |
| Others | 23 (49) |
The hospitalists asked 0 to 2 questions during 8/47 (17%) of the curbside consultations, 3 to 5 questions during 26/47 (55%) consultations, and more than 5 questions during 13/47 (28%). Based on the information received during the curbside consultations, the hospitalists thought that the curbside consultations were insufficient for 18/47 (38%) of patients. In all instances, the opinions of the 2 hospitalists concurred with respect to this conclusion, and the independent reviewer agreed with this assessment in 17 of these 18 (94%).
The advice rendered in the formal consultations differed from that provided in 26/47 (55%) of the curbside consultations, and the formal consultation was thought to have changed management for 28/47 (60%) of patients (Table 2). The independent reviewer thought that the advice provided in the formal consultations changed management in 29/47 (62%) of the cases, and in 24/28 cases (86%) where the hospitalist felt that the formal consult changed management.
| Curbside Consultations, N (%) | |||
|---|---|---|---|
| Total | Accurate and Complete | Inaccurate or Incomplete | |
| 47 (100) | 23 (49) | 24 (51) | |
| |||
| Advice in formal consultation differed from advice in curbside consultation | 26 (55) | 7 (30) | 19 (79)* |
| Formal consultation changed management | 28 (60) | 6 (26) | 22 (92) |
| Minor change | 18 (64) | 6 (100) | 12 (55) |
| Major change | 10 (36) | 0 (0) | 10 (45) |
| Curbside consultation insufficient | 18 (38) | 2 (9) | 16 (67) |
Information was felt to be inaccurate or incomplete in 24/47 (51%) of the curbside consultations (13/47 inaccurate, 16/47 incomplete, 5/47 both inaccurate and incomplete), and when inaccurate or incomplete information was obtained, the advice given in the formal consultations more commonly differed from that provided in the curbside consultation (19/24, 79% vs 7/23, 30%; P < 0.001), and was more commonly felt to change management (22/24, 92% vs 6/23, 26%; P < 0.0001) (Table 2). No association was found between whether the curbside consultation contained complete or accurate information and the consulting service from which the curbside originated, the consulting provider, the consultative aspect(s) or medical issue(s) addressed, the number of questions asked by the hospitalist during the curbside consultation, nor whether the hospitalists felt that a formal consultation was needed.
DISCUSSION
The important findings of this study are that (a) the recommendations made by hospitalists in curbside versus formal consultations on the same patient frequently differ, (b) these differences frequently result in changes in clinical management, (c) the information presented in curbside consultations by providers is frequently inaccurate or incomplete, regardless of the providers specialty or seniority, (d) when inaccurate or incomplete information is received, the recommendations made in curbside and formal consultations differ more frequently, and (e) we found no way to predict whether the information provided in a curbside consultation was likely to be inaccurate or incomplete.
Our hospitalists thought that 38% of the curbside consultations they received should have had formal consultations. Manian and McKinsey7 reported that as many as 53% of questions asked of infectious disease consultants were thought to be too complex to be addressed in an informal consultation. Others, however, report that only 11%33% of curbside consultations were thought to require formal consultation.1, 9, 10, 16 Our hospitalists asked 3 or more questions of the consulting providers in more than 80% of the curbside consultations, suggesting that the curbside consultations we received might have had a higher complexity than those seen by others.
Our finding that information provided in curbside consultation was frequently inaccurate or incomplete is consistent with a number of previous studies reporting physicians' perceptions of the accuracy of curbside consultations.2, 3 Hospital medicine is not likely to be the only discipline affected by inaccurate curbside consultation practices, as surveys of specialists in infectious disease, gynecology, and neurosurgery report that practitioners in these disciplines have similar concerns.1, 10, 14 In a survey returned by 34 physicians, Myers1 found that 50% thought the information exchanged during curbside consultations was inaccurate, leading him to conclude that inaccuracies presented during curbside consultations required further study.
We found no way of predicting whether curbside consultations were likely to include inaccurate or incomplete information. This observation is consistent with the results of Bergus et al16 who found that the frequency of curbside consultations being converted to formal consultations was independent of the training status of the consulting physician, and with the data of Myers1 who found no way of predicting the likelihood that a curbside consultation should be converted to a formal consultation.
We found that formal consultations resulted in management changes more often than differences in recommendations (ie, 60% vs 55%, respectively). This small difference occurred because, on occasion, the formal consultations found issues to address other than the one(s) for which the curbside consultation was requested. In the majority of these instances, the management changes were minor and the curbside consultation was still felt to be sufficient.
In some instances, the advice given after the curbside and the formal consultations differed to only a minor extent (eg, varying recommendations for oral diabetes management). In other instances, however, the advice differed substantially (eg, change in antibiotic management in a septic patient with a multidrug resistant organism, when the original curbside question was for when to order a follow‐up chest roentgenogram for hypoxia; see Supporting Information, Appendix, in the online version of this article). In 26 patients (55%), formal consultation resulted in different medications being started or stopped, additional tests being performed, or different decisions being made about admission versus discharge.
Our study has a number of strengths. First, while a number of reports document that physicians' perceptions are that curbside consultations frequently contain errors,2, 3, 5, 12 to our knowledge this is the first study that prospectively compared the information collected and advice given in curbside versus formal consultation. Second, while this study was conducted as a quality improvement project, thereby requiring us to conclude that the results are not generalizable, the data presented were collected by 18 different hospitalists, reducing the potential of bias from an individual provider's knowledge base or practice. Third, there was excellent agreement between the independent reviewer and the 2 hospitalists who performed the curbside and formal consultations regarding whether a curbside consultation would have been sufficient, and whether the formal consultation changed patient management. Fourth, the study was conducted over a 1‐year period, which should have reduced potential bias arising from the increasing experience of residents requesting consultations as their training progressed.
Our study has several limitations. First, the number of curbside consultations we received during the study period (50 over 215 days) was lower than anticipated, and lower than the rates of consultation reported by others.1, 7, 9 This likely relates to the fact that, prior to beginning the study, Denver Health hospitalists already provided mandatory consultations for several surgical services (thereby reducing the number of curbside consultations received from these services), because curbside consultations received during evenings, nights, and weekends were not included in the study for reasons of convenience, and because we excluded all administrative curbside consultations. Our hospitalist service also provides consultative services 24 hours a day, thereby reducing the number of consultations received during daytime hours. Second, the frequency with which curbside consultations included inaccurate or incomplete information might be higher than what occurs in other hospitals, as Denver Health is an urban, university‐affiliated public hospital and the patients encountered may be more complex and trainees may be less adept at recognizing the information that would facilitate accurate curbside consultations (although we found no difference in the frequency with which inaccurate or incomplete information was provided as a function of the seniority of the requesting physician). Third, the disparity between curbside and formal consultations that we observed could have been biased by the Hawthorne effect. We attempted to address this by not providing the hospitalists who did the formal consultation with any information collected by the hospitalist involved with the curbside consultation, and by comparing the conclusions reached by the hospitalists performing the curbside and formal consultations with those of a third party reviewer. Fourth, while we found no association between the frequency of curbside consultations in which information was inaccurate or incomplete and the consulting service, there could be a selection bias of the consulting service requesting the curbside consultations as a result of the mandatory consultations already provided by our hospitalists. Finally, our study was not designed or adequately powered to determine why curbside consultations frequently have inaccurate or incomplete information.
In summary, we found that the information provided to hospitalists during a curbside consultation was often inaccurate and incomplete, and that these problems with information exchange adversely affected the accuracy of the resulting recommendations. While there are a number of advantages to curbside consultations,1, 3, 7, 10, 12, 13 our findings indicate that the risk associated with this practice is substantial.
Acknowledgements
Disclosure: Nothing to report.
- .Curbside consultation in infectious diseases: a prospective study.J Infect Dis.1984;150:797–802.
- ,,.Physicians' experiences and beliefs regarding informal consultation.JAMA.1998;280:900–904.
- ,,.Curbside consultation practices and attitudes among primary care physicians and medical subspecialists.JAMA.1998;280:905–909.
- ,,,,,.The complexity, relative value, and financial worth of curbside consultations in an academic infectious diseases unit.Clin Infect Dis.2010;51:651–655.
- ,.Curbside consultations. A closer look at a common practice.JAMA.1996;275:145–147.
- ,,,.Informal advice‐ and information‐seeking between physicians.J Med Educ.1981;56;174–180.
- ,.A prospective study of 2,092 “curbside” questions asked of two infectious disease consultants in private practice in the midwest.Clin Infect Dis.1996;22:303–307.
- ,,,,.Curbside consultation in endocrine practice: a prospective observational study.Endocrinologist.1996;6:328–331.
- ,,.Informal consultations provided to general internists by the gastroenterology department of an HMO.J Gen Intern Med.1998;13:435–438.
- .“Curbside” consultations in gynecologic oncology: a closer look at a common practice.Gynecol Oncol.1999;74:456–459.
- ,,, et al.Informal consultations in infectious diseases and clinical microbiology practice.Clin Microbiol Infect.2003;9:724–726.
- .Curbside consultations and the viaduct effect.JAMA.1998;280:929–930.
- .What do we really need to know about consultation and referral?J Gen Intern Med.1998;13:497–498.
- ,.Telephone advice for neurosurgical referrals. Who assumes duty of care?Br J Neurosurg.2001;15:453–455.
- ,.Malpractice liability for informal consultations.Fam Med.2003;35:476–481.
- ,,,.Does the structure of clinical questions affect the outcome of curbside consultations with specialty colleagues?Arch Fam Med.2000;9:541–547.
A curbside consultation is an informal process whereby a consultant is asked to provide information or advice about a patient's care without doing a formal assessment of the patient.14 Curbside consultations are common in the practice of medicine2, 3, 5 and are frequently requested by physicians caring for hospitalized patients. Several surveys have documented the quantity of curbside consultations requested of various subspecialties, the types of questions asked, the time it takes to respond, and physicians' perceptions about the quality of the information exchanged.111 While curbside consultations have a number of advantages, physicians' perceptions are that the information conveyed may be inaccurate or incomplete and that the advice offered may be erroneous.13, 5, 10, 12, 13
Cartmill and White14 performed a random audit of 10% of the telephone referrals they received for neurosurgical consultation over a 1‐year period and noted discrepancies between the Glascow Coma Scores reported during the telephone referrals and those noted in the medical records, but the frequency of these discrepancies was not reported. To our knowledge, no studies have compared the quality of the information provided in curbside consultations with that obtained in formal consultations that included direct face‐to‐face patient evaluations and primary data collection, and whether the advice provided in curbside and formal consultations on the same patient differed.
We performed a prospective cohort study to compare the information received by hospitalists during curbside consultations on hospitalized patients, with that obtained from formal consultations done the same day on the same patients, by different hospitalists who were unaware of any details regarding the curbside consultation. We also compared the advice provided by the 2 hospitalists following their curbside and formal consultations. Our hypotheses were that the information received during curbside consultations was frequently inaccurate or incomplete, that the recommendations made after the formal consultation would frequently differ from those made in the curbside consultation, and that these differences would have important implications on patient care.
METHODS
This was a quality improvement study conducted at Denver Health, a 500‐bed university‐affiliated urban safety net hospital from January 10, 2011 to January 9, 2012. The study design was a prospective cohort that included all curbside consultations on hospitalized patients received between 7 AM and 3 PM, on intermittently selected weekdays, by the Internal Medicine Consultation Service that was staffed by 18 hospitalists. Data were collected intermittently based upon hospitalist availability and was done to limit potential alterations in the consulting practices of the providers requesting consultations.
Consultations were defined as being curbside when the consulting provider asked for advice, suggestions, or opinions about a patient's care but did not ask the hospitalist to see the patient.15, 15 Consultations pertaining to administrative issues (eg, whether a patient should be admitted to an intensive care bed as opposed to an acute care floor bed) or on patients who were already being followed by a hospitalist were excluded.
The hospitalist receiving the curbside consultation was allowed to ask questions as they normally would, but could not verify the accuracy of the information received (eg, could not review any portion of the patient's medical record, such as notes or lab data). A standardized data collection sheet was used to record the service and level of training of the requesting provider, the medical issue(s) of concern, all clinical data offered by the provider, the number of questions asked by the hospitalist of the provider, and whether, on the basis of the information provided, the hospitalist felt that the question(s) being asked was (were) of sufficient complexity that a formal consultation should occur. The hospitalist then offered advice based upon the information given during the curbside consultation.
After completing the curbside consultation, the hospitalist requested verbal permission from the requesting provider to perform a formal consultation. If the request was approved, the hospitalist performing the curbside consultation contacted a different hospitalist who performed the formal consultation within the next few hours. The only information given to the second hospitalist was the patient's identifiers and the clinical question(s) being asked. The formal consultation included a complete face‐to‐face history and physical examination, a review of the patient's medical record, documentation of the provider's findings, and recommendations for care.
Upon completion of the formal consultation, the hospitalists who performed the curbside and the formal consultations met to review the advice each gave to the requesting provider and the information on which this advice was based. The 2 hospitalists jointly determined the following: (a) whether the information received during the curbside consultation was correct and complete, (b) whether the advice provided in the formal consultation differed from that provided in the curbside consultation, (c) whether the advice provided in the formal consultation dealt with issues other than one(s) leading to the curbside consultation, (d) whether differences in the recommendations given in the curbside versus the formal consultation changed patient management in a meaningful way, and (e) whether the curbside consultation alone was felt to be sufficient.
Information obtained by the hospitalist performing the formal consultation that was different from, or not included in, the information recorded during the curbside consultation was considered to be incorrect or incomplete, respectively. A change in management was defined as an alteration in the direction or type of care that the patient would have received as a result of the advice being given. A pulmonary and critical care physician, with >35 years of experience in inpatient medicine, reviewed the information provided in the curbside and formal consultations, and independently assessed whether the curbside consultation alone would have been sufficient and whether the formal consultation changed management.
Curbside consultations were neither solicited nor discouraged during the course of the study. The provider requesting the curbside consultation was not informed or debriefed about the study in an attempt to avoid affecting future consultation practices from that provider or service.
Associations were sought between the frequency of inaccurate or incomplete data and the requesting service and provider, the consultative category and medical issue, the number of questions asked by the hospitalist during the curbside consultation, and whether the hospitalist doing the curbside consultation thought that formal consultation was needed. A chi‐square test was used to analyze all associations. A P value of <0.05 was considered significant. All analyses were performed using SAS Enterprise Guide 4.3 (SAS Institute, Inc, Cary, NC) software. The study was approved by the Colorado Multiple Institutional Review Board.
RESULTS
Fifty curbside consultations were requested on a total of 215 study days. The requesting service declined formal consultation in 3 instances, leaving 47 curbside consultations that had a formal consultation. Curbside consultations came from a variety of services and providers, and addressed a variety of issues and concerns (Table 1).
| Curbside Consultations, N (%) | |
|---|---|
| 47 (100) | |
| |
| Requesting service | |
| Psychiatry | 21 (45) |
| Emergency Department | 9 (19) |
| Obstetrics/Gynecology | 5 (11) |
| Neurology | 4 (8) |
| Other (Orthopedics, Anesthesia, General Surgery, Neurosurgery, and Interventional Radiology) | 8 (17) |
| Requesting provider | |
| Resident | 25 (53) |
| Intern | 8 (17) |
| Attending | 9 (19) |
| Other | 5 (11) |
| Consultative issue* | |
| Diagnosis | 10 (21) |
| Treatment | 29 (62) |
| Evaluation | 20 (43) |
| Discharge | 13 (28) |
| Lab interpretation | 4 (9) |
| Medical concern* | |
| Cardiac | 27 (57) |
| Endocrine | 17 (36) |
| Infectious disease | 9 (19) |
| Pulmonary | 8 (17) |
| Gastroenterology | 6 (13) |
| Fluid and electrolyte | 6 (13) |
| Others | 23 (49) |
The hospitalists asked 0 to 2 questions during 8/47 (17%) of the curbside consultations, 3 to 5 questions during 26/47 (55%) consultations, and more than 5 questions during 13/47 (28%). Based on the information received during the curbside consultations, the hospitalists thought that the curbside consultations were insufficient for 18/47 (38%) of patients. In all instances, the opinions of the 2 hospitalists concurred with respect to this conclusion, and the independent reviewer agreed with this assessment in 17 of these 18 (94%).
The advice rendered in the formal consultations differed from that provided in 26/47 (55%) of the curbside consultations, and the formal consultation was thought to have changed management for 28/47 (60%) of patients (Table 2). The independent reviewer thought that the advice provided in the formal consultations changed management in 29/47 (62%) of the cases, and in 24/28 cases (86%) where the hospitalist felt that the formal consult changed management.
| Curbside Consultations, N (%) | |||
|---|---|---|---|
| Total | Accurate and Complete | Inaccurate or Incomplete | |
| 47 (100) | 23 (49) | 24 (51) | |
| |||
| Advice in formal consultation differed from advice in curbside consultation | 26 (55) | 7 (30) | 19 (79)* |
| Formal consultation changed management | 28 (60) | 6 (26) | 22 (92) |
| Minor change | 18 (64) | 6 (100) | 12 (55) |
| Major change | 10 (36) | 0 (0) | 10 (45) |
| Curbside consultation insufficient | 18 (38) | 2 (9) | 16 (67) |
Information was felt to be inaccurate or incomplete in 24/47 (51%) of the curbside consultations (13/47 inaccurate, 16/47 incomplete, 5/47 both inaccurate and incomplete), and when inaccurate or incomplete information was obtained, the advice given in the formal consultations more commonly differed from that provided in the curbside consultation (19/24, 79% vs 7/23, 30%; P < 0.001), and was more commonly felt to change management (22/24, 92% vs 6/23, 26%; P < 0.0001) (Table 2). No association was found between whether the curbside consultation contained complete or accurate information and the consulting service from which the curbside originated, the consulting provider, the consultative aspect(s) or medical issue(s) addressed, the number of questions asked by the hospitalist during the curbside consultation, nor whether the hospitalists felt that a formal consultation was needed.
DISCUSSION
The important findings of this study are that (a) the recommendations made by hospitalists in curbside versus formal consultations on the same patient frequently differ, (b) these differences frequently result in changes in clinical management, (c) the information presented in curbside consultations by providers is frequently inaccurate or incomplete, regardless of the providers specialty or seniority, (d) when inaccurate or incomplete information is received, the recommendations made in curbside and formal consultations differ more frequently, and (e) we found no way to predict whether the information provided in a curbside consultation was likely to be inaccurate or incomplete.
Our hospitalists thought that 38% of the curbside consultations they received should have had formal consultations. Manian and McKinsey7 reported that as many as 53% of questions asked of infectious disease consultants were thought to be too complex to be addressed in an informal consultation. Others, however, report that only 11%33% of curbside consultations were thought to require formal consultation.1, 9, 10, 16 Our hospitalists asked 3 or more questions of the consulting providers in more than 80% of the curbside consultations, suggesting that the curbside consultations we received might have had a higher complexity than those seen by others.
Our finding that information provided in curbside consultation was frequently inaccurate or incomplete is consistent with a number of previous studies reporting physicians' perceptions of the accuracy of curbside consultations.2, 3 Hospital medicine is not likely to be the only discipline affected by inaccurate curbside consultation practices, as surveys of specialists in infectious disease, gynecology, and neurosurgery report that practitioners in these disciplines have similar concerns.1, 10, 14 In a survey returned by 34 physicians, Myers1 found that 50% thought the information exchanged during curbside consultations was inaccurate, leading him to conclude that inaccuracies presented during curbside consultations required further study.
We found no way of predicting whether curbside consultations were likely to include inaccurate or incomplete information. This observation is consistent with the results of Bergus et al16 who found that the frequency of curbside consultations being converted to formal consultations was independent of the training status of the consulting physician, and with the data of Myers1 who found no way of predicting the likelihood that a curbside consultation should be converted to a formal consultation.
We found that formal consultations resulted in management changes more often than differences in recommendations (ie, 60% vs 55%, respectively). This small difference occurred because, on occasion, the formal consultations found issues to address other than the one(s) for which the curbside consultation was requested. In the majority of these instances, the management changes were minor and the curbside consultation was still felt to be sufficient.
In some instances, the advice given after the curbside and the formal consultations differed to only a minor extent (eg, varying recommendations for oral diabetes management). In other instances, however, the advice differed substantially (eg, change in antibiotic management in a septic patient with a multidrug resistant organism, when the original curbside question was for when to order a follow‐up chest roentgenogram for hypoxia; see Supporting Information, Appendix, in the online version of this article). In 26 patients (55%), formal consultation resulted in different medications being started or stopped, additional tests being performed, or different decisions being made about admission versus discharge.
Our study has a number of strengths. First, while a number of reports document that physicians' perceptions are that curbside consultations frequently contain errors,2, 3, 5, 12 to our knowledge this is the first study that prospectively compared the information collected and advice given in curbside versus formal consultation. Second, while this study was conducted as a quality improvement project, thereby requiring us to conclude that the results are not generalizable, the data presented were collected by 18 different hospitalists, reducing the potential of bias from an individual provider's knowledge base or practice. Third, there was excellent agreement between the independent reviewer and the 2 hospitalists who performed the curbside and formal consultations regarding whether a curbside consultation would have been sufficient, and whether the formal consultation changed patient management. Fourth, the study was conducted over a 1‐year period, which should have reduced potential bias arising from the increasing experience of residents requesting consultations as their training progressed.
Our study has several limitations. First, the number of curbside consultations we received during the study period (50 over 215 days) was lower than anticipated, and lower than the rates of consultation reported by others.1, 7, 9 This likely relates to the fact that, prior to beginning the study, Denver Health hospitalists already provided mandatory consultations for several surgical services (thereby reducing the number of curbside consultations received from these services), because curbside consultations received during evenings, nights, and weekends were not included in the study for reasons of convenience, and because we excluded all administrative curbside consultations. Our hospitalist service also provides consultative services 24 hours a day, thereby reducing the number of consultations received during daytime hours. Second, the frequency with which curbside consultations included inaccurate or incomplete information might be higher than what occurs in other hospitals, as Denver Health is an urban, university‐affiliated public hospital and the patients encountered may be more complex and trainees may be less adept at recognizing the information that would facilitate accurate curbside consultations (although we found no difference in the frequency with which inaccurate or incomplete information was provided as a function of the seniority of the requesting physician). Third, the disparity between curbside and formal consultations that we observed could have been biased by the Hawthorne effect. We attempted to address this by not providing the hospitalists who did the formal consultation with any information collected by the hospitalist involved with the curbside consultation, and by comparing the conclusions reached by the hospitalists performing the curbside and formal consultations with those of a third party reviewer. Fourth, while we found no association between the frequency of curbside consultations in which information was inaccurate or incomplete and the consulting service, there could be a selection bias of the consulting service requesting the curbside consultations as a result of the mandatory consultations already provided by our hospitalists. Finally, our study was not designed or adequately powered to determine why curbside consultations frequently have inaccurate or incomplete information.
In summary, we found that the information provided to hospitalists during a curbside consultation was often inaccurate and incomplete, and that these problems with information exchange adversely affected the accuracy of the resulting recommendations. While there are a number of advantages to curbside consultations,1, 3, 7, 10, 12, 13 our findings indicate that the risk associated with this practice is substantial.
Acknowledgements
Disclosure: Nothing to report.
- .Curbside consultation in infectious diseases: a prospective study.J Infect Dis.1984;150:797–802.
- ,,.Physicians' experiences and beliefs regarding informal consultation.JAMA.1998;280:900–904.
- ,,.Curbside consultation practices and attitudes among primary care physicians and medical subspecialists.JAMA.1998;280:905–909.
- ,,,,,.The complexity, relative value, and financial worth of curbside consultations in an academic infectious diseases unit.Clin Infect Dis.2010;51:651–655.
- ,.Curbside consultations. A closer look at a common practice.JAMA.1996;275:145–147.
- ,,,.Informal advice‐ and information‐seeking between physicians.J Med Educ.1981;56;174–180.
- ,.A prospective study of 2,092 “curbside” questions asked of two infectious disease consultants in private practice in the midwest.Clin Infect Dis.1996;22:303–307.
- ,,,,.Curbside consultation in endocrine practice: a prospective observational study.Endocrinologist.1996;6:328–331.
- ,,.Informal consultations provided to general internists by the gastroenterology department of an HMO.J Gen Intern Med.1998;13:435–438.
- .“Curbside” consultations in gynecologic oncology: a closer look at a common practice.Gynecol Oncol.1999;74:456–459.
- ,,, et al.Informal consultations in infectious diseases and clinical microbiology practice.Clin Microbiol Infect.2003;9:724–726.
- .Curbside consultations and the viaduct effect.JAMA.1998;280:929–930.
- .What do we really need to know about consultation and referral?J Gen Intern Med.1998;13:497–498.
- ,.Telephone advice for neurosurgical referrals. Who assumes duty of care?Br J Neurosurg.2001;15:453–455.
- ,.Malpractice liability for informal consultations.Fam Med.2003;35:476–481.
- ,,,.Does the structure of clinical questions affect the outcome of curbside consultations with specialty colleagues?Arch Fam Med.2000;9:541–547.
Copyright © 2012 Society of Hospital Medicine
Inappropriate Prescribing of PPIs
Proton pump inhibitors (PPIs) are the third most commonly prescribed class of medication in the United States, with $13.6 billion in yearly sales.1 Despite their effectiveness in treating acid reflux2 and their mortality benefit in the treatment of patients with gastrointestinal bleeding,3 recent literature has identified a number of risks associated with PPIs, including an increased incidence of Clostridium difficile infection,4 decreased effectiveness of clopidogrel in patients with acute coronary syndrome,5 increased risk of community‐ and hospital‐acquired pneumonia, and an increased risk of hip fracture.69 Additionally, in March of 2011, the US Food and Drug Administration (FDA) issued a warning regarding the potential for PPIs to cause low magnesium levels which can, in turn, cause muscle spasms, an irregular heartbeat, and convulsions.10
Inappropriate PPI prescription practice has been demonstrated in the primary care setting,11 as well as in small studies conducted in the hospital setting.1216 We hypothesized that many hospitalized patients receive these medications without having an accepted indication, and examined 2 populations of hospitalized patients, including administrative data from 6.5 million discharges from US university hospitals, to look for appropriate diagnoses justifying their use.
METHODS
We performed a retrospective review of administrative data collected between January 1, 2008 and December 31, 2009 from 2 patient populations: (a) those discharged from Denver Health (DH), a university‐affiliated public safety net hospital in Denver, CO; and (b) patients discharged from 112 academic health centers and 256 of their affiliated hospitals that participate in the University HealthSystem Consortium (UHC). The Colorado Multiple Institution Review Board reviewed and approved the conduct of this study.
Inclusion criteria for both populations were age >18 or <90 years, and hospitalization on a Medicine service. Prisoners and women known to be pregnant were excluded. In both cohorts, if patients had more than 1 admission during the 2‐year study period, only data from the first admission were used.
We recorded demographics, admitting diagnosis, and discharge diagnoses together with information pertaining to the name, route, and duration of administration of all PPIs (ie, omeprazole, lansoprazole, esomeprazole, pantoprazole, rabeprazole). We created a broadly inclusive set of valid indications for PPIs by incorporating diagnoses that could be identified by International Classification of Diseases, Ninth Revision.
(ICD‐9) codes from a number of previously published sources including the National Institute of Clinical Excellence (NICE) guidelines issued by the National Health Service (NHS) of the United Kingdom in 200012, 1721 (Table 1).
| Indication | ICD‐9 Code |
|---|---|
| |
| Helicobacter pylori | 041.86 |
| Abnormality of secretion of gastrin | 251.5 |
| Esophageal varices with bleeding | 456.0 |
| Esophageal varices without mention of bleeding | 456.1 |
| Esophageal varices in diseases classified elsewhere | 456.2 |
| Esophagitis | 530.10530.19 |
| Perforation of esophagus | 530.4 |
| Gastroesophageal laceration‐hemorrhage syndrome | 530.7 |
| Esophageal reflux | 530.81 |
| Barrett's esophagus | 530.85 |
| Gastric ulcer | 531.0031.91 |
| Duodenal ulcer | 532.00532.91 |
| Peptic ulcer, site unspecified | 533.00533.91 |
| Gastritis and duodenitis | 535.00535.71 |
| Gastroparesis | 536.3 |
| Dyspepsia and other specified disorders of function of stomach | 536.8 |
| Hemorrhage of gastrointestinal tract, unspecified | 578.9 |
To assess the accuracy of the administrative data from DH, we also reviewed the Emergency Department histories, admission histories, progress notes, electronic pharmacy records, endoscopy reports, and discharge summaries of 123 patients randomly selected (ie, a 5% sample) from the group of patients identified by administrative data to have received a PPI without a valid indication, looking for any accepted indication that might have been missed in the administrative data.
All analyses were performed using SAS Enterprise Guide 4.1 (SAS Institute, Cary, NC). A Student t test was used to compare continuous variables and a chi‐square test was used to compare categorical variables. Bonferroni corrections were used for multiple comparisons, such that P values less than 0.01 were considered to be significant for categorical variables.
RESULTS
Inclusion criteria were met by 9875 patients in the Denver Health database and 6,592,100 patients in the UHC database. The demographics and primary discharge diagnoses for these patients are summarized in Table 2.
| DH (N = 9875) | UHC (N = 6,592,100) | ||||
|---|---|---|---|---|---|
| Received a PPI | No PPI | Received a PPI | No PPI | ||
| |||||
| No. (%) | 3962 (40) | 5913 (60) | 918,474 (14) | 5,673,626 (86) | |
| Age (mean SD) | 53 15 | 51 16 | 59 17 | 55 18 | |
| Gender (% male) | 2197 (55) | 3438 (58) | 464,552 (51) | 2,882,577 (51) | |
| Race (% white) | 1610 (41) | 2425 (41) | 619,571 (67) | 3,670,450 (65) | |
| Top 5 primary discharge diagnoses | |||||
| Chest pain | 229 (6) | 462 (8) | Coronary atherosclerosis | 35,470 (4) | 186,321 (3) |
| Alcohol withdrawal | 147 (4) | 174 (3) | Acute myocardial infarction | 26,507 (3) | 132,159 (2) |
| Pneumonia, organism unspecified | 142 (4) | 262 (4) | Heart failure | 21,143 (2) | 103,751 (2) |
| Acute pancreatitis | 132 (3) | 106 (2) | Septicemia | 20,345 (2) | 64,915 (1) |
| Obstructive chronic bronchitis with (acute) exacerbation | 89 (2) | 154 (3) | Chest pain | 16,936 (2) | 107,497 (2) |
Only 39% and 27% of the patients in the DH and UHC databases, respectively, had a valid indication for PPIs on the basis of discharge diagnoses (Table 3). In the DH data, if admission ICD‐9 codes were also inspected for valid PPI indications, 1579 (40%) of patients receiving PPIs had a valid indication (admission ICD‐9 codes were not available for patients in the UHC database). Thirty‐one percent of Denver Health patients spent time in the intensive care unit (ICU) during their hospital stay and 65% of those patients received a PPI without a valid indication, as compared to 59% of patients who remained on the General Medicine ward (Table 3).
| DH (N = 9875) | UHC (N = 6,592,100) | |
|---|---|---|
| ||
| Patients receiving PPIs (% of total) | 3962 (40) | 918,474 (14) |
| Any ICU stay, N (% of all patients) | 1238 (31) | |
| General Medicine ward only, N (% of all patients) | 2724 (69) | |
| Patients with indication for PPI (% of all patients receiving PPIs)* | 1540 (39) | 247,142 (27) |
| Any ICU stay, N (% of all ICU patients) | 434 (35) | |
| General Medicine ward only, N (% of all ward patients) | 1106 (41) | |
| Patients without indication for PPI (% of those receiving PPIs)* | 2422 (61) | 671,332 (73) |
| Any ICU stay, N (% of all ICU patients) | 804 (65) | |
| General Medicine ward only, N (% of all ward patients) | 1618 (59) | |
Higher rates of concurrent C. difficile infections were observed in patients receiving PPIs in both databases; a higher rate of concurrent diagnosis of pneumonia was seen in patients receiving PPIs in the UHC population, with a nonsignificant trend towards the same finding in DH patients (Table 4).
| Denver Health | UHC | |||||
|---|---|---|---|---|---|---|
| Concurrent diagnosis | (+) PPI 3962 | () PPI 5913 | P | (+) PPI 918,474 | () PPI 5,673,626 | P |
| ||||||
| C. difficile | 46 (1.16) | 26 (0.44) | <0.0001 | 12,113 (1.32) | 175 (0.0031) | <0.0001 |
| Pneumonia | 400 (10.1) | 517 (8.7) | 0.0232 | 75,274 (8.2) | 300,557 (5.3) | <0.0001 |
Chart review in the DH population found valid indications for PPIs in 19% of patients who were thought not have a valid indication on the basis of the administrative data (Table 5). For 56% of those in whom no valid indication was confirmed, physicians identified prophylaxis as the justification.
| Characteristic | N (%) |
|---|---|
| |
| Valid indication found on chart review only | 23 (19) |
| No valid indication after chart review | 100 (81) |
| Written indication: prophylaxis | 56 (56) |
| No written documentation of indication present in the chart | 33 (33) |
| Written indication: continue home medication | 9 (9) |
| Intubated with or without written indication of prophylaxis | 16 (16) |
DISCUSSION
The important finding of this study was that the majority of patients in 2 large groups of Medicine patients hospitalized in university‐affiliated hospitals received PPIs without having a valid indication. To our knowledge, the more than 900,000 UHC patients who received a PPI during their hospitalization represent the largest inpatient population evaluated for appropriateness of PPI prescriptions.
Our finding that 41% of the patients admitted to the DH Medicine service received a PPI during their hospital stay is similar to what has been observed by others.9, 14, 22 The rate of PPI prescription was lower in the UHC population (14%) for unclear reasons. By our definition, 61% lacked an adequate diagnosis to justify the prescription of the PPI. After performing a chart review on a randomly selected 5% of these records, we found that the DH administrative database had failed to identify 19% of patients who had a valid indication for receiving a PPI. Adjusting the administrative data accordingly still resulted in 50% of DH patients not having a valid indication for receiving a PPI. This is consistent with the 54% recorded by Batuwitage and colleagues11 in the outpatient setting by direct chart review, as well as a range of 60%‐75% for hospitalized patients in other studies.12, 13, 15, 23, 24
Stomach acidity is believed to provide an important host defense against lower gastrointestinal tract infections including Salmonella, Campylobacter, and Clostridium difficile.25 A recent study by Howell et al26 showed a doseresponse effect between PPI use and C. difficile infection, supporting a causal connection between loss of stomach acidity and development of Clostridium difficile‐associated diarrhea (CDAD). We found that C. difficile infection was more common in both populations of patients receiving PPIs (although the relative risk was much higher in the UHC database) (Table 5). The rate of CDAD in DH patients who received PPIs was 2.6 times higher than in patients who did not receive these acid suppressive agents.
The role of acid suppression in increasing risk for community‐acquired pneumonia is not entirely clear. Theories regarding the loss of an important host defense and bacterial proliferation head the list.6, 8, 27 Gastric and duodenal bacterial overgrowth is significantly more common in patients receiving PPIs than in patients receiving histamine type‐2 (H2) blockers.28 Previous studies have identified an increased rate of hospital‐acquired pneumonia and recurrent community‐acquired pneumonia27 in patients receiving any form of acid suppression therapy, but the risk appears to be greater in patients receiving PPIs than in those receiving H2 receptor antagonists (H2RAs).9 Significantly more patients in the UHC population who were taking PPIs had a concurrent diagnosis of pneumonia, consistent with previous studies alerting to this association6, 8, 9, 27 and consistent with the nonsignificant trend observed in the DH population.
Our study has a number of limitations. Our database comes from a single university‐affiliated public hospital with residents and hospitalists writing orders for all medications. The hospitals in the UHC are also teaching hospitals. Accordingly, our results might not generalize to other settings or reflect prescribing patterns in private, nonteaching hospital environments. Because our study was retrospective, we could not confirm the decision‐making process supporting the prescription of PPIs. Similarly, we could not temporarily relate the existence of the indication with the time the PPI was prescribed. Our list of appropriate indications for prescribing PPIs was developed by reviewing a number of references, and other studies have used slightly different lists (albeit the more commonly recognized indications are the same), but it may be argued that the list either includes or misses diagnoses in error.
While there is considerable debate about the use of PPIs for stress ulcer prophylaxis,29 we specifically chose not to include this as one of our valid indications for PPIs for 4 reasons. First, the American Society of Health‐System Pharmacists (ASHP) Report does not recommend prophylaxis for non‐ICU patients, and only recommends prophylaxis for those ICU patients with a coagulopathy, those requiring mechanical ventilation for more than 48 hours, those with a history of gastrointestinal ulceration or bleeding in the year prior to admission, and those with 2 or more of the following indications: sepsis, ICU stay >1 week, occult bleeding lasting 6 or more days, receiving high‐dose corticosteroids, and selected surgical situations.30 At the time the guideline was written, the authors note that there was insufficient data on PPIs to make any recommendations on their use, but no subsequent guidelines have been issued.30 Second, a review by Mohebbi and Hesch published in 2009, and a meta‐analysis by Lin and colleagues published in 2010, summarize subsequent randomized trials that suggest that PPIs and H2 blockers are, at best, similarly effective at preventing upper gastrointestinal (GI) bleeding among critically ill patients.31, 32 Third, the NICE guidelines do not include stress ulcer prophylaxis as an appropriate indication for PPIs except in the prevention and treatment of NSAID [non‐steroidal anti‐inflammatory drug]‐associated ulcers.19 Finally, H2RAs are currently the only medications with an FDA‐approved indication for stress ulcer prophylaxis. We acknowledge that PPIs may be a reasonable and acceptable choice for stress ulcer prophylaxis in patients who meet indications, but we were unable to identify such patients in either of our administrative databases.
In our Denver Health population, only 31% of our patients spent any time in the intensive care unit, and only a fraction of these would have both an accepted indication for stress ulcer prophylaxis by the ASHP guidelines and an intolerance or contraindication to an H2RA or sulcralfate. While our administrative database lacked the detail necessary to identify this small group of patients, the number of patients who might have been misclassified as not having a valid PPI indication was likely very small. Similar to the findings of previous studies,15, 18, 23, 29 prophylaxis against gastrointestinal bleeding was the stated justification for prescribing the PPI in 56% of the DH patient charts reviewed. It is impossible for us to estimate the number of patients in our administrative database for whom stress ulcer prophylaxis was justified by existing guidelines, as it would be necessary to gather a number of specific clinical details for each patient including: 1) ICU stay; 2) presence of coagulopathy; 3) duration of mechanical ventilation; 4) presence of sepsis; 5) duration of ICU stay; 6) presence of occult bleeding for >6 days; and 7) use of high‐dose corticosteroids. This level of clinical detail would likely only be available through a prospective study design, as has been suggested by other authors.33 Further research into the use, safety, and effectiveness of PPIs specifically for stress ulcer prophylaxis is warranted.
In conclusion, we found that 73% of nearly 1 million Medicine patients discharged from academic medical centers received a PPI without a valid indication during their hospitalization. The implications of our findings are broad. PPIs are more expensive31 than H2RAs and there is increasing evidence that they have significant side effects. In both databases we examined, the rate of C. difficile infection was higher in patients receiving PPIs than others. The prescribing habits of physicians in these university hospital settings appear to be far out of line with published guidelines and evidence‐based practice. Reducing inappropriate prescribing of PPIs would be an important educational and quality assurance project in most institutions.
- IMS Health Web site. Available at: http://www.imshealth.com/deployedfiles/ims/Global/Content/Corporate/Press%20Room/Top‐line%20Market%20Data/2009%20Top‐line%20Market%20Data/Top%20Therapy%20Classes%20by%20U.S.Sales.pdf. Accessed May 1,2011.
- ,, , et al.Comparison of omeprazole and cimetidine in reflux oesophagitis: symptomatic, endoscopic, and histological evaluations.Gut.1990;31(9):968–972.
- ,,, et al.Omeprazole before endoscopy in patients with gastrointestinal bleeding.N Engl J Med.2007;356(16):1631–1640.
- ,,,.Use of gastric acid‐suppressive agents and the risk of community‐acquired Clostridium difficile‐associated disease.JAMA.2005;294(23):2989–2995.
- ,,, et al.Risk of adverse outcomes associated with concomitant use of clopidogrel and proton pump inhibitors following acute coronary syndrome.JAMA.2009;301(9):937–944.
- ,,,,,.Risk of community‐acquired pneumonia and use of gastric acid‐suppressive drugs.JAMA.2004;292(16):1955–1960.
- ,,,.Long‐term proton pump inhibitor therapy and risk of hip fracture.JAMA2006;296(24):2947–2953.
- ,,,,,.Use of proton pump inhibitors and the risk of community‐acquired pneumonia: a population‐based case‐control study.Arch Intern Med.2007;167(9):950–955.
- ,,,.Acid‐suppressive medication use and the risk for hospital‐acquired pneumonia.JAMA.2009;301(20):2120–2128.
- US Food and Drug Administration (FDA) Website. Available at: http://www.fda.gov/Safety/MedWatch/SafetyInformation/SafetyAlertsfor HumanMedicalProducts/ucm245275.htm. Accessed March 2,2011.
- ,,,.Inappropriate prescribing of proton pump inhibitors in primary care.Postgrad Med J.2007;83(975):66–68.
- ,.Stress ulcer prophylaxis in hospitalized patients not in intensive care units.Am J Health Syst Pharm.2007;64(13):1396–1400.
- ,,,.Predictors of inappropriate utilization of intravenous proton pump inhibitors.Aliment Pharmacol Ther.2007;25(5):609–615.
- ,,.Overuse of acid‐suppressive therapy in hospitalized patients.Am J Gastroenterol.2000;95(11):3118–3122.
- ,,,,,.Patterns and predictors of proton pump inhibitor overuse among academic and non‐academic hospitalists.Intern Med2010;49(23):2561–2568.
- ,,, et al.Hospital use of acid‐suppressive medications and its fall‐out on prescribing in general practice: a 1‐month survey.Aliment Pharmacol Ther.2003;17(12):1503–1506.
- ,,.Overuse and inappropriate prescribing of proton pump inhibitors in patients with Clostridium difficile‐associated disease.QJM.2008;101(6):445–448.
- ,,,.Acid suppressive therapy use on an inpatient internal medicine service.Ann Pharmacother.2006;40(7–8):1261–1266.
- National Institute of Clinical Excellence (NICE), National Health Service (NHS), Dyspepsia: Management of dyspepsia in adults in primary care. Web site. Available at: http://www.nice.org.uk/nicemedia/live/10950/29460/29460.pdf. Accessed May 1,2011.
- ,,.When should stress ulcer prophylaxis be used in the ICU?Curr Opin Crit Care.2009;15(2):139–143.
- ,.An evaluation of the use of proton pump inhibitors.Pharm World Sci2001;23(3):116–117.
- ,,.Overuse of proton pump inhibitors.J Clin Pharm Ther.2000;25(5):333–340.
- ,,,.Pattern of intravenous proton pump inhibitors use in ICU and non‐ICU setting: a prospective observational study.Saudi J Gastroenterol.2010;16(4):275–279.
- ,,, et al.Overuse of PPIs in patients at admission, during treatment, and at discharge in a tertiary Spanish hospital.Curr Clin Pharmacol.2010;5(4):288–297.
- ,,.Systematic review of the risk of enteric infection in patients taking acid suppression.Am J Gastroenterol.2007;102(9):2047–2056.
- ,,, et al.Iatrogenic gastric acid suppression and the risk of nosocomial Clostridium difficile infection.Arch Intern Med.2010;170(9):784–790.
- ,,,,.Recurrent community‐acquired pneumonia in patients starting acid‐suppressing drugs.Am J Med.2010;123(1):47–53.
- ,,, et al.Bacterial overgrowth during treatment with omeprazole compared with cimetidine: a prospective randomised double blind study.Gut.1996;39(1):54–59.
- ,,,.Why do physicians prescribe stress ulcer prophylaxis to general medicine patients?South Med J2010;103(11):1103–1110.
- ASHP therapeutic guidelines on stress ulcer prophylaxis.ASHP Commission on Therapeutics and approved by the ASHP Board of Directors on November 14, 1998.Am J Health Syst Pharm.1999;56(4):347–379.
- ,.Stress ulcer prophylaxis in the intensive care unit.Proc (Bayl Univ Med Cent).2009;22(4):373–376.
- ,,,,.The efficacy and safety of proton pump inhibitors vs histamine‐2 receptor antagonists for stress ulcer bleeding prophylaxis among critical care patients: a meta‐analysis.Crit Care Med.2010;38(4):1197–1205.
- ,,.Proton pump inhibitors for the prevention of stress‐related mucosal disease in critically‐ill patients: a meta‐analysis.J Med Assoc Thai.2009;92(5):632–637.
- ,,,.Proton pump inhibitors for prophylaxis of nosocomial upper gastrointestinal tract bleeding: effect of standardized guidelines on prescribing practice.Arch Intern Med.2010;170(9):779–783.
Proton pump inhibitors (PPIs) are the third most commonly prescribed class of medication in the United States, with $13.6 billion in yearly sales.1 Despite their effectiveness in treating acid reflux2 and their mortality benefit in the treatment of patients with gastrointestinal bleeding,3 recent literature has identified a number of risks associated with PPIs, including an increased incidence of Clostridium difficile infection,4 decreased effectiveness of clopidogrel in patients with acute coronary syndrome,5 increased risk of community‐ and hospital‐acquired pneumonia, and an increased risk of hip fracture.69 Additionally, in March of 2011, the US Food and Drug Administration (FDA) issued a warning regarding the potential for PPIs to cause low magnesium levels which can, in turn, cause muscle spasms, an irregular heartbeat, and convulsions.10
Inappropriate PPI prescription practice has been demonstrated in the primary care setting,11 as well as in small studies conducted in the hospital setting.1216 We hypothesized that many hospitalized patients receive these medications without having an accepted indication, and examined 2 populations of hospitalized patients, including administrative data from 6.5 million discharges from US university hospitals, to look for appropriate diagnoses justifying their use.
METHODS
We performed a retrospective review of administrative data collected between January 1, 2008 and December 31, 2009 from 2 patient populations: (a) those discharged from Denver Health (DH), a university‐affiliated public safety net hospital in Denver, CO; and (b) patients discharged from 112 academic health centers and 256 of their affiliated hospitals that participate in the University HealthSystem Consortium (UHC). The Colorado Multiple Institution Review Board reviewed and approved the conduct of this study.
Inclusion criteria for both populations were age >18 or <90 years, and hospitalization on a Medicine service. Prisoners and women known to be pregnant were excluded. In both cohorts, if patients had more than 1 admission during the 2‐year study period, only data from the first admission were used.
We recorded demographics, admitting diagnosis, and discharge diagnoses together with information pertaining to the name, route, and duration of administration of all PPIs (ie, omeprazole, lansoprazole, esomeprazole, pantoprazole, rabeprazole). We created a broadly inclusive set of valid indications for PPIs by incorporating diagnoses that could be identified by International Classification of Diseases, Ninth Revision.
(ICD‐9) codes from a number of previously published sources including the National Institute of Clinical Excellence (NICE) guidelines issued by the National Health Service (NHS) of the United Kingdom in 200012, 1721 (Table 1).
| Indication | ICD‐9 Code |
|---|---|
| |
| Helicobacter pylori | 041.86 |
| Abnormality of secretion of gastrin | 251.5 |
| Esophageal varices with bleeding | 456.0 |
| Esophageal varices without mention of bleeding | 456.1 |
| Esophageal varices in diseases classified elsewhere | 456.2 |
| Esophagitis | 530.10530.19 |
| Perforation of esophagus | 530.4 |
| Gastroesophageal laceration‐hemorrhage syndrome | 530.7 |
| Esophageal reflux | 530.81 |
| Barrett's esophagus | 530.85 |
| Gastric ulcer | 531.0031.91 |
| Duodenal ulcer | 532.00532.91 |
| Peptic ulcer, site unspecified | 533.00533.91 |
| Gastritis and duodenitis | 535.00535.71 |
| Gastroparesis | 536.3 |
| Dyspepsia and other specified disorders of function of stomach | 536.8 |
| Hemorrhage of gastrointestinal tract, unspecified | 578.9 |
To assess the accuracy of the administrative data from DH, we also reviewed the Emergency Department histories, admission histories, progress notes, electronic pharmacy records, endoscopy reports, and discharge summaries of 123 patients randomly selected (ie, a 5% sample) from the group of patients identified by administrative data to have received a PPI without a valid indication, looking for any accepted indication that might have been missed in the administrative data.
All analyses were performed using SAS Enterprise Guide 4.1 (SAS Institute, Cary, NC). A Student t test was used to compare continuous variables and a chi‐square test was used to compare categorical variables. Bonferroni corrections were used for multiple comparisons, such that P values less than 0.01 were considered to be significant for categorical variables.
RESULTS
Inclusion criteria were met by 9875 patients in the Denver Health database and 6,592,100 patients in the UHC database. The demographics and primary discharge diagnoses for these patients are summarized in Table 2.
| DH (N = 9875) | UHC (N = 6,592,100) | ||||
|---|---|---|---|---|---|
| Received a PPI | No PPI | Received a PPI | No PPI | ||
| |||||
| No. (%) | 3962 (40) | 5913 (60) | 918,474 (14) | 5,673,626 (86) | |
| Age (mean SD) | 53 15 | 51 16 | 59 17 | 55 18 | |
| Gender (% male) | 2197 (55) | 3438 (58) | 464,552 (51) | 2,882,577 (51) | |
| Race (% white) | 1610 (41) | 2425 (41) | 619,571 (67) | 3,670,450 (65) | |
| Top 5 primary discharge diagnoses | |||||
| Chest pain | 229 (6) | 462 (8) | Coronary atherosclerosis | 35,470 (4) | 186,321 (3) |
| Alcohol withdrawal | 147 (4) | 174 (3) | Acute myocardial infarction | 26,507 (3) | 132,159 (2) |
| Pneumonia, organism unspecified | 142 (4) | 262 (4) | Heart failure | 21,143 (2) | 103,751 (2) |
| Acute pancreatitis | 132 (3) | 106 (2) | Septicemia | 20,345 (2) | 64,915 (1) |
| Obstructive chronic bronchitis with (acute) exacerbation | 89 (2) | 154 (3) | Chest pain | 16,936 (2) | 107,497 (2) |
Only 39% and 27% of the patients in the DH and UHC databases, respectively, had a valid indication for PPIs on the basis of discharge diagnoses (Table 3). In the DH data, if admission ICD‐9 codes were also inspected for valid PPI indications, 1579 (40%) of patients receiving PPIs had a valid indication (admission ICD‐9 codes were not available for patients in the UHC database). Thirty‐one percent of Denver Health patients spent time in the intensive care unit (ICU) during their hospital stay and 65% of those patients received a PPI without a valid indication, as compared to 59% of patients who remained on the General Medicine ward (Table 3).
| DH (N = 9875) | UHC (N = 6,592,100) | |
|---|---|---|
| ||
| Patients receiving PPIs (% of total) | 3962 (40) | 918,474 (14) |
| Any ICU stay, N (% of all patients) | 1238 (31) | |
| General Medicine ward only, N (% of all patients) | 2724 (69) | |
| Patients with indication for PPI (% of all patients receiving PPIs)* | 1540 (39) | 247,142 (27) |
| Any ICU stay, N (% of all ICU patients) | 434 (35) | |
| General Medicine ward only, N (% of all ward patients) | 1106 (41) | |
| Patients without indication for PPI (% of those receiving PPIs)* | 2422 (61) | 671,332 (73) |
| Any ICU stay, N (% of all ICU patients) | 804 (65) | |
| General Medicine ward only, N (% of all ward patients) | 1618 (59) | |
Higher rates of concurrent C. difficile infections were observed in patients receiving PPIs in both databases; a higher rate of concurrent diagnosis of pneumonia was seen in patients receiving PPIs in the UHC population, with a nonsignificant trend towards the same finding in DH patients (Table 4).
| Denver Health | UHC | |||||
|---|---|---|---|---|---|---|
| Concurrent diagnosis | (+) PPI 3962 | () PPI 5913 | P | (+) PPI 918,474 | () PPI 5,673,626 | P |
| ||||||
| C. difficile | 46 (1.16) | 26 (0.44) | <0.0001 | 12,113 (1.32) | 175 (0.0031) | <0.0001 |
| Pneumonia | 400 (10.1) | 517 (8.7) | 0.0232 | 75,274 (8.2) | 300,557 (5.3) | <0.0001 |
Chart review in the DH population found valid indications for PPIs in 19% of patients who were thought not have a valid indication on the basis of the administrative data (Table 5). For 56% of those in whom no valid indication was confirmed, physicians identified prophylaxis as the justification.
| Characteristic | N (%) |
|---|---|
| |
| Valid indication found on chart review only | 23 (19) |
| No valid indication after chart review | 100 (81) |
| Written indication: prophylaxis | 56 (56) |
| No written documentation of indication present in the chart | 33 (33) |
| Written indication: continue home medication | 9 (9) |
| Intubated with or without written indication of prophylaxis | 16 (16) |
DISCUSSION
The important finding of this study was that the majority of patients in 2 large groups of Medicine patients hospitalized in university‐affiliated hospitals received PPIs without having a valid indication. To our knowledge, the more than 900,000 UHC patients who received a PPI during their hospitalization represent the largest inpatient population evaluated for appropriateness of PPI prescriptions.
Our finding that 41% of the patients admitted to the DH Medicine service received a PPI during their hospital stay is similar to what has been observed by others.9, 14, 22 The rate of PPI prescription was lower in the UHC population (14%) for unclear reasons. By our definition, 61% lacked an adequate diagnosis to justify the prescription of the PPI. After performing a chart review on a randomly selected 5% of these records, we found that the DH administrative database had failed to identify 19% of patients who had a valid indication for receiving a PPI. Adjusting the administrative data accordingly still resulted in 50% of DH patients not having a valid indication for receiving a PPI. This is consistent with the 54% recorded by Batuwitage and colleagues11 in the outpatient setting by direct chart review, as well as a range of 60%‐75% for hospitalized patients in other studies.12, 13, 15, 23, 24
Stomach acidity is believed to provide an important host defense against lower gastrointestinal tract infections including Salmonella, Campylobacter, and Clostridium difficile.25 A recent study by Howell et al26 showed a doseresponse effect between PPI use and C. difficile infection, supporting a causal connection between loss of stomach acidity and development of Clostridium difficile‐associated diarrhea (CDAD). We found that C. difficile infection was more common in both populations of patients receiving PPIs (although the relative risk was much higher in the UHC database) (Table 5). The rate of CDAD in DH patients who received PPIs was 2.6 times higher than in patients who did not receive these acid suppressive agents.
The role of acid suppression in increasing risk for community‐acquired pneumonia is not entirely clear. Theories regarding the loss of an important host defense and bacterial proliferation head the list.6, 8, 27 Gastric and duodenal bacterial overgrowth is significantly more common in patients receiving PPIs than in patients receiving histamine type‐2 (H2) blockers.28 Previous studies have identified an increased rate of hospital‐acquired pneumonia and recurrent community‐acquired pneumonia27 in patients receiving any form of acid suppression therapy, but the risk appears to be greater in patients receiving PPIs than in those receiving H2 receptor antagonists (H2RAs).9 Significantly more patients in the UHC population who were taking PPIs had a concurrent diagnosis of pneumonia, consistent with previous studies alerting to this association6, 8, 9, 27 and consistent with the nonsignificant trend observed in the DH population.
Our study has a number of limitations. Our database comes from a single university‐affiliated public hospital with residents and hospitalists writing orders for all medications. The hospitals in the UHC are also teaching hospitals. Accordingly, our results might not generalize to other settings or reflect prescribing patterns in private, nonteaching hospital environments. Because our study was retrospective, we could not confirm the decision‐making process supporting the prescription of PPIs. Similarly, we could not temporarily relate the existence of the indication with the time the PPI was prescribed. Our list of appropriate indications for prescribing PPIs was developed by reviewing a number of references, and other studies have used slightly different lists (albeit the more commonly recognized indications are the same), but it may be argued that the list either includes or misses diagnoses in error.
While there is considerable debate about the use of PPIs for stress ulcer prophylaxis,29 we specifically chose not to include this as one of our valid indications for PPIs for 4 reasons. First, the American Society of Health‐System Pharmacists (ASHP) Report does not recommend prophylaxis for non‐ICU patients, and only recommends prophylaxis for those ICU patients with a coagulopathy, those requiring mechanical ventilation for more than 48 hours, those with a history of gastrointestinal ulceration or bleeding in the year prior to admission, and those with 2 or more of the following indications: sepsis, ICU stay >1 week, occult bleeding lasting 6 or more days, receiving high‐dose corticosteroids, and selected surgical situations.30 At the time the guideline was written, the authors note that there was insufficient data on PPIs to make any recommendations on their use, but no subsequent guidelines have been issued.30 Second, a review by Mohebbi and Hesch published in 2009, and a meta‐analysis by Lin and colleagues published in 2010, summarize subsequent randomized trials that suggest that PPIs and H2 blockers are, at best, similarly effective at preventing upper gastrointestinal (GI) bleeding among critically ill patients.31, 32 Third, the NICE guidelines do not include stress ulcer prophylaxis as an appropriate indication for PPIs except in the prevention and treatment of NSAID [non‐steroidal anti‐inflammatory drug]‐associated ulcers.19 Finally, H2RAs are currently the only medications with an FDA‐approved indication for stress ulcer prophylaxis. We acknowledge that PPIs may be a reasonable and acceptable choice for stress ulcer prophylaxis in patients who meet indications, but we were unable to identify such patients in either of our administrative databases.
In our Denver Health population, only 31% of our patients spent any time in the intensive care unit, and only a fraction of these would have both an accepted indication for stress ulcer prophylaxis by the ASHP guidelines and an intolerance or contraindication to an H2RA or sulcralfate. While our administrative database lacked the detail necessary to identify this small group of patients, the number of patients who might have been misclassified as not having a valid PPI indication was likely very small. Similar to the findings of previous studies,15, 18, 23, 29 prophylaxis against gastrointestinal bleeding was the stated justification for prescribing the PPI in 56% of the DH patient charts reviewed. It is impossible for us to estimate the number of patients in our administrative database for whom stress ulcer prophylaxis was justified by existing guidelines, as it would be necessary to gather a number of specific clinical details for each patient including: 1) ICU stay; 2) presence of coagulopathy; 3) duration of mechanical ventilation; 4) presence of sepsis; 5) duration of ICU stay; 6) presence of occult bleeding for >6 days; and 7) use of high‐dose corticosteroids. This level of clinical detail would likely only be available through a prospective study design, as has been suggested by other authors.33 Further research into the use, safety, and effectiveness of PPIs specifically for stress ulcer prophylaxis is warranted.
In conclusion, we found that 73% of nearly 1 million Medicine patients discharged from academic medical centers received a PPI without a valid indication during their hospitalization. The implications of our findings are broad. PPIs are more expensive31 than H2RAs and there is increasing evidence that they have significant side effects. In both databases we examined, the rate of C. difficile infection was higher in patients receiving PPIs than others. The prescribing habits of physicians in these university hospital settings appear to be far out of line with published guidelines and evidence‐based practice. Reducing inappropriate prescribing of PPIs would be an important educational and quality assurance project in most institutions.
- IMS Health Web site. Available at: http://www.imshealth.com/deployedfiles/ims/Global/Content/Corporate/Press%20Room/Top‐line%20Market%20Data/2009%20Top‐line%20Market%20Data/Top%20Therapy%20Classes%20by%20U.S.Sales.pdf. Accessed May 1,2011.
- ,, , et al.Comparison of omeprazole and cimetidine in reflux oesophagitis: symptomatic, endoscopic, and histological evaluations.Gut.1990;31(9):968–972.
- ,,, et al.Omeprazole before endoscopy in patients with gastrointestinal bleeding.N Engl J Med.2007;356(16):1631–1640.
- ,,,.Use of gastric acid‐suppressive agents and the risk of community‐acquired Clostridium difficile‐associated disease.JAMA.2005;294(23):2989–2995.
- ,,, et al.Risk of adverse outcomes associated with concomitant use of clopidogrel and proton pump inhibitors following acute coronary syndrome.JAMA.2009;301(9):937–944.
- ,,,,,.Risk of community‐acquired pneumonia and use of gastric acid‐suppressive drugs.JAMA.2004;292(16):1955–1960.
- ,,,.Long‐term proton pump inhibitor therapy and risk of hip fracture.JAMA2006;296(24):2947–2953.
- ,,,,,.Use of proton pump inhibitors and the risk of community‐acquired pneumonia: a population‐based case‐control study.Arch Intern Med.2007;167(9):950–955.
- ,,,.Acid‐suppressive medication use and the risk for hospital‐acquired pneumonia.JAMA.2009;301(20):2120–2128.
- US Food and Drug Administration (FDA) Website. Available at: http://www.fda.gov/Safety/MedWatch/SafetyInformation/SafetyAlertsfor HumanMedicalProducts/ucm245275.htm. Accessed March 2,2011.
- ,,,.Inappropriate prescribing of proton pump inhibitors in primary care.Postgrad Med J.2007;83(975):66–68.
- ,.Stress ulcer prophylaxis in hospitalized patients not in intensive care units.Am J Health Syst Pharm.2007;64(13):1396–1400.
- ,,,.Predictors of inappropriate utilization of intravenous proton pump inhibitors.Aliment Pharmacol Ther.2007;25(5):609–615.
- ,,.Overuse of acid‐suppressive therapy in hospitalized patients.Am J Gastroenterol.2000;95(11):3118–3122.
- ,,,,,.Patterns and predictors of proton pump inhibitor overuse among academic and non‐academic hospitalists.Intern Med2010;49(23):2561–2568.
- ,,, et al.Hospital use of acid‐suppressive medications and its fall‐out on prescribing in general practice: a 1‐month survey.Aliment Pharmacol Ther.2003;17(12):1503–1506.
- ,,.Overuse and inappropriate prescribing of proton pump inhibitors in patients with Clostridium difficile‐associated disease.QJM.2008;101(6):445–448.
- ,,,.Acid suppressive therapy use on an inpatient internal medicine service.Ann Pharmacother.2006;40(7–8):1261–1266.
- National Institute of Clinical Excellence (NICE), National Health Service (NHS), Dyspepsia: Management of dyspepsia in adults in primary care. Web site. Available at: http://www.nice.org.uk/nicemedia/live/10950/29460/29460.pdf. Accessed May 1,2011.
- ,,.When should stress ulcer prophylaxis be used in the ICU?Curr Opin Crit Care.2009;15(2):139–143.
- ,.An evaluation of the use of proton pump inhibitors.Pharm World Sci2001;23(3):116–117.
- ,,.Overuse of proton pump inhibitors.J Clin Pharm Ther.2000;25(5):333–340.
- ,,,.Pattern of intravenous proton pump inhibitors use in ICU and non‐ICU setting: a prospective observational study.Saudi J Gastroenterol.2010;16(4):275–279.
- ,,, et al.Overuse of PPIs in patients at admission, during treatment, and at discharge in a tertiary Spanish hospital.Curr Clin Pharmacol.2010;5(4):288–297.
- ,,.Systematic review of the risk of enteric infection in patients taking acid suppression.Am J Gastroenterol.2007;102(9):2047–2056.
- ,,, et al.Iatrogenic gastric acid suppression and the risk of nosocomial Clostridium difficile infection.Arch Intern Med.2010;170(9):784–790.
- ,,,,.Recurrent community‐acquired pneumonia in patients starting acid‐suppressing drugs.Am J Med.2010;123(1):47–53.
- ,,, et al.Bacterial overgrowth during treatment with omeprazole compared with cimetidine: a prospective randomised double blind study.Gut.1996;39(1):54–59.
- ,,,.Why do physicians prescribe stress ulcer prophylaxis to general medicine patients?South Med J2010;103(11):1103–1110.
- ASHP therapeutic guidelines on stress ulcer prophylaxis.ASHP Commission on Therapeutics and approved by the ASHP Board of Directors on November 14, 1998.Am J Health Syst Pharm.1999;56(4):347–379.
- ,.Stress ulcer prophylaxis in the intensive care unit.Proc (Bayl Univ Med Cent).2009;22(4):373–376.
- ,,,,.The efficacy and safety of proton pump inhibitors vs histamine‐2 receptor antagonists for stress ulcer bleeding prophylaxis among critical care patients: a meta‐analysis.Crit Care Med.2010;38(4):1197–1205.
- ,,.Proton pump inhibitors for the prevention of stress‐related mucosal disease in critically‐ill patients: a meta‐analysis.J Med Assoc Thai.2009;92(5):632–637.
- ,,,.Proton pump inhibitors for prophylaxis of nosocomial upper gastrointestinal tract bleeding: effect of standardized guidelines on prescribing practice.Arch Intern Med.2010;170(9):779–783.
Copyright © 2011 Society of Hospital Medicine
The Wells Rule and VTE Prophylaxis
Symptoms, signs, chest radiograms, electrocardiograms and laboratory data have a low specificity for the diagnosis of pulmonary embolism (PE) when used in isolation, but when used in combination they can accurately identify patients with an increased likelihood of having a PE.17 The Wells score combines multiple variables into a prediction tool (Table 1). The original model identified three categories of patients with increasing likelihoods of having a PE,6 but a simpler, dichotomous version was subsequently proposed.7 A sequential diagnostic strategy combining the dichotomous Wells rule with a serum d‐dimer test has been validated against contrast‐enhanced spiral computed tomography (CTPE) on cohorts comprised largely of ambulatory outpatient and emergency room patients.815 This method, however, has never been tested in hospitalized patients who were receiving heparin in doses designed to prevent the development of venous thromboembolism (VTE). The purpose of this study was to evaluate the utility of the modified Wells score to predict the presence or absence of PE in hospitalized patients who were receiving prophylactic heparin.
| |
| Symptoms and signs of deep‐vein thrombosis | 3.0 |
| Heart rate >100 beats per minute | 1.5 |
| Recent immobilization or surgery (<4 weeks) | 1.5 |
| Previous VTE | 1.5 |
| Hemoptysis | 1.0 |
| Active cancer | 1.0 |
| PE more likely than alternate diagnosis | 3.0 |
Methods
We screened consecutive patients who underwent CTPE studies from January 2006 through December 2007 at Denver Health, a university‐affiliated public hospital. Inclusion criteria were patients between 18 and 89 years of age who underwent CTPE imaging 2 or more days after being hospitalized, and had been receiving fractionated or unfractionated heparin in doses appropriate for preventing the development of deep venous thrombosis from the time of admission. Patients were excluded if they had signs or symptoms that were consistent with a diagnosis of PE at the time of admission, if they had a contraindication to prophylactic anticoagulation or if their prophylactic heparin therapy had been interrupted for any reason from the time prior to when the CTPE was ordered.
Patients were grouped depending on the service or location of their admission (ie, Medicine, Surgery, Orthopedics, Medical or Surgical Intensive Care Units). The objective elements of the Wells score were obtained by reviewing each patient's history and physical examination, progress notes and discharge summary. Patients were considered to have an alternate diagnosis of equal or greater likelihood than a PE if a d‐dimer was ordered, or if such a possibility was suggested by the treating clinician in the computerized order for the CTPE. The modified Wells score was used to classify patients into PE‐likely (total score 4) or PE‐unlikely (total score <4).7 Fisher's exact test was used to analyze the 2 2 table. P< 0.05 was taken to represent significance.
The Colorado Multiple Institutional Review Board approved this study with a waiver of informed consent.
Results
Of 446 patients who had CTPEs during the study period 286 (64%) met the inclusion criteria (Figure 1). Those who were excluded included 131 who did not receive continuous prophylactic anticoagulation from the time they were admitted to the time of the CT, 18 who had preexisting signs or symptoms and signs consistent with a diagnosis of PE at the time of admission, and 11 who were receiving therapeutic anticoagulation. The patients were hospitalized on different units and on a number of different services (Table 2).

| Total Patients | PE | PE Likely | |
|---|---|---|---|
| |||
| Medicine | 89 | 7 (8%) | 59 (66%) |
| Surgery | 55 | 0 (0%) | 43 (78%) |
| Orthopedics | 57 | 6 (11%) | 43 (75%) |
| MICU | 24 | 3 (13%) | 20 (83%) |
| SICU | 61 | 4 (7%) | 47 (77%) |
| Total | 286 | 20 (7%) | 212 (74%) |
Low molecular weight heparin was given to 165 patients (dalteparin, 5000 units, once daily), unfractionated heparin to 120 patients (104 receiving 5000 units twice daily and 16 receiving 5000 units 3 times a day) and 1 patient was given a Factor Xa inhibitor (fondaparinux 2.5 mg once daily) due to a history of heparin induced thrombocytopenia.
Hypoxia and tachycardia were the most common reasons for requesting a CTPE in instances in which an indication for CT imaging was documented. In almost 28% of patients, however, the reason for suspecting PE was not apparent on chart review (Table 3).
| Patients (%) | |
|---|---|
| |
| Hypoxia | 118 (41) |
| Hypoxia + tachycardia | 45 (16) |
| Tachycardia | 32 (11) |
| Chest pain | 10 (3) |
| Hemoptysis | 1 (0.3) |
| Not specified | 80 (28) |
| Total | 286 (100) |
The prevalence of PE was 20/286 (7.0%, 95% CI (confidence interval): 4.0‐10.0). On the basis of the Wells score 212 patients (74%) were classified as PE‐likely and 74 (26%) as PE‐unlikely. Immobility or recent surgery, tachycardia and the absence of a more plausible diagnosis were the most common contributors to the final score (Table 4).
| n (%) | |
|---|---|
| |
| Symptoms and signs of deep‐vein thrombosis | 12 (6) |
| Heart rate >100 beats per minute | 119 (60) |
| Recent immobilization or surgery (<4 weeks) | 179 (90) |
| Previous VTE | 10 (5) |
| Hemoptysis | 1 (<1) |
| Active cancer | 18 (9) |
| PE more likely than alternate diagnosis | 131 (66) |
Nineteen of the 20 patients (95%) who had PE diagnosed on the basis of a positive CTPE were risk‐stratified on the basis of the Wells score into the PE‐likely category, and 1 (5%) was classified as PE‐unlikely. Of the 266 patients whose CTPEs were negative 193 (73%) were classified as PE‐likely and 73 (27%) as PE‐unlikely (P < 0.03). Accordingly, the modified Wells score was 95% sensitive for having a diagnosis of PE confirmed on CTPE, the specificity was only 27%, the positive predictive value was only 9% and the negative predictive value was 99%(Table 5) with negative likelihood ratio of 0.19.
| Wells Rule | CTPE | Total | |
|---|---|---|---|
| Positive | Negative | ||
| |||
| PE likely | 19 | 193 | 272 |
| PE unlikely | 1 | 73 | 74 |
| Total | 20 | 266 | 286 |
| Sensitivity | 0.95 | ||
| Specificity | 0.27 | ||
| Positive predictive value | 0.09 | ||
| Negative predictive value | 0.99 | ||
| Positive likelihood ratio | 1.31 | ||
| Negative likelihood ratio | 0.18 | ||
| Two‐sided P value | 0.03 | ||
A d‐dimer was ordered for 70 of the 74 patients (95%) who were classified as PE‐unlikely. In 67 of these (96%) the test was positive, and in all but 1 the result was falsely positive. D‐dimer testing was also obtained in 8 of 212 (4%) of patients classified as PE‐likely and was positive in all 8.
Discussion
This retrospective cohort study demonstrated that in hospitalized patients who were receiving prophylactic doses of fractionated or unfractionated heparin and underwent CTPE studies for the clinical suspicion of PE, the prevalence of PE was very low, the modified Wells rule classified 26% of the patients as PE‐unlikely, and the PE‐unlikely category was associated with an extremely high negative predictive value and low negative likelihood ratio for PE. We also confirmed that the prevalence of a positive d‐dimer was so high in this population that the test did not add to the ability to risk‐stratify patients for the likelihood of having a PE. These findings lead to the conclusion that CTPE studies were performed excessively in this cohort of patients.
Previous studies validating the Wells score enrolled combinations of inpatients and outpatients813 or outpatients exclusively.14, 15 To our knowledge the present study is the first to validate the utility of the scoring system in inpatients receiving prophylactic anticoagulation. As would be expected, the prevalence of PE in our population was lower than the 9% to 30% that has previously been reported in patients not receiving prophylactic anticoagulation,815 consistent with the 68% to 76% reduction in the risk of deep venous thrombosis that occurs with use of low‐dose heparin or low molecular weight heparin.16
Similar to the findings of Arnason et al.17 a large proportion of this inpatient cohort was classified as PE‐likely on the basis of only 3 of the 7 variablestachycardia, immobility or previous surgery, and the absence of a more likely competing diagnosis.
The d‐dimer was elevated above the upper limit of normal in nearly all the cases in which it was tested (96%). Bounameaux et al.18 first suggested that conditions other than VTE could increase the plasma d‐dimer level. D‐dimer levels above the cutoff that excludes thrombosis have been documented in absence of thrombosis in the elderly and in patients with numerous other conditions including infections, cancer, coronary, cerebral and peripheral arterial vascular disease, heart failure, rheumatologic diseases, surgery, trauma burns, and pregnancy.1821 Van Beek et al.22 and Miron et al.23 demonstrated that d‐dimer testing was not useful in hospitalized patients. Kabrhel et al.24 reported similar results in an Emergency Department cohort and concluded that d‐dimer testing increased the percent of patients who were investigated for PE and the percent that were sent for pulmonary vascular imaging without increasing the percent of patients diagnosed as having a PE. In our cohort, 74 patients (26%) were classified as PE‐unlikely, and we theorize that 67 (90%) of these underwent CTPE studies solely on the basis of having a positive d‐dimer. All but one of the CTPEs in the patients with positive d‐dimers were negative for PE confirming the that the low specificity of d‐dimer testing in hospitalized patients also applies to those receiving prophylactic anticoagulation.
The Wells rule was associated with a high negative predictive value (99%) and a corresponding low negative likelihood ratio of 0.19, with both of these parameters likely being strongly influenced by the low prevalence of PE in this cohort.
In most longitudinal controlled studies of heparin‐based prophylaxis the incidence of VTE in all medical and most surgical patients approximates 5%.25,26 If this were taken to represent the pre‐test probability of VTE in patients on prophylaxis in whom the question of PE arises, then according to Bayesian theory, a PE‐unlikely classification with a negative likelihood ratio of 0.19 would result in a post‐test probability of less than 1%. This is well below the threshold at which diagnostic imaging delivers no benefit and in fact, may cause harm. Accordingly, PE can be safely excluded in those who are risk‐stratified to PE‐unlikely, with or without an accompanying negative d‐dimer. The average charge for a CTPE at our institution is $1800 and the 2009 cost/charge ratio was 54%. Accordingly, the cost savings to our hospital if CTPEs were not done on the 74 patients classified as PE‐unlikely would exceed $66,000/year.
Our study has a number of potential limitations. Because the data came from a single university‐affiliated public hospital the results might not generalize to other hospitals (teaching or nonteaching). Despite finding a very low prevalence of PE in patients receiving prophylactic heparin, the true prevalence of PE might have been overestimated since our sample size was small and Denver Health is a regional level I trauma center and has a busy joint arthroplasty service, i.e., services known to have an increased prevalence of venous thrombosis.16 If the prevalence of PE were indeed lower than what we observed, however, it would decrease the number of true positive and false negative CTPEs which would, in turn, further strengthen the conclusion that CTPEs are being overused in hospitalized patients receiving prophylactic heparin who are risk‐stratified to a PE‐unlikely category. Similarly, because our sample size was small we may have underestimated the prevalence of PE. Our narrow CIs, and the fact that the prevalence we observed is consistent with the effect of prophylaxic heparin on the incidence of VTE suggest that, if an error were made, it would not be large enough to alter our conclusions.
Our analysis did not include patients in whom PE was excluded without performing CTPE testing. If these patients had CTPEs the large majority would be negative because of a very low pretest probability and risk‐stratification would have placed them in a PE‐unlikely category (ie, true negatives), thereby also increasing the negative predictive value of the Wells score used in this setting.
We calculated the Wells score retrospectively as was previously done in studies by Chagnon et al.,11 Righini et al.,14 and Ranji et al.27 (although the methods used in these studies were not described in detail). We assumed that whenever a d‐dimer test was ordered the treating physician thought that PE was less likely than an alternate diagnosis reasoning that, if they thought PE were the most likely diagnosis, d‐dimers should not have been obtained as, in this circumstance, they are not recommended as part of the diagnostic algorithm.8 Conversely, we assumed that for patients who did not get d‐dimer testing, the treating physician thought that PE was the most likely diagnosis. Alternatively, the physicians might not have ordered a d‐dimer because they recognized that the test is of limited clinical utility in hospitalized patients. In this latter circumstance, the number of PE‐likely patients would be overestimated and the number of PE‐unlikely would be underestimated, reducing the strength of our conclusions or potentially invalidating them. Since the accuracy of prediction rules mirrors that of implicit clinical judgment, however, we suggest that, for most of the patients who had CTPEs performed without d‐dimers, the ordering physician had a high suspicion of PE28, 29 and that the large majority of PE‐likely patients were correctly classified.
In summary, we found that CTPE testing is frequently performed in hospitalized patients receiving prophylactic heparin despite there being a very low prevalence of PE in this cohort, and that risk‐stratifying patients into the PE‐unlikely category using the modified Wells score accurately excludes the diagnosis of PE. The problem of overuse of CTPEs is compounded by the well‐recognized misuse of d‐dimer testing in hospitalized patients. On the basis of our findings we recommend that, when hospitalized patients who are receiving heparin prophylaxis to prevent VTE develop signs or symptoms suggestive of PE they should be risk‐stratified using the modified Wells criteria. In those classified as PE‐unlikely PE can be safely excluded without further testing. Using this approach 26% of CTPEs done on the cohort of hospitalized patients we studied, and all d‐dimers could have been avoided. If the results of our study are duplicated in other centers these recommendations should be included in future guidelines summarizing the most cost‐effective ways to evaluate patients for possible PE.
Acknowledgements
Ms. Angela Keniston assisted in this study by identifying the initial population by using the hospital's computerized data warehouse.
- ,Accuracy of the clinical diagnosis of pulmonary embolism.JAMA.1967;202(7):115–118.
- ,,, et al.Clinical, laboratory, roentgenographic, and electrocardiographic findings in patients with acute pulmonary embolism and no preexisting cardiac or pulmonary disease.Chest.1991;100(3):598–603.
- ,,,Chest Radiographs in acute pulmonary embolism. Results from the International Cooperative Pulmonary Embolism Registry.Chest.2000;118(1):33–38.
- ,,Alveolar‐arterial gradient in the assessment of acute pulmonary embolism.Chest.1995;107(1):139–143.
- ,,, et al.Diagnostic value of the electrocardiogram in suspected pulmonary embolism.Am J Cardiol.2000;86(7):807–809.
- ,,, et al.Use of a clinical model for safe management of patients with suspected pulmonary embolism.Ann Intern Med.1998;129(12):997–1005.
- ,,, et al.Derivation of a simple clinical model to categorize patient's probability of pulmonary embolism: increasing the models utility with the simpliRed D‐dimer.Thromb Haemost.2000;83(3):416–420.
- ,,, et al.Effectiveness of managing suspected pulmonary embolism using an algorithm combining clinical probability, d‐dimer testing and computer tomography.JAMA.2006;295(2):172–179.
- ,,,, et al.Comparison of the revised Geneva score with the Wells rule for assessing clinical probability of pulmonary embolism.J Thromb Haemost.2008;6(1):40–44.
- ,,, et al.Further validation and simplification of the Wells clinical decision rule in pulmonary embolism.J Thromb Haemost.2008;99(1):229–234.
- ,,, et al.Comparison of two clinical prediction rules and implicit assessment among patients with suspected pulmonary embolism.Am J Med.2002;113(4):269–275.
- ,,,A prospective reassessment of the utility of the Wells score in identifying pulmonary embolism.Med J Aust.2007;187(6):333–336.
- ,,,et al.Performance of the Wells and Revised Geneva scores for predicting pulmonary embolism.Eur J Emerg Med.2009;16(1):49–52.
- ,,,Clinical probability assessment of pulmonary embolism by the Wells' score: is the easiest the best?J Thromb Haemost.2006;4(3):702–704
- ,,, et al.Simple and safe exclusion of pulmonary embolism in outpatients using quantitative D‐dimer and Wells' simplified decision rule.J Thromb Haemost.2007;97:146–150.
- ,,, et al.Prevention of venous thromboembolism.Chest.2001;119:132S–175S.
- ,,Appropriateness of diagnostic strategies for evaluating suspected pulmonary embolism.J Thromb Haemost.2007;97(2):195–201.
- ,,, et al.Measurement of plasma D‐dimer for diagnosis of deep venous thrombosis.Am J Clin Path.1989;91(1):82–85.
- ,,,Plasma D‐dimer levels in elderly patients with suspected pulmonary embolism.Thromb Res.2000;98(6):577–579.
- ,,, et al.D‐dimer plasma concentration in various clinical conditions: implication for the use of this test in the diagnostic approach of venous thromboembolism.Thromb Res.1993;69(1):125–130.
- ,,,D‐dimer for venous thromboembolism diagnosis: 20 years later.J Thromb Haemost.2008;6(7):1059–1071.
- ,,, et al.The role of plasma D‐dimer concentration in the exclusion of pulmonary embolism.Brit J Haematol.1996;92(3):725–732.
- ,,, et al.Contribution of non‐invasive evaluation to the diagnosis of pulmonary embolism in hospitalized patients.Eur Respir J.1999;13(6):1365–1370.
- ,,A highly sensitive ELISA D‐dimer increases testing but not diagnosis of pulmonary embolism.Acad Emerg Med2006;13:519–524.
- ,,A comparison of enoxaparin with placebo for the prevention of venous thromboembolism in acutely ill medical patients. Prophylaxis in Medical Patients with Enoxaparin Study Group.N Engl J Med.1999;341(11):793–800.
- ,,,,The incidence of symptomatic venous thromboembolism after enoxaparin prophylaxis in lower extremity arthroplasty: a cohort study of 1,984 patients.Canadian Collaborative Group.1998;114:115S–118S.
- ,,,,Impact of reliance on CT pulmonary angiography on diagnosis of pulmonary embolism: a Bayesian analysis.J Hosp Med.2006;1:81–87.
- The PIOPED investigators: Value of the ventilation‐perfusion scan in acute pulmonary embolism.JAMA.1990;263:2753–2759.
- ,,, et al.Non‐invasive diagnosis of venous thromboembolism in outpatients.Lancet.353:190–195.
Symptoms, signs, chest radiograms, electrocardiograms and laboratory data have a low specificity for the diagnosis of pulmonary embolism (PE) when used in isolation, but when used in combination they can accurately identify patients with an increased likelihood of having a PE.17 The Wells score combines multiple variables into a prediction tool (Table 1). The original model identified three categories of patients with increasing likelihoods of having a PE,6 but a simpler, dichotomous version was subsequently proposed.7 A sequential diagnostic strategy combining the dichotomous Wells rule with a serum d‐dimer test has been validated against contrast‐enhanced spiral computed tomography (CTPE) on cohorts comprised largely of ambulatory outpatient and emergency room patients.815 This method, however, has never been tested in hospitalized patients who were receiving heparin in doses designed to prevent the development of venous thromboembolism (VTE). The purpose of this study was to evaluate the utility of the modified Wells score to predict the presence or absence of PE in hospitalized patients who were receiving prophylactic heparin.
| |
| Symptoms and signs of deep‐vein thrombosis | 3.0 |
| Heart rate >100 beats per minute | 1.5 |
| Recent immobilization or surgery (<4 weeks) | 1.5 |
| Previous VTE | 1.5 |
| Hemoptysis | 1.0 |
| Active cancer | 1.0 |
| PE more likely than alternate diagnosis | 3.0 |
Methods
We screened consecutive patients who underwent CTPE studies from January 2006 through December 2007 at Denver Health, a university‐affiliated public hospital. Inclusion criteria were patients between 18 and 89 years of age who underwent CTPE imaging 2 or more days after being hospitalized, and had been receiving fractionated or unfractionated heparin in doses appropriate for preventing the development of deep venous thrombosis from the time of admission. Patients were excluded if they had signs or symptoms that were consistent with a diagnosis of PE at the time of admission, if they had a contraindication to prophylactic anticoagulation or if their prophylactic heparin therapy had been interrupted for any reason from the time prior to when the CTPE was ordered.
Patients were grouped depending on the service or location of their admission (ie, Medicine, Surgery, Orthopedics, Medical or Surgical Intensive Care Units). The objective elements of the Wells score were obtained by reviewing each patient's history and physical examination, progress notes and discharge summary. Patients were considered to have an alternate diagnosis of equal or greater likelihood than a PE if a d‐dimer was ordered, or if such a possibility was suggested by the treating clinician in the computerized order for the CTPE. The modified Wells score was used to classify patients into PE‐likely (total score 4) or PE‐unlikely (total score <4).7 Fisher's exact test was used to analyze the 2 2 table. P< 0.05 was taken to represent significance.
The Colorado Multiple Institutional Review Board approved this study with a waiver of informed consent.
Results
Of 446 patients who had CTPEs during the study period 286 (64%) met the inclusion criteria (Figure 1). Those who were excluded included 131 who did not receive continuous prophylactic anticoagulation from the time they were admitted to the time of the CT, 18 who had preexisting signs or symptoms and signs consistent with a diagnosis of PE at the time of admission, and 11 who were receiving therapeutic anticoagulation. The patients were hospitalized on different units and on a number of different services (Table 2).
| Total Patients | PE | PE Likely | |
|---|---|---|---|
| |||
| Medicine | 89 | 7 (8%) | 59 (66%) |
| Surgery | 55 | 0 (0%) | 43 (78%) |
| Orthopedics | 57 | 6 (11%) | 43 (75%) |
| MICU | 24 | 3 (13%) | 20 (83%) |
| SICU | 61 | 4 (7%) | 47 (77%) |
| Total | 286 | 20 (7%) | 212 (74%) |
Low molecular weight heparin was given to 165 patients (dalteparin, 5000 units, once daily), unfractionated heparin to 120 patients (104 receiving 5000 units twice daily and 16 receiving 5000 units 3 times a day) and 1 patient was given a Factor Xa inhibitor (fondaparinux 2.5 mg once daily) due to a history of heparin induced thrombocytopenia.
Hypoxia and tachycardia were the most common reasons for requesting a CTPE in instances in which an indication for CT imaging was documented. In almost 28% of patients, however, the reason for suspecting PE was not apparent on chart review (Table 3).
| Patients (%) | |
|---|---|
| |
| Hypoxia | 118 (41) |
| Hypoxia + tachycardia | 45 (16) |
| Tachycardia | 32 (11) |
| Chest pain | 10 (3) |
| Hemoptysis | 1 (0.3) |
| Not specified | 80 (28) |
| Total | 286 (100) |
The prevalence of PE was 20/286 (7.0%, 95% CI (confidence interval): 4.0‐10.0). On the basis of the Wells score 212 patients (74%) were classified as PE‐likely and 74 (26%) as PE‐unlikely. Immobility or recent surgery, tachycardia and the absence of a more plausible diagnosis were the most common contributors to the final score (Table 4).
| n (%) | |
|---|---|
| |
| Symptoms and signs of deep‐vein thrombosis | 12 (6) |
| Heart rate >100 beats per minute | 119 (60) |
| Recent immobilization or surgery (<4 weeks) | 179 (90) |
| Previous VTE | 10 (5) |
| Hemoptysis | 1 (<1) |
| Active cancer | 18 (9) |
| PE more likely than alternate diagnosis | 131 (66) |
Nineteen of the 20 patients (95%) who had PE diagnosed on the basis of a positive CTPE were risk‐stratified on the basis of the Wells score into the PE‐likely category, and 1 (5%) was classified as PE‐unlikely. Of the 266 patients whose CTPEs were negative 193 (73%) were classified as PE‐likely and 73 (27%) as PE‐unlikely (P < 0.03). Accordingly, the modified Wells score was 95% sensitive for having a diagnosis of PE confirmed on CTPE, the specificity was only 27%, the positive predictive value was only 9% and the negative predictive value was 99%(Table 5) with negative likelihood ratio of 0.19.
| Wells Rule | CTPE | Total | |
|---|---|---|---|
| Positive | Negative | ||
| |||
| PE likely | 19 | 193 | 272 |
| PE unlikely | 1 | 73 | 74 |
| Total | 20 | 266 | 286 |
| Sensitivity | 0.95 | ||
| Specificity | 0.27 | ||
| Positive predictive value | 0.09 | ||
| Negative predictive value | 0.99 | ||
| Positive likelihood ratio | 1.31 | ||
| Negative likelihood ratio | 0.18 | ||
| Two‐sided P value | 0.03 | ||
A d‐dimer was ordered for 70 of the 74 patients (95%) who were classified as PE‐unlikely. In 67 of these (96%) the test was positive, and in all but 1 the result was falsely positive. D‐dimer testing was also obtained in 8 of 212 (4%) of patients classified as PE‐likely and was positive in all 8.
Discussion
This retrospective cohort study demonstrated that in hospitalized patients who were receiving prophylactic doses of fractionated or unfractionated heparin and underwent CTPE studies for the clinical suspicion of PE, the prevalence of PE was very low, the modified Wells rule classified 26% of the patients as PE‐unlikely, and the PE‐unlikely category was associated with an extremely high negative predictive value and low negative likelihood ratio for PE. We also confirmed that the prevalence of a positive d‐dimer was so high in this population that the test did not add to the ability to risk‐stratify patients for the likelihood of having a PE. These findings lead to the conclusion that CTPE studies were performed excessively in this cohort of patients.
Previous studies validating the Wells score enrolled combinations of inpatients and outpatients813 or outpatients exclusively.14, 15 To our knowledge the present study is the first to validate the utility of the scoring system in inpatients receiving prophylactic anticoagulation. As would be expected, the prevalence of PE in our population was lower than the 9% to 30% that has previously been reported in patients not receiving prophylactic anticoagulation,815 consistent with the 68% to 76% reduction in the risk of deep venous thrombosis that occurs with use of low‐dose heparin or low molecular weight heparin.16
Similar to the findings of Arnason et al.17 a large proportion of this inpatient cohort was classified as PE‐likely on the basis of only 3 of the 7 variablestachycardia, immobility or previous surgery, and the absence of a more likely competing diagnosis.
The d‐dimer was elevated above the upper limit of normal in nearly all the cases in which it was tested (96%). Bounameaux et al.18 first suggested that conditions other than VTE could increase the plasma d‐dimer level. D‐dimer levels above the cutoff that excludes thrombosis have been documented in absence of thrombosis in the elderly and in patients with numerous other conditions including infections, cancer, coronary, cerebral and peripheral arterial vascular disease, heart failure, rheumatologic diseases, surgery, trauma burns, and pregnancy.1821 Van Beek et al.22 and Miron et al.23 demonstrated that d‐dimer testing was not useful in hospitalized patients. Kabrhel et al.24 reported similar results in an Emergency Department cohort and concluded that d‐dimer testing increased the percent of patients who were investigated for PE and the percent that were sent for pulmonary vascular imaging without increasing the percent of patients diagnosed as having a PE. In our cohort, 74 patients (26%) were classified as PE‐unlikely, and we theorize that 67 (90%) of these underwent CTPE studies solely on the basis of having a positive d‐dimer. All but one of the CTPEs in the patients with positive d‐dimers were negative for PE confirming the that the low specificity of d‐dimer testing in hospitalized patients also applies to those receiving prophylactic anticoagulation.
The Wells rule was associated with a high negative predictive value (99%) and a corresponding low negative likelihood ratio of 0.19, with both of these parameters likely being strongly influenced by the low prevalence of PE in this cohort.
In most longitudinal controlled studies of heparin‐based prophylaxis the incidence of VTE in all medical and most surgical patients approximates 5%.25,26 If this were taken to represent the pre‐test probability of VTE in patients on prophylaxis in whom the question of PE arises, then according to Bayesian theory, a PE‐unlikely classification with a negative likelihood ratio of 0.19 would result in a post‐test probability of less than 1%. This is well below the threshold at which diagnostic imaging delivers no benefit and in fact, may cause harm. Accordingly, PE can be safely excluded in those who are risk‐stratified to PE‐unlikely, with or without an accompanying negative d‐dimer. The average charge for a CTPE at our institution is $1800 and the 2009 cost/charge ratio was 54%. Accordingly, the cost savings to our hospital if CTPEs were not done on the 74 patients classified as PE‐unlikely would exceed $66,000/year.
Our study has a number of potential limitations. Because the data came from a single university‐affiliated public hospital the results might not generalize to other hospitals (teaching or nonteaching). Despite finding a very low prevalence of PE in patients receiving prophylactic heparin, the true prevalence of PE might have been overestimated since our sample size was small and Denver Health is a regional level I trauma center and has a busy joint arthroplasty service, i.e., services known to have an increased prevalence of venous thrombosis.16 If the prevalence of PE were indeed lower than what we observed, however, it would decrease the number of true positive and false negative CTPEs which would, in turn, further strengthen the conclusion that CTPEs are being overused in hospitalized patients receiving prophylactic heparin who are risk‐stratified to a PE‐unlikely category. Similarly, because our sample size was small we may have underestimated the prevalence of PE. Our narrow CIs, and the fact that the prevalence we observed is consistent with the effect of prophylaxic heparin on the incidence of VTE suggest that, if an error were made, it would not be large enough to alter our conclusions.
Our analysis did not include patients in whom PE was excluded without performing CTPE testing. If these patients had CTPEs the large majority would be negative because of a very low pretest probability and risk‐stratification would have placed them in a PE‐unlikely category (ie, true negatives), thereby also increasing the negative predictive value of the Wells score used in this setting.
We calculated the Wells score retrospectively as was previously done in studies by Chagnon et al.,11 Righini et al.,14 and Ranji et al.27 (although the methods used in these studies were not described in detail). We assumed that whenever a d‐dimer test was ordered the treating physician thought that PE was less likely than an alternate diagnosis reasoning that, if they thought PE were the most likely diagnosis, d‐dimers should not have been obtained as, in this circumstance, they are not recommended as part of the diagnostic algorithm.8 Conversely, we assumed that for patients who did not get d‐dimer testing, the treating physician thought that PE was the most likely diagnosis. Alternatively, the physicians might not have ordered a d‐dimer because they recognized that the test is of limited clinical utility in hospitalized patients. In this latter circumstance, the number of PE‐likely patients would be overestimated and the number of PE‐unlikely would be underestimated, reducing the strength of our conclusions or potentially invalidating them. Since the accuracy of prediction rules mirrors that of implicit clinical judgment, however, we suggest that, for most of the patients who had CTPEs performed without d‐dimers, the ordering physician had a high suspicion of PE28, 29 and that the large majority of PE‐likely patients were correctly classified.
In summary, we found that CTPE testing is frequently performed in hospitalized patients receiving prophylactic heparin despite there being a very low prevalence of PE in this cohort, and that risk‐stratifying patients into the PE‐unlikely category using the modified Wells score accurately excludes the diagnosis of PE. The problem of overuse of CTPEs is compounded by the well‐recognized misuse of d‐dimer testing in hospitalized patients. On the basis of our findings we recommend that, when hospitalized patients who are receiving heparin prophylaxis to prevent VTE develop signs or symptoms suggestive of PE they should be risk‐stratified using the modified Wells criteria. In those classified as PE‐unlikely PE can be safely excluded without further testing. Using this approach 26% of CTPEs done on the cohort of hospitalized patients we studied, and all d‐dimers could have been avoided. If the results of our study are duplicated in other centers these recommendations should be included in future guidelines summarizing the most cost‐effective ways to evaluate patients for possible PE.
Acknowledgements
Ms. Angela Keniston assisted in this study by identifying the initial population by using the hospital's computerized data warehouse.
- ,Accuracy of the clinical diagnosis of pulmonary embolism.JAMA.1967;202(7):115–118.
- ,,, et al.Clinical, laboratory, roentgenographic, and electrocardiographic findings in patients with acute pulmonary embolism and no preexisting cardiac or pulmonary disease.Chest.1991;100(3):598–603.
- ,,,Chest Radiographs in acute pulmonary embolism. Results from the International Cooperative Pulmonary Embolism Registry.Chest.2000;118(1):33–38.
- ,,Alveolar‐arterial gradient in the assessment of acute pulmonary embolism.Chest.1995;107(1):139–143.
- ,,, et al.Diagnostic value of the electrocardiogram in suspected pulmonary embolism.Am J Cardiol.2000;86(7):807–809.
- ,,, et al.Use of a clinical model for safe management of patients with suspected pulmonary embolism.Ann Intern Med.1998;129(12):997–1005.
- ,,, et al.Derivation of a simple clinical model to categorize patient's probability of pulmonary embolism: increasing the models utility with the simpliRed D‐dimer.Thromb Haemost.2000;83(3):416–420.
- ,,, et al.Effectiveness of managing suspected pulmonary embolism using an algorithm combining clinical probability, d‐dimer testing and computer tomography.JAMA.2006;295(2):172–179.
- ,,,, et al.Comparison of the revised Geneva score with the Wells rule for assessing clinical probability of pulmonary embolism.J Thromb Haemost.2008;6(1):40–44.
- ,,, et al.Further validation and simplification of the Wells clinical decision rule in pulmonary embolism.J Thromb Haemost.2008;99(1):229–234.
- ,,, et al.Comparison of two clinical prediction rules and implicit assessment among patients with suspected pulmonary embolism.Am J Med.2002;113(4):269–275.
- ,,,A prospective reassessment of the utility of the Wells score in identifying pulmonary embolism.Med J Aust.2007;187(6):333–336.
- ,,,et al.Performance of the Wells and Revised Geneva scores for predicting pulmonary embolism.Eur J Emerg Med.2009;16(1):49–52.
- ,,,Clinical probability assessment of pulmonary embolism by the Wells' score: is the easiest the best?J Thromb Haemost.2006;4(3):702–704
- ,,, et al.Simple and safe exclusion of pulmonary embolism in outpatients using quantitative D‐dimer and Wells' simplified decision rule.J Thromb Haemost.2007;97:146–150.
- ,,, et al.Prevention of venous thromboembolism.Chest.2001;119:132S–175S.
- ,,Appropriateness of diagnostic strategies for evaluating suspected pulmonary embolism.J Thromb Haemost.2007;97(2):195–201.
- ,,, et al.Measurement of plasma D‐dimer for diagnosis of deep venous thrombosis.Am J Clin Path.1989;91(1):82–85.
- ,,,Plasma D‐dimer levels in elderly patients with suspected pulmonary embolism.Thromb Res.2000;98(6):577–579.
- ,,, et al.D‐dimer plasma concentration in various clinical conditions: implication for the use of this test in the diagnostic approach of venous thromboembolism.Thromb Res.1993;69(1):125–130.
- ,,,D‐dimer for venous thromboembolism diagnosis: 20 years later.J Thromb Haemost.2008;6(7):1059–1071.
- ,,, et al.The role of plasma D‐dimer concentration in the exclusion of pulmonary embolism.Brit J Haematol.1996;92(3):725–732.
- ,,, et al.Contribution of non‐invasive evaluation to the diagnosis of pulmonary embolism in hospitalized patients.Eur Respir J.1999;13(6):1365–1370.
- ,,A highly sensitive ELISA D‐dimer increases testing but not diagnosis of pulmonary embolism.Acad Emerg Med2006;13:519–524.
- ,,A comparison of enoxaparin with placebo for the prevention of venous thromboembolism in acutely ill medical patients. Prophylaxis in Medical Patients with Enoxaparin Study Group.N Engl J Med.1999;341(11):793–800.
- ,,,,The incidence of symptomatic venous thromboembolism after enoxaparin prophylaxis in lower extremity arthroplasty: a cohort study of 1,984 patients.Canadian Collaborative Group.1998;114:115S–118S.
- ,,,,Impact of reliance on CT pulmonary angiography on diagnosis of pulmonary embolism: a Bayesian analysis.J Hosp Med.2006;1:81–87.
- The PIOPED investigators: Value of the ventilation‐perfusion scan in acute pulmonary embolism.JAMA.1990;263:2753–2759.
- ,,, et al.Non‐invasive diagnosis of venous thromboembolism in outpatients.Lancet.353:190–195.
Copyright © 2011 Society of Hospital Medicine
Bacterial Contamination of Work Wear
In September 2007, the British Department of Health developed guidelines for health care workers regarding uniforms and work wear that banned the traditional white coat and other long‐sleeved garments in an attempt to decrease nosocomial bacterial transmission.1 Similar policies have recently been adopted in Scotland.2 Interestingly, the National Health Service report acknowledged that evidence was lacking that would support that white coats and long‐sleeved garments caused nosocomial infection.1, 3 Although many studies have documented that health care work clothes are contaminated with bacteria, including methicillin‐resistant Staphylococcal aureus (MRSA) and other pathogenic species,413 none have determined whether avoiding white coats and switching to short‐sleeved garments decreases bacterial contamination.
We performed a prospective, randomized, controlled trial designed to compare the extent of bacterial contamination of physicians' white coats with that of newly laundered, standardized short‐sleeved uniforms. Our hypotheses were that infrequently cleaned white coats would have greater bacterial contamination than uniforms, that the extent of contamination would be inversely related to the frequency with which the coats were washed, and that the increased contamination of the cuffs of the white coats would result in increased contamination of the skin of the wrists. Our results led us also to assess the rate at which bacterial contamination of short‐sleeved uniforms occurs during the workday.
Methods
The study was conducted at Denver Health, a university‐affiliated public safety‐net hospital and was approved by the Colorado Multiple Institutional Review Board.
Trial Design
The study was a prospective, randomized, controlled trial. No protocol changes occurred during the study.
Participants
Participants included residents and hospitalists directly caring for patients on internal medicine units between August 1, 2008 and November 15, 2009.
Intervention
Subjects wore either a standard, newly laundered, short‐sleeved uniform or continued to wear their own white coats.
Outcomes
The primary end point was the percentage of subjects contaminated with MRSA. Cultures were collected using a standardized RODAC imprint method14 with BBL RODAC plates containing trypticase soy agar with lecithin and polysorbate 80 (Becton Dickinson, Sparks, MD) 8 hours after the physicians started their work day. All physicians had cultures obtained from the breast pocket and sleeve cuff (long‐sleeved for the white coats, short‐sleeved for the uniforms) and from the skin of the volar surface of the wrist of their dominant hand. Those wearing white coats also had cultures obtained from the mid‐biceps level of the sleeve of the dominant hand, as this location closely approximated the location of the cuffs of the short‐sleeved uniforms.
Cultures were incubated in ambient air at 35C‐37C for 1822 hours. After incubation, visible colonies were counted using a dissecting microscope to a maximum of 200 colonies at the recommendation of the manufacturer. Colonies that were morphologically consistent with Staphylococcus species by colony growth and Gram stain were further tested for coagulase using a BactiStaph rapid latex agglutination test (Remel, Lenexa, KS). If positive, these colonies were subcultured to sheep blood agar (Remel, Lenexa, KS) and BBL MRSA Chromagar (Becton Dickinson, Sparks, MD) and incubated for an additional 1824 hours. Characteristic growth on blood agar that also produced mauve‐colored colonies on chromagar was taken to indicate MRSA.
A separate set of 10 physicians donned newly laundered, short‐sleeved uniforms at 6:30 AM for culturing from the breast pocket and sleeve cuff of the dominant hand prior to and 2.5, 5, and 8 hours after they were donned by the participants (with culturing of each site done on separate days to avoid the effects of obtaining multiple cultures at the same site on the same day). These cultures were not assessed for MRSA.
At the time that consent was obtained, all participants completed an anonymous survey that assessed the frequency with which they normally washed or changed their white coats.
Sample Size
Based on the finding that 20% of our first 20 participants were colonized with MRSA, we determined that to find a 25% difference in the percentage of subjects colonized with MRSA in the 2 groups, with a power of 0.8 and P < 0.05 being significant (2‐sided Fisher's exact test), 50 subjects would be needed in each group.
Randomization
Randomization of potential participants occurred 1 day prior to the study using a computer‐generated table of random numbers. The principal investigator and a coinvestigator enrolled participants. Consent was obtained from those randomized to wear a newly laundered standard short‐sleeved uniform at the time of randomization so that they could don the uniforms when arriving at the hospital the following morning (at approximately 6:30 AM). Physicians in this group were also instructed not to wear their white coats at any time during the day they were wearing the uniforms. Physicians randomized to wear their own white coats were not notified or consented until the day of the study, a few hours prior to the time the cultures were obtained. This approach prevented them from either changing their white coats or washing them prior to the time the cultures were taken.
Because our study included both employees of the hospital and trainees, a number of protection measures were required. No information of any sort was collected about those who agreed or refused to participate in the study. In addition, the request to participate in the study did not come from the person's direct supervisor.
Statistical Methods
All data were collected and entered using Excel for Mac 2004 version 11.5.4. All analyses were performed using SAS Enterprise Guide 4.1 (SAS Institute, Inc., Cary, NC).
The Wilcoxon rank‐sum test and chi square analysis were used to seek differences in colony count and percentage of cultures with MRSA, respectively, in cultures obtained: (1) from the sleeve cuffs and pockets of the white coats compared with those from the sleeve cuffs and pockets of the uniforms, (2) from the sleeve cuffs of the white coats compared with those from the sleeve cuffs of the short‐sleeved uniforms, (3) from the mid‐biceps area of the sleeve sof the white coats compared with those from the sleeve cuffs of the uniforms, and (4) from the skin of the wrists of those wearing white coats compared with those wearing the uniforms. Bonferroni's correction for multiple comparisons was applied, with a P < 0.125 indicating significance.
Friedman's test and repeated‐measures logistic regression were used to seek differences in colony count or of the percentage of cultures with MRSA, respectively, on white coats or uniforms by site of culture on both garments. A P < 0.05 indicated significance for these analyses.
The Kruskal‐Wallis and chi‐square tests were utilized to test the effect of white coat wash frequency on colony count and MRSA contamination, respectively.
All data are presented as medians with 95% confidence intervals or proportions.
Results
Participant Flow
Fifty physicians were studied in each group, all of whom completed the survey. In general, more than 95% of potential participants approached agreed to participate in the study (Figure 1).

Recruitment
The first and last physicians were studied in August 2008 and November 2009, respectively. The trial ended when the specified number of participants (50 in each group) had been enrolled.
Data on Entry
No data were recorded from the participants at the time of randomization in compliance with institutional review board regulations pertaining to employment issues that could arise when studying members of the workforce.
Outcomes
No significant differences were found between the colony counts cultured from white coats (104 [80127]) versus newly laundered uniforms (142 [83213]), P = 0.61. No significant differences were found between the colony counts cultured from the sleeve cuffs of the white coats (58.5 [4866]) versus the uniforms (37 [2768]), P = 0.07, or between the colony counts cultured from the pockets of the white coats (45.5 [3254]) versus the uniforms (74.5 [4897], P = 0.040. Bonferroni corrections were used for multiple comparisons such that a P < 0.0125 was considered significant. Cultures from at least 1 site of 8 of 50 physicians (16%) wearing white coats and 10 of 50 physicians (20%) wearing short‐sleeved uniforms were positive for MRSA (P = .60).
Colony counts were greater in cultures obtained from the sleeve cuffs of the white coats compared with the pockets or mid‐biceps area (Table 1). For the uniforms, no difference in colony count in cultures from the pockets versus sleeve cuffs was observed. No difference was found when comparing the number of subjects with MRSA contamination of the 3 sites of the white coats or the 2 sites of the uniforms (Table 1).
| White Coat (n = 50) | P | Uniforms (n = 50) | P | |
|---|---|---|---|---|
| Colony count, median (95% CI) | ||||
| Sleeve cuff | 58.5 (4866) | < 0.0001 | 37.0 (2768) | 0.25 |
| 45.5 (3254) | 74.5 (4897) | |||
| Mid‐biceps area of sleeve | 25.5 (2029) | |||
| MRSA contamination, n (%) | ||||
| Sleeve cuff | 4 (8%) | 0.71 | 6 (12%) | 0.18 |
| 5 (10%) | 9 (18%) | |||
| Mid‐biceps area of sleeve | 3 (6%) |
No difference was observed with respect to colony count or the percentage of subjects positive for MRSA in cultures obtained from the mid‐biceps area of the white coats versus those from the cuffs of the short‐sleeved uniforms (Table 2).
| White Coat Mid‐Biceps (n = 50) | Uniform Sleeve Cuff (n = 50) | P | |
|---|---|---|---|
| Colony count, median (95% CI) | 25.5 (2029) | 37.0 (2768) | 0.07 |
| MRSA contamination, n (%) | 3 (6%) | 6 (12%) | 0.49 |
No difference was observed with respect to colony count or the percentage of subjects positive for MRSA in cultures obtained from the volar surface of the wrists of subjects wearing either of the 2 garments (Table 3).
| White Coat (n = 50) | Uniform (n = 50) | P | |
|---|---|---|---|
| Colony count, median (95% CI) | 23.5 (1740) | 40.5 (2859) | 0.09 |
| MRSA Contamination, n (% of subjects) | 3 (6%) | 5 (10%) | 0.72 |
The frequency with which physicians randomized to wearing their white coats admitted to washing or changing their coats varied markedly (Table 4). No significant differences were found with respect to total colony count (P = 0.81), colony count by site (data not shown), or percentage of physicians contaminated with MRSA (P = 0.22) as a function of washing or changing frequency (Table 4).
| White Coat Washing Frequency | Number of Subjects (%) | Total Colony Count (All Sites), Median (95% CI) | Number with MRSA Contamination, n (%) |
|---|---|---|---|
| Weekly | 15 (30%) | 124 (107229) | 1 (7%) |
| Every 2 weeks | 21 (42%) | 156 (90237) | 6 (29%) |
| Every 4 weeks | 8 (16%) | 89 (41206) | 0 (0%) |
| Every 8 weeks | 5 (10%) | 140 (58291) | 2 (40%) |
| Rarely | 1 (2%) | 150 | 0 (0%) |
Sequential culturing showed that the newly laundered uniforms were nearly sterile prior to putting them on. By 3 hours of wear, however, nearly 50% of the colonies counted at 8 hours were already present (Figure 2).

Harms
No adverse events occurred during the course of the study in either group.
Discussion
The important findings of this study are that, contrary to our hypotheses, at the end of an 8‐hour workday, no significant differences were found between the extent of bacterial or MRSA contamination of infrequently washed white coats compared with those of newly laundered uniforms, no difference was observed with respect to the extent of bacterial or MRSA contamination of the wrists of physicians wearing either of the 2 garments, and no association was apparent between the extent of bacterial or MRSA contamination and the frequency with which white coats were washed or changed. In addition, we also found that bacterial contamination of newly laundered uniforms occurred within hours of putting them on.
Interpretation
Numerous studies have demonstrated that white coats and uniforms worn by health care providers are frequently contaminated with bacteria, including both methicillin‐sensitive and ‐resistant Staphylococcus aureus and other pathogens.413 This contamination may come from nasal or perineal carriage of the health care provider, from the environment, and/or from patients who are colonized or infected.11, 15 Although many have suggested that patients can become contaminated from contact with health care providers' clothing and studies employing pulsed‐field gel electrophoresis and other techniques have suggested that cross‐infection can occur,10, 1618 others have not confirmed this contention,19, 20 and Lessing and colleagues16 concluded that transmission from staff to patients was a rare phenomenon. The systematic review reported to the Department of Health in England,3 the British Medical Association guidelines regarding dress codes for doctors,21 and the department's report on which the new clothing guidelines were based1 concluded there was no conclusive evidence indicating that work clothes posed a risk of spreading infection to patients. Despite this, the Working Group and the British Medical Association recommended that white coats should not be worn when providing patient care and that shirts and blouses should be short‐sleeved.1 Recent evidence‐based reviews concluded that there was insufficient evidence to justify this policy,3, 22 and our data indicate that the policy will not decrease bacterial or MRSA contamination of physicians' work clothes or skin.
The recommendation that long‐sleeved clothing should be avoided comes from studies indicating that cuffs of these garments are more heavily contaminated than other areas5, 8 and are more likely to come in contact with patients.1 Wong and colleagues5 reported that cuffs and lower front pockets had greater contamination than did the backs of white coats, but no difference was seen in colony count from cuffs compared with pockets. Loh and colleagues8 found greater bacterial contamination on the cuffs than on the backs of white coats, but their conclusion came from comparing the percentage of subjects with selected colony counts (ie, between 100 and 199 only), and the analysis did not adjust for repeated sampling of each participant. Apparently, colony counts from the cuffs were not different than those from the pockets. Callaghan7 found that contamination of nursing uniforms was equal at all sites. We found that sleeve cuffs of white coats had slightly but significantly more contamination with bacteria than either the pocket or the midsleeve areas, but interestingly, we found no difference in colony count from cultures taken from the skin at the wrists of the subjects wearing either garment. We found no difference in the extent of bacterial contamination by site in the subjects wearing short‐sleeved uniforms or in the percentage of subjects contaminated with MRSA by site of culture of either garment.
Contrary to our hypothesis, we found no association between the frequency with which white coats were changed or washed and the extent of bacterial contamination, despite the physicians having admitted to washing or changing their white coats infrequently (Table 4). Similar findings were reported by Loh and colleagues8 and by Treakle and colleagues.12
Our finding that contamination of clean uniforms happens rapidly is consistent with published data. Speers and colleagues4 found increasing contamination of nurses' aprons and dresses comparing samples obtained early in the day with those taken several hours later. Boyce and colleagues6 found that 65% of nursing uniforms were contaminated with MRSA after performing morning patient‐care activities on patients with MRSA wound or urine infections. Perry and colleagues9 found that 39% of uniforms that were laundered at home were contaminated with MRSA, vancomycin‐resistant enterococci, or Clostridium difficile at the beginning of the work shift, increasing to 54% by the end of a 24‐hour shift, and Babb and colleagues20 found that nearly 100% of nurses' gowns were contaminated within the first day of use (33% with Staphylococcus aureus). Dancer22 recently suggested that if staff were afforded clean coats every day, it is possible that concerns over potential contamination would be less of an issue. Our data suggest, however, that work clothes would have to be changed every few hours if the intent were to reduce bacterial contamination.
Limitations
Our study has a number of potential limitations. The RODAC imprint method only sampled a small area of both the white coats and the uniforms, and accordingly, the culture data might not accurately reflect the total degree of contamination. However, we cultured 3 areas on the white coats and 2 on the uniforms, including areas thought to be more heavily contaminated (sleeve cuffs of white coats). Although this area had greater colony counts, the variation in bacterial and MRSA contamination from all areas was small.
We did not culture the anterior nares to determine if the participants were colonized with MRSA. Normal health care workers have varying degrees of nasal colonization with MRSA, and this could account for some of the 16%‐20% MRSA contamination rate we observed. However, previous studies have shown that nasal colonization of healthcare workers only minimally contributes to uniform contamination.4
Although achieving good hand hygiene compliance has been a major focus at our hospital, we did not track the hand hygiene compliance of the physicians in either group. Accordingly, not finding reduced bacterial contamination in those wearing short‐sleeved uniforms could be explained if physicians in this group had systematically worse hand‐washing compliance than those randomized to wearing their own white coats. Our use of concurrent controls limits this possibility, as does that during the time of this study, hand hygiene compliance (assessed by monthly surreptitious observation) was approximately 90% throughout the hospital.
Despite the infrequent wash frequencies reported, the physicians' responses to the survey could have overestimated the true wash frequency as a result of the Hawthorne effect. The colony count and MRSA contamination rates observed, however, suggest that even if this occurred, it would not have altered our conclusion that bacterial contamination was not associated with wash frequency.
Generalizability
Because data were collected from a single, university‐affiliated public teaching hospital from hospitalists and residents working on the internal medicine service, the results might not be generalizable to other types of institutions, other personnel, or other services.
In conclusion, bacterial contamination of work clothes occurs within the first few hours after donning them. By the end of an 8‐hour work day, we found no data supporting the contention that long‐sleeved white coats were more heavily contaminated than were short‐sleeved uniforms. Our data do not support discarding white coats for uniforms that are changed on a daily basis or for requiring health care workers to avoid long‐sleeved garments.
Acknowledgements
The authors thank Henry Fonseca and his team for providing our physician uniforms. They also thank the Denver Health Department of Medicine Small Grants program for supporting this study.
- Department of Health. Uniforms and workwear: an evidence base for developing local policy. National Health Service, September 17, 2007. Available at: http://www.dh.gov.uk/en/Publicationsandstatistics/Publications/Publicationspolicyandguidance/DH_078433. Accessed January 29,2010.
- Scottish Government Health Directorates. NHS Scotland Dress Code. Available at: http://www.sehd.scot.nhs.uk/mels/CEL2008_53.pdf. Accessed February 10,2010.
- ,,,.Uniform: an evidence review of the microbiological significance of uniforms and uniform policy in the prevention and control of healthcare‐associated infections. Report to the Department of Health (England).J Hosp Infect.2007;66:301–307.
- ,,,.Contamination of nurses' uniforms with Staphylococcus aureus.Lancet.1969;2:233–235.
- ,,.Microbial flora on doctors' white coats.Brit Med J.1991;303:1602–1604.
- ,,,.Environmental contamination due to methicillin‐resistant Staphylococcus aureus: possible infection control implications.Infect Control Hosp Epidemiol.1997;18:622–627.
- ,Bacterial contamination of nurses' uniforms: a study.Nursing Stand.1998;13:37–42.
- ,,.Bacterial flora on the white coats of medical students.J Hosp Infection.2000;45:65–68.
- ,,.Bacterial contamination of uniforms.J Hosp Infect.2001;48:238–241.
- ,,, et al.Significance of methicillin‐resistant Staphylococcus aureus (MRSA) survey in a university teaching hospital.J Infec Chemother.2003;9:172–177.
- ,,, et al.Detection of methicillin‐resistant Staphylococcus aureus and vancomycin‐resistant enterococci on the gowns and gloves of healthcare workers.Infect Control Hosp Epidemiol2008;29 (7):583–9.
- ,,,,,.Bacterial contamination of health care workers' white coats.Am J Infect Control.2009;37:101–105.
- ,,,,,.Meticillin‐resistant Staphylococcus aureus contamination of healthcare workers' uniforms in long‐term care facilities.J Hosp Infect.2009;71:170–175.
- ,,,,.Comparison of the Rodac imprint method to selective enrichment broth for recovery of vancomycin‐resistant enterococci and drug‐resistant Enterobacteriaceae from environmental surfaces.J Clin Microbiol.2000;38:4646–4648.
- ,,.Effect of clothing on dispersal of Staphylococcus aureus by males and females.Lancet.1974;2:1131–1133.
- ,,.When should healthcare workers be screened for methicillin‐resistant Staphylococcus aureus?J Hosp Infect.1996;34:205–210.
- ,,.Methicillin‐resistant Staphylococcus aureus transmission: the possible importance of unrecognized health care worker carriage.Am J Infect Control.2008;36:93–97.
- ,,, et al.Methicillin‐resistant Staphylococcus aureus carriage, infection and transmission in dialysis patients, healthcare workers and their family members.Nephrol Dial Transplant.2008;23:1659–1665.
- ,,.Are active microbiological surveillance and subsequent isolation needed to prevent the spread of methicillin‐resistant Staphylococcus aureus.Clin Infect Dis.2005;40:405–409.
- ,,.Contamination of protective clothing and nurses' uniforms in an isolation ward.J Hosp Infect.1983;4:149–157.
- British Medical Association. Uniform and dress code for doctors. December 6, 2007. Available at: http://www.bma.org.uk/employmentandcontracts/working_arrangements/CCSCdresscode051207.jsp. Accessed February 9,2010.
- .Pants, policies and paranoia.J Hosp Infect.2010;74:10–15.
In September 2007, the British Department of Health developed guidelines for health care workers regarding uniforms and work wear that banned the traditional white coat and other long‐sleeved garments in an attempt to decrease nosocomial bacterial transmission.1 Similar policies have recently been adopted in Scotland.2 Interestingly, the National Health Service report acknowledged that evidence was lacking that would support that white coats and long‐sleeved garments caused nosocomial infection.1, 3 Although many studies have documented that health care work clothes are contaminated with bacteria, including methicillin‐resistant Staphylococcal aureus (MRSA) and other pathogenic species,413 none have determined whether avoiding white coats and switching to short‐sleeved garments decreases bacterial contamination.
We performed a prospective, randomized, controlled trial designed to compare the extent of bacterial contamination of physicians' white coats with that of newly laundered, standardized short‐sleeved uniforms. Our hypotheses were that infrequently cleaned white coats would have greater bacterial contamination than uniforms, that the extent of contamination would be inversely related to the frequency with which the coats were washed, and that the increased contamination of the cuffs of the white coats would result in increased contamination of the skin of the wrists. Our results led us also to assess the rate at which bacterial contamination of short‐sleeved uniforms occurs during the workday.
Methods
The study was conducted at Denver Health, a university‐affiliated public safety‐net hospital and was approved by the Colorado Multiple Institutional Review Board.
Trial Design
The study was a prospective, randomized, controlled trial. No protocol changes occurred during the study.
Participants
Participants included residents and hospitalists directly caring for patients on internal medicine units between August 1, 2008 and November 15, 2009.
Intervention
Subjects wore either a standard, newly laundered, short‐sleeved uniform or continued to wear their own white coats.
Outcomes
The primary end point was the percentage of subjects contaminated with MRSA. Cultures were collected using a standardized RODAC imprint method14 with BBL RODAC plates containing trypticase soy agar with lecithin and polysorbate 80 (Becton Dickinson, Sparks, MD) 8 hours after the physicians started their work day. All physicians had cultures obtained from the breast pocket and sleeve cuff (long‐sleeved for the white coats, short‐sleeved for the uniforms) and from the skin of the volar surface of the wrist of their dominant hand. Those wearing white coats also had cultures obtained from the mid‐biceps level of the sleeve of the dominant hand, as this location closely approximated the location of the cuffs of the short‐sleeved uniforms.
Cultures were incubated in ambient air at 35C‐37C for 1822 hours. After incubation, visible colonies were counted using a dissecting microscope to a maximum of 200 colonies at the recommendation of the manufacturer. Colonies that were morphologically consistent with Staphylococcus species by colony growth and Gram stain were further tested for coagulase using a BactiStaph rapid latex agglutination test (Remel, Lenexa, KS). If positive, these colonies were subcultured to sheep blood agar (Remel, Lenexa, KS) and BBL MRSA Chromagar (Becton Dickinson, Sparks, MD) and incubated for an additional 1824 hours. Characteristic growth on blood agar that also produced mauve‐colored colonies on chromagar was taken to indicate MRSA.
A separate set of 10 physicians donned newly laundered, short‐sleeved uniforms at 6:30 AM for culturing from the breast pocket and sleeve cuff of the dominant hand prior to and 2.5, 5, and 8 hours after they were donned by the participants (with culturing of each site done on separate days to avoid the effects of obtaining multiple cultures at the same site on the same day). These cultures were not assessed for MRSA.
At the time that consent was obtained, all participants completed an anonymous survey that assessed the frequency with which they normally washed or changed their white coats.
Sample Size
Based on the finding that 20% of our first 20 participants were colonized with MRSA, we determined that to find a 25% difference in the percentage of subjects colonized with MRSA in the 2 groups, with a power of 0.8 and P < 0.05 being significant (2‐sided Fisher's exact test), 50 subjects would be needed in each group.
Randomization
Randomization of potential participants occurred 1 day prior to the study using a computer‐generated table of random numbers. The principal investigator and a coinvestigator enrolled participants. Consent was obtained from those randomized to wear a newly laundered standard short‐sleeved uniform at the time of randomization so that they could don the uniforms when arriving at the hospital the following morning (at approximately 6:30 AM). Physicians in this group were also instructed not to wear their white coats at any time during the day they were wearing the uniforms. Physicians randomized to wear their own white coats were not notified or consented until the day of the study, a few hours prior to the time the cultures were obtained. This approach prevented them from either changing their white coats or washing them prior to the time the cultures were taken.
Because our study included both employees of the hospital and trainees, a number of protection measures were required. No information of any sort was collected about those who agreed or refused to participate in the study. In addition, the request to participate in the study did not come from the person's direct supervisor.
Statistical Methods
All data were collected and entered using Excel for Mac 2004 version 11.5.4. All analyses were performed using SAS Enterprise Guide 4.1 (SAS Institute, Inc., Cary, NC).
The Wilcoxon rank‐sum test and chi square analysis were used to seek differences in colony count and percentage of cultures with MRSA, respectively, in cultures obtained: (1) from the sleeve cuffs and pockets of the white coats compared with those from the sleeve cuffs and pockets of the uniforms, (2) from the sleeve cuffs of the white coats compared with those from the sleeve cuffs of the short‐sleeved uniforms, (3) from the mid‐biceps area of the sleeve sof the white coats compared with those from the sleeve cuffs of the uniforms, and (4) from the skin of the wrists of those wearing white coats compared with those wearing the uniforms. Bonferroni's correction for multiple comparisons was applied, with a P < 0.125 indicating significance.
Friedman's test and repeated‐measures logistic regression were used to seek differences in colony count or of the percentage of cultures with MRSA, respectively, on white coats or uniforms by site of culture on both garments. A P < 0.05 indicated significance for these analyses.
The Kruskal‐Wallis and chi‐square tests were utilized to test the effect of white coat wash frequency on colony count and MRSA contamination, respectively.
All data are presented as medians with 95% confidence intervals or proportions.
Results
Participant Flow
Fifty physicians were studied in each group, all of whom completed the survey. In general, more than 95% of potential participants approached agreed to participate in the study (Figure 1).
Recruitment
The first and last physicians were studied in August 2008 and November 2009, respectively. The trial ended when the specified number of participants (50 in each group) had been enrolled.
Data on Entry
No data were recorded from the participants at the time of randomization in compliance with institutional review board regulations pertaining to employment issues that could arise when studying members of the workforce.
Outcomes
No significant differences were found between the colony counts cultured from white coats (104 [80127]) versus newly laundered uniforms (142 [83213]), P = 0.61. No significant differences were found between the colony counts cultured from the sleeve cuffs of the white coats (58.5 [4866]) versus the uniforms (37 [2768]), P = 0.07, or between the colony counts cultured from the pockets of the white coats (45.5 [3254]) versus the uniforms (74.5 [4897], P = 0.040. Bonferroni corrections were used for multiple comparisons such that a P < 0.0125 was considered significant. Cultures from at least 1 site of 8 of 50 physicians (16%) wearing white coats and 10 of 50 physicians (20%) wearing short‐sleeved uniforms were positive for MRSA (P = .60).
Colony counts were greater in cultures obtained from the sleeve cuffs of the white coats compared with the pockets or mid‐biceps area (Table 1). For the uniforms, no difference in colony count in cultures from the pockets versus sleeve cuffs was observed. No difference was found when comparing the number of subjects with MRSA contamination of the 3 sites of the white coats or the 2 sites of the uniforms (Table 1).
| White Coat (n = 50) | P | Uniforms (n = 50) | P | |
|---|---|---|---|---|
| Colony count, median (95% CI) | ||||
| Sleeve cuff | 58.5 (4866) | < 0.0001 | 37.0 (2768) | 0.25 |
| 45.5 (3254) | 74.5 (4897) | |||
| Mid‐biceps area of sleeve | 25.5 (2029) | |||
| MRSA contamination, n (%) | ||||
| Sleeve cuff | 4 (8%) | 0.71 | 6 (12%) | 0.18 |
| 5 (10%) | 9 (18%) | |||
| Mid‐biceps area of sleeve | 3 (6%) |
No difference was observed with respect to colony count or the percentage of subjects positive for MRSA in cultures obtained from the mid‐biceps area of the white coats versus those from the cuffs of the short‐sleeved uniforms (Table 2).
| White Coat Mid‐Biceps (n = 50) | Uniform Sleeve Cuff (n = 50) | P | |
|---|---|---|---|
| Colony count, median (95% CI) | 25.5 (2029) | 37.0 (2768) | 0.07 |
| MRSA contamination, n (%) | 3 (6%) | 6 (12%) | 0.49 |
No difference was observed with respect to colony count or the percentage of subjects positive for MRSA in cultures obtained from the volar surface of the wrists of subjects wearing either of the 2 garments (Table 3).
| White Coat (n = 50) | Uniform (n = 50) | P | |
|---|---|---|---|
| Colony count, median (95% CI) | 23.5 (1740) | 40.5 (2859) | 0.09 |
| MRSA Contamination, n (% of subjects) | 3 (6%) | 5 (10%) | 0.72 |
The frequency with which physicians randomized to wearing their white coats admitted to washing or changing their coats varied markedly (Table 4). No significant differences were found with respect to total colony count (P = 0.81), colony count by site (data not shown), or percentage of physicians contaminated with MRSA (P = 0.22) as a function of washing or changing frequency (Table 4).
| White Coat Washing Frequency | Number of Subjects (%) | Total Colony Count (All Sites), Median (95% CI) | Number with MRSA Contamination, n (%) |
|---|---|---|---|
| Weekly | 15 (30%) | 124 (107229) | 1 (7%) |
| Every 2 weeks | 21 (42%) | 156 (90237) | 6 (29%) |
| Every 4 weeks | 8 (16%) | 89 (41206) | 0 (0%) |
| Every 8 weeks | 5 (10%) | 140 (58291) | 2 (40%) |
| Rarely | 1 (2%) | 150 | 0 (0%) |
Sequential culturing showed that the newly laundered uniforms were nearly sterile prior to putting them on. By 3 hours of wear, however, nearly 50% of the colonies counted at 8 hours were already present (Figure 2).
Harms
No adverse events occurred during the course of the study in either group.
Discussion
The important findings of this study are that, contrary to our hypotheses, at the end of an 8‐hour workday, no significant differences were found between the extent of bacterial or MRSA contamination of infrequently washed white coats compared with those of newly laundered uniforms, no difference was observed with respect to the extent of bacterial or MRSA contamination of the wrists of physicians wearing either of the 2 garments, and no association was apparent between the extent of bacterial or MRSA contamination and the frequency with which white coats were washed or changed. In addition, we also found that bacterial contamination of newly laundered uniforms occurred within hours of putting them on.
Interpretation
Numerous studies have demonstrated that white coats and uniforms worn by health care providers are frequently contaminated with bacteria, including both methicillin‐sensitive and ‐resistant Staphylococcus aureus and other pathogens.413 This contamination may come from nasal or perineal carriage of the health care provider, from the environment, and/or from patients who are colonized or infected.11, 15 Although many have suggested that patients can become contaminated from contact with health care providers' clothing and studies employing pulsed‐field gel electrophoresis and other techniques have suggested that cross‐infection can occur,10, 1618 others have not confirmed this contention,19, 20 and Lessing and colleagues16 concluded that transmission from staff to patients was a rare phenomenon. The systematic review reported to the Department of Health in England,3 the British Medical Association guidelines regarding dress codes for doctors,21 and the department's report on which the new clothing guidelines were based1 concluded there was no conclusive evidence indicating that work clothes posed a risk of spreading infection to patients. Despite this, the Working Group and the British Medical Association recommended that white coats should not be worn when providing patient care and that shirts and blouses should be short‐sleeved.1 Recent evidence‐based reviews concluded that there was insufficient evidence to justify this policy,3, 22 and our data indicate that the policy will not decrease bacterial or MRSA contamination of physicians' work clothes or skin.
The recommendation that long‐sleeved clothing should be avoided comes from studies indicating that cuffs of these garments are more heavily contaminated than other areas5, 8 and are more likely to come in contact with patients.1 Wong and colleagues5 reported that cuffs and lower front pockets had greater contamination than did the backs of white coats, but no difference was seen in colony count from cuffs compared with pockets. Loh and colleagues8 found greater bacterial contamination on the cuffs than on the backs of white coats, but their conclusion came from comparing the percentage of subjects with selected colony counts (ie, between 100 and 199 only), and the analysis did not adjust for repeated sampling of each participant. Apparently, colony counts from the cuffs were not different than those from the pockets. Callaghan7 found that contamination of nursing uniforms was equal at all sites. We found that sleeve cuffs of white coats had slightly but significantly more contamination with bacteria than either the pocket or the midsleeve areas, but interestingly, we found no difference in colony count from cultures taken from the skin at the wrists of the subjects wearing either garment. We found no difference in the extent of bacterial contamination by site in the subjects wearing short‐sleeved uniforms or in the percentage of subjects contaminated with MRSA by site of culture of either garment.
Contrary to our hypothesis, we found no association between the frequency with which white coats were changed or washed and the extent of bacterial contamination, despite the physicians having admitted to washing or changing their white coats infrequently (Table 4). Similar findings were reported by Loh and colleagues8 and by Treakle and colleagues.12
Our finding that contamination of clean uniforms happens rapidly is consistent with published data. Speers and colleagues4 found increasing contamination of nurses' aprons and dresses comparing samples obtained early in the day with those taken several hours later. Boyce and colleagues6 found that 65% of nursing uniforms were contaminated with MRSA after performing morning patient‐care activities on patients with MRSA wound or urine infections. Perry and colleagues9 found that 39% of uniforms that were laundered at home were contaminated with MRSA, vancomycin‐resistant enterococci, or Clostridium difficile at the beginning of the work shift, increasing to 54% by the end of a 24‐hour shift, and Babb and colleagues20 found that nearly 100% of nurses' gowns were contaminated within the first day of use (33% with Staphylococcus aureus). Dancer22 recently suggested that if staff were afforded clean coats every day, it is possible that concerns over potential contamination would be less of an issue. Our data suggest, however, that work clothes would have to be changed every few hours if the intent were to reduce bacterial contamination.
Limitations
Our study has a number of potential limitations. The RODAC imprint method only sampled a small area of both the white coats and the uniforms, and accordingly, the culture data might not accurately reflect the total degree of contamination. However, we cultured 3 areas on the white coats and 2 on the uniforms, including areas thought to be more heavily contaminated (sleeve cuffs of white coats). Although this area had greater colony counts, the variation in bacterial and MRSA contamination from all areas was small.
We did not culture the anterior nares to determine if the participants were colonized with MRSA. Normal health care workers have varying degrees of nasal colonization with MRSA, and this could account for some of the 16%‐20% MRSA contamination rate we observed. However, previous studies have shown that nasal colonization of healthcare workers only minimally contributes to uniform contamination.4
Although achieving good hand hygiene compliance has been a major focus at our hospital, we did not track the hand hygiene compliance of the physicians in either group. Accordingly, not finding reduced bacterial contamination in those wearing short‐sleeved uniforms could be explained if physicians in this group had systematically worse hand‐washing compliance than those randomized to wearing their own white coats. Our use of concurrent controls limits this possibility, as does that during the time of this study, hand hygiene compliance (assessed by monthly surreptitious observation) was approximately 90% throughout the hospital.
Despite the infrequent wash frequencies reported, the physicians' responses to the survey could have overestimated the true wash frequency as a result of the Hawthorne effect. The colony count and MRSA contamination rates observed, however, suggest that even if this occurred, it would not have altered our conclusion that bacterial contamination was not associated with wash frequency.
Generalizability
Because data were collected from a single, university‐affiliated public teaching hospital from hospitalists and residents working on the internal medicine service, the results might not be generalizable to other types of institutions, other personnel, or other services.
In conclusion, bacterial contamination of work clothes occurs within the first few hours after donning them. By the end of an 8‐hour work day, we found no data supporting the contention that long‐sleeved white coats were more heavily contaminated than were short‐sleeved uniforms. Our data do not support discarding white coats for uniforms that are changed on a daily basis or for requiring health care workers to avoid long‐sleeved garments.
Acknowledgements
The authors thank Henry Fonseca and his team for providing our physician uniforms. They also thank the Denver Health Department of Medicine Small Grants program for supporting this study.
- Department of Health. Uniforms and workwear: an evidence base for developing local policy. National Health Service, September 17, 2007. Available at: http://www.dh.gov.uk/en/Publicationsandstatistics/Publications/Publicationspolicyandguidance/DH_078433. Accessed January 29,2010.
- Scottish Government Health Directorates. NHS Scotland Dress Code. Available at: http://www.sehd.scot.nhs.uk/mels/CEL2008_53.pdf. Accessed February 10,2010.
- ,,,.Uniform: an evidence review of the microbiological significance of uniforms and uniform policy in the prevention and control of healthcare‐associated infections. Report to the Department of Health (England).J Hosp Infect.2007;66:301–307.
- ,,,.Contamination of nurses' uniforms with Staphylococcus aureus.Lancet.1969;2:233–235.
- ,,.Microbial flora on doctors' white coats.Brit Med J.1991;303:1602–1604.
- ,,,.Environmental contamination due to methicillin‐resistant Staphylococcus aureus: possible infection control implications.Infect Control Hosp Epidemiol.1997;18:622–627.
- ,Bacterial contamination of nurses' uniforms: a study.Nursing Stand.1998;13:37–42.
- ,,.Bacterial flora on the white coats of medical students.J Hosp Infection.2000;45:65–68.
- ,,.Bacterial contamination of uniforms.J Hosp Infect.2001;48:238–241.
- ,,, et al.Significance of methicillin‐resistant Staphylococcus aureus (MRSA) survey in a university teaching hospital.J Infec Chemother.2003;9:172–177.
- ,,, et al.Detection of methicillin‐resistant Staphylococcus aureus and vancomycin‐resistant enterococci on the gowns and gloves of healthcare workers.Infect Control Hosp Epidemiol2008;29 (7):583–9.
- ,,,,,.Bacterial contamination of health care workers' white coats.Am J Infect Control.2009;37:101–105.
- ,,,,,.Meticillin‐resistant Staphylococcus aureus contamination of healthcare workers' uniforms in long‐term care facilities.J Hosp Infect.2009;71:170–175.
- ,,,,.Comparison of the Rodac imprint method to selective enrichment broth for recovery of vancomycin‐resistant enterococci and drug‐resistant Enterobacteriaceae from environmental surfaces.J Clin Microbiol.2000;38:4646–4648.
- ,,.Effect of clothing on dispersal of Staphylococcus aureus by males and females.Lancet.1974;2:1131–1133.
- ,,.When should healthcare workers be screened for methicillin‐resistant Staphylococcus aureus?J Hosp Infect.1996;34:205–210.
- ,,.Methicillin‐resistant Staphylococcus aureus transmission: the possible importance of unrecognized health care worker carriage.Am J Infect Control.2008;36:93–97.
- ,,, et al.Methicillin‐resistant Staphylococcus aureus carriage, infection and transmission in dialysis patients, healthcare workers and their family members.Nephrol Dial Transplant.2008;23:1659–1665.
- ,,.Are active microbiological surveillance and subsequent isolation needed to prevent the spread of methicillin‐resistant Staphylococcus aureus.Clin Infect Dis.2005;40:405–409.
- ,,.Contamination of protective clothing and nurses' uniforms in an isolation ward.J Hosp Infect.1983;4:149–157.
- British Medical Association. Uniform and dress code for doctors. December 6, 2007. Available at: http://www.bma.org.uk/employmentandcontracts/working_arrangements/CCSCdresscode051207.jsp. Accessed February 9,2010.
- .Pants, policies and paranoia.J Hosp Infect.2010;74:10–15.
Copyright © 2011 Society of Hospital Medicine