User login
Gender Disparities for Academic Hospitalists
Gender disparities still exist for women in academic medicine.[1, 2, 3, 4, 5, 6, 7, 8, 9] The most recent data from the Association of American Medical Colleges (AAMC) show that although gender disparities are decreasing, women are still under‐represented in the assistant, associate, and full‐professor ranks as well as in leadership positions.[1]
Some studies indicate that gender differences are less evident when examining younger cohorts.[1, 10, 11, 12, 13] Hospital medicine emerged around 1996, when the term hospitalist was first coined.[14] The gender distribution of academic hospitalists is likely nearly equal,[15, 16] and they are generally younger physicians.[15, 17, 18, 19, 20] Accordingly, we questioned whether gender disparities existed in academic hospital medicine (HM) and, if so, whether these disparities were greater than those that might exist in academic general internal medicine (GIM).
METHODS
This study consisted of both prospective and retrospective observation of data collected for academic adult hospitalists and general internists who practice in the United States. It was approved by the Colorado Multiple Institutional Review Board.
Gender distribution was assessed with respect to: (1) academic HM and GIM faculty, (2) leadership (ie, division or section heads), and (3) scholarly work (ie, speaking opportunities and publications). Data were collected between October 1, 2012 and August 31, 2014.
Gender Distribution of Faculty and Division/Section Heads
All US internal medicine residency programs were identified from the list of members or affiliates of the AAMC that were fully accredited by the Liaison Committee on Medical Education[21] using the Graduate Medical Education Directory.[22] We then determined the primary training hospital(s) affiliated with each program and selected those that were considered to be university hospitals and eliminated those that did not have divisions or sections of HM or GIM. We determined the gender of the respective division/section heads on the basis of the faculty member's first name (and often from accompanying photos) as well as from information obtained via Internet searches and, if necessary, contacted the individual institutions via email or phone call(s). We also determined the number and gender of all of the HM and GIM faculty members in a random sample of 25% of these hospitals from information on their respective websites.
Gender Distribution for Scholarly Productivity
We determined the gender and specialty of all speakers at the Society of Hospital Medicine and the Society of General Internal Medicine national conferences from 2006 to 2012. A list of speakers at each conference was obtained from conference pamphlets or agendas that were available via Internet searches or obtained directly from the organization. We also determined whether each presenter was a featured speaker (defined as one whose talk was unopposed by other sessions), plenary speaker (defined as such in the conference pamphlets), or if they spoke in a group format (also as indicated in the conference pamphlets). Because of the low number of featured and plenary speakers, these data were combined. Faculty labeled as additional faculty when presenting in a group format were excluded as were speakers at precourses, those presenting abstracts, and those participating in interest group sessions.
For authorship, a PubMed search was used to identify all articles published in the Journal of Hospital Medicine (JHM) and the Journal of General Internal Medicine (JGIM) from January 1, 2006 through December 31, 2012, and the gender and specialty of all the first and last authors were determined as described above. Specialty was determined from the division, section or department affiliation indicated for each author and by Internet searches. In some instances, it was necessary to contact the authors or their departments directly to verify their specialty. When articles had only 1 author, the author was considered a first author.
Duplicate records (eg, same author, same journal) and articles without an author were excluded, as were authors who did not have an MD, DO, or MBBS degree and those who were not affiliated with an institution in the United States. All manuscripts, with the exception of errata, were analyzed together as well as in 3 subgroups: original research, editorials, and others.
A second investigator corroborated data regarding gender and specialty for all speakers and authors to strengthen data integrity. On the rare occasion when discrepancies were found, a third investigator adjudicated the results.
Definitions
Physicians were defined as being hospitalists if they were listed as a member of a division or section of HM on their publications or if Internet searches indicated that they were a hospitalist or primarily worked on inpatient medical services. Physicians were considered to be general internists if they were listed as such on their publications and their specialty could be verified in Web‐based searches. If physicians appeared to have changing roles over time, we attempted to assign their specialty based upon their role at the time the article was published or the presentation was delivered. If necessary, phone calls and/or emails were also done to determine the physician's specialty.
Analysis
REDCap, a secure, Web‐based application for building and managing online surveys and databases, was used to collect and manage all study data.[23] All analyses were performed using SAS Enterprise Guide 4.3 (SAS Institute, Inc., Cary, NC). A [2] test was used to compare proportions of male versus female physicians, and data from hospitalists versus general internists. Because we performed multiple comparisons when analyzing presentations and publications, a Bonferroni adjustment was made such that a P<0.0125 for presentations and P<0.006 (within specialty) or P<0.0125 (between specialty) for the publication analyses were considered significant. P<0.05 was considered significant for all other comparisons.
RESULTS
Gender Distribution of Faculty
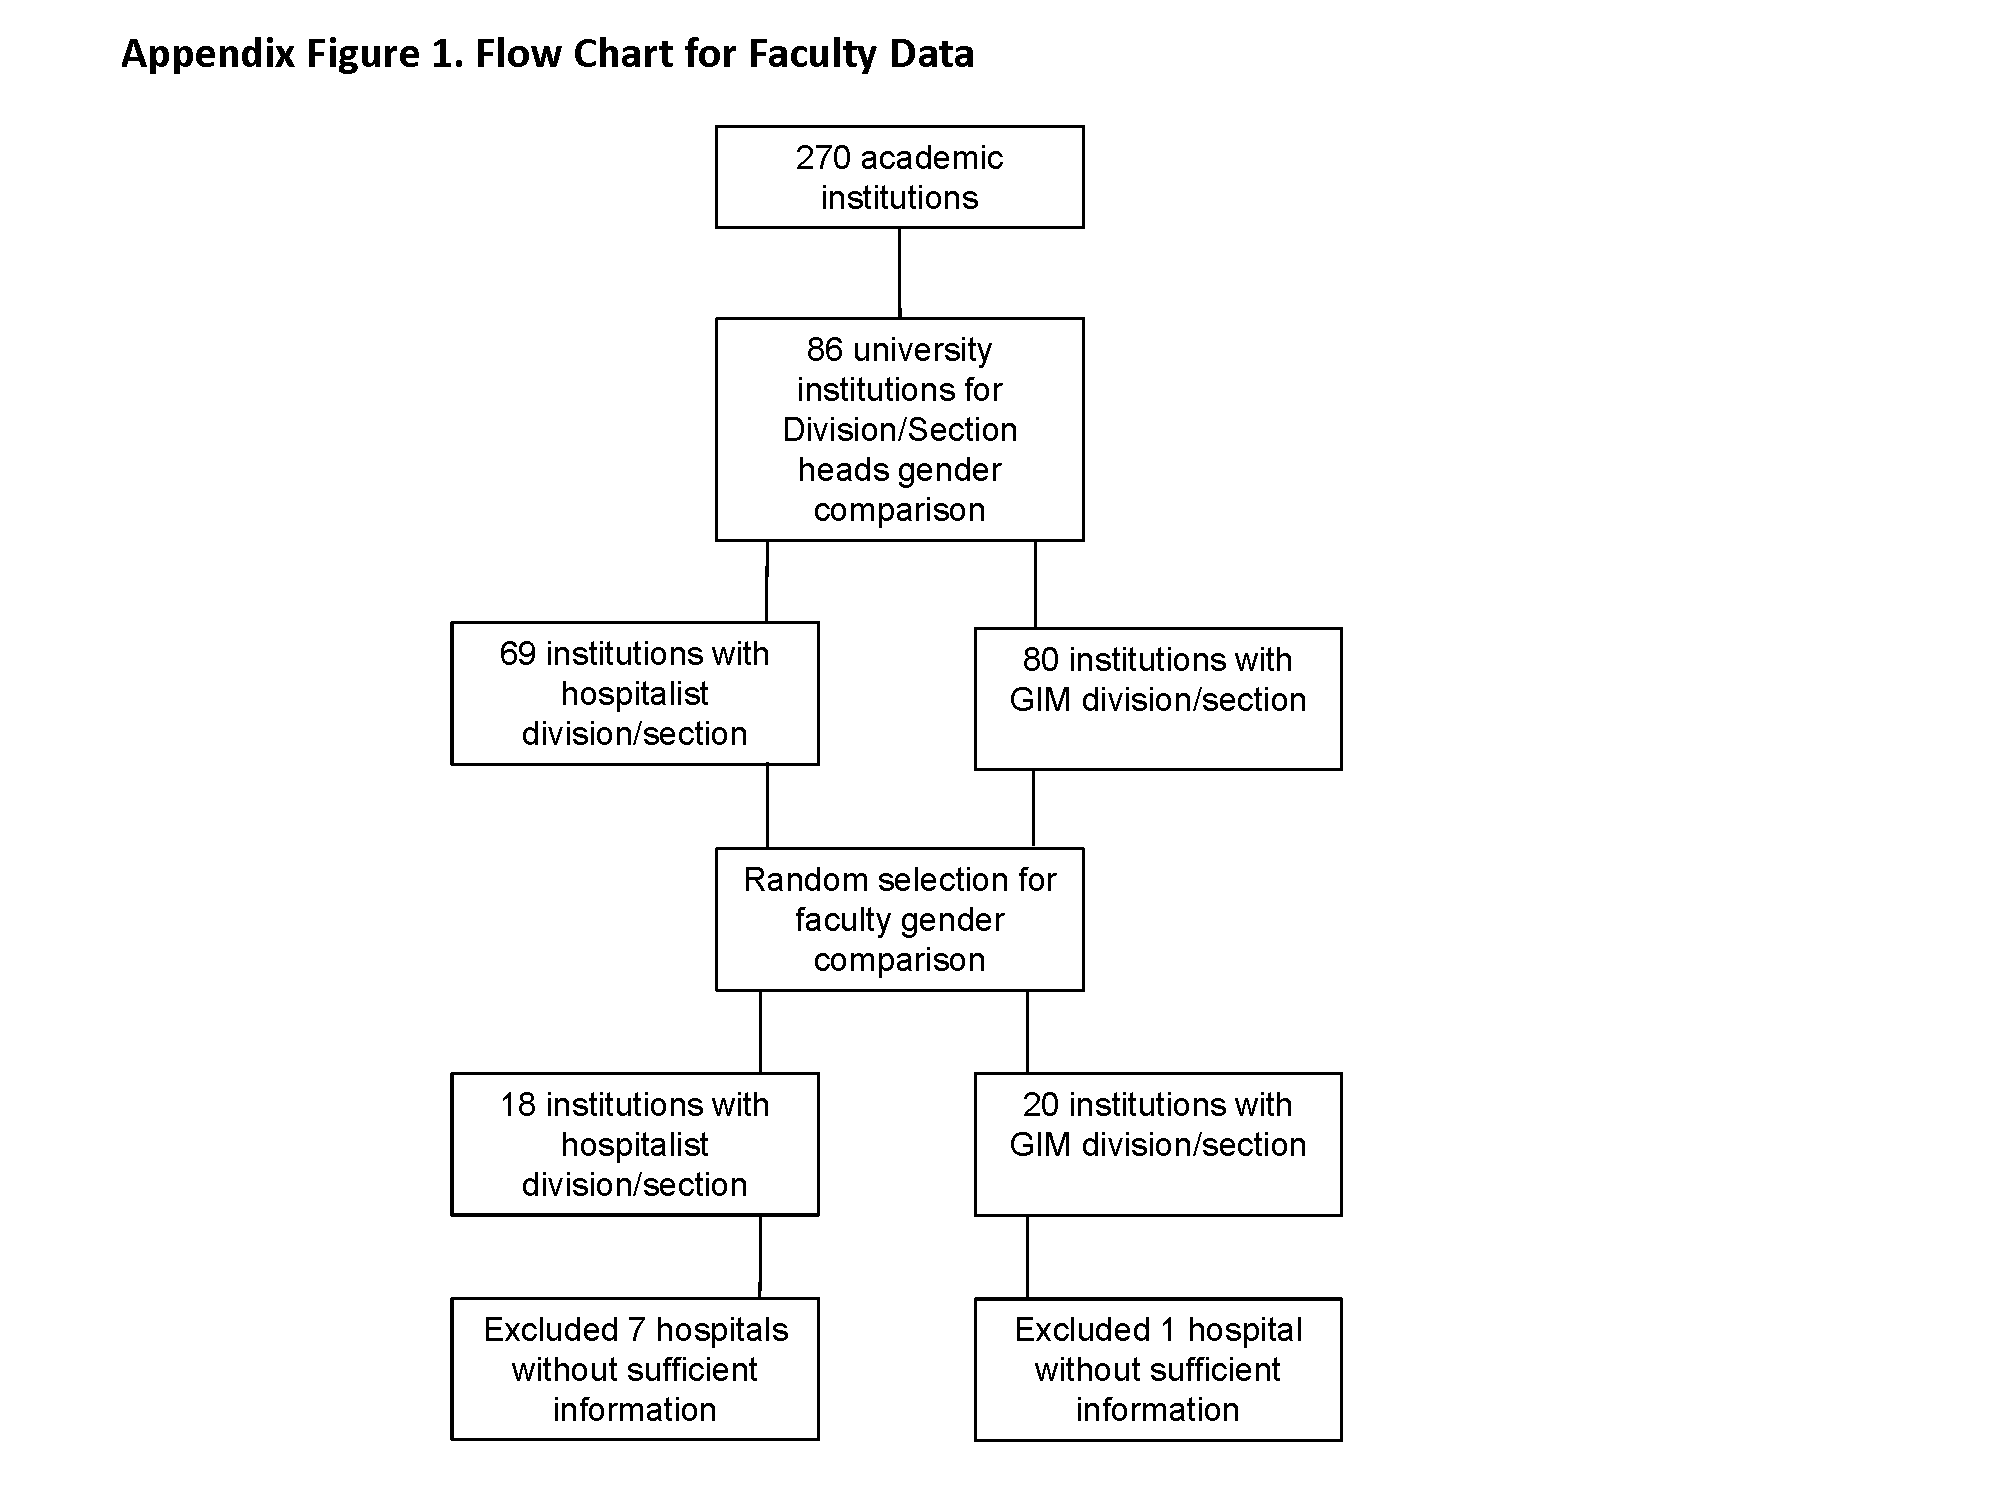
Eighteen HM and 20 GIM programs from university hospitals were randomly selected for review (see Supporting Figure 1 in the online version of this article). Seven of the HM programs and 1 of the GIM programs did not have a website, did not differentiate hospitalists from other faculty, or did not list their faculty on the website and were excluded from the analysis. In the remaining 11 HM programs and 19 GIM programs, women made up 277/568 (49%) and 555/1099 (51%) of the faculty, respectively (P=0.50).
Gender Distribution of Division/Section Heads
Eighty‐six of the programs were classified as university hospitals (see Supporting Figure 1 in the online version of this article), and in these, women led 11/69 (16%) of the HM divisions or sections and 28/80 (35%) of the GIM divisions (P=0.008).
Gender Distribution for Scholarly Productivity
Speaking Opportunities
A total of 1227 presentations were given at the 2 conferences from 2006 to 2012, with 1343 of the speakers meeting inclusion criteria (see Supporting Figure 2 in the online version of this article). Hospitalists accounted for 557 of the speakers, of which 146 (26%) were women. General internists accounted for 580 of the speakers, of which 291 (50%) were women (P<0.0001) (Table 1).
| Male, N (%) | Female, N (%) | |
|---|---|---|
| ||
| Hospitalists | ||
| All presentations | 411 (74) | 146 (26)* |
| Featured or plenary presentations | 49 (91) | 5 (9)* |
| General internists | ||
| All presentations | 289 (50) | 291 (50) |
| Featured or plenary presentations | 27 (55) | 22 (45) |
Of the 117 featured or plenary speakers, 54 were hospitalists and 5 (9%) of these were women. Of the 49 who were general internists, 22 (45%) were women (P<0.0001).
Authorship
The PubMed search identified a total of 3285 articles published in the JHM and the JGIM from 2006 to 2012, and 2172 first authors and 1869 last authors met inclusion criteria (see Supporting Figure 3 in the online version of this article). Hospitalists were listed as first or last authors on 464 and 305 articles, respectively, and of these, women were first authors on 153 (33%) and last authors on 63 (21%). General internists were listed as first or last authors on 895 and 769 articles, respectively, with women as first authors on 423 (47%) and last authors on 265 (34%). Compared with general internists, fewer women hospitalists were listed as either first or last authors (both P<0.0001) (Table 2).
| First Author | Last Author | |||
|---|---|---|---|---|
| Male, N (%) | Female, N (%) | Male, N (%) | Female, N (%) | |
| ||||
| Hospitalists | ||||
| All publications | 311 (67) | 153 (33)* | 242 (79) | 63 (21)* |
| Original investigations/brief reports | 124 (61) | 79 (39)* | 96 (76) | 30 (24)* |
| Editorials | 34 (77) | 10 (23)* | 18 (86) | 3 (14)* |
| Other | 153 (71) | 64 (29)* | 128 (81) | 30 (19)* |
| General internists | ||||
| All publications | 472 (53) | 423 (47) | 504 (66) | 265 (34)* |
| Original investigations/brief reports | 218 (46) | 261 (54) | 310 (65) | 170 (35)* |
| Editorial | 98 (68) | 46 (32)* | 43 (73) | 16 (27)* |
| Other | 156 (57) | 116 (43) | 151 (66) | 79 (34)* |
Fewer women hospitalists were listed as first or last authors on all article types. For original research articles written by general internists, there was a trend for more women to be listed as first authors than men (261/479, 54%), but this difference was not statistically significant.
DISCUSSION
The important findings of this study are that, despite an equal gender distribution of academic HM and GIM faculty, fewer women were HM division/section chiefs, fewer women were speakers at the 2 selected national meetings, and fewer women were first or last authors of publications in 2 selected journals in comparison with general internists.
Previous studies have found that women lag behind their male counterparts with respect to academic productivity, leadership, and promotion.[1, 5, 7] Some studies suggest, however, that gender differences are reduced when younger cohorts are examined.[1, 10, 11, 12, 13] Surveys indicate that that the mean age of hospitalists is younger than most other specialties.[15, 19, 20, 24] The mean age of academic GIM physicians is unknown, but surveys of GIM (not differentiating academic from nonacademic) suggest that it is an older cohort than that of HM.[24] Despite hospitalists being a younger cohort, we found gender disparities in all areas investigated.
Our findings with respect to gender disparities in HM division or section leadership are consistent with the annual AAMC Women in US Academic Medicine and Science Benchmarking Report that found only 22% of all permanent division or section heads were women.[1]
Gender disparities with respect to authorship of medical publications have been previously noted,[3, 6, 15, 25] but to our knowledge, this is the first study to investigate the gender of authors who were hospitalists. Although we found a higher proportion of women hospitalists who were first or last authors than was observed by Jagsi and colleagues,[3] women hospitalists were still under‐represented with respect to this measure of academic productivity. Erren et al. reviewed 6 major journals from 2010 and 2011, and found that first authorship of original research by women ranged from 23.7% to 46.7%, and for last authorship from 18.3% to 28.8%.[25] Interestingly, we found no significant gender difference for first authors who were general internists, and there was a trend toward more women general internists being first authors than men for original research, reviews, and brief reports (data not shown).
Our study did not attempt to answer the question of why gender disparities persist, but many previous studies have explored this issue.[4, 8, 12, 26, 27, 28, 29, 30, 31, 32, 33, 34, 35, 36, 37, 38, 39, 40, 41, 42] Issues raised by others include the quantity of academic work (ie, publications and grants obtained), differences in hours worked and allocation of time, lack of mentorship, family responsibilities, discrimination, differences in career motivation, and levels of institutional support, to name a few.
The under‐representation of women hospitalists in leadership, authorship, and speaking opportunities may be consistent with gender‐related differences in research productivity. Fewer publications could lead to fewer national presentations, which could lead to fewer leadership opportunities. Our findings with respect to general internists are not consistent with this idea, however, as whereas women were under‐represented in GIM leadership positions, we found no disparities with respect to the gender of first authors or speakers at national meetings for general internists. The finding that hospitalists had gender disparities with respect to first authors and national speakers but general internists did not, argues against several hypotheses (ie, that women lack mentorship, have less career motivation, fewer career building opportunities).
One notable hypothesis, and perhaps one that is often discussed in the literature, is that women shoulder the majority of family responsibilities, and this may result in women having less time for their careers. Jolly and colleagues studied physician‐researchers and noted that women were more likely than men to have spouses or domestic partners who were fully employed, spent 8.5 more hours per week on domestic activities, and were more likely to take time off during disruptions of usual child care.[33] Carr and colleagues found that women with children (compared to men with children) had fewer publications, slower self‐perceived career progress, and lower career satisfaction, but having children had little effect on faculty aspirations and goals.[2] Kaplan et al., however, found that family responsibilities do not appear to account for sex differences in academic advancement.[4] Interestingly, in a study comparing physicians from Generation X to those of the Baby Boomer age, Generation X women reported working more than their male Generation X counterparts, and both had more of a focus on worklife balance than the older generation.[12]
The nature the of 2 specialties' work environment and job requirements could have also resulted in some of the differences seen. Primary care clinical work is typically conducted Monday through Friday, and hospitalist work frequently includes some weekend, evening, night, and holiday coverage. Although these are known differences, both specialties have also been noted to offer many advantages to women and men alike, including collaborative working environments and flexible work hours.[16]
Finally, finding disparity in leadership positions in both specialties supports the possibility that those responsible for hiring could have implicit gender biases. Under‐representation in entry‐level positions is also not a likely explanation for the differences we observed, because nearly an equal number of men and women graduate from medical school, pursue residency training in internal medicine, and become either academic hospitalists or general internists at university settings.[1, 15, 24] This hypothesis could, however, explain why disparities exist with respect to senior authorship and leadership positions, as typically, these individuals have been in practice longer and the current trends of improved gender equality have not always been the case.
Our study has a number of limitations. First, we only examined publications in 2 journals and presentations at 2 national conferences, although the journals and conferences selected are considered to be the major ones in the 2 specialties. Second, using Internet searches may have resulted in inaccurate gender and specialty assignment, but previous studies have used similar methodology.[3, 43] Additionally, we also attempted to contact individuals for direct confirmation when the information we obtained was not clear and had a second investigator independently verify the gender and specialty data. Third, we utilized division/department websites when available to determine the gender of HM divisions/sections. If not recently updated, these websites may not have reflected the most current leader of the unit, but this concern would seemingly pertain to both hospitalists and general internists. Fourth, we opted to only study faculty and division/section heads at university hospitals, as typically these institutions had GIM and hospitalist groups and also typically had websites. Because we only studied faculty and leadership at university hospitals, our data are not generalizable to all hospitalist and GIM groups. Finally, we excluded pediatric hospitalists, and thus, this study is representative of adult hospitalists only. Including pediatric hospitalists was out of the scope of this project.
Our study also had a number of strengths. To our knowledge, this is the first study to provide an estimate of the gender distribution in academic HM, of hospitalists as speakers at national meetings, as first and last authors, and of HM division or section heads, and is the first to compare these results with those observed for general internists. In addition, we examined 7 years of data from 2 of the major journals and national conferences for these specialties.
In summary, despite HM being a newer field with a younger cohort of physicians, we found that gender disparities exist for women with respect to authorship, national speaking opportunities, and division or section leadership. Identifying why these gender differences exist presents an important next step.
Disclosures: Nothing to report. Marisha Burden, MD and Maria G. Frank, MD are coprincipal authors.
- Association of American Medical Colleges. Women in U.S. academic medicine and science: Statistics and benchmarking report. 2012. Available at: https://members.aamc.org/eweb/upload/Women%20in%20U%20S%20%20Academic%20Medicine%20Statistics%20and%20Benchmarking%20Report%202011-20123.pdf. Accessed September 1, 2014.
- , , , et al. Relation of family responsibilities and gender to the productivity and career satisfaction of medical faculty. Ann Intern Med. 1998;129:532–538.
- , , , et al. The “gender gap” in authorship of academic medical literature—a 35‐year perspective. N Engl J Med. 2006;355:281–287.
- , , , , , . Sex differences in academic advancement. Results of a national study of pediatricians. N Engl J Med. 1996;335:1282–1289.
- . Women physicians in academic medicine: new insights from cohort studies. N Engl J Med. 2000;342:399–405.
- , , , , . Gender differences in academic productivity and leadership appointments of physicians throughout academic careers. Acad Med. 2011;86:43–47.
- , , , . Promotion of women physicians in academic medicine. Glass ceiling or sticky floor? JAMA. 1995;273:1022–1025.
- , , , . Compensation and advancement of women in academic medicine: is there equity? Ann Intern Med. 2004;141:205–212.
- , , . Women physicians: choosing a career in academic medicine. Acad Med. 2012;87:105–114.
- , , , . The status of women at one academic medical center. Breaking through the glass ceiling. JAMA. 1990;264:1813–1817.
- , . Status of women in academic anesthesiology. Anesthesiology. 1986;64:496–500.
- , , . The generation and gender shifts in medicine: an exploratory survey of internal medicine physicians. BMC Health Serv Res. 2006;6:55.
- Pew Research Center. On pay gap, millenial women near parity—for now. December 2013. Available at: http://www.pewsocialtrends.org/files/2013/12/gender-and-work_final.pdf. Published December 11, 2013. Accessed February 5, 2015.
- , . The emerging role of "hospitalists" in the American health care system. N Engl J Med. 1996;335:514–517.
- , , , , , . Mentorship, productivity, and promotion among academic hospitalists. J Gen Intern Med. 2012;27:23–27.
- . The gender factor. The Hospitalist. Available at: http://www.the‐hospitalist.org/article/the‐gender‐factor. Published March 1, 2006. Accessed September 1, 2014.
- Association of American Medical Colleges. Analysis in brief: Supplemental information for estimating the number and characteristics of hospitalist physicians in the United States and their possible workforce implications. Available at: https://www.aamc.org/download/300686/data/aibvol12_no3-supplemental.pdf. Published August 2012. Accessed September 1, 2014.
- , , , . Survey of US academic hospitalist leaders about mentorship and academic activities in hospitalist groups. J Hosp Med. 2011;6:5–9.
- State of Hospital Medicine: 2011 Report Based on 2010 Data. Medical Group Management Association and Society of Hospital Medicine. www.mgma.com, www.hospitalmedicine.org.
- Today's Hospitalist Survey. Compensation and Career Survey Results. 2013. Available at: http://www.todayshospitalist.com/index.php?b=salary_survey_results. Accessed January 11, 2015.
- Association of American Medical Colleges. Women in U.S. Academic Medicine: Statistics and Benchmarking Report. 2009–2010. Available at: https://www.aamc.org/download/182674/data/gwims_stats_2009‐2010.pdf. Accessed September 1, 2014.
- American Medical Association. Graduate Medical Education Directory 2012–2013. Chicago, IL: American Medical Association; 2012:182–203.
- , , , , , . Research electronic data capture (REDCap)—a metadata‐driven methodology and workflow process for providing translational research informatics support. J Biomed Inform. 2009;42:377–381.
- Association of American Medical Colleges. 2012 Physician Specialty Data Book. Center for Workforce Studies. Available at: https://www.aamc.org/download/313228/data/2012physicianspecialtydatabook.pdf. Published November 2012. Accessed September 1, 2014.
- , , , . Representation of women as authors, reviewers, editors in chief, and editorial board members at 6 general medical journals in 2010 and 2011. JAMA Intern Med. 2014;174:633–635.
- , , , et al. Relationships of gender and career motivation to medical faculty members' production of academic publications. Acad Med. 1998;73:180–186.
- , , , et al. Faculty perceptions of gender discrimination and sexual harassment in academic medicine. Ann Intern Med. 2000;132:889–896.
- , , , . Attitudes of clinical faculty about career progress, career success and recognition, and commitment to academic medicine. Results of a survey. Arch Intern Med. 2000;160:2625–2629.
- , , , , . A "ton of feathers": gender discrimination in academic medical careers and how to manage it. J Womens Health (Larchmt). 2003;12:1009–1018.
- , , . Perceived obstacles to career success for women in academic surgery. Arch Surg. 2000;135:972–977.
- , , , . Career satisfaction of US women physicians: results from the Women Physicians' Health Study. Society of General Internal Medicine Career Satisfaction Study Group. Arch Intern Med. 1999;159:1417–1426.
- . Doing the same and earning less: male and female physicians in a new medical specialty. Inquiry. 2004;41:301–315.
- , , , , , . Gender differences in time spent on parenting and domestic responsibilities by high‐achieving young physician‐researchers. Ann Intern Med. 2014;160:344–353.
- , , , , . Stories from early‐career women physicians who have left academic medicine: a qualitative study at a single institution. Acad Med. 2011;86:752–758.
- , , , . The $16,819 pay gap for newly trained physicians: the unexplained trend of men earning more than women. Health Aff (Millwood). 2011;30:193–201.
- , , , , . Experiencing the culture of academic medicine: gender matters, a national study. J Gen Intern Med. 2013;28:201–207.
- . Gender pay gaps in hospital medicine. The Hospitalist. Available at: http://www.the‐hospitalist.org/article/gender‐pay‐gaps‐in‐hospital‐medicine. Published February 29, 2012. Accessed September 1, 2014.
- , , . Mentoring in academic medicine: a systematic review. JAMA. 2006;296:1103–1115.
- . Inequality quantified: mind the gender gap. Nature. 2013;495:22–24.
- , , , et al. Gender differences in academic advancement: patterns, causes, and potential solutions in one US College of Medicine. Acad Med. 2003;78:500–508.
- , . Why aren't there more women leaders in academic medicine? The views of clinical department chairs. Acad Med. 2001;76:453–465.
- . Gender factors in reviewer recommendations for manuscript publication. J Appl Behav Anal. 1990;23:539–543.
- , , , . Scientific impact of women in academic surgery. J Surg Res. 2008;148:13–16.
Gender disparities still exist for women in academic medicine.[1, 2, 3, 4, 5, 6, 7, 8, 9] The most recent data from the Association of American Medical Colleges (AAMC) show that although gender disparities are decreasing, women are still under‐represented in the assistant, associate, and full‐professor ranks as well as in leadership positions.[1]
Some studies indicate that gender differences are less evident when examining younger cohorts.[1, 10, 11, 12, 13] Hospital medicine emerged around 1996, when the term hospitalist was first coined.[14] The gender distribution of academic hospitalists is likely nearly equal,[15, 16] and they are generally younger physicians.[15, 17, 18, 19, 20] Accordingly, we questioned whether gender disparities existed in academic hospital medicine (HM) and, if so, whether these disparities were greater than those that might exist in academic general internal medicine (GIM).
METHODS
This study consisted of both prospective and retrospective observation of data collected for academic adult hospitalists and general internists who practice in the United States. It was approved by the Colorado Multiple Institutional Review Board.
Gender distribution was assessed with respect to: (1) academic HM and GIM faculty, (2) leadership (ie, division or section heads), and (3) scholarly work (ie, speaking opportunities and publications). Data were collected between October 1, 2012 and August 31, 2014.
Gender Distribution of Faculty and Division/Section Heads
All US internal medicine residency programs were identified from the list of members or affiliates of the AAMC that were fully accredited by the Liaison Committee on Medical Education[21] using the Graduate Medical Education Directory.[22] We then determined the primary training hospital(s) affiliated with each program and selected those that were considered to be university hospitals and eliminated those that did not have divisions or sections of HM or GIM. We determined the gender of the respective division/section heads on the basis of the faculty member's first name (and often from accompanying photos) as well as from information obtained via Internet searches and, if necessary, contacted the individual institutions via email or phone call(s). We also determined the number and gender of all of the HM and GIM faculty members in a random sample of 25% of these hospitals from information on their respective websites.
Gender Distribution for Scholarly Productivity
We determined the gender and specialty of all speakers at the Society of Hospital Medicine and the Society of General Internal Medicine national conferences from 2006 to 2012. A list of speakers at each conference was obtained from conference pamphlets or agendas that were available via Internet searches or obtained directly from the organization. We also determined whether each presenter was a featured speaker (defined as one whose talk was unopposed by other sessions), plenary speaker (defined as such in the conference pamphlets), or if they spoke in a group format (also as indicated in the conference pamphlets). Because of the low number of featured and plenary speakers, these data were combined. Faculty labeled as additional faculty when presenting in a group format were excluded as were speakers at precourses, those presenting abstracts, and those participating in interest group sessions.
For authorship, a PubMed search was used to identify all articles published in the Journal of Hospital Medicine (JHM) and the Journal of General Internal Medicine (JGIM) from January 1, 2006 through December 31, 2012, and the gender and specialty of all the first and last authors were determined as described above. Specialty was determined from the division, section or department affiliation indicated for each author and by Internet searches. In some instances, it was necessary to contact the authors or their departments directly to verify their specialty. When articles had only 1 author, the author was considered a first author.
Duplicate records (eg, same author, same journal) and articles without an author were excluded, as were authors who did not have an MD, DO, or MBBS degree and those who were not affiliated with an institution in the United States. All manuscripts, with the exception of errata, were analyzed together as well as in 3 subgroups: original research, editorials, and others.
A second investigator corroborated data regarding gender and specialty for all speakers and authors to strengthen data integrity. On the rare occasion when discrepancies were found, a third investigator adjudicated the results.
Definitions
Physicians were defined as being hospitalists if they were listed as a member of a division or section of HM on their publications or if Internet searches indicated that they were a hospitalist or primarily worked on inpatient medical services. Physicians were considered to be general internists if they were listed as such on their publications and their specialty could be verified in Web‐based searches. If physicians appeared to have changing roles over time, we attempted to assign their specialty based upon their role at the time the article was published or the presentation was delivered. If necessary, phone calls and/or emails were also done to determine the physician's specialty.
Analysis
REDCap, a secure, Web‐based application for building and managing online surveys and databases, was used to collect and manage all study data.[23] All analyses were performed using SAS Enterprise Guide 4.3 (SAS Institute, Inc., Cary, NC). A [2] test was used to compare proportions of male versus female physicians, and data from hospitalists versus general internists. Because we performed multiple comparisons when analyzing presentations and publications, a Bonferroni adjustment was made such that a P<0.0125 for presentations and P<0.006 (within specialty) or P<0.0125 (between specialty) for the publication analyses were considered significant. P<0.05 was considered significant for all other comparisons.
RESULTS
Gender Distribution of Faculty
Eighteen HM and 20 GIM programs from university hospitals were randomly selected for review (see Supporting Figure 1 in the online version of this article). Seven of the HM programs and 1 of the GIM programs did not have a website, did not differentiate hospitalists from other faculty, or did not list their faculty on the website and were excluded from the analysis. In the remaining 11 HM programs and 19 GIM programs, women made up 277/568 (49%) and 555/1099 (51%) of the faculty, respectively (P=0.50).
Gender Distribution of Division/Section Heads
Eighty‐six of the programs were classified as university hospitals (see Supporting Figure 1 in the online version of this article), and in these, women led 11/69 (16%) of the HM divisions or sections and 28/80 (35%) of the GIM divisions (P=0.008).
Gender Distribution for Scholarly Productivity
Speaking Opportunities
A total of 1227 presentations were given at the 2 conferences from 2006 to 2012, with 1343 of the speakers meeting inclusion criteria (see Supporting Figure 2 in the online version of this article). Hospitalists accounted for 557 of the speakers, of which 146 (26%) were women. General internists accounted for 580 of the speakers, of which 291 (50%) were women (P<0.0001) (Table 1).
| Male, N (%) | Female, N (%) | |
|---|---|---|
| ||
| Hospitalists | ||
| All presentations | 411 (74) | 146 (26)* |
| Featured or plenary presentations | 49 (91) | 5 (9)* |
| General internists | ||
| All presentations | 289 (50) | 291 (50) |
| Featured or plenary presentations | 27 (55) | 22 (45) |
Of the 117 featured or plenary speakers, 54 were hospitalists and 5 (9%) of these were women. Of the 49 who were general internists, 22 (45%) were women (P<0.0001).
Authorship
The PubMed search identified a total of 3285 articles published in the JHM and the JGIM from 2006 to 2012, and 2172 first authors and 1869 last authors met inclusion criteria (see Supporting Figure 3 in the online version of this article). Hospitalists were listed as first or last authors on 464 and 305 articles, respectively, and of these, women were first authors on 153 (33%) and last authors on 63 (21%). General internists were listed as first or last authors on 895 and 769 articles, respectively, with women as first authors on 423 (47%) and last authors on 265 (34%). Compared with general internists, fewer women hospitalists were listed as either first or last authors (both P<0.0001) (Table 2).
| First Author | Last Author | |||
|---|---|---|---|---|
| Male, N (%) | Female, N (%) | Male, N (%) | Female, N (%) | |
| ||||
| Hospitalists | ||||
| All publications | 311 (67) | 153 (33)* | 242 (79) | 63 (21)* |
| Original investigations/brief reports | 124 (61) | 79 (39)* | 96 (76) | 30 (24)* |
| Editorials | 34 (77) | 10 (23)* | 18 (86) | 3 (14)* |
| Other | 153 (71) | 64 (29)* | 128 (81) | 30 (19)* |
| General internists | ||||
| All publications | 472 (53) | 423 (47) | 504 (66) | 265 (34)* |
| Original investigations/brief reports | 218 (46) | 261 (54) | 310 (65) | 170 (35)* |
| Editorial | 98 (68) | 46 (32)* | 43 (73) | 16 (27)* |
| Other | 156 (57) | 116 (43) | 151 (66) | 79 (34)* |
Fewer women hospitalists were listed as first or last authors on all article types. For original research articles written by general internists, there was a trend for more women to be listed as first authors than men (261/479, 54%), but this difference was not statistically significant.
DISCUSSION
The important findings of this study are that, despite an equal gender distribution of academic HM and GIM faculty, fewer women were HM division/section chiefs, fewer women were speakers at the 2 selected national meetings, and fewer women were first or last authors of publications in 2 selected journals in comparison with general internists.
Previous studies have found that women lag behind their male counterparts with respect to academic productivity, leadership, and promotion.[1, 5, 7] Some studies suggest, however, that gender differences are reduced when younger cohorts are examined.[1, 10, 11, 12, 13] Surveys indicate that that the mean age of hospitalists is younger than most other specialties.[15, 19, 20, 24] The mean age of academic GIM physicians is unknown, but surveys of GIM (not differentiating academic from nonacademic) suggest that it is an older cohort than that of HM.[24] Despite hospitalists being a younger cohort, we found gender disparities in all areas investigated.
Our findings with respect to gender disparities in HM division or section leadership are consistent with the annual AAMC Women in US Academic Medicine and Science Benchmarking Report that found only 22% of all permanent division or section heads were women.[1]
Gender disparities with respect to authorship of medical publications have been previously noted,[3, 6, 15, 25] but to our knowledge, this is the first study to investigate the gender of authors who were hospitalists. Although we found a higher proportion of women hospitalists who were first or last authors than was observed by Jagsi and colleagues,[3] women hospitalists were still under‐represented with respect to this measure of academic productivity. Erren et al. reviewed 6 major journals from 2010 and 2011, and found that first authorship of original research by women ranged from 23.7% to 46.7%, and for last authorship from 18.3% to 28.8%.[25] Interestingly, we found no significant gender difference for first authors who were general internists, and there was a trend toward more women general internists being first authors than men for original research, reviews, and brief reports (data not shown).
Our study did not attempt to answer the question of why gender disparities persist, but many previous studies have explored this issue.[4, 8, 12, 26, 27, 28, 29, 30, 31, 32, 33, 34, 35, 36, 37, 38, 39, 40, 41, 42] Issues raised by others include the quantity of academic work (ie, publications and grants obtained), differences in hours worked and allocation of time, lack of mentorship, family responsibilities, discrimination, differences in career motivation, and levels of institutional support, to name a few.
The under‐representation of women hospitalists in leadership, authorship, and speaking opportunities may be consistent with gender‐related differences in research productivity. Fewer publications could lead to fewer national presentations, which could lead to fewer leadership opportunities. Our findings with respect to general internists are not consistent with this idea, however, as whereas women were under‐represented in GIM leadership positions, we found no disparities with respect to the gender of first authors or speakers at national meetings for general internists. The finding that hospitalists had gender disparities with respect to first authors and national speakers but general internists did not, argues against several hypotheses (ie, that women lack mentorship, have less career motivation, fewer career building opportunities).
One notable hypothesis, and perhaps one that is often discussed in the literature, is that women shoulder the majority of family responsibilities, and this may result in women having less time for their careers. Jolly and colleagues studied physician‐researchers and noted that women were more likely than men to have spouses or domestic partners who were fully employed, spent 8.5 more hours per week on domestic activities, and were more likely to take time off during disruptions of usual child care.[33] Carr and colleagues found that women with children (compared to men with children) had fewer publications, slower self‐perceived career progress, and lower career satisfaction, but having children had little effect on faculty aspirations and goals.[2] Kaplan et al., however, found that family responsibilities do not appear to account for sex differences in academic advancement.[4] Interestingly, in a study comparing physicians from Generation X to those of the Baby Boomer age, Generation X women reported working more than their male Generation X counterparts, and both had more of a focus on worklife balance than the older generation.[12]
The nature the of 2 specialties' work environment and job requirements could have also resulted in some of the differences seen. Primary care clinical work is typically conducted Monday through Friday, and hospitalist work frequently includes some weekend, evening, night, and holiday coverage. Although these are known differences, both specialties have also been noted to offer many advantages to women and men alike, including collaborative working environments and flexible work hours.[16]
Finally, finding disparity in leadership positions in both specialties supports the possibility that those responsible for hiring could have implicit gender biases. Under‐representation in entry‐level positions is also not a likely explanation for the differences we observed, because nearly an equal number of men and women graduate from medical school, pursue residency training in internal medicine, and become either academic hospitalists or general internists at university settings.[1, 15, 24] This hypothesis could, however, explain why disparities exist with respect to senior authorship and leadership positions, as typically, these individuals have been in practice longer and the current trends of improved gender equality have not always been the case.
Our study has a number of limitations. First, we only examined publications in 2 journals and presentations at 2 national conferences, although the journals and conferences selected are considered to be the major ones in the 2 specialties. Second, using Internet searches may have resulted in inaccurate gender and specialty assignment, but previous studies have used similar methodology.[3, 43] Additionally, we also attempted to contact individuals for direct confirmation when the information we obtained was not clear and had a second investigator independently verify the gender and specialty data. Third, we utilized division/department websites when available to determine the gender of HM divisions/sections. If not recently updated, these websites may not have reflected the most current leader of the unit, but this concern would seemingly pertain to both hospitalists and general internists. Fourth, we opted to only study faculty and division/section heads at university hospitals, as typically these institutions had GIM and hospitalist groups and also typically had websites. Because we only studied faculty and leadership at university hospitals, our data are not generalizable to all hospitalist and GIM groups. Finally, we excluded pediatric hospitalists, and thus, this study is representative of adult hospitalists only. Including pediatric hospitalists was out of the scope of this project.
Our study also had a number of strengths. To our knowledge, this is the first study to provide an estimate of the gender distribution in academic HM, of hospitalists as speakers at national meetings, as first and last authors, and of HM division or section heads, and is the first to compare these results with those observed for general internists. In addition, we examined 7 years of data from 2 of the major journals and national conferences for these specialties.
In summary, despite HM being a newer field with a younger cohort of physicians, we found that gender disparities exist for women with respect to authorship, national speaking opportunities, and division or section leadership. Identifying why these gender differences exist presents an important next step.
Disclosures: Nothing to report. Marisha Burden, MD and Maria G. Frank, MD are coprincipal authors.
- Association of American Medical Colleges. Women in U.S. academic medicine and science: Statistics and benchmarking report. 2012. Available at: https://members.aamc.org/eweb/upload/Women%20in%20U%20S%20%20Academic%20Medicine%20Statistics%20and%20Benchmarking%20Report%202011-20123.pdf. Accessed September 1, 2014.
- , , , et al. Relation of family responsibilities and gender to the productivity and career satisfaction of medical faculty. Ann Intern Med. 1998;129:532–538.
- , , , et al. The “gender gap” in authorship of academic medical literature—a 35‐year perspective. N Engl J Med. 2006;355:281–287.
- , , , , , . Sex differences in academic advancement. Results of a national study of pediatricians. N Engl J Med. 1996;335:1282–1289.
- . Women physicians in academic medicine: new insights from cohort studies. N Engl J Med. 2000;342:399–405.
- , , , , . Gender differences in academic productivity and leadership appointments of physicians throughout academic careers. Acad Med. 2011;86:43–47.
- , , , . Promotion of women physicians in academic medicine. Glass ceiling or sticky floor? JAMA. 1995;273:1022–1025.
- , , , . Compensation and advancement of women in academic medicine: is there equity? Ann Intern Med. 2004;141:205–212.
- , , . Women physicians: choosing a career in academic medicine. Acad Med. 2012;87:105–114.
- , , , . The status of women at one academic medical center. Breaking through the glass ceiling. JAMA. 1990;264:1813–1817.
- , . Status of women in academic anesthesiology. Anesthesiology. 1986;64:496–500.
- , , . The generation and gender shifts in medicine: an exploratory survey of internal medicine physicians. BMC Health Serv Res. 2006;6:55.
- Pew Research Center. On pay gap, millenial women near parity—for now. December 2013. Available at: http://www.pewsocialtrends.org/files/2013/12/gender-and-work_final.pdf. Published December 11, 2013. Accessed February 5, 2015.
- , . The emerging role of "hospitalists" in the American health care system. N Engl J Med. 1996;335:514–517.
- , , , , , . Mentorship, productivity, and promotion among academic hospitalists. J Gen Intern Med. 2012;27:23–27.
- . The gender factor. The Hospitalist. Available at: http://www.the‐hospitalist.org/article/the‐gender‐factor. Published March 1, 2006. Accessed September 1, 2014.
- Association of American Medical Colleges. Analysis in brief: Supplemental information for estimating the number and characteristics of hospitalist physicians in the United States and their possible workforce implications. Available at: https://www.aamc.org/download/300686/data/aibvol12_no3-supplemental.pdf. Published August 2012. Accessed September 1, 2014.
- , , , . Survey of US academic hospitalist leaders about mentorship and academic activities in hospitalist groups. J Hosp Med. 2011;6:5–9.
- State of Hospital Medicine: 2011 Report Based on 2010 Data. Medical Group Management Association and Society of Hospital Medicine. www.mgma.com, www.hospitalmedicine.org.
- Today's Hospitalist Survey. Compensation and Career Survey Results. 2013. Available at: http://www.todayshospitalist.com/index.php?b=salary_survey_results. Accessed January 11, 2015.
- Association of American Medical Colleges. Women in U.S. Academic Medicine: Statistics and Benchmarking Report. 2009–2010. Available at: https://www.aamc.org/download/182674/data/gwims_stats_2009‐2010.pdf. Accessed September 1, 2014.
- American Medical Association. Graduate Medical Education Directory 2012–2013. Chicago, IL: American Medical Association; 2012:182–203.
- , , , , , . Research electronic data capture (REDCap)—a metadata‐driven methodology and workflow process for providing translational research informatics support. J Biomed Inform. 2009;42:377–381.
- Association of American Medical Colleges. 2012 Physician Specialty Data Book. Center for Workforce Studies. Available at: https://www.aamc.org/download/313228/data/2012physicianspecialtydatabook.pdf. Published November 2012. Accessed September 1, 2014.
- , , , . Representation of women as authors, reviewers, editors in chief, and editorial board members at 6 general medical journals in 2010 and 2011. JAMA Intern Med. 2014;174:633–635.
- , , , et al. Relationships of gender and career motivation to medical faculty members' production of academic publications. Acad Med. 1998;73:180–186.
- , , , et al. Faculty perceptions of gender discrimination and sexual harassment in academic medicine. Ann Intern Med. 2000;132:889–896.
- , , , . Attitudes of clinical faculty about career progress, career success and recognition, and commitment to academic medicine. Results of a survey. Arch Intern Med. 2000;160:2625–2629.
- , , , , . A "ton of feathers": gender discrimination in academic medical careers and how to manage it. J Womens Health (Larchmt). 2003;12:1009–1018.
- , , . Perceived obstacles to career success for women in academic surgery. Arch Surg. 2000;135:972–977.
- , , , . Career satisfaction of US women physicians: results from the Women Physicians' Health Study. Society of General Internal Medicine Career Satisfaction Study Group. Arch Intern Med. 1999;159:1417–1426.
- . Doing the same and earning less: male and female physicians in a new medical specialty. Inquiry. 2004;41:301–315.
- , , , , , . Gender differences in time spent on parenting and domestic responsibilities by high‐achieving young physician‐researchers. Ann Intern Med. 2014;160:344–353.
- , , , , . Stories from early‐career women physicians who have left academic medicine: a qualitative study at a single institution. Acad Med. 2011;86:752–758.
- , , , . The $16,819 pay gap for newly trained physicians: the unexplained trend of men earning more than women. Health Aff (Millwood). 2011;30:193–201.
- , , , , . Experiencing the culture of academic medicine: gender matters, a national study. J Gen Intern Med. 2013;28:201–207.
- . Gender pay gaps in hospital medicine. The Hospitalist. Available at: http://www.the‐hospitalist.org/article/gender‐pay‐gaps‐in‐hospital‐medicine. Published February 29, 2012. Accessed September 1, 2014.
- , , . Mentoring in academic medicine: a systematic review. JAMA. 2006;296:1103–1115.
- . Inequality quantified: mind the gender gap. Nature. 2013;495:22–24.
- , , , et al. Gender differences in academic advancement: patterns, causes, and potential solutions in one US College of Medicine. Acad Med. 2003;78:500–508.
- , . Why aren't there more women leaders in academic medicine? The views of clinical department chairs. Acad Med. 2001;76:453–465.
- . Gender factors in reviewer recommendations for manuscript publication. J Appl Behav Anal. 1990;23:539–543.
- , , , . Scientific impact of women in academic surgery. J Surg Res. 2008;148:13–16.
© 2015 Society of Hospital Medicine


Caring About Prognosis
Prognostication continues to be a challenge to the clinician despite over 100 prognostic indices that have been developed during the past few decades to inform clinical practice and medical decision making.[1] Physicians are not accurate in prognostication of patients' risk of death and tend to overestimate survival.[2, 3] In addition, many physicians do not feel comfortable offering a prognosis to patients, despite patients' wishes to be informed.[4, 5] Regardless of the prevalence in the literature and value in improving physicians' prognostic accuracy, prognostic indices of survival are not regularly utilized in the hospital setting. Prognostic tools available for providers are often complicated and may require data about patients that are not readily available.[6, 7, 8] Prognostic indices may be too specific to a patient population, too difficult to remember, or too time consuming to use. A simple, rapid, and practical prognostic index is important in the hospital setting to assist in identifying patients at high risk of death so that primary palliative interventions can be incorporated into the plan of care early in the hospital stay. Patient and family education, advance care planning, formulating the plan of care based on patientfamily goals, and improved resource utilization could be better executed by more accurate risk of death prediction on hospital admission.
The CARING criteria are the only prognostic index to our knowledge that evaluates a patient's risk of death in the next year, with information readily available at the time of hospital admission (Table 1).[9] The CARING criteria are a unique prognostic tool: (1) CARING is a mnemonic acronym, making it more user friendly to the clinician. (2) The 5 prognostic indicators are readily available from the patient's chart on admission; gathering further data by patient or caretaker interviews or by obtaining laboratory data is not needed. (3) The timing for application of the tool on admission to the hospital is an ideal opportunity to intervene and introduce palliative interventions early on the hospital stay. The CARING criteria were developed and validated in a Veteran's Administration hospital setting by Fischer et al.[9] We sought to validate the CARING criteria in a broader patient populationmedical and surgical patients from a tertiary referral university hospital setting and a safety‐net hospital setting.
METHODS
Study Design
This study was a retrospective observational cohort study. The study was approved by the Colorado Multiple Institutional Review Board and the University of Colorado Hospital Research Review Committee.
Study Purpose
To validate the CARING criteria in a tertiary referral university hospital (University of Colorado Hospital [UCH]) and safety‐net hospital (Denver Health and Hospitals [DHH]) setting using similar methodology to that employed by the original CARING criteria study.[9]
Study Setting/Population
All adults (18 years of age) admitted as inpatients to the medical and surgical services of internal medicine, hospitalist, pulmonary, cardiology, hematology/oncology, hepatology, surgery, intensive care unit, and intermediary care unit at UCH and DHH during the study period of July 2005 through August 2005. The only exclusion criteria were those patients who were prisoners or pregnant. Administrative admission data from July 2005 to August 2005 were used to identify names of all persons admitted to the medicine and surgical services of the study hospitals during the specified time period.
The 2 study hospitals, UCH and DHH, provide a range of patients who vary in ethnicity, socioeconomic status, and medical illness. This variability allows for greater generalizability of the results. Both hospitals are affiliated with the University of Colorado School of Medicine internal medicine residency training program and are located in Denver, Colorado.
At the time of the study, UCH was a licensed 550‐bed tertiary referral, academic hospital serving the Denver metropolitan area and the Rocky Mountain region as a specialty care and referral center. DHH was a 398‐bed, academic, safety‐net hospital serving primarily the Denver metropolitan area. DHH provides 42% of the care for the uninsured in Denver and 26% of the uninsured care for the state of Colorado.
Measures
The CARING criteria were developed and validated in a Veteran's Administration (VA) hospital setting by Fischer et al.[9] The purpose of the CARING criteria is to identify patients, at the time of hospital admission, who are at higher risk of death in the following year. The prognostic index uses 5 predictors that can be abstracted from the chart at time of admission. The CARING criteria were developed a priori, and patients were evaluated using only the medical data available at the time of admission. The criteria include items that are already part of the routine physician admission notes and do not require additional data collection or assessments. The criteria include: C=primary diagnosis of cancer, A=2 admissions to the hospital for a chronic illness within the last year; R=resident in a nursing home; I=intensive care unit (ICU) admission with multiorgan failure (MOF), NG=noncancer hospice guidelines (meeting 2 of the National Hospice and Palliative Care Organization's [NHPCO] guidelines).
Patients were identified using name, date of birth, social security number, address, and phone number. This identifying information was then used for tracing death records 1 year after hospital admission.
Mortality at 1 year following the index hospitalization was the primary end point. To minimize missing data and the number of subjects lost to follow‐up, 3 determinants of mortality were used. First, electronic medical records of the 2 participating hospitals and their outpatient clinics were reviewed to determine if a follow‐up appointment had occurred past the study's end point of 1 year (August 2006). For those without a confirmed follow‐up visit, death records from the Colorado Department of Public Health and Vital Records were obtained. For those patients residing outside of Colorado or whose mortality status was still unclear, the National Death Index was accessed.
Medical Record Review
Medical records for all study participants were reviewed by J.Y. (UCH) and B.C. (DHH). Data collection was completed using direct data entry into a Microsoft Access (Microsoft Corp., Redmond, WA) database utilizing a data entry form linked with the database table. This form utilized skip patterns and input masks to ensure quality of data entry and minimize missing or invalid data. Inter‐rater reliability was assessed by an independent rereview (S.F.) of 5% of the total charts. Demographic variables were collected using hospital administrative data. These included personal identifiers of the participants for purposes of mortality follow‐up. Clinical data including the 5 CARING variables and additional descriptive variables were abstracted from the paper hospital chart and the electronic record of the chart (together these constitute the medical record).
Death Follow‐up
A search of Colorado death records was conducted in February 2011 for all subjects. Death records were used to determine mortality and time to death from the index hospitalization. The National Death Index was then searched for any subjects without or record of death in Colorado.
Analysis
All analyses were conducted using the statistical application software SAS for Windows version 9.3 (SAS Institute, Cary, NC). Simple frequencies and means ( standard deviation) were used to describe the baseline characteristics. Multiple logistic regression models were used to model 1‐year mortality. The models were fitted using all of the CARING variables and age. As the aim of the study was to validate the CARING criteria, the variables for the models were selected a priori based on the original index. Two hospital cohorts (DHH and UCH) were modeled separately and as a combined sample. Kaplan‐Meier survival analysis was conducted to compare those subjects who met 1 of the CARING criteria with those who did not through the entire period of mortality follow‐up (20052011). Finally, using the probabilities from the logistic regression models, we again developed a scoring rule appropriate for a non‐VA setting to allow clinicians to easily identify patient risk for 1‐year mortality at the time of hospital admission.
RESULTS
There were a total of 1064 patients admitted to the medical and surgical services during the study period568 patients at DHH and 496 patients at UCH. Sample characteristics of each individual hospital cohort and the entire combined study cohort are detailed in Table 2. Overall, slightly over half the population were male, with a mean age of 50 years, and the ethnic breakdown roughly reflects the population in Denver. A total of 36.5% (n=388) of the study population met 1 of the CARING criteria, and 12.6% (n=134 among 1063 excluding 1 without an admit date) died within 1 year of the index hospitalization. These were younger and healthier patients compared to the VA sample used in developing the CARING criteria.
| |
| Renal | Dementia |
| Stop/decline dialysis | Unable to ambulate independently |
| Not candidate for transplant | Urinary or fecal incontinence |
| Urine output < 40cc/24 hours | Unable to speak with more than single words |
| Creatinine > 8.0 (>6.0 for diabetics) | Unable to bathe independently |
| Creatinine clearance 10cc/min | Unable to dress independently |
| Uremia | Co‐morbid conditions: |
| Persistent serum K + > 7.0 | Aspiration pneumonia |
| Co‐morbid conditions: | Pyelonephritis |
| Cancer CHF | Decubitus ulcer |
| Chronic lung disease AIDS/HIV | Difficulty swallowing or refusal to eat |
| Sepsis Cirrhosis | |
| Cardiac | Pulmonary |
| Ejection fraction < 20% | Dyspnea at rest |
| Symptomatic with diuretics and vasodilators | FEV1 < 30% |
| Not candidate for transplant | Frequent ER or hospital admits for pulmonary infections or respiratory distress |
| History of cardiac arrest | Cor pulmonale or right heart failure |
| History of syncope | 02 sat < 88% on 02 |
| Systolic BP < 120mmHG | PC02 > 50 |
| CVA cardiac origin | Resting tachycardia > 100/min |
| Co‐morbid conditions as listed in Renal | Co‐morbid conditions as listed in Renal |
| Liver | Stroke/CVA |
| End stage cirrhosis | Coma at onset |
| Not candidate for transplant | Coma >3 days |
| Protime > 5sec and albumin <2.5 | Limb paralysis |
| Ascites unresponsive to treatment | Urinary/fecal incontinence |
| Hepatorenal syndrome | Impaired sitting balance |
| Hepatic encephalopathy | Karnofsky < 50% |
| Spontaneous bacterial peritonitis | Recurrent aspiration |
| Recurrent variceal bleed | Age > 70 |
| Co‐morbid conditions as listed in Renal | Co‐morbid conditions as listed in Renal |
| HIV/AIDS | Neuromuscular |
| Persistent decline in function | Diminished respiratory function |
| Chronic diarrhea 1 year | Chosen not to receive BiPAP/vent |
| Decision to stop treatment | Difficulty swallowing |
| CNS lymphoma | Diminished functional status |
| MAC‐untreated | Incontinence |
| Systemic lymphoma | Co‐morbid conditions as listed in Renal |
| Dilated cardiomyopathy | |
| CD4 < 25 with disease progression | |
| Viral load > 100,000 | |
| Safety‐Net Hospital Cohort, N=568 | Academic Center Cohort, N=496 | Study Cohort,N=1064 | Original CARING Cohort, N=8739 | |
|---|---|---|---|---|
| ||||
| Mean age ( SD), y | 47.8 (16.5) | 54.4 (17.5) | 50.9 (17.3) | 63 (13) |
| Male gender | 59.5% (338) | 50.1% (248) | 55.1% (586) | 98% (856) |
| Ethnicity | ||||
| African American | 14.1% (80) | 13.5% (65) | 13.8% (145) | 13% (114) |
| Asian | 0.4% (2) | 1.5% (7) | 0.9% (9) | Not reported |
| Caucasian | 41.7% (237) | 66.3% (318) | 53.0 % (555) | 69% (602) |
| Latino | 41.9% (238) | 9.6% (46) | 27.1% (284) | 8% (70) |
| Native American | 0.5% (3) | 0.4% (2) | 0.5% (5) | Not reported |
| Other | 0.5% (3) | 0.6% (3) | 0.6% (6) | 10% (87) |
| Unknown | 0.9% (5) | 8.1% (39) | 4.2% (44) | Not reported |
| CARING criteria | ||||
| Cancer | 6.2% (35) | 19.4% (96) | 12.3% (131) | 23% (201) |
| Admissions to the hospital 2 in past year | 13.6% (77) | 42.7% (212) | 27.2% (289) | 36% (314) |
| Resident in a nursing home | 1.8% (10) | 3.4% (17) | 2.5% (27) | 3% (26) |
| ICU with MOF | 3.7% (21) | 1.2% (6) | 2.5% (27) | 2% (17) |
| NHPCO (2) noncancer guidelines | 1.6% (9) | 5.9% (29) | 3.6% (38) | 8% (70) |
Reliability testing demonstrated excellent inter‐rater reliability. Kappa for each criterion is as follows: (1) primary diagnosis of cancer=1.0, (2) 2 admissions to the hospital in the past year=0.91, (3) resident in a nursing home=1.0, (4) ICU admission with MOF=1.0, and (5) 2 noncancer hospice guidelines=0.78.
This study aimed to validate the CARING criteria9; therefore, all original individual CARING criterion were included in the validation logistic regression models. The 1 exception to this was in the university hospital study cohort, where the ICU criterion was excluded from the model due to small sample size and quasiseparation in the model. The model results are presented in Table 3 for the individual hospitals and combined study cohort.
| Safety Net Hospital Cohort, C Index=0.76 | Academic Center Cohort, C Index=0.76 | Combined Hospital Cohort, C Index=0.79 | ||||
|---|---|---|---|---|---|---|
| Estimate | Odds Ratio (95% CI) | Estimate | Odds Ratio (95% CI) | Estimate | Odds Ratio (95% CI) | |
| ||||||
| Cancer | 1.92 | 6.85 (2.83‐16.59)a | 1.85 | 6.36 (3.54‐11.41)a | 1.98 | 7.23 (4.45‐11.75)a |
| Admissions to the hospital 2 in past year | 0.55 | 1.74 (0.76‐3.97) | 0.14 | 0.87 (0.51‐1.49) | 0.20 | 1.22 (0.78‐1.91) |
| Resident in a nursing home | 0.49 | 0.61 (0.06‐6.56) | 0.27 | 1.31 (0.37‐4.66) | 0.09 | 1.09 (0.36‐3.32) |
| ICU with MOF | 1.85 | 6.34 (2.0219.90)a | 1.94 | 6.97 (2.75‐17.68)a | ||
| NHPCO (2) noncancer guidelines | 3.04 | 20.86 (4.25102.32)a | 2.62 | 13.73 (5.86‐32.15)a | 2.74 | 15.55 (7.2833.23)a |
| Ageb | 0.38 | 1.46 (1.05‐2.03)a | 0.45 | 1.56 (1.23‐1.98)a | 0.47 | 1.60 (1.32‐1.93)a |
In the safety‐net hospital, admission to the hospital with a primary diagnosis related to cancer, 2 noncancer hospice guidelines, ICU admission with MOF, and age by category all were significant predictors of 1‐year mortality. In the university hospital cohort, primary diagnosis of cancer, 2 noncancer hospice guidelines, and age by category were predictive of 1‐year mortality. Finally, in the entire study cohort, primary diagnosis of cancer, ICU with MOF, 2 noncancer hospice guidelines, and age were all predictive of 1‐year mortality. Parameter estimates were similar in 3 of the criteria compared to the VA setting. Differences in patient characteristics may have caused the differences in the estimates. Gender was additionally tested but not significant in any model. One‐year survival was significantly lower for those who met 1 of the CARING criteria versus those who did not (Figure 1).

Based on the framework from the original CARING criteria analysis, a scoring rule was developed using the regression results of this validation cohort. To predict a high probability of 1‐year mortality, sensitivity was set to 58% and specificity was set at 86% (error rate=17%). Medium to high probability was set with a sensitivity of 73% and specificity of 72% (error rate=28%). The coefficients from the regression model of the entire study cohort were converted to scores for each of the CARING criteria. The scores are as follows: 0.5 points for admission from a nursing home, 1 point for 2 hospital admissions in the past year for a chronic illness, 10 points for primary diagnosis of cancer, 10 points for ICU admission with MOF, and 14 points for 2 noncancer hospice guidelines. For every age category increase, 2 points are assigned so that 0 points for age <55 years, 2 points for ages 56 to 65 years, 4 points for ages 66 to 75 years, and 6 points for >75 years. Points for individual risk factors were proportional to s (ie, log odds) in the logistic regression model for death at 1 year. Although no linear transformation exists between s and probabilities (of death at 1 year), the aggregated points for combinations of risk factors shown in Table 4 follow the probabilities in an approximately linear fashion, so that different degrees of risk of death can be represented contiguously (as highlighted by differently shaded regions in the scoring matrix) (Table 4). The scoring matrix allows for quick identification for patients at high risk for 1‐year mortality. In this non‐VA setting with healthier patients, low risk is defined at a lower probability threshold (0.1) compared to the VA setting (0.175).
| CARING Criteria Components | |||||||
|---|---|---|---|---|---|---|---|
| None | Resident in a Nursing Home | Admitted to the Hospital 2 Times in the Past Year | Resident in a Nursing Home Admitted to the Hospital 2 Times in the Past Year | Primary Diagnosis of Cancer | ICU Admission With MOF | Noncancer Hospice Guidelines | |
| |||||||
| Age | |||||||
| 55 years | 0 | 0.5 | 1 | 1.5 | 10 | ||
| 5565 years | 2 | 2.5 | 3 | 3.5 | 10 | ||
| 6675 years | 4 | 4.5 | 5 | 5.5 | 10 | ||
| >75 years | 6 | 6.5 | 7 | 7.5 | 10 | ||
| Risk | |||||||
| Low | 3.5 | Probability<0.1 | |||||
| Medium | 46.5 | 0.1probability <0.175 | |||||
| High | 7 | Probability0.175 | |||||
DISCUSSION
The CARING criteria are a practical prognostic tool that can be easily and rapidly applied to patients admitted to the hospital to estimate risk of death in 1 year, with the goal of identifying patients who may benefit most from incorporating palliative interventions into their plan of care. This study validated the CARING criteria in a tertiary referral university hospital and safety‐net hospital setting, demonstrating applicability in a much broader population than the VA hospital of the original CARING criteria study. The population studied represented a younger population by over 10 years, a more equitable proportion of males to females, a broader ethnic diversity, and lower 1‐year deaths rates than the original study. Despite the broader representation of the population, the significance of each of the individual CARING criterion was maintained except for 2 hospital admissions in the past year for a chronic illness (admission from a nursing home did not meet significance in either study as a sole criterion). As with the original study, meeting 2 of the NHPCO noncancer hospice guidelines demonstrated the highest risk of 1‐year mortality following index hospitalization, followed by primary diagnosis of cancer and ICU admission with MOF. Advancing age, also similar to the original study, conferred increased risk across the criterion.
Hospitalists could be an effective target for utilizing the CARING criteria because they are frequently the first‐line providers in the hospital setting. With the national shortage of palliative care specialists, hospitalists need to be able to identify when a patient has a limited life expectancy so they will be better equipped to make clinical decisions that are aligned with their patients' values, preferences, and goals of care. With the realization that not addressing advance care planning and patient goals of care may be considered medical errors, primary palliative care skills become alarmingly more important as priorities for hospitalists to obtain and feel comfortable using in daily practice.
The CARING criteria are directly applicable to patients who are seen by hospitalists. Other prognostic indices have focused on select patient populations, such as the elderly,[10, 11, 12] require collection of data that are not readily available on admission or would not otherwise be obtained,[10, 13] or apply to patients post‐hospital discharge, thereby missing the opportunity to make an impact earlier in the disease trajectory and incorporate palliative care into the hospital plan of care when key discussions about goals of care and preferences should be encouraged.
Additionally, the CARING criteria could easily be incorporated as a trigger for palliative care consults on hospital admission. Palliative care consults tend to happen late in a hospital stay, limiting the effectiveness of the palliative care team. A trigger system for hospitalists and other primary providers on hospital admission would lend to more effective timing of palliative measures being incorporated into the plan of care. Palliative care consults would not only be initiated earlier, but could be targeted for the more complex and sick patients with the highest risk of death in the next year.
In the time‐pressured environment, the presence of any 1 of the CARING criteria can act as a trigger to begin incorporating primary palliative care measures into the plan of care. The admitting hospitalist provider (ie, physician, nurse practitioner, physician assistant) could access the CARING criteria through an electronic health record prompt when admitting patients. When a more detailed assessment of mortality risk is helpful, the hospitalist can use the scoring matrix, which combines age with the individual criterion to calculate patients at medium or high risk of death within 1 year. Limited resources can then be directed to the patients with the greatest need. Patients with a focused care need, such as advance care planning or hospice referral, can be directed to the social worker or case manager. More complicated patients may be referred to a specialty palliative care team.
Several limitations to this study are recognized, including the small sample size of patients meeting criterion for ICU with MOF in the academic center study cohort. The patient data were collected during a transition time when the university hospital moved to a new campus, resulting in an ICU at each campus that housed patients with differing levels of illness severity, which may have contributed to the lower acuity ICU patient observed. Although we advocate the simplicity of the CARING criteria, the NHPCO noncancer hospice guidelines are more complicated, as they incorporates 8 broad categories of chronic illness. The hospice guidelines may not be general knowledge to the hospitalist or other primary providers. ePrognosis (
CONCLUSION
The CARING criteria are a simple, practical prognostic tool predictive of death within 1 year that has been validated in a broad population of hospitalized patients. The criteria hold up in a younger, healthier population that is more diverse by age, gender, and ethnicity than the VA population. With ready access to critical prognostic information on hospital admission, clinicians will be better informed to make decisions that are aligned with their patients' values, preferences, and goals of care.
Disclosure
Nothing to report.
- , , . Predicting death: an empirical evaluation of predictive tools for mortality. Arch Intern Med. 2011;171:1721–1726.
- , . Extent and determinants of error in physicians' prognoses in terminally ill patients: prospective cohort study. West J Med. 2000;172:310–313.
- , , , et al. A systematic review of physicians' survival predictions in terminally ill cancer patients. BMJ. 2003;327:195–198.
- , . Attitude and self‐reported practice regarding prognostication in a national sample of internists. Arch Intern Med. 1998;158:2389–2395.
- , , , et al. Discussing prognosis: balancing hope and realism. Cancer J. 2010;16:461–466.
- , , , . Acute Physiology and Chronic Health Evaluation (APACHE) IV: hospital mortality assessment for today's critically ill patients. Crit Care Med. 2006;34:1297–1310.
- , , , , . SAPS 3 admission score: an external validation in a general intensive care population. Intensive Care Med. 2008;34:1873–1877.
- , , , , , . Prospective validation of the intensive care unit admission Mortality Probability Model (MPM0‐III). Crit Care Med. 2009;37:1619–1623.
- , , , , , . A practical tool to identify patients who may benefit from a palliative approach: the CARING criteria. J Pain Symptom Manage. 2006;31:285–292.
- , , , et al. Prediction of survival for older hospitalized patients: the HELP survival model. J Am Geriatr Soc. 2000;48:S16–S24.
- , , , et al. Development and validation of a multidimensional prognostic index for one‐year mortality from comprehensive geriatric assessment in hospitalized older patients. Rejuvenation Res. 2008;11:151–161.
- , , , et al. Burden of illness score for elderly persons: risk adjustment incorporating the cumulative impact of diseases, physiologic abnormalities, and functional impairments. Med Care. 2003;41:70–83.
- , , , et al. The SUPPORT prognostic model. Objective estimates of survival for seriously ill hospitalized adults. Study to understand prognoses and preferences for outcomes and risks of treatments. Ann Intern Med. 1995;122:191–203.
Prognostication continues to be a challenge to the clinician despite over 100 prognostic indices that have been developed during the past few decades to inform clinical practice and medical decision making.[1] Physicians are not accurate in prognostication of patients' risk of death and tend to overestimate survival.[2, 3] In addition, many physicians do not feel comfortable offering a prognosis to patients, despite patients' wishes to be informed.[4, 5] Regardless of the prevalence in the literature and value in improving physicians' prognostic accuracy, prognostic indices of survival are not regularly utilized in the hospital setting. Prognostic tools available for providers are often complicated and may require data about patients that are not readily available.[6, 7, 8] Prognostic indices may be too specific to a patient population, too difficult to remember, or too time consuming to use. A simple, rapid, and practical prognostic index is important in the hospital setting to assist in identifying patients at high risk of death so that primary palliative interventions can be incorporated into the plan of care early in the hospital stay. Patient and family education, advance care planning, formulating the plan of care based on patientfamily goals, and improved resource utilization could be better executed by more accurate risk of death prediction on hospital admission.
The CARING criteria are the only prognostic index to our knowledge that evaluates a patient's risk of death in the next year, with information readily available at the time of hospital admission (Table 1).[9] The CARING criteria are a unique prognostic tool: (1) CARING is a mnemonic acronym, making it more user friendly to the clinician. (2) The 5 prognostic indicators are readily available from the patient's chart on admission; gathering further data by patient or caretaker interviews or by obtaining laboratory data is not needed. (3) The timing for application of the tool on admission to the hospital is an ideal opportunity to intervene and introduce palliative interventions early on the hospital stay. The CARING criteria were developed and validated in a Veteran's Administration hospital setting by Fischer et al.[9] We sought to validate the CARING criteria in a broader patient populationmedical and surgical patients from a tertiary referral university hospital setting and a safety‐net hospital setting.
METHODS
Study Design
This study was a retrospective observational cohort study. The study was approved by the Colorado Multiple Institutional Review Board and the University of Colorado Hospital Research Review Committee.
Study Purpose
To validate the CARING criteria in a tertiary referral university hospital (University of Colorado Hospital [UCH]) and safety‐net hospital (Denver Health and Hospitals [DHH]) setting using similar methodology to that employed by the original CARING criteria study.[9]
Study Setting/Population
All adults (18 years of age) admitted as inpatients to the medical and surgical services of internal medicine, hospitalist, pulmonary, cardiology, hematology/oncology, hepatology, surgery, intensive care unit, and intermediary care unit at UCH and DHH during the study period of July 2005 through August 2005. The only exclusion criteria were those patients who were prisoners or pregnant. Administrative admission data from July 2005 to August 2005 were used to identify names of all persons admitted to the medicine and surgical services of the study hospitals during the specified time period.
The 2 study hospitals, UCH and DHH, provide a range of patients who vary in ethnicity, socioeconomic status, and medical illness. This variability allows for greater generalizability of the results. Both hospitals are affiliated with the University of Colorado School of Medicine internal medicine residency training program and are located in Denver, Colorado.
At the time of the study, UCH was a licensed 550‐bed tertiary referral, academic hospital serving the Denver metropolitan area and the Rocky Mountain region as a specialty care and referral center. DHH was a 398‐bed, academic, safety‐net hospital serving primarily the Denver metropolitan area. DHH provides 42% of the care for the uninsured in Denver and 26% of the uninsured care for the state of Colorado.
Measures
The CARING criteria were developed and validated in a Veteran's Administration (VA) hospital setting by Fischer et al.[9] The purpose of the CARING criteria is to identify patients, at the time of hospital admission, who are at higher risk of death in the following year. The prognostic index uses 5 predictors that can be abstracted from the chart at time of admission. The CARING criteria were developed a priori, and patients were evaluated using only the medical data available at the time of admission. The criteria include items that are already part of the routine physician admission notes and do not require additional data collection or assessments. The criteria include: C=primary diagnosis of cancer, A=2 admissions to the hospital for a chronic illness within the last year; R=resident in a nursing home; I=intensive care unit (ICU) admission with multiorgan failure (MOF), NG=noncancer hospice guidelines (meeting 2 of the National Hospice and Palliative Care Organization's [NHPCO] guidelines).
Patients were identified using name, date of birth, social security number, address, and phone number. This identifying information was then used for tracing death records 1 year after hospital admission.
Mortality at 1 year following the index hospitalization was the primary end point. To minimize missing data and the number of subjects lost to follow‐up, 3 determinants of mortality were used. First, electronic medical records of the 2 participating hospitals and their outpatient clinics were reviewed to determine if a follow‐up appointment had occurred past the study's end point of 1 year (August 2006). For those without a confirmed follow‐up visit, death records from the Colorado Department of Public Health and Vital Records were obtained. For those patients residing outside of Colorado or whose mortality status was still unclear, the National Death Index was accessed.
Medical Record Review
Medical records for all study participants were reviewed by J.Y. (UCH) and B.C. (DHH). Data collection was completed using direct data entry into a Microsoft Access (Microsoft Corp., Redmond, WA) database utilizing a data entry form linked with the database table. This form utilized skip patterns and input masks to ensure quality of data entry and minimize missing or invalid data. Inter‐rater reliability was assessed by an independent rereview (S.F.) of 5% of the total charts. Demographic variables were collected using hospital administrative data. These included personal identifiers of the participants for purposes of mortality follow‐up. Clinical data including the 5 CARING variables and additional descriptive variables were abstracted from the paper hospital chart and the electronic record of the chart (together these constitute the medical record).
Death Follow‐up
A search of Colorado death records was conducted in February 2011 for all subjects. Death records were used to determine mortality and time to death from the index hospitalization. The National Death Index was then searched for any subjects without or record of death in Colorado.
Analysis
All analyses were conducted using the statistical application software SAS for Windows version 9.3 (SAS Institute, Cary, NC). Simple frequencies and means ( standard deviation) were used to describe the baseline characteristics. Multiple logistic regression models were used to model 1‐year mortality. The models were fitted using all of the CARING variables and age. As the aim of the study was to validate the CARING criteria, the variables for the models were selected a priori based on the original index. Two hospital cohorts (DHH and UCH) were modeled separately and as a combined sample. Kaplan‐Meier survival analysis was conducted to compare those subjects who met 1 of the CARING criteria with those who did not through the entire period of mortality follow‐up (20052011). Finally, using the probabilities from the logistic regression models, we again developed a scoring rule appropriate for a non‐VA setting to allow clinicians to easily identify patient risk for 1‐year mortality at the time of hospital admission.
RESULTS
There were a total of 1064 patients admitted to the medical and surgical services during the study period568 patients at DHH and 496 patients at UCH. Sample characteristics of each individual hospital cohort and the entire combined study cohort are detailed in Table 2. Overall, slightly over half the population were male, with a mean age of 50 years, and the ethnic breakdown roughly reflects the population in Denver. A total of 36.5% (n=388) of the study population met 1 of the CARING criteria, and 12.6% (n=134 among 1063 excluding 1 without an admit date) died within 1 year of the index hospitalization. These were younger and healthier patients compared to the VA sample used in developing the CARING criteria.
| |
| Renal | Dementia |
| Stop/decline dialysis | Unable to ambulate independently |
| Not candidate for transplant | Urinary or fecal incontinence |
| Urine output < 40cc/24 hours | Unable to speak with more than single words |
| Creatinine > 8.0 (>6.0 for diabetics) | Unable to bathe independently |
| Creatinine clearance 10cc/min | Unable to dress independently |
| Uremia | Co‐morbid conditions: |
| Persistent serum K + > 7.0 | Aspiration pneumonia |
| Co‐morbid conditions: | Pyelonephritis |
| Cancer CHF | Decubitus ulcer |
| Chronic lung disease AIDS/HIV | Difficulty swallowing or refusal to eat |
| Sepsis Cirrhosis | |
| Cardiac | Pulmonary |
| Ejection fraction < 20% | Dyspnea at rest |
| Symptomatic with diuretics and vasodilators | FEV1 < 30% |
| Not candidate for transplant | Frequent ER or hospital admits for pulmonary infections or respiratory distress |
| History of cardiac arrest | Cor pulmonale or right heart failure |
| History of syncope | 02 sat < 88% on 02 |
| Systolic BP < 120mmHG | PC02 > 50 |
| CVA cardiac origin | Resting tachycardia > 100/min |
| Co‐morbid conditions as listed in Renal | Co‐morbid conditions as listed in Renal |
| Liver | Stroke/CVA |
| End stage cirrhosis | Coma at onset |
| Not candidate for transplant | Coma >3 days |
| Protime > 5sec and albumin <2.5 | Limb paralysis |
| Ascites unresponsive to treatment | Urinary/fecal incontinence |
| Hepatorenal syndrome | Impaired sitting balance |
| Hepatic encephalopathy | Karnofsky < 50% |
| Spontaneous bacterial peritonitis | Recurrent aspiration |
| Recurrent variceal bleed | Age > 70 |
| Co‐morbid conditions as listed in Renal | Co‐morbid conditions as listed in Renal |
| HIV/AIDS | Neuromuscular |
| Persistent decline in function | Diminished respiratory function |
| Chronic diarrhea 1 year | Chosen not to receive BiPAP/vent |
| Decision to stop treatment | Difficulty swallowing |
| CNS lymphoma | Diminished functional status |
| MAC‐untreated | Incontinence |
| Systemic lymphoma | Co‐morbid conditions as listed in Renal |
| Dilated cardiomyopathy | |
| CD4 < 25 with disease progression | |
| Viral load > 100,000 | |
| Safety‐Net Hospital Cohort, N=568 | Academic Center Cohort, N=496 | Study Cohort,N=1064 | Original CARING Cohort, N=8739 | |
|---|---|---|---|---|
| ||||
| Mean age ( SD), y | 47.8 (16.5) | 54.4 (17.5) | 50.9 (17.3) | 63 (13) |
| Male gender | 59.5% (338) | 50.1% (248) | 55.1% (586) | 98% (856) |
| Ethnicity | ||||
| African American | 14.1% (80) | 13.5% (65) | 13.8% (145) | 13% (114) |
| Asian | 0.4% (2) | 1.5% (7) | 0.9% (9) | Not reported |
| Caucasian | 41.7% (237) | 66.3% (318) | 53.0 % (555) | 69% (602) |
| Latino | 41.9% (238) | 9.6% (46) | 27.1% (284) | 8% (70) |
| Native American | 0.5% (3) | 0.4% (2) | 0.5% (5) | Not reported |
| Other | 0.5% (3) | 0.6% (3) | 0.6% (6) | 10% (87) |
| Unknown | 0.9% (5) | 8.1% (39) | 4.2% (44) | Not reported |
| CARING criteria | ||||
| Cancer | 6.2% (35) | 19.4% (96) | 12.3% (131) | 23% (201) |
| Admissions to the hospital 2 in past year | 13.6% (77) | 42.7% (212) | 27.2% (289) | 36% (314) |
| Resident in a nursing home | 1.8% (10) | 3.4% (17) | 2.5% (27) | 3% (26) |
| ICU with MOF | 3.7% (21) | 1.2% (6) | 2.5% (27) | 2% (17) |
| NHPCO (2) noncancer guidelines | 1.6% (9) | 5.9% (29) | 3.6% (38) | 8% (70) |
Reliability testing demonstrated excellent inter‐rater reliability. Kappa for each criterion is as follows: (1) primary diagnosis of cancer=1.0, (2) 2 admissions to the hospital in the past year=0.91, (3) resident in a nursing home=1.0, (4) ICU admission with MOF=1.0, and (5) 2 noncancer hospice guidelines=0.78.
This study aimed to validate the CARING criteria9; therefore, all original individual CARING criterion were included in the validation logistic regression models. The 1 exception to this was in the university hospital study cohort, where the ICU criterion was excluded from the model due to small sample size and quasiseparation in the model. The model results are presented in Table 3 for the individual hospitals and combined study cohort.
| Safety Net Hospital Cohort, C Index=0.76 | Academic Center Cohort, C Index=0.76 | Combined Hospital Cohort, C Index=0.79 | ||||
|---|---|---|---|---|---|---|
| Estimate | Odds Ratio (95% CI) | Estimate | Odds Ratio (95% CI) | Estimate | Odds Ratio (95% CI) | |
| ||||||
| Cancer | 1.92 | 6.85 (2.83‐16.59)a | 1.85 | 6.36 (3.54‐11.41)a | 1.98 | 7.23 (4.45‐11.75)a |
| Admissions to the hospital 2 in past year | 0.55 | 1.74 (0.76‐3.97) | 0.14 | 0.87 (0.51‐1.49) | 0.20 | 1.22 (0.78‐1.91) |
| Resident in a nursing home | 0.49 | 0.61 (0.06‐6.56) | 0.27 | 1.31 (0.37‐4.66) | 0.09 | 1.09 (0.36‐3.32) |
| ICU with MOF | 1.85 | 6.34 (2.0219.90)a | 1.94 | 6.97 (2.75‐17.68)a | ||
| NHPCO (2) noncancer guidelines | 3.04 | 20.86 (4.25102.32)a | 2.62 | 13.73 (5.86‐32.15)a | 2.74 | 15.55 (7.2833.23)a |
| Ageb | 0.38 | 1.46 (1.05‐2.03)a | 0.45 | 1.56 (1.23‐1.98)a | 0.47 | 1.60 (1.32‐1.93)a |
In the safety‐net hospital, admission to the hospital with a primary diagnosis related to cancer, 2 noncancer hospice guidelines, ICU admission with MOF, and age by category all were significant predictors of 1‐year mortality. In the university hospital cohort, primary diagnosis of cancer, 2 noncancer hospice guidelines, and age by category were predictive of 1‐year mortality. Finally, in the entire study cohort, primary diagnosis of cancer, ICU with MOF, 2 noncancer hospice guidelines, and age were all predictive of 1‐year mortality. Parameter estimates were similar in 3 of the criteria compared to the VA setting. Differences in patient characteristics may have caused the differences in the estimates. Gender was additionally tested but not significant in any model. One‐year survival was significantly lower for those who met 1 of the CARING criteria versus those who did not (Figure 1).
Based on the framework from the original CARING criteria analysis, a scoring rule was developed using the regression results of this validation cohort. To predict a high probability of 1‐year mortality, sensitivity was set to 58% and specificity was set at 86% (error rate=17%). Medium to high probability was set with a sensitivity of 73% and specificity of 72% (error rate=28%). The coefficients from the regression model of the entire study cohort were converted to scores for each of the CARING criteria. The scores are as follows: 0.5 points for admission from a nursing home, 1 point for 2 hospital admissions in the past year for a chronic illness, 10 points for primary diagnosis of cancer, 10 points for ICU admission with MOF, and 14 points for 2 noncancer hospice guidelines. For every age category increase, 2 points are assigned so that 0 points for age <55 years, 2 points for ages 56 to 65 years, 4 points for ages 66 to 75 years, and 6 points for >75 years. Points for individual risk factors were proportional to s (ie, log odds) in the logistic regression model for death at 1 year. Although no linear transformation exists between s and probabilities (of death at 1 year), the aggregated points for combinations of risk factors shown in Table 4 follow the probabilities in an approximately linear fashion, so that different degrees of risk of death can be represented contiguously (as highlighted by differently shaded regions in the scoring matrix) (Table 4). The scoring matrix allows for quick identification for patients at high risk for 1‐year mortality. In this non‐VA setting with healthier patients, low risk is defined at a lower probability threshold (0.1) compared to the VA setting (0.175).
| CARING Criteria Components | |||||||
|---|---|---|---|---|---|---|---|
| None | Resident in a Nursing Home | Admitted to the Hospital 2 Times in the Past Year | Resident in a Nursing Home Admitted to the Hospital 2 Times in the Past Year | Primary Diagnosis of Cancer | ICU Admission With MOF | Noncancer Hospice Guidelines | |
| |||||||
| Age | |||||||
| 55 years | 0 | 0.5 | 1 | 1.5 | 10 | ||
| 5565 years | 2 | 2.5 | 3 | 3.5 | 10 | ||
| 6675 years | 4 | 4.5 | 5 | 5.5 | 10 | ||
| >75 years | 6 | 6.5 | 7 | 7.5 | 10 | ||
| Risk | |||||||
| Low | 3.5 | Probability<0.1 | |||||
| Medium | 46.5 | 0.1probability <0.175 | |||||
| High | 7 | Probability0.175 | |||||
DISCUSSION
The CARING criteria are a practical prognostic tool that can be easily and rapidly applied to patients admitted to the hospital to estimate risk of death in 1 year, with the goal of identifying patients who may benefit most from incorporating palliative interventions into their plan of care. This study validated the CARING criteria in a tertiary referral university hospital and safety‐net hospital setting, demonstrating applicability in a much broader population than the VA hospital of the original CARING criteria study. The population studied represented a younger population by over 10 years, a more equitable proportion of males to females, a broader ethnic diversity, and lower 1‐year deaths rates than the original study. Despite the broader representation of the population, the significance of each of the individual CARING criterion was maintained except for 2 hospital admissions in the past year for a chronic illness (admission from a nursing home did not meet significance in either study as a sole criterion). As with the original study, meeting 2 of the NHPCO noncancer hospice guidelines demonstrated the highest risk of 1‐year mortality following index hospitalization, followed by primary diagnosis of cancer and ICU admission with MOF. Advancing age, also similar to the original study, conferred increased risk across the criterion.
Hospitalists could be an effective target for utilizing the CARING criteria because they are frequently the first‐line providers in the hospital setting. With the national shortage of palliative care specialists, hospitalists need to be able to identify when a patient has a limited life expectancy so they will be better equipped to make clinical decisions that are aligned with their patients' values, preferences, and goals of care. With the realization that not addressing advance care planning and patient goals of care may be considered medical errors, primary palliative care skills become alarmingly more important as priorities for hospitalists to obtain and feel comfortable using in daily practice.
The CARING criteria are directly applicable to patients who are seen by hospitalists. Other prognostic indices have focused on select patient populations, such as the elderly,[10, 11, 12] require collection of data that are not readily available on admission or would not otherwise be obtained,[10, 13] or apply to patients post‐hospital discharge, thereby missing the opportunity to make an impact earlier in the disease trajectory and incorporate palliative care into the hospital plan of care when key discussions about goals of care and preferences should be encouraged.
Additionally, the CARING criteria could easily be incorporated as a trigger for palliative care consults on hospital admission. Palliative care consults tend to happen late in a hospital stay, limiting the effectiveness of the palliative care team. A trigger system for hospitalists and other primary providers on hospital admission would lend to more effective timing of palliative measures being incorporated into the plan of care. Palliative care consults would not only be initiated earlier, but could be targeted for the more complex and sick patients with the highest risk of death in the next year.
In the time‐pressured environment, the presence of any 1 of the CARING criteria can act as a trigger to begin incorporating primary palliative care measures into the plan of care. The admitting hospitalist provider (ie, physician, nurse practitioner, physician assistant) could access the CARING criteria through an electronic health record prompt when admitting patients. When a more detailed assessment of mortality risk is helpful, the hospitalist can use the scoring matrix, which combines age with the individual criterion to calculate patients at medium or high risk of death within 1 year. Limited resources can then be directed to the patients with the greatest need. Patients with a focused care need, such as advance care planning or hospice referral, can be directed to the social worker or case manager. More complicated patients may be referred to a specialty palliative care team.
Several limitations to this study are recognized, including the small sample size of patients meeting criterion for ICU with MOF in the academic center study cohort. The patient data were collected during a transition time when the university hospital moved to a new campus, resulting in an ICU at each campus that housed patients with differing levels of illness severity, which may have contributed to the lower acuity ICU patient observed. Although we advocate the simplicity of the CARING criteria, the NHPCO noncancer hospice guidelines are more complicated, as they incorporates 8 broad categories of chronic illness. The hospice guidelines may not be general knowledge to the hospitalist or other primary providers. ePrognosis (
CONCLUSION
The CARING criteria are a simple, practical prognostic tool predictive of death within 1 year that has been validated in a broad population of hospitalized patients. The criteria hold up in a younger, healthier population that is more diverse by age, gender, and ethnicity than the VA population. With ready access to critical prognostic information on hospital admission, clinicians will be better informed to make decisions that are aligned with their patients' values, preferences, and goals of care.
Disclosure
Nothing to report.
- , , . Predicting death: an empirical evaluation of predictive tools for mortality. Arch Intern Med. 2011;171:1721–1726.
- , . Extent and determinants of error in physicians' prognoses in terminally ill patients: prospective cohort study. West J Med. 2000;172:310–313.
- , , , et al. A systematic review of physicians' survival predictions in terminally ill cancer patients. BMJ. 2003;327:195–198.
- , . Attitude and self‐reported practice regarding prognostication in a national sample of internists. Arch Intern Med. 1998;158:2389–2395.
- , , , et al. Discussing prognosis: balancing hope and realism. Cancer J. 2010;16:461–466.
- , , , . Acute Physiology and Chronic Health Evaluation (APACHE) IV: hospital mortality assessment for today's critically ill patients. Crit Care Med. 2006;34:1297–1310.
- , , , , . SAPS 3 admission score: an external validation in a general intensive care population. Intensive Care Med. 2008;34:1873–1877.
- , , , , , . Prospective validation of the intensive care unit admission Mortality Probability Model (MPM0‐III). Crit Care Med. 2009;37:1619–1623.
- , , , , , . A practical tool to identify patients who may benefit from a palliative approach: the CARING criteria. J Pain Symptom Manage. 2006;31:285–292.
- , , , et al. Prediction of survival for older hospitalized patients: the HELP survival model. J Am Geriatr Soc. 2000;48:S16–S24.
- , , , et al. Development and validation of a multidimensional prognostic index for one‐year mortality from comprehensive geriatric assessment in hospitalized older patients. Rejuvenation Res. 2008;11:151–161.
- , , , et al. Burden of illness score for elderly persons: risk adjustment incorporating the cumulative impact of diseases, physiologic abnormalities, and functional impairments. Med Care. 2003;41:70–83.
- , , , et al. The SUPPORT prognostic model. Objective estimates of survival for seriously ill hospitalized adults. Study to understand prognoses and preferences for outcomes and risks of treatments. Ann Intern Med. 1995;122:191–203.
© 2013 Society of Hospital Medicine
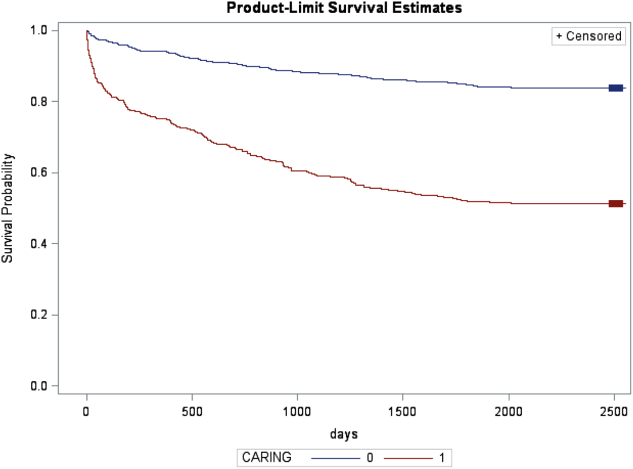
Curbside vs Formal Consultation
A curbside consultation is an informal process whereby a consultant is asked to provide information or advice about a patient's care without doing a formal assessment of the patient.14 Curbside consultations are common in the practice of medicine2, 3, 5 and are frequently requested by physicians caring for hospitalized patients. Several surveys have documented the quantity of curbside consultations requested of various subspecialties, the types of questions asked, the time it takes to respond, and physicians' perceptions about the quality of the information exchanged.111 While curbside consultations have a number of advantages, physicians' perceptions are that the information conveyed may be inaccurate or incomplete and that the advice offered may be erroneous.13, 5, 10, 12, 13
Cartmill and White14 performed a random audit of 10% of the telephone referrals they received for neurosurgical consultation over a 1‐year period and noted discrepancies between the Glascow Coma Scores reported during the telephone referrals and those noted in the medical records, but the frequency of these discrepancies was not reported. To our knowledge, no studies have compared the quality of the information provided in curbside consultations with that obtained in formal consultations that included direct face‐to‐face patient evaluations and primary data collection, and whether the advice provided in curbside and formal consultations on the same patient differed.
We performed a prospective cohort study to compare the information received by hospitalists during curbside consultations on hospitalized patients, with that obtained from formal consultations done the same day on the same patients, by different hospitalists who were unaware of any details regarding the curbside consultation. We also compared the advice provided by the 2 hospitalists following their curbside and formal consultations. Our hypotheses were that the information received during curbside consultations was frequently inaccurate or incomplete, that the recommendations made after the formal consultation would frequently differ from those made in the curbside consultation, and that these differences would have important implications on patient care.
METHODS
This was a quality improvement study conducted at Denver Health, a 500‐bed university‐affiliated urban safety net hospital from January 10, 2011 to January 9, 2012. The study design was a prospective cohort that included all curbside consultations on hospitalized patients received between 7 AM and 3 PM, on intermittently selected weekdays, by the Internal Medicine Consultation Service that was staffed by 18 hospitalists. Data were collected intermittently based upon hospitalist availability and was done to limit potential alterations in the consulting practices of the providers requesting consultations.
Consultations were defined as being curbside when the consulting provider asked for advice, suggestions, or opinions about a patient's care but did not ask the hospitalist to see the patient.15, 15 Consultations pertaining to administrative issues (eg, whether a patient should be admitted to an intensive care bed as opposed to an acute care floor bed) or on patients who were already being followed by a hospitalist were excluded.
The hospitalist receiving the curbside consultation was allowed to ask questions as they normally would, but could not verify the accuracy of the information received (eg, could not review any portion of the patient's medical record, such as notes or lab data). A standardized data collection sheet was used to record the service and level of training of the requesting provider, the medical issue(s) of concern, all clinical data offered by the provider, the number of questions asked by the hospitalist of the provider, and whether, on the basis of the information provided, the hospitalist felt that the question(s) being asked was (were) of sufficient complexity that a formal consultation should occur. The hospitalist then offered advice based upon the information given during the curbside consultation.
After completing the curbside consultation, the hospitalist requested verbal permission from the requesting provider to perform a formal consultation. If the request was approved, the hospitalist performing the curbside consultation contacted a different hospitalist who performed the formal consultation within the next few hours. The only information given to the second hospitalist was the patient's identifiers and the clinical question(s) being asked. The formal consultation included a complete face‐to‐face history and physical examination, a review of the patient's medical record, documentation of the provider's findings, and recommendations for care.
Upon completion of the formal consultation, the hospitalists who performed the curbside and the formal consultations met to review the advice each gave to the requesting provider and the information on which this advice was based. The 2 hospitalists jointly determined the following: (a) whether the information received during the curbside consultation was correct and complete, (b) whether the advice provided in the formal consultation differed from that provided in the curbside consultation, (c) whether the advice provided in the formal consultation dealt with issues other than one(s) leading to the curbside consultation, (d) whether differences in the recommendations given in the curbside versus the formal consultation changed patient management in a meaningful way, and (e) whether the curbside consultation alone was felt to be sufficient.
Information obtained by the hospitalist performing the formal consultation that was different from, or not included in, the information recorded during the curbside consultation was considered to be incorrect or incomplete, respectively. A change in management was defined as an alteration in the direction or type of care that the patient would have received as a result of the advice being given. A pulmonary and critical care physician, with >35 years of experience in inpatient medicine, reviewed the information provided in the curbside and formal consultations, and independently assessed whether the curbside consultation alone would have been sufficient and whether the formal consultation changed management.
Curbside consultations were neither solicited nor discouraged during the course of the study. The provider requesting the curbside consultation was not informed or debriefed about the study in an attempt to avoid affecting future consultation practices from that provider or service.
Associations were sought between the frequency of inaccurate or incomplete data and the requesting service and provider, the consultative category and medical issue, the number of questions asked by the hospitalist during the curbside consultation, and whether the hospitalist doing the curbside consultation thought that formal consultation was needed. A chi‐square test was used to analyze all associations. A P value of <0.05 was considered significant. All analyses were performed using SAS Enterprise Guide 4.3 (SAS Institute, Inc, Cary, NC) software. The study was approved by the Colorado Multiple Institutional Review Board.
RESULTS
Fifty curbside consultations were requested on a total of 215 study days. The requesting service declined formal consultation in 3 instances, leaving 47 curbside consultations that had a formal consultation. Curbside consultations came from a variety of services and providers, and addressed a variety of issues and concerns (Table 1).
| Curbside Consultations, N (%) | |
|---|---|
| 47 (100) | |
| |
| Requesting service | |
| Psychiatry | 21 (45) |
| Emergency Department | 9 (19) |
| Obstetrics/Gynecology | 5 (11) |
| Neurology | 4 (8) |
| Other (Orthopedics, Anesthesia, General Surgery, Neurosurgery, and Interventional Radiology) | 8 (17) |
| Requesting provider | |
| Resident | 25 (53) |
| Intern | 8 (17) |
| Attending | 9 (19) |
| Other | 5 (11) |
| Consultative issue* | |
| Diagnosis | 10 (21) |
| Treatment | 29 (62) |
| Evaluation | 20 (43) |
| Discharge | 13 (28) |
| Lab interpretation | 4 (9) |
| Medical concern* | |
| Cardiac | 27 (57) |
| Endocrine | 17 (36) |
| Infectious disease | 9 (19) |
| Pulmonary | 8 (17) |
| Gastroenterology | 6 (13) |
| Fluid and electrolyte | 6 (13) |
| Others | 23 (49) |
The hospitalists asked 0 to 2 questions during 8/47 (17%) of the curbside consultations, 3 to 5 questions during 26/47 (55%) consultations, and more than 5 questions during 13/47 (28%). Based on the information received during the curbside consultations, the hospitalists thought that the curbside consultations were insufficient for 18/47 (38%) of patients. In all instances, the opinions of the 2 hospitalists concurred with respect to this conclusion, and the independent reviewer agreed with this assessment in 17 of these 18 (94%).
The advice rendered in the formal consultations differed from that provided in 26/47 (55%) of the curbside consultations, and the formal consultation was thought to have changed management for 28/47 (60%) of patients (Table 2). The independent reviewer thought that the advice provided in the formal consultations changed management in 29/47 (62%) of the cases, and in 24/28 cases (86%) where the hospitalist felt that the formal consult changed management.
| Curbside Consultations, N (%) | |||
|---|---|---|---|
| Total | Accurate and Complete | Inaccurate or Incomplete | |
| 47 (100) | 23 (49) | 24 (51) | |
| |||
| Advice in formal consultation differed from advice in curbside consultation | 26 (55) | 7 (30) | 19 (79)* |
| Formal consultation changed management | 28 (60) | 6 (26) | 22 (92) |
| Minor change | 18 (64) | 6 (100) | 12 (55) |
| Major change | 10 (36) | 0 (0) | 10 (45) |
| Curbside consultation insufficient | 18 (38) | 2 (9) | 16 (67) |
Information was felt to be inaccurate or incomplete in 24/47 (51%) of the curbside consultations (13/47 inaccurate, 16/47 incomplete, 5/47 both inaccurate and incomplete), and when inaccurate or incomplete information was obtained, the advice given in the formal consultations more commonly differed from that provided in the curbside consultation (19/24, 79% vs 7/23, 30%; P < 0.001), and was more commonly felt to change management (22/24, 92% vs 6/23, 26%; P < 0.0001) (Table 2). No association was found between whether the curbside consultation contained complete or accurate information and the consulting service from which the curbside originated, the consulting provider, the consultative aspect(s) or medical issue(s) addressed, the number of questions asked by the hospitalist during the curbside consultation, nor whether the hospitalists felt that a formal consultation was needed.
DISCUSSION
The important findings of this study are that (a) the recommendations made by hospitalists in curbside versus formal consultations on the same patient frequently differ, (b) these differences frequently result in changes in clinical management, (c) the information presented in curbside consultations by providers is frequently inaccurate or incomplete, regardless of the providers specialty or seniority, (d) when inaccurate or incomplete information is received, the recommendations made in curbside and formal consultations differ more frequently, and (e) we found no way to predict whether the information provided in a curbside consultation was likely to be inaccurate or incomplete.
Our hospitalists thought that 38% of the curbside consultations they received should have had formal consultations. Manian and McKinsey7 reported that as many as 53% of questions asked of infectious disease consultants were thought to be too complex to be addressed in an informal consultation. Others, however, report that only 11%33% of curbside consultations were thought to require formal consultation.1, 9, 10, 16 Our hospitalists asked 3 or more questions of the consulting providers in more than 80% of the curbside consultations, suggesting that the curbside consultations we received might have had a higher complexity than those seen by others.
Our finding that information provided in curbside consultation was frequently inaccurate or incomplete is consistent with a number of previous studies reporting physicians' perceptions of the accuracy of curbside consultations.2, 3 Hospital medicine is not likely to be the only discipline affected by inaccurate curbside consultation practices, as surveys of specialists in infectious disease, gynecology, and neurosurgery report that practitioners in these disciplines have similar concerns.1, 10, 14 In a survey returned by 34 physicians, Myers1 found that 50% thought the information exchanged during curbside consultations was inaccurate, leading him to conclude that inaccuracies presented during curbside consultations required further study.
We found no way of predicting whether curbside consultations were likely to include inaccurate or incomplete information. This observation is consistent with the results of Bergus et al16 who found that the frequency of curbside consultations being converted to formal consultations was independent of the training status of the consulting physician, and with the data of Myers1 who found no way of predicting the likelihood that a curbside consultation should be converted to a formal consultation.
We found that formal consultations resulted in management changes more often than differences in recommendations (ie, 60% vs 55%, respectively). This small difference occurred because, on occasion, the formal consultations found issues to address other than the one(s) for which the curbside consultation was requested. In the majority of these instances, the management changes were minor and the curbside consultation was still felt to be sufficient.
In some instances, the advice given after the curbside and the formal consultations differed to only a minor extent (eg, varying recommendations for oral diabetes management). In other instances, however, the advice differed substantially (eg, change in antibiotic management in a septic patient with a multidrug resistant organism, when the original curbside question was for when to order a follow‐up chest roentgenogram for hypoxia; see Supporting Information, Appendix, in the online version of this article). In 26 patients (55%), formal consultation resulted in different medications being started or stopped, additional tests being performed, or different decisions being made about admission versus discharge.
Our study has a number of strengths. First, while a number of reports document that physicians' perceptions are that curbside consultations frequently contain errors,2, 3, 5, 12 to our knowledge this is the first study that prospectively compared the information collected and advice given in curbside versus formal consultation. Second, while this study was conducted as a quality improvement project, thereby requiring us to conclude that the results are not generalizable, the data presented were collected by 18 different hospitalists, reducing the potential of bias from an individual provider's knowledge base or practice. Third, there was excellent agreement between the independent reviewer and the 2 hospitalists who performed the curbside and formal consultations regarding whether a curbside consultation would have been sufficient, and whether the formal consultation changed patient management. Fourth, the study was conducted over a 1‐year period, which should have reduced potential bias arising from the increasing experience of residents requesting consultations as their training progressed.
Our study has several limitations. First, the number of curbside consultations we received during the study period (50 over 215 days) was lower than anticipated, and lower than the rates of consultation reported by others.1, 7, 9 This likely relates to the fact that, prior to beginning the study, Denver Health hospitalists already provided mandatory consultations for several surgical services (thereby reducing the number of curbside consultations received from these services), because curbside consultations received during evenings, nights, and weekends were not included in the study for reasons of convenience, and because we excluded all administrative curbside consultations. Our hospitalist service also provides consultative services 24 hours a day, thereby reducing the number of consultations received during daytime hours. Second, the frequency with which curbside consultations included inaccurate or incomplete information might be higher than what occurs in other hospitals, as Denver Health is an urban, university‐affiliated public hospital and the patients encountered may be more complex and trainees may be less adept at recognizing the information that would facilitate accurate curbside consultations (although we found no difference in the frequency with which inaccurate or incomplete information was provided as a function of the seniority of the requesting physician). Third, the disparity between curbside and formal consultations that we observed could have been biased by the Hawthorne effect. We attempted to address this by not providing the hospitalists who did the formal consultation with any information collected by the hospitalist involved with the curbside consultation, and by comparing the conclusions reached by the hospitalists performing the curbside and formal consultations with those of a third party reviewer. Fourth, while we found no association between the frequency of curbside consultations in which information was inaccurate or incomplete and the consulting service, there could be a selection bias of the consulting service requesting the curbside consultations as a result of the mandatory consultations already provided by our hospitalists. Finally, our study was not designed or adequately powered to determine why curbside consultations frequently have inaccurate or incomplete information.
In summary, we found that the information provided to hospitalists during a curbside consultation was often inaccurate and incomplete, and that these problems with information exchange adversely affected the accuracy of the resulting recommendations. While there are a number of advantages to curbside consultations,1, 3, 7, 10, 12, 13 our findings indicate that the risk associated with this practice is substantial.
Acknowledgements
Disclosure: Nothing to report.
- .Curbside consultation in infectious diseases: a prospective study.J Infect Dis.1984;150:797–802.
- ,,.Physicians' experiences and beliefs regarding informal consultation.JAMA.1998;280:900–904.
- ,,.Curbside consultation practices and attitudes among primary care physicians and medical subspecialists.JAMA.1998;280:905–909.
- ,,,,,.The complexity, relative value, and financial worth of curbside consultations in an academic infectious diseases unit.Clin Infect Dis.2010;51:651–655.
- ,.Curbside consultations. A closer look at a common practice.JAMA.1996;275:145–147.
- ,,,.Informal advice‐ and information‐seeking between physicians.J Med Educ.1981;56;174–180.
- ,.A prospective study of 2,092 “curbside” questions asked of two infectious disease consultants in private practice in the midwest.Clin Infect Dis.1996;22:303–307.
- ,,,,.Curbside consultation in endocrine practice: a prospective observational study.Endocrinologist.1996;6:328–331.
- ,,.Informal consultations provided to general internists by the gastroenterology department of an HMO.J Gen Intern Med.1998;13:435–438.
- .“Curbside” consultations in gynecologic oncology: a closer look at a common practice.Gynecol Oncol.1999;74:456–459.
- ,,, et al.Informal consultations in infectious diseases and clinical microbiology practice.Clin Microbiol Infect.2003;9:724–726.
- .Curbside consultations and the viaduct effect.JAMA.1998;280:929–930.
- .What do we really need to know about consultation and referral?J Gen Intern Med.1998;13:497–498.
- ,.Telephone advice for neurosurgical referrals. Who assumes duty of care?Br J Neurosurg.2001;15:453–455.
- ,.Malpractice liability for informal consultations.Fam Med.2003;35:476–481.
- ,,,.Does the structure of clinical questions affect the outcome of curbside consultations with specialty colleagues?Arch Fam Med.2000;9:541–547.
A curbside consultation is an informal process whereby a consultant is asked to provide information or advice about a patient's care without doing a formal assessment of the patient.14 Curbside consultations are common in the practice of medicine2, 3, 5 and are frequently requested by physicians caring for hospitalized patients. Several surveys have documented the quantity of curbside consultations requested of various subspecialties, the types of questions asked, the time it takes to respond, and physicians' perceptions about the quality of the information exchanged.111 While curbside consultations have a number of advantages, physicians' perceptions are that the information conveyed may be inaccurate or incomplete and that the advice offered may be erroneous.13, 5, 10, 12, 13
Cartmill and White14 performed a random audit of 10% of the telephone referrals they received for neurosurgical consultation over a 1‐year period and noted discrepancies between the Glascow Coma Scores reported during the telephone referrals and those noted in the medical records, but the frequency of these discrepancies was not reported. To our knowledge, no studies have compared the quality of the information provided in curbside consultations with that obtained in formal consultations that included direct face‐to‐face patient evaluations and primary data collection, and whether the advice provided in curbside and formal consultations on the same patient differed.
We performed a prospective cohort study to compare the information received by hospitalists during curbside consultations on hospitalized patients, with that obtained from formal consultations done the same day on the same patients, by different hospitalists who were unaware of any details regarding the curbside consultation. We also compared the advice provided by the 2 hospitalists following their curbside and formal consultations. Our hypotheses were that the information received during curbside consultations was frequently inaccurate or incomplete, that the recommendations made after the formal consultation would frequently differ from those made in the curbside consultation, and that these differences would have important implications on patient care.
METHODS
This was a quality improvement study conducted at Denver Health, a 500‐bed university‐affiliated urban safety net hospital from January 10, 2011 to January 9, 2012. The study design was a prospective cohort that included all curbside consultations on hospitalized patients received between 7 AM and 3 PM, on intermittently selected weekdays, by the Internal Medicine Consultation Service that was staffed by 18 hospitalists. Data were collected intermittently based upon hospitalist availability and was done to limit potential alterations in the consulting practices of the providers requesting consultations.
Consultations were defined as being curbside when the consulting provider asked for advice, suggestions, or opinions about a patient's care but did not ask the hospitalist to see the patient.15, 15 Consultations pertaining to administrative issues (eg, whether a patient should be admitted to an intensive care bed as opposed to an acute care floor bed) or on patients who were already being followed by a hospitalist were excluded.
The hospitalist receiving the curbside consultation was allowed to ask questions as they normally would, but could not verify the accuracy of the information received (eg, could not review any portion of the patient's medical record, such as notes or lab data). A standardized data collection sheet was used to record the service and level of training of the requesting provider, the medical issue(s) of concern, all clinical data offered by the provider, the number of questions asked by the hospitalist of the provider, and whether, on the basis of the information provided, the hospitalist felt that the question(s) being asked was (were) of sufficient complexity that a formal consultation should occur. The hospitalist then offered advice based upon the information given during the curbside consultation.
After completing the curbside consultation, the hospitalist requested verbal permission from the requesting provider to perform a formal consultation. If the request was approved, the hospitalist performing the curbside consultation contacted a different hospitalist who performed the formal consultation within the next few hours. The only information given to the second hospitalist was the patient's identifiers and the clinical question(s) being asked. The formal consultation included a complete face‐to‐face history and physical examination, a review of the patient's medical record, documentation of the provider's findings, and recommendations for care.
Upon completion of the formal consultation, the hospitalists who performed the curbside and the formal consultations met to review the advice each gave to the requesting provider and the information on which this advice was based. The 2 hospitalists jointly determined the following: (a) whether the information received during the curbside consultation was correct and complete, (b) whether the advice provided in the formal consultation differed from that provided in the curbside consultation, (c) whether the advice provided in the formal consultation dealt with issues other than one(s) leading to the curbside consultation, (d) whether differences in the recommendations given in the curbside versus the formal consultation changed patient management in a meaningful way, and (e) whether the curbside consultation alone was felt to be sufficient.
Information obtained by the hospitalist performing the formal consultation that was different from, or not included in, the information recorded during the curbside consultation was considered to be incorrect or incomplete, respectively. A change in management was defined as an alteration in the direction or type of care that the patient would have received as a result of the advice being given. A pulmonary and critical care physician, with >35 years of experience in inpatient medicine, reviewed the information provided in the curbside and formal consultations, and independently assessed whether the curbside consultation alone would have been sufficient and whether the formal consultation changed management.
Curbside consultations were neither solicited nor discouraged during the course of the study. The provider requesting the curbside consultation was not informed or debriefed about the study in an attempt to avoid affecting future consultation practices from that provider or service.
Associations were sought between the frequency of inaccurate or incomplete data and the requesting service and provider, the consultative category and medical issue, the number of questions asked by the hospitalist during the curbside consultation, and whether the hospitalist doing the curbside consultation thought that formal consultation was needed. A chi‐square test was used to analyze all associations. A P value of <0.05 was considered significant. All analyses were performed using SAS Enterprise Guide 4.3 (SAS Institute, Inc, Cary, NC) software. The study was approved by the Colorado Multiple Institutional Review Board.
RESULTS
Fifty curbside consultations were requested on a total of 215 study days. The requesting service declined formal consultation in 3 instances, leaving 47 curbside consultations that had a formal consultation. Curbside consultations came from a variety of services and providers, and addressed a variety of issues and concerns (Table 1).
| Curbside Consultations, N (%) | |
|---|---|
| 47 (100) | |
| |
| Requesting service | |
| Psychiatry | 21 (45) |
| Emergency Department | 9 (19) |
| Obstetrics/Gynecology | 5 (11) |
| Neurology | 4 (8) |
| Other (Orthopedics, Anesthesia, General Surgery, Neurosurgery, and Interventional Radiology) | 8 (17) |
| Requesting provider | |
| Resident | 25 (53) |
| Intern | 8 (17) |
| Attending | 9 (19) |
| Other | 5 (11) |
| Consultative issue* | |
| Diagnosis | 10 (21) |
| Treatment | 29 (62) |
| Evaluation | 20 (43) |
| Discharge | 13 (28) |
| Lab interpretation | 4 (9) |
| Medical concern* | |
| Cardiac | 27 (57) |
| Endocrine | 17 (36) |
| Infectious disease | 9 (19) |
| Pulmonary | 8 (17) |
| Gastroenterology | 6 (13) |
| Fluid and electrolyte | 6 (13) |
| Others | 23 (49) |
The hospitalists asked 0 to 2 questions during 8/47 (17%) of the curbside consultations, 3 to 5 questions during 26/47 (55%) consultations, and more than 5 questions during 13/47 (28%). Based on the information received during the curbside consultations, the hospitalists thought that the curbside consultations were insufficient for 18/47 (38%) of patients. In all instances, the opinions of the 2 hospitalists concurred with respect to this conclusion, and the independent reviewer agreed with this assessment in 17 of these 18 (94%).
The advice rendered in the formal consultations differed from that provided in 26/47 (55%) of the curbside consultations, and the formal consultation was thought to have changed management for 28/47 (60%) of patients (Table 2). The independent reviewer thought that the advice provided in the formal consultations changed management in 29/47 (62%) of the cases, and in 24/28 cases (86%) where the hospitalist felt that the formal consult changed management.
| Curbside Consultations, N (%) | |||
|---|---|---|---|
| Total | Accurate and Complete | Inaccurate or Incomplete | |
| 47 (100) | 23 (49) | 24 (51) | |
| |||
| Advice in formal consultation differed from advice in curbside consultation | 26 (55) | 7 (30) | 19 (79)* |
| Formal consultation changed management | 28 (60) | 6 (26) | 22 (92) |
| Minor change | 18 (64) | 6 (100) | 12 (55) |
| Major change | 10 (36) | 0 (0) | 10 (45) |
| Curbside consultation insufficient | 18 (38) | 2 (9) | 16 (67) |
Information was felt to be inaccurate or incomplete in 24/47 (51%) of the curbside consultations (13/47 inaccurate, 16/47 incomplete, 5/47 both inaccurate and incomplete), and when inaccurate or incomplete information was obtained, the advice given in the formal consultations more commonly differed from that provided in the curbside consultation (19/24, 79% vs 7/23, 30%; P < 0.001), and was more commonly felt to change management (22/24, 92% vs 6/23, 26%; P < 0.0001) (Table 2). No association was found between whether the curbside consultation contained complete or accurate information and the consulting service from which the curbside originated, the consulting provider, the consultative aspect(s) or medical issue(s) addressed, the number of questions asked by the hospitalist during the curbside consultation, nor whether the hospitalists felt that a formal consultation was needed.
DISCUSSION
The important findings of this study are that (a) the recommendations made by hospitalists in curbside versus formal consultations on the same patient frequently differ, (b) these differences frequently result in changes in clinical management, (c) the information presented in curbside consultations by providers is frequently inaccurate or incomplete, regardless of the providers specialty or seniority, (d) when inaccurate or incomplete information is received, the recommendations made in curbside and formal consultations differ more frequently, and (e) we found no way to predict whether the information provided in a curbside consultation was likely to be inaccurate or incomplete.
Our hospitalists thought that 38% of the curbside consultations they received should have had formal consultations. Manian and McKinsey7 reported that as many as 53% of questions asked of infectious disease consultants were thought to be too complex to be addressed in an informal consultation. Others, however, report that only 11%33% of curbside consultations were thought to require formal consultation.1, 9, 10, 16 Our hospitalists asked 3 or more questions of the consulting providers in more than 80% of the curbside consultations, suggesting that the curbside consultations we received might have had a higher complexity than those seen by others.
Our finding that information provided in curbside consultation was frequently inaccurate or incomplete is consistent with a number of previous studies reporting physicians' perceptions of the accuracy of curbside consultations.2, 3 Hospital medicine is not likely to be the only discipline affected by inaccurate curbside consultation practices, as surveys of specialists in infectious disease, gynecology, and neurosurgery report that practitioners in these disciplines have similar concerns.1, 10, 14 In a survey returned by 34 physicians, Myers1 found that 50% thought the information exchanged during curbside consultations was inaccurate, leading him to conclude that inaccuracies presented during curbside consultations required further study.
We found no way of predicting whether curbside consultations were likely to include inaccurate or incomplete information. This observation is consistent with the results of Bergus et al16 who found that the frequency of curbside consultations being converted to formal consultations was independent of the training status of the consulting physician, and with the data of Myers1 who found no way of predicting the likelihood that a curbside consultation should be converted to a formal consultation.
We found that formal consultations resulted in management changes more often than differences in recommendations (ie, 60% vs 55%, respectively). This small difference occurred because, on occasion, the formal consultations found issues to address other than the one(s) for which the curbside consultation was requested. In the majority of these instances, the management changes were minor and the curbside consultation was still felt to be sufficient.
In some instances, the advice given after the curbside and the formal consultations differed to only a minor extent (eg, varying recommendations for oral diabetes management). In other instances, however, the advice differed substantially (eg, change in antibiotic management in a septic patient with a multidrug resistant organism, when the original curbside question was for when to order a follow‐up chest roentgenogram for hypoxia; see Supporting Information, Appendix, in the online version of this article). In 26 patients (55%), formal consultation resulted in different medications being started or stopped, additional tests being performed, or different decisions being made about admission versus discharge.
Our study has a number of strengths. First, while a number of reports document that physicians' perceptions are that curbside consultations frequently contain errors,2, 3, 5, 12 to our knowledge this is the first study that prospectively compared the information collected and advice given in curbside versus formal consultation. Second, while this study was conducted as a quality improvement project, thereby requiring us to conclude that the results are not generalizable, the data presented were collected by 18 different hospitalists, reducing the potential of bias from an individual provider's knowledge base or practice. Third, there was excellent agreement between the independent reviewer and the 2 hospitalists who performed the curbside and formal consultations regarding whether a curbside consultation would have been sufficient, and whether the formal consultation changed patient management. Fourth, the study was conducted over a 1‐year period, which should have reduced potential bias arising from the increasing experience of residents requesting consultations as their training progressed.
Our study has several limitations. First, the number of curbside consultations we received during the study period (50 over 215 days) was lower than anticipated, and lower than the rates of consultation reported by others.1, 7, 9 This likely relates to the fact that, prior to beginning the study, Denver Health hospitalists already provided mandatory consultations for several surgical services (thereby reducing the number of curbside consultations received from these services), because curbside consultations received during evenings, nights, and weekends were not included in the study for reasons of convenience, and because we excluded all administrative curbside consultations. Our hospitalist service also provides consultative services 24 hours a day, thereby reducing the number of consultations received during daytime hours. Second, the frequency with which curbside consultations included inaccurate or incomplete information might be higher than what occurs in other hospitals, as Denver Health is an urban, university‐affiliated public hospital and the patients encountered may be more complex and trainees may be less adept at recognizing the information that would facilitate accurate curbside consultations (although we found no difference in the frequency with which inaccurate or incomplete information was provided as a function of the seniority of the requesting physician). Third, the disparity between curbside and formal consultations that we observed could have been biased by the Hawthorne effect. We attempted to address this by not providing the hospitalists who did the formal consultation with any information collected by the hospitalist involved with the curbside consultation, and by comparing the conclusions reached by the hospitalists performing the curbside and formal consultations with those of a third party reviewer. Fourth, while we found no association between the frequency of curbside consultations in which information was inaccurate or incomplete and the consulting service, there could be a selection bias of the consulting service requesting the curbside consultations as a result of the mandatory consultations already provided by our hospitalists. Finally, our study was not designed or adequately powered to determine why curbside consultations frequently have inaccurate or incomplete information.
In summary, we found that the information provided to hospitalists during a curbside consultation was often inaccurate and incomplete, and that these problems with information exchange adversely affected the accuracy of the resulting recommendations. While there are a number of advantages to curbside consultations,1, 3, 7, 10, 12, 13 our findings indicate that the risk associated with this practice is substantial.
Acknowledgements
Disclosure: Nothing to report.
- .Curbside consultation in infectious diseases: a prospective study.J Infect Dis.1984;150:797–802.
- ,,.Physicians' experiences and beliefs regarding informal consultation.JAMA.1998;280:900–904.
- ,,.Curbside consultation practices and attitudes among primary care physicians and medical subspecialists.JAMA.1998;280:905–909.
- ,,,,,.The complexity, relative value, and financial worth of curbside consultations in an academic infectious diseases unit.Clin Infect Dis.2010;51:651–655.
- ,.Curbside consultations. A closer look at a common practice.JAMA.1996;275:145–147.
- ,,,.Informal advice‐ and information‐seeking between physicians.J Med Educ.1981;56;174–180.
- ,.A prospective study of 2,092 “curbside” questions asked of two infectious disease consultants in private practice in the midwest.Clin Infect Dis.1996;22:303–307.
- ,,,,.Curbside consultation in endocrine practice: a prospective observational study.Endocrinologist.1996;6:328–331.
- ,,.Informal consultations provided to general internists by the gastroenterology department of an HMO.J Gen Intern Med.1998;13:435–438.
- .“Curbside” consultations in gynecologic oncology: a closer look at a common practice.Gynecol Oncol.1999;74:456–459.
- ,,, et al.Informal consultations in infectious diseases and clinical microbiology practice.Clin Microbiol Infect.2003;9:724–726.
- .Curbside consultations and the viaduct effect.JAMA.1998;280:929–930.
- .What do we really need to know about consultation and referral?J Gen Intern Med.1998;13:497–498.
- ,.Telephone advice for neurosurgical referrals. Who assumes duty of care?Br J Neurosurg.2001;15:453–455.
- ,.Malpractice liability for informal consultations.Fam Med.2003;35:476–481.
- ,,,.Does the structure of clinical questions affect the outcome of curbside consultations with specialty colleagues?Arch Fam Med.2000;9:541–547.
Copyright © 2012 Society of Hospital Medicine
ACUTE Center for Eating Disorders
Anorexia nervosa occurs in 0.9% of women and 0.3% of men in the United States1 and is associated with a prolonged course,2 extensive medical complications that can affect almost every organ system,3, 4 and a 5% mean crude mortality rate9.6 times expected for age‐matched women in the United States.2, 5 Those with anorexia nervosa die as a complication of their illness more frequently than any other mental illness.3 Anorexia nervosa is commonly diagnosed during the adolescent years,2 with almost 25% going on to develop chronic anorexia nervosa.2, 6 Consequently, many patients with severe anorexia nervosa will receive treatment by adult medicine practitioners.
Patients with anorexia nervosa frequently require hospitalization. Published guidelines suggest that those who are 70% or less than ideal body weight, bradycardic, hypotensive, or those with severe electrolyte disturbances warrant admission for medical stabilization.79 Once admitted, however, there are no published guidelines for best practices to medically stabilize patients.7, 10 Although most experts advocate a multidisciplinary approach with weight restoration and medical stability as the goals of hospital admission,8, 9 controversy exists in the literature about how best to achieve these goals.7, 10
It is known, however, that for patients with complicated medical illnesses, such as human immunodeficiency virus (HIV) and sepsis, higher volumes of patient caseloads treated by physicians with disease‐specific expertise has been found to lead to improved outcomes in patients.11, 12 The adult patient with severe anorexia nervosa who requires inpatient medical stabilization may also benefit from a multidisciplinary trained staff familiar with the medical management of anorexia nervosa. Accordingly, we have developed the Acute Comprehensive Urgent Treatment for Eating Disorders (ACUTE) Center.
PROGRAM DESCRIPTION
The ACUTE Center at Denver Health is a 5‐bed unit dedicated to the medical stabilization of patients with severe malnutrition due to anorexia nervosa or severe electrolyte disorders due to bulimia nervosa. ACUTE accepts patients 17 years and older with medical complications related to chronic malnutrition and refeeding.
ACUTE uses a multidisciplinary approach to patient care. The physician team is composed of a hospital medicine attending physician, consultative expertise by an internal medicine specialist in the management of the medical complications of eating disorders, and a psychiatrist specializing in eating disorders. There is a dedicated team of nurses, two dieticians, physical therapists, certified nursing assistants, speech therapists, a psychotherapist, and a chaplain.
ACUTE patients are on continuous telemetry monitoring for the duration of their hospitalization to monitor for arrhythmias as well as signs of covert exercise. As part of the initial intake, a full set of vital signs is obtained, including height and weight. Patients are weighed daily with their back to the scale. There is no discussion of weight fluctuations. Patients may walk at a slow pace around the unit. No exercise is allowed.
Each patient at the ACUTE Center has an individualized meal plan and are started on an oral caloric intake 200 kcal below their basal energy expenditure (BEE). Indirect calorimetry is performed on the first hospital day. Each patient meets on a daily basis with the registered dietician to choose meals that meet their caloric goals.
All patients have a sitter continuously for their first week, and thereafter sitter time may be reduced to supervision surrounding each meal. Patients who fail to finish their prescribed meal are required to drink a liquid supplement to meet caloric goals. Calories are increased weekly until the patient's weight shows a clear pattern of weight increase. 0
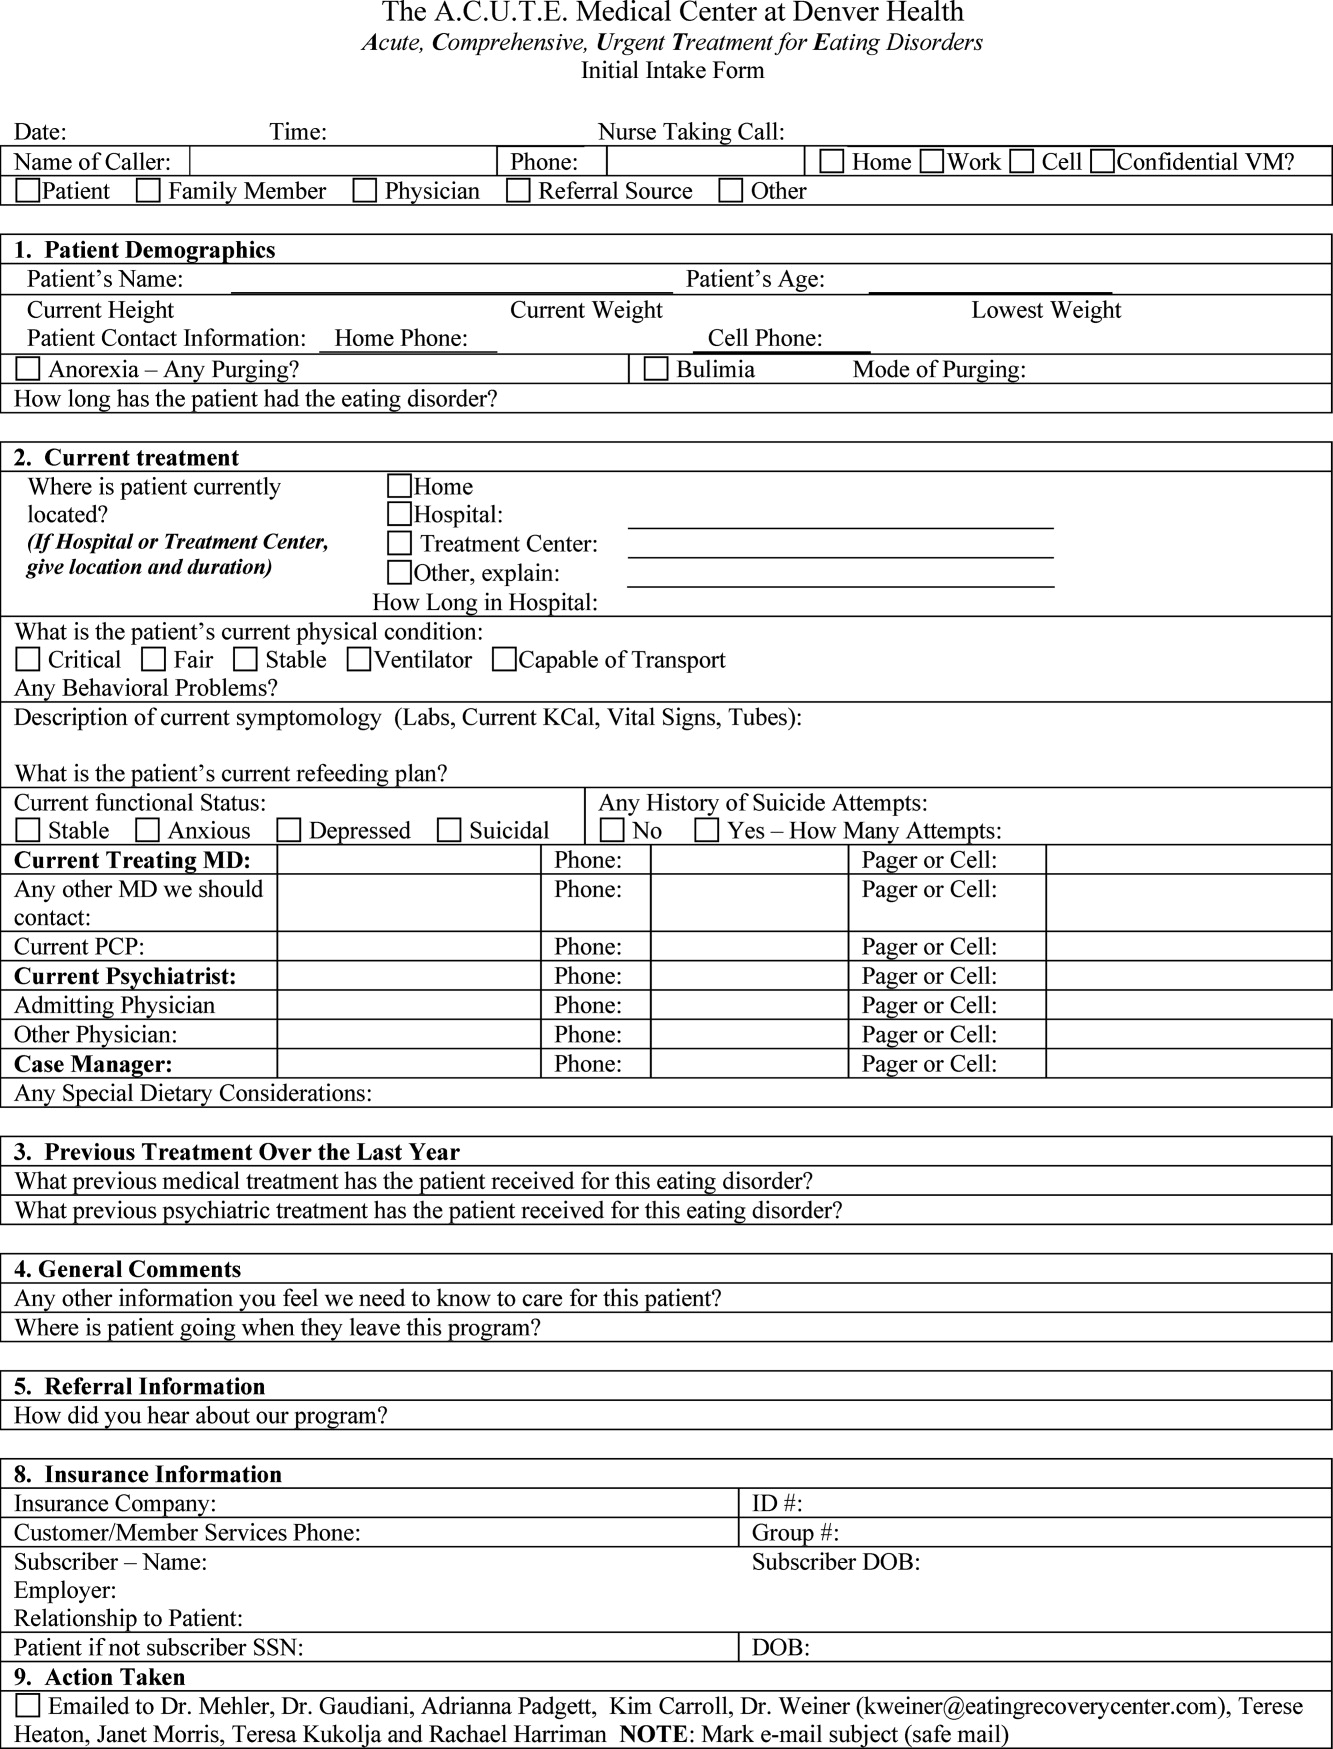
Patients are discharged from the ACUTE Center when they have achieved several basic goals: They are consuming greater than 2000 kcal per day, they are consistently gaining 23 pounds per week, their laboratory values have stabilized without electrolyte supplementation, and they are strong enough for an inpatient eating disorder program.
METHODS
Patients admitted to the ACUTE Center between October 2008 and December 2010 for medical stabilization and monitored refeeding were included. Patients with a diagnosis of bulimia nervosa were excluded. Demographic data and laboratory results were obtained electronically from our data repository, whereas weight, height, and other clinical characteristics were obtained by manual chart abstraction. The statistical analysis was conducted in SAS Enterprise Guide v4.1 (SAS Institute, Cary, NC).
RESULTS
In its first 27 months, the ACUTE Center had 76 total admissions, comprising 59 patients. Of the 76 admissions, the 62 admissions for medical stabilization and monitored refeeding of 54 patients with anorexia nervosa were included. Forty‐eight of the 54 (89%) included patients were female. Six patients were hospitalized twice, and 1 patient 3 times. There were 3 transfers to the intensive care unit, and no inpatient mortality. Of the 62 admissions, 11 (18%) discharges were to home, and 51 (82%) were to inpatient psychiatric eating disorder units.
The mean age at admission was 27 years (range 1765 years). The mean percent of ideal body weight (IBW) on admission was 62.2% 10.2%. The mean body mass index (BMI) was 12.9 2.0 kg/m2 on admission, and 13.1 1.9 kg/m2 upon discharge. The median length of stay was 16 days (interquartile range [IQR] 929 days). Median calculated BEE (1119 [10671184 IQR]) was higher than measured BEE by indirect calorimetry (792 [6341094]), (Table 1).
| Median (Interquartile Range)* | Range | |
|---|---|---|
| ||
| Age, yr | 27 (2135) | 1765 |
| Female | 56 | 90% |
| Length of hospitalization, days | 16 (929) | 570 |
| Calculated BEE | 1119 (10671184) | 9061491 |
| Measured BEE | 792 (6341094) | 5001742 |
| DEXA Z‐score | 2.2 1.1 | 4.40.7 |
| Height, in | 65 (6167) | 5774 |
| Weight on admission, lb | 76.1 14.4 | 50.8110.0 |
| % Ideal body weight on admission | 62.2 10.2 | 42.4101.0 |
| % Ideal body weight on discharge | 63.2 9.1 | 42.3 82.7 |
| BMI on admission | 12.9 2.0 | 8.719.7 |
| BMI nadir | 12.4 1.9 | 8.415.7 |
| BMI on discharge | 13.1 1.9 | 8.717.0 |
The majority of admission laboratory values, including serum albumin, blood urea nitrogen (BUN), creatinine, potassium, magnesium, and phosphate levels, were within normal limits. Fifty‐six percent were hyponatremic at admission, with a mean serum sodium level of 133 6 mmol/L (Table 2).
| Median (Interquartile Range)* | Range | |
|---|---|---|
| ||
| Sodium (135143 mmol/L) | 133 6 | 117145 |
| Potassium (3.65.1 mmol/L) | 3.8 (3.0 4.0) | 1.85.5 |
| Carbon dioxide (1827 mmol/L) | 28 (2531) | 1845 |
| Glucose (60199 mg/dL) | 85 (76105) | 41166 |
| BUN (622 mg/dL) | 16 (923) | 344 |
| Creatinine (0.61.2 mg/dL) | 0.7 (0.61.0) | 0.31.6 |
| Calcium (8.110.5 mg/dL) | 8.9 0.6 | 7.610.1 |
| Phosphorus (2.74.8 mg/dL) | 3.2 (2.83.7) | 2.15.7 |
| Magnesium (1.32.1 mEq/L) | 1.8 0.3 | 1.22.5 |
| AST (1040 U/L) | 38 (2391) | 122402 |
| ALT (745 U/L) | 45 (2498) | 152436 |
| Total bilirubin (0.01.2 mg/dL) | 0.5 (0.30.7) | 0.12.2 |
| Pre‐albumin (2052 mg/dL) | 21 7 | 842 |
| Albumin (3.05.3 g/dL) | 3.7 0.7 | 1.64.8 |
| WBC (4.510.0 k/L) | 4.0 (3.25.7) | 1.120.3 |
| Neutrophils (%) (48.069.0%) | 55.5 13.1 | 17.082.0 |
| Lymphocytes (%) (21.043.0%) | 34.9 13.0 | 10.864.0 |
| Platelet count (150450 k/L) | 266 (193371) | 40819 |
| Hematocrit (37.047.0%) | 36.1 5.4 | 19.145.7 |
| MCV (80100 fL) | 91 7 | 73105 |
| TSH (0.346.00 IU/mL) | 1.52 (0.962.84) | 0.1864.1 |
| INR (0.821.17) | 1.09 (1.001.22) | 0.812.05 |
| 1,25 Hydroxy vitamin D (3080 ng/mL) | 41 (3058) | 8171 |
DISCUSSION
Hospital Medicine is currently the fastest growing area of specialization in medicine.13 Palliative care, inpatient geriatrics, short stay units, and bedside procedures have evolved into hospitalist‐led services.1418 The management of the medical complications of severe eating disorders is another potential niche for hospitalists.
The ACUTE Center at Denver Health represents a center in which highly specialized, multidisciplinary care is provided for a rare and extremely ill population of patients. Prior to entering the ACUTE Center, the patients described in our program had each experienced prolonged and unsuccessful stays for medical stabilization in acute care hospitals across the country, after being denied treatment in eating disorder programs due to medical instability.
Patients transferred to ACUTE often received medical care reflecting a lack of specific expertise, training, and exposure. The most common management discrepancy we noted was over‐aggressive provision of intravenous fluids. Consequently, we often diurese 1020 pounds of edema weight, gained during a prior medical hospitalization, before beginning the process of weight restoration. This edema weight artificially increases admission weight and results in less than expected weight gain from admission to discharge.
Even without substantial weight gain, medical stabilization is evidenced by consistent caloric oral intake, and fluid and electrolyte stabilization after initial refeeding. Accordingly, patients who have been treated at the ACUTE Center often become eligible for admission to eating disorder programs at body weights below the typical 70% of ideal body weight that most programs use as a threshold for admission.
From a clinical research perspective, centers such as ACUTE allow for opportunities to better understand and investigate the nuances of patient care in the setting of severe malnutrition. From our cohort of patients to date, we have noted unique issues in albumin levels,19 coagulopathy,20 and liver function,21 among others. As an example, the cohort of patients with anorexia nervosa described here had profoundly low body weight, but relatively normal admission labs. Even the serum albumin, a parameter often used to reflect nutrition in an adult internal medicine setting, is usually normal, reflecting, in an otherwise generally healthy young population, the absence of a malignant, inflammatory, or infectious etiology of weight loss.19
Hospitalists also advocate for their patients by helping to maximize the benefits of their health care coverage. Many health care plans place limits on inpatient psychiatric care benefits. Patients who are severely malnourished from their eating disorder may waste valuable psychiatric care benefits undergoing medical stabilization in psychiatric units while physically unable to undergo psychotherapy. This has become increasingly important as health insurance plans continue to decrease coverage for residential care of patients with anorexia.22
In contrast, the medical benefits of most health plans are more robust. Accordingly, from the patient perspective, medical stabilization in an acute medical unit before admission to a psychiatry unit maximizes their ability to participate in the intensive psychiatric therapy which is still needed after medical stabilization. A recent study from a residential eating disorder program confirmed that a higher discharge BMI was the single best predictor of full recovery from anorexia nervosa.23
In the future, we believe that a continuing concentration of care and experience may also lend itself to the development of protocols and management guidelines which may benefit patients beyond our own unit. Severely malnourished patients with anorexia nervosa, or bulimic patients with complicated electrolyte disorders, are likely to benefit both medically and financially from centers of excellence. Inpatient or residential psychiatric eating disorder programs may act in synergy with medical eating disorders units, like ACUTE, to most efficiently care for the severely malnourished patient. Hospitalists, with the proper training and experience, are uniquely positioned to develop such centers of excellence.
- ,,,.The prevalence and correlates of eating disorders in the national comorbidity survey replication.Biol Psychiatry.2007;61:348–358.
- .The outcome of anorexia nervosa in the 20th century.Am J Psychiatry.2002;159:1284–1293.
- ,.Anorexia nervosa medical issues.J Womens Health.2003;12:331–340.
- .Diagnosis and care of patients with anorexia nervosa in primary care settings.Ann Intern Med.2001;134:1048–1059.
- ,,, et al.Mortality in eating disorders: a descriptive study.Int J Eat Disord.2000;28:20–26.
- ,,,,.Long‐term prognosis in anorexia nervosa: lessons from a 21‐year follow‐up study.Lancet.2000;355:721–722.
- ,,,,.Variations in admissions practices for adolescents with anorexia nervosa: a North American sample.J Adolesc Health.2008;43:425–431.
- American Psychiatric Association.Treatment of patients with eating disorders, third edition.Am J Psychiatry.2006;163(suppl 7):4–54.
- American Dietetic Association.Position of the American Dietetic Association: nutrition intervention in the treatment of anorexia nervosa, bulimia nervosa, and other eating disorders (ADA reports).J Am Diet Assoc.2006;106:2073–2082.
- ,.Clinical practice guidelines for treating restrictive eating disorder patients during medical hospitalization.Curr Opin Pediatr.2008;20:390–397.
- .Practice makes perfect: a volume‐outcome study of hospital patients with HIV disease.J Acquir Immune Defic Syndr.2008;47:226–233.
- ,,,.Association between physician caseload and patient outcome for sepsis treatment.Infect Control Hosp Epidemiol.2009;30:556–562.
- .Reflections: the hospitalist movement ten years later.J Hosp Med.2006;1:248–252.
- What will board certification be‐and mean‐for hospitalists?.Palliative care in hospitals.J Hosp Med.2006;1:21–28.
- .Palliative care and hospitalists: a partnership for hope.J Hosp Med.2006;1:5–6.
- ,,, et al.Impact of a bedside procedure service on general medicine inpatients: a firm‐based trial.J Hosp Med.2007;2:143–149.
- ,,,.Growth in the care of older patients by hospitalists in the United States.N Engl J Med.2009;360:1102–1112.
- ,,, et al.A hospitalist run short stay unit: features that predict length of stay and eventual admission to traditional inpatient services.J Hosp Med.2009;4:276–284.
- ,,.Serum albumin levels may not correlate with weight status in severe anorexia nervosa.Eat Disord.2009;17:322–326.
- ,,,,.The use of thrombelastography to determine coagulation status in severe anorexia nervosa: a case series.Int J Eat Disord.2010;43(4):382–385.
- ,,,.Liver function test abnormalities in anorexia nervosa—cause or effect.Int J Eat Disord.2010;43(4):378–381.
- .Eating disorders: a new front in insurance fight.New York Times. October 13, 2011. Available at: http://www.nytimes.com/2011/10/14/business/ruling‐offers‐hope‐to‐eating‐disorder‐sufferers. html?ref=business.
- ,.Long‐term outcome of residential treatment for anorexia nervosa and bulimia nervosa.Eat Disord.2011;19:132–144.
Anorexia nervosa occurs in 0.9% of women and 0.3% of men in the United States1 and is associated with a prolonged course,2 extensive medical complications that can affect almost every organ system,3, 4 and a 5% mean crude mortality rate9.6 times expected for age‐matched women in the United States.2, 5 Those with anorexia nervosa die as a complication of their illness more frequently than any other mental illness.3 Anorexia nervosa is commonly diagnosed during the adolescent years,2 with almost 25% going on to develop chronic anorexia nervosa.2, 6 Consequently, many patients with severe anorexia nervosa will receive treatment by adult medicine practitioners.
Patients with anorexia nervosa frequently require hospitalization. Published guidelines suggest that those who are 70% or less than ideal body weight, bradycardic, hypotensive, or those with severe electrolyte disturbances warrant admission for medical stabilization.79 Once admitted, however, there are no published guidelines for best practices to medically stabilize patients.7, 10 Although most experts advocate a multidisciplinary approach with weight restoration and medical stability as the goals of hospital admission,8, 9 controversy exists in the literature about how best to achieve these goals.7, 10
It is known, however, that for patients with complicated medical illnesses, such as human immunodeficiency virus (HIV) and sepsis, higher volumes of patient caseloads treated by physicians with disease‐specific expertise has been found to lead to improved outcomes in patients.11, 12 The adult patient with severe anorexia nervosa who requires inpatient medical stabilization may also benefit from a multidisciplinary trained staff familiar with the medical management of anorexia nervosa. Accordingly, we have developed the Acute Comprehensive Urgent Treatment for Eating Disorders (ACUTE) Center.
PROGRAM DESCRIPTION
The ACUTE Center at Denver Health is a 5‐bed unit dedicated to the medical stabilization of patients with severe malnutrition due to anorexia nervosa or severe electrolyte disorders due to bulimia nervosa. ACUTE accepts patients 17 years and older with medical complications related to chronic malnutrition and refeeding.
ACUTE uses a multidisciplinary approach to patient care. The physician team is composed of a hospital medicine attending physician, consultative expertise by an internal medicine specialist in the management of the medical complications of eating disorders, and a psychiatrist specializing in eating disorders. There is a dedicated team of nurses, two dieticians, physical therapists, certified nursing assistants, speech therapists, a psychotherapist, and a chaplain.
ACUTE patients are on continuous telemetry monitoring for the duration of their hospitalization to monitor for arrhythmias as well as signs of covert exercise. As part of the initial intake, a full set of vital signs is obtained, including height and weight. Patients are weighed daily with their back to the scale. There is no discussion of weight fluctuations. Patients may walk at a slow pace around the unit. No exercise is allowed.
Each patient at the ACUTE Center has an individualized meal plan and are started on an oral caloric intake 200 kcal below their basal energy expenditure (BEE). Indirect calorimetry is performed on the first hospital day. Each patient meets on a daily basis with the registered dietician to choose meals that meet their caloric goals.
All patients have a sitter continuously for their first week, and thereafter sitter time may be reduced to supervision surrounding each meal. Patients who fail to finish their prescribed meal are required to drink a liquid supplement to meet caloric goals. Calories are increased weekly until the patient's weight shows a clear pattern of weight increase. 0
Patients are discharged from the ACUTE Center when they have achieved several basic goals: They are consuming greater than 2000 kcal per day, they are consistently gaining 23 pounds per week, their laboratory values have stabilized without electrolyte supplementation, and they are strong enough for an inpatient eating disorder program.
METHODS
Patients admitted to the ACUTE Center between October 2008 and December 2010 for medical stabilization and monitored refeeding were included. Patients with a diagnosis of bulimia nervosa were excluded. Demographic data and laboratory results were obtained electronically from our data repository, whereas weight, height, and other clinical characteristics were obtained by manual chart abstraction. The statistical analysis was conducted in SAS Enterprise Guide v4.1 (SAS Institute, Cary, NC).
RESULTS
In its first 27 months, the ACUTE Center had 76 total admissions, comprising 59 patients. Of the 76 admissions, the 62 admissions for medical stabilization and monitored refeeding of 54 patients with anorexia nervosa were included. Forty‐eight of the 54 (89%) included patients were female. Six patients were hospitalized twice, and 1 patient 3 times. There were 3 transfers to the intensive care unit, and no inpatient mortality. Of the 62 admissions, 11 (18%) discharges were to home, and 51 (82%) were to inpatient psychiatric eating disorder units.
The mean age at admission was 27 years (range 1765 years). The mean percent of ideal body weight (IBW) on admission was 62.2% 10.2%. The mean body mass index (BMI) was 12.9 2.0 kg/m2 on admission, and 13.1 1.9 kg/m2 upon discharge. The median length of stay was 16 days (interquartile range [IQR] 929 days). Median calculated BEE (1119 [10671184 IQR]) was higher than measured BEE by indirect calorimetry (792 [6341094]), (Table 1).
| Median (Interquartile Range)* | Range | |
|---|---|---|
| ||
| Age, yr | 27 (2135) | 1765 |
| Female | 56 | 90% |
| Length of hospitalization, days | 16 (929) | 570 |
| Calculated BEE | 1119 (10671184) | 9061491 |
| Measured BEE | 792 (6341094) | 5001742 |
| DEXA Z‐score | 2.2 1.1 | 4.40.7 |
| Height, in | 65 (6167) | 5774 |
| Weight on admission, lb | 76.1 14.4 | 50.8110.0 |
| % Ideal body weight on admission | 62.2 10.2 | 42.4101.0 |
| % Ideal body weight on discharge | 63.2 9.1 | 42.3 82.7 |
| BMI on admission | 12.9 2.0 | 8.719.7 |
| BMI nadir | 12.4 1.9 | 8.415.7 |
| BMI on discharge | 13.1 1.9 | 8.717.0 |
The majority of admission laboratory values, including serum albumin, blood urea nitrogen (BUN), creatinine, potassium, magnesium, and phosphate levels, were within normal limits. Fifty‐six percent were hyponatremic at admission, with a mean serum sodium level of 133 6 mmol/L (Table 2).
| Median (Interquartile Range)* | Range | |
|---|---|---|
| ||
| Sodium (135143 mmol/L) | 133 6 | 117145 |
| Potassium (3.65.1 mmol/L) | 3.8 (3.0 4.0) | 1.85.5 |
| Carbon dioxide (1827 mmol/L) | 28 (2531) | 1845 |
| Glucose (60199 mg/dL) | 85 (76105) | 41166 |
| BUN (622 mg/dL) | 16 (923) | 344 |
| Creatinine (0.61.2 mg/dL) | 0.7 (0.61.0) | 0.31.6 |
| Calcium (8.110.5 mg/dL) | 8.9 0.6 | 7.610.1 |
| Phosphorus (2.74.8 mg/dL) | 3.2 (2.83.7) | 2.15.7 |
| Magnesium (1.32.1 mEq/L) | 1.8 0.3 | 1.22.5 |
| AST (1040 U/L) | 38 (2391) | 122402 |
| ALT (745 U/L) | 45 (2498) | 152436 |
| Total bilirubin (0.01.2 mg/dL) | 0.5 (0.30.7) | 0.12.2 |
| Pre‐albumin (2052 mg/dL) | 21 7 | 842 |
| Albumin (3.05.3 g/dL) | 3.7 0.7 | 1.64.8 |
| WBC (4.510.0 k/L) | 4.0 (3.25.7) | 1.120.3 |
| Neutrophils (%) (48.069.0%) | 55.5 13.1 | 17.082.0 |
| Lymphocytes (%) (21.043.0%) | 34.9 13.0 | 10.864.0 |
| Platelet count (150450 k/L) | 266 (193371) | 40819 |
| Hematocrit (37.047.0%) | 36.1 5.4 | 19.145.7 |
| MCV (80100 fL) | 91 7 | 73105 |
| TSH (0.346.00 IU/mL) | 1.52 (0.962.84) | 0.1864.1 |
| INR (0.821.17) | 1.09 (1.001.22) | 0.812.05 |
| 1,25 Hydroxy vitamin D (3080 ng/mL) | 41 (3058) | 8171 |
DISCUSSION
Hospital Medicine is currently the fastest growing area of specialization in medicine.13 Palliative care, inpatient geriatrics, short stay units, and bedside procedures have evolved into hospitalist‐led services.1418 The management of the medical complications of severe eating disorders is another potential niche for hospitalists.
The ACUTE Center at Denver Health represents a center in which highly specialized, multidisciplinary care is provided for a rare and extremely ill population of patients. Prior to entering the ACUTE Center, the patients described in our program had each experienced prolonged and unsuccessful stays for medical stabilization in acute care hospitals across the country, after being denied treatment in eating disorder programs due to medical instability.
Patients transferred to ACUTE often received medical care reflecting a lack of specific expertise, training, and exposure. The most common management discrepancy we noted was over‐aggressive provision of intravenous fluids. Consequently, we often diurese 1020 pounds of edema weight, gained during a prior medical hospitalization, before beginning the process of weight restoration. This edema weight artificially increases admission weight and results in less than expected weight gain from admission to discharge.
Even without substantial weight gain, medical stabilization is evidenced by consistent caloric oral intake, and fluid and electrolyte stabilization after initial refeeding. Accordingly, patients who have been treated at the ACUTE Center often become eligible for admission to eating disorder programs at body weights below the typical 70% of ideal body weight that most programs use as a threshold for admission.
From a clinical research perspective, centers such as ACUTE allow for opportunities to better understand and investigate the nuances of patient care in the setting of severe malnutrition. From our cohort of patients to date, we have noted unique issues in albumin levels,19 coagulopathy,20 and liver function,21 among others. As an example, the cohort of patients with anorexia nervosa described here had profoundly low body weight, but relatively normal admission labs. Even the serum albumin, a parameter often used to reflect nutrition in an adult internal medicine setting, is usually normal, reflecting, in an otherwise generally healthy young population, the absence of a malignant, inflammatory, or infectious etiology of weight loss.19
Hospitalists also advocate for their patients by helping to maximize the benefits of their health care coverage. Many health care plans place limits on inpatient psychiatric care benefits. Patients who are severely malnourished from their eating disorder may waste valuable psychiatric care benefits undergoing medical stabilization in psychiatric units while physically unable to undergo psychotherapy. This has become increasingly important as health insurance plans continue to decrease coverage for residential care of patients with anorexia.22
In contrast, the medical benefits of most health plans are more robust. Accordingly, from the patient perspective, medical stabilization in an acute medical unit before admission to a psychiatry unit maximizes their ability to participate in the intensive psychiatric therapy which is still needed after medical stabilization. A recent study from a residential eating disorder program confirmed that a higher discharge BMI was the single best predictor of full recovery from anorexia nervosa.23
In the future, we believe that a continuing concentration of care and experience may also lend itself to the development of protocols and management guidelines which may benefit patients beyond our own unit. Severely malnourished patients with anorexia nervosa, or bulimic patients with complicated electrolyte disorders, are likely to benefit both medically and financially from centers of excellence. Inpatient or residential psychiatric eating disorder programs may act in synergy with medical eating disorders units, like ACUTE, to most efficiently care for the severely malnourished patient. Hospitalists, with the proper training and experience, are uniquely positioned to develop such centers of excellence.
- ,,,.The prevalence and correlates of eating disorders in the national comorbidity survey replication.Biol Psychiatry.2007;61:348–358.
- .The outcome of anorexia nervosa in the 20th century.Am J Psychiatry.2002;159:1284–1293.
- ,.Anorexia nervosa medical issues.J Womens Health.2003;12:331–340.
- .Diagnosis and care of patients with anorexia nervosa in primary care settings.Ann Intern Med.2001;134:1048–1059.
- ,,, et al.Mortality in eating disorders: a descriptive study.Int J Eat Disord.2000;28:20–26.
- ,,,,.Long‐term prognosis in anorexia nervosa: lessons from a 21‐year follow‐up study.Lancet.2000;355:721–722.
- ,,,,.Variations in admissions practices for adolescents with anorexia nervosa: a North American sample.J Adolesc Health.2008;43:425–431.
- American Psychiatric Association.Treatment of patients with eating disorders, third edition.Am J Psychiatry.2006;163(suppl 7):4–54.
- American Dietetic Association.Position of the American Dietetic Association: nutrition intervention in the treatment of anorexia nervosa, bulimia nervosa, and other eating disorders (ADA reports).J Am Diet Assoc.2006;106:2073–2082.
- ,.Clinical practice guidelines for treating restrictive eating disorder patients during medical hospitalization.Curr Opin Pediatr.2008;20:390–397.
- .Practice makes perfect: a volume‐outcome study of hospital patients with HIV disease.J Acquir Immune Defic Syndr.2008;47:226–233.
- ,,,.Association between physician caseload and patient outcome for sepsis treatment.Infect Control Hosp Epidemiol.2009;30:556–562.
- .Reflections: the hospitalist movement ten years later.J Hosp Med.2006;1:248–252.
- What will board certification be‐and mean‐for hospitalists?.Palliative care in hospitals.J Hosp Med.2006;1:21–28.
- .Palliative care and hospitalists: a partnership for hope.J Hosp Med.2006;1:5–6.
- ,,, et al.Impact of a bedside procedure service on general medicine inpatients: a firm‐based trial.J Hosp Med.2007;2:143–149.
- ,,,.Growth in the care of older patients by hospitalists in the United States.N Engl J Med.2009;360:1102–1112.
- ,,, et al.A hospitalist run short stay unit: features that predict length of stay and eventual admission to traditional inpatient services.J Hosp Med.2009;4:276–284.
- ,,.Serum albumin levels may not correlate with weight status in severe anorexia nervosa.Eat Disord.2009;17:322–326.
- ,,,,.The use of thrombelastography to determine coagulation status in severe anorexia nervosa: a case series.Int J Eat Disord.2010;43(4):382–385.
- ,,,.Liver function test abnormalities in anorexia nervosa—cause or effect.Int J Eat Disord.2010;43(4):378–381.
- .Eating disorders: a new front in insurance fight.New York Times. October 13, 2011. Available at: http://www.nytimes.com/2011/10/14/business/ruling‐offers‐hope‐to‐eating‐disorder‐sufferers. html?ref=business.
- ,.Long‐term outcome of residential treatment for anorexia nervosa and bulimia nervosa.Eat Disord.2011;19:132–144.
