User login
Hospitalist Minority Mentoring Program
The fraction of the US population identifying themselves as ethnic minorities was 36% in 2010 and will exceed 50% by 2050.[1, 2] This has resulted in an increasing gap in healthcare, as minorities have well‐documented disparities in access to healthcare and a disproportionately high morbidity and mortality.[3] In 2008, only 12.3% of US physicians were from under‐represented minority (URM) groups (see Figure in Castillo‐Page 4) (ie, those racial and ethnic populations that are underrepresented in the medical profession relative to their numbers in the general population as defined by the American Association of Medical Colleges[4, 5]). Diversifying the healthcare workforce may be an effective approach to reducing healthcare disparities, as URM physicians are more likely to choose primary care specialties,[6] work in underserved communities with socioeconomic or racial mixes similar to their own, thereby increasing access to care,[6, 7, 8] increasing minority patient satisfaction, and improving the quality of care received by minorities.[9, 10, 11]
The number of URM students attending medical school is slowly increasing, but in 2011, only 15% of the matriculating medical school students were URMs (see Figure 12 and Table 10 in Castillo‐Page[12]), and medical schools actively compete for this limited number of applicants. To increase the pool of qualified candidates, more URM students need to graduate college and pursue postgraduate healthcare training.[12]
URM undergraduate freshmen with intentions to enter medical school are 50% less likely to apply to medical school by the time they are seniors than their non‐Latino, white, and Asian counterparts.[13] Higher attrition rates have been linked to students having negative experiences in the basic science courses and with a lack of role models and exposure to careers in healthcare.[13, 14, 15, 16] We developed a hospitalist‐led mentoring program that was focused on overcoming these perceived limitations. This report describes the program and follow‐up data from our first year cohort documenting its success.
METHODS
The Healthcare Interest Program (HIP) was developed by 2 hospitalists (L. C., E. C.) and a physician's assistant (C. N.) who worked at Denver Health (DH), a university‐affiliated public hospital. We worked in conjunction with the chief diversity officer of the University of Colorado, Denver (UCD), primarily a commuter university in metropolitan Denver, where URMs composed 51% of the 2011 freshmen class. We reviewed articles describing mentoring programs for undergraduate students, and by consensus, designed a 7‐component program, each of which was intended to address a specific barrier identified in the literature as possibly contributing to reduced interest of minority students in pursuing medical careers (Table 1).[13, 14, 15, 16]
| Component | Goal |
|---|---|
| Clinical shadowing | |
| Student meets with their mentor and/or with other healthcare providers (eg, pharmacist, nurse) 4 hours per day, 1 or 2 times per month. | Expose students to various healthcare careers and to care for underserved patients. |
| Mentoring | |
| Student meets with their mentor for life coaching, career counseling, and to learn interviewing techniques 4 hours per month | Expand ideas of opportunity, address barriers or concerns before they affect grades, write letter of recommendation |
| Books to Bedside lectures | |
| One lecture per month designed to integrate clinical medicine with the undergraduate basic sciences. Sample lectures include: The Physics of Electrocardiograms and The Biochemistry of Diabetic Ketoacidosis | Improve the undergraduate experience in the basic science courses |
| Book club | |
| Group discussions of books selected for their focus on healthcare disparities and cultural diversity; 2 or 3 books per year (eg, The Spirit Catches You and You Fall Down by Ann Fadiman, Just Like Us by Helen Thorpe) | Socialize, begin to understand and discuss health disparities and caring for the underserved. |
| Diversity lectures | |
| Three speakers per term, each discussing different aspects of health disparities research being conducted in the Denver metropolitan area | Understand the disparities affecting the students' communities. Inspire interest in becoming involved with research. |
| Social events | |
| Kickoff, winter, and end‐of‐year gatherings | Socializing, peer group support |
| Journaling and reflection essay | |
| Summary of hospital experience with mentor and thoughts regarding healthcare career goals and plans. | Formalize career goals |
During the 2009 to 2010 academic year, information about the program, together with an application, was e‐mailed to all students at UCD who self‐identified as having interest in healthcare careers. This information was also distributed at all prehealth clubs and gatherings (ie, to students expressing interest in graduate and professional programs in healthcare‐related fields). All sophomore and junior students who submitted an application and had grade point averages (GPA) 2.8 were interviewed by the program director. Twenty‐three students were selected on the basis of their GPAs (attempting to include those with a range of GPAs), interviews, and the essays prepared as part of their applications.
An e‐mail soliciting mentors was sent to all hospitalists physicians and midlevels working at DH; 25/30 volunteered, and 20 were selected on the basis of their gender (as mentors were matched to students based on gender). The HIP director met with the mentors in person to introduce the program and its goals. All mentors had been practicing hospital medicine for 10 years after their training, and all but 3 were non‐Latino white. Each student accepted into the program was paired with a hospitalist who served as their mentor for the year.
The mentors were instructed in life coaching in both e‐mails and individual discussions. Every 2 or 3 months each hospitalist was contacted by e‐mail to see if questions or problems had arisen and to emphasize the need to meet with their mentees monthly.
Students filled out a written survey after each Books‐to‐Bedside (described in Table 1) discussion. The HIP director met with each student for at least 1 hour per semester and gathered feedback regarding mentor‐mentee success, shadowing experience, and the quality of the book club. At the end of the academic year, students completed a written, anonymous survey assessing their impressions of the program and their intentions of pursuing additional training in healthcare careers (Table 2). We used descriptive statistics to analyze the data including frequencies and mean tests.
|
| Open‐ended questions: |
| 1. How did HIP or your HIP mentor affect your application to your healthcare field of interest (eg, letter of recommendation, clinical hours, change in healthcare career of interest)? |
| 2. How did the Books to Bedside presentation affect you? |
| 3. My healthcare professional school of interest is (eg, medical school, nursing school, physician assistant school, pharmacy school, physical therapy school, dental school). |
| 4. How many times per month were you able to shadow at Denver Health? |
| 5. How would you revise the program to improve it? |
| Yes/no questions: |
| 1. English is my primary language. |
| 2. I am the first in my immediate family to attend college |
| 3. Did you work while in school? |
| 4. Did you receive scholarships while in school? |
| 5. Prior to participating in this program, I had a role model in my healthcare field of interest. |
| 6. My role model is my HIP mentor. |
| 7. May we contact you in 2 to 3 years to obtain information regarding your acceptance into your healthcare field of interest? |
| Likert 5‐point questions: |
| 1. Participation in HIP expanded my perceptions of what I could accomplish in the healthcare field. |
| 2. Participation in HIP has increased my confidence that I will be accepted into my healthcare field of choice. |
| 3. I intend to go to my healthcare school in the state of Colorado. |
| 4. One of my long‐term goals is to work with people with health disparities (eg, underserved). |
| 5. One of my long‐term goals is to work in a rural environment. |
| 6. I have access to my prehealth advisors. |
| 7. I have access to my HIP mentor. |
| 8. Outside of the HIP, I have had access to clinical experience shadowing with a physician or physician assistant. |
| 9. If not accepted the first time, I will reapply to my healthcare field of interest. |
| 10. I would recommend HIP to my colleagues. |
Two years after completing the program, each student was contacted via e‐mail and/or phone to determine whether they were still pursuing healthcare careers.
RESULTS
Twenty‐three students were accepted into the program (14 female, 9 male, mean age 19 [standard deviation1]). Their GPAs ranged from 2.8 to 4.0. Eleven (48%) were the first in their family to attend college, 6 (26%) indicated that English was not their primary language, and 16 (70%) were working while attending school. All 23 students stayed in the HIP program for the full academic year.
Nineteen of the 23 students (83%) completed the survey at the end of the year. Of these, 19 (100%) strongly agreed that the HIP expanded their perceptions of what they might accomplish and increased their confidence in being able to succeed in a healthcare profession. All 19 (100%) stated that they hoped to care for underserved minority patients in the future. Sixteen (84%) strongly agreed that their role model in life was their HIP mentor. These findings suggest that many of the HIP components successfully accomplished their goals (Table 1).
Two‐year follow‐up was available for 21 of the 23 students (91%). Twenty (95%) remained committed to a career in healthcare, 18 (86%) had graduated college, 6 (29%) were enrolled in graduate training in the healthcare professions (2 in medical school, 1 in nursing school, and 3 in a master's programs in public health, counseling, and medical science, respectively), and 9 (43%) were in the process of applying to postgraduate healthcare training programs (7 to medical school, 1 to dental school, and 1 to nursing school, respectively). Five students were preparing to take the Medical College Admissions Test, and 7 were working at various jobs in the healthcare field (eg, phlebotomists, certified nurse assistants, research assistants). Of the 16 students who expressed an interest in attending medical school at the beginning of the program, 15 (94%) maintained that interest.
DISCUSSION
HIP was extremely well‐received by the participating students, the majority graduated college and remained committed to a career in healthcare, and 29% were enrolled in postgraduate training in healthcare professions 2 years after graduation.
The 86% graduation rate that we observed compares highly favorably to the UCD campus‐wide graduation rates for minority students of 12.5% at 4 years and 30.8% at 5 years. Although there may be selection bias in the students participating in HIP, the extremely high graduation rate is consistent with HIP meeting 1 or more of its stated objectives.
Many universities have prehealthcare pipeline programs that are designed to provide short‐term summer medical experiences, research opportunities, and assistance with the Medical College Admissions Test.[17, 18, 19] We believe, however, that several aspects of our program are unique. First, we designed HIP to be year‐long, rather than a summertime program. Continuing the mentoring and life coaching throughout the year may allow stronger relationships to develop between the mentor and the student. In addition, ongoing student‐mentor interactions during the time when a student may be encountering problems with their undergraduate basic science courses may be beneficial. Second, the Books‐to‐Bedside lectures series, which was designed to link the students' basic science training with clinical medicine, has not previously been described and may contribute to a higher rate of completion of their basic science training. Third, those aspects of the program resulting in increased peer interactions (eg, book club discussions, diversity lectures, and social gatherings) provided an important venue for students with similar interests to interact, an opportunity that is limited at UCD as it is primarily a commuter university.
A number of lessons were learned during the first year of the program. First, a program such as ours must include rigorous evaluation from the start to make a case for support to the university and key stakeholders. With this in mind, it is possible to obtain funding and ensure long‐term sustainability. Second, by involving UCD's chief diversity officer in the development, the program fostered a strong partnership between DH and UCD and facilitated growing the program. Third, the hospitalists who attended the diversity‐training aspects of the program stated through informal feedback that they felt better equipped to care for the underserved and felt that providing mentorship increased their personal job satisfaction. Fourth, the students requested more opportunities for them to participate in health disparities research and in shadowing in subspecialties in addition to internal medicine. In response to this feedback, we now offer research opportunities, lectures on health disparities research, and interactions with community leaders working in improving healthcare for the underserved.
Although influencing the graduation rate from graduate level schooling is beyond the scope of HIP, we can conclude that the large majority of students participating in HIP maintained their interest in the healthcare professions, graduated college, and that many went on to postgraduate healthcare training. The data we present pertain to the cohort of students in the first year of the HIP. As the program matures, we will continue to evaluate the long‐term outcomes of our students and hospitalist mentors. This may provide opportunities for other academic hospitalists to replicate our program in their own communities.
ACKNOWLEDGMENTS
Disclosure: The authors report no conflicts of interest.
- United States Census Bureau. An older and more diverse nation by midcentury. Available at: https://www.census.gov/newsroom/releases/archives/population/cb08–123.html. Accessed February 28, 2013.
- United States Census Bureau. State and county quick facts. Available at: http://quickfacts.census.gov/qfd/states/00000.html. Accessed February 28, 2013.
- Centers for Disease Control and Prevention. Surveillance of health status in minority communities—racial and ethnic approaches to community health across the U.S. (REACH US) risk factor survey, United States, 2009. Available at: http://cdc.gov/mmwr/preview/mmwrhtml/ss6006a1.htm. Accessed February 28, 2013.
- Association of American Medical Colleges. Diversity in the physician workforce: facts and figures 2010. Available at: https://members.aamc.org/eweb/upload/Diversity%20in%20the%20 Physician%20Workforce%20Facts%20and%20Figures%202010.pdf. Accessed April 29, 2014.
- Association of American Medical Colleges Executive Committee. The status of the new AAMC definition of “underrepresented in medicine” following the Supreme Court's decision in Grutter. Available at: https://www.aamc.org/download/54278/data/urm.pdf. Accessed May 25, 2014.
- . Physician Characteristics and Distribution in the US. 2013 ed. Chicago, IL: American Medical Association; 2013.
- , , , et al. The role of black and Hispanic physicians in providing health care for underserved populations. N Engl J Med. 1996;334:1305–1310.
- , , . The association among specialty, race, ethnicity, and practice location among California physicians in diverse Specialties. J Natl Med Assoc. 2012;104:46–52.
- , , , , Patient‐physician racial concordance and the perceived quality and use of health care. Arch Intern Med. 1999;159:997–1004.
- , . Race of physician and satisfaction with care among African‐American patients. J Natl Med Assoc. 2002;94:937–943.
- U.S. Department of Health and Human Services Health Resources and Services Administration Bureau of Health Professions. The rational for diversity in health professions: a review of the evidence. 2006. Available at: http://bhpr.hrsa.gov/healthworkforce/reports/diversityreviewevidence.pdf. Accessed March 30, 2014.
- . Association of American Medical Colleges. Diversity in medical education: facts and figures 2012. Available at: https://members.aamc.org/eweb/upload/Diversity%20in%20Medical%20Ed ucation%20Facts%20and%20Figures%202012.pdf. Accessed February 28, 2013.
- , , . The leaky pipeline: factors associated with early decline in interest in premedical studies among underrepresented minority undergraduate students. Acad Med. 2008;83:503–511.
- , . Perspective: adopting an asset bundles model to support and advance minority students' careers in academic medicine and the scientific pipeline. Acad Med. 2012;87:1488–1495.
- , , , . Contributors of black men's success in admission to and graduation from medical school. Acad Med. 2011;86:892–900.
- , . Premed survival: understanding the culling process in premedical undergraduate education. Acad Med. 2002;77:719–724.
- , , , . A novel enrichment program using cascading mentorship to increase diversity in the health care professions. Acad Med. 2013;88:1232–1238.
- , . A social and academic enrichment program promotes medical school matriculation and graduation for disadvantaged students. Educ Health. 2012;25:55–63.
- , , , . Addressing medical school diversity through an undergraduate partnership at Texas A83:512–515.
The fraction of the US population identifying themselves as ethnic minorities was 36% in 2010 and will exceed 50% by 2050.[1, 2] This has resulted in an increasing gap in healthcare, as minorities have well‐documented disparities in access to healthcare and a disproportionately high morbidity and mortality.[3] In 2008, only 12.3% of US physicians were from under‐represented minority (URM) groups (see Figure in Castillo‐Page 4) (ie, those racial and ethnic populations that are underrepresented in the medical profession relative to their numbers in the general population as defined by the American Association of Medical Colleges[4, 5]). Diversifying the healthcare workforce may be an effective approach to reducing healthcare disparities, as URM physicians are more likely to choose primary care specialties,[6] work in underserved communities with socioeconomic or racial mixes similar to their own, thereby increasing access to care,[6, 7, 8] increasing minority patient satisfaction, and improving the quality of care received by minorities.[9, 10, 11]
The number of URM students attending medical school is slowly increasing, but in 2011, only 15% of the matriculating medical school students were URMs (see Figure 12 and Table 10 in Castillo‐Page[12]), and medical schools actively compete for this limited number of applicants. To increase the pool of qualified candidates, more URM students need to graduate college and pursue postgraduate healthcare training.[12]
URM undergraduate freshmen with intentions to enter medical school are 50% less likely to apply to medical school by the time they are seniors than their non‐Latino, white, and Asian counterparts.[13] Higher attrition rates have been linked to students having negative experiences in the basic science courses and with a lack of role models and exposure to careers in healthcare.[13, 14, 15, 16] We developed a hospitalist‐led mentoring program that was focused on overcoming these perceived limitations. This report describes the program and follow‐up data from our first year cohort documenting its success.
METHODS
The Healthcare Interest Program (HIP) was developed by 2 hospitalists (L. C., E. C.) and a physician's assistant (C. N.) who worked at Denver Health (DH), a university‐affiliated public hospital. We worked in conjunction with the chief diversity officer of the University of Colorado, Denver (UCD), primarily a commuter university in metropolitan Denver, where URMs composed 51% of the 2011 freshmen class. We reviewed articles describing mentoring programs for undergraduate students, and by consensus, designed a 7‐component program, each of which was intended to address a specific barrier identified in the literature as possibly contributing to reduced interest of minority students in pursuing medical careers (Table 1).[13, 14, 15, 16]
| Component | Goal |
|---|---|
| Clinical shadowing | |
| Student meets with their mentor and/or with other healthcare providers (eg, pharmacist, nurse) 4 hours per day, 1 or 2 times per month. | Expose students to various healthcare careers and to care for underserved patients. |
| Mentoring | |
| Student meets with their mentor for life coaching, career counseling, and to learn interviewing techniques 4 hours per month | Expand ideas of opportunity, address barriers or concerns before they affect grades, write letter of recommendation |
| Books to Bedside lectures | |
| One lecture per month designed to integrate clinical medicine with the undergraduate basic sciences. Sample lectures include: The Physics of Electrocardiograms and The Biochemistry of Diabetic Ketoacidosis | Improve the undergraduate experience in the basic science courses |
| Book club | |
| Group discussions of books selected for their focus on healthcare disparities and cultural diversity; 2 or 3 books per year (eg, The Spirit Catches You and You Fall Down by Ann Fadiman, Just Like Us by Helen Thorpe) | Socialize, begin to understand and discuss health disparities and caring for the underserved. |
| Diversity lectures | |
| Three speakers per term, each discussing different aspects of health disparities research being conducted in the Denver metropolitan area | Understand the disparities affecting the students' communities. Inspire interest in becoming involved with research. |
| Social events | |
| Kickoff, winter, and end‐of‐year gatherings | Socializing, peer group support |
| Journaling and reflection essay | |
| Summary of hospital experience with mentor and thoughts regarding healthcare career goals and plans. | Formalize career goals |
During the 2009 to 2010 academic year, information about the program, together with an application, was e‐mailed to all students at UCD who self‐identified as having interest in healthcare careers. This information was also distributed at all prehealth clubs and gatherings (ie, to students expressing interest in graduate and professional programs in healthcare‐related fields). All sophomore and junior students who submitted an application and had grade point averages (GPA) 2.8 were interviewed by the program director. Twenty‐three students were selected on the basis of their GPAs (attempting to include those with a range of GPAs), interviews, and the essays prepared as part of their applications.
An e‐mail soliciting mentors was sent to all hospitalists physicians and midlevels working at DH; 25/30 volunteered, and 20 were selected on the basis of their gender (as mentors were matched to students based on gender). The HIP director met with the mentors in person to introduce the program and its goals. All mentors had been practicing hospital medicine for 10 years after their training, and all but 3 were non‐Latino white. Each student accepted into the program was paired with a hospitalist who served as their mentor for the year.
The mentors were instructed in life coaching in both e‐mails and individual discussions. Every 2 or 3 months each hospitalist was contacted by e‐mail to see if questions or problems had arisen and to emphasize the need to meet with their mentees monthly.
Students filled out a written survey after each Books‐to‐Bedside (described in Table 1) discussion. The HIP director met with each student for at least 1 hour per semester and gathered feedback regarding mentor‐mentee success, shadowing experience, and the quality of the book club. At the end of the academic year, students completed a written, anonymous survey assessing their impressions of the program and their intentions of pursuing additional training in healthcare careers (Table 2). We used descriptive statistics to analyze the data including frequencies and mean tests.
|
| Open‐ended questions: |
| 1. How did HIP or your HIP mentor affect your application to your healthcare field of interest (eg, letter of recommendation, clinical hours, change in healthcare career of interest)? |
| 2. How did the Books to Bedside presentation affect you? |
| 3. My healthcare professional school of interest is (eg, medical school, nursing school, physician assistant school, pharmacy school, physical therapy school, dental school). |
| 4. How many times per month were you able to shadow at Denver Health? |
| 5. How would you revise the program to improve it? |
| Yes/no questions: |
| 1. English is my primary language. |
| 2. I am the first in my immediate family to attend college |
| 3. Did you work while in school? |
| 4. Did you receive scholarships while in school? |
| 5. Prior to participating in this program, I had a role model in my healthcare field of interest. |
| 6. My role model is my HIP mentor. |
| 7. May we contact you in 2 to 3 years to obtain information regarding your acceptance into your healthcare field of interest? |
| Likert 5‐point questions: |
| 1. Participation in HIP expanded my perceptions of what I could accomplish in the healthcare field. |
| 2. Participation in HIP has increased my confidence that I will be accepted into my healthcare field of choice. |
| 3. I intend to go to my healthcare school in the state of Colorado. |
| 4. One of my long‐term goals is to work with people with health disparities (eg, underserved). |
| 5. One of my long‐term goals is to work in a rural environment. |
| 6. I have access to my prehealth advisors. |
| 7. I have access to my HIP mentor. |
| 8. Outside of the HIP, I have had access to clinical experience shadowing with a physician or physician assistant. |
| 9. If not accepted the first time, I will reapply to my healthcare field of interest. |
| 10. I would recommend HIP to my colleagues. |
Two years after completing the program, each student was contacted via e‐mail and/or phone to determine whether they were still pursuing healthcare careers.
RESULTS
Twenty‐three students were accepted into the program (14 female, 9 male, mean age 19 [standard deviation1]). Their GPAs ranged from 2.8 to 4.0. Eleven (48%) were the first in their family to attend college, 6 (26%) indicated that English was not their primary language, and 16 (70%) were working while attending school. All 23 students stayed in the HIP program for the full academic year.
Nineteen of the 23 students (83%) completed the survey at the end of the year. Of these, 19 (100%) strongly agreed that the HIP expanded their perceptions of what they might accomplish and increased their confidence in being able to succeed in a healthcare profession. All 19 (100%) stated that they hoped to care for underserved minority patients in the future. Sixteen (84%) strongly agreed that their role model in life was their HIP mentor. These findings suggest that many of the HIP components successfully accomplished their goals (Table 1).
Two‐year follow‐up was available for 21 of the 23 students (91%). Twenty (95%) remained committed to a career in healthcare, 18 (86%) had graduated college, 6 (29%) were enrolled in graduate training in the healthcare professions (2 in medical school, 1 in nursing school, and 3 in a master's programs in public health, counseling, and medical science, respectively), and 9 (43%) were in the process of applying to postgraduate healthcare training programs (7 to medical school, 1 to dental school, and 1 to nursing school, respectively). Five students were preparing to take the Medical College Admissions Test, and 7 were working at various jobs in the healthcare field (eg, phlebotomists, certified nurse assistants, research assistants). Of the 16 students who expressed an interest in attending medical school at the beginning of the program, 15 (94%) maintained that interest.
DISCUSSION
HIP was extremely well‐received by the participating students, the majority graduated college and remained committed to a career in healthcare, and 29% were enrolled in postgraduate training in healthcare professions 2 years after graduation.
The 86% graduation rate that we observed compares highly favorably to the UCD campus‐wide graduation rates for minority students of 12.5% at 4 years and 30.8% at 5 years. Although there may be selection bias in the students participating in HIP, the extremely high graduation rate is consistent with HIP meeting 1 or more of its stated objectives.
Many universities have prehealthcare pipeline programs that are designed to provide short‐term summer medical experiences, research opportunities, and assistance with the Medical College Admissions Test.[17, 18, 19] We believe, however, that several aspects of our program are unique. First, we designed HIP to be year‐long, rather than a summertime program. Continuing the mentoring and life coaching throughout the year may allow stronger relationships to develop between the mentor and the student. In addition, ongoing student‐mentor interactions during the time when a student may be encountering problems with their undergraduate basic science courses may be beneficial. Second, the Books‐to‐Bedside lectures series, which was designed to link the students' basic science training with clinical medicine, has not previously been described and may contribute to a higher rate of completion of their basic science training. Third, those aspects of the program resulting in increased peer interactions (eg, book club discussions, diversity lectures, and social gatherings) provided an important venue for students with similar interests to interact, an opportunity that is limited at UCD as it is primarily a commuter university.
A number of lessons were learned during the first year of the program. First, a program such as ours must include rigorous evaluation from the start to make a case for support to the university and key stakeholders. With this in mind, it is possible to obtain funding and ensure long‐term sustainability. Second, by involving UCD's chief diversity officer in the development, the program fostered a strong partnership between DH and UCD and facilitated growing the program. Third, the hospitalists who attended the diversity‐training aspects of the program stated through informal feedback that they felt better equipped to care for the underserved and felt that providing mentorship increased their personal job satisfaction. Fourth, the students requested more opportunities for them to participate in health disparities research and in shadowing in subspecialties in addition to internal medicine. In response to this feedback, we now offer research opportunities, lectures on health disparities research, and interactions with community leaders working in improving healthcare for the underserved.
Although influencing the graduation rate from graduate level schooling is beyond the scope of HIP, we can conclude that the large majority of students participating in HIP maintained their interest in the healthcare professions, graduated college, and that many went on to postgraduate healthcare training. The data we present pertain to the cohort of students in the first year of the HIP. As the program matures, we will continue to evaluate the long‐term outcomes of our students and hospitalist mentors. This may provide opportunities for other academic hospitalists to replicate our program in their own communities.
ACKNOWLEDGMENTS
Disclosure: The authors report no conflicts of interest.
- United States Census Bureau. An older and more diverse nation by midcentury. Available at: https://www.census.gov/newsroom/releases/archives/population/cb08–123.html. Accessed February 28, 2013.
- United States Census Bureau. State and county quick facts. Available at: http://quickfacts.census.gov/qfd/states/00000.html. Accessed February 28, 2013.
- Centers for Disease Control and Prevention. Surveillance of health status in minority communities—racial and ethnic approaches to community health across the U.S. (REACH US) risk factor survey, United States, 2009. Available at: http://cdc.gov/mmwr/preview/mmwrhtml/ss6006a1.htm. Accessed February 28, 2013.
- Association of American Medical Colleges. Diversity in the physician workforce: facts and figures 2010. Available at: https://members.aamc.org/eweb/upload/Diversity%20in%20the%20 Physician%20Workforce%20Facts%20and%20Figures%202010.pdf. Accessed April 29, 2014.
- Association of American Medical Colleges Executive Committee. The status of the new AAMC definition of “underrepresented in medicine” following the Supreme Court's decision in Grutter. Available at: https://www.aamc.org/download/54278/data/urm.pdf. Accessed May 25, 2014.
- . Physician Characteristics and Distribution in the US. 2013 ed. Chicago, IL: American Medical Association; 2013.
- , , , et al. The role of black and Hispanic physicians in providing health care for underserved populations. N Engl J Med. 1996;334:1305–1310.
- , , . The association among specialty, race, ethnicity, and practice location among California physicians in diverse Specialties. J Natl Med Assoc. 2012;104:46–52.
- , , , , Patient‐physician racial concordance and the perceived quality and use of health care. Arch Intern Med. 1999;159:997–1004.
- , . Race of physician and satisfaction with care among African‐American patients. J Natl Med Assoc. 2002;94:937–943.
- U.S. Department of Health and Human Services Health Resources and Services Administration Bureau of Health Professions. The rational for diversity in health professions: a review of the evidence. 2006. Available at: http://bhpr.hrsa.gov/healthworkforce/reports/diversityreviewevidence.pdf. Accessed March 30, 2014.
- . Association of American Medical Colleges. Diversity in medical education: facts and figures 2012. Available at: https://members.aamc.org/eweb/upload/Diversity%20in%20Medical%20Ed ucation%20Facts%20and%20Figures%202012.pdf. Accessed February 28, 2013.
- , , . The leaky pipeline: factors associated with early decline in interest in premedical studies among underrepresented minority undergraduate students. Acad Med. 2008;83:503–511.
- , . Perspective: adopting an asset bundles model to support and advance minority students' careers in academic medicine and the scientific pipeline. Acad Med. 2012;87:1488–1495.
- , , , . Contributors of black men's success in admission to and graduation from medical school. Acad Med. 2011;86:892–900.
- , . Premed survival: understanding the culling process in premedical undergraduate education. Acad Med. 2002;77:719–724.
- , , , . A novel enrichment program using cascading mentorship to increase diversity in the health care professions. Acad Med. 2013;88:1232–1238.
- , . A social and academic enrichment program promotes medical school matriculation and graduation for disadvantaged students. Educ Health. 2012;25:55–63.
- , , , . Addressing medical school diversity through an undergraduate partnership at Texas A83:512–515.
Caring About Prognosis
Prognostication continues to be a challenge to the clinician despite over 100 prognostic indices that have been developed during the past few decades to inform clinical practice and medical decision making.[1] Physicians are not accurate in prognostication of patients' risk of death and tend to overestimate survival.[2, 3] In addition, many physicians do not feel comfortable offering a prognosis to patients, despite patients' wishes to be informed.[4, 5] Regardless of the prevalence in the literature and value in improving physicians' prognostic accuracy, prognostic indices of survival are not regularly utilized in the hospital setting. Prognostic tools available for providers are often complicated and may require data about patients that are not readily available.[6, 7, 8] Prognostic indices may be too specific to a patient population, too difficult to remember, or too time consuming to use. A simple, rapid, and practical prognostic index is important in the hospital setting to assist in identifying patients at high risk of death so that primary palliative interventions can be incorporated into the plan of care early in the hospital stay. Patient and family education, advance care planning, formulating the plan of care based on patientfamily goals, and improved resource utilization could be better executed by more accurate risk of death prediction on hospital admission.
The CARING criteria are the only prognostic index to our knowledge that evaluates a patient's risk of death in the next year, with information readily available at the time of hospital admission (Table 1).[9] The CARING criteria are a unique prognostic tool: (1) CARING is a mnemonic acronym, making it more user friendly to the clinician. (2) The 5 prognostic indicators are readily available from the patient's chart on admission; gathering further data by patient or caretaker interviews or by obtaining laboratory data is not needed. (3) The timing for application of the tool on admission to the hospital is an ideal opportunity to intervene and introduce palliative interventions early on the hospital stay. The CARING criteria were developed and validated in a Veteran's Administration hospital setting by Fischer et al.[9] We sought to validate the CARING criteria in a broader patient populationmedical and surgical patients from a tertiary referral university hospital setting and a safety‐net hospital setting.
METHODS
Study Design
This study was a retrospective observational cohort study. The study was approved by the Colorado Multiple Institutional Review Board and the University of Colorado Hospital Research Review Committee.
Study Purpose
To validate the CARING criteria in a tertiary referral university hospital (University of Colorado Hospital [UCH]) and safety‐net hospital (Denver Health and Hospitals [DHH]) setting using similar methodology to that employed by the original CARING criteria study.[9]
Study Setting/Population
All adults (18 years of age) admitted as inpatients to the medical and surgical services of internal medicine, hospitalist, pulmonary, cardiology, hematology/oncology, hepatology, surgery, intensive care unit, and intermediary care unit at UCH and DHH during the study period of July 2005 through August 2005. The only exclusion criteria were those patients who were prisoners or pregnant. Administrative admission data from July 2005 to August 2005 were used to identify names of all persons admitted to the medicine and surgical services of the study hospitals during the specified time period.
The 2 study hospitals, UCH and DHH, provide a range of patients who vary in ethnicity, socioeconomic status, and medical illness. This variability allows for greater generalizability of the results. Both hospitals are affiliated with the University of Colorado School of Medicine internal medicine residency training program and are located in Denver, Colorado.
At the time of the study, UCH was a licensed 550‐bed tertiary referral, academic hospital serving the Denver metropolitan area and the Rocky Mountain region as a specialty care and referral center. DHH was a 398‐bed, academic, safety‐net hospital serving primarily the Denver metropolitan area. DHH provides 42% of the care for the uninsured in Denver and 26% of the uninsured care for the state of Colorado.
Measures
The CARING criteria were developed and validated in a Veteran's Administration (VA) hospital setting by Fischer et al.[9] The purpose of the CARING criteria is to identify patients, at the time of hospital admission, who are at higher risk of death in the following year. The prognostic index uses 5 predictors that can be abstracted from the chart at time of admission. The CARING criteria were developed a priori, and patients were evaluated using only the medical data available at the time of admission. The criteria include items that are already part of the routine physician admission notes and do not require additional data collection or assessments. The criteria include: C=primary diagnosis of cancer, A=2 admissions to the hospital for a chronic illness within the last year; R=resident in a nursing home; I=intensive care unit (ICU) admission with multiorgan failure (MOF), NG=noncancer hospice guidelines (meeting 2 of the National Hospice and Palliative Care Organization's [NHPCO] guidelines).
Patients were identified using name, date of birth, social security number, address, and phone number. This identifying information was then used for tracing death records 1 year after hospital admission.
Mortality at 1 year following the index hospitalization was the primary end point. To minimize missing data and the number of subjects lost to follow‐up, 3 determinants of mortality were used. First, electronic medical records of the 2 participating hospitals and their outpatient clinics were reviewed to determine if a follow‐up appointment had occurred past the study's end point of 1 year (August 2006). For those without a confirmed follow‐up visit, death records from the Colorado Department of Public Health and Vital Records were obtained. For those patients residing outside of Colorado or whose mortality status was still unclear, the National Death Index was accessed.
Medical Record Review
Medical records for all study participants were reviewed by J.Y. (UCH) and B.C. (DHH). Data collection was completed using direct data entry into a Microsoft Access (Microsoft Corp., Redmond, WA) database utilizing a data entry form linked with the database table. This form utilized skip patterns and input masks to ensure quality of data entry and minimize missing or invalid data. Inter‐rater reliability was assessed by an independent rereview (S.F.) of 5% of the total charts. Demographic variables were collected using hospital administrative data. These included personal identifiers of the participants for purposes of mortality follow‐up. Clinical data including the 5 CARING variables and additional descriptive variables were abstracted from the paper hospital chart and the electronic record of the chart (together these constitute the medical record).
Death Follow‐up
A search of Colorado death records was conducted in February 2011 for all subjects. Death records were used to determine mortality and time to death from the index hospitalization. The National Death Index was then searched for any subjects without or record of death in Colorado.
Analysis
All analyses were conducted using the statistical application software SAS for Windows version 9.3 (SAS Institute, Cary, NC). Simple frequencies and means ( standard deviation) were used to describe the baseline characteristics. Multiple logistic regression models were used to model 1‐year mortality. The models were fitted using all of the CARING variables and age. As the aim of the study was to validate the CARING criteria, the variables for the models were selected a priori based on the original index. Two hospital cohorts (DHH and UCH) were modeled separately and as a combined sample. Kaplan‐Meier survival analysis was conducted to compare those subjects who met 1 of the CARING criteria with those who did not through the entire period of mortality follow‐up (20052011). Finally, using the probabilities from the logistic regression models, we again developed a scoring rule appropriate for a non‐VA setting to allow clinicians to easily identify patient risk for 1‐year mortality at the time of hospital admission.
RESULTS
There were a total of 1064 patients admitted to the medical and surgical services during the study period568 patients at DHH and 496 patients at UCH. Sample characteristics of each individual hospital cohort and the entire combined study cohort are detailed in Table 2. Overall, slightly over half the population were male, with a mean age of 50 years, and the ethnic breakdown roughly reflects the population in Denver. A total of 36.5% (n=388) of the study population met 1 of the CARING criteria, and 12.6% (n=134 among 1063 excluding 1 without an admit date) died within 1 year of the index hospitalization. These were younger and healthier patients compared to the VA sample used in developing the CARING criteria.
| |
| Renal | Dementia |
| Stop/decline dialysis | Unable to ambulate independently |
| Not candidate for transplant | Urinary or fecal incontinence |
| Urine output < 40cc/24 hours | Unable to speak with more than single words |
| Creatinine > 8.0 (>6.0 for diabetics) | Unable to bathe independently |
| Creatinine clearance 10cc/min | Unable to dress independently |
| Uremia | Co‐morbid conditions: |
| Persistent serum K + > 7.0 | Aspiration pneumonia |
| Co‐morbid conditions: | Pyelonephritis |
| Cancer CHF | Decubitus ulcer |
| Chronic lung disease AIDS/HIV | Difficulty swallowing or refusal to eat |
| Sepsis Cirrhosis | |
| Cardiac | Pulmonary |
| Ejection fraction < 20% | Dyspnea at rest |
| Symptomatic with diuretics and vasodilators | FEV1 < 30% |
| Not candidate for transplant | Frequent ER or hospital admits for pulmonary infections or respiratory distress |
| History of cardiac arrest | Cor pulmonale or right heart failure |
| History of syncope | 02 sat < 88% on 02 |
| Systolic BP < 120mmHG | PC02 > 50 |
| CVA cardiac origin | Resting tachycardia > 100/min |
| Co‐morbid conditions as listed in Renal | Co‐morbid conditions as listed in Renal |
| Liver | Stroke/CVA |
| End stage cirrhosis | Coma at onset |
| Not candidate for transplant | Coma >3 days |
| Protime > 5sec and albumin <2.5 | Limb paralysis |
| Ascites unresponsive to treatment | Urinary/fecal incontinence |
| Hepatorenal syndrome | Impaired sitting balance |
| Hepatic encephalopathy | Karnofsky < 50% |
| Spontaneous bacterial peritonitis | Recurrent aspiration |
| Recurrent variceal bleed | Age > 70 |
| Co‐morbid conditions as listed in Renal | Co‐morbid conditions as listed in Renal |
| HIV/AIDS | Neuromuscular |
| Persistent decline in function | Diminished respiratory function |
| Chronic diarrhea 1 year | Chosen not to receive BiPAP/vent |
| Decision to stop treatment | Difficulty swallowing |
| CNS lymphoma | Diminished functional status |
| MAC‐untreated | Incontinence |
| Systemic lymphoma | Co‐morbid conditions as listed in Renal |
| Dilated cardiomyopathy | |
| CD4 < 25 with disease progression | |
| Viral load > 100,000 | |
| Safety‐Net Hospital Cohort, N=568 | Academic Center Cohort, N=496 | Study Cohort,N=1064 | Original CARING Cohort, N=8739 | |
|---|---|---|---|---|
| ||||
| Mean age ( SD), y | 47.8 (16.5) | 54.4 (17.5) | 50.9 (17.3) | 63 (13) |
| Male gender | 59.5% (338) | 50.1% (248) | 55.1% (586) | 98% (856) |
| Ethnicity | ||||
| African American | 14.1% (80) | 13.5% (65) | 13.8% (145) | 13% (114) |
| Asian | 0.4% (2) | 1.5% (7) | 0.9% (9) | Not reported |
| Caucasian | 41.7% (237) | 66.3% (318) | 53.0 % (555) | 69% (602) |
| Latino | 41.9% (238) | 9.6% (46) | 27.1% (284) | 8% (70) |
| Native American | 0.5% (3) | 0.4% (2) | 0.5% (5) | Not reported |
| Other | 0.5% (3) | 0.6% (3) | 0.6% (6) | 10% (87) |
| Unknown | 0.9% (5) | 8.1% (39) | 4.2% (44) | Not reported |
| CARING criteria | ||||
| Cancer | 6.2% (35) | 19.4% (96) | 12.3% (131) | 23% (201) |
| Admissions to the hospital 2 in past year | 13.6% (77) | 42.7% (212) | 27.2% (289) | 36% (314) |
| Resident in a nursing home | 1.8% (10) | 3.4% (17) | 2.5% (27) | 3% (26) |
| ICU with MOF | 3.7% (21) | 1.2% (6) | 2.5% (27) | 2% (17) |
| NHPCO (2) noncancer guidelines | 1.6% (9) | 5.9% (29) | 3.6% (38) | 8% (70) |
Reliability testing demonstrated excellent inter‐rater reliability. Kappa for each criterion is as follows: (1) primary diagnosis of cancer=1.0, (2) 2 admissions to the hospital in the past year=0.91, (3) resident in a nursing home=1.0, (4) ICU admission with MOF=1.0, and (5) 2 noncancer hospice guidelines=0.78.
This study aimed to validate the CARING criteria9; therefore, all original individual CARING criterion were included in the validation logistic regression models. The 1 exception to this was in the university hospital study cohort, where the ICU criterion was excluded from the model due to small sample size and quasiseparation in the model. The model results are presented in Table 3 for the individual hospitals and combined study cohort.
| Safety Net Hospital Cohort, C Index=0.76 | Academic Center Cohort, C Index=0.76 | Combined Hospital Cohort, C Index=0.79 | ||||
|---|---|---|---|---|---|---|
| Estimate | Odds Ratio (95% CI) | Estimate | Odds Ratio (95% CI) | Estimate | Odds Ratio (95% CI) | |
| ||||||
| Cancer | 1.92 | 6.85 (2.83‐16.59)a | 1.85 | 6.36 (3.54‐11.41)a | 1.98 | 7.23 (4.45‐11.75)a |
| Admissions to the hospital 2 in past year | 0.55 | 1.74 (0.76‐3.97) | 0.14 | 0.87 (0.51‐1.49) | 0.20 | 1.22 (0.78‐1.91) |
| Resident in a nursing home | 0.49 | 0.61 (0.06‐6.56) | 0.27 | 1.31 (0.37‐4.66) | 0.09 | 1.09 (0.36‐3.32) |
| ICU with MOF | 1.85 | 6.34 (2.0219.90)a | 1.94 | 6.97 (2.75‐17.68)a | ||
| NHPCO (2) noncancer guidelines | 3.04 | 20.86 (4.25102.32)a | 2.62 | 13.73 (5.86‐32.15)a | 2.74 | 15.55 (7.2833.23)a |
| Ageb | 0.38 | 1.46 (1.05‐2.03)a | 0.45 | 1.56 (1.23‐1.98)a | 0.47 | 1.60 (1.32‐1.93)a |
In the safety‐net hospital, admission to the hospital with a primary diagnosis related to cancer, 2 noncancer hospice guidelines, ICU admission with MOF, and age by category all were significant predictors of 1‐year mortality. In the university hospital cohort, primary diagnosis of cancer, 2 noncancer hospice guidelines, and age by category were predictive of 1‐year mortality. Finally, in the entire study cohort, primary diagnosis of cancer, ICU with MOF, 2 noncancer hospice guidelines, and age were all predictive of 1‐year mortality. Parameter estimates were similar in 3 of the criteria compared to the VA setting. Differences in patient characteristics may have caused the differences in the estimates. Gender was additionally tested but not significant in any model. One‐year survival was significantly lower for those who met 1 of the CARING criteria versus those who did not (Figure 1).

Based on the framework from the original CARING criteria analysis, a scoring rule was developed using the regression results of this validation cohort. To predict a high probability of 1‐year mortality, sensitivity was set to 58% and specificity was set at 86% (error rate=17%). Medium to high probability was set with a sensitivity of 73% and specificity of 72% (error rate=28%). The coefficients from the regression model of the entire study cohort were converted to scores for each of the CARING criteria. The scores are as follows: 0.5 points for admission from a nursing home, 1 point for 2 hospital admissions in the past year for a chronic illness, 10 points for primary diagnosis of cancer, 10 points for ICU admission with MOF, and 14 points for 2 noncancer hospice guidelines. For every age category increase, 2 points are assigned so that 0 points for age <55 years, 2 points for ages 56 to 65 years, 4 points for ages 66 to 75 years, and 6 points for >75 years. Points for individual risk factors were proportional to s (ie, log odds) in the logistic regression model for death at 1 year. Although no linear transformation exists between s and probabilities (of death at 1 year), the aggregated points for combinations of risk factors shown in Table 4 follow the probabilities in an approximately linear fashion, so that different degrees of risk of death can be represented contiguously (as highlighted by differently shaded regions in the scoring matrix) (Table 4). The scoring matrix allows for quick identification for patients at high risk for 1‐year mortality. In this non‐VA setting with healthier patients, low risk is defined at a lower probability threshold (0.1) compared to the VA setting (0.175).
| CARING Criteria Components | |||||||
|---|---|---|---|---|---|---|---|
| None | Resident in a Nursing Home | Admitted to the Hospital 2 Times in the Past Year | Resident in a Nursing Home Admitted to the Hospital 2 Times in the Past Year | Primary Diagnosis of Cancer | ICU Admission With MOF | Noncancer Hospice Guidelines | |
| |||||||
| Age | |||||||
| 55 years | 0 | 0.5 | 1 | 1.5 | 10 | ||
| 5565 years | 2 | 2.5 | 3 | 3.5 | 10 | ||
| 6675 years | 4 | 4.5 | 5 | 5.5 | 10 | ||
| >75 years | 6 | 6.5 | 7 | 7.5 | 10 | ||
| Risk | |||||||
| Low | 3.5 | Probability<0.1 | |||||
| Medium | 46.5 | 0.1probability <0.175 | |||||
| High | 7 | Probability0.175 | |||||
DISCUSSION
The CARING criteria are a practical prognostic tool that can be easily and rapidly applied to patients admitted to the hospital to estimate risk of death in 1 year, with the goal of identifying patients who may benefit most from incorporating palliative interventions into their plan of care. This study validated the CARING criteria in a tertiary referral university hospital and safety‐net hospital setting, demonstrating applicability in a much broader population than the VA hospital of the original CARING criteria study. The population studied represented a younger population by over 10 years, a more equitable proportion of males to females, a broader ethnic diversity, and lower 1‐year deaths rates than the original study. Despite the broader representation of the population, the significance of each of the individual CARING criterion was maintained except for 2 hospital admissions in the past year for a chronic illness (admission from a nursing home did not meet significance in either study as a sole criterion). As with the original study, meeting 2 of the NHPCO noncancer hospice guidelines demonstrated the highest risk of 1‐year mortality following index hospitalization, followed by primary diagnosis of cancer and ICU admission with MOF. Advancing age, also similar to the original study, conferred increased risk across the criterion.
Hospitalists could be an effective target for utilizing the CARING criteria because they are frequently the first‐line providers in the hospital setting. With the national shortage of palliative care specialists, hospitalists need to be able to identify when a patient has a limited life expectancy so they will be better equipped to make clinical decisions that are aligned with their patients' values, preferences, and goals of care. With the realization that not addressing advance care planning and patient goals of care may be considered medical errors, primary palliative care skills become alarmingly more important as priorities for hospitalists to obtain and feel comfortable using in daily practice.
The CARING criteria are directly applicable to patients who are seen by hospitalists. Other prognostic indices have focused on select patient populations, such as the elderly,[10, 11, 12] require collection of data that are not readily available on admission or would not otherwise be obtained,[10, 13] or apply to patients post‐hospital discharge, thereby missing the opportunity to make an impact earlier in the disease trajectory and incorporate palliative care into the hospital plan of care when key discussions about goals of care and preferences should be encouraged.
Additionally, the CARING criteria could easily be incorporated as a trigger for palliative care consults on hospital admission. Palliative care consults tend to happen late in a hospital stay, limiting the effectiveness of the palliative care team. A trigger system for hospitalists and other primary providers on hospital admission would lend to more effective timing of palliative measures being incorporated into the plan of care. Palliative care consults would not only be initiated earlier, but could be targeted for the more complex and sick patients with the highest risk of death in the next year.
In the time‐pressured environment, the presence of any 1 of the CARING criteria can act as a trigger to begin incorporating primary palliative care measures into the plan of care. The admitting hospitalist provider (ie, physician, nurse practitioner, physician assistant) could access the CARING criteria through an electronic health record prompt when admitting patients. When a more detailed assessment of mortality risk is helpful, the hospitalist can use the scoring matrix, which combines age with the individual criterion to calculate patients at medium or high risk of death within 1 year. Limited resources can then be directed to the patients with the greatest need. Patients with a focused care need, such as advance care planning or hospice referral, can be directed to the social worker or case manager. More complicated patients may be referred to a specialty palliative care team.
Several limitations to this study are recognized, including the small sample size of patients meeting criterion for ICU with MOF in the academic center study cohort. The patient data were collected during a transition time when the university hospital moved to a new campus, resulting in an ICU at each campus that housed patients with differing levels of illness severity, which may have contributed to the lower acuity ICU patient observed. Although we advocate the simplicity of the CARING criteria, the NHPCO noncancer hospice guidelines are more complicated, as they incorporates 8 broad categories of chronic illness. The hospice guidelines may not be general knowledge to the hospitalist or other primary providers. ePrognosis (
CONCLUSION
The CARING criteria are a simple, practical prognostic tool predictive of death within 1 year that has been validated in a broad population of hospitalized patients. The criteria hold up in a younger, healthier population that is more diverse by age, gender, and ethnicity than the VA population. With ready access to critical prognostic information on hospital admission, clinicians will be better informed to make decisions that are aligned with their patients' values, preferences, and goals of care.
Disclosure
Nothing to report.
- , , . Predicting death: an empirical evaluation of predictive tools for mortality. Arch Intern Med. 2011;171:1721–1726.
- , . Extent and determinants of error in physicians' prognoses in terminally ill patients: prospective cohort study. West J Med. 2000;172:310–313.
- , , , et al. A systematic review of physicians' survival predictions in terminally ill cancer patients. BMJ. 2003;327:195–198.
- , . Attitude and self‐reported practice regarding prognostication in a national sample of internists. Arch Intern Med. 1998;158:2389–2395.
- , , , et al. Discussing prognosis: balancing hope and realism. Cancer J. 2010;16:461–466.
- , , , . Acute Physiology and Chronic Health Evaluation (APACHE) IV: hospital mortality assessment for today's critically ill patients. Crit Care Med. 2006;34:1297–1310.
- , , , , . SAPS 3 admission score: an external validation in a general intensive care population. Intensive Care Med. 2008;34:1873–1877.
- , , , , , . Prospective validation of the intensive care unit admission Mortality Probability Model (MPM0‐III). Crit Care Med. 2009;37:1619–1623.
- , , , , , . A practical tool to identify patients who may benefit from a palliative approach: the CARING criteria. J Pain Symptom Manage. 2006;31:285–292.
- , , , et al. Prediction of survival for older hospitalized patients: the HELP survival model. J Am Geriatr Soc. 2000;48:S16–S24.
- , , , et al. Development and validation of a multidimensional prognostic index for one‐year mortality from comprehensive geriatric assessment in hospitalized older patients. Rejuvenation Res. 2008;11:151–161.
- , , , et al. Burden of illness score for elderly persons: risk adjustment incorporating the cumulative impact of diseases, physiologic abnormalities, and functional impairments. Med Care. 2003;41:70–83.
- , , , et al. The SUPPORT prognostic model. Objective estimates of survival for seriously ill hospitalized adults. Study to understand prognoses and preferences for outcomes and risks of treatments. Ann Intern Med. 1995;122:191–203.
Prognostication continues to be a challenge to the clinician despite over 100 prognostic indices that have been developed during the past few decades to inform clinical practice and medical decision making.[1] Physicians are not accurate in prognostication of patients' risk of death and tend to overestimate survival.[2, 3] In addition, many physicians do not feel comfortable offering a prognosis to patients, despite patients' wishes to be informed.[4, 5] Regardless of the prevalence in the literature and value in improving physicians' prognostic accuracy, prognostic indices of survival are not regularly utilized in the hospital setting. Prognostic tools available for providers are often complicated and may require data about patients that are not readily available.[6, 7, 8] Prognostic indices may be too specific to a patient population, too difficult to remember, or too time consuming to use. A simple, rapid, and practical prognostic index is important in the hospital setting to assist in identifying patients at high risk of death so that primary palliative interventions can be incorporated into the plan of care early in the hospital stay. Patient and family education, advance care planning, formulating the plan of care based on patientfamily goals, and improved resource utilization could be better executed by more accurate risk of death prediction on hospital admission.
The CARING criteria are the only prognostic index to our knowledge that evaluates a patient's risk of death in the next year, with information readily available at the time of hospital admission (Table 1).[9] The CARING criteria are a unique prognostic tool: (1) CARING is a mnemonic acronym, making it more user friendly to the clinician. (2) The 5 prognostic indicators are readily available from the patient's chart on admission; gathering further data by patient or caretaker interviews or by obtaining laboratory data is not needed. (3) The timing for application of the tool on admission to the hospital is an ideal opportunity to intervene and introduce palliative interventions early on the hospital stay. The CARING criteria were developed and validated in a Veteran's Administration hospital setting by Fischer et al.[9] We sought to validate the CARING criteria in a broader patient populationmedical and surgical patients from a tertiary referral university hospital setting and a safety‐net hospital setting.
METHODS
Study Design
This study was a retrospective observational cohort study. The study was approved by the Colorado Multiple Institutional Review Board and the University of Colorado Hospital Research Review Committee.
Study Purpose
To validate the CARING criteria in a tertiary referral university hospital (University of Colorado Hospital [UCH]) and safety‐net hospital (Denver Health and Hospitals [DHH]) setting using similar methodology to that employed by the original CARING criteria study.[9]
Study Setting/Population
All adults (18 years of age) admitted as inpatients to the medical and surgical services of internal medicine, hospitalist, pulmonary, cardiology, hematology/oncology, hepatology, surgery, intensive care unit, and intermediary care unit at UCH and DHH during the study period of July 2005 through August 2005. The only exclusion criteria were those patients who were prisoners or pregnant. Administrative admission data from July 2005 to August 2005 were used to identify names of all persons admitted to the medicine and surgical services of the study hospitals during the specified time period.
The 2 study hospitals, UCH and DHH, provide a range of patients who vary in ethnicity, socioeconomic status, and medical illness. This variability allows for greater generalizability of the results. Both hospitals are affiliated with the University of Colorado School of Medicine internal medicine residency training program and are located in Denver, Colorado.
At the time of the study, UCH was a licensed 550‐bed tertiary referral, academic hospital serving the Denver metropolitan area and the Rocky Mountain region as a specialty care and referral center. DHH was a 398‐bed, academic, safety‐net hospital serving primarily the Denver metropolitan area. DHH provides 42% of the care for the uninsured in Denver and 26% of the uninsured care for the state of Colorado.
Measures
The CARING criteria were developed and validated in a Veteran's Administration (VA) hospital setting by Fischer et al.[9] The purpose of the CARING criteria is to identify patients, at the time of hospital admission, who are at higher risk of death in the following year. The prognostic index uses 5 predictors that can be abstracted from the chart at time of admission. The CARING criteria were developed a priori, and patients were evaluated using only the medical data available at the time of admission. The criteria include items that are already part of the routine physician admission notes and do not require additional data collection or assessments. The criteria include: C=primary diagnosis of cancer, A=2 admissions to the hospital for a chronic illness within the last year; R=resident in a nursing home; I=intensive care unit (ICU) admission with multiorgan failure (MOF), NG=noncancer hospice guidelines (meeting 2 of the National Hospice and Palliative Care Organization's [NHPCO] guidelines).
Patients were identified using name, date of birth, social security number, address, and phone number. This identifying information was then used for tracing death records 1 year after hospital admission.
Mortality at 1 year following the index hospitalization was the primary end point. To minimize missing data and the number of subjects lost to follow‐up, 3 determinants of mortality were used. First, electronic medical records of the 2 participating hospitals and their outpatient clinics were reviewed to determine if a follow‐up appointment had occurred past the study's end point of 1 year (August 2006). For those without a confirmed follow‐up visit, death records from the Colorado Department of Public Health and Vital Records were obtained. For those patients residing outside of Colorado or whose mortality status was still unclear, the National Death Index was accessed.
Medical Record Review
Medical records for all study participants were reviewed by J.Y. (UCH) and B.C. (DHH). Data collection was completed using direct data entry into a Microsoft Access (Microsoft Corp., Redmond, WA) database utilizing a data entry form linked with the database table. This form utilized skip patterns and input masks to ensure quality of data entry and minimize missing or invalid data. Inter‐rater reliability was assessed by an independent rereview (S.F.) of 5% of the total charts. Demographic variables were collected using hospital administrative data. These included personal identifiers of the participants for purposes of mortality follow‐up. Clinical data including the 5 CARING variables and additional descriptive variables were abstracted from the paper hospital chart and the electronic record of the chart (together these constitute the medical record).
Death Follow‐up
A search of Colorado death records was conducted in February 2011 for all subjects. Death records were used to determine mortality and time to death from the index hospitalization. The National Death Index was then searched for any subjects without or record of death in Colorado.
Analysis
All analyses were conducted using the statistical application software SAS for Windows version 9.3 (SAS Institute, Cary, NC). Simple frequencies and means ( standard deviation) were used to describe the baseline characteristics. Multiple logistic regression models were used to model 1‐year mortality. The models were fitted using all of the CARING variables and age. As the aim of the study was to validate the CARING criteria, the variables for the models were selected a priori based on the original index. Two hospital cohorts (DHH and UCH) were modeled separately and as a combined sample. Kaplan‐Meier survival analysis was conducted to compare those subjects who met 1 of the CARING criteria with those who did not through the entire period of mortality follow‐up (20052011). Finally, using the probabilities from the logistic regression models, we again developed a scoring rule appropriate for a non‐VA setting to allow clinicians to easily identify patient risk for 1‐year mortality at the time of hospital admission.
RESULTS
There were a total of 1064 patients admitted to the medical and surgical services during the study period568 patients at DHH and 496 patients at UCH. Sample characteristics of each individual hospital cohort and the entire combined study cohort are detailed in Table 2. Overall, slightly over half the population were male, with a mean age of 50 years, and the ethnic breakdown roughly reflects the population in Denver. A total of 36.5% (n=388) of the study population met 1 of the CARING criteria, and 12.6% (n=134 among 1063 excluding 1 without an admit date) died within 1 year of the index hospitalization. These were younger and healthier patients compared to the VA sample used in developing the CARING criteria.
| |
| Renal | Dementia |
| Stop/decline dialysis | Unable to ambulate independently |
| Not candidate for transplant | Urinary or fecal incontinence |
| Urine output < 40cc/24 hours | Unable to speak with more than single words |
| Creatinine > 8.0 (>6.0 for diabetics) | Unable to bathe independently |
| Creatinine clearance 10cc/min | Unable to dress independently |
| Uremia | Co‐morbid conditions: |
| Persistent serum K + > 7.0 | Aspiration pneumonia |
| Co‐morbid conditions: | Pyelonephritis |
| Cancer CHF | Decubitus ulcer |
| Chronic lung disease AIDS/HIV | Difficulty swallowing or refusal to eat |
| Sepsis Cirrhosis | |
| Cardiac | Pulmonary |
| Ejection fraction < 20% | Dyspnea at rest |
| Symptomatic with diuretics and vasodilators | FEV1 < 30% |
| Not candidate for transplant | Frequent ER or hospital admits for pulmonary infections or respiratory distress |
| History of cardiac arrest | Cor pulmonale or right heart failure |
| History of syncope | 02 sat < 88% on 02 |
| Systolic BP < 120mmHG | PC02 > 50 |
| CVA cardiac origin | Resting tachycardia > 100/min |
| Co‐morbid conditions as listed in Renal | Co‐morbid conditions as listed in Renal |
| Liver | Stroke/CVA |
| End stage cirrhosis | Coma at onset |
| Not candidate for transplant | Coma >3 days |
| Protime > 5sec and albumin <2.5 | Limb paralysis |
| Ascites unresponsive to treatment | Urinary/fecal incontinence |
| Hepatorenal syndrome | Impaired sitting balance |
| Hepatic encephalopathy | Karnofsky < 50% |
| Spontaneous bacterial peritonitis | Recurrent aspiration |
| Recurrent variceal bleed | Age > 70 |
| Co‐morbid conditions as listed in Renal | Co‐morbid conditions as listed in Renal |
| HIV/AIDS | Neuromuscular |
| Persistent decline in function | Diminished respiratory function |
| Chronic diarrhea 1 year | Chosen not to receive BiPAP/vent |
| Decision to stop treatment | Difficulty swallowing |
| CNS lymphoma | Diminished functional status |
| MAC‐untreated | Incontinence |
| Systemic lymphoma | Co‐morbid conditions as listed in Renal |
| Dilated cardiomyopathy | |
| CD4 < 25 with disease progression | |
| Viral load > 100,000 | |
| Safety‐Net Hospital Cohort, N=568 | Academic Center Cohort, N=496 | Study Cohort,N=1064 | Original CARING Cohort, N=8739 | |
|---|---|---|---|---|
| ||||
| Mean age ( SD), y | 47.8 (16.5) | 54.4 (17.5) | 50.9 (17.3) | 63 (13) |
| Male gender | 59.5% (338) | 50.1% (248) | 55.1% (586) | 98% (856) |
| Ethnicity | ||||
| African American | 14.1% (80) | 13.5% (65) | 13.8% (145) | 13% (114) |
| Asian | 0.4% (2) | 1.5% (7) | 0.9% (9) | Not reported |
| Caucasian | 41.7% (237) | 66.3% (318) | 53.0 % (555) | 69% (602) |
| Latino | 41.9% (238) | 9.6% (46) | 27.1% (284) | 8% (70) |
| Native American | 0.5% (3) | 0.4% (2) | 0.5% (5) | Not reported |
| Other | 0.5% (3) | 0.6% (3) | 0.6% (6) | 10% (87) |
| Unknown | 0.9% (5) | 8.1% (39) | 4.2% (44) | Not reported |
| CARING criteria | ||||
| Cancer | 6.2% (35) | 19.4% (96) | 12.3% (131) | 23% (201) |
| Admissions to the hospital 2 in past year | 13.6% (77) | 42.7% (212) | 27.2% (289) | 36% (314) |
| Resident in a nursing home | 1.8% (10) | 3.4% (17) | 2.5% (27) | 3% (26) |
| ICU with MOF | 3.7% (21) | 1.2% (6) | 2.5% (27) | 2% (17) |
| NHPCO (2) noncancer guidelines | 1.6% (9) | 5.9% (29) | 3.6% (38) | 8% (70) |
Reliability testing demonstrated excellent inter‐rater reliability. Kappa for each criterion is as follows: (1) primary diagnosis of cancer=1.0, (2) 2 admissions to the hospital in the past year=0.91, (3) resident in a nursing home=1.0, (4) ICU admission with MOF=1.0, and (5) 2 noncancer hospice guidelines=0.78.
This study aimed to validate the CARING criteria9; therefore, all original individual CARING criterion were included in the validation logistic regression models. The 1 exception to this was in the university hospital study cohort, where the ICU criterion was excluded from the model due to small sample size and quasiseparation in the model. The model results are presented in Table 3 for the individual hospitals and combined study cohort.
| Safety Net Hospital Cohort, C Index=0.76 | Academic Center Cohort, C Index=0.76 | Combined Hospital Cohort, C Index=0.79 | ||||
|---|---|---|---|---|---|---|
| Estimate | Odds Ratio (95% CI) | Estimate | Odds Ratio (95% CI) | Estimate | Odds Ratio (95% CI) | |
| ||||||
| Cancer | 1.92 | 6.85 (2.83‐16.59)a | 1.85 | 6.36 (3.54‐11.41)a | 1.98 | 7.23 (4.45‐11.75)a |
| Admissions to the hospital 2 in past year | 0.55 | 1.74 (0.76‐3.97) | 0.14 | 0.87 (0.51‐1.49) | 0.20 | 1.22 (0.78‐1.91) |
| Resident in a nursing home | 0.49 | 0.61 (0.06‐6.56) | 0.27 | 1.31 (0.37‐4.66) | 0.09 | 1.09 (0.36‐3.32) |
| ICU with MOF | 1.85 | 6.34 (2.0219.90)a | 1.94 | 6.97 (2.75‐17.68)a | ||
| NHPCO (2) noncancer guidelines | 3.04 | 20.86 (4.25102.32)a | 2.62 | 13.73 (5.86‐32.15)a | 2.74 | 15.55 (7.2833.23)a |
| Ageb | 0.38 | 1.46 (1.05‐2.03)a | 0.45 | 1.56 (1.23‐1.98)a | 0.47 | 1.60 (1.32‐1.93)a |
In the safety‐net hospital, admission to the hospital with a primary diagnosis related to cancer, 2 noncancer hospice guidelines, ICU admission with MOF, and age by category all were significant predictors of 1‐year mortality. In the university hospital cohort, primary diagnosis of cancer, 2 noncancer hospice guidelines, and age by category were predictive of 1‐year mortality. Finally, in the entire study cohort, primary diagnosis of cancer, ICU with MOF, 2 noncancer hospice guidelines, and age were all predictive of 1‐year mortality. Parameter estimates were similar in 3 of the criteria compared to the VA setting. Differences in patient characteristics may have caused the differences in the estimates. Gender was additionally tested but not significant in any model. One‐year survival was significantly lower for those who met 1 of the CARING criteria versus those who did not (Figure 1).
Based on the framework from the original CARING criteria analysis, a scoring rule was developed using the regression results of this validation cohort. To predict a high probability of 1‐year mortality, sensitivity was set to 58% and specificity was set at 86% (error rate=17%). Medium to high probability was set with a sensitivity of 73% and specificity of 72% (error rate=28%). The coefficients from the regression model of the entire study cohort were converted to scores for each of the CARING criteria. The scores are as follows: 0.5 points for admission from a nursing home, 1 point for 2 hospital admissions in the past year for a chronic illness, 10 points for primary diagnosis of cancer, 10 points for ICU admission with MOF, and 14 points for 2 noncancer hospice guidelines. For every age category increase, 2 points are assigned so that 0 points for age <55 years, 2 points for ages 56 to 65 years, 4 points for ages 66 to 75 years, and 6 points for >75 years. Points for individual risk factors were proportional to s (ie, log odds) in the logistic regression model for death at 1 year. Although no linear transformation exists between s and probabilities (of death at 1 year), the aggregated points for combinations of risk factors shown in Table 4 follow the probabilities in an approximately linear fashion, so that different degrees of risk of death can be represented contiguously (as highlighted by differently shaded regions in the scoring matrix) (Table 4). The scoring matrix allows for quick identification for patients at high risk for 1‐year mortality. In this non‐VA setting with healthier patients, low risk is defined at a lower probability threshold (0.1) compared to the VA setting (0.175).
| CARING Criteria Components | |||||||
|---|---|---|---|---|---|---|---|
| None | Resident in a Nursing Home | Admitted to the Hospital 2 Times in the Past Year | Resident in a Nursing Home Admitted to the Hospital 2 Times in the Past Year | Primary Diagnosis of Cancer | ICU Admission With MOF | Noncancer Hospice Guidelines | |
| |||||||
| Age | |||||||
| 55 years | 0 | 0.5 | 1 | 1.5 | 10 | ||
| 5565 years | 2 | 2.5 | 3 | 3.5 | 10 | ||
| 6675 years | 4 | 4.5 | 5 | 5.5 | 10 | ||
| >75 years | 6 | 6.5 | 7 | 7.5 | 10 | ||
| Risk | |||||||
| Low | 3.5 | Probability<0.1 | |||||
| Medium | 46.5 | 0.1probability <0.175 | |||||
| High | 7 | Probability0.175 | |||||
DISCUSSION
The CARING criteria are a practical prognostic tool that can be easily and rapidly applied to patients admitted to the hospital to estimate risk of death in 1 year, with the goal of identifying patients who may benefit most from incorporating palliative interventions into their plan of care. This study validated the CARING criteria in a tertiary referral university hospital and safety‐net hospital setting, demonstrating applicability in a much broader population than the VA hospital of the original CARING criteria study. The population studied represented a younger population by over 10 years, a more equitable proportion of males to females, a broader ethnic diversity, and lower 1‐year deaths rates than the original study. Despite the broader representation of the population, the significance of each of the individual CARING criterion was maintained except for 2 hospital admissions in the past year for a chronic illness (admission from a nursing home did not meet significance in either study as a sole criterion). As with the original study, meeting 2 of the NHPCO noncancer hospice guidelines demonstrated the highest risk of 1‐year mortality following index hospitalization, followed by primary diagnosis of cancer and ICU admission with MOF. Advancing age, also similar to the original study, conferred increased risk across the criterion.
Hospitalists could be an effective target for utilizing the CARING criteria because they are frequently the first‐line providers in the hospital setting. With the national shortage of palliative care specialists, hospitalists need to be able to identify when a patient has a limited life expectancy so they will be better equipped to make clinical decisions that are aligned with their patients' values, preferences, and goals of care. With the realization that not addressing advance care planning and patient goals of care may be considered medical errors, primary palliative care skills become alarmingly more important as priorities for hospitalists to obtain and feel comfortable using in daily practice.
The CARING criteria are directly applicable to patients who are seen by hospitalists. Other prognostic indices have focused on select patient populations, such as the elderly,[10, 11, 12] require collection of data that are not readily available on admission or would not otherwise be obtained,[10, 13] or apply to patients post‐hospital discharge, thereby missing the opportunity to make an impact earlier in the disease trajectory and incorporate palliative care into the hospital plan of care when key discussions about goals of care and preferences should be encouraged.
Additionally, the CARING criteria could easily be incorporated as a trigger for palliative care consults on hospital admission. Palliative care consults tend to happen late in a hospital stay, limiting the effectiveness of the palliative care team. A trigger system for hospitalists and other primary providers on hospital admission would lend to more effective timing of palliative measures being incorporated into the plan of care. Palliative care consults would not only be initiated earlier, but could be targeted for the more complex and sick patients with the highest risk of death in the next year.
In the time‐pressured environment, the presence of any 1 of the CARING criteria can act as a trigger to begin incorporating primary palliative care measures into the plan of care. The admitting hospitalist provider (ie, physician, nurse practitioner, physician assistant) could access the CARING criteria through an electronic health record prompt when admitting patients. When a more detailed assessment of mortality risk is helpful, the hospitalist can use the scoring matrix, which combines age with the individual criterion to calculate patients at medium or high risk of death within 1 year. Limited resources can then be directed to the patients with the greatest need. Patients with a focused care need, such as advance care planning or hospice referral, can be directed to the social worker or case manager. More complicated patients may be referred to a specialty palliative care team.
Several limitations to this study are recognized, including the small sample size of patients meeting criterion for ICU with MOF in the academic center study cohort. The patient data were collected during a transition time when the university hospital moved to a new campus, resulting in an ICU at each campus that housed patients with differing levels of illness severity, which may have contributed to the lower acuity ICU patient observed. Although we advocate the simplicity of the CARING criteria, the NHPCO noncancer hospice guidelines are more complicated, as they incorporates 8 broad categories of chronic illness. The hospice guidelines may not be general knowledge to the hospitalist or other primary providers. ePrognosis (
CONCLUSION
The CARING criteria are a simple, practical prognostic tool predictive of death within 1 year that has been validated in a broad population of hospitalized patients. The criteria hold up in a younger, healthier population that is more diverse by age, gender, and ethnicity than the VA population. With ready access to critical prognostic information on hospital admission, clinicians will be better informed to make decisions that are aligned with their patients' values, preferences, and goals of care.
Disclosure
Nothing to report.
- , , . Predicting death: an empirical evaluation of predictive tools for mortality. Arch Intern Med. 2011;171:1721–1726.
- , . Extent and determinants of error in physicians' prognoses in terminally ill patients: prospective cohort study. West J Med. 2000;172:310–313.
- , , , et al. A systematic review of physicians' survival predictions in terminally ill cancer patients. BMJ. 2003;327:195–198.
- , . Attitude and self‐reported practice regarding prognostication in a national sample of internists. Arch Intern Med. 1998;158:2389–2395.
- , , , et al. Discussing prognosis: balancing hope and realism. Cancer J. 2010;16:461–466.
- , , , . Acute Physiology and Chronic Health Evaluation (APACHE) IV: hospital mortality assessment for today's critically ill patients. Crit Care Med. 2006;34:1297–1310.
- , , , , . SAPS 3 admission score: an external validation in a general intensive care population. Intensive Care Med. 2008;34:1873–1877.
- , , , , , . Prospective validation of the intensive care unit admission Mortality Probability Model (MPM0‐III). Crit Care Med. 2009;37:1619–1623.
- , , , , , . A practical tool to identify patients who may benefit from a palliative approach: the CARING criteria. J Pain Symptom Manage. 2006;31:285–292.
- , , , et al. Prediction of survival for older hospitalized patients: the HELP survival model. J Am Geriatr Soc. 2000;48:S16–S24.
- , , , et al. Development and validation of a multidimensional prognostic index for one‐year mortality from comprehensive geriatric assessment in hospitalized older patients. Rejuvenation Res. 2008;11:151–161.
- , , , et al. Burden of illness score for elderly persons: risk adjustment incorporating the cumulative impact of diseases, physiologic abnormalities, and functional impairments. Med Care. 2003;41:70–83.
- , , , et al. The SUPPORT prognostic model. Objective estimates of survival for seriously ill hospitalized adults. Study to understand prognoses and preferences for outcomes and risks of treatments. Ann Intern Med. 1995;122:191–203.
© 2013 Society of Hospital Medicine
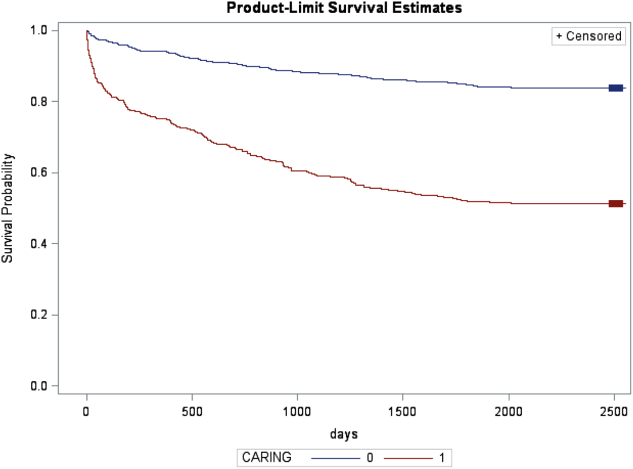
Low Concordance for Site of Death
At the turn of the 20th century, most deaths in the United States occurred at home. By the 1960s, over 70% of deaths occurred in an institutional setting, reflecting an evolution of medical technology.[1, 2, 3] With the birth of the hospice movement in the 1970s, dying patients had the opportunity to have both death at home and aggressive symptom control at the end of life. Although there has been a slow decline in the proportion of deaths that occur in the hospital over the past 2 decades,[3] the overwhelming majority of persons state that they would prefer to die at home. However, recent findings suggest that most people will die in an institutional setting.[3, 4, 5, 6]
Although good data exist describing population preferences for location of death, and we know, based on death records, where deaths occur in the United States, there are few studies that examine concordance between preferred and actual site of death at the individual patient level. Furthermore, although factors have been identified that predict death at home, factors predicting concordance between preferred and actual site of death are not well described.[3, 6, 7, 8, 9, 10, 11, 12, 13]
Regardless of where death ultimately occurs, most adults will experience multiple hospitalizations within the last years of their life. Understanding the preferences and subsequent experiences of this population is of particular relevance to hospitalist physicians who are in a unique position to elicit goals from seriously ill patients and help match patient preferences with their medical care. In this observational study, we sought to determine preferences for site of death in a cohort of adult patients admitted to the hospital for medical illness, and then follow those patients to determine where death occurred for those who died. We also sought to explore factors that may predict concordance between preferred and actual site of death. We hypothesized that ethnic diversity and lower socioeconomic status would be associated with a lower likelihood of concordance between preferred and actual site of death. We also hypothesized that advanced care planning would be associated with a higher likelihood of concordance. The Colorado Multi‐Institutional Review Board approved this study.
METHODS
Participants were recruited from 3 hospitals affiliated with the University of Colorado School of Medicine Internal Medicine Residency program, including the Denver Veterans' Administration Center (DVAMC), Denver Health Medical Center (DHMC), and University of Colorado Hospital (UCH). The DVAMC is a large urban Veterans Administration hospital, serving veterans from the Denver metro area, and is a tertiary referral center for veterans in rural Colorado, Wyoming, and parts of Montana. DHMC, the safety‐net hospital for the Denver area, serves over 25% of the residents in the city and county of Denver, including such special populations as the indigent, chronically mentally ill, and persons with polysubstance dependence. UCH had 350 licensed beds at the time of our study and serves as the Rocky Mountain region's only academic tertiary, specialty care, and referral center. At the time of this study, there was limited inpatient palliative care services at the DVAMC and UH, and no palliative care services at DHMC. Participants were screened on the first day following admission to the adult general medical service. Participants were recruited on 96 postadmission days between February 2004 and June 2006. Recruitment days varied from Monday through Friday, to include admissions from the weekend and throughout the year to reduce potential bias due to seasonal trends of diseases such as influenza. Patients were excluded if they died or were discharged within the first 24 hours of admission, were pregnant, jailed, or unable to give informed consent. All other patients were approached and invited to participate in a brief survey.
After informed consent was obtained, participants completed a bedside interview that included self‐identified ethnicity and the Berkman‐Syme Social Network Index,[14] a brief questionnaire quantifying social support from spouse or domestic partner, family, friends, and other religious or secular organizations. Baseline socioeconomic measures (eg, income, employment, home ownership, car ownership) and questions related to the last days of life were also included. Participants were asked the following question, If you were very sick, with an illness that could not be cured, and in bed most of the time, where would you spend the last days of your life if you could chose?
For each participant, we performed a detailed chart review to determine demographic data, presence of advance directives, and CARING criteria (Cancer, Admissions 2, Residence in a nursing home, Intensive care unit admit with multiorgan failure, 2 Noncancer hospice Guidelines), a set of prognostic criteria identifying patients at an index hospitalization who have a high burden of illness and are at risk for death in the following year.[15] We then followed patients for 5 years. If participants died within the follow‐up period, we collected the date and location of death using medical records, death certificates, or in a few cases when official death records were unavailable, direct contact with the family. Participants were considered alive if they had a clinic visit or MD/RN phone contact within 3 months prior to the final collection point date.
Analysis
SAS 9.1 (SAS Institute Inc., Cary, NC) was used for all analyses. Simple frequencies and means statistics were used to determine rates of descriptive characteristics of the sample as well as rates of the measured outcomes, preferred place to spend last days of life, and actual site of death. Agreement or concordance between preferred and actual site of death was calculated. For the purposes of the analysis, we assumed all persons who stated they had no preference died in a place concordant with their wishes. To calculate agreement by preferred and actual site, participants who expressed a preference and died (n=111) in hospital, nursing home, home, or hospice setting were included in the analysis, and participants (n=4) who died in an unknown or other locations were excluded (eg, motel room).
Logistic Regression Modeling
2 tests were performed for all categorical variables to determine a significant association with outcome variables. Preferred place of death and concordance between preferred and actual site of death were modeled using predictive variables selected if univariable association demonstrated a P0.25. This standard cutoff was selected to broadly identify candidate variables for logistic regression modeling.[16] A stepwise algorithm was used to select significant predictors that would remain in the model.
In lieu of fitting a multinomial logit model for preferred site of death of home vs hospital vs nursing home or hospice facility as preferred site of death, 3 logit models (although only 2 may be sufficient to estimate the underlying multinomial logit model[17]) were considered with outcome categories: home vs nursing home or hospice facility, and hospital vs nursing home or hospice facility and home vs hospital.
For the logistic regression modeling of concordance, we included the full sample of patients who died during the follow‐up period (n=123). We classified participants as dying in a place concordant with their wishes or not concordant.
RESULTS
Study Population
Subjects were recruited on 96 post‐admission days totaling 842 admissions. Three hundred thirty‐one patients (39%) were ineligible for study participation (n=175 discharged within 24 hours, n=76 unable to consent, n=78 ineligible for other reasons [eg, prisoner, pregnant, under 18 years old], n=2 died within 24 hours of admission). Only 53 of the remaining 511 (10%) patients refused; 458 patients (90%) gave informed consent to participate. Characteristics of the study population are depicted in Table 1. There were very few missing cases (<3%), that is persons without a recent clinic follow‐up date, contact, or a confirmed date of death. These persons were considered alive. Overall, the sample population was ethnically diverse, slightly older than middle age, mostly male (due to the inclusion of the Veterans Administration hospital), and of low socioeconomic status.
| Mean age (SD), y | 57.9 (14.8) |
|---|---|
| |
| Mean time to death (SD), d | 339.5 (348.4) |
| Ethnicity | |
| African American | 19% (88) |
| Caucasian | 52% (239) |
| Latino | 22% (102) |
| Other | 6% (29) |
| Spanish language only | 6% (27) |
| Female gender | 35% (159) |
| Admitted to DVAMC | 41% (188) |
| Admitted to DHMC | 38% (174) |
| Admitted to UCH | 21% (96) |
| CARING criteria | |
| Cancer diagnosis | 11% (51) |
| Admitted to hospital 2 times in the past year for chronic illness | 40% (181) |
| Resident in a nursing home | 2% (9) |
| Noncancer hospice guidelines (meeting 2) | 13% (59) |
| Income <$30,000/year | 84% (377) |
| No greater than high school education | 55% (248) |
| Home owner | 26% (120) |
| Rents home | 39% (177) |
| Unstable living situationa | 34% (156) |
| Low social supportb | 36% (165) |
| Uninsured | 18% (81) |
| Regular primary care provider | 73% (330) |
Preferred Site of Death
When asked where they preferred to spend the last days of their life, 75% of patients (n=343) stated they would like to be at home. In the hospital was the preferred location for 10% of patients, whereas 6% stated a nursing home and 4% a hospice inpatient facility. Two percent stated they had no preference, and 3% refused to answer (Figure 1)

We found that in the univariable analysis the following factors were associated with preference for site of death at a significance level of P<0.25: unstable housing, hospital setting, income level, ethnicity, CARING criteria, presence of an advance directive, education level, married, primary care provider, and presence of public insurance. Results of the logit models (home vs nursing home or hospice facility, and hospital vs nursing home or hospice facility and home vs hospital) are presented in Table 2.
| Adjusted Odds Ratio (95% Confidence Interval) | |||
|---|---|---|---|
| Home vs Nursing Home/Hospice Facility | Hospital vs Nursing Home/Hospice Facility | Home vs Hospital | |
| |||
| Low income | 2.71 (1.305.67) | 3.05 (1.019.24) | 0.99 (0.422.37) |
| Married | 2.44 (1.145.21) | 2.40 (0.876.62) | 0.82 (0.421.57) |
| CARING criteria | 0.58 (0.301.14) | 0.44 (0.181.09) | 0.89 (0.471.66) |
Patients with income <$30,000/year were more likely to prefer home (or hospital) over a nursing home or hospice facility. Being married was predictive of preferring home over nursing home or hospice facility. Patients meeting 1 of the CARING criteria trended toward being less likely (P=0.11 for home and P=0.08 for hospital) to prefer home (or hospital) vs nursing home or hospice facility. However, there were no significant predictors for a preference for home or hospital when directly comparing the 2 locations, as expected from observing similar effects of variables in the other 2 logit models.
Actual Site of Death
One hundred twenty‐three patients died during the follow‐up period (26% of the total sample). Of those who died, the mean age was 64 years (standard deviation 13), 82% had annual incomes <$30,000, 73% were men, and 77% met at least 1 of the CARING criteria suggesting advanced medical illness. The distribution of ethnicities of the deceased subsample was similar to that of the overall cohort. Complete death records were obtained for 121 patients. Only 31% (n=38) died at home, whereas 35% (n=42) died in a hospital, 20% (n=24) died in a nursing home, and 12% (n=14) died in an inpatient hospice facility (Figure 1).
In univariable analysis, there were no associations at a 25% significance level between actual site of death and ethnicity, gender, age, severity of illness, high vs low social support, high or low socioeconomic status, stable vs unstable housing, or presence of a completed advance directive in the medical record.
Concordance Between Preferred and Actual Site of Death
Overall, 37% of the patients died where they stated they would prefer to die, including the 2 with no preference. Concordance rates for each site of death are presented in Table 3. We examined sociodemographic variables, disease severity, advance‐care planning, primary care provider, health insurance, and hospital site to look for associations with concordance. We found that female gender was positively associated with concordance (odds ratio [OR], 3.30; 95% confidence interval [CI], 1.25‐8.72). CARING criteria (P=0.06) and Latino ethnicity (vs all other ethnicity categories, P=0.12) also showed trends for association. Restricting to those who preferred home, the associations became stronger (OR, 4.62; 95% CI, 1.44‐14.79 for female; OR, 7.72; 95% CI, 1.67‐35.71 for CARING criteria), and the trend for the negative association between Latino ethnicity and concordance remained (P=0.12). Results of the model are shown in Table 4.
| Actual Site of Death, n (Row %) | Row Total, % Out of 111 | ||||
|---|---|---|---|---|---|
| Hospital | Nursing Home | Home | Hospice Facility | ||
| Preferred hospital | 5 (42%) | 3 (25%) | 2 (17%) | 2 (17%) | 12 (11%) |
| Preferred nursing home | 1 (13%) | 5 (63%) | 2 (25%) | 0 | 8 (7%) |
| Preferred home | 30 (34%) | 15 (17%) | 31 (35%) | 12 (14%) | 88 (79%) |
| Preferred hospice facility | 3 (100%) | 0 | 0 | 0 | 3 (3%) |
| Adjusted Odds Ratio (95% Confidence Interval) | |||
|---|---|---|---|
| All | Home (Using Same Variables) | Home (Using Only Significant Variables) | |
| |||
| Female gender | 3.30 (1.258.72) | 4.62 (1.4414.79) | 3.57 (1.2410.34) |
| CARING criteria | 3.09 (0.979.81) | 7.72 (1.6735.71) | 5.93 (1.4124.91) |
| Latino vs African American/Caucasian/other | 0.43 (0.151.24) | 0.35 (0.091.30) | |
DISCUSSION
We found, similarly to previous reports in the literature, the majority of patients preferred to die at home. We did not find a significant difference in preferences or location of death by ethnicity or illness severity. Lower‐income patients and married patients were more likely to prefer to be at home over a nursing home or a hospice facility in the last days of life. We found that the minority of patients died at their stated preferred site of death, and female gender was the only predictive variable we found to distinguish those patients who died in a place concordant with their wishes compared to those who did not.
In the literature, previous studies have reported concordance rates between preferred and actual site of death that range from 30% to 90%.[12, 13, 18, 19, 20, 21, 22, 23, 24] We found a concordance rate at the lowest end of this spectrum. In trying to understand our findings and place them in context, it is helpful to examine other studies. Many of these studies focused solely on cancer patients.[13, 18, 19, 20, 21, 22, 23] Cancer follows a more predictable trajectory of decline compared to other common life‐threatening illnesses, such as cardiac disease, emphysema, or liver failure, that often involve periods of acute deteriorations and plateaus throughout illness progression. The more predictable trajectory may explain the overall higher concordance rates found in the studies involving cancer patients.
The majority of studies in the literature examining concordance between preferred and actual site of death recruited the study sample from home health or home palliative care programs that were providing support and care to participants.[10, 12, 13, 18, 22, 25, 26, 27] The high concordance rates reported may be the result of the patients in the sample receiving services at home aimed at eliciting preferences and providing support at home. Our observational study is unique in that we elicited patient preferences from a diverse group of hospitalized adults. Patients had a broad range of medical illness and were at various stages in their disease trajectory. This allowed our findings to be more generalizable, a major strength of our study.
The only variable associated with concordance that we identified to predict concordance between preferred and actual site of death was female gender. Women have been shown to be more active in medical decision making, which may explain our findings.[28] Female gender and illness severity (as measured by the CARING criteria) were found to be associated with concordance when the preference is for death at home. For persons with more advanced medical illness, they may have had more opportunity to consider their preferences and talk about these preferences. It is even possible that our interview prompted some participants to have discussions with their families or providers.
Variables with high face validity, such as high social support, higher education, and completing an advance directive, did not demonstrate any effect on the outcome of concordance. Other studies have shown that low functional status, Caucasian ethnicity, home care, higher education, and social support have been associated with a greater likelihood for a home death.[3, 6, 9] However, although studies specifically examining concordance between preferred and actual site of death have looked at predictors for home death, we were unable to find predictors for concordance across all preferences in the literature. We can conclude from our findings that the factors that influence concordance of preferences for site of death are extremely complex and difficult to capture and measure. This is extremely unsatisfying in the face of the low concordance rate of 30% we identified.
Latino ethnicity showed a trend toward having a negative association with concordance between preferred and actual site of death. This trend persisted whether it was concordance overall or for concordance with those who preferred a death at home. In the literature, Latinos have been found to be less likely to complete advance directives, use hospice services at the end of life, and are more likely to experience a hospital death.[29, 30, 31, 32, 33] As care at the end of life continues to improve, careful attention should be paid to ensure that these kinds of gaps do not widen any further.
We interviewed patients at an index hospitalization. Patients had an acute medical illness or an exacerbation of a chronic medical illness and required at least 24 hours of hospitalization to be eligible for inclusion. Our bedside interview made use of an opportune time to question patients, a time when it may have been easier for patients to visualize severe illness at the end of life, rather than asking this question during a time of wellness. Although participants overwhelmingly stated they preferred to be at home, for those who died, decisions were made in their care that did not allow for this preference.
Our follow‐up after the initial bedside interview only included death records of where and when participants died. We do not have the details and narrative of the conversations that may have taken place that led to the care decisions that determined participants' actual place of death. We do not know if preferences were elicited or discussed, and care decisions then negotiated, to best meet the goals and preferences expressed at that time. We also do not know if the conversations did not occur and the default of medical intervention and cure‐focused care dictated how participants spent the last days of their life. There is evidence that when conversations about goals and preferences do occur, concordance between preferences and care received are high.[12, 21]
We were unable to identify any predictors beyond gender in this cohort of adults hospitalized with a broad spectrum of severe medical illness to predict concordance with stated preferences and actual site of death. We can conclude then, based on our findings and supported by the literature, that the default trends toward institutional end‐of‐life experiences. To shift to a more patient‐centered approach, away from the default, healthcare providers need to embrace a palliative approach and incorporate preferences and goals into the discussions about next steps of care to facilitate the peaceful death that the majority of patients imagine for themselves. Hospitalist physicians have a unique opportunity at an index hospitalization to start the conversation about preferences for care including where patients would want to spend the last days of their life.
Our study does have some limitations. We elicited preferences at a single point in time, at an index hospitalization. It is possible that participants' preferences changed over the course of their illness. However, in Agar et al.'s study of longitudinal patient preferences for site of death and place of care, most preferences remained stable over time.[18] We also did not have data that included palliative care involvement, homecare or hospice utilization, or cause of death. All of these variables may be important predictors of concordance. Issues of symptom management and lack of caregiver may also dictate place of death, even when goals and care are aligned. We do not have data to address these components of end‐of‐life decision making.
CONCLUSION
Patients continue to express a preference for death at home. However, the majority of patients experienced an institutional death. Furthermore, few participants achieved concordance with where they preferred to die and where they actually died. Female gender was the sole factor associated with concordance between preferred and actual site of death. Incorporating a palliative approach that elicits goals and helps match goals to care, may offer the best opportunity to help people die where they chose.
Disclosures: This research was supported by the Brookdale National Fellowship Award and the NIA/Beeson grant 5K23AG028957. All authors have seen and agree with the contents of the article. This submission was not under review by any other publication. The authors have no financial interest or other potential conflicts of interest.
- Field MJ, Cassel CK, eds. Committee on Care at the End of Life. Approaching Death: Improving Care at the End of Life. Washington DC: National Academy Press; 1997.
- , . Demography and epidemiology of dying in the U.S. with emphasis on deaths of older persons. Hosp J. 1998;13:49–60.
- , , , . Factors associated with site of death: a national study of where people die. Med Care. 2003;41:323–335.
- , , , , , . Terminal cancer care and patient's preferences for place of death: a prospective study. BMJ. 1990;301:415–417.
- , , , et al. Influence of patient preferences and local health system characteristics on the place of death. SUPPORT Investigators. Study to Understand Prognoses and Preferences for Risks and Outcomes of Treatment. J Am Geriatr Soc. 1998;46:1242–1250.
- , , , , , . Where people die: a multilevel approach to understanding influences on site of death in America. Med Care Res Rev. 2007;64:351–378.
- , , , , , . Dying at home or in an institution using death certificates to explore the factors associated with place of death. Health Policy. 2006;78:319–329.
- , . How do cancer patients who die at home differ from those who die elsewhere? Palliat Med. 1998;12:279–286.
- , . Factors influencing death at home in terminally ill patients with cancer: systematic review [published correction appears in BMJ. 2006;332:1012]. BMJ 2006;332:515–521.
- , , , , , . Predictive factors for home deaths among cancer patients in Swedish palliative home care. Support Care Cancer. 2003;11:560–567.
- , . Systemic adenosine infusions alleviated neuropathic pain. Pain. 2001;94:121–122.
- , , . Prevalence, effectiveness, and predictors of planning their place of death among older persons followed in community‐based long term care. J Am Geriatr Soc. 2000;48:943–948.
- , , , , . Preferences for place of care and place of death among informal caregivers of the terminally ill. Palliat Med. 2005;19:492–499.
- , . Social networks, host resistance, and mortality: a nine‐year follow‐up study of Alameda County residents. Am J Epidemiol. 1979;109:186–204.
- , , , , , . A practical tool to identify patients who may benefit from a palliative approach: the CARING criteria. J Pain Symptom Manage. 2006;31:285–292.
- , . Applied Logistic Regression. 2nd ed. New York, NY: Wiley‐Interscience; 2000.
- , . Calculation of polychotmous logistic regression parameters using individualized regressions. Biometrika. 1984;71:11–18.
- , , , , , . Preference for place of care and place of death in palliative care: are these different questions? Palliat Med. 2008;22(7):787–795.
- , , . Place of death: preferences among cancer patients and their carers. Soc Sci Med. 2004;58:2431–2444.
- , . Determinants of congruence between the preferred and actual place of death for terminally ill cancer patients. J Palliat Care. 2003;19:230–237.
- , , . Factors associated with location of death (home or hospital) of patients referred to a palliative care team. CMAJ. 1995;152:361–367.
- , , , et al. Proxy perspectives regarding end‐of‐life care for persons with cancer. Cancer. 2008;112:1854–1861.
- , , , , , . Actual and preferred place of death of cancer patients. Results from the Italian survey of the dying of cancer (ISDOC). J Epidemiol Community Health. 2006;60:412–416.
- , , , . Family reports of barriers to optimal care of the dying. Nurs Res. 2000;49:310–317.
- , , . Place of death: preferences among cancer patients and their carers. Soc Sci Med. 2004;58(12):2431–2444.
- , . Where do elderly patients prefer to die? Place of death and patient characteristics of 100 elderly patients under the care of a home health care team. J Am Geriatr Soc. 1983;31:457–461.
- , , , , , . Predictors of home death in palliative care cancer patients. J Palliat Care. 2000;16:23–28.
- , . Patient preferences for medical decision making: who really wants to participate? Med Care. 2000;38:335–341.
- , , , et al. Racial and ethnic differences in advance care planning among patients with cancer: impact of terminal illness acknowledgment, religiousness, and treatment preferences. J Clin Oncol. 2008;26:4131–4137.
- , , , . Influence of ethnicity on advance directives and end‐of‐life decisions. JAMA. 1997;277:298–299.
- , , , . Differences in end‐of‐life decision making among black and white ambulatory cancer patients. J Gen Intern Med. 1996;11:651–656.
- , , . Hospice usage by minorities in the last year of life: results from the National Mortality Feedback Survey. J Am Geriatr Soc. 2003;51:970–978.
- , , , , , . Place of death: correlations with quality of life of patients with cancer and predictors of bereaved caregivers' mental health. J Clin Oncol. 2010;28:4457–4464.
At the turn of the 20th century, most deaths in the United States occurred at home. By the 1960s, over 70% of deaths occurred in an institutional setting, reflecting an evolution of medical technology.[1, 2, 3] With the birth of the hospice movement in the 1970s, dying patients had the opportunity to have both death at home and aggressive symptom control at the end of life. Although there has been a slow decline in the proportion of deaths that occur in the hospital over the past 2 decades,[3] the overwhelming majority of persons state that they would prefer to die at home. However, recent findings suggest that most people will die in an institutional setting.[3, 4, 5, 6]
Although good data exist describing population preferences for location of death, and we know, based on death records, where deaths occur in the United States, there are few studies that examine concordance between preferred and actual site of death at the individual patient level. Furthermore, although factors have been identified that predict death at home, factors predicting concordance between preferred and actual site of death are not well described.[3, 6, 7, 8, 9, 10, 11, 12, 13]
Regardless of where death ultimately occurs, most adults will experience multiple hospitalizations within the last years of their life. Understanding the preferences and subsequent experiences of this population is of particular relevance to hospitalist physicians who are in a unique position to elicit goals from seriously ill patients and help match patient preferences with their medical care. In this observational study, we sought to determine preferences for site of death in a cohort of adult patients admitted to the hospital for medical illness, and then follow those patients to determine where death occurred for those who died. We also sought to explore factors that may predict concordance between preferred and actual site of death. We hypothesized that ethnic diversity and lower socioeconomic status would be associated with a lower likelihood of concordance between preferred and actual site of death. We also hypothesized that advanced care planning would be associated with a higher likelihood of concordance. The Colorado Multi‐Institutional Review Board approved this study.
METHODS
Participants were recruited from 3 hospitals affiliated with the University of Colorado School of Medicine Internal Medicine Residency program, including the Denver Veterans' Administration Center (DVAMC), Denver Health Medical Center (DHMC), and University of Colorado Hospital (UCH). The DVAMC is a large urban Veterans Administration hospital, serving veterans from the Denver metro area, and is a tertiary referral center for veterans in rural Colorado, Wyoming, and parts of Montana. DHMC, the safety‐net hospital for the Denver area, serves over 25% of the residents in the city and county of Denver, including such special populations as the indigent, chronically mentally ill, and persons with polysubstance dependence. UCH had 350 licensed beds at the time of our study and serves as the Rocky Mountain region's only academic tertiary, specialty care, and referral center. At the time of this study, there was limited inpatient palliative care services at the DVAMC and UH, and no palliative care services at DHMC. Participants were screened on the first day following admission to the adult general medical service. Participants were recruited on 96 postadmission days between February 2004 and June 2006. Recruitment days varied from Monday through Friday, to include admissions from the weekend and throughout the year to reduce potential bias due to seasonal trends of diseases such as influenza. Patients were excluded if they died or were discharged within the first 24 hours of admission, were pregnant, jailed, or unable to give informed consent. All other patients were approached and invited to participate in a brief survey.
After informed consent was obtained, participants completed a bedside interview that included self‐identified ethnicity and the Berkman‐Syme Social Network Index,[14] a brief questionnaire quantifying social support from spouse or domestic partner, family, friends, and other religious or secular organizations. Baseline socioeconomic measures (eg, income, employment, home ownership, car ownership) and questions related to the last days of life were also included. Participants were asked the following question, If you were very sick, with an illness that could not be cured, and in bed most of the time, where would you spend the last days of your life if you could chose?
For each participant, we performed a detailed chart review to determine demographic data, presence of advance directives, and CARING criteria (Cancer, Admissions 2, Residence in a nursing home, Intensive care unit admit with multiorgan failure, 2 Noncancer hospice Guidelines), a set of prognostic criteria identifying patients at an index hospitalization who have a high burden of illness and are at risk for death in the following year.[15] We then followed patients for 5 years. If participants died within the follow‐up period, we collected the date and location of death using medical records, death certificates, or in a few cases when official death records were unavailable, direct contact with the family. Participants were considered alive if they had a clinic visit or MD/RN phone contact within 3 months prior to the final collection point date.
Analysis
SAS 9.1 (SAS Institute Inc., Cary, NC) was used for all analyses. Simple frequencies and means statistics were used to determine rates of descriptive characteristics of the sample as well as rates of the measured outcomes, preferred place to spend last days of life, and actual site of death. Agreement or concordance between preferred and actual site of death was calculated. For the purposes of the analysis, we assumed all persons who stated they had no preference died in a place concordant with their wishes. To calculate agreement by preferred and actual site, participants who expressed a preference and died (n=111) in hospital, nursing home, home, or hospice setting were included in the analysis, and participants (n=4) who died in an unknown or other locations were excluded (eg, motel room).
Logistic Regression Modeling
2 tests were performed for all categorical variables to determine a significant association with outcome variables. Preferred place of death and concordance between preferred and actual site of death were modeled using predictive variables selected if univariable association demonstrated a P0.25. This standard cutoff was selected to broadly identify candidate variables for logistic regression modeling.[16] A stepwise algorithm was used to select significant predictors that would remain in the model.
In lieu of fitting a multinomial logit model for preferred site of death of home vs hospital vs nursing home or hospice facility as preferred site of death, 3 logit models (although only 2 may be sufficient to estimate the underlying multinomial logit model[17]) were considered with outcome categories: home vs nursing home or hospice facility, and hospital vs nursing home or hospice facility and home vs hospital.
For the logistic regression modeling of concordance, we included the full sample of patients who died during the follow‐up period (n=123). We classified participants as dying in a place concordant with their wishes or not concordant.
RESULTS
Study Population
Subjects were recruited on 96 post‐admission days totaling 842 admissions. Three hundred thirty‐one patients (39%) were ineligible for study participation (n=175 discharged within 24 hours, n=76 unable to consent, n=78 ineligible for other reasons [eg, prisoner, pregnant, under 18 years old], n=2 died within 24 hours of admission). Only 53 of the remaining 511 (10%) patients refused; 458 patients (90%) gave informed consent to participate. Characteristics of the study population are depicted in Table 1. There were very few missing cases (<3%), that is persons without a recent clinic follow‐up date, contact, or a confirmed date of death. These persons were considered alive. Overall, the sample population was ethnically diverse, slightly older than middle age, mostly male (due to the inclusion of the Veterans Administration hospital), and of low socioeconomic status.
| Mean age (SD), y | 57.9 (14.8) |
|---|---|
| |
| Mean time to death (SD), d | 339.5 (348.4) |
| Ethnicity | |
| African American | 19% (88) |
| Caucasian | 52% (239) |
| Latino | 22% (102) |
| Other | 6% (29) |
| Spanish language only | 6% (27) |
| Female gender | 35% (159) |
| Admitted to DVAMC | 41% (188) |
| Admitted to DHMC | 38% (174) |
| Admitted to UCH | 21% (96) |
| CARING criteria | |
| Cancer diagnosis | 11% (51) |
| Admitted to hospital 2 times in the past year for chronic illness | 40% (181) |
| Resident in a nursing home | 2% (9) |
| Noncancer hospice guidelines (meeting 2) | 13% (59) |
| Income <$30,000/year | 84% (377) |
| No greater than high school education | 55% (248) |
| Home owner | 26% (120) |
| Rents home | 39% (177) |
| Unstable living situationa | 34% (156) |
| Low social supportb | 36% (165) |
| Uninsured | 18% (81) |
| Regular primary care provider | 73% (330) |
Preferred Site of Death
When asked where they preferred to spend the last days of their life, 75% of patients (n=343) stated they would like to be at home. In the hospital was the preferred location for 10% of patients, whereas 6% stated a nursing home and 4% a hospice inpatient facility. Two percent stated they had no preference, and 3% refused to answer (Figure 1)
We found that in the univariable analysis the following factors were associated with preference for site of death at a significance level of P<0.25: unstable housing, hospital setting, income level, ethnicity, CARING criteria, presence of an advance directive, education level, married, primary care provider, and presence of public insurance. Results of the logit models (home vs nursing home or hospice facility, and hospital vs nursing home or hospice facility and home vs hospital) are presented in Table 2.
| Adjusted Odds Ratio (95% Confidence Interval) | |||
|---|---|---|---|
| Home vs Nursing Home/Hospice Facility | Hospital vs Nursing Home/Hospice Facility | Home vs Hospital | |
| |||
| Low income | 2.71 (1.305.67) | 3.05 (1.019.24) | 0.99 (0.422.37) |
| Married | 2.44 (1.145.21) | 2.40 (0.876.62) | 0.82 (0.421.57) |
| CARING criteria | 0.58 (0.301.14) | 0.44 (0.181.09) | 0.89 (0.471.66) |
Patients with income <$30,000/year were more likely to prefer home (or hospital) over a nursing home or hospice facility. Being married was predictive of preferring home over nursing home or hospice facility. Patients meeting 1 of the CARING criteria trended toward being less likely (P=0.11 for home and P=0.08 for hospital) to prefer home (or hospital) vs nursing home or hospice facility. However, there were no significant predictors for a preference for home or hospital when directly comparing the 2 locations, as expected from observing similar effects of variables in the other 2 logit models.
Actual Site of Death
One hundred twenty‐three patients died during the follow‐up period (26% of the total sample). Of those who died, the mean age was 64 years (standard deviation 13), 82% had annual incomes <$30,000, 73% were men, and 77% met at least 1 of the CARING criteria suggesting advanced medical illness. The distribution of ethnicities of the deceased subsample was similar to that of the overall cohort. Complete death records were obtained for 121 patients. Only 31% (n=38) died at home, whereas 35% (n=42) died in a hospital, 20% (n=24) died in a nursing home, and 12% (n=14) died in an inpatient hospice facility (Figure 1).
In univariable analysis, there were no associations at a 25% significance level between actual site of death and ethnicity, gender, age, severity of illness, high vs low social support, high or low socioeconomic status, stable vs unstable housing, or presence of a completed advance directive in the medical record.
Concordance Between Preferred and Actual Site of Death
Overall, 37% of the patients died where they stated they would prefer to die, including the 2 with no preference. Concordance rates for each site of death are presented in Table 3. We examined sociodemographic variables, disease severity, advance‐care planning, primary care provider, health insurance, and hospital site to look for associations with concordance. We found that female gender was positively associated with concordance (odds ratio [OR], 3.30; 95% confidence interval [CI], 1.25‐8.72). CARING criteria (P=0.06) and Latino ethnicity (vs all other ethnicity categories, P=0.12) also showed trends for association. Restricting to those who preferred home, the associations became stronger (OR, 4.62; 95% CI, 1.44‐14.79 for female; OR, 7.72; 95% CI, 1.67‐35.71 for CARING criteria), and the trend for the negative association between Latino ethnicity and concordance remained (P=0.12). Results of the model are shown in Table 4.
| Actual Site of Death, n (Row %) | Row Total, % Out of 111 | ||||
|---|---|---|---|---|---|
| Hospital | Nursing Home | Home | Hospice Facility | ||
| Preferred hospital | 5 (42%) | 3 (25%) | 2 (17%) | 2 (17%) | 12 (11%) |
| Preferred nursing home | 1 (13%) | 5 (63%) | 2 (25%) | 0 | 8 (7%) |
| Preferred home | 30 (34%) | 15 (17%) | 31 (35%) | 12 (14%) | 88 (79%) |
| Preferred hospice facility | 3 (100%) | 0 | 0 | 0 | 3 (3%) |
| Adjusted Odds Ratio (95% Confidence Interval) | |||
|---|---|---|---|
| All | Home (Using Same Variables) | Home (Using Only Significant Variables) | |
| |||
| Female gender | 3.30 (1.258.72) | 4.62 (1.4414.79) | 3.57 (1.2410.34) |
| CARING criteria | 3.09 (0.979.81) | 7.72 (1.6735.71) | 5.93 (1.4124.91) |
| Latino vs African American/Caucasian/other | 0.43 (0.151.24) | 0.35 (0.091.30) | |
DISCUSSION
We found, similarly to previous reports in the literature, the majority of patients preferred to die at home. We did not find a significant difference in preferences or location of death by ethnicity or illness severity. Lower‐income patients and married patients were more likely to prefer to be at home over a nursing home or a hospice facility in the last days of life. We found that the minority of patients died at their stated preferred site of death, and female gender was the only predictive variable we found to distinguish those patients who died in a place concordant with their wishes compared to those who did not.
In the literature, previous studies have reported concordance rates between preferred and actual site of death that range from 30% to 90%.[12, 13, 18, 19, 20, 21, 22, 23, 24] We found a concordance rate at the lowest end of this spectrum. In trying to understand our findings and place them in context, it is helpful to examine other studies. Many of these studies focused solely on cancer patients.[13, 18, 19, 20, 21, 22, 23] Cancer follows a more predictable trajectory of decline compared to other common life‐threatening illnesses, such as cardiac disease, emphysema, or liver failure, that often involve periods of acute deteriorations and plateaus throughout illness progression. The more predictable trajectory may explain the overall higher concordance rates found in the studies involving cancer patients.
The majority of studies in the literature examining concordance between preferred and actual site of death recruited the study sample from home health or home palliative care programs that were providing support and care to participants.[10, 12, 13, 18, 22, 25, 26, 27] The high concordance rates reported may be the result of the patients in the sample receiving services at home aimed at eliciting preferences and providing support at home. Our observational study is unique in that we elicited patient preferences from a diverse group of hospitalized adults. Patients had a broad range of medical illness and were at various stages in their disease trajectory. This allowed our findings to be more generalizable, a major strength of our study.
The only variable associated with concordance that we identified to predict concordance between preferred and actual site of death was female gender. Women have been shown to be more active in medical decision making, which may explain our findings.[28] Female gender and illness severity (as measured by the CARING criteria) were found to be associated with concordance when the preference is for death at home. For persons with more advanced medical illness, they may have had more opportunity to consider their preferences and talk about these preferences. It is even possible that our interview prompted some participants to have discussions with their families or providers.
Variables with high face validity, such as high social support, higher education, and completing an advance directive, did not demonstrate any effect on the outcome of concordance. Other studies have shown that low functional status, Caucasian ethnicity, home care, higher education, and social support have been associated with a greater likelihood for a home death.[3, 6, 9] However, although studies specifically examining concordance between preferred and actual site of death have looked at predictors for home death, we were unable to find predictors for concordance across all preferences in the literature. We can conclude from our findings that the factors that influence concordance of preferences for site of death are extremely complex and difficult to capture and measure. This is extremely unsatisfying in the face of the low concordance rate of 30% we identified.
Latino ethnicity showed a trend toward having a negative association with concordance between preferred and actual site of death. This trend persisted whether it was concordance overall or for concordance with those who preferred a death at home. In the literature, Latinos have been found to be less likely to complete advance directives, use hospice services at the end of life, and are more likely to experience a hospital death.[29, 30, 31, 32, 33] As care at the end of life continues to improve, careful attention should be paid to ensure that these kinds of gaps do not widen any further.
We interviewed patients at an index hospitalization. Patients had an acute medical illness or an exacerbation of a chronic medical illness and required at least 24 hours of hospitalization to be eligible for inclusion. Our bedside interview made use of an opportune time to question patients, a time when it may have been easier for patients to visualize severe illness at the end of life, rather than asking this question during a time of wellness. Although participants overwhelmingly stated they preferred to be at home, for those who died, decisions were made in their care that did not allow for this preference.
Our follow‐up after the initial bedside interview only included death records of where and when participants died. We do not have the details and narrative of the conversations that may have taken place that led to the care decisions that determined participants' actual place of death. We do not know if preferences were elicited or discussed, and care decisions then negotiated, to best meet the goals and preferences expressed at that time. We also do not know if the conversations did not occur and the default of medical intervention and cure‐focused care dictated how participants spent the last days of their life. There is evidence that when conversations about goals and preferences do occur, concordance between preferences and care received are high.[12, 21]
We were unable to identify any predictors beyond gender in this cohort of adults hospitalized with a broad spectrum of severe medical illness to predict concordance with stated preferences and actual site of death. We can conclude then, based on our findings and supported by the literature, that the default trends toward institutional end‐of‐life experiences. To shift to a more patient‐centered approach, away from the default, healthcare providers need to embrace a palliative approach and incorporate preferences and goals into the discussions about next steps of care to facilitate the peaceful death that the majority of patients imagine for themselves. Hospitalist physicians have a unique opportunity at an index hospitalization to start the conversation about preferences for care including where patients would want to spend the last days of their life.
Our study does have some limitations. We elicited preferences at a single point in time, at an index hospitalization. It is possible that participants' preferences changed over the course of their illness. However, in Agar et al.'s study of longitudinal patient preferences for site of death and place of care, most preferences remained stable over time.[18] We also did not have data that included palliative care involvement, homecare or hospice utilization, or cause of death. All of these variables may be important predictors of concordance. Issues of symptom management and lack of caregiver may also dictate place of death, even when goals and care are aligned. We do not have data to address these components of end‐of‐life decision making.
CONCLUSION
Patients continue to express a preference for death at home. However, the majority of patients experienced an institutional death. Furthermore, few participants achieved concordance with where they preferred to die and where they actually died. Female gender was the sole factor associated with concordance between preferred and actual site of death. Incorporating a palliative approach that elicits goals and helps match goals to care, may offer the best opportunity to help people die where they chose.
Disclosures: This research was supported by the Brookdale National Fellowship Award and the NIA/Beeson grant 5K23AG028957. All authors have seen and agree with the contents of the article. This submission was not under review by any other publication. The authors have no financial interest or other potential conflicts of interest.
- Field MJ, Cassel CK, eds. Committee on Care at the End of Life. Approaching Death: Improving Care at the End of Life. Washington DC: National Academy Press; 1997.
- , . Demography and epidemiology of dying in the U.S. with emphasis on deaths of older persons. Hosp J. 1998;13:49–60.
- , , , . Factors associated with site of death: a national study of where people die. Med Care. 2003;41:323–335.
- , , , , , . Terminal cancer care and patient's preferences for place of death: a prospective study. BMJ. 1990;301:415–417.
- , , , et al. Influence of patient preferences and local health system characteristics on the place of death. SUPPORT Investigators. Study to Understand Prognoses and Preferences for Risks and Outcomes of Treatment. J Am Geriatr Soc. 1998;46:1242–1250.
- , , , , , . Where people die: a multilevel approach to understanding influences on site of death in America. Med Care Res Rev. 2007;64:351–378.
- , , , , , . Dying at home or in an institution using death certificates to explore the factors associated with place of death. Health Policy. 2006;78:319–329.
- , . How do cancer patients who die at home differ from those who die elsewhere? Palliat Med. 1998;12:279–286.
- , . Factors influencing death at home in terminally ill patients with cancer: systematic review [published correction appears in BMJ. 2006;332:1012]. BMJ 2006;332:515–521.
- , , , , , . Predictive factors for home deaths among cancer patients in Swedish palliative home care. Support Care Cancer. 2003;11:560–567.
- , . Systemic adenosine infusions alleviated neuropathic pain. Pain. 2001;94:121–122.
- , , . Prevalence, effectiveness, and predictors of planning their place of death among older persons followed in community‐based long term care. J Am Geriatr Soc. 2000;48:943–948.
- , , , , . Preferences for place of care and place of death among informal caregivers of the terminally ill. Palliat Med. 2005;19:492–499.
- , . Social networks, host resistance, and mortality: a nine‐year follow‐up study of Alameda County residents. Am J Epidemiol. 1979;109:186–204.
- , , , , , . A practical tool to identify patients who may benefit from a palliative approach: the CARING criteria. J Pain Symptom Manage. 2006;31:285–292.
- , . Applied Logistic Regression. 2nd ed. New York, NY: Wiley‐Interscience; 2000.
- , . Calculation of polychotmous logistic regression parameters using individualized regressions. Biometrika. 1984;71:11–18.
- , , , , , . Preference for place of care and place of death in palliative care: are these different questions? Palliat Med. 2008;22(7):787–795.
- , , . Place of death: preferences among cancer patients and their carers. Soc Sci Med. 2004;58:2431–2444.
- , . Determinants of congruence between the preferred and actual place of death for terminally ill cancer patients. J Palliat Care. 2003;19:230–237.
- , , . Factors associated with location of death (home or hospital) of patients referred to a palliative care team. CMAJ. 1995;152:361–367.
- , , , et al. Proxy perspectives regarding end‐of‐life care for persons with cancer. Cancer. 2008;112:1854–1861.
- , , , , , . Actual and preferred place of death of cancer patients. Results from the Italian survey of the dying of cancer (ISDOC). J Epidemiol Community Health. 2006;60:412–416.
- , , , . Family reports of barriers to optimal care of the dying. Nurs Res. 2000;49:310–317.
- , , . Place of death: preferences among cancer patients and their carers. Soc Sci Med. 2004;58(12):2431–2444.
- , . Where do elderly patients prefer to die? Place of death and patient characteristics of 100 elderly patients under the care of a home health care team. J Am Geriatr Soc. 1983;31:457–461.
- , , , , , . Predictors of home death in palliative care cancer patients. J Palliat Care. 2000;16:23–28.
- , . Patient preferences for medical decision making: who really wants to participate? Med Care. 2000;38:335–341.
- , , , et al. Racial and ethnic differences in advance care planning among patients with cancer: impact of terminal illness acknowledgment, religiousness, and treatment preferences. J Clin Oncol. 2008;26:4131–4137.
- , , , . Influence of ethnicity on advance directives and end‐of‐life decisions. JAMA. 1997;277:298–299.
- , , , . Differences in end‐of‐life decision making among black and white ambulatory cancer patients. J Gen Intern Med. 1996;11:651–656.
- , , . Hospice usage by minorities in the last year of life: results from the National Mortality Feedback Survey. J Am Geriatr Soc. 2003;51:970–978.
- , , , , , . Place of death: correlations with quality of life of patients with cancer and predictors of bereaved caregivers' mental health. J Clin Oncol. 2010;28:4457–4464.
Copyright © 2013 Society of Hospital Medicine