User login
Policy in Clinical Practice: Emergency Medicaid and Access to Allogeneic Stem Cell Transplant for Undocumented Immigrants
Clinical Scenario
Juan, a 50-year-old man with acute myeloid leukemia (AML), sat on the edge of his bed, dejected. Juan’s leukemia had relapsed for a third time, and he was low on options and optimism. Originally from Mexico, he had made the journey to Colorado to work as a mechanic and care for his disabled son. Like millions of other individuals in the United States, he did not obtain a visa and had no affordable options for health insurance. For nearly a decade, that had seemed not to matter, until he became ill. Initially presenting to the emergency department with fatigue and night sweats, Juan was diagnosed with poor-risk AML and underwent emergent induction chemotherapy reimbursed under Emergency Medicaid (Table). Just when his bone marrow biopsy showed remission, however, Juan was told there was no chance to cure him, as his documentation status precluded him from receiving the next recommended therapy: stem cell transplant (SCT). Without transplant, Juan’s leukemia relapsed within a few months. He decided to undergo all the salvage chemotherapy that was offered, worrying about how his son would survive without his father.
Background and History
For the patient with a new cancer diagnosis, a difference in immigration status may be the difference between life and death. Undocumented immigrants are excluded from federally funded benefits, including those offered under Medicare, most Medicaid programs, and the Patient Protection and Affordable Care Act (Table).1 The nearly 11 million undocumented immigrants residing in the United States are integral to the workforce and economy. Although they pay taxes that fund Medicaid, contributing approximately $11.7 billion nationally in 2017, undocumented immigrants are ineligible to benefit from such programs.2 The inequity of this policy is highlighted by Juan, an undocumented immigrant presenting with a new diagnosis of AML.
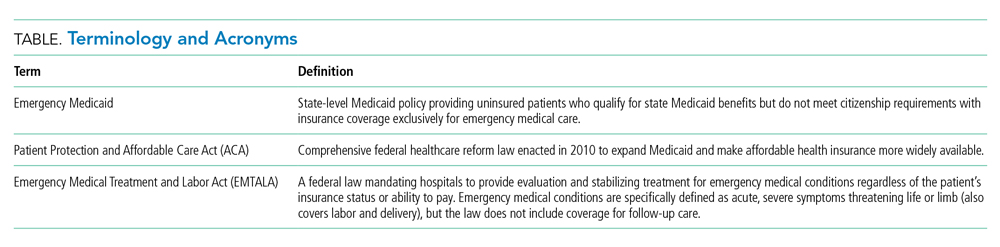
The Emergency Medical Treatment and Active Labor Act (EMTALA) is a 1986 federal law which mandates that patients who present to the hospital with an emergency medical condition receive appropriate evaluation and stabilizing treatment. An emergency condition is defined as “manifesting itself by acute symptoms of sufficient severity … such that the absence of immediate medical attention could reasonably be expected to result in (A) placing the patient’s health in serious jeopardy; (B) serious impairment to bodily functions; or (C) serious dysfunction of any bodily organ or part” (Table).3,4 The Centers for Medicare & Medicaid manual restates the EMTALA definition and notes that services for an emergency medical condition cannot include care related to organ transplantation. Most state Emergency Medicaid programs have adopted the federal definition of what constitutes a medical emergency.5 As a result, undocumented individuals who qualify for Medicaid benefits but who do not meet citizenship requirements are eligible to “receive Medical Assistance benefits for emergency medical care only.”3
Similar to our patient Juan, individuals who initially present with an acute leukemia would be eligible for induction chemotherapy, as blast crisis is imminently fatal. Once in remission, however, standard-of-care therapy for patients without disqualifying comorbidities, depending on cytogenetic disease phenotypes, recommends the only current potential cure: allogeneic SCT, a treatment that was far from routine practice at the time EMTALA was enacted.6 When preparing for transplant, a patient is stable and no longer fits EMTALA’s “emergency” criteria, even though their health is still in “serious jeopardy,” as their cancer has been incompletely treated. Because most state Emergency Medicaid programs adopt the federal definition of an emergency medical condition, the cure is out of reach.
Policy in Clinical Practice
This policy requires clinicians to deviate from the usual standard of care and results in inferior outcomes. For AML patients in the poor-risk category, allogeneic SCT is recommended following induction chemotherapy.7 The risk of relapse is 30% to 40% if consolidation therapy includes SCT, vs 70% to 80% if treated with chemotherapeutic consolidation alone.6 AML patients in the intermediate-, and sometimes even favorable- risk categories, have been shown to benefit from allogeneic SCT as well, with risk of relapse half that of a patient who undergoes consolidation without transplant. Undocumented individuals with AML are therefore resigned to inadequate cancer treatment, including lifelong salvage chemotherapy, and have a substantially decreased chance of achieving sustained remission.6 Furthermore, providing inequitable care for undocumented patients with other medical conditions, such as end-stage kidney disease (ESKD), has been associated with inferior patient-reported outcomes, higher mortality and hospital costs, and clinician burnout. In many states, undocumented immigrants with ESKD rely on emergency dialysis (dialysis made available only after presenting critically ill to an emergency department). In 2019, Colorado’s Medicaid agency opted to include ESKD as a qualifying condition for Emergency Medicaid, thereby expanding access to scheduled dialysis. This led to improved patient quality of life, a decreased emotional toll on patients and clinicians, and reduced costs.8,9
Economic Considerations
Policy discussions must consider cost. The average cost of allogeneic SCT in the United States was approximately $226,000 in 2018, which is often compared to the cost of managing a patient with refractory disease who does not receive transplant.10 This study reported a cost of active disease without transplant, including chemotherapy and hospitalizations, of approximately $69,000, plus terminal care costs of nearly $89,000; at a total of $158,000, this comes out to $68,000 less than SCT.10 This cost savings, however, results in a patient’s death rather than an up to 85% chance of long-term, relapse-free survival.6
To more completely capture the relationship between the healthcare value and cost-effectiveness of SCT, a second study calculated the incremental cost-effectiveness ratio (ICER) of transplantation in acute leukemias in the first 100 days post transplant, including management of complications, such as hospitalization, acute graft-versus-host disease (GVHD), infection, and blood product transfusions. ICER represents the economic value of an intervention compared to an alternative, calculated as cost per quality-adjusted life years. The ICER of SCT compared to no transplant is $16,346 to $34,360, depending on type of transplant and conditioning regimen.11 An ICER of less than $50,000 is considered an acceptable expense for the value achieved—in this case, a significant opportunity for cure. This finding supports SCT, including management of complications, as an economically valuable intervention. Furthermore, if a sustained remission is achieved with SCT, this difference in expense buys the individual patient potentially decades of productivity to contribute back into society and the economy. According to the National Bureau of Economic Research, undocumented workers as a whole contribute $5 trillion to the US Gross Domestic Product over a 10-year period, or about $45,000 per worker per year.12 According to the costs cited, curing a single undocumented worker with acute leukemia via SCT and allowing them to return to work would lead to a return on investment in less than 2 years. If the goal is high-quality, high-value, equitable care, it is logical to spend the money upfront and allow all patients the best chance for recovery.
One might suggest that patients instead receive treatment in their country of origin. This proposition, however, is often unrealistic. Latin American countries, for example, lack access to many standard-of-care cancer treatments available domestically. In Mexico, SCT is only available at a single facility in Mexico City, which is unable to track outcomes.13 The mortality-to-incidence ratio for cancer, a marker of availability of effective treatment, for Latin America is 0.48, substantially inferior to that of the United States (0.29).14 Importantly, almost two thirds of undocumented immigrants in the United States have lived in the country for 10 or more years, and 43% are parents of minor children, an increasing proportion of whom are American citizens.15 This highlights the impracticality of these individuals returning to their country of origin for treatment.
Commentary and Recommendations
Medicaid laws in several states have made it possible for undocumented immigrants to receive access to standard-of-care therapies. Washington and California have included provisions that enable undocumented immigrants to receive allogeneic SCT if they are otherwise medically eligible. In the course of this policy change, legal arguments from the California Court of Appeals expressed that the language of the law was not intended to deny lifesaving treatment to an individual.16 California’s Emergency Medicaid policy is comparable to that of other states, but because the courts considered SCT a “continuation of medically necessary inpatient hospital services … directly related to the emergency” for which the patient initially presented, they concluded that it could be covered under California Medicaid. Despite covering SCT for undocumented immigrants, California maintains lower costs for those patients compared to US citizens on Medicaid while providing evidence-based cancer care.17 This exemplifies sustainable and equitable healthcare policy for the rest of the nation.
A proposed change in policy could occur at either the federal or state level. One option would be to follow the example set by the State of Washington. Under Emergency Medicaid, Washington modified qualifying conditions to include “emergency room care, inpatient admission, or outpatient surgery; a cancer treatment plan; dialysis treatment; anti-rejection medication for an organ transplant” and long-term care services.18 Federal policy reform for undocumented immigrants would also improve access to care. The US Citizenship Act of 2021, introduced to the House of Representatives in February 2021, offers a path to citizenship for undocumented immigrants, ultimately allowing for undocumented individuals to be eligible for the same programs as citizens, though after a period of up to 8 years.19 More immediate revisions of qualifying conditions under state Emergency Medicaid programs, coupled with a path to citizenship, would make significant progress towards reducing structural health inequities. Such policy change would also have broader implications. Three quarters of undocumented immigrants in the United States originate from Mexico, Central America, and South America, and the incidence rate of AML for Latinx individuals is 3.6 per 100,000, a figure which can be extrapolated to an estimated 380 cases per year in the US undocumented population.20-22 In addition to benefiting patients with acute leukemias, the proposed policy change would also benefit numerous others who are frequently hospitalized for acute decompensations of chronic conditions, including congestive heart failure, liver disease, ESKD, and chronic lung conditions. Enabling follow-up care for these diseases under Emergency Medicaid would likewise be expected to reduce costs and improve both quality of care and patient-centered and clinical outcomes.
What Should I Tell My Patient?
Hospitalists frequently care for undocumented immigrants with acute leukemias because the hospital can only be reimbursed by Emergency Medicaid when a patient is admitted to the hospital. Patients may ask about what they can expect in the course of their illness and, while details may be left to the oncologist, hospitalists will be faced with responding to many of these questions. Clinicians at our institution hold honest conversations with patients like Juan. We are compelled to provide the care that hospital and state policies allow, and can only offer the best care available to them because of the restrictions of an insurance system to which they contribute financially, yet cannot benefit from, in their time of need. We can tell our undocumented immigrant patients that we find this unacceptable and are actively advocating to change this policy.
Conclusion
The State of Colorado and the nation must amend its healthcare policy to include comprehensive cancer care for everyone. Offering standard-of-care therapy to all patients is not only ethical, but also an economically sound policy benefiting patients, clinicians, and the workforce.
1. Skopec L, Holahan J, Elmendorf C. Changes in Health Insurance Coverage in 2013-2016: Medicaid Expansion States Lead the Way. Urban Institute. September 11, 2018. Accessed July 12, 2021. https://www.urban.org/research/publication/changes-health-insurance-coverage-2013-2016-medicaid-expansion-states-lead-way
2. Christensen Gee L, Gardner M, Hill ME, Wiehe M. Undocumented Immigrants’ State & Local Tax Contributions. Institute on Taxation & Economic Policy. Updated March 2017. Accessed July 12, 2021. https://www.immigrationresearch.org/system/files/immigration_taxes_2017.pdf
3. Emergency Medical Treatment and Labor Act (EMTALA), Public Law 42 U.S.C. 1395dd. 2010.
4. Social Security Act. Sec. 1903 [42 U.S.C. 1396b]. Accessed July 12, 2021. https://www.ssa.gov/OP_Home/ssact/title19/1903.htm.
5. Cervantes L, Mundo W, Powe NR. The status of provision of standard outpatient dialysis for US undocumented immigrants with ESKD. Clin J Am Soc Nephrol. 2019;14(8):1258-1260. https://doi.org/10.2215/CJN.03460319
6. Cornelissen JJ, Blaise D. Hematopoietic stem cell transplantation for patients with AML in first complete remission. Blood. 2016;127(1):62-70. https://doi.org/10.1182/blood-2015-07-604546
7. NCCN Clinical Practice Guidelines in Oncology (NCCN Guidelines). Acute Myeloid Leukemia. 2021.
8. Cervantes L, Richardson S, Raghavan R, et al. Clinicians’ perspectives on providing emergency-only hemodialysis to undocumented immigrants: a qualitative study. Ann Intern Med. 2018;169(2):78-86. https://doi.org/10.7326/M18-0400
9. Cervantes L, Tong A, Camacho C, Collings A, Powe NR. Patient-reported outcomes and experiences in the transition of undocumented patients from emergency to scheduled hemodialysis. Kidney Int. 2021;99(1):198-207. https://doi.org/10.1016/j.kint.2020.07.024
10. Stein E, Xie J, Duchesneau E, et al. Cost effectiveness of midostaurin in the treatment of newly diagnosed FLT3-mutated acute myeloid leukemia in the United States. Pharmacoeconomics. 2019;37(2):239-253. https://doi.org/10.1007/s40273-018-0732-4
11. Preussler JM, Denzen EM, Majhail NS. Costs and cost-effectiveness of hematopoietic cell transplantation. Biol Blood Marrow Transplant. 2012;18(11):1620-1628. https://doi.org/10.1016/j.bbmt.2012.04.001
12. Edwards R, Ortega F. The Economic Contribution of Unauthorized Workers: An Industry Analysis. National Bureau of Economic Research. November 2016. Accessed July 12, 2021. https://www.nber.org/system/files/working_papers/w22834/w22834.pdf
13. Nunnery SE, Fintel AE, Jackson WC, Chandler JC, Ugwueke MO, Martin MG. Treatment disparities faced by undocumented workers from low- and middle-income countries in the United States with hematologic malignancies. J Natl Compr Canc Netw. 2016;14(4):483-486. https://doi.org/10.6004/jnccn.2016.0053
14. World Cancer Initiative. Cancer Preparedness in Latin America: The Need to Build on Recent Progress. 2019. Accessed July 7, 2021. https://worldcancerinitiative.economist.com/cancer-preparedness-latin-america
15. Taylor P, Lopez MH, Passel JS, Motel S; Pew Research Center. Unauthorized Immigrants: Length of Residency, Patterns of Parenthood. December 1, 2011. Accessed July 12, 2021. https://www.pewresearch.org/hispanic/2011/12/01/unauthorized-immigrants-length-of-residency-patterns-of-parenthood/
16. California Supreme Court, Records and Briefs: S019427, Dominguez vs. Superior Court of Alameda County. 1990.
17. Wallace SP, Torres J, Sadegh-Nobari T, Pourat N, Brown ER. Undocumented Immigrants and Health Care Reform. UCLA Center for Health Policy Research. August 31, 2012. Accessed July 7, 2021. https://healthpolicy.ucla.edu/publications/Documents/PDF/undocumentedreport-aug2013.pdf
18. Washington State Health Care Authority. Health care services and supports. Noncitizens. Accessed July 12, 2021. https://www.hca.wa.gov/health-care-services-supports/apple-health-medicaid-coverage/non-citizens
19. 117th Congress of the United States. H.R.1177, U.S. Citizenship Act of 2021.
20. National Institutes of Health. Surveillance, Epidemiology, and End Results (SEER) Program. Accessed July 7, 2021. https://seer.cancer.gov/
21. Migration Policy Institute. Profile of the unauthorized population: United States. Accessed July 12, 2021. https://www.migrationpolicy.org/data/unauthorized-immigrant-population/state/US. 2021.
22. Torres L. Latinx? Lat Stud. 2018;16:283-285. https://doi.org/10.1057/s41276-018-0142-y
Clinical Scenario
Juan, a 50-year-old man with acute myeloid leukemia (AML), sat on the edge of his bed, dejected. Juan’s leukemia had relapsed for a third time, and he was low on options and optimism. Originally from Mexico, he had made the journey to Colorado to work as a mechanic and care for his disabled son. Like millions of other individuals in the United States, he did not obtain a visa and had no affordable options for health insurance. For nearly a decade, that had seemed not to matter, until he became ill. Initially presenting to the emergency department with fatigue and night sweats, Juan was diagnosed with poor-risk AML and underwent emergent induction chemotherapy reimbursed under Emergency Medicaid (Table). Just when his bone marrow biopsy showed remission, however, Juan was told there was no chance to cure him, as his documentation status precluded him from receiving the next recommended therapy: stem cell transplant (SCT). Without transplant, Juan’s leukemia relapsed within a few months. He decided to undergo all the salvage chemotherapy that was offered, worrying about how his son would survive without his father.
Background and History
For the patient with a new cancer diagnosis, a difference in immigration status may be the difference between life and death. Undocumented immigrants are excluded from federally funded benefits, including those offered under Medicare, most Medicaid programs, and the Patient Protection and Affordable Care Act (Table).1 The nearly 11 million undocumented immigrants residing in the United States are integral to the workforce and economy. Although they pay taxes that fund Medicaid, contributing approximately $11.7 billion nationally in 2017, undocumented immigrants are ineligible to benefit from such programs.2 The inequity of this policy is highlighted by Juan, an undocumented immigrant presenting with a new diagnosis of AML.
The Emergency Medical Treatment and Active Labor Act (EMTALA) is a 1986 federal law which mandates that patients who present to the hospital with an emergency medical condition receive appropriate evaluation and stabilizing treatment. An emergency condition is defined as “manifesting itself by acute symptoms of sufficient severity … such that the absence of immediate medical attention could reasonably be expected to result in (A) placing the patient’s health in serious jeopardy; (B) serious impairment to bodily functions; or (C) serious dysfunction of any bodily organ or part” (Table).3,4 The Centers for Medicare & Medicaid manual restates the EMTALA definition and notes that services for an emergency medical condition cannot include care related to organ transplantation. Most state Emergency Medicaid programs have adopted the federal definition of what constitutes a medical emergency.5 As a result, undocumented individuals who qualify for Medicaid benefits but who do not meet citizenship requirements are eligible to “receive Medical Assistance benefits for emergency medical care only.”3
Similar to our patient Juan, individuals who initially present with an acute leukemia would be eligible for induction chemotherapy, as blast crisis is imminently fatal. Once in remission, however, standard-of-care therapy for patients without disqualifying comorbidities, depending on cytogenetic disease phenotypes, recommends the only current potential cure: allogeneic SCT, a treatment that was far from routine practice at the time EMTALA was enacted.6 When preparing for transplant, a patient is stable and no longer fits EMTALA’s “emergency” criteria, even though their health is still in “serious jeopardy,” as their cancer has been incompletely treated. Because most state Emergency Medicaid programs adopt the federal definition of an emergency medical condition, the cure is out of reach.
Policy in Clinical Practice
This policy requires clinicians to deviate from the usual standard of care and results in inferior outcomes. For AML patients in the poor-risk category, allogeneic SCT is recommended following induction chemotherapy.7 The risk of relapse is 30% to 40% if consolidation therapy includes SCT, vs 70% to 80% if treated with chemotherapeutic consolidation alone.6 AML patients in the intermediate-, and sometimes even favorable- risk categories, have been shown to benefit from allogeneic SCT as well, with risk of relapse half that of a patient who undergoes consolidation without transplant. Undocumented individuals with AML are therefore resigned to inadequate cancer treatment, including lifelong salvage chemotherapy, and have a substantially decreased chance of achieving sustained remission.6 Furthermore, providing inequitable care for undocumented patients with other medical conditions, such as end-stage kidney disease (ESKD), has been associated with inferior patient-reported outcomes, higher mortality and hospital costs, and clinician burnout. In many states, undocumented immigrants with ESKD rely on emergency dialysis (dialysis made available only after presenting critically ill to an emergency department). In 2019, Colorado’s Medicaid agency opted to include ESKD as a qualifying condition for Emergency Medicaid, thereby expanding access to scheduled dialysis. This led to improved patient quality of life, a decreased emotional toll on patients and clinicians, and reduced costs.8,9
Economic Considerations
Policy discussions must consider cost. The average cost of allogeneic SCT in the United States was approximately $226,000 in 2018, which is often compared to the cost of managing a patient with refractory disease who does not receive transplant.10 This study reported a cost of active disease without transplant, including chemotherapy and hospitalizations, of approximately $69,000, plus terminal care costs of nearly $89,000; at a total of $158,000, this comes out to $68,000 less than SCT.10 This cost savings, however, results in a patient’s death rather than an up to 85% chance of long-term, relapse-free survival.6
To more completely capture the relationship between the healthcare value and cost-effectiveness of SCT, a second study calculated the incremental cost-effectiveness ratio (ICER) of transplantation in acute leukemias in the first 100 days post transplant, including management of complications, such as hospitalization, acute graft-versus-host disease (GVHD), infection, and blood product transfusions. ICER represents the economic value of an intervention compared to an alternative, calculated as cost per quality-adjusted life years. The ICER of SCT compared to no transplant is $16,346 to $34,360, depending on type of transplant and conditioning regimen.11 An ICER of less than $50,000 is considered an acceptable expense for the value achieved—in this case, a significant opportunity for cure. This finding supports SCT, including management of complications, as an economically valuable intervention. Furthermore, if a sustained remission is achieved with SCT, this difference in expense buys the individual patient potentially decades of productivity to contribute back into society and the economy. According to the National Bureau of Economic Research, undocumented workers as a whole contribute $5 trillion to the US Gross Domestic Product over a 10-year period, or about $45,000 per worker per year.12 According to the costs cited, curing a single undocumented worker with acute leukemia via SCT and allowing them to return to work would lead to a return on investment in less than 2 years. If the goal is high-quality, high-value, equitable care, it is logical to spend the money upfront and allow all patients the best chance for recovery.
One might suggest that patients instead receive treatment in their country of origin. This proposition, however, is often unrealistic. Latin American countries, for example, lack access to many standard-of-care cancer treatments available domestically. In Mexico, SCT is only available at a single facility in Mexico City, which is unable to track outcomes.13 The mortality-to-incidence ratio for cancer, a marker of availability of effective treatment, for Latin America is 0.48, substantially inferior to that of the United States (0.29).14 Importantly, almost two thirds of undocumented immigrants in the United States have lived in the country for 10 or more years, and 43% are parents of minor children, an increasing proportion of whom are American citizens.15 This highlights the impracticality of these individuals returning to their country of origin for treatment.
Commentary and Recommendations
Medicaid laws in several states have made it possible for undocumented immigrants to receive access to standard-of-care therapies. Washington and California have included provisions that enable undocumented immigrants to receive allogeneic SCT if they are otherwise medically eligible. In the course of this policy change, legal arguments from the California Court of Appeals expressed that the language of the law was not intended to deny lifesaving treatment to an individual.16 California’s Emergency Medicaid policy is comparable to that of other states, but because the courts considered SCT a “continuation of medically necessary inpatient hospital services … directly related to the emergency” for which the patient initially presented, they concluded that it could be covered under California Medicaid. Despite covering SCT for undocumented immigrants, California maintains lower costs for those patients compared to US citizens on Medicaid while providing evidence-based cancer care.17 This exemplifies sustainable and equitable healthcare policy for the rest of the nation.
A proposed change in policy could occur at either the federal or state level. One option would be to follow the example set by the State of Washington. Under Emergency Medicaid, Washington modified qualifying conditions to include “emergency room care, inpatient admission, or outpatient surgery; a cancer treatment plan; dialysis treatment; anti-rejection medication for an organ transplant” and long-term care services.18 Federal policy reform for undocumented immigrants would also improve access to care. The US Citizenship Act of 2021, introduced to the House of Representatives in February 2021, offers a path to citizenship for undocumented immigrants, ultimately allowing for undocumented individuals to be eligible for the same programs as citizens, though after a period of up to 8 years.19 More immediate revisions of qualifying conditions under state Emergency Medicaid programs, coupled with a path to citizenship, would make significant progress towards reducing structural health inequities. Such policy change would also have broader implications. Three quarters of undocumented immigrants in the United States originate from Mexico, Central America, and South America, and the incidence rate of AML for Latinx individuals is 3.6 per 100,000, a figure which can be extrapolated to an estimated 380 cases per year in the US undocumented population.20-22 In addition to benefiting patients with acute leukemias, the proposed policy change would also benefit numerous others who are frequently hospitalized for acute decompensations of chronic conditions, including congestive heart failure, liver disease, ESKD, and chronic lung conditions. Enabling follow-up care for these diseases under Emergency Medicaid would likewise be expected to reduce costs and improve both quality of care and patient-centered and clinical outcomes.
What Should I Tell My Patient?
Hospitalists frequently care for undocumented immigrants with acute leukemias because the hospital can only be reimbursed by Emergency Medicaid when a patient is admitted to the hospital. Patients may ask about what they can expect in the course of their illness and, while details may be left to the oncologist, hospitalists will be faced with responding to many of these questions. Clinicians at our institution hold honest conversations with patients like Juan. We are compelled to provide the care that hospital and state policies allow, and can only offer the best care available to them because of the restrictions of an insurance system to which they contribute financially, yet cannot benefit from, in their time of need. We can tell our undocumented immigrant patients that we find this unacceptable and are actively advocating to change this policy.
Conclusion
The State of Colorado and the nation must amend its healthcare policy to include comprehensive cancer care for everyone. Offering standard-of-care therapy to all patients is not only ethical, but also an economically sound policy benefiting patients, clinicians, and the workforce.
1. Skopec L, Holahan J, Elmendorf C. Changes in Health Insurance Coverage in 2013-2016: Medicaid Expansion States Lead the Way. Urban Institute. September 11, 2018. Accessed July 12, 2021. https://www.urban.org/research/publication/changes-health-insurance-coverage-2013-2016-medicaid-expansion-states-lead-way
2. Christensen Gee L, Gardner M, Hill ME, Wiehe M. Undocumented Immigrants’ State & Local Tax Contributions. Institute on Taxation & Economic Policy. Updated March 2017. Accessed July 12, 2021. https://www.immigrationresearch.org/system/files/immigration_taxes_2017.pdf
3. Emergency Medical Treatment and Labor Act (EMTALA), Public Law 42 U.S.C. 1395dd. 2010.
4. Social Security Act. Sec. 1903 [42 U.S.C. 1396b]. Accessed July 12, 2021. https://www.ssa.gov/OP_Home/ssact/title19/1903.htm.
5. Cervantes L, Mundo W, Powe NR. The status of provision of standard outpatient dialysis for US undocumented immigrants with ESKD. Clin J Am Soc Nephrol. 2019;14(8):1258-1260. https://doi.org/10.2215/CJN.03460319
6. Cornelissen JJ, Blaise D. Hematopoietic stem cell transplantation for patients with AML in first complete remission. Blood. 2016;127(1):62-70. https://doi.org/10.1182/blood-2015-07-604546
7. NCCN Clinical Practice Guidelines in Oncology (NCCN Guidelines). Acute Myeloid Leukemia. 2021.
8. Cervantes L, Richardson S, Raghavan R, et al. Clinicians’ perspectives on providing emergency-only hemodialysis to undocumented immigrants: a qualitative study. Ann Intern Med. 2018;169(2):78-86. https://doi.org/10.7326/M18-0400
9. Cervantes L, Tong A, Camacho C, Collings A, Powe NR. Patient-reported outcomes and experiences in the transition of undocumented patients from emergency to scheduled hemodialysis. Kidney Int. 2021;99(1):198-207. https://doi.org/10.1016/j.kint.2020.07.024
10. Stein E, Xie J, Duchesneau E, et al. Cost effectiveness of midostaurin in the treatment of newly diagnosed FLT3-mutated acute myeloid leukemia in the United States. Pharmacoeconomics. 2019;37(2):239-253. https://doi.org/10.1007/s40273-018-0732-4
11. Preussler JM, Denzen EM, Majhail NS. Costs and cost-effectiveness of hematopoietic cell transplantation. Biol Blood Marrow Transplant. 2012;18(11):1620-1628. https://doi.org/10.1016/j.bbmt.2012.04.001
12. Edwards R, Ortega F. The Economic Contribution of Unauthorized Workers: An Industry Analysis. National Bureau of Economic Research. November 2016. Accessed July 12, 2021. https://www.nber.org/system/files/working_papers/w22834/w22834.pdf
13. Nunnery SE, Fintel AE, Jackson WC, Chandler JC, Ugwueke MO, Martin MG. Treatment disparities faced by undocumented workers from low- and middle-income countries in the United States with hematologic malignancies. J Natl Compr Canc Netw. 2016;14(4):483-486. https://doi.org/10.6004/jnccn.2016.0053
14. World Cancer Initiative. Cancer Preparedness in Latin America: The Need to Build on Recent Progress. 2019. Accessed July 7, 2021. https://worldcancerinitiative.economist.com/cancer-preparedness-latin-america
15. Taylor P, Lopez MH, Passel JS, Motel S; Pew Research Center. Unauthorized Immigrants: Length of Residency, Patterns of Parenthood. December 1, 2011. Accessed July 12, 2021. https://www.pewresearch.org/hispanic/2011/12/01/unauthorized-immigrants-length-of-residency-patterns-of-parenthood/
16. California Supreme Court, Records and Briefs: S019427, Dominguez vs. Superior Court of Alameda County. 1990.
17. Wallace SP, Torres J, Sadegh-Nobari T, Pourat N, Brown ER. Undocumented Immigrants and Health Care Reform. UCLA Center for Health Policy Research. August 31, 2012. Accessed July 7, 2021. https://healthpolicy.ucla.edu/publications/Documents/PDF/undocumentedreport-aug2013.pdf
18. Washington State Health Care Authority. Health care services and supports. Noncitizens. Accessed July 12, 2021. https://www.hca.wa.gov/health-care-services-supports/apple-health-medicaid-coverage/non-citizens
19. 117th Congress of the United States. H.R.1177, U.S. Citizenship Act of 2021.
20. National Institutes of Health. Surveillance, Epidemiology, and End Results (SEER) Program. Accessed July 7, 2021. https://seer.cancer.gov/
21. Migration Policy Institute. Profile of the unauthorized population: United States. Accessed July 12, 2021. https://www.migrationpolicy.org/data/unauthorized-immigrant-population/state/US. 2021.
22. Torres L. Latinx? Lat Stud. 2018;16:283-285. https://doi.org/10.1057/s41276-018-0142-y
© 2021 Society of Hospital Medicine
Advancing Diversity, Equity, and Inclusion in Hospital Medicine
Studies continue to demonstrate persistent gaps in equity for women and underrepresented minorities (URMs)1 throughout nearly all aspects of academic medicine, including rank,2-4 tenure,5 authorship,6,7 funding opportunities,8,9 awards,10 speakership,11 leadership,12,13 and salaries.2,14,15
In this article, we report DEI efforts within our division, focusing on the development of our strategic plan and specific outcomes related to compensation, recruitment, and policies.
METHODS
Our Division’s Framework to DEI—“It Takes a Village”
Our Division of Hospital Medicine (DHM), previously within the Division of General Internal Medicine, was founded in October 2017. The DHM at the University of Colorado Hospital (UCH) is composed of 100 faculty members (70 physicians and 30 advanced-practice providers; 58% women and 42% men). In 2018, we implemented a stepwise approach to critically assess DEI within our group and to build a strategic plan to address the issues.

As a new division, we sought stakeholder feedback from division members. All faculty within the division were invited to attend a meeting in which issues related to DEI were discussed. A literature review that spanned both medical and nonmedical fields was also completed. Search terms included salary equity, gender equity, diverse teams, diversity recruitment and retention, diversifying leadership, and diverse speakers. Salaries, internally funded time, and other processes, such as recruitment, promotion, and hiring for leadership positions, were evaluated during the first year we became a division.
TThrough this work, and with stakeholder engagement, we developed a divisional strategic plan to address DEI globally. Our strategic plan included developing a DEI director role to assist with overseeing DEI efforts. We have highlighted the various methods utilized for each component (Figure 1). This work occurred from October 2017 to December 2018.
Our institutional structures
Using best practices from both medical and nonmedical fields, we developed evidence-based approaches to
Compensation: transparent and consistent approaches based upon benchmarking with a framework of equal pay for equal work and similar advanced training/academic rank. In conjunction with efforts within the School of Medicine (SOM), Department of Medicine (DOM), and the UCH, our division sought to study salaries across DHM faculty members. We had an open call for faculty to participate in a newly developed DHM Compensation Committee, with the intent of rigorously examining our compensation practices and goals. Through faculty feedback and committee work, salary equity was defined as equal pay (ie, base salary for one clinical full-time equivalent [FTE]) for equal work based on academic rank and/or years of practice/advanced training. We also compared DHM salaries to regional academic hospital medicine groups and concluded that DHM salaries were lower than local and national benchmarks. This information was used to create a two-phase approach to increasing salaries for all individuals below the American Association of Medical Colleges (AAMC) benchmarks33 for academic hospitalists. We also developed a stipend system for external roles that came with additional compensation and roles within our own division that came with additional pay (ie, nocturnist). Phase 1 focused on those whose salaries were furthest away from and below benchmark, and phase 2 targeted all remaining individuals below benchmark.
A similar review of FTEs (based on required number of shifts for a full-time hospitalist) tied to our internal DHM leadership positions was completed by the division head and director of DEI. Specifically, the mission for each of our internally funded roles, job descriptions, and responsibilities was reviewed to ensure equity in funding.
Recruitment and advancement: processes to ensure equity and diversity in recruitment, tracking, and reporting, working to eliminate/mitigate bias. In collaboration with members of the AAMC Group on Women in Medicine and Science (GWIMS) and coauthors from various institutions, we developed toolkits and checklists aimed at achieving equity and diversity within candidate pools and on major committees, including, but not limited to, search and promotion committees.32 Additionally, a checklist was developed to help recruit more diverse speakers, including women and URMs, for local, regional, and national conferences.
Policies: evidence-based approaches, tracking and reporting, standardized approaches to eliminate/mitigate bias, embracing nontraditional paths. In partnership with our departmental efforts, members of our team led data collection and reporting for salary benchmarking, leadership roles, and committee membership. This included developing surveys and reporting templates that can be used to identify disparities and inform future efforts. We worked to ensure that we have faculty representing our field at the department and SOM levels. Specifically, we made sure to nominate division members during open calls for departmental and schoolwide committees, including the promotions committee.
Our People
The faculty and staff within our division have been instrumental in moving efforts forward in the following important areas.
Leadership: develop the position of director of DEI as well as leadership structures to support and increase DEI. One of the first steps in our strategic plan was creating a director of DEI leadership role (Appendix Figure 2). The director is responsible for researching, applying, and promoting a broad scope of DEI initiatives and best practices within the DHM, DOM, and SOM (in collaboration with their leaders), including recruitment, retention, and promotion of medical students, residents, and faculty; educational program development; health disparities research; and community-engaged scholarship.
Support: develop family leave policies/develop flexible work policies. Several members of our division worked on departmental committees and served in leadership roles on staff and faculty council. Estimated costs were assessed. Through collective efforts of department leadership and division head support, the department approved parental leave to employees following the birth of an employee’s child or the placement of a child with an employee in connection with adoption or permanent foster care.
Mentorship/sponsorship: enhance faculty advancement programs/develop pipeline and trainings/collaborate with student groups and organizations/invest in all of our people. Faculty across our divisional sites have held important roles in developing pipeline programs for undergraduate students bound for health professions, as well as programs developed specifically for medical students and internal medicine residents. This includes two programs, the CU Hospitalist Scholars Program (CUHSP) and Leadership Education for Aspiring Doctors (LEAD), in which undergraduate students have the opportunity to round with hospital medicine teams, work on quality-improvement projects, and receive extensive mentorship and advising from a diverse faculty team. Additionally, our faculty advancement team within the DHM has grown and been restructured to include more defined goals and to ensure each faculty member has at least one mentor in their area of interest.
Supportive: lactation space and support/diverse space options/inclusive and diverse environments. We worked closely with hospital leadership to advocate for adequately equipped lactation spaces, including equipment such as pumps, refrigerators, and computer workstations.
Measures
Our measures focused on (1) development and implementation of our DEI strategic plan, including new policies, processes, and practices related to key components of the DEI program; and (2) assessment of specific DEI programs, including pre-post salary data disparities based on rank and pre-post disparities for protected time for similar roles.
Analysis
Through rapid PDSA cycles, we evaluated salary equity, equity in leadership allotment, and committee membership. We have developed a tracking board to track progress of the multiple projects in the strategic plan.
RESULTS
Strategic Plan Development and Tracking
From October 2017 to December 2018, we developed a robust strategic plan and stepwise approach to DEI (Figure 1 and Figure 2). The director of DEI position was developed (see Appendix Figure 2 for job description) to help oversee these efforts. Figure 3 highlights the specific efforts and the progress made on implementation (ie, high-level dashboard or “tracking board”). While outcomes are still pending in the areas of recruitment and advancement and environment, we have made measurable improvements in compensation, as outlined in the following section.

Compensation
One year after the salary-equity interventions, all of our physician faculty’s salaries were at the goal benchmark (Table), and differences in salary for those in similar years of rank were nearly eliminated. Similarly, after implementing an internally consistent approach to assigning FTE for new and established positions within the division (ie, those that fall within the purview of the division), all faculty in similar types of roles had similar amounts of protected time.

Recruitment and Advancement
Toolkits32 and committee recommendations have been incorporated into division goals, though some aspects are still in implementation phases, as division-wide implicit bias training was delayed secondary to the COVID-19 pandemic. Key goals include: (1) implicit bias training for all members of major committees; (2) aiming for a goal of at least 40% representation of women and 40% URMs on committees; (3) having a diversity expert serve on each committee in order to identify and discuss any potential bias in the search and candidate-selection processes; and (4) careful tracking of diversity metrics in regard to diversity of candidates at each step of the interview and selection process.

Surveys and reporting templates for equity on committees and leadership positions have been developed and deployed. Data dashboards for our division have been developed as well (for compensation, leadership, and committee membership). A divisional dashboard to report recruitment efforts is in progress.
We have successfully nominated several faculty members to the SOM promotions committee and departmental committees during open calls for these positions. At the division level, we have also adapted internal policies to ensure promotion occurs on time and offers alternative pathways for faculty that may primarily focus on clinical pathways. All faculty who have gone up for promotion thus far have been successfully promoted in their desired pathway.
Environment
We successfully advocated and achieved adequately equipped lactation spaces, including equipment such as pumps, refrigerators, and computer workstations. This achievement was possible because of our hospital partners. Our efforts helped us acquire sufficient space and facilities such that nursing mothers can pump and still be able to answer phones, enter orders, and document visits.
Our team members conducted environmental scans and raised concerns when the environment was not inclusive, such as conference rooms with portraits of leadership that do not show diversity. The all-male pictures were removed from one frequently used departmental conference room, which will eventually house a diverse group of pictures and achievements.
We aim to eliminate bias by offering implicit bias training for our faculty. While this is presently required for those who serve on committees, in leadership positions, or those involved in recruitment and interviewing for the DOM, our goal is to eventually provide this training to all faculty and staff in the division. We have also incorporated DEI topics into our educational conferences for faculty, including sessions on recognizing bias in medicine, how to be an upstander/ally, and the impact of race and racism on medicine.
DISCUSSION
The important findings of this work are: (1) that successes in DEI can be achieved with strategic planning and stakeholder engagement; (2) through simple modification of processes, we can improve equity in compensation and FTE allotted to leadership; (3) though it takes time, diversity recruitment can be improved using sound, sustainable, evidence-based processes; (4) this work is time-intensive and challenging, requiring ongoing efforts to improve, modify, and enhance current efforts and future successes.
We have certainly made some progress with DEI initiatives within our division and have also learned a great deal from this experience. First, change is difficult for all parties involved, including those leading change and those affected by the changes. We purposely made an effort to facilitate discussions with all of the DHM faculty and staff to ensure that everyone felt included in this work and that everyone’s voice was heard. This was exemplified by inviting all faculty members to a feedback session in which we discussed DEI within our division and areas that we wanted to improve on. Early on, we were able to define what diversity, equity, and inclusion meant to us as a division and then use these definitions to develop tangible goals for all the areas of highest importance to the group.
By increasing faculty presence on key committees, such as the promotions committee, we now have faculty members who are well versed in promotions processes. We are fortunate to have a promotions process that supports faculty advancement for faculty with diverse interests that spans from supporting highly clinical faculty, clinician educators, as well as more traditional researchers.34 By having hospitalists serve in these roles, we help to add to the diverse perspectives on these committees, including emphasizing the scholarship that is associated with quality improvement, as well as DEI efforts which can often be viewed as service as opposed to scholarship.
Clear communication and transparency were key to all of our DEI initiatives. We had monthly updates on our DEI efforts during business meetings and also held impromptu meetings (also known as flash mobs35) to answer questions and discuss concerns in real time. As with all DEI work, it is important to know where you are starting (having accurate data and a clear understanding of the data) and be able to communicate that data to the group. For example, using AAMC salary benchmarking33 as well as other benchmarks allowed us to accurately calculate variance among salaries and identify the appropriate goal salary for each of our faculty members. Likewise, by completing an in-depth inventory on the work being done by all of our faculty in leadership roles, we were able to standardize the compensation/FTE for each of these roles. Tracking these changes over time, via the use of dashboards in our case, allows for real-time measurements and accountability for all of those involved. Our end goal will be to have all of these initiatives feed into one large dashboard.
Collaborating with leadership and stakeholders in the DOM, SOM, and hospital helped to make our DEI initiatives successful. Much too often, we work in silos when it comes to DEI work. However, we tend to have similar goals and can achieve much more if we work together. Collaboration with multiple stakeholders allowed for wider dissemination and resulted in a larger impact to the campus and community at large. This has been exemplified by the committee composition guidance that has been utilized by the DOM, as well as implementation of campus-wide policies, specifically the parental leave policy, which our faculty members played an important role in creating. Likewise, it is important to look outside of our institutions and work with other hospital medicine groups around the country who are interested in promoting DEI.
We still have much work ahead of us. We are continuing to measure outcomes status postimplementation of the toolkit and checklists being used for diversity recruitment and committee composition. Additionally, we are actively working on several initiatives, including:
- Instituting implicit bias training for all of our faculty
- Partnering with national leaders and our hospital systems to develop zero-tolerance policies regarding abusive behaviors (verbal, physical, and other), racism, and sexism in the hospital and other work settings
- Development of specific recruitment strategies as a means of diversifying our healthcare workforce (of note, based on a 2020 survey of our faculty, in which there was a 70% response rate, 8.5% of our faculty identified as URMs)
- Completion of a diversity dashboard to track our progress in all of these efforts over time
- Development of a more robust pipeline to promotion and leadership for our URM faculty
This study has several strengths. Many of the plans and strategies described here can be used to guide others interested in implementing this work. Figure 2 provides a stepwise
approach to addressing DEI in hospital medicine groups and divisions. We conducted this work at a large academic medical center, and while it may not be generalizable, it does offer some ideas for others to consider in their own work to advance DEI at their institutions. There are also several limitations to this work. Eliminating salary inequities with our approach did take resources. We took advantage of already lower salaries and the need to increase salaries closer to benchmark and paired this effort with our DEI efforts to achieve salary equity. This required partnerships with the department and hospital. Efforts to advance DEI also take a lot of time and effort, and thus commitment from the division, department, and institution as a whole is key. While we have outcomes for our efforts related to salary equity, recruitment efforts should be realized over time, as currently it is too early to tell. We have highlighted the efforts that have been put in place at this time.
CONCLUSION
Using a systematic evidence-based approach with key stakeholder involvement, a division-wide DEI strategy was developed and implemented. While this work is still ongoing, short-term wins are possible, in particular around salary equity and development of policies and structures to promote DEI.
1. Underrepresented racial and ethnic groups. National Institutes of Health website. Accessed December 26, 2020. https://extramural-diversity.nih.gov/diversity-matters/underrepresented-groups
2. Ash AS, Carr PL, Goldstein R, Friedman RH. Compensation and advancement of women in academic medicine: is there equity? Ann Intern Med. 2004;141(3):205-212. https://doi.org/10.7326/0003-4819-141-3-200408030-00009
3. Jena AB, Khullar D, Ho O, Olenski AR, Blumenthal DM. Sex differences in academic rank in US medical schools in 2014. JAMA. 2015;314(11):1149-1158. https://doi.org/10.1001/jama.2015.10680
4. Fang D, Moy E, Colburn L, Hurley J. Racial and ethnic disparities in faculty promotion in academic medicine. JAMA. 2000;284(9):1085-1092. https://doi.org/10.1001/jama.284.9.1085
5. Baptiste D, Fecher AM, Dolejs SC, et al. Gender differences in academic surgery, work-life balance, and satisfaction. J Surg Res. 2017;218:99-107. https://doi.org/10.1016/j.jss.2017.05.075
6. Hart KL, Perlis RH. Trends in proportion of women as authors of medical journal articles, 2008-2018. JAMA Intern Med. 2019;179:1285-1287. https://doi.org/10.1001/jamainternmed.2019.0907
7. Thomas EG, Jayabalasingham B, Collins T, Geertzen J, Bui C, Dominici F. Gender disparities in invited commentary authorship in 2459 medical journals. JAMA Netw Open. 2019;2(10):e1913682. https://doi.org/10.1001/jamanetworkopen.2019.13682
8. Hechtman LA, Moore NP, Schulkey CE, et al. NIH funding longevity by gender. Proc Natl Acad Sci U S A. 2018;115(31):7943-7948. https://doi.org/10.1073/pnas.1800615115
9. Sege R, Nykiel-Bub L, Selk S. Sex differences in institutional support for junior biomedical researchers. JAMA. 2015;314(11):1175-1177. https://doi.org/10.1001/jama.2015.8517
10. Silver JK, Slocum CS, Bank AM, et al. Where are the women? The underrepresentation of women physicians among recognition award recipients from medical specialty societies. PM R. 2017;9(8):804-815. https://doi.org/10.1016/j.pmrj.2017.06.001
11. Ruzycki SM, Fletcher S, Earp M, Bharwani A, Lithgow KC. Trends in the proportion of female speakers at medical conferences in the United States and in Canada, 2007 to 2017. JAMA Netw Open. 2019;2(4):e192103. https://doi.org/10.1001/jamanetworkopen.2019.2103
12. Carr PL, Raj A, Kaplan SE, Terrin N, Breeze JL, Freund KM. Gender differences in academic medicine: retention, rank, and leadership comparisons from the National Faculty Survey. Acad Med. 2018;93(11):1694-1699. https://doi.org/10.1097/ACM.0000000000002146
13. Carr PL, Gunn C, Raj A, Kaplan S, Freund KM. Recruitment, promotion, and retention of women in academic medicine: how institutions are addressing gender disparities. Womens Health Issues. 2017;27(3):374-381. https://doi.org/10.1016/j.whi.2016.11.003
14. Jena AB, Olenski AR, Blumenthal DM. Sex differences in physician salary in US public medical schools. JAMA Intern Med. 2016;176(9):1294-1304. https://doi.org/10.1001/jamainternmed.2016.3284
15. Lo Sasso AT, Richards MR, Chou CF, Gerber SE. The $16,819 pay gap for newly trained physicians: the unexplained trend of men earning more than women. Health Aff (Millwood). 2011;30(2):193-201. https://doi.org/10.1377/hlthaff.2010.0597
16. Wachter RM, Goldman L. The emerging role of “hospitalists” in the American health care system. N Engl J Med. 1996;335(7):514-517. https://doi.org/10.1056/NEJM199608153350713
17. Weaver AC, Wetterneck TB, Whelan CT, Hinami K. A matter of priorities? Exploring the persistent gender pay gap in hospital medicine. J Hosp Med. 2015;10(8):486-490. https://doi.org/10.1002/jhm.2400
18. Burden M, Frank MG, Keniston A, et al. Gender disparities in leadership and scholarly productivity of academic hospitalists. J Hosp Med. 2015;10(8):481-485. https://doi.org/10.1002/jhm.2340
19. Northcutt N, Papp S, Keniston A, et al, Society of Hospital Medicine Diversity, Equity and Inclusion Special Interest Group. SPEAKers at the National Society of Hospital Medicine Meeting: a follow-up study of gender equity for conference speakers from 2015 to 2019. The SPEAK UP Study. J Hosp Med. 2020;15(4):228-231. https://doi.org/10.12788/jhm.3401
20. Shah SS, Shaughnessy EE, Spector ND. Leading by example: how medical journals can improve representation in academic medicine. J Hosp Med. 2019;14(7):393. https://doi.org/10.12788/jhm.3247
21. Shah SS, Shaughnessy EE, Spector ND. Promoting gender equity at the Journal of Hospital Medicine [editorial]. J Hosp Med. 2020;15(9):517. https://doi.org/10.12788/jhm.3522
22. Sheehy AM, Kolehmainen C, Carnes M. We specialize in change leadership: a call for hospitalists to lead the quest for workforce gender equity [editorial]. J Hosp Med. 2015;10(8):551-552. https://doi.org/10.1002/jhm.2399
23. Evans MK, Rosenbaum L, Malina D, Morrissey S, Rubin EJ. Diagnosing and treating systemic racism [editorial]. N Engl J Med. 2020;383(3):274-276. https://doi.org/10.1056/NEJMe2021693
24. Rock D, Grant H. Why diverse teams are smarter. Harvard Business Review. Published November 4, 2016. Accessed July 24, 2019. https://hbr.org/2016/11/why-diverse-teams-are-smarter
25. Johnson RL, Saha S, Arbelaez JJ, Beach MC, Cooper LA. Racial and ethnic differences in patient perceptions of bias and cultural competence in health care. J Gen Intern Med. 2004;19(2):101-110. https://doi.org/10.1111/j.1525-1497.2004.30262.x
26. Betancourt JR, Green AR, Carrillo JE, Park ER. Cultural competence and health care disparities: key perspectives and trends. Health Aff (Millwood). 2005;24(2):499-505. https://doi.org/10.1377/hlthaff.24.2.499
27. Acosta D, Ackerman-Barger K. Breaking the silence: time to talk about race and racism [comment]. Acad Med. 2017;92(3):285-288. https://doi.org/10.1097/ACM.0000000000001416
28. Cohen JJ, Gabriel BA, Terrell C. The case for diversity in the health care workforce. Health Aff (Millwood). 2002;21(5):90-102. https://doi.org/10.1377/hlthaff.21.5.90
29. Chang E, Simon M, Dong X. Integrating cultural humility into health care professional education and training. Adv Health Sci Educ Theory Pract. 2012;17(2):269-278. https://doi.org/10.1007/s10459-010-9264-1
30. Foronda C, Baptiste DL, Reinholdt MM, Ousman K. Cultural humility: a concept analysis. J Transcult Nurs. 2016;27(3):210-217. https://doi.org/10.1177/1043659615592677
31. Butkus R, Serchen J, Moyer DV, et al; Health and Public Policy Committee of the American College of Physicians. Achieving gender equity in physician compensation and career advancement: a position paper of the American College of Physicians. Ann Intern Med. 2018;168(10):721-723. https://doi.org/10.7326/M17-3438
32. Burden M, del Pino-Jones A, Shafer M, Sheth S, Rexrode K. GWIMS Equity Recruitment Toolkit. Accessed July 27, 2019. https://www.aamc.org/download/492864/data/equityinrecruitmenttoolkit.pdf
33. AAMC Faculty Salary Report. AAMC website. Accessed September 6, 2020. https://www.aamc.org/data-reports/workforce/report/aamc-faculty-salary-report
34. Promotion process. University of Colorado Anschutz Medical Campus website. Accessed September 7, 2020. https://medschool.cuanschutz.edu/faculty-affairs/for-faculty/promotion-and-tenure/promotion-process
35. Pierce RG, Diaz M, Kneeland P. Optimizing well-being, practice culture, and professional thriving in an era of turbulence. J Hosp Med. 2019;14(2):126-128. https://doi.org/10.12788/jhm.3101
Studies continue to demonstrate persistent gaps in equity for women and underrepresented minorities (URMs)1 throughout nearly all aspects of academic medicine, including rank,2-4 tenure,5 authorship,6,7 funding opportunities,8,9 awards,10 speakership,11 leadership,12,13 and salaries.2,14,15
In this article, we report DEI efforts within our division, focusing on the development of our strategic plan and specific outcomes related to compensation, recruitment, and policies.
METHODS
Our Division’s Framework to DEI—“It Takes a Village”
Our Division of Hospital Medicine (DHM), previously within the Division of General Internal Medicine, was founded in October 2017. The DHM at the University of Colorado Hospital (UCH) is composed of 100 faculty members (70 physicians and 30 advanced-practice providers; 58% women and 42% men). In 2018, we implemented a stepwise approach to critically assess DEI within our group and to build a strategic plan to address the issues.
As a new division, we sought stakeholder feedback from division members. All faculty within the division were invited to attend a meeting in which issues related to DEI were discussed. A literature review that spanned both medical and nonmedical fields was also completed. Search terms included salary equity, gender equity, diverse teams, diversity recruitment and retention, diversifying leadership, and diverse speakers. Salaries, internally funded time, and other processes, such as recruitment, promotion, and hiring for leadership positions, were evaluated during the first year we became a division.
TThrough this work, and with stakeholder engagement, we developed a divisional strategic plan to address DEI globally. Our strategic plan included developing a DEI director role to assist with overseeing DEI efforts. We have highlighted the various methods utilized for each component (Figure 1). This work occurred from October 2017 to December 2018.
Our institutional structures
Using best practices from both medical and nonmedical fields, we developed evidence-based approaches to
Compensation: transparent and consistent approaches based upon benchmarking with a framework of equal pay for equal work and similar advanced training/academic rank. In conjunction with efforts within the School of Medicine (SOM), Department of Medicine (DOM), and the UCH, our division sought to study salaries across DHM faculty members. We had an open call for faculty to participate in a newly developed DHM Compensation Committee, with the intent of rigorously examining our compensation practices and goals. Through faculty feedback and committee work, salary equity was defined as equal pay (ie, base salary for one clinical full-time equivalent [FTE]) for equal work based on academic rank and/or years of practice/advanced training. We also compared DHM salaries to regional academic hospital medicine groups and concluded that DHM salaries were lower than local and national benchmarks. This information was used to create a two-phase approach to increasing salaries for all individuals below the American Association of Medical Colleges (AAMC) benchmarks33 for academic hospitalists. We also developed a stipend system for external roles that came with additional compensation and roles within our own division that came with additional pay (ie, nocturnist). Phase 1 focused on those whose salaries were furthest away from and below benchmark, and phase 2 targeted all remaining individuals below benchmark.
A similar review of FTEs (based on required number of shifts for a full-time hospitalist) tied to our internal DHM leadership positions was completed by the division head and director of DEI. Specifically, the mission for each of our internally funded roles, job descriptions, and responsibilities was reviewed to ensure equity in funding.
Recruitment and advancement: processes to ensure equity and diversity in recruitment, tracking, and reporting, working to eliminate/mitigate bias. In collaboration with members of the AAMC Group on Women in Medicine and Science (GWIMS) and coauthors from various institutions, we developed toolkits and checklists aimed at achieving equity and diversity within candidate pools and on major committees, including, but not limited to, search and promotion committees.32 Additionally, a checklist was developed to help recruit more diverse speakers, including women and URMs, for local, regional, and national conferences.
Policies: evidence-based approaches, tracking and reporting, standardized approaches to eliminate/mitigate bias, embracing nontraditional paths. In partnership with our departmental efforts, members of our team led data collection and reporting for salary benchmarking, leadership roles, and committee membership. This included developing surveys and reporting templates that can be used to identify disparities and inform future efforts. We worked to ensure that we have faculty representing our field at the department and SOM levels. Specifically, we made sure to nominate division members during open calls for departmental and schoolwide committees, including the promotions committee.
Our People
The faculty and staff within our division have been instrumental in moving efforts forward in the following important areas.
Leadership: develop the position of director of DEI as well as leadership structures to support and increase DEI. One of the first steps in our strategic plan was creating a director of DEI leadership role (Appendix Figure 2). The director is responsible for researching, applying, and promoting a broad scope of DEI initiatives and best practices within the DHM, DOM, and SOM (in collaboration with their leaders), including recruitment, retention, and promotion of medical students, residents, and faculty; educational program development; health disparities research; and community-engaged scholarship.
Support: develop family leave policies/develop flexible work policies. Several members of our division worked on departmental committees and served in leadership roles on staff and faculty council. Estimated costs were assessed. Through collective efforts of department leadership and division head support, the department approved parental leave to employees following the birth of an employee’s child or the placement of a child with an employee in connection with adoption or permanent foster care.
Mentorship/sponsorship: enhance faculty advancement programs/develop pipeline and trainings/collaborate with student groups and organizations/invest in all of our people. Faculty across our divisional sites have held important roles in developing pipeline programs for undergraduate students bound for health professions, as well as programs developed specifically for medical students and internal medicine residents. This includes two programs, the CU Hospitalist Scholars Program (CUHSP) and Leadership Education for Aspiring Doctors (LEAD), in which undergraduate students have the opportunity to round with hospital medicine teams, work on quality-improvement projects, and receive extensive mentorship and advising from a diverse faculty team. Additionally, our faculty advancement team within the DHM has grown and been restructured to include more defined goals and to ensure each faculty member has at least one mentor in their area of interest.
Supportive: lactation space and support/diverse space options/inclusive and diverse environments. We worked closely with hospital leadership to advocate for adequately equipped lactation spaces, including equipment such as pumps, refrigerators, and computer workstations.
Measures
Our measures focused on (1) development and implementation of our DEI strategic plan, including new policies, processes, and practices related to key components of the DEI program; and (2) assessment of specific DEI programs, including pre-post salary data disparities based on rank and pre-post disparities for protected time for similar roles.
Analysis
Through rapid PDSA cycles, we evaluated salary equity, equity in leadership allotment, and committee membership. We have developed a tracking board to track progress of the multiple projects in the strategic plan.
RESULTS
Strategic Plan Development and Tracking
From October 2017 to December 2018, we developed a robust strategic plan and stepwise approach to DEI (Figure 1 and Figure 2). The director of DEI position was developed (see Appendix Figure 2 for job description) to help oversee these efforts. Figure 3 highlights the specific efforts and the progress made on implementation (ie, high-level dashboard or “tracking board”). While outcomes are still pending in the areas of recruitment and advancement and environment, we have made measurable improvements in compensation, as outlined in the following section.
Compensation
One year after the salary-equity interventions, all of our physician faculty’s salaries were at the goal benchmark (Table), and differences in salary for those in similar years of rank were nearly eliminated. Similarly, after implementing an internally consistent approach to assigning FTE for new and established positions within the division (ie, those that fall within the purview of the division), all faculty in similar types of roles had similar amounts of protected time.
Recruitment and Advancement
Toolkits32 and committee recommendations have been incorporated into division goals, though some aspects are still in implementation phases, as division-wide implicit bias training was delayed secondary to the COVID-19 pandemic. Key goals include: (1) implicit bias training for all members of major committees; (2) aiming for a goal of at least 40% representation of women and 40% URMs on committees; (3) having a diversity expert serve on each committee in order to identify and discuss any potential bias in the search and candidate-selection processes; and (4) careful tracking of diversity metrics in regard to diversity of candidates at each step of the interview and selection process.
Surveys and reporting templates for equity on committees and leadership positions have been developed and deployed. Data dashboards for our division have been developed as well (for compensation, leadership, and committee membership). A divisional dashboard to report recruitment efforts is in progress.
We have successfully nominated several faculty members to the SOM promotions committee and departmental committees during open calls for these positions. At the division level, we have also adapted internal policies to ensure promotion occurs on time and offers alternative pathways for faculty that may primarily focus on clinical pathways. All faculty who have gone up for promotion thus far have been successfully promoted in their desired pathway.
Environment
We successfully advocated and achieved adequately equipped lactation spaces, including equipment such as pumps, refrigerators, and computer workstations. This achievement was possible because of our hospital partners. Our efforts helped us acquire sufficient space and facilities such that nursing mothers can pump and still be able to answer phones, enter orders, and document visits.
Our team members conducted environmental scans and raised concerns when the environment was not inclusive, such as conference rooms with portraits of leadership that do not show diversity. The all-male pictures were removed from one frequently used departmental conference room, which will eventually house a diverse group of pictures and achievements.
We aim to eliminate bias by offering implicit bias training for our faculty. While this is presently required for those who serve on committees, in leadership positions, or those involved in recruitment and interviewing for the DOM, our goal is to eventually provide this training to all faculty and staff in the division. We have also incorporated DEI topics into our educational conferences for faculty, including sessions on recognizing bias in medicine, how to be an upstander/ally, and the impact of race and racism on medicine.
DISCUSSION
The important findings of this work are: (1) that successes in DEI can be achieved with strategic planning and stakeholder engagement; (2) through simple modification of processes, we can improve equity in compensation and FTE allotted to leadership; (3) though it takes time, diversity recruitment can be improved using sound, sustainable, evidence-based processes; (4) this work is time-intensive and challenging, requiring ongoing efforts to improve, modify, and enhance current efforts and future successes.
We have certainly made some progress with DEI initiatives within our division and have also learned a great deal from this experience. First, change is difficult for all parties involved, including those leading change and those affected by the changes. We purposely made an effort to facilitate discussions with all of the DHM faculty and staff to ensure that everyone felt included in this work and that everyone’s voice was heard. This was exemplified by inviting all faculty members to a feedback session in which we discussed DEI within our division and areas that we wanted to improve on. Early on, we were able to define what diversity, equity, and inclusion meant to us as a division and then use these definitions to develop tangible goals for all the areas of highest importance to the group.
By increasing faculty presence on key committees, such as the promotions committee, we now have faculty members who are well versed in promotions processes. We are fortunate to have a promotions process that supports faculty advancement for faculty with diverse interests that spans from supporting highly clinical faculty, clinician educators, as well as more traditional researchers.34 By having hospitalists serve in these roles, we help to add to the diverse perspectives on these committees, including emphasizing the scholarship that is associated with quality improvement, as well as DEI efforts which can often be viewed as service as opposed to scholarship.
Clear communication and transparency were key to all of our DEI initiatives. We had monthly updates on our DEI efforts during business meetings and also held impromptu meetings (also known as flash mobs35) to answer questions and discuss concerns in real time. As with all DEI work, it is important to know where you are starting (having accurate data and a clear understanding of the data) and be able to communicate that data to the group. For example, using AAMC salary benchmarking33 as well as other benchmarks allowed us to accurately calculate variance among salaries and identify the appropriate goal salary for each of our faculty members. Likewise, by completing an in-depth inventory on the work being done by all of our faculty in leadership roles, we were able to standardize the compensation/FTE for each of these roles. Tracking these changes over time, via the use of dashboards in our case, allows for real-time measurements and accountability for all of those involved. Our end goal will be to have all of these initiatives feed into one large dashboard.
Collaborating with leadership and stakeholders in the DOM, SOM, and hospital helped to make our DEI initiatives successful. Much too often, we work in silos when it comes to DEI work. However, we tend to have similar goals and can achieve much more if we work together. Collaboration with multiple stakeholders allowed for wider dissemination and resulted in a larger impact to the campus and community at large. This has been exemplified by the committee composition guidance that has been utilized by the DOM, as well as implementation of campus-wide policies, specifically the parental leave policy, which our faculty members played an important role in creating. Likewise, it is important to look outside of our institutions and work with other hospital medicine groups around the country who are interested in promoting DEI.
We still have much work ahead of us. We are continuing to measure outcomes status postimplementation of the toolkit and checklists being used for diversity recruitment and committee composition. Additionally, we are actively working on several initiatives, including:
- Instituting implicit bias training for all of our faculty
- Partnering with national leaders and our hospital systems to develop zero-tolerance policies regarding abusive behaviors (verbal, physical, and other), racism, and sexism in the hospital and other work settings
- Development of specific recruitment strategies as a means of diversifying our healthcare workforce (of note, based on a 2020 survey of our faculty, in which there was a 70% response rate, 8.5% of our faculty identified as URMs)
- Completion of a diversity dashboard to track our progress in all of these efforts over time
- Development of a more robust pipeline to promotion and leadership for our URM faculty
This study has several strengths. Many of the plans and strategies described here can be used to guide others interested in implementing this work. Figure 2 provides a stepwise
approach to addressing DEI in hospital medicine groups and divisions. We conducted this work at a large academic medical center, and while it may not be generalizable, it does offer some ideas for others to consider in their own work to advance DEI at their institutions. There are also several limitations to this work. Eliminating salary inequities with our approach did take resources. We took advantage of already lower salaries and the need to increase salaries closer to benchmark and paired this effort with our DEI efforts to achieve salary equity. This required partnerships with the department and hospital. Efforts to advance DEI also take a lot of time and effort, and thus commitment from the division, department, and institution as a whole is key. While we have outcomes for our efforts related to salary equity, recruitment efforts should be realized over time, as currently it is too early to tell. We have highlighted the efforts that have been put in place at this time.
CONCLUSION
Using a systematic evidence-based approach with key stakeholder involvement, a division-wide DEI strategy was developed and implemented. While this work is still ongoing, short-term wins are possible, in particular around salary equity and development of policies and structures to promote DEI.
1. Underrepresented racial and ethnic groups. National Institutes of Health website. Accessed December 26, 2020. https://extramural-diversity.nih.gov/diversity-matters/underrepresented-groups
2. Ash AS, Carr PL, Goldstein R, Friedman RH. Compensation and advancement of women in academic medicine: is there equity? Ann Intern Med. 2004;141(3):205-212. https://doi.org/10.7326/0003-4819-141-3-200408030-00009
3. Jena AB, Khullar D, Ho O, Olenski AR, Blumenthal DM. Sex differences in academic rank in US medical schools in 2014. JAMA. 2015;314(11):1149-1158. https://doi.org/10.1001/jama.2015.10680
4. Fang D, Moy E, Colburn L, Hurley J. Racial and ethnic disparities in faculty promotion in academic medicine. JAMA. 2000;284(9):1085-1092. https://doi.org/10.1001/jama.284.9.1085
5. Baptiste D, Fecher AM, Dolejs SC, et al. Gender differences in academic surgery, work-life balance, and satisfaction. J Surg Res. 2017;218:99-107. https://doi.org/10.1016/j.jss.2017.05.075
6. Hart KL, Perlis RH. Trends in proportion of women as authors of medical journal articles, 2008-2018. JAMA Intern Med. 2019;179:1285-1287. https://doi.org/10.1001/jamainternmed.2019.0907
7. Thomas EG, Jayabalasingham B, Collins T, Geertzen J, Bui C, Dominici F. Gender disparities in invited commentary authorship in 2459 medical journals. JAMA Netw Open. 2019;2(10):e1913682. https://doi.org/10.1001/jamanetworkopen.2019.13682
8. Hechtman LA, Moore NP, Schulkey CE, et al. NIH funding longevity by gender. Proc Natl Acad Sci U S A. 2018;115(31):7943-7948. https://doi.org/10.1073/pnas.1800615115
9. Sege R, Nykiel-Bub L, Selk S. Sex differences in institutional support for junior biomedical researchers. JAMA. 2015;314(11):1175-1177. https://doi.org/10.1001/jama.2015.8517
10. Silver JK, Slocum CS, Bank AM, et al. Where are the women? The underrepresentation of women physicians among recognition award recipients from medical specialty societies. PM R. 2017;9(8):804-815. https://doi.org/10.1016/j.pmrj.2017.06.001
11. Ruzycki SM, Fletcher S, Earp M, Bharwani A, Lithgow KC. Trends in the proportion of female speakers at medical conferences in the United States and in Canada, 2007 to 2017. JAMA Netw Open. 2019;2(4):e192103. https://doi.org/10.1001/jamanetworkopen.2019.2103
12. Carr PL, Raj A, Kaplan SE, Terrin N, Breeze JL, Freund KM. Gender differences in academic medicine: retention, rank, and leadership comparisons from the National Faculty Survey. Acad Med. 2018;93(11):1694-1699. https://doi.org/10.1097/ACM.0000000000002146
13. Carr PL, Gunn C, Raj A, Kaplan S, Freund KM. Recruitment, promotion, and retention of women in academic medicine: how institutions are addressing gender disparities. Womens Health Issues. 2017;27(3):374-381. https://doi.org/10.1016/j.whi.2016.11.003
14. Jena AB, Olenski AR, Blumenthal DM. Sex differences in physician salary in US public medical schools. JAMA Intern Med. 2016;176(9):1294-1304. https://doi.org/10.1001/jamainternmed.2016.3284
15. Lo Sasso AT, Richards MR, Chou CF, Gerber SE. The $16,819 pay gap for newly trained physicians: the unexplained trend of men earning more than women. Health Aff (Millwood). 2011;30(2):193-201. https://doi.org/10.1377/hlthaff.2010.0597
16. Wachter RM, Goldman L. The emerging role of “hospitalists” in the American health care system. N Engl J Med. 1996;335(7):514-517. https://doi.org/10.1056/NEJM199608153350713
17. Weaver AC, Wetterneck TB, Whelan CT, Hinami K. A matter of priorities? Exploring the persistent gender pay gap in hospital medicine. J Hosp Med. 2015;10(8):486-490. https://doi.org/10.1002/jhm.2400
18. Burden M, Frank MG, Keniston A, et al. Gender disparities in leadership and scholarly productivity of academic hospitalists. J Hosp Med. 2015;10(8):481-485. https://doi.org/10.1002/jhm.2340
19. Northcutt N, Papp S, Keniston A, et al, Society of Hospital Medicine Diversity, Equity and Inclusion Special Interest Group. SPEAKers at the National Society of Hospital Medicine Meeting: a follow-up study of gender equity for conference speakers from 2015 to 2019. The SPEAK UP Study. J Hosp Med. 2020;15(4):228-231. https://doi.org/10.12788/jhm.3401
20. Shah SS, Shaughnessy EE, Spector ND. Leading by example: how medical journals can improve representation in academic medicine. J Hosp Med. 2019;14(7):393. https://doi.org/10.12788/jhm.3247
21. Shah SS, Shaughnessy EE, Spector ND. Promoting gender equity at the Journal of Hospital Medicine [editorial]. J Hosp Med. 2020;15(9):517. https://doi.org/10.12788/jhm.3522
22. Sheehy AM, Kolehmainen C, Carnes M. We specialize in change leadership: a call for hospitalists to lead the quest for workforce gender equity [editorial]. J Hosp Med. 2015;10(8):551-552. https://doi.org/10.1002/jhm.2399
23. Evans MK, Rosenbaum L, Malina D, Morrissey S, Rubin EJ. Diagnosing and treating systemic racism [editorial]. N Engl J Med. 2020;383(3):274-276. https://doi.org/10.1056/NEJMe2021693
24. Rock D, Grant H. Why diverse teams are smarter. Harvard Business Review. Published November 4, 2016. Accessed July 24, 2019. https://hbr.org/2016/11/why-diverse-teams-are-smarter
25. Johnson RL, Saha S, Arbelaez JJ, Beach MC, Cooper LA. Racial and ethnic differences in patient perceptions of bias and cultural competence in health care. J Gen Intern Med. 2004;19(2):101-110. https://doi.org/10.1111/j.1525-1497.2004.30262.x
26. Betancourt JR, Green AR, Carrillo JE, Park ER. Cultural competence and health care disparities: key perspectives and trends. Health Aff (Millwood). 2005;24(2):499-505. https://doi.org/10.1377/hlthaff.24.2.499
27. Acosta D, Ackerman-Barger K. Breaking the silence: time to talk about race and racism [comment]. Acad Med. 2017;92(3):285-288. https://doi.org/10.1097/ACM.0000000000001416
28. Cohen JJ, Gabriel BA, Terrell C. The case for diversity in the health care workforce. Health Aff (Millwood). 2002;21(5):90-102. https://doi.org/10.1377/hlthaff.21.5.90
29. Chang E, Simon M, Dong X. Integrating cultural humility into health care professional education and training. Adv Health Sci Educ Theory Pract. 2012;17(2):269-278. https://doi.org/10.1007/s10459-010-9264-1
30. Foronda C, Baptiste DL, Reinholdt MM, Ousman K. Cultural humility: a concept analysis. J Transcult Nurs. 2016;27(3):210-217. https://doi.org/10.1177/1043659615592677
31. Butkus R, Serchen J, Moyer DV, et al; Health and Public Policy Committee of the American College of Physicians. Achieving gender equity in physician compensation and career advancement: a position paper of the American College of Physicians. Ann Intern Med. 2018;168(10):721-723. https://doi.org/10.7326/M17-3438
32. Burden M, del Pino-Jones A, Shafer M, Sheth S, Rexrode K. GWIMS Equity Recruitment Toolkit. Accessed July 27, 2019. https://www.aamc.org/download/492864/data/equityinrecruitmenttoolkit.pdf
33. AAMC Faculty Salary Report. AAMC website. Accessed September 6, 2020. https://www.aamc.org/data-reports/workforce/report/aamc-faculty-salary-report
34. Promotion process. University of Colorado Anschutz Medical Campus website. Accessed September 7, 2020. https://medschool.cuanschutz.edu/faculty-affairs/for-faculty/promotion-and-tenure/promotion-process
35. Pierce RG, Diaz M, Kneeland P. Optimizing well-being, practice culture, and professional thriving in an era of turbulence. J Hosp Med. 2019;14(2):126-128. https://doi.org/10.12788/jhm.3101
© 2021 Society of Hospital Medicine
Dialysis in the Undocumented: Driving Policy Change with Data
Hilda and I shared childhood stories while we enjoyed one of her favorite Mexican dishes, grilled nopalitos (cactus). Hilda loved nopalitos, but she rarely ate them because they are high in potassium. Hilda had end-stage kidney disease (ESKD), and as an undocumented Mexican immigrant in Denver, CO, she relied on emergency-only hemodialysis. Instead of receiving standard hemodialysis three times per week as required, Hilda would arrive critically ill to the hospital after her nausea, vomiting, and shortness of breath became unbearable. After three cardiac arrests from high potassium levels, she fervently avoided foods high in it. This time, however, she was not worried about potassium. This was our last meal together. She would fly to Mexico a few days later to die.
Our hospital medicine team knew Hilda well. We had continuity because we had been admitting her to the intensive care unit or medicine floor one night each week to receive two hemodialysis sessions when she was critically ill. I immediately connected with Hilda because our lives were parallel in many ways. Hilda and I were both in our early 30s, English was our second language, we both grew up in poverty, and we now had children in elementary school. I, however, was documented. My United States citizenship allowed me the privilege of pursuing a medical degree and gaining access to quality healthcare. In contrast, Hilda had been forced to end her education prematurely, marry her mother’s friend for financial stability at the age of 14, and eventually flee to the US to escape poverty. She survived by cleaning homes until her kidneys failed. Initially, Hilda was my patient. Over time, she became a dear friend.
The first two years of emergency-only hemodialysis devastated Hilda. Too sick to work, she became homeless, staying with a nurse until we found a shelter for single mothers. Multiple cardiac arrests and resuscitations traumatized her young sons, who called 911 each time she collapsed and witnessed the resuscitations. Her boys did not understand the cycle of separation from their mother for her emergent, weekly dialysis hospital admissions and wondered if she would survive to the following week. After two years of emergency-only dialysis, Hilda’s deep love for her boys and concern about the possibility that her sudden death could leave them alone led her to pre-emptively decide to stop emergency-only dialysis. Had Hilda’s treatment costs been covered by emergency Medicaid, as undocumented immigrants with ESKD are in some other states, she may not have been forced into this terrible decision. Moving to a state where standard dialysis is covered was not an option for Hilda because she wanted her boys to stay in Colorado where they had family and friends. With no other options, she first sought a loving adoptive family in the US so that her boys could grow up and have the opportunity to pursue an education. After carefully finding the right adoptive parents, Hilda wanted to celebrate her life with the people she loved. To show her gratitude, she organized a large Mexican Christmas party and invited all of the healthcare providers and friends that had supported her. She generously gave everyone a small gift to remember her by from the few things she owned. I received the wooden rosary her father had left her. A short while later, Hilda flew home to Mexico and passed away on Mother’s Day in 2014.
Two years of caring for Hilda as an internal medicine hospitalist changed me. Grief gave way to anger, anger to determination. I found it morally distressing to continue to provide this type of care. Something had to change and there was little research in this area. One small study had demonstrated that emergency-only hemodialysis was nearly four-fold more expensive due to additional visits to the emergency department and admissions to the hospital, compared to standard outpatient hemodialysis.1 After much soul-searching and advice seeking, I scaled down my clinical hospitalist shifts and gathered a team to do research. For four years, we worked on illuminating the suffering of undocumented immigrants with ESKD that rely on emergency-only hemodialysis. We conducted 20 individual face-to-face qualitative interviews with undocumented immigrants with ESKD and heard first-hand about the emotional and physical burdens and the existential anxiety associated with weekly threats to life.2 We published a retrospective cohort study looking at differences in mortality and found that immigrants who relied on emergency-only hemodialysis had a 14-fold greater mortality rate than those on standard hemodialysis five years after initiating hemodialysis.3 In another retrospective study, we described the circumstances among undocumented immigrants with ESKD who died in the hospital after presenting with ESKD complications, and found that the majority presented with high potassium and a recorded rhythm disturbance.4 I discovered that as a hospitalist physician, I was not the only one distressed. We conducted 50 qualitative interviews to determine the perspectives of interdisciplinary clinicians on providing emergency dialysis and found that there are more clinicians experiencing moral distress. They described several important drivers of burnout,5 including emotional exhaustion from witnessing needless suffering and high mortality, as well as physical exhaustion from overextending themselves to bridge their patient’s care. Together, we discovered that the research told the larger narrative behind Hilda’s struggles. These publications caught the attention of the media and enabled us to speak to a wider audience of clinicians, health policy makers, and the general public.6-10 They also became a catalyst to engaging and enlisting the good will and interest of a number of key stakeholders to look for solutions.
In the US, undocumented immigrants do not qualify for insurance through traditional Medicaid, Medicare, or the provisions from the Patient Protection and Affordable Care Act. Instead, emergency Medicaid provides reimbursements for care of undocumented immigrants. According to the 1986 Emergency Medicaid Treatment and Active Labor Act, federal Medicaid payments can only be made for the care of undocumented immigrants if care is necessary for the treatment of an emergency medical condition.11 However, the Centers for Medicare and Medicaid (CMS) has outlined certain conditions that cannot qualify for matching federal funds under emergency Medicaid (ie, organ transplant and routine prenatal or postpartum care). Beyond these requirements, federal CMS and the Office of the Inspector General defer to states to define what constitutes a medical emergency. A few states include ESKD in the definition of “emergency medical condition,” thereby expanding access to standard hemodialysis to undocumented immigrants. We wanted Colorado to join that list.
On August 2018, after four years of research and months of dialog, everything changed: Colorado Medicaid announced that ESKD was now an “emergency medical condition.” As simple as that, undocumented immigrants would receive standard maintenance hemodialysis. Tears streamed down my face as I read a message from a policy specialist from the Colorado Medicaid: Your team “played a big role in bringing awareness to this issue, and your advocacy for these patients is impressive … thank you for fighting for such an important cause.” I reread her message, imagining what this would have meant to Hilda and her boys.
Our work to enhance care in this community is not over. To better understand the provision of dialysis care for undocumented immigrants in the United States, our team reviewed the Medicaid language for each of the 50 US states in addition to connecting with clinicians and organizations (eg, National Kidney Foundation and ESKD Networks). We found that only 12 states provide Medicaid reimbursement for standard dialysis and that a majority of the US states do not currently define need for dialysis as an emergency medical condition.12 As our Colorado team works with stakeholders in other states interested in similarly redefining their state’s emergency Medicaid definition, our most important advice is that advocacy is a team-based effort. There may be resistance and some may argue that expanding access to care would be an economic burden on taxpayers; however, research demonstrates that undocumented immigrants contribute more to the US Medicare Trust Fund than they actually withdraw toward healthcare.13 Furthermore, a new study has demonstrated that a net savings of nearly $6,000 per person per month is realized when patients are transitioned from emergency-only hemodialysis to standard hemodialysis.14
Internal medicine hospitalists on the front-line of healthcare systems are regular witnesses to its horrible injustices. We rarely share our perspectives and do not expect change to follow. With Hilda, we saw how a powerful combination of research and coalition building could lift one patient’s tragic story to a level where it could produce change. Augmenting Hilda’s experience of tragically poor access to care with evidence-based research gave her story validity far beyond our immediate circle of friends and colleagues, making a singular tragedy, policy relevant. Each time we shared our research to community advocacy groups, health policy stakeholders, state legislators, nurses, and staff; we began with Hilda’s story, not just because it inspired us, but because its truth was undeniable. Our patients’ stories matter, and it is our responsibility to tell them.
Each time I prepare nopalitos for my family, I think of my last meal with Hilda. No matter how painful or difficult her struggle with ESKD, Hilda persisted. She protected her boys. They were her purpose. When she knew she could no longer give them the life she wanted for them, she found a family who would. Hilda’s sons now live with a loving adoptive family, are thriving in school, and her oldest is interested in becoming a physician. Nopal, or cactus, symbolizes such endurance—a plant with unique adaptations and strength that can flourish under extreme environmental stress. Like a cactus storing precious water, Hilda treasured her children, and her resolve to provide for them was unstoppable, right to the edge of death. When our team first took up Hilda’s cause, change seemed impossible. We discovered the opposite. As I clench the wooden rosary she left me that Christmas, I thank her for giving our team the courage to adapt and persist, for in doing so we found a path, first to research and then to broader partnerships and more meaningful policy changes.
Acknowledgments
The author would like to thank Hilda, her family, and the patients at Denver Health. She would also like to acknowledge Hilda’s family, Drs. Mark Earnest, John F. Steiner, Romana Hasnain-Wynia, Rudolph Rodriguez, Judy Regensteiner, and Michel Chonchol for reading and providing feedback on earlier drafts of this narrative.
1. Sheikh-Hamad D, Paiuk E, Wright AJ, Kleinmann C, Khosla U, Shandera WX. Care for immigrants with end-stage renal disease in Houston: a comparison of two practices. Tex Med. 2007;103(4):54-58, 53.
2. Cervantes L, Fischer S, Berlinger N, et al. The illness experience of undocumented immigrants with end-stage renal disease. JAMA Intern Med. 2017;177(4):529-535. https://doi.org/510.1001/jamainternmed.2016.8865.
3. Cervantes L, Tuot D, Raghavan R, et al. Association of emergency-only vs standard hemodialysis with mortality and health care use among undocumented immigrants with end-stage renal disease. JAMA Intern Med. 2018;178(2):188-195. https://doi.org/10.1001/jamainternmed.2017.7039.
4. Cervantes L, O’Hare A, Chonchol M, et al. Circumstances of death among undocumented immigrants who rely on emergency-only hemodialysis. Clin J Am Soc Nephr. 2018;13(9):1405-1406. https://doi.org/10.2215/CJN.03440318.
5. Cervantes L, Richardson S, Raghavan R, et al. Clinicians’ perspectives on providing emergency-only hemodialysis to undocumented immigrants: a qualitative study. Ann Intern Med. 2018;169(2):78-86. https://doi.org/10.7326/M18-0400.
6. Brown J. Colorado immigrants force to wait until the brink of death to get kidney care. The Denver Post 2017; https://www.denverpost.com/2017/02/07/study-undocumented-immigrants-kidney-disease/. Accessed August 27, 2019.
7. Gupta S. CNN: Undocumented immigrants on dialysis forced to cheat death every week. 2018; https://www.cnn.com/2018/08/02/health/kidney-dialysis-undocumented-immigrants/index.html. Accessed August 27, 2019.
8. Harper J. NPR: Another cause of doctor burnout? Being forced to give immigrants unequal care. 2018; https://www.npr.org/sections/health-shots/2018/05/21/613115383/another-cause-of-doctor-burnout-being-forced-to-give-immigrants-unequal-care. Accessed August 27, 2019.
9. Rapaport L. Doctors distress by ‘unethical’ dialysis rules for undocumented immigrants. 2018; https://www.reuters.com/article/us-health-physicians-moral-distress/doctors-distressed-by-unethical-dialysis-rules-for-undocumented-immigrants-idUSKCN1IN30T. Accessed August 27, 2019.
10. Mitchell D. Undocumented immigrants with kidney failure can’t get proper medical care. 2018; https://kdvr.com/2018/08/10/undocumented-immigrants-with-kidney-failure-cant-get-proper-medical-care/. Accessed August 27, 2019.
11. Rodriguez RA. Dialysis for undocumented immigrants in the United States. Adv Chronic Kidney Dis. 2015;22(1):60-65. https://doi.org/10.1053/j.ackd.2014.1007.1003.
12. Cervantes L, Mundo W, Powe NR. The Status of provision of standard outpatient dialysis for US undocumented immigrants with ESKD. Clin J Am Soc Nephr. 2019;14(8):1258-1260. https://doi.org/https://doi.org/10.2215/CJN.03460319.
13. Zallman L, Woolhandler S, Himmelstein D, Bor D, McCormick D. Immigrants contributed an estimated $115.2 billion more to the Medicare Trust Fund than they took out in 2002-09. Health Aff. 2013;32(6):1153-1160. https://doi.org/10.1377/hlthaff.2012.1223.
14. Nguyen OK, Vazquez MA, Charles L, et al. Association of scheduled vs emergency-only dialysis with health outcomes and costs in undocumented immigrants with end-stage renal disease. JAMA Int Med. 2019;179(2):175-183. https://doi.org/10.1001/jamainternmed.2018.5866.
Hilda and I shared childhood stories while we enjoyed one of her favorite Mexican dishes, grilled nopalitos (cactus). Hilda loved nopalitos, but she rarely ate them because they are high in potassium. Hilda had end-stage kidney disease (ESKD), and as an undocumented Mexican immigrant in Denver, CO, she relied on emergency-only hemodialysis. Instead of receiving standard hemodialysis three times per week as required, Hilda would arrive critically ill to the hospital after her nausea, vomiting, and shortness of breath became unbearable. After three cardiac arrests from high potassium levels, she fervently avoided foods high in it. This time, however, she was not worried about potassium. This was our last meal together. She would fly to Mexico a few days later to die.
Our hospital medicine team knew Hilda well. We had continuity because we had been admitting her to the intensive care unit or medicine floor one night each week to receive two hemodialysis sessions when she was critically ill. I immediately connected with Hilda because our lives were parallel in many ways. Hilda and I were both in our early 30s, English was our second language, we both grew up in poverty, and we now had children in elementary school. I, however, was documented. My United States citizenship allowed me the privilege of pursuing a medical degree and gaining access to quality healthcare. In contrast, Hilda had been forced to end her education prematurely, marry her mother’s friend for financial stability at the age of 14, and eventually flee to the US to escape poverty. She survived by cleaning homes until her kidneys failed. Initially, Hilda was my patient. Over time, she became a dear friend.
The first two years of emergency-only hemodialysis devastated Hilda. Too sick to work, she became homeless, staying with a nurse until we found a shelter for single mothers. Multiple cardiac arrests and resuscitations traumatized her young sons, who called 911 each time she collapsed and witnessed the resuscitations. Her boys did not understand the cycle of separation from their mother for her emergent, weekly dialysis hospital admissions and wondered if she would survive to the following week. After two years of emergency-only dialysis, Hilda’s deep love for her boys and concern about the possibility that her sudden death could leave them alone led her to pre-emptively decide to stop emergency-only dialysis. Had Hilda’s treatment costs been covered by emergency Medicaid, as undocumented immigrants with ESKD are in some other states, she may not have been forced into this terrible decision. Moving to a state where standard dialysis is covered was not an option for Hilda because she wanted her boys to stay in Colorado where they had family and friends. With no other options, she first sought a loving adoptive family in the US so that her boys could grow up and have the opportunity to pursue an education. After carefully finding the right adoptive parents, Hilda wanted to celebrate her life with the people she loved. To show her gratitude, she organized a large Mexican Christmas party and invited all of the healthcare providers and friends that had supported her. She generously gave everyone a small gift to remember her by from the few things she owned. I received the wooden rosary her father had left her. A short while later, Hilda flew home to Mexico and passed away on Mother’s Day in 2014.
Two years of caring for Hilda as an internal medicine hospitalist changed me. Grief gave way to anger, anger to determination. I found it morally distressing to continue to provide this type of care. Something had to change and there was little research in this area. One small study had demonstrated that emergency-only hemodialysis was nearly four-fold more expensive due to additional visits to the emergency department and admissions to the hospital, compared to standard outpatient hemodialysis.1 After much soul-searching and advice seeking, I scaled down my clinical hospitalist shifts and gathered a team to do research. For four years, we worked on illuminating the suffering of undocumented immigrants with ESKD that rely on emergency-only hemodialysis. We conducted 20 individual face-to-face qualitative interviews with undocumented immigrants with ESKD and heard first-hand about the emotional and physical burdens and the existential anxiety associated with weekly threats to life.2 We published a retrospective cohort study looking at differences in mortality and found that immigrants who relied on emergency-only hemodialysis had a 14-fold greater mortality rate than those on standard hemodialysis five years after initiating hemodialysis.3 In another retrospective study, we described the circumstances among undocumented immigrants with ESKD who died in the hospital after presenting with ESKD complications, and found that the majority presented with high potassium and a recorded rhythm disturbance.4 I discovered that as a hospitalist physician, I was not the only one distressed. We conducted 50 qualitative interviews to determine the perspectives of interdisciplinary clinicians on providing emergency dialysis and found that there are more clinicians experiencing moral distress. They described several important drivers of burnout,5 including emotional exhaustion from witnessing needless suffering and high mortality, as well as physical exhaustion from overextending themselves to bridge their patient’s care. Together, we discovered that the research told the larger narrative behind Hilda’s struggles. These publications caught the attention of the media and enabled us to speak to a wider audience of clinicians, health policy makers, and the general public.6-10 They also became a catalyst to engaging and enlisting the good will and interest of a number of key stakeholders to look for solutions.
In the US, undocumented immigrants do not qualify for insurance through traditional Medicaid, Medicare, or the provisions from the Patient Protection and Affordable Care Act. Instead, emergency Medicaid provides reimbursements for care of undocumented immigrants. According to the 1986 Emergency Medicaid Treatment and Active Labor Act, federal Medicaid payments can only be made for the care of undocumented immigrants if care is necessary for the treatment of an emergency medical condition.11 However, the Centers for Medicare and Medicaid (CMS) has outlined certain conditions that cannot qualify for matching federal funds under emergency Medicaid (ie, organ transplant and routine prenatal or postpartum care). Beyond these requirements, federal CMS and the Office of the Inspector General defer to states to define what constitutes a medical emergency. A few states include ESKD in the definition of “emergency medical condition,” thereby expanding access to standard hemodialysis to undocumented immigrants. We wanted Colorado to join that list.
On August 2018, after four years of research and months of dialog, everything changed: Colorado Medicaid announced that ESKD was now an “emergency medical condition.” As simple as that, undocumented immigrants would receive standard maintenance hemodialysis. Tears streamed down my face as I read a message from a policy specialist from the Colorado Medicaid: Your team “played a big role in bringing awareness to this issue, and your advocacy for these patients is impressive … thank you for fighting for such an important cause.” I reread her message, imagining what this would have meant to Hilda and her boys.
Our work to enhance care in this community is not over. To better understand the provision of dialysis care for undocumented immigrants in the United States, our team reviewed the Medicaid language for each of the 50 US states in addition to connecting with clinicians and organizations (eg, National Kidney Foundation and ESKD Networks). We found that only 12 states provide Medicaid reimbursement for standard dialysis and that a majority of the US states do not currently define need for dialysis as an emergency medical condition.12 As our Colorado team works with stakeholders in other states interested in similarly redefining their state’s emergency Medicaid definition, our most important advice is that advocacy is a team-based effort. There may be resistance and some may argue that expanding access to care would be an economic burden on taxpayers; however, research demonstrates that undocumented immigrants contribute more to the US Medicare Trust Fund than they actually withdraw toward healthcare.13 Furthermore, a new study has demonstrated that a net savings of nearly $6,000 per person per month is realized when patients are transitioned from emergency-only hemodialysis to standard hemodialysis.14
Internal medicine hospitalists on the front-line of healthcare systems are regular witnesses to its horrible injustices. We rarely share our perspectives and do not expect change to follow. With Hilda, we saw how a powerful combination of research and coalition building could lift one patient’s tragic story to a level where it could produce change. Augmenting Hilda’s experience of tragically poor access to care with evidence-based research gave her story validity far beyond our immediate circle of friends and colleagues, making a singular tragedy, policy relevant. Each time we shared our research to community advocacy groups, health policy stakeholders, state legislators, nurses, and staff; we began with Hilda’s story, not just because it inspired us, but because its truth was undeniable. Our patients’ stories matter, and it is our responsibility to tell them.
Each time I prepare nopalitos for my family, I think of my last meal with Hilda. No matter how painful or difficult her struggle with ESKD, Hilda persisted. She protected her boys. They were her purpose. When she knew she could no longer give them the life she wanted for them, she found a family who would. Hilda’s sons now live with a loving adoptive family, are thriving in school, and her oldest is interested in becoming a physician. Nopal, or cactus, symbolizes such endurance—a plant with unique adaptations and strength that can flourish under extreme environmental stress. Like a cactus storing precious water, Hilda treasured her children, and her resolve to provide for them was unstoppable, right to the edge of death. When our team first took up Hilda’s cause, change seemed impossible. We discovered the opposite. As I clench the wooden rosary she left me that Christmas, I thank her for giving our team the courage to adapt and persist, for in doing so we found a path, first to research and then to broader partnerships and more meaningful policy changes.
Acknowledgments
The author would like to thank Hilda, her family, and the patients at Denver Health. She would also like to acknowledge Hilda’s family, Drs. Mark Earnest, John F. Steiner, Romana Hasnain-Wynia, Rudolph Rodriguez, Judy Regensteiner, and Michel Chonchol for reading and providing feedback on earlier drafts of this narrative.
1. Sheikh-Hamad D, Paiuk E, Wright AJ, Kleinmann C, Khosla U, Shandera WX. Care for immigrants with end-stage renal disease in Houston: a comparison of two practices. Tex Med. 2007;103(4):54-58, 53.
2. Cervantes L, Fischer S, Berlinger N, et al. The illness experience of undocumented immigrants with end-stage renal disease. JAMA Intern Med. 2017;177(4):529-535. https://doi.org/510.1001/jamainternmed.2016.8865.
3. Cervantes L, Tuot D, Raghavan R, et al. Association of emergency-only vs standard hemodialysis with mortality and health care use among undocumented immigrants with end-stage renal disease. JAMA Intern Med. 2018;178(2):188-195. https://doi.org/10.1001/jamainternmed.2017.7039.
4. Cervantes L, O’Hare A, Chonchol M, et al. Circumstances of death among undocumented immigrants who rely on emergency-only hemodialysis. Clin J Am Soc Nephr. 2018;13(9):1405-1406. https://doi.org/10.2215/CJN.03440318.
5. Cervantes L, Richardson S, Raghavan R, et al. Clinicians’ perspectives on providing emergency-only hemodialysis to undocumented immigrants: a qualitative study. Ann Intern Med. 2018;169(2):78-86. https://doi.org/10.7326/M18-0400.
6. Brown J. Colorado immigrants force to wait until the brink of death to get kidney care. The Denver Post 2017; https://www.denverpost.com/2017/02/07/study-undocumented-immigrants-kidney-disease/. Accessed August 27, 2019.
7. Gupta S. CNN: Undocumented immigrants on dialysis forced to cheat death every week. 2018; https://www.cnn.com/2018/08/02/health/kidney-dialysis-undocumented-immigrants/index.html. Accessed August 27, 2019.
8. Harper J. NPR: Another cause of doctor burnout? Being forced to give immigrants unequal care. 2018; https://www.npr.org/sections/health-shots/2018/05/21/613115383/another-cause-of-doctor-burnout-being-forced-to-give-immigrants-unequal-care. Accessed August 27, 2019.
9. Rapaport L. Doctors distress by ‘unethical’ dialysis rules for undocumented immigrants. 2018; https://www.reuters.com/article/us-health-physicians-moral-distress/doctors-distressed-by-unethical-dialysis-rules-for-undocumented-immigrants-idUSKCN1IN30T. Accessed August 27, 2019.
10. Mitchell D. Undocumented immigrants with kidney failure can’t get proper medical care. 2018; https://kdvr.com/2018/08/10/undocumented-immigrants-with-kidney-failure-cant-get-proper-medical-care/. Accessed August 27, 2019.
11. Rodriguez RA. Dialysis for undocumented immigrants in the United States. Adv Chronic Kidney Dis. 2015;22(1):60-65. https://doi.org/10.1053/j.ackd.2014.1007.1003.
12. Cervantes L, Mundo W, Powe NR. The Status of provision of standard outpatient dialysis for US undocumented immigrants with ESKD. Clin J Am Soc Nephr. 2019;14(8):1258-1260. https://doi.org/https://doi.org/10.2215/CJN.03460319.
13. Zallman L, Woolhandler S, Himmelstein D, Bor D, McCormick D. Immigrants contributed an estimated $115.2 billion more to the Medicare Trust Fund than they took out in 2002-09. Health Aff. 2013;32(6):1153-1160. https://doi.org/10.1377/hlthaff.2012.1223.
14. Nguyen OK, Vazquez MA, Charles L, et al. Association of scheduled vs emergency-only dialysis with health outcomes and costs in undocumented immigrants with end-stage renal disease. JAMA Int Med. 2019;179(2):175-183. https://doi.org/10.1001/jamainternmed.2018.5866.
© 2019 Society of Hospital Medicine
Hospitalist Minority Mentoring Program
The fraction of the US population identifying themselves as ethnic minorities was 36% in 2010 and will exceed 50% by 2050.[1, 2] This has resulted in an increasing gap in healthcare, as minorities have well‐documented disparities in access to healthcare and a disproportionately high morbidity and mortality.[3] In 2008, only 12.3% of US physicians were from under‐represented minority (URM) groups (see Figure in Castillo‐Page 4) (ie, those racial and ethnic populations that are underrepresented in the medical profession relative to their numbers in the general population as defined by the American Association of Medical Colleges[4, 5]). Diversifying the healthcare workforce may be an effective approach to reducing healthcare disparities, as URM physicians are more likely to choose primary care specialties,[6] work in underserved communities with socioeconomic or racial mixes similar to their own, thereby increasing access to care,[6, 7, 8] increasing minority patient satisfaction, and improving the quality of care received by minorities.[9, 10, 11]
The number of URM students attending medical school is slowly increasing, but in 2011, only 15% of the matriculating medical school students were URMs (see Figure 12 and Table 10 in Castillo‐Page[12]), and medical schools actively compete for this limited number of applicants. To increase the pool of qualified candidates, more URM students need to graduate college and pursue postgraduate healthcare training.[12]
URM undergraduate freshmen with intentions to enter medical school are 50% less likely to apply to medical school by the time they are seniors than their non‐Latino, white, and Asian counterparts.[13] Higher attrition rates have been linked to students having negative experiences in the basic science courses and with a lack of role models and exposure to careers in healthcare.[13, 14, 15, 16] We developed a hospitalist‐led mentoring program that was focused on overcoming these perceived limitations. This report describes the program and follow‐up data from our first year cohort documenting its success.
METHODS
The Healthcare Interest Program (HIP) was developed by 2 hospitalists (L. C., E. C.) and a physician's assistant (C. N.) who worked at Denver Health (DH), a university‐affiliated public hospital. We worked in conjunction with the chief diversity officer of the University of Colorado, Denver (UCD), primarily a commuter university in metropolitan Denver, where URMs composed 51% of the 2011 freshmen class. We reviewed articles describing mentoring programs for undergraduate students, and by consensus, designed a 7‐component program, each of which was intended to address a specific barrier identified in the literature as possibly contributing to reduced interest of minority students in pursuing medical careers (Table 1).[13, 14, 15, 16]
| Component | Goal |
|---|---|
| Clinical shadowing | |
| Student meets with their mentor and/or with other healthcare providers (eg, pharmacist, nurse) 4 hours per day, 1 or 2 times per month. | Expose students to various healthcare careers and to care for underserved patients. |
| Mentoring | |
| Student meets with their mentor for life coaching, career counseling, and to learn interviewing techniques 4 hours per month | Expand ideas of opportunity, address barriers or concerns before they affect grades, write letter of recommendation |
| Books to Bedside lectures | |
| One lecture per month designed to integrate clinical medicine with the undergraduate basic sciences. Sample lectures include: The Physics of Electrocardiograms and The Biochemistry of Diabetic Ketoacidosis | Improve the undergraduate experience in the basic science courses |
| Book club | |
| Group discussions of books selected for their focus on healthcare disparities and cultural diversity; 2 or 3 books per year (eg, The Spirit Catches You and You Fall Down by Ann Fadiman, Just Like Us by Helen Thorpe) | Socialize, begin to understand and discuss health disparities and caring for the underserved. |
| Diversity lectures | |
| Three speakers per term, each discussing different aspects of health disparities research being conducted in the Denver metropolitan area | Understand the disparities affecting the students' communities. Inspire interest in becoming involved with research. |
| Social events | |
| Kickoff, winter, and end‐of‐year gatherings | Socializing, peer group support |
| Journaling and reflection essay | |
| Summary of hospital experience with mentor and thoughts regarding healthcare career goals and plans. | Formalize career goals |
During the 2009 to 2010 academic year, information about the program, together with an application, was e‐mailed to all students at UCD who self‐identified as having interest in healthcare careers. This information was also distributed at all prehealth clubs and gatherings (ie, to students expressing interest in graduate and professional programs in healthcare‐related fields). All sophomore and junior students who submitted an application and had grade point averages (GPA) 2.8 were interviewed by the program director. Twenty‐three students were selected on the basis of their GPAs (attempting to include those with a range of GPAs), interviews, and the essays prepared as part of their applications.
An e‐mail soliciting mentors was sent to all hospitalists physicians and midlevels working at DH; 25/30 volunteered, and 20 were selected on the basis of their gender (as mentors were matched to students based on gender). The HIP director met with the mentors in person to introduce the program and its goals. All mentors had been practicing hospital medicine for 10 years after their training, and all but 3 were non‐Latino white. Each student accepted into the program was paired with a hospitalist who served as their mentor for the year.
The mentors were instructed in life coaching in both e‐mails and individual discussions. Every 2 or 3 months each hospitalist was contacted by e‐mail to see if questions or problems had arisen and to emphasize the need to meet with their mentees monthly.
Students filled out a written survey after each Books‐to‐Bedside (described in Table 1) discussion. The HIP director met with each student for at least 1 hour per semester and gathered feedback regarding mentor‐mentee success, shadowing experience, and the quality of the book club. At the end of the academic year, students completed a written, anonymous survey assessing their impressions of the program and their intentions of pursuing additional training in healthcare careers (Table 2). We used descriptive statistics to analyze the data including frequencies and mean tests.
|
| Open‐ended questions: |
| 1. How did HIP or your HIP mentor affect your application to your healthcare field of interest (eg, letter of recommendation, clinical hours, change in healthcare career of interest)? |
| 2. How did the Books to Bedside presentation affect you? |
| 3. My healthcare professional school of interest is (eg, medical school, nursing school, physician assistant school, pharmacy school, physical therapy school, dental school). |
| 4. How many times per month were you able to shadow at Denver Health? |
| 5. How would you revise the program to improve it? |
| Yes/no questions: |
| 1. English is my primary language. |
| 2. I am the first in my immediate family to attend college |
| 3. Did you work while in school? |
| 4. Did you receive scholarships while in school? |
| 5. Prior to participating in this program, I had a role model in my healthcare field of interest. |
| 6. My role model is my HIP mentor. |
| 7. May we contact you in 2 to 3 years to obtain information regarding your acceptance into your healthcare field of interest? |
| Likert 5‐point questions: |
| 1. Participation in HIP expanded my perceptions of what I could accomplish in the healthcare field. |
| 2. Participation in HIP has increased my confidence that I will be accepted into my healthcare field of choice. |
| 3. I intend to go to my healthcare school in the state of Colorado. |
| 4. One of my long‐term goals is to work with people with health disparities (eg, underserved). |
| 5. One of my long‐term goals is to work in a rural environment. |
| 6. I have access to my prehealth advisors. |
| 7. I have access to my HIP mentor. |
| 8. Outside of the HIP, I have had access to clinical experience shadowing with a physician or physician assistant. |
| 9. If not accepted the first time, I will reapply to my healthcare field of interest. |
| 10. I would recommend HIP to my colleagues. |
Two years after completing the program, each student was contacted via e‐mail and/or phone to determine whether they were still pursuing healthcare careers.
RESULTS
Twenty‐three students were accepted into the program (14 female, 9 male, mean age 19 [standard deviation1]). Their GPAs ranged from 2.8 to 4.0. Eleven (48%) were the first in their family to attend college, 6 (26%) indicated that English was not their primary language, and 16 (70%) were working while attending school. All 23 students stayed in the HIP program for the full academic year.
Nineteen of the 23 students (83%) completed the survey at the end of the year. Of these, 19 (100%) strongly agreed that the HIP expanded their perceptions of what they might accomplish and increased their confidence in being able to succeed in a healthcare profession. All 19 (100%) stated that they hoped to care for underserved minority patients in the future. Sixteen (84%) strongly agreed that their role model in life was their HIP mentor. These findings suggest that many of the HIP components successfully accomplished their goals (Table 1).
Two‐year follow‐up was available for 21 of the 23 students (91%). Twenty (95%) remained committed to a career in healthcare, 18 (86%) had graduated college, 6 (29%) were enrolled in graduate training in the healthcare professions (2 in medical school, 1 in nursing school, and 3 in a master's programs in public health, counseling, and medical science, respectively), and 9 (43%) were in the process of applying to postgraduate healthcare training programs (7 to medical school, 1 to dental school, and 1 to nursing school, respectively). Five students were preparing to take the Medical College Admissions Test, and 7 were working at various jobs in the healthcare field (eg, phlebotomists, certified nurse assistants, research assistants). Of the 16 students who expressed an interest in attending medical school at the beginning of the program, 15 (94%) maintained that interest.
DISCUSSION
HIP was extremely well‐received by the participating students, the majority graduated college and remained committed to a career in healthcare, and 29% were enrolled in postgraduate training in healthcare professions 2 years after graduation.
The 86% graduation rate that we observed compares highly favorably to the UCD campus‐wide graduation rates for minority students of 12.5% at 4 years and 30.8% at 5 years. Although there may be selection bias in the students participating in HIP, the extremely high graduation rate is consistent with HIP meeting 1 or more of its stated objectives.
Many universities have prehealthcare pipeline programs that are designed to provide short‐term summer medical experiences, research opportunities, and assistance with the Medical College Admissions Test.[17, 18, 19] We believe, however, that several aspects of our program are unique. First, we designed HIP to be year‐long, rather than a summertime program. Continuing the mentoring and life coaching throughout the year may allow stronger relationships to develop between the mentor and the student. In addition, ongoing student‐mentor interactions during the time when a student may be encountering problems with their undergraduate basic science courses may be beneficial. Second, the Books‐to‐Bedside lectures series, which was designed to link the students' basic science training with clinical medicine, has not previously been described and may contribute to a higher rate of completion of their basic science training. Third, those aspects of the program resulting in increased peer interactions (eg, book club discussions, diversity lectures, and social gatherings) provided an important venue for students with similar interests to interact, an opportunity that is limited at UCD as it is primarily a commuter university.
A number of lessons were learned during the first year of the program. First, a program such as ours must include rigorous evaluation from the start to make a case for support to the university and key stakeholders. With this in mind, it is possible to obtain funding and ensure long‐term sustainability. Second, by involving UCD's chief diversity officer in the development, the program fostered a strong partnership between DH and UCD and facilitated growing the program. Third, the hospitalists who attended the diversity‐training aspects of the program stated through informal feedback that they felt better equipped to care for the underserved and felt that providing mentorship increased their personal job satisfaction. Fourth, the students requested more opportunities for them to participate in health disparities research and in shadowing in subspecialties in addition to internal medicine. In response to this feedback, we now offer research opportunities, lectures on health disparities research, and interactions with community leaders working in improving healthcare for the underserved.
Although influencing the graduation rate from graduate level schooling is beyond the scope of HIP, we can conclude that the large majority of students participating in HIP maintained their interest in the healthcare professions, graduated college, and that many went on to postgraduate healthcare training. The data we present pertain to the cohort of students in the first year of the HIP. As the program matures, we will continue to evaluate the long‐term outcomes of our students and hospitalist mentors. This may provide opportunities for other academic hospitalists to replicate our program in their own communities.
ACKNOWLEDGMENTS
Disclosure: The authors report no conflicts of interest.
- United States Census Bureau. An older and more diverse nation by midcentury. Available at: https://www.census.gov/newsroom/releases/archives/population/cb08–123.html. Accessed February 28, 2013.
- United States Census Bureau. State and county quick facts. Available at: http://quickfacts.census.gov/qfd/states/00000.html. Accessed February 28, 2013.
- Centers for Disease Control and Prevention. Surveillance of health status in minority communities—racial and ethnic approaches to community health across the U.S. (REACH US) risk factor survey, United States, 2009. Available at: http://cdc.gov/mmwr/preview/mmwrhtml/ss6006a1.htm. Accessed February 28, 2013.
- Association of American Medical Colleges. Diversity in the physician workforce: facts and figures 2010. Available at: https://members.aamc.org/eweb/upload/Diversity%20in%20the%20 Physician%20Workforce%20Facts%20and%20Figures%202010.pdf. Accessed April 29, 2014.
- Association of American Medical Colleges Executive Committee. The status of the new AAMC definition of “underrepresented in medicine” following the Supreme Court's decision in Grutter. Available at: https://www.aamc.org/download/54278/data/urm.pdf. Accessed May 25, 2014.
- . Physician Characteristics and Distribution in the US. 2013 ed. Chicago, IL: American Medical Association; 2013.
- , , , et al. The role of black and Hispanic physicians in providing health care for underserved populations. N Engl J Med. 1996;334:1305–1310.
- , , . The association among specialty, race, ethnicity, and practice location among California physicians in diverse Specialties. J Natl Med Assoc. 2012;104:46–52.
- , , , , Patient‐physician racial concordance and the perceived quality and use of health care. Arch Intern Med. 1999;159:997–1004.
- , . Race of physician and satisfaction with care among African‐American patients. J Natl Med Assoc. 2002;94:937–943.
- U.S. Department of Health and Human Services Health Resources and Services Administration Bureau of Health Professions. The rational for diversity in health professions: a review of the evidence. 2006. Available at: http://bhpr.hrsa.gov/healthworkforce/reports/diversityreviewevidence.pdf. Accessed March 30, 2014.
- . Association of American Medical Colleges. Diversity in medical education: facts and figures 2012. Available at: https://members.aamc.org/eweb/upload/Diversity%20in%20Medical%20Ed ucation%20Facts%20and%20Figures%202012.pdf. Accessed February 28, 2013.
- , , . The leaky pipeline: factors associated with early decline in interest in premedical studies among underrepresented minority undergraduate students. Acad Med. 2008;83:503–511.
- , . Perspective: adopting an asset bundles model to support and advance minority students' careers in academic medicine and the scientific pipeline. Acad Med. 2012;87:1488–1495.
- , , , . Contributors of black men's success in admission to and graduation from medical school. Acad Med. 2011;86:892–900.
- , . Premed survival: understanding the culling process in premedical undergraduate education. Acad Med. 2002;77:719–724.
- , , , . A novel enrichment program using cascading mentorship to increase diversity in the health care professions. Acad Med. 2013;88:1232–1238.
- , . A social and academic enrichment program promotes medical school matriculation and graduation for disadvantaged students. Educ Health. 2012;25:55–63.
- , , , . Addressing medical school diversity through an undergraduate partnership at Texas A83:512–515.
The fraction of the US population identifying themselves as ethnic minorities was 36% in 2010 and will exceed 50% by 2050.[1, 2] This has resulted in an increasing gap in healthcare, as minorities have well‐documented disparities in access to healthcare and a disproportionately high morbidity and mortality.[3] In 2008, only 12.3% of US physicians were from under‐represented minority (URM) groups (see Figure in Castillo‐Page 4) (ie, those racial and ethnic populations that are underrepresented in the medical profession relative to their numbers in the general population as defined by the American Association of Medical Colleges[4, 5]). Diversifying the healthcare workforce may be an effective approach to reducing healthcare disparities, as URM physicians are more likely to choose primary care specialties,[6] work in underserved communities with socioeconomic or racial mixes similar to their own, thereby increasing access to care,[6, 7, 8] increasing minority patient satisfaction, and improving the quality of care received by minorities.[9, 10, 11]
The number of URM students attending medical school is slowly increasing, but in 2011, only 15% of the matriculating medical school students were URMs (see Figure 12 and Table 10 in Castillo‐Page[12]), and medical schools actively compete for this limited number of applicants. To increase the pool of qualified candidates, more URM students need to graduate college and pursue postgraduate healthcare training.[12]
URM undergraduate freshmen with intentions to enter medical school are 50% less likely to apply to medical school by the time they are seniors than their non‐Latino, white, and Asian counterparts.[13] Higher attrition rates have been linked to students having negative experiences in the basic science courses and with a lack of role models and exposure to careers in healthcare.[13, 14, 15, 16] We developed a hospitalist‐led mentoring program that was focused on overcoming these perceived limitations. This report describes the program and follow‐up data from our first year cohort documenting its success.
METHODS
The Healthcare Interest Program (HIP) was developed by 2 hospitalists (L. C., E. C.) and a physician's assistant (C. N.) who worked at Denver Health (DH), a university‐affiliated public hospital. We worked in conjunction with the chief diversity officer of the University of Colorado, Denver (UCD), primarily a commuter university in metropolitan Denver, where URMs composed 51% of the 2011 freshmen class. We reviewed articles describing mentoring programs for undergraduate students, and by consensus, designed a 7‐component program, each of which was intended to address a specific barrier identified in the literature as possibly contributing to reduced interest of minority students in pursuing medical careers (Table 1).[13, 14, 15, 16]
| Component | Goal |
|---|---|
| Clinical shadowing | |
| Student meets with their mentor and/or with other healthcare providers (eg, pharmacist, nurse) 4 hours per day, 1 or 2 times per month. | Expose students to various healthcare careers and to care for underserved patients. |
| Mentoring | |
| Student meets with their mentor for life coaching, career counseling, and to learn interviewing techniques 4 hours per month | Expand ideas of opportunity, address barriers or concerns before they affect grades, write letter of recommendation |
| Books to Bedside lectures | |
| One lecture per month designed to integrate clinical medicine with the undergraduate basic sciences. Sample lectures include: The Physics of Electrocardiograms and The Biochemistry of Diabetic Ketoacidosis | Improve the undergraduate experience in the basic science courses |
| Book club | |
| Group discussions of books selected for their focus on healthcare disparities and cultural diversity; 2 or 3 books per year (eg, The Spirit Catches You and You Fall Down by Ann Fadiman, Just Like Us by Helen Thorpe) | Socialize, begin to understand and discuss health disparities and caring for the underserved. |
| Diversity lectures | |
| Three speakers per term, each discussing different aspects of health disparities research being conducted in the Denver metropolitan area | Understand the disparities affecting the students' communities. Inspire interest in becoming involved with research. |
| Social events | |
| Kickoff, winter, and end‐of‐year gatherings | Socializing, peer group support |
| Journaling and reflection essay | |
| Summary of hospital experience with mentor and thoughts regarding healthcare career goals and plans. | Formalize career goals |
During the 2009 to 2010 academic year, information about the program, together with an application, was e‐mailed to all students at UCD who self‐identified as having interest in healthcare careers. This information was also distributed at all prehealth clubs and gatherings (ie, to students expressing interest in graduate and professional programs in healthcare‐related fields). All sophomore and junior students who submitted an application and had grade point averages (GPA) 2.8 were interviewed by the program director. Twenty‐three students were selected on the basis of their GPAs (attempting to include those with a range of GPAs), interviews, and the essays prepared as part of their applications.
An e‐mail soliciting mentors was sent to all hospitalists physicians and midlevels working at DH; 25/30 volunteered, and 20 were selected on the basis of their gender (as mentors were matched to students based on gender). The HIP director met with the mentors in person to introduce the program and its goals. All mentors had been practicing hospital medicine for 10 years after their training, and all but 3 were non‐Latino white. Each student accepted into the program was paired with a hospitalist who served as their mentor for the year.
The mentors were instructed in life coaching in both e‐mails and individual discussions. Every 2 or 3 months each hospitalist was contacted by e‐mail to see if questions or problems had arisen and to emphasize the need to meet with their mentees monthly.
Students filled out a written survey after each Books‐to‐Bedside (described in Table 1) discussion. The HIP director met with each student for at least 1 hour per semester and gathered feedback regarding mentor‐mentee success, shadowing experience, and the quality of the book club. At the end of the academic year, students completed a written, anonymous survey assessing their impressions of the program and their intentions of pursuing additional training in healthcare careers (Table 2). We used descriptive statistics to analyze the data including frequencies and mean tests.
|
| Open‐ended questions: |
| 1. How did HIP or your HIP mentor affect your application to your healthcare field of interest (eg, letter of recommendation, clinical hours, change in healthcare career of interest)? |
| 2. How did the Books to Bedside presentation affect you? |
| 3. My healthcare professional school of interest is (eg, medical school, nursing school, physician assistant school, pharmacy school, physical therapy school, dental school). |
| 4. How many times per month were you able to shadow at Denver Health? |
| 5. How would you revise the program to improve it? |
| Yes/no questions: |
| 1. English is my primary language. |
| 2. I am the first in my immediate family to attend college |
| 3. Did you work while in school? |
| 4. Did you receive scholarships while in school? |
| 5. Prior to participating in this program, I had a role model in my healthcare field of interest. |
| 6. My role model is my HIP mentor. |
| 7. May we contact you in 2 to 3 years to obtain information regarding your acceptance into your healthcare field of interest? |
| Likert 5‐point questions: |
| 1. Participation in HIP expanded my perceptions of what I could accomplish in the healthcare field. |
| 2. Participation in HIP has increased my confidence that I will be accepted into my healthcare field of choice. |
| 3. I intend to go to my healthcare school in the state of Colorado. |
| 4. One of my long‐term goals is to work with people with health disparities (eg, underserved). |
| 5. One of my long‐term goals is to work in a rural environment. |
| 6. I have access to my prehealth advisors. |
| 7. I have access to my HIP mentor. |
| 8. Outside of the HIP, I have had access to clinical experience shadowing with a physician or physician assistant. |
| 9. If not accepted the first time, I will reapply to my healthcare field of interest. |
| 10. I would recommend HIP to my colleagues. |
Two years after completing the program, each student was contacted via e‐mail and/or phone to determine whether they were still pursuing healthcare careers.
RESULTS
Twenty‐three students were accepted into the program (14 female, 9 male, mean age 19 [standard deviation1]). Their GPAs ranged from 2.8 to 4.0. Eleven (48%) were the first in their family to attend college, 6 (26%) indicated that English was not their primary language, and 16 (70%) were working while attending school. All 23 students stayed in the HIP program for the full academic year.
Nineteen of the 23 students (83%) completed the survey at the end of the year. Of these, 19 (100%) strongly agreed that the HIP expanded their perceptions of what they might accomplish and increased their confidence in being able to succeed in a healthcare profession. All 19 (100%) stated that they hoped to care for underserved minority patients in the future. Sixteen (84%) strongly agreed that their role model in life was their HIP mentor. These findings suggest that many of the HIP components successfully accomplished their goals (Table 1).
Two‐year follow‐up was available for 21 of the 23 students (91%). Twenty (95%) remained committed to a career in healthcare, 18 (86%) had graduated college, 6 (29%) were enrolled in graduate training in the healthcare professions (2 in medical school, 1 in nursing school, and 3 in a master's programs in public health, counseling, and medical science, respectively), and 9 (43%) were in the process of applying to postgraduate healthcare training programs (7 to medical school, 1 to dental school, and 1 to nursing school, respectively). Five students were preparing to take the Medical College Admissions Test, and 7 were working at various jobs in the healthcare field (eg, phlebotomists, certified nurse assistants, research assistants). Of the 16 students who expressed an interest in attending medical school at the beginning of the program, 15 (94%) maintained that interest.
DISCUSSION
HIP was extremely well‐received by the participating students, the majority graduated college and remained committed to a career in healthcare, and 29% were enrolled in postgraduate training in healthcare professions 2 years after graduation.
The 86% graduation rate that we observed compares highly favorably to the UCD campus‐wide graduation rates for minority students of 12.5% at 4 years and 30.8% at 5 years. Although there may be selection bias in the students participating in HIP, the extremely high graduation rate is consistent with HIP meeting 1 or more of its stated objectives.
Many universities have prehealthcare pipeline programs that are designed to provide short‐term summer medical experiences, research opportunities, and assistance with the Medical College Admissions Test.[17, 18, 19] We believe, however, that several aspects of our program are unique. First, we designed HIP to be year‐long, rather than a summertime program. Continuing the mentoring and life coaching throughout the year may allow stronger relationships to develop between the mentor and the student. In addition, ongoing student‐mentor interactions during the time when a student may be encountering problems with their undergraduate basic science courses may be beneficial. Second, the Books‐to‐Bedside lectures series, which was designed to link the students' basic science training with clinical medicine, has not previously been described and may contribute to a higher rate of completion of their basic science training. Third, those aspects of the program resulting in increased peer interactions (eg, book club discussions, diversity lectures, and social gatherings) provided an important venue for students with similar interests to interact, an opportunity that is limited at UCD as it is primarily a commuter university.
A number of lessons were learned during the first year of the program. First, a program such as ours must include rigorous evaluation from the start to make a case for support to the university and key stakeholders. With this in mind, it is possible to obtain funding and ensure long‐term sustainability. Second, by involving UCD's chief diversity officer in the development, the program fostered a strong partnership between DH and UCD and facilitated growing the program. Third, the hospitalists who attended the diversity‐training aspects of the program stated through informal feedback that they felt better equipped to care for the underserved and felt that providing mentorship increased their personal job satisfaction. Fourth, the students requested more opportunities for them to participate in health disparities research and in shadowing in subspecialties in addition to internal medicine. In response to this feedback, we now offer research opportunities, lectures on health disparities research, and interactions with community leaders working in improving healthcare for the underserved.
Although influencing the graduation rate from graduate level schooling is beyond the scope of HIP, we can conclude that the large majority of students participating in HIP maintained their interest in the healthcare professions, graduated college, and that many went on to postgraduate healthcare training. The data we present pertain to the cohort of students in the first year of the HIP. As the program matures, we will continue to evaluate the long‐term outcomes of our students and hospitalist mentors. This may provide opportunities for other academic hospitalists to replicate our program in their own communities.
ACKNOWLEDGMENTS
Disclosure: The authors report no conflicts of interest.
- United States Census Bureau. An older and more diverse nation by midcentury. Available at: https://www.census.gov/newsroom/releases/archives/population/cb08–123.html. Accessed February 28, 2013.
- United States Census Bureau. State and county quick facts. Available at: http://quickfacts.census.gov/qfd/states/00000.html. Accessed February 28, 2013.
- Centers for Disease Control and Prevention. Surveillance of health status in minority communities—racial and ethnic approaches to community health across the U.S. (REACH US) risk factor survey, United States, 2009. Available at: http://cdc.gov/mmwr/preview/mmwrhtml/ss6006a1.htm. Accessed February 28, 2013.
- Association of American Medical Colleges. Diversity in the physician workforce: facts and figures 2010. Available at: https://members.aamc.org/eweb/upload/Diversity%20in%20the%20 Physician%20Workforce%20Facts%20and%20Figures%202010.pdf. Accessed April 29, 2014.
- Association of American Medical Colleges Executive Committee. The status of the new AAMC definition of “underrepresented in medicine” following the Supreme Court's decision in Grutter. Available at: https://www.aamc.org/download/54278/data/urm.pdf. Accessed May 25, 2014.
- . Physician Characteristics and Distribution in the US. 2013 ed. Chicago, IL: American Medical Association; 2013.
- , , , et al. The role of black and Hispanic physicians in providing health care for underserved populations. N Engl J Med. 1996;334:1305–1310.
- , , . The association among specialty, race, ethnicity, and practice location among California physicians in diverse Specialties. J Natl Med Assoc. 2012;104:46–52.
- , , , , Patient‐physician racial concordance and the perceived quality and use of health care. Arch Intern Med. 1999;159:997–1004.
- , . Race of physician and satisfaction with care among African‐American patients. J Natl Med Assoc. 2002;94:937–943.
- U.S. Department of Health and Human Services Health Resources and Services Administration Bureau of Health Professions. The rational for diversity in health professions: a review of the evidence. 2006. Available at: http://bhpr.hrsa.gov/healthworkforce/reports/diversityreviewevidence.pdf. Accessed March 30, 2014.
- . Association of American Medical Colleges. Diversity in medical education: facts and figures 2012. Available at: https://members.aamc.org/eweb/upload/Diversity%20in%20Medical%20Ed ucation%20Facts%20and%20Figures%202012.pdf. Accessed February 28, 2013.
- , , . The leaky pipeline: factors associated with early decline in interest in premedical studies among underrepresented minority undergraduate students. Acad Med. 2008;83:503–511.
- , . Perspective: adopting an asset bundles model to support and advance minority students' careers in academic medicine and the scientific pipeline. Acad Med. 2012;87:1488–1495.
- , , , . Contributors of black men's success in admission to and graduation from medical school. Acad Med. 2011;86:892–900.
- , . Premed survival: understanding the culling process in premedical undergraduate education. Acad Med. 2002;77:719–724.
- , , , . A novel enrichment program using cascading mentorship to increase diversity in the health care professions. Acad Med. 2013;88:1232–1238.
- , . A social and academic enrichment program promotes medical school matriculation and graduation for disadvantaged students. Educ Health. 2012;25:55–63.
- , , , . Addressing medical school diversity through an undergraduate partnership at Texas A83:512–515.
Study of Antimicrobial Scrubs
Healthcare workers' (HCWs) attire becomes contaminated with bacterial pathogens during the course of the workday,[1, 2, 3, 4, 5, 6, 7, 8, 9, 10, 11, 12] and Munoz‐Price et al.[13] recently demonstrated that finding bacterial pathogens on HCWs' white coats correlated with finding the same pathogens on their hands. Because of concern for an association between attire colonization and nosocomial infection, governmental agencies in England and Scotland banned HCWs from wearing white coats or long‐sleeve garments,[14, 15] despite evidence that such an approach does not reduce contamination.[12]
Newly developed antimicrobial textiles have been incorporated into HCW scrubs,[16, 17, 18, 19, 20] and commercial Web sites and product inserts report that these products can reduce bacterial contamination by 80.9% at 8 hours to greater than 99% under laboratory conditions depending on the product and microbe studied.[16, 17, 19] Because there are limited clinical data pertaining to the effectiveness of antimicrobial scrubs, we performed a prospective study designed to determine whether wearing these products reduced bacterial contamination of HCWs' scrubs or skin at the end of an 8‐hour workday.
METHODS
Design
The study was a prospective, unblinded, randomized, controlled trial that was approved by the Colorado Multiple Institutional Review Board and conducted at Denver Health, a university‐affiliated public safety net hospital. No protocol changes occurred during the study.
Participants
Participants included hospitalist physicians, internal medicine residents, physician assistants, nurse practitioners, and nurses who directly cared for patients hospitalized on internal medicine units between March 12, 2012 and August 28, 2012. Participants known to be pregnant or those who refused to participate in the study were excluded.
Intervention
Standard scrubs issued by the hospital were tested along with 2 different antimicrobial scrubs (scrub A and scrub B). Scrub A was made with a polyester microfiber material embedded with a proprietary antimicrobial chemical. Scrub B was a polyestercotton blend scrub that included 2 proprietary antimicrobial chemicals and silver embedded into the fabric. The standard scrub was made of a polyestercotton blend with no antimicrobial properties. All scrubs consisted of pants and a short‐sleeved shirt, with either a pocket at the left breast or lower front surface, and all were tested new prior to any washing or wear. Preliminary cultures were done on 2 scrubs in each group to assess the extent of preuse contamination. All providers were instructed not to wear white coats at any time during the day that they were wearing the scrubs. Providers were not told the type of scrub they received, but the antimicrobial scrubs had a different appearance and texture than the standard scrubs, so blinding was not possible.
Outcomes
The primary end point was the total bacterial colony count of samples obtained from the breast or lower front pocket, the sleeve cuff of the dominant hand, and the pant leg at the midthigh of the dominant leg on all scrubs after an 8‐hour workday. Secondary outcomes were the bacterial colony counts of cultures obtained from the volar surface of the wrists of the HCWs' dominant arm, and the colony counts of methicillin‐resistant Staphylococcus aureus (MRSA), vancomycin‐resistant enterococci (VRE), and resistant Gram‐negative bacteria on the 3 scrub types, all obtained after the 8‐hour workday.
Cultures were collected using a standardized RODAC imprint method[21] with BBL RODAC plates containing blood agar (Becton Dickinson, Sparks, MD). Cultures were incubated in ambient air at 35 to 37C for 18 to 22 hours. After incubation, visible colonies were counted using a dissecting microscope to a maximum of 200 colonies as recommended by the manufacturer. Colonies morphologically consistent with Staphylococcus species were subsequently tested for coagulase using a BactiStaph rapid latex agglutination test (Remel, Lenexa, KS). If positive, these colonies were subcultured to sheep blood agar (Remel) and BBL MRSA CHROMagar (Becton Dickinson) and incubated for an additional 18 to 24 hours. Characteristic growth on blood agar that also produced mauve‐colored colonies on CHROMagar was taken to indicate MRSA. Colonies morphologically suspicious for being VRE were identified and confirmed as VRE using a positive identification and susceptibility panel (Microscan; Siemens, Deerfield, IL). A negative combination panel (Microscan, Siemens) was also used to identify and confirm resistant Gram‐negative rods.
Each participant completed a survey that included questions that identified their occupation, whether they had had contact with patients who were known to be colonized or infected with MRSA, VRE, or resistant Gram‐negative rods during the testing period, and whether they experienced any adverse events that might relate to wearing the uniform.
Sample Size
We assumed that cultures taken from the sleeve of the control scrubs would have a mean ( standard deviation) colony count of 69 (67) based on data from our previous study.[12] Although the companies making the antimicrobial scrubs indicated that their respective products provided between 80.9% at 8 hours and >99% reduction in bacterial colony counts in laboratory settings, we assumed that a 70% decrease in colony count compared with standard scrubs could be clinically important. After adjusting for multiple comparisons and accounting for using nonparametric analyses with an unknown distribution, we estimated a need to recruit 35 subjects in each of 3 groups.
Randomization
The principal investigator and coinvestigators enrolled and consented participants. After obtaining consent, block randomization, stratified by occupation, occurred 1 day prior to the study using a computer‐generated table of random numbers.
Statistics
Data were collected and managed using REDCap (Research Electronic Data Capture; Vanderbilt UniversityThe Institute for Medicine and Public Health, Nashville, TN) electronic data capture tools hosted at Denver Health. REDCap is a secure Web‐based application designed to support data collection for research studies, providing: (1) an intuitive interface for validated data entry, (2) audit trails for tracking data manipulation and export procedures, (3) automated export procedures for seamless data downloads to common statistical packages, and (4) procedures for importing data from external sources.[22]
Colony counts were compared using a Kruskal‐Wallis 1‐way analysis of variance by ranks. Bonferroni's correction for multiple comparisons resulted in a P<0.01 as indicating statistical significance. Proportions were compared using [2] analysis. All data are presented as medians with interquartile range (IQR) or proportions.
RESULTS
We screened 118 HCWs for participation and randomized 109, 37 in the control and antimicrobial scrub group A, and 35 in antimicrobial scrub group B (during the course of the study we neglected to culture the pockets of 2 participants in the standard scrub group and 2 in antimicrobial scrub group A). Because our primary end point was total colony count from cultures taken from 3 sites, data from these 4 subjects could not be used, and all the data from these 4 subjects were excluded from the primary analysis; 4 additional subjects were subsequently recruited allowing us to meet our block enrollment target (Figure 1). The first and last participants were studied on March 12, 2012 and August 28, 2012, respectively. The trial ended once the defined number of participants was enrolled. The occupations of the 105 participants are summarized in Table 1.

| All Subjects, N=105 | Standard Scrub, n=35 | Antimicrobial Scrub A, n=35 | Antimicrobial Scrub B, n=35 | |
|---|---|---|---|---|
| Healthcare worker type, n (%) | ||||
| Attending physician | 11 (10) | 5 (14) | 3 (9) | 3 (9) |
| Intern/resident | 51 (49) | 17 (49) | 16 (46) | 18 (51) |
| Midlevels | 6 (6) | 2 (6) | 2 (6) | 2 (6) |
| Nurse | 37 (35) | 11 (31) | 14 (40) | 12 (34) |
| Cared for colonized or infected patient with antibiotic resistant organism, n (%) | 55 (52) | 16 (46) | 20 (57) | 19 (54) |
| Number of colonized or infected patients cared for, n (%) | ||||
| 1 | 37 (67) | 10 (63) | 13 (65) | 14 (74) |
| 2 | 11 (20) | 4 (25) | 6 (30) | 1 (5) |
| 3 or more | 6 (11) | 2 (12) | 1 (5) | 3 (16) |
| Unknown | 1 (2) | 0 (0) | 0 (0) | 1 (5) |
Colony counts of all scrubs cultured prior to use never exceeded 10 colonies. The median (IQR) total colony counts from all sites on the scrubs was 99 (66182) for standard scrubs, 137 (84289) for antimicrobial scrub type A, and 138 (62274) for antimicrobial scrub type B (P=0.36). We found no significant differences between the colony counts cultured from any of the individual sites among the 3 groups, regardless of occupation (Table 2). No significant difference was observed with respect to colony counts cultured from the wrist among the 3 study groups (Table 2). Comparisons between groups were planned a priori if a difference across all groups was found. Given the nonsignificant P values across all scrub groups, no further comparisons were made.
| Total (From All Sites on Scrubs) | Sleeve Cuff | Thigh | Wrist | ||
|---|---|---|---|---|---|
| |||||
| All subjects, N=105 | |||||
| Standard scrub | 99 (66182) | 41 (2070) | 20 (944) | 32 (2161) | 16 (540) |
| Antimicrobial scrub A | 137 (84289) | 65 (35117) | 33 (16124) | 41 (1586) | 23 (442) |
| Antimicrobial scrub B | 138 (62274) | 41 (2299) | 21 (941) | 40 (18107) | 15 (654) |
| P value | 0.36 | 0.17 | 0.07 | 0.57 | 0.92 |
| Physicians and midlevels, n=68 | |||||
| Standard scrub | 115.5 (72.5173.5) | 44.5 (2270.5) | 27.5 (10.538.5) | 35 (2362.5) | 24.5 (755) |
| Antimicrobial scrub A | 210 (114289) | 86 (64120) | 39 (18129) | 49 (2486) | 24 (342) |
| Antimicrobial scrub B | 149 (68295) | 52 (26126) | 21 (1069) | 37 (18141) | 19 (872) |
| P value | 0.21 | 0.08 | 0.19 | 0.85 | 0.76 |
| Nurses, n=37 | |||||
| Standard scrub | 89 (31236) | 37 (1348) | 13 (552) | 28 (1342) | 9 (321) |
| Antimicrobial scrub A | 105 (43256) | 45.5 (2258) | 21.5 (1654) | 38.5 (1268) | 17 (643) |
| Antimicrobial scrub B | 91.5 (60174.5) | 27 (1340) | 16 (7.526) | 51 (2186.5) | 10 (3.543.5) |
| P value | 0.86 | 0.39 | 0.19 | 0.49 | 0.41 |
Fifty‐five participants (52%) reported caring for patients who were known to be colonized or infected with an antibiotic‐resistant organism, 16 (46%) randomized to wear standard scrubs, and 20 (57%) and 19 (54%) randomized to wear antimicrobial scrub A or B, respectively (P=0.61). Of these, however, antibiotic‐resistant organisms were only cultured from the scrubs of 2 providers (1 with 1 colony of MRSA from the breast pocket of antimicrobial scrub A, 1 with 1 colony of MRSA cultured from the pocket of antimicrobial scrub B [P=0.55]), and from the wrist of only 1 provider (a multiresistant Gram‐negative rod who wore antimicrobial scrub B).
Adverse Events
Six subjects (5.7%) reported adverse events, all of whom were wearing antimicrobial scrubs (P=0.18). For participants wearing antimicrobial scrub A, 1 (3%) reported itchiness and 2 (6%) reported heaviness or poor breathability. For participants wearing antimicrobial scrub B, 1 (3%) reported redness, 1 (3%) reported itchiness, and 1 (3%) reported heaviness or poor breathability.
DISCUSSION
The important findings of this study are that we found no evidence indicating that either of the 2 antimicrobial scrubs tested reduced bacterial contamination or antibiotic‐resistant contamination on HCWs' scrubs or wrists compared with standard scrubs at the end of an 8‐hour workday, and that despite many HCWs being exposed to patients who were colonized or infected with antibiotic‐resistant bacteria, these organisms were only rarely cultured from their uniforms.
We found that HCWs in all 3 arms of the study had bacterial contamination on their scrubs and skin, consistent with previous studies showing that HCWs' uniforms are frequently contaminated with bacteria, including MRSA, VRE, and other pathogens.[1, 2, 3, 4, 5, 6, 7, 8, 9, 10, 11, 12] We previously found that bacterial contamination of HCWs' uniforms occurs within hours of putting on newly laundered uniforms.[12]
Literature on the effectiveness of antimicrobial HCW uniforms when tested in clinical settings is limited. Bearman and colleagues[23] recently published the results of a study of 31 subjects who wore either standard or antimicrobial scrubs, crossing over every 4 weeks for 4 months, with random culturing done weekly at the beginning and end of a work shift. Scrubs were laundered an average of 1.5 times/week, but the timing of the laundering relative to when cultures were obtained was not reported. Very few isolates of MRSA, Gram‐negative rods, or VRE were found (only 3.9%, 0.4%, and 0.05% of the 2000 samples obtained, respectively), and no differences were observed with respect to the number of HCWs who had antibiotic‐resistant organisms cultured when they were wearing standard versus antimicrobial scrubs. Those who had MRSA cultured, however, had lower mean log colony counts when they were wearing the antimicrobial scrubs. The small number of samples with positive isolates, together with differences in the extent of before‐shift contamination among groups complicates interpreting these data. The authors concluded that a prospective trial was needed. We attempted to include the scrub studied by Bearman and colleagues[23] in our study, but the company had insufficient stock available at the time we tried to purchase the product.
Gross and colleagues[24] found no difference in the mean colony counts of cultures taken from silver‐impregnated versus standard scrubs in a pilot crossover study done with 10 HCWs (although there were trends toward higher colony counts when the subjects wore antimicrobial scrubs).
Antibiotic‐resistant bacteria were only cultured from 3 participants (2.9%) in our current study, compared to 16% of those randomized to wearing white coats in our previous study and 20% of those randomized to wearing standard scrubs.[12] This difference may be explained by several recent studies reporting that rates of MRSA infections in hospitals are decreasing.[25, 26] The rate of hospital‐acquired MRSA infection or colonization at our own institution decreased 80% from 2007 to 2012. At the times of our previous and current studies, providers were expected to wear gowns and gloves when caring for patients as per standard contact precautions. Rates of infection and colonization of VRE and resistant Gram‐negative rods have remained low at our hospital, and our data are consistent with the rates reported on HCWs' uniforms in other studies.[2, 5, 10]
Only 6 of our subjects reported adverse reactions, but all were wearing antimicrobial scrubs (P=0.18). Several of the participants described that the fabrics of the 2 antimicrobial scrubs were heavier and less breathable than the standard scrubs. We believe this difference is more likely to explain the adverse reactions reported than is any type of reaction to the specific chemicals in the fabrics.
Our study has several limitations. Because it was conducted on the general internal medicine units of a single university‐affiliated public hospital, the results may not generalize to other types of institutions or other inpatient services.
As we previously described,[12] the RODAC imprint method only samples a small area of HCWs' uniforms and thus does not represent total bacterial contamination.[21] We specifically cultured areas that are known to be highly contaminated (ie, sleeve cuffs and pockets). Although imprint methods have limitations (as do other methods for culturing clothing), they have been commonly utilized in studies assessing bacterial contamination of HCW clothing.[2, 3, 5]
Although some of the bacterial load we cultured could have come from the providers themselves, previous studies have shown that 80% to 90% of the resistant bacteria cultured from HCWs' attire come from other sources.[1, 2]
Because our sample size was calculated on the basis of being able to detect a difference of 70% in total bacterial colony count, our study was not large enough to exclude a lower level of effectiveness. However, we saw no trends suggesting the antimicrobial products might have a lower level of effectiveness.
We did not observe the hand‐washing practices of the participants, and accordingly, cannot confirm that these practices were the same in each of our 3 study groups. Intermittent, surreptitious monitoring of hand‐washing practices on our internal medicine units over the last several years has found compliance with hand hygiene recommendations varying from 70% to 90%.
Although the participants in our study were not explicitly told to which scrub they were randomized, the colors, appearances, and textures of the antimicrobial fabrics were different from the standard scrubs such that blinding was impossible. Participants wearing antimicrobial scrubs could have changed their hand hygiene practices (ie, less careful hand hygiene). Lack of blinding could also have led to over‐reporting of adverse events by the subjects randomized to wear the antimicrobial scrubs.
In an effort to treat all the scrubs in the same fashion, all were tested new, prior to being washed or previously worn. Studying the scrubs prior to washing or wearing could have increased the reports of adverse effects, as the fabrics could have been stiffer and more uncomfortable than they might have been at a later stage in their use.
Our study also has some strengths. Our participants included physicians, residents, nurses, nurse practitioners, and physician assistants. Accordingly, our results should be generalizable to most HCWs. We also confirmed that the scrubs that were tested were nearly sterile prior to use.
In conclusion, we found no evidence suggesting that either of 2 antimicrobial scrubs tested decreased bacterial contamination of HCWs' scrubs or skin after an 8‐hour workday compared to standard scrubs. We also found that, although HCWs are frequently exposed to patients harboring antibiotic‐resistant bacteria, these bacteria were only rarely cultured from HCWs' scrubs or skin.
- , , , . Contamination of nurses' uniforms with Staphylococcus aureus. Lancet. 1969;2:233–235.
- , , . Contamination of protective clothing and nurses' uniforms in an isolation ward. J Hosp Infect. 1983;4:149–157.
- , , . Microbial flora on doctors' white coats. BMJ. 1991;303:1602–1604.
- . Bacterial contamination of nurses' uniforms: a study. Nursing Stand. 1998;13:37–42.
- , , . Bacterial flora on the white coats of medical students. J Hosp Infect. 2000;45:65–68.
- , , . Bacterial contamination of uniforms. J Hosp Infect. 2001;48:238–241.
- , , , et al. Significance of methicillin‐resistant Staphylococcus aureus (MRSA) survey in a university teaching hospital. J Infect Chemother. 2003;9:172–177.
- . Environmental contamination makes an important contribution to hospital infection. J Hosp Infect. 2007;65(suppl 2):50–54.
- , , , et al. Detection of methicillin‐resistant Staphylococcus aureus and vancomycin‐resistant enterococci on the gowns and gloves of healthcare workers. Infect Control Hosp Epidemiol. 2008;29:583–589.
- , , , , , . Bacterial contamination of health care workers' white coats. Am J Infect Control. 2009;37:101–105.
- , , , , , . Nursing and physician attire as possible source of nosocomial infections. Am J Infect Control. 2011;39:555–559.
- , , , , , . Newly cleaned physician uniforms and infrequently washed white coats have similar rates of bacterial contamination after an 8‐hour workday: a randomized controlled trial. J Hosp Med. 2011;6:177–182.
- , , , et al. Associations between bacterial contamination of health care workers' hands and contamination of white coats and scrubs. Am J Infect Control. 2012;40:e245–e248.
- Department of Health. Uniforms and workwear: an evidence base for developing local policy. National Health Service, 17 September 2007. Available at: http://www.dh.gov.uk/en/Publicationsandstatistics/Publications/Publicationspolicyandguidance/DH_078433. Accessed January 29, 2010.
- Scottish Government Health Directorates. NHS Scotland dress code. Available at: http://www.sehd.scot.nhs.uk/mels/CEL2008_53.pdf. Accessed February 10, 2010.
- Bio Shield Tech Web site. Bio Gardz–unisex scrub top–antimicrobial treatment. Available at: http://www.bioshieldtech.com/Bio_Gardz_Unisex_Scrub_Top_Antimicrobial_Tre_p/sbt01‐r‐p.htm. Accessed January 9, 2013.
- Doc Froc Web site and informational packet. Available at: http://www.docfroc.com. Accessed July 22, 2011.
- Vestagen Web site and informational packet. Available at: http://www.vestagen.com. Accessed July 22, 2011.
- Under Scrub apparel Web site. Testing. Available at: http://underscrub.com/testing. Accessed March 21, 2013.
- MediThreads Web site. Microban FAQ's. Available at: http://medithreads.com/faq/microban‐faqs. Accessed March 21, 2013.
- , , , , . Comparison of the Rodac imprint method to selective enrichment broth for recovery of vancomycin‐resistant enterococci and drug‐resistant Enterobacteriaceae from environmental surfaces. J Clin Microbiol. 2000;38:4646–4648.
- , , , , , . Research electronic data capture (REDCap)—a metadata‐driven methodology and workflow process for providing translational research informatics support. J Biomed Inform. 2009;42:377–381.
- , , , et al. A crossover trial of antimicrobial scrubs to reduce methicillin‐resistant Staphylococcus aureus burden on healthcare worker apparel. Infect Control Hosp Epidemiol. 2012;33:268–275.
- , , , , . Pilot study on the microbial contamination of conventional vs. silver‐impregnated uniforms worn by ambulance personnel during one week of emergency medical service. GMS Krankenhhyg Interdiszip. 2010;5.pii: Doc09.
- , , , et al. Epidemiology of Staphylococcus aureus blood and skin and soft tissue infections in the US military health system, 2005–2010. JAMA. 2012;308:50–59.
- , , , et al. Health care‐associated invasive MRSA infections, 2005–2008. JAMA. 2010;304:641–648.
Healthcare workers' (HCWs) attire becomes contaminated with bacterial pathogens during the course of the workday,[1, 2, 3, 4, 5, 6, 7, 8, 9, 10, 11, 12] and Munoz‐Price et al.[13] recently demonstrated that finding bacterial pathogens on HCWs' white coats correlated with finding the same pathogens on their hands. Because of concern for an association between attire colonization and nosocomial infection, governmental agencies in England and Scotland banned HCWs from wearing white coats or long‐sleeve garments,[14, 15] despite evidence that such an approach does not reduce contamination.[12]
Newly developed antimicrobial textiles have been incorporated into HCW scrubs,[16, 17, 18, 19, 20] and commercial Web sites and product inserts report that these products can reduce bacterial contamination by 80.9% at 8 hours to greater than 99% under laboratory conditions depending on the product and microbe studied.[16, 17, 19] Because there are limited clinical data pertaining to the effectiveness of antimicrobial scrubs, we performed a prospective study designed to determine whether wearing these products reduced bacterial contamination of HCWs' scrubs or skin at the end of an 8‐hour workday.
METHODS
Design
The study was a prospective, unblinded, randomized, controlled trial that was approved by the Colorado Multiple Institutional Review Board and conducted at Denver Health, a university‐affiliated public safety net hospital. No protocol changes occurred during the study.
Participants
Participants included hospitalist physicians, internal medicine residents, physician assistants, nurse practitioners, and nurses who directly cared for patients hospitalized on internal medicine units between March 12, 2012 and August 28, 2012. Participants known to be pregnant or those who refused to participate in the study were excluded.
Intervention
Standard scrubs issued by the hospital were tested along with 2 different antimicrobial scrubs (scrub A and scrub B). Scrub A was made with a polyester microfiber material embedded with a proprietary antimicrobial chemical. Scrub B was a polyestercotton blend scrub that included 2 proprietary antimicrobial chemicals and silver embedded into the fabric. The standard scrub was made of a polyestercotton blend with no antimicrobial properties. All scrubs consisted of pants and a short‐sleeved shirt, with either a pocket at the left breast or lower front surface, and all were tested new prior to any washing or wear. Preliminary cultures were done on 2 scrubs in each group to assess the extent of preuse contamination. All providers were instructed not to wear white coats at any time during the day that they were wearing the scrubs. Providers were not told the type of scrub they received, but the antimicrobial scrubs had a different appearance and texture than the standard scrubs, so blinding was not possible.
Outcomes
The primary end point was the total bacterial colony count of samples obtained from the breast or lower front pocket, the sleeve cuff of the dominant hand, and the pant leg at the midthigh of the dominant leg on all scrubs after an 8‐hour workday. Secondary outcomes were the bacterial colony counts of cultures obtained from the volar surface of the wrists of the HCWs' dominant arm, and the colony counts of methicillin‐resistant Staphylococcus aureus (MRSA), vancomycin‐resistant enterococci (VRE), and resistant Gram‐negative bacteria on the 3 scrub types, all obtained after the 8‐hour workday.
Cultures were collected using a standardized RODAC imprint method[21] with BBL RODAC plates containing blood agar (Becton Dickinson, Sparks, MD). Cultures were incubated in ambient air at 35 to 37C for 18 to 22 hours. After incubation, visible colonies were counted using a dissecting microscope to a maximum of 200 colonies as recommended by the manufacturer. Colonies morphologically consistent with Staphylococcus species were subsequently tested for coagulase using a BactiStaph rapid latex agglutination test (Remel, Lenexa, KS). If positive, these colonies were subcultured to sheep blood agar (Remel) and BBL MRSA CHROMagar (Becton Dickinson) and incubated for an additional 18 to 24 hours. Characteristic growth on blood agar that also produced mauve‐colored colonies on CHROMagar was taken to indicate MRSA. Colonies morphologically suspicious for being VRE were identified and confirmed as VRE using a positive identification and susceptibility panel (Microscan; Siemens, Deerfield, IL). A negative combination panel (Microscan, Siemens) was also used to identify and confirm resistant Gram‐negative rods.
Each participant completed a survey that included questions that identified their occupation, whether they had had contact with patients who were known to be colonized or infected with MRSA, VRE, or resistant Gram‐negative rods during the testing period, and whether they experienced any adverse events that might relate to wearing the uniform.
Sample Size
We assumed that cultures taken from the sleeve of the control scrubs would have a mean ( standard deviation) colony count of 69 (67) based on data from our previous study.[12] Although the companies making the antimicrobial scrubs indicated that their respective products provided between 80.9% at 8 hours and >99% reduction in bacterial colony counts in laboratory settings, we assumed that a 70% decrease in colony count compared with standard scrubs could be clinically important. After adjusting for multiple comparisons and accounting for using nonparametric analyses with an unknown distribution, we estimated a need to recruit 35 subjects in each of 3 groups.
Randomization
The principal investigator and coinvestigators enrolled and consented participants. After obtaining consent, block randomization, stratified by occupation, occurred 1 day prior to the study using a computer‐generated table of random numbers.
Statistics
Data were collected and managed using REDCap (Research Electronic Data Capture; Vanderbilt UniversityThe Institute for Medicine and Public Health, Nashville, TN) electronic data capture tools hosted at Denver Health. REDCap is a secure Web‐based application designed to support data collection for research studies, providing: (1) an intuitive interface for validated data entry, (2) audit trails for tracking data manipulation and export procedures, (3) automated export procedures for seamless data downloads to common statistical packages, and (4) procedures for importing data from external sources.[22]
Colony counts were compared using a Kruskal‐Wallis 1‐way analysis of variance by ranks. Bonferroni's correction for multiple comparisons resulted in a P<0.01 as indicating statistical significance. Proportions were compared using [2] analysis. All data are presented as medians with interquartile range (IQR) or proportions.
RESULTS
We screened 118 HCWs for participation and randomized 109, 37 in the control and antimicrobial scrub group A, and 35 in antimicrobial scrub group B (during the course of the study we neglected to culture the pockets of 2 participants in the standard scrub group and 2 in antimicrobial scrub group A). Because our primary end point was total colony count from cultures taken from 3 sites, data from these 4 subjects could not be used, and all the data from these 4 subjects were excluded from the primary analysis; 4 additional subjects were subsequently recruited allowing us to meet our block enrollment target (Figure 1). The first and last participants were studied on March 12, 2012 and August 28, 2012, respectively. The trial ended once the defined number of participants was enrolled. The occupations of the 105 participants are summarized in Table 1.
| All Subjects, N=105 | Standard Scrub, n=35 | Antimicrobial Scrub A, n=35 | Antimicrobial Scrub B, n=35 | |
|---|---|---|---|---|
| Healthcare worker type, n (%) | ||||
| Attending physician | 11 (10) | 5 (14) | 3 (9) | 3 (9) |
| Intern/resident | 51 (49) | 17 (49) | 16 (46) | 18 (51) |
| Midlevels | 6 (6) | 2 (6) | 2 (6) | 2 (6) |
| Nurse | 37 (35) | 11 (31) | 14 (40) | 12 (34) |
| Cared for colonized or infected patient with antibiotic resistant organism, n (%) | 55 (52) | 16 (46) | 20 (57) | 19 (54) |
| Number of colonized or infected patients cared for, n (%) | ||||
| 1 | 37 (67) | 10 (63) | 13 (65) | 14 (74) |
| 2 | 11 (20) | 4 (25) | 6 (30) | 1 (5) |
| 3 or more | 6 (11) | 2 (12) | 1 (5) | 3 (16) |
| Unknown | 1 (2) | 0 (0) | 0 (0) | 1 (5) |
Colony counts of all scrubs cultured prior to use never exceeded 10 colonies. The median (IQR) total colony counts from all sites on the scrubs was 99 (66182) for standard scrubs, 137 (84289) for antimicrobial scrub type A, and 138 (62274) for antimicrobial scrub type B (P=0.36). We found no significant differences between the colony counts cultured from any of the individual sites among the 3 groups, regardless of occupation (Table 2). No significant difference was observed with respect to colony counts cultured from the wrist among the 3 study groups (Table 2). Comparisons between groups were planned a priori if a difference across all groups was found. Given the nonsignificant P values across all scrub groups, no further comparisons were made.
| Total (From All Sites on Scrubs) | Sleeve Cuff | Thigh | Wrist | ||
|---|---|---|---|---|---|
| |||||
| All subjects, N=105 | |||||
| Standard scrub | 99 (66182) | 41 (2070) | 20 (944) | 32 (2161) | 16 (540) |
| Antimicrobial scrub A | 137 (84289) | 65 (35117) | 33 (16124) | 41 (1586) | 23 (442) |
| Antimicrobial scrub B | 138 (62274) | 41 (2299) | 21 (941) | 40 (18107) | 15 (654) |
| P value | 0.36 | 0.17 | 0.07 | 0.57 | 0.92 |
| Physicians and midlevels, n=68 | |||||
| Standard scrub | 115.5 (72.5173.5) | 44.5 (2270.5) | 27.5 (10.538.5) | 35 (2362.5) | 24.5 (755) |
| Antimicrobial scrub A | 210 (114289) | 86 (64120) | 39 (18129) | 49 (2486) | 24 (342) |
| Antimicrobial scrub B | 149 (68295) | 52 (26126) | 21 (1069) | 37 (18141) | 19 (872) |
| P value | 0.21 | 0.08 | 0.19 | 0.85 | 0.76 |
| Nurses, n=37 | |||||
| Standard scrub | 89 (31236) | 37 (1348) | 13 (552) | 28 (1342) | 9 (321) |
| Antimicrobial scrub A | 105 (43256) | 45.5 (2258) | 21.5 (1654) | 38.5 (1268) | 17 (643) |
| Antimicrobial scrub B | 91.5 (60174.5) | 27 (1340) | 16 (7.526) | 51 (2186.5) | 10 (3.543.5) |
| P value | 0.86 | 0.39 | 0.19 | 0.49 | 0.41 |
Fifty‐five participants (52%) reported caring for patients who were known to be colonized or infected with an antibiotic‐resistant organism, 16 (46%) randomized to wear standard scrubs, and 20 (57%) and 19 (54%) randomized to wear antimicrobial scrub A or B, respectively (P=0.61). Of these, however, antibiotic‐resistant organisms were only cultured from the scrubs of 2 providers (1 with 1 colony of MRSA from the breast pocket of antimicrobial scrub A, 1 with 1 colony of MRSA cultured from the pocket of antimicrobial scrub B [P=0.55]), and from the wrist of only 1 provider (a multiresistant Gram‐negative rod who wore antimicrobial scrub B).
Adverse Events
Six subjects (5.7%) reported adverse events, all of whom were wearing antimicrobial scrubs (P=0.18). For participants wearing antimicrobial scrub A, 1 (3%) reported itchiness and 2 (6%) reported heaviness or poor breathability. For participants wearing antimicrobial scrub B, 1 (3%) reported redness, 1 (3%) reported itchiness, and 1 (3%) reported heaviness or poor breathability.
DISCUSSION
The important findings of this study are that we found no evidence indicating that either of the 2 antimicrobial scrubs tested reduced bacterial contamination or antibiotic‐resistant contamination on HCWs' scrubs or wrists compared with standard scrubs at the end of an 8‐hour workday, and that despite many HCWs being exposed to patients who were colonized or infected with antibiotic‐resistant bacteria, these organisms were only rarely cultured from their uniforms.
We found that HCWs in all 3 arms of the study had bacterial contamination on their scrubs and skin, consistent with previous studies showing that HCWs' uniforms are frequently contaminated with bacteria, including MRSA, VRE, and other pathogens.[1, 2, 3, 4, 5, 6, 7, 8, 9, 10, 11, 12] We previously found that bacterial contamination of HCWs' uniforms occurs within hours of putting on newly laundered uniforms.[12]
Literature on the effectiveness of antimicrobial HCW uniforms when tested in clinical settings is limited. Bearman and colleagues[23] recently published the results of a study of 31 subjects who wore either standard or antimicrobial scrubs, crossing over every 4 weeks for 4 months, with random culturing done weekly at the beginning and end of a work shift. Scrubs were laundered an average of 1.5 times/week, but the timing of the laundering relative to when cultures were obtained was not reported. Very few isolates of MRSA, Gram‐negative rods, or VRE were found (only 3.9%, 0.4%, and 0.05% of the 2000 samples obtained, respectively), and no differences were observed with respect to the number of HCWs who had antibiotic‐resistant organisms cultured when they were wearing standard versus antimicrobial scrubs. Those who had MRSA cultured, however, had lower mean log colony counts when they were wearing the antimicrobial scrubs. The small number of samples with positive isolates, together with differences in the extent of before‐shift contamination among groups complicates interpreting these data. The authors concluded that a prospective trial was needed. We attempted to include the scrub studied by Bearman and colleagues[23] in our study, but the company had insufficient stock available at the time we tried to purchase the product.
Gross and colleagues[24] found no difference in the mean colony counts of cultures taken from silver‐impregnated versus standard scrubs in a pilot crossover study done with 10 HCWs (although there were trends toward higher colony counts when the subjects wore antimicrobial scrubs).
Antibiotic‐resistant bacteria were only cultured from 3 participants (2.9%) in our current study, compared to 16% of those randomized to wearing white coats in our previous study and 20% of those randomized to wearing standard scrubs.[12] This difference may be explained by several recent studies reporting that rates of MRSA infections in hospitals are decreasing.[25, 26] The rate of hospital‐acquired MRSA infection or colonization at our own institution decreased 80% from 2007 to 2012. At the times of our previous and current studies, providers were expected to wear gowns and gloves when caring for patients as per standard contact precautions. Rates of infection and colonization of VRE and resistant Gram‐negative rods have remained low at our hospital, and our data are consistent with the rates reported on HCWs' uniforms in other studies.[2, 5, 10]
Only 6 of our subjects reported adverse reactions, but all were wearing antimicrobial scrubs (P=0.18). Several of the participants described that the fabrics of the 2 antimicrobial scrubs were heavier and less breathable than the standard scrubs. We believe this difference is more likely to explain the adverse reactions reported than is any type of reaction to the specific chemicals in the fabrics.
Our study has several limitations. Because it was conducted on the general internal medicine units of a single university‐affiliated public hospital, the results may not generalize to other types of institutions or other inpatient services.
As we previously described,[12] the RODAC imprint method only samples a small area of HCWs' uniforms and thus does not represent total bacterial contamination.[21] We specifically cultured areas that are known to be highly contaminated (ie, sleeve cuffs and pockets). Although imprint methods have limitations (as do other methods for culturing clothing), they have been commonly utilized in studies assessing bacterial contamination of HCW clothing.[2, 3, 5]
Although some of the bacterial load we cultured could have come from the providers themselves, previous studies have shown that 80% to 90% of the resistant bacteria cultured from HCWs' attire come from other sources.[1, 2]
Because our sample size was calculated on the basis of being able to detect a difference of 70% in total bacterial colony count, our study was not large enough to exclude a lower level of effectiveness. However, we saw no trends suggesting the antimicrobial products might have a lower level of effectiveness.
We did not observe the hand‐washing practices of the participants, and accordingly, cannot confirm that these practices were the same in each of our 3 study groups. Intermittent, surreptitious monitoring of hand‐washing practices on our internal medicine units over the last several years has found compliance with hand hygiene recommendations varying from 70% to 90%.
Although the participants in our study were not explicitly told to which scrub they were randomized, the colors, appearances, and textures of the antimicrobial fabrics were different from the standard scrubs such that blinding was impossible. Participants wearing antimicrobial scrubs could have changed their hand hygiene practices (ie, less careful hand hygiene). Lack of blinding could also have led to over‐reporting of adverse events by the subjects randomized to wear the antimicrobial scrubs.
In an effort to treat all the scrubs in the same fashion, all were tested new, prior to being washed or previously worn. Studying the scrubs prior to washing or wearing could have increased the reports of adverse effects, as the fabrics could have been stiffer and more uncomfortable than they might have been at a later stage in their use.
Our study also has some strengths. Our participants included physicians, residents, nurses, nurse practitioners, and physician assistants. Accordingly, our results should be generalizable to most HCWs. We also confirmed that the scrubs that were tested were nearly sterile prior to use.
In conclusion, we found no evidence suggesting that either of 2 antimicrobial scrubs tested decreased bacterial contamination of HCWs' scrubs or skin after an 8‐hour workday compared to standard scrubs. We also found that, although HCWs are frequently exposed to patients harboring antibiotic‐resistant bacteria, these bacteria were only rarely cultured from HCWs' scrubs or skin.
- , , , . Contamination of nurses' uniforms with Staphylococcus aureus. Lancet. 1969;2:233–235.
- , , . Contamination of protective clothing and nurses' uniforms in an isolation ward. J Hosp Infect. 1983;4:149–157.
- , , . Microbial flora on doctors' white coats. BMJ. 1991;303:1602–1604.
- . Bacterial contamination of nurses' uniforms: a study. Nursing Stand. 1998;13:37–42.
- , , . Bacterial flora on the white coats of medical students. J Hosp Infect. 2000;45:65–68.
- , , . Bacterial contamination of uniforms. J Hosp Infect. 2001;48:238–241.
- , , , et al. Significance of methicillin‐resistant Staphylococcus aureus (MRSA) survey in a university teaching hospital. J Infect Chemother. 2003;9:172–177.
- . Environmental contamination makes an important contribution to hospital infection. J Hosp Infect. 2007;65(suppl 2):50–54.
- , , , et al. Detection of methicillin‐resistant Staphylococcus aureus and vancomycin‐resistant enterococci on the gowns and gloves of healthcare workers. Infect Control Hosp Epidemiol. 2008;29:583–589.
- , , , , , . Bacterial contamination of health care workers' white coats. Am J Infect Control. 2009;37:101–105.
- , , , , , . Nursing and physician attire as possible source of nosocomial infections. Am J Infect Control. 2011;39:555–559.
- , , , , , . Newly cleaned physician uniforms and infrequently washed white coats have similar rates of bacterial contamination after an 8‐hour workday: a randomized controlled trial. J Hosp Med. 2011;6:177–182.
- , , , et al. Associations between bacterial contamination of health care workers' hands and contamination of white coats and scrubs. Am J Infect Control. 2012;40:e245–e248.
- Department of Health. Uniforms and workwear: an evidence base for developing local policy. National Health Service, 17 September 2007. Available at: http://www.dh.gov.uk/en/Publicationsandstatistics/Publications/Publicationspolicyandguidance/DH_078433. Accessed January 29, 2010.
- Scottish Government Health Directorates. NHS Scotland dress code. Available at: http://www.sehd.scot.nhs.uk/mels/CEL2008_53.pdf. Accessed February 10, 2010.
- Bio Shield Tech Web site. Bio Gardz–unisex scrub top–antimicrobial treatment. Available at: http://www.bioshieldtech.com/Bio_Gardz_Unisex_Scrub_Top_Antimicrobial_Tre_p/sbt01‐r‐p.htm. Accessed January 9, 2013.
- Doc Froc Web site and informational packet. Available at: http://www.docfroc.com. Accessed July 22, 2011.
- Vestagen Web site and informational packet. Available at: http://www.vestagen.com. Accessed July 22, 2011.
- Under Scrub apparel Web site. Testing. Available at: http://underscrub.com/testing. Accessed March 21, 2013.
- MediThreads Web site. Microban FAQ's. Available at: http://medithreads.com/faq/microban‐faqs. Accessed March 21, 2013.
- , , , , . Comparison of the Rodac imprint method to selective enrichment broth for recovery of vancomycin‐resistant enterococci and drug‐resistant Enterobacteriaceae from environmental surfaces. J Clin Microbiol. 2000;38:4646–4648.
- , , , , , . Research electronic data capture (REDCap)—a metadata‐driven methodology and workflow process for providing translational research informatics support. J Biomed Inform. 2009;42:377–381.
- , , , et al. A crossover trial of antimicrobial scrubs to reduce methicillin‐resistant Staphylococcus aureus burden on healthcare worker apparel. Infect Control Hosp Epidemiol. 2012;33:268–275.
- , , , , . Pilot study on the microbial contamination of conventional vs. silver‐impregnated uniforms worn by ambulance personnel during one week of emergency medical service. GMS Krankenhhyg Interdiszip. 2010;5.pii: Doc09.
- , , , et al. Epidemiology of Staphylococcus aureus blood and skin and soft tissue infections in the US military health system, 2005–2010. JAMA. 2012;308:50–59.
- , , , et al. Health care‐associated invasive MRSA infections, 2005–2008. JAMA. 2010;304:641–648.
© 2013 Society of Hospital Medicine
Low Concordance for Site of Death
At the turn of the 20th century, most deaths in the United States occurred at home. By the 1960s, over 70% of deaths occurred in an institutional setting, reflecting an evolution of medical technology.[1, 2, 3] With the birth of the hospice movement in the 1970s, dying patients had the opportunity to have both death at home and aggressive symptom control at the end of life. Although there has been a slow decline in the proportion of deaths that occur in the hospital over the past 2 decades,[3] the overwhelming majority of persons state that they would prefer to die at home. However, recent findings suggest that most people will die in an institutional setting.[3, 4, 5, 6]
Although good data exist describing population preferences for location of death, and we know, based on death records, where deaths occur in the United States, there are few studies that examine concordance between preferred and actual site of death at the individual patient level. Furthermore, although factors have been identified that predict death at home, factors predicting concordance between preferred and actual site of death are not well described.[3, 6, 7, 8, 9, 10, 11, 12, 13]
Regardless of where death ultimately occurs, most adults will experience multiple hospitalizations within the last years of their life. Understanding the preferences and subsequent experiences of this population is of particular relevance to hospitalist physicians who are in a unique position to elicit goals from seriously ill patients and help match patient preferences with their medical care. In this observational study, we sought to determine preferences for site of death in a cohort of adult patients admitted to the hospital for medical illness, and then follow those patients to determine where death occurred for those who died. We also sought to explore factors that may predict concordance between preferred and actual site of death. We hypothesized that ethnic diversity and lower socioeconomic status would be associated with a lower likelihood of concordance between preferred and actual site of death. We also hypothesized that advanced care planning would be associated with a higher likelihood of concordance. The Colorado Multi‐Institutional Review Board approved this study.
METHODS
Participants were recruited from 3 hospitals affiliated with the University of Colorado School of Medicine Internal Medicine Residency program, including the Denver Veterans' Administration Center (DVAMC), Denver Health Medical Center (DHMC), and University of Colorado Hospital (UCH). The DVAMC is a large urban Veterans Administration hospital, serving veterans from the Denver metro area, and is a tertiary referral center for veterans in rural Colorado, Wyoming, and parts of Montana. DHMC, the safety‐net hospital for the Denver area, serves over 25% of the residents in the city and county of Denver, including such special populations as the indigent, chronically mentally ill, and persons with polysubstance dependence. UCH had 350 licensed beds at the time of our study and serves as the Rocky Mountain region's only academic tertiary, specialty care, and referral center. At the time of this study, there was limited inpatient palliative care services at the DVAMC and UH, and no palliative care services at DHMC. Participants were screened on the first day following admission to the adult general medical service. Participants were recruited on 96 postadmission days between February 2004 and June 2006. Recruitment days varied from Monday through Friday, to include admissions from the weekend and throughout the year to reduce potential bias due to seasonal trends of diseases such as influenza. Patients were excluded if they died or were discharged within the first 24 hours of admission, were pregnant, jailed, or unable to give informed consent. All other patients were approached and invited to participate in a brief survey.
After informed consent was obtained, participants completed a bedside interview that included self‐identified ethnicity and the Berkman‐Syme Social Network Index,[14] a brief questionnaire quantifying social support from spouse or domestic partner, family, friends, and other religious or secular organizations. Baseline socioeconomic measures (eg, income, employment, home ownership, car ownership) and questions related to the last days of life were also included. Participants were asked the following question, If you were very sick, with an illness that could not be cured, and in bed most of the time, where would you spend the last days of your life if you could chose?
For each participant, we performed a detailed chart review to determine demographic data, presence of advance directives, and CARING criteria (Cancer, Admissions 2, Residence in a nursing home, Intensive care unit admit with multiorgan failure, 2 Noncancer hospice Guidelines), a set of prognostic criteria identifying patients at an index hospitalization who have a high burden of illness and are at risk for death in the following year.[15] We then followed patients for 5 years. If participants died within the follow‐up period, we collected the date and location of death using medical records, death certificates, or in a few cases when official death records were unavailable, direct contact with the family. Participants were considered alive if they had a clinic visit or MD/RN phone contact within 3 months prior to the final collection point date.
Analysis
SAS 9.1 (SAS Institute Inc., Cary, NC) was used for all analyses. Simple frequencies and means statistics were used to determine rates of descriptive characteristics of the sample as well as rates of the measured outcomes, preferred place to spend last days of life, and actual site of death. Agreement or concordance between preferred and actual site of death was calculated. For the purposes of the analysis, we assumed all persons who stated they had no preference died in a place concordant with their wishes. To calculate agreement by preferred and actual site, participants who expressed a preference and died (n=111) in hospital, nursing home, home, or hospice setting were included in the analysis, and participants (n=4) who died in an unknown or other locations were excluded (eg, motel room).
Logistic Regression Modeling
2 tests were performed for all categorical variables to determine a significant association with outcome variables. Preferred place of death and concordance between preferred and actual site of death were modeled using predictive variables selected if univariable association demonstrated a P0.25. This standard cutoff was selected to broadly identify candidate variables for logistic regression modeling.[16] A stepwise algorithm was used to select significant predictors that would remain in the model.
In lieu of fitting a multinomial logit model for preferred site of death of home vs hospital vs nursing home or hospice facility as preferred site of death, 3 logit models (although only 2 may be sufficient to estimate the underlying multinomial logit model[17]) were considered with outcome categories: home vs nursing home or hospice facility, and hospital vs nursing home or hospice facility and home vs hospital.
For the logistic regression modeling of concordance, we included the full sample of patients who died during the follow‐up period (n=123). We classified participants as dying in a place concordant with their wishes or not concordant.
RESULTS
Study Population
Subjects were recruited on 96 post‐admission days totaling 842 admissions. Three hundred thirty‐one patients (39%) were ineligible for study participation (n=175 discharged within 24 hours, n=76 unable to consent, n=78 ineligible for other reasons [eg, prisoner, pregnant, under 18 years old], n=2 died within 24 hours of admission). Only 53 of the remaining 511 (10%) patients refused; 458 patients (90%) gave informed consent to participate. Characteristics of the study population are depicted in Table 1. There were very few missing cases (<3%), that is persons without a recent clinic follow‐up date, contact, or a confirmed date of death. These persons were considered alive. Overall, the sample population was ethnically diverse, slightly older than middle age, mostly male (due to the inclusion of the Veterans Administration hospital), and of low socioeconomic status.
| Mean age (SD), y | 57.9 (14.8) |
|---|---|
| |
| Mean time to death (SD), d | 339.5 (348.4) |
| Ethnicity | |
| African American | 19% (88) |
| Caucasian | 52% (239) |
| Latino | 22% (102) |
| Other | 6% (29) |
| Spanish language only | 6% (27) |
| Female gender | 35% (159) |
| Admitted to DVAMC | 41% (188) |
| Admitted to DHMC | 38% (174) |
| Admitted to UCH | 21% (96) |
| CARING criteria | |
| Cancer diagnosis | 11% (51) |
| Admitted to hospital 2 times in the past year for chronic illness | 40% (181) |
| Resident in a nursing home | 2% (9) |
| Noncancer hospice guidelines (meeting 2) | 13% (59) |
| Income <$30,000/year | 84% (377) |
| No greater than high school education | 55% (248) |
| Home owner | 26% (120) |
| Rents home | 39% (177) |
| Unstable living situationa | 34% (156) |
| Low social supportb | 36% (165) |
| Uninsured | 18% (81) |
| Regular primary care provider | 73% (330) |
Preferred Site of Death
When asked where they preferred to spend the last days of their life, 75% of patients (n=343) stated they would like to be at home. In the hospital was the preferred location for 10% of patients, whereas 6% stated a nursing home and 4% a hospice inpatient facility. Two percent stated they had no preference, and 3% refused to answer (Figure 1)

We found that in the univariable analysis the following factors were associated with preference for site of death at a significance level of P<0.25: unstable housing, hospital setting, income level, ethnicity, CARING criteria, presence of an advance directive, education level, married, primary care provider, and presence of public insurance. Results of the logit models (home vs nursing home or hospice facility, and hospital vs nursing home or hospice facility and home vs hospital) are presented in Table 2.
| Adjusted Odds Ratio (95% Confidence Interval) | |||
|---|---|---|---|
| Home vs Nursing Home/Hospice Facility | Hospital vs Nursing Home/Hospice Facility | Home vs Hospital | |
| |||
| Low income | 2.71 (1.305.67) | 3.05 (1.019.24) | 0.99 (0.422.37) |
| Married | 2.44 (1.145.21) | 2.40 (0.876.62) | 0.82 (0.421.57) |
| CARING criteria | 0.58 (0.301.14) | 0.44 (0.181.09) | 0.89 (0.471.66) |
Patients with income <$30,000/year were more likely to prefer home (or hospital) over a nursing home or hospice facility. Being married was predictive of preferring home over nursing home or hospice facility. Patients meeting 1 of the CARING criteria trended toward being less likely (P=0.11 for home and P=0.08 for hospital) to prefer home (or hospital) vs nursing home or hospice facility. However, there were no significant predictors for a preference for home or hospital when directly comparing the 2 locations, as expected from observing similar effects of variables in the other 2 logit models.
Actual Site of Death
One hundred twenty‐three patients died during the follow‐up period (26% of the total sample). Of those who died, the mean age was 64 years (standard deviation 13), 82% had annual incomes <$30,000, 73% were men, and 77% met at least 1 of the CARING criteria suggesting advanced medical illness. The distribution of ethnicities of the deceased subsample was similar to that of the overall cohort. Complete death records were obtained for 121 patients. Only 31% (n=38) died at home, whereas 35% (n=42) died in a hospital, 20% (n=24) died in a nursing home, and 12% (n=14) died in an inpatient hospice facility (Figure 1).
In univariable analysis, there were no associations at a 25% significance level between actual site of death and ethnicity, gender, age, severity of illness, high vs low social support, high or low socioeconomic status, stable vs unstable housing, or presence of a completed advance directive in the medical record.
Concordance Between Preferred and Actual Site of Death
Overall, 37% of the patients died where they stated they would prefer to die, including the 2 with no preference. Concordance rates for each site of death are presented in Table 3. We examined sociodemographic variables, disease severity, advance‐care planning, primary care provider, health insurance, and hospital site to look for associations with concordance. We found that female gender was positively associated with concordance (odds ratio [OR], 3.30; 95% confidence interval [CI], 1.25‐8.72). CARING criteria (P=0.06) and Latino ethnicity (vs all other ethnicity categories, P=0.12) also showed trends for association. Restricting to those who preferred home, the associations became stronger (OR, 4.62; 95% CI, 1.44‐14.79 for female; OR, 7.72; 95% CI, 1.67‐35.71 for CARING criteria), and the trend for the negative association between Latino ethnicity and concordance remained (P=0.12). Results of the model are shown in Table 4.
| Actual Site of Death, n (Row %) | Row Total, % Out of 111 | ||||
|---|---|---|---|---|---|
| Hospital | Nursing Home | Home | Hospice Facility | ||
| Preferred hospital | 5 (42%) | 3 (25%) | 2 (17%) | 2 (17%) | 12 (11%) |
| Preferred nursing home | 1 (13%) | 5 (63%) | 2 (25%) | 0 | 8 (7%) |
| Preferred home | 30 (34%) | 15 (17%) | 31 (35%) | 12 (14%) | 88 (79%) |
| Preferred hospice facility | 3 (100%) | 0 | 0 | 0 | 3 (3%) |
| Adjusted Odds Ratio (95% Confidence Interval) | |||
|---|---|---|---|
| All | Home (Using Same Variables) | Home (Using Only Significant Variables) | |
| |||
| Female gender | 3.30 (1.258.72) | 4.62 (1.4414.79) | 3.57 (1.2410.34) |
| CARING criteria | 3.09 (0.979.81) | 7.72 (1.6735.71) | 5.93 (1.4124.91) |
| Latino vs African American/Caucasian/other | 0.43 (0.151.24) | 0.35 (0.091.30) | |
DISCUSSION
We found, similarly to previous reports in the literature, the majority of patients preferred to die at home. We did not find a significant difference in preferences or location of death by ethnicity or illness severity. Lower‐income patients and married patients were more likely to prefer to be at home over a nursing home or a hospice facility in the last days of life. We found that the minority of patients died at their stated preferred site of death, and female gender was the only predictive variable we found to distinguish those patients who died in a place concordant with their wishes compared to those who did not.
In the literature, previous studies have reported concordance rates between preferred and actual site of death that range from 30% to 90%.[12, 13, 18, 19, 20, 21, 22, 23, 24] We found a concordance rate at the lowest end of this spectrum. In trying to understand our findings and place them in context, it is helpful to examine other studies. Many of these studies focused solely on cancer patients.[13, 18, 19, 20, 21, 22, 23] Cancer follows a more predictable trajectory of decline compared to other common life‐threatening illnesses, such as cardiac disease, emphysema, or liver failure, that often involve periods of acute deteriorations and plateaus throughout illness progression. The more predictable trajectory may explain the overall higher concordance rates found in the studies involving cancer patients.
The majority of studies in the literature examining concordance between preferred and actual site of death recruited the study sample from home health or home palliative care programs that were providing support and care to participants.[10, 12, 13, 18, 22, 25, 26, 27] The high concordance rates reported may be the result of the patients in the sample receiving services at home aimed at eliciting preferences and providing support at home. Our observational study is unique in that we elicited patient preferences from a diverse group of hospitalized adults. Patients had a broad range of medical illness and were at various stages in their disease trajectory. This allowed our findings to be more generalizable, a major strength of our study.
The only variable associated with concordance that we identified to predict concordance between preferred and actual site of death was female gender. Women have been shown to be more active in medical decision making, which may explain our findings.[28] Female gender and illness severity (as measured by the CARING criteria) were found to be associated with concordance when the preference is for death at home. For persons with more advanced medical illness, they may have had more opportunity to consider their preferences and talk about these preferences. It is even possible that our interview prompted some participants to have discussions with their families or providers.
Variables with high face validity, such as high social support, higher education, and completing an advance directive, did not demonstrate any effect on the outcome of concordance. Other studies have shown that low functional status, Caucasian ethnicity, home care, higher education, and social support have been associated with a greater likelihood for a home death.[3, 6, 9] However, although studies specifically examining concordance between preferred and actual site of death have looked at predictors for home death, we were unable to find predictors for concordance across all preferences in the literature. We can conclude from our findings that the factors that influence concordance of preferences for site of death are extremely complex and difficult to capture and measure. This is extremely unsatisfying in the face of the low concordance rate of 30% we identified.
Latino ethnicity showed a trend toward having a negative association with concordance between preferred and actual site of death. This trend persisted whether it was concordance overall or for concordance with those who preferred a death at home. In the literature, Latinos have been found to be less likely to complete advance directives, use hospice services at the end of life, and are more likely to experience a hospital death.[29, 30, 31, 32, 33] As care at the end of life continues to improve, careful attention should be paid to ensure that these kinds of gaps do not widen any further.
We interviewed patients at an index hospitalization. Patients had an acute medical illness or an exacerbation of a chronic medical illness and required at least 24 hours of hospitalization to be eligible for inclusion. Our bedside interview made use of an opportune time to question patients, a time when it may have been easier for patients to visualize severe illness at the end of life, rather than asking this question during a time of wellness. Although participants overwhelmingly stated they preferred to be at home, for those who died, decisions were made in their care that did not allow for this preference.
Our follow‐up after the initial bedside interview only included death records of where and when participants died. We do not have the details and narrative of the conversations that may have taken place that led to the care decisions that determined participants' actual place of death. We do not know if preferences were elicited or discussed, and care decisions then negotiated, to best meet the goals and preferences expressed at that time. We also do not know if the conversations did not occur and the default of medical intervention and cure‐focused care dictated how participants spent the last days of their life. There is evidence that when conversations about goals and preferences do occur, concordance between preferences and care received are high.[12, 21]
We were unable to identify any predictors beyond gender in this cohort of adults hospitalized with a broad spectrum of severe medical illness to predict concordance with stated preferences and actual site of death. We can conclude then, based on our findings and supported by the literature, that the default trends toward institutional end‐of‐life experiences. To shift to a more patient‐centered approach, away from the default, healthcare providers need to embrace a palliative approach and incorporate preferences and goals into the discussions about next steps of care to facilitate the peaceful death that the majority of patients imagine for themselves. Hospitalist physicians have a unique opportunity at an index hospitalization to start the conversation about preferences for care including where patients would want to spend the last days of their life.
Our study does have some limitations. We elicited preferences at a single point in time, at an index hospitalization. It is possible that participants' preferences changed over the course of their illness. However, in Agar et al.'s study of longitudinal patient preferences for site of death and place of care, most preferences remained stable over time.[18] We also did not have data that included palliative care involvement, homecare or hospice utilization, or cause of death. All of these variables may be important predictors of concordance. Issues of symptom management and lack of caregiver may also dictate place of death, even when goals and care are aligned. We do not have data to address these components of end‐of‐life decision making.
CONCLUSION
Patients continue to express a preference for death at home. However, the majority of patients experienced an institutional death. Furthermore, few participants achieved concordance with where they preferred to die and where they actually died. Female gender was the sole factor associated with concordance between preferred and actual site of death. Incorporating a palliative approach that elicits goals and helps match goals to care, may offer the best opportunity to help people die where they chose.
Disclosures: This research was supported by the Brookdale National Fellowship Award and the NIA/Beeson grant 5K23AG028957. All authors have seen and agree with the contents of the article. This submission was not under review by any other publication. The authors have no financial interest or other potential conflicts of interest.
- Field MJ, Cassel CK, eds. Committee on Care at the End of Life. Approaching Death: Improving Care at the End of Life. Washington DC: National Academy Press; 1997.
- , . Demography and epidemiology of dying in the U.S. with emphasis on deaths of older persons. Hosp J. 1998;13:49–60.
- , , , . Factors associated with site of death: a national study of where people die. Med Care. 2003;41:323–335.
- , , , , , . Terminal cancer care and patient's preferences for place of death: a prospective study. BMJ. 1990;301:415–417.
- , , , et al. Influence of patient preferences and local health system characteristics on the place of death. SUPPORT Investigators. Study to Understand Prognoses and Preferences for Risks and Outcomes of Treatment. J Am Geriatr Soc. 1998;46:1242–1250.
- , , , , , . Where people die: a multilevel approach to understanding influences on site of death in America. Med Care Res Rev. 2007;64:351–378.
- , , , , , . Dying at home or in an institution using death certificates to explore the factors associated with place of death. Health Policy. 2006;78:319–329.
- , . How do cancer patients who die at home differ from those who die elsewhere? Palliat Med. 1998;12:279–286.
- , . Factors influencing death at home in terminally ill patients with cancer: systematic review [published correction appears in BMJ. 2006;332:1012]. BMJ 2006;332:515–521.
- , , , , , . Predictive factors for home deaths among cancer patients in Swedish palliative home care. Support Care Cancer. 2003;11:560–567.
- , . Systemic adenosine infusions alleviated neuropathic pain. Pain. 2001;94:121–122.
- , , . Prevalence, effectiveness, and predictors of planning their place of death among older persons followed in community‐based long term care. J Am Geriatr Soc. 2000;48:943–948.
- , , , , . Preferences for place of care and place of death among informal caregivers of the terminally ill. Palliat Med. 2005;19:492–499.
- , . Social networks, host resistance, and mortality: a nine‐year follow‐up study of Alameda County residents. Am J Epidemiol. 1979;109:186–204.
- , , , , , . A practical tool to identify patients who may benefit from a palliative approach: the CARING criteria. J Pain Symptom Manage. 2006;31:285–292.
- , . Applied Logistic Regression. 2nd ed. New York, NY: Wiley‐Interscience; 2000.
- , . Calculation of polychotmous logistic regression parameters using individualized regressions. Biometrika. 1984;71:11–18.
- , , , , , . Preference for place of care and place of death in palliative care: are these different questions? Palliat Med. 2008;22(7):787–795.
- , , . Place of death: preferences among cancer patients and their carers. Soc Sci Med. 2004;58:2431–2444.
- , . Determinants of congruence between the preferred and actual place of death for terminally ill cancer patients. J Palliat Care. 2003;19:230–237.
- , , . Factors associated with location of death (home or hospital) of patients referred to a palliative care team. CMAJ. 1995;152:361–367.
- , , , et al. Proxy perspectives regarding end‐of‐life care for persons with cancer. Cancer. 2008;112:1854–1861.
- , , , , , . Actual and preferred place of death of cancer patients. Results from the Italian survey of the dying of cancer (ISDOC). J Epidemiol Community Health. 2006;60:412–416.
- , , , . Family reports of barriers to optimal care of the dying. Nurs Res. 2000;49:310–317.
- , , . Place of death: preferences among cancer patients and their carers. Soc Sci Med. 2004;58(12):2431–2444.
- , . Where do elderly patients prefer to die? Place of death and patient characteristics of 100 elderly patients under the care of a home health care team. J Am Geriatr Soc. 1983;31:457–461.
- , , , , , . Predictors of home death in palliative care cancer patients. J Palliat Care. 2000;16:23–28.
- , . Patient preferences for medical decision making: who really wants to participate? Med Care. 2000;38:335–341.
- , , , et al. Racial and ethnic differences in advance care planning among patients with cancer: impact of terminal illness acknowledgment, religiousness, and treatment preferences. J Clin Oncol. 2008;26:4131–4137.
- , , , . Influence of ethnicity on advance directives and end‐of‐life decisions. JAMA. 1997;277:298–299.
- , , , . Differences in end‐of‐life decision making among black and white ambulatory cancer patients. J Gen Intern Med. 1996;11:651–656.
- , , . Hospice usage by minorities in the last year of life: results from the National Mortality Feedback Survey. J Am Geriatr Soc. 2003;51:970–978.
- , , , , , . Place of death: correlations with quality of life of patients with cancer and predictors of bereaved caregivers' mental health. J Clin Oncol. 2010;28:4457–4464.
At the turn of the 20th century, most deaths in the United States occurred at home. By the 1960s, over 70% of deaths occurred in an institutional setting, reflecting an evolution of medical technology.[1, 2, 3] With the birth of the hospice movement in the 1970s, dying patients had the opportunity to have both death at home and aggressive symptom control at the end of life. Although there has been a slow decline in the proportion of deaths that occur in the hospital over the past 2 decades,[3] the overwhelming majority of persons state that they would prefer to die at home. However, recent findings suggest that most people will die in an institutional setting.[3, 4, 5, 6]
Although good data exist describing population preferences for location of death, and we know, based on death records, where deaths occur in the United States, there are few studies that examine concordance between preferred and actual site of death at the individual patient level. Furthermore, although factors have been identified that predict death at home, factors predicting concordance between preferred and actual site of death are not well described.[3, 6, 7, 8, 9, 10, 11, 12, 13]
Regardless of where death ultimately occurs, most adults will experience multiple hospitalizations within the last years of their life. Understanding the preferences and subsequent experiences of this population is of particular relevance to hospitalist physicians who are in a unique position to elicit goals from seriously ill patients and help match patient preferences with their medical care. In this observational study, we sought to determine preferences for site of death in a cohort of adult patients admitted to the hospital for medical illness, and then follow those patients to determine where death occurred for those who died. We also sought to explore factors that may predict concordance between preferred and actual site of death. We hypothesized that ethnic diversity and lower socioeconomic status would be associated with a lower likelihood of concordance between preferred and actual site of death. We also hypothesized that advanced care planning would be associated with a higher likelihood of concordance. The Colorado Multi‐Institutional Review Board approved this study.
METHODS
Participants were recruited from 3 hospitals affiliated with the University of Colorado School of Medicine Internal Medicine Residency program, including the Denver Veterans' Administration Center (DVAMC), Denver Health Medical Center (DHMC), and University of Colorado Hospital (UCH). The DVAMC is a large urban Veterans Administration hospital, serving veterans from the Denver metro area, and is a tertiary referral center for veterans in rural Colorado, Wyoming, and parts of Montana. DHMC, the safety‐net hospital for the Denver area, serves over 25% of the residents in the city and county of Denver, including such special populations as the indigent, chronically mentally ill, and persons with polysubstance dependence. UCH had 350 licensed beds at the time of our study and serves as the Rocky Mountain region's only academic tertiary, specialty care, and referral center. At the time of this study, there was limited inpatient palliative care services at the DVAMC and UH, and no palliative care services at DHMC. Participants were screened on the first day following admission to the adult general medical service. Participants were recruited on 96 postadmission days between February 2004 and June 2006. Recruitment days varied from Monday through Friday, to include admissions from the weekend and throughout the year to reduce potential bias due to seasonal trends of diseases such as influenza. Patients were excluded if they died or were discharged within the first 24 hours of admission, were pregnant, jailed, or unable to give informed consent. All other patients were approached and invited to participate in a brief survey.
After informed consent was obtained, participants completed a bedside interview that included self‐identified ethnicity and the Berkman‐Syme Social Network Index,[14] a brief questionnaire quantifying social support from spouse or domestic partner, family, friends, and other religious or secular organizations. Baseline socioeconomic measures (eg, income, employment, home ownership, car ownership) and questions related to the last days of life were also included. Participants were asked the following question, If you were very sick, with an illness that could not be cured, and in bed most of the time, where would you spend the last days of your life if you could chose?
For each participant, we performed a detailed chart review to determine demographic data, presence of advance directives, and CARING criteria (Cancer, Admissions 2, Residence in a nursing home, Intensive care unit admit with multiorgan failure, 2 Noncancer hospice Guidelines), a set of prognostic criteria identifying patients at an index hospitalization who have a high burden of illness and are at risk for death in the following year.[15] We then followed patients for 5 years. If participants died within the follow‐up period, we collected the date and location of death using medical records, death certificates, or in a few cases when official death records were unavailable, direct contact with the family. Participants were considered alive if they had a clinic visit or MD/RN phone contact within 3 months prior to the final collection point date.
Analysis
SAS 9.1 (SAS Institute Inc., Cary, NC) was used for all analyses. Simple frequencies and means statistics were used to determine rates of descriptive characteristics of the sample as well as rates of the measured outcomes, preferred place to spend last days of life, and actual site of death. Agreement or concordance between preferred and actual site of death was calculated. For the purposes of the analysis, we assumed all persons who stated they had no preference died in a place concordant with their wishes. To calculate agreement by preferred and actual site, participants who expressed a preference and died (n=111) in hospital, nursing home, home, or hospice setting were included in the analysis, and participants (n=4) who died in an unknown or other locations were excluded (eg, motel room).
Logistic Regression Modeling
2 tests were performed for all categorical variables to determine a significant association with outcome variables. Preferred place of death and concordance between preferred and actual site of death were modeled using predictive variables selected if univariable association demonstrated a P0.25. This standard cutoff was selected to broadly identify candidate variables for logistic regression modeling.[16] A stepwise algorithm was used to select significant predictors that would remain in the model.
In lieu of fitting a multinomial logit model for preferred site of death of home vs hospital vs nursing home or hospice facility as preferred site of death, 3 logit models (although only 2 may be sufficient to estimate the underlying multinomial logit model[17]) were considered with outcome categories: home vs nursing home or hospice facility, and hospital vs nursing home or hospice facility and home vs hospital.
For the logistic regression modeling of concordance, we included the full sample of patients who died during the follow‐up period (n=123). We classified participants as dying in a place concordant with their wishes or not concordant.
RESULTS
Study Population
Subjects were recruited on 96 post‐admission days totaling 842 admissions. Three hundred thirty‐one patients (39%) were ineligible for study participation (n=175 discharged within 24 hours, n=76 unable to consent, n=78 ineligible for other reasons [eg, prisoner, pregnant, under 18 years old], n=2 died within 24 hours of admission). Only 53 of the remaining 511 (10%) patients refused; 458 patients (90%) gave informed consent to participate. Characteristics of the study population are depicted in Table 1. There were very few missing cases (<3%), that is persons without a recent clinic follow‐up date, contact, or a confirmed date of death. These persons were considered alive. Overall, the sample population was ethnically diverse, slightly older than middle age, mostly male (due to the inclusion of the Veterans Administration hospital), and of low socioeconomic status.
| Mean age (SD), y | 57.9 (14.8) |
|---|---|
| |
| Mean time to death (SD), d | 339.5 (348.4) |
| Ethnicity | |
| African American | 19% (88) |
| Caucasian | 52% (239) |
| Latino | 22% (102) |
| Other | 6% (29) |
| Spanish language only | 6% (27) |
| Female gender | 35% (159) |
| Admitted to DVAMC | 41% (188) |
| Admitted to DHMC | 38% (174) |
| Admitted to UCH | 21% (96) |
| CARING criteria | |
| Cancer diagnosis | 11% (51) |
| Admitted to hospital 2 times in the past year for chronic illness | 40% (181) |
| Resident in a nursing home | 2% (9) |
| Noncancer hospice guidelines (meeting 2) | 13% (59) |
| Income <$30,000/year | 84% (377) |
| No greater than high school education | 55% (248) |
| Home owner | 26% (120) |
| Rents home | 39% (177) |
| Unstable living situationa | 34% (156) |
| Low social supportb | 36% (165) |
| Uninsured | 18% (81) |
| Regular primary care provider | 73% (330) |
Preferred Site of Death
When asked where they preferred to spend the last days of their life, 75% of patients (n=343) stated they would like to be at home. In the hospital was the preferred location for 10% of patients, whereas 6% stated a nursing home and 4% a hospice inpatient facility. Two percent stated they had no preference, and 3% refused to answer (Figure 1)
We found that in the univariable analysis the following factors were associated with preference for site of death at a significance level of P<0.25: unstable housing, hospital setting, income level, ethnicity, CARING criteria, presence of an advance directive, education level, married, primary care provider, and presence of public insurance. Results of the logit models (home vs nursing home or hospice facility, and hospital vs nursing home or hospice facility and home vs hospital) are presented in Table 2.
| Adjusted Odds Ratio (95% Confidence Interval) | |||
|---|---|---|---|
| Home vs Nursing Home/Hospice Facility | Hospital vs Nursing Home/Hospice Facility | Home vs Hospital | |
| |||
| Low income | 2.71 (1.305.67) | 3.05 (1.019.24) | 0.99 (0.422.37) |
| Married | 2.44 (1.145.21) | 2.40 (0.876.62) | 0.82 (0.421.57) |
| CARING criteria | 0.58 (0.301.14) | 0.44 (0.181.09) | 0.89 (0.471.66) |
Patients with income <$30,000/year were more likely to prefer home (or hospital) over a nursing home or hospice facility. Being married was predictive of preferring home over nursing home or hospice facility. Patients meeting 1 of the CARING criteria trended toward being less likely (P=0.11 for home and P=0.08 for hospital) to prefer home (or hospital) vs nursing home or hospice facility. However, there were no significant predictors for a preference for home or hospital when directly comparing the 2 locations, as expected from observing similar effects of variables in the other 2 logit models.
Actual Site of Death
One hundred twenty‐three patients died during the follow‐up period (26% of the total sample). Of those who died, the mean age was 64 years (standard deviation 13), 82% had annual incomes <$30,000, 73% were men, and 77% met at least 1 of the CARING criteria suggesting advanced medical illness. The distribution of ethnicities of the deceased subsample was similar to that of the overall cohort. Complete death records were obtained for 121 patients. Only 31% (n=38) died at home, whereas 35% (n=42) died in a hospital, 20% (n=24) died in a nursing home, and 12% (n=14) died in an inpatient hospice facility (Figure 1).
In univariable analysis, there were no associations at a 25% significance level between actual site of death and ethnicity, gender, age, severity of illness, high vs low social support, high or low socioeconomic status, stable vs unstable housing, or presence of a completed advance directive in the medical record.
Concordance Between Preferred and Actual Site of Death
Overall, 37% of the patients died where they stated they would prefer to die, including the 2 with no preference. Concordance rates for each site of death are presented in Table 3. We examined sociodemographic variables, disease severity, advance‐care planning, primary care provider, health insurance, and hospital site to look for associations with concordance. We found that female gender was positively associated with concordance (odds ratio [OR], 3.30; 95% confidence interval [CI], 1.25‐8.72). CARING criteria (P=0.06) and Latino ethnicity (vs all other ethnicity categories, P=0.12) also showed trends for association. Restricting to those who preferred home, the associations became stronger (OR, 4.62; 95% CI, 1.44‐14.79 for female; OR, 7.72; 95% CI, 1.67‐35.71 for CARING criteria), and the trend for the negative association between Latino ethnicity and concordance remained (P=0.12). Results of the model are shown in Table 4.
| Actual Site of Death, n (Row %) | Row Total, % Out of 111 | ||||
|---|---|---|---|---|---|
| Hospital | Nursing Home | Home | Hospice Facility | ||
| Preferred hospital | 5 (42%) | 3 (25%) | 2 (17%) | 2 (17%) | 12 (11%) |
| Preferred nursing home | 1 (13%) | 5 (63%) | 2 (25%) | 0 | 8 (7%) |
| Preferred home | 30 (34%) | 15 (17%) | 31 (35%) | 12 (14%) | 88 (79%) |
| Preferred hospice facility | 3 (100%) | 0 | 0 | 0 | 3 (3%) |
| Adjusted Odds Ratio (95% Confidence Interval) | |||
|---|---|---|---|
| All | Home (Using Same Variables) | Home (Using Only Significant Variables) | |
| |||
| Female gender | 3.30 (1.258.72) | 4.62 (1.4414.79) | 3.57 (1.2410.34) |
| CARING criteria | 3.09 (0.979.81) | 7.72 (1.6735.71) | 5.93 (1.4124.91) |
| Latino vs African American/Caucasian/other | 0.43 (0.151.24) | 0.35 (0.091.30) | |
DISCUSSION
We found, similarly to previous reports in the literature, the majority of patients preferred to die at home. We did not find a significant difference in preferences or location of death by ethnicity or illness severity. Lower‐income patients and married patients were more likely to prefer to be at home over a nursing home or a hospice facility in the last days of life. We found that the minority of patients died at their stated preferred site of death, and female gender was the only predictive variable we found to distinguish those patients who died in a place concordant with their wishes compared to those who did not.
In the literature, previous studies have reported concordance rates between preferred and actual site of death that range from 30% to 90%.[12, 13, 18, 19, 20, 21, 22, 23, 24] We found a concordance rate at the lowest end of this spectrum. In trying to understand our findings and place them in context, it is helpful to examine other studies. Many of these studies focused solely on cancer patients.[13, 18, 19, 20, 21, 22, 23] Cancer follows a more predictable trajectory of decline compared to other common life‐threatening illnesses, such as cardiac disease, emphysema, or liver failure, that often involve periods of acute deteriorations and plateaus throughout illness progression. The more predictable trajectory may explain the overall higher concordance rates found in the studies involving cancer patients.
The majority of studies in the literature examining concordance between preferred and actual site of death recruited the study sample from home health or home palliative care programs that were providing support and care to participants.[10, 12, 13, 18, 22, 25, 26, 27] The high concordance rates reported may be the result of the patients in the sample receiving services at home aimed at eliciting preferences and providing support at home. Our observational study is unique in that we elicited patient preferences from a diverse group of hospitalized adults. Patients had a broad range of medical illness and were at various stages in their disease trajectory. This allowed our findings to be more generalizable, a major strength of our study.
The only variable associated with concordance that we identified to predict concordance between preferred and actual site of death was female gender. Women have been shown to be more active in medical decision making, which may explain our findings.[28] Female gender and illness severity (as measured by the CARING criteria) were found to be associated with concordance when the preference is for death at home. For persons with more advanced medical illness, they may have had more opportunity to consider their preferences and talk about these preferences. It is even possible that our interview prompted some participants to have discussions with their families or providers.
Variables with high face validity, such as high social support, higher education, and completing an advance directive, did not demonstrate any effect on the outcome of concordance. Other studies have shown that low functional status, Caucasian ethnicity, home care, higher education, and social support have been associated with a greater likelihood for a home death.[3, 6, 9] However, although studies specifically examining concordance between preferred and actual site of death have looked at predictors for home death, we were unable to find predictors for concordance across all preferences in the literature. We can conclude from our findings that the factors that influence concordance of preferences for site of death are extremely complex and difficult to capture and measure. This is extremely unsatisfying in the face of the low concordance rate of 30% we identified.
Latino ethnicity showed a trend toward having a negative association with concordance between preferred and actual site of death. This trend persisted whether it was concordance overall or for concordance with those who preferred a death at home. In the literature, Latinos have been found to be less likely to complete advance directives, use hospice services at the end of life, and are more likely to experience a hospital death.[29, 30, 31, 32, 33] As care at the end of life continues to improve, careful attention should be paid to ensure that these kinds of gaps do not widen any further.
We interviewed patients at an index hospitalization. Patients had an acute medical illness or an exacerbation of a chronic medical illness and required at least 24 hours of hospitalization to be eligible for inclusion. Our bedside interview made use of an opportune time to question patients, a time when it may have been easier for patients to visualize severe illness at the end of life, rather than asking this question during a time of wellness. Although participants overwhelmingly stated they preferred to be at home, for those who died, decisions were made in their care that did not allow for this preference.
Our follow‐up after the initial bedside interview only included death records of where and when participants died. We do not have the details and narrative of the conversations that may have taken place that led to the care decisions that determined participants' actual place of death. We do not know if preferences were elicited or discussed, and care decisions then negotiated, to best meet the goals and preferences expressed at that time. We also do not know if the conversations did not occur and the default of medical intervention and cure‐focused care dictated how participants spent the last days of their life. There is evidence that when conversations about goals and preferences do occur, concordance between preferences and care received are high.[12, 21]
We were unable to identify any predictors beyond gender in this cohort of adults hospitalized with a broad spectrum of severe medical illness to predict concordance with stated preferences and actual site of death. We can conclude then, based on our findings and supported by the literature, that the default trends toward institutional end‐of‐life experiences. To shift to a more patient‐centered approach, away from the default, healthcare providers need to embrace a palliative approach and incorporate preferences and goals into the discussions about next steps of care to facilitate the peaceful death that the majority of patients imagine for themselves. Hospitalist physicians have a unique opportunity at an index hospitalization to start the conversation about preferences for care including where patients would want to spend the last days of their life.
Our study does have some limitations. We elicited preferences at a single point in time, at an index hospitalization. It is possible that participants' preferences changed over the course of their illness. However, in Agar et al.'s study of longitudinal patient preferences for site of death and place of care, most preferences remained stable over time.[18] We also did not have data that included palliative care involvement, homecare or hospice utilization, or cause of death. All of these variables may be important predictors of concordance. Issues of symptom management and lack of caregiver may also dictate place of death, even when goals and care are aligned. We do not have data to address these components of end‐of‐life decision making.
CONCLUSION
Patients continue to express a preference for death at home. However, the majority of patients experienced an institutional death. Furthermore, few participants achieved concordance with where they preferred to die and where they actually died. Female gender was the sole factor associated with concordance between preferred and actual site of death. Incorporating a palliative approach that elicits goals and helps match goals to care, may offer the best opportunity to help people die where they chose.
Disclosures: This research was supported by the Brookdale National Fellowship Award and the NIA/Beeson grant 5K23AG028957. All authors have seen and agree with the contents of the article. This submission was not under review by any other publication. The authors have no financial interest or other potential conflicts of interest.
- Field MJ, Cassel CK, eds. Committee on Care at the End of Life. Approaching Death: Improving Care at the End of Life. Washington DC: National Academy Press; 1997.
- , . Demography and epidemiology of dying in the U.S. with emphasis on deaths of older persons. Hosp J. 1998;13:49–60.
- , , , . Factors associated with site of death: a national study of where people die. Med Care. 2003;41:323–335.
- , , , , , . Terminal cancer care and patient's preferences for place of death: a prospective study. BMJ. 1990;301:415–417.
- , , , et al. Influence of patient preferences and local health system characteristics on the place of death. SUPPORT Investigators. Study to Understand Prognoses and Preferences for Risks and Outcomes of Treatment. J Am Geriatr Soc. 1998;46:1242–1250.
- , , , , , . Where people die: a multilevel approach to understanding influences on site of death in America. Med Care Res Rev. 2007;64:351–378.
- , , , , , . Dying at home or in an institution using death certificates to explore the factors associated with place of death. Health Policy. 2006;78:319–329.
- , . How do cancer patients who die at home differ from those who die elsewhere? Palliat Med. 1998;12:279–286.
- , . Factors influencing death at home in terminally ill patients with cancer: systematic review [published correction appears in BMJ. 2006;332:1012]. BMJ 2006;332:515–521.
- , , , , , . Predictive factors for home deaths among cancer patients in Swedish palliative home care. Support Care Cancer. 2003;11:560–567.
- , . Systemic adenosine infusions alleviated neuropathic pain. Pain. 2001;94:121–122.
- , , . Prevalence, effectiveness, and predictors of planning their place of death among older persons followed in community‐based long term care. J Am Geriatr Soc. 2000;48:943–948.
- , , , , . Preferences for place of care and place of death among informal caregivers of the terminally ill. Palliat Med. 2005;19:492–499.
- , . Social networks, host resistance, and mortality: a nine‐year follow‐up study of Alameda County residents. Am J Epidemiol. 1979;109:186–204.
- , , , , , . A practical tool to identify patients who may benefit from a palliative approach: the CARING criteria. J Pain Symptom Manage. 2006;31:285–292.
- , . Applied Logistic Regression. 2nd ed. New York, NY: Wiley‐Interscience; 2000.
- , . Calculation of polychotmous logistic regression parameters using individualized regressions. Biometrika. 1984;71:11–18.
- , , , , , . Preference for place of care and place of death in palliative care: are these different questions? Palliat Med. 2008;22(7):787–795.
- , , . Place of death: preferences among cancer patients and their carers. Soc Sci Med. 2004;58:2431–2444.
- , . Determinants of congruence between the preferred and actual place of death for terminally ill cancer patients. J Palliat Care. 2003;19:230–237.
- , , . Factors associated with location of death (home or hospital) of patients referred to a palliative care team. CMAJ. 1995;152:361–367.
- , , , et al. Proxy perspectives regarding end‐of‐life care for persons with cancer. Cancer. 2008;112:1854–1861.
- , , , , , . Actual and preferred place of death of cancer patients. Results from the Italian survey of the dying of cancer (ISDOC). J Epidemiol Community Health. 2006;60:412–416.
- , , , . Family reports of barriers to optimal care of the dying. Nurs Res. 2000;49:310–317.
- , , . Place of death: preferences among cancer patients and their carers. Soc Sci Med. 2004;58(12):2431–2444.
- , . Where do elderly patients prefer to die? Place of death and patient characteristics of 100 elderly patients under the care of a home health care team. J Am Geriatr Soc. 1983;31:457–461.
- , , , , , . Predictors of home death in palliative care cancer patients. J Palliat Care. 2000;16:23–28.
- , . Patient preferences for medical decision making: who really wants to participate? Med Care. 2000;38:335–341.
- , , , et al. Racial and ethnic differences in advance care planning among patients with cancer: impact of terminal illness acknowledgment, religiousness, and treatment preferences. J Clin Oncol. 2008;26:4131–4137.
- , , , . Influence of ethnicity on advance directives and end‐of‐life decisions. JAMA. 1997;277:298–299.
- , , , . Differences in end‐of‐life decision making among black and white ambulatory cancer patients. J Gen Intern Med. 1996;11:651–656.
- , , . Hospice usage by minorities in the last year of life: results from the National Mortality Feedback Survey. J Am Geriatr Soc. 2003;51:970–978.
- , , , , , . Place of death: correlations with quality of life of patients with cancer and predictors of bereaved caregivers' mental health. J Clin Oncol. 2010;28:4457–4464.
Copyright © 2013 Society of Hospital Medicine
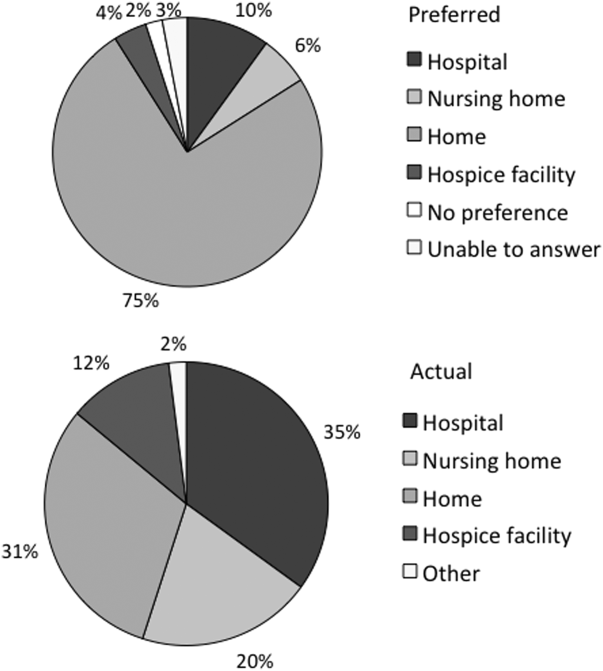
Curbside vs Formal Consultation
A curbside consultation is an informal process whereby a consultant is asked to provide information or advice about a patient's care without doing a formal assessment of the patient.14 Curbside consultations are common in the practice of medicine2, 3, 5 and are frequently requested by physicians caring for hospitalized patients. Several surveys have documented the quantity of curbside consultations requested of various subspecialties, the types of questions asked, the time it takes to respond, and physicians' perceptions about the quality of the information exchanged.111 While curbside consultations have a number of advantages, physicians' perceptions are that the information conveyed may be inaccurate or incomplete and that the advice offered may be erroneous.13, 5, 10, 12, 13
Cartmill and White14 performed a random audit of 10% of the telephone referrals they received for neurosurgical consultation over a 1‐year period and noted discrepancies between the Glascow Coma Scores reported during the telephone referrals and those noted in the medical records, but the frequency of these discrepancies was not reported. To our knowledge, no studies have compared the quality of the information provided in curbside consultations with that obtained in formal consultations that included direct face‐to‐face patient evaluations and primary data collection, and whether the advice provided in curbside and formal consultations on the same patient differed.
We performed a prospective cohort study to compare the information received by hospitalists during curbside consultations on hospitalized patients, with that obtained from formal consultations done the same day on the same patients, by different hospitalists who were unaware of any details regarding the curbside consultation. We also compared the advice provided by the 2 hospitalists following their curbside and formal consultations. Our hypotheses were that the information received during curbside consultations was frequently inaccurate or incomplete, that the recommendations made after the formal consultation would frequently differ from those made in the curbside consultation, and that these differences would have important implications on patient care.
METHODS
This was a quality improvement study conducted at Denver Health, a 500‐bed university‐affiliated urban safety net hospital from January 10, 2011 to January 9, 2012. The study design was a prospective cohort that included all curbside consultations on hospitalized patients received between 7 AM and 3 PM, on intermittently selected weekdays, by the Internal Medicine Consultation Service that was staffed by 18 hospitalists. Data were collected intermittently based upon hospitalist availability and was done to limit potential alterations in the consulting practices of the providers requesting consultations.
Consultations were defined as being curbside when the consulting provider asked for advice, suggestions, or opinions about a patient's care but did not ask the hospitalist to see the patient.15, 15 Consultations pertaining to administrative issues (eg, whether a patient should be admitted to an intensive care bed as opposed to an acute care floor bed) or on patients who were already being followed by a hospitalist were excluded.
The hospitalist receiving the curbside consultation was allowed to ask questions as they normally would, but could not verify the accuracy of the information received (eg, could not review any portion of the patient's medical record, such as notes or lab data). A standardized data collection sheet was used to record the service and level of training of the requesting provider, the medical issue(s) of concern, all clinical data offered by the provider, the number of questions asked by the hospitalist of the provider, and whether, on the basis of the information provided, the hospitalist felt that the question(s) being asked was (were) of sufficient complexity that a formal consultation should occur. The hospitalist then offered advice based upon the information given during the curbside consultation.
After completing the curbside consultation, the hospitalist requested verbal permission from the requesting provider to perform a formal consultation. If the request was approved, the hospitalist performing the curbside consultation contacted a different hospitalist who performed the formal consultation within the next few hours. The only information given to the second hospitalist was the patient's identifiers and the clinical question(s) being asked. The formal consultation included a complete face‐to‐face history and physical examination, a review of the patient's medical record, documentation of the provider's findings, and recommendations for care.
Upon completion of the formal consultation, the hospitalists who performed the curbside and the formal consultations met to review the advice each gave to the requesting provider and the information on which this advice was based. The 2 hospitalists jointly determined the following: (a) whether the information received during the curbside consultation was correct and complete, (b) whether the advice provided in the formal consultation differed from that provided in the curbside consultation, (c) whether the advice provided in the formal consultation dealt with issues other than one(s) leading to the curbside consultation, (d) whether differences in the recommendations given in the curbside versus the formal consultation changed patient management in a meaningful way, and (e) whether the curbside consultation alone was felt to be sufficient.
Information obtained by the hospitalist performing the formal consultation that was different from, or not included in, the information recorded during the curbside consultation was considered to be incorrect or incomplete, respectively. A change in management was defined as an alteration in the direction or type of care that the patient would have received as a result of the advice being given. A pulmonary and critical care physician, with >35 years of experience in inpatient medicine, reviewed the information provided in the curbside and formal consultations, and independently assessed whether the curbside consultation alone would have been sufficient and whether the formal consultation changed management.
Curbside consultations were neither solicited nor discouraged during the course of the study. The provider requesting the curbside consultation was not informed or debriefed about the study in an attempt to avoid affecting future consultation practices from that provider or service.
Associations were sought between the frequency of inaccurate or incomplete data and the requesting service and provider, the consultative category and medical issue, the number of questions asked by the hospitalist during the curbside consultation, and whether the hospitalist doing the curbside consultation thought that formal consultation was needed. A chi‐square test was used to analyze all associations. A P value of <0.05 was considered significant. All analyses were performed using SAS Enterprise Guide 4.3 (SAS Institute, Inc, Cary, NC) software. The study was approved by the Colorado Multiple Institutional Review Board.
RESULTS
Fifty curbside consultations were requested on a total of 215 study days. The requesting service declined formal consultation in 3 instances, leaving 47 curbside consultations that had a formal consultation. Curbside consultations came from a variety of services and providers, and addressed a variety of issues and concerns (Table 1).
| Curbside Consultations, N (%) | |
|---|---|
| 47 (100) | |
| |
| Requesting service | |
| Psychiatry | 21 (45) |
| Emergency Department | 9 (19) |
| Obstetrics/Gynecology | 5 (11) |
| Neurology | 4 (8) |
| Other (Orthopedics, Anesthesia, General Surgery, Neurosurgery, and Interventional Radiology) | 8 (17) |
| Requesting provider | |
| Resident | 25 (53) |
| Intern | 8 (17) |
| Attending | 9 (19) |
| Other | 5 (11) |
| Consultative issue* | |
| Diagnosis | 10 (21) |
| Treatment | 29 (62) |
| Evaluation | 20 (43) |
| Discharge | 13 (28) |
| Lab interpretation | 4 (9) |
| Medical concern* | |
| Cardiac | 27 (57) |
| Endocrine | 17 (36) |
| Infectious disease | 9 (19) |
| Pulmonary | 8 (17) |
| Gastroenterology | 6 (13) |
| Fluid and electrolyte | 6 (13) |
| Others | 23 (49) |
The hospitalists asked 0 to 2 questions during 8/47 (17%) of the curbside consultations, 3 to 5 questions during 26/47 (55%) consultations, and more than 5 questions during 13/47 (28%). Based on the information received during the curbside consultations, the hospitalists thought that the curbside consultations were insufficient for 18/47 (38%) of patients. In all instances, the opinions of the 2 hospitalists concurred with respect to this conclusion, and the independent reviewer agreed with this assessment in 17 of these 18 (94%).
The advice rendered in the formal consultations differed from that provided in 26/47 (55%) of the curbside consultations, and the formal consultation was thought to have changed management for 28/47 (60%) of patients (Table 2). The independent reviewer thought that the advice provided in the formal consultations changed management in 29/47 (62%) of the cases, and in 24/28 cases (86%) where the hospitalist felt that the formal consult changed management.
| Curbside Consultations, N (%) | |||
|---|---|---|---|
| Total | Accurate and Complete | Inaccurate or Incomplete | |
| 47 (100) | 23 (49) | 24 (51) | |
| |||
| Advice in formal consultation differed from advice in curbside consultation | 26 (55) | 7 (30) | 19 (79)* |
| Formal consultation changed management | 28 (60) | 6 (26) | 22 (92) |
| Minor change | 18 (64) | 6 (100) | 12 (55) |
| Major change | 10 (36) | 0 (0) | 10 (45) |
| Curbside consultation insufficient | 18 (38) | 2 (9) | 16 (67) |
Information was felt to be inaccurate or incomplete in 24/47 (51%) of the curbside consultations (13/47 inaccurate, 16/47 incomplete, 5/47 both inaccurate and incomplete), and when inaccurate or incomplete information was obtained, the advice given in the formal consultations more commonly differed from that provided in the curbside consultation (19/24, 79% vs 7/23, 30%; P < 0.001), and was more commonly felt to change management (22/24, 92% vs 6/23, 26%; P < 0.0001) (Table 2). No association was found between whether the curbside consultation contained complete or accurate information and the consulting service from which the curbside originated, the consulting provider, the consultative aspect(s) or medical issue(s) addressed, the number of questions asked by the hospitalist during the curbside consultation, nor whether the hospitalists felt that a formal consultation was needed.
DISCUSSION
The important findings of this study are that (a) the recommendations made by hospitalists in curbside versus formal consultations on the same patient frequently differ, (b) these differences frequently result in changes in clinical management, (c) the information presented in curbside consultations by providers is frequently inaccurate or incomplete, regardless of the providers specialty or seniority, (d) when inaccurate or incomplete information is received, the recommendations made in curbside and formal consultations differ more frequently, and (e) we found no way to predict whether the information provided in a curbside consultation was likely to be inaccurate or incomplete.
Our hospitalists thought that 38% of the curbside consultations they received should have had formal consultations. Manian and McKinsey7 reported that as many as 53% of questions asked of infectious disease consultants were thought to be too complex to be addressed in an informal consultation. Others, however, report that only 11%33% of curbside consultations were thought to require formal consultation.1, 9, 10, 16 Our hospitalists asked 3 or more questions of the consulting providers in more than 80% of the curbside consultations, suggesting that the curbside consultations we received might have had a higher complexity than those seen by others.
Our finding that information provided in curbside consultation was frequently inaccurate or incomplete is consistent with a number of previous studies reporting physicians' perceptions of the accuracy of curbside consultations.2, 3 Hospital medicine is not likely to be the only discipline affected by inaccurate curbside consultation practices, as surveys of specialists in infectious disease, gynecology, and neurosurgery report that practitioners in these disciplines have similar concerns.1, 10, 14 In a survey returned by 34 physicians, Myers1 found that 50% thought the information exchanged during curbside consultations was inaccurate, leading him to conclude that inaccuracies presented during curbside consultations required further study.
We found no way of predicting whether curbside consultations were likely to include inaccurate or incomplete information. This observation is consistent with the results of Bergus et al16 who found that the frequency of curbside consultations being converted to formal consultations was independent of the training status of the consulting physician, and with the data of Myers1 who found no way of predicting the likelihood that a curbside consultation should be converted to a formal consultation.
We found that formal consultations resulted in management changes more often than differences in recommendations (ie, 60% vs 55%, respectively). This small difference occurred because, on occasion, the formal consultations found issues to address other than the one(s) for which the curbside consultation was requested. In the majority of these instances, the management changes were minor and the curbside consultation was still felt to be sufficient.
In some instances, the advice given after the curbside and the formal consultations differed to only a minor extent (eg, varying recommendations for oral diabetes management). In other instances, however, the advice differed substantially (eg, change in antibiotic management in a septic patient with a multidrug resistant organism, when the original curbside question was for when to order a follow‐up chest roentgenogram for hypoxia; see Supporting Information, Appendix, in the online version of this article). In 26 patients (55%), formal consultation resulted in different medications being started or stopped, additional tests being performed, or different decisions being made about admission versus discharge.
Our study has a number of strengths. First, while a number of reports document that physicians' perceptions are that curbside consultations frequently contain errors,2, 3, 5, 12 to our knowledge this is the first study that prospectively compared the information collected and advice given in curbside versus formal consultation. Second, while this study was conducted as a quality improvement project, thereby requiring us to conclude that the results are not generalizable, the data presented were collected by 18 different hospitalists, reducing the potential of bias from an individual provider's knowledge base or practice. Third, there was excellent agreement between the independent reviewer and the 2 hospitalists who performed the curbside and formal consultations regarding whether a curbside consultation would have been sufficient, and whether the formal consultation changed patient management. Fourth, the study was conducted over a 1‐year period, which should have reduced potential bias arising from the increasing experience of residents requesting consultations as their training progressed.
Our study has several limitations. First, the number of curbside consultations we received during the study period (50 over 215 days) was lower than anticipated, and lower than the rates of consultation reported by others.1, 7, 9 This likely relates to the fact that, prior to beginning the study, Denver Health hospitalists already provided mandatory consultations for several surgical services (thereby reducing the number of curbside consultations received from these services), because curbside consultations received during evenings, nights, and weekends were not included in the study for reasons of convenience, and because we excluded all administrative curbside consultations. Our hospitalist service also provides consultative services 24 hours a day, thereby reducing the number of consultations received during daytime hours. Second, the frequency with which curbside consultations included inaccurate or incomplete information might be higher than what occurs in other hospitals, as Denver Health is an urban, university‐affiliated public hospital and the patients encountered may be more complex and trainees may be less adept at recognizing the information that would facilitate accurate curbside consultations (although we found no difference in the frequency with which inaccurate or incomplete information was provided as a function of the seniority of the requesting physician). Third, the disparity between curbside and formal consultations that we observed could have been biased by the Hawthorne effect. We attempted to address this by not providing the hospitalists who did the formal consultation with any information collected by the hospitalist involved with the curbside consultation, and by comparing the conclusions reached by the hospitalists performing the curbside and formal consultations with those of a third party reviewer. Fourth, while we found no association between the frequency of curbside consultations in which information was inaccurate or incomplete and the consulting service, there could be a selection bias of the consulting service requesting the curbside consultations as a result of the mandatory consultations already provided by our hospitalists. Finally, our study was not designed or adequately powered to determine why curbside consultations frequently have inaccurate or incomplete information.
In summary, we found that the information provided to hospitalists during a curbside consultation was often inaccurate and incomplete, and that these problems with information exchange adversely affected the accuracy of the resulting recommendations. While there are a number of advantages to curbside consultations,1, 3, 7, 10, 12, 13 our findings indicate that the risk associated with this practice is substantial.
Acknowledgements
Disclosure: Nothing to report.
- .Curbside consultation in infectious diseases: a prospective study.J Infect Dis.1984;150:797–802.
- ,,.Physicians' experiences and beliefs regarding informal consultation.JAMA.1998;280:900–904.
- ,,.Curbside consultation practices and attitudes among primary care physicians and medical subspecialists.JAMA.1998;280:905–909.
- ,,,,,.The complexity, relative value, and financial worth of curbside consultations in an academic infectious diseases unit.Clin Infect Dis.2010;51:651–655.
- ,.Curbside consultations. A closer look at a common practice.JAMA.1996;275:145–147.
- ,,,.Informal advice‐ and information‐seeking between physicians.J Med Educ.1981;56;174–180.
- ,.A prospective study of 2,092 “curbside” questions asked of two infectious disease consultants in private practice in the midwest.Clin Infect Dis.1996;22:303–307.
- ,,,,.Curbside consultation in endocrine practice: a prospective observational study.Endocrinologist.1996;6:328–331.
- ,,.Informal consultations provided to general internists by the gastroenterology department of an HMO.J Gen Intern Med.1998;13:435–438.
- .“Curbside” consultations in gynecologic oncology: a closer look at a common practice.Gynecol Oncol.1999;74:456–459.
- ,,, et al.Informal consultations in infectious diseases and clinical microbiology practice.Clin Microbiol Infect.2003;9:724–726.
- .Curbside consultations and the viaduct effect.JAMA.1998;280:929–930.
- .What do we really need to know about consultation and referral?J Gen Intern Med.1998;13:497–498.
- ,.Telephone advice for neurosurgical referrals. Who assumes duty of care?Br J Neurosurg.2001;15:453–455.
- ,.Malpractice liability for informal consultations.Fam Med.2003;35:476–481.
- ,,,.Does the structure of clinical questions affect the outcome of curbside consultations with specialty colleagues?Arch Fam Med.2000;9:541–547.
A curbside consultation is an informal process whereby a consultant is asked to provide information or advice about a patient's care without doing a formal assessment of the patient.14 Curbside consultations are common in the practice of medicine2, 3, 5 and are frequently requested by physicians caring for hospitalized patients. Several surveys have documented the quantity of curbside consultations requested of various subspecialties, the types of questions asked, the time it takes to respond, and physicians' perceptions about the quality of the information exchanged.111 While curbside consultations have a number of advantages, physicians' perceptions are that the information conveyed may be inaccurate or incomplete and that the advice offered may be erroneous.13, 5, 10, 12, 13
Cartmill and White14 performed a random audit of 10% of the telephone referrals they received for neurosurgical consultation over a 1‐year period and noted discrepancies between the Glascow Coma Scores reported during the telephone referrals and those noted in the medical records, but the frequency of these discrepancies was not reported. To our knowledge, no studies have compared the quality of the information provided in curbside consultations with that obtained in formal consultations that included direct face‐to‐face patient evaluations and primary data collection, and whether the advice provided in curbside and formal consultations on the same patient differed.
We performed a prospective cohort study to compare the information received by hospitalists during curbside consultations on hospitalized patients, with that obtained from formal consultations done the same day on the same patients, by different hospitalists who were unaware of any details regarding the curbside consultation. We also compared the advice provided by the 2 hospitalists following their curbside and formal consultations. Our hypotheses were that the information received during curbside consultations was frequently inaccurate or incomplete, that the recommendations made after the formal consultation would frequently differ from those made in the curbside consultation, and that these differences would have important implications on patient care.
METHODS
This was a quality improvement study conducted at Denver Health, a 500‐bed university‐affiliated urban safety net hospital from January 10, 2011 to January 9, 2012. The study design was a prospective cohort that included all curbside consultations on hospitalized patients received between 7 AM and 3 PM, on intermittently selected weekdays, by the Internal Medicine Consultation Service that was staffed by 18 hospitalists. Data were collected intermittently based upon hospitalist availability and was done to limit potential alterations in the consulting practices of the providers requesting consultations.
Consultations were defined as being curbside when the consulting provider asked for advice, suggestions, or opinions about a patient's care but did not ask the hospitalist to see the patient.15, 15 Consultations pertaining to administrative issues (eg, whether a patient should be admitted to an intensive care bed as opposed to an acute care floor bed) or on patients who were already being followed by a hospitalist were excluded.
The hospitalist receiving the curbside consultation was allowed to ask questions as they normally would, but could not verify the accuracy of the information received (eg, could not review any portion of the patient's medical record, such as notes or lab data). A standardized data collection sheet was used to record the service and level of training of the requesting provider, the medical issue(s) of concern, all clinical data offered by the provider, the number of questions asked by the hospitalist of the provider, and whether, on the basis of the information provided, the hospitalist felt that the question(s) being asked was (were) of sufficient complexity that a formal consultation should occur. The hospitalist then offered advice based upon the information given during the curbside consultation.
After completing the curbside consultation, the hospitalist requested verbal permission from the requesting provider to perform a formal consultation. If the request was approved, the hospitalist performing the curbside consultation contacted a different hospitalist who performed the formal consultation within the next few hours. The only information given to the second hospitalist was the patient's identifiers and the clinical question(s) being asked. The formal consultation included a complete face‐to‐face history and physical examination, a review of the patient's medical record, documentation of the provider's findings, and recommendations for care.
Upon completion of the formal consultation, the hospitalists who performed the curbside and the formal consultations met to review the advice each gave to the requesting provider and the information on which this advice was based. The 2 hospitalists jointly determined the following: (a) whether the information received during the curbside consultation was correct and complete, (b) whether the advice provided in the formal consultation differed from that provided in the curbside consultation, (c) whether the advice provided in the formal consultation dealt with issues other than one(s) leading to the curbside consultation, (d) whether differences in the recommendations given in the curbside versus the formal consultation changed patient management in a meaningful way, and (e) whether the curbside consultation alone was felt to be sufficient.
Information obtained by the hospitalist performing the formal consultation that was different from, or not included in, the information recorded during the curbside consultation was considered to be incorrect or incomplete, respectively. A change in management was defined as an alteration in the direction or type of care that the patient would have received as a result of the advice being given. A pulmonary and critical care physician, with >35 years of experience in inpatient medicine, reviewed the information provided in the curbside and formal consultations, and independently assessed whether the curbside consultation alone would have been sufficient and whether the formal consultation changed management.
Curbside consultations were neither solicited nor discouraged during the course of the study. The provider requesting the curbside consultation was not informed or debriefed about the study in an attempt to avoid affecting future consultation practices from that provider or service.
Associations were sought between the frequency of inaccurate or incomplete data and the requesting service and provider, the consultative category and medical issue, the number of questions asked by the hospitalist during the curbside consultation, and whether the hospitalist doing the curbside consultation thought that formal consultation was needed. A chi‐square test was used to analyze all associations. A P value of <0.05 was considered significant. All analyses were performed using SAS Enterprise Guide 4.3 (SAS Institute, Inc, Cary, NC) software. The study was approved by the Colorado Multiple Institutional Review Board.
RESULTS
Fifty curbside consultations were requested on a total of 215 study days. The requesting service declined formal consultation in 3 instances, leaving 47 curbside consultations that had a formal consultation. Curbside consultations came from a variety of services and providers, and addressed a variety of issues and concerns (Table 1).
| Curbside Consultations, N (%) | |
|---|---|
| 47 (100) | |
| |
| Requesting service | |
| Psychiatry | 21 (45) |
| Emergency Department | 9 (19) |
| Obstetrics/Gynecology | 5 (11) |
| Neurology | 4 (8) |
| Other (Orthopedics, Anesthesia, General Surgery, Neurosurgery, and Interventional Radiology) | 8 (17) |
| Requesting provider | |
| Resident | 25 (53) |
| Intern | 8 (17) |
| Attending | 9 (19) |
| Other | 5 (11) |
| Consultative issue* | |
| Diagnosis | 10 (21) |
| Treatment | 29 (62) |
| Evaluation | 20 (43) |
| Discharge | 13 (28) |
| Lab interpretation | 4 (9) |
| Medical concern* | |
| Cardiac | 27 (57) |
| Endocrine | 17 (36) |
| Infectious disease | 9 (19) |
| Pulmonary | 8 (17) |
| Gastroenterology | 6 (13) |
| Fluid and electrolyte | 6 (13) |
| Others | 23 (49) |
The hospitalists asked 0 to 2 questions during 8/47 (17%) of the curbside consultations, 3 to 5 questions during 26/47 (55%) consultations, and more than 5 questions during 13/47 (28%). Based on the information received during the curbside consultations, the hospitalists thought that the curbside consultations were insufficient for 18/47 (38%) of patients. In all instances, the opinions of the 2 hospitalists concurred with respect to this conclusion, and the independent reviewer agreed with this assessment in 17 of these 18 (94%).
The advice rendered in the formal consultations differed from that provided in 26/47 (55%) of the curbside consultations, and the formal consultation was thought to have changed management for 28/47 (60%) of patients (Table 2). The independent reviewer thought that the advice provided in the formal consultations changed management in 29/47 (62%) of the cases, and in 24/28 cases (86%) where the hospitalist felt that the formal consult changed management.
| Curbside Consultations, N (%) | |||
|---|---|---|---|
| Total | Accurate and Complete | Inaccurate or Incomplete | |
| 47 (100) | 23 (49) | 24 (51) | |
| |||
| Advice in formal consultation differed from advice in curbside consultation | 26 (55) | 7 (30) | 19 (79)* |
| Formal consultation changed management | 28 (60) | 6 (26) | 22 (92) |
| Minor change | 18 (64) | 6 (100) | 12 (55) |
| Major change | 10 (36) | 0 (0) | 10 (45) |
| Curbside consultation insufficient | 18 (38) | 2 (9) | 16 (67) |
Information was felt to be inaccurate or incomplete in 24/47 (51%) of the curbside consultations (13/47 inaccurate, 16/47 incomplete, 5/47 both inaccurate and incomplete), and when inaccurate or incomplete information was obtained, the advice given in the formal consultations more commonly differed from that provided in the curbside consultation (19/24, 79% vs 7/23, 30%; P < 0.001), and was more commonly felt to change management (22/24, 92% vs 6/23, 26%; P < 0.0001) (Table 2). No association was found between whether the curbside consultation contained complete or accurate information and the consulting service from which the curbside originated, the consulting provider, the consultative aspect(s) or medical issue(s) addressed, the number of questions asked by the hospitalist during the curbside consultation, nor whether the hospitalists felt that a formal consultation was needed.
DISCUSSION
The important findings of this study are that (a) the recommendations made by hospitalists in curbside versus formal consultations on the same patient frequently differ, (b) these differences frequently result in changes in clinical management, (c) the information presented in curbside consultations by providers is frequently inaccurate or incomplete, regardless of the providers specialty or seniority, (d) when inaccurate or incomplete information is received, the recommendations made in curbside and formal consultations differ more frequently, and (e) we found no way to predict whether the information provided in a curbside consultation was likely to be inaccurate or incomplete.
Our hospitalists thought that 38% of the curbside consultations they received should have had formal consultations. Manian and McKinsey7 reported that as many as 53% of questions asked of infectious disease consultants were thought to be too complex to be addressed in an informal consultation. Others, however, report that only 11%33% of curbside consultations were thought to require formal consultation.1, 9, 10, 16 Our hospitalists asked 3 or more questions of the consulting providers in more than 80% of the curbside consultations, suggesting that the curbside consultations we received might have had a higher complexity than those seen by others.
Our finding that information provided in curbside consultation was frequently inaccurate or incomplete is consistent with a number of previous studies reporting physicians' perceptions of the accuracy of curbside consultations.2, 3 Hospital medicine is not likely to be the only discipline affected by inaccurate curbside consultation practices, as surveys of specialists in infectious disease, gynecology, and neurosurgery report that practitioners in these disciplines have similar concerns.1, 10, 14 In a survey returned by 34 physicians, Myers1 found that 50% thought the information exchanged during curbside consultations was inaccurate, leading him to conclude that inaccuracies presented during curbside consultations required further study.
We found no way of predicting whether curbside consultations were likely to include inaccurate or incomplete information. This observation is consistent with the results of Bergus et al16 who found that the frequency of curbside consultations being converted to formal consultations was independent of the training status of the consulting physician, and with the data of Myers1 who found no way of predicting the likelihood that a curbside consultation should be converted to a formal consultation.
We found that formal consultations resulted in management changes more often than differences in recommendations (ie, 60% vs 55%, respectively). This small difference occurred because, on occasion, the formal consultations found issues to address other than the one(s) for which the curbside consultation was requested. In the majority of these instances, the management changes were minor and the curbside consultation was still felt to be sufficient.
In some instances, the advice given after the curbside and the formal consultations differed to only a minor extent (eg, varying recommendations for oral diabetes management). In other instances, however, the advice differed substantially (eg, change in antibiotic management in a septic patient with a multidrug resistant organism, when the original curbside question was for when to order a follow‐up chest roentgenogram for hypoxia; see Supporting Information, Appendix, in the online version of this article). In 26 patients (55%), formal consultation resulted in different medications being started or stopped, additional tests being performed, or different decisions being made about admission versus discharge.
Our study has a number of strengths. First, while a number of reports document that physicians' perceptions are that curbside consultations frequently contain errors,2, 3, 5, 12 to our knowledge this is the first study that prospectively compared the information collected and advice given in curbside versus formal consultation. Second, while this study was conducted as a quality improvement project, thereby requiring us to conclude that the results are not generalizable, the data presented were collected by 18 different hospitalists, reducing the potential of bias from an individual provider's knowledge base or practice. Third, there was excellent agreement between the independent reviewer and the 2 hospitalists who performed the curbside and formal consultations regarding whether a curbside consultation would have been sufficient, and whether the formal consultation changed patient management. Fourth, the study was conducted over a 1‐year period, which should have reduced potential bias arising from the increasing experience of residents requesting consultations as their training progressed.
Our study has several limitations. First, the number of curbside consultations we received during the study period (50 over 215 days) was lower than anticipated, and lower than the rates of consultation reported by others.1, 7, 9 This likely relates to the fact that, prior to beginning the study, Denver Health hospitalists already provided mandatory consultations for several surgical services (thereby reducing the number of curbside consultations received from these services), because curbside consultations received during evenings, nights, and weekends were not included in the study for reasons of convenience, and because we excluded all administrative curbside consultations. Our hospitalist service also provides consultative services 24 hours a day, thereby reducing the number of consultations received during daytime hours. Second, the frequency with which curbside consultations included inaccurate or incomplete information might be higher than what occurs in other hospitals, as Denver Health is an urban, university‐affiliated public hospital and the patients encountered may be more complex and trainees may be less adept at recognizing the information that would facilitate accurate curbside consultations (although we found no difference in the frequency with which inaccurate or incomplete information was provided as a function of the seniority of the requesting physician). Third, the disparity between curbside and formal consultations that we observed could have been biased by the Hawthorne effect. We attempted to address this by not providing the hospitalists who did the formal consultation with any information collected by the hospitalist involved with the curbside consultation, and by comparing the conclusions reached by the hospitalists performing the curbside and formal consultations with those of a third party reviewer. Fourth, while we found no association between the frequency of curbside consultations in which information was inaccurate or incomplete and the consulting service, there could be a selection bias of the consulting service requesting the curbside consultations as a result of the mandatory consultations already provided by our hospitalists. Finally, our study was not designed or adequately powered to determine why curbside consultations frequently have inaccurate or incomplete information.
In summary, we found that the information provided to hospitalists during a curbside consultation was often inaccurate and incomplete, and that these problems with information exchange adversely affected the accuracy of the resulting recommendations. While there are a number of advantages to curbside consultations,1, 3, 7, 10, 12, 13 our findings indicate that the risk associated with this practice is substantial.
Acknowledgements
Disclosure: Nothing to report.
- .Curbside consultation in infectious diseases: a prospective study.J Infect Dis.1984;150:797–802.
- ,,.Physicians' experiences and beliefs regarding informal consultation.JAMA.1998;280:900–904.
- ,,.Curbside consultation practices and attitudes among primary care physicians and medical subspecialists.JAMA.1998;280:905–909.
- ,,,,,.The complexity, relative value, and financial worth of curbside consultations in an academic infectious diseases unit.Clin Infect Dis.2010;51:651–655.
- ,.Curbside consultations. A closer look at a common practice.JAMA.1996;275:145–147.
- ,,,.Informal advice‐ and information‐seeking between physicians.J Med Educ.1981;56;174–180.
- ,.A prospective study of 2,092 “curbside” questions asked of two infectious disease consultants in private practice in the midwest.Clin Infect Dis.1996;22:303–307.
- ,,,,.Curbside consultation in endocrine practice: a prospective observational study.Endocrinologist.1996;6:328–331.
- ,,.Informal consultations provided to general internists by the gastroenterology department of an HMO.J Gen Intern Med.1998;13:435–438.
- .“Curbside” consultations in gynecologic oncology: a closer look at a common practice.Gynecol Oncol.1999;74:456–459.
- ,,, et al.Informal consultations in infectious diseases and clinical microbiology practice.Clin Microbiol Infect.2003;9:724–726.
- .Curbside consultations and the viaduct effect.JAMA.1998;280:929–930.
- .What do we really need to know about consultation and referral?J Gen Intern Med.1998;13:497–498.
- ,.Telephone advice for neurosurgical referrals. Who assumes duty of care?Br J Neurosurg.2001;15:453–455.
- ,.Malpractice liability for informal consultations.Fam Med.2003;35:476–481.
- ,,,.Does the structure of clinical questions affect the outcome of curbside consultations with specialty colleagues?Arch Fam Med.2000;9:541–547.
Copyright © 2012 Society of Hospital Medicine
Bacterial Contamination of Work Wear
In September 2007, the British Department of Health developed guidelines for health care workers regarding uniforms and work wear that banned the traditional white coat and other long‐sleeved garments in an attempt to decrease nosocomial bacterial transmission.1 Similar policies have recently been adopted in Scotland.2 Interestingly, the National Health Service report acknowledged that evidence was lacking that would support that white coats and long‐sleeved garments caused nosocomial infection.1, 3 Although many studies have documented that health care work clothes are contaminated with bacteria, including methicillin‐resistant Staphylococcal aureus (MRSA) and other pathogenic species,413 none have determined whether avoiding white coats and switching to short‐sleeved garments decreases bacterial contamination.
We performed a prospective, randomized, controlled trial designed to compare the extent of bacterial contamination of physicians' white coats with that of newly laundered, standardized short‐sleeved uniforms. Our hypotheses were that infrequently cleaned white coats would have greater bacterial contamination than uniforms, that the extent of contamination would be inversely related to the frequency with which the coats were washed, and that the increased contamination of the cuffs of the white coats would result in increased contamination of the skin of the wrists. Our results led us also to assess the rate at which bacterial contamination of short‐sleeved uniforms occurs during the workday.
Methods
The study was conducted at Denver Health, a university‐affiliated public safety‐net hospital and was approved by the Colorado Multiple Institutional Review Board.
Trial Design
The study was a prospective, randomized, controlled trial. No protocol changes occurred during the study.
Participants
Participants included residents and hospitalists directly caring for patients on internal medicine units between August 1, 2008 and November 15, 2009.
Intervention
Subjects wore either a standard, newly laundered, short‐sleeved uniform or continued to wear their own white coats.
Outcomes
The primary end point was the percentage of subjects contaminated with MRSA. Cultures were collected using a standardized RODAC imprint method14 with BBL RODAC plates containing trypticase soy agar with lecithin and polysorbate 80 (Becton Dickinson, Sparks, MD) 8 hours after the physicians started their work day. All physicians had cultures obtained from the breast pocket and sleeve cuff (long‐sleeved for the white coats, short‐sleeved for the uniforms) and from the skin of the volar surface of the wrist of their dominant hand. Those wearing white coats also had cultures obtained from the mid‐biceps level of the sleeve of the dominant hand, as this location closely approximated the location of the cuffs of the short‐sleeved uniforms.
Cultures were incubated in ambient air at 35C‐37C for 1822 hours. After incubation, visible colonies were counted using a dissecting microscope to a maximum of 200 colonies at the recommendation of the manufacturer. Colonies that were morphologically consistent with Staphylococcus species by colony growth and Gram stain were further tested for coagulase using a BactiStaph rapid latex agglutination test (Remel, Lenexa, KS). If positive, these colonies were subcultured to sheep blood agar (Remel, Lenexa, KS) and BBL MRSA Chromagar (Becton Dickinson, Sparks, MD) and incubated for an additional 1824 hours. Characteristic growth on blood agar that also produced mauve‐colored colonies on chromagar was taken to indicate MRSA.
A separate set of 10 physicians donned newly laundered, short‐sleeved uniforms at 6:30 AM for culturing from the breast pocket and sleeve cuff of the dominant hand prior to and 2.5, 5, and 8 hours after they were donned by the participants (with culturing of each site done on separate days to avoid the effects of obtaining multiple cultures at the same site on the same day). These cultures were not assessed for MRSA.
At the time that consent was obtained, all participants completed an anonymous survey that assessed the frequency with which they normally washed or changed their white coats.
Sample Size
Based on the finding that 20% of our first 20 participants were colonized with MRSA, we determined that to find a 25% difference in the percentage of subjects colonized with MRSA in the 2 groups, with a power of 0.8 and P < 0.05 being significant (2‐sided Fisher's exact test), 50 subjects would be needed in each group.
Randomization
Randomization of potential participants occurred 1 day prior to the study using a computer‐generated table of random numbers. The principal investigator and a coinvestigator enrolled participants. Consent was obtained from those randomized to wear a newly laundered standard short‐sleeved uniform at the time of randomization so that they could don the uniforms when arriving at the hospital the following morning (at approximately 6:30 AM). Physicians in this group were also instructed not to wear their white coats at any time during the day they were wearing the uniforms. Physicians randomized to wear their own white coats were not notified or consented until the day of the study, a few hours prior to the time the cultures were obtained. This approach prevented them from either changing their white coats or washing them prior to the time the cultures were taken.
Because our study included both employees of the hospital and trainees, a number of protection measures were required. No information of any sort was collected about those who agreed or refused to participate in the study. In addition, the request to participate in the study did not come from the person's direct supervisor.
Statistical Methods
All data were collected and entered using Excel for Mac 2004 version 11.5.4. All analyses were performed using SAS Enterprise Guide 4.1 (SAS Institute, Inc., Cary, NC).
The Wilcoxon rank‐sum test and chi square analysis were used to seek differences in colony count and percentage of cultures with MRSA, respectively, in cultures obtained: (1) from the sleeve cuffs and pockets of the white coats compared with those from the sleeve cuffs and pockets of the uniforms, (2) from the sleeve cuffs of the white coats compared with those from the sleeve cuffs of the short‐sleeved uniforms, (3) from the mid‐biceps area of the sleeve sof the white coats compared with those from the sleeve cuffs of the uniforms, and (4) from the skin of the wrists of those wearing white coats compared with those wearing the uniforms. Bonferroni's correction for multiple comparisons was applied, with a P < 0.125 indicating significance.
Friedman's test and repeated‐measures logistic regression were used to seek differences in colony count or of the percentage of cultures with MRSA, respectively, on white coats or uniforms by site of culture on both garments. A P < 0.05 indicated significance for these analyses.
The Kruskal‐Wallis and chi‐square tests were utilized to test the effect of white coat wash frequency on colony count and MRSA contamination, respectively.
All data are presented as medians with 95% confidence intervals or proportions.
Results
Participant Flow
Fifty physicians were studied in each group, all of whom completed the survey. In general, more than 95% of potential participants approached agreed to participate in the study (Figure 1).

Recruitment
The first and last physicians were studied in August 2008 and November 2009, respectively. The trial ended when the specified number of participants (50 in each group) had been enrolled.
Data on Entry
No data were recorded from the participants at the time of randomization in compliance with institutional review board regulations pertaining to employment issues that could arise when studying members of the workforce.
Outcomes
No significant differences were found between the colony counts cultured from white coats (104 [80127]) versus newly laundered uniforms (142 [83213]), P = 0.61. No significant differences were found between the colony counts cultured from the sleeve cuffs of the white coats (58.5 [4866]) versus the uniforms (37 [2768]), P = 0.07, or between the colony counts cultured from the pockets of the white coats (45.5 [3254]) versus the uniforms (74.5 [4897], P = 0.040. Bonferroni corrections were used for multiple comparisons such that a P < 0.0125 was considered significant. Cultures from at least 1 site of 8 of 50 physicians (16%) wearing white coats and 10 of 50 physicians (20%) wearing short‐sleeved uniforms were positive for MRSA (P = .60).
Colony counts were greater in cultures obtained from the sleeve cuffs of the white coats compared with the pockets or mid‐biceps area (Table 1). For the uniforms, no difference in colony count in cultures from the pockets versus sleeve cuffs was observed. No difference was found when comparing the number of subjects with MRSA contamination of the 3 sites of the white coats or the 2 sites of the uniforms (Table 1).
| White Coat (n = 50) | P | Uniforms (n = 50) | P | |
|---|---|---|---|---|
| Colony count, median (95% CI) | ||||
| Sleeve cuff | 58.5 (4866) | < 0.0001 | 37.0 (2768) | 0.25 |
| 45.5 (3254) | 74.5 (4897) | |||
| Mid‐biceps area of sleeve | 25.5 (2029) | |||
| MRSA contamination, n (%) | ||||
| Sleeve cuff | 4 (8%) | 0.71 | 6 (12%) | 0.18 |
| 5 (10%) | 9 (18%) | |||
| Mid‐biceps area of sleeve | 3 (6%) |
No difference was observed with respect to colony count or the percentage of subjects positive for MRSA in cultures obtained from the mid‐biceps area of the white coats versus those from the cuffs of the short‐sleeved uniforms (Table 2).
| White Coat Mid‐Biceps (n = 50) | Uniform Sleeve Cuff (n = 50) | P | |
|---|---|---|---|
| Colony count, median (95% CI) | 25.5 (2029) | 37.0 (2768) | 0.07 |
| MRSA contamination, n (%) | 3 (6%) | 6 (12%) | 0.49 |
No difference was observed with respect to colony count or the percentage of subjects positive for MRSA in cultures obtained from the volar surface of the wrists of subjects wearing either of the 2 garments (Table 3).
| White Coat (n = 50) | Uniform (n = 50) | P | |
|---|---|---|---|
| Colony count, median (95% CI) | 23.5 (1740) | 40.5 (2859) | 0.09 |
| MRSA Contamination, n (% of subjects) | 3 (6%) | 5 (10%) | 0.72 |
The frequency with which physicians randomized to wearing their white coats admitted to washing or changing their coats varied markedly (Table 4). No significant differences were found with respect to total colony count (P = 0.81), colony count by site (data not shown), or percentage of physicians contaminated with MRSA (P = 0.22) as a function of washing or changing frequency (Table 4).
| White Coat Washing Frequency | Number of Subjects (%) | Total Colony Count (All Sites), Median (95% CI) | Number with MRSA Contamination, n (%) |
|---|---|---|---|
| Weekly | 15 (30%) | 124 (107229) | 1 (7%) |
| Every 2 weeks | 21 (42%) | 156 (90237) | 6 (29%) |
| Every 4 weeks | 8 (16%) | 89 (41206) | 0 (0%) |
| Every 8 weeks | 5 (10%) | 140 (58291) | 2 (40%) |
| Rarely | 1 (2%) | 150 | 0 (0%) |
Sequential culturing showed that the newly laundered uniforms were nearly sterile prior to putting them on. By 3 hours of wear, however, nearly 50% of the colonies counted at 8 hours were already present (Figure 2).

Harms
No adverse events occurred during the course of the study in either group.
Discussion
The important findings of this study are that, contrary to our hypotheses, at the end of an 8‐hour workday, no significant differences were found between the extent of bacterial or MRSA contamination of infrequently washed white coats compared with those of newly laundered uniforms, no difference was observed with respect to the extent of bacterial or MRSA contamination of the wrists of physicians wearing either of the 2 garments, and no association was apparent between the extent of bacterial or MRSA contamination and the frequency with which white coats were washed or changed. In addition, we also found that bacterial contamination of newly laundered uniforms occurred within hours of putting them on.
Interpretation
Numerous studies have demonstrated that white coats and uniforms worn by health care providers are frequently contaminated with bacteria, including both methicillin‐sensitive and ‐resistant Staphylococcus aureus and other pathogens.413 This contamination may come from nasal or perineal carriage of the health care provider, from the environment, and/or from patients who are colonized or infected.11, 15 Although many have suggested that patients can become contaminated from contact with health care providers' clothing and studies employing pulsed‐field gel electrophoresis and other techniques have suggested that cross‐infection can occur,10, 1618 others have not confirmed this contention,19, 20 and Lessing and colleagues16 concluded that transmission from staff to patients was a rare phenomenon. The systematic review reported to the Department of Health in England,3 the British Medical Association guidelines regarding dress codes for doctors,21 and the department's report on which the new clothing guidelines were based1 concluded there was no conclusive evidence indicating that work clothes posed a risk of spreading infection to patients. Despite this, the Working Group and the British Medical Association recommended that white coats should not be worn when providing patient care and that shirts and blouses should be short‐sleeved.1 Recent evidence‐based reviews concluded that there was insufficient evidence to justify this policy,3, 22 and our data indicate that the policy will not decrease bacterial or MRSA contamination of physicians' work clothes or skin.
The recommendation that long‐sleeved clothing should be avoided comes from studies indicating that cuffs of these garments are more heavily contaminated than other areas5, 8 and are more likely to come in contact with patients.1 Wong and colleagues5 reported that cuffs and lower front pockets had greater contamination than did the backs of white coats, but no difference was seen in colony count from cuffs compared with pockets. Loh and colleagues8 found greater bacterial contamination on the cuffs than on the backs of white coats, but their conclusion came from comparing the percentage of subjects with selected colony counts (ie, between 100 and 199 only), and the analysis did not adjust for repeated sampling of each participant. Apparently, colony counts from the cuffs were not different than those from the pockets. Callaghan7 found that contamination of nursing uniforms was equal at all sites. We found that sleeve cuffs of white coats had slightly but significantly more contamination with bacteria than either the pocket or the midsleeve areas, but interestingly, we found no difference in colony count from cultures taken from the skin at the wrists of the subjects wearing either garment. We found no difference in the extent of bacterial contamination by site in the subjects wearing short‐sleeved uniforms or in the percentage of subjects contaminated with MRSA by site of culture of either garment.
Contrary to our hypothesis, we found no association between the frequency with which white coats were changed or washed and the extent of bacterial contamination, despite the physicians having admitted to washing or changing their white coats infrequently (Table 4). Similar findings were reported by Loh and colleagues8 and by Treakle and colleagues.12
Our finding that contamination of clean uniforms happens rapidly is consistent with published data. Speers and colleagues4 found increasing contamination of nurses' aprons and dresses comparing samples obtained early in the day with those taken several hours later. Boyce and colleagues6 found that 65% of nursing uniforms were contaminated with MRSA after performing morning patient‐care activities on patients with MRSA wound or urine infections. Perry and colleagues9 found that 39% of uniforms that were laundered at home were contaminated with MRSA, vancomycin‐resistant enterococci, or Clostridium difficile at the beginning of the work shift, increasing to 54% by the end of a 24‐hour shift, and Babb and colleagues20 found that nearly 100% of nurses' gowns were contaminated within the first day of use (33% with Staphylococcus aureus). Dancer22 recently suggested that if staff were afforded clean coats every day, it is possible that concerns over potential contamination would be less of an issue. Our data suggest, however, that work clothes would have to be changed every few hours if the intent were to reduce bacterial contamination.
Limitations
Our study has a number of potential limitations. The RODAC imprint method only sampled a small area of both the white coats and the uniforms, and accordingly, the culture data might not accurately reflect the total degree of contamination. However, we cultured 3 areas on the white coats and 2 on the uniforms, including areas thought to be more heavily contaminated (sleeve cuffs of white coats). Although this area had greater colony counts, the variation in bacterial and MRSA contamination from all areas was small.
We did not culture the anterior nares to determine if the participants were colonized with MRSA. Normal health care workers have varying degrees of nasal colonization with MRSA, and this could account for some of the 16%‐20% MRSA contamination rate we observed. However, previous studies have shown that nasal colonization of healthcare workers only minimally contributes to uniform contamination.4
Although achieving good hand hygiene compliance has been a major focus at our hospital, we did not track the hand hygiene compliance of the physicians in either group. Accordingly, not finding reduced bacterial contamination in those wearing short‐sleeved uniforms could be explained if physicians in this group had systematically worse hand‐washing compliance than those randomized to wearing their own white coats. Our use of concurrent controls limits this possibility, as does that during the time of this study, hand hygiene compliance (assessed by monthly surreptitious observation) was approximately 90% throughout the hospital.
Despite the infrequent wash frequencies reported, the physicians' responses to the survey could have overestimated the true wash frequency as a result of the Hawthorne effect. The colony count and MRSA contamination rates observed, however, suggest that even if this occurred, it would not have altered our conclusion that bacterial contamination was not associated with wash frequency.
Generalizability
Because data were collected from a single, university‐affiliated public teaching hospital from hospitalists and residents working on the internal medicine service, the results might not be generalizable to other types of institutions, other personnel, or other services.
In conclusion, bacterial contamination of work clothes occurs within the first few hours after donning them. By the end of an 8‐hour work day, we found no data supporting the contention that long‐sleeved white coats were more heavily contaminated than were short‐sleeved uniforms. Our data do not support discarding white coats for uniforms that are changed on a daily basis or for requiring health care workers to avoid long‐sleeved garments.
Acknowledgements
The authors thank Henry Fonseca and his team for providing our physician uniforms. They also thank the Denver Health Department of Medicine Small Grants program for supporting this study.
- Department of Health. Uniforms and workwear: an evidence base for developing local policy. National Health Service, September 17, 2007. Available at: http://www.dh.gov.uk/en/Publicationsandstatistics/Publications/Publicationspolicyandguidance/DH_078433. Accessed January 29,2010.
- Scottish Government Health Directorates. NHS Scotland Dress Code. Available at: http://www.sehd.scot.nhs.uk/mels/CEL2008_53.pdf. Accessed February 10,2010.
- ,,,.Uniform: an evidence review of the microbiological significance of uniforms and uniform policy in the prevention and control of healthcare‐associated infections. Report to the Department of Health (England).J Hosp Infect.2007;66:301–307.
- ,,,.Contamination of nurses' uniforms with Staphylococcus aureus.Lancet.1969;2:233–235.
- ,,.Microbial flora on doctors' white coats.Brit Med J.1991;303:1602–1604.
- ,,,.Environmental contamination due to methicillin‐resistant Staphylococcus aureus: possible infection control implications.Infect Control Hosp Epidemiol.1997;18:622–627.
- ,Bacterial contamination of nurses' uniforms: a study.Nursing Stand.1998;13:37–42.
- ,,.Bacterial flora on the white coats of medical students.J Hosp Infection.2000;45:65–68.
- ,,.Bacterial contamination of uniforms.J Hosp Infect.2001;48:238–241.
- ,,, et al.Significance of methicillin‐resistant Staphylococcus aureus (MRSA) survey in a university teaching hospital.J Infec Chemother.2003;9:172–177.
- ,,, et al.Detection of methicillin‐resistant Staphylococcus aureus and vancomycin‐resistant enterococci on the gowns and gloves of healthcare workers.Infect Control Hosp Epidemiol2008;29 (7):583–9.
- ,,,,,.Bacterial contamination of health care workers' white coats.Am J Infect Control.2009;37:101–105.
- ,,,,,.Meticillin‐resistant Staphylococcus aureus contamination of healthcare workers' uniforms in long‐term care facilities.J Hosp Infect.2009;71:170–175.
- ,,,,.Comparison of the Rodac imprint method to selective enrichment broth for recovery of vancomycin‐resistant enterococci and drug‐resistant Enterobacteriaceae from environmental surfaces.J Clin Microbiol.2000;38:4646–4648.
- ,,.Effect of clothing on dispersal of Staphylococcus aureus by males and females.Lancet.1974;2:1131–1133.
- ,,.When should healthcare workers be screened for methicillin‐resistant Staphylococcus aureus?J Hosp Infect.1996;34:205–210.
- ,,.Methicillin‐resistant Staphylococcus aureus transmission: the possible importance of unrecognized health care worker carriage.Am J Infect Control.2008;36:93–97.
- ,,, et al.Methicillin‐resistant Staphylococcus aureus carriage, infection and transmission in dialysis patients, healthcare workers and their family members.Nephrol Dial Transplant.2008;23:1659–1665.
- ,,.Are active microbiological surveillance and subsequent isolation needed to prevent the spread of methicillin‐resistant Staphylococcus aureus.Clin Infect Dis.2005;40:405–409.
- ,,.Contamination of protective clothing and nurses' uniforms in an isolation ward.J Hosp Infect.1983;4:149–157.
- British Medical Association. Uniform and dress code for doctors. December 6, 2007. Available at: http://www.bma.org.uk/employmentandcontracts/working_arrangements/CCSCdresscode051207.jsp. Accessed February 9,2010.
- .Pants, policies and paranoia.J Hosp Infect.2010;74:10–15.
In September 2007, the British Department of Health developed guidelines for health care workers regarding uniforms and work wear that banned the traditional white coat and other long‐sleeved garments in an attempt to decrease nosocomial bacterial transmission.1 Similar policies have recently been adopted in Scotland.2 Interestingly, the National Health Service report acknowledged that evidence was lacking that would support that white coats and long‐sleeved garments caused nosocomial infection.1, 3 Although many studies have documented that health care work clothes are contaminated with bacteria, including methicillin‐resistant Staphylococcal aureus (MRSA) and other pathogenic species,413 none have determined whether avoiding white coats and switching to short‐sleeved garments decreases bacterial contamination.
We performed a prospective, randomized, controlled trial designed to compare the extent of bacterial contamination of physicians' white coats with that of newly laundered, standardized short‐sleeved uniforms. Our hypotheses were that infrequently cleaned white coats would have greater bacterial contamination than uniforms, that the extent of contamination would be inversely related to the frequency with which the coats were washed, and that the increased contamination of the cuffs of the white coats would result in increased contamination of the skin of the wrists. Our results led us also to assess the rate at which bacterial contamination of short‐sleeved uniforms occurs during the workday.
Methods
The study was conducted at Denver Health, a university‐affiliated public safety‐net hospital and was approved by the Colorado Multiple Institutional Review Board.
Trial Design
The study was a prospective, randomized, controlled trial. No protocol changes occurred during the study.
Participants
Participants included residents and hospitalists directly caring for patients on internal medicine units between August 1, 2008 and November 15, 2009.
Intervention
Subjects wore either a standard, newly laundered, short‐sleeved uniform or continued to wear their own white coats.
Outcomes
The primary end point was the percentage of subjects contaminated with MRSA. Cultures were collected using a standardized RODAC imprint method14 with BBL RODAC plates containing trypticase soy agar with lecithin and polysorbate 80 (Becton Dickinson, Sparks, MD) 8 hours after the physicians started their work day. All physicians had cultures obtained from the breast pocket and sleeve cuff (long‐sleeved for the white coats, short‐sleeved for the uniforms) and from the skin of the volar surface of the wrist of their dominant hand. Those wearing white coats also had cultures obtained from the mid‐biceps level of the sleeve of the dominant hand, as this location closely approximated the location of the cuffs of the short‐sleeved uniforms.
Cultures were incubated in ambient air at 35C‐37C for 1822 hours. After incubation, visible colonies were counted using a dissecting microscope to a maximum of 200 colonies at the recommendation of the manufacturer. Colonies that were morphologically consistent with Staphylococcus species by colony growth and Gram stain were further tested for coagulase using a BactiStaph rapid latex agglutination test (Remel, Lenexa, KS). If positive, these colonies were subcultured to sheep blood agar (Remel, Lenexa, KS) and BBL MRSA Chromagar (Becton Dickinson, Sparks, MD) and incubated for an additional 1824 hours. Characteristic growth on blood agar that also produced mauve‐colored colonies on chromagar was taken to indicate MRSA.
A separate set of 10 physicians donned newly laundered, short‐sleeved uniforms at 6:30 AM for culturing from the breast pocket and sleeve cuff of the dominant hand prior to and 2.5, 5, and 8 hours after they were donned by the participants (with culturing of each site done on separate days to avoid the effects of obtaining multiple cultures at the same site on the same day). These cultures were not assessed for MRSA.
At the time that consent was obtained, all participants completed an anonymous survey that assessed the frequency with which they normally washed or changed their white coats.
Sample Size
Based on the finding that 20% of our first 20 participants were colonized with MRSA, we determined that to find a 25% difference in the percentage of subjects colonized with MRSA in the 2 groups, with a power of 0.8 and P < 0.05 being significant (2‐sided Fisher's exact test), 50 subjects would be needed in each group.
Randomization
Randomization of potential participants occurred 1 day prior to the study using a computer‐generated table of random numbers. The principal investigator and a coinvestigator enrolled participants. Consent was obtained from those randomized to wear a newly laundered standard short‐sleeved uniform at the time of randomization so that they could don the uniforms when arriving at the hospital the following morning (at approximately 6:30 AM). Physicians in this group were also instructed not to wear their white coats at any time during the day they were wearing the uniforms. Physicians randomized to wear their own white coats were not notified or consented until the day of the study, a few hours prior to the time the cultures were obtained. This approach prevented them from either changing their white coats or washing them prior to the time the cultures were taken.
Because our study included both employees of the hospital and trainees, a number of protection measures were required. No information of any sort was collected about those who agreed or refused to participate in the study. In addition, the request to participate in the study did not come from the person's direct supervisor.
Statistical Methods
All data were collected and entered using Excel for Mac 2004 version 11.5.4. All analyses were performed using SAS Enterprise Guide 4.1 (SAS Institute, Inc., Cary, NC).
The Wilcoxon rank‐sum test and chi square analysis were used to seek differences in colony count and percentage of cultures with MRSA, respectively, in cultures obtained: (1) from the sleeve cuffs and pockets of the white coats compared with those from the sleeve cuffs and pockets of the uniforms, (2) from the sleeve cuffs of the white coats compared with those from the sleeve cuffs of the short‐sleeved uniforms, (3) from the mid‐biceps area of the sleeve sof the white coats compared with those from the sleeve cuffs of the uniforms, and (4) from the skin of the wrists of those wearing white coats compared with those wearing the uniforms. Bonferroni's correction for multiple comparisons was applied, with a P < 0.125 indicating significance.
Friedman's test and repeated‐measures logistic regression were used to seek differences in colony count or of the percentage of cultures with MRSA, respectively, on white coats or uniforms by site of culture on both garments. A P < 0.05 indicated significance for these analyses.
The Kruskal‐Wallis and chi‐square tests were utilized to test the effect of white coat wash frequency on colony count and MRSA contamination, respectively.
All data are presented as medians with 95% confidence intervals or proportions.
Results
Participant Flow
Fifty physicians were studied in each group, all of whom completed the survey. In general, more than 95% of potential participants approached agreed to participate in the study (Figure 1).
Recruitment
The first and last physicians were studied in August 2008 and November 2009, respectively. The trial ended when the specified number of participants (50 in each group) had been enrolled.
Data on Entry
No data were recorded from the participants at the time of randomization in compliance with institutional review board regulations pertaining to employment issues that could arise when studying members of the workforce.
Outcomes
No significant differences were found between the colony counts cultured from white coats (104 [80127]) versus newly laundered uniforms (142 [83213]), P = 0.61. No significant differences were found between the colony counts cultured from the sleeve cuffs of the white coats (58.5 [4866]) versus the uniforms (37 [2768]), P = 0.07, or between the colony counts cultured from the pockets of the white coats (45.5 [3254]) versus the uniforms (74.5 [4897], P = 0.040. Bonferroni corrections were used for multiple comparisons such that a P < 0.0125 was considered significant. Cultures from at least 1 site of 8 of 50 physicians (16%) wearing white coats and 10 of 50 physicians (20%) wearing short‐sleeved uniforms were positive for MRSA (P = .60).
Colony counts were greater in cultures obtained from the sleeve cuffs of the white coats compared with the pockets or mid‐biceps area (Table 1). For the uniforms, no difference in colony count in cultures from the pockets versus sleeve cuffs was observed. No difference was found when comparing the number of subjects with MRSA contamination of the 3 sites of the white coats or the 2 sites of the uniforms (Table 1).
| White Coat (n = 50) | P | Uniforms (n = 50) | P | |
|---|---|---|---|---|
| Colony count, median (95% CI) | ||||
| Sleeve cuff | 58.5 (4866) | < 0.0001 | 37.0 (2768) | 0.25 |
| 45.5 (3254) | 74.5 (4897) | |||
| Mid‐biceps area of sleeve | 25.5 (2029) | |||
| MRSA contamination, n (%) | ||||
| Sleeve cuff | 4 (8%) | 0.71 | 6 (12%) | 0.18 |
| 5 (10%) | 9 (18%) | |||
| Mid‐biceps area of sleeve | 3 (6%) |
No difference was observed with respect to colony count or the percentage of subjects positive for MRSA in cultures obtained from the mid‐biceps area of the white coats versus those from the cuffs of the short‐sleeved uniforms (Table 2).
| White Coat Mid‐Biceps (n = 50) | Uniform Sleeve Cuff (n = 50) | P | |
|---|---|---|---|
| Colony count, median (95% CI) | 25.5 (2029) | 37.0 (2768) | 0.07 |
| MRSA contamination, n (%) | 3 (6%) | 6 (12%) | 0.49 |
No difference was observed with respect to colony count or the percentage of subjects positive for MRSA in cultures obtained from the volar surface of the wrists of subjects wearing either of the 2 garments (Table 3).
| White Coat (n = 50) | Uniform (n = 50) | P | |
|---|---|---|---|
| Colony count, median (95% CI) | 23.5 (1740) | 40.5 (2859) | 0.09 |
| MRSA Contamination, n (% of subjects) | 3 (6%) | 5 (10%) | 0.72 |
The frequency with which physicians randomized to wearing their white coats admitted to washing or changing their coats varied markedly (Table 4). No significant differences were found with respect to total colony count (P = 0.81), colony count by site (data not shown), or percentage of physicians contaminated with MRSA (P = 0.22) as a function of washing or changing frequency (Table 4).
| White Coat Washing Frequency | Number of Subjects (%) | Total Colony Count (All Sites), Median (95% CI) | Number with MRSA Contamination, n (%) |
|---|---|---|---|
| Weekly | 15 (30%) | 124 (107229) | 1 (7%) |
| Every 2 weeks | 21 (42%) | 156 (90237) | 6 (29%) |
| Every 4 weeks | 8 (16%) | 89 (41206) | 0 (0%) |
| Every 8 weeks | 5 (10%) | 140 (58291) | 2 (40%) |
| Rarely | 1 (2%) | 150 | 0 (0%) |
Sequential culturing showed that the newly laundered uniforms were nearly sterile prior to putting them on. By 3 hours of wear, however, nearly 50% of the colonies counted at 8 hours were already present (Figure 2).
Harms
No adverse events occurred during the course of the study in either group.
Discussion
The important findings of this study are that, contrary to our hypotheses, at the end of an 8‐hour workday, no significant differences were found between the extent of bacterial or MRSA contamination of infrequently washed white coats compared with those of newly laundered uniforms, no difference was observed with respect to the extent of bacterial or MRSA contamination of the wrists of physicians wearing either of the 2 garments, and no association was apparent between the extent of bacterial or MRSA contamination and the frequency with which white coats were washed or changed. In addition, we also found that bacterial contamination of newly laundered uniforms occurred within hours of putting them on.
Interpretation
Numerous studies have demonstrated that white coats and uniforms worn by health care providers are frequently contaminated with bacteria, including both methicillin‐sensitive and ‐resistant Staphylococcus aureus and other pathogens.413 This contamination may come from nasal or perineal carriage of the health care provider, from the environment, and/or from patients who are colonized or infected.11, 15 Although many have suggested that patients can become contaminated from contact with health care providers' clothing and studies employing pulsed‐field gel electrophoresis and other techniques have suggested that cross‐infection can occur,10, 1618 others have not confirmed this contention,19, 20 and Lessing and colleagues16 concluded that transmission from staff to patients was a rare phenomenon. The systematic review reported to the Department of Health in England,3 the British Medical Association guidelines regarding dress codes for doctors,21 and the department's report on which the new clothing guidelines were based1 concluded there was no conclusive evidence indicating that work clothes posed a risk of spreading infection to patients. Despite this, the Working Group and the British Medical Association recommended that white coats should not be worn when providing patient care and that shirts and blouses should be short‐sleeved.1 Recent evidence‐based reviews concluded that there was insufficient evidence to justify this policy,3, 22 and our data indicate that the policy will not decrease bacterial or MRSA contamination of physicians' work clothes or skin.
The recommendation that long‐sleeved clothing should be avoided comes from studies indicating that cuffs of these garments are more heavily contaminated than other areas5, 8 and are more likely to come in contact with patients.1 Wong and colleagues5 reported that cuffs and lower front pockets had greater contamination than did the backs of white coats, but no difference was seen in colony count from cuffs compared with pockets. Loh and colleagues8 found greater bacterial contamination on the cuffs than on the backs of white coats, but their conclusion came from comparing the percentage of subjects with selected colony counts (ie, between 100 and 199 only), and the analysis did not adjust for repeated sampling of each participant. Apparently, colony counts from the cuffs were not different than those from the pockets. Callaghan7 found that contamination of nursing uniforms was equal at all sites. We found that sleeve cuffs of white coats had slightly but significantly more contamination with bacteria than either the pocket or the midsleeve areas, but interestingly, we found no difference in colony count from cultures taken from the skin at the wrists of the subjects wearing either garment. We found no difference in the extent of bacterial contamination by site in the subjects wearing short‐sleeved uniforms or in the percentage of subjects contaminated with MRSA by site of culture of either garment.
Contrary to our hypothesis, we found no association between the frequency with which white coats were changed or washed and the extent of bacterial contamination, despite the physicians having admitted to washing or changing their white coats infrequently (Table 4). Similar findings were reported by Loh and colleagues8 and by Treakle and colleagues.12
Our finding that contamination of clean uniforms happens rapidly is consistent with published data. Speers and colleagues4 found increasing contamination of nurses' aprons and dresses comparing samples obtained early in the day with those taken several hours later. Boyce and colleagues6 found that 65% of nursing uniforms were contaminated with MRSA after performing morning patient‐care activities on patients with MRSA wound or urine infections. Perry and colleagues9 found that 39% of uniforms that were laundered at home were contaminated with MRSA, vancomycin‐resistant enterococci, or Clostridium difficile at the beginning of the work shift, increasing to 54% by the end of a 24‐hour shift, and Babb and colleagues20 found that nearly 100% of nurses' gowns were contaminated within the first day of use (33% with Staphylococcus aureus). Dancer22 recently suggested that if staff were afforded clean coats every day, it is possible that concerns over potential contamination would be less of an issue. Our data suggest, however, that work clothes would have to be changed every few hours if the intent were to reduce bacterial contamination.
Limitations
Our study has a number of potential limitations. The RODAC imprint method only sampled a small area of both the white coats and the uniforms, and accordingly, the culture data might not accurately reflect the total degree of contamination. However, we cultured 3 areas on the white coats and 2 on the uniforms, including areas thought to be more heavily contaminated (sleeve cuffs of white coats). Although this area had greater colony counts, the variation in bacterial and MRSA contamination from all areas was small.
We did not culture the anterior nares to determine if the participants were colonized with MRSA. Normal health care workers have varying degrees of nasal colonization with MRSA, and this could account for some of the 16%‐20% MRSA contamination rate we observed. However, previous studies have shown that nasal colonization of healthcare workers only minimally contributes to uniform contamination.4
Although achieving good hand hygiene compliance has been a major focus at our hospital, we did not track the hand hygiene compliance of the physicians in either group. Accordingly, not finding reduced bacterial contamination in those wearing short‐sleeved uniforms could be explained if physicians in this group had systematically worse hand‐washing compliance than those randomized to wearing their own white coats. Our use of concurrent controls limits this possibility, as does that during the time of this study, hand hygiene compliance (assessed by monthly surreptitious observation) was approximately 90% throughout the hospital.
Despite the infrequent wash frequencies reported, the physicians' responses to the survey could have overestimated the true wash frequency as a result of the Hawthorne effect. The colony count and MRSA contamination rates observed, however, suggest that even if this occurred, it would not have altered our conclusion that bacterial contamination was not associated with wash frequency.
Generalizability
Because data were collected from a single, university‐affiliated public teaching hospital from hospitalists and residents working on the internal medicine service, the results might not be generalizable to other types of institutions, other personnel, or other services.
In conclusion, bacterial contamination of work clothes occurs within the first few hours after donning them. By the end of an 8‐hour work day, we found no data supporting the contention that long‐sleeved white coats were more heavily contaminated than were short‐sleeved uniforms. Our data do not support discarding white coats for uniforms that are changed on a daily basis or for requiring health care workers to avoid long‐sleeved garments.
Acknowledgements
The authors thank Henry Fonseca and his team for providing our physician uniforms. They also thank the Denver Health Department of Medicine Small Grants program for supporting this study.
- Department of Health. Uniforms and workwear: an evidence base for developing local policy. National Health Service, September 17, 2007. Available at: http://www.dh.gov.uk/en/Publicationsandstatistics/Publications/Publicationspolicyandguidance/DH_078433. Accessed January 29,2010.
- Scottish Government Health Directorates. NHS Scotland Dress Code. Available at: http://www.sehd.scot.nhs.uk/mels/CEL2008_53.pdf. Accessed February 10,2010.
- ,,,.Uniform: an evidence review of the microbiological significance of uniforms and uniform policy in the prevention and control of healthcare‐associated infections. Report to the Department of Health (England).J Hosp Infect.2007;66:301–307.
- ,,,.Contamination of nurses' uniforms with Staphylococcus aureus.Lancet.1969;2:233–235.
- ,,.Microbial flora on doctors' white coats.Brit Med J.1991;303:1602–1604.
- ,,,.Environmental contamination due to methicillin‐resistant Staphylococcus aureus: possible infection control implications.Infect Control Hosp Epidemiol.1997;18:622–627.
- ,Bacterial contamination of nurses' uniforms: a study.Nursing Stand.1998;13:37–42.
- ,,.Bacterial flora on the white coats of medical students.J Hosp Infection.2000;45:65–68.
- ,,.Bacterial contamination of uniforms.J Hosp Infect.2001;48:238–241.
- ,,, et al.Significance of methicillin‐resistant Staphylococcus aureus (MRSA) survey in a university teaching hospital.J Infec Chemother.2003;9:172–177.
- ,,, et al.Detection of methicillin‐resistant Staphylococcus aureus and vancomycin‐resistant enterococci on the gowns and gloves of healthcare workers.Infect Control Hosp Epidemiol2008;29 (7):583–9.
- ,,,,,.Bacterial contamination of health care workers' white coats.Am J Infect Control.2009;37:101–105.
- ,,,,,.Meticillin‐resistant Staphylococcus aureus contamination of healthcare workers' uniforms in long‐term care facilities.J Hosp Infect.2009;71:170–175.
- ,,,,.Comparison of the Rodac imprint method to selective enrichment broth for recovery of vancomycin‐resistant enterococci and drug‐resistant Enterobacteriaceae from environmental surfaces.J Clin Microbiol.2000;38:4646–4648.
- ,,.Effect of clothing on dispersal of Staphylococcus aureus by males and females.Lancet.1974;2:1131–1133.
- ,,.When should healthcare workers be screened for methicillin‐resistant Staphylococcus aureus?J Hosp Infect.1996;34:205–210.
- ,,.Methicillin‐resistant Staphylococcus aureus transmission: the possible importance of unrecognized health care worker carriage.Am J Infect Control.2008;36:93–97.
- ,,, et al.Methicillin‐resistant Staphylococcus aureus carriage, infection and transmission in dialysis patients, healthcare workers and their family members.Nephrol Dial Transplant.2008;23:1659–1665.
- ,,.Are active microbiological surveillance and subsequent isolation needed to prevent the spread of methicillin‐resistant Staphylococcus aureus.Clin Infect Dis.2005;40:405–409.
- ,,.Contamination of protective clothing and nurses' uniforms in an isolation ward.J Hosp Infect.1983;4:149–157.
- British Medical Association. Uniform and dress code for doctors. December 6, 2007. Available at: http://www.bma.org.uk/employmentandcontracts/working_arrangements/CCSCdresscode051207.jsp. Accessed February 9,2010.
- .Pants, policies and paranoia.J Hosp Infect.2010;74:10–15.
Copyright © 2011 Society of Hospital Medicine