User login
Clinical Alerts Predict Readmission
Rapid response systems (RRSs) have been developed to identify and treat deteriorating patients on general hospital units.[1] The most commonly proposed approach to the problem of identifying and stabilizing deteriorating hospitalized patients includes some combination of an early warning system to detect the deterioration and an RRS to deal with it. We previously demonstrated that a relatively simple hospital‐specific prediction model employing routine laboratory values and vital sign data is capable of predicting clinical deterioration, the need for intensive care unit (ICU) transfer, and hospital mortality in patients admitted to general medicine units.[2, 3, 4, 5, 6]
Hospital readmissions within 30 days of hospital discharge occur often and are difficult to predict. Starting in 2013, readmission penalties have been applied to specific conditions in the United States (acute myocardial infarction, heart failure, and pneumonia), with the expectation that additional conditions will be added to this group in years to come.[7, 8] Unfortunately, interventions developed to date have not been universally successful in preventing hospital readmissions for various medical conditions and patient types.[9] One potential explanation for this is the inability to reliably predict which patients are at risk for readmission to better target preventative interventions. Predictors of hospital readmission can be disease specific, such as the presence of multivessel disease in patients hospitalized with myocardial infarction,[10] or more general, such as lack of available medical follow‐up postdischarge.[11] Therefore, we performed a study to determine whether the occurrence of automated clinical deterioration alerts (CDAs) predicted 30‐day hospital readmission.
METHODS
Study Location
The study was conducted on 8 general medicine units of Barnes‐Jewish Hospital, a 1250‐bed academic medical center in St. Louis, Missouri (January 15, 2015December 12, 2015). Patient care on the inpatient medicine units is delivered by either attending hospitalist physicians or housestaff physicians under the supervision of an attending physician. The study was approved by the Washington University School of Medicine Human Studies Committee, and informed consent was waived.
Study Overview
We retrospectively evaluated all adult patients (aged >18 years) admitted through the emergency department or transferred directly to the general medicine units from other institutions. We excluded patients who died while hospitalized. All data were derived from the hospital informatics database provided by the Center for Clinical Excellence, BJC HealthCare.
Primary End Point
Readmission for any reason (ie, all‐cause readmission) to an acute care facility in the 30 days following discharge after the index hospitalization served as the primary end point. Barnes‐Jewish Hospital serves as the main teaching institution for BJC Healthcare, a large integrated healthcare system of both inpatient and outpatient care. The system includes a total of 12 hospitals and multiple community health locations in a compact geographic region surrounding and including St. Louis, Missouri, and we included readmission to any of these hospitals in our analysis. Persons treated within this healthcare system are, in nearly all cases, readmitted to 1 of the system's participating 12 hospitals. If a patient who receives healthcare in the system presents to a nonsystem hospital, he/she is often transferred back into the integrated system because of issues of insurance coverage. Patients with a 30‐day readmission were compared to those without a 30‐day readmission.
Variables
We recorded information regarding demographics, median income of the zip code of residence as a marker of socioeconomic status, admission to any BJC Healthcare facility within 6 months of the index admission, and comorbidities. To represent the global burden of comorbidities in each patient, we calculated their Charlson Comorbidity Index score.[12] Severity of illness was assessed using the All Patient RefinedDiagnosis Related Groups severity of illness score.
CDA Algorithm Overview
Details regarding the CDA model development and its implementation have been previously described in detail.[4, 5, 6] In brief, we applied logistic regression techniques to develop the CDA algorithm. Manually obtained vital signs, laboratory data, and pharmacy data inputted real time into the electronic medical record (EMR) were continuously assessed. The CDA algorithm searched for the 36 input variables (Table 1) as previously described from the EMR for all patients admitted to the 8 medicine units 24 hours per day and 7 days a week.[4, 5, 6] Values for every continuous parameter were scaled so that all measurements lay in the interval (0, 1) and were normalized by the minimum and maximum of the parameter. To capture the temporal effects in our data, we retain a sliding window of all the collected data points within the last 24 hours. We then subdivide these data into a series of n equally sized buckets (eg, 6 sequential buckets of 4 hours each). To capture variations within a bucket, we compute 3 values for each bucket: the minimum, maximum, and mean data points. Each of the resulting 3 n values are input to the logistic regression equation as separate variables.
| Age |
| Alanine aminotransferase |
| Alternative medicines |
| Anion gap |
| Anti‐infectives |
| Antineoplastics |
| Aspartate aminotransferase |
| Biologicals |
| Blood pressure, diastolic |
| Blood pressure, systolic |
| Calcium, serum |
| Calcium, serum, ionized |
| Cardiovascular agents |
| Central nervous system agents |
| Charlson Comorbidity Index |
| Coagulation modifiers |
| Estimated creatinine clearance |
| Gastrointestinal agents |
| Genitourinary tract agents |
| Hormones/hormone modifiers |
| Immunologic agents |
| Magnesium, serum |
| Metabolic agents |
| Miscellaneous agents |
| Nutritional products |
| Oxygen saturation, pulse oximetry |
| Phosphate, serum |
| Potassium, serum |
| Psychotherapeutic agents |
| Pulse |
| Radiologic agents |
| Respirations |
| Respiratory agents |
| Shock Index |
| Temperature |
| Topical agents |
The algorithm was first implemented in MATLAB (MathWorks, Natick, MA). For the purposes of training, we used a single 24‐hour window of data from each patient. The dataset's 36 input variables were divided into buckets and minimum/mean/maximum features wherever applicable, resulting in 398 variables. The first half of the original dataset was used to train the model. We then used the second half of the dataset as the validation dataset. We generated a predicted outcome for each case in the validation data, using the model parameter coefficients derived from the training data. We also employed bootstrap aggregation to improve classification accuracy and to address overfitting. We then applied various threshold cut points to convert these predictions into binary values and compared the results against the ICU transfer outcome. A threshold of 0.9760 for specificity was chosen to achieve a sensitivity of approximately 40%. These operating characteristics were chosen in turn to generate a manageable number of alerts per hospital nursing unit per day (estimated at 12 per nursing unit per day). At this cut point the C statistic was 0.8834, with an overall accuracy of 0.9292.[5] Patients with inputted data meeting the CDA threshold had a real‐time alert sent to the hospital rapid response team prompting a patient evaluation.
Statistical Analysis
The number of patients admitted to the 8 general medicine units of Barnes‐Jewish Hospital during the study period determined the sample size. Categorical variables were compared using 2 or Fisher exact test as appropriate. Continuous variables were compared using the Mann‐Whitney U test. All analyses were 2‐tailed, and a P value of <0.05 was assumed to represent statistical significance. We relied on logistic regression for identifying variables independently associated with 30‐day readmission. Based on univariate analysis, variables significant at P < 0.15 were entered into the model. To arrive at the most parsimonious model, we utilized a stepwise backward elimination approach. We evaluated collinearity with the variance inflation factor. We report adjusted odds ratios (ORs) and 95% confidence intervals (CIs) where appropriate. The model's goodness of fit was assessed via calculation of the Hosmer‐Lemeshow test. Receiver operating characteristic (ROC) curves were used to compare the predictive models for 30‐day readmission with or without the CDA variable. All statistical analyses were performed using SPSS (version 22.0; IBM, Armonk, NY).
RESULTS
The final cohort had 3015 patients with a mean age of 57.5 17.5 years and 47.8% males. The most common reasons for hospital admission were infection or sepsis syndrome including pneumonia and urinary tract infections (23.6%), congestive heart failure or other cardiac conditions (18.4%), respiratory distress including chronic obstructive pulmonary disease (16.2%), acute or chronic renal failure (9.7%), gastrointestinal disorders (8.4%), and diabetes mellitus management (7.4%). Overall, there were 567 (18.8%) patients who were readmitted within 30 days of their hospital discharge date.
Table 2 shows the characteristics of patients readmitted within 30 days and of patients not requiring hospital readmission within 30 days. Patients requiring hospital readmission within 30 days were younger and had significantly more comorbidities as manifested by significantly greater Charlson scores and individual comorbidities including coronary artery disease, congestive heart disease, peripheral vascular disease, connective tissue disease, cirrhosis, diabetes mellitus with end‐organ complications, renal failure, and metastatic cancer. Patients with a 30‐day readmission had significantly longer duration of hospitalization, more emergency department visits in the 6 months prior to the index hospitalization, lower minimum hemoglobin measurements, higher minimum serum creatinine values, and were more likely to have Medicare or Medicaid insurance compared to patients without a 30‐day readmission.
| Variable | 30‐Day Readmission | P Value | |
|---|---|---|---|
| Yes (n = 567) | No (n = 2,448) | ||
| |||
| Age, y | 56.1 17.0 | 57.8 17.6 | 0.046 |
| Gender | |||
| Male | 252 (44.4) | 1,188 (48.5) | 0.079 |
| Female | 315 (55.6) | 1,260 (51.5) | |
| Race | |||
| Caucasian | 277 (48.9) | 1,234 (50.4) | 0.800 |
| African American | 257 (45.3) | 1,076 (44.0) | |
| Other | 33 (5.8) | 138 (5.6) | |
| Median income, dollars | 30,149 [25,23436,453] | 29,271 [24,83037,026] | 0.903 |
| BMI | 29.4 10.0 | 29.0 9.2 | 0.393 |
| APR‐DRG Severity of Illness Score | 2.6 0.4 | 2.5 0.5 | 0.152 |
| Charlson Comorbidity Index | 6 [39] | 5 [27] | <0.001 |
| ICU transfer during admission | 93 (16.4) | 410 (16.7) | 0.842 |
| Myocardial infarction | 83 (14.6) | 256 (10.5) | 0.005 |
| Congestive heart failure | 177 (31.2) | 540 (22.1) | <0.001 |
| Peripheral vascular disease | 76 (13.4) | 214 (8.7) | 0.001 |
| Cardiovascular disease | 69 (12.2) | 224 (9.2) | 0.029 |
| Dementia | 15 (2.6) | 80 (3.3) | 0.445 |
| Chronic obstructive pulmonary disease | 220 (38.8) | 855 (34.9) | 0.083 |
| Connective tissue disease | 45 (7.9) | 118 (4.8) | 0.003 |
| Peptic ulcer disease | 26 (4.6) | 111 (4.5) | 0.958 |
| Cirrhosis | 60 (10.6) | 141 (5.8) | <0.001 |
| Diabetes mellitus without end‐organ complications | 148 (26.1) | 625 (25.5) | 0.779 |
| Diabetes mellitus with end‐organ complications | 92 (16.2) | 197 (8.0) | <0.001 |
| Paralysis | 25 (4.4) | 77 (3.1) | 0.134 |
| Renal failure | 214 (37.7) | 620 (25.3) | <0.001 |
| Underlying malignancy | 85 (15.0) | 314 (12.8) | 0.171 |
| Metastatic cancer | 64 (11.3) | 163 (6.7) | <0.001 |
| Human immunodeficiency virus | 10 (1.8) | 47 (1.9) | 0.806 |
| Minimum hemoglobin, g/dL | 9.1 [7.411.4] | 10.7 [8.712.4] | <0.001 |
| Minimum creatinine, mg/dL | 1.12 [0.792.35] | 1.03 [0.791.63] | 0.006 |
| Length of stay, d | 3.8 [1.97.8] | 3.3 [1.85.9] | <0.001 |
| ED visit in the past year | 1 [03] | 0 [01] | <0.001 |
| Clinical deterioration alert triggered | 269 (47.4) | 872 (35.6%) | <0.001 |
| Insurance | |||
| Private | 111 (19.6) | 528 (21.6) | 0.020 |
| Medicare | 299 (52.7) | 1,217 (49.7) | |
| Medicaid | 129 (22.8) | 499 (20.4) | |
| Patient pay | 28 (4.9) | 204 (8.3) | |
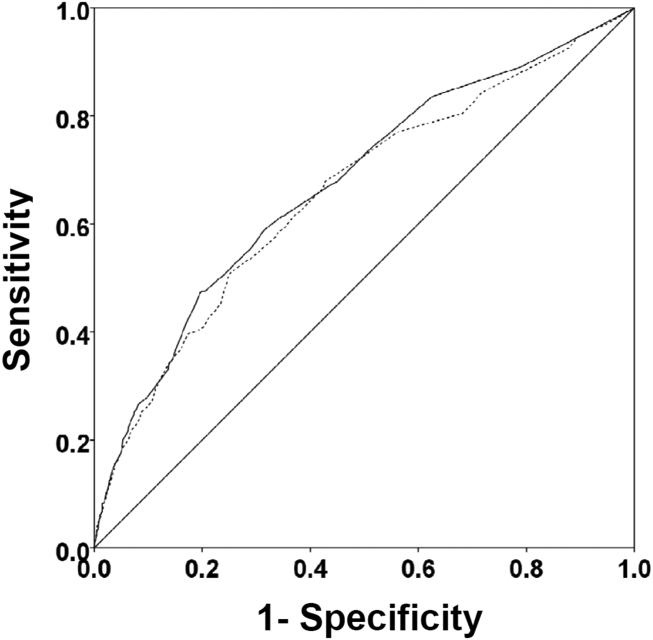
There were 1141 (34.4%) patients that triggered a CDA. Patients triggering a CDA were significantly more likely to have a 30‐day readmission compared to those who did not trigger a CDA (23.6% vs 15.9%; P < 0.001). Patients triggering a CDA were also significantly more likely to be readmitted within 60 days (31.7% vs 22.1%; P < 0.001) and 90 days (35.8% vs 26.2%; P < 0.001) compared to patients who did not trigger a CDA. Multiple logistic regression identified the triggering of a CDA to be independently associated with 30‐day readmission (OR: 1.40; 95% CI: 1.26‐1.55; P = 0.001) (Table 3). Other independent predictors of 30‐day readmission were: an emergency department visit in the previous 6 months, increasing age in 1‐year increments, presence of connective tissue disease, diabetes mellitus with end‐organ complications, chronic renal disease, cirrhosis, and metastatic cancer (Hosmer‐Lemeshow goodness of fit test, 0.363). Figure 1 reveals the ROC curves for the logistic regression model (Table 3) with and without the CDA variable. As the ROC curves document, the 2 models had similar sensitivity for the entire range of specificities. Reflecting this, the area under the ROC curve for the model inclusive of the CDA variable equaled 0.675 (95% CI: 0.649‐0.700), whereas the area under the ROC curve for the model excluding the CDA variable equaled 0.658 (95% CI: 0.632‐0.684).
| Variables | OR | 95% CI | P Value |
|---|---|---|---|
| |||
| Clinical deterioration alert | 1.40 | 1.261.55 | 0.001 |
| Age (1‐point increments) | 1.01 | 1.011.02 | 0.003 |
| Connective tissue disease | 1.63 | 1.341.98 | 0.012 |
| Cirrhosis | 1.25 | 1.171.33 | <0.001 |
| Diabetes mellitus with end‐organ complications | 1.23 | 1.131.33 | 0.010 |
| Chronic renal disease | 1.16 | 1.081.24 | 0.034 |
| Metastatic cancer | 1.12 | 1.081.17 | 0.002 |
| Emergency department visit in previous 6 months | 1.23 | 1.201.26 | <0.001 |

DISCUSSION
We demonstrated that the occurrence of an automated CDA is associated with increased risk for 30‐day hospital readmission. However, the addition of the CDA variable to the other variables identified to be independently associated with 30‐day readmission (Table 3) did not significantly add to the overall predictive accuracy of the derived logistic regression model. Other investigators have previously attempted to develop automated predictors of hospital readmission. Amarasingham et al. developed a real‐time electronic predictive model that identifies hospitalized heart failure patients at high risk for readmission or death from clinical and nonclinical risk factors present on admission.[13] Their electronic model demonstrated good discrimination for 30‐day mortality and readmission and performed as well, or better than, models developed by the Center for Medicaid and Medicare Services and the Acute Decompensated Heart Failure Registry. Similarly, Baillie et al. developed an automated prediction model that was effectively integrated into an existing EMR and identified patients on admission who were at risk for readmission within 30 days of discharge.[14] Our automated CDA differs from these previous risk predictors by surveying patients throughout their hospital stay as opposed to identifying risk for readmission at a single time point.
Several limitations of our study should be recognized. First, this was a noninterventional study aimed at examining the ability of CDAs to predict hospital readmission. Future studies are needed to assess whether the use of enhanced readmission prediction algorithms can be utilized to avert hospital readmissions. Second, the data derive from a single center, and this necessarily limits the generalizability of our findings. As such, our results may not reflect what one might see at other institutions. For example, Barnes‐Jewish Hospital has a regional referral pattern that includes community hospitals, regional long‐term acute care hospitals, nursing homes, and chronic wound, dialysis, and infusion clinics. This may explain, in part, the relatively high rate of hospital readmission observed in our cohort. Third, there is the possibility that CDAs were associated with readmission by chance given the number of potential predictor variables examined. The importance of CDAs as a determinant of rehospitalization requires confirmation in other independent populations. Fourth, it is likely that we did not capture all hospital readmissions, primarily those occurring outside of our hospital system. Therefore, we may have underestimated the actual rates of readmission for this cohort. Finally, we cannot be certain that all important predictors of hospital readmission were captured in this study.
The development of an accurate real‐time early warning system has the potential to identify patients at risk for various adverse outcomes including clinical deterioration, hospital death, and postdischarge readmission. By identifying patients at greatest risk for readmission, valuable healthcare resources can be better targeted to such populations. Our findings suggest that existing readmission predictors may suboptimally risk‐stratify patients, and it may be important to include additional clinical variables if pay for performance and other across‐institution comparisons are to be fair to institutions that care for more seriously ill patients. The variables identified as predictors of 30‐day hospital readmission in our study, with the exception of a CDA, are all readily identifiable clinical characteristics. The modest incremental value of a CDA to these clinical characteristics suggests that they would suffice for the identification of patients at high risk for hospital readmission. This is especially important for safety‐net institutions not routinely employing automated CDAs. These safety‐net hospitals provide a disproportionate level of care for patients who otherwise would have difficulty obtaining inpatient medical care and disproportionately carry the greatest burden of hospital readmissions.[15]
Disclosure
This study was funded in part by the Barnes‐Jewish Hospital Foundation and by grant number UL1 RR024992 from the National Center for Research Resources (NCRR), a component of the National Institutes of Health (NIH), and NIH Roadmap for Medical Research. Its contents are solely the responsibility of the authors and do not necessarily represent the official views of the NCRR or NIH.
- , , . Rapid‐response teams. N Engl J Med. 2011;365:139–146.
- , , , , , . Early prediction of septic shock in hospitalized patients. J Hosp Med. 2010;5:19–25.
- , , , et al. Implementation of a real‐time computerized sepsis alert in nonintensive care unit patients. Crit Care Med. 2011;39:469–473.
- , , , et al. Toward a two‐tier clinical warning system for hospitalized patients. AMIA Annu Symp Proc. 2011;2011:511–519.
- , , , et al. A trial of a real‐time alert for clinical deterioration in patients hospitalized on general medical wards. J Hosp Med. 2013;8:236–242.
- , , , et al. A randomized trial of real‐time automated clinical deterioration alerts sent to a rapid response team. J Hosp Med. 2014;9:424–429.
- , . Revisiting hospital readmissions JAMA. 2013;309:398–400.
- , , , . Adverse outcomes associated with delayed intensive care unit transfers in an integrated healthcare system. J Hosp Med. 2012;7:224–230.
- , , , , . Interventions to reduce 30‐day rehospitalization: a systematic review. Ann Intern Med. 2011; 155:520–528.
- , , , et al. International variation in and factors associated with hospital readmission after myocardial infarction. JAMA. 2012;307:66–74.
- , , , , . Predictors of early readmission among patients 40 to 64 years of age hospitalized for chronic obstructive pulmonary disease. Ann Am Thorac Soc. 2014;11:685–694.
- , , , , , . Assessing illness severity: does clinical judgement work? J Chronic Dis. 1986;39:439–452.
- , , , et al. An automated model to identify heart failure patients at risk for 30‐day readmission or death using electronic medical record data. Med Care. 2010;48:981–988.
- , , , et al. The readmission risk flag: using the electronic health record to automatically identify patients at risk for 30‐day readmission. J Hosp Med. 2013;8:689–695.
- , , . The Medicare hospital readmissions reduction program: time for reform. JAMA. 2015;314:347–348.
Rapid response systems (RRSs) have been developed to identify and treat deteriorating patients on general hospital units.[1] The most commonly proposed approach to the problem of identifying and stabilizing deteriorating hospitalized patients includes some combination of an early warning system to detect the deterioration and an RRS to deal with it. We previously demonstrated that a relatively simple hospital‐specific prediction model employing routine laboratory values and vital sign data is capable of predicting clinical deterioration, the need for intensive care unit (ICU) transfer, and hospital mortality in patients admitted to general medicine units.[2, 3, 4, 5, 6]
Hospital readmissions within 30 days of hospital discharge occur often and are difficult to predict. Starting in 2013, readmission penalties have been applied to specific conditions in the United States (acute myocardial infarction, heart failure, and pneumonia), with the expectation that additional conditions will be added to this group in years to come.[7, 8] Unfortunately, interventions developed to date have not been universally successful in preventing hospital readmissions for various medical conditions and patient types.[9] One potential explanation for this is the inability to reliably predict which patients are at risk for readmission to better target preventative interventions. Predictors of hospital readmission can be disease specific, such as the presence of multivessel disease in patients hospitalized with myocardial infarction,[10] or more general, such as lack of available medical follow‐up postdischarge.[11] Therefore, we performed a study to determine whether the occurrence of automated clinical deterioration alerts (CDAs) predicted 30‐day hospital readmission.
METHODS
Study Location
The study was conducted on 8 general medicine units of Barnes‐Jewish Hospital, a 1250‐bed academic medical center in St. Louis, Missouri (January 15, 2015December 12, 2015). Patient care on the inpatient medicine units is delivered by either attending hospitalist physicians or housestaff physicians under the supervision of an attending physician. The study was approved by the Washington University School of Medicine Human Studies Committee, and informed consent was waived.
Study Overview
We retrospectively evaluated all adult patients (aged >18 years) admitted through the emergency department or transferred directly to the general medicine units from other institutions. We excluded patients who died while hospitalized. All data were derived from the hospital informatics database provided by the Center for Clinical Excellence, BJC HealthCare.
Primary End Point
Readmission for any reason (ie, all‐cause readmission) to an acute care facility in the 30 days following discharge after the index hospitalization served as the primary end point. Barnes‐Jewish Hospital serves as the main teaching institution for BJC Healthcare, a large integrated healthcare system of both inpatient and outpatient care. The system includes a total of 12 hospitals and multiple community health locations in a compact geographic region surrounding and including St. Louis, Missouri, and we included readmission to any of these hospitals in our analysis. Persons treated within this healthcare system are, in nearly all cases, readmitted to 1 of the system's participating 12 hospitals. If a patient who receives healthcare in the system presents to a nonsystem hospital, he/she is often transferred back into the integrated system because of issues of insurance coverage. Patients with a 30‐day readmission were compared to those without a 30‐day readmission.
Variables
We recorded information regarding demographics, median income of the zip code of residence as a marker of socioeconomic status, admission to any BJC Healthcare facility within 6 months of the index admission, and comorbidities. To represent the global burden of comorbidities in each patient, we calculated their Charlson Comorbidity Index score.[12] Severity of illness was assessed using the All Patient RefinedDiagnosis Related Groups severity of illness score.
CDA Algorithm Overview
Details regarding the CDA model development and its implementation have been previously described in detail.[4, 5, 6] In brief, we applied logistic regression techniques to develop the CDA algorithm. Manually obtained vital signs, laboratory data, and pharmacy data inputted real time into the electronic medical record (EMR) were continuously assessed. The CDA algorithm searched for the 36 input variables (Table 1) as previously described from the EMR for all patients admitted to the 8 medicine units 24 hours per day and 7 days a week.[4, 5, 6] Values for every continuous parameter were scaled so that all measurements lay in the interval (0, 1) and were normalized by the minimum and maximum of the parameter. To capture the temporal effects in our data, we retain a sliding window of all the collected data points within the last 24 hours. We then subdivide these data into a series of n equally sized buckets (eg, 6 sequential buckets of 4 hours each). To capture variations within a bucket, we compute 3 values for each bucket: the minimum, maximum, and mean data points. Each of the resulting 3 n values are input to the logistic regression equation as separate variables.
| Age |
| Alanine aminotransferase |
| Alternative medicines |
| Anion gap |
| Anti‐infectives |
| Antineoplastics |
| Aspartate aminotransferase |
| Biologicals |
| Blood pressure, diastolic |
| Blood pressure, systolic |
| Calcium, serum |
| Calcium, serum, ionized |
| Cardiovascular agents |
| Central nervous system agents |
| Charlson Comorbidity Index |
| Coagulation modifiers |
| Estimated creatinine clearance |
| Gastrointestinal agents |
| Genitourinary tract agents |
| Hormones/hormone modifiers |
| Immunologic agents |
| Magnesium, serum |
| Metabolic agents |
| Miscellaneous agents |
| Nutritional products |
| Oxygen saturation, pulse oximetry |
| Phosphate, serum |
| Potassium, serum |
| Psychotherapeutic agents |
| Pulse |
| Radiologic agents |
| Respirations |
| Respiratory agents |
| Shock Index |
| Temperature |
| Topical agents |
The algorithm was first implemented in MATLAB (MathWorks, Natick, MA). For the purposes of training, we used a single 24‐hour window of data from each patient. The dataset's 36 input variables were divided into buckets and minimum/mean/maximum features wherever applicable, resulting in 398 variables. The first half of the original dataset was used to train the model. We then used the second half of the dataset as the validation dataset. We generated a predicted outcome for each case in the validation data, using the model parameter coefficients derived from the training data. We also employed bootstrap aggregation to improve classification accuracy and to address overfitting. We then applied various threshold cut points to convert these predictions into binary values and compared the results against the ICU transfer outcome. A threshold of 0.9760 for specificity was chosen to achieve a sensitivity of approximately 40%. These operating characteristics were chosen in turn to generate a manageable number of alerts per hospital nursing unit per day (estimated at 12 per nursing unit per day). At this cut point the C statistic was 0.8834, with an overall accuracy of 0.9292.[5] Patients with inputted data meeting the CDA threshold had a real‐time alert sent to the hospital rapid response team prompting a patient evaluation.
Statistical Analysis
The number of patients admitted to the 8 general medicine units of Barnes‐Jewish Hospital during the study period determined the sample size. Categorical variables were compared using 2 or Fisher exact test as appropriate. Continuous variables were compared using the Mann‐Whitney U test. All analyses were 2‐tailed, and a P value of <0.05 was assumed to represent statistical significance. We relied on logistic regression for identifying variables independently associated with 30‐day readmission. Based on univariate analysis, variables significant at P < 0.15 were entered into the model. To arrive at the most parsimonious model, we utilized a stepwise backward elimination approach. We evaluated collinearity with the variance inflation factor. We report adjusted odds ratios (ORs) and 95% confidence intervals (CIs) where appropriate. The model's goodness of fit was assessed via calculation of the Hosmer‐Lemeshow test. Receiver operating characteristic (ROC) curves were used to compare the predictive models for 30‐day readmission with or without the CDA variable. All statistical analyses were performed using SPSS (version 22.0; IBM, Armonk, NY).
RESULTS
The final cohort had 3015 patients with a mean age of 57.5 17.5 years and 47.8% males. The most common reasons for hospital admission were infection or sepsis syndrome including pneumonia and urinary tract infections (23.6%), congestive heart failure or other cardiac conditions (18.4%), respiratory distress including chronic obstructive pulmonary disease (16.2%), acute or chronic renal failure (9.7%), gastrointestinal disorders (8.4%), and diabetes mellitus management (7.4%). Overall, there were 567 (18.8%) patients who were readmitted within 30 days of their hospital discharge date.
Table 2 shows the characteristics of patients readmitted within 30 days and of patients not requiring hospital readmission within 30 days. Patients requiring hospital readmission within 30 days were younger and had significantly more comorbidities as manifested by significantly greater Charlson scores and individual comorbidities including coronary artery disease, congestive heart disease, peripheral vascular disease, connective tissue disease, cirrhosis, diabetes mellitus with end‐organ complications, renal failure, and metastatic cancer. Patients with a 30‐day readmission had significantly longer duration of hospitalization, more emergency department visits in the 6 months prior to the index hospitalization, lower minimum hemoglobin measurements, higher minimum serum creatinine values, and were more likely to have Medicare or Medicaid insurance compared to patients without a 30‐day readmission.
| Variable | 30‐Day Readmission | P Value | |
|---|---|---|---|
| Yes (n = 567) | No (n = 2,448) | ||
| |||
| Age, y | 56.1 17.0 | 57.8 17.6 | 0.046 |
| Gender | |||
| Male | 252 (44.4) | 1,188 (48.5) | 0.079 |
| Female | 315 (55.6) | 1,260 (51.5) | |
| Race | |||
| Caucasian | 277 (48.9) | 1,234 (50.4) | 0.800 |
| African American | 257 (45.3) | 1,076 (44.0) | |
| Other | 33 (5.8) | 138 (5.6) | |
| Median income, dollars | 30,149 [25,23436,453] | 29,271 [24,83037,026] | 0.903 |
| BMI | 29.4 10.0 | 29.0 9.2 | 0.393 |
| APR‐DRG Severity of Illness Score | 2.6 0.4 | 2.5 0.5 | 0.152 |
| Charlson Comorbidity Index | 6 [39] | 5 [27] | <0.001 |
| ICU transfer during admission | 93 (16.4) | 410 (16.7) | 0.842 |
| Myocardial infarction | 83 (14.6) | 256 (10.5) | 0.005 |
| Congestive heart failure | 177 (31.2) | 540 (22.1) | <0.001 |
| Peripheral vascular disease | 76 (13.4) | 214 (8.7) | 0.001 |
| Cardiovascular disease | 69 (12.2) | 224 (9.2) | 0.029 |
| Dementia | 15 (2.6) | 80 (3.3) | 0.445 |
| Chronic obstructive pulmonary disease | 220 (38.8) | 855 (34.9) | 0.083 |
| Connective tissue disease | 45 (7.9) | 118 (4.8) | 0.003 |
| Peptic ulcer disease | 26 (4.6) | 111 (4.5) | 0.958 |
| Cirrhosis | 60 (10.6) | 141 (5.8) | <0.001 |
| Diabetes mellitus without end‐organ complications | 148 (26.1) | 625 (25.5) | 0.779 |
| Diabetes mellitus with end‐organ complications | 92 (16.2) | 197 (8.0) | <0.001 |
| Paralysis | 25 (4.4) | 77 (3.1) | 0.134 |
| Renal failure | 214 (37.7) | 620 (25.3) | <0.001 |
| Underlying malignancy | 85 (15.0) | 314 (12.8) | 0.171 |
| Metastatic cancer | 64 (11.3) | 163 (6.7) | <0.001 |
| Human immunodeficiency virus | 10 (1.8) | 47 (1.9) | 0.806 |
| Minimum hemoglobin, g/dL | 9.1 [7.411.4] | 10.7 [8.712.4] | <0.001 |
| Minimum creatinine, mg/dL | 1.12 [0.792.35] | 1.03 [0.791.63] | 0.006 |
| Length of stay, d | 3.8 [1.97.8] | 3.3 [1.85.9] | <0.001 |
| ED visit in the past year | 1 [03] | 0 [01] | <0.001 |
| Clinical deterioration alert triggered | 269 (47.4) | 872 (35.6%) | <0.001 |
| Insurance | |||
| Private | 111 (19.6) | 528 (21.6) | 0.020 |
| Medicare | 299 (52.7) | 1,217 (49.7) | |
| Medicaid | 129 (22.8) | 499 (20.4) | |
| Patient pay | 28 (4.9) | 204 (8.3) | |
There were 1141 (34.4%) patients that triggered a CDA. Patients triggering a CDA were significantly more likely to have a 30‐day readmission compared to those who did not trigger a CDA (23.6% vs 15.9%; P < 0.001). Patients triggering a CDA were also significantly more likely to be readmitted within 60 days (31.7% vs 22.1%; P < 0.001) and 90 days (35.8% vs 26.2%; P < 0.001) compared to patients who did not trigger a CDA. Multiple logistic regression identified the triggering of a CDA to be independently associated with 30‐day readmission (OR: 1.40; 95% CI: 1.26‐1.55; P = 0.001) (Table 3). Other independent predictors of 30‐day readmission were: an emergency department visit in the previous 6 months, increasing age in 1‐year increments, presence of connective tissue disease, diabetes mellitus with end‐organ complications, chronic renal disease, cirrhosis, and metastatic cancer (Hosmer‐Lemeshow goodness of fit test, 0.363). Figure 1 reveals the ROC curves for the logistic regression model (Table 3) with and without the CDA variable. As the ROC curves document, the 2 models had similar sensitivity for the entire range of specificities. Reflecting this, the area under the ROC curve for the model inclusive of the CDA variable equaled 0.675 (95% CI: 0.649‐0.700), whereas the area under the ROC curve for the model excluding the CDA variable equaled 0.658 (95% CI: 0.632‐0.684).
| Variables | OR | 95% CI | P Value |
|---|---|---|---|
| |||
| Clinical deterioration alert | 1.40 | 1.261.55 | 0.001 |
| Age (1‐point increments) | 1.01 | 1.011.02 | 0.003 |
| Connective tissue disease | 1.63 | 1.341.98 | 0.012 |
| Cirrhosis | 1.25 | 1.171.33 | <0.001 |
| Diabetes mellitus with end‐organ complications | 1.23 | 1.131.33 | 0.010 |
| Chronic renal disease | 1.16 | 1.081.24 | 0.034 |
| Metastatic cancer | 1.12 | 1.081.17 | 0.002 |
| Emergency department visit in previous 6 months | 1.23 | 1.201.26 | <0.001 |
DISCUSSION
We demonstrated that the occurrence of an automated CDA is associated with increased risk for 30‐day hospital readmission. However, the addition of the CDA variable to the other variables identified to be independently associated with 30‐day readmission (Table 3) did not significantly add to the overall predictive accuracy of the derived logistic regression model. Other investigators have previously attempted to develop automated predictors of hospital readmission. Amarasingham et al. developed a real‐time electronic predictive model that identifies hospitalized heart failure patients at high risk for readmission or death from clinical and nonclinical risk factors present on admission.[13] Their electronic model demonstrated good discrimination for 30‐day mortality and readmission and performed as well, or better than, models developed by the Center for Medicaid and Medicare Services and the Acute Decompensated Heart Failure Registry. Similarly, Baillie et al. developed an automated prediction model that was effectively integrated into an existing EMR and identified patients on admission who were at risk for readmission within 30 days of discharge.[14] Our automated CDA differs from these previous risk predictors by surveying patients throughout their hospital stay as opposed to identifying risk for readmission at a single time point.
Several limitations of our study should be recognized. First, this was a noninterventional study aimed at examining the ability of CDAs to predict hospital readmission. Future studies are needed to assess whether the use of enhanced readmission prediction algorithms can be utilized to avert hospital readmissions. Second, the data derive from a single center, and this necessarily limits the generalizability of our findings. As such, our results may not reflect what one might see at other institutions. For example, Barnes‐Jewish Hospital has a regional referral pattern that includes community hospitals, regional long‐term acute care hospitals, nursing homes, and chronic wound, dialysis, and infusion clinics. This may explain, in part, the relatively high rate of hospital readmission observed in our cohort. Third, there is the possibility that CDAs were associated with readmission by chance given the number of potential predictor variables examined. The importance of CDAs as a determinant of rehospitalization requires confirmation in other independent populations. Fourth, it is likely that we did not capture all hospital readmissions, primarily those occurring outside of our hospital system. Therefore, we may have underestimated the actual rates of readmission for this cohort. Finally, we cannot be certain that all important predictors of hospital readmission were captured in this study.
The development of an accurate real‐time early warning system has the potential to identify patients at risk for various adverse outcomes including clinical deterioration, hospital death, and postdischarge readmission. By identifying patients at greatest risk for readmission, valuable healthcare resources can be better targeted to such populations. Our findings suggest that existing readmission predictors may suboptimally risk‐stratify patients, and it may be important to include additional clinical variables if pay for performance and other across‐institution comparisons are to be fair to institutions that care for more seriously ill patients. The variables identified as predictors of 30‐day hospital readmission in our study, with the exception of a CDA, are all readily identifiable clinical characteristics. The modest incremental value of a CDA to these clinical characteristics suggests that they would suffice for the identification of patients at high risk for hospital readmission. This is especially important for safety‐net institutions not routinely employing automated CDAs. These safety‐net hospitals provide a disproportionate level of care for patients who otherwise would have difficulty obtaining inpatient medical care and disproportionately carry the greatest burden of hospital readmissions.[15]
Disclosure
This study was funded in part by the Barnes‐Jewish Hospital Foundation and by grant number UL1 RR024992 from the National Center for Research Resources (NCRR), a component of the National Institutes of Health (NIH), and NIH Roadmap for Medical Research. Its contents are solely the responsibility of the authors and do not necessarily represent the official views of the NCRR or NIH.
- , , . Rapid‐response teams. N Engl J Med. 2011;365:139–146.
- , , , , , . Early prediction of septic shock in hospitalized patients. J Hosp Med. 2010;5:19–25.
- , , , et al. Implementation of a real‐time computerized sepsis alert in nonintensive care unit patients. Crit Care Med. 2011;39:469–473.
- , , , et al. Toward a two‐tier clinical warning system for hospitalized patients. AMIA Annu Symp Proc. 2011;2011:511–519.
- , , , et al. A trial of a real‐time alert for clinical deterioration in patients hospitalized on general medical wards. J Hosp Med. 2013;8:236–242.
- , , , et al. A randomized trial of real‐time automated clinical deterioration alerts sent to a rapid response team. J Hosp Med. 2014;9:424–429.
- , . Revisiting hospital readmissions JAMA. 2013;309:398–400.
- , , , . Adverse outcomes associated with delayed intensive care unit transfers in an integrated healthcare system. J Hosp Med. 2012;7:224–230.
- , , , , . Interventions to reduce 30‐day rehospitalization: a systematic review. Ann Intern Med. 2011; 155:520–528.
- , , , et al. International variation in and factors associated with hospital readmission after myocardial infarction. JAMA. 2012;307:66–74.
- , , , , . Predictors of early readmission among patients 40 to 64 years of age hospitalized for chronic obstructive pulmonary disease. Ann Am Thorac Soc. 2014;11:685–694.
- , , , , , . Assessing illness severity: does clinical judgement work? J Chronic Dis. 1986;39:439–452.
- , , , et al. An automated model to identify heart failure patients at risk for 30‐day readmission or death using electronic medical record data. Med Care. 2010;48:981–988.
- , , , et al. The readmission risk flag: using the electronic health record to automatically identify patients at risk for 30‐day readmission. J Hosp Med. 2013;8:689–695.
- , , . The Medicare hospital readmissions reduction program: time for reform. JAMA. 2015;314:347–348.
Secular Trends in AB Resistance
Among hospitalized patients with serious infections, the choice of empiric therapy plays a key role in outcomes.[1, 2, 3, 4, 5, 6, 7, 8, 9] Rising rates and variable patterns of antimicrobial resistance, however, complicate selecting appropriate empiric therapy. Amidst this shifting landscape of resistance to antimicrobials, gram‐negative bacteria and specifically Acinetobacter baumannii (AB), remain a considerable challenge.[10] On the one hand, AB is a less‐frequent cause of serious infections than organisms like Pseudomonas aeruginosa or Enterobacteriaceae in severely ill hospitalized patients.[11, 12] On the other, AB has evolved a variety of resistance mechanisms and exhibits unpredictable susceptibility patterns.[13] These factors combine to increase the likelihood of administering inappropriate empiric therapy when faced with an infection caused by AB and, thereby, raising the risk of death.[14] The fact that clinicians may not routinely consider AB as the potential culprit pathogen in the patient they are treating along with this organism's highly in vitro resistant nature, may result in routine gram‐negative coverage being frequently inadequate for AB infections.
To address the poor outcomes related to inappropriate empiric therapy in the setting of AB, one requires an appreciation of the longitudinal changes and geographic differences in the susceptibility of this pathogen. Thus, we aimed to examine secular trends in the resistance of AB to antimicrobial agents whose effectiveness against this microorganism was well supported in the literature during the study timeframe.[15]
METHODS
To determine the prevalence of predefined resistance patterns among AB in respiratory and blood stream infection (BSI) specimens, we examined The Surveillance Network (TSN) database from Eurofins. We explored data collected between years 2003 and 2012. The database has been used extensively for surveillance purposes since 1994, and has previously been described in detail.[16, 17, 18, 19, 20] Briefly, TSN is a warehouse of routine clinical microbiology data collected from a nationally representative sample of microbiology laboratories in 217 hospitals in the United States. To minimize selection bias, laboratories are included based on their geography and the demographics of the populations they serve.[18] Only clinically significant samples are reported. No personal identifying information for source patients is available in this database. Only source laboratories that perform antimicrobial susceptibility testing according standard Food and Drug Administrationapproved testing methods and that interpret susceptibility in accordance with the Clinical Laboratory Standards Institute breakpoints are included.[21] (See Supporting Table 4 in the online version of this article for minimum inhibitory concentration (MIC) changes over the course of the studycurrent colistin and polymyxin breakpoints applied retrospectively). All enrolled laboratories undergo a pre‐enrollment site visit. Logical filters are used for routine quality control to detect unusual susceptibility profiles and to ensure appropriate testing methods. Repeat testing and reporting are done as necessary.[18]
Laboratory samples are reported as susceptible, intermediate, or resistant. We grouped isolates with intermediate MICs together with the resistant ones for the purposes of the current analysis. Duplicate isolates were excluded. Only samples representing 1 of the 2 infections of interest, respiratory or BSI, were included.
We examined 3 time periods2003 to 2005, 2006 to 2008, and 2009 to 2012for the prevalence of AB's resistance to the following antibiotics: carbapenems (imipenem, meropenem, doripenem), aminoglycosides (tobramycin, amikacin), tetracyclines (minocycline, doxycycline), polymyxins (colistin, polymyxin B), ampicillin‐sulbactam, and trimethoprim‐sulfamethoxazole. Antimicrobial resistance was defined by the designation of intermediate or resistant in the susceptibility category. Resistance to a class of antibiotics was defined as resistance to all drugs within the class for which testing was available. The organism was multidrug resistant (MDR) if it was resistant to at least 1 antimicrobial in at least 3 drug classes examined.[22] Resistance to a combination of 2 drugs was present if the specimen was resistant to both of the drugs in the combination for which testing was available. We examined the data by infection type, time period, the 9 US Census divisions, and location of origin of the sample.
All categorical variables are reported as percentages. Continuous variables are reported as meansstandard deviations and/or medians with the interquartile range (IQR). We did not pursue hypothesis testing due to a high risk of type I error in this large dataset. Therefore, only clinically important trends are highlighted.
RESULTS
Among the 39,320 AB specimens, 81.1% were derived from a respiratory source and 18.9% represented BSI. Demographics of source patients are listed in Table 1. Notably, the median age of those with respiratory infection (58 years; IQR 38, 73) was higher than among patients with BSI (54.5 years; IQR 36, 71), and there were proportionally fewer females among respiratory patients (39.9%) than those with BSI (46.0%). Though only 24.3% of all BSI samples originated from the intensive are unit (ICU), 40.5% of respiratory specimens came from that location. The plurality of all specimens was collected in the 2003 to 2005 time interval (41.3%), followed by 2006 to 2008 (34.7%), with a minority coming from years 2009 to 2012 (24.0%). The proportions of collected specimens from respiratory and BSI sources were similar in all time periods examined (Table 1). Geographically, the South Atlantic division contributed the most samples (24.1%) and East South Central the fewest (2.6%) (Figure 1). The vast majority of all samples came from hospital wards (78.6%), where roughly one‐half originated in the ICU (37.5%). Fewer still came from outpatient sources (18.3%), and a small minority (2.5%) from nursing homes.

| Pneumonia | BSI | All | |
|---|---|---|---|
| |||
| Total, N (%) | 31,868 (81.1) | 7,452 (18.9) | 39,320 |
| Age, y | |||
| Mean (SD) | 57.7 (37.4) | 57.6 (40.6) | 57.7 (38.0) |
| Median (IQR 25, 75) | 58 (38, 73) | 54.5 (36, 71) | 57 (37, 73) |
| Gender, female (%) | 12,725 (39.9) | 3,425 (46.0) | 16,150 (41.1) |
| ICU (%) | 12,9191 (40.5) | 1,809 (24.3) | 14,7284 (37.5) |
| Time period, % total | |||
| 20032005 | 12,910 (40.5) | 3,340 (44.8) | 16,250 (41.3) |
| 20062008 | 11,205 (35.2) | 2,435 (32.7) | 13,640 (34.7) |
| 20092012 | 7,753 (24.3) | 1,677 (22.5) | 9,430 (24.0) |
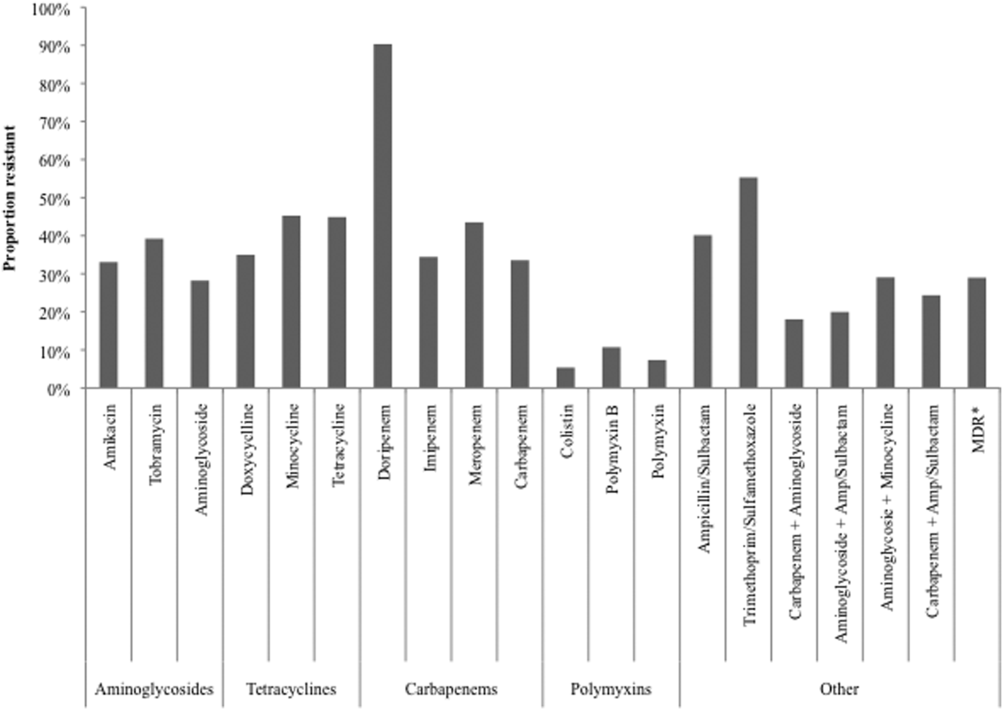
Figure 2 depicts overall resistance patterns by individual drugs, drug classes, and frequently used combinations of agents. Although doripenem had the highest rate of resistance numerically (90.3%), its susceptibility was tested only in a small minority of specimens (n=31, 0.08%). Resistance to trimethoprim‐sulfamethoxazole was high (55.3%) based on a large number of samples tested (n=33,031). Conversely, colistin as an agent and polymyxins as a class exhibited the highest susceptibility rates of over 90%, though the numbers of samples tested for susceptibility to these drugs were also small (colistin n=2,086, 5.3%; polymyxins n=3,120, 7.9%) (Figure 2). Among commonly used drug combinations, carbapenem+aminoglycoside (18.0%) had the lowest resistance rates, and nearly 30% of all AB specimens tested met the criteria for MDR.
Over time, resistance to carbapenems more‐than doubled, from 21.0% in 2003 to 2005 to 47.9% in 2009 to 2012 (Table 2). Although relatively few samples were tested for colistin susceptibility (n=2,086, 5.3%), resistance to this drug also more than doubled from 2.8% (95% confidence interval: 1.9‐4.2) in 2006 to 2008 to 6.9% (95% confidence interval: 5.7‐8.2) in 2009 to 2012. As a class, however, polymyxins exhibited stable resistance rates over the time frame of the study (Table 2). Prevalence of MDR AB rose from 21.4% in 2003 to 2005 to 33.7% in 2006 to 2008, and remained stable at 35.2% in 2009 to 2012. Resistance to even such broad combinations as carbapenem+ampicillin/sulbactam nearly tripled from 13.2% in 2003 to 2005 to 35.5% in 2009 to 2012. Notably, between 2003 and 2012, although resistance rates either rose or remained stable to all other agents, those to minocycline diminished from 56.5% in 2003 to 2005 to 36.6% in 2006 to 2008 to 30.5% in 2009 to 2012. (See Supporting Table 1 in the online version of this article for time trends based on whether they represented respiratory or BSI specimens, with directionally similar trends in both.)
| Drug/Combination | Time Period | ||||||||
|---|---|---|---|---|---|---|---|---|---|
| 20032005 | 20062008 | 20092012 | |||||||
| Na | %b | 95% CI | N | % | 95% CI | N | % | 95% CI | |
| |||||||||
| Amikacin | 12,949 | 25.2 | 24.5‐26.0 | 10.929 | 35.2 | 34.3‐36.1 | 6,292 | 45.7 | 44.4‐46.9 |
| Tobramycin | 14,549 | 37.1 | 36.3‐37.9 | 11,877 | 41.9 | 41.0‐42.8 | 7,901 | 39.2 | 38.1‐40.3 |
| Aminoglycoside | 14,505 | 22.5 | 21.8‐23.2 | 11,967 | 30.6 | 29.8‐31.4 | 7,736 | 34.8 | 33.8‐35.8 |
| Doxycycline | 173 | 36.4 | 29.6‐43.8 | 38 | 29.0 | 17.0‐44.8 | 32 | 34.4 | 20.4‐51.7 |
| Minocycline | 1,388 | 56.5 | 53.9‐50.1 | 902 | 36.6 | 33.5‐39.8 | 522 | 30.5 | 26.7‐34.5 |
| Tetracycline | 1,511 | 55.4 | 52.9‐57.9 | 940 | 36.3 | 33.3‐39.4 | 546 | 30.8 | 27.0‐34.8 |
| Doripenem | NR | NR | NR | 9 | 77.8 | 45.3‐93.7 | 22 | 95.5 | 78.2‐99.2 |
| Imipenem | 14,728 | 21.8 | 21.2‐22.5 | 12,094 | 40.3 | 39.4‐41.2 | 6,681 | 51.7 | 50.5‐52.9 |
| Meropenem | 7,226 | 37.0 | 35.9‐38.1 | 5,628 | 48.7 | 47.3‐50.0 | 4,919 | 47.3 | 45.9‐48.7 |
| Carbapenem | 15,490 | 21.0 | 20.4‐21.7 | 12,975 | 38.8 | 38.0‐39.7 | 8,778 | 47.9 | 46.9‐49.0 |
| Ampicillin/sulbactam | 10,525 | 35.2 | 34.3‐36.2 | 9,413 | 44.9 | 43.9‐45.9 | 6,460 | 41.2 | 40.0‐42.4 |
| Colistin | NR | NR | NR | 783 | 2.8 | 1.9‐4.2 | 1,303 | 6.9 | 5.7‐8.2 |
| Polymyxin B | 105 | 7.6 | 3.9‐14.3 | 796 | 12.8 | 10.7‐15.3 | 321 | 6.5 | 4.3‐9.6 |
| Polymyxin | 105 | 7.6 | 3.9‐14.3 | 1,563 | 7.9 | 6.6‐9.3 | 1,452 | 6.8 | 5.6‐8.2 |
| Trimethoprim/sulfamethoxazole | 13,640 | 52.5 | 51.7‐53.3 | 11,535 | 57.1 | 56.2‐58.0 | 7,856 | 57.6 | 56.5‐58.7 |
| MDRc | 16,249 | 21.4 | 20.7‐22.0 | 13,640 | 33.7 | 33.0‐34.5 | 9,431 | 35.2 | 34.2‐36.2 |
| Carbapenem+aminoglycoside | 14,601 | 8.9 | 8.5‐9.4 | 12,333 | 21.3 | 20.6‐22.0 | 8,256 | 29.3 | 28.3‐30.3 |
| Aminoglycoside+ampicillin/sulbactam | 10,107 | 12.9 | 12.3‐13.6 | 9,077 | 24.9 | 24.0‐25.8 | 6,200 | 24.3 | 23.2‐25.3 |
| Aminoglycosie+minocycline | 1,359 | 35.6 | 33.1‐38.2 | 856 | 21.4 | 18.8‐24.2 | 503 | 24.5 | 20.9‐28.4 |
| Carbapenem+ampicillin/sulbactam | 10,228 | 13.2 | 12.5‐13.9 | 9,145 | 29.4 | 28.4‐30.3 | 6,143 | 35.5 | 34.3‐36.7 |
Regionally, examining resistance by classes and combinations of antibiotics, trimethoprim‐sulfamethoxazole exhibited consistently the highest rates of resistance, ranging from the lowest in the New England (28.8%) to the highest in the East North Central (69.9%) Census divisions (See Supporting Table 2 in the online version of this article). The rates of resistance to tetracyclines ranged from 0.0% in New England to 52.6% in the Mountain division, and to polymyxins from 0.0% in the East South Central division to 23.4% in New England. Generally, New England enjoyed the lowest rates of resistance (0.0% to tetracyclines to 28.8% to trimethoprim‐sulfamethoxazole), and the Mountain division the highest (0.9% to polymyxins to 52.6% to tetracyclines). The rates of MDR AB ranged from 8.0% in New England to 50.4% in the Mountain division (see Supporting Table 2 in the online version of this article).
Examining resistances to drug classes and combinations by the location of the source specimen revealed that trimethoprim‐sulfamethoxazole once again exhibited the highest rate of resistance across all locations (see Supporting Table 3 in the online version of this article). Despite their modest contribution to the overall sample pool (n=967, 2.5%), organisms from nursing home subjects had the highest prevalence of resistance to aminoglycosides (36.3%), tetracyclines (57.1%), and carbapenems (47.1%). This pattern held true for combination regimens examined. Nursing homes also vastly surpassed other locations in the rates of MDR AB (46.5%). Interestingly, the rates of MDR did not differ substantially among regular inpatient wards (29.2%), the ICU (28.7%), and outpatient locations (26.2%) (see Supporting Table 3 in the online version of this article).
DISCUSSION
In this large multicenter survey we have documented the rising rates of AB resistance to clinically important antimicrobials in the United States. On the whole, all antimicrobials, except for minocycline, exhibited either large or small increases in resistance. Alarmingly, even colistin, a true last resort AB treatment, lost a considerable amount of activity against AB, with the resistance rate rising from 2.8% in 2006 to 2008 to 6.9% in 2009 to 2012. The single encouraging trend that we observed was that resistance to minocycline appeared to diminish substantially, going from over one‐half of all AB tested in 2003 to 2005 to just under one‐third in 2009 to 2012.
Although we did note a rise in the MDR AB, our data suggest a lower percentage of all AB that meets the MDR phenotype criteria compared to reports by other groups. For example, the Center for Disease Dynamics and Economic Policy (CDDEP), analyzing the same data as our study, reports a rise in MDR AB from 32.1% in 1999 to 51.0% in 2010.[23] This discrepancy is easily explained by the fact that we included polymyxins, tetracyclines, and trimethoprim‐sulfamethoxazole in our evaluation, whereas the CDDEP did not examine these agents. Furthermore, we omitted fluoroquinolones, a drug class with high rates of resistance, from our study, because we were interested in focusing only on antimicrobials with clinical data in AB infections.[22] In addition, we limited our evaluation to specimens derived from respiratory or BSI sources, whereas the CDDEP data reflect any AB isolate present in TSN.
We additionally confirm that there is substantial geographic variation in resistance patterns. Thus, despite different definitions, our data agree with those from the CDDEP that the MDR prevalence is highest in the Mountain and East North Central divisions, and lowest in New England overall.[23] The wide variations underscore the fact that it is not valid to speak of national rates of resistance, but rather it is important to concentrate on the local patterns. This information, though important from the macroepidemiologic standpoint, is likely still not granular enough to help clinicians make empiric treatment decisions. In fact, what is needed for that is real‐time antibiogram data specific to each center and even each unit within each center.
The latter point is further illustrated by our analysis of locations of origin of the specimens. In this analysis, we discovered that, contrary to the common presumption that the ICU has the highest rate of resistant organisms, specimens derived from nursing homes represent perhaps the most intensely resistant organisms. In other words, the nursing home is the setting most likely to harbor patients with respiratory infections and BSIs caused by resistant AB. These data are in agreement with several other recent investigations. In a period‐prevalence survey conducted in the state of Maryland in 2009 by Thom and colleagues, long‐term care facilities were found to have the highest prevalence of any AB, and also those resistant to imipenem, MDR, and extensively drug‐resistant organisms.[24] Mortensen and coworkers confirmed the high prevalence of AB and AB resistance in long‐term care facilities, and extended this finding to suggest that there is evidence for intra‐ and interhospital spread of these pathogens.[25] Our data confirm this concerning finding at the national level, and point to a potential area of intervention for infection prevention.
An additional finding of some concern is that the highest proportion of colistin resistance among those specimens, whose location of origin was reported in the database, was the outpatient setting (6.6% compared to 5.4% in the ICU specimens, for example). Although these infections would likely meet the definition for healthcare‐associated infection, AB as a community‐acquired respiratory pathogen is not unprecedented either in the United States or abroad.[26, 27, 28, 29, 30] It is, however, reassuring that most other antimicrobials examined in our study exhibit higher rates of susceptibility in the specimens derived from the outpatient settings than either from the hospital or the nursing home.
Our study has a number of strengths. As a large multicenter survey, it is representative of AB susceptibility patterns across the United States, which makes it highly generalizable. We focused on antibiotics for which clinical evidence is available, thus adding a practical dimension to the results. Another pragmatic consideration is examining the data by geographic distributions, allowing an additional layer of granularity for clinical decisions. At the same time it suffers from some limitations. The TSN database consists of microbiology samples from hospital laboratories. Although we attempted to reduce the risk of duplication, because of how samples are numbered in the database, repeat sampling remains a possibility. Despite having stratified the data by geography and the location of origin of the specimen, it is likely not granular enough for local risk stratification decisions clinicians make daily about the choices of empiric therapy. Some of the MIC breakpoints have changed over the period of the study (see Supporting Table 4 in the online version of this article). Because these changes occurred in the last year of data collection (2012), they should have had only a minimal, if any, impact on the observed rates of resistance in the time frame examined. Additionally, because resistance rates evolve rapidly, more current data are required for effective clinical decision making.
In summary, we have demonstrated that the last decade has seen an alarming increase in the rate of resistance of AB to multiple clinically important antimicrobial agents and classes. We have further emphasized the importance of granularity in susceptibility data to help clinicians make sensible decisions about empiric therapy in hospitalized patients with serious infections. Finally, and potentially most disturbingly, the nursing home as a location appears to be a robust reservoir for spread for resistant AB. All of these observations highlight the urgent need to develop novel antibiotics and nontraditional agents, such as antibodies and vaccines, to combat AB infections, in addition to having important infection prevention implications if we are to contain the looming threat of the end of antibiotics.[31]
Disclosure
This study was funded by a grant from Tetraphase Pharmaceuticals, Watertown, MA.
- National Nosocomial Infections Surveillance (NNIS) System Report. Am J Infect Control. 2004;32:470–485.
- , , , National surveillance of antimicrobial resistance in Pseudomonas aeruginosa isolates obtained from intensive care unit patients from 1993 to 2002. Antimicrob Agents Chemother. 2004;48:4606–4610.
- , , , et al. Health care‐associated pneumonia and community‐acquired pneumonia: a single‐center experience. Antimicrob Agents Chemother. 2007;51:3568–3573.
- , , , et al. Clinical importance of delays in the initiation of appropriate antibiotic treatment for ventilator‐associated pneumonia. Chest. 2002;122:262–268.
- ; ICU‐Acquired Pneumonia Study Group. Modification of empiric antibiotic treatment in patients with pneumonia acquired in the intensive care unit. Intensive Care Med. 1996;22:387–394.
- , , , , Antimicrobial therapy escalation and hospital mortality among patients with HCAP: a single center experience. Chest. 2008:134:963–968.
- , , , et al. Surviving Sepsis Campaign: international guidelines for management of severe sepsis and septic shock: 2008. Crit Care Med. 2008;36:296–327.
- , , , , , Inappropriate antibiotic therapy in Gram‐negative sepsis increases hospital length of stay. Crit Care Med. 2011;39:46–51.
- , , , Inadequate antimicrobial treatment of infections: a risk factor for hospital mortality among critically ill patients. Chest. 1999;115:462–474.
- Centers for Disease Control and Prevention. Antibiotic resistance threats in the United States, 2013. Available at: http://www.cdc.gov/drugresistance/threat-report-2013/pdf/ar-threats-2013-508.pdf#page=59. Accessed December 29, 2014.
- , , , et al.; National Healthcare Safety Network (NHSN) Team and Participating NHSN Facilities. Antimicrobial‐resistant pathogens associated with healthcare‐associated infections: summary of data reported to the National Healthcare Safety Network at the Centers for Disease Control and Prevention, 2009–2010. Infect Control Hosp Epidemiol. 2013;34:1–14.
- , , , , Multi‐drug resistance, inappropriate initial antibiotic therapy and mortality in Gram‐negative severe sepsis and septic shock: a retrospective cohort study. Crit Care. 2014;18(6):596.
- , , , , , Global challenge of multidrug‐resistant Acinetobacter baumannii. Antimicrob Agents Chemother. 2007;51:3471–3484.
- , , , Predictors of hospital mortality among septic ICU patients with Acinetobacter spp. bacteremia: a cohort study. BMC Infect Dis. 2014;14:572.
- , Treatment of Acinetobacter infections. Clin Infect Dis. 2010;51:79–84.
- , , Increasing resistance of Acinetobacter species to imipenem in United States hospitals, 1999–2006. Infect Control Hosp Epidemiol. 2010;31:196–197.
- , , , , Trends in resistance to carbapenems and third‐generation cephalosporins among clinical isolates of Klebsiella pneumoniae in the United States, 1999–2010. Infect Control Hosp Epidemiol. 2013;34:259–268.
- , , Antimicrobial resistance in key bloodstream bacterial isolates: electronic surveillance with the Surveillance Network Database—USA. Clin Infect Dis. 1999;29:259–263.
- , , Community‐associated methicillin‐resistant Staphylococcus aureus in outpatients, United States, 1999–2006. Emerg Infect Dis. 2009;15:1925–1930.
- , , , , Prevalence of antimicrobial resistance in bacteria isolated from central nervous system specimens as reported by U.S. hospital laboratories from 2000 to 2002. Ann Clin Microbiol Antimicrob. 2004;3:3.
- Performance standards for antimicrobial susceptibility testing: twenty‐second informational supplement. CLSI document M100‐S22. Wayne, PA: Clinical and Laboratory Standards Institute; 2012.
- , , , et al. Multidrug‐resistant, extensively drug‐resistant and pandrug‐resistant bacteria: an international expert proposal for interim standard definitions for acquired resistance. Clin Microbiol Infect. 2012;18:268–281.
- CDDEP: The Center for Disease Dynamics, Economics and Policy. Resistance map: Acinetobacter baumannii overview. Available at: http://www.cddep.org/projects/resistance_map/acinetobacter_baumannii_overview. Accessed January 16, 2015.
- , , , et al.; Maryland MDRO Prevention Collaborative. Assessing the burden of Acinetobacter baumannii in Maryland: a statewide cross‐sectional period prevalence survey. Infect Control Hosp Epidemiol. 2012;33:883–888.
- , , , et al. Multidrug‐resistant Acinetobacter baumannii infection, colonization, and transmission related to a long‐term care facility providing subacute care. Infect Control Hosp Epidemiol. 2014;35:406–411.
- , , , , , Severe community‐acquired pneumonia due to Acinetobacter baumannii. Chest. 2001;120:1072–1077.
- , , , , , Fulminant community‐acquired Acinetobacter baumannii pneumonia as distinct clinical syndrome. Chest. 2006;129:102–109.
- , , , Community‐acquired Acinetobacter baumannii pneumonia. Rev Clin Esp. 2003;203:284–286.
- , , , et al. Antimicrobial drug‐resistant microbes associated with hospitalized community‐acquired and healthcare‐associated pneumonia: a multi‐center study in Taiwan. J Formos Med Assoc. 2013;112:31–40.
- , , , , Antimicrobial resistance in Hispanic patients hospitalized in San Antonio, TX with community‐acquired pneumonia. Hosp Pract (1995). 2010;38:108–113.
- Centers for Disease Control and Prevention. CDC director blog. The end of antibiotics. Can we come back from the brink? Available at: http://blogs.cdc.gov/cdcdirector/2014/05/05/the-end-of-antibiotics-can-we-come-back-from-the-brink/. Published May 5, 2014. Accessed January 16, 2015.
Among hospitalized patients with serious infections, the choice of empiric therapy plays a key role in outcomes.[1, 2, 3, 4, 5, 6, 7, 8, 9] Rising rates and variable patterns of antimicrobial resistance, however, complicate selecting appropriate empiric therapy. Amidst this shifting landscape of resistance to antimicrobials, gram‐negative bacteria and specifically Acinetobacter baumannii (AB), remain a considerable challenge.[10] On the one hand, AB is a less‐frequent cause of serious infections than organisms like Pseudomonas aeruginosa or Enterobacteriaceae in severely ill hospitalized patients.[11, 12] On the other, AB has evolved a variety of resistance mechanisms and exhibits unpredictable susceptibility patterns.[13] These factors combine to increase the likelihood of administering inappropriate empiric therapy when faced with an infection caused by AB and, thereby, raising the risk of death.[14] The fact that clinicians may not routinely consider AB as the potential culprit pathogen in the patient they are treating along with this organism's highly in vitro resistant nature, may result in routine gram‐negative coverage being frequently inadequate for AB infections.
To address the poor outcomes related to inappropriate empiric therapy in the setting of AB, one requires an appreciation of the longitudinal changes and geographic differences in the susceptibility of this pathogen. Thus, we aimed to examine secular trends in the resistance of AB to antimicrobial agents whose effectiveness against this microorganism was well supported in the literature during the study timeframe.[15]
METHODS
To determine the prevalence of predefined resistance patterns among AB in respiratory and blood stream infection (BSI) specimens, we examined The Surveillance Network (TSN) database from Eurofins. We explored data collected between years 2003 and 2012. The database has been used extensively for surveillance purposes since 1994, and has previously been described in detail.[16, 17, 18, 19, 20] Briefly, TSN is a warehouse of routine clinical microbiology data collected from a nationally representative sample of microbiology laboratories in 217 hospitals in the United States. To minimize selection bias, laboratories are included based on their geography and the demographics of the populations they serve.[18] Only clinically significant samples are reported. No personal identifying information for source patients is available in this database. Only source laboratories that perform antimicrobial susceptibility testing according standard Food and Drug Administrationapproved testing methods and that interpret susceptibility in accordance with the Clinical Laboratory Standards Institute breakpoints are included.[21] (See Supporting Table 4 in the online version of this article for minimum inhibitory concentration (MIC) changes over the course of the studycurrent colistin and polymyxin breakpoints applied retrospectively). All enrolled laboratories undergo a pre‐enrollment site visit. Logical filters are used for routine quality control to detect unusual susceptibility profiles and to ensure appropriate testing methods. Repeat testing and reporting are done as necessary.[18]
Laboratory samples are reported as susceptible, intermediate, or resistant. We grouped isolates with intermediate MICs together with the resistant ones for the purposes of the current analysis. Duplicate isolates were excluded. Only samples representing 1 of the 2 infections of interest, respiratory or BSI, were included.
We examined 3 time periods2003 to 2005, 2006 to 2008, and 2009 to 2012for the prevalence of AB's resistance to the following antibiotics: carbapenems (imipenem, meropenem, doripenem), aminoglycosides (tobramycin, amikacin), tetracyclines (minocycline, doxycycline), polymyxins (colistin, polymyxin B), ampicillin‐sulbactam, and trimethoprim‐sulfamethoxazole. Antimicrobial resistance was defined by the designation of intermediate or resistant in the susceptibility category. Resistance to a class of antibiotics was defined as resistance to all drugs within the class for which testing was available. The organism was multidrug resistant (MDR) if it was resistant to at least 1 antimicrobial in at least 3 drug classes examined.[22] Resistance to a combination of 2 drugs was present if the specimen was resistant to both of the drugs in the combination for which testing was available. We examined the data by infection type, time period, the 9 US Census divisions, and location of origin of the sample.
All categorical variables are reported as percentages. Continuous variables are reported as meansstandard deviations and/or medians with the interquartile range (IQR). We did not pursue hypothesis testing due to a high risk of type I error in this large dataset. Therefore, only clinically important trends are highlighted.
RESULTS
Among the 39,320 AB specimens, 81.1% were derived from a respiratory source and 18.9% represented BSI. Demographics of source patients are listed in Table 1. Notably, the median age of those with respiratory infection (58 years; IQR 38, 73) was higher than among patients with BSI (54.5 years; IQR 36, 71), and there were proportionally fewer females among respiratory patients (39.9%) than those with BSI (46.0%). Though only 24.3% of all BSI samples originated from the intensive are unit (ICU), 40.5% of respiratory specimens came from that location. The plurality of all specimens was collected in the 2003 to 2005 time interval (41.3%), followed by 2006 to 2008 (34.7%), with a minority coming from years 2009 to 2012 (24.0%). The proportions of collected specimens from respiratory and BSI sources were similar in all time periods examined (Table 1). Geographically, the South Atlantic division contributed the most samples (24.1%) and East South Central the fewest (2.6%) (Figure 1). The vast majority of all samples came from hospital wards (78.6%), where roughly one‐half originated in the ICU (37.5%). Fewer still came from outpatient sources (18.3%), and a small minority (2.5%) from nursing homes.
| Pneumonia | BSI | All | |
|---|---|---|---|
| |||
| Total, N (%) | 31,868 (81.1) | 7,452 (18.9) | 39,320 |
| Age, y | |||
| Mean (SD) | 57.7 (37.4) | 57.6 (40.6) | 57.7 (38.0) |
| Median (IQR 25, 75) | 58 (38, 73) | 54.5 (36, 71) | 57 (37, 73) |
| Gender, female (%) | 12,725 (39.9) | 3,425 (46.0) | 16,150 (41.1) |
| ICU (%) | 12,9191 (40.5) | 1,809 (24.3) | 14,7284 (37.5) |
| Time period, % total | |||
| 20032005 | 12,910 (40.5) | 3,340 (44.8) | 16,250 (41.3) |
| 20062008 | 11,205 (35.2) | 2,435 (32.7) | 13,640 (34.7) |
| 20092012 | 7,753 (24.3) | 1,677 (22.5) | 9,430 (24.0) |
Figure 2 depicts overall resistance patterns by individual drugs, drug classes, and frequently used combinations of agents. Although doripenem had the highest rate of resistance numerically (90.3%), its susceptibility was tested only in a small minority of specimens (n=31, 0.08%). Resistance to trimethoprim‐sulfamethoxazole was high (55.3%) based on a large number of samples tested (n=33,031). Conversely, colistin as an agent and polymyxins as a class exhibited the highest susceptibility rates of over 90%, though the numbers of samples tested for susceptibility to these drugs were also small (colistin n=2,086, 5.3%; polymyxins n=3,120, 7.9%) (Figure 2). Among commonly used drug combinations, carbapenem+aminoglycoside (18.0%) had the lowest resistance rates, and nearly 30% of all AB specimens tested met the criteria for MDR.
Over time, resistance to carbapenems more‐than doubled, from 21.0% in 2003 to 2005 to 47.9% in 2009 to 2012 (Table 2). Although relatively few samples were tested for colistin susceptibility (n=2,086, 5.3%), resistance to this drug also more than doubled from 2.8% (95% confidence interval: 1.9‐4.2) in 2006 to 2008 to 6.9% (95% confidence interval: 5.7‐8.2) in 2009 to 2012. As a class, however, polymyxins exhibited stable resistance rates over the time frame of the study (Table 2). Prevalence of MDR AB rose from 21.4% in 2003 to 2005 to 33.7% in 2006 to 2008, and remained stable at 35.2% in 2009 to 2012. Resistance to even such broad combinations as carbapenem+ampicillin/sulbactam nearly tripled from 13.2% in 2003 to 2005 to 35.5% in 2009 to 2012. Notably, between 2003 and 2012, although resistance rates either rose or remained stable to all other agents, those to minocycline diminished from 56.5% in 2003 to 2005 to 36.6% in 2006 to 2008 to 30.5% in 2009 to 2012. (See Supporting Table 1 in the online version of this article for time trends based on whether they represented respiratory or BSI specimens, with directionally similar trends in both.)
| Drug/Combination | Time Period | ||||||||
|---|---|---|---|---|---|---|---|---|---|
| 20032005 | 20062008 | 20092012 | |||||||
| Na | %b | 95% CI | N | % | 95% CI | N | % | 95% CI | |
| |||||||||
| Amikacin | 12,949 | 25.2 | 24.5‐26.0 | 10.929 | 35.2 | 34.3‐36.1 | 6,292 | 45.7 | 44.4‐46.9 |
| Tobramycin | 14,549 | 37.1 | 36.3‐37.9 | 11,877 | 41.9 | 41.0‐42.8 | 7,901 | 39.2 | 38.1‐40.3 |
| Aminoglycoside | 14,505 | 22.5 | 21.8‐23.2 | 11,967 | 30.6 | 29.8‐31.4 | 7,736 | 34.8 | 33.8‐35.8 |
| Doxycycline | 173 | 36.4 | 29.6‐43.8 | 38 | 29.0 | 17.0‐44.8 | 32 | 34.4 | 20.4‐51.7 |
| Minocycline | 1,388 | 56.5 | 53.9‐50.1 | 902 | 36.6 | 33.5‐39.8 | 522 | 30.5 | 26.7‐34.5 |
| Tetracycline | 1,511 | 55.4 | 52.9‐57.9 | 940 | 36.3 | 33.3‐39.4 | 546 | 30.8 | 27.0‐34.8 |
| Doripenem | NR | NR | NR | 9 | 77.8 | 45.3‐93.7 | 22 | 95.5 | 78.2‐99.2 |
| Imipenem | 14,728 | 21.8 | 21.2‐22.5 | 12,094 | 40.3 | 39.4‐41.2 | 6,681 | 51.7 | 50.5‐52.9 |
| Meropenem | 7,226 | 37.0 | 35.9‐38.1 | 5,628 | 48.7 | 47.3‐50.0 | 4,919 | 47.3 | 45.9‐48.7 |
| Carbapenem | 15,490 | 21.0 | 20.4‐21.7 | 12,975 | 38.8 | 38.0‐39.7 | 8,778 | 47.9 | 46.9‐49.0 |
| Ampicillin/sulbactam | 10,525 | 35.2 | 34.3‐36.2 | 9,413 | 44.9 | 43.9‐45.9 | 6,460 | 41.2 | 40.0‐42.4 |
| Colistin | NR | NR | NR | 783 | 2.8 | 1.9‐4.2 | 1,303 | 6.9 | 5.7‐8.2 |
| Polymyxin B | 105 | 7.6 | 3.9‐14.3 | 796 | 12.8 | 10.7‐15.3 | 321 | 6.5 | 4.3‐9.6 |
| Polymyxin | 105 | 7.6 | 3.9‐14.3 | 1,563 | 7.9 | 6.6‐9.3 | 1,452 | 6.8 | 5.6‐8.2 |
| Trimethoprim/sulfamethoxazole | 13,640 | 52.5 | 51.7‐53.3 | 11,535 | 57.1 | 56.2‐58.0 | 7,856 | 57.6 | 56.5‐58.7 |
| MDRc | 16,249 | 21.4 | 20.7‐22.0 | 13,640 | 33.7 | 33.0‐34.5 | 9,431 | 35.2 | 34.2‐36.2 |
| Carbapenem+aminoglycoside | 14,601 | 8.9 | 8.5‐9.4 | 12,333 | 21.3 | 20.6‐22.0 | 8,256 | 29.3 | 28.3‐30.3 |
| Aminoglycoside+ampicillin/sulbactam | 10,107 | 12.9 | 12.3‐13.6 | 9,077 | 24.9 | 24.0‐25.8 | 6,200 | 24.3 | 23.2‐25.3 |
| Aminoglycosie+minocycline | 1,359 | 35.6 | 33.1‐38.2 | 856 | 21.4 | 18.8‐24.2 | 503 | 24.5 | 20.9‐28.4 |
| Carbapenem+ampicillin/sulbactam | 10,228 | 13.2 | 12.5‐13.9 | 9,145 | 29.4 | 28.4‐30.3 | 6,143 | 35.5 | 34.3‐36.7 |
Regionally, examining resistance by classes and combinations of antibiotics, trimethoprim‐sulfamethoxazole exhibited consistently the highest rates of resistance, ranging from the lowest in the New England (28.8%) to the highest in the East North Central (69.9%) Census divisions (See Supporting Table 2 in the online version of this article). The rates of resistance to tetracyclines ranged from 0.0% in New England to 52.6% in the Mountain division, and to polymyxins from 0.0% in the East South Central division to 23.4% in New England. Generally, New England enjoyed the lowest rates of resistance (0.0% to tetracyclines to 28.8% to trimethoprim‐sulfamethoxazole), and the Mountain division the highest (0.9% to polymyxins to 52.6% to tetracyclines). The rates of MDR AB ranged from 8.0% in New England to 50.4% in the Mountain division (see Supporting Table 2 in the online version of this article).
Examining resistances to drug classes and combinations by the location of the source specimen revealed that trimethoprim‐sulfamethoxazole once again exhibited the highest rate of resistance across all locations (see Supporting Table 3 in the online version of this article). Despite their modest contribution to the overall sample pool (n=967, 2.5%), organisms from nursing home subjects had the highest prevalence of resistance to aminoglycosides (36.3%), tetracyclines (57.1%), and carbapenems (47.1%). This pattern held true for combination regimens examined. Nursing homes also vastly surpassed other locations in the rates of MDR AB (46.5%). Interestingly, the rates of MDR did not differ substantially among regular inpatient wards (29.2%), the ICU (28.7%), and outpatient locations (26.2%) (see Supporting Table 3 in the online version of this article).
DISCUSSION
In this large multicenter survey we have documented the rising rates of AB resistance to clinically important antimicrobials in the United States. On the whole, all antimicrobials, except for minocycline, exhibited either large or small increases in resistance. Alarmingly, even colistin, a true last resort AB treatment, lost a considerable amount of activity against AB, with the resistance rate rising from 2.8% in 2006 to 2008 to 6.9% in 2009 to 2012. The single encouraging trend that we observed was that resistance to minocycline appeared to diminish substantially, going from over one‐half of all AB tested in 2003 to 2005 to just under one‐third in 2009 to 2012.
Although we did note a rise in the MDR AB, our data suggest a lower percentage of all AB that meets the MDR phenotype criteria compared to reports by other groups. For example, the Center for Disease Dynamics and Economic Policy (CDDEP), analyzing the same data as our study, reports a rise in MDR AB from 32.1% in 1999 to 51.0% in 2010.[23] This discrepancy is easily explained by the fact that we included polymyxins, tetracyclines, and trimethoprim‐sulfamethoxazole in our evaluation, whereas the CDDEP did not examine these agents. Furthermore, we omitted fluoroquinolones, a drug class with high rates of resistance, from our study, because we were interested in focusing only on antimicrobials with clinical data in AB infections.[22] In addition, we limited our evaluation to specimens derived from respiratory or BSI sources, whereas the CDDEP data reflect any AB isolate present in TSN.
We additionally confirm that there is substantial geographic variation in resistance patterns. Thus, despite different definitions, our data agree with those from the CDDEP that the MDR prevalence is highest in the Mountain and East North Central divisions, and lowest in New England overall.[23] The wide variations underscore the fact that it is not valid to speak of national rates of resistance, but rather it is important to concentrate on the local patterns. This information, though important from the macroepidemiologic standpoint, is likely still not granular enough to help clinicians make empiric treatment decisions. In fact, what is needed for that is real‐time antibiogram data specific to each center and even each unit within each center.
The latter point is further illustrated by our analysis of locations of origin of the specimens. In this analysis, we discovered that, contrary to the common presumption that the ICU has the highest rate of resistant organisms, specimens derived from nursing homes represent perhaps the most intensely resistant organisms. In other words, the nursing home is the setting most likely to harbor patients with respiratory infections and BSIs caused by resistant AB. These data are in agreement with several other recent investigations. In a period‐prevalence survey conducted in the state of Maryland in 2009 by Thom and colleagues, long‐term care facilities were found to have the highest prevalence of any AB, and also those resistant to imipenem, MDR, and extensively drug‐resistant organisms.[24] Mortensen and coworkers confirmed the high prevalence of AB and AB resistance in long‐term care facilities, and extended this finding to suggest that there is evidence for intra‐ and interhospital spread of these pathogens.[25] Our data confirm this concerning finding at the national level, and point to a potential area of intervention for infection prevention.
An additional finding of some concern is that the highest proportion of colistin resistance among those specimens, whose location of origin was reported in the database, was the outpatient setting (6.6% compared to 5.4% in the ICU specimens, for example). Although these infections would likely meet the definition for healthcare‐associated infection, AB as a community‐acquired respiratory pathogen is not unprecedented either in the United States or abroad.[26, 27, 28, 29, 30] It is, however, reassuring that most other antimicrobials examined in our study exhibit higher rates of susceptibility in the specimens derived from the outpatient settings than either from the hospital or the nursing home.
Our study has a number of strengths. As a large multicenter survey, it is representative of AB susceptibility patterns across the United States, which makes it highly generalizable. We focused on antibiotics for which clinical evidence is available, thus adding a practical dimension to the results. Another pragmatic consideration is examining the data by geographic distributions, allowing an additional layer of granularity for clinical decisions. At the same time it suffers from some limitations. The TSN database consists of microbiology samples from hospital laboratories. Although we attempted to reduce the risk of duplication, because of how samples are numbered in the database, repeat sampling remains a possibility. Despite having stratified the data by geography and the location of origin of the specimen, it is likely not granular enough for local risk stratification decisions clinicians make daily about the choices of empiric therapy. Some of the MIC breakpoints have changed over the period of the study (see Supporting Table 4 in the online version of this article). Because these changes occurred in the last year of data collection (2012), they should have had only a minimal, if any, impact on the observed rates of resistance in the time frame examined. Additionally, because resistance rates evolve rapidly, more current data are required for effective clinical decision making.
In summary, we have demonstrated that the last decade has seen an alarming increase in the rate of resistance of AB to multiple clinically important antimicrobial agents and classes. We have further emphasized the importance of granularity in susceptibility data to help clinicians make sensible decisions about empiric therapy in hospitalized patients with serious infections. Finally, and potentially most disturbingly, the nursing home as a location appears to be a robust reservoir for spread for resistant AB. All of these observations highlight the urgent need to develop novel antibiotics and nontraditional agents, such as antibodies and vaccines, to combat AB infections, in addition to having important infection prevention implications if we are to contain the looming threat of the end of antibiotics.[31]
Disclosure
This study was funded by a grant from Tetraphase Pharmaceuticals, Watertown, MA.
- National Nosocomial Infections Surveillance (NNIS) System Report. Am J Infect Control. 2004;32:470–485.
- , , , National surveillance of antimicrobial resistance in Pseudomonas aeruginosa isolates obtained from intensive care unit patients from 1993 to 2002. Antimicrob Agents Chemother. 2004;48:4606–4610.
- , , , et al. Health care‐associated pneumonia and community‐acquired pneumonia: a single‐center experience. Antimicrob Agents Chemother. 2007;51:3568–3573.
- , , , et al. Clinical importance of delays in the initiation of appropriate antibiotic treatment for ventilator‐associated pneumonia. Chest. 2002;122:262–268.
- ; ICU‐Acquired Pneumonia Study Group. Modification of empiric antibiotic treatment in patients with pneumonia acquired in the intensive care unit. Intensive Care Med. 1996;22:387–394.
- , , , , Antimicrobial therapy escalation and hospital mortality among patients with HCAP: a single center experience. Chest. 2008:134:963–968.
- , , , et al. Surviving Sepsis Campaign: international guidelines for management of severe sepsis and septic shock: 2008. Crit Care Med. 2008;36:296–327.
- , , , , , Inappropriate antibiotic therapy in Gram‐negative sepsis increases hospital length of stay. Crit Care Med. 2011;39:46–51.
- , , , Inadequate antimicrobial treatment of infections: a risk factor for hospital mortality among critically ill patients. Chest. 1999;115:462–474.
- Centers for Disease Control and Prevention. Antibiotic resistance threats in the United States, 2013. Available at: http://www.cdc.gov/drugresistance/threat-report-2013/pdf/ar-threats-2013-508.pdf#page=59. Accessed December 29, 2014.
- , , , et al.; National Healthcare Safety Network (NHSN) Team and Participating NHSN Facilities. Antimicrobial‐resistant pathogens associated with healthcare‐associated infections: summary of data reported to the National Healthcare Safety Network at the Centers for Disease Control and Prevention, 2009–2010. Infect Control Hosp Epidemiol. 2013;34:1–14.
- , , , , Multi‐drug resistance, inappropriate initial antibiotic therapy and mortality in Gram‐negative severe sepsis and septic shock: a retrospective cohort study. Crit Care. 2014;18(6):596.
- , , , , , Global challenge of multidrug‐resistant Acinetobacter baumannii. Antimicrob Agents Chemother. 2007;51:3471–3484.
- , , , Predictors of hospital mortality among septic ICU patients with Acinetobacter spp. bacteremia: a cohort study. BMC Infect Dis. 2014;14:572.
- , Treatment of Acinetobacter infections. Clin Infect Dis. 2010;51:79–84.
- , , Increasing resistance of Acinetobacter species to imipenem in United States hospitals, 1999–2006. Infect Control Hosp Epidemiol. 2010;31:196–197.
- , , , , Trends in resistance to carbapenems and third‐generation cephalosporins among clinical isolates of Klebsiella pneumoniae in the United States, 1999–2010. Infect Control Hosp Epidemiol. 2013;34:259–268.
- , , Antimicrobial resistance in key bloodstream bacterial isolates: electronic surveillance with the Surveillance Network Database—USA. Clin Infect Dis. 1999;29:259–263.
- , , Community‐associated methicillin‐resistant Staphylococcus aureus in outpatients, United States, 1999–2006. Emerg Infect Dis. 2009;15:1925–1930.
- , , , , Prevalence of antimicrobial resistance in bacteria isolated from central nervous system specimens as reported by U.S. hospital laboratories from 2000 to 2002. Ann Clin Microbiol Antimicrob. 2004;3:3.
- Performance standards for antimicrobial susceptibility testing: twenty‐second informational supplement. CLSI document M100‐S22. Wayne, PA: Clinical and Laboratory Standards Institute; 2012.
- , , , et al. Multidrug‐resistant, extensively drug‐resistant and pandrug‐resistant bacteria: an international expert proposal for interim standard definitions for acquired resistance. Clin Microbiol Infect. 2012;18:268–281.
- CDDEP: The Center for Disease Dynamics, Economics and Policy. Resistance map: Acinetobacter baumannii overview. Available at: http://www.cddep.org/projects/resistance_map/acinetobacter_baumannii_overview. Accessed January 16, 2015.
- , , , et al.; Maryland MDRO Prevention Collaborative. Assessing the burden of Acinetobacter baumannii in Maryland: a statewide cross‐sectional period prevalence survey. Infect Control Hosp Epidemiol. 2012;33:883–888.
- , , , et al. Multidrug‐resistant Acinetobacter baumannii infection, colonization, and transmission related to a long‐term care facility providing subacute care. Infect Control Hosp Epidemiol. 2014;35:406–411.
- , , , , , Severe community‐acquired pneumonia due to Acinetobacter baumannii. Chest. 2001;120:1072–1077.
- , , , , , Fulminant community‐acquired Acinetobacter baumannii pneumonia as distinct clinical syndrome. Chest. 2006;129:102–109.
- , , , Community‐acquired Acinetobacter baumannii pneumonia. Rev Clin Esp. 2003;203:284–286.
- , , , et al. Antimicrobial drug‐resistant microbes associated with hospitalized community‐acquired and healthcare‐associated pneumonia: a multi‐center study in Taiwan. J Formos Med Assoc. 2013;112:31–40.
- , , , , Antimicrobial resistance in Hispanic patients hospitalized in San Antonio, TX with community‐acquired pneumonia. Hosp Pract (1995). 2010;38:108–113.
- Centers for Disease Control and Prevention. CDC director blog. The end of antibiotics. Can we come back from the brink? Available at: http://blogs.cdc.gov/cdcdirector/2014/05/05/the-end-of-antibiotics-can-we-come-back-from-the-brink/. Published May 5, 2014. Accessed January 16, 2015.
© 2015 Society of Hospital Medicine
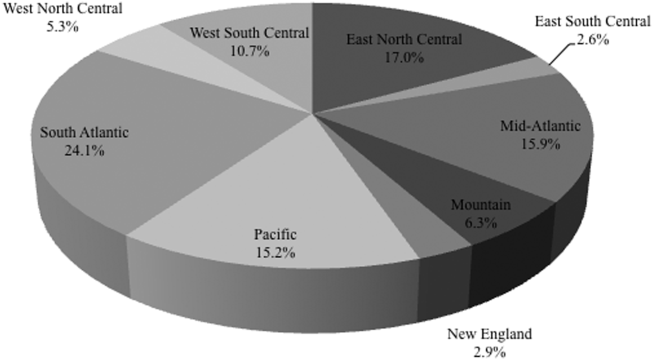

Sepsis and Septic Shock Readmission Risk
Despite its decreasing mortality, sepsis remains a leading reason for intensive care unit (ICU) admission and is associated with crude mortality in excess of 25%.[1, 2] In the United States there are between 660,000 and 750,000 sepsis hospitalizations annually, with the direct costs surpassing $24 billion.[3, 4, 5] As mortality rates have begun to fall, attention has shifted to issues of morbidity and recovery, the intermediate and longer‐term consequences associated with survivorship, and how interventions made while the patient is acutely ill in the ICU alter later health outcomes.[3, 5, 6, 7, 8]
One area of particular interest is the need for healthcare utilization following an acute admission for sepsis, and specifically rehospitalization within 30 days of discharge. This outcome is important not just from the perspective of the patient's well‐being, but also from the point of view of healthcare financing. Through the establishment of Hospital Readmission Reduction Program, the Centers for Medicare and Medicaid Services have sharply reduced reimbursement to hospitals for excessive rates of 30‐day readmissions.[9]
For sepsis, little is known about such readmissions, and even less about how to prevent them. A handful of studies suggest that this rate is between 5% and 26%.[10, 11, 12, 13] Whereas some of these studies looked at some of the factors that impact readmissions,[11, 12] none examined the potential contribution of microbiology of sepsis to this outcome.
To explore these questions, we conducted a single‐center retrospective cohort study among critically ill patients admitted to the ICU with severe culture‐positive sepsis and/or septic shock and determined the rate of early posthospital discharge readmission. In addition, we sought to elucidate predictors of subsequent readmission.
METHODS
Study Design and Ethical Standards
We conducted a single‐center retrospective cohort study from January 2008 to December 2012. The study was approved by the Washington University School of Medicine Human Studies Committee, and informed consent was waived because the data collection was retrospective without any patient‐identifying information. The study was performed in accordance with the ethical standards of the 1964 Declaration of Helsinki and its later amendments. Aspects of our methodology have been previously published.[14]
Primary Endpoint
All‐cause readmission to an acute‐care facility in the 30 days following discharge after the index hospitalization with sepsis served as the primary endpoint. The index hospitalizations occurred at the Barnes‐Jewish Hospital, a 1200‐bed inner‐city academic institution that serves as the main teaching institution for BJC HealthCare, a large integrated healthcare system of both inpatient and outpatient care. BJC includes a total of 13 hospitals in a compact geographic region surrounding and including St. Louis, Missouri, and we included readmission to any of these hospitals in our analysis. Persons treated within this healthcare system are, in nearly all cases, readmitted to 1 of the system's participating 13 hospitals. If a patient who receives healthcare in the system presents to an out‐of‐system hospital, he/she is often transferred back into the integrated system because of issues of insurance coverage.
Study Cohort
All consecutive adult ICU patients were included if (1) They had a positive blood culture for a pathogen (Cultures positive only for coagulase negative Staphylococcus aureus were excluded as contaminants.), (2) there was an International Classification of Diseases, Ninth Revision, Clinical Modification (ICD‐9‐CM) code corresponding to an acute organ dysfunction,[4] and (3) they survived their index hospitalization. Only the first episode of sepsis was included as the index hospitalization.
Definitions
All‐cause 30‐day readmission, was defined as a repeat hospitalization within 30 days of discharge from the index hospitalization among survivors of culture‐positive severe sepsis or septic shock. The definition of severe sepsis was based on discharge ICD‐9‐CM codes for acute organ dysfunction.[3] Patients were classified as having septic shock if vasopressors (norepinephrine, dopamine, epinephrine, phenylephrine, or vasopressin) were initiated within 24 hours of the blood culture collection date and time.
Initially appropriate antimicrobial treatment (IAAT) was deemed appropriate if the initially prescribed antibiotic regimen was active against the identified pathogen based on in vitro susceptibility testing and administered for at least 24 hours within 24 hours following blood culture collection. All other regimens were classified as non‐IAAT. Combination antimicrobial treatment was not required for IAAT designation.[15] Prior antibiotic exposure and prior hospitalization occurred within the preceding 90 days, and prior bacteremia within 30 days of the index episode. Multidrug resistance (MDR) among Gram‐negative bacteria was defined as nonsusceptibility to at least 1 antimicrobial agent from at least 3 different antimicrobial classes.[16] Both extended spectrum ‐lactamase (ESBL) organisms and carbapenemase‐producing Enterobacteriaceae were identified via molecular testing.
Healthcare‐associated (HCA) infections were defined by the presence of at least 1 of the following: (1) recent hospitalization, (2) immune suppression (defined as any primary immune deficiency or acquired immune deficiency syndrome or exposure within 3 prior months to immunosuppressive treatmentschemotherapy, radiation therapy, or steroids), (3) nursing home residence, (4) hemodialysis, (5) prior antibiotics. and (6) index bacteremia deemed a hospital‐acquired bloodstream infection (occurring >2 days following index admission date). Acute kidney injury (AKI) was defined according to the RIFLE (Risk, Injury, Failure, Loss, End‐stage) criteria based on the greatest change in serum creatinine (SCr).[17]
Data Elements
Patient‐specific baseline characteristics and process of care variables were collected from the automated hospital medical record, microbiology database, and pharmacy database of Barnes‐Jewish Hospital. Electronic inpatient and outpatient medical records available for all patients in the BJC HealthCare system were reviewed to determine prior antibiotic exposure. The baseline characteristics collected during the index hospitalization included demographics and comorbid conditions. The comorbidities were identified based on their corresponding ICD‐9‐CM codes. The Acute Physiology and Chronic Health Evaluation (APACHE) II and Charlson comorbidity scores were calculated based on clinical data present during the 24 hours after the positive blood cultures were obtained.[18] This was done to accommodate patients with community‐acquired and healthcare‐associated community‐onset infections who only had clinical data available after blood cultures were drawn. Lowest and highest SCr levels were collected during the index hospitalization to determine each patient's AKI status.
Statistical Analyses
Continuous variables were reported as means with standard deviations and as medians with 25th and 75th percentiles. Differences between mean values were tested via the Student t test, and between medians using the Mann‐Whitney U test. Categorical data were summarized as proportions, and the 2 test or Fisher exact test for small samples was used to examine differences between groups. We developed multiple logistic regression models to identify clinical risk factors that were associated with 30‐day all‐cause readmission. All risk factors that were significant at 0.20 in the univariate analyses, as well as all biologically plausible factors even if they did not reach this level of significance, were included in the models. All variables entered into the models were assessed for collinearity, and interaction terms were tested. The most parsimonious models were derived using the backward manual elimination method, and the best‐fitting model was chosen based on the area under the receiver operating characteristics curve (AUROC or the C statistic). The model's calibration was assessed with the Hosmer‐Lemeshow goodness‐of‐fit test. All tests were 2‐tailed, and a P value <0.05 represented statistical significance.
All computations were performed in Stata/SE, version 9 (StataCorp, College Station, TX).
Role of Sponsor
The sponsor had no role in the design, analyses, interpretation, or publication of the study.
RESULTS
Among the 1697 patients with severe sepsis or septic shock who were discharged alive from the hospital, 543 (32.0%) required a rehospitalization within 30 days. There were no differences in age or gender distribution between the groups (Table 1). All comorbidities examined were more prevalent among those with a 30‐day readmission than among those without, with the median Charlson comorbidity score reflecting this imbalance (5 vs 4, P<0.001). Similarly, most of the HCA risk factors were more prevalent among the readmitted group than the comparator group, with HCA sepsis among 94.2% of the former and 90.7% of the latter (P = 0.014).
| 30‐Day Readmission = Yes | 30‐Day Readmission = No | ||||
|---|---|---|---|---|---|
| N = 543 | % = 32.00% | N = 1,154 | % = 68.00% | P Value | |
| |||||
| Baseline characteristics | |||||
| Age, y | |||||
| Mean SD | 58.5 15.7 | 59.5 15.8 | |||
| Median (25, 75) | 60 (49, 69) | 60 (50, 70) | 0.297 | ||
| Race | |||||
| Caucasian | 335 | 61.69% | 769 | 66.64% | 0.046 |
| African American | 157 | 28.91% | 305 | 26.43% | 0.284 |
| Other | 9 | 1.66% | 22 | 1.91% | 0.721 |
| Sex, female | 244 | 44.94% | 537 | 46.53% | 0.538 |
| Admission source | |||||
| Home | 374 | 68.88% | 726 | 62.91% | 0.016 |
| Nursing home, rehab, or LTAC | 39 | 7.81% | 104 | 9.01% | 0.206 |
| Transfer from another hospital | 117 | 21.55% | 297 | 25.74% | 0.061 |
| Comorbidities | |||||
| CHF | 131 | 24.13% | 227 | 19.67% | 0.036 |
| COPD | 156 | 28.73% | 253 | 21.92% | 0.002 |
| CLD | 83 | 15.29% | 144 | 12.48% | 0.113 |
| DM | 175 | 32.23% | 296 | 25.65% | 0.005 |
| CKD | 137 | 25.23% | 199 | 17.24% | <0.001 |
| Malignancy | 225 | 41.44% | 395 | 34.23% | 0.004 |
| HIV | 11 | 2.03% | 10 | 0.87% | 0.044 |
| Charlson comorbidity score | |||||
| Mean SD | 5.24 3.32 | 4.48 3.35 | |||
| Median (25, 75) | 5 (3, 8) | 4 (2, 7) | <0.001 | ||
| HCA RF | 503 | 94.19% | 1,019 | 90.66% | 0.014 |
| Hemodialysis | 65 | 12.01% | 114 | 9.92% | 0.192 |
| Immune suppression | 193 | 36.07% | 352 | 31.21% | 0.044 |
| Prior hospitalization | 339 | 65.07% | 620 | 57.09% | 0.002 |
| Nursing home residence | 39 | 7.81% | 104 | 9.01% | 0.206 |
| Prior antibiotics | 301 | 55.43% | 568 | 49.22% | 0.017 |
| Hospital‐acquired BSI* | 240 | 44.20% | 485 | 42.03% | 0.399 |
| Prior bacteremia within 30 days | 88 | 16.21% | 154 | 13.34% | 0.116 |
| Sepsis‐related parameters | |||||
| LOS prior to bacteremia, d | |||||
| Mean SD | 6.65 11.22 | 5.88 10.81 | |||
| Median (25, 75) | 1 (0, 10) | 0 (0, 8) | 0.250 | ||
| Surgery | |||||
| None | 362 | 66.67% | 836 | 72.44% | 0.015 |
| Abdominal | 104 | 19.15% | 167 | 14.47% | 0.014 |
| Extra‐abdominal | 73 | 13.44% | 135 | 11.70% | 0.306 |
| Status unknown | 4 | 0.74% | 16 | 1.39% | 0.247 |
| Central line | 333 | 64.41% | 637 | 57.80% | 0.011 |
| TPN at the time of bacteremia or prior to it during index hospitalization | 52 | 9.74% | 74 | 5.45% | 0.017 |
| APACHE II | |||||
| Mean SD | 15.08 5.47 | 15.35 5.43 | |||
| Median (25, 75) | 15 (11, 18) | 15 (12, 19) | 0.275 | ||
| Severe sepsis | 361 | 66.48% | 747 | 64.73% | 0.480 |
| Septic shock requiring vasopressors | 182 | 33.52% | 407 | 35.27% | |
| On MV | 104 | 19.22% | 251 | 21.90% | 0.208 |
| Peak WBC (103/L) | |||||
| Mean SD | 22.26 25.20 | 22.14 17.99 | |||
| Median (25, 75) | 17.1 (8.9, 30.6) | 16.9 (10, 31) | 0.654 | ||
| Lowest serum SCr, mg/dL | |||||
| Mean SD | 1.02 1.05 | 0.96 1.03 | |||
| Median (25, 75) | 0.68 (0.5, 1.06) | 0.66 (0.49, 0.96) | 0.006 | ||
| Highest serum SCr, mg/dL | |||||
| Mean SD | 2.81 2.79 | 2.46 2.67 | |||
| Median (25, 75) | 1.68 (1.04, 3.3) | 1.41 (0.94, 2.61) | 0.001 | ||
| RIFLE category | |||||
| None | 81 | 14.92% | 213 | 18.46% | 0.073 |
| Risk | 112 | 20.63% | 306 | 26.52% | 0.009 |
| Injury | 133 | 24.49% | 247 | 21.40% | 0.154 |
| Failure | 120 | 22.10% | 212 | 18.37% | 0.071 |
| Loss | 50 | 9.21% | 91 | 7.89% | 0.357 |
| End‐stage | 47 | 8.66% | 85 | 7.37% | 0.355 |
| Infection source | |||||
| Urine | 95 | 17.50% | 258 | 22.36% | 0.021 |
| Abdomen | 69 | 12.71% | 113 | 9.79% | 0.070 |
| Lung | 93 | 17.13% | 232 | 20.10% | 0.146 |
| Line | 91 | 16.76% | 150 | 13.00% | 0.038 |
| CNS | 1 | 0.18% | 16 | 1.39% | 0.012 |
| Skin | 51 | 9.39% | 82 | 7.11% | 0.102 |
| Unknown | 173 | 31.86% | 375 | 32.50% | 0.794 |
During the index hospitalization, 589 patients (34.7%) suffered from septic shock requiring vasopressors; this did not impact the 30‐day readmission risk (Table 1). Commensurately, markers of severity of acute illness (APACHE II score, mechanical ventilation, peak white blood cell count) did not differ between the groups. With respect to the primary source of sepsis, urine was less, whereas central nervous system was more likely among those readmitted within 30 days. Similarly, there was a significant imbalance between the groups in the prevalence of AKI (Table 1). Specifically, those who did require a readmission were slightly less likely to have sustained no AKI (RIFLE: None; 14.9% vs 18.5%, P = 0.073). Those requiring readmission were also less likely to be in the category RIFLE: Risk (20.6% vs 26.5%, P = 0.009). The direction of this disparity was reversed for the Injury and Failure categories. No differences between groups were seen among those with categories Loss and end‐stage kidney disease (ESKD) (Table 1).
The microbiology of sepsis did not differ in most respects between the 30‐day readmission groups, save for several organisms (Table 2). Most strikingly, those who required a readmission were more likely than those who did not to be infected with Bacteroides spp, Candida spp, an MDR or an ESBL organism (Table 2). As for the outcomes of the index hospitalization, those with a repeat admission had a longer overall and postonset of sepsis initial hospital length of stay, and were less likely to be discharged either home without home health care or transferred to another hospital at the end of their index hospitalization (Table 3).
| 30‐Day Readmission = Yes | 30‐Day Readmission = No | P Value | |||
|---|---|---|---|---|---|
| N | % | N | % | ||
| |||||
| 543 | 32.00% | 1,154 | 68.00% | ||
| Gram‐positive BSI | 260 | 47.88% | 580 | 50.26% | 0.376 |
| Staphylococcus aureus | 138 | 25.41% | 287 | 24.87% | 0.810 |
| MRSA | 78 | 14.36% | 147 | 12.74% | 0.358 |
| VISA | 6 | 1.10% | 9 | 0.78% | 0.580 |
| Streptococcus pneumoniae | 7 | 1.29% | 33 | 2.86% | 0.058 |
| Streptococcus spp | 34 | 6.26% | 81 | 7.02% | 0.606 |
| Peptostreptococcus spp | 5 | 0.92% | 15 | 1.30% | 0.633 |
| Clostridium perfringens | 4 | 0.74% | 10 | 0.87% | 1.000 |
| Enterococcus faecalis | 54 | 9.94% | 108 | 9.36% | 0.732 |
| Enterococcus faecium | 29 | 5.34% | 63 | 5.46% | 1.000 |
| VRE | 36 | 6.63% | 70 | 6.07% | 0.668 |
| Gram‐negative BSI | 231 | 42.54% | 515 | 44.63% | 0.419 |
| Escherichia coli | 54 | 9.94% | 151 | 13.08% | 0.067 |
| Klebsiella pneumoniae | 54 | 9.94% | 108 | 9.36% | 0.723 |
| Klebsiella oxytoca | 11 | 2.03% | 18 | 1.56% | 0.548 |
| Enterobacter aerogenes | 6 | 1.10% | 13 | 1.13% | 1.000 |
| Enterobacter cloacae | 21 | 3.87% | 44 | 3.81% | 1.000 |
| Pseudomonas aeruginosa | 28 | 5.16% | 65 | 5.63% | 0.733 |
| Acinetobacter spp | 8 | 1.47% | 27 | 2.34% | 0.276 |
| Bacteroides spp | 25 | 4.60% | 30 | 2.60% | 0.039 |
| Serratia marcescens | 14 | 2.58% | 21 | 1.82% | 0.360 |
| Stenotrophomonas maltophilia | 3 | 0.55% | 8 | 0.69% | 1.000 |
| Achromobacter spp | 2 | 0.37% | 3 | 0.17% | 0.597 |
| Aeromonas spp | 2 | 0.37% | 1 | 0.09% | 0.241 |
| Burkholderia cepacia | 0 | 0.00% | 6 | 0.52% | 0.186 |
| Citrobacter freundii | 2 | 0.37% | 15 | 1.39% | 0.073 |
| Fusobacterium spp | 7 | 1.29% | 10 | 0.87% | 0.438 |
| Haemophilus influenzae | 1 | 0.18% | 4 | 0.35% | 1.000 |
| Prevotella spp | 1 | 0.18% | 6 | 0.52% | 0.441 |
| Proteus mirabilis | 9 | 1.66% | 39 | 3.38% | 0.058 |
| MDR PA | 2 | 0.37% | 7 | 0.61% | 0.727 |
| ESBL | 10 | 6.25% | 8 | 2.06% | 0.017 |
| CRE | 2 | 1.25% | 0 | 0.00% | 0.028 |
| MDR Gram‐negative or Gram‐positive | 231 | 47.53% | 450 | 41.86% | 0.036 |
| Candida spp | 58 | 10.68% | 76 | 6.59% | 0.004 |
| Polymicrobal BSI | 50 | 9.21% | 111 | 9.62% | 0.788 |
| Initially inappropriate treatment | 119 | 21.92% | 207 | 17.94% | 0.052 |
| 30‐Day Readmission = Yes | 30‐Day Readmission = No | ||||
|---|---|---|---|---|---|
| N = 543 | % = 32.00% | N = 1,154 | % = 68.00% | P Value | |
| |||||
| Hospital LOS, days | |||||
| Mean SD | 26.44 23.27 | 23.58 21.79 | 0.019 | ||
| Median (25, 75) | 19.16 (9.66, 35.86) | 17.77 (8.9, 30.69) | |||
| Hospital LOS following BSI onset, days | |||||
| Mean SD | 19.80 18.54 | 17.69 17.08 | 0.022 | ||
| Median (25, 75) | 13.9 (7.9, 25.39) | 12.66 (7.05, 22.66) | |||
| Discharge destination | |||||
| Home | 125 | 23.02% | 334 | 28.94% | 0.010 |
| Home with home care | 163 | 30.02% | 303 | 26.26% | 0.105 |
| Rehab | 81 | 14.92% | 149 | 12.91% | 0.260 |
| LTAC | 41 | 7.55% | 87 | 7.54% | 0.993 |
| Transfer to another hospital | 1 | 0.18% | 19 | 1.65% | 0.007 |
| SNF | 132 | 24.31% | 262 | 22.70% | 0.465 |
In a logistic regression model, 5 factors emerged as predictors of 30‐day readmission (Table 4). Having RIFLE: Injury or RIFLE: Failure carried an approximately 2‐fold increase in the odds of 30‐day rehospitalization (odds ratio: 1.95, 95% confidence interval: 1.302.93, P = 0.001) relative to having a RIFLE: None or RIFLE: Risk. Although having strong association with this outcome, harboring an ESBL organism or Bacteroides spp were both relatively infrequent events (3.3% ESBL and 3.2% Bacteroides spp). Infection with Escherichia coli and urine as the source of sepsis both appeared to be significantly protective against a readmission (Table 4). The model's discrimination was moderate (AUROC = 0.653) and its calibration adequate (Hosmer‐Lemeshow P = 0.907). (See Supporting Information, Appendix 1, in the online version of this article for the steps in the development of the final model.)
| OR | 95% CI | P Value | |
|---|---|---|---|
| |||
| ESBL | 4.503 | 1.42914.190 | 0.010 |
| RIFLE: Injury or Failure (reference: RIFLE: None or Risk) | 1.951 | 1.2972.933 | 0.001 |
| Bacteroides spp | 2.044 | 1.0583.948 | 0.033 |
| Source: urine | 0.583 | 0.3470.979 | 0.041 |
| Escherichia coli | 0.494 | 0.2700.904 | 0.022 |
DISCUSSION
In this single‐center retrospective cohort study, nearly one‐third of survivors of culture‐positive severe sepsis or septic shock required a rehospitalization within 30 days of discharge from their index admission. Factors that contributed to a higher odds of rehospitalization were having mild‐to‐moderate AKI (RIFLE: Injury or RIFLE: Failure) and infection with ESBL organisms or Bacteroides spp, whereas urine as the source of sepsis and E coli as the pathogen appeared to be protective.
A recent study by Hua and colleagues examining the New York Statewide Planning and Research Cooperative System for the years 2008 to 2010 noted a 16.2% overall rate of 30‐day rehospitalization among survivors of initial critical illness.[11] Just as we observed, Hua et al. concluded that development of AKI correlated with readmission. Because they relied on administrative data for their analysis, AKI was diagnosed when hemodialysis was utilized. Examining AKI using SCr changes, our findings add a layer of granularity to the relationship between AKI stages and early readmission. Specifically, we failed to detect any rise in the odds of rehospitalization when either very mild (RIFLE: Risk) or severe (RIFLE: Loss or RIFLE: ESKD) AKI was present. Only when either RIFLE: Injury or RIFLE: Failure developed did the odds of readmission rise. In addition to diverging definitions between our studies, differences in populations also likely yielded different results.[11] Although Hua et al. examined all admissions to the ICU regardless of the diagnosis or illness severity, our cohort consisted of only those ICU patients who survived culture‐positive severe sepsis/septic shock. Because AKI is a known risk factor for mortality in sepsis,[19] the potential for immortal time bias leaves a smaller pool of surviving patients with ESKD at risk for readmission. Regardless of the explanation, it may be prudent to focus on preventing AKI not only to improve survival, but also from the standpoint of diminishing the risk of an early readmission.
Four additional studies have examined the frequency of early readmissions among survivors of critical illness. Liu et al. noted 17.9% 30‐day rehospitalization rate among sepsis survivors.[12] Factors associated with the risk of early readmission included acute and chronic diseases burdens, index hospital LOS, and the need for the ICU in the index sepsis admission. In contrast to our cohort, all of whom were in the ICU during their index episode, less than two‐thirds of the entire population studied by Liu had required an ICU admission. Additionally, Liu's study did not specifically examine the potential impact of AKI or of microbiology on this outcome.
Prescott and coworkers examined healthcare utilization following an episode of severe sepsis.[13] Among other findings, they reported a 30‐day readmission rate of 26.5% among survivors. Although closer to our estimate, this study included all patients surviving a severe sepsis hospitalization, and not only those with a positive culture. These investigators did not examine predictors of readmission.[13]
Horkan et al. examined specifically whether there was an association between AKI and postdischarge outcomes, including 30‐day readmission risk, in a large cohort of patients who survived their critical illness.[20] In it they found that readmission risk ranged from 19% to 21%, depending on the extent of the AKI. Moreover, similar to our findings, they reported that in an adjusted analysis RIFLE: Injury and RIFLE: Failure were associated with a rise in the odds of a 30‐day rehospitalizaiton. In contrast to our study, Horkan et al. did detect an increase in the odds of this outcome associated with RIFLE: Risk. There are likely at least 3 reasons for this difference. First, we focused only on patients with severe sepsis or septic shock, whereas Horkan and colleagues included all critical illness survivors. Second, we were able to explore the impact of microbiology on this outcome. Third, Horkan's study included an order of magnitude more patients than did ours, thus making it more likely either to have the power to detect a true association that we may have lacked or to be more susceptible to type I error.
Finally, Goodwin and colleagues utilized 3 states' databases included in the Health Care and Utilization Project (HCUP) from the Agency for Healthcare Research and Quality to study frequency and risk factors for 30‐day readmission among survivors of severe sepsis.[21] Patients were identified based on the use of the severe sepsis (995.92) and septic shock (785.52). These authors found a 30‐day readmission rate of 26%. Although chronic renal disease, among several other factors, was associated with an increase in this risk, the data source did not permit these investigators to examine the impact of AKI on the outcomes. Similarly, HCUP data do not contain microbiology, a distinct difference from our analysis.
If clinicians are to pursue strategies to reduce the risk of an all‐cause 30‐day readmission, the key goal is not simply to identify all variables associated with readmission, but to focus on factors that are potentially modifiable. Although neither Hua nor Liu and their teams identified any additional factors that are potentially modifiable,[11, 12] in the present study, among the 5 factors we identified, the development of mild to moderate AKI during the index hospitalization may deserve stronger consideration for efforts at prevention. Although one cannot conclude automatically that preventing AKI in this population could mitigate some of the early rehospitalization risk, critically ill patients are frequently exposed to a multitude of nephrotoxic agents. Those caring for subjects with sepsis should reevaluate the risk‐benefit equation of these factors more cautiously and apply guideline‐recommended AKI prevention strategies more aggressively, particularly because a relatively minor change in SCr resulted in an excess risk of readmission.[22]
In addition to AKI, which is potentially modifiable, we identified several other clinical factors predictive of 30‐day readmission, which are admittedly not preventable. Thus, microbiology was predictive of this outcome, with E coli engendering fewer and Bacteroides spp and ESBL organisms more early rehospitalizations. Similarly, urine as the source of sepsis was associated with a lower risk for this endpoint.
Our study has a number of limitations. As a retrospective cohort, it is subject to bias, most notably a selection bias. Specifically, because the flagship hospital of the BJC HealthCare system is a referral center, it is possible that we did not capture all readmissions. However, generally, if a patient who receives healthcare within 1 of the BJC hospitals presents to a nonsystem hospital, that patient is nearly always transferred back into the integrated system because of issues of insurance coverage. Analysis of certain diagnosis‐related groups has indicated that 73% of all patients overall discharged from 4 of the large BJC system institutions who require a readmission within 30 days of discharge return to a BJC hospital (personal communication, Financial Analysis and Decision Support Department at BJC to Dr. Kollef May 12, 2015). Therefore, we may have misclassified the outcome in as many as 180 patients. The fact that our readmission rate was fully double that seen in Hua et al.'s and Liu et al.'s studies, and somewhat higher than that reported by Prescott et al., attests not only to the population differences, but also to the fact that we are unlikely to have missed a substantial percentage of readmissions.[11, 12, 13] Furthermore, to mitigate biases, we enrolled all consecutive patients meeting the predetermined criteria. Missing from our analysis are events that occurred between the index discharge and the readmission. Likewise, we were unable to obtain such potentially important variables as code status or outpatient mortality following discharge. These intervening factors, if included in subsequent studies, may increase the predictive power of the model. Because we relied on administrative coding to identify cases of severe sepsis and septic shock, it is possible that there is misclassification within our cohort. Recent studies indicate, however, that the Angus definition, used in our study, has high negative and positive predictive values for severe sepsis identification.[23] It is still possible that our cohort is skewed toward a more severely ill population, making our results less generalizable to the less severely ill septic patients.[24] The study was performed at a single healthcare system and included only cases of severe sepsis or septic shock that had a positive blood culture, and thus the findings may not be broadly generalizable either to patients without a positive blood culture or to institutions that do not resemble it.
In summary, we have demonstrated that survivors of culture‐positive severe sepsis or septic shock have a high rate of 30‐day rehospitalization. Because the US federal government's initiatives deem 30‐day readmissions to be a quality metric and penalize institutions with higher‐than average readmission rates, a high volume of critically ill patients with culture‐positive severe sepsis and septic shock may disproportionately put an institution at risk for such penalties. Unfortunately, not many of the determinants of readmission are amenable to prevention. As sepsis survival continues to improve, hospitals will need to concentrate their resources on coordinating care of these complex patients so as to improve both individual quality of life and the quality of care that they provide.
Disclosures
This study was supported by a research grant from Cubist Pharmaceuticals, Lexington, Massachusetts. Dr. Kollef's time was in part supported by the Barnes‐Jewish Hospital Foundation. The authors report no conflicts of interest.
- , , , et al; Sepsis Occurrence in Acutely Ill Patients Investigators. Sepsis in European intensive care units: results of the SOAP study. Crit Care Med. 2006;34:344–353
- , , , et al. Death in the United States, 2007. NCHS Data Brief. 2009;26:1–8.
- , , , et al. The epidemiology of sepsis in the United States from 1979 through 2000. N Engl J Med. 2003;348:1548–1564.
- , , , , , . Epidemiology of severe sepsis in the United States: analysis of incidence, outcome, and associated costs of care. Crit Care Med. 2001;29:1303–1310.
- , , , et al: Hospitalizations, costs, and outcomes of severe sepsis in the United States 2003 to 2007. Crit Care Med. 2012;40:754–761.
- , , , et al. Facing the challenge: decreasing case fatality rates in severe sepsis despite increasing hospitalization. Crit Care Med. 2005;33:2555–2562.
- , , , et al. Rapid increase in hospitalization and mortality rates for severe sepsis in the United States: a trend analysis from 1993 to 2003. Crit Care Med. 2007;35:1244–1250.
- , , , , . Two decades of mortality trends among patients with severe sepsis: a comparative meta‐analysis. Crit Care Med. 2014;42:625–631.
- , , , et al. Preventing 30‐day hospital readmissions: a systematic review and meta‐analysis of randomized trials. JAMA Intern Med. 2014;174:1095–1107.
- , . Trends in septicemia hospitalizations and readmissions in selected HCUP states, 2005 and 2010. HCUP Statistical Brief #161. Agency for Healthcare Research and Quality, Rockville, MD. Available at: http://www.hcup‐us.ahrq.gov/reports/statbriefs/sb161.pdf. Published September 2013, Accessed January 13, 2015.
- , , , . Early and late unplanned rehospitalizations for survivors of critical illness. Crit Care Med. 2015;43:430–438.
- , , , , , . Hospital readmission and healthcare utilization following sepsis in community settings. J Hosp Med. 2014;9:502–507.
- , , , , . Increased 1‐year healthcare use in survivors of severe sepsis. Am J Respir Crit Care Med. 2014;190:62–69.
- , , , , . Multi‐drug resistance, inappropriate initial antibiotic therapy and mortality in Gram‐negative severe sepsis and septic shock: a retrospective cohort study. Crit Care. 2014;18:596.
- , , . Does combination antimicrobial therapy reduce mortality in Gram‐negative bacteraemia? A meta‐analysis. Lancet Infect Dis. 2004;4:519–527.
- , , , et al. Multidrug‐resistant, extensively drug‐resistant and pandrug‐resistant bacteria: an international expert proposal for interim standard definitions for acquired resistance. Clin Microbiol Infect. 2012;18:268–281.
- , , , , ; Acute Dialysis Quality Initiative Workgroup. Acute renal failure—definition, outcome measures, animal models, fluid therapy and information technology needs: the Second International Consensus Conference of the Acute Dialysis Quality Initiative (ADQI) Group. Crit Care. 2004;8:R204–R212.
- , , , . APACHE II: a severity of disease classification system. Crit Care Med. 1985;13:818–829.
- , , , et al. RIFLE criteria for acute kidney injury are associated with hospital mortality in critically ill patients: a cohort analysis. Crit Care. 2006;10:R73
- , , , , , . The association of acute kidney injury in the critically ill and postdischarge outcomes: a cohort study. Crit Care Med. 2015;43:354–364.
- , , , . Frequency, cost, and risk factors of readmissions among severe sepsis survivors. Crit Care Med. 2015;43:738–746.
- Acute Kidney Injury Work Group. Kidney disease: improving global outcomes (KDIGO). KDIGO clinical practice guideline for acute kidney injury. Kidney Int Suppl. 2012;2:1–138. Available at: http://www.kdigo.org/clinical_practice_guidelines/pdf/KDIGO%20AKI%20Guideline.pdf. Accessed March 4, 2015.
- , , , , , . Validity of administrative data in recording sepsis: a systematic review. Crit Care. 2015;19(1):139.
- , , , , , . Severe sepsis cohorts derived from claims‐based strategies appear to be biased toward a more severely ill patient population. Crit Care Med. 2013;41:945–953.
Despite its decreasing mortality, sepsis remains a leading reason for intensive care unit (ICU) admission and is associated with crude mortality in excess of 25%.[1, 2] In the United States there are between 660,000 and 750,000 sepsis hospitalizations annually, with the direct costs surpassing $24 billion.[3, 4, 5] As mortality rates have begun to fall, attention has shifted to issues of morbidity and recovery, the intermediate and longer‐term consequences associated with survivorship, and how interventions made while the patient is acutely ill in the ICU alter later health outcomes.[3, 5, 6, 7, 8]
One area of particular interest is the need for healthcare utilization following an acute admission for sepsis, and specifically rehospitalization within 30 days of discharge. This outcome is important not just from the perspective of the patient's well‐being, but also from the point of view of healthcare financing. Through the establishment of Hospital Readmission Reduction Program, the Centers for Medicare and Medicaid Services have sharply reduced reimbursement to hospitals for excessive rates of 30‐day readmissions.[9]
For sepsis, little is known about such readmissions, and even less about how to prevent them. A handful of studies suggest that this rate is between 5% and 26%.[10, 11, 12, 13] Whereas some of these studies looked at some of the factors that impact readmissions,[11, 12] none examined the potential contribution of microbiology of sepsis to this outcome.
To explore these questions, we conducted a single‐center retrospective cohort study among critically ill patients admitted to the ICU with severe culture‐positive sepsis and/or septic shock and determined the rate of early posthospital discharge readmission. In addition, we sought to elucidate predictors of subsequent readmission.
METHODS
Study Design and Ethical Standards
We conducted a single‐center retrospective cohort study from January 2008 to December 2012. The study was approved by the Washington University School of Medicine Human Studies Committee, and informed consent was waived because the data collection was retrospective without any patient‐identifying information. The study was performed in accordance with the ethical standards of the 1964 Declaration of Helsinki and its later amendments. Aspects of our methodology have been previously published.[14]
Primary Endpoint
All‐cause readmission to an acute‐care facility in the 30 days following discharge after the index hospitalization with sepsis served as the primary endpoint. The index hospitalizations occurred at the Barnes‐Jewish Hospital, a 1200‐bed inner‐city academic institution that serves as the main teaching institution for BJC HealthCare, a large integrated healthcare system of both inpatient and outpatient care. BJC includes a total of 13 hospitals in a compact geographic region surrounding and including St. Louis, Missouri, and we included readmission to any of these hospitals in our analysis. Persons treated within this healthcare system are, in nearly all cases, readmitted to 1 of the system's participating 13 hospitals. If a patient who receives healthcare in the system presents to an out‐of‐system hospital, he/she is often transferred back into the integrated system because of issues of insurance coverage.
Study Cohort
All consecutive adult ICU patients were included if (1) They had a positive blood culture for a pathogen (Cultures positive only for coagulase negative Staphylococcus aureus were excluded as contaminants.), (2) there was an International Classification of Diseases, Ninth Revision, Clinical Modification (ICD‐9‐CM) code corresponding to an acute organ dysfunction,[4] and (3) they survived their index hospitalization. Only the first episode of sepsis was included as the index hospitalization.
Definitions
All‐cause 30‐day readmission, was defined as a repeat hospitalization within 30 days of discharge from the index hospitalization among survivors of culture‐positive severe sepsis or septic shock. The definition of severe sepsis was based on discharge ICD‐9‐CM codes for acute organ dysfunction.[3] Patients were classified as having septic shock if vasopressors (norepinephrine, dopamine, epinephrine, phenylephrine, or vasopressin) were initiated within 24 hours of the blood culture collection date and time.
Initially appropriate antimicrobial treatment (IAAT) was deemed appropriate if the initially prescribed antibiotic regimen was active against the identified pathogen based on in vitro susceptibility testing and administered for at least 24 hours within 24 hours following blood culture collection. All other regimens were classified as non‐IAAT. Combination antimicrobial treatment was not required for IAAT designation.[15] Prior antibiotic exposure and prior hospitalization occurred within the preceding 90 days, and prior bacteremia within 30 days of the index episode. Multidrug resistance (MDR) among Gram‐negative bacteria was defined as nonsusceptibility to at least 1 antimicrobial agent from at least 3 different antimicrobial classes.[16] Both extended spectrum ‐lactamase (ESBL) organisms and carbapenemase‐producing Enterobacteriaceae were identified via molecular testing.
Healthcare‐associated (HCA) infections were defined by the presence of at least 1 of the following: (1) recent hospitalization, (2) immune suppression (defined as any primary immune deficiency or acquired immune deficiency syndrome or exposure within 3 prior months to immunosuppressive treatmentschemotherapy, radiation therapy, or steroids), (3) nursing home residence, (4) hemodialysis, (5) prior antibiotics. and (6) index bacteremia deemed a hospital‐acquired bloodstream infection (occurring >2 days following index admission date). Acute kidney injury (AKI) was defined according to the RIFLE (Risk, Injury, Failure, Loss, End‐stage) criteria based on the greatest change in serum creatinine (SCr).[17]
Data Elements
Patient‐specific baseline characteristics and process of care variables were collected from the automated hospital medical record, microbiology database, and pharmacy database of Barnes‐Jewish Hospital. Electronic inpatient and outpatient medical records available for all patients in the BJC HealthCare system were reviewed to determine prior antibiotic exposure. The baseline characteristics collected during the index hospitalization included demographics and comorbid conditions. The comorbidities were identified based on their corresponding ICD‐9‐CM codes. The Acute Physiology and Chronic Health Evaluation (APACHE) II and Charlson comorbidity scores were calculated based on clinical data present during the 24 hours after the positive blood cultures were obtained.[18] This was done to accommodate patients with community‐acquired and healthcare‐associated community‐onset infections who only had clinical data available after blood cultures were drawn. Lowest and highest SCr levels were collected during the index hospitalization to determine each patient's AKI status.
Statistical Analyses
Continuous variables were reported as means with standard deviations and as medians with 25th and 75th percentiles. Differences between mean values were tested via the Student t test, and between medians using the Mann‐Whitney U test. Categorical data were summarized as proportions, and the 2 test or Fisher exact test for small samples was used to examine differences between groups. We developed multiple logistic regression models to identify clinical risk factors that were associated with 30‐day all‐cause readmission. All risk factors that were significant at 0.20 in the univariate analyses, as well as all biologically plausible factors even if they did not reach this level of significance, were included in the models. All variables entered into the models were assessed for collinearity, and interaction terms were tested. The most parsimonious models were derived using the backward manual elimination method, and the best‐fitting model was chosen based on the area under the receiver operating characteristics curve (AUROC or the C statistic). The model's calibration was assessed with the Hosmer‐Lemeshow goodness‐of‐fit test. All tests were 2‐tailed, and a P value <0.05 represented statistical significance.
All computations were performed in Stata/SE, version 9 (StataCorp, College Station, TX).
Role of Sponsor
The sponsor had no role in the design, analyses, interpretation, or publication of the study.
RESULTS
Among the 1697 patients with severe sepsis or septic shock who were discharged alive from the hospital, 543 (32.0%) required a rehospitalization within 30 days. There were no differences in age or gender distribution between the groups (Table 1). All comorbidities examined were more prevalent among those with a 30‐day readmission than among those without, with the median Charlson comorbidity score reflecting this imbalance (5 vs 4, P<0.001). Similarly, most of the HCA risk factors were more prevalent among the readmitted group than the comparator group, with HCA sepsis among 94.2% of the former and 90.7% of the latter (P = 0.014).
| 30‐Day Readmission = Yes | 30‐Day Readmission = No | ||||
|---|---|---|---|---|---|
| N = 543 | % = 32.00% | N = 1,154 | % = 68.00% | P Value | |
| |||||
| Baseline characteristics | |||||
| Age, y | |||||
| Mean SD | 58.5 15.7 | 59.5 15.8 | |||
| Median (25, 75) | 60 (49, 69) | 60 (50, 70) | 0.297 | ||
| Race | |||||
| Caucasian | 335 | 61.69% | 769 | 66.64% | 0.046 |
| African American | 157 | 28.91% | 305 | 26.43% | 0.284 |
| Other | 9 | 1.66% | 22 | 1.91% | 0.721 |
| Sex, female | 244 | 44.94% | 537 | 46.53% | 0.538 |
| Admission source | |||||
| Home | 374 | 68.88% | 726 | 62.91% | 0.016 |
| Nursing home, rehab, or LTAC | 39 | 7.81% | 104 | 9.01% | 0.206 |
| Transfer from another hospital | 117 | 21.55% | 297 | 25.74% | 0.061 |
| Comorbidities | |||||
| CHF | 131 | 24.13% | 227 | 19.67% | 0.036 |
| COPD | 156 | 28.73% | 253 | 21.92% | 0.002 |
| CLD | 83 | 15.29% | 144 | 12.48% | 0.113 |
| DM | 175 | 32.23% | 296 | 25.65% | 0.005 |
| CKD | 137 | 25.23% | 199 | 17.24% | <0.001 |
| Malignancy | 225 | 41.44% | 395 | 34.23% | 0.004 |
| HIV | 11 | 2.03% | 10 | 0.87% | 0.044 |
| Charlson comorbidity score | |||||
| Mean SD | 5.24 3.32 | 4.48 3.35 | |||
| Median (25, 75) | 5 (3, 8) | 4 (2, 7) | <0.001 | ||
| HCA RF | 503 | 94.19% | 1,019 | 90.66% | 0.014 |
| Hemodialysis | 65 | 12.01% | 114 | 9.92% | 0.192 |
| Immune suppression | 193 | 36.07% | 352 | 31.21% | 0.044 |
| Prior hospitalization | 339 | 65.07% | 620 | 57.09% | 0.002 |
| Nursing home residence | 39 | 7.81% | 104 | 9.01% | 0.206 |
| Prior antibiotics | 301 | 55.43% | 568 | 49.22% | 0.017 |
| Hospital‐acquired BSI* | 240 | 44.20% | 485 | 42.03% | 0.399 |
| Prior bacteremia within 30 days | 88 | 16.21% | 154 | 13.34% | 0.116 |
| Sepsis‐related parameters | |||||
| LOS prior to bacteremia, d | |||||
| Mean SD | 6.65 11.22 | 5.88 10.81 | |||
| Median (25, 75) | 1 (0, 10) | 0 (0, 8) | 0.250 | ||
| Surgery | |||||
| None | 362 | 66.67% | 836 | 72.44% | 0.015 |
| Abdominal | 104 | 19.15% | 167 | 14.47% | 0.014 |
| Extra‐abdominal | 73 | 13.44% | 135 | 11.70% | 0.306 |
| Status unknown | 4 | 0.74% | 16 | 1.39% | 0.247 |
| Central line | 333 | 64.41% | 637 | 57.80% | 0.011 |
| TPN at the time of bacteremia or prior to it during index hospitalization | 52 | 9.74% | 74 | 5.45% | 0.017 |
| APACHE II | |||||
| Mean SD | 15.08 5.47 | 15.35 5.43 | |||
| Median (25, 75) | 15 (11, 18) | 15 (12, 19) | 0.275 | ||
| Severe sepsis | 361 | 66.48% | 747 | 64.73% | 0.480 |
| Septic shock requiring vasopressors | 182 | 33.52% | 407 | 35.27% | |
| On MV | 104 | 19.22% | 251 | 21.90% | 0.208 |
| Peak WBC (103/L) | |||||
| Mean SD | 22.26 25.20 | 22.14 17.99 | |||
| Median (25, 75) | 17.1 (8.9, 30.6) | 16.9 (10, 31) | 0.654 | ||
| Lowest serum SCr, mg/dL | |||||
| Mean SD | 1.02 1.05 | 0.96 1.03 | |||
| Median (25, 75) | 0.68 (0.5, 1.06) | 0.66 (0.49, 0.96) | 0.006 | ||
| Highest serum SCr, mg/dL | |||||
| Mean SD | 2.81 2.79 | 2.46 2.67 | |||
| Median (25, 75) | 1.68 (1.04, 3.3) | 1.41 (0.94, 2.61) | 0.001 | ||
| RIFLE category | |||||
| None | 81 | 14.92% | 213 | 18.46% | 0.073 |
| Risk | 112 | 20.63% | 306 | 26.52% | 0.009 |
| Injury | 133 | 24.49% | 247 | 21.40% | 0.154 |
| Failure | 120 | 22.10% | 212 | 18.37% | 0.071 |
| Loss | 50 | 9.21% | 91 | 7.89% | 0.357 |
| End‐stage | 47 | 8.66% | 85 | 7.37% | 0.355 |
| Infection source | |||||
| Urine | 95 | 17.50% | 258 | 22.36% | 0.021 |
| Abdomen | 69 | 12.71% | 113 | 9.79% | 0.070 |
| Lung | 93 | 17.13% | 232 | 20.10% | 0.146 |
| Line | 91 | 16.76% | 150 | 13.00% | 0.038 |
| CNS | 1 | 0.18% | 16 | 1.39% | 0.012 |
| Skin | 51 | 9.39% | 82 | 7.11% | 0.102 |
| Unknown | 173 | 31.86% | 375 | 32.50% | 0.794 |
During the index hospitalization, 589 patients (34.7%) suffered from septic shock requiring vasopressors; this did not impact the 30‐day readmission risk (Table 1). Commensurately, markers of severity of acute illness (APACHE II score, mechanical ventilation, peak white blood cell count) did not differ between the groups. With respect to the primary source of sepsis, urine was less, whereas central nervous system was more likely among those readmitted within 30 days. Similarly, there was a significant imbalance between the groups in the prevalence of AKI (Table 1). Specifically, those who did require a readmission were slightly less likely to have sustained no AKI (RIFLE: None; 14.9% vs 18.5%, P = 0.073). Those requiring readmission were also less likely to be in the category RIFLE: Risk (20.6% vs 26.5%, P = 0.009). The direction of this disparity was reversed for the Injury and Failure categories. No differences between groups were seen among those with categories Loss and end‐stage kidney disease (ESKD) (Table 1).
The microbiology of sepsis did not differ in most respects between the 30‐day readmission groups, save for several organisms (Table 2). Most strikingly, those who required a readmission were more likely than those who did not to be infected with Bacteroides spp, Candida spp, an MDR or an ESBL organism (Table 2). As for the outcomes of the index hospitalization, those with a repeat admission had a longer overall and postonset of sepsis initial hospital length of stay, and were less likely to be discharged either home without home health care or transferred to another hospital at the end of their index hospitalization (Table 3).
| 30‐Day Readmission = Yes | 30‐Day Readmission = No | P Value | |||
|---|---|---|---|---|---|
| N | % | N | % | ||
| |||||
| 543 | 32.00% | 1,154 | 68.00% | ||
| Gram‐positive BSI | 260 | 47.88% | 580 | 50.26% | 0.376 |
| Staphylococcus aureus | 138 | 25.41% | 287 | 24.87% | 0.810 |
| MRSA | 78 | 14.36% | 147 | 12.74% | 0.358 |
| VISA | 6 | 1.10% | 9 | 0.78% | 0.580 |
| Streptococcus pneumoniae | 7 | 1.29% | 33 | 2.86% | 0.058 |
| Streptococcus spp | 34 | 6.26% | 81 | 7.02% | 0.606 |
| Peptostreptococcus spp | 5 | 0.92% | 15 | 1.30% | 0.633 |
| Clostridium perfringens | 4 | 0.74% | 10 | 0.87% | 1.000 |
| Enterococcus faecalis | 54 | 9.94% | 108 | 9.36% | 0.732 |
| Enterococcus faecium | 29 | 5.34% | 63 | 5.46% | 1.000 |
| VRE | 36 | 6.63% | 70 | 6.07% | 0.668 |
| Gram‐negative BSI | 231 | 42.54% | 515 | 44.63% | 0.419 |
| Escherichia coli | 54 | 9.94% | 151 | 13.08% | 0.067 |
| Klebsiella pneumoniae | 54 | 9.94% | 108 | 9.36% | 0.723 |
| Klebsiella oxytoca | 11 | 2.03% | 18 | 1.56% | 0.548 |
| Enterobacter aerogenes | 6 | 1.10% | 13 | 1.13% | 1.000 |
| Enterobacter cloacae | 21 | 3.87% | 44 | 3.81% | 1.000 |
| Pseudomonas aeruginosa | 28 | 5.16% | 65 | 5.63% | 0.733 |
| Acinetobacter spp | 8 | 1.47% | 27 | 2.34% | 0.276 |
| Bacteroides spp | 25 | 4.60% | 30 | 2.60% | 0.039 |
| Serratia marcescens | 14 | 2.58% | 21 | 1.82% | 0.360 |
| Stenotrophomonas maltophilia | 3 | 0.55% | 8 | 0.69% | 1.000 |
| Achromobacter spp | 2 | 0.37% | 3 | 0.17% | 0.597 |
| Aeromonas spp | 2 | 0.37% | 1 | 0.09% | 0.241 |
| Burkholderia cepacia | 0 | 0.00% | 6 | 0.52% | 0.186 |
| Citrobacter freundii | 2 | 0.37% | 15 | 1.39% | 0.073 |
| Fusobacterium spp | 7 | 1.29% | 10 | 0.87% | 0.438 |
| Haemophilus influenzae | 1 | 0.18% | 4 | 0.35% | 1.000 |
| Prevotella spp | 1 | 0.18% | 6 | 0.52% | 0.441 |
| Proteus mirabilis | 9 | 1.66% | 39 | 3.38% | 0.058 |
| MDR PA | 2 | 0.37% | 7 | 0.61% | 0.727 |
| ESBL | 10 | 6.25% | 8 | 2.06% | 0.017 |
| CRE | 2 | 1.25% | 0 | 0.00% | 0.028 |
| MDR Gram‐negative or Gram‐positive | 231 | 47.53% | 450 | 41.86% | 0.036 |
| Candida spp | 58 | 10.68% | 76 | 6.59% | 0.004 |
| Polymicrobal BSI | 50 | 9.21% | 111 | 9.62% | 0.788 |
| Initially inappropriate treatment | 119 | 21.92% | 207 | 17.94% | 0.052 |
| 30‐Day Readmission = Yes | 30‐Day Readmission = No | ||||
|---|---|---|---|---|---|
| N = 543 | % = 32.00% | N = 1,154 | % = 68.00% | P Value | |
| |||||
| Hospital LOS, days | |||||
| Mean SD | 26.44 23.27 | 23.58 21.79 | 0.019 | ||
| Median (25, 75) | 19.16 (9.66, 35.86) | 17.77 (8.9, 30.69) | |||
| Hospital LOS following BSI onset, days | |||||
| Mean SD | 19.80 18.54 | 17.69 17.08 | 0.022 | ||
| Median (25, 75) | 13.9 (7.9, 25.39) | 12.66 (7.05, 22.66) | |||
| Discharge destination | |||||
| Home | 125 | 23.02% | 334 | 28.94% | 0.010 |
| Home with home care | 163 | 30.02% | 303 | 26.26% | 0.105 |
| Rehab | 81 | 14.92% | 149 | 12.91% | 0.260 |
| LTAC | 41 | 7.55% | 87 | 7.54% | 0.993 |
| Transfer to another hospital | 1 | 0.18% | 19 | 1.65% | 0.007 |
| SNF | 132 | 24.31% | 262 | 22.70% | 0.465 |
In a logistic regression model, 5 factors emerged as predictors of 30‐day readmission (Table 4). Having RIFLE: Injury or RIFLE: Failure carried an approximately 2‐fold increase in the odds of 30‐day rehospitalization (odds ratio: 1.95, 95% confidence interval: 1.302.93, P = 0.001) relative to having a RIFLE: None or RIFLE: Risk. Although having strong association with this outcome, harboring an ESBL organism or Bacteroides spp were both relatively infrequent events (3.3% ESBL and 3.2% Bacteroides spp). Infection with Escherichia coli and urine as the source of sepsis both appeared to be significantly protective against a readmission (Table 4). The model's discrimination was moderate (AUROC = 0.653) and its calibration adequate (Hosmer‐Lemeshow P = 0.907). (See Supporting Information, Appendix 1, in the online version of this article for the steps in the development of the final model.)
| OR | 95% CI | P Value | |
|---|---|---|---|
| |||
| ESBL | 4.503 | 1.42914.190 | 0.010 |
| RIFLE: Injury or Failure (reference: RIFLE: None or Risk) | 1.951 | 1.2972.933 | 0.001 |
| Bacteroides spp | 2.044 | 1.0583.948 | 0.033 |
| Source: urine | 0.583 | 0.3470.979 | 0.041 |
| Escherichia coli | 0.494 | 0.2700.904 | 0.022 |
DISCUSSION
In this single‐center retrospective cohort study, nearly one‐third of survivors of culture‐positive severe sepsis or septic shock required a rehospitalization within 30 days of discharge from their index admission. Factors that contributed to a higher odds of rehospitalization were having mild‐to‐moderate AKI (RIFLE: Injury or RIFLE: Failure) and infection with ESBL organisms or Bacteroides spp, whereas urine as the source of sepsis and E coli as the pathogen appeared to be protective.
A recent study by Hua and colleagues examining the New York Statewide Planning and Research Cooperative System for the years 2008 to 2010 noted a 16.2% overall rate of 30‐day rehospitalization among survivors of initial critical illness.[11] Just as we observed, Hua et al. concluded that development of AKI correlated with readmission. Because they relied on administrative data for their analysis, AKI was diagnosed when hemodialysis was utilized. Examining AKI using SCr changes, our findings add a layer of granularity to the relationship between AKI stages and early readmission. Specifically, we failed to detect any rise in the odds of rehospitalization when either very mild (RIFLE: Risk) or severe (RIFLE: Loss or RIFLE: ESKD) AKI was present. Only when either RIFLE: Injury or RIFLE: Failure developed did the odds of readmission rise. In addition to diverging definitions between our studies, differences in populations also likely yielded different results.[11] Although Hua et al. examined all admissions to the ICU regardless of the diagnosis or illness severity, our cohort consisted of only those ICU patients who survived culture‐positive severe sepsis/septic shock. Because AKI is a known risk factor for mortality in sepsis,[19] the potential for immortal time bias leaves a smaller pool of surviving patients with ESKD at risk for readmission. Regardless of the explanation, it may be prudent to focus on preventing AKI not only to improve survival, but also from the standpoint of diminishing the risk of an early readmission.
Four additional studies have examined the frequency of early readmissions among survivors of critical illness. Liu et al. noted 17.9% 30‐day rehospitalization rate among sepsis survivors.[12] Factors associated with the risk of early readmission included acute and chronic diseases burdens, index hospital LOS, and the need for the ICU in the index sepsis admission. In contrast to our cohort, all of whom were in the ICU during their index episode, less than two‐thirds of the entire population studied by Liu had required an ICU admission. Additionally, Liu's study did not specifically examine the potential impact of AKI or of microbiology on this outcome.
Prescott and coworkers examined healthcare utilization following an episode of severe sepsis.[13] Among other findings, they reported a 30‐day readmission rate of 26.5% among survivors. Although closer to our estimate, this study included all patients surviving a severe sepsis hospitalization, and not only those with a positive culture. These investigators did not examine predictors of readmission.[13]
Horkan et al. examined specifically whether there was an association between AKI and postdischarge outcomes, including 30‐day readmission risk, in a large cohort of patients who survived their critical illness.[20] In it they found that readmission risk ranged from 19% to 21%, depending on the extent of the AKI. Moreover, similar to our findings, they reported that in an adjusted analysis RIFLE: Injury and RIFLE: Failure were associated with a rise in the odds of a 30‐day rehospitalizaiton. In contrast to our study, Horkan et al. did detect an increase in the odds of this outcome associated with RIFLE: Risk. There are likely at least 3 reasons for this difference. First, we focused only on patients with severe sepsis or septic shock, whereas Horkan and colleagues included all critical illness survivors. Second, we were able to explore the impact of microbiology on this outcome. Third, Horkan's study included an order of magnitude more patients than did ours, thus making it more likely either to have the power to detect a true association that we may have lacked or to be more susceptible to type I error.
Finally, Goodwin and colleagues utilized 3 states' databases included in the Health Care and Utilization Project (HCUP) from the Agency for Healthcare Research and Quality to study frequency and risk factors for 30‐day readmission among survivors of severe sepsis.[21] Patients were identified based on the use of the severe sepsis (995.92) and septic shock (785.52). These authors found a 30‐day readmission rate of 26%. Although chronic renal disease, among several other factors, was associated with an increase in this risk, the data source did not permit these investigators to examine the impact of AKI on the outcomes. Similarly, HCUP data do not contain microbiology, a distinct difference from our analysis.
If clinicians are to pursue strategies to reduce the risk of an all‐cause 30‐day readmission, the key goal is not simply to identify all variables associated with readmission, but to focus on factors that are potentially modifiable. Although neither Hua nor Liu and their teams identified any additional factors that are potentially modifiable,[11, 12] in the present study, among the 5 factors we identified, the development of mild to moderate AKI during the index hospitalization may deserve stronger consideration for efforts at prevention. Although one cannot conclude automatically that preventing AKI in this population could mitigate some of the early rehospitalization risk, critically ill patients are frequently exposed to a multitude of nephrotoxic agents. Those caring for subjects with sepsis should reevaluate the risk‐benefit equation of these factors more cautiously and apply guideline‐recommended AKI prevention strategies more aggressively, particularly because a relatively minor change in SCr resulted in an excess risk of readmission.[22]
In addition to AKI, which is potentially modifiable, we identified several other clinical factors predictive of 30‐day readmission, which are admittedly not preventable. Thus, microbiology was predictive of this outcome, with E coli engendering fewer and Bacteroides spp and ESBL organisms more early rehospitalizations. Similarly, urine as the source of sepsis was associated with a lower risk for this endpoint.
Our study has a number of limitations. As a retrospective cohort, it is subject to bias, most notably a selection bias. Specifically, because the flagship hospital of the BJC HealthCare system is a referral center, it is possible that we did not capture all readmissions. However, generally, if a patient who receives healthcare within 1 of the BJC hospitals presents to a nonsystem hospital, that patient is nearly always transferred back into the integrated system because of issues of insurance coverage. Analysis of certain diagnosis‐related groups has indicated that 73% of all patients overall discharged from 4 of the large BJC system institutions who require a readmission within 30 days of discharge return to a BJC hospital (personal communication, Financial Analysis and Decision Support Department at BJC to Dr. Kollef May 12, 2015). Therefore, we may have misclassified the outcome in as many as 180 patients. The fact that our readmission rate was fully double that seen in Hua et al.'s and Liu et al.'s studies, and somewhat higher than that reported by Prescott et al., attests not only to the population differences, but also to the fact that we are unlikely to have missed a substantial percentage of readmissions.[11, 12, 13] Furthermore, to mitigate biases, we enrolled all consecutive patients meeting the predetermined criteria. Missing from our analysis are events that occurred between the index discharge and the readmission. Likewise, we were unable to obtain such potentially important variables as code status or outpatient mortality following discharge. These intervening factors, if included in subsequent studies, may increase the predictive power of the model. Because we relied on administrative coding to identify cases of severe sepsis and septic shock, it is possible that there is misclassification within our cohort. Recent studies indicate, however, that the Angus definition, used in our study, has high negative and positive predictive values for severe sepsis identification.[23] It is still possible that our cohort is skewed toward a more severely ill population, making our results less generalizable to the less severely ill septic patients.[24] The study was performed at a single healthcare system and included only cases of severe sepsis or septic shock that had a positive blood culture, and thus the findings may not be broadly generalizable either to patients without a positive blood culture or to institutions that do not resemble it.
In summary, we have demonstrated that survivors of culture‐positive severe sepsis or septic shock have a high rate of 30‐day rehospitalization. Because the US federal government's initiatives deem 30‐day readmissions to be a quality metric and penalize institutions with higher‐than average readmission rates, a high volume of critically ill patients with culture‐positive severe sepsis and septic shock may disproportionately put an institution at risk for such penalties. Unfortunately, not many of the determinants of readmission are amenable to prevention. As sepsis survival continues to improve, hospitals will need to concentrate their resources on coordinating care of these complex patients so as to improve both individual quality of life and the quality of care that they provide.
Disclosures
This study was supported by a research grant from Cubist Pharmaceuticals, Lexington, Massachusetts. Dr. Kollef's time was in part supported by the Barnes‐Jewish Hospital Foundation. The authors report no conflicts of interest.
- , , , et al; Sepsis Occurrence in Acutely Ill Patients Investigators. Sepsis in European intensive care units: results of the SOAP study. Crit Care Med. 2006;34:344–353
- , , , et al. Death in the United States, 2007. NCHS Data Brief. 2009;26:1–8.
- , , , et al. The epidemiology of sepsis in the United States from 1979 through 2000. N Engl J Med. 2003;348:1548–1564.
- , , , , , . Epidemiology of severe sepsis in the United States: analysis of incidence, outcome, and associated costs of care. Crit Care Med. 2001;29:1303–1310.
- , , , et al: Hospitalizations, costs, and outcomes of severe sepsis in the United States 2003 to 2007. Crit Care Med. 2012;40:754–761.
- , , , et al. Facing the challenge: decreasing case fatality rates in severe sepsis despite increasing hospitalization. Crit Care Med. 2005;33:2555–2562.
- , , , et al. Rapid increase in hospitalization and mortality rates for severe sepsis in the United States: a trend analysis from 1993 to 2003. Crit Care Med. 2007;35:1244–1250.
- , , , , . Two decades of mortality trends among patients with severe sepsis: a comparative meta‐analysis. Crit Care Med. 2014;42:625–631.
- , , , et al. Preventing 30‐day hospital readmissions: a systematic review and meta‐analysis of randomized trials. JAMA Intern Med. 2014;174:1095–1107.
- , . Trends in septicemia hospitalizations and readmissions in selected HCUP states, 2005 and 2010. HCUP Statistical Brief #161. Agency for Healthcare Research and Quality, Rockville, MD. Available at: http://www.hcup‐us.ahrq.gov/reports/statbriefs/sb161.pdf. Published September 2013, Accessed January 13, 2015.
- , , , . Early and late unplanned rehospitalizations for survivors of critical illness. Crit Care Med. 2015;43:430–438.
- , , , , , . Hospital readmission and healthcare utilization following sepsis in community settings. J Hosp Med. 2014;9:502–507.
- , , , , . Increased 1‐year healthcare use in survivors of severe sepsis. Am J Respir Crit Care Med. 2014;190:62–69.
- , , , , . Multi‐drug resistance, inappropriate initial antibiotic therapy and mortality in Gram‐negative severe sepsis and septic shock: a retrospective cohort study. Crit Care. 2014;18:596.
- , , . Does combination antimicrobial therapy reduce mortality in Gram‐negative bacteraemia? A meta‐analysis. Lancet Infect Dis. 2004;4:519–527.
- , , , et al. Multidrug‐resistant, extensively drug‐resistant and pandrug‐resistant bacteria: an international expert proposal for interim standard definitions for acquired resistance. Clin Microbiol Infect. 2012;18:268–281.
- , , , , ; Acute Dialysis Quality Initiative Workgroup. Acute renal failure—definition, outcome measures, animal models, fluid therapy and information technology needs: the Second International Consensus Conference of the Acute Dialysis Quality Initiative (ADQI) Group. Crit Care. 2004;8:R204–R212.
- , , , . APACHE II: a severity of disease classification system. Crit Care Med. 1985;13:818–829.
- , , , et al. RIFLE criteria for acute kidney injury are associated with hospital mortality in critically ill patients: a cohort analysis. Crit Care. 2006;10:R73
- , , , , , . The association of acute kidney injury in the critically ill and postdischarge outcomes: a cohort study. Crit Care Med. 2015;43:354–364.
- , , , . Frequency, cost, and risk factors of readmissions among severe sepsis survivors. Crit Care Med. 2015;43:738–746.
- Acute Kidney Injury Work Group. Kidney disease: improving global outcomes (KDIGO). KDIGO clinical practice guideline for acute kidney injury. Kidney Int Suppl. 2012;2:1–138. Available at: http://www.kdigo.org/clinical_practice_guidelines/pdf/KDIGO%20AKI%20Guideline.pdf. Accessed March 4, 2015.
- , , , , , . Validity of administrative data in recording sepsis: a systematic review. Crit Care. 2015;19(1):139.
- , , , , , . Severe sepsis cohorts derived from claims‐based strategies appear to be biased toward a more severely ill patient population. Crit Care Med. 2013;41:945–953.
© 2015 Society of Hospital Medicine
Clinical Deterioration Alerts
Patients deemed suitable for care on a general hospital unit are not expected to deteriorate; however, triage systems are not perfect, and some patients on general nursing units do develop critical illness during their hospitalization. Fortunately, there is mounting evidence that deteriorating patients exhibit measurable pathologic changes that could possibly be used to identify them prior to significant adverse outcomes, such as cardiac arrest.[1, 2, 3] Given the evidence that unplanned intensive care unit (ICU) transfers of patients on general units result in worse outcomes than more controlled ICU admissions,[1, 4, 5, 6] it is logical to assume that earlier identification of a deteriorating patient could provide a window of opportunity to prevent adverse outcomes.
The most commonly proposed systematic solution to the problem of identifying and stabilizing deteriorating patients on general hospital units includes some combination of an early warning system (EWS) to detect the deterioration and a rapid response team (RRT) to deal with it.[7, 8, 9, 10] We previously demonstrated that a relatively simple hospital‐specific method for generating EWS alerts derived from the electronic medical record (EMR) database is capable of predicting clinical deterioration and the need for ICU transfer, as well as hospital mortality, in non‐ICU patients admitted to general inpatient medicine units.[11, 12, 13, 14] However, our data also showed that simply providing the EWS alerts to these nursing units did not result in any demonstrable improvement in patient outcomes.[14] Therefore, we set out to determine whether linking real‐time EWS alerts to an intervention and notification of the RRT for patient evaluation could improve the outcomes of patients cared for on general inpatient units.
METHODS
Study Location
The study was conducted on 8 adult inpatient medicine units of Barnes‐Jewish Hospital, a 1250‐bed academic medical center in St. Louis, MO (January 15, 2013May 9, 2013). Patient care on the inpatient medicine units is delivered by either attending hospitalist physicians or dedicated housestaff physicians under the supervision of an attending physician. Continuous electronic vital sign monitoring is not provided on these units. The study was approved by the Washington University School of Medicine Human Studies Committee, and informed consent was waived. This was a nonblinded study (
Patients and Procedures
Patients admitted to the 8 medicine units received usual care during the study except as noted below. Manually obtained vital signs, laboratory data, and pharmacy data inputted in real time into the EMR were continuously assessed. The EWS searched for the 36 input variables previously described[11, 14] from the EMR for all patients admitted to the 8 medicine units 24 hours per day and 7 days a week. Values for every continuous parameter were scaled so that all measurements lay in the interval (0, 1) and were normalized by the minimum and maximum of the parameter as previously described.[14] To capture the temporal effects in our data, we retained a sliding window of all the collected data points within the last 24 hours. We then subdivided these data into a series of 6 sequential buckets of 4 hours each. We excluded the 2 hours of data prior to ICU transfer in building the model (so the data were 26 hours to 2 hours prior to ICU transfer for ICU transfer patients, and the first 24 hours of admission for everyone else). Eligible patients were selected for study entry when they triggered an alert for clinical deterioration as determined by the EWS.[11, 14]
The EWS alert was implemented in an internally developed, Java‐based clinical decision support rules engine, which identified when new data relevant to the model were available in a real‐time central data repository. In a clinical application, it is important to capture unusual changes in vital‐sign data over time. Such changes may precede clinical deterioration by hours, providing a chance to intervene if detected early enough. In addition, not all readings in time‐series data should be treated equally; the value of some kinds of data may change depending on their age. For example, a patient's condition may be better reflected by a blood‐oxygenation reading collected 1 hour ago than a reading collected 12 hours ago. This is the rationale for our use of a sliding window of all collected data points within the last 24 hours performed on a real‐time basis to determine the alert status of the patient.[11, 14]
We applied various threshold cut points to convert the EWS alert predictions into binary values and compared the results against the actual ICU transfer outcome.[14] A threshold of 0.9760 for specificity was chosen to achieve a sensitivity of approximately 40%. These operating characteristics were chosen in turn to generate a manageable number of alerts per hospital nursing unit per day (estimated at 12 per nursing unit per day). At this cut point, the C statistic was 0.8834, with an overall accuracy of 0.9292. In other words, our EWS alert system is calibrated so that for every 1000 patient discharges per year from these 8 hospital units, there would be 75 patients generating an alert, of which 30 patients would be expected to have the study outcome (ie, clinical deterioration requiring ICU transfer).
Once patients on the study units were identified as at risk for clinical deterioration by the EWS, they were assigned by a computerized random number generator to the intervention group or the control group. The control group was managed according to the usual care provided on the medicine units. The EWS alerts generated for the control patients were electronically stored, but these alerts were not sent to the RRT nurse, instead they were hidden from all clinical staff. The intervention group had their EWS alerts sent real time to the nursing member of the hospital's RRT. The RRT is composed of a registered nurse, a second‐ or third‐year internal medicine resident, and a respiratory therapist. The RRT was introduced in 2009 for the study units involved in this investigation. For 2009, 2010, and 2011 the RRT nurse was pulled from the staff of 1 of the hospital's ICUs in a rotating manner to respond to calls to the RRT as they occurred. Starting in 2012, the RRT nurse was established as a dedicated position without other clinical responsibilities. The RRT nurse carries a hospital‐issued mobile phone, to which the automated alert messages were sent real time, and was instructed to respond to all EWS alerts within 20 minutes of their receipt.
The RRT nurse would initially evaluate the alerted intervention patients using the Modified Early Warning Score[15, 16] and make further clinical and triage decisions based on those criteria and discussions with the RRT physician or the patient's treating physicians. The RRT focused their interventions using an internally developed tool called the Four Ds (discuss goals of care, drugs needing to be administered, diagnostics needing to be performed, and damage control with the use of oxygen, intravenous fluids, ventilation, and blood products). Patients evaluated by the RRT could have their current level of care maintained, have the frequency of vital sign monitoring increased, be transferred to an ICU, or have a code blue called for emergent resuscitation. The RRT reviewed goals of care for all patients to determine the appropriateness of interventions, especially for patients near the end of life who did not desire intensive care interventions. Nursing staff on the hospital units could also make calls to the RRT for patient evaluation at any time based on their clinical assessments performed during routine nursing rounds.
The primary efficacy outcome was the need for ICU transfer. Secondary outcome measures were hospital mortality and hospital length of stay. Pertinent demographic, laboratory, and clinical data were gathered prospectively including age, gender, race, underlying comorbidities, and severity of illness assessed by the Charlson comorbidity score and Elixhauser comorbidities.[17, 18]
Statistical Analysis
We required a sample size of 514 patients (257 per group) to achieve 80% power at a 5% significance level, based on the superiority design, a baseline event rate for ICU transfer of 20.0%, and an absolute reduction of 8.0% (PS Power and Sample Size Calculations, version 3.0, Vanderbilt Biostatistics, Nashville, TN). Continuous variables were reported as means with standard deviations or medians with 25th and 75th percentiles according to their distribution. The Student t test was used when comparing normally distributed data, and the Mann‐Whitney U test was employed to analyze non‐normally distributed data (eg, hospital length of stay). Categorical data were expressed as frequency distributions, and the [2] test was used to determine if differences existed between groups. A P value <0.05 was regarded as statistically significant. An interim analysis was planned for the data safety monitoring board to evaluate patient safety after 50% of the patients were recruited. The primary analysis was by intention to treat. Analyses were performed using SPSS version 11.0 for Windows (SPSS, Inc., Chicago, IL).
Data Safety Monitoring Board
An independent data safety and monitoring board was convened to monitor the study and to review and approve protocol amendments by the steering committee.
RESULTS
Between January 15, 2013 and May 9, 2013, there were 4731 consecutive patients admitted to the 8 inpatient units and electronically screened as the base population for this investigation. Five hundred seventy‐one (12.1%) patients triggered an alert and were enrolled into the study (Figure 1). There were 286 patients assigned to the intervention group and 285 assigned to the control group. No patients were lost to follow‐up. Demographics, reason for hospital admission, and comorbidities of the 2 groups were similar (Table 1). The number of patients having a separate RRT call by the primary nursing team on the hospital units within 24 hours of generating an alert was greater for the intervention group but did not reach statistical significance (19.9% vs 16.5%; odds ratio: 1.260; 95% confidence interval [CI]: 0.8231.931). Table 2 provides the new diagnostic and therapeutic interventions initiated within 24 hours after a EWS alert was generated. Patients in the intervention group were significantly more likely to have their primary care team physician notified by an RRT nurse regarding medical condition issues and to have oximetry and telemetry started, whereas control patients were significantly more likely to have new antibiotic orders written within 24 hours of generating an alert.

| Variable | Intervention Group, n=286 | Control Group, n=285 | P Value |
|---|---|---|---|
| Age, y | 63.7 16.0 | 63.1 15.4 | 0.495 |
| Gender, n (%) | |||
| Male | 132 (46.2) | 140 (49.1) | 0.503 |
| Female | 154 (53.8) | 145 (50.9) | |
| Race, n (%) | |||
| Caucasian | 155 (54.2) | 154 (54.0) | 0.417 |
| African American | 105 (36.7) | 113 (39.6) | |
| Other | 26 (9.1) | 18 (6.3) | |
| Reason for hospital admission | |||
| Cardiac | 12 (4.2) | 15 (5.3) | 0.548 |
| Pulmonary | 64 (22.4) | 72 (25.3) | 0.418 |
| Underlying malignancy | 6 (2.1) | 3 (1.1) | 0.504 |
| Renal disease | 31 (10.8) | 22 (7.7) | 0.248 |
| Thromboembolism | 4 (1.4) | 5 (1.8) | 0.752 |
| Infection | 55 (19.2) | 50 (17.5) | 0.603 |
| Neurologic disease | 33 (11.5) | 22 (7.7) | 0.122 |
| Intra‐abdominal disease | 41 (14.3) | 47 (16.5) | 0.476 |
| Hematologic condition | 4 (1.4) | 5 (1.8) | 0.752 |
| Endocrine disorder | 12 (4.2) | 6 (2.1) | 0.153 |
| Source of hospital admission | |||
| Emergency department | 201 (70.3) | 203 (71.2) | 0.200 |
| Direct admission | 36 (12.6) | 46 (16.1) | |
| Hospital transfer | 49 (17.1) | 36 (12.6) | |
| Charlson score | 6.7 3.6 | 6.6 3.2 | 0.879 |
| Elixhauser comorbidities score | 7.4 3.5 | 7.5 3.4 | 0.839 |
| Variable | Intervention Group, n=286 | Control Group, n=285 | P Value |
|---|---|---|---|
| |||
| Medications, n (%) | |||
| Antibiotics | 92 (32.2) | 121 (42.5) | 0.011 |
| Antiarrhythmics | 48 (16.8) | 44 (15.4) | 0.662 |
| Anticoagulants | 83 (29.0) | 97 (34.0) | 0.197 |
| Diuretics/antihypertensives | 71 (24.8) | 55 (19.3) | 0.111 |
| Bronchodilators | 78 (27.3) | 73 (25.6) | 0.653 |
| Anticonvulsives | 26 (9.1) | 27 (9.5) | 0.875 |
| Sedatives/narcotics | 0 (0.0) | 1 (0.4) | 0.499 |
| Respiratory support, n (%) | |||
| Noninvasive ventilation | 17 (6.0) | 9 (3.1) | 0.106 |
| Escalated oxygen support | 12 (4.2) | 7 (2.5) | 0.247 |
| Enhanced vital signs, n (%) | 50 (17.5) | 47 (16.5) | 0.752 |
| Maintenance intravenous fluids, n (%) | 48 (16.8) | 41 (14.4) | 0.430 |
| Vasopressors, n (%) | 57 (19.9) | 61 (21.4) | 0.664 |
| Bolus intravenous fluids, n (%) | 7 (2.4) | 14 (4.9) | 0.118 |
| Telemetry, n (%) | 198 (69.2) | 176 (61.8) | 0.052 |
| Oximetry, n (%) | 20 (7.0) | 6 (2.1) | 0.005 |
| New intravenous access, n (%) | 26 (9.1) | 35 (12.3) | 0.217 |
| Primary care team physician called by RRT nurse, n (%) | 82 (28.7) | 56 (19.6) | 0.012 |
Fifty‐one patients (17.8%) randomly assigned to the intervention group required ICU transfer compared with 52 of 285 patients (18.2%) in the control group (odds ratio: 0.972; 95% CI: 0.6351.490; P=0.898) (Table 3). Twenty‐one patients (7.3%) randomly assigned to the intervention group expired during their hospitalization compared with 22 of 285 patients (7.7%) in the control group (odds ratio: 0.947; 95%CI: 0.5091.764; P=0.865). Hospital length of stay was 8.49.5 days (median, 4.5 days; interquartile range, 2.311.4 days) for patients randomized to the intervention group and 9.411.1 days (median, 5.3 days; interquartile range, 3.211.2 days) for patients randomized to the control group (P=0.038). The ICU length of stay was 4.86.6 days (median, 2.9 days; interquartile range, 1.76.5 days) for patients randomized to the intervention group and 5.86.4 days (median, 2.9 days; interquartile range, 1.57.4) for patients randomized to the control group (P=0.812).The number of patients requiring transfer to a nursing home or long‐term acute care hospital was similar for patients in the intervention and control groups (26.9% vs 26.3%; odds ratio: 1.032; 95% CI: 0.7121.495; P=0.870). Similarly, the number of patients requiring hospital readmission before 30 days and 180 days, respectively, was similar for the 2 treatment groups (Table 3). For the combined study population, the EWS alerts were triggered 94138 hours (median, 27 hours; interquartile range, 7132 hours) prior to ICU transfer and 250204 hours (median200 hours; interquartile range, 54347 hours) prior to hospital mortality. The number of RRT calls for the 8 medicine units studied progressively increased from the start of the RRT program in 2009 through 2013 (121 in 2009, 194 in 2010, 298 in 2011, 415 in 2012, 415 in 2013; P<0.001 for the trend).
| Outcome | Intervention Group, n=286 | Control Group, n=285 | P Value |
|---|---|---|---|
| |||
| ICU transfer, n (%) | 51 (17.8) | 52 (18.2) | 0.898 |
| All‐cause hospital mortality, n (%) | 21 (7.3) | 22 (7.7) | 0.865 |
| Transfer to nursing home or LTAC, n (%) | 77 (26.9) | 75 (26.3) | 0.870 |
| 30‐day readmission, n (%) | 53 (18.5) | 62 (21.8) | 0.337 |
| 180‐day readmission, n (%) | 124 (43.4) | 117 (41.1) | 0.577 |
| Hospital length of stay, d* | 8.49.5, 4.5 [2.311.4] | 9.411.1, 5.3 [3.211.2] | 0.038 |
| ICU length of stay, d* | 4.86.6, 2.9 [1.76.5] | 5.86.4, 2.9 [1.57.4] | 0.812 |
DISCUSSION
We demonstrated that a real‐time EWS alert sent to a RRT nurse was associated with a modest reduction in hospital length of stay, but similar rates of hospital mortality, ICU transfer, and subsequent need for placement in a long‐term care setting compared with usual care. We also found the number of RRT calls to have increased progressively from 2009 to the present on the study units examined.
Unplanned ICU transfers occurring as early as within 8 hours of hospitalization are relatively common and associated with increased mortality.[6] Bapoje et al. evaluated a total of 152 patients over 1 year who had unplanned ICU transfers.[19] The most common reason was worsening of the problem for which the patient was admitted (48%). Other investigators have also attempted to identify predictors for clinical deterioration resulting in unplanned ICU transfer that could be employed in an EWS.[20, 21] Organizations like the Institute for Healthcare Improvement have called for the development and routine implementation of EWSs to direct the activities of RRTs and improve outcomes.[22] However, a recent systematic review found that much of the evidence in support of EWSs and emergency response teams is of poor quality and lacking prospective randomized trials.[23]
Our earlier experience demonstrated that simply providing an alert to nursing units did not result in any demonstrable improvements in the outcomes of high‐risk patients identified by our EWS.[14] Previous investigations have also had difficulty in demonstrating consistent outcome improvements with the use of EWSs and RRTs.[24, 25, 26, 27, 28, 29, 30, 31, 32] As a result of mandates from quality improvement organizations, most US hospitals currently employ RRTs for emergent mobilization of resources when a clinically deteriorating patient is identified on a hospital ward.[33, 34] Linking RRT actions with a validated real‐time alert may represent a way of improving the overall effectiveness of such teams for monitoring general hospital units, short of having all hospitalized patients in units staffed and monitored to provide higher levels of supervision (eg, ICUs, step‐down units).[9, 35]
An alternative approach to preventing patient deterioration is to provide closer overall monitoring. This has been accomplished by employing nursing personnel to increase monitoring, or with the use of automated monitoring equipment. Bellomo et al. showed that the deployment of electronic automated vital sign monitors on general hospital units was associated with improved utilization of RRTs, increased patient survival, and decreased time for vital sign measurement and recording.[36] Laurens and Dwyer found that implementation of medical emergency teams (METs) to respond to predefined MET activation criteria as observed by hospital staff resulted in reduced hospital mortality and reduced need for ICU transfer.[37] However, other investigators have observed that imperfect implementation of nursing‐performed observational monitoring resulted in no demonstrable benefit, illustrating the limitations of this approach.[38] Our findings suggest that nursing care of patients on general hospital units may be enhanced with the use of an EWS alert sent to the RRT. This is supported by the observation that communications between the RRT and the primary care teams was greater as was the use of telemetry and oximetry in the intervention arm. Moreover, there appears to have been a learning effect for the nursing staff that occurred on our study units, as evidenced by the increased number of RRT calls that occurred between 2009 and 2013. This change in nursing practices on these units certainly made it more difficult for us to observe outcome differences in our current study with the prescribed intervention, reinforcing the notion that evaluating an already established practice is a difficult proposition.[39]
Our study has several important limitations. First, the EWS alert was developed and validated at Barnes‐Jewish Hospital.[11, 12, 13, 14] We cannot say whether this alert will perform similarly in another hospital. Second, the EWS alert only contains data from medical patients. Development and validation of EWS alerts for other hospitalized populations, including surgical and pediatric patients, are needed to make such systems more generalizable. Third, the primary clinical outcome employed for this trial was problematic. Transfer to an ICU may not be an optimal outcome variable, as it may be desirable to transfer alerted patients to an ICU, which can be perceived to represent a soft landing for such patients once an alert has been generated. A better measure could be 30‐day all‐cause mortality, which would not be subject to clinician biases. Finally, we could not specifically identify explanations for the greater use of antibiotics in the control group despite similar rates of infection for both study arms. Future studies should closely evaluate the ability of EWS alerts to alter specific therapies (eg, reduce antibiotic utilization).
In summary, we have demonstrated that an EWS alert linked to a RRT likely contributed to a modest reduction in hospital length of stay, but no reductions in hospital mortality and ICU transfer. These findings suggest that inpatient deterioration on general hospital units can be identified and linked to a specific intervention. Continued efforts are needed to identify and implement systems that will not only accurately identify high‐risk patients on general hospital units but also intervene to improve their outcomes. We are moving forward with the development of a 2‐tiered EWS utilizing both EMR data and real‐time streamed vital sign data, to determine if we can further improve the prediction of clinical deterioration and potentially intervene in a more clinically meaningful manner.
Acknowledgements
The authors thank Ann Doyle, BSN, Lisa Mayfield, BSN, and Darain Mitchell for their assistance in carrying out this research protocol; and William Shannon, PhD, from the Division of General Medical Sciences at Washington University, for statistical support.
Disclosures: This study was funded in part by the Barnes‐Jewish Hospital Foundation, the Chest Foundation of the American College of Chest Physicians, and by grant number UL1 RR024992 from the National Center for Research Resources (NCRR), a component of the National Institutes of Health (NIH), and NIH Roadmap for Medical Research. Its contents are solely the responsibility of the authors and do not necessarily represent the official view of the NCRR or NIH. The steering committee was responsible for the study design, execution, analysis, and content of the article. The Barnes‐Jewish Hospital Foundation, the American College of Chest Physicians, and the Chest Foundation were not involved in the design, conduct, or analysis of the trial. The authors report no conflicts of interest. Marin Kollef, Yixin Chen, Kevin Heard, Gina LaRossa, Chenyang Lu, Nathan Martin, Nelda Martin, Scott Micek, and Thomas Bailey have all made substantial contributions to conception and design, or acquisition of data, or analysis and interpretation of data; have drafted the submitted article or revised it critically for important intellectual content; have provided final approval of the version to be published; and have agreed to be accountable for all aspects of the work in ensuring that questions related to the accuracy or integrity of any part of the work are appropriately investigated and resolved.
- , , , et al. Duration of life‐threatening antecedents prior to intensive care admission. Intensive Care Med. 2002;28(11):1629–1634.
- , , , et al. A comparison of antecedents to cardiac arrests, deaths and emergency intensive care admissions in Australia and New Zealand, and the United Kingdom—the ACADEMIA study. Resuscitation. 2004;62(3):275–282.
- , , . Abnormal vital signs are associated with an increased risk for critical events in US veteran inpatients. Resuscitation. 2009;80(11):1264–1269.
- , , , et al. Septic shock: an analysis of outcomes for patients with onset on hospital wards versus intensive care units. Crit Care Med. 1998;26(6):1020–1024.
- , , , , . Inpatient transfers to the intensive care unit: delays are associated with increased mortality and morbidity. J Gen Intern Med. 2003;18(2):77–83.
- , , , . Adverse outcomes associated with delayed intensive care unit transfers in an integrated healthcare system. J Hosp Med. 2012;7(3):224–230.
- , , , et al. Findings of the first consensus conference on medical emergency teams. Crit Care Med. 2006;34(9):2463–2478.
- , , , et al. “Identifying the hospitalised patient in crisis”—a consensus conference on the afferent limb of rapid response systems. Resuscitation. 2010;81(4):375–382.
- , , . Rapid‐response teams. N Engl J Med. 2011;365(2):139–146.
- , , , , . Acute care teams: a systematic review and meta‐analysis. Arch Intern Med. 2010;170(1):18–26.
- , , , et al. Toward a two‐tier clinical warning system for hospitalized patients. AMIA Annu Symp Proc. 2011;2011:511–519.
- , , , , , . Early prediction of septic shock in hospitalized patients. J Hosp Med. 2010;5(1):19–25.
- , , , et al. Implementation of a real‐time computerized sepsis alert in nonintensive care unit patients. Crit Care Med. 2011;39(3):469–473.
- , , , et al. A trial of a real‐time Alert for clinical deterioration in Patients hospitalized on general medical wards. J Hosp Med. 2013;8(5):236–242.
- , , , , . Prospective evaluation of a modified Early Warning Score to aid earlier detection of patients developing critical illness on a general surgical ward. Br J Anaesth. 2000;84:663P.
- , , , . Validation of a modified Early Warning Score in medical admissions. QJM. 2001;94(10):521–526.
- , , . Adapting a clinical comorbidity index for use with ICD‐9‐CM administrative databases. J Clin Epidemiol. 1992;45(6):613–619.
- , , , . Comorbidity measures for use with administrative data. Med Care. 1998;36(1):8–27.
- , , , . Unplanned transfers to a medical intensive care unit: causes and relationship to preventable errors in care. J Hosp Med. 2011;6(2):68–72.
- , , , , , . Unplanned transfers to the intensive care unit: the role of the shock index. J Hosp Med. 2010;5(8):460–465.
- , , , , , . Early detection of impending physiologic deterioration among patients who are not in intensive care: development of predictive models using data from an automated electronic medical record. J Hosp Med. 2012;7(5):388–395.
- Institute for Healthcare Improvement. Early warning systems: the next level of rapid response; 2011. Available at: http://www.ihi.org/Engage/Memberships/MentorHospitalRegistry/Pages/RapidResponseSystems.aspx. Accessed April 6, 2011.
- , . Do either early warning systems or emergency response teams improve hospital patient survival? A systematic review. Resuscitation. 2013;84(12):1652–1667.
- , , , et al. Introducing critical care outreach: a ward‐randomised trial of phased introduction in a general hospital. Intensive Care Med. 2004;30(7):1398–1404.
- . Out of our reach? Assessing the impact of introducing critical care outreach service. Anaesthesiology. 2003;58(9):882–885.
- , , . Effect of the critical care outreach team on patient survival to discharge from hospital and readmission to critical care: non‐randomised population based study. BMJ. 2003;327(7422):1014.
- , , . Reducing mortality and avoiding preventable ICU utilization: analysis of a successful rapid response program using APR DRGs. J Healthc Qual. 2011;33(5):7–16.
- , , , et al. Introduction of the medical emergency team (MET) system: a cluster‐randomised control trial. Lancet. 2005;365(9477):2091–2097.
- , , , , , . The impact of the introduction of critical care outreach services in England: a multicentre interrupted time‐series analysis. Crit Care. 2007;11(5):R113.
- , , , et al. Systematic review and evaluation of physiological track and trigger warning systems for identifying at‐risk patients on the ward. Intensive Care Med. 2007;33(4):667–679.
- , , , . Timing and teamwork—an observational pilot study of patients referred to a Rapid Response Team with the aim of identifying factors amenable to re‐design of a Rapid Response System. Resuscitation. 2012;83(6):782–787.
- , , , , , . The impact of rapid response team on outcome of patients transferred from the ward to the ICU: a single‐center study. Crit Care Med. 2013;41(10):2284–2291.
- , , , . Rapid response: a quality improvement conundrum. J Hosp Med. 2009;4(4):255–257.
- . Rapid response systems now established at 2,900 hospitals. Hospitalist News. 2010;3:1.
- , , . Early warning systems. Hosp Chron. 2012;7:37–43.
- , , , et al. A controlled trial of electronic automated advisory vital signs monitoring in general hospital wards. Crit Care Med. 2012;40(8):2349–2361.
- , . The impact of medical emergency teams on ICU admission rates, cardiopulmonary arrests and mortality in a regional hospital. Resuscitation. 2011;82(6):707–712.
- , , . Imperfect implementation of an early warning scoring system in a danish teaching hospital: a cross‐sectional study. PLoS One. 2013;8:e70068.
- , . Introduction of medical emergency teams in Australia and New Zealand: A multicentre study. Crit Care. 2008;12(3):151.
Patients deemed suitable for care on a general hospital unit are not expected to deteriorate; however, triage systems are not perfect, and some patients on general nursing units do develop critical illness during their hospitalization. Fortunately, there is mounting evidence that deteriorating patients exhibit measurable pathologic changes that could possibly be used to identify them prior to significant adverse outcomes, such as cardiac arrest.[1, 2, 3] Given the evidence that unplanned intensive care unit (ICU) transfers of patients on general units result in worse outcomes than more controlled ICU admissions,[1, 4, 5, 6] it is logical to assume that earlier identification of a deteriorating patient could provide a window of opportunity to prevent adverse outcomes.
The most commonly proposed systematic solution to the problem of identifying and stabilizing deteriorating patients on general hospital units includes some combination of an early warning system (EWS) to detect the deterioration and a rapid response team (RRT) to deal with it.[7, 8, 9, 10] We previously demonstrated that a relatively simple hospital‐specific method for generating EWS alerts derived from the electronic medical record (EMR) database is capable of predicting clinical deterioration and the need for ICU transfer, as well as hospital mortality, in non‐ICU patients admitted to general inpatient medicine units.[11, 12, 13, 14] However, our data also showed that simply providing the EWS alerts to these nursing units did not result in any demonstrable improvement in patient outcomes.[14] Therefore, we set out to determine whether linking real‐time EWS alerts to an intervention and notification of the RRT for patient evaluation could improve the outcomes of patients cared for on general inpatient units.
METHODS
Study Location
The study was conducted on 8 adult inpatient medicine units of Barnes‐Jewish Hospital, a 1250‐bed academic medical center in St. Louis, MO (January 15, 2013May 9, 2013). Patient care on the inpatient medicine units is delivered by either attending hospitalist physicians or dedicated housestaff physicians under the supervision of an attending physician. Continuous electronic vital sign monitoring is not provided on these units. The study was approved by the Washington University School of Medicine Human Studies Committee, and informed consent was waived. This was a nonblinded study (
Patients and Procedures
Patients admitted to the 8 medicine units received usual care during the study except as noted below. Manually obtained vital signs, laboratory data, and pharmacy data inputted in real time into the EMR were continuously assessed. The EWS searched for the 36 input variables previously described[11, 14] from the EMR for all patients admitted to the 8 medicine units 24 hours per day and 7 days a week. Values for every continuous parameter were scaled so that all measurements lay in the interval (0, 1) and were normalized by the minimum and maximum of the parameter as previously described.[14] To capture the temporal effects in our data, we retained a sliding window of all the collected data points within the last 24 hours. We then subdivided these data into a series of 6 sequential buckets of 4 hours each. We excluded the 2 hours of data prior to ICU transfer in building the model (so the data were 26 hours to 2 hours prior to ICU transfer for ICU transfer patients, and the first 24 hours of admission for everyone else). Eligible patients were selected for study entry when they triggered an alert for clinical deterioration as determined by the EWS.[11, 14]
The EWS alert was implemented in an internally developed, Java‐based clinical decision support rules engine, which identified when new data relevant to the model were available in a real‐time central data repository. In a clinical application, it is important to capture unusual changes in vital‐sign data over time. Such changes may precede clinical deterioration by hours, providing a chance to intervene if detected early enough. In addition, not all readings in time‐series data should be treated equally; the value of some kinds of data may change depending on their age. For example, a patient's condition may be better reflected by a blood‐oxygenation reading collected 1 hour ago than a reading collected 12 hours ago. This is the rationale for our use of a sliding window of all collected data points within the last 24 hours performed on a real‐time basis to determine the alert status of the patient.[11, 14]
We applied various threshold cut points to convert the EWS alert predictions into binary values and compared the results against the actual ICU transfer outcome.[14] A threshold of 0.9760 for specificity was chosen to achieve a sensitivity of approximately 40%. These operating characteristics were chosen in turn to generate a manageable number of alerts per hospital nursing unit per day (estimated at 12 per nursing unit per day). At this cut point, the C statistic was 0.8834, with an overall accuracy of 0.9292. In other words, our EWS alert system is calibrated so that for every 1000 patient discharges per year from these 8 hospital units, there would be 75 patients generating an alert, of which 30 patients would be expected to have the study outcome (ie, clinical deterioration requiring ICU transfer).
Once patients on the study units were identified as at risk for clinical deterioration by the EWS, they were assigned by a computerized random number generator to the intervention group or the control group. The control group was managed according to the usual care provided on the medicine units. The EWS alerts generated for the control patients were electronically stored, but these alerts were not sent to the RRT nurse, instead they were hidden from all clinical staff. The intervention group had their EWS alerts sent real time to the nursing member of the hospital's RRT. The RRT is composed of a registered nurse, a second‐ or third‐year internal medicine resident, and a respiratory therapist. The RRT was introduced in 2009 for the study units involved in this investigation. For 2009, 2010, and 2011 the RRT nurse was pulled from the staff of 1 of the hospital's ICUs in a rotating manner to respond to calls to the RRT as they occurred. Starting in 2012, the RRT nurse was established as a dedicated position without other clinical responsibilities. The RRT nurse carries a hospital‐issued mobile phone, to which the automated alert messages were sent real time, and was instructed to respond to all EWS alerts within 20 minutes of their receipt.
The RRT nurse would initially evaluate the alerted intervention patients using the Modified Early Warning Score[15, 16] and make further clinical and triage decisions based on those criteria and discussions with the RRT physician or the patient's treating physicians. The RRT focused their interventions using an internally developed tool called the Four Ds (discuss goals of care, drugs needing to be administered, diagnostics needing to be performed, and damage control with the use of oxygen, intravenous fluids, ventilation, and blood products). Patients evaluated by the RRT could have their current level of care maintained, have the frequency of vital sign monitoring increased, be transferred to an ICU, or have a code blue called for emergent resuscitation. The RRT reviewed goals of care for all patients to determine the appropriateness of interventions, especially for patients near the end of life who did not desire intensive care interventions. Nursing staff on the hospital units could also make calls to the RRT for patient evaluation at any time based on their clinical assessments performed during routine nursing rounds.
The primary efficacy outcome was the need for ICU transfer. Secondary outcome measures were hospital mortality and hospital length of stay. Pertinent demographic, laboratory, and clinical data were gathered prospectively including age, gender, race, underlying comorbidities, and severity of illness assessed by the Charlson comorbidity score and Elixhauser comorbidities.[17, 18]
Statistical Analysis
We required a sample size of 514 patients (257 per group) to achieve 80% power at a 5% significance level, based on the superiority design, a baseline event rate for ICU transfer of 20.0%, and an absolute reduction of 8.0% (PS Power and Sample Size Calculations, version 3.0, Vanderbilt Biostatistics, Nashville, TN). Continuous variables were reported as means with standard deviations or medians with 25th and 75th percentiles according to their distribution. The Student t test was used when comparing normally distributed data, and the Mann‐Whitney U test was employed to analyze non‐normally distributed data (eg, hospital length of stay). Categorical data were expressed as frequency distributions, and the [2] test was used to determine if differences existed between groups. A P value <0.05 was regarded as statistically significant. An interim analysis was planned for the data safety monitoring board to evaluate patient safety after 50% of the patients were recruited. The primary analysis was by intention to treat. Analyses were performed using SPSS version 11.0 for Windows (SPSS, Inc., Chicago, IL).
Data Safety Monitoring Board
An independent data safety and monitoring board was convened to monitor the study and to review and approve protocol amendments by the steering committee.
RESULTS
Between January 15, 2013 and May 9, 2013, there were 4731 consecutive patients admitted to the 8 inpatient units and electronically screened as the base population for this investigation. Five hundred seventy‐one (12.1%) patients triggered an alert and were enrolled into the study (Figure 1). There were 286 patients assigned to the intervention group and 285 assigned to the control group. No patients were lost to follow‐up. Demographics, reason for hospital admission, and comorbidities of the 2 groups were similar (Table 1). The number of patients having a separate RRT call by the primary nursing team on the hospital units within 24 hours of generating an alert was greater for the intervention group but did not reach statistical significance (19.9% vs 16.5%; odds ratio: 1.260; 95% confidence interval [CI]: 0.8231.931). Table 2 provides the new diagnostic and therapeutic interventions initiated within 24 hours after a EWS alert was generated. Patients in the intervention group were significantly more likely to have their primary care team physician notified by an RRT nurse regarding medical condition issues and to have oximetry and telemetry started, whereas control patients were significantly more likely to have new antibiotic orders written within 24 hours of generating an alert.
| Variable | Intervention Group, n=286 | Control Group, n=285 | P Value |
|---|---|---|---|
| Age, y | 63.7 16.0 | 63.1 15.4 | 0.495 |
| Gender, n (%) | |||
| Male | 132 (46.2) | 140 (49.1) | 0.503 |
| Female | 154 (53.8) | 145 (50.9) | |
| Race, n (%) | |||
| Caucasian | 155 (54.2) | 154 (54.0) | 0.417 |
| African American | 105 (36.7) | 113 (39.6) | |
| Other | 26 (9.1) | 18 (6.3) | |
| Reason for hospital admission | |||
| Cardiac | 12 (4.2) | 15 (5.3) | 0.548 |
| Pulmonary | 64 (22.4) | 72 (25.3) | 0.418 |
| Underlying malignancy | 6 (2.1) | 3 (1.1) | 0.504 |
| Renal disease | 31 (10.8) | 22 (7.7) | 0.248 |
| Thromboembolism | 4 (1.4) | 5 (1.8) | 0.752 |
| Infection | 55 (19.2) | 50 (17.5) | 0.603 |
| Neurologic disease | 33 (11.5) | 22 (7.7) | 0.122 |
| Intra‐abdominal disease | 41 (14.3) | 47 (16.5) | 0.476 |
| Hematologic condition | 4 (1.4) | 5 (1.8) | 0.752 |
| Endocrine disorder | 12 (4.2) | 6 (2.1) | 0.153 |
| Source of hospital admission | |||
| Emergency department | 201 (70.3) | 203 (71.2) | 0.200 |
| Direct admission | 36 (12.6) | 46 (16.1) | |
| Hospital transfer | 49 (17.1) | 36 (12.6) | |
| Charlson score | 6.7 3.6 | 6.6 3.2 | 0.879 |
| Elixhauser comorbidities score | 7.4 3.5 | 7.5 3.4 | 0.839 |
| Variable | Intervention Group, n=286 | Control Group, n=285 | P Value |
|---|---|---|---|
| |||
| Medications, n (%) | |||
| Antibiotics | 92 (32.2) | 121 (42.5) | 0.011 |
| Antiarrhythmics | 48 (16.8) | 44 (15.4) | 0.662 |
| Anticoagulants | 83 (29.0) | 97 (34.0) | 0.197 |
| Diuretics/antihypertensives | 71 (24.8) | 55 (19.3) | 0.111 |
| Bronchodilators | 78 (27.3) | 73 (25.6) | 0.653 |
| Anticonvulsives | 26 (9.1) | 27 (9.5) | 0.875 |
| Sedatives/narcotics | 0 (0.0) | 1 (0.4) | 0.499 |
| Respiratory support, n (%) | |||
| Noninvasive ventilation | 17 (6.0) | 9 (3.1) | 0.106 |
| Escalated oxygen support | 12 (4.2) | 7 (2.5) | 0.247 |
| Enhanced vital signs, n (%) | 50 (17.5) | 47 (16.5) | 0.752 |
| Maintenance intravenous fluids, n (%) | 48 (16.8) | 41 (14.4) | 0.430 |
| Vasopressors, n (%) | 57 (19.9) | 61 (21.4) | 0.664 |
| Bolus intravenous fluids, n (%) | 7 (2.4) | 14 (4.9) | 0.118 |
| Telemetry, n (%) | 198 (69.2) | 176 (61.8) | 0.052 |
| Oximetry, n (%) | 20 (7.0) | 6 (2.1) | 0.005 |
| New intravenous access, n (%) | 26 (9.1) | 35 (12.3) | 0.217 |
| Primary care team physician called by RRT nurse, n (%) | 82 (28.7) | 56 (19.6) | 0.012 |
Fifty‐one patients (17.8%) randomly assigned to the intervention group required ICU transfer compared with 52 of 285 patients (18.2%) in the control group (odds ratio: 0.972; 95% CI: 0.6351.490; P=0.898) (Table 3). Twenty‐one patients (7.3%) randomly assigned to the intervention group expired during their hospitalization compared with 22 of 285 patients (7.7%) in the control group (odds ratio: 0.947; 95%CI: 0.5091.764; P=0.865). Hospital length of stay was 8.49.5 days (median, 4.5 days; interquartile range, 2.311.4 days) for patients randomized to the intervention group and 9.411.1 days (median, 5.3 days; interquartile range, 3.211.2 days) for patients randomized to the control group (P=0.038). The ICU length of stay was 4.86.6 days (median, 2.9 days; interquartile range, 1.76.5 days) for patients randomized to the intervention group and 5.86.4 days (median, 2.9 days; interquartile range, 1.57.4) for patients randomized to the control group (P=0.812).The number of patients requiring transfer to a nursing home or long‐term acute care hospital was similar for patients in the intervention and control groups (26.9% vs 26.3%; odds ratio: 1.032; 95% CI: 0.7121.495; P=0.870). Similarly, the number of patients requiring hospital readmission before 30 days and 180 days, respectively, was similar for the 2 treatment groups (Table 3). For the combined study population, the EWS alerts were triggered 94138 hours (median, 27 hours; interquartile range, 7132 hours) prior to ICU transfer and 250204 hours (median200 hours; interquartile range, 54347 hours) prior to hospital mortality. The number of RRT calls for the 8 medicine units studied progressively increased from the start of the RRT program in 2009 through 2013 (121 in 2009, 194 in 2010, 298 in 2011, 415 in 2012, 415 in 2013; P<0.001 for the trend).
| Outcome | Intervention Group, n=286 | Control Group, n=285 | P Value |
|---|---|---|---|
| |||
| ICU transfer, n (%) | 51 (17.8) | 52 (18.2) | 0.898 |
| All‐cause hospital mortality, n (%) | 21 (7.3) | 22 (7.7) | 0.865 |
| Transfer to nursing home or LTAC, n (%) | 77 (26.9) | 75 (26.3) | 0.870 |
| 30‐day readmission, n (%) | 53 (18.5) | 62 (21.8) | 0.337 |
| 180‐day readmission, n (%) | 124 (43.4) | 117 (41.1) | 0.577 |
| Hospital length of stay, d* | 8.49.5, 4.5 [2.311.4] | 9.411.1, 5.3 [3.211.2] | 0.038 |
| ICU length of stay, d* | 4.86.6, 2.9 [1.76.5] | 5.86.4, 2.9 [1.57.4] | 0.812 |
DISCUSSION
We demonstrated that a real‐time EWS alert sent to a RRT nurse was associated with a modest reduction in hospital length of stay, but similar rates of hospital mortality, ICU transfer, and subsequent need for placement in a long‐term care setting compared with usual care. We also found the number of RRT calls to have increased progressively from 2009 to the present on the study units examined.
Unplanned ICU transfers occurring as early as within 8 hours of hospitalization are relatively common and associated with increased mortality.[6] Bapoje et al. evaluated a total of 152 patients over 1 year who had unplanned ICU transfers.[19] The most common reason was worsening of the problem for which the patient was admitted (48%). Other investigators have also attempted to identify predictors for clinical deterioration resulting in unplanned ICU transfer that could be employed in an EWS.[20, 21] Organizations like the Institute for Healthcare Improvement have called for the development and routine implementation of EWSs to direct the activities of RRTs and improve outcomes.[22] However, a recent systematic review found that much of the evidence in support of EWSs and emergency response teams is of poor quality and lacking prospective randomized trials.[23]
Our earlier experience demonstrated that simply providing an alert to nursing units did not result in any demonstrable improvements in the outcomes of high‐risk patients identified by our EWS.[14] Previous investigations have also had difficulty in demonstrating consistent outcome improvements with the use of EWSs and RRTs.[24, 25, 26, 27, 28, 29, 30, 31, 32] As a result of mandates from quality improvement organizations, most US hospitals currently employ RRTs for emergent mobilization of resources when a clinically deteriorating patient is identified on a hospital ward.[33, 34] Linking RRT actions with a validated real‐time alert may represent a way of improving the overall effectiveness of such teams for monitoring general hospital units, short of having all hospitalized patients in units staffed and monitored to provide higher levels of supervision (eg, ICUs, step‐down units).[9, 35]
An alternative approach to preventing patient deterioration is to provide closer overall monitoring. This has been accomplished by employing nursing personnel to increase monitoring, or with the use of automated monitoring equipment. Bellomo et al. showed that the deployment of electronic automated vital sign monitors on general hospital units was associated with improved utilization of RRTs, increased patient survival, and decreased time for vital sign measurement and recording.[36] Laurens and Dwyer found that implementation of medical emergency teams (METs) to respond to predefined MET activation criteria as observed by hospital staff resulted in reduced hospital mortality and reduced need for ICU transfer.[37] However, other investigators have observed that imperfect implementation of nursing‐performed observational monitoring resulted in no demonstrable benefit, illustrating the limitations of this approach.[38] Our findings suggest that nursing care of patients on general hospital units may be enhanced with the use of an EWS alert sent to the RRT. This is supported by the observation that communications between the RRT and the primary care teams was greater as was the use of telemetry and oximetry in the intervention arm. Moreover, there appears to have been a learning effect for the nursing staff that occurred on our study units, as evidenced by the increased number of RRT calls that occurred between 2009 and 2013. This change in nursing practices on these units certainly made it more difficult for us to observe outcome differences in our current study with the prescribed intervention, reinforcing the notion that evaluating an already established practice is a difficult proposition.[39]
Our study has several important limitations. First, the EWS alert was developed and validated at Barnes‐Jewish Hospital.[11, 12, 13, 14] We cannot say whether this alert will perform similarly in another hospital. Second, the EWS alert only contains data from medical patients. Development and validation of EWS alerts for other hospitalized populations, including surgical and pediatric patients, are needed to make such systems more generalizable. Third, the primary clinical outcome employed for this trial was problematic. Transfer to an ICU may not be an optimal outcome variable, as it may be desirable to transfer alerted patients to an ICU, which can be perceived to represent a soft landing for such patients once an alert has been generated. A better measure could be 30‐day all‐cause mortality, which would not be subject to clinician biases. Finally, we could not specifically identify explanations for the greater use of antibiotics in the control group despite similar rates of infection for both study arms. Future studies should closely evaluate the ability of EWS alerts to alter specific therapies (eg, reduce antibiotic utilization).
In summary, we have demonstrated that an EWS alert linked to a RRT likely contributed to a modest reduction in hospital length of stay, but no reductions in hospital mortality and ICU transfer. These findings suggest that inpatient deterioration on general hospital units can be identified and linked to a specific intervention. Continued efforts are needed to identify and implement systems that will not only accurately identify high‐risk patients on general hospital units but also intervene to improve their outcomes. We are moving forward with the development of a 2‐tiered EWS utilizing both EMR data and real‐time streamed vital sign data, to determine if we can further improve the prediction of clinical deterioration and potentially intervene in a more clinically meaningful manner.
Acknowledgements
The authors thank Ann Doyle, BSN, Lisa Mayfield, BSN, and Darain Mitchell for their assistance in carrying out this research protocol; and William Shannon, PhD, from the Division of General Medical Sciences at Washington University, for statistical support.
Disclosures: This study was funded in part by the Barnes‐Jewish Hospital Foundation, the Chest Foundation of the American College of Chest Physicians, and by grant number UL1 RR024992 from the National Center for Research Resources (NCRR), a component of the National Institutes of Health (NIH), and NIH Roadmap for Medical Research. Its contents are solely the responsibility of the authors and do not necessarily represent the official view of the NCRR or NIH. The steering committee was responsible for the study design, execution, analysis, and content of the article. The Barnes‐Jewish Hospital Foundation, the American College of Chest Physicians, and the Chest Foundation were not involved in the design, conduct, or analysis of the trial. The authors report no conflicts of interest. Marin Kollef, Yixin Chen, Kevin Heard, Gina LaRossa, Chenyang Lu, Nathan Martin, Nelda Martin, Scott Micek, and Thomas Bailey have all made substantial contributions to conception and design, or acquisition of data, or analysis and interpretation of data; have drafted the submitted article or revised it critically for important intellectual content; have provided final approval of the version to be published; and have agreed to be accountable for all aspects of the work in ensuring that questions related to the accuracy or integrity of any part of the work are appropriately investigated and resolved.
- , , , et al. Duration of life‐threatening antecedents prior to intensive care admission. Intensive Care Med. 2002;28(11):1629–1634.
- , , , et al. A comparison of antecedents to cardiac arrests, deaths and emergency intensive care admissions in Australia and New Zealand, and the United Kingdom—the ACADEMIA study. Resuscitation. 2004;62(3):275–282.
- , , . Abnormal vital signs are associated with an increased risk for critical events in US veteran inpatients. Resuscitation. 2009;80(11):1264–1269.
- , , , et al. Septic shock: an analysis of outcomes for patients with onset on hospital wards versus intensive care units. Crit Care Med. 1998;26(6):1020–1024.
- , , , , . Inpatient transfers to the intensive care unit: delays are associated with increased mortality and morbidity. J Gen Intern Med. 2003;18(2):77–83.
- , , , . Adverse outcomes associated with delayed intensive care unit transfers in an integrated healthcare system. J Hosp Med. 2012;7(3):224–230.
- , , , et al. Findings of the first consensus conference on medical emergency teams. Crit Care Med. 2006;34(9):2463–2478.
- , , , et al. “Identifying the hospitalised patient in crisis”—a consensus conference on the afferent limb of rapid response systems. Resuscitation. 2010;81(4):375–382.
- , , . Rapid‐response teams. N Engl J Med. 2011;365(2):139–146.
- , , , , . Acute care teams: a systematic review and meta‐analysis. Arch Intern Med. 2010;170(1):18–26.
- , , , et al. Toward a two‐tier clinical warning system for hospitalized patients. AMIA Annu Symp Proc. 2011;2011:511–519.
- , , , , , . Early prediction of septic shock in hospitalized patients. J Hosp Med. 2010;5(1):19–25.
- , , , et al. Implementation of a real‐time computerized sepsis alert in nonintensive care unit patients. Crit Care Med. 2011;39(3):469–473.
- , , , et al. A trial of a real‐time Alert for clinical deterioration in Patients hospitalized on general medical wards. J Hosp Med. 2013;8(5):236–242.
- , , , , . Prospective evaluation of a modified Early Warning Score to aid earlier detection of patients developing critical illness on a general surgical ward. Br J Anaesth. 2000;84:663P.
- , , , . Validation of a modified Early Warning Score in medical admissions. QJM. 2001;94(10):521–526.
- , , . Adapting a clinical comorbidity index for use with ICD‐9‐CM administrative databases. J Clin Epidemiol. 1992;45(6):613–619.
- , , , . Comorbidity measures for use with administrative data. Med Care. 1998;36(1):8–27.
- , , , . Unplanned transfers to a medical intensive care unit: causes and relationship to preventable errors in care. J Hosp Med. 2011;6(2):68–72.
- , , , , , . Unplanned transfers to the intensive care unit: the role of the shock index. J Hosp Med. 2010;5(8):460–465.
- , , , , , . Early detection of impending physiologic deterioration among patients who are not in intensive care: development of predictive models using data from an automated electronic medical record. J Hosp Med. 2012;7(5):388–395.
- Institute for Healthcare Improvement. Early warning systems: the next level of rapid response; 2011. Available at: http://www.ihi.org/Engage/Memberships/MentorHospitalRegistry/Pages/RapidResponseSystems.aspx. Accessed April 6, 2011.
- , . Do either early warning systems or emergency response teams improve hospital patient survival? A systematic review. Resuscitation. 2013;84(12):1652–1667.
- , , , et al. Introducing critical care outreach: a ward‐randomised trial of phased introduction in a general hospital. Intensive Care Med. 2004;30(7):1398–1404.
- . Out of our reach? Assessing the impact of introducing critical care outreach service. Anaesthesiology. 2003;58(9):882–885.
- , , . Effect of the critical care outreach team on patient survival to discharge from hospital and readmission to critical care: non‐randomised population based study. BMJ. 2003;327(7422):1014.
- , , . Reducing mortality and avoiding preventable ICU utilization: analysis of a successful rapid response program using APR DRGs. J Healthc Qual. 2011;33(5):7–16.
- , , , et al. Introduction of the medical emergency team (MET) system: a cluster‐randomised control trial. Lancet. 2005;365(9477):2091–2097.
- , , , , , . The impact of the introduction of critical care outreach services in England: a multicentre interrupted time‐series analysis. Crit Care. 2007;11(5):R113.
- , , , et al. Systematic review and evaluation of physiological track and trigger warning systems for identifying at‐risk patients on the ward. Intensive Care Med. 2007;33(4):667–679.
- , , , . Timing and teamwork—an observational pilot study of patients referred to a Rapid Response Team with the aim of identifying factors amenable to re‐design of a Rapid Response System. Resuscitation. 2012;83(6):782–787.
- , , , , , . The impact of rapid response team on outcome of patients transferred from the ward to the ICU: a single‐center study. Crit Care Med. 2013;41(10):2284–2291.
- , , , . Rapid response: a quality improvement conundrum. J Hosp Med. 2009;4(4):255–257.
- . Rapid response systems now established at 2,900 hospitals. Hospitalist News. 2010;3:1.
- , , . Early warning systems. Hosp Chron. 2012;7:37–43.
- , , , et al. A controlled trial of electronic automated advisory vital signs monitoring in general hospital wards. Crit Care Med. 2012;40(8):2349–2361.
- , . The impact of medical emergency teams on ICU admission rates, cardiopulmonary arrests and mortality in a regional hospital. Resuscitation. 2011;82(6):707–712.
- , , . Imperfect implementation of an early warning scoring system in a danish teaching hospital: a cross‐sectional study. PLoS One. 2013;8:e70068.
- , . Introduction of medical emergency teams in Australia and New Zealand: A multicentre study. Crit Care. 2008;12(3):151.
© 2014 Society of Hospital Medicine
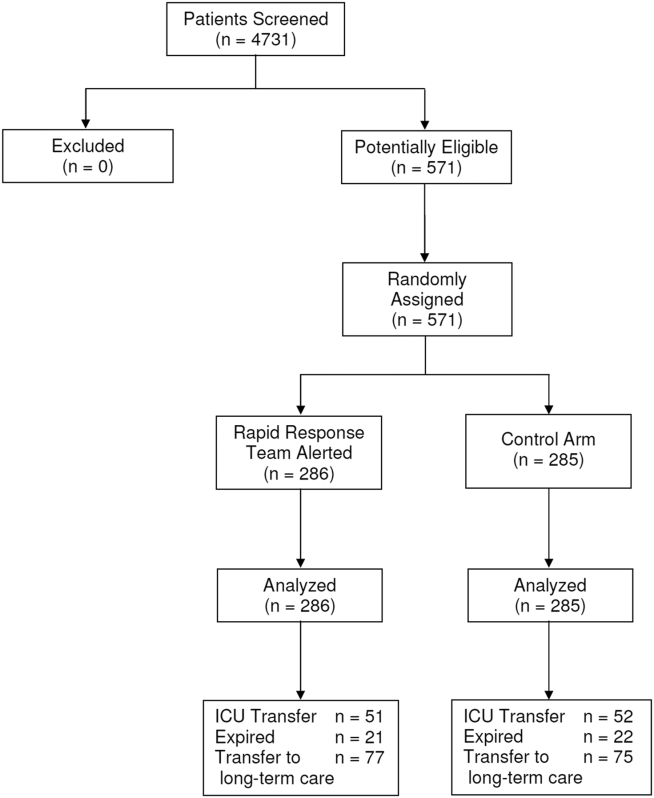
Deterioration Alerts on Medical Wards
Timely interventions are essential in the management of complex medical conditions such as new‐onset sepsis in order to prevent rapid progression to severe sepsis and septic shock.[1, 2, 3, 4, 5] Similarly, rapid identification and appropriate treatment of other medical and surgical conditions have been associated with improved outcomes.[6, 7, 8] We previously developed a real‐time, computerized prediction tool (PT) using recursive partitioning regression tree analysis for the identification of impending sepsis for use on general hospital wards.[9] We also showed that implementation of a real‐time computerized sepsis alert on hospital wards based on the PT resulted in increased use of early interventions, including antibiotic escalation, intravenous fluids, oxygen therapy, and diagnostics in patients identified as at risk.[10]
The first goal of this study was to develop an updated PT for use on hospital wards that could be used to predict subsequent global clinical deterioration and the need for a higher level of care. The second goal was to determine whether simply providing a real‐time alert to nursing staff based on the updated PT resulted in any demonstrable changes in patient outcomes.
METHODS
Study Location
The study was conducted at Barnes‐Jewish Hospital, a 1250‐bed academic medical center in St. Louis, Missouri. Eight adult medicine wards were assessed from July 2007 through December 2011. The medicine wards are closed areas with patient care delivered by dedicated house staff physicians under the supervision of a board‐certified attending physician. The study was approved by the Washington University School of Medicine Human Studies Committee.
Study Period
The period from July 2007 through January 2010 was used to train and retrospectively test the prediction model. The period from January 2011 through December 2011 was used to prospectively validate the model during a randomized trial using alerts generated from the prediction model.
Patients
Electronically captured clinical data were housed in a centralized clinical data repository. This repository cataloged 28,927 hospital visits from 19,116 distinct patients between July 2007 and January 2010. It contained a rich set of demographic and medical data for each of the visits, such as patient age, manually collected vital‐sign data, pharmacy data, laboratory data, and intensive care unit (ICU) transfer. This study served as a proof of concept for our vision of using machine learning to identify at‐risk patients and ultimately to perform real‐time event detection and interventions.
Algorithm Overview
Details regarding the predictive model development have been previously described.[11] To predict ICU transfer for patients housed on general medical wards, we used logistic regression, employing a novel framework to analyze the data stream from each patient, assigning scores to reflect the probability of ICU transfer to each patient.
Before building the model, several preprocessing steps were applied to eliminate outliers and find an appropriate representation of patients' states. For each of 36 input variables we specified acceptable ranges based on the domain knowledge of the medical experts on our team. For any value that was outside of the medically conceivable range, we replaced it by the mean value for that patient, if available. Values for every continuous parameter were scaled so that all measurements lay in the interval [0, 1] and were normalized by the minimum and maximum of the parameter. To capture the temporal effects in our data, we retained a sliding window of all the collected data points within the last 24 hours. We then subdivided these data into a series of 6 sequential buckets of 4 hours each.
To capture variations within a bucket, we computed 3 values for each feature in the bucket: the minimum, maximum, and mean data points. Each of the resulting 3n values was input to the logistic regression equation as separate variables. To deal with missing data points within the buckets, we used the patients' most recent reading from any time earlier in the hospital stay, if available. If no prior values existed, we used mean values calculated over the entire historical dataset. Bucket 6 max/min/mean represents the most recent 4‐hour window from the preceding 24‐hour time period for the maximum, minimum, and mean values, respectively. By itself, logistic regression does not operate on time‐series data. That is, each variable input to the logistic equation corresponds to exactly 1 data point (eg, a blood‐pressure variable would consist of a single blood‐pressure reading). In a clinical application, however, it is important to capture unusual changes in vital‐sign data over time. Such changes may precede clinical deterioration by hours, providing a chance to intervene if detected early enough. In addition, not all readings in time‐series data should be treated equally; the value of some kinds of data may change depending on their age. For example, a patient's condition may be better reflected by a blood‐oxygenation reading collected 1 hour ago than a reading collected 12 hours ago. This is the rationale for our use of a sliding window of all collected data points within the last 24 hours performed in a real‐time basis.
The algorithm was first implemented in MATLAB (Natick, MA). For the purposes of training, we used a single 24‐hour window of data from each patient. For patients admitted to ICU, this window was 26 hours to 2 hours prior to ICU admission; for all other patients, this window consisted of the first 24 hours of their hospital stay. The dataset's 36 input variables were divided into buckets and min/mean/max features wherever applicable, resulting in 398 variables. The first half of the dataset was used to train the model. We then used the second half of the dataset as the validation dataset. We generated a predicted outcome for each case in the validation data, using the model parameter coefficients derived from the training data. We also employed bootstrap aggregation to improve classification accuracy and to address overfitting. We then applied various threshold cut‐points to convert these predictions into binary values and compared the results against the ICU transfer outcome. A threshold of 0.9760 for specificity was chosen to achieve a sensitivity of approximately 40%. These operating characteristics were chosen in turn to generate a manageable number of alerts per hospital nursing unit per day (estimated at 12 per nursing unit per day). At this cut‐point the C‐statistic was 0.8834, with an overall accuracy of 0.9292.
In order to train the logistic model, we used a single 24‐hour window of data for each patient. However, in a system that predicts patients' outcomes in real time, scores are recomputed each time new data are entered into the database. Hence, patients have a series of scores over the length of their hospital stay, and an alert is triggered when any one of these scores is above the chosen threshold.
Once the model was developed, we implemented it in an internally developed, Java‐based clinical decision support rules engine, which identified when new data relevant to the model were available in a real‐time central data repository. The rules engine queried the data repository to acquire all data needed to evaluate the model. The score was calculated with each relevant new data point, and an alert was generated when the score exceeded the cut‐point threshold. We then prospectively validated these alerts on patients on 8 general medical wards at Barnes Jewish Hospital. Details regarding the architecture of our clinical decision support system have been previously published.[12] The sensitivity and positive predictive values for ICU transfer for these alerts were tracked during an intervention trial that ran from January 24, 2011, through December 31, 2011. Four general medical wards were randomized to the intervention group and 4 wards were randomized to the control group. The 8 general medical wards were ordered according to their alert rates based upon the historical data from July 2007 through January 2010, creating 4 pairs of wards in ascending order of alert rate. Within each of the 4 pairs, 1 member of the pair was randomized to the intervention group and the other to the control group using a random number generator.
Real‐time automated alerts generated 24 hours per day, 7 days per week from the predictive algorithm were sent to the charge‐nurse pager on the intervention units. Alerts were also generated and stored in the database on the control units, but these alerts were not sent to the charge nurse on those units. The alerts were sent to the charge nurses on the respective wards, as these individuals were thought to be in the best position to perform the initial assessment of the alerted patients, especially during evening hours when physician staffing was reduced. The charge nurses assessed the intervention‐group patients and were instructed to contact the responsible physician (hospitalist or internal medicine house officer) to inform them of the alert, or to call the rapid response team (RRT) if the patient's condition already appeared to be significantly deteriorating.
Descriptive statistics for algorithm sensitivity and positive predictive value and for patient outcomes were performed. Associations between alerts and the primary outcome, ICU transfer, were determined, as well as the impact of alerts in the intervention group compared with the control group, using [2] tests. The same analyses were performed for patient death. Differences in length of stay (LOS) were assessed using the Wilcoxon rank sum test.
RESULTS
Predictive Model
The variables with the greatest coefficients contributing to the PT model included respiratory rate, oxygen saturation, shock index, systolic blood pressure, anticoagulation use, heart rate, and diastolic blood pressure. A complete list of variables is provided in the Appendix (see Supporting Information in the online version of this article). All but 1 are routinely collected vital‐sign measures, and all but 1 occur in the 4‐hour period immediately prior to the alert (bucket 6).
Prospective Trial
Patient characteristics are presented in Table 1. Patients were well matched for race, sex, age, and underlying diagnoses. All alerts reported to the charge nurses were to be associated with a call from the charge nurse to the responsible physician caring for the alerted patient. The mean number of alerts per alerted patient was 1.8 (standard deviation=1.7). Patients meeting the alert threshold were at nearly 5.3‐fold greater risk of ICU transfer (95% confidence interval [CI]: 4.6‐6.0) than those not satisfying the alert threshold (358 of 2353 [15.2%; 95% CI: 13.8%‐16.7%] vs 512 of 17678 [2.9%; 95% CI: 2.7%‐3.2%], respectively; P<0.0001). Patients with alerts were at 8.9‐fold greater risk of death (95% CI: 7.4‐10.7) than those without alerts (244 of 2353 [10.4%; 95% CI: 9.2%‐11.7%] vs 206 of 17678 [1.2%; 95% CI: 1.0%‐1.3%], respectively; P<0.0001). Operating characteristics of the PT from the prospective trial are shown in Table 2. Alerts occurred a median of 25.5 hours prior to ICU transfer (interquartile range, 7.00‐81.75) and 8 hours prior to death (interquartile range, 4.09‐15.66).
| Study Group | ||||||
|---|---|---|---|---|---|---|
| Control (N=10,120) | Intervention (N=9911) | |||||
| ||||||
| Race | N | % | N | % | ||
| White | 5,062 | 50 | 4,934 | 50 | ||
| Black | 4,864 | 48 | 4,790 | 48 | ||
| Other | 194 | 2 | 187 | 2 | ||
| Sex | ||||||
| F | 5,355 | 53 | 5,308 | 54 | ||
| M | 4,765 | 47 | 4,603 | 46 | ||
| Age at discharge, median (IQR), y | 57 (4469) | 57 (4470) | ||||
| Top 10 ICD‐9 descriptions and counts, n (%) | ||||||
| 1 | Diseases of the digestive system | 1,774 (17.5) | Diseases of the digestive system | 1,664 (16.7) | ||
| 2 | Diseases of the circulatory system | 1,252 (12.4) | Diseases of the circulatory system | 1,253 (12.6) | ||
| 3 | Diseases of the respiratory system | 1,236 (12.2) | Diseases of the respiratory system | 1,210 (12.2) | ||
| 4 | Injury and poisoning | 864 (8.5) | Injury and poisoning | 849 (8.6) | ||
| 5 | Endocrine, nutritional, and metabolic diseases, and immunity disorders | 797 (7.9) | Diseases of the genitourinary system | 795 (8.0) | ||
| 6 | Diseases of the genitourinary system | 762 (7.5) | Endocrine, nutritional, and metabolic diseases, and immunity disorders | 780 (7.9) | ||
| 7 | Infectious and parasitic diseases | 555 (5.5) | Infectious and parasitic diseases | 549 (5.5) | ||
| 8 | Neoplasms | 547 (5.4) | Neoplasms | 465 (4.7) | ||
| 9 | Diseases of the blood and blood‐forming organs | 426 (4.2) | Diseases of the blood and blood‐forming organs | 429 (4.3) | ||
| 10 | Symptoms, signs, and ill‐defined conditions and factors influencing health status | 410 (4.1) | Diseases of the musculoskeletal system and connective tissue | 399 (4.0) | ||
| Sensitivity, % | Specificity, % | PPV, % | NPV, % | Positive Likelihood Ratio | Negative Likelihood Ratio | |||
|---|---|---|---|---|---|---|---|---|
| ||||||||
| ICU Transfer | Yes (N=870) | No (N=19,161) | ||||||
| Alert | 358 | 1,995 | 41.1 (95% CI: 37.944.5) | 89.6 (95% CI: 89.290.0) | 15.2 (95% CI: 13.816.7) | 97.1 (95% CI: 96.897.3) | 3.95 (95% CI: 3.614.30) | 0.66 (95% CI: 0.620.70) |
| No Alert | 512 | 17,166 | ||||||
| Death | Yes (N=450) | No (N=19,581) | ||||||
| Alert | 244 | 2109 | 54.2 (95% CI: 49.658.8) | 89.2 (95% CI: 88.889.7) | 10.4 (95% CI: 9.211.7) | 98.8 (95% CI: 98.799.0) | 5.03 (95% CI: 4.585.53) | 0.51 (95% CI: 0.460.57) |
| No Alert | 206 | 17,472 | ||||||
Among patients identified by the PT, there were no differences in the proportion of patients who were transferred to the ICU or who died in the intervention group as compared with the control group (Table 3). In addition, although there was no difference in LOS in the intervention group compared with the control group, identification by the PT was associated with a significantly longer median LOS (7.01 days vs 2.94 days, P<0.001). The largest numbers of patients who were transferred to the ICU or died did so in the first hospital day, and 60% of patients who were transferred to the ICU did so in the first 4 days, whereas deaths were more evenly distributed across the hospital stay.
| Outcomes by Alert Statusa | ||||||||
|---|---|---|---|---|---|---|---|---|
| Alert Study Group | No‐Alert Study Group | |||||||
| Intervention, N=1194 | Control, N=1159 | Intervention, N=8717 | Control, N=8961 | |||||
| N | % | N | % | N | % | N | % | |
| ||||||||
| ICU Transfer | ||||||||
| Yes | 192 | 16 | 166 | 14 | 252 | 3 | 260 | 3 |
| No | 1002 | 84 | 993 | 86 | 8465 | 97 | 8701 | 97 |
| Death | ||||||||
| Yes | 127 | 11 | 117 | 10 | 96 | 1 | 110 | 1 |
| No | 1067 | 89 | 1042 | 90 | 8621 | 99 | 8851 | 99 |
| LOS from admit to discharge, median (IQR), da | 7.07 (3.9912.15) | 6.92 (3.8212.67) | 2.97 (1.775.33) | 2.91 (1.745.19) | ||||
DISCUSSION
We have demonstrated that a relatively simple hospital‐specific method for generating a PT derived from routine laboratory and hemodynamic values is capable of predicting clinical deterioration and the need for ICU transfer, as well as hospital mortality, in non‐ICU patients admitted to general hospital wards. We also found that the PT identified a sicker patient population as manifest by longer hospital LOS. The methods used in generating this real‐time PT are relatively simple and easily executed with the use of an electronic medical record (EMR) system. However, our data also showed that simply providing an alert to nursing units based on the PT did not result in any demonstrable improvement in patient outcomes. Moreover, our PT and intervention in their current form have substantial limitations, including low sensitivity and positive predictive value, high possibility of alert fatigue, and no clear clinical impact. These limitations suggest that this approach has limited applicability in its current form.
Unplanned ICU transfers occurring as early as within 8 hours of hospitalization are relatively common and associated with increased mortality.[13] Bapoje et al evaluated a total of 152 patients over 1 year who had unplanned ICU transfers.[14] The most common reason was worsening of the problem for which the patient was admitted (48%). Other investigators have also attempted to identify predictors for clinical deterioration resulting in unplanned ICU transfer that could be employed in a PT or early warning system (EWS). Keller et al evaluated 50 consecutive general medical patients with unplanned ICU transfers between 2003 and 2004.[15] Using a case‐control methodology, these investigators found shock index values>0.85 to be the best predictor for subsequent unplanned ICU transfer (P<0.02; odds ratio: 3.0).
Organizations such as the Institute for Healthcare Improvement have called for the development and implementation of EWSs in order to direct the activities of RRTs and improve outcomes.[16] Escobar et al carried out a retrospective case‐control study using as the unit of analysis 12‐hour patient shifts on hospital wards.[17] Using logistic regression and split validation, they developed a PT for ICU transfer from clinical variables available in their EMR. The EMR derived PT had a C‐statistic of 0.845 in the derivation dataset and 0.775 in the validation dataset, concluding that EMR‐based detection of impending deterioration outside the ICU is feasible in integrated healthcare delivery systems.
We found that simply providing an alert to nursing units did not result in any demonstrable improvements in the outcomes of high‐risk patients identified by our PT. This may have been due to simply relying on the alerted nursing staff to make phone calls to physicians and not linking a specific and effective patient‐directed intervention to the PT. Other investigators have similarly observed that the use of an EWS or PT may not result in outcome improvements.[18] Gao et al performed an analysis of 31 studies describing hospital track and trigger EWSs.[19] They found little evidence of reliability, validity, and utility of these systems. Peebles et al showed that even when high‐risk non‐ICU patients are identified, delays in providing appropriate therapies occur, which may explain the lack of efficacy of EWSs and RRTs.[20] These observations suggest that there is currently a paucity of validated interventions available to improve outcome in deteriorating patients, despite our ability to identify patients who are at risk for such deterioration.
As a result of mandates from quality‐improvement organizations, most US hospitals currently employ RRTs for emergent mobilization of resources when a clinically deteriorating patient is identified on a hospital ward.[21] However, as noted above, there is limited evidence to suggest that RRTs contribute to improved patient outcomes.[22, 23, 24, 25, 26, 27] The potential importance of this is reflected in a recent report suggesting that 2900 US hospitals now have rapid‐response systems in place without clear demonstration of their overall efficacy.[28] Linking rapid‐response interventions with a validated real‐time alert may represent a way of improving the effectiveness of such interventions.[29, 30, 31, 32, 33, 34] Our data showed that hospital LOS was statistically longer among alerted patients compared with nonalerted patients. This supports the conclusion that the alerts helped identify a sicker group of patients, but the nursing alerts did not appear to change outcomes. This finding also seems to refute the hypothesis that simply linking an intervention to a PT will improve outcomes, albeit the intervention we employed may not have been robust enough to influence patient outcomes.
The development of accurate real‐time EWSs holds the potential to identify patients at risk for clinical deterioration at an earlier point in time when rescue interventions can be implemented in a potentially more effective manner in both adults and children.[35] Unfortunately, the ideal intervention to be applied in this situation is unknown. Our experience suggests that successful interventions will require a more integrated approach than simply providing an alert with general management principles. As a result of our experience, we are undertaking a randomized clinical trial in 2013 to determine whether linking a patient‐specific intervention to a PT will result in improved outcomes. The intervention we will be testing is to have the RRT immediately notified about alerted patients so as to formally evaluate them and to determine the need for therapeutic interventions, and to administer such interventions as needed and/or transfer the alerted patients to a higher level of care as deemed necessary. Additionally, we are updating our PT with more temporal data to determine if this will improve its accuracy. One of these updates will include linking the PT to wirelessly obtained continuous oximetry and heart‐rate data, using minimally intrusive sensors, to establish a 2‐tiered EWS.[11]
Our study has several important limitations. First, the PT was developed using local data, and thus the results may not be applicable to other settings. However, our model shares many of the characteristics identified in other clinical‐deterioration PTs.[15, 17] Second, the positive prediction value of 15.2% for ICU transfer may not be clinically useful due to the large number of false‐positive results. Moreover, the large number of false positives could result in alert fatigue, causing alerts to be ignored. Third, although the charge nurses were supposed to call the responsible physicians for the alerted patients, we did not determine whether all these calls occurred or whether they resulted in any meaningful changes in monitoring or patient treatment. This is important because lack of an effective intervention or treatment would make the intervention group much more like our control group. Future studies are needed to assess the impact of an integrated intervention (eg, notification of experienced RRT members with adequate resource access) to determine if patient outcomes can be impacted by the use of an EWS. Finally, we did not compare the performance of our PT to other models such as the modified early warning score (MEWS).
An additional limitation to consider is that our PT offered no new information to the nurse manager, or the PT did not change the opinions of the charge nurses. This is supported by a recent study of 63 serious adverse outcomes in a Belgian teaching hospital where death was the final outcome.[36] Survey results revealed that nurses were often unaware that their patients were deteriorating before the crisis. Nurses also reported threshold levels for concern for abnormal vital signs that suggested they would call for assistance relatively late in clinical crises. The limited ability of nursing staff to identify deteriorating patients is also supported by a recent simulation study demonstrating that nurses did identify that patients were deteriorating, but as each patient deteriorated staff performance declined, with a reduction in all observational records and actions.[37]
In summary, we have demonstrated that a relatively simple hospital‐specific PT could accurately identify patients on general medicine wards who subsequently developed clinical deterioration and the need for ICU transfer, as well as hospital mortality. However, no improvements in patient outcomes were found from reporting this information to nursing wards on a real‐time basis. The low positive predictive value of the alerts, local development of the EWS, and absence of improved outcomes substantially limits the broader application of this system in its current form. Continued efforts are needed to identify and implement systems that will not only accurately identify high‐risk patients on general wards but also intervene to improve their outcomes.
Acknowledgments
Disclosures: This study was funded in part by the Barnes‐Jewish Hospital Foundation and by Grant No. UL1 RR024992 from the National Center for Research Resources (NCRR), a component of the National Institutes of Health (NIH), and the NIH Roadmap for Medical Research. Its contents are solely the responsibility of the authors and do not necessarily represent the official view of NCRR or NIH.
- , , , et al. Improvement in process of care and outcome after a multicenter severe sepsis educational program in Spain. JAMA. 2008;299:2294–2303.
- , , , et al. Early goal‐directed therapy in the treatment of severe sepsis and septic shock. N Engl J Med. 2001;345:1368–1377.
- , , , et al. Before‐after study of a standardized hospital order set for the management of septic shock. Crit Care Med. 2007;34:2707–2713.
- , , . Surviving Sepsis Campaign: international guidelines for management of severe sepsis and septic shock: 2008. Crit Care Med. 2008;36:296–327.
- , , , et al. Septic shock: an analysis of outcomes for patients with onset on hospital wards versus intensive care units. Crit Care Med. 1998;26:1020–1024.
- , , , , . Inpatient transfers to the intensive care unit: delays are associated with increased mortality and morbidity. J Gen Intern Med. 2003;18:77–83.
- , , , , , . Causes and effects of surgical delay in patients with hip fracture: a cohort study. Ann Intern Med. 2011;155:226–233.
- , , , . Comprehensive stroke centers overcome the weekend versus weekday gap in stroke treatment and mortality. Stroke. 2011;42:2403–2409.
- , , , , , . Hospital‐wide impact of a standardized order set for the management of bacteremic severe sepsis. Crit Care Med. 2009;37:819–824.
- , , , et al. Implementation of a real‐time computerized sepsis alert in non–intensive care unit patients. Crit Care Med. 2011;39:469–473.
- , , , et al. Toward a two‐tier clinical warning system for hospitalized patients. AMIA Annu Symp Proc. 2011;2011:511–519.
- , , , , , . Migrating toward a next‐generation clinical decision support application: the BJC HealthCare experience. AMIA Annu Symp Proc. 2007;344–348.
- , , , . Adverse outcomes associated with delayed intensive care unit transfers in an integrated healthcare system. J Hosp Med. 2011;7:224–230.
- , , , . Unplanned transfers to a medical intensive care unit: causes and relationship to preventable errors in care. J Hosp Med. 2011;6:68–72.
- , , , , , . Unplanned transfers to the intensive care unit: the role of the shock index. J Hosp Med. 2010;5:460–465.
- Institute for Healthcare Improvement. Early warning systems: the next level of rapid response. Available at: http://www.ihi.org/IHI/Programs/AudioAndWebPrograms/ExpeditionEarlyWarningSystemsTheNextLevelofRapidResponse.htmplayerwmp. Accessed April 6, 2011.
- , , , , , . Early detection of impending physiologic deterioration among patients who are not in intensive care: development of predictive models using data from an automated electronic medical record. J Hosp Med. 2012;7:388–395.
- , , . Early warning systems: the next level of rapid response. Nursing. 2012;42:38–44.
- , , , et al. Systematic review and evaluation of physiological track and trigger warning systems for identifying at‐risk patients on the ward. Intensive Care Med. 2007;33:667–679.
- , , , . Timing and teamwork—an observational pilot study of patients referred to a Rapid Response Team with the aim of identifying factors amenable to re‐design of a Rapid Response System. Resuscitation. 2012;83:782–787.
- , , , . Rapid response: a quality improvement conundrum. J Hosp Med. 2009;4:255–257.
- , , , et al. Introducing critical care outreach: a ward‐randomised trial of phased introduction in a general hospital. Intensive Care Med. 2004;30:1398–1404.
- . Out of our reach? Assessing the impact of introducing critical care outreach service. Anaesthesiology. 2003;58:882–885.
- , , . Effect of the critical care outreach team on patient survival to discharge from hospital and readmission to critical care: non‐randomised population based study. BMJ. 2003;327:1014–1016.
- , , . Reducing mortality and avoiding preventable ICU utilization: analysis of a successful rapid response program using APR DRGs [published online ahead of print March 10, 2010]. J Healthc Qual. doi: 10.1111/j.1945‐1474.2010.00084.x.
- , , , et al. Introduction of the medical emergency team (MET) system: a cluster‐randomised control trial. Lancet. 2005;365:2091–2097.
- , , , , , . The impact of the introduction of critical care outreach services in England: a multicentre interrupted time‐series analysis. Crit Care. 2007;11:R113.
- . Rapid response systems now established at 2,900 hospitals. Hospitalist News. March 2010;3:1.
- , , , , . Rapid response teams: a systematic review and meta‐analysis. Arch Intern Med. 2010;170:18–26.
- , , , et al. Outreach and early warning systems (EWS) for the prevention of intensive care admission and death of critically ill adult patients on general hospital wards. Cochrane Database Syst Rev. 2007;3:CD005529.
- , , . Rapid‐response teams. N Engl J Med. 2011;365:139–146.
- , , . Early warning systems. Hosp Chron. 2012;7(suppl 1):37–43.
- , , , et al. Grand challenges in clinical decision support. J Biomed Inform. 2008;41(2):387–392.
- , , , et al. Utility of commonly captured data from an EHR to identify hospitalized patients at risk for clinical deterioration. AMIA Annu Symp Proc. 2007;404–408.
- , , , , , . Sensitivity of the pediatric early warning score to identify patient deterioration. Pediatrics. 2010;125(4)e763–e769.
- , , , . In‐hospital mortality after serious adverse events on medical and surgical nursing units: a mixed methods study [published online ahead of print July 24, 2012]. J Clin Nurs. doi: 10.1111/j.1365‐2702.2012.04154.x.
- , , , et al. Managing deteriorating patients: registered nurses' performance in a simulated setting. Open Nurs J. 2011;5:120–126.
Timely interventions are essential in the management of complex medical conditions such as new‐onset sepsis in order to prevent rapid progression to severe sepsis and septic shock.[1, 2, 3, 4, 5] Similarly, rapid identification and appropriate treatment of other medical and surgical conditions have been associated with improved outcomes.[6, 7, 8] We previously developed a real‐time, computerized prediction tool (PT) using recursive partitioning regression tree analysis for the identification of impending sepsis for use on general hospital wards.[9] We also showed that implementation of a real‐time computerized sepsis alert on hospital wards based on the PT resulted in increased use of early interventions, including antibiotic escalation, intravenous fluids, oxygen therapy, and diagnostics in patients identified as at risk.[10]
The first goal of this study was to develop an updated PT for use on hospital wards that could be used to predict subsequent global clinical deterioration and the need for a higher level of care. The second goal was to determine whether simply providing a real‐time alert to nursing staff based on the updated PT resulted in any demonstrable changes in patient outcomes.
METHODS
Study Location
The study was conducted at Barnes‐Jewish Hospital, a 1250‐bed academic medical center in St. Louis, Missouri. Eight adult medicine wards were assessed from July 2007 through December 2011. The medicine wards are closed areas with patient care delivered by dedicated house staff physicians under the supervision of a board‐certified attending physician. The study was approved by the Washington University School of Medicine Human Studies Committee.
Study Period
The period from July 2007 through January 2010 was used to train and retrospectively test the prediction model. The period from January 2011 through December 2011 was used to prospectively validate the model during a randomized trial using alerts generated from the prediction model.
Patients
Electronically captured clinical data were housed in a centralized clinical data repository. This repository cataloged 28,927 hospital visits from 19,116 distinct patients between July 2007 and January 2010. It contained a rich set of demographic and medical data for each of the visits, such as patient age, manually collected vital‐sign data, pharmacy data, laboratory data, and intensive care unit (ICU) transfer. This study served as a proof of concept for our vision of using machine learning to identify at‐risk patients and ultimately to perform real‐time event detection and interventions.
Algorithm Overview
Details regarding the predictive model development have been previously described.[11] To predict ICU transfer for patients housed on general medical wards, we used logistic regression, employing a novel framework to analyze the data stream from each patient, assigning scores to reflect the probability of ICU transfer to each patient.
Before building the model, several preprocessing steps were applied to eliminate outliers and find an appropriate representation of patients' states. For each of 36 input variables we specified acceptable ranges based on the domain knowledge of the medical experts on our team. For any value that was outside of the medically conceivable range, we replaced it by the mean value for that patient, if available. Values for every continuous parameter were scaled so that all measurements lay in the interval [0, 1] and were normalized by the minimum and maximum of the parameter. To capture the temporal effects in our data, we retained a sliding window of all the collected data points within the last 24 hours. We then subdivided these data into a series of 6 sequential buckets of 4 hours each.
To capture variations within a bucket, we computed 3 values for each feature in the bucket: the minimum, maximum, and mean data points. Each of the resulting 3n values was input to the logistic regression equation as separate variables. To deal with missing data points within the buckets, we used the patients' most recent reading from any time earlier in the hospital stay, if available. If no prior values existed, we used mean values calculated over the entire historical dataset. Bucket 6 max/min/mean represents the most recent 4‐hour window from the preceding 24‐hour time period for the maximum, minimum, and mean values, respectively. By itself, logistic regression does not operate on time‐series data. That is, each variable input to the logistic equation corresponds to exactly 1 data point (eg, a blood‐pressure variable would consist of a single blood‐pressure reading). In a clinical application, however, it is important to capture unusual changes in vital‐sign data over time. Such changes may precede clinical deterioration by hours, providing a chance to intervene if detected early enough. In addition, not all readings in time‐series data should be treated equally; the value of some kinds of data may change depending on their age. For example, a patient's condition may be better reflected by a blood‐oxygenation reading collected 1 hour ago than a reading collected 12 hours ago. This is the rationale for our use of a sliding window of all collected data points within the last 24 hours performed in a real‐time basis.
The algorithm was first implemented in MATLAB (Natick, MA). For the purposes of training, we used a single 24‐hour window of data from each patient. For patients admitted to ICU, this window was 26 hours to 2 hours prior to ICU admission; for all other patients, this window consisted of the first 24 hours of their hospital stay. The dataset's 36 input variables were divided into buckets and min/mean/max features wherever applicable, resulting in 398 variables. The first half of the dataset was used to train the model. We then used the second half of the dataset as the validation dataset. We generated a predicted outcome for each case in the validation data, using the model parameter coefficients derived from the training data. We also employed bootstrap aggregation to improve classification accuracy and to address overfitting. We then applied various threshold cut‐points to convert these predictions into binary values and compared the results against the ICU transfer outcome. A threshold of 0.9760 for specificity was chosen to achieve a sensitivity of approximately 40%. These operating characteristics were chosen in turn to generate a manageable number of alerts per hospital nursing unit per day (estimated at 12 per nursing unit per day). At this cut‐point the C‐statistic was 0.8834, with an overall accuracy of 0.9292.
In order to train the logistic model, we used a single 24‐hour window of data for each patient. However, in a system that predicts patients' outcomes in real time, scores are recomputed each time new data are entered into the database. Hence, patients have a series of scores over the length of their hospital stay, and an alert is triggered when any one of these scores is above the chosen threshold.
Once the model was developed, we implemented it in an internally developed, Java‐based clinical decision support rules engine, which identified when new data relevant to the model were available in a real‐time central data repository. The rules engine queried the data repository to acquire all data needed to evaluate the model. The score was calculated with each relevant new data point, and an alert was generated when the score exceeded the cut‐point threshold. We then prospectively validated these alerts on patients on 8 general medical wards at Barnes Jewish Hospital. Details regarding the architecture of our clinical decision support system have been previously published.[12] The sensitivity and positive predictive values for ICU transfer for these alerts were tracked during an intervention trial that ran from January 24, 2011, through December 31, 2011. Four general medical wards were randomized to the intervention group and 4 wards were randomized to the control group. The 8 general medical wards were ordered according to their alert rates based upon the historical data from July 2007 through January 2010, creating 4 pairs of wards in ascending order of alert rate. Within each of the 4 pairs, 1 member of the pair was randomized to the intervention group and the other to the control group using a random number generator.
Real‐time automated alerts generated 24 hours per day, 7 days per week from the predictive algorithm were sent to the charge‐nurse pager on the intervention units. Alerts were also generated and stored in the database on the control units, but these alerts were not sent to the charge nurse on those units. The alerts were sent to the charge nurses on the respective wards, as these individuals were thought to be in the best position to perform the initial assessment of the alerted patients, especially during evening hours when physician staffing was reduced. The charge nurses assessed the intervention‐group patients and were instructed to contact the responsible physician (hospitalist or internal medicine house officer) to inform them of the alert, or to call the rapid response team (RRT) if the patient's condition already appeared to be significantly deteriorating.
Descriptive statistics for algorithm sensitivity and positive predictive value and for patient outcomes were performed. Associations between alerts and the primary outcome, ICU transfer, were determined, as well as the impact of alerts in the intervention group compared with the control group, using [2] tests. The same analyses were performed for patient death. Differences in length of stay (LOS) were assessed using the Wilcoxon rank sum test.
RESULTS
Predictive Model
The variables with the greatest coefficients contributing to the PT model included respiratory rate, oxygen saturation, shock index, systolic blood pressure, anticoagulation use, heart rate, and diastolic blood pressure. A complete list of variables is provided in the Appendix (see Supporting Information in the online version of this article). All but 1 are routinely collected vital‐sign measures, and all but 1 occur in the 4‐hour period immediately prior to the alert (bucket 6).
Prospective Trial
Patient characteristics are presented in Table 1. Patients were well matched for race, sex, age, and underlying diagnoses. All alerts reported to the charge nurses were to be associated with a call from the charge nurse to the responsible physician caring for the alerted patient. The mean number of alerts per alerted patient was 1.8 (standard deviation=1.7). Patients meeting the alert threshold were at nearly 5.3‐fold greater risk of ICU transfer (95% confidence interval [CI]: 4.6‐6.0) than those not satisfying the alert threshold (358 of 2353 [15.2%; 95% CI: 13.8%‐16.7%] vs 512 of 17678 [2.9%; 95% CI: 2.7%‐3.2%], respectively; P<0.0001). Patients with alerts were at 8.9‐fold greater risk of death (95% CI: 7.4‐10.7) than those without alerts (244 of 2353 [10.4%; 95% CI: 9.2%‐11.7%] vs 206 of 17678 [1.2%; 95% CI: 1.0%‐1.3%], respectively; P<0.0001). Operating characteristics of the PT from the prospective trial are shown in Table 2. Alerts occurred a median of 25.5 hours prior to ICU transfer (interquartile range, 7.00‐81.75) and 8 hours prior to death (interquartile range, 4.09‐15.66).
| Study Group | ||||||
|---|---|---|---|---|---|---|
| Control (N=10,120) | Intervention (N=9911) | |||||
| ||||||
| Race | N | % | N | % | ||
| White | 5,062 | 50 | 4,934 | 50 | ||
| Black | 4,864 | 48 | 4,790 | 48 | ||
| Other | 194 | 2 | 187 | 2 | ||
| Sex | ||||||
| F | 5,355 | 53 | 5,308 | 54 | ||
| M | 4,765 | 47 | 4,603 | 46 | ||
| Age at discharge, median (IQR), y | 57 (4469) | 57 (4470) | ||||
| Top 10 ICD‐9 descriptions and counts, n (%) | ||||||
| 1 | Diseases of the digestive system | 1,774 (17.5) | Diseases of the digestive system | 1,664 (16.7) | ||
| 2 | Diseases of the circulatory system | 1,252 (12.4) | Diseases of the circulatory system | 1,253 (12.6) | ||
| 3 | Diseases of the respiratory system | 1,236 (12.2) | Diseases of the respiratory system | 1,210 (12.2) | ||
| 4 | Injury and poisoning | 864 (8.5) | Injury and poisoning | 849 (8.6) | ||
| 5 | Endocrine, nutritional, and metabolic diseases, and immunity disorders | 797 (7.9) | Diseases of the genitourinary system | 795 (8.0) | ||
| 6 | Diseases of the genitourinary system | 762 (7.5) | Endocrine, nutritional, and metabolic diseases, and immunity disorders | 780 (7.9) | ||
| 7 | Infectious and parasitic diseases | 555 (5.5) | Infectious and parasitic diseases | 549 (5.5) | ||
| 8 | Neoplasms | 547 (5.4) | Neoplasms | 465 (4.7) | ||
| 9 | Diseases of the blood and blood‐forming organs | 426 (4.2) | Diseases of the blood and blood‐forming organs | 429 (4.3) | ||
| 10 | Symptoms, signs, and ill‐defined conditions and factors influencing health status | 410 (4.1) | Diseases of the musculoskeletal system and connective tissue | 399 (4.0) | ||
| Sensitivity, % | Specificity, % | PPV, % | NPV, % | Positive Likelihood Ratio | Negative Likelihood Ratio | |||
|---|---|---|---|---|---|---|---|---|
| ||||||||
| ICU Transfer | Yes (N=870) | No (N=19,161) | ||||||
| Alert | 358 | 1,995 | 41.1 (95% CI: 37.944.5) | 89.6 (95% CI: 89.290.0) | 15.2 (95% CI: 13.816.7) | 97.1 (95% CI: 96.897.3) | 3.95 (95% CI: 3.614.30) | 0.66 (95% CI: 0.620.70) |
| No Alert | 512 | 17,166 | ||||||
| Death | Yes (N=450) | No (N=19,581) | ||||||
| Alert | 244 | 2109 | 54.2 (95% CI: 49.658.8) | 89.2 (95% CI: 88.889.7) | 10.4 (95% CI: 9.211.7) | 98.8 (95% CI: 98.799.0) | 5.03 (95% CI: 4.585.53) | 0.51 (95% CI: 0.460.57) |
| No Alert | 206 | 17,472 | ||||||
Among patients identified by the PT, there were no differences in the proportion of patients who were transferred to the ICU or who died in the intervention group as compared with the control group (Table 3). In addition, although there was no difference in LOS in the intervention group compared with the control group, identification by the PT was associated with a significantly longer median LOS (7.01 days vs 2.94 days, P<0.001). The largest numbers of patients who were transferred to the ICU or died did so in the first hospital day, and 60% of patients who were transferred to the ICU did so in the first 4 days, whereas deaths were more evenly distributed across the hospital stay.
| Outcomes by Alert Statusa | ||||||||
|---|---|---|---|---|---|---|---|---|
| Alert Study Group | No‐Alert Study Group | |||||||
| Intervention, N=1194 | Control, N=1159 | Intervention, N=8717 | Control, N=8961 | |||||
| N | % | N | % | N | % | N | % | |
| ||||||||
| ICU Transfer | ||||||||
| Yes | 192 | 16 | 166 | 14 | 252 | 3 | 260 | 3 |
| No | 1002 | 84 | 993 | 86 | 8465 | 97 | 8701 | 97 |
| Death | ||||||||
| Yes | 127 | 11 | 117 | 10 | 96 | 1 | 110 | 1 |
| No | 1067 | 89 | 1042 | 90 | 8621 | 99 | 8851 | 99 |
| LOS from admit to discharge, median (IQR), da | 7.07 (3.9912.15) | 6.92 (3.8212.67) | 2.97 (1.775.33) | 2.91 (1.745.19) | ||||
DISCUSSION
We have demonstrated that a relatively simple hospital‐specific method for generating a PT derived from routine laboratory and hemodynamic values is capable of predicting clinical deterioration and the need for ICU transfer, as well as hospital mortality, in non‐ICU patients admitted to general hospital wards. We also found that the PT identified a sicker patient population as manifest by longer hospital LOS. The methods used in generating this real‐time PT are relatively simple and easily executed with the use of an electronic medical record (EMR) system. However, our data also showed that simply providing an alert to nursing units based on the PT did not result in any demonstrable improvement in patient outcomes. Moreover, our PT and intervention in their current form have substantial limitations, including low sensitivity and positive predictive value, high possibility of alert fatigue, and no clear clinical impact. These limitations suggest that this approach has limited applicability in its current form.
Unplanned ICU transfers occurring as early as within 8 hours of hospitalization are relatively common and associated with increased mortality.[13] Bapoje et al evaluated a total of 152 patients over 1 year who had unplanned ICU transfers.[14] The most common reason was worsening of the problem for which the patient was admitted (48%). Other investigators have also attempted to identify predictors for clinical deterioration resulting in unplanned ICU transfer that could be employed in a PT or early warning system (EWS). Keller et al evaluated 50 consecutive general medical patients with unplanned ICU transfers between 2003 and 2004.[15] Using a case‐control methodology, these investigators found shock index values>0.85 to be the best predictor for subsequent unplanned ICU transfer (P<0.02; odds ratio: 3.0).
Organizations such as the Institute for Healthcare Improvement have called for the development and implementation of EWSs in order to direct the activities of RRTs and improve outcomes.[16] Escobar et al carried out a retrospective case‐control study using as the unit of analysis 12‐hour patient shifts on hospital wards.[17] Using logistic regression and split validation, they developed a PT for ICU transfer from clinical variables available in their EMR. The EMR derived PT had a C‐statistic of 0.845 in the derivation dataset and 0.775 in the validation dataset, concluding that EMR‐based detection of impending deterioration outside the ICU is feasible in integrated healthcare delivery systems.
We found that simply providing an alert to nursing units did not result in any demonstrable improvements in the outcomes of high‐risk patients identified by our PT. This may have been due to simply relying on the alerted nursing staff to make phone calls to physicians and not linking a specific and effective patient‐directed intervention to the PT. Other investigators have similarly observed that the use of an EWS or PT may not result in outcome improvements.[18] Gao et al performed an analysis of 31 studies describing hospital track and trigger EWSs.[19] They found little evidence of reliability, validity, and utility of these systems. Peebles et al showed that even when high‐risk non‐ICU patients are identified, delays in providing appropriate therapies occur, which may explain the lack of efficacy of EWSs and RRTs.[20] These observations suggest that there is currently a paucity of validated interventions available to improve outcome in deteriorating patients, despite our ability to identify patients who are at risk for such deterioration.
As a result of mandates from quality‐improvement organizations, most US hospitals currently employ RRTs for emergent mobilization of resources when a clinically deteriorating patient is identified on a hospital ward.[21] However, as noted above, there is limited evidence to suggest that RRTs contribute to improved patient outcomes.[22, 23, 24, 25, 26, 27] The potential importance of this is reflected in a recent report suggesting that 2900 US hospitals now have rapid‐response systems in place without clear demonstration of their overall efficacy.[28] Linking rapid‐response interventions with a validated real‐time alert may represent a way of improving the effectiveness of such interventions.[29, 30, 31, 32, 33, 34] Our data showed that hospital LOS was statistically longer among alerted patients compared with nonalerted patients. This supports the conclusion that the alerts helped identify a sicker group of patients, but the nursing alerts did not appear to change outcomes. This finding also seems to refute the hypothesis that simply linking an intervention to a PT will improve outcomes, albeit the intervention we employed may not have been robust enough to influence patient outcomes.
The development of accurate real‐time EWSs holds the potential to identify patients at risk for clinical deterioration at an earlier point in time when rescue interventions can be implemented in a potentially more effective manner in both adults and children.[35] Unfortunately, the ideal intervention to be applied in this situation is unknown. Our experience suggests that successful interventions will require a more integrated approach than simply providing an alert with general management principles. As a result of our experience, we are undertaking a randomized clinical trial in 2013 to determine whether linking a patient‐specific intervention to a PT will result in improved outcomes. The intervention we will be testing is to have the RRT immediately notified about alerted patients so as to formally evaluate them and to determine the need for therapeutic interventions, and to administer such interventions as needed and/or transfer the alerted patients to a higher level of care as deemed necessary. Additionally, we are updating our PT with more temporal data to determine if this will improve its accuracy. One of these updates will include linking the PT to wirelessly obtained continuous oximetry and heart‐rate data, using minimally intrusive sensors, to establish a 2‐tiered EWS.[11]
Our study has several important limitations. First, the PT was developed using local data, and thus the results may not be applicable to other settings. However, our model shares many of the characteristics identified in other clinical‐deterioration PTs.[15, 17] Second, the positive prediction value of 15.2% for ICU transfer may not be clinically useful due to the large number of false‐positive results. Moreover, the large number of false positives could result in alert fatigue, causing alerts to be ignored. Third, although the charge nurses were supposed to call the responsible physicians for the alerted patients, we did not determine whether all these calls occurred or whether they resulted in any meaningful changes in monitoring or patient treatment. This is important because lack of an effective intervention or treatment would make the intervention group much more like our control group. Future studies are needed to assess the impact of an integrated intervention (eg, notification of experienced RRT members with adequate resource access) to determine if patient outcomes can be impacted by the use of an EWS. Finally, we did not compare the performance of our PT to other models such as the modified early warning score (MEWS).
An additional limitation to consider is that our PT offered no new information to the nurse manager, or the PT did not change the opinions of the charge nurses. This is supported by a recent study of 63 serious adverse outcomes in a Belgian teaching hospital where death was the final outcome.[36] Survey results revealed that nurses were often unaware that their patients were deteriorating before the crisis. Nurses also reported threshold levels for concern for abnormal vital signs that suggested they would call for assistance relatively late in clinical crises. The limited ability of nursing staff to identify deteriorating patients is also supported by a recent simulation study demonstrating that nurses did identify that patients were deteriorating, but as each patient deteriorated staff performance declined, with a reduction in all observational records and actions.[37]
In summary, we have demonstrated that a relatively simple hospital‐specific PT could accurately identify patients on general medicine wards who subsequently developed clinical deterioration and the need for ICU transfer, as well as hospital mortality. However, no improvements in patient outcomes were found from reporting this information to nursing wards on a real‐time basis. The low positive predictive value of the alerts, local development of the EWS, and absence of improved outcomes substantially limits the broader application of this system in its current form. Continued efforts are needed to identify and implement systems that will not only accurately identify high‐risk patients on general wards but also intervene to improve their outcomes.
Acknowledgments
Disclosures: This study was funded in part by the Barnes‐Jewish Hospital Foundation and by Grant No. UL1 RR024992 from the National Center for Research Resources (NCRR), a component of the National Institutes of Health (NIH), and the NIH Roadmap for Medical Research. Its contents are solely the responsibility of the authors and do not necessarily represent the official view of NCRR or NIH.
- , , , et al. Improvement in process of care and outcome after a multicenter severe sepsis educational program in Spain. JAMA. 2008;299:2294–2303.
- , , , et al. Early goal‐directed therapy in the treatment of severe sepsis and septic shock. N Engl J Med. 2001;345:1368–1377.
- , , , et al. Before‐after study of a standardized hospital order set for the management of septic shock. Crit Care Med. 2007;34:2707–2713.
- , , . Surviving Sepsis Campaign: international guidelines for management of severe sepsis and septic shock: 2008. Crit Care Med. 2008;36:296–327.
- , , , et al. Septic shock: an analysis of outcomes for patients with onset on hospital wards versus intensive care units. Crit Care Med. 1998;26:1020–1024.
- , , , , . Inpatient transfers to the intensive care unit: delays are associated with increased mortality and morbidity. J Gen Intern Med. 2003;18:77–83.
- , , , , , . Causes and effects of surgical delay in patients with hip fracture: a cohort study. Ann Intern Med. 2011;155:226–233.
- , , , . Comprehensive stroke centers overcome the weekend versus weekday gap in stroke treatment and mortality. Stroke. 2011;42:2403–2409.
- , , , , , . Hospital‐wide impact of a standardized order set for the management of bacteremic severe sepsis. Crit Care Med. 2009;37:819–824.
- , , , et al. Implementation of a real‐time computerized sepsis alert in non–intensive care unit patients. Crit Care Med. 2011;39:469–473.
- , , , et al. Toward a two‐tier clinical warning system for hospitalized patients. AMIA Annu Symp Proc. 2011;2011:511–519.
- , , , , , . Migrating toward a next‐generation clinical decision support application: the BJC HealthCare experience. AMIA Annu Symp Proc. 2007;344–348.
- , , , . Adverse outcomes associated with delayed intensive care unit transfers in an integrated healthcare system. J Hosp Med. 2011;7:224–230.
- , , , . Unplanned transfers to a medical intensive care unit: causes and relationship to preventable errors in care. J Hosp Med. 2011;6:68–72.
- , , , , , . Unplanned transfers to the intensive care unit: the role of the shock index. J Hosp Med. 2010;5:460–465.
- Institute for Healthcare Improvement. Early warning systems: the next level of rapid response. Available at: http://www.ihi.org/IHI/Programs/AudioAndWebPrograms/ExpeditionEarlyWarningSystemsTheNextLevelofRapidResponse.htmplayerwmp. Accessed April 6, 2011.
- , , , , , . Early detection of impending physiologic deterioration among patients who are not in intensive care: development of predictive models using data from an automated electronic medical record. J Hosp Med. 2012;7:388–395.
- , , . Early warning systems: the next level of rapid response. Nursing. 2012;42:38–44.
- , , , et al. Systematic review and evaluation of physiological track and trigger warning systems for identifying at‐risk patients on the ward. Intensive Care Med. 2007;33:667–679.
- , , , . Timing and teamwork—an observational pilot study of patients referred to a Rapid Response Team with the aim of identifying factors amenable to re‐design of a Rapid Response System. Resuscitation. 2012;83:782–787.
- , , , . Rapid response: a quality improvement conundrum. J Hosp Med. 2009;4:255–257.
- , , , et al. Introducing critical care outreach: a ward‐randomised trial of phased introduction in a general hospital. Intensive Care Med. 2004;30:1398–1404.
- . Out of our reach? Assessing the impact of introducing critical care outreach service. Anaesthesiology. 2003;58:882–885.
- , , . Effect of the critical care outreach team on patient survival to discharge from hospital and readmission to critical care: non‐randomised population based study. BMJ. 2003;327:1014–1016.
- , , . Reducing mortality and avoiding preventable ICU utilization: analysis of a successful rapid response program using APR DRGs [published online ahead of print March 10, 2010]. J Healthc Qual. doi: 10.1111/j.1945‐1474.2010.00084.x.
- , , , et al. Introduction of the medical emergency team (MET) system: a cluster‐randomised control trial. Lancet. 2005;365:2091–2097.
- , , , , , . The impact of the introduction of critical care outreach services in England: a multicentre interrupted time‐series analysis. Crit Care. 2007;11:R113.
- . Rapid response systems now established at 2,900 hospitals. Hospitalist News. March 2010;3:1.
- , , , , . Rapid response teams: a systematic review and meta‐analysis. Arch Intern Med. 2010;170:18–26.
- , , , et al. Outreach and early warning systems (EWS) for the prevention of intensive care admission and death of critically ill adult patients on general hospital wards. Cochrane Database Syst Rev. 2007;3:CD005529.
- , , . Rapid‐response teams. N Engl J Med. 2011;365:139–146.
- , , . Early warning systems. Hosp Chron. 2012;7(suppl 1):37–43.
- , , , et al. Grand challenges in clinical decision support. J Biomed Inform. 2008;41(2):387–392.
- , , , et al. Utility of commonly captured data from an EHR to identify hospitalized patients at risk for clinical deterioration. AMIA Annu Symp Proc. 2007;404–408.
- , , , , , . Sensitivity of the pediatric early warning score to identify patient deterioration. Pediatrics. 2010;125(4)e763–e769.
- , , , . In‐hospital mortality after serious adverse events on medical and surgical nursing units: a mixed methods study [published online ahead of print July 24, 2012]. J Clin Nurs. doi: 10.1111/j.1365‐2702.2012.04154.x.
- , , , et al. Managing deteriorating patients: registered nurses' performance in a simulated setting. Open Nurs J. 2011;5:120–126.
Copyright © 2013 Society of Hospital Medicine
Severe Sepsis
Severe sepsis and septic shock are associated with excess mortality when inappropriate initial antimicrobial therapy, defined as an antimicrobial regimen that lacks in vitro activity against the isolated organism(s) responsible for the infection, is administered.14 Unfortunately, bacterial resistance to antibiotics is increasing and creates a therapeutic challenge for clinicians when treating patients with serious infections, such as severe sepsis. Increasing rates of bacterial resistance leads many clinicians to empirically treat critically ill patients with broad‐spectrum antibiotics, which can perpetuate the cycle of increasing resistance.5, 6 Conversely, inappropriate initial antimicrobial therapy can lead to treatment failures and adverse patient outcomes.7 Individuals with severe sepsis appear to be at particularly high risk of excess mortality when inappropriate initial antimicrobial therapy is administered.8, 9
The most recent Surviving Sepsis Guidelines recommend empiric combination therapy targeting Gram‐negative bacteria, particularly for patients with known or suspected Pseudomonas infections, as a means to decrease the likelihood of administering inappropriate initial antimicrobial therapy.10 However, the selection of an antimicrobial regimen that is active against the causative pathogen(s) is problematic, as the treating physician usually does not know the susceptibilities of the pathogen(s) for the selected empiric antibiotics. Therefore, we performed a study with the main goal of determining whether resistance to the initially prescribed antimicrobial regimen was associated with clinical outcome in patients with severe sepsis attributed to Gram‐negative bacteremia.
Materials and Methods
Study Location and Patients
This study was conducted at a university‐affiliated, urban teaching hospital: Barnes‐Jewish Hospital (1200 beds). During a 6‐year period (January 2002 to December 2007), all hospitalized patients with a positive blood culture for Gram‐negative bacteria, with antimicrobial susceptibility testing performed for the blood isolate(s), were eligible for this investigation. This study was approved by the Washington University School of Medicine Human Studies Committee.
Study Design and Data Collection
A retrospective cohort study design was employed. Two investigators (J.A.D., R.M.R.) identified potential study patients by the presence of a positive blood culture for Pseudomonas aeruginosa, Acinetobacter species, or Enterobacteriaceae (Escherichia coli, Klebsiella species, Enterobacter species) combined with primary or secondary International Classification of Diseases (ICD‐9‐CM) codes indicative of acute organ dysfunction, at least two criteria from the systemic inflammatory response syndrome (SIRS),10 and initial antibiotic treatment with either cefepime, piperacillin‐tazobactam, or a carbapenem (imipenem or meropenem). These antimicrobials represent the primary agents employed for the treatment of Gram‐negative infections at Barnes‐Jewish Hospital during the study period, and had to be administered within 12 hours of having the subsequently positive blood cultures drawn. Based on the initial study database construction, 3 investigators (E.C.W., J.K., M.P.) merged patient‐specific data from the automated hospital medical records, microbiology database, and pharmacy database of Barnes‐Jewish Hospital to complete the clinical database under the auspices of the definitions described below.
The baseline characteristics collected by the study investigators included: age, gender, race, the presence of congestive heart failure, chronic obstructive pulmonary disease, diabetes mellitus, chronic liver disease, underlying malignancy, and end‐stage renal disease requiring renal replacement therapy. All cause hospital mortality was evaluated as the primary outcome variable. Secondary outcomes included acquired organ dysfunction and hospital length of stay. The Acute Physiology and Chronic Health Evaluation (APACHE) II11 and Charlson co‐morbidity scores were also calculated during the 24 hours after the positive blood cultures were drawn. This was done because we included patients with community‐acquired infections who only had clinical data available after blood cultures were drawn.
Definitions
All definitions were selected prospectively as part of the original study design. Cases of Gram‐negative bacteremia were classified into mutually exclusive groups comprised of either community‐acquired or healthcare‐associated infection. Patients with healthcare‐associated bacteremia were categorized as community‐onset or hospital‐onset, as previously described.12 In brief, patients with healthcare‐associated community‐onset bacteremia had the positive culture obtained within the first 48 hours of hospital admission in combination with one or more of the following risk factors: (1) residence in a nursing home, rehabilitation hospital, or other long‐term nursing facility; (2) previous hospitalization within the immediately preceding 12 months; (3) receiving outpatient hemodialysis, peritoneal dialysis, wound care, or infusion therapy necessitating regular visits to a hospital‐based clinic; and (4) having an immune‐compromised state. Patients were classified as having healthcare‐associated hospital‐onset bacteremia when the culture was obtained 48 hours or more after admission. Community‐acquired bacteremia occurred in patients without healthcare risk factors and a positive blood culture within the first 48 hours of admission. Prior antibiotic exposure was defined as having occurred within the previous 30 days from the onset of severe sepsis.
To be included in the analysis, patients had to meet criteria for severe sepsis based on discharge ICD‐9‐CM codes for acute organ dysfunction, as previously described.13 The organs of interest included the heart, lungs, kidneys, bone marrow (hematologic), brain, and liver. Patients were classified as having septic shock if vasopressors (norepinephrine, dopamine, epinephrine, phenylephrine, or vasopressin) were initiated within 24 hours of the blood culture collection date and time. Empiric antimicrobial treatment was classified as being appropriate if the initially prescribed antibiotic regimen was active against the identified pathogen(s) based on in vitro susceptibility testing and administered within 12 hours following blood culture collection. Appropriate antimicrobial treatment also had to be prescribed for at least 24 hours. However, the total duration of antimicrobial therapy was at the discretion of the treating physicians. The Charlson co‐morbidity score was calculated using ICD‐9‐CM codes abstracted from the index hospitalization employing MS‐DRG Grouper version 26.
Antimicrobial Monitoring
From January 2002 through the present, Barnes‐Jewish Hospital utilized an antibiotic control program to help guide antimicrobial therapy. During this time, the use of cefepime and gentamicin was unrestricted. However, initiation of intravenous ciprofloxacin, imipenem/cilastatin, meropenem, or piperacillin/tazobactam was restricted and required preauthorization from either a clinical pharmacist or infectious diseases physician. Each intensive care unit (ICU) had a clinical pharmacist who reviewed all antibiotic orders to insure that dosing and interval of antibiotic administration was adequate for individual patients based on body size, renal function, and the resuscitation status of the patient. After daytime hours, the on‐call clinical pharmacist reviewed and approved the antibiotic orders. The initial antibiotic dosages for the antibiotics employed for the treatment of Gram‐negative infections at Barnes‐Jewish Hospital were as follows: cefepime, 1 to 2 grams every eight hours; pipercillin‐tazobactam, 4.5 grams every six hours; imipenem, 0.5 grams every six hours; meropenem, 1 gram every eight hours; ciprofloxacin, 400 mg every eight hours; gentamicin, 5 mg/kg once daily.
Starting in June 2005, a sepsis order set was implemented in the emergency department, general medical wards, and the intensive care units with the intent of standardizing empiric antibiotic selection for patients with sepsis based on the infection type (ie, community‐acquired pneumonia, healthcare‐associated pneumonia, intra‐abdominal infection, etc) and the hospital's antibiogram.14, 15 However, antimicrobial selection, dosing, and de‐escalation of therapy were still optimized by clinical pharmacists in these clinical areas.
Antimicrobial Susceptibility Testing
The microbiology laboratory performed antimicrobial susceptibility testing of the Gram‐negative blood isolates using the disk diffusion method according to guidelines and breakpoints established by the Clinical Laboratory and Standards Institute (CLSI) and published during the inclusive years of the study.16, 17 Zone diameters obtained by disk diffusion testing were converted to minimum inhibitory concentrations (MICs in mg/L) by linear regression analysis for each antimicrobial agent using the BIOMIC V3 antimicrobial susceptibility system (Giles Scientific, Inc., Santa Barbara, CA). Linear regression algorithms contained in the software of this system were determined by comparative studies correlating microbroth dilution‐determined MIC values with zone sizes obtained by disk diffusion testing.18
Data Analysis
Continuous variables were reported as mean the standard deviation, or median and quartiles. The Student's t test was used when comparing normally distributed data, and the MannWhitney U test was employed to analyze nonnormally distributed data. Categorical data were expressed as frequency distributions and the Chi‐squared test was used to determine if differences existed between groups. We performed multiple logistic regression analysis to identify clinical risk factors that were associated with hospital mortality (SPSS, Inc., Chicago, IL). All risk factors from Table 1, as well as the individual pathogens examined, were included in the corresponding multivariable analysis with the exception of acquired organ dysfunction (considered a secondary outcome). All tests were two‐tailed, and a P value <0.05 was determined to represent statistical significance.
| Variable | Hospital Survivors (n = 302) | Hospital Nonsurvivors (n = 233) | P value |
|---|---|---|---|
| |||
| Age, years | 57.9 16.2 | 60.3 15.8 | 0.091 |
| Male | 156 (51.7) | 132 (56.7) | 0.250 |
| Infection onset source | |||
| Community‐acquired | 31 (10.3) | 15 (6.4) | 0.005 |
| Healthcare‐associated community‐onset | 119 (39.4) | 68 (29.2) | |
| Healthcare‐associated hospital‐onset | 152 (50.3) | 150 (64.4) | |
| Underlying co‐morbidities | |||
| CHF | 43 (14.2) | 53 (22.7) | 0.011 |
| COPD | 42 (13.9) | 56 (24.0) | 0.003 |
| Chronic kidney disease | 31 (10.3) | 41 (17.6) | 0.014 |
| Liver disease | 34 (11.3) | 31 (13.3) | 0.473 |
| Active malignancy | 100 (33.1) | 83 (35.6) | 0.544 |
| Diabetes | 68 (22.5) | 50 (21.5) | 0.770 |
| Charlson co‐morbidity score | 4.5 3.5 | 5.2 3.9 | 0.041 |
| APACHE II score | 21.8 6.1 | 27.1 6.2 | <0.001 |
| ICU admission | 221 (73.2) | 216 (92.7) | <0.001 |
| Vasopressors | 137 (45.4) | 197 (84.5) | <0.001 |
| Mechanical ventilation | 124 (41.1) | 183 (78.5) | <0.001 |
| Drotrecogin alfa (activated) | 6 (2.0) | 21 (9.0) | <0.001 |
| Dysfunctional acquired organ systems | |||
| Cardiovascular | 149 (49.3) | 204 (87.6) | <0.001 |
| Respiratory | 141 (46.7) | 202 (86.7) | <0.001 |
| Renal | 145 (48.0) | 136 (58.4) | 0.017 |
| Hepatic | 13 (4.3) | 27 (11.6) | 0.001 |
| Hematologic | 103 (34.1) | 63 (27.0) | 0.080 |
| Neurologic | 11 (3.6) | 19 (8.2) | 0.024 |
| 2 Dysfunctional acquired organ systems | 164 (54.3) | 213 (91.4) | <0.001 |
| Source of bloodstream infection | |||
| Lungs | 95 (31.5) | 127 (54.5) | <0.001 |
| Urinary tract | 92 (30.5) | 45 (19.3) | |
| Central venous catheter | 30 (9.9) | 16 (6.9) | |
| Intra‐abdominal | 63 (20.9) | 33 (14.2) | |
| Unknown | 22 (7.3) | 12 (5.2) | |
| Prior antibiotics* | 103 (34.1) | 110 (47.2) | 0.002 |
Results
Patient Characteristics
Included in the study were 535 consecutive patients with severe sepsis attributed to Pseudomonas aeruginosa, Acinetobacter species, or Enterobacteriaceae bacteremia, of whom 233 (43.6%) died during their hospitalization. The mean age was 58.9 16.0 years (range, 18 to 96 years) with 288 (53.8%) males and 247 (46.2%) females. The infection sources included community‐acquired (n = 46, 8.6%), healthcare‐associated community‐onset (n = 187, 35.0%), and healthcare‐associated hospital‐onset (n = 302, 56.4%). Hospital nonsurvivors were statistically more likely to have a healthcare‐associated hospital‐onset infection, congestive heart failure, chronic obstructive pulmonary disease, chronic kidney disease, ICU admission, need for mechanical ventilation and/or vasopressors, administration of drotrecogin alfa (activated), prior antibiotic administration, the lungs as the source of infection, acquired dysfunction of the cardiovascular, respiratory, renal, hepatic, and neurologic organ systems, and greater APACHE II and Charlson co‐morbidity scores compared to hospital survivors (Table 1). Hospital nonsurvivors were also statistically less likely to have a healthcare‐associated community‐onset infection and a urinary source of infection compared to hospital survivors (Table 1).
Microbiology
Among the 547 Gram‐negative bacteria isolated from blood, the most common were Enterobacteriaceae (Escherichia coli, Klebsiella species, Enterobacter species) (70.2%) followed by Pseudomonas aeruginosa (20.8%) and Acinetobacter species (9.0%) (Table 2). Nine patients had two different Enterobacteriaceae species isolated from their blood cultures, and three patients had an Enterobacteriaceae species and Pseudomonas aeruginosa isolated from their blood cultures. Hospital nonsurvivors were statistically more likely to be infected with Pseudomonas aeruginosa and less likely to be infected with Enterobacteriaceae. The pathogen‐specific hospital mortality rate was significantly greater for Pseudomonas aeruginosa and Acinetobacter species compared to Enterobacteriaceae (P < 0.001 and P = 0.008, respectively).
| Bacteria | Hospital Survivors (n = 302) | Hospital Nonsurvivors (n = 233) | P value* | Percent Resistant | Pathogen‐ Specific Mortality Rate |
|---|---|---|---|---|---|
| |||||
| Enterobacteriaceae | 241 (79.8) | 143 (61.4) | <0.001 | 9.1 | 37.2 |
| Pseudomonas aeruginosa | 47 (15.6) | 67 (28.8) | <0.001 | 16.7 | 58.8 |
| Acinetobacter species | 22 (7.3) | 27 (11.6) | 0.087 | 71.4 | 55.1 |
Antimicrobial Treatment and Resistance
Among the study patients, 358 (66.9%) received cefepime, 102 (19.1%) received piperacillin‐tazobactam, and 75 (14.0%) received a carbapenem (meropenem or imipenem) as their initial antibiotic treatment. There were 169 (31.6%) patients who received initial combination therapy with either an aminoglycoside (n = 99, 58.6%) or ciprofloxacin (n = 70, 41.4%). Eighty‐two (15.3%) patients were infected with a pathogen that was resistant to the initial antibiotic treatment regimen [cefepime (n = 41; 50.0%), piperacillin‐tazobactam (n = 25; 30.5%), or imipenem/meropenem (n = 16; 19.5%), plus either an aminoglycoside or ciprofloxacin (n = 28; 34.1%)], and were classified as receiving inappropriate initial antibiotic therapy. Among the 453 (84.7%) patients infected with a pathogen that was susceptible to the initial antibiotic regimen, there was no relationship identified between minimum inhibitory concentration values and hospital mortality.
Patients infected with a pathogen resistant to the initial antibiotic regimen had significantly greater risk of hospital mortality (63.4% vs 40.0%; P < 0.001) (Figure 1). For the 82 individuals infected with a pathogen that was resistant to the initial antibiotic regimen, no difference in hospital mortality was observed among those prescribed initial combination treatment with an aminoglycoside (n = 17) (64.7% vs 61.1%; P = 0.790) or ciprofloxacin (n = 11) (72.7% vs 61.1%; P = 0.733) compared to monotherapy (n = 54). Similarly, among the patients infected with a pathogen that was susceptible to the initial antibiotic regimen, there was no difference in hospital mortality among those whose bloodstream isolate was only susceptible to the prescribed aminoglycoside (n = 12) compared to patients with isolates that were susceptible to the prescribed beta‐lactam antibiotic (n = 441) (41.7% vs 39.9%; P = 0.902).
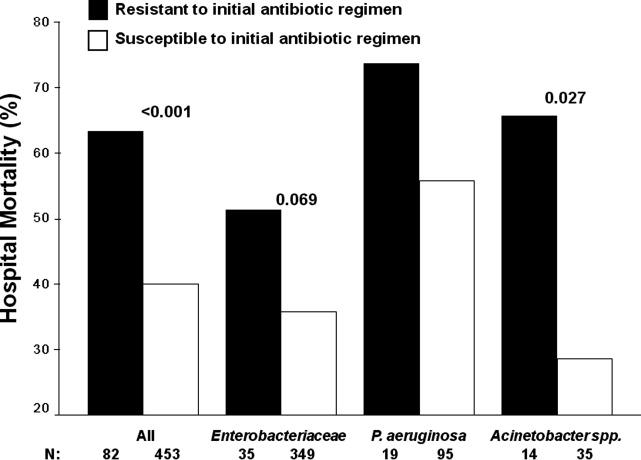
Logistic regression analysis identified infection with a pathogen resistant to the initial antibiotic regimen [adjusted odds ratio (AOR), 2.28; 95% confidence interval (CI), 1.69‐3.08; P = 0.006], increasing APACHE II scores (1‐point increments) (AOR, 1.13; 95% CI, 1.10‐1.15; P < 0.001), the need for vasopressors (AOR, 2.57; 95% CI, 2.15‐3.53; P < 0.001), the need for mechanical ventilation (AOR, 2.54; 95% CI, 2.19‐3.47; P < 0.001), healthcare‐associated hospital‐onset infection (AOR, 1.67; 95% CI, 1.32‐2.10; P =0.027), and infection with Pseudomonas aeruginosa (AOR, 2.21; 95% CI, 1.74‐2.86; P =0.002) as independent risk factors for hospital mortality (Hosmer‐Lemeshow goodness‐of‐fit test = 0.305). The model explained between 29.7% (Cox and Snell R square) and 39.8% (Nagelkerke R squared) of the variance in hospital mortality, and correctly classified 75.3% of cases.
Secondary Outcomes
Two or more acquired organ system derangements occurred significantly more often among patients with a pathogen resistant to the initial antibiotic regimen compared to those infected with susceptible isolates (84.1% vs 68.0%; P = 0.003). Hospital length of stay was significantly longer for patients infected with a pathogen resistant to the initial antibiotic regimen compared to those infected with susceptible isolates [39.9 50.6 days (median 27 days; quartiles 12 days and 45.5 days) vs 21.6 22.0 days (median 15 days; quartiles 7 days and 30 days); P < 0.001].
Discussion
Our study demonstrated that hospital nonsurvivors with severe sepsis attributed to Gram‐negative bacteremia had significantly greater rates of resistance to their initially prescribed antibiotic regimen compared to hospital survivors. This observation was confirmed in a multivariate analysis controlling for severity of illness and other potential confounding variables. Additionally, acquired organ system derangements and hospital length of stay were greater for patients infected with Gram‐negative pathogens resistant to the empiric antibiotic regimen. We also observed no survival advantage with the use of combination antimicrobial therapy for the subgroup of patients whose pathogens were resistant to the initially prescribed antibiotic regimen. Lastly, no difference in mortality was observed for patients with bacterial isolates that were susceptible only to the prescribed aminoglycoside compared to those with isolates susceptible to the prescribed beta‐lactam antibiotic.
Several previous investigators have linked antibiotic resistance and outcome in patients with serious infections attributed to Gram‐negative bacteria. Tam et al. examined 34 patients with Pseudomonas aeruginosa bacteremia having elevated MICs to piperacillin‐tazobactam (32 g/mL) that were reported as susceptible.19 In seven of these cases, piperacillin‐tazobactam was prescribed empirically, whereas other agents directed against Gram‐negative bacteria were employed in the other patients (carbapenems, aminoglycosides). Thirty‐day mortality was significantly greater for the patients treated with piperacillin‐tazobactam (85.7% vs 22.2%; P = 0.004), and a multivariate analysis found treatment with piperacillin‐tazobactam to be independently associated with 30‐day mortality. Similarly, Bhat et al. examined 204 episodes of bacteremia caused by Gram‐negative bacteria for which patients received cefepime.20 Patients infected with a Gram‐negative bacteria having an MIC to cefepime greater than, or equal to, 8 g/mL had a significantly greater 28‐day mortality compared to patients infected with isolates having an MIC to cefepime that was less than 8 g/mL (54.8% vs 24.1%; P = 0.001).
Our findings are consistent with earlier studies of patients with serious Gram‐negative infections including bacteremia and nosocomial pneumonia. Micek et al. showed that patients with Pseudomonas aeruginosa bacteremia who received inappropriate initial antimicrobial therapy had a greater risk of hospital mortality compared to patients initially treated with an antimicrobial regimen having activity for the Pseudomonas isolate based on in vitro susceptibility testing.21 Similarly, Trouillet et al.,22 Beardsley et al.,23 and Heyland et al.24 found that combination antimicrobial regimens directed against Gram‐negative bacteria in patients with nosocomial pneumonia were more likely to be appropriate based on the antimicrobial susceptibility patterns of the organisms compared to monotherapy. In a more recent study, Micek et al. demonstrated that combination antimicrobial therapy directed against severe sepsis attributed to Gram‐negative bacteria was associated with improved outcomes compared to monotherapy, especially when the combination agent was an aminoglycoside.25 However, empiric combination therapy that included an aminoglycoside was also associated with increased nephrotoxicity which makes the empiric use of aminoglycosides in all patients with suspected Gram‐negative severe sepsis problematic.25, 26 Nevertheless, the use of combination therapy represents a potential strategy to maximize the administration of appropriate treatment for serious Gram‐negative bacterial infections.
Rapid assessment of antimicrobial susceptibility is another strategy that offers the possibility of identifying the resistance pattern of Gram‐negative pathogens quickly in order to provide more appropriate treatment. Bouza et al. found that use of a rapid E‐test on the respiratory specimens of patients with ventilator‐associated pneumonia was associated with fewer days of fever, fewer days of antibiotic administration until resolution of the episode of ventilator‐associated pneumonia, decreased antibiotic consumption, less Clostridium difficile‐associated diarrhea, lower costs of antimicrobial agents, and fewer days receiving mechanical ventilation.27 Other methods for the rapid identification of resistant bacteria include real‐time polymerase chain reaction assays based on hybridization probes to identify specific resistance mechanisms in bacteria.28 Application of such methods for identification of broad categories of resistance mechanisms in Gram‐negative bacteria offer the possibility of tailoring initial antimicrobial regimens in order to provide appropriate therapy in a more timely manner.
Our study has several important limitations that should be noted. First, the study was performed at a single center and the results may not be generalizable to other institutions. However, the findings from other investigators corroborate the importance of antimicrobial resistance as a predictor of outcome for patients with serious Gram‐negative infections.19, 20 Additionally, a similar association has been observed in patients with methicillin‐resistant Staphylococcus aureus bacteremia, supporting the more general importance of antimicrobial resistance as an outcome predictor.29 Second, the method employed for determining MICs was a literature‐based linear regression method correlating disk diffusion diameters with broth dilution MIC determinations. Therefore, the lack of correlation we observed between MIC values and outcome for susceptible Gram‐negative isolates associated with severe sepsis requires further confirmation. Third, we only examined 3 antibiotics, or antibiotic classes, so our results may not be applicable to other agents. This also applies to doripenem, as we did not have that specific carbapenem available at the time this investigation took place.
Another important limitation of our study is the relatively small number of individuals infected with a pathogen that was resistant to the initial treatment regimen, or only susceptible to the aminoglycoside when combination therapy was prescribed. This limited our ability to detect meaningful associations in these subgroups of patients, to include whether or not combination therapy influenced their clinical outcome. Finally, we did not examine the exact timing of antibiotic therapy relative to the onset of severe sepsis. Instead we used a 12‐hour window from when subsequently positive blood cultures were drawn to the administration of initial antibiotic therapy. Other investigators have shown that delays in initial appropriate therapy of more than one hour for patients with septic shock increases the risk of death.9, 30 Failure to include the exact timing of therapy could have resulted in a final multivariate model that includes prediction variables that would not otherwise have been incorporated.
In summary, we demonstrated that resistance to the initial antibiotic treatment regimen was associated with a greater risk of hospital mortality in patients with severe sepsis attributed to Gram‐negative bacteremia. These findings imply that more rapid assessment of antimicrobial susceptibility could result in improved prescription of antibiotics in order to maximize initial administration of appropriate therapy. Future studies are required to address whether rapid determination of antimicrobial susceptibility can result in more effective administration of appropriate therapy, and if this can result in improved patient outcomes.
- ,,,.Inadequate antimicrobial treatment of infections: a risk factor for hospital mortality among critically ill patients.Chest.1999;115:462–474.
- ,,, et al.The clinical evaluation committee in a large multicenter phase 3 trial of drotrecogin alfa (activated) in patients with severe sepsis (PROWESS): role, methodology, and results.Crit Care Med.2003;31:2291–2301.
- ,,,,,.Impact of adequate empical antibiotic therapy on the outcome of patients admitted to the intensive care unit with sepsis.Crit Care Med.2003;31:2742–2751.
- ,,,,,.Inappropriate initial antimicrobial therapy and its effect on survival in a clinical trial of immunomodulating therapy for severe sepsis.Am J Med.2003;115:529–535.
- ,.Antibiotic‐resistant bugs in the 21st century—a clinical super‐challenge.N Engl J Med.2009;360:439–443.
- ,,, et al.Bad bugs, no drugs: no ESKAPE! An update from the Infectious Diseases Society of America.Clin Infect Dis.2009;48:1–12.
- .Broad‐spectrum antimicrobials and the treatment of serious bacterial infections: getting it right up front.Clin Infect Dis.2008;47:S3–S13.
- ,,, et al.Bundled care for septic shock: an analysis of clinical trials.Crit Care Med.2010;38:668–678.
- ,,, et al.Effectiveness of treatments for severe sepsis: a prospective, multicenter, observational study.Am J Respir Crit Care Med.2009;180:861–866.
- ,,, et al.Surviving Sepsis Campaign: international guidelines for management of severe sepsis and septic shock: 2008.Crit Care Med.2008;36:296–327.
- ,,,.APACHE II: a severity of disease classification system.Crit Care Med.1985;13:818–829.
- ,,, et al.Invasive methicillin‐resistant Staphylococcus aureus infections in the United States.JAMA.2007;298:1763–1771.
- ,,,,,.Epidemiology of severe sepsis in the United States: analysis of incidence, outcome, and associated costs of care.Crit Care Med.2001;29:1303–1310.
- ,,,,,.Hospital‐wide impact of a standardized order set for the management of bacteremic severe sepsis.Crit Care Med.2009;37:819–824.
- ,,, et al.Before‐after study of a standardized hospital order set for the management of septic shock.Crit Care Med.2007;34:2707–2713.
- National Committee for Clinical Laboratory Standards.Performance Standards for Antimicrobial Susceptibility Testing: Twelfth Informational Supplement. M100‐S12.Wayne, PA:National Committee for Clinical Laboratory Standards;2002.
- Clinical Laboratory Standards Institute.Performance Standards for Antimicrobial Susceptibility Testing: Seventeenth Informational Supplement. M100‐S17.Wayne, PA:Clinical Laboratory Standards Institute;2007.
- ,,, et al.Evaluation of the BIOGRAM antimicrobial susceptibility test system.J Clin Microbiol.1985;22:793–798.
- ,,, et al.Outcomes of bacteremia due to Pseudomonas aeruginosa with reduced susceptibility to piperacillin‐tazobactam: implications on the appropriateness of the resistance breakpoint.Clin Infect Dis.2008;46:862–867.
- ,,, et al.Failure of current cefepime breakpoints to predict clinical outcomes of bacteremia caused by Gram‐negative organisms.Antimicrob Agents Chemother.2007;51:4390–4395.
- ,,,,,.Pseudomonas aeruginosa bloodstream infection: importance of appropriate initial antimicrobial treatment.Antimicrob Agents Chemother.2005;49:1306–1311.
- ,,.Ventilator‐associated pneumonia caused by potentially drug‐resistant bacteria.Am J Respir Crit Care Med.1998;157:531–539.
- ,,,,,.Using local microbiologic data to develop institution‐specific guidelines for the treatment of hospital‐acquired pneumonia.Chest.2006;130:787–793.
- ,,, et al.Randomized trial of combination versus monotherapy for the empiric treatment of suspected ventilator‐associated pneumonia.Crit Care Med.2008;36:737–744.
- ,,, et al.Empiric combination antibiotic therapy is associated with improved outcome in Gram‐negative sepsis: a retrospective analysis.Antimicrob Agents Chemother.2010;54:1742–1748.
- ,,, et al.Monotherapy versus beta‐lactam‐aminoglycoside combination treatment for Gram‐negative bacteremia: a prospective, observational study.Antimicrob Agents Chemother.1997;41:1127–1133.
- ,,, et al.Direct E‐test (AB Biodisk) of respiratory samples improves antimicrobial use in ventilator‐associated pneumonia.Clin Infect Dis.2007;44:382–387.
- ,,, et al.Rapid detection of CTX‐M‐producing Enterobacteriaceae in urine samples.J Antimicrob Chemother.2009;64:986–989.
- ,,, et al.Influence of vancomycin minimum inhibitory concentration on the treatment of methicillin‐resistant Staphylococcus aureus bacteremia.Clin Infect Dis.2008;46:193–200.
- ,,, et al.Duration of hypotension before initiation of effective antimicrobial therapy is the critical determinant of survival in human septic shock.Crit Care Med.2006;34:1589–1596.
Severe sepsis and septic shock are associated with excess mortality when inappropriate initial antimicrobial therapy, defined as an antimicrobial regimen that lacks in vitro activity against the isolated organism(s) responsible for the infection, is administered.14 Unfortunately, bacterial resistance to antibiotics is increasing and creates a therapeutic challenge for clinicians when treating patients with serious infections, such as severe sepsis. Increasing rates of bacterial resistance leads many clinicians to empirically treat critically ill patients with broad‐spectrum antibiotics, which can perpetuate the cycle of increasing resistance.5, 6 Conversely, inappropriate initial antimicrobial therapy can lead to treatment failures and adverse patient outcomes.7 Individuals with severe sepsis appear to be at particularly high risk of excess mortality when inappropriate initial antimicrobial therapy is administered.8, 9
The most recent Surviving Sepsis Guidelines recommend empiric combination therapy targeting Gram‐negative bacteria, particularly for patients with known or suspected Pseudomonas infections, as a means to decrease the likelihood of administering inappropriate initial antimicrobial therapy.10 However, the selection of an antimicrobial regimen that is active against the causative pathogen(s) is problematic, as the treating physician usually does not know the susceptibilities of the pathogen(s) for the selected empiric antibiotics. Therefore, we performed a study with the main goal of determining whether resistance to the initially prescribed antimicrobial regimen was associated with clinical outcome in patients with severe sepsis attributed to Gram‐negative bacteremia.
Materials and Methods
Study Location and Patients
This study was conducted at a university‐affiliated, urban teaching hospital: Barnes‐Jewish Hospital (1200 beds). During a 6‐year period (January 2002 to December 2007), all hospitalized patients with a positive blood culture for Gram‐negative bacteria, with antimicrobial susceptibility testing performed for the blood isolate(s), were eligible for this investigation. This study was approved by the Washington University School of Medicine Human Studies Committee.
Study Design and Data Collection
A retrospective cohort study design was employed. Two investigators (J.A.D., R.M.R.) identified potential study patients by the presence of a positive blood culture for Pseudomonas aeruginosa, Acinetobacter species, or Enterobacteriaceae (Escherichia coli, Klebsiella species, Enterobacter species) combined with primary or secondary International Classification of Diseases (ICD‐9‐CM) codes indicative of acute organ dysfunction, at least two criteria from the systemic inflammatory response syndrome (SIRS),10 and initial antibiotic treatment with either cefepime, piperacillin‐tazobactam, or a carbapenem (imipenem or meropenem). These antimicrobials represent the primary agents employed for the treatment of Gram‐negative infections at Barnes‐Jewish Hospital during the study period, and had to be administered within 12 hours of having the subsequently positive blood cultures drawn. Based on the initial study database construction, 3 investigators (E.C.W., J.K., M.P.) merged patient‐specific data from the automated hospital medical records, microbiology database, and pharmacy database of Barnes‐Jewish Hospital to complete the clinical database under the auspices of the definitions described below.
The baseline characteristics collected by the study investigators included: age, gender, race, the presence of congestive heart failure, chronic obstructive pulmonary disease, diabetes mellitus, chronic liver disease, underlying malignancy, and end‐stage renal disease requiring renal replacement therapy. All cause hospital mortality was evaluated as the primary outcome variable. Secondary outcomes included acquired organ dysfunction and hospital length of stay. The Acute Physiology and Chronic Health Evaluation (APACHE) II11 and Charlson co‐morbidity scores were also calculated during the 24 hours after the positive blood cultures were drawn. This was done because we included patients with community‐acquired infections who only had clinical data available after blood cultures were drawn.
Definitions
All definitions were selected prospectively as part of the original study design. Cases of Gram‐negative bacteremia were classified into mutually exclusive groups comprised of either community‐acquired or healthcare‐associated infection. Patients with healthcare‐associated bacteremia were categorized as community‐onset or hospital‐onset, as previously described.12 In brief, patients with healthcare‐associated community‐onset bacteremia had the positive culture obtained within the first 48 hours of hospital admission in combination with one or more of the following risk factors: (1) residence in a nursing home, rehabilitation hospital, or other long‐term nursing facility; (2) previous hospitalization within the immediately preceding 12 months; (3) receiving outpatient hemodialysis, peritoneal dialysis, wound care, or infusion therapy necessitating regular visits to a hospital‐based clinic; and (4) having an immune‐compromised state. Patients were classified as having healthcare‐associated hospital‐onset bacteremia when the culture was obtained 48 hours or more after admission. Community‐acquired bacteremia occurred in patients without healthcare risk factors and a positive blood culture within the first 48 hours of admission. Prior antibiotic exposure was defined as having occurred within the previous 30 days from the onset of severe sepsis.
To be included in the analysis, patients had to meet criteria for severe sepsis based on discharge ICD‐9‐CM codes for acute organ dysfunction, as previously described.13 The organs of interest included the heart, lungs, kidneys, bone marrow (hematologic), brain, and liver. Patients were classified as having septic shock if vasopressors (norepinephrine, dopamine, epinephrine, phenylephrine, or vasopressin) were initiated within 24 hours of the blood culture collection date and time. Empiric antimicrobial treatment was classified as being appropriate if the initially prescribed antibiotic regimen was active against the identified pathogen(s) based on in vitro susceptibility testing and administered within 12 hours following blood culture collection. Appropriate antimicrobial treatment also had to be prescribed for at least 24 hours. However, the total duration of antimicrobial therapy was at the discretion of the treating physicians. The Charlson co‐morbidity score was calculated using ICD‐9‐CM codes abstracted from the index hospitalization employing MS‐DRG Grouper version 26.
Antimicrobial Monitoring
From January 2002 through the present, Barnes‐Jewish Hospital utilized an antibiotic control program to help guide antimicrobial therapy. During this time, the use of cefepime and gentamicin was unrestricted. However, initiation of intravenous ciprofloxacin, imipenem/cilastatin, meropenem, or piperacillin/tazobactam was restricted and required preauthorization from either a clinical pharmacist or infectious diseases physician. Each intensive care unit (ICU) had a clinical pharmacist who reviewed all antibiotic orders to insure that dosing and interval of antibiotic administration was adequate for individual patients based on body size, renal function, and the resuscitation status of the patient. After daytime hours, the on‐call clinical pharmacist reviewed and approved the antibiotic orders. The initial antibiotic dosages for the antibiotics employed for the treatment of Gram‐negative infections at Barnes‐Jewish Hospital were as follows: cefepime, 1 to 2 grams every eight hours; pipercillin‐tazobactam, 4.5 grams every six hours; imipenem, 0.5 grams every six hours; meropenem, 1 gram every eight hours; ciprofloxacin, 400 mg every eight hours; gentamicin, 5 mg/kg once daily.
Starting in June 2005, a sepsis order set was implemented in the emergency department, general medical wards, and the intensive care units with the intent of standardizing empiric antibiotic selection for patients with sepsis based on the infection type (ie, community‐acquired pneumonia, healthcare‐associated pneumonia, intra‐abdominal infection, etc) and the hospital's antibiogram.14, 15 However, antimicrobial selection, dosing, and de‐escalation of therapy were still optimized by clinical pharmacists in these clinical areas.
Antimicrobial Susceptibility Testing
The microbiology laboratory performed antimicrobial susceptibility testing of the Gram‐negative blood isolates using the disk diffusion method according to guidelines and breakpoints established by the Clinical Laboratory and Standards Institute (CLSI) and published during the inclusive years of the study.16, 17 Zone diameters obtained by disk diffusion testing were converted to minimum inhibitory concentrations (MICs in mg/L) by linear regression analysis for each antimicrobial agent using the BIOMIC V3 antimicrobial susceptibility system (Giles Scientific, Inc., Santa Barbara, CA). Linear regression algorithms contained in the software of this system were determined by comparative studies correlating microbroth dilution‐determined MIC values with zone sizes obtained by disk diffusion testing.18
Data Analysis
Continuous variables were reported as mean the standard deviation, or median and quartiles. The Student's t test was used when comparing normally distributed data, and the MannWhitney U test was employed to analyze nonnormally distributed data. Categorical data were expressed as frequency distributions and the Chi‐squared test was used to determine if differences existed between groups. We performed multiple logistic regression analysis to identify clinical risk factors that were associated with hospital mortality (SPSS, Inc., Chicago, IL). All risk factors from Table 1, as well as the individual pathogens examined, were included in the corresponding multivariable analysis with the exception of acquired organ dysfunction (considered a secondary outcome). All tests were two‐tailed, and a P value <0.05 was determined to represent statistical significance.
| Variable | Hospital Survivors (n = 302) | Hospital Nonsurvivors (n = 233) | P value |
|---|---|---|---|
| |||
| Age, years | 57.9 16.2 | 60.3 15.8 | 0.091 |
| Male | 156 (51.7) | 132 (56.7) | 0.250 |
| Infection onset source | |||
| Community‐acquired | 31 (10.3) | 15 (6.4) | 0.005 |
| Healthcare‐associated community‐onset | 119 (39.4) | 68 (29.2) | |
| Healthcare‐associated hospital‐onset | 152 (50.3) | 150 (64.4) | |
| Underlying co‐morbidities | |||
| CHF | 43 (14.2) | 53 (22.7) | 0.011 |
| COPD | 42 (13.9) | 56 (24.0) | 0.003 |
| Chronic kidney disease | 31 (10.3) | 41 (17.6) | 0.014 |
| Liver disease | 34 (11.3) | 31 (13.3) | 0.473 |
| Active malignancy | 100 (33.1) | 83 (35.6) | 0.544 |
| Diabetes | 68 (22.5) | 50 (21.5) | 0.770 |
| Charlson co‐morbidity score | 4.5 3.5 | 5.2 3.9 | 0.041 |
| APACHE II score | 21.8 6.1 | 27.1 6.2 | <0.001 |
| ICU admission | 221 (73.2) | 216 (92.7) | <0.001 |
| Vasopressors | 137 (45.4) | 197 (84.5) | <0.001 |
| Mechanical ventilation | 124 (41.1) | 183 (78.5) | <0.001 |
| Drotrecogin alfa (activated) | 6 (2.0) | 21 (9.0) | <0.001 |
| Dysfunctional acquired organ systems | |||
| Cardiovascular | 149 (49.3) | 204 (87.6) | <0.001 |
| Respiratory | 141 (46.7) | 202 (86.7) | <0.001 |
| Renal | 145 (48.0) | 136 (58.4) | 0.017 |
| Hepatic | 13 (4.3) | 27 (11.6) | 0.001 |
| Hematologic | 103 (34.1) | 63 (27.0) | 0.080 |
| Neurologic | 11 (3.6) | 19 (8.2) | 0.024 |
| 2 Dysfunctional acquired organ systems | 164 (54.3) | 213 (91.4) | <0.001 |
| Source of bloodstream infection | |||
| Lungs | 95 (31.5) | 127 (54.5) | <0.001 |
| Urinary tract | 92 (30.5) | 45 (19.3) | |
| Central venous catheter | 30 (9.9) | 16 (6.9) | |
| Intra‐abdominal | 63 (20.9) | 33 (14.2) | |
| Unknown | 22 (7.3) | 12 (5.2) | |
| Prior antibiotics* | 103 (34.1) | 110 (47.2) | 0.002 |
Results
Patient Characteristics
Included in the study were 535 consecutive patients with severe sepsis attributed to Pseudomonas aeruginosa, Acinetobacter species, or Enterobacteriaceae bacteremia, of whom 233 (43.6%) died during their hospitalization. The mean age was 58.9 16.0 years (range, 18 to 96 years) with 288 (53.8%) males and 247 (46.2%) females. The infection sources included community‐acquired (n = 46, 8.6%), healthcare‐associated community‐onset (n = 187, 35.0%), and healthcare‐associated hospital‐onset (n = 302, 56.4%). Hospital nonsurvivors were statistically more likely to have a healthcare‐associated hospital‐onset infection, congestive heart failure, chronic obstructive pulmonary disease, chronic kidney disease, ICU admission, need for mechanical ventilation and/or vasopressors, administration of drotrecogin alfa (activated), prior antibiotic administration, the lungs as the source of infection, acquired dysfunction of the cardiovascular, respiratory, renal, hepatic, and neurologic organ systems, and greater APACHE II and Charlson co‐morbidity scores compared to hospital survivors (Table 1). Hospital nonsurvivors were also statistically less likely to have a healthcare‐associated community‐onset infection and a urinary source of infection compared to hospital survivors (Table 1).
Microbiology
Among the 547 Gram‐negative bacteria isolated from blood, the most common were Enterobacteriaceae (Escherichia coli, Klebsiella species, Enterobacter species) (70.2%) followed by Pseudomonas aeruginosa (20.8%) and Acinetobacter species (9.0%) (Table 2). Nine patients had two different Enterobacteriaceae species isolated from their blood cultures, and three patients had an Enterobacteriaceae species and Pseudomonas aeruginosa isolated from their blood cultures. Hospital nonsurvivors were statistically more likely to be infected with Pseudomonas aeruginosa and less likely to be infected with Enterobacteriaceae. The pathogen‐specific hospital mortality rate was significantly greater for Pseudomonas aeruginosa and Acinetobacter species compared to Enterobacteriaceae (P < 0.001 and P = 0.008, respectively).
| Bacteria | Hospital Survivors (n = 302) | Hospital Nonsurvivors (n = 233) | P value* | Percent Resistant | Pathogen‐ Specific Mortality Rate |
|---|---|---|---|---|---|
| |||||
| Enterobacteriaceae | 241 (79.8) | 143 (61.4) | <0.001 | 9.1 | 37.2 |
| Pseudomonas aeruginosa | 47 (15.6) | 67 (28.8) | <0.001 | 16.7 | 58.8 |
| Acinetobacter species | 22 (7.3) | 27 (11.6) | 0.087 | 71.4 | 55.1 |
Antimicrobial Treatment and Resistance
Among the study patients, 358 (66.9%) received cefepime, 102 (19.1%) received piperacillin‐tazobactam, and 75 (14.0%) received a carbapenem (meropenem or imipenem) as their initial antibiotic treatment. There were 169 (31.6%) patients who received initial combination therapy with either an aminoglycoside (n = 99, 58.6%) or ciprofloxacin (n = 70, 41.4%). Eighty‐two (15.3%) patients were infected with a pathogen that was resistant to the initial antibiotic treatment regimen [cefepime (n = 41; 50.0%), piperacillin‐tazobactam (n = 25; 30.5%), or imipenem/meropenem (n = 16; 19.5%), plus either an aminoglycoside or ciprofloxacin (n = 28; 34.1%)], and were classified as receiving inappropriate initial antibiotic therapy. Among the 453 (84.7%) patients infected with a pathogen that was susceptible to the initial antibiotic regimen, there was no relationship identified between minimum inhibitory concentration values and hospital mortality.
Patients infected with a pathogen resistant to the initial antibiotic regimen had significantly greater risk of hospital mortality (63.4% vs 40.0%; P < 0.001) (Figure 1). For the 82 individuals infected with a pathogen that was resistant to the initial antibiotic regimen, no difference in hospital mortality was observed among those prescribed initial combination treatment with an aminoglycoside (n = 17) (64.7% vs 61.1%; P = 0.790) or ciprofloxacin (n = 11) (72.7% vs 61.1%; P = 0.733) compared to monotherapy (n = 54). Similarly, among the patients infected with a pathogen that was susceptible to the initial antibiotic regimen, there was no difference in hospital mortality among those whose bloodstream isolate was only susceptible to the prescribed aminoglycoside (n = 12) compared to patients with isolates that were susceptible to the prescribed beta‐lactam antibiotic (n = 441) (41.7% vs 39.9%; P = 0.902).
Logistic regression analysis identified infection with a pathogen resistant to the initial antibiotic regimen [adjusted odds ratio (AOR), 2.28; 95% confidence interval (CI), 1.69‐3.08; P = 0.006], increasing APACHE II scores (1‐point increments) (AOR, 1.13; 95% CI, 1.10‐1.15; P < 0.001), the need for vasopressors (AOR, 2.57; 95% CI, 2.15‐3.53; P < 0.001), the need for mechanical ventilation (AOR, 2.54; 95% CI, 2.19‐3.47; P < 0.001), healthcare‐associated hospital‐onset infection (AOR, 1.67; 95% CI, 1.32‐2.10; P =0.027), and infection with Pseudomonas aeruginosa (AOR, 2.21; 95% CI, 1.74‐2.86; P =0.002) as independent risk factors for hospital mortality (Hosmer‐Lemeshow goodness‐of‐fit test = 0.305). The model explained between 29.7% (Cox and Snell R square) and 39.8% (Nagelkerke R squared) of the variance in hospital mortality, and correctly classified 75.3% of cases.
Secondary Outcomes
Two or more acquired organ system derangements occurred significantly more often among patients with a pathogen resistant to the initial antibiotic regimen compared to those infected with susceptible isolates (84.1% vs 68.0%; P = 0.003). Hospital length of stay was significantly longer for patients infected with a pathogen resistant to the initial antibiotic regimen compared to those infected with susceptible isolates [39.9 50.6 days (median 27 days; quartiles 12 days and 45.5 days) vs 21.6 22.0 days (median 15 days; quartiles 7 days and 30 days); P < 0.001].
Discussion
Our study demonstrated that hospital nonsurvivors with severe sepsis attributed to Gram‐negative bacteremia had significantly greater rates of resistance to their initially prescribed antibiotic regimen compared to hospital survivors. This observation was confirmed in a multivariate analysis controlling for severity of illness and other potential confounding variables. Additionally, acquired organ system derangements and hospital length of stay were greater for patients infected with Gram‐negative pathogens resistant to the empiric antibiotic regimen. We also observed no survival advantage with the use of combination antimicrobial therapy for the subgroup of patients whose pathogens were resistant to the initially prescribed antibiotic regimen. Lastly, no difference in mortality was observed for patients with bacterial isolates that were susceptible only to the prescribed aminoglycoside compared to those with isolates susceptible to the prescribed beta‐lactam antibiotic.
Several previous investigators have linked antibiotic resistance and outcome in patients with serious infections attributed to Gram‐negative bacteria. Tam et al. examined 34 patients with Pseudomonas aeruginosa bacteremia having elevated MICs to piperacillin‐tazobactam (32 g/mL) that were reported as susceptible.19 In seven of these cases, piperacillin‐tazobactam was prescribed empirically, whereas other agents directed against Gram‐negative bacteria were employed in the other patients (carbapenems, aminoglycosides). Thirty‐day mortality was significantly greater for the patients treated with piperacillin‐tazobactam (85.7% vs 22.2%; P = 0.004), and a multivariate analysis found treatment with piperacillin‐tazobactam to be independently associated with 30‐day mortality. Similarly, Bhat et al. examined 204 episodes of bacteremia caused by Gram‐negative bacteria for which patients received cefepime.20 Patients infected with a Gram‐negative bacteria having an MIC to cefepime greater than, or equal to, 8 g/mL had a significantly greater 28‐day mortality compared to patients infected with isolates having an MIC to cefepime that was less than 8 g/mL (54.8% vs 24.1%; P = 0.001).
Our findings are consistent with earlier studies of patients with serious Gram‐negative infections including bacteremia and nosocomial pneumonia. Micek et al. showed that patients with Pseudomonas aeruginosa bacteremia who received inappropriate initial antimicrobial therapy had a greater risk of hospital mortality compared to patients initially treated with an antimicrobial regimen having activity for the Pseudomonas isolate based on in vitro susceptibility testing.21 Similarly, Trouillet et al.,22 Beardsley et al.,23 and Heyland et al.24 found that combination antimicrobial regimens directed against Gram‐negative bacteria in patients with nosocomial pneumonia were more likely to be appropriate based on the antimicrobial susceptibility patterns of the organisms compared to monotherapy. In a more recent study, Micek et al. demonstrated that combination antimicrobial therapy directed against severe sepsis attributed to Gram‐negative bacteria was associated with improved outcomes compared to monotherapy, especially when the combination agent was an aminoglycoside.25 However, empiric combination therapy that included an aminoglycoside was also associated with increased nephrotoxicity which makes the empiric use of aminoglycosides in all patients with suspected Gram‐negative severe sepsis problematic.25, 26 Nevertheless, the use of combination therapy represents a potential strategy to maximize the administration of appropriate treatment for serious Gram‐negative bacterial infections.
Rapid assessment of antimicrobial susceptibility is another strategy that offers the possibility of identifying the resistance pattern of Gram‐negative pathogens quickly in order to provide more appropriate treatment. Bouza et al. found that use of a rapid E‐test on the respiratory specimens of patients with ventilator‐associated pneumonia was associated with fewer days of fever, fewer days of antibiotic administration until resolution of the episode of ventilator‐associated pneumonia, decreased antibiotic consumption, less Clostridium difficile‐associated diarrhea, lower costs of antimicrobial agents, and fewer days receiving mechanical ventilation.27 Other methods for the rapid identification of resistant bacteria include real‐time polymerase chain reaction assays based on hybridization probes to identify specific resistance mechanisms in bacteria.28 Application of such methods for identification of broad categories of resistance mechanisms in Gram‐negative bacteria offer the possibility of tailoring initial antimicrobial regimens in order to provide appropriate therapy in a more timely manner.
Our study has several important limitations that should be noted. First, the study was performed at a single center and the results may not be generalizable to other institutions. However, the findings from other investigators corroborate the importance of antimicrobial resistance as a predictor of outcome for patients with serious Gram‐negative infections.19, 20 Additionally, a similar association has been observed in patients with methicillin‐resistant Staphylococcus aureus bacteremia, supporting the more general importance of antimicrobial resistance as an outcome predictor.29 Second, the method employed for determining MICs was a literature‐based linear regression method correlating disk diffusion diameters with broth dilution MIC determinations. Therefore, the lack of correlation we observed between MIC values and outcome for susceptible Gram‐negative isolates associated with severe sepsis requires further confirmation. Third, we only examined 3 antibiotics, or antibiotic classes, so our results may not be applicable to other agents. This also applies to doripenem, as we did not have that specific carbapenem available at the time this investigation took place.
Another important limitation of our study is the relatively small number of individuals infected with a pathogen that was resistant to the initial treatment regimen, or only susceptible to the aminoglycoside when combination therapy was prescribed. This limited our ability to detect meaningful associations in these subgroups of patients, to include whether or not combination therapy influenced their clinical outcome. Finally, we did not examine the exact timing of antibiotic therapy relative to the onset of severe sepsis. Instead we used a 12‐hour window from when subsequently positive blood cultures were drawn to the administration of initial antibiotic therapy. Other investigators have shown that delays in initial appropriate therapy of more than one hour for patients with septic shock increases the risk of death.9, 30 Failure to include the exact timing of therapy could have resulted in a final multivariate model that includes prediction variables that would not otherwise have been incorporated.
In summary, we demonstrated that resistance to the initial antibiotic treatment regimen was associated with a greater risk of hospital mortality in patients with severe sepsis attributed to Gram‐negative bacteremia. These findings imply that more rapid assessment of antimicrobial susceptibility could result in improved prescription of antibiotics in order to maximize initial administration of appropriate therapy. Future studies are required to address whether rapid determination of antimicrobial susceptibility can result in more effective administration of appropriate therapy, and if this can result in improved patient outcomes.
- ,,,.Inadequate antimicrobial treatment of infections: a risk factor for hospital mortality among critically ill patients.Chest.1999;115:462–474.
- ,,, et al.The clinical evaluation committee in a large multicenter phase 3 trial of drotrecogin alfa (activated) in patients with severe sepsis (PROWESS): role, methodology, and results.Crit Care Med.2003;31:2291–2301.
- ,,,,,.Impact of adequate empical antibiotic therapy on the outcome of patients admitted to the intensive care unit with sepsis.Crit Care Med.2003;31:2742–2751.
- ,,,,,.Inappropriate initial antimicrobial therapy and its effect on survival in a clinical trial of immunomodulating therapy for severe sepsis.Am J Med.2003;115:529–535.
- ,.Antibiotic‐resistant bugs in the 21st century—a clinical super‐challenge.N Engl J Med.2009;360:439–443.
- ,,, et al.Bad bugs, no drugs: no ESKAPE! An update from the Infectious Diseases Society of America.Clin Infect Dis.2009;48:1–12.
- .Broad‐spectrum antimicrobials and the treatment of serious bacterial infections: getting it right up front.Clin Infect Dis.2008;47:S3–S13.
- ,,, et al.Bundled care for septic shock: an analysis of clinical trials.Crit Care Med.2010;38:668–678.
- ,,, et al.Effectiveness of treatments for severe sepsis: a prospective, multicenter, observational study.Am J Respir Crit Care Med.2009;180:861–866.
- ,,, et al.Surviving Sepsis Campaign: international guidelines for management of severe sepsis and septic shock: 2008.Crit Care Med.2008;36:296–327.
- ,,,.APACHE II: a severity of disease classification system.Crit Care Med.1985;13:818–829.
- ,,, et al.Invasive methicillin‐resistant Staphylococcus aureus infections in the United States.JAMA.2007;298:1763–1771.
- ,,,,,.Epidemiology of severe sepsis in the United States: analysis of incidence, outcome, and associated costs of care.Crit Care Med.2001;29:1303–1310.
- ,,,,,.Hospital‐wide impact of a standardized order set for the management of bacteremic severe sepsis.Crit Care Med.2009;37:819–824.
- ,,, et al.Before‐after study of a standardized hospital order set for the management of septic shock.Crit Care Med.2007;34:2707–2713.
- National Committee for Clinical Laboratory Standards.Performance Standards for Antimicrobial Susceptibility Testing: Twelfth Informational Supplement. M100‐S12.Wayne, PA:National Committee for Clinical Laboratory Standards;2002.
- Clinical Laboratory Standards Institute.Performance Standards for Antimicrobial Susceptibility Testing: Seventeenth Informational Supplement. M100‐S17.Wayne, PA:Clinical Laboratory Standards Institute;2007.
- ,,, et al.Evaluation of the BIOGRAM antimicrobial susceptibility test system.J Clin Microbiol.1985;22:793–798.
- ,,, et al.Outcomes of bacteremia due to Pseudomonas aeruginosa with reduced susceptibility to piperacillin‐tazobactam: implications on the appropriateness of the resistance breakpoint.Clin Infect Dis.2008;46:862–867.
- ,,, et al.Failure of current cefepime breakpoints to predict clinical outcomes of bacteremia caused by Gram‐negative organisms.Antimicrob Agents Chemother.2007;51:4390–4395.
- ,,,,,.Pseudomonas aeruginosa bloodstream infection: importance of appropriate initial antimicrobial treatment.Antimicrob Agents Chemother.2005;49:1306–1311.
- ,,.Ventilator‐associated pneumonia caused by potentially drug‐resistant bacteria.Am J Respir Crit Care Med.1998;157:531–539.
- ,,,,,.Using local microbiologic data to develop institution‐specific guidelines for the treatment of hospital‐acquired pneumonia.Chest.2006;130:787–793.
- ,,, et al.Randomized trial of combination versus monotherapy for the empiric treatment of suspected ventilator‐associated pneumonia.Crit Care Med.2008;36:737–744.
- ,,, et al.Empiric combination antibiotic therapy is associated with improved outcome in Gram‐negative sepsis: a retrospective analysis.Antimicrob Agents Chemother.2010;54:1742–1748.
- ,,, et al.Monotherapy versus beta‐lactam‐aminoglycoside combination treatment for Gram‐negative bacteremia: a prospective, observational study.Antimicrob Agents Chemother.1997;41:1127–1133.
- ,,, et al.Direct E‐test (AB Biodisk) of respiratory samples improves antimicrobial use in ventilator‐associated pneumonia.Clin Infect Dis.2007;44:382–387.
- ,,, et al.Rapid detection of CTX‐M‐producing Enterobacteriaceae in urine samples.J Antimicrob Chemother.2009;64:986–989.
- ,,, et al.Influence of vancomycin minimum inhibitory concentration on the treatment of methicillin‐resistant Staphylococcus aureus bacteremia.Clin Infect Dis.2008;46:193–200.
- ,,, et al.Duration of hypotension before initiation of effective antimicrobial therapy is the critical determinant of survival in human septic shock.Crit Care Med.2006;34:1589–1596.
Copyright © 2011 Society of Hospital Medicine

Inappropriate Treatment of HCA‐cSSTI
Classically, infections have been categorized as either community‐acquired (CAI) or nosocomial in origin. Until recently, this scheme was thought adequate to capture the differences in the microbiology and outcomes in the corresponding scenarios. However, recent evidence suggests that this distinction may no longer be valid. For example, with the spread and diffusion of healthcare delivery beyond the confines of the hospital along with the increasing use of broad spectrum antibiotics both in and out of the hospital, pathogens such as methicillin‐resistant Staphylococcus aureus (MRSA) and Pseudomonas aeruginosa (PA), traditionally thought to be confined to the hospital, are now seen in patients presenting from the community to the emergency department (ED).1, 2 Reflecting this shift in epidemiology, some national guidelines now recognize healthcare‐associated infection (HCAI) as a distinct entity.3 The concept of HCAI allows the clinician to identify patients who, despite suffering a community onset infection, still may be at risk for a resistant bacterial pathogen. Recent studies in both bloodstream infection and pneumonia have clearly demonstrated that those with HCAI have distinct microbiology and outcomes relative to those with pure CAI.47
Most work focusing on establishing HCAI has not addressed skin and soft tissue infections. These infections, although not often fatal, account for an increasing number of admissions to the hospital.8, 9 In addition, they may be associated with substantial morbidity and cost.8 Given that many pathogens such as S. aureus, which may be resistant to typical antimicrobials used in the ED, are also major culprits in complicated skin and skin structure infections (cSSSI), the HCAI paradigm may apply in cSSSI. Furthermore, because of these patterns of increased resistance, HCA‐cSSSI patients, similar to other HCAI groups, may be at an increased risk of being treated with initially inappropriate antibiotic therapy.7, 10
Since in the setting of other types of infection inappropriate empiric treatment has been shown to be associated with increased mortality and costs,7, 1015 and since indirect evidence suggests a similar impact on healthcare utilization among cSSSI patients,8 we hypothesized that among a cohort of patients hospitalized with a cSSSI, the initial empiric choice of therapy is independently associated with hospital length of stay (LOS). We performed a retrospective cohort study to address this question.
Methods
Study Design
We performed a single‐center retrospective cohort study of patients with cSSSI admitted to the hospital through the ED. All consecutive patients hospitalized between April 2006 and December 2007 meeting predefined inclusion criteria (see below) were enrolled. The study was approved by the Washington University School of Medicine Human Studies Committee, and informed consent was waived. We have previously reported on the characteristics and outcomes of this cohort, including both community‐acquired and HCA‐cSSSI patients.16
Study Cohort
All consecutive patients admitted from the community through the ED between April 2006 and December 2007 at the Barnes‐Jewish Hospital, a 1200‐bed university‐affiliated, urban teaching hospital in St. Louis, MO were included if: (1) they had a diagnosis of a predefined cSSSI (see Appendix Table A1, based on reference 8) and (2) they had a positive microbiology culture obtained within 24 hours of hospital admission. Similar to the work by Edelsberg et al.8 we excluded patients if certain diagnoses and procedures were present (Appendix Table A2). Cases were also excluded if they represented a readmission for the same diagnosis within 30 days of the original hospitalization.
Definitions
HCAI was defined as any cSSSI in a patient with a history of recent hospitalization (within the previous year, consistent with the previous study16), receiving antibiotics prior to admission (previous 90 days), transferring from a nursing home, or needing chronic dialysis. We defined a polymicrobial infection as one with more than one organism, and mixed infection as an infection with both a gram‐positive and a gram‐negative organism. Inappropriate empiric therapy took place if a patient did not receive treatment within 24 hours of the time the culture was obtained with an agent exhibiting in vitro activity against the isolated pathogen(s). In mixed infections, appropriate therapy was treatment within 24 hours of culture being obtained with agent(s) active against all pathogens recovered.
Data Elements
We collected information about multiple baseline demographic and clinical factors including: age, gender, race/ethnicity, comorbidities, the presence of risk factors for HCAI, the presence of bacteremia at admission, and the location of admission (ward vs. intensive care unit [ICU]). Bacteriology data included information on specific bacterium/a recovered from culture, the site of the culture (eg, tissue, blood), susceptibility patterns, and whether the infection was monomicrobial, polymicrobial, or mixed. When blood culture was available and positive, we prioritized this over wound and other cultures and designated the corresponding organism as the culprit in the index infection. Cultures growing our coagulase‐negative S. aureus were excluded as a probable contaminant. Treatment data included information on the choice of the antimicrobial therapy and the timing of its institution relative to the timing of obtaining the culture specimen. The presence of such procedures as incision and drainage (I&D) or debridement was recorded.
Statistical Analyses
Descriptive statistics comparing HCAI patients treated appropriately to those receiving inappropriate empiric coverage based on their clinical, demographic, microbiologic and treatment characteristics were computed. Hospital LOS served as the primary and hospital mortality as the secondary outcomes, comparing patients with HCAI treated appropriately to those treated inappropriately. All continuous variables were compared using Student's t test or the Mann‐Whitney U test as appropriate. All categorical variables were compared using the chi‐square test or Fisher's exact test. To assess the attributable impact of inappropriate therapy in HCAI on the outcomes of interest, general linear models with log transformation were developed to model hospital LOS parameters; all means are presented as geometric means. All potential risk factors significant at the 0.1 level in univariate analyses were entered into the model. All calculations were performed in Stata version 9 (Statacorp, College Station, TX).
Results
Of the 717 patients with culture‐positive cSSSI admitted during the study period, 527 (73.5%) were classified as HCAI. The most common reason for classification as an HCAI was recent hospitalization. Among those with an HCA‐cSSSI, 405 (76.9%) received appropriate empiric treatment, with nearly one‐quarter receiving inappropriate initial coverage. Those receiving inappropriate antibiotic were more likely to be African American, and had a higher likelihood of having end‐stage renal disease (ESRD) than those with appropriate coverage (Table 1). While those patients treated appropriately had higher rates of both cellulitis and abscess as the presenting infection, a substantially higher proportion of those receiving inappropriate initial treatment had a decubitus ulcer (29.5% vs. 10.9%, P <0.001), a device‐associated infection (42.6% vs. 28.6%, P = 0.004), and had evidence of bacteremia (68.9% vs. 57.8%, P = 0.028) than those receiving appropriate empiric coverage (Table 2).
| Inappropriate (n = 122), n (%) | Appropriate (n = 405), n (%) | P Value | |
|---|---|---|---|
| |||
| Age, years | 56.3 18.0 | 53.6 16.7 | 0.147 |
| Gender (F) | 62 (50.8) | 190 (46.9) | 0.449 |
| Race | |||
| Caucasian | 51 (41.8) | 219 (54.1) | 0.048 |
| African American | 68 (55.7) | 178 (43.9) | |
| Other | 3 (2.5) | 8 (2.0) | |
| HCAI risk factors | |||
| Recent hospitalization* | 110 (90.2) | 373 (92.1) | 0.498 |
| Within 90 days | 98 (80.3) | 274 (67.7) | 0.007 |
| >90 and 180 days | 52 (42.6) | 170 (42.0) | 0.899 |
| >180 days and 1 year | 46 (37.7) | 164 (40.5) | 0.581 |
| Prior antibiotics | 26 (21.3) | 90 (22.2) | 0.831 |
| Nursing home resident | 29 (23.8) | 54 (13.3) | 0.006 |
| Hemodialysis | 19 (15.6) | 39 (9.7) | 0.067 |
| Comorbidities | |||
| DM | 40 (37.8) | 128 (31.6) | 0.806 |
| PVD | 5 (4.1) | 15 (3.7) | 0.841 |
| Liver disease | 6 (4.9) | 33 (8.2) | 0.232 |
| Cancer | 21 (17.2) | 85 (21.0) | 0.362 |
| HIV | 1 (0.8) | 12 (3.0) | 0.316 |
| Organ transplant | 2 (1.6) | 8 (2.0) | 1.000 |
| Autoimmune disease | 5 (4.1) | 8 (2.0) | 0.185 |
| ESRD | 22 (18.0) | 46 (11.4) | 0.054 |
| Inappropriate (n = 122), n (%) | Appropriate (n = 405), n (%) | P Value | |
|---|---|---|---|
| |||
| Cellulitis | 28 (23.0) | 171 (42.2) | <0.001 |
| Decubitus ulcer | 36 (29.5) | 44 (10.9) | <0.001 |
| Post‐op wound | 25 (20.5) | 75 (18.5) | 0.626 |
| Device‐associated infection | 52 (42.6) | 116 (28.6) | 0.004 |
| Diabetic foot ulcer | 9 (7.4) | 24 (5.9) | 0.562 |
| Abscess | 22 (18.0) | 108 (26.7) | 0.052 |
| Other* | 2 (1.6) | 17 (4.2) | 0.269 |
| Presence of bacteremia | 84 (68.9) | 234 (57.8) | 0.028 |
The pathogens recovered from the appropriately and inappropriately treated groups are listed in Figure 1. While S. aureus overall was more common among those treated appropriately, the frequency of MRSA did not differ between the groups. Both E. faecalis and E. faecium were recovered more frequently in the inappropriate group, resulting in a similar pattern among the vancomycin‐resistant enterococcal species. Likewise, P. aeruginosa, P. mirabilis, and A. baumannii were all more frequently seen in the group treated inappropriately than in the group getting appropriate empiric coverage. A mixed infection was also more likely to be present among those not exposed (16.5%) than among those exposed (7.5%) to appropriate early therapy (P = 0.001) (Figure 1).
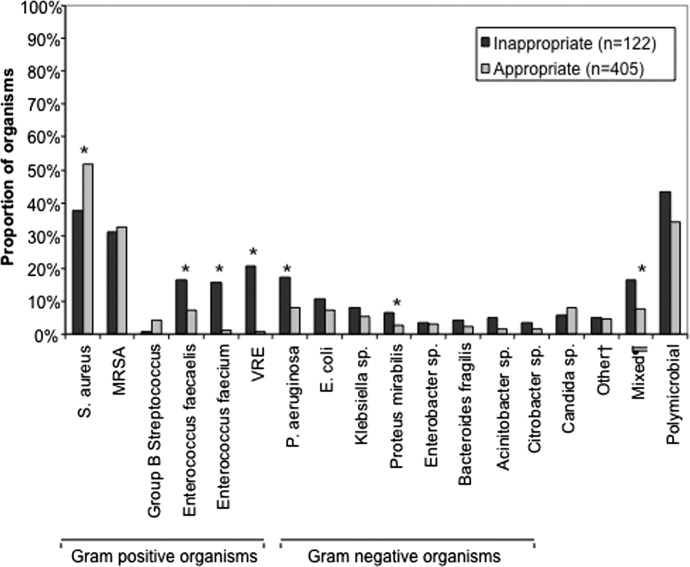
In terms of processes of care and outcomes (Table 3), commensurate with the higher prevalence of abscess in the appropriately treated group, the rate of I&D was significantly higher in this cohort (36.8%) than in the inappropriately treated (23.0%) group (P = 0.005). Need for initial ICU care did not differ as a function of appropriateness of therapy (P = 0.635).
| Inappropriate (n = 122) | Appropriate (n = 405) | P Value | |
|---|---|---|---|
| |||
| I&D/debridement | 28 (23.0%) | 149 (36.8%) | 0.005 |
| I&D in ED | 0 | 7 (1.7) | 0.361 |
| ICU | 9 (7.4%) | 25 (6.2%) | 0.635 |
| Hospital LOS, days | |||
| Median (IQR 25, 75) [Range] | 7.0 (4.2, 13.6) [0.686.6] | 6 (3.3, 10.1) [0.748.3] | 0.026 |
| Hospital mortality | 9 (7.4%) | 26 (6.4%) | 0.710 |
The unadjusted mortality rate was low overall and did not vary based on initial treatment (Table 3). In a generalized linear model with the log‐transformed LOS as the dependent variable, adjusting for multiple potential confounders, initial inappropriate antibiotic therapy had an attributable incremental increase in the hospital LOS of 1.8 days (95% CI, 1.42.3) (Table 4).
| Factor | Attributable LOS (days) | 95% CI | P Value |
|---|---|---|---|
| |||
| Infection type: device | 3.6 | 2.74.8 | <0.001 |
| Infection type: decubitus ulcer | 3.3 | 2.64.2 | <0.001 |
| Infection type: abscess | 2.5 | 1.64.0 | <0.001 |
| Organism: P. mirabilis | 2.2 | 1.43.4 | <0.001 |
| Organism: E. faecalis | 2.1 | 1.72.6 | <0.001 |
| Nursing home resident | 2.1 | 1.62.6 | <0.001 |
| Inappropriate antibiotic | 1.8 | 1.42.3 | <0.001 |
| Race: Non‐Caucasian | 0.31 | 0.240.41 | <0.001 |
| Organism: E. faecium | 0.23 | 0.150.35 | <0.001 |
Because bacteremia is known to be an effect modifier of the relationship between the empiric choice of antibiotic and infection outcomes, we further explored its role in the HCAI cSSSI on the outcomes of interest (Table 5). Similar to the effect detected in the overall cohort, treatment with inappropriate therapy was associated with an increase in the hospital LOS, but not hospital mortality in those with bacteremia, though this phenomenon was observed only among patients with secondary bacteremia, and not among those without (Table 5).
| Bacteremia Present (n = 318) | Bacteremia Absent (n = 209) | |||||
|---|---|---|---|---|---|---|
| I (n = 84) | A (n = 234) | P Value | I (n = 38) | A (n = 171) | P Value | |
| ||||||
| Hospital LOS, days | ||||||
| Mean SD | 14.4 27.5 | 9.8 9.7 | 0.041 | 6.6 6.8 | 6.9 8.2 | 0.761 |
| Median (IQR 25, 75) | 8.8 (5.4, 13.9) | 7.0 (4.3, 11.7) | 4.4 (2.4, 7.7) | 3.9 (2.0, 8.2) | ||
| Hospital mortality | 8 (9.5%) | 24 (10.3%) | 0.848 | 1 (2.6%) | 2 (1.2%) | 0.454 |
Discussion
This retrospective analysis provides evidence that inappropriate empiric antibiotic therapy for HCA‐cSSSI independently prolongs hospital LOS. The impact of inappropriate initial treatment on LOS is independent of many important confounders. In addition, we observed that this effect, while present among patients with secondary bacteremia, is absent among those without a blood stream infection.
To the best of our knowledge, ours is the first cohort study to examine the outcomes associated with inappropriate treatment of a HCAI cSSSI within the context of available microbiology data. Edelsberg et al.8 examined clinical and economic outcomes associated with the failure of the initial treatment of cSSSI. While not specifically focusing on HCAI patients, these authors noted an overall 23% initial therapy failure rate. Among those patients who failed initial therapy, the risk of hospital death was nearly 3‐fold higher (adjusted odds ratio [OR], 2.91; 95% CI, 2.343.62), and they incurred the mean of 5.4 additional hospital days, compared to patients treated successfully with the initial regimen.8 Our study confirms Edelsberg et al.'s8 observation of prolonged hospital LOS in association with treatment failure, and builds upon it by defining the actual LOS increment attributable to inappropriate empiric therapy. It is worth noting that the study by Edelsberg et al.,8 however, lacked explicit definition of the HCAI population and microbiology data, and used treatment failure as a surrogate marker for inappropriate treatment. It is likely these differences between our two studies in the underlying population and exposure definitions that account for the differences in the mortality data between that study and ours.
It is not fundamentally surprising that early exposure to inappropriate empiric therapy alters healthcare resource utilization outcomes for the worse. Others have demonstrated that infection with a resistant organism results in prolongation of hospital LOS and costs. For example, in a large cohort of over 600 surgical hospitalizations requiring treatment for a gram‐negative infection, antibiotic resistance was an independent predictor of increased LOS and costs.15 These authors quantified the incremental burden of early gram‐negative resistance at over $11,000 in hospital costs.15 Unfortunately, the treatment differences for resistant and sensitive organisms were not examined.15 Similarly, Shorr et al. examined risk factors for prolonged hospital LOS and increased costs in a cohort of 291 patients with MRSA sterile site infection.17 Because in this study 23% of the patients received inappropriate empiric therapy, the authors were able to examine the impact of this exposure on utilization outcomes.17 In an adjusted analysis, inappropriate initial treatment was associated with an incremental increase in the LOS of 2.5 days, corresponding to the unadjusted cost differential of nearly $6,000.17 Although focusing on a different population, our results are consistent with these previous observations that antibiotic resistance and early inappropriate therapy affect hospital utilization parameters, in our case by adding nearly 2 days to the hospital LOS.
Our study has a number of limitations. First, as a retrospective cohort study it is prone to various forms of bias, most notably selection bias. To minimize the possibility of such, we established a priori case definitions and enrolled consecutive patients over a specific period of time. Second, as in any observational study, confounding is an issue. We dealt with this statistically by constructing a multivariable regression model; however, the possibility of residual confounding remains. Third, because some of the wound and ulcer cultures likely were obtained with a swab and thus represented colonization, rather than infection, we may have over‐estimated the rate of inappropriate therapy, and this needs to be followed up in future prospective studies. Similarly, we may have over‐estimated the likelihood of inappropriate therapy among polymicrobial and mixed infections as well, given that, for example, a gram‐negative organism may carry a different clinical significance when cultured from blood (infection) than when it is detected in a decubitus ulcer (potential colonization). Fourth, because we limited our cohort to patients without deep‐seated infections, such as necrotizing fasciitis, other procedures were not collected. This omission may have led to either over‐estimation or under‐estimation of the impact of inappropriate therapy on the outcomes of interest.
The fact that our cohort represents a single large urban academic tertiary care medical center may limit the generalizability of our results only to centers that share similar characteristics. Finally, similar to most other studies of this type, ours lacks data on posthospitalization outcomes and for this reason limits itself to hospital outcomes only.
In summary, we have shown that, similar to other populations with HCAI, a substantial proportion (nearly 1/4) of cSSSI patients with HCAI receive inappropriate empiric therapy for their infection, and this early exposure, though not affecting hospital mortality, is associated with a significant prolongation of the hospitalization by as much as 2 days. Studies are needed to refine decision rules for risk‐stratifying patients with cSSSI HCAI in order to determine the probability of infection with a resistant organism. In turn, such instruments at the bedside may assure improved utilization of appropriately targeted empiric therapy that will both optimize individual patient outcomes and reduce the risk of emergence of antimicrobial resistance.
Appendix
| Principal diagnosis code | Description |
|---|---|
| 680 | Carbuncle and furuncle |
| 681 | Cellulitis and abscess of finger and toe |
| 682 | Other cellulitis and abscess |
| 683 | Acute lymphadenitis |
| 685 | Pilonidal cyst with abscess |
| 686 | Other local infections of skin and subcutaneous tissue |
| 707 | Decubitus ulcer |
| 707.1 | Ulcers of lower limbs, except decubitus |
| 707.8 | Chronic ulcer of other specified sites |
| 707.9 | Chronic ulcer of unspecified site |
| 958.3 | Posttraumatic wound infection, not elsewhere classified |
| 996.62 | Infection due to other vascular device, implant, and graft |
| 997.62 | Infection (chronic) of amputation stump |
| 998.5 | Postoperative wound infection |
| Diagnosis code | Description |
|---|---|
| 728.86 | Necrotizing fasciitis |
| 785.4 | Gangrene |
| 686.09 | Ecthyma gangrenosum |
| 730.00730.2 | Osteomyelitis |
| 630677 | Complications of pregnancy, childbirth and puerperium |
| 288.0 | Neutropenia |
| 684 | Impetigo |
| Procedure code | |
| 39.95 | Plasmapheresis |
| 99.71 | Hemoperfusion |
- ,,, et al.Invasive methicillin‐resistant Staphylococcus aureus infections in the United States.JAMA.2007;298:1762–1771.
- ,,, et al.Methicillin‐resistant S. aureus infections among patients in the emergency department.N Engl J Med.2006;17;355:666–674.
- Hospital‐Acquired Pneumonia Guideline Committee of the American Thoracic Society and Infectious Diseases Society of America.Guidelines for the management of adults with hospital‐acquired pneumonia, ventilator‐associated pneumonia, and healthcare‐associated pneumonia.Am J Respir Crit Care Med.2005;171:388–416.
- ,,, et al.Epidemiology and outcomes of health‐care‐associated pneumonia: Results from a large US database of culture‐positive pneumonia.Chest.2005;128:3854–3862.
- ,,, et al.Health care‐associated bloodstream infections in adults: A reason to change the accepted definition of community‐acquired infections.Ann Intern Med.2002;137:791–797.
- ,,,,,.Healthcare‐associated bloodstream infection: A distinct entity? Insights from a large U.S. database.Crit Care Med.2006;34:2588–2595.
- ,,, et al.Health care‐associated pneumonia and community‐acquired pneumonia: a single‐center experience.Antimicrob Agents Chemother.2007;51:3568–3573.
- ,,,,,.Clinical and economic consequences of failure of initial antibiotic therapy for hospitalized patients with complicated skin and skin‐structure infections.Infect Control Hosp Epidemiol.2008;29:160–169.
- ,,, et al.Skin, soft tissue, bone, and joint infections in hospitalized patients: Epidemiology and microbiological, clinical, and economic outcomes.Infect Control Hosp Epidemiol.2007;28:1290–1298.
- ,,, et al.Methicillin‐resistant Staphylococcus aureus sterile‐site infection: The importance of appropriate initial antimicrobial treatment.Crit Care Med.2006;34:2069–2074.
- ,,, et al.The influence of inadequate antimicrobial treatment of bloodstream infections on patient outcomes in the ICU setting.Chest.2000;118:146–155.
- ,.Modification of empiric antibiotic treatment in patients with pneumonia acquired in the intensive care unit.Intensive Care Med.1996;22:387–394.
- ,,, et al.Clinical importance of delays in the initiation of appropriate antibiotic treatment for ventilator‐associated pneumonia.Chest.2002;122:262–268.
- ,,,,.Antimicrobial therapy escalation and hospital mortality among patients with HCAP: A single center experience.Chest.2008;134:963–968.
- ,,, et al.Cost of gram‐negative resistance.Crit Care Med.2007;35:89–95.
- ,,, et al.Epidemiology and outcomes of hospitalizations with complicated skin and skin‐structure infections: implications of healthcare‐associated infection risk factors.Infect Control Hosp Epidemiol.2009;30:1203–1210.
- ,,.Inappropriate therapy for methicillin‐resistant Staphylococcus aureus: resource utilization and cost implications.Crit Care Med.2008;36:2335–2340.
Classically, infections have been categorized as either community‐acquired (CAI) or nosocomial in origin. Until recently, this scheme was thought adequate to capture the differences in the microbiology and outcomes in the corresponding scenarios. However, recent evidence suggests that this distinction may no longer be valid. For example, with the spread and diffusion of healthcare delivery beyond the confines of the hospital along with the increasing use of broad spectrum antibiotics both in and out of the hospital, pathogens such as methicillin‐resistant Staphylococcus aureus (MRSA) and Pseudomonas aeruginosa (PA), traditionally thought to be confined to the hospital, are now seen in patients presenting from the community to the emergency department (ED).1, 2 Reflecting this shift in epidemiology, some national guidelines now recognize healthcare‐associated infection (HCAI) as a distinct entity.3 The concept of HCAI allows the clinician to identify patients who, despite suffering a community onset infection, still may be at risk for a resistant bacterial pathogen. Recent studies in both bloodstream infection and pneumonia have clearly demonstrated that those with HCAI have distinct microbiology and outcomes relative to those with pure CAI.47
Most work focusing on establishing HCAI has not addressed skin and soft tissue infections. These infections, although not often fatal, account for an increasing number of admissions to the hospital.8, 9 In addition, they may be associated with substantial morbidity and cost.8 Given that many pathogens such as S. aureus, which may be resistant to typical antimicrobials used in the ED, are also major culprits in complicated skin and skin structure infections (cSSSI), the HCAI paradigm may apply in cSSSI. Furthermore, because of these patterns of increased resistance, HCA‐cSSSI patients, similar to other HCAI groups, may be at an increased risk of being treated with initially inappropriate antibiotic therapy.7, 10
Since in the setting of other types of infection inappropriate empiric treatment has been shown to be associated with increased mortality and costs,7, 1015 and since indirect evidence suggests a similar impact on healthcare utilization among cSSSI patients,8 we hypothesized that among a cohort of patients hospitalized with a cSSSI, the initial empiric choice of therapy is independently associated with hospital length of stay (LOS). We performed a retrospective cohort study to address this question.
Methods
Study Design
We performed a single‐center retrospective cohort study of patients with cSSSI admitted to the hospital through the ED. All consecutive patients hospitalized between April 2006 and December 2007 meeting predefined inclusion criteria (see below) were enrolled. The study was approved by the Washington University School of Medicine Human Studies Committee, and informed consent was waived. We have previously reported on the characteristics and outcomes of this cohort, including both community‐acquired and HCA‐cSSSI patients.16
Study Cohort
All consecutive patients admitted from the community through the ED between April 2006 and December 2007 at the Barnes‐Jewish Hospital, a 1200‐bed university‐affiliated, urban teaching hospital in St. Louis, MO were included if: (1) they had a diagnosis of a predefined cSSSI (see Appendix Table A1, based on reference 8) and (2) they had a positive microbiology culture obtained within 24 hours of hospital admission. Similar to the work by Edelsberg et al.8 we excluded patients if certain diagnoses and procedures were present (Appendix Table A2). Cases were also excluded if they represented a readmission for the same diagnosis within 30 days of the original hospitalization.
Definitions
HCAI was defined as any cSSSI in a patient with a history of recent hospitalization (within the previous year, consistent with the previous study16), receiving antibiotics prior to admission (previous 90 days), transferring from a nursing home, or needing chronic dialysis. We defined a polymicrobial infection as one with more than one organism, and mixed infection as an infection with both a gram‐positive and a gram‐negative organism. Inappropriate empiric therapy took place if a patient did not receive treatment within 24 hours of the time the culture was obtained with an agent exhibiting in vitro activity against the isolated pathogen(s). In mixed infections, appropriate therapy was treatment within 24 hours of culture being obtained with agent(s) active against all pathogens recovered.
Data Elements
We collected information about multiple baseline demographic and clinical factors including: age, gender, race/ethnicity, comorbidities, the presence of risk factors for HCAI, the presence of bacteremia at admission, and the location of admission (ward vs. intensive care unit [ICU]). Bacteriology data included information on specific bacterium/a recovered from culture, the site of the culture (eg, tissue, blood), susceptibility patterns, and whether the infection was monomicrobial, polymicrobial, or mixed. When blood culture was available and positive, we prioritized this over wound and other cultures and designated the corresponding organism as the culprit in the index infection. Cultures growing our coagulase‐negative S. aureus were excluded as a probable contaminant. Treatment data included information on the choice of the antimicrobial therapy and the timing of its institution relative to the timing of obtaining the culture specimen. The presence of such procedures as incision and drainage (I&D) or debridement was recorded.
Statistical Analyses
Descriptive statistics comparing HCAI patients treated appropriately to those receiving inappropriate empiric coverage based on their clinical, demographic, microbiologic and treatment characteristics were computed. Hospital LOS served as the primary and hospital mortality as the secondary outcomes, comparing patients with HCAI treated appropriately to those treated inappropriately. All continuous variables were compared using Student's t test or the Mann‐Whitney U test as appropriate. All categorical variables were compared using the chi‐square test or Fisher's exact test. To assess the attributable impact of inappropriate therapy in HCAI on the outcomes of interest, general linear models with log transformation were developed to model hospital LOS parameters; all means are presented as geometric means. All potential risk factors significant at the 0.1 level in univariate analyses were entered into the model. All calculations were performed in Stata version 9 (Statacorp, College Station, TX).
Results
Of the 717 patients with culture‐positive cSSSI admitted during the study period, 527 (73.5%) were classified as HCAI. The most common reason for classification as an HCAI was recent hospitalization. Among those with an HCA‐cSSSI, 405 (76.9%) received appropriate empiric treatment, with nearly one‐quarter receiving inappropriate initial coverage. Those receiving inappropriate antibiotic were more likely to be African American, and had a higher likelihood of having end‐stage renal disease (ESRD) than those with appropriate coverage (Table 1). While those patients treated appropriately had higher rates of both cellulitis and abscess as the presenting infection, a substantially higher proportion of those receiving inappropriate initial treatment had a decubitus ulcer (29.5% vs. 10.9%, P <0.001), a device‐associated infection (42.6% vs. 28.6%, P = 0.004), and had evidence of bacteremia (68.9% vs. 57.8%, P = 0.028) than those receiving appropriate empiric coverage (Table 2).
| Inappropriate (n = 122), n (%) | Appropriate (n = 405), n (%) | P Value | |
|---|---|---|---|
| |||
| Age, years | 56.3 18.0 | 53.6 16.7 | 0.147 |
| Gender (F) | 62 (50.8) | 190 (46.9) | 0.449 |
| Race | |||
| Caucasian | 51 (41.8) | 219 (54.1) | 0.048 |
| African American | 68 (55.7) | 178 (43.9) | |
| Other | 3 (2.5) | 8 (2.0) | |
| HCAI risk factors | |||
| Recent hospitalization* | 110 (90.2) | 373 (92.1) | 0.498 |
| Within 90 days | 98 (80.3) | 274 (67.7) | 0.007 |
| >90 and 180 days | 52 (42.6) | 170 (42.0) | 0.899 |
| >180 days and 1 year | 46 (37.7) | 164 (40.5) | 0.581 |
| Prior antibiotics | 26 (21.3) | 90 (22.2) | 0.831 |
| Nursing home resident | 29 (23.8) | 54 (13.3) | 0.006 |
| Hemodialysis | 19 (15.6) | 39 (9.7) | 0.067 |
| Comorbidities | |||
| DM | 40 (37.8) | 128 (31.6) | 0.806 |
| PVD | 5 (4.1) | 15 (3.7) | 0.841 |
| Liver disease | 6 (4.9) | 33 (8.2) | 0.232 |
| Cancer | 21 (17.2) | 85 (21.0) | 0.362 |
| HIV | 1 (0.8) | 12 (3.0) | 0.316 |
| Organ transplant | 2 (1.6) | 8 (2.0) | 1.000 |
| Autoimmune disease | 5 (4.1) | 8 (2.0) | 0.185 |
| ESRD | 22 (18.0) | 46 (11.4) | 0.054 |
| Inappropriate (n = 122), n (%) | Appropriate (n = 405), n (%) | P Value | |
|---|---|---|---|
| |||
| Cellulitis | 28 (23.0) | 171 (42.2) | <0.001 |
| Decubitus ulcer | 36 (29.5) | 44 (10.9) | <0.001 |
| Post‐op wound | 25 (20.5) | 75 (18.5) | 0.626 |
| Device‐associated infection | 52 (42.6) | 116 (28.6) | 0.004 |
| Diabetic foot ulcer | 9 (7.4) | 24 (5.9) | 0.562 |
| Abscess | 22 (18.0) | 108 (26.7) | 0.052 |
| Other* | 2 (1.6) | 17 (4.2) | 0.269 |
| Presence of bacteremia | 84 (68.9) | 234 (57.8) | 0.028 |
The pathogens recovered from the appropriately and inappropriately treated groups are listed in Figure 1. While S. aureus overall was more common among those treated appropriately, the frequency of MRSA did not differ between the groups. Both E. faecalis and E. faecium were recovered more frequently in the inappropriate group, resulting in a similar pattern among the vancomycin‐resistant enterococcal species. Likewise, P. aeruginosa, P. mirabilis, and A. baumannii were all more frequently seen in the group treated inappropriately than in the group getting appropriate empiric coverage. A mixed infection was also more likely to be present among those not exposed (16.5%) than among those exposed (7.5%) to appropriate early therapy (P = 0.001) (Figure 1).
In terms of processes of care and outcomes (Table 3), commensurate with the higher prevalence of abscess in the appropriately treated group, the rate of I&D was significantly higher in this cohort (36.8%) than in the inappropriately treated (23.0%) group (P = 0.005). Need for initial ICU care did not differ as a function of appropriateness of therapy (P = 0.635).
| Inappropriate (n = 122) | Appropriate (n = 405) | P Value | |
|---|---|---|---|
| |||
| I&D/debridement | 28 (23.0%) | 149 (36.8%) | 0.005 |
| I&D in ED | 0 | 7 (1.7) | 0.361 |
| ICU | 9 (7.4%) | 25 (6.2%) | 0.635 |
| Hospital LOS, days | |||
| Median (IQR 25, 75) [Range] | 7.0 (4.2, 13.6) [0.686.6] | 6 (3.3, 10.1) [0.748.3] | 0.026 |
| Hospital mortality | 9 (7.4%) | 26 (6.4%) | 0.710 |
The unadjusted mortality rate was low overall and did not vary based on initial treatment (Table 3). In a generalized linear model with the log‐transformed LOS as the dependent variable, adjusting for multiple potential confounders, initial inappropriate antibiotic therapy had an attributable incremental increase in the hospital LOS of 1.8 days (95% CI, 1.42.3) (Table 4).
| Factor | Attributable LOS (days) | 95% CI | P Value |
|---|---|---|---|
| |||
| Infection type: device | 3.6 | 2.74.8 | <0.001 |
| Infection type: decubitus ulcer | 3.3 | 2.64.2 | <0.001 |
| Infection type: abscess | 2.5 | 1.64.0 | <0.001 |
| Organism: P. mirabilis | 2.2 | 1.43.4 | <0.001 |
| Organism: E. faecalis | 2.1 | 1.72.6 | <0.001 |
| Nursing home resident | 2.1 | 1.62.6 | <0.001 |
| Inappropriate antibiotic | 1.8 | 1.42.3 | <0.001 |
| Race: Non‐Caucasian | 0.31 | 0.240.41 | <0.001 |
| Organism: E. faecium | 0.23 | 0.150.35 | <0.001 |
Because bacteremia is known to be an effect modifier of the relationship between the empiric choice of antibiotic and infection outcomes, we further explored its role in the HCAI cSSSI on the outcomes of interest (Table 5). Similar to the effect detected in the overall cohort, treatment with inappropriate therapy was associated with an increase in the hospital LOS, but not hospital mortality in those with bacteremia, though this phenomenon was observed only among patients with secondary bacteremia, and not among those without (Table 5).
| Bacteremia Present (n = 318) | Bacteremia Absent (n = 209) | |||||
|---|---|---|---|---|---|---|
| I (n = 84) | A (n = 234) | P Value | I (n = 38) | A (n = 171) | P Value | |
| ||||||
| Hospital LOS, days | ||||||
| Mean SD | 14.4 27.5 | 9.8 9.7 | 0.041 | 6.6 6.8 | 6.9 8.2 | 0.761 |
| Median (IQR 25, 75) | 8.8 (5.4, 13.9) | 7.0 (4.3, 11.7) | 4.4 (2.4, 7.7) | 3.9 (2.0, 8.2) | ||
| Hospital mortality | 8 (9.5%) | 24 (10.3%) | 0.848 | 1 (2.6%) | 2 (1.2%) | 0.454 |
Discussion
This retrospective analysis provides evidence that inappropriate empiric antibiotic therapy for HCA‐cSSSI independently prolongs hospital LOS. The impact of inappropriate initial treatment on LOS is independent of many important confounders. In addition, we observed that this effect, while present among patients with secondary bacteremia, is absent among those without a blood stream infection.
To the best of our knowledge, ours is the first cohort study to examine the outcomes associated with inappropriate treatment of a HCAI cSSSI within the context of available microbiology data. Edelsberg et al.8 examined clinical and economic outcomes associated with the failure of the initial treatment of cSSSI. While not specifically focusing on HCAI patients, these authors noted an overall 23% initial therapy failure rate. Among those patients who failed initial therapy, the risk of hospital death was nearly 3‐fold higher (adjusted odds ratio [OR], 2.91; 95% CI, 2.343.62), and they incurred the mean of 5.4 additional hospital days, compared to patients treated successfully with the initial regimen.8 Our study confirms Edelsberg et al.'s8 observation of prolonged hospital LOS in association with treatment failure, and builds upon it by defining the actual LOS increment attributable to inappropriate empiric therapy. It is worth noting that the study by Edelsberg et al.,8 however, lacked explicit definition of the HCAI population and microbiology data, and used treatment failure as a surrogate marker for inappropriate treatment. It is likely these differences between our two studies in the underlying population and exposure definitions that account for the differences in the mortality data between that study and ours.
It is not fundamentally surprising that early exposure to inappropriate empiric therapy alters healthcare resource utilization outcomes for the worse. Others have demonstrated that infection with a resistant organism results in prolongation of hospital LOS and costs. For example, in a large cohort of over 600 surgical hospitalizations requiring treatment for a gram‐negative infection, antibiotic resistance was an independent predictor of increased LOS and costs.15 These authors quantified the incremental burden of early gram‐negative resistance at over $11,000 in hospital costs.15 Unfortunately, the treatment differences for resistant and sensitive organisms were not examined.15 Similarly, Shorr et al. examined risk factors for prolonged hospital LOS and increased costs in a cohort of 291 patients with MRSA sterile site infection.17 Because in this study 23% of the patients received inappropriate empiric therapy, the authors were able to examine the impact of this exposure on utilization outcomes.17 In an adjusted analysis, inappropriate initial treatment was associated with an incremental increase in the LOS of 2.5 days, corresponding to the unadjusted cost differential of nearly $6,000.17 Although focusing on a different population, our results are consistent with these previous observations that antibiotic resistance and early inappropriate therapy affect hospital utilization parameters, in our case by adding nearly 2 days to the hospital LOS.
Our study has a number of limitations. First, as a retrospective cohort study it is prone to various forms of bias, most notably selection bias. To minimize the possibility of such, we established a priori case definitions and enrolled consecutive patients over a specific period of time. Second, as in any observational study, confounding is an issue. We dealt with this statistically by constructing a multivariable regression model; however, the possibility of residual confounding remains. Third, because some of the wound and ulcer cultures likely were obtained with a swab and thus represented colonization, rather than infection, we may have over‐estimated the rate of inappropriate therapy, and this needs to be followed up in future prospective studies. Similarly, we may have over‐estimated the likelihood of inappropriate therapy among polymicrobial and mixed infections as well, given that, for example, a gram‐negative organism may carry a different clinical significance when cultured from blood (infection) than when it is detected in a decubitus ulcer (potential colonization). Fourth, because we limited our cohort to patients without deep‐seated infections, such as necrotizing fasciitis, other procedures were not collected. This omission may have led to either over‐estimation or under‐estimation of the impact of inappropriate therapy on the outcomes of interest.
The fact that our cohort represents a single large urban academic tertiary care medical center may limit the generalizability of our results only to centers that share similar characteristics. Finally, similar to most other studies of this type, ours lacks data on posthospitalization outcomes and for this reason limits itself to hospital outcomes only.
In summary, we have shown that, similar to other populations with HCAI, a substantial proportion (nearly 1/4) of cSSSI patients with HCAI receive inappropriate empiric therapy for their infection, and this early exposure, though not affecting hospital mortality, is associated with a significant prolongation of the hospitalization by as much as 2 days. Studies are needed to refine decision rules for risk‐stratifying patients with cSSSI HCAI in order to determine the probability of infection with a resistant organism. In turn, such instruments at the bedside may assure improved utilization of appropriately targeted empiric therapy that will both optimize individual patient outcomes and reduce the risk of emergence of antimicrobial resistance.
Appendix
| Principal diagnosis code | Description |
|---|---|
| 680 | Carbuncle and furuncle |
| 681 | Cellulitis and abscess of finger and toe |
| 682 | Other cellulitis and abscess |
| 683 | Acute lymphadenitis |
| 685 | Pilonidal cyst with abscess |
| 686 | Other local infections of skin and subcutaneous tissue |
| 707 | Decubitus ulcer |
| 707.1 | Ulcers of lower limbs, except decubitus |
| 707.8 | Chronic ulcer of other specified sites |
| 707.9 | Chronic ulcer of unspecified site |
| 958.3 | Posttraumatic wound infection, not elsewhere classified |
| 996.62 | Infection due to other vascular device, implant, and graft |
| 997.62 | Infection (chronic) of amputation stump |
| 998.5 | Postoperative wound infection |
| Diagnosis code | Description |
|---|---|
| 728.86 | Necrotizing fasciitis |
| 785.4 | Gangrene |
| 686.09 | Ecthyma gangrenosum |
| 730.00730.2 | Osteomyelitis |
| 630677 | Complications of pregnancy, childbirth and puerperium |
| 288.0 | Neutropenia |
| 684 | Impetigo |
| Procedure code | |
| 39.95 | Plasmapheresis |
| 99.71 | Hemoperfusion |
- ,,, et al.Invasive methicillin‐resistant Staphylococcus aureus infections in the United States.JAMA.2007;298:1762–1771.
- ,,, et al.Methicillin‐resistant S. aureus infections among patients in the emergency department.N Engl J Med.2006;17;355:666–674.
- Hospital‐Acquired Pneumonia Guideline Committee of the American Thoracic Society and Infectious Diseases Society of America.Guidelines for the management of adults with hospital‐acquired pneumonia, ventilator‐associated pneumonia, and healthcare‐associated pneumonia.Am J Respir Crit Care Med.2005;171:388–416.
- ,,, et al.Epidemiology and outcomes of health‐care‐associated pneumonia: Results from a large US database of culture‐positive pneumonia.Chest.2005;128:3854–3862.
- ,,, et al.Health care‐associated bloodstream infections in adults: A reason to change the accepted definition of community‐acquired infections.Ann Intern Med.2002;137:791–797.
- ,,,,,.Healthcare‐associated bloodstream infection: A distinct entity? Insights from a large U.S. database.Crit Care Med.2006;34:2588–2595.
- ,,, et al.Health care‐associated pneumonia and community‐acquired pneumonia: a single‐center experience.Antimicrob Agents Chemother.2007;51:3568–3573.
- ,,,,,.Clinical and economic consequences of failure of initial antibiotic therapy for hospitalized patients with complicated skin and skin‐structure infections.Infect Control Hosp Epidemiol.2008;29:160–169.
- ,,, et al.Skin, soft tissue, bone, and joint infections in hospitalized patients: Epidemiology and microbiological, clinical, and economic outcomes.Infect Control Hosp Epidemiol.2007;28:1290–1298.
- ,,, et al.Methicillin‐resistant Staphylococcus aureus sterile‐site infection: The importance of appropriate initial antimicrobial treatment.Crit Care Med.2006;34:2069–2074.
- ,,, et al.The influence of inadequate antimicrobial treatment of bloodstream infections on patient outcomes in the ICU setting.Chest.2000;118:146–155.
- ,.Modification of empiric antibiotic treatment in patients with pneumonia acquired in the intensive care unit.Intensive Care Med.1996;22:387–394.
- ,,, et al.Clinical importance of delays in the initiation of appropriate antibiotic treatment for ventilator‐associated pneumonia.Chest.2002;122:262–268.
- ,,,,.Antimicrobial therapy escalation and hospital mortality among patients with HCAP: A single center experience.Chest.2008;134:963–968.
- ,,, et al.Cost of gram‐negative resistance.Crit Care Med.2007;35:89–95.
- ,,, et al.Epidemiology and outcomes of hospitalizations with complicated skin and skin‐structure infections: implications of healthcare‐associated infection risk factors.Infect Control Hosp Epidemiol.2009;30:1203–1210.
- ,,.Inappropriate therapy for methicillin‐resistant Staphylococcus aureus: resource utilization and cost implications.Crit Care Med.2008;36:2335–2340.
Copyright © 2010 Society of Hospital Medicine

Early Prediction of Septic Shock
Severe sepsis is responsible for significant morbidity and mortality. In the United States, approximately 750,000 cases occur each year with an estimated mortality of 30% to 50%.1 Early goal‐directed therapy has been shown to decrease mortality in patients with severe sepsis and septic shock.2, 3 As a result, efforts have been focused toward providing early and aggressive intervention once sepsis has been established. In many cases this has been accomplished through the implementation of a protocol with guidelines for fluid management, antibiotic and vasopressor administration, and other interventions.410 Prior studies have demonstrated that care of hospitalized patients before intensive care unit (ICU) admission is often suboptimal,1113 and have suggested that patients with clear indicators of acute deterioration may go unrecognized on the ward. We previously reported the effects of implementing a hospital‐wide protocol for the management of severe sepsis,14 finding that although there was a significant reduction in overall mortality there was no difference for patients who developed severe sepsis on the hospital ward. This finding also suggests that the initial care of patients with severe sepsis on hospital wards may differ in intensity compared to emergency departments and ICUs. Failure on the part of the clinician to recognize the harbingers of impending sepsis before the onset of organ dysfunction or hypotension may contribute to a delay in aggressive therapy.
Previous efforts at early recognition of sepsis have relied on diagnostic studies or specific biomarkers to screen at‐risk patients. These have included such studies as messenger RNA (mRNA) expression,15 C‐reactive protein,16 procalcitonin in newborns,17 immunocompetence measures in burn patients,18 protein C concentration in neutropenic patients,19 and several immune markers (eg, tumor necrosis factor‐alpha, interleukin [IL]‐1 beta, IL‐6, IL‐8, and IL‐10).20 However, these biomarkers have been studied only in specific patient populations, require suspicion on the part of the clinician and the measurement of diagnostic or laboratory values that would otherwise not have been obtained. The ideal tool for predicting the onset of sepsis would be applicable to a broad patient population, not require specific suspicion on the part of the clinician, and use only routinely obtained clinical measurements and laboratory values.
Prediction models and scoring systems that use routine hemodynamic and laboratory values for several endpoints related to sepsis and septic shock have been developed. Many such tools are used to define severity of illness and predict outcome, while others have been developed to predict such events as bacteremia in patients presenting with fever,21 the probability of infection in the critically ill,22 and end‐organ dysfunction in severe sepsis.23 Little work has been done to develop such a model capable of predicting the onset of sepsis,24 and there have been no attempts to deploy a model as a large‐scale screening tool.
Our objective was to develop a simple algorithm that can be used in an automated fashion to screen hospitalized patients for impending septic shock. Such a model would be derived from routine hemodynamic and laboratory values, and take advantage of a computerized medical record system for data collection.
Patients and Methods
Patient Enrollment and Data Collection
This study was conducted at Barnes‐Jewish Hospital, St. Louis, MO, a university‐affiliated, urban teaching hospital. The study was approved by the Washington University (St. Louis, MO) School of Medicine Human Studies Committee. Patients included in the study where those hospitalized during 2005, 2006, and 2007, and who had at least 1 International Statistical Classification of Diseases and Related Health Problems, 9th edition (ICD9) discharge diagnosis code for the medical/nonsurgical diagnoses listed in Appendix 1. From this pool of patients, septic shock patients were identified as those who were admitted to the hospital ward and later developed septic shock requiring transfer to an ICU for vasopressor support and hemodynamic monitoring. This was accomplished by using discharge ICD9 codes for acute infection matched to codes for acute organ dysfunction and the need for vasopressors within 24 hours of ICU transfer (Appendix 1). The patients used as controls were then all those remaining in the pool once the septic shock patients were identified and separated.
Case patients were excluded from the analysis if they were transferred to the ICU within 2 hours of hospital admission, as these patients are unlikely to have an adequate amount of pretransfer clinical data available for analysis. Both case and control patients were excluded if they lacked any value for basic, routine laboratory data (serum sodium, chloride, total bicarbonate, urea nitrogen, creatinine, glucose, white blood cell count, neutrophil count, hemoglobin, hematocrit, and platelet count) and certain vital signs (blood pressure, heart rate, temperature). Patient data from 2005 were used in the derivation of the prediction model, and 2006 and 2007 patient data were used to prospectively validate the model. Clinical variables used in the analysis were selected based on both ease of access from the electronic medical record and clinical relevance, and are shown in Table 1.
|
| Age (years) |
| Albumin (g/dL) |
| Arterial blood gas (pH, PaCO2, PaO2) |
| Anion gap |
| Bilirubin (mg/dL) |
| BP, systolic and diastolic (mm of Hg) |
| Blood urea nitrogen (mg/dL) |
| Chloride (mmol/L) |
| Creatinine (mg/dL) |
| Glucose (mg/dL) |
| Hemoglobin (g/dL) |
| International normalized ratio |
| Neutrophil count, absolute (1 103/L) |
| Platelet count (1 103/L) |
| Pulse (beats/minute) |
| Pulse pressure (mm of Hg) |
| Shock index (pulse divided by systolic BP) |
| Sodium (mmol/L) |
| Total bicarbonate (mmol/L) |
| Temperature (degrees Celsius) |
| White blood cell count (1 103/L) |
In performing the Recursive Partitioning And Regression Tree (RPART) analysis to generate a prediction model, data for case patients were extracted in a window from 24 hours to 2 hours before ICU admission. The data collection window excluded the 2 hours prior to ICU transfer in order to minimize the effect of acute hemodynamic or laboratory changes that may have prompted the transfer; the purpose of the model is to identify hemodynamic and laboratory patterns in the several hours before the onset of clinically evident shock, so data from a time during which impending shock was clinically apparent were excluded. For the control patients, data from the first 48 hours of their hospitalization were included in the analysis.
Statistical Analysis
RPART analysis was performed on the 2005 patient data set to generate a prediction algorithm. This method of analysis results in a classification tree that contains a series of binary splits designed to separate patients into mutually exclusive subgroups.25 Each split in the tree is selected based on its ability to produce a partition with the greatest purity. Initially, a large tree that contains splits for all input variables is generated. This initial tree is generally too large to be useful as the final subgroups are too small to make sensible statistical inference.25 A pruning process is then applied to the initial tree with the goal of finding the subtree that is most predictive of the outcome of interest. The analysis was done using the RPART package of the R statistical analysis program, version 2.7.0 (R: A Language and Environment for Statistical Computing, R Development Core Team, Foundation for Statistical Computing, Vienna, Austria). The resulting classification tree was then used as a prediction algorithm and applied in a prospective fashion to the 2006 and 2007 patient data sets.
For the purpose of performing the RPART analysis, each set of case data entered into the analysis consisted of a random extraction of the desired clinical data within the specified extraction window from a single case patient. Thus, if a case patient had more than 1 value available for any variable of interest, 1 value was randomly selected to be entered in combination with the other available clinical data. Furthermore, in order to ensure that the majority of case patient data were included in the analysis, this process was iterated 10 times for each case patient. This resulted in 10 sets of case patient data being entered into the analysis for each case patient in the database, with each set containing a value for all variables of interest randomly extracted from those available for that patient. In addition to ensuring that the majority of case patient data were included, this technique also functionally expands the number of case patients present in the analysis. As there were far more control patients than case patients in the database, this in turn results in a classification tree that does not simply identify controls without regard to the relatively small number of case patients.
Data for the control patients entered into the analysis were extracted in a similar fashion, though only 1 set of data were included in the analysis for each control patient present in the database. As a result, only 1 randomly selected value per variable was included in the analysis.
Results
Patients
During 2005, 562 septic patients and 13,223 control patients were identified. For 2006 and 2007 there were 635 and 667 case patients, and 13,102 and 13,270 control patients, respectively.
Predictors of Sepsis
RPART analysis of the 2005 patient data set demonstrated that the most significant predictors of sepsis in the 24 hours preceding transfer to the medical ICU were the partial pressure of arterial oxygen (PaO2), systolic blood pressure, absolute neutrophil count, blood urea nitrogen (BUN), pH, bicarbonate, chloride, and albumin. This resulted in a simple algorithm with nine classification splits (Figure 1), which was then prospectively applied to the 2006 and 2007 patient data sets. These results are summarized in Table 2.
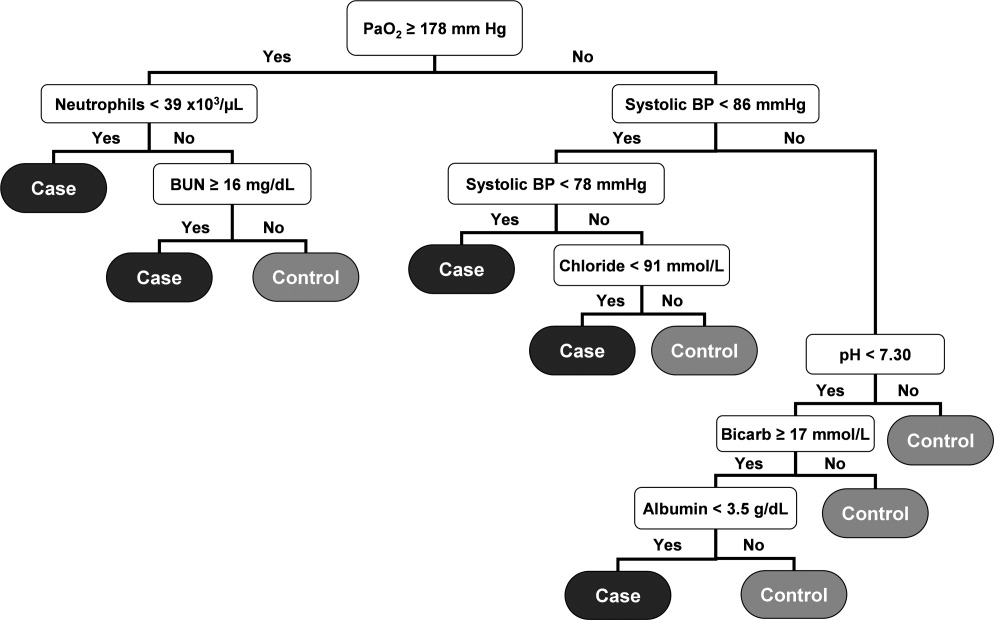
| Total Number | Number Correctly Classified (%) | Case Identification Time Before ICU Admission (minutes) | PPV (%) | NPV (%) | MCR (%) | |
|---|---|---|---|---|---|---|
| ||||||
| 2005 | 27.9 | 98.1 | 7.8 | |||
| Cases | 562 | 320 (56.9) | ||||
| Controls | 13,223 | 12,394 (93.7) | ||||
| 2006 | 179 230 | 28.7 | 97.7 | 8.4 | ||
| Cases | 635 | 347 (54.7) | ||||
| Controls | 13,102 | 12,241 (93.4) | ||||
| 2007 | 192 210 | 28.3 | 97.6 | 8.8 | ||
| Cases | 667 | 367 (55.0) | ||||
| Controls | 13,270 | 12,341 (93.0) | ||||
The resulting classification model had a low total misclassification rate for the 2005 data. Of the 562 septic patients, 320 (56.9%) were correctly classified, and 12,394 (93.7%) of the control patients were appropriately identified. The number of septic and control patients misclassified was 242 and 829, respectively, yielding a total misclassification rate of 7.8%. When applied to the 2006 patient data set, 347 (54.7%) of the 635 septic shock patients were correctly identified, while 12,241 (93.4%) of the 13,102 control patients were correctly classified. The total misclassification rate for the 2006 patient set was 8.4%. For the 2007 patient data, 367 (55.0%) of the 667 case patients were correctly identified, and 12,341 (93.0%) of the 13,270 control patients were correctly identified. This resulted in a total misclassification rate of 8.8%.
The 2006 and 2007 case patients were identified 179 230 minutes and 192 210 minutes before ICU transfer, respectively (Figure 2). The algorithm demonstrated positive and negative predictive values of 28.7% and 97.7% for the 2006 patient set, respectively, and 28.3% and 97.6% for the 2007 patient set, respectively.
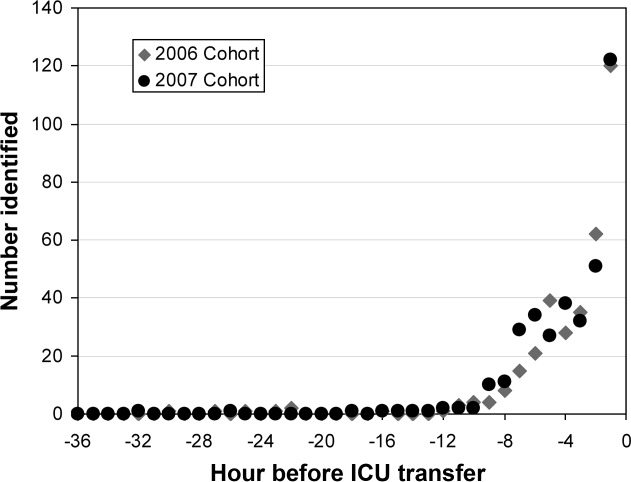
Although the prediction algorithm shown in Figure 1 identified the majority of the case patients with ample time for clinical intervention prior to ICU transfer, the analysis used to derive this model included values for the arterial blood gas (ABG). As this is not a routinely obtained study for hospitalized patients outside of an ICU, it is possible that the performance of this model can in part be attributed to clinical acumen rather than changes in patient physiology. The ABG would likely only be obtained in patients with a more concerning or deteriorating clinical course, and thus more likely to develop shock. To address this possibility, a second analysis was performed that did not include the values for the ABG. The result was an algorithm with 13 classification splits, as shown in Figure 3.
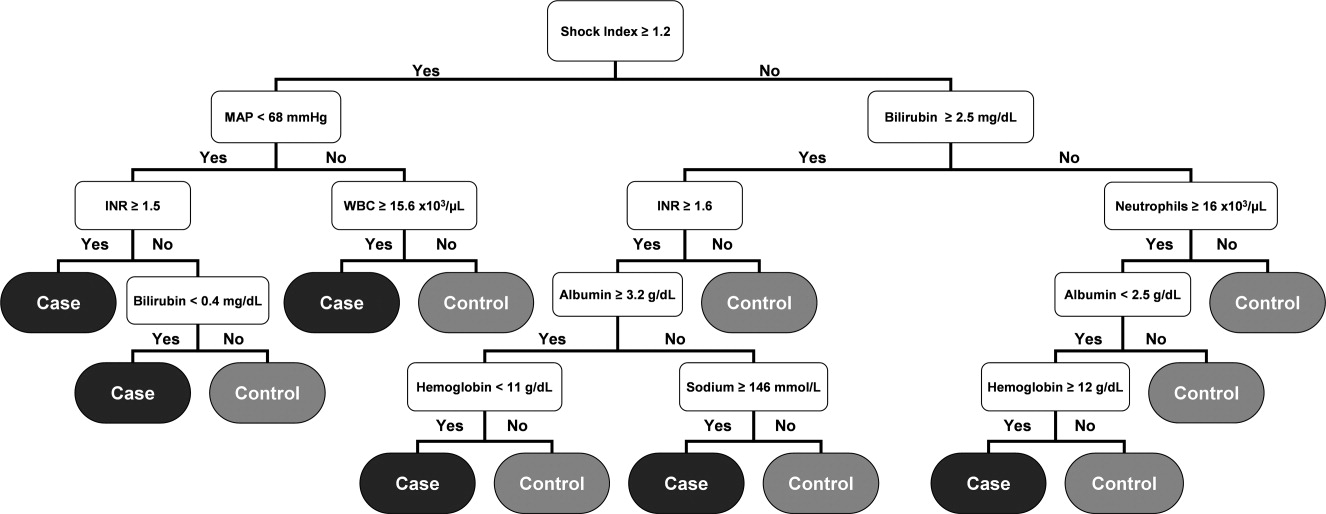
The most predictive clinical variables in this analysis included the shock index (heart rate divided by systolic blood pressure), mean arterial pressure, total bilirubin, international normalized ratio (INR), total white blood cell count, absolute neutrophil count, albumin, hemoglobin, and sodium. This model was again applied to the 2006 and 2007 patient data sets (Table 3).
| Total Number | Number Correctly Classified (%) | Case Identification Time Before ICU Admission (minutes) | PPV (%) | NPV (%) | MCR (%) | |
|---|---|---|---|---|---|---|
| ||||||
| 2005 | 20.5 | 96.7 | 6.7 | |||
| Cases | 562 | 126 (22.4) | ||||
| Controls | 13,223 | 12,735 (96.3) | ||||
| 2006 | 508 536 | 21.4 | 96.1 | 7.0 | ||
| Cases | 635 | 121 (19.1) | ||||
| Controls | 13,102 | 12,657 (96.6) | ||||
| 2007 | 496 512 | 19.5 | 95.8 | 7.1 | ||
| Cases | 667 | 102 (15.3) | ||||
| Controls | 13,270 | 12,850 (96.8) | ||||
The overall misclassification rates for 2006 and 2007 were 7.0% and 7.1%, respectively. The model correctly identified 121 (19.1%) of the 635 cases and 12,657 (96.6%) of the 13,102 control patients from 2006, and 102 (15.3%) of the 667 cases and 12,850 (96.8%) of the 13,270 control patients from 2007. The respective positive and negative predictive values were 21.4% and 96.1% for 2006, respectively, and 19.5% and 95.8% for 2007, respectively.
Although the overall performance of the model derived without the ABG data was not as good, the identification times prior to ICU transfer were significantly improved. For the 2006 data, patients were identified 508 536 minutes before transfer (Figure 4), compared to 179 230 minutes for the model that included the ABG data (P < 0.01). For the 2007 data, patients were identified 496 512 minutes prior to ICU admission (Figure 4), compared to 192 210 minutes for the previous model (P < 0.01).
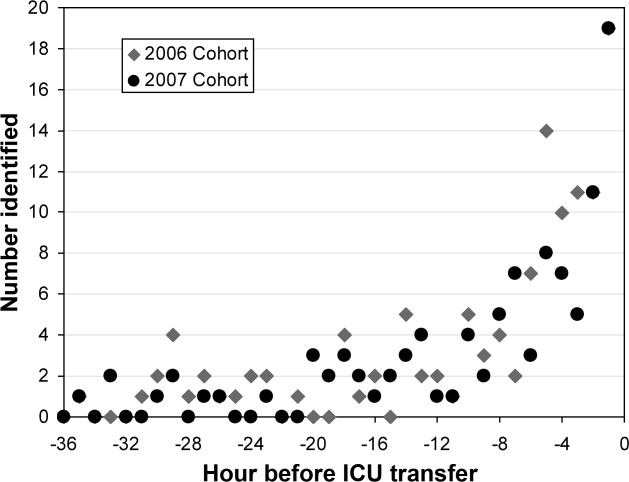
Discussion
We have demonstrated a simple method for generating an algorithm derived from routine laboratory and hemodynamic values that is capable of predicting the onset of sepsis in a significant proportion of non‐ICU patients. Two prediction models were generated, 1 with and 1 without ABG data included in the analysis. In the 2006 and 2007 validation cohorts, the model including these data correctly classified 54.7% and 55.0% of the patients who developed septic shock and 93.4% and 93.0% of control patients, respectively. The second model identified 19.1% and 15.3% of the septic shock patients and 96.6% and 96.8% of the control patients for 2006 and 2007, respectively. The methods used in generating this model are relatively simple and can be executed with the use of an electronic medical record system.
Early, goal‐directed cardiovascular resuscitation and adequate initial antibiotic therapy have been shown to decrease mortality in patients with severe sepsis and septic shock.2, 26 Prior studies employing early, targeted resuscitation strategies have demonstrated decreased use of vasopressors10 and decreased mortality.510 In addition, we previously demonstrated that a standardized order set for the management of severe sepsis in the emergency department that focused on early and aggressive intervention was associated with decreased 28‐day mortality.1 These studies suggest that early, aggressive management of septic shock can improve outcomes. Identification of patients prior to overt clinical deterioration may allow for early intervention aimed at preventing shock or improving its outcome.
The purpose of this method is to develop a model capable of recognizing patterns in clinical data that herald a patient's otherwise unidentified clinical deterioration. It is not intended to replace existing outcome prediction tools or severity of illness scoring systems, where a high degree of accuracy would be required. Rather, it would be best implemented as an automated screening tool incorporated into an electronic medical record system. When a hospitalized patient is identified as a possible septic shock patient by the classification tree, a notification is then issued to the clinicians caring for the patient. The primary goal of this method is to notify clinicians of potential clinical deterioration. Any action taken as a result of this notification is at the discretion of the clinician. This method could be employed for any population of hospitalized patients, though because of variations in clinical practice and patient physiology, different models would need to be generated for differing patient populations.
This method has limitations, the foremost of which is the possible instability of the resulting classification model. This type of analysis results in an algorithm that depends on binary splits to classify patients. In generating the algorithm, the recursive partitioning analysis selects the variables and cutoff values that result in the strongest decision tree with the most pure classifications at the end nodes. These variables and cutoff values may not immediately seem logical from a clinical standpoint, and may vary with changes in practice and even possibly between divisions within a hospital. As a result, the algorithm would likely require intermittent updating to remain effective and a model derived from 1 hospital or patient population would not necessarily be applicable to patients at another institution or from a different population. However, once the method has been developed at an institution, the process of revising the algorithm could be essentially automated and uses few resources.
Another shortcoming of this method is the relatively low sensitivity of the resulting algorithm. In a role as an automated alert system, a low false‐positive rate is particularly desirable to avoid unnecessary frequent distraction of clinicians. The sensitivity of the model can be improved through manipulation of how the analysis is performed, but this would be at the expense of a higher false‐positive rate, which is not acceptable. Finally, prior studies examining treatment for sepsis have demonstrated an advantage to early and aggressive therapy. It is not clear, however, if identifying these patients prior to the onset of clinically evident sepsis would result in improved outcomes. Further work is required to determine if this is the case. We are currently conducting a prospective study that employs the method described here in conjunction with an automated alert system to ascertain if it impacts outcomes on patients admitted to the medicine wards of Barnes‐Jewish Hospital.
In conclusion, the method presented here represents a technique that consumes few resources and is capable of identifying some patients before septic shock becomes clinically evident. When applied in an automated fashion with the capability to alert clinicians caring for a patient, the method demonstrated here may allow for earlier diagnosis and possibly intervention for septic shock patients.
- ,,, et al.Before–after study of a standardized hospital order set for the management of septic shock.Crit Care Med.2006;34(11):2707–2713.
- ,,, et al.Early goal‐directed therapy in the treatment of severe sepsis and septic shock.N Engl J Med.2001;345:1368–1377.
- ,,, et al.Early goal‐directed therapy in severe sepsis and septic shock revisited; concepts, controversies, and contemporary findings.Chest.2006;130(5):1579–1595.
- .Implementing the severe sepsis care bundles outside the ICU by outreach.Nurs Crit Care.2007;12:225–229.
- ,,, et al.The impact of compliance with 6‐hour and 24‐hour sepsis bundles on hospital mortality in patients with severe sepsis: a prospective observational study.Crit Care.2005;9:R764–R770.
- ,,, et al.Translating research to clinical practice, a 1‐year experience with implementing early goal‐directed therapy for septic shock in the emergency department.Chest.2006;129:225–232.
- ,,, et al.Prospective external validation of the clinical effectiveness of an emergency department‐based early goal‐directed therapy protocol for severe sepsis and septic shock.Chest.2007;132:425–432.
- ,,, et al.Implementation of a bundle of quality indicators for the early management of severe sepsis and septic shock is associated with decreased mortality.Crit Care Med.2007;35:1105–1112.
- ,,, et al.Implementation of an evidence‐based “standard operating procedure” and outcome in septic shock.Crit Care Med.2006;34:943–949.
- ,,, et al.Outcome of septic shock in older adults after implementation of the sepsis “bundle”.J Am Geriatr Soc.2008;56:272–278.
- ,,, et al.Confidential inquiry into quality of care before admission to intensive care.BMJ.1998;316:1853–1858.
- ,,.Unexpected deaths and referrals to intensive care of patients on general wards. Are some cases potentially avoidable?J R Coll Physicians Lond.1999;33(3):255–259.
- ,,, et al.Septic shock: an analysis of outcomes for patients with onset on hospital wards versus intensive care units.Crit Care Med.1998;26(6):1020–1024.
- ,,,,,.Hospital‐wide impact of a standardized order set for the management of bacteremic severe sepsis.Crit Care Med.2009;37(3):819–824.
- ,,,,,.The mRNA expression of fatty acid amide hydrolase in human whole blood correlates with sepsis.J Endotoxin Res.2007;13(1):35–38.
- ,,, et al.C‐reactive protein use as an early indicator of infection in patients with systemic inflammatory response syndrome.Intensive Care Med.2004;30(11):2038–2045.
- ,,,,.Procalcitonin as a screening test of late‐onset sepsis in preterm very low birth weight infants.J Perinatol.2005;25(6):397–402.
- ,,.A simple method for predicting severe sepsis in burn patients.Am J Surg.1980;139(4):513–517.
- ,,, et al.Prognostic value of protein C concentrations in neutropenic patients at high risk of severe septic complications.Crit Care Med.2000;28(7):2209–2216.
- ,,,,.Circulating immune parameters predicting the progression from hospital‐acquired pneumonia to septic shock in surgical patients.Crit Care Med.2005;9(6):R662–R669.
- ,,.A simple prediction algorithm for bacteremia in patients with acute febrile illness.Q J Med.2005;98:813–820.
- ,,,.Infection probability score (IPS): a method to help assess the probability of infection in critically ill patients.Crit Care Med.2003;31(11):2579–2584.
- ,.Multivariate regression modeling for the prediction of inflammation, systemic pressure, and end‐organ function in severe sepsis.Shock.1997;8(3):225–231.
- ,,,,,.Abnormal heart rate characteristics preceding neonatal sepsis and sepsis‐like illness.Pediatr Res.2003;53:920–926.
- ,.Statistics for Biology and Health.New York:Springer‐Verlag;1999.
- ,,, et al.Impact of adequate empiric antibiotic therapy on the outcome of patients admitted to the intensive care unit with sepsis.Crit Care Med.2003;31:2742–2751.
Severe sepsis is responsible for significant morbidity and mortality. In the United States, approximately 750,000 cases occur each year with an estimated mortality of 30% to 50%.1 Early goal‐directed therapy has been shown to decrease mortality in patients with severe sepsis and septic shock.2, 3 As a result, efforts have been focused toward providing early and aggressive intervention once sepsis has been established. In many cases this has been accomplished through the implementation of a protocol with guidelines for fluid management, antibiotic and vasopressor administration, and other interventions.410 Prior studies have demonstrated that care of hospitalized patients before intensive care unit (ICU) admission is often suboptimal,1113 and have suggested that patients with clear indicators of acute deterioration may go unrecognized on the ward. We previously reported the effects of implementing a hospital‐wide protocol for the management of severe sepsis,14 finding that although there was a significant reduction in overall mortality there was no difference for patients who developed severe sepsis on the hospital ward. This finding also suggests that the initial care of patients with severe sepsis on hospital wards may differ in intensity compared to emergency departments and ICUs. Failure on the part of the clinician to recognize the harbingers of impending sepsis before the onset of organ dysfunction or hypotension may contribute to a delay in aggressive therapy.
Previous efforts at early recognition of sepsis have relied on diagnostic studies or specific biomarkers to screen at‐risk patients. These have included such studies as messenger RNA (mRNA) expression,15 C‐reactive protein,16 procalcitonin in newborns,17 immunocompetence measures in burn patients,18 protein C concentration in neutropenic patients,19 and several immune markers (eg, tumor necrosis factor‐alpha, interleukin [IL]‐1 beta, IL‐6, IL‐8, and IL‐10).20 However, these biomarkers have been studied only in specific patient populations, require suspicion on the part of the clinician and the measurement of diagnostic or laboratory values that would otherwise not have been obtained. The ideal tool for predicting the onset of sepsis would be applicable to a broad patient population, not require specific suspicion on the part of the clinician, and use only routinely obtained clinical measurements and laboratory values.
Prediction models and scoring systems that use routine hemodynamic and laboratory values for several endpoints related to sepsis and septic shock have been developed. Many such tools are used to define severity of illness and predict outcome, while others have been developed to predict such events as bacteremia in patients presenting with fever,21 the probability of infection in the critically ill,22 and end‐organ dysfunction in severe sepsis.23 Little work has been done to develop such a model capable of predicting the onset of sepsis,24 and there have been no attempts to deploy a model as a large‐scale screening tool.
Our objective was to develop a simple algorithm that can be used in an automated fashion to screen hospitalized patients for impending septic shock. Such a model would be derived from routine hemodynamic and laboratory values, and take advantage of a computerized medical record system for data collection.
Patients and Methods
Patient Enrollment and Data Collection
This study was conducted at Barnes‐Jewish Hospital, St. Louis, MO, a university‐affiliated, urban teaching hospital. The study was approved by the Washington University (St. Louis, MO) School of Medicine Human Studies Committee. Patients included in the study where those hospitalized during 2005, 2006, and 2007, and who had at least 1 International Statistical Classification of Diseases and Related Health Problems, 9th edition (ICD9) discharge diagnosis code for the medical/nonsurgical diagnoses listed in Appendix 1. From this pool of patients, septic shock patients were identified as those who were admitted to the hospital ward and later developed septic shock requiring transfer to an ICU for vasopressor support and hemodynamic monitoring. This was accomplished by using discharge ICD9 codes for acute infection matched to codes for acute organ dysfunction and the need for vasopressors within 24 hours of ICU transfer (Appendix 1). The patients used as controls were then all those remaining in the pool once the septic shock patients were identified and separated.
Case patients were excluded from the analysis if they were transferred to the ICU within 2 hours of hospital admission, as these patients are unlikely to have an adequate amount of pretransfer clinical data available for analysis. Both case and control patients were excluded if they lacked any value for basic, routine laboratory data (serum sodium, chloride, total bicarbonate, urea nitrogen, creatinine, glucose, white blood cell count, neutrophil count, hemoglobin, hematocrit, and platelet count) and certain vital signs (blood pressure, heart rate, temperature). Patient data from 2005 were used in the derivation of the prediction model, and 2006 and 2007 patient data were used to prospectively validate the model. Clinical variables used in the analysis were selected based on both ease of access from the electronic medical record and clinical relevance, and are shown in Table 1.
|
| Age (years) |
| Albumin (g/dL) |
| Arterial blood gas (pH, PaCO2, PaO2) |
| Anion gap |
| Bilirubin (mg/dL) |
| BP, systolic and diastolic (mm of Hg) |
| Blood urea nitrogen (mg/dL) |
| Chloride (mmol/L) |
| Creatinine (mg/dL) |
| Glucose (mg/dL) |
| Hemoglobin (g/dL) |
| International normalized ratio |
| Neutrophil count, absolute (1 103/L) |
| Platelet count (1 103/L) |
| Pulse (beats/minute) |
| Pulse pressure (mm of Hg) |
| Shock index (pulse divided by systolic BP) |
| Sodium (mmol/L) |
| Total bicarbonate (mmol/L) |
| Temperature (degrees Celsius) |
| White blood cell count (1 103/L) |
In performing the Recursive Partitioning And Regression Tree (RPART) analysis to generate a prediction model, data for case patients were extracted in a window from 24 hours to 2 hours before ICU admission. The data collection window excluded the 2 hours prior to ICU transfer in order to minimize the effect of acute hemodynamic or laboratory changes that may have prompted the transfer; the purpose of the model is to identify hemodynamic and laboratory patterns in the several hours before the onset of clinically evident shock, so data from a time during which impending shock was clinically apparent were excluded. For the control patients, data from the first 48 hours of their hospitalization were included in the analysis.
Statistical Analysis
RPART analysis was performed on the 2005 patient data set to generate a prediction algorithm. This method of analysis results in a classification tree that contains a series of binary splits designed to separate patients into mutually exclusive subgroups.25 Each split in the tree is selected based on its ability to produce a partition with the greatest purity. Initially, a large tree that contains splits for all input variables is generated. This initial tree is generally too large to be useful as the final subgroups are too small to make sensible statistical inference.25 A pruning process is then applied to the initial tree with the goal of finding the subtree that is most predictive of the outcome of interest. The analysis was done using the RPART package of the R statistical analysis program, version 2.7.0 (R: A Language and Environment for Statistical Computing, R Development Core Team, Foundation for Statistical Computing, Vienna, Austria). The resulting classification tree was then used as a prediction algorithm and applied in a prospective fashion to the 2006 and 2007 patient data sets.
For the purpose of performing the RPART analysis, each set of case data entered into the analysis consisted of a random extraction of the desired clinical data within the specified extraction window from a single case patient. Thus, if a case patient had more than 1 value available for any variable of interest, 1 value was randomly selected to be entered in combination with the other available clinical data. Furthermore, in order to ensure that the majority of case patient data were included in the analysis, this process was iterated 10 times for each case patient. This resulted in 10 sets of case patient data being entered into the analysis for each case patient in the database, with each set containing a value for all variables of interest randomly extracted from those available for that patient. In addition to ensuring that the majority of case patient data were included, this technique also functionally expands the number of case patients present in the analysis. As there were far more control patients than case patients in the database, this in turn results in a classification tree that does not simply identify controls without regard to the relatively small number of case patients.
Data for the control patients entered into the analysis were extracted in a similar fashion, though only 1 set of data were included in the analysis for each control patient present in the database. As a result, only 1 randomly selected value per variable was included in the analysis.
Results
Patients
During 2005, 562 septic patients and 13,223 control patients were identified. For 2006 and 2007 there were 635 and 667 case patients, and 13,102 and 13,270 control patients, respectively.
Predictors of Sepsis
RPART analysis of the 2005 patient data set demonstrated that the most significant predictors of sepsis in the 24 hours preceding transfer to the medical ICU were the partial pressure of arterial oxygen (PaO2), systolic blood pressure, absolute neutrophil count, blood urea nitrogen (BUN), pH, bicarbonate, chloride, and albumin. This resulted in a simple algorithm with nine classification splits (Figure 1), which was then prospectively applied to the 2006 and 2007 patient data sets. These results are summarized in Table 2.
| Total Number | Number Correctly Classified (%) | Case Identification Time Before ICU Admission (minutes) | PPV (%) | NPV (%) | MCR (%) | |
|---|---|---|---|---|---|---|
| ||||||
| 2005 | 27.9 | 98.1 | 7.8 | |||
| Cases | 562 | 320 (56.9) | ||||
| Controls | 13,223 | 12,394 (93.7) | ||||
| 2006 | 179 230 | 28.7 | 97.7 | 8.4 | ||
| Cases | 635 | 347 (54.7) | ||||
| Controls | 13,102 | 12,241 (93.4) | ||||
| 2007 | 192 210 | 28.3 | 97.6 | 8.8 | ||
| Cases | 667 | 367 (55.0) | ||||
| Controls | 13,270 | 12,341 (93.0) | ||||
The resulting classification model had a low total misclassification rate for the 2005 data. Of the 562 septic patients, 320 (56.9%) were correctly classified, and 12,394 (93.7%) of the control patients were appropriately identified. The number of septic and control patients misclassified was 242 and 829, respectively, yielding a total misclassification rate of 7.8%. When applied to the 2006 patient data set, 347 (54.7%) of the 635 septic shock patients were correctly identified, while 12,241 (93.4%) of the 13,102 control patients were correctly classified. The total misclassification rate for the 2006 patient set was 8.4%. For the 2007 patient data, 367 (55.0%) of the 667 case patients were correctly identified, and 12,341 (93.0%) of the 13,270 control patients were correctly identified. This resulted in a total misclassification rate of 8.8%.
The 2006 and 2007 case patients were identified 179 230 minutes and 192 210 minutes before ICU transfer, respectively (Figure 2). The algorithm demonstrated positive and negative predictive values of 28.7% and 97.7% for the 2006 patient set, respectively, and 28.3% and 97.6% for the 2007 patient set, respectively.
Although the prediction algorithm shown in Figure 1 identified the majority of the case patients with ample time for clinical intervention prior to ICU transfer, the analysis used to derive this model included values for the arterial blood gas (ABG). As this is not a routinely obtained study for hospitalized patients outside of an ICU, it is possible that the performance of this model can in part be attributed to clinical acumen rather than changes in patient physiology. The ABG would likely only be obtained in patients with a more concerning or deteriorating clinical course, and thus more likely to develop shock. To address this possibility, a second analysis was performed that did not include the values for the ABG. The result was an algorithm with 13 classification splits, as shown in Figure 3.
The most predictive clinical variables in this analysis included the shock index (heart rate divided by systolic blood pressure), mean arterial pressure, total bilirubin, international normalized ratio (INR), total white blood cell count, absolute neutrophil count, albumin, hemoglobin, and sodium. This model was again applied to the 2006 and 2007 patient data sets (Table 3).
| Total Number | Number Correctly Classified (%) | Case Identification Time Before ICU Admission (minutes) | PPV (%) | NPV (%) | MCR (%) | |
|---|---|---|---|---|---|---|
| ||||||
| 2005 | 20.5 | 96.7 | 6.7 | |||
| Cases | 562 | 126 (22.4) | ||||
| Controls | 13,223 | 12,735 (96.3) | ||||
| 2006 | 508 536 | 21.4 | 96.1 | 7.0 | ||
| Cases | 635 | 121 (19.1) | ||||
| Controls | 13,102 | 12,657 (96.6) | ||||
| 2007 | 496 512 | 19.5 | 95.8 | 7.1 | ||
| Cases | 667 | 102 (15.3) | ||||
| Controls | 13,270 | 12,850 (96.8) | ||||
The overall misclassification rates for 2006 and 2007 were 7.0% and 7.1%, respectively. The model correctly identified 121 (19.1%) of the 635 cases and 12,657 (96.6%) of the 13,102 control patients from 2006, and 102 (15.3%) of the 667 cases and 12,850 (96.8%) of the 13,270 control patients from 2007. The respective positive and negative predictive values were 21.4% and 96.1% for 2006, respectively, and 19.5% and 95.8% for 2007, respectively.
Although the overall performance of the model derived without the ABG data was not as good, the identification times prior to ICU transfer were significantly improved. For the 2006 data, patients were identified 508 536 minutes before transfer (Figure 4), compared to 179 230 minutes for the model that included the ABG data (P < 0.01). For the 2007 data, patients were identified 496 512 minutes prior to ICU admission (Figure 4), compared to 192 210 minutes for the previous model (P < 0.01).
Discussion
We have demonstrated a simple method for generating an algorithm derived from routine laboratory and hemodynamic values that is capable of predicting the onset of sepsis in a significant proportion of non‐ICU patients. Two prediction models were generated, 1 with and 1 without ABG data included in the analysis. In the 2006 and 2007 validation cohorts, the model including these data correctly classified 54.7% and 55.0% of the patients who developed septic shock and 93.4% and 93.0% of control patients, respectively. The second model identified 19.1% and 15.3% of the septic shock patients and 96.6% and 96.8% of the control patients for 2006 and 2007, respectively. The methods used in generating this model are relatively simple and can be executed with the use of an electronic medical record system.
Early, goal‐directed cardiovascular resuscitation and adequate initial antibiotic therapy have been shown to decrease mortality in patients with severe sepsis and septic shock.2, 26 Prior studies employing early, targeted resuscitation strategies have demonstrated decreased use of vasopressors10 and decreased mortality.510 In addition, we previously demonstrated that a standardized order set for the management of severe sepsis in the emergency department that focused on early and aggressive intervention was associated with decreased 28‐day mortality.1 These studies suggest that early, aggressive management of septic shock can improve outcomes. Identification of patients prior to overt clinical deterioration may allow for early intervention aimed at preventing shock or improving its outcome.
The purpose of this method is to develop a model capable of recognizing patterns in clinical data that herald a patient's otherwise unidentified clinical deterioration. It is not intended to replace existing outcome prediction tools or severity of illness scoring systems, where a high degree of accuracy would be required. Rather, it would be best implemented as an automated screening tool incorporated into an electronic medical record system. When a hospitalized patient is identified as a possible septic shock patient by the classification tree, a notification is then issued to the clinicians caring for the patient. The primary goal of this method is to notify clinicians of potential clinical deterioration. Any action taken as a result of this notification is at the discretion of the clinician. This method could be employed for any population of hospitalized patients, though because of variations in clinical practice and patient physiology, different models would need to be generated for differing patient populations.
This method has limitations, the foremost of which is the possible instability of the resulting classification model. This type of analysis results in an algorithm that depends on binary splits to classify patients. In generating the algorithm, the recursive partitioning analysis selects the variables and cutoff values that result in the strongest decision tree with the most pure classifications at the end nodes. These variables and cutoff values may not immediately seem logical from a clinical standpoint, and may vary with changes in practice and even possibly between divisions within a hospital. As a result, the algorithm would likely require intermittent updating to remain effective and a model derived from 1 hospital or patient population would not necessarily be applicable to patients at another institution or from a different population. However, once the method has been developed at an institution, the process of revising the algorithm could be essentially automated and uses few resources.
Another shortcoming of this method is the relatively low sensitivity of the resulting algorithm. In a role as an automated alert system, a low false‐positive rate is particularly desirable to avoid unnecessary frequent distraction of clinicians. The sensitivity of the model can be improved through manipulation of how the analysis is performed, but this would be at the expense of a higher false‐positive rate, which is not acceptable. Finally, prior studies examining treatment for sepsis have demonstrated an advantage to early and aggressive therapy. It is not clear, however, if identifying these patients prior to the onset of clinically evident sepsis would result in improved outcomes. Further work is required to determine if this is the case. We are currently conducting a prospective study that employs the method described here in conjunction with an automated alert system to ascertain if it impacts outcomes on patients admitted to the medicine wards of Barnes‐Jewish Hospital.
In conclusion, the method presented here represents a technique that consumes few resources and is capable of identifying some patients before septic shock becomes clinically evident. When applied in an automated fashion with the capability to alert clinicians caring for a patient, the method demonstrated here may allow for earlier diagnosis and possibly intervention for septic shock patients.
- ,,, et al.Before–after study of a standardized hospital order set for the management of septic shock.Crit Care Med.2006;34(11):2707–2713.
- ,,, et al.Early goal‐directed therapy in the treatment of severe sepsis and septic shock.N Engl J Med.2001;345:1368–1377.
- ,,, et al.Early goal‐directed therapy in severe sepsis and septic shock revisited; concepts, controversies, and contemporary findings.Chest.2006;130(5):1579–1595.
- .Implementing the severe sepsis care bundles outside the ICU by outreach.Nurs Crit Care.2007;12:225–229.
- ,,, et al.The impact of compliance with 6‐hour and 24‐hour sepsis bundles on hospital mortality in patients with severe sepsis: a prospective observational study.Crit Care.2005;9:R764–R770.
- ,,, et al.Translating research to clinical practice, a 1‐year experience with implementing early goal‐directed therapy for septic shock in the emergency department.Chest.2006;129:225–232.
- ,,, et al.Prospective external validation of the clinical effectiveness of an emergency department‐based early goal‐directed therapy protocol for severe sepsis and septic shock.Chest.2007;132:425–432.
- ,,, et al.Implementation of a bundle of quality indicators for the early management of severe sepsis and septic shock is associated with decreased mortality.Crit Care Med.2007;35:1105–1112.
- ,,, et al.Implementation of an evidence‐based “standard operating procedure” and outcome in septic shock.Crit Care Med.2006;34:943–949.
- ,,, et al.Outcome of septic shock in older adults after implementation of the sepsis “bundle”.J Am Geriatr Soc.2008;56:272–278.
- ,,, et al.Confidential inquiry into quality of care before admission to intensive care.BMJ.1998;316:1853–1858.
- ,,.Unexpected deaths and referrals to intensive care of patients on general wards. Are some cases potentially avoidable?J R Coll Physicians Lond.1999;33(3):255–259.
- ,,, et al.Septic shock: an analysis of outcomes for patients with onset on hospital wards versus intensive care units.Crit Care Med.1998;26(6):1020–1024.
- ,,,,,.Hospital‐wide impact of a standardized order set for the management of bacteremic severe sepsis.Crit Care Med.2009;37(3):819–824.
- ,,,,,.The mRNA expression of fatty acid amide hydrolase in human whole blood correlates with sepsis.J Endotoxin Res.2007;13(1):35–38.
- ,,, et al.C‐reactive protein use as an early indicator of infection in patients with systemic inflammatory response syndrome.Intensive Care Med.2004;30(11):2038–2045.
- ,,,,.Procalcitonin as a screening test of late‐onset sepsis in preterm very low birth weight infants.J Perinatol.2005;25(6):397–402.
- ,,.A simple method for predicting severe sepsis in burn patients.Am J Surg.1980;139(4):513–517.
- ,,, et al.Prognostic value of protein C concentrations in neutropenic patients at high risk of severe septic complications.Crit Care Med.2000;28(7):2209–2216.
- ,,,,.Circulating immune parameters predicting the progression from hospital‐acquired pneumonia to septic shock in surgical patients.Crit Care Med.2005;9(6):R662–R669.
- ,,.A simple prediction algorithm for bacteremia in patients with acute febrile illness.Q J Med.2005;98:813–820.
- ,,,.Infection probability score (IPS): a method to help assess the probability of infection in critically ill patients.Crit Care Med.2003;31(11):2579–2584.
- ,.Multivariate regression modeling for the prediction of inflammation, systemic pressure, and end‐organ function in severe sepsis.Shock.1997;8(3):225–231.
- ,,,,,.Abnormal heart rate characteristics preceding neonatal sepsis and sepsis‐like illness.Pediatr Res.2003;53:920–926.
- ,.Statistics for Biology and Health.New York:Springer‐Verlag;1999.
- ,,, et al.Impact of adequate empiric antibiotic therapy on the outcome of patients admitted to the intensive care unit with sepsis.Crit Care Med.2003;31:2742–2751.
Copyright © 2010 Society of Hospital Medicine
