User login
Early Prediction of Septic Shock
Severe sepsis is responsible for significant morbidity and mortality. In the United States, approximately 750,000 cases occur each year with an estimated mortality of 30% to 50%.1 Early goal‐directed therapy has been shown to decrease mortality in patients with severe sepsis and septic shock.2, 3 As a result, efforts have been focused toward providing early and aggressive intervention once sepsis has been established. In many cases this has been accomplished through the implementation of a protocol with guidelines for fluid management, antibiotic and vasopressor administration, and other interventions.410 Prior studies have demonstrated that care of hospitalized patients before intensive care unit (ICU) admission is often suboptimal,1113 and have suggested that patients with clear indicators of acute deterioration may go unrecognized on the ward. We previously reported the effects of implementing a hospital‐wide protocol for the management of severe sepsis,14 finding that although there was a significant reduction in overall mortality there was no difference for patients who developed severe sepsis on the hospital ward. This finding also suggests that the initial care of patients with severe sepsis on hospital wards may differ in intensity compared to emergency departments and ICUs. Failure on the part of the clinician to recognize the harbingers of impending sepsis before the onset of organ dysfunction or hypotension may contribute to a delay in aggressive therapy.
Previous efforts at early recognition of sepsis have relied on diagnostic studies or specific biomarkers to screen at‐risk patients. These have included such studies as messenger RNA (mRNA) expression,15 C‐reactive protein,16 procalcitonin in newborns,17 immunocompetence measures in burn patients,18 protein C concentration in neutropenic patients,19 and several immune markers (eg, tumor necrosis factor‐alpha, interleukin [IL]‐1 beta, IL‐6, IL‐8, and IL‐10).20 However, these biomarkers have been studied only in specific patient populations, require suspicion on the part of the clinician and the measurement of diagnostic or laboratory values that would otherwise not have been obtained. The ideal tool for predicting the onset of sepsis would be applicable to a broad patient population, not require specific suspicion on the part of the clinician, and use only routinely obtained clinical measurements and laboratory values.
Prediction models and scoring systems that use routine hemodynamic and laboratory values for several endpoints related to sepsis and septic shock have been developed. Many such tools are used to define severity of illness and predict outcome, while others have been developed to predict such events as bacteremia in patients presenting with fever,21 the probability of infection in the critically ill,22 and end‐organ dysfunction in severe sepsis.23 Little work has been done to develop such a model capable of predicting the onset of sepsis,24 and there have been no attempts to deploy a model as a large‐scale screening tool.
Our objective was to develop a simple algorithm that can be used in an automated fashion to screen hospitalized patients for impending septic shock. Such a model would be derived from routine hemodynamic and laboratory values, and take advantage of a computerized medical record system for data collection.
Patients and Methods
Patient Enrollment and Data Collection
This study was conducted at Barnes‐Jewish Hospital, St. Louis, MO, a university‐affiliated, urban teaching hospital. The study was approved by the Washington University (St. Louis, MO) School of Medicine Human Studies Committee. Patients included in the study where those hospitalized during 2005, 2006, and 2007, and who had at least 1 International Statistical Classification of Diseases and Related Health Problems, 9th edition (ICD9) discharge diagnosis code for the medical/nonsurgical diagnoses listed in Appendix 1. From this pool of patients, septic shock patients were identified as those who were admitted to the hospital ward and later developed septic shock requiring transfer to an ICU for vasopressor support and hemodynamic monitoring. This was accomplished by using discharge ICD9 codes for acute infection matched to codes for acute organ dysfunction and the need for vasopressors within 24 hours of ICU transfer (Appendix 1). The patients used as controls were then all those remaining in the pool once the septic shock patients were identified and separated.
Case patients were excluded from the analysis if they were transferred to the ICU within 2 hours of hospital admission, as these patients are unlikely to have an adequate amount of pretransfer clinical data available for analysis. Both case and control patients were excluded if they lacked any value for basic, routine laboratory data (serum sodium, chloride, total bicarbonate, urea nitrogen, creatinine, glucose, white blood cell count, neutrophil count, hemoglobin, hematocrit, and platelet count) and certain vital signs (blood pressure, heart rate, temperature). Patient data from 2005 were used in the derivation of the prediction model, and 2006 and 2007 patient data were used to prospectively validate the model. Clinical variables used in the analysis were selected based on both ease of access from the electronic medical record and clinical relevance, and are shown in Table 1.
|
| Age (years) |
| Albumin (g/dL) |
| Arterial blood gas (pH, PaCO2, PaO2) |
| Anion gap |
| Bilirubin (mg/dL) |
| BP, systolic and diastolic (mm of Hg) |
| Blood urea nitrogen (mg/dL) |
| Chloride (mmol/L) |
| Creatinine (mg/dL) |
| Glucose (mg/dL) |
| Hemoglobin (g/dL) |
| International normalized ratio |
| Neutrophil count, absolute (1 103/L) |
| Platelet count (1 103/L) |
| Pulse (beats/minute) |
| Pulse pressure (mm of Hg) |
| Shock index (pulse divided by systolic BP) |
| Sodium (mmol/L) |
| Total bicarbonate (mmol/L) |
| Temperature (degrees Celsius) |
| White blood cell count (1 103/L) |
In performing the Recursive Partitioning And Regression Tree (RPART) analysis to generate a prediction model, data for case patients were extracted in a window from 24 hours to 2 hours before ICU admission. The data collection window excluded the 2 hours prior to ICU transfer in order to minimize the effect of acute hemodynamic or laboratory changes that may have prompted the transfer; the purpose of the model is to identify hemodynamic and laboratory patterns in the several hours before the onset of clinically evident shock, so data from a time during which impending shock was clinically apparent were excluded. For the control patients, data from the first 48 hours of their hospitalization were included in the analysis.
Statistical Analysis
RPART analysis was performed on the 2005 patient data set to generate a prediction algorithm. This method of analysis results in a classification tree that contains a series of binary splits designed to separate patients into mutually exclusive subgroups.25 Each split in the tree is selected based on its ability to produce a partition with the greatest purity. Initially, a large tree that contains splits for all input variables is generated. This initial tree is generally too large to be useful as the final subgroups are too small to make sensible statistical inference.25 A pruning process is then applied to the initial tree with the goal of finding the subtree that is most predictive of the outcome of interest. The analysis was done using the RPART package of the R statistical analysis program, version 2.7.0 (R: A Language and Environment for Statistical Computing, R Development Core Team, Foundation for Statistical Computing, Vienna, Austria). The resulting classification tree was then used as a prediction algorithm and applied in a prospective fashion to the 2006 and 2007 patient data sets.
For the purpose of performing the RPART analysis, each set of case data entered into the analysis consisted of a random extraction of the desired clinical data within the specified extraction window from a single case patient. Thus, if a case patient had more than 1 value available for any variable of interest, 1 value was randomly selected to be entered in combination with the other available clinical data. Furthermore, in order to ensure that the majority of case patient data were included in the analysis, this process was iterated 10 times for each case patient. This resulted in 10 sets of case patient data being entered into the analysis for each case patient in the database, with each set containing a value for all variables of interest randomly extracted from those available for that patient. In addition to ensuring that the majority of case patient data were included, this technique also functionally expands the number of case patients present in the analysis. As there were far more control patients than case patients in the database, this in turn results in a classification tree that does not simply identify controls without regard to the relatively small number of case patients.
Data for the control patients entered into the analysis were extracted in a similar fashion, though only 1 set of data were included in the analysis for each control patient present in the database. As a result, only 1 randomly selected value per variable was included in the analysis.
Results
Patients
During 2005, 562 septic patients and 13,223 control patients were identified. For 2006 and 2007 there were 635 and 667 case patients, and 13,102 and 13,270 control patients, respectively.
Predictors of Sepsis
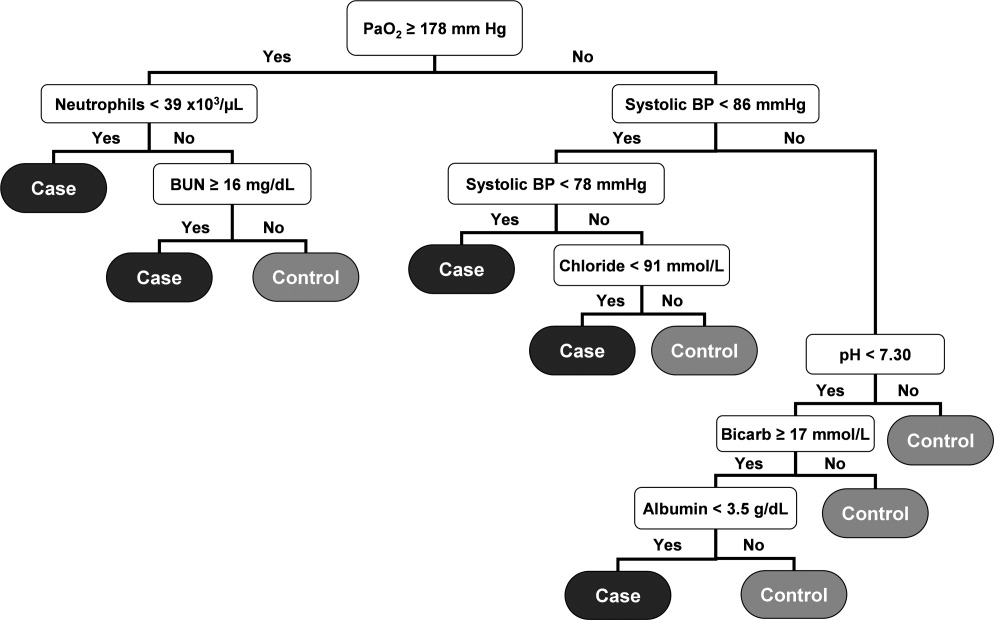
RPART analysis of the 2005 patient data set demonstrated that the most significant predictors of sepsis in the 24 hours preceding transfer to the medical ICU were the partial pressure of arterial oxygen (PaO2), systolic blood pressure, absolute neutrophil count, blood urea nitrogen (BUN), pH, bicarbonate, chloride, and albumin. This resulted in a simple algorithm with nine classification splits (Figure 1), which was then prospectively applied to the 2006 and 2007 patient data sets. These results are summarized in Table 2.
| Total Number | Number Correctly Classified (%) | Case Identification Time Before ICU Admission (minutes) | PPV (%) | NPV (%) | MCR (%) | |
|---|---|---|---|---|---|---|
| ||||||
| 2005 | 27.9 | 98.1 | 7.8 | |||
| Cases | 562 | 320 (56.9) | ||||
| Controls | 13,223 | 12,394 (93.7) | ||||
| 2006 | 179 230 | 28.7 | 97.7 | 8.4 | ||
| Cases | 635 | 347 (54.7) | ||||
| Controls | 13,102 | 12,241 (93.4) | ||||
| 2007 | 192 210 | 28.3 | 97.6 | 8.8 | ||
| Cases | 667 | 367 (55.0) | ||||
| Controls | 13,270 | 12,341 (93.0) | ||||
The resulting classification model had a low total misclassification rate for the 2005 data. Of the 562 septic patients, 320 (56.9%) were correctly classified, and 12,394 (93.7%) of the control patients were appropriately identified. The number of septic and control patients misclassified was 242 and 829, respectively, yielding a total misclassification rate of 7.8%. When applied to the 2006 patient data set, 347 (54.7%) of the 635 septic shock patients were correctly identified, while 12,241 (93.4%) of the 13,102 control patients were correctly classified. The total misclassification rate for the 2006 patient set was 8.4%. For the 2007 patient data, 367 (55.0%) of the 667 case patients were correctly identified, and 12,341 (93.0%) of the 13,270 control patients were correctly identified. This resulted in a total misclassification rate of 8.8%.
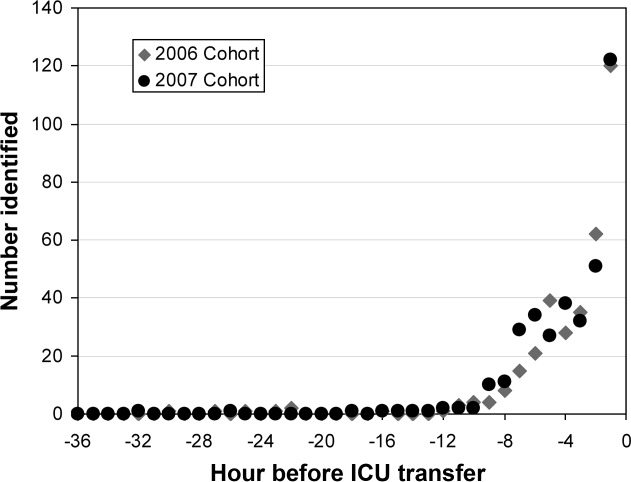
The 2006 and 2007 case patients were identified 179 230 minutes and 192 210 minutes before ICU transfer, respectively (Figure 2). The algorithm demonstrated positive and negative predictive values of 28.7% and 97.7% for the 2006 patient set, respectively, and 28.3% and 97.6% for the 2007 patient set, respectively.
Although the prediction algorithm shown in Figure 1 identified the majority of the case patients with ample time for clinical intervention prior to ICU transfer, the analysis used to derive this model included values for the arterial blood gas (ABG). As this is not a routinely obtained study for hospitalized patients outside of an ICU, it is possible that the performance of this model can in part be attributed to clinical acumen rather than changes in patient physiology. The ABG would likely only be obtained in patients with a more concerning or deteriorating clinical course, and thus more likely to develop shock. To address this possibility, a second analysis was performed that did not include the values for the ABG. The result was an algorithm with 13 classification splits, as shown in Figure 3.
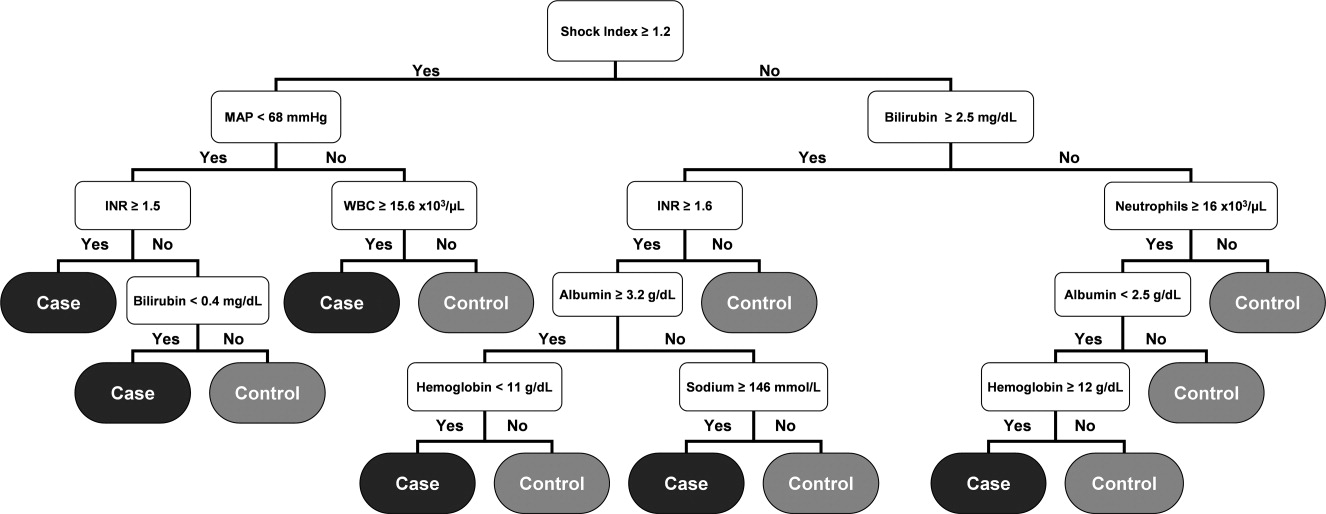
The most predictive clinical variables in this analysis included the shock index (heart rate divided by systolic blood pressure), mean arterial pressure, total bilirubin, international normalized ratio (INR), total white blood cell count, absolute neutrophil count, albumin, hemoglobin, and sodium. This model was again applied to the 2006 and 2007 patient data sets (Table 3).
| Total Number | Number Correctly Classified (%) | Case Identification Time Before ICU Admission (minutes) | PPV (%) | NPV (%) | MCR (%) | |
|---|---|---|---|---|---|---|
| ||||||
| 2005 | 20.5 | 96.7 | 6.7 | |||
| Cases | 562 | 126 (22.4) | ||||
| Controls | 13,223 | 12,735 (96.3) | ||||
| 2006 | 508 536 | 21.4 | 96.1 | 7.0 | ||
| Cases | 635 | 121 (19.1) | ||||
| Controls | 13,102 | 12,657 (96.6) | ||||
| 2007 | 496 512 | 19.5 | 95.8 | 7.1 | ||
| Cases | 667 | 102 (15.3) | ||||
| Controls | 13,270 | 12,850 (96.8) | ||||
The overall misclassification rates for 2006 and 2007 were 7.0% and 7.1%, respectively. The model correctly identified 121 (19.1%) of the 635 cases and 12,657 (96.6%) of the 13,102 control patients from 2006, and 102 (15.3%) of the 667 cases and 12,850 (96.8%) of the 13,270 control patients from 2007. The respective positive and negative predictive values were 21.4% and 96.1% for 2006, respectively, and 19.5% and 95.8% for 2007, respectively.
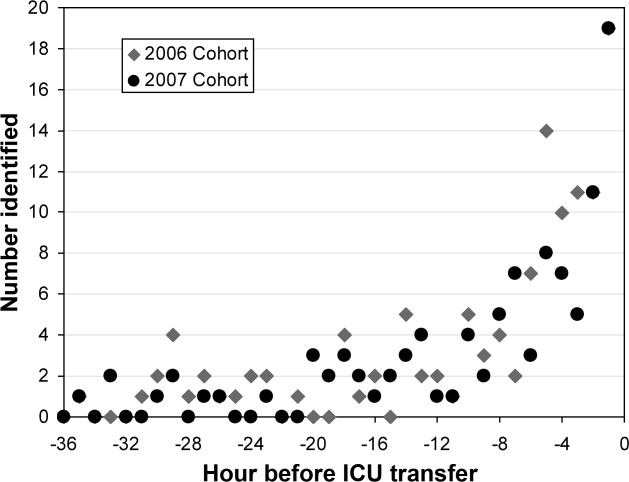
Although the overall performance of the model derived without the ABG data was not as good, the identification times prior to ICU transfer were significantly improved. For the 2006 data, patients were identified 508 536 minutes before transfer (Figure 4), compared to 179 230 minutes for the model that included the ABG data (P < 0.01). For the 2007 data, patients were identified 496 512 minutes prior to ICU admission (Figure 4), compared to 192 210 minutes for the previous model (P < 0.01).
Discussion
We have demonstrated a simple method for generating an algorithm derived from routine laboratory and hemodynamic values that is capable of predicting the onset of sepsis in a significant proportion of non‐ICU patients. Two prediction models were generated, 1 with and 1 without ABG data included in the analysis. In the 2006 and 2007 validation cohorts, the model including these data correctly classified 54.7% and 55.0% of the patients who developed septic shock and 93.4% and 93.0% of control patients, respectively. The second model identified 19.1% and 15.3% of the septic shock patients and 96.6% and 96.8% of the control patients for 2006 and 2007, respectively. The methods used in generating this model are relatively simple and can be executed with the use of an electronic medical record system.
Early, goal‐directed cardiovascular resuscitation and adequate initial antibiotic therapy have been shown to decrease mortality in patients with severe sepsis and septic shock.2, 26 Prior studies employing early, targeted resuscitation strategies have demonstrated decreased use of vasopressors10 and decreased mortality.510 In addition, we previously demonstrated that a standardized order set for the management of severe sepsis in the emergency department that focused on early and aggressive intervention was associated with decreased 28‐day mortality.1 These studies suggest that early, aggressive management of septic shock can improve outcomes. Identification of patients prior to overt clinical deterioration may allow for early intervention aimed at preventing shock or improving its outcome.
The purpose of this method is to develop a model capable of recognizing patterns in clinical data that herald a patient's otherwise unidentified clinical deterioration. It is not intended to replace existing outcome prediction tools or severity of illness scoring systems, where a high degree of accuracy would be required. Rather, it would be best implemented as an automated screening tool incorporated into an electronic medical record system. When a hospitalized patient is identified as a possible septic shock patient by the classification tree, a notification is then issued to the clinicians caring for the patient. The primary goal of this method is to notify clinicians of potential clinical deterioration. Any action taken as a result of this notification is at the discretion of the clinician. This method could be employed for any population of hospitalized patients, though because of variations in clinical practice and patient physiology, different models would need to be generated for differing patient populations.
This method has limitations, the foremost of which is the possible instability of the resulting classification model. This type of analysis results in an algorithm that depends on binary splits to classify patients. In generating the algorithm, the recursive partitioning analysis selects the variables and cutoff values that result in the strongest decision tree with the most pure classifications at the end nodes. These variables and cutoff values may not immediately seem logical from a clinical standpoint, and may vary with changes in practice and even possibly between divisions within a hospital. As a result, the algorithm would likely require intermittent updating to remain effective and a model derived from 1 hospital or patient population would not necessarily be applicable to patients at another institution or from a different population. However, once the method has been developed at an institution, the process of revising the algorithm could be essentially automated and uses few resources.
Another shortcoming of this method is the relatively low sensitivity of the resulting algorithm. In a role as an automated alert system, a low false‐positive rate is particularly desirable to avoid unnecessary frequent distraction of clinicians. The sensitivity of the model can be improved through manipulation of how the analysis is performed, but this would be at the expense of a higher false‐positive rate, which is not acceptable. Finally, prior studies examining treatment for sepsis have demonstrated an advantage to early and aggressive therapy. It is not clear, however, if identifying these patients prior to the onset of clinically evident sepsis would result in improved outcomes. Further work is required to determine if this is the case. We are currently conducting a prospective study that employs the method described here in conjunction with an automated alert system to ascertain if it impacts outcomes on patients admitted to the medicine wards of Barnes‐Jewish Hospital.
In conclusion, the method presented here represents a technique that consumes few resources and is capable of identifying some patients before septic shock becomes clinically evident. When applied in an automated fashion with the capability to alert clinicians caring for a patient, the method demonstrated here may allow for earlier diagnosis and possibly intervention for septic shock patients.
- ,,, et al.Before–after study of a standardized hospital order set for the management of septic shock.Crit Care Med.2006;34(11):2707–2713.
- ,,, et al.Early goal‐directed therapy in the treatment of severe sepsis and septic shock.N Engl J Med.2001;345:1368–1377.
- ,,, et al.Early goal‐directed therapy in severe sepsis and septic shock revisited; concepts, controversies, and contemporary findings.Chest.2006;130(5):1579–1595.
- .Implementing the severe sepsis care bundles outside the ICU by outreach.Nurs Crit Care.2007;12:225–229.
- ,,, et al.The impact of compliance with 6‐hour and 24‐hour sepsis bundles on hospital mortality in patients with severe sepsis: a prospective observational study.Crit Care.2005;9:R764–R770.
- ,,, et al.Translating research to clinical practice, a 1‐year experience with implementing early goal‐directed therapy for septic shock in the emergency department.Chest.2006;129:225–232.
- ,,, et al.Prospective external validation of the clinical effectiveness of an emergency department‐based early goal‐directed therapy protocol for severe sepsis and septic shock.Chest.2007;132:425–432.
- ,,, et al.Implementation of a bundle of quality indicators for the early management of severe sepsis and septic shock is associated with decreased mortality.Crit Care Med.2007;35:1105–1112.
- ,,, et al.Implementation of an evidence‐based “standard operating procedure” and outcome in septic shock.Crit Care Med.2006;34:943–949.
- ,,, et al.Outcome of septic shock in older adults after implementation of the sepsis “bundle”.J Am Geriatr Soc.2008;56:272–278.
- ,,, et al.Confidential inquiry into quality of care before admission to intensive care.BMJ.1998;316:1853–1858.
- ,,.Unexpected deaths and referrals to intensive care of patients on general wards. Are some cases potentially avoidable?J R Coll Physicians Lond.1999;33(3):255–259.
- ,,, et al.Septic shock: an analysis of outcomes for patients with onset on hospital wards versus intensive care units.Crit Care Med.1998;26(6):1020–1024.
- ,,,,,.Hospital‐wide impact of a standardized order set for the management of bacteremic severe sepsis.Crit Care Med.2009;37(3):819–824.
- ,,,,,.The mRNA expression of fatty acid amide hydrolase in human whole blood correlates with sepsis.J Endotoxin Res.2007;13(1):35–38.
- ,,, et al.C‐reactive protein use as an early indicator of infection in patients with systemic inflammatory response syndrome.Intensive Care Med.2004;30(11):2038–2045.
- ,,,,.Procalcitonin as a screening test of late‐onset sepsis in preterm very low birth weight infants.J Perinatol.2005;25(6):397–402.
- ,,.A simple method for predicting severe sepsis in burn patients.Am J Surg.1980;139(4):513–517.
- ,,, et al.Prognostic value of protein C concentrations in neutropenic patients at high risk of severe septic complications.Crit Care Med.2000;28(7):2209–2216.
- ,,,,.Circulating immune parameters predicting the progression from hospital‐acquired pneumonia to septic shock in surgical patients.Crit Care Med.2005;9(6):R662–R669.
- ,,.A simple prediction algorithm for bacteremia in patients with acute febrile illness.Q J Med.2005;98:813–820.
- ,,,.Infection probability score (IPS): a method to help assess the probability of infection in critically ill patients.Crit Care Med.2003;31(11):2579–2584.
- ,.Multivariate regression modeling for the prediction of inflammation, systemic pressure, and end‐organ function in severe sepsis.Shock.1997;8(3):225–231.
- ,,,,,.Abnormal heart rate characteristics preceding neonatal sepsis and sepsis‐like illness.Pediatr Res.2003;53:920–926.
- ,.Statistics for Biology and Health.New York:Springer‐Verlag;1999.
- ,,, et al.Impact of adequate empiric antibiotic therapy on the outcome of patients admitted to the intensive care unit with sepsis.Crit Care Med.2003;31:2742–2751.
Severe sepsis is responsible for significant morbidity and mortality. In the United States, approximately 750,000 cases occur each year with an estimated mortality of 30% to 50%.1 Early goal‐directed therapy has been shown to decrease mortality in patients with severe sepsis and septic shock.2, 3 As a result, efforts have been focused toward providing early and aggressive intervention once sepsis has been established. In many cases this has been accomplished through the implementation of a protocol with guidelines for fluid management, antibiotic and vasopressor administration, and other interventions.410 Prior studies have demonstrated that care of hospitalized patients before intensive care unit (ICU) admission is often suboptimal,1113 and have suggested that patients with clear indicators of acute deterioration may go unrecognized on the ward. We previously reported the effects of implementing a hospital‐wide protocol for the management of severe sepsis,14 finding that although there was a significant reduction in overall mortality there was no difference for patients who developed severe sepsis on the hospital ward. This finding also suggests that the initial care of patients with severe sepsis on hospital wards may differ in intensity compared to emergency departments and ICUs. Failure on the part of the clinician to recognize the harbingers of impending sepsis before the onset of organ dysfunction or hypotension may contribute to a delay in aggressive therapy.
Previous efforts at early recognition of sepsis have relied on diagnostic studies or specific biomarkers to screen at‐risk patients. These have included such studies as messenger RNA (mRNA) expression,15 C‐reactive protein,16 procalcitonin in newborns,17 immunocompetence measures in burn patients,18 protein C concentration in neutropenic patients,19 and several immune markers (eg, tumor necrosis factor‐alpha, interleukin [IL]‐1 beta, IL‐6, IL‐8, and IL‐10).20 However, these biomarkers have been studied only in specific patient populations, require suspicion on the part of the clinician and the measurement of diagnostic or laboratory values that would otherwise not have been obtained. The ideal tool for predicting the onset of sepsis would be applicable to a broad patient population, not require specific suspicion on the part of the clinician, and use only routinely obtained clinical measurements and laboratory values.
Prediction models and scoring systems that use routine hemodynamic and laboratory values for several endpoints related to sepsis and septic shock have been developed. Many such tools are used to define severity of illness and predict outcome, while others have been developed to predict such events as bacteremia in patients presenting with fever,21 the probability of infection in the critically ill,22 and end‐organ dysfunction in severe sepsis.23 Little work has been done to develop such a model capable of predicting the onset of sepsis,24 and there have been no attempts to deploy a model as a large‐scale screening tool.
Our objective was to develop a simple algorithm that can be used in an automated fashion to screen hospitalized patients for impending septic shock. Such a model would be derived from routine hemodynamic and laboratory values, and take advantage of a computerized medical record system for data collection.
Patients and Methods
Patient Enrollment and Data Collection
This study was conducted at Barnes‐Jewish Hospital, St. Louis, MO, a university‐affiliated, urban teaching hospital. The study was approved by the Washington University (St. Louis, MO) School of Medicine Human Studies Committee. Patients included in the study where those hospitalized during 2005, 2006, and 2007, and who had at least 1 International Statistical Classification of Diseases and Related Health Problems, 9th edition (ICD9) discharge diagnosis code for the medical/nonsurgical diagnoses listed in Appendix 1. From this pool of patients, septic shock patients were identified as those who were admitted to the hospital ward and later developed septic shock requiring transfer to an ICU for vasopressor support and hemodynamic monitoring. This was accomplished by using discharge ICD9 codes for acute infection matched to codes for acute organ dysfunction and the need for vasopressors within 24 hours of ICU transfer (Appendix 1). The patients used as controls were then all those remaining in the pool once the septic shock patients were identified and separated.
Case patients were excluded from the analysis if they were transferred to the ICU within 2 hours of hospital admission, as these patients are unlikely to have an adequate amount of pretransfer clinical data available for analysis. Both case and control patients were excluded if they lacked any value for basic, routine laboratory data (serum sodium, chloride, total bicarbonate, urea nitrogen, creatinine, glucose, white blood cell count, neutrophil count, hemoglobin, hematocrit, and platelet count) and certain vital signs (blood pressure, heart rate, temperature). Patient data from 2005 were used in the derivation of the prediction model, and 2006 and 2007 patient data were used to prospectively validate the model. Clinical variables used in the analysis were selected based on both ease of access from the electronic medical record and clinical relevance, and are shown in Table 1.
|
| Age (years) |
| Albumin (g/dL) |
| Arterial blood gas (pH, PaCO2, PaO2) |
| Anion gap |
| Bilirubin (mg/dL) |
| BP, systolic and diastolic (mm of Hg) |
| Blood urea nitrogen (mg/dL) |
| Chloride (mmol/L) |
| Creatinine (mg/dL) |
| Glucose (mg/dL) |
| Hemoglobin (g/dL) |
| International normalized ratio |
| Neutrophil count, absolute (1 103/L) |
| Platelet count (1 103/L) |
| Pulse (beats/minute) |
| Pulse pressure (mm of Hg) |
| Shock index (pulse divided by systolic BP) |
| Sodium (mmol/L) |
| Total bicarbonate (mmol/L) |
| Temperature (degrees Celsius) |
| White blood cell count (1 103/L) |
In performing the Recursive Partitioning And Regression Tree (RPART) analysis to generate a prediction model, data for case patients were extracted in a window from 24 hours to 2 hours before ICU admission. The data collection window excluded the 2 hours prior to ICU transfer in order to minimize the effect of acute hemodynamic or laboratory changes that may have prompted the transfer; the purpose of the model is to identify hemodynamic and laboratory patterns in the several hours before the onset of clinically evident shock, so data from a time during which impending shock was clinically apparent were excluded. For the control patients, data from the first 48 hours of their hospitalization were included in the analysis.
Statistical Analysis
RPART analysis was performed on the 2005 patient data set to generate a prediction algorithm. This method of analysis results in a classification tree that contains a series of binary splits designed to separate patients into mutually exclusive subgroups.25 Each split in the tree is selected based on its ability to produce a partition with the greatest purity. Initially, a large tree that contains splits for all input variables is generated. This initial tree is generally too large to be useful as the final subgroups are too small to make sensible statistical inference.25 A pruning process is then applied to the initial tree with the goal of finding the subtree that is most predictive of the outcome of interest. The analysis was done using the RPART package of the R statistical analysis program, version 2.7.0 (R: A Language and Environment for Statistical Computing, R Development Core Team, Foundation for Statistical Computing, Vienna, Austria). The resulting classification tree was then used as a prediction algorithm and applied in a prospective fashion to the 2006 and 2007 patient data sets.
For the purpose of performing the RPART analysis, each set of case data entered into the analysis consisted of a random extraction of the desired clinical data within the specified extraction window from a single case patient. Thus, if a case patient had more than 1 value available for any variable of interest, 1 value was randomly selected to be entered in combination with the other available clinical data. Furthermore, in order to ensure that the majority of case patient data were included in the analysis, this process was iterated 10 times for each case patient. This resulted in 10 sets of case patient data being entered into the analysis for each case patient in the database, with each set containing a value for all variables of interest randomly extracted from those available for that patient. In addition to ensuring that the majority of case patient data were included, this technique also functionally expands the number of case patients present in the analysis. As there were far more control patients than case patients in the database, this in turn results in a classification tree that does not simply identify controls without regard to the relatively small number of case patients.
Data for the control patients entered into the analysis were extracted in a similar fashion, though only 1 set of data were included in the analysis for each control patient present in the database. As a result, only 1 randomly selected value per variable was included in the analysis.
Results
Patients
During 2005, 562 septic patients and 13,223 control patients were identified. For 2006 and 2007 there were 635 and 667 case patients, and 13,102 and 13,270 control patients, respectively.
Predictors of Sepsis
RPART analysis of the 2005 patient data set demonstrated that the most significant predictors of sepsis in the 24 hours preceding transfer to the medical ICU were the partial pressure of arterial oxygen (PaO2), systolic blood pressure, absolute neutrophil count, blood urea nitrogen (BUN), pH, bicarbonate, chloride, and albumin. This resulted in a simple algorithm with nine classification splits (Figure 1), which was then prospectively applied to the 2006 and 2007 patient data sets. These results are summarized in Table 2.
| Total Number | Number Correctly Classified (%) | Case Identification Time Before ICU Admission (minutes) | PPV (%) | NPV (%) | MCR (%) | |
|---|---|---|---|---|---|---|
| ||||||
| 2005 | 27.9 | 98.1 | 7.8 | |||
| Cases | 562 | 320 (56.9) | ||||
| Controls | 13,223 | 12,394 (93.7) | ||||
| 2006 | 179 230 | 28.7 | 97.7 | 8.4 | ||
| Cases | 635 | 347 (54.7) | ||||
| Controls | 13,102 | 12,241 (93.4) | ||||
| 2007 | 192 210 | 28.3 | 97.6 | 8.8 | ||
| Cases | 667 | 367 (55.0) | ||||
| Controls | 13,270 | 12,341 (93.0) | ||||
The resulting classification model had a low total misclassification rate for the 2005 data. Of the 562 septic patients, 320 (56.9%) were correctly classified, and 12,394 (93.7%) of the control patients were appropriately identified. The number of septic and control patients misclassified was 242 and 829, respectively, yielding a total misclassification rate of 7.8%. When applied to the 2006 patient data set, 347 (54.7%) of the 635 septic shock patients were correctly identified, while 12,241 (93.4%) of the 13,102 control patients were correctly classified. The total misclassification rate for the 2006 patient set was 8.4%. For the 2007 patient data, 367 (55.0%) of the 667 case patients were correctly identified, and 12,341 (93.0%) of the 13,270 control patients were correctly identified. This resulted in a total misclassification rate of 8.8%.
The 2006 and 2007 case patients were identified 179 230 minutes and 192 210 minutes before ICU transfer, respectively (Figure 2). The algorithm demonstrated positive and negative predictive values of 28.7% and 97.7% for the 2006 patient set, respectively, and 28.3% and 97.6% for the 2007 patient set, respectively.
Although the prediction algorithm shown in Figure 1 identified the majority of the case patients with ample time for clinical intervention prior to ICU transfer, the analysis used to derive this model included values for the arterial blood gas (ABG). As this is not a routinely obtained study for hospitalized patients outside of an ICU, it is possible that the performance of this model can in part be attributed to clinical acumen rather than changes in patient physiology. The ABG would likely only be obtained in patients with a more concerning or deteriorating clinical course, and thus more likely to develop shock. To address this possibility, a second analysis was performed that did not include the values for the ABG. The result was an algorithm with 13 classification splits, as shown in Figure 3.
The most predictive clinical variables in this analysis included the shock index (heart rate divided by systolic blood pressure), mean arterial pressure, total bilirubin, international normalized ratio (INR), total white blood cell count, absolute neutrophil count, albumin, hemoglobin, and sodium. This model was again applied to the 2006 and 2007 patient data sets (Table 3).
| Total Number | Number Correctly Classified (%) | Case Identification Time Before ICU Admission (minutes) | PPV (%) | NPV (%) | MCR (%) | |
|---|---|---|---|---|---|---|
| ||||||
| 2005 | 20.5 | 96.7 | 6.7 | |||
| Cases | 562 | 126 (22.4) | ||||
| Controls | 13,223 | 12,735 (96.3) | ||||
| 2006 | 508 536 | 21.4 | 96.1 | 7.0 | ||
| Cases | 635 | 121 (19.1) | ||||
| Controls | 13,102 | 12,657 (96.6) | ||||
| 2007 | 496 512 | 19.5 | 95.8 | 7.1 | ||
| Cases | 667 | 102 (15.3) | ||||
| Controls | 13,270 | 12,850 (96.8) | ||||
The overall misclassification rates for 2006 and 2007 were 7.0% and 7.1%, respectively. The model correctly identified 121 (19.1%) of the 635 cases and 12,657 (96.6%) of the 13,102 control patients from 2006, and 102 (15.3%) of the 667 cases and 12,850 (96.8%) of the 13,270 control patients from 2007. The respective positive and negative predictive values were 21.4% and 96.1% for 2006, respectively, and 19.5% and 95.8% for 2007, respectively.
Although the overall performance of the model derived without the ABG data was not as good, the identification times prior to ICU transfer were significantly improved. For the 2006 data, patients were identified 508 536 minutes before transfer (Figure 4), compared to 179 230 minutes for the model that included the ABG data (P < 0.01). For the 2007 data, patients were identified 496 512 minutes prior to ICU admission (Figure 4), compared to 192 210 minutes for the previous model (P < 0.01).
Discussion
We have demonstrated a simple method for generating an algorithm derived from routine laboratory and hemodynamic values that is capable of predicting the onset of sepsis in a significant proportion of non‐ICU patients. Two prediction models were generated, 1 with and 1 without ABG data included in the analysis. In the 2006 and 2007 validation cohorts, the model including these data correctly classified 54.7% and 55.0% of the patients who developed septic shock and 93.4% and 93.0% of control patients, respectively. The second model identified 19.1% and 15.3% of the septic shock patients and 96.6% and 96.8% of the control patients for 2006 and 2007, respectively. The methods used in generating this model are relatively simple and can be executed with the use of an electronic medical record system.
Early, goal‐directed cardiovascular resuscitation and adequate initial antibiotic therapy have been shown to decrease mortality in patients with severe sepsis and septic shock.2, 26 Prior studies employing early, targeted resuscitation strategies have demonstrated decreased use of vasopressors10 and decreased mortality.510 In addition, we previously demonstrated that a standardized order set for the management of severe sepsis in the emergency department that focused on early and aggressive intervention was associated with decreased 28‐day mortality.1 These studies suggest that early, aggressive management of septic shock can improve outcomes. Identification of patients prior to overt clinical deterioration may allow for early intervention aimed at preventing shock or improving its outcome.
The purpose of this method is to develop a model capable of recognizing patterns in clinical data that herald a patient's otherwise unidentified clinical deterioration. It is not intended to replace existing outcome prediction tools or severity of illness scoring systems, where a high degree of accuracy would be required. Rather, it would be best implemented as an automated screening tool incorporated into an electronic medical record system. When a hospitalized patient is identified as a possible septic shock patient by the classification tree, a notification is then issued to the clinicians caring for the patient. The primary goal of this method is to notify clinicians of potential clinical deterioration. Any action taken as a result of this notification is at the discretion of the clinician. This method could be employed for any population of hospitalized patients, though because of variations in clinical practice and patient physiology, different models would need to be generated for differing patient populations.
This method has limitations, the foremost of which is the possible instability of the resulting classification model. This type of analysis results in an algorithm that depends on binary splits to classify patients. In generating the algorithm, the recursive partitioning analysis selects the variables and cutoff values that result in the strongest decision tree with the most pure classifications at the end nodes. These variables and cutoff values may not immediately seem logical from a clinical standpoint, and may vary with changes in practice and even possibly between divisions within a hospital. As a result, the algorithm would likely require intermittent updating to remain effective and a model derived from 1 hospital or patient population would not necessarily be applicable to patients at another institution or from a different population. However, once the method has been developed at an institution, the process of revising the algorithm could be essentially automated and uses few resources.
Another shortcoming of this method is the relatively low sensitivity of the resulting algorithm. In a role as an automated alert system, a low false‐positive rate is particularly desirable to avoid unnecessary frequent distraction of clinicians. The sensitivity of the model can be improved through manipulation of how the analysis is performed, but this would be at the expense of a higher false‐positive rate, which is not acceptable. Finally, prior studies examining treatment for sepsis have demonstrated an advantage to early and aggressive therapy. It is not clear, however, if identifying these patients prior to the onset of clinically evident sepsis would result in improved outcomes. Further work is required to determine if this is the case. We are currently conducting a prospective study that employs the method described here in conjunction with an automated alert system to ascertain if it impacts outcomes on patients admitted to the medicine wards of Barnes‐Jewish Hospital.
In conclusion, the method presented here represents a technique that consumes few resources and is capable of identifying some patients before septic shock becomes clinically evident. When applied in an automated fashion with the capability to alert clinicians caring for a patient, the method demonstrated here may allow for earlier diagnosis and possibly intervention for septic shock patients.
- ,,, et al.Before–after study of a standardized hospital order set for the management of septic shock.Crit Care Med.2006;34(11):2707–2713.
- ,,, et al.Early goal‐directed therapy in the treatment of severe sepsis and septic shock.N Engl J Med.2001;345:1368–1377.
- ,,, et al.Early goal‐directed therapy in severe sepsis and septic shock revisited; concepts, controversies, and contemporary findings.Chest.2006;130(5):1579–1595.
- .Implementing the severe sepsis care bundles outside the ICU by outreach.Nurs Crit Care.2007;12:225–229.
- ,,, et al.The impact of compliance with 6‐hour and 24‐hour sepsis bundles on hospital mortality in patients with severe sepsis: a prospective observational study.Crit Care.2005;9:R764–R770.
- ,,, et al.Translating research to clinical practice, a 1‐year experience with implementing early goal‐directed therapy for septic shock in the emergency department.Chest.2006;129:225–232.
- ,,, et al.Prospective external validation of the clinical effectiveness of an emergency department‐based early goal‐directed therapy protocol for severe sepsis and septic shock.Chest.2007;132:425–432.
- ,,, et al.Implementation of a bundle of quality indicators for the early management of severe sepsis and septic shock is associated with decreased mortality.Crit Care Med.2007;35:1105–1112.
- ,,, et al.Implementation of an evidence‐based “standard operating procedure” and outcome in septic shock.Crit Care Med.2006;34:943–949.
- ,,, et al.Outcome of septic shock in older adults after implementation of the sepsis “bundle”.J Am Geriatr Soc.2008;56:272–278.
- ,,, et al.Confidential inquiry into quality of care before admission to intensive care.BMJ.1998;316:1853–1858.
- ,,.Unexpected deaths and referrals to intensive care of patients on general wards. Are some cases potentially avoidable?J R Coll Physicians Lond.1999;33(3):255–259.
- ,,, et al.Septic shock: an analysis of outcomes for patients with onset on hospital wards versus intensive care units.Crit Care Med.1998;26(6):1020–1024.
- ,,,,,.Hospital‐wide impact of a standardized order set for the management of bacteremic severe sepsis.Crit Care Med.2009;37(3):819–824.
- ,,,,,.The mRNA expression of fatty acid amide hydrolase in human whole blood correlates with sepsis.J Endotoxin Res.2007;13(1):35–38.
- ,,, et al.C‐reactive protein use as an early indicator of infection in patients with systemic inflammatory response syndrome.Intensive Care Med.2004;30(11):2038–2045.
- ,,,,.Procalcitonin as a screening test of late‐onset sepsis in preterm very low birth weight infants.J Perinatol.2005;25(6):397–402.
- ,,.A simple method for predicting severe sepsis in burn patients.Am J Surg.1980;139(4):513–517.
- ,,, et al.Prognostic value of protein C concentrations in neutropenic patients at high risk of severe septic complications.Crit Care Med.2000;28(7):2209–2216.
- ,,,,.Circulating immune parameters predicting the progression from hospital‐acquired pneumonia to septic shock in surgical patients.Crit Care Med.2005;9(6):R662–R669.
- ,,.A simple prediction algorithm for bacteremia in patients with acute febrile illness.Q J Med.2005;98:813–820.
- ,,,.Infection probability score (IPS): a method to help assess the probability of infection in critically ill patients.Crit Care Med.2003;31(11):2579–2584.
- ,.Multivariate regression modeling for the prediction of inflammation, systemic pressure, and end‐organ function in severe sepsis.Shock.1997;8(3):225–231.
- ,,,,,.Abnormal heart rate characteristics preceding neonatal sepsis and sepsis‐like illness.Pediatr Res.2003;53:920–926.
- ,.Statistics for Biology and Health.New York:Springer‐Verlag;1999.
- ,,, et al.Impact of adequate empiric antibiotic therapy on the outcome of patients admitted to the intensive care unit with sepsis.Crit Care Med.2003;31:2742–2751.
Copyright © 2010 Society of Hospital Medicine
