User login
Among hospitalized patients with serious infections, the choice of empiric therapy plays a key role in outcomes.[1, 2, 3, 4, 5, 6, 7, 8, 9] Rising rates and variable patterns of antimicrobial resistance, however, complicate selecting appropriate empiric therapy. Amidst this shifting landscape of resistance to antimicrobials, gram‐negative bacteria and specifically Acinetobacter baumannii (AB), remain a considerable challenge.[10] On the one hand, AB is a less‐frequent cause of serious infections than organisms like Pseudomonas aeruginosa or Enterobacteriaceae in severely ill hospitalized patients.[11, 12] On the other, AB has evolved a variety of resistance mechanisms and exhibits unpredictable susceptibility patterns.[13] These factors combine to increase the likelihood of administering inappropriate empiric therapy when faced with an infection caused by AB and, thereby, raising the risk of death.[14] The fact that clinicians may not routinely consider AB as the potential culprit pathogen in the patient they are treating along with this organism's highly in vitro resistant nature, may result in routine gram‐negative coverage being frequently inadequate for AB infections.
To address the poor outcomes related to inappropriate empiric therapy in the setting of AB, one requires an appreciation of the longitudinal changes and geographic differences in the susceptibility of this pathogen. Thus, we aimed to examine secular trends in the resistance of AB to antimicrobial agents whose effectiveness against this microorganism was well supported in the literature during the study timeframe.[15]
METHODS
To determine the prevalence of predefined resistance patterns among AB in respiratory and blood stream infection (BSI) specimens, we examined The Surveillance Network (TSN) database from Eurofins. We explored data collected between years 2003 and 2012. The database has been used extensively for surveillance purposes since 1994, and has previously been described in detail.[16, 17, 18, 19, 20] Briefly, TSN is a warehouse of routine clinical microbiology data collected from a nationally representative sample of microbiology laboratories in 217 hospitals in the United States. To minimize selection bias, laboratories are included based on their geography and the demographics of the populations they serve.[18] Only clinically significant samples are reported. No personal identifying information for source patients is available in this database. Only source laboratories that perform antimicrobial susceptibility testing according standard Food and Drug Administrationapproved testing methods and that interpret susceptibility in accordance with the Clinical Laboratory Standards Institute breakpoints are included.[21] (See Supporting Table 4 in the online version of this article for minimum inhibitory concentration (MIC) changes over the course of the studycurrent colistin and polymyxin breakpoints applied retrospectively). All enrolled laboratories undergo a pre‐enrollment site visit. Logical filters are used for routine quality control to detect unusual susceptibility profiles and to ensure appropriate testing methods. Repeat testing and reporting are done as necessary.[18]
Laboratory samples are reported as susceptible, intermediate, or resistant. We grouped isolates with intermediate MICs together with the resistant ones for the purposes of the current analysis. Duplicate isolates were excluded. Only samples representing 1 of the 2 infections of interest, respiratory or BSI, were included.
We examined 3 time periods2003 to 2005, 2006 to 2008, and 2009 to 2012for the prevalence of AB's resistance to the following antibiotics: carbapenems (imipenem, meropenem, doripenem), aminoglycosides (tobramycin, amikacin), tetracyclines (minocycline, doxycycline), polymyxins (colistin, polymyxin B), ampicillin‐sulbactam, and trimethoprim‐sulfamethoxazole. Antimicrobial resistance was defined by the designation of intermediate or resistant in the susceptibility category. Resistance to a class of antibiotics was defined as resistance to all drugs within the class for which testing was available. The organism was multidrug resistant (MDR) if it was resistant to at least 1 antimicrobial in at least 3 drug classes examined.[22] Resistance to a combination of 2 drugs was present if the specimen was resistant to both of the drugs in the combination for which testing was available. We examined the data by infection type, time period, the 9 US Census divisions, and location of origin of the sample.
All categorical variables are reported as percentages. Continuous variables are reported as meansstandard deviations and/or medians with the interquartile range (IQR). We did not pursue hypothesis testing due to a high risk of type I error in this large dataset. Therefore, only clinically important trends are highlighted.
RESULTS
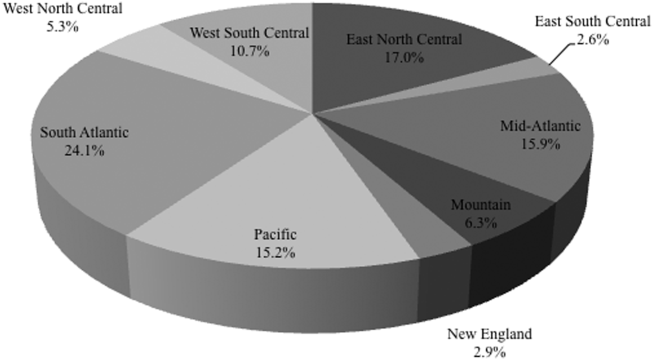
Among the 39,320 AB specimens, 81.1% were derived from a respiratory source and 18.9% represented BSI. Demographics of source patients are listed in Table 1. Notably, the median age of those with respiratory infection (58 years; IQR 38, 73) was higher than among patients with BSI (54.5 years; IQR 36, 71), and there were proportionally fewer females among respiratory patients (39.9%) than those with BSI (46.0%). Though only 24.3% of all BSI samples originated from the intensive are unit (ICU), 40.5% of respiratory specimens came from that location. The plurality of all specimens was collected in the 2003 to 2005 time interval (41.3%), followed by 2006 to 2008 (34.7%), with a minority coming from years 2009 to 2012 (24.0%). The proportions of collected specimens from respiratory and BSI sources were similar in all time periods examined (Table 1). Geographically, the South Atlantic division contributed the most samples (24.1%) and East South Central the fewest (2.6%) (Figure 1). The vast majority of all samples came from hospital wards (78.6%), where roughly one‐half originated in the ICU (37.5%). Fewer still came from outpatient sources (18.3%), and a small minority (2.5%) from nursing homes.

| Pneumonia | BSI | All | |
|---|---|---|---|
| |||
| Total, N (%) | 31,868 (81.1) | 7,452 (18.9) | 39,320 |
| Age, y | |||
| Mean (SD) | 57.7 (37.4) | 57.6 (40.6) | 57.7 (38.0) |
| Median (IQR 25, 75) | 58 (38, 73) | 54.5 (36, 71) | 57 (37, 73) |
| Gender, female (%) | 12,725 (39.9) | 3,425 (46.0) | 16,150 (41.1) |
| ICU (%) | 12,9191 (40.5) | 1,809 (24.3) | 14,7284 (37.5) |
| Time period, % total | |||
| 20032005 | 12,910 (40.5) | 3,340 (44.8) | 16,250 (41.3) |
| 20062008 | 11,205 (35.2) | 2,435 (32.7) | 13,640 (34.7) |
| 20092012 | 7,753 (24.3) | 1,677 (22.5) | 9,430 (24.0) |
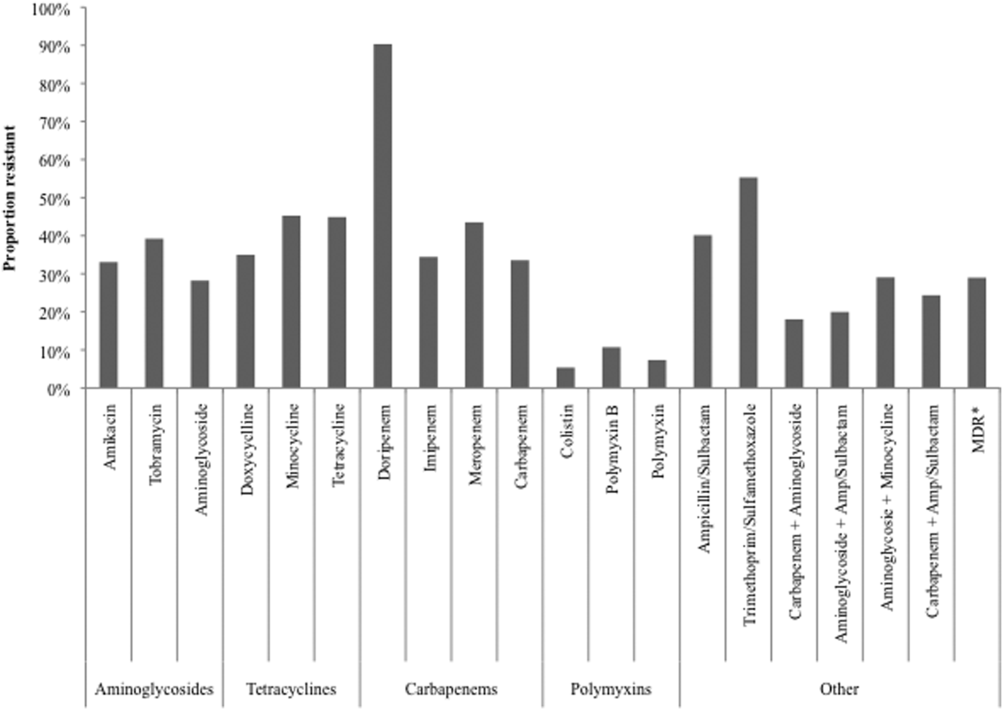
Figure 2 depicts overall resistance patterns by individual drugs, drug classes, and frequently used combinations of agents. Although doripenem had the highest rate of resistance numerically (90.3%), its susceptibility was tested only in a small minority of specimens (n=31, 0.08%). Resistance to trimethoprim‐sulfamethoxazole was high (55.3%) based on a large number of samples tested (n=33,031). Conversely, colistin as an agent and polymyxins as a class exhibited the highest susceptibility rates of over 90%, though the numbers of samples tested for susceptibility to these drugs were also small (colistin n=2,086, 5.3%; polymyxins n=3,120, 7.9%) (Figure 2). Among commonly used drug combinations, carbapenem+aminoglycoside (18.0%) had the lowest resistance rates, and nearly 30% of all AB specimens tested met the criteria for MDR.
Over time, resistance to carbapenems more‐than doubled, from 21.0% in 2003 to 2005 to 47.9% in 2009 to 2012 (Table 2). Although relatively few samples were tested for colistin susceptibility (n=2,086, 5.3%), resistance to this drug also more than doubled from 2.8% (95% confidence interval: 1.9‐4.2) in 2006 to 2008 to 6.9% (95% confidence interval: 5.7‐8.2) in 2009 to 2012. As a class, however, polymyxins exhibited stable resistance rates over the time frame of the study (Table 2). Prevalence of MDR AB rose from 21.4% in 2003 to 2005 to 33.7% in 2006 to 2008, and remained stable at 35.2% in 2009 to 2012. Resistance to even such broad combinations as carbapenem+ampicillin/sulbactam nearly tripled from 13.2% in 2003 to 2005 to 35.5% in 2009 to 2012. Notably, between 2003 and 2012, although resistance rates either rose or remained stable to all other agents, those to minocycline diminished from 56.5% in 2003 to 2005 to 36.6% in 2006 to 2008 to 30.5% in 2009 to 2012. (See Supporting Table 1 in the online version of this article for time trends based on whether they represented respiratory or BSI specimens, with directionally similar trends in both.)
| Drug/Combination | Time Period | ||||||||
|---|---|---|---|---|---|---|---|---|---|
| 20032005 | 20062008 | 20092012 | |||||||
| Na | %b | 95% CI | N | % | 95% CI | N | % | 95% CI | |
| |||||||||
| Amikacin | 12,949 | 25.2 | 24.5‐26.0 | 10.929 | 35.2 | 34.3‐36.1 | 6,292 | 45.7 | 44.4‐46.9 |
| Tobramycin | 14,549 | 37.1 | 36.3‐37.9 | 11,877 | 41.9 | 41.0‐42.8 | 7,901 | 39.2 | 38.1‐40.3 |
| Aminoglycoside | 14,505 | 22.5 | 21.8‐23.2 | 11,967 | 30.6 | 29.8‐31.4 | 7,736 | 34.8 | 33.8‐35.8 |
| Doxycycline | 173 | 36.4 | 29.6‐43.8 | 38 | 29.0 | 17.0‐44.8 | 32 | 34.4 | 20.4‐51.7 |
| Minocycline | 1,388 | 56.5 | 53.9‐50.1 | 902 | 36.6 | 33.5‐39.8 | 522 | 30.5 | 26.7‐34.5 |
| Tetracycline | 1,511 | 55.4 | 52.9‐57.9 | 940 | 36.3 | 33.3‐39.4 | 546 | 30.8 | 27.0‐34.8 |
| Doripenem | NR | NR | NR | 9 | 77.8 | 45.3‐93.7 | 22 | 95.5 | 78.2‐99.2 |
| Imipenem | 14,728 | 21.8 | 21.2‐22.5 | 12,094 | 40.3 | 39.4‐41.2 | 6,681 | 51.7 | 50.5‐52.9 |
| Meropenem | 7,226 | 37.0 | 35.9‐38.1 | 5,628 | 48.7 | 47.3‐50.0 | 4,919 | 47.3 | 45.9‐48.7 |
| Carbapenem | 15,490 | 21.0 | 20.4‐21.7 | 12,975 | 38.8 | 38.0‐39.7 | 8,778 | 47.9 | 46.9‐49.0 |
| Ampicillin/sulbactam | 10,525 | 35.2 | 34.3‐36.2 | 9,413 | 44.9 | 43.9‐45.9 | 6,460 | 41.2 | 40.0‐42.4 |
| Colistin | NR | NR | NR | 783 | 2.8 | 1.9‐4.2 | 1,303 | 6.9 | 5.7‐8.2 |
| Polymyxin B | 105 | 7.6 | 3.9‐14.3 | 796 | 12.8 | 10.7‐15.3 | 321 | 6.5 | 4.3‐9.6 |
| Polymyxin | 105 | 7.6 | 3.9‐14.3 | 1,563 | 7.9 | 6.6‐9.3 | 1,452 | 6.8 | 5.6‐8.2 |
| Trimethoprim/sulfamethoxazole | 13,640 | 52.5 | 51.7‐53.3 | 11,535 | 57.1 | 56.2‐58.0 | 7,856 | 57.6 | 56.5‐58.7 |
| MDRc | 16,249 | 21.4 | 20.7‐22.0 | 13,640 | 33.7 | 33.0‐34.5 | 9,431 | 35.2 | 34.2‐36.2 |
| Carbapenem+aminoglycoside | 14,601 | 8.9 | 8.5‐9.4 | 12,333 | 21.3 | 20.6‐22.0 | 8,256 | 29.3 | 28.3‐30.3 |
| Aminoglycoside+ampicillin/sulbactam | 10,107 | 12.9 | 12.3‐13.6 | 9,077 | 24.9 | 24.0‐25.8 | 6,200 | 24.3 | 23.2‐25.3 |
| Aminoglycosie+minocycline | 1,359 | 35.6 | 33.1‐38.2 | 856 | 21.4 | 18.8‐24.2 | 503 | 24.5 | 20.9‐28.4 |
| Carbapenem+ampicillin/sulbactam | 10,228 | 13.2 | 12.5‐13.9 | 9,145 | 29.4 | 28.4‐30.3 | 6,143 | 35.5 | 34.3‐36.7 |
Regionally, examining resistance by classes and combinations of antibiotics, trimethoprim‐sulfamethoxazole exhibited consistently the highest rates of resistance, ranging from the lowest in the New England (28.8%) to the highest in the East North Central (69.9%) Census divisions (See Supporting Table 2 in the online version of this article). The rates of resistance to tetracyclines ranged from 0.0% in New England to 52.6% in the Mountain division, and to polymyxins from 0.0% in the East South Central division to 23.4% in New England. Generally, New England enjoyed the lowest rates of resistance (0.0% to tetracyclines to 28.8% to trimethoprim‐sulfamethoxazole), and the Mountain division the highest (0.9% to polymyxins to 52.6% to tetracyclines). The rates of MDR AB ranged from 8.0% in New England to 50.4% in the Mountain division (see Supporting Table 2 in the online version of this article).
Examining resistances to drug classes and combinations by the location of the source specimen revealed that trimethoprim‐sulfamethoxazole once again exhibited the highest rate of resistance across all locations (see Supporting Table 3 in the online version of this article). Despite their modest contribution to the overall sample pool (n=967, 2.5%), organisms from nursing home subjects had the highest prevalence of resistance to aminoglycosides (36.3%), tetracyclines (57.1%), and carbapenems (47.1%). This pattern held true for combination regimens examined. Nursing homes also vastly surpassed other locations in the rates of MDR AB (46.5%). Interestingly, the rates of MDR did not differ substantially among regular inpatient wards (29.2%), the ICU (28.7%), and outpatient locations (26.2%) (see Supporting Table 3 in the online version of this article).
DISCUSSION
In this large multicenter survey we have documented the rising rates of AB resistance to clinically important antimicrobials in the United States. On the whole, all antimicrobials, except for minocycline, exhibited either large or small increases in resistance. Alarmingly, even colistin, a true last resort AB treatment, lost a considerable amount of activity against AB, with the resistance rate rising from 2.8% in 2006 to 2008 to 6.9% in 2009 to 2012. The single encouraging trend that we observed was that resistance to minocycline appeared to diminish substantially, going from over one‐half of all AB tested in 2003 to 2005 to just under one‐third in 2009 to 2012.
Although we did note a rise in the MDR AB, our data suggest a lower percentage of all AB that meets the MDR phenotype criteria compared to reports by other groups. For example, the Center for Disease Dynamics and Economic Policy (CDDEP), analyzing the same data as our study, reports a rise in MDR AB from 32.1% in 1999 to 51.0% in 2010.[23] This discrepancy is easily explained by the fact that we included polymyxins, tetracyclines, and trimethoprim‐sulfamethoxazole in our evaluation, whereas the CDDEP did not examine these agents. Furthermore, we omitted fluoroquinolones, a drug class with high rates of resistance, from our study, because we were interested in focusing only on antimicrobials with clinical data in AB infections.[22] In addition, we limited our evaluation to specimens derived from respiratory or BSI sources, whereas the CDDEP data reflect any AB isolate present in TSN.
We additionally confirm that there is substantial geographic variation in resistance patterns. Thus, despite different definitions, our data agree with those from the CDDEP that the MDR prevalence is highest in the Mountain and East North Central divisions, and lowest in New England overall.[23] The wide variations underscore the fact that it is not valid to speak of national rates of resistance, but rather it is important to concentrate on the local patterns. This information, though important from the macroepidemiologic standpoint, is likely still not granular enough to help clinicians make empiric treatment decisions. In fact, what is needed for that is real‐time antibiogram data specific to each center and even each unit within each center.
The latter point is further illustrated by our analysis of locations of origin of the specimens. In this analysis, we discovered that, contrary to the common presumption that the ICU has the highest rate of resistant organisms, specimens derived from nursing homes represent perhaps the most intensely resistant organisms. In other words, the nursing home is the setting most likely to harbor patients with respiratory infections and BSIs caused by resistant AB. These data are in agreement with several other recent investigations. In a period‐prevalence survey conducted in the state of Maryland in 2009 by Thom and colleagues, long‐term care facilities were found to have the highest prevalence of any AB, and also those resistant to imipenem, MDR, and extensively drug‐resistant organisms.[24] Mortensen and coworkers confirmed the high prevalence of AB and AB resistance in long‐term care facilities, and extended this finding to suggest that there is evidence for intra‐ and interhospital spread of these pathogens.[25] Our data confirm this concerning finding at the national level, and point to a potential area of intervention for infection prevention.
An additional finding of some concern is that the highest proportion of colistin resistance among those specimens, whose location of origin was reported in the database, was the outpatient setting (6.6% compared to 5.4% in the ICU specimens, for example). Although these infections would likely meet the definition for healthcare‐associated infection, AB as a community‐acquired respiratory pathogen is not unprecedented either in the United States or abroad.[26, 27, 28, 29, 30] It is, however, reassuring that most other antimicrobials examined in our study exhibit higher rates of susceptibility in the specimens derived from the outpatient settings than either from the hospital or the nursing home.
Our study has a number of strengths. As a large multicenter survey, it is representative of AB susceptibility patterns across the United States, which makes it highly generalizable. We focused on antibiotics for which clinical evidence is available, thus adding a practical dimension to the results. Another pragmatic consideration is examining the data by geographic distributions, allowing an additional layer of granularity for clinical decisions. At the same time it suffers from some limitations. The TSN database consists of microbiology samples from hospital laboratories. Although we attempted to reduce the risk of duplication, because of how samples are numbered in the database, repeat sampling remains a possibility. Despite having stratified the data by geography and the location of origin of the specimen, it is likely not granular enough for local risk stratification decisions clinicians make daily about the choices of empiric therapy. Some of the MIC breakpoints have changed over the period of the study (see Supporting Table 4 in the online version of this article). Because these changes occurred in the last year of data collection (2012), they should have had only a minimal, if any, impact on the observed rates of resistance in the time frame examined. Additionally, because resistance rates evolve rapidly, more current data are required for effective clinical decision making.
In summary, we have demonstrated that the last decade has seen an alarming increase in the rate of resistance of AB to multiple clinically important antimicrobial agents and classes. We have further emphasized the importance of granularity in susceptibility data to help clinicians make sensible decisions about empiric therapy in hospitalized patients with serious infections. Finally, and potentially most disturbingly, the nursing home as a location appears to be a robust reservoir for spread for resistant AB. All of these observations highlight the urgent need to develop novel antibiotics and nontraditional agents, such as antibodies and vaccines, to combat AB infections, in addition to having important infection prevention implications if we are to contain the looming threat of the end of antibiotics.[31]
Disclosure
This study was funded by a grant from Tetraphase Pharmaceuticals, Watertown, MA.
- National Nosocomial Infections Surveillance (NNIS) System Report. Am J Infect Control. 2004;32:470–485.
- , , , National surveillance of antimicrobial resistance in Pseudomonas aeruginosa isolates obtained from intensive care unit patients from 1993 to 2002. Antimicrob Agents Chemother. 2004;48:4606–4610.
- , , , et al. Health care‐associated pneumonia and community‐acquired pneumonia: a single‐center experience. Antimicrob Agents Chemother. 2007;51:3568–3573.
- , , , et al. Clinical importance of delays in the initiation of appropriate antibiotic treatment for ventilator‐associated pneumonia. Chest. 2002;122:262–268.
- ; ICU‐Acquired Pneumonia Study Group. Modification of empiric antibiotic treatment in patients with pneumonia acquired in the intensive care unit. Intensive Care Med. 1996;22:387–394.
- , , , , Antimicrobial therapy escalation and hospital mortality among patients with HCAP: a single center experience. Chest. 2008:134:963–968.
- , , , et al. Surviving Sepsis Campaign: international guidelines for management of severe sepsis and septic shock: 2008. Crit Care Med. 2008;36:296–327.
- , , , , , Inappropriate antibiotic therapy in Gram‐negative sepsis increases hospital length of stay. Crit Care Med. 2011;39:46–51.
- , , , Inadequate antimicrobial treatment of infections: a risk factor for hospital mortality among critically ill patients. Chest. 1999;115:462–474.
- Centers for Disease Control and Prevention. Antibiotic resistance threats in the United States, 2013. Available at: http://www.cdc.gov/drugresistance/threat-report-2013/pdf/ar-threats-2013-508.pdf#page=59. Accessed December 29, 2014.
- , , , et al.; National Healthcare Safety Network (NHSN) Team and Participating NHSN Facilities. Antimicrobial‐resistant pathogens associated with healthcare‐associated infections: summary of data reported to the National Healthcare Safety Network at the Centers for Disease Control and Prevention, 2009–2010. Infect Control Hosp Epidemiol. 2013;34:1–14.
- , , , , Multi‐drug resistance, inappropriate initial antibiotic therapy and mortality in Gram‐negative severe sepsis and septic shock: a retrospective cohort study. Crit Care. 2014;18(6):596.
- , , , , , Global challenge of multidrug‐resistant Acinetobacter baumannii. Antimicrob Agents Chemother. 2007;51:3471–3484.
- , , , Predictors of hospital mortality among septic ICU patients with Acinetobacter spp. bacteremia: a cohort study. BMC Infect Dis. 2014;14:572.
- , Treatment of Acinetobacter infections. Clin Infect Dis. 2010;51:79–84.
- , , Increasing resistance of Acinetobacter species to imipenem in United States hospitals, 1999–2006. Infect Control Hosp Epidemiol. 2010;31:196–197.
- , , , , Trends in resistance to carbapenems and third‐generation cephalosporins among clinical isolates of Klebsiella pneumoniae in the United States, 1999–2010. Infect Control Hosp Epidemiol. 2013;34:259–268.
- , , Antimicrobial resistance in key bloodstream bacterial isolates: electronic surveillance with the Surveillance Network Database—USA. Clin Infect Dis. 1999;29:259–263.
- , , Community‐associated methicillin‐resistant Staphylococcus aureus in outpatients, United States, 1999–2006. Emerg Infect Dis. 2009;15:1925–1930.
- , , , , Prevalence of antimicrobial resistance in bacteria isolated from central nervous system specimens as reported by U.S. hospital laboratories from 2000 to 2002. Ann Clin Microbiol Antimicrob. 2004;3:3.
- Performance standards for antimicrobial susceptibility testing: twenty‐second informational supplement. CLSI document M100‐S22. Wayne, PA: Clinical and Laboratory Standards Institute; 2012.
- , , , et al. Multidrug‐resistant, extensively drug‐resistant and pandrug‐resistant bacteria: an international expert proposal for interim standard definitions for acquired resistance. Clin Microbiol Infect. 2012;18:268–281.
- CDDEP: The Center for Disease Dynamics, Economics and Policy. Resistance map: Acinetobacter baumannii overview. Available at: http://www.cddep.org/projects/resistance_map/acinetobacter_baumannii_overview. Accessed January 16, 2015.
- , , , et al.; Maryland MDRO Prevention Collaborative. Assessing the burden of Acinetobacter baumannii in Maryland: a statewide cross‐sectional period prevalence survey. Infect Control Hosp Epidemiol. 2012;33:883–888.
- , , , et al. Multidrug‐resistant Acinetobacter baumannii infection, colonization, and transmission related to a long‐term care facility providing subacute care. Infect Control Hosp Epidemiol. 2014;35:406–411.
- , , , , , Severe community‐acquired pneumonia due to Acinetobacter baumannii. Chest. 2001;120:1072–1077.
- , , , , , Fulminant community‐acquired Acinetobacter baumannii pneumonia as distinct clinical syndrome. Chest. 2006;129:102–109.
- , , , Community‐acquired Acinetobacter baumannii pneumonia. Rev Clin Esp. 2003;203:284–286.
- , , , et al. Antimicrobial drug‐resistant microbes associated with hospitalized community‐acquired and healthcare‐associated pneumonia: a multi‐center study in Taiwan. J Formos Med Assoc. 2013;112:31–40.
- , , , , Antimicrobial resistance in Hispanic patients hospitalized in San Antonio, TX with community‐acquired pneumonia. Hosp Pract (1995). 2010;38:108–113.
- Centers for Disease Control and Prevention. CDC director blog. The end of antibiotics. Can we come back from the brink? Available at: http://blogs.cdc.gov/cdcdirector/2014/05/05/the-end-of-antibiotics-can-we-come-back-from-the-brink/. Published May 5, 2014. Accessed January 16, 2015.
Among hospitalized patients with serious infections, the choice of empiric therapy plays a key role in outcomes.[1, 2, 3, 4, 5, 6, 7, 8, 9] Rising rates and variable patterns of antimicrobial resistance, however, complicate selecting appropriate empiric therapy. Amidst this shifting landscape of resistance to antimicrobials, gram‐negative bacteria and specifically Acinetobacter baumannii (AB), remain a considerable challenge.[10] On the one hand, AB is a less‐frequent cause of serious infections than organisms like Pseudomonas aeruginosa or Enterobacteriaceae in severely ill hospitalized patients.[11, 12] On the other, AB has evolved a variety of resistance mechanisms and exhibits unpredictable susceptibility patterns.[13] These factors combine to increase the likelihood of administering inappropriate empiric therapy when faced with an infection caused by AB and, thereby, raising the risk of death.[14] The fact that clinicians may not routinely consider AB as the potential culprit pathogen in the patient they are treating along with this organism's highly in vitro resistant nature, may result in routine gram‐negative coverage being frequently inadequate for AB infections.
To address the poor outcomes related to inappropriate empiric therapy in the setting of AB, one requires an appreciation of the longitudinal changes and geographic differences in the susceptibility of this pathogen. Thus, we aimed to examine secular trends in the resistance of AB to antimicrobial agents whose effectiveness against this microorganism was well supported in the literature during the study timeframe.[15]
METHODS
To determine the prevalence of predefined resistance patterns among AB in respiratory and blood stream infection (BSI) specimens, we examined The Surveillance Network (TSN) database from Eurofins. We explored data collected between years 2003 and 2012. The database has been used extensively for surveillance purposes since 1994, and has previously been described in detail.[16, 17, 18, 19, 20] Briefly, TSN is a warehouse of routine clinical microbiology data collected from a nationally representative sample of microbiology laboratories in 217 hospitals in the United States. To minimize selection bias, laboratories are included based on their geography and the demographics of the populations they serve.[18] Only clinically significant samples are reported. No personal identifying information for source patients is available in this database. Only source laboratories that perform antimicrobial susceptibility testing according standard Food and Drug Administrationapproved testing methods and that interpret susceptibility in accordance with the Clinical Laboratory Standards Institute breakpoints are included.[21] (See Supporting Table 4 in the online version of this article for minimum inhibitory concentration (MIC) changes over the course of the studycurrent colistin and polymyxin breakpoints applied retrospectively). All enrolled laboratories undergo a pre‐enrollment site visit. Logical filters are used for routine quality control to detect unusual susceptibility profiles and to ensure appropriate testing methods. Repeat testing and reporting are done as necessary.[18]
Laboratory samples are reported as susceptible, intermediate, or resistant. We grouped isolates with intermediate MICs together with the resistant ones for the purposes of the current analysis. Duplicate isolates were excluded. Only samples representing 1 of the 2 infections of interest, respiratory or BSI, were included.
We examined 3 time periods2003 to 2005, 2006 to 2008, and 2009 to 2012for the prevalence of AB's resistance to the following antibiotics: carbapenems (imipenem, meropenem, doripenem), aminoglycosides (tobramycin, amikacin), tetracyclines (minocycline, doxycycline), polymyxins (colistin, polymyxin B), ampicillin‐sulbactam, and trimethoprim‐sulfamethoxazole. Antimicrobial resistance was defined by the designation of intermediate or resistant in the susceptibility category. Resistance to a class of antibiotics was defined as resistance to all drugs within the class for which testing was available. The organism was multidrug resistant (MDR) if it was resistant to at least 1 antimicrobial in at least 3 drug classes examined.[22] Resistance to a combination of 2 drugs was present if the specimen was resistant to both of the drugs in the combination for which testing was available. We examined the data by infection type, time period, the 9 US Census divisions, and location of origin of the sample.
All categorical variables are reported as percentages. Continuous variables are reported as meansstandard deviations and/or medians with the interquartile range (IQR). We did not pursue hypothesis testing due to a high risk of type I error in this large dataset. Therefore, only clinically important trends are highlighted.
RESULTS
Among the 39,320 AB specimens, 81.1% were derived from a respiratory source and 18.9% represented BSI. Demographics of source patients are listed in Table 1. Notably, the median age of those with respiratory infection (58 years; IQR 38, 73) was higher than among patients with BSI (54.5 years; IQR 36, 71), and there were proportionally fewer females among respiratory patients (39.9%) than those with BSI (46.0%). Though only 24.3% of all BSI samples originated from the intensive are unit (ICU), 40.5% of respiratory specimens came from that location. The plurality of all specimens was collected in the 2003 to 2005 time interval (41.3%), followed by 2006 to 2008 (34.7%), with a minority coming from years 2009 to 2012 (24.0%). The proportions of collected specimens from respiratory and BSI sources were similar in all time periods examined (Table 1). Geographically, the South Atlantic division contributed the most samples (24.1%) and East South Central the fewest (2.6%) (Figure 1). The vast majority of all samples came from hospital wards (78.6%), where roughly one‐half originated in the ICU (37.5%). Fewer still came from outpatient sources (18.3%), and a small minority (2.5%) from nursing homes.
| Pneumonia | BSI | All | |
|---|---|---|---|
| |||
| Total, N (%) | 31,868 (81.1) | 7,452 (18.9) | 39,320 |
| Age, y | |||
| Mean (SD) | 57.7 (37.4) | 57.6 (40.6) | 57.7 (38.0) |
| Median (IQR 25, 75) | 58 (38, 73) | 54.5 (36, 71) | 57 (37, 73) |
| Gender, female (%) | 12,725 (39.9) | 3,425 (46.0) | 16,150 (41.1) |
| ICU (%) | 12,9191 (40.5) | 1,809 (24.3) | 14,7284 (37.5) |
| Time period, % total | |||
| 20032005 | 12,910 (40.5) | 3,340 (44.8) | 16,250 (41.3) |
| 20062008 | 11,205 (35.2) | 2,435 (32.7) | 13,640 (34.7) |
| 20092012 | 7,753 (24.3) | 1,677 (22.5) | 9,430 (24.0) |
Figure 2 depicts overall resistance patterns by individual drugs, drug classes, and frequently used combinations of agents. Although doripenem had the highest rate of resistance numerically (90.3%), its susceptibility was tested only in a small minority of specimens (n=31, 0.08%). Resistance to trimethoprim‐sulfamethoxazole was high (55.3%) based on a large number of samples tested (n=33,031). Conversely, colistin as an agent and polymyxins as a class exhibited the highest susceptibility rates of over 90%, though the numbers of samples tested for susceptibility to these drugs were also small (colistin n=2,086, 5.3%; polymyxins n=3,120, 7.9%) (Figure 2). Among commonly used drug combinations, carbapenem+aminoglycoside (18.0%) had the lowest resistance rates, and nearly 30% of all AB specimens tested met the criteria for MDR.
Over time, resistance to carbapenems more‐than doubled, from 21.0% in 2003 to 2005 to 47.9% in 2009 to 2012 (Table 2). Although relatively few samples were tested for colistin susceptibility (n=2,086, 5.3%), resistance to this drug also more than doubled from 2.8% (95% confidence interval: 1.9‐4.2) in 2006 to 2008 to 6.9% (95% confidence interval: 5.7‐8.2) in 2009 to 2012. As a class, however, polymyxins exhibited stable resistance rates over the time frame of the study (Table 2). Prevalence of MDR AB rose from 21.4% in 2003 to 2005 to 33.7% in 2006 to 2008, and remained stable at 35.2% in 2009 to 2012. Resistance to even such broad combinations as carbapenem+ampicillin/sulbactam nearly tripled from 13.2% in 2003 to 2005 to 35.5% in 2009 to 2012. Notably, between 2003 and 2012, although resistance rates either rose or remained stable to all other agents, those to minocycline diminished from 56.5% in 2003 to 2005 to 36.6% in 2006 to 2008 to 30.5% in 2009 to 2012. (See Supporting Table 1 in the online version of this article for time trends based on whether they represented respiratory or BSI specimens, with directionally similar trends in both.)
| Drug/Combination | Time Period | ||||||||
|---|---|---|---|---|---|---|---|---|---|
| 20032005 | 20062008 | 20092012 | |||||||
| Na | %b | 95% CI | N | % | 95% CI | N | % | 95% CI | |
| |||||||||
| Amikacin | 12,949 | 25.2 | 24.5‐26.0 | 10.929 | 35.2 | 34.3‐36.1 | 6,292 | 45.7 | 44.4‐46.9 |
| Tobramycin | 14,549 | 37.1 | 36.3‐37.9 | 11,877 | 41.9 | 41.0‐42.8 | 7,901 | 39.2 | 38.1‐40.3 |
| Aminoglycoside | 14,505 | 22.5 | 21.8‐23.2 | 11,967 | 30.6 | 29.8‐31.4 | 7,736 | 34.8 | 33.8‐35.8 |
| Doxycycline | 173 | 36.4 | 29.6‐43.8 | 38 | 29.0 | 17.0‐44.8 | 32 | 34.4 | 20.4‐51.7 |
| Minocycline | 1,388 | 56.5 | 53.9‐50.1 | 902 | 36.6 | 33.5‐39.8 | 522 | 30.5 | 26.7‐34.5 |
| Tetracycline | 1,511 | 55.4 | 52.9‐57.9 | 940 | 36.3 | 33.3‐39.4 | 546 | 30.8 | 27.0‐34.8 |
| Doripenem | NR | NR | NR | 9 | 77.8 | 45.3‐93.7 | 22 | 95.5 | 78.2‐99.2 |
| Imipenem | 14,728 | 21.8 | 21.2‐22.5 | 12,094 | 40.3 | 39.4‐41.2 | 6,681 | 51.7 | 50.5‐52.9 |
| Meropenem | 7,226 | 37.0 | 35.9‐38.1 | 5,628 | 48.7 | 47.3‐50.0 | 4,919 | 47.3 | 45.9‐48.7 |
| Carbapenem | 15,490 | 21.0 | 20.4‐21.7 | 12,975 | 38.8 | 38.0‐39.7 | 8,778 | 47.9 | 46.9‐49.0 |
| Ampicillin/sulbactam | 10,525 | 35.2 | 34.3‐36.2 | 9,413 | 44.9 | 43.9‐45.9 | 6,460 | 41.2 | 40.0‐42.4 |
| Colistin | NR | NR | NR | 783 | 2.8 | 1.9‐4.2 | 1,303 | 6.9 | 5.7‐8.2 |
| Polymyxin B | 105 | 7.6 | 3.9‐14.3 | 796 | 12.8 | 10.7‐15.3 | 321 | 6.5 | 4.3‐9.6 |
| Polymyxin | 105 | 7.6 | 3.9‐14.3 | 1,563 | 7.9 | 6.6‐9.3 | 1,452 | 6.8 | 5.6‐8.2 |
| Trimethoprim/sulfamethoxazole | 13,640 | 52.5 | 51.7‐53.3 | 11,535 | 57.1 | 56.2‐58.0 | 7,856 | 57.6 | 56.5‐58.7 |
| MDRc | 16,249 | 21.4 | 20.7‐22.0 | 13,640 | 33.7 | 33.0‐34.5 | 9,431 | 35.2 | 34.2‐36.2 |
| Carbapenem+aminoglycoside | 14,601 | 8.9 | 8.5‐9.4 | 12,333 | 21.3 | 20.6‐22.0 | 8,256 | 29.3 | 28.3‐30.3 |
| Aminoglycoside+ampicillin/sulbactam | 10,107 | 12.9 | 12.3‐13.6 | 9,077 | 24.9 | 24.0‐25.8 | 6,200 | 24.3 | 23.2‐25.3 |
| Aminoglycosie+minocycline | 1,359 | 35.6 | 33.1‐38.2 | 856 | 21.4 | 18.8‐24.2 | 503 | 24.5 | 20.9‐28.4 |
| Carbapenem+ampicillin/sulbactam | 10,228 | 13.2 | 12.5‐13.9 | 9,145 | 29.4 | 28.4‐30.3 | 6,143 | 35.5 | 34.3‐36.7 |
Regionally, examining resistance by classes and combinations of antibiotics, trimethoprim‐sulfamethoxazole exhibited consistently the highest rates of resistance, ranging from the lowest in the New England (28.8%) to the highest in the East North Central (69.9%) Census divisions (See Supporting Table 2 in the online version of this article). The rates of resistance to tetracyclines ranged from 0.0% in New England to 52.6% in the Mountain division, and to polymyxins from 0.0% in the East South Central division to 23.4% in New England. Generally, New England enjoyed the lowest rates of resistance (0.0% to tetracyclines to 28.8% to trimethoprim‐sulfamethoxazole), and the Mountain division the highest (0.9% to polymyxins to 52.6% to tetracyclines). The rates of MDR AB ranged from 8.0% in New England to 50.4% in the Mountain division (see Supporting Table 2 in the online version of this article).
Examining resistances to drug classes and combinations by the location of the source specimen revealed that trimethoprim‐sulfamethoxazole once again exhibited the highest rate of resistance across all locations (see Supporting Table 3 in the online version of this article). Despite their modest contribution to the overall sample pool (n=967, 2.5%), organisms from nursing home subjects had the highest prevalence of resistance to aminoglycosides (36.3%), tetracyclines (57.1%), and carbapenems (47.1%). This pattern held true for combination regimens examined. Nursing homes also vastly surpassed other locations in the rates of MDR AB (46.5%). Interestingly, the rates of MDR did not differ substantially among regular inpatient wards (29.2%), the ICU (28.7%), and outpatient locations (26.2%) (see Supporting Table 3 in the online version of this article).
DISCUSSION
In this large multicenter survey we have documented the rising rates of AB resistance to clinically important antimicrobials in the United States. On the whole, all antimicrobials, except for minocycline, exhibited either large or small increases in resistance. Alarmingly, even colistin, a true last resort AB treatment, lost a considerable amount of activity against AB, with the resistance rate rising from 2.8% in 2006 to 2008 to 6.9% in 2009 to 2012. The single encouraging trend that we observed was that resistance to minocycline appeared to diminish substantially, going from over one‐half of all AB tested in 2003 to 2005 to just under one‐third in 2009 to 2012.
Although we did note a rise in the MDR AB, our data suggest a lower percentage of all AB that meets the MDR phenotype criteria compared to reports by other groups. For example, the Center for Disease Dynamics and Economic Policy (CDDEP), analyzing the same data as our study, reports a rise in MDR AB from 32.1% in 1999 to 51.0% in 2010.[23] This discrepancy is easily explained by the fact that we included polymyxins, tetracyclines, and trimethoprim‐sulfamethoxazole in our evaluation, whereas the CDDEP did not examine these agents. Furthermore, we omitted fluoroquinolones, a drug class with high rates of resistance, from our study, because we were interested in focusing only on antimicrobials with clinical data in AB infections.[22] In addition, we limited our evaluation to specimens derived from respiratory or BSI sources, whereas the CDDEP data reflect any AB isolate present in TSN.
We additionally confirm that there is substantial geographic variation in resistance patterns. Thus, despite different definitions, our data agree with those from the CDDEP that the MDR prevalence is highest in the Mountain and East North Central divisions, and lowest in New England overall.[23] The wide variations underscore the fact that it is not valid to speak of national rates of resistance, but rather it is important to concentrate on the local patterns. This information, though important from the macroepidemiologic standpoint, is likely still not granular enough to help clinicians make empiric treatment decisions. In fact, what is needed for that is real‐time antibiogram data specific to each center and even each unit within each center.
The latter point is further illustrated by our analysis of locations of origin of the specimens. In this analysis, we discovered that, contrary to the common presumption that the ICU has the highest rate of resistant organisms, specimens derived from nursing homes represent perhaps the most intensely resistant organisms. In other words, the nursing home is the setting most likely to harbor patients with respiratory infections and BSIs caused by resistant AB. These data are in agreement with several other recent investigations. In a period‐prevalence survey conducted in the state of Maryland in 2009 by Thom and colleagues, long‐term care facilities were found to have the highest prevalence of any AB, and also those resistant to imipenem, MDR, and extensively drug‐resistant organisms.[24] Mortensen and coworkers confirmed the high prevalence of AB and AB resistance in long‐term care facilities, and extended this finding to suggest that there is evidence for intra‐ and interhospital spread of these pathogens.[25] Our data confirm this concerning finding at the national level, and point to a potential area of intervention for infection prevention.
An additional finding of some concern is that the highest proportion of colistin resistance among those specimens, whose location of origin was reported in the database, was the outpatient setting (6.6% compared to 5.4% in the ICU specimens, for example). Although these infections would likely meet the definition for healthcare‐associated infection, AB as a community‐acquired respiratory pathogen is not unprecedented either in the United States or abroad.[26, 27, 28, 29, 30] It is, however, reassuring that most other antimicrobials examined in our study exhibit higher rates of susceptibility in the specimens derived from the outpatient settings than either from the hospital or the nursing home.
Our study has a number of strengths. As a large multicenter survey, it is representative of AB susceptibility patterns across the United States, which makes it highly generalizable. We focused on antibiotics for which clinical evidence is available, thus adding a practical dimension to the results. Another pragmatic consideration is examining the data by geographic distributions, allowing an additional layer of granularity for clinical decisions. At the same time it suffers from some limitations. The TSN database consists of microbiology samples from hospital laboratories. Although we attempted to reduce the risk of duplication, because of how samples are numbered in the database, repeat sampling remains a possibility. Despite having stratified the data by geography and the location of origin of the specimen, it is likely not granular enough for local risk stratification decisions clinicians make daily about the choices of empiric therapy. Some of the MIC breakpoints have changed over the period of the study (see Supporting Table 4 in the online version of this article). Because these changes occurred in the last year of data collection (2012), they should have had only a minimal, if any, impact on the observed rates of resistance in the time frame examined. Additionally, because resistance rates evolve rapidly, more current data are required for effective clinical decision making.
In summary, we have demonstrated that the last decade has seen an alarming increase in the rate of resistance of AB to multiple clinically important antimicrobial agents and classes. We have further emphasized the importance of granularity in susceptibility data to help clinicians make sensible decisions about empiric therapy in hospitalized patients with serious infections. Finally, and potentially most disturbingly, the nursing home as a location appears to be a robust reservoir for spread for resistant AB. All of these observations highlight the urgent need to develop novel antibiotics and nontraditional agents, such as antibodies and vaccines, to combat AB infections, in addition to having important infection prevention implications if we are to contain the looming threat of the end of antibiotics.[31]
Disclosure
This study was funded by a grant from Tetraphase Pharmaceuticals, Watertown, MA.
- National Nosocomial Infections Surveillance (NNIS) System Report. Am J Infect Control. 2004;32:470–485.
- , , , National surveillance of antimicrobial resistance in Pseudomonas aeruginosa isolates obtained from intensive care unit patients from 1993 to 2002. Antimicrob Agents Chemother. 2004;48:4606–4610.
- , , , et al. Health care‐associated pneumonia and community‐acquired pneumonia: a single‐center experience. Antimicrob Agents Chemother. 2007;51:3568–3573.
- , , , et al. Clinical importance of delays in the initiation of appropriate antibiotic treatment for ventilator‐associated pneumonia. Chest. 2002;122:262–268.
- ; ICU‐Acquired Pneumonia Study Group. Modification of empiric antibiotic treatment in patients with pneumonia acquired in the intensive care unit. Intensive Care Med. 1996;22:387–394.
- , , , , Antimicrobial therapy escalation and hospital mortality among patients with HCAP: a single center experience. Chest. 2008:134:963–968.
- , , , et al. Surviving Sepsis Campaign: international guidelines for management of severe sepsis and septic shock: 2008. Crit Care Med. 2008;36:296–327.
- , , , , , Inappropriate antibiotic therapy in Gram‐negative sepsis increases hospital length of stay. Crit Care Med. 2011;39:46–51.
- , , , Inadequate antimicrobial treatment of infections: a risk factor for hospital mortality among critically ill patients. Chest. 1999;115:462–474.
- Centers for Disease Control and Prevention. Antibiotic resistance threats in the United States, 2013. Available at: http://www.cdc.gov/drugresistance/threat-report-2013/pdf/ar-threats-2013-508.pdf#page=59. Accessed December 29, 2014.
- , , , et al.; National Healthcare Safety Network (NHSN) Team and Participating NHSN Facilities. Antimicrobial‐resistant pathogens associated with healthcare‐associated infections: summary of data reported to the National Healthcare Safety Network at the Centers for Disease Control and Prevention, 2009–2010. Infect Control Hosp Epidemiol. 2013;34:1–14.
- , , , , Multi‐drug resistance, inappropriate initial antibiotic therapy and mortality in Gram‐negative severe sepsis and septic shock: a retrospective cohort study. Crit Care. 2014;18(6):596.
- , , , , , Global challenge of multidrug‐resistant Acinetobacter baumannii. Antimicrob Agents Chemother. 2007;51:3471–3484.
- , , , Predictors of hospital mortality among septic ICU patients with Acinetobacter spp. bacteremia: a cohort study. BMC Infect Dis. 2014;14:572.
- , Treatment of Acinetobacter infections. Clin Infect Dis. 2010;51:79–84.
- , , Increasing resistance of Acinetobacter species to imipenem in United States hospitals, 1999–2006. Infect Control Hosp Epidemiol. 2010;31:196–197.
- , , , , Trends in resistance to carbapenems and third‐generation cephalosporins among clinical isolates of Klebsiella pneumoniae in the United States, 1999–2010. Infect Control Hosp Epidemiol. 2013;34:259–268.
- , , Antimicrobial resistance in key bloodstream bacterial isolates: electronic surveillance with the Surveillance Network Database—USA. Clin Infect Dis. 1999;29:259–263.
- , , Community‐associated methicillin‐resistant Staphylococcus aureus in outpatients, United States, 1999–2006. Emerg Infect Dis. 2009;15:1925–1930.
- , , , , Prevalence of antimicrobial resistance in bacteria isolated from central nervous system specimens as reported by U.S. hospital laboratories from 2000 to 2002. Ann Clin Microbiol Antimicrob. 2004;3:3.
- Performance standards for antimicrobial susceptibility testing: twenty‐second informational supplement. CLSI document M100‐S22. Wayne, PA: Clinical and Laboratory Standards Institute; 2012.
- , , , et al. Multidrug‐resistant, extensively drug‐resistant and pandrug‐resistant bacteria: an international expert proposal for interim standard definitions for acquired resistance. Clin Microbiol Infect. 2012;18:268–281.
- CDDEP: The Center for Disease Dynamics, Economics and Policy. Resistance map: Acinetobacter baumannii overview. Available at: http://www.cddep.org/projects/resistance_map/acinetobacter_baumannii_overview. Accessed January 16, 2015.
- , , , et al.; Maryland MDRO Prevention Collaborative. Assessing the burden of Acinetobacter baumannii in Maryland: a statewide cross‐sectional period prevalence survey. Infect Control Hosp Epidemiol. 2012;33:883–888.
- , , , et al. Multidrug‐resistant Acinetobacter baumannii infection, colonization, and transmission related to a long‐term care facility providing subacute care. Infect Control Hosp Epidemiol. 2014;35:406–411.
- , , , , , Severe community‐acquired pneumonia due to Acinetobacter baumannii. Chest. 2001;120:1072–1077.
- , , , , , Fulminant community‐acquired Acinetobacter baumannii pneumonia as distinct clinical syndrome. Chest. 2006;129:102–109.
- , , , Community‐acquired Acinetobacter baumannii pneumonia. Rev Clin Esp. 2003;203:284–286.
- , , , et al. Antimicrobial drug‐resistant microbes associated with hospitalized community‐acquired and healthcare‐associated pneumonia: a multi‐center study in Taiwan. J Formos Med Assoc. 2013;112:31–40.
- , , , , Antimicrobial resistance in Hispanic patients hospitalized in San Antonio, TX with community‐acquired pneumonia. Hosp Pract (1995). 2010;38:108–113.
- Centers for Disease Control and Prevention. CDC director blog. The end of antibiotics. Can we come back from the brink? Available at: http://blogs.cdc.gov/cdcdirector/2014/05/05/the-end-of-antibiotics-can-we-come-back-from-the-brink/. Published May 5, 2014. Accessed January 16, 2015.
© 2015 Society of Hospital Medicine