User login
Secular Trends in AB Resistance
Among hospitalized patients with serious infections, the choice of empiric therapy plays a key role in outcomes.[1, 2, 3, 4, 5, 6, 7, 8, 9] Rising rates and variable patterns of antimicrobial resistance, however, complicate selecting appropriate empiric therapy. Amidst this shifting landscape of resistance to antimicrobials, gram‐negative bacteria and specifically Acinetobacter baumannii (AB), remain a considerable challenge.[10] On the one hand, AB is a less‐frequent cause of serious infections than organisms like Pseudomonas aeruginosa or Enterobacteriaceae in severely ill hospitalized patients.[11, 12] On the other, AB has evolved a variety of resistance mechanisms and exhibits unpredictable susceptibility patterns.[13] These factors combine to increase the likelihood of administering inappropriate empiric therapy when faced with an infection caused by AB and, thereby, raising the risk of death.[14] The fact that clinicians may not routinely consider AB as the potential culprit pathogen in the patient they are treating along with this organism's highly in vitro resistant nature, may result in routine gram‐negative coverage being frequently inadequate for AB infections.
To address the poor outcomes related to inappropriate empiric therapy in the setting of AB, one requires an appreciation of the longitudinal changes and geographic differences in the susceptibility of this pathogen. Thus, we aimed to examine secular trends in the resistance of AB to antimicrobial agents whose effectiveness against this microorganism was well supported in the literature during the study timeframe.[15]
METHODS
To determine the prevalence of predefined resistance patterns among AB in respiratory and blood stream infection (BSI) specimens, we examined The Surveillance Network (TSN) database from Eurofins. We explored data collected between years 2003 and 2012. The database has been used extensively for surveillance purposes since 1994, and has previously been described in detail.[16, 17, 18, 19, 20] Briefly, TSN is a warehouse of routine clinical microbiology data collected from a nationally representative sample of microbiology laboratories in 217 hospitals in the United States. To minimize selection bias, laboratories are included based on their geography and the demographics of the populations they serve.[18] Only clinically significant samples are reported. No personal identifying information for source patients is available in this database. Only source laboratories that perform antimicrobial susceptibility testing according standard Food and Drug Administrationapproved testing methods and that interpret susceptibility in accordance with the Clinical Laboratory Standards Institute breakpoints are included.[21] (See Supporting Table 4 in the online version of this article for minimum inhibitory concentration (MIC) changes over the course of the studycurrent colistin and polymyxin breakpoints applied retrospectively). All enrolled laboratories undergo a pre‐enrollment site visit. Logical filters are used for routine quality control to detect unusual susceptibility profiles and to ensure appropriate testing methods. Repeat testing and reporting are done as necessary.[18]
Laboratory samples are reported as susceptible, intermediate, or resistant. We grouped isolates with intermediate MICs together with the resistant ones for the purposes of the current analysis. Duplicate isolates were excluded. Only samples representing 1 of the 2 infections of interest, respiratory or BSI, were included.
We examined 3 time periods2003 to 2005, 2006 to 2008, and 2009 to 2012for the prevalence of AB's resistance to the following antibiotics: carbapenems (imipenem, meropenem, doripenem), aminoglycosides (tobramycin, amikacin), tetracyclines (minocycline, doxycycline), polymyxins (colistin, polymyxin B), ampicillin‐sulbactam, and trimethoprim‐sulfamethoxazole. Antimicrobial resistance was defined by the designation of intermediate or resistant in the susceptibility category. Resistance to a class of antibiotics was defined as resistance to all drugs within the class for which testing was available. The organism was multidrug resistant (MDR) if it was resistant to at least 1 antimicrobial in at least 3 drug classes examined.[22] Resistance to a combination of 2 drugs was present if the specimen was resistant to both of the drugs in the combination for which testing was available. We examined the data by infection type, time period, the 9 US Census divisions, and location of origin of the sample.
All categorical variables are reported as percentages. Continuous variables are reported as meansstandard deviations and/or medians with the interquartile range (IQR). We did not pursue hypothesis testing due to a high risk of type I error in this large dataset. Therefore, only clinically important trends are highlighted.
RESULTS
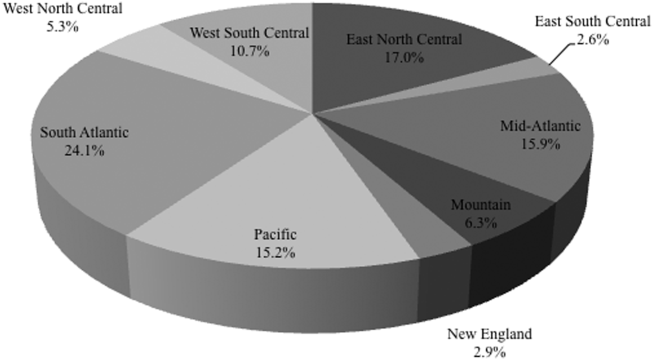
Among the 39,320 AB specimens, 81.1% were derived from a respiratory source and 18.9% represented BSI. Demographics of source patients are listed in Table 1. Notably, the median age of those with respiratory infection (58 years; IQR 38, 73) was higher than among patients with BSI (54.5 years; IQR 36, 71), and there were proportionally fewer females among respiratory patients (39.9%) than those with BSI (46.0%). Though only 24.3% of all BSI samples originated from the intensive are unit (ICU), 40.5% of respiratory specimens came from that location. The plurality of all specimens was collected in the 2003 to 2005 time interval (41.3%), followed by 2006 to 2008 (34.7%), with a minority coming from years 2009 to 2012 (24.0%). The proportions of collected specimens from respiratory and BSI sources were similar in all time periods examined (Table 1). Geographically, the South Atlantic division contributed the most samples (24.1%) and East South Central the fewest (2.6%) (Figure 1). The vast majority of all samples came from hospital wards (78.6%), where roughly one‐half originated in the ICU (37.5%). Fewer still came from outpatient sources (18.3%), and a small minority (2.5%) from nursing homes.

| Pneumonia | BSI | All | |
|---|---|---|---|
| |||
| Total, N (%) | 31,868 (81.1) | 7,452 (18.9) | 39,320 |
| Age, y | |||
| Mean (SD) | 57.7 (37.4) | 57.6 (40.6) | 57.7 (38.0) |
| Median (IQR 25, 75) | 58 (38, 73) | 54.5 (36, 71) | 57 (37, 73) |
| Gender, female (%) | 12,725 (39.9) | 3,425 (46.0) | 16,150 (41.1) |
| ICU (%) | 12,9191 (40.5) | 1,809 (24.3) | 14,7284 (37.5) |
| Time period, % total | |||
| 20032005 | 12,910 (40.5) | 3,340 (44.8) | 16,250 (41.3) |
| 20062008 | 11,205 (35.2) | 2,435 (32.7) | 13,640 (34.7) |
| 20092012 | 7,753 (24.3) | 1,677 (22.5) | 9,430 (24.0) |
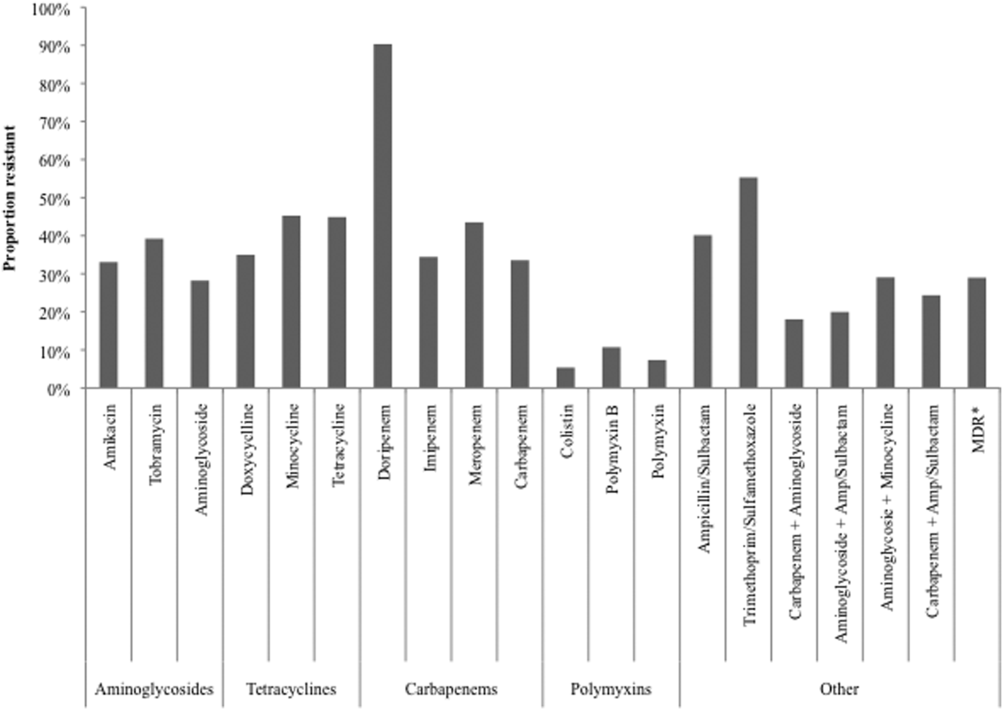
Figure 2 depicts overall resistance patterns by individual drugs, drug classes, and frequently used combinations of agents. Although doripenem had the highest rate of resistance numerically (90.3%), its susceptibility was tested only in a small minority of specimens (n=31, 0.08%). Resistance to trimethoprim‐sulfamethoxazole was high (55.3%) based on a large number of samples tested (n=33,031). Conversely, colistin as an agent and polymyxins as a class exhibited the highest susceptibility rates of over 90%, though the numbers of samples tested for susceptibility to these drugs were also small (colistin n=2,086, 5.3%; polymyxins n=3,120, 7.9%) (Figure 2). Among commonly used drug combinations, carbapenem+aminoglycoside (18.0%) had the lowest resistance rates, and nearly 30% of all AB specimens tested met the criteria for MDR.
Over time, resistance to carbapenems more‐than doubled, from 21.0% in 2003 to 2005 to 47.9% in 2009 to 2012 (Table 2). Although relatively few samples were tested for colistin susceptibility (n=2,086, 5.3%), resistance to this drug also more than doubled from 2.8% (95% confidence interval: 1.9‐4.2) in 2006 to 2008 to 6.9% (95% confidence interval: 5.7‐8.2) in 2009 to 2012. As a class, however, polymyxins exhibited stable resistance rates over the time frame of the study (Table 2). Prevalence of MDR AB rose from 21.4% in 2003 to 2005 to 33.7% in 2006 to 2008, and remained stable at 35.2% in 2009 to 2012. Resistance to even such broad combinations as carbapenem+ampicillin/sulbactam nearly tripled from 13.2% in 2003 to 2005 to 35.5% in 2009 to 2012. Notably, between 2003 and 2012, although resistance rates either rose or remained stable to all other agents, those to minocycline diminished from 56.5% in 2003 to 2005 to 36.6% in 2006 to 2008 to 30.5% in 2009 to 2012. (See Supporting Table 1 in the online version of this article for time trends based on whether they represented respiratory or BSI specimens, with directionally similar trends in both.)
| Drug/Combination | Time Period | ||||||||
|---|---|---|---|---|---|---|---|---|---|
| 20032005 | 20062008 | 20092012 | |||||||
| Na | %b | 95% CI | N | % | 95% CI | N | % | 95% CI | |
| |||||||||
| Amikacin | 12,949 | 25.2 | 24.5‐26.0 | 10.929 | 35.2 | 34.3‐36.1 | 6,292 | 45.7 | 44.4‐46.9 |
| Tobramycin | 14,549 | 37.1 | 36.3‐37.9 | 11,877 | 41.9 | 41.0‐42.8 | 7,901 | 39.2 | 38.1‐40.3 |
| Aminoglycoside | 14,505 | 22.5 | 21.8‐23.2 | 11,967 | 30.6 | 29.8‐31.4 | 7,736 | 34.8 | 33.8‐35.8 |
| Doxycycline | 173 | 36.4 | 29.6‐43.8 | 38 | 29.0 | 17.0‐44.8 | 32 | 34.4 | 20.4‐51.7 |
| Minocycline | 1,388 | 56.5 | 53.9‐50.1 | 902 | 36.6 | 33.5‐39.8 | 522 | 30.5 | 26.7‐34.5 |
| Tetracycline | 1,511 | 55.4 | 52.9‐57.9 | 940 | 36.3 | 33.3‐39.4 | 546 | 30.8 | 27.0‐34.8 |
| Doripenem | NR | NR | NR | 9 | 77.8 | 45.3‐93.7 | 22 | 95.5 | 78.2‐99.2 |
| Imipenem | 14,728 | 21.8 | 21.2‐22.5 | 12,094 | 40.3 | 39.4‐41.2 | 6,681 | 51.7 | 50.5‐52.9 |
| Meropenem | 7,226 | 37.0 | 35.9‐38.1 | 5,628 | 48.7 | 47.3‐50.0 | 4,919 | 47.3 | 45.9‐48.7 |
| Carbapenem | 15,490 | 21.0 | 20.4‐21.7 | 12,975 | 38.8 | 38.0‐39.7 | 8,778 | 47.9 | 46.9‐49.0 |
| Ampicillin/sulbactam | 10,525 | 35.2 | 34.3‐36.2 | 9,413 | 44.9 | 43.9‐45.9 | 6,460 | 41.2 | 40.0‐42.4 |
| Colistin | NR | NR | NR | 783 | 2.8 | 1.9‐4.2 | 1,303 | 6.9 | 5.7‐8.2 |
| Polymyxin B | 105 | 7.6 | 3.9‐14.3 | 796 | 12.8 | 10.7‐15.3 | 321 | 6.5 | 4.3‐9.6 |
| Polymyxin | 105 | 7.6 | 3.9‐14.3 | 1,563 | 7.9 | 6.6‐9.3 | 1,452 | 6.8 | 5.6‐8.2 |
| Trimethoprim/sulfamethoxazole | 13,640 | 52.5 | 51.7‐53.3 | 11,535 | 57.1 | 56.2‐58.0 | 7,856 | 57.6 | 56.5‐58.7 |
| MDRc | 16,249 | 21.4 | 20.7‐22.0 | 13,640 | 33.7 | 33.0‐34.5 | 9,431 | 35.2 | 34.2‐36.2 |
| Carbapenem+aminoglycoside | 14,601 | 8.9 | 8.5‐9.4 | 12,333 | 21.3 | 20.6‐22.0 | 8,256 | 29.3 | 28.3‐30.3 |
| Aminoglycoside+ampicillin/sulbactam | 10,107 | 12.9 | 12.3‐13.6 | 9,077 | 24.9 | 24.0‐25.8 | 6,200 | 24.3 | 23.2‐25.3 |
| Aminoglycosie+minocycline | 1,359 | 35.6 | 33.1‐38.2 | 856 | 21.4 | 18.8‐24.2 | 503 | 24.5 | 20.9‐28.4 |
| Carbapenem+ampicillin/sulbactam | 10,228 | 13.2 | 12.5‐13.9 | 9,145 | 29.4 | 28.4‐30.3 | 6,143 | 35.5 | 34.3‐36.7 |
Regionally, examining resistance by classes and combinations of antibiotics, trimethoprim‐sulfamethoxazole exhibited consistently the highest rates of resistance, ranging from the lowest in the New England (28.8%) to the highest in the East North Central (69.9%) Census divisions (See Supporting Table 2 in the online version of this article). The rates of resistance to tetracyclines ranged from 0.0% in New England to 52.6% in the Mountain division, and to polymyxins from 0.0% in the East South Central division to 23.4% in New England. Generally, New England enjoyed the lowest rates of resistance (0.0% to tetracyclines to 28.8% to trimethoprim‐sulfamethoxazole), and the Mountain division the highest (0.9% to polymyxins to 52.6% to tetracyclines). The rates of MDR AB ranged from 8.0% in New England to 50.4% in the Mountain division (see Supporting Table 2 in the online version of this article).
Examining resistances to drug classes and combinations by the location of the source specimen revealed that trimethoprim‐sulfamethoxazole once again exhibited the highest rate of resistance across all locations (see Supporting Table 3 in the online version of this article). Despite their modest contribution to the overall sample pool (n=967, 2.5%), organisms from nursing home subjects had the highest prevalence of resistance to aminoglycosides (36.3%), tetracyclines (57.1%), and carbapenems (47.1%). This pattern held true for combination regimens examined. Nursing homes also vastly surpassed other locations in the rates of MDR AB (46.5%). Interestingly, the rates of MDR did not differ substantially among regular inpatient wards (29.2%), the ICU (28.7%), and outpatient locations (26.2%) (see Supporting Table 3 in the online version of this article).
DISCUSSION
In this large multicenter survey we have documented the rising rates of AB resistance to clinically important antimicrobials in the United States. On the whole, all antimicrobials, except for minocycline, exhibited either large or small increases in resistance. Alarmingly, even colistin, a true last resort AB treatment, lost a considerable amount of activity against AB, with the resistance rate rising from 2.8% in 2006 to 2008 to 6.9% in 2009 to 2012. The single encouraging trend that we observed was that resistance to minocycline appeared to diminish substantially, going from over one‐half of all AB tested in 2003 to 2005 to just under one‐third in 2009 to 2012.
Although we did note a rise in the MDR AB, our data suggest a lower percentage of all AB that meets the MDR phenotype criteria compared to reports by other groups. For example, the Center for Disease Dynamics and Economic Policy (CDDEP), analyzing the same data as our study, reports a rise in MDR AB from 32.1% in 1999 to 51.0% in 2010.[23] This discrepancy is easily explained by the fact that we included polymyxins, tetracyclines, and trimethoprim‐sulfamethoxazole in our evaluation, whereas the CDDEP did not examine these agents. Furthermore, we omitted fluoroquinolones, a drug class with high rates of resistance, from our study, because we were interested in focusing only on antimicrobials with clinical data in AB infections.[22] In addition, we limited our evaluation to specimens derived from respiratory or BSI sources, whereas the CDDEP data reflect any AB isolate present in TSN.
We additionally confirm that there is substantial geographic variation in resistance patterns. Thus, despite different definitions, our data agree with those from the CDDEP that the MDR prevalence is highest in the Mountain and East North Central divisions, and lowest in New England overall.[23] The wide variations underscore the fact that it is not valid to speak of national rates of resistance, but rather it is important to concentrate on the local patterns. This information, though important from the macroepidemiologic standpoint, is likely still not granular enough to help clinicians make empiric treatment decisions. In fact, what is needed for that is real‐time antibiogram data specific to each center and even each unit within each center.
The latter point is further illustrated by our analysis of locations of origin of the specimens. In this analysis, we discovered that, contrary to the common presumption that the ICU has the highest rate of resistant organisms, specimens derived from nursing homes represent perhaps the most intensely resistant organisms. In other words, the nursing home is the setting most likely to harbor patients with respiratory infections and BSIs caused by resistant AB. These data are in agreement with several other recent investigations. In a period‐prevalence survey conducted in the state of Maryland in 2009 by Thom and colleagues, long‐term care facilities were found to have the highest prevalence of any AB, and also those resistant to imipenem, MDR, and extensively drug‐resistant organisms.[24] Mortensen and coworkers confirmed the high prevalence of AB and AB resistance in long‐term care facilities, and extended this finding to suggest that there is evidence for intra‐ and interhospital spread of these pathogens.[25] Our data confirm this concerning finding at the national level, and point to a potential area of intervention for infection prevention.
An additional finding of some concern is that the highest proportion of colistin resistance among those specimens, whose location of origin was reported in the database, was the outpatient setting (6.6% compared to 5.4% in the ICU specimens, for example). Although these infections would likely meet the definition for healthcare‐associated infection, AB as a community‐acquired respiratory pathogen is not unprecedented either in the United States or abroad.[26, 27, 28, 29, 30] It is, however, reassuring that most other antimicrobials examined in our study exhibit higher rates of susceptibility in the specimens derived from the outpatient settings than either from the hospital or the nursing home.
Our study has a number of strengths. As a large multicenter survey, it is representative of AB susceptibility patterns across the United States, which makes it highly generalizable. We focused on antibiotics for which clinical evidence is available, thus adding a practical dimension to the results. Another pragmatic consideration is examining the data by geographic distributions, allowing an additional layer of granularity for clinical decisions. At the same time it suffers from some limitations. The TSN database consists of microbiology samples from hospital laboratories. Although we attempted to reduce the risk of duplication, because of how samples are numbered in the database, repeat sampling remains a possibility. Despite having stratified the data by geography and the location of origin of the specimen, it is likely not granular enough for local risk stratification decisions clinicians make daily about the choices of empiric therapy. Some of the MIC breakpoints have changed over the period of the study (see Supporting Table 4 in the online version of this article). Because these changes occurred in the last year of data collection (2012), they should have had only a minimal, if any, impact on the observed rates of resistance in the time frame examined. Additionally, because resistance rates evolve rapidly, more current data are required for effective clinical decision making.
In summary, we have demonstrated that the last decade has seen an alarming increase in the rate of resistance of AB to multiple clinically important antimicrobial agents and classes. We have further emphasized the importance of granularity in susceptibility data to help clinicians make sensible decisions about empiric therapy in hospitalized patients with serious infections. Finally, and potentially most disturbingly, the nursing home as a location appears to be a robust reservoir for spread for resistant AB. All of these observations highlight the urgent need to develop novel antibiotics and nontraditional agents, such as antibodies and vaccines, to combat AB infections, in addition to having important infection prevention implications if we are to contain the looming threat of the end of antibiotics.[31]
Disclosure
This study was funded by a grant from Tetraphase Pharmaceuticals, Watertown, MA.
- National Nosocomial Infections Surveillance (NNIS) System Report. Am J Infect Control. 2004;32:470–485.
- , , , National surveillance of antimicrobial resistance in Pseudomonas aeruginosa isolates obtained from intensive care unit patients from 1993 to 2002. Antimicrob Agents Chemother. 2004;48:4606–4610.
- , , , et al. Health care‐associated pneumonia and community‐acquired pneumonia: a single‐center experience. Antimicrob Agents Chemother. 2007;51:3568–3573.
- , , , et al. Clinical importance of delays in the initiation of appropriate antibiotic treatment for ventilator‐associated pneumonia. Chest. 2002;122:262–268.
- ; ICU‐Acquired Pneumonia Study Group. Modification of empiric antibiotic treatment in patients with pneumonia acquired in the intensive care unit. Intensive Care Med. 1996;22:387–394.
- , , , , Antimicrobial therapy escalation and hospital mortality among patients with HCAP: a single center experience. Chest. 2008:134:963–968.
- , , , et al. Surviving Sepsis Campaign: international guidelines for management of severe sepsis and septic shock: 2008. Crit Care Med. 2008;36:296–327.
- , , , , , Inappropriate antibiotic therapy in Gram‐negative sepsis increases hospital length of stay. Crit Care Med. 2011;39:46–51.
- , , , Inadequate antimicrobial treatment of infections: a risk factor for hospital mortality among critically ill patients. Chest. 1999;115:462–474.
- Centers for Disease Control and Prevention. Antibiotic resistance threats in the United States, 2013. Available at: http://www.cdc.gov/drugresistance/threat-report-2013/pdf/ar-threats-2013-508.pdf#page=59. Accessed December 29, 2014.
- , , , et al.; National Healthcare Safety Network (NHSN) Team and Participating NHSN Facilities. Antimicrobial‐resistant pathogens associated with healthcare‐associated infections: summary of data reported to the National Healthcare Safety Network at the Centers for Disease Control and Prevention, 2009–2010. Infect Control Hosp Epidemiol. 2013;34:1–14.
- , , , , Multi‐drug resistance, inappropriate initial antibiotic therapy and mortality in Gram‐negative severe sepsis and septic shock: a retrospective cohort study. Crit Care. 2014;18(6):596.
- , , , , , Global challenge of multidrug‐resistant Acinetobacter baumannii. Antimicrob Agents Chemother. 2007;51:3471–3484.
- , , , Predictors of hospital mortality among septic ICU patients with Acinetobacter spp. bacteremia: a cohort study. BMC Infect Dis. 2014;14:572.
- , Treatment of Acinetobacter infections. Clin Infect Dis. 2010;51:79–84.
- , , Increasing resistance of Acinetobacter species to imipenem in United States hospitals, 1999–2006. Infect Control Hosp Epidemiol. 2010;31:196–197.
- , , , , Trends in resistance to carbapenems and third‐generation cephalosporins among clinical isolates of Klebsiella pneumoniae in the United States, 1999–2010. Infect Control Hosp Epidemiol. 2013;34:259–268.
- , , Antimicrobial resistance in key bloodstream bacterial isolates: electronic surveillance with the Surveillance Network Database—USA. Clin Infect Dis. 1999;29:259–263.
- , , Community‐associated methicillin‐resistant Staphylococcus aureus in outpatients, United States, 1999–2006. Emerg Infect Dis. 2009;15:1925–1930.
- , , , , Prevalence of antimicrobial resistance in bacteria isolated from central nervous system specimens as reported by U.S. hospital laboratories from 2000 to 2002. Ann Clin Microbiol Antimicrob. 2004;3:3.
- Performance standards for antimicrobial susceptibility testing: twenty‐second informational supplement. CLSI document M100‐S22. Wayne, PA: Clinical and Laboratory Standards Institute; 2012.
- , , , et al. Multidrug‐resistant, extensively drug‐resistant and pandrug‐resistant bacteria: an international expert proposal for interim standard definitions for acquired resistance. Clin Microbiol Infect. 2012;18:268–281.
- CDDEP: The Center for Disease Dynamics, Economics and Policy. Resistance map: Acinetobacter baumannii overview. Available at: http://www.cddep.org/projects/resistance_map/acinetobacter_baumannii_overview. Accessed January 16, 2015.
- , , , et al.; Maryland MDRO Prevention Collaborative. Assessing the burden of Acinetobacter baumannii in Maryland: a statewide cross‐sectional period prevalence survey. Infect Control Hosp Epidemiol. 2012;33:883–888.
- , , , et al. Multidrug‐resistant Acinetobacter baumannii infection, colonization, and transmission related to a long‐term care facility providing subacute care. Infect Control Hosp Epidemiol. 2014;35:406–411.
- , , , , , Severe community‐acquired pneumonia due to Acinetobacter baumannii. Chest. 2001;120:1072–1077.
- , , , , , Fulminant community‐acquired Acinetobacter baumannii pneumonia as distinct clinical syndrome. Chest. 2006;129:102–109.
- , , , Community‐acquired Acinetobacter baumannii pneumonia. Rev Clin Esp. 2003;203:284–286.
- , , , et al. Antimicrobial drug‐resistant microbes associated with hospitalized community‐acquired and healthcare‐associated pneumonia: a multi‐center study in Taiwan. J Formos Med Assoc. 2013;112:31–40.
- , , , , Antimicrobial resistance in Hispanic patients hospitalized in San Antonio, TX with community‐acquired pneumonia. Hosp Pract (1995). 2010;38:108–113.
- Centers for Disease Control and Prevention. CDC director blog. The end of antibiotics. Can we come back from the brink? Available at: http://blogs.cdc.gov/cdcdirector/2014/05/05/the-end-of-antibiotics-can-we-come-back-from-the-brink/. Published May 5, 2014. Accessed January 16, 2015.
Among hospitalized patients with serious infections, the choice of empiric therapy plays a key role in outcomes.[1, 2, 3, 4, 5, 6, 7, 8, 9] Rising rates and variable patterns of antimicrobial resistance, however, complicate selecting appropriate empiric therapy. Amidst this shifting landscape of resistance to antimicrobials, gram‐negative bacteria and specifically Acinetobacter baumannii (AB), remain a considerable challenge.[10] On the one hand, AB is a less‐frequent cause of serious infections than organisms like Pseudomonas aeruginosa or Enterobacteriaceae in severely ill hospitalized patients.[11, 12] On the other, AB has evolved a variety of resistance mechanisms and exhibits unpredictable susceptibility patterns.[13] These factors combine to increase the likelihood of administering inappropriate empiric therapy when faced with an infection caused by AB and, thereby, raising the risk of death.[14] The fact that clinicians may not routinely consider AB as the potential culprit pathogen in the patient they are treating along with this organism's highly in vitro resistant nature, may result in routine gram‐negative coverage being frequently inadequate for AB infections.
To address the poor outcomes related to inappropriate empiric therapy in the setting of AB, one requires an appreciation of the longitudinal changes and geographic differences in the susceptibility of this pathogen. Thus, we aimed to examine secular trends in the resistance of AB to antimicrobial agents whose effectiveness against this microorganism was well supported in the literature during the study timeframe.[15]
METHODS
To determine the prevalence of predefined resistance patterns among AB in respiratory and blood stream infection (BSI) specimens, we examined The Surveillance Network (TSN) database from Eurofins. We explored data collected between years 2003 and 2012. The database has been used extensively for surveillance purposes since 1994, and has previously been described in detail.[16, 17, 18, 19, 20] Briefly, TSN is a warehouse of routine clinical microbiology data collected from a nationally representative sample of microbiology laboratories in 217 hospitals in the United States. To minimize selection bias, laboratories are included based on their geography and the demographics of the populations they serve.[18] Only clinically significant samples are reported. No personal identifying information for source patients is available in this database. Only source laboratories that perform antimicrobial susceptibility testing according standard Food and Drug Administrationapproved testing methods and that interpret susceptibility in accordance with the Clinical Laboratory Standards Institute breakpoints are included.[21] (See Supporting Table 4 in the online version of this article for minimum inhibitory concentration (MIC) changes over the course of the studycurrent colistin and polymyxin breakpoints applied retrospectively). All enrolled laboratories undergo a pre‐enrollment site visit. Logical filters are used for routine quality control to detect unusual susceptibility profiles and to ensure appropriate testing methods. Repeat testing and reporting are done as necessary.[18]
Laboratory samples are reported as susceptible, intermediate, or resistant. We grouped isolates with intermediate MICs together with the resistant ones for the purposes of the current analysis. Duplicate isolates were excluded. Only samples representing 1 of the 2 infections of interest, respiratory or BSI, were included.
We examined 3 time periods2003 to 2005, 2006 to 2008, and 2009 to 2012for the prevalence of AB's resistance to the following antibiotics: carbapenems (imipenem, meropenem, doripenem), aminoglycosides (tobramycin, amikacin), tetracyclines (minocycline, doxycycline), polymyxins (colistin, polymyxin B), ampicillin‐sulbactam, and trimethoprim‐sulfamethoxazole. Antimicrobial resistance was defined by the designation of intermediate or resistant in the susceptibility category. Resistance to a class of antibiotics was defined as resistance to all drugs within the class for which testing was available. The organism was multidrug resistant (MDR) if it was resistant to at least 1 antimicrobial in at least 3 drug classes examined.[22] Resistance to a combination of 2 drugs was present if the specimen was resistant to both of the drugs in the combination for which testing was available. We examined the data by infection type, time period, the 9 US Census divisions, and location of origin of the sample.
All categorical variables are reported as percentages. Continuous variables are reported as meansstandard deviations and/or medians with the interquartile range (IQR). We did not pursue hypothesis testing due to a high risk of type I error in this large dataset. Therefore, only clinically important trends are highlighted.
RESULTS
Among the 39,320 AB specimens, 81.1% were derived from a respiratory source and 18.9% represented BSI. Demographics of source patients are listed in Table 1. Notably, the median age of those with respiratory infection (58 years; IQR 38, 73) was higher than among patients with BSI (54.5 years; IQR 36, 71), and there were proportionally fewer females among respiratory patients (39.9%) than those with BSI (46.0%). Though only 24.3% of all BSI samples originated from the intensive are unit (ICU), 40.5% of respiratory specimens came from that location. The plurality of all specimens was collected in the 2003 to 2005 time interval (41.3%), followed by 2006 to 2008 (34.7%), with a minority coming from years 2009 to 2012 (24.0%). The proportions of collected specimens from respiratory and BSI sources were similar in all time periods examined (Table 1). Geographically, the South Atlantic division contributed the most samples (24.1%) and East South Central the fewest (2.6%) (Figure 1). The vast majority of all samples came from hospital wards (78.6%), where roughly one‐half originated in the ICU (37.5%). Fewer still came from outpatient sources (18.3%), and a small minority (2.5%) from nursing homes.
| Pneumonia | BSI | All | |
|---|---|---|---|
| |||
| Total, N (%) | 31,868 (81.1) | 7,452 (18.9) | 39,320 |
| Age, y | |||
| Mean (SD) | 57.7 (37.4) | 57.6 (40.6) | 57.7 (38.0) |
| Median (IQR 25, 75) | 58 (38, 73) | 54.5 (36, 71) | 57 (37, 73) |
| Gender, female (%) | 12,725 (39.9) | 3,425 (46.0) | 16,150 (41.1) |
| ICU (%) | 12,9191 (40.5) | 1,809 (24.3) | 14,7284 (37.5) |
| Time period, % total | |||
| 20032005 | 12,910 (40.5) | 3,340 (44.8) | 16,250 (41.3) |
| 20062008 | 11,205 (35.2) | 2,435 (32.7) | 13,640 (34.7) |
| 20092012 | 7,753 (24.3) | 1,677 (22.5) | 9,430 (24.0) |
Figure 2 depicts overall resistance patterns by individual drugs, drug classes, and frequently used combinations of agents. Although doripenem had the highest rate of resistance numerically (90.3%), its susceptibility was tested only in a small minority of specimens (n=31, 0.08%). Resistance to trimethoprim‐sulfamethoxazole was high (55.3%) based on a large number of samples tested (n=33,031). Conversely, colistin as an agent and polymyxins as a class exhibited the highest susceptibility rates of over 90%, though the numbers of samples tested for susceptibility to these drugs were also small (colistin n=2,086, 5.3%; polymyxins n=3,120, 7.9%) (Figure 2). Among commonly used drug combinations, carbapenem+aminoglycoside (18.0%) had the lowest resistance rates, and nearly 30% of all AB specimens tested met the criteria for MDR.
Over time, resistance to carbapenems more‐than doubled, from 21.0% in 2003 to 2005 to 47.9% in 2009 to 2012 (Table 2). Although relatively few samples were tested for colistin susceptibility (n=2,086, 5.3%), resistance to this drug also more than doubled from 2.8% (95% confidence interval: 1.9‐4.2) in 2006 to 2008 to 6.9% (95% confidence interval: 5.7‐8.2) in 2009 to 2012. As a class, however, polymyxins exhibited stable resistance rates over the time frame of the study (Table 2). Prevalence of MDR AB rose from 21.4% in 2003 to 2005 to 33.7% in 2006 to 2008, and remained stable at 35.2% in 2009 to 2012. Resistance to even such broad combinations as carbapenem+ampicillin/sulbactam nearly tripled from 13.2% in 2003 to 2005 to 35.5% in 2009 to 2012. Notably, between 2003 and 2012, although resistance rates either rose or remained stable to all other agents, those to minocycline diminished from 56.5% in 2003 to 2005 to 36.6% in 2006 to 2008 to 30.5% in 2009 to 2012. (See Supporting Table 1 in the online version of this article for time trends based on whether they represented respiratory or BSI specimens, with directionally similar trends in both.)
| Drug/Combination | Time Period | ||||||||
|---|---|---|---|---|---|---|---|---|---|
| 20032005 | 20062008 | 20092012 | |||||||
| Na | %b | 95% CI | N | % | 95% CI | N | % | 95% CI | |
| |||||||||
| Amikacin | 12,949 | 25.2 | 24.5‐26.0 | 10.929 | 35.2 | 34.3‐36.1 | 6,292 | 45.7 | 44.4‐46.9 |
| Tobramycin | 14,549 | 37.1 | 36.3‐37.9 | 11,877 | 41.9 | 41.0‐42.8 | 7,901 | 39.2 | 38.1‐40.3 |
| Aminoglycoside | 14,505 | 22.5 | 21.8‐23.2 | 11,967 | 30.6 | 29.8‐31.4 | 7,736 | 34.8 | 33.8‐35.8 |
| Doxycycline | 173 | 36.4 | 29.6‐43.8 | 38 | 29.0 | 17.0‐44.8 | 32 | 34.4 | 20.4‐51.7 |
| Minocycline | 1,388 | 56.5 | 53.9‐50.1 | 902 | 36.6 | 33.5‐39.8 | 522 | 30.5 | 26.7‐34.5 |
| Tetracycline | 1,511 | 55.4 | 52.9‐57.9 | 940 | 36.3 | 33.3‐39.4 | 546 | 30.8 | 27.0‐34.8 |
| Doripenem | NR | NR | NR | 9 | 77.8 | 45.3‐93.7 | 22 | 95.5 | 78.2‐99.2 |
| Imipenem | 14,728 | 21.8 | 21.2‐22.5 | 12,094 | 40.3 | 39.4‐41.2 | 6,681 | 51.7 | 50.5‐52.9 |
| Meropenem | 7,226 | 37.0 | 35.9‐38.1 | 5,628 | 48.7 | 47.3‐50.0 | 4,919 | 47.3 | 45.9‐48.7 |
| Carbapenem | 15,490 | 21.0 | 20.4‐21.7 | 12,975 | 38.8 | 38.0‐39.7 | 8,778 | 47.9 | 46.9‐49.0 |
| Ampicillin/sulbactam | 10,525 | 35.2 | 34.3‐36.2 | 9,413 | 44.9 | 43.9‐45.9 | 6,460 | 41.2 | 40.0‐42.4 |
| Colistin | NR | NR | NR | 783 | 2.8 | 1.9‐4.2 | 1,303 | 6.9 | 5.7‐8.2 |
| Polymyxin B | 105 | 7.6 | 3.9‐14.3 | 796 | 12.8 | 10.7‐15.3 | 321 | 6.5 | 4.3‐9.6 |
| Polymyxin | 105 | 7.6 | 3.9‐14.3 | 1,563 | 7.9 | 6.6‐9.3 | 1,452 | 6.8 | 5.6‐8.2 |
| Trimethoprim/sulfamethoxazole | 13,640 | 52.5 | 51.7‐53.3 | 11,535 | 57.1 | 56.2‐58.0 | 7,856 | 57.6 | 56.5‐58.7 |
| MDRc | 16,249 | 21.4 | 20.7‐22.0 | 13,640 | 33.7 | 33.0‐34.5 | 9,431 | 35.2 | 34.2‐36.2 |
| Carbapenem+aminoglycoside | 14,601 | 8.9 | 8.5‐9.4 | 12,333 | 21.3 | 20.6‐22.0 | 8,256 | 29.3 | 28.3‐30.3 |
| Aminoglycoside+ampicillin/sulbactam | 10,107 | 12.9 | 12.3‐13.6 | 9,077 | 24.9 | 24.0‐25.8 | 6,200 | 24.3 | 23.2‐25.3 |
| Aminoglycosie+minocycline | 1,359 | 35.6 | 33.1‐38.2 | 856 | 21.4 | 18.8‐24.2 | 503 | 24.5 | 20.9‐28.4 |
| Carbapenem+ampicillin/sulbactam | 10,228 | 13.2 | 12.5‐13.9 | 9,145 | 29.4 | 28.4‐30.3 | 6,143 | 35.5 | 34.3‐36.7 |
Regionally, examining resistance by classes and combinations of antibiotics, trimethoprim‐sulfamethoxazole exhibited consistently the highest rates of resistance, ranging from the lowest in the New England (28.8%) to the highest in the East North Central (69.9%) Census divisions (See Supporting Table 2 in the online version of this article). The rates of resistance to tetracyclines ranged from 0.0% in New England to 52.6% in the Mountain division, and to polymyxins from 0.0% in the East South Central division to 23.4% in New England. Generally, New England enjoyed the lowest rates of resistance (0.0% to tetracyclines to 28.8% to trimethoprim‐sulfamethoxazole), and the Mountain division the highest (0.9% to polymyxins to 52.6% to tetracyclines). The rates of MDR AB ranged from 8.0% in New England to 50.4% in the Mountain division (see Supporting Table 2 in the online version of this article).
Examining resistances to drug classes and combinations by the location of the source specimen revealed that trimethoprim‐sulfamethoxazole once again exhibited the highest rate of resistance across all locations (see Supporting Table 3 in the online version of this article). Despite their modest contribution to the overall sample pool (n=967, 2.5%), organisms from nursing home subjects had the highest prevalence of resistance to aminoglycosides (36.3%), tetracyclines (57.1%), and carbapenems (47.1%). This pattern held true for combination regimens examined. Nursing homes also vastly surpassed other locations in the rates of MDR AB (46.5%). Interestingly, the rates of MDR did not differ substantially among regular inpatient wards (29.2%), the ICU (28.7%), and outpatient locations (26.2%) (see Supporting Table 3 in the online version of this article).
DISCUSSION
In this large multicenter survey we have documented the rising rates of AB resistance to clinically important antimicrobials in the United States. On the whole, all antimicrobials, except for minocycline, exhibited either large or small increases in resistance. Alarmingly, even colistin, a true last resort AB treatment, lost a considerable amount of activity against AB, with the resistance rate rising from 2.8% in 2006 to 2008 to 6.9% in 2009 to 2012. The single encouraging trend that we observed was that resistance to minocycline appeared to diminish substantially, going from over one‐half of all AB tested in 2003 to 2005 to just under one‐third in 2009 to 2012.
Although we did note a rise in the MDR AB, our data suggest a lower percentage of all AB that meets the MDR phenotype criteria compared to reports by other groups. For example, the Center for Disease Dynamics and Economic Policy (CDDEP), analyzing the same data as our study, reports a rise in MDR AB from 32.1% in 1999 to 51.0% in 2010.[23] This discrepancy is easily explained by the fact that we included polymyxins, tetracyclines, and trimethoprim‐sulfamethoxazole in our evaluation, whereas the CDDEP did not examine these agents. Furthermore, we omitted fluoroquinolones, a drug class with high rates of resistance, from our study, because we were interested in focusing only on antimicrobials with clinical data in AB infections.[22] In addition, we limited our evaluation to specimens derived from respiratory or BSI sources, whereas the CDDEP data reflect any AB isolate present in TSN.
We additionally confirm that there is substantial geographic variation in resistance patterns. Thus, despite different definitions, our data agree with those from the CDDEP that the MDR prevalence is highest in the Mountain and East North Central divisions, and lowest in New England overall.[23] The wide variations underscore the fact that it is not valid to speak of national rates of resistance, but rather it is important to concentrate on the local patterns. This information, though important from the macroepidemiologic standpoint, is likely still not granular enough to help clinicians make empiric treatment decisions. In fact, what is needed for that is real‐time antibiogram data specific to each center and even each unit within each center.
The latter point is further illustrated by our analysis of locations of origin of the specimens. In this analysis, we discovered that, contrary to the common presumption that the ICU has the highest rate of resistant organisms, specimens derived from nursing homes represent perhaps the most intensely resistant organisms. In other words, the nursing home is the setting most likely to harbor patients with respiratory infections and BSIs caused by resistant AB. These data are in agreement with several other recent investigations. In a period‐prevalence survey conducted in the state of Maryland in 2009 by Thom and colleagues, long‐term care facilities were found to have the highest prevalence of any AB, and also those resistant to imipenem, MDR, and extensively drug‐resistant organisms.[24] Mortensen and coworkers confirmed the high prevalence of AB and AB resistance in long‐term care facilities, and extended this finding to suggest that there is evidence for intra‐ and interhospital spread of these pathogens.[25] Our data confirm this concerning finding at the national level, and point to a potential area of intervention for infection prevention.
An additional finding of some concern is that the highest proportion of colistin resistance among those specimens, whose location of origin was reported in the database, was the outpatient setting (6.6% compared to 5.4% in the ICU specimens, for example). Although these infections would likely meet the definition for healthcare‐associated infection, AB as a community‐acquired respiratory pathogen is not unprecedented either in the United States or abroad.[26, 27, 28, 29, 30] It is, however, reassuring that most other antimicrobials examined in our study exhibit higher rates of susceptibility in the specimens derived from the outpatient settings than either from the hospital or the nursing home.
Our study has a number of strengths. As a large multicenter survey, it is representative of AB susceptibility patterns across the United States, which makes it highly generalizable. We focused on antibiotics for which clinical evidence is available, thus adding a practical dimension to the results. Another pragmatic consideration is examining the data by geographic distributions, allowing an additional layer of granularity for clinical decisions. At the same time it suffers from some limitations. The TSN database consists of microbiology samples from hospital laboratories. Although we attempted to reduce the risk of duplication, because of how samples are numbered in the database, repeat sampling remains a possibility. Despite having stratified the data by geography and the location of origin of the specimen, it is likely not granular enough for local risk stratification decisions clinicians make daily about the choices of empiric therapy. Some of the MIC breakpoints have changed over the period of the study (see Supporting Table 4 in the online version of this article). Because these changes occurred in the last year of data collection (2012), they should have had only a minimal, if any, impact on the observed rates of resistance in the time frame examined. Additionally, because resistance rates evolve rapidly, more current data are required for effective clinical decision making.
In summary, we have demonstrated that the last decade has seen an alarming increase in the rate of resistance of AB to multiple clinically important antimicrobial agents and classes. We have further emphasized the importance of granularity in susceptibility data to help clinicians make sensible decisions about empiric therapy in hospitalized patients with serious infections. Finally, and potentially most disturbingly, the nursing home as a location appears to be a robust reservoir for spread for resistant AB. All of these observations highlight the urgent need to develop novel antibiotics and nontraditional agents, such as antibodies and vaccines, to combat AB infections, in addition to having important infection prevention implications if we are to contain the looming threat of the end of antibiotics.[31]
Disclosure
This study was funded by a grant from Tetraphase Pharmaceuticals, Watertown, MA.
- National Nosocomial Infections Surveillance (NNIS) System Report. Am J Infect Control. 2004;32:470–485.
- , , , National surveillance of antimicrobial resistance in Pseudomonas aeruginosa isolates obtained from intensive care unit patients from 1993 to 2002. Antimicrob Agents Chemother. 2004;48:4606–4610.
- , , , et al. Health care‐associated pneumonia and community‐acquired pneumonia: a single‐center experience. Antimicrob Agents Chemother. 2007;51:3568–3573.
- , , , et al. Clinical importance of delays in the initiation of appropriate antibiotic treatment for ventilator‐associated pneumonia. Chest. 2002;122:262–268.
- ; ICU‐Acquired Pneumonia Study Group. Modification of empiric antibiotic treatment in patients with pneumonia acquired in the intensive care unit. Intensive Care Med. 1996;22:387–394.
- , , , , Antimicrobial therapy escalation and hospital mortality among patients with HCAP: a single center experience. Chest. 2008:134:963–968.
- , , , et al. Surviving Sepsis Campaign: international guidelines for management of severe sepsis and septic shock: 2008. Crit Care Med. 2008;36:296–327.
- , , , , , Inappropriate antibiotic therapy in Gram‐negative sepsis increases hospital length of stay. Crit Care Med. 2011;39:46–51.
- , , , Inadequate antimicrobial treatment of infections: a risk factor for hospital mortality among critically ill patients. Chest. 1999;115:462–474.
- Centers for Disease Control and Prevention. Antibiotic resistance threats in the United States, 2013. Available at: http://www.cdc.gov/drugresistance/threat-report-2013/pdf/ar-threats-2013-508.pdf#page=59. Accessed December 29, 2014.
- , , , et al.; National Healthcare Safety Network (NHSN) Team and Participating NHSN Facilities. Antimicrobial‐resistant pathogens associated with healthcare‐associated infections: summary of data reported to the National Healthcare Safety Network at the Centers for Disease Control and Prevention, 2009–2010. Infect Control Hosp Epidemiol. 2013;34:1–14.
- , , , , Multi‐drug resistance, inappropriate initial antibiotic therapy and mortality in Gram‐negative severe sepsis and septic shock: a retrospective cohort study. Crit Care. 2014;18(6):596.
- , , , , , Global challenge of multidrug‐resistant Acinetobacter baumannii. Antimicrob Agents Chemother. 2007;51:3471–3484.
- , , , Predictors of hospital mortality among septic ICU patients with Acinetobacter spp. bacteremia: a cohort study. BMC Infect Dis. 2014;14:572.
- , Treatment of Acinetobacter infections. Clin Infect Dis. 2010;51:79–84.
- , , Increasing resistance of Acinetobacter species to imipenem in United States hospitals, 1999–2006. Infect Control Hosp Epidemiol. 2010;31:196–197.
- , , , , Trends in resistance to carbapenems and third‐generation cephalosporins among clinical isolates of Klebsiella pneumoniae in the United States, 1999–2010. Infect Control Hosp Epidemiol. 2013;34:259–268.
- , , Antimicrobial resistance in key bloodstream bacterial isolates: electronic surveillance with the Surveillance Network Database—USA. Clin Infect Dis. 1999;29:259–263.
- , , Community‐associated methicillin‐resistant Staphylococcus aureus in outpatients, United States, 1999–2006. Emerg Infect Dis. 2009;15:1925–1930.
- , , , , Prevalence of antimicrobial resistance in bacteria isolated from central nervous system specimens as reported by U.S. hospital laboratories from 2000 to 2002. Ann Clin Microbiol Antimicrob. 2004;3:3.
- Performance standards for antimicrobial susceptibility testing: twenty‐second informational supplement. CLSI document M100‐S22. Wayne, PA: Clinical and Laboratory Standards Institute; 2012.
- , , , et al. Multidrug‐resistant, extensively drug‐resistant and pandrug‐resistant bacteria: an international expert proposal for interim standard definitions for acquired resistance. Clin Microbiol Infect. 2012;18:268–281.
- CDDEP: The Center for Disease Dynamics, Economics and Policy. Resistance map: Acinetobacter baumannii overview. Available at: http://www.cddep.org/projects/resistance_map/acinetobacter_baumannii_overview. Accessed January 16, 2015.
- , , , et al.; Maryland MDRO Prevention Collaborative. Assessing the burden of Acinetobacter baumannii in Maryland: a statewide cross‐sectional period prevalence survey. Infect Control Hosp Epidemiol. 2012;33:883–888.
- , , , et al. Multidrug‐resistant Acinetobacter baumannii infection, colonization, and transmission related to a long‐term care facility providing subacute care. Infect Control Hosp Epidemiol. 2014;35:406–411.
- , , , , , Severe community‐acquired pneumonia due to Acinetobacter baumannii. Chest. 2001;120:1072–1077.
- , , , , , Fulminant community‐acquired Acinetobacter baumannii pneumonia as distinct clinical syndrome. Chest. 2006;129:102–109.
- , , , Community‐acquired Acinetobacter baumannii pneumonia. Rev Clin Esp. 2003;203:284–286.
- , , , et al. Antimicrobial drug‐resistant microbes associated with hospitalized community‐acquired and healthcare‐associated pneumonia: a multi‐center study in Taiwan. J Formos Med Assoc. 2013;112:31–40.
- , , , , Antimicrobial resistance in Hispanic patients hospitalized in San Antonio, TX with community‐acquired pneumonia. Hosp Pract (1995). 2010;38:108–113.
- Centers for Disease Control and Prevention. CDC director blog. The end of antibiotics. Can we come back from the brink? Available at: http://blogs.cdc.gov/cdcdirector/2014/05/05/the-end-of-antibiotics-can-we-come-back-from-the-brink/. Published May 5, 2014. Accessed January 16, 2015.
© 2015 Society of Hospital Medicine

Sepsis and Septic Shock Readmission Risk
Despite its decreasing mortality, sepsis remains a leading reason for intensive care unit (ICU) admission and is associated with crude mortality in excess of 25%.[1, 2] In the United States there are between 660,000 and 750,000 sepsis hospitalizations annually, with the direct costs surpassing $24 billion.[3, 4, 5] As mortality rates have begun to fall, attention has shifted to issues of morbidity and recovery, the intermediate and longer‐term consequences associated with survivorship, and how interventions made while the patient is acutely ill in the ICU alter later health outcomes.[3, 5, 6, 7, 8]
One area of particular interest is the need for healthcare utilization following an acute admission for sepsis, and specifically rehospitalization within 30 days of discharge. This outcome is important not just from the perspective of the patient's well‐being, but also from the point of view of healthcare financing. Through the establishment of Hospital Readmission Reduction Program, the Centers for Medicare and Medicaid Services have sharply reduced reimbursement to hospitals for excessive rates of 30‐day readmissions.[9]
For sepsis, little is known about such readmissions, and even less about how to prevent them. A handful of studies suggest that this rate is between 5% and 26%.[10, 11, 12, 13] Whereas some of these studies looked at some of the factors that impact readmissions,[11, 12] none examined the potential contribution of microbiology of sepsis to this outcome.
To explore these questions, we conducted a single‐center retrospective cohort study among critically ill patients admitted to the ICU with severe culture‐positive sepsis and/or septic shock and determined the rate of early posthospital discharge readmission. In addition, we sought to elucidate predictors of subsequent readmission.
METHODS
Study Design and Ethical Standards
We conducted a single‐center retrospective cohort study from January 2008 to December 2012. The study was approved by the Washington University School of Medicine Human Studies Committee, and informed consent was waived because the data collection was retrospective without any patient‐identifying information. The study was performed in accordance with the ethical standards of the 1964 Declaration of Helsinki and its later amendments. Aspects of our methodology have been previously published.[14]
Primary Endpoint
All‐cause readmission to an acute‐care facility in the 30 days following discharge after the index hospitalization with sepsis served as the primary endpoint. The index hospitalizations occurred at the Barnes‐Jewish Hospital, a 1200‐bed inner‐city academic institution that serves as the main teaching institution for BJC HealthCare, a large integrated healthcare system of both inpatient and outpatient care. BJC includes a total of 13 hospitals in a compact geographic region surrounding and including St. Louis, Missouri, and we included readmission to any of these hospitals in our analysis. Persons treated within this healthcare system are, in nearly all cases, readmitted to 1 of the system's participating 13 hospitals. If a patient who receives healthcare in the system presents to an out‐of‐system hospital, he/she is often transferred back into the integrated system because of issues of insurance coverage.
Study Cohort
All consecutive adult ICU patients were included if (1) They had a positive blood culture for a pathogen (Cultures positive only for coagulase negative Staphylococcus aureus were excluded as contaminants.), (2) there was an International Classification of Diseases, Ninth Revision, Clinical Modification (ICD‐9‐CM) code corresponding to an acute organ dysfunction,[4] and (3) they survived their index hospitalization. Only the first episode of sepsis was included as the index hospitalization.
Definitions
All‐cause 30‐day readmission, was defined as a repeat hospitalization within 30 days of discharge from the index hospitalization among survivors of culture‐positive severe sepsis or septic shock. The definition of severe sepsis was based on discharge ICD‐9‐CM codes for acute organ dysfunction.[3] Patients were classified as having septic shock if vasopressors (norepinephrine, dopamine, epinephrine, phenylephrine, or vasopressin) were initiated within 24 hours of the blood culture collection date and time.
Initially appropriate antimicrobial treatment (IAAT) was deemed appropriate if the initially prescribed antibiotic regimen was active against the identified pathogen based on in vitro susceptibility testing and administered for at least 24 hours within 24 hours following blood culture collection. All other regimens were classified as non‐IAAT. Combination antimicrobial treatment was not required for IAAT designation.[15] Prior antibiotic exposure and prior hospitalization occurred within the preceding 90 days, and prior bacteremia within 30 days of the index episode. Multidrug resistance (MDR) among Gram‐negative bacteria was defined as nonsusceptibility to at least 1 antimicrobial agent from at least 3 different antimicrobial classes.[16] Both extended spectrum ‐lactamase (ESBL) organisms and carbapenemase‐producing Enterobacteriaceae were identified via molecular testing.
Healthcare‐associated (HCA) infections were defined by the presence of at least 1 of the following: (1) recent hospitalization, (2) immune suppression (defined as any primary immune deficiency or acquired immune deficiency syndrome or exposure within 3 prior months to immunosuppressive treatmentschemotherapy, radiation therapy, or steroids), (3) nursing home residence, (4) hemodialysis, (5) prior antibiotics. and (6) index bacteremia deemed a hospital‐acquired bloodstream infection (occurring >2 days following index admission date). Acute kidney injury (AKI) was defined according to the RIFLE (Risk, Injury, Failure, Loss, End‐stage) criteria based on the greatest change in serum creatinine (SCr).[17]
Data Elements
Patient‐specific baseline characteristics and process of care variables were collected from the automated hospital medical record, microbiology database, and pharmacy database of Barnes‐Jewish Hospital. Electronic inpatient and outpatient medical records available for all patients in the BJC HealthCare system were reviewed to determine prior antibiotic exposure. The baseline characteristics collected during the index hospitalization included demographics and comorbid conditions. The comorbidities were identified based on their corresponding ICD‐9‐CM codes. The Acute Physiology and Chronic Health Evaluation (APACHE) II and Charlson comorbidity scores were calculated based on clinical data present during the 24 hours after the positive blood cultures were obtained.[18] This was done to accommodate patients with community‐acquired and healthcare‐associated community‐onset infections who only had clinical data available after blood cultures were drawn. Lowest and highest SCr levels were collected during the index hospitalization to determine each patient's AKI status.
Statistical Analyses
Continuous variables were reported as means with standard deviations and as medians with 25th and 75th percentiles. Differences between mean values were tested via the Student t test, and between medians using the Mann‐Whitney U test. Categorical data were summarized as proportions, and the 2 test or Fisher exact test for small samples was used to examine differences between groups. We developed multiple logistic regression models to identify clinical risk factors that were associated with 30‐day all‐cause readmission. All risk factors that were significant at 0.20 in the univariate analyses, as well as all biologically plausible factors even if they did not reach this level of significance, were included in the models. All variables entered into the models were assessed for collinearity, and interaction terms were tested. The most parsimonious models were derived using the backward manual elimination method, and the best‐fitting model was chosen based on the area under the receiver operating characteristics curve (AUROC or the C statistic). The model's calibration was assessed with the Hosmer‐Lemeshow goodness‐of‐fit test. All tests were 2‐tailed, and a P value <0.05 represented statistical significance.
All computations were performed in Stata/SE, version 9 (StataCorp, College Station, TX).
Role of Sponsor
The sponsor had no role in the design, analyses, interpretation, or publication of the study.
RESULTS
Among the 1697 patients with severe sepsis or septic shock who were discharged alive from the hospital, 543 (32.0%) required a rehospitalization within 30 days. There were no differences in age or gender distribution between the groups (Table 1). All comorbidities examined were more prevalent among those with a 30‐day readmission than among those without, with the median Charlson comorbidity score reflecting this imbalance (5 vs 4, P<0.001). Similarly, most of the HCA risk factors were more prevalent among the readmitted group than the comparator group, with HCA sepsis among 94.2% of the former and 90.7% of the latter (P = 0.014).
| 30‐Day Readmission = Yes | 30‐Day Readmission = No | ||||
|---|---|---|---|---|---|
| N = 543 | % = 32.00% | N = 1,154 | % = 68.00% | P Value | |
| |||||
| Baseline characteristics | |||||
| Age, y | |||||
| Mean SD | 58.5 15.7 | 59.5 15.8 | |||
| Median (25, 75) | 60 (49, 69) | 60 (50, 70) | 0.297 | ||
| Race | |||||
| Caucasian | 335 | 61.69% | 769 | 66.64% | 0.046 |
| African American | 157 | 28.91% | 305 | 26.43% | 0.284 |
| Other | 9 | 1.66% | 22 | 1.91% | 0.721 |
| Sex, female | 244 | 44.94% | 537 | 46.53% | 0.538 |
| Admission source | |||||
| Home | 374 | 68.88% | 726 | 62.91% | 0.016 |
| Nursing home, rehab, or LTAC | 39 | 7.81% | 104 | 9.01% | 0.206 |
| Transfer from another hospital | 117 | 21.55% | 297 | 25.74% | 0.061 |
| Comorbidities | |||||
| CHF | 131 | 24.13% | 227 | 19.67% | 0.036 |
| COPD | 156 | 28.73% | 253 | 21.92% | 0.002 |
| CLD | 83 | 15.29% | 144 | 12.48% | 0.113 |
| DM | 175 | 32.23% | 296 | 25.65% | 0.005 |
| CKD | 137 | 25.23% | 199 | 17.24% | <0.001 |
| Malignancy | 225 | 41.44% | 395 | 34.23% | 0.004 |
| HIV | 11 | 2.03% | 10 | 0.87% | 0.044 |
| Charlson comorbidity score | |||||
| Mean SD | 5.24 3.32 | 4.48 3.35 | |||
| Median (25, 75) | 5 (3, 8) | 4 (2, 7) | <0.001 | ||
| HCA RF | 503 | 94.19% | 1,019 | 90.66% | 0.014 |
| Hemodialysis | 65 | 12.01% | 114 | 9.92% | 0.192 |
| Immune suppression | 193 | 36.07% | 352 | 31.21% | 0.044 |
| Prior hospitalization | 339 | 65.07% | 620 | 57.09% | 0.002 |
| Nursing home residence | 39 | 7.81% | 104 | 9.01% | 0.206 |
| Prior antibiotics | 301 | 55.43% | 568 | 49.22% | 0.017 |
| Hospital‐acquired BSI* | 240 | 44.20% | 485 | 42.03% | 0.399 |
| Prior bacteremia within 30 days | 88 | 16.21% | 154 | 13.34% | 0.116 |
| Sepsis‐related parameters | |||||
| LOS prior to bacteremia, d | |||||
| Mean SD | 6.65 11.22 | 5.88 10.81 | |||
| Median (25, 75) | 1 (0, 10) | 0 (0, 8) | 0.250 | ||
| Surgery | |||||
| None | 362 | 66.67% | 836 | 72.44% | 0.015 |
| Abdominal | 104 | 19.15% | 167 | 14.47% | 0.014 |
| Extra‐abdominal | 73 | 13.44% | 135 | 11.70% | 0.306 |
| Status unknown | 4 | 0.74% | 16 | 1.39% | 0.247 |
| Central line | 333 | 64.41% | 637 | 57.80% | 0.011 |
| TPN at the time of bacteremia or prior to it during index hospitalization | 52 | 9.74% | 74 | 5.45% | 0.017 |
| APACHE II | |||||
| Mean SD | 15.08 5.47 | 15.35 5.43 | |||
| Median (25, 75) | 15 (11, 18) | 15 (12, 19) | 0.275 | ||
| Severe sepsis | 361 | 66.48% | 747 | 64.73% | 0.480 |
| Septic shock requiring vasopressors | 182 | 33.52% | 407 | 35.27% | |
| On MV | 104 | 19.22% | 251 | 21.90% | 0.208 |
| Peak WBC (103/L) | |||||
| Mean SD | 22.26 25.20 | 22.14 17.99 | |||
| Median (25, 75) | 17.1 (8.9, 30.6) | 16.9 (10, 31) | 0.654 | ||
| Lowest serum SCr, mg/dL | |||||
| Mean SD | 1.02 1.05 | 0.96 1.03 | |||
| Median (25, 75) | 0.68 (0.5, 1.06) | 0.66 (0.49, 0.96) | 0.006 | ||
| Highest serum SCr, mg/dL | |||||
| Mean SD | 2.81 2.79 | 2.46 2.67 | |||
| Median (25, 75) | 1.68 (1.04, 3.3) | 1.41 (0.94, 2.61) | 0.001 | ||
| RIFLE category | |||||
| None | 81 | 14.92% | 213 | 18.46% | 0.073 |
| Risk | 112 | 20.63% | 306 | 26.52% | 0.009 |
| Injury | 133 | 24.49% | 247 | 21.40% | 0.154 |
| Failure | 120 | 22.10% | 212 | 18.37% | 0.071 |
| Loss | 50 | 9.21% | 91 | 7.89% | 0.357 |
| End‐stage | 47 | 8.66% | 85 | 7.37% | 0.355 |
| Infection source | |||||
| Urine | 95 | 17.50% | 258 | 22.36% | 0.021 |
| Abdomen | 69 | 12.71% | 113 | 9.79% | 0.070 |
| Lung | 93 | 17.13% | 232 | 20.10% | 0.146 |
| Line | 91 | 16.76% | 150 | 13.00% | 0.038 |
| CNS | 1 | 0.18% | 16 | 1.39% | 0.012 |
| Skin | 51 | 9.39% | 82 | 7.11% | 0.102 |
| Unknown | 173 | 31.86% | 375 | 32.50% | 0.794 |
During the index hospitalization, 589 patients (34.7%) suffered from septic shock requiring vasopressors; this did not impact the 30‐day readmission risk (Table 1). Commensurately, markers of severity of acute illness (APACHE II score, mechanical ventilation, peak white blood cell count) did not differ between the groups. With respect to the primary source of sepsis, urine was less, whereas central nervous system was more likely among those readmitted within 30 days. Similarly, there was a significant imbalance between the groups in the prevalence of AKI (Table 1). Specifically, those who did require a readmission were slightly less likely to have sustained no AKI (RIFLE: None; 14.9% vs 18.5%, P = 0.073). Those requiring readmission were also less likely to be in the category RIFLE: Risk (20.6% vs 26.5%, P = 0.009). The direction of this disparity was reversed for the Injury and Failure categories. No differences between groups were seen among those with categories Loss and end‐stage kidney disease (ESKD) (Table 1).
The microbiology of sepsis did not differ in most respects between the 30‐day readmission groups, save for several organisms (Table 2). Most strikingly, those who required a readmission were more likely than those who did not to be infected with Bacteroides spp, Candida spp, an MDR or an ESBL organism (Table 2). As for the outcomes of the index hospitalization, those with a repeat admission had a longer overall and postonset of sepsis initial hospital length of stay, and were less likely to be discharged either home without home health care or transferred to another hospital at the end of their index hospitalization (Table 3).
| 30‐Day Readmission = Yes | 30‐Day Readmission = No | P Value | |||
|---|---|---|---|---|---|
| N | % | N | % | ||
| |||||
| 543 | 32.00% | 1,154 | 68.00% | ||
| Gram‐positive BSI | 260 | 47.88% | 580 | 50.26% | 0.376 |
| Staphylococcus aureus | 138 | 25.41% | 287 | 24.87% | 0.810 |
| MRSA | 78 | 14.36% | 147 | 12.74% | 0.358 |
| VISA | 6 | 1.10% | 9 | 0.78% | 0.580 |
| Streptococcus pneumoniae | 7 | 1.29% | 33 | 2.86% | 0.058 |
| Streptococcus spp | 34 | 6.26% | 81 | 7.02% | 0.606 |
| Peptostreptococcus spp | 5 | 0.92% | 15 | 1.30% | 0.633 |
| Clostridium perfringens | 4 | 0.74% | 10 | 0.87% | 1.000 |
| Enterococcus faecalis | 54 | 9.94% | 108 | 9.36% | 0.732 |
| Enterococcus faecium | 29 | 5.34% | 63 | 5.46% | 1.000 |
| VRE | 36 | 6.63% | 70 | 6.07% | 0.668 |
| Gram‐negative BSI | 231 | 42.54% | 515 | 44.63% | 0.419 |
| Escherichia coli | 54 | 9.94% | 151 | 13.08% | 0.067 |
| Klebsiella pneumoniae | 54 | 9.94% | 108 | 9.36% | 0.723 |
| Klebsiella oxytoca | 11 | 2.03% | 18 | 1.56% | 0.548 |
| Enterobacter aerogenes | 6 | 1.10% | 13 | 1.13% | 1.000 |
| Enterobacter cloacae | 21 | 3.87% | 44 | 3.81% | 1.000 |
| Pseudomonas aeruginosa | 28 | 5.16% | 65 | 5.63% | 0.733 |
| Acinetobacter spp | 8 | 1.47% | 27 | 2.34% | 0.276 |
| Bacteroides spp | 25 | 4.60% | 30 | 2.60% | 0.039 |
| Serratia marcescens | 14 | 2.58% | 21 | 1.82% | 0.360 |
| Stenotrophomonas maltophilia | 3 | 0.55% | 8 | 0.69% | 1.000 |
| Achromobacter spp | 2 | 0.37% | 3 | 0.17% | 0.597 |
| Aeromonas spp | 2 | 0.37% | 1 | 0.09% | 0.241 |
| Burkholderia cepacia | 0 | 0.00% | 6 | 0.52% | 0.186 |
| Citrobacter freundii | 2 | 0.37% | 15 | 1.39% | 0.073 |
| Fusobacterium spp | 7 | 1.29% | 10 | 0.87% | 0.438 |
| Haemophilus influenzae | 1 | 0.18% | 4 | 0.35% | 1.000 |
| Prevotella spp | 1 | 0.18% | 6 | 0.52% | 0.441 |
| Proteus mirabilis | 9 | 1.66% | 39 | 3.38% | 0.058 |
| MDR PA | 2 | 0.37% | 7 | 0.61% | 0.727 |
| ESBL | 10 | 6.25% | 8 | 2.06% | 0.017 |
| CRE | 2 | 1.25% | 0 | 0.00% | 0.028 |
| MDR Gram‐negative or Gram‐positive | 231 | 47.53% | 450 | 41.86% | 0.036 |
| Candida spp | 58 | 10.68% | 76 | 6.59% | 0.004 |
| Polymicrobal BSI | 50 | 9.21% | 111 | 9.62% | 0.788 |
| Initially inappropriate treatment | 119 | 21.92% | 207 | 17.94% | 0.052 |
| 30‐Day Readmission = Yes | 30‐Day Readmission = No | ||||
|---|---|---|---|---|---|
| N = 543 | % = 32.00% | N = 1,154 | % = 68.00% | P Value | |
| |||||
| Hospital LOS, days | |||||
| Mean SD | 26.44 23.27 | 23.58 21.79 | 0.019 | ||
| Median (25, 75) | 19.16 (9.66, 35.86) | 17.77 (8.9, 30.69) | |||
| Hospital LOS following BSI onset, days | |||||
| Mean SD | 19.80 18.54 | 17.69 17.08 | 0.022 | ||
| Median (25, 75) | 13.9 (7.9, 25.39) | 12.66 (7.05, 22.66) | |||
| Discharge destination | |||||
| Home | 125 | 23.02% | 334 | 28.94% | 0.010 |
| Home with home care | 163 | 30.02% | 303 | 26.26% | 0.105 |
| Rehab | 81 | 14.92% | 149 | 12.91% | 0.260 |
| LTAC | 41 | 7.55% | 87 | 7.54% | 0.993 |
| Transfer to another hospital | 1 | 0.18% | 19 | 1.65% | 0.007 |
| SNF | 132 | 24.31% | 262 | 22.70% | 0.465 |
In a logistic regression model, 5 factors emerged as predictors of 30‐day readmission (Table 4). Having RIFLE: Injury or RIFLE: Failure carried an approximately 2‐fold increase in the odds of 30‐day rehospitalization (odds ratio: 1.95, 95% confidence interval: 1.302.93, P = 0.001) relative to having a RIFLE: None or RIFLE: Risk. Although having strong association with this outcome, harboring an ESBL organism or Bacteroides spp were both relatively infrequent events (3.3% ESBL and 3.2% Bacteroides spp). Infection with Escherichia coli and urine as the source of sepsis both appeared to be significantly protective against a readmission (Table 4). The model's discrimination was moderate (AUROC = 0.653) and its calibration adequate (Hosmer‐Lemeshow P = 0.907). (See Supporting Information, Appendix 1, in the online version of this article for the steps in the development of the final model.)
| OR | 95% CI | P Value | |
|---|---|---|---|
| |||
| ESBL | 4.503 | 1.42914.190 | 0.010 |
| RIFLE: Injury or Failure (reference: RIFLE: None or Risk) | 1.951 | 1.2972.933 | 0.001 |
| Bacteroides spp | 2.044 | 1.0583.948 | 0.033 |
| Source: urine | 0.583 | 0.3470.979 | 0.041 |
| Escherichia coli | 0.494 | 0.2700.904 | 0.022 |
DISCUSSION
In this single‐center retrospective cohort study, nearly one‐third of survivors of culture‐positive severe sepsis or septic shock required a rehospitalization within 30 days of discharge from their index admission. Factors that contributed to a higher odds of rehospitalization were having mild‐to‐moderate AKI (RIFLE: Injury or RIFLE: Failure) and infection with ESBL organisms or Bacteroides spp, whereas urine as the source of sepsis and E coli as the pathogen appeared to be protective.
A recent study by Hua and colleagues examining the New York Statewide Planning and Research Cooperative System for the years 2008 to 2010 noted a 16.2% overall rate of 30‐day rehospitalization among survivors of initial critical illness.[11] Just as we observed, Hua et al. concluded that development of AKI correlated with readmission. Because they relied on administrative data for their analysis, AKI was diagnosed when hemodialysis was utilized. Examining AKI using SCr changes, our findings add a layer of granularity to the relationship between AKI stages and early readmission. Specifically, we failed to detect any rise in the odds of rehospitalization when either very mild (RIFLE: Risk) or severe (RIFLE: Loss or RIFLE: ESKD) AKI was present. Only when either RIFLE: Injury or RIFLE: Failure developed did the odds of readmission rise. In addition to diverging definitions between our studies, differences in populations also likely yielded different results.[11] Although Hua et al. examined all admissions to the ICU regardless of the diagnosis or illness severity, our cohort consisted of only those ICU patients who survived culture‐positive severe sepsis/septic shock. Because AKI is a known risk factor for mortality in sepsis,[19] the potential for immortal time bias leaves a smaller pool of surviving patients with ESKD at risk for readmission. Regardless of the explanation, it may be prudent to focus on preventing AKI not only to improve survival, but also from the standpoint of diminishing the risk of an early readmission.
Four additional studies have examined the frequency of early readmissions among survivors of critical illness. Liu et al. noted 17.9% 30‐day rehospitalization rate among sepsis survivors.[12] Factors associated with the risk of early readmission included acute and chronic diseases burdens, index hospital LOS, and the need for the ICU in the index sepsis admission. In contrast to our cohort, all of whom were in the ICU during their index episode, less than two‐thirds of the entire population studied by Liu had required an ICU admission. Additionally, Liu's study did not specifically examine the potential impact of AKI or of microbiology on this outcome.
Prescott and coworkers examined healthcare utilization following an episode of severe sepsis.[13] Among other findings, they reported a 30‐day readmission rate of 26.5% among survivors. Although closer to our estimate, this study included all patients surviving a severe sepsis hospitalization, and not only those with a positive culture. These investigators did not examine predictors of readmission.[13]
Horkan et al. examined specifically whether there was an association between AKI and postdischarge outcomes, including 30‐day readmission risk, in a large cohort of patients who survived their critical illness.[20] In it they found that readmission risk ranged from 19% to 21%, depending on the extent of the AKI. Moreover, similar to our findings, they reported that in an adjusted analysis RIFLE: Injury and RIFLE: Failure were associated with a rise in the odds of a 30‐day rehospitalizaiton. In contrast to our study, Horkan et al. did detect an increase in the odds of this outcome associated with RIFLE: Risk. There are likely at least 3 reasons for this difference. First, we focused only on patients with severe sepsis or septic shock, whereas Horkan and colleagues included all critical illness survivors. Second, we were able to explore the impact of microbiology on this outcome. Third, Horkan's study included an order of magnitude more patients than did ours, thus making it more likely either to have the power to detect a true association that we may have lacked or to be more susceptible to type I error.
Finally, Goodwin and colleagues utilized 3 states' databases included in the Health Care and Utilization Project (HCUP) from the Agency for Healthcare Research and Quality to study frequency and risk factors for 30‐day readmission among survivors of severe sepsis.[21] Patients were identified based on the use of the severe sepsis (995.92) and septic shock (785.52). These authors found a 30‐day readmission rate of 26%. Although chronic renal disease, among several other factors, was associated with an increase in this risk, the data source did not permit these investigators to examine the impact of AKI on the outcomes. Similarly, HCUP data do not contain microbiology, a distinct difference from our analysis.
If clinicians are to pursue strategies to reduce the risk of an all‐cause 30‐day readmission, the key goal is not simply to identify all variables associated with readmission, but to focus on factors that are potentially modifiable. Although neither Hua nor Liu and their teams identified any additional factors that are potentially modifiable,[11, 12] in the present study, among the 5 factors we identified, the development of mild to moderate AKI during the index hospitalization may deserve stronger consideration for efforts at prevention. Although one cannot conclude automatically that preventing AKI in this population could mitigate some of the early rehospitalization risk, critically ill patients are frequently exposed to a multitude of nephrotoxic agents. Those caring for subjects with sepsis should reevaluate the risk‐benefit equation of these factors more cautiously and apply guideline‐recommended AKI prevention strategies more aggressively, particularly because a relatively minor change in SCr resulted in an excess risk of readmission.[22]
In addition to AKI, which is potentially modifiable, we identified several other clinical factors predictive of 30‐day readmission, which are admittedly not preventable. Thus, microbiology was predictive of this outcome, with E coli engendering fewer and Bacteroides spp and ESBL organisms more early rehospitalizations. Similarly, urine as the source of sepsis was associated with a lower risk for this endpoint.
Our study has a number of limitations. As a retrospective cohort, it is subject to bias, most notably a selection bias. Specifically, because the flagship hospital of the BJC HealthCare system is a referral center, it is possible that we did not capture all readmissions. However, generally, if a patient who receives healthcare within 1 of the BJC hospitals presents to a nonsystem hospital, that patient is nearly always transferred back into the integrated system because of issues of insurance coverage. Analysis of certain diagnosis‐related groups has indicated that 73% of all patients overall discharged from 4 of the large BJC system institutions who require a readmission within 30 days of discharge return to a BJC hospital (personal communication, Financial Analysis and Decision Support Department at BJC to Dr. Kollef May 12, 2015). Therefore, we may have misclassified the outcome in as many as 180 patients. The fact that our readmission rate was fully double that seen in Hua et al.'s and Liu et al.'s studies, and somewhat higher than that reported by Prescott et al., attests not only to the population differences, but also to the fact that we are unlikely to have missed a substantial percentage of readmissions.[11, 12, 13] Furthermore, to mitigate biases, we enrolled all consecutive patients meeting the predetermined criteria. Missing from our analysis are events that occurred between the index discharge and the readmission. Likewise, we were unable to obtain such potentially important variables as code status or outpatient mortality following discharge. These intervening factors, if included in subsequent studies, may increase the predictive power of the model. Because we relied on administrative coding to identify cases of severe sepsis and septic shock, it is possible that there is misclassification within our cohort. Recent studies indicate, however, that the Angus definition, used in our study, has high negative and positive predictive values for severe sepsis identification.[23] It is still possible that our cohort is skewed toward a more severely ill population, making our results less generalizable to the less severely ill septic patients.[24] The study was performed at a single healthcare system and included only cases of severe sepsis or septic shock that had a positive blood culture, and thus the findings may not be broadly generalizable either to patients without a positive blood culture or to institutions that do not resemble it.
In summary, we have demonstrated that survivors of culture‐positive severe sepsis or septic shock have a high rate of 30‐day rehospitalization. Because the US federal government's initiatives deem 30‐day readmissions to be a quality metric and penalize institutions with higher‐than average readmission rates, a high volume of critically ill patients with culture‐positive severe sepsis and septic shock may disproportionately put an institution at risk for such penalties. Unfortunately, not many of the determinants of readmission are amenable to prevention. As sepsis survival continues to improve, hospitals will need to concentrate their resources on coordinating care of these complex patients so as to improve both individual quality of life and the quality of care that they provide.
Disclosures
This study was supported by a research grant from Cubist Pharmaceuticals, Lexington, Massachusetts. Dr. Kollef's time was in part supported by the Barnes‐Jewish Hospital Foundation. The authors report no conflicts of interest.
- , , , et al; Sepsis Occurrence in Acutely Ill Patients Investigators. Sepsis in European intensive care units: results of the SOAP study. Crit Care Med. 2006;34:344–353
- , , , et al. Death in the United States, 2007. NCHS Data Brief. 2009;26:1–8.
- , , , et al. The epidemiology of sepsis in the United States from 1979 through 2000. N Engl J Med. 2003;348:1548–1564.
- , , , , , . Epidemiology of severe sepsis in the United States: analysis of incidence, outcome, and associated costs of care. Crit Care Med. 2001;29:1303–1310.
- , , , et al: Hospitalizations, costs, and outcomes of severe sepsis in the United States 2003 to 2007. Crit Care Med. 2012;40:754–761.
- , , , et al. Facing the challenge: decreasing case fatality rates in severe sepsis despite increasing hospitalization. Crit Care Med. 2005;33:2555–2562.
- , , , et al. Rapid increase in hospitalization and mortality rates for severe sepsis in the United States: a trend analysis from 1993 to 2003. Crit Care Med. 2007;35:1244–1250.
- , , , , . Two decades of mortality trends among patients with severe sepsis: a comparative meta‐analysis. Crit Care Med. 2014;42:625–631.
- , , , et al. Preventing 30‐day hospital readmissions: a systematic review and meta‐analysis of randomized trials. JAMA Intern Med. 2014;174:1095–1107.
- , . Trends in septicemia hospitalizations and readmissions in selected HCUP states, 2005 and 2010. HCUP Statistical Brief #161. Agency for Healthcare Research and Quality, Rockville, MD. Available at: http://www.hcup‐us.ahrq.gov/reports/statbriefs/sb161.pdf. Published September 2013, Accessed January 13, 2015.
- , , , . Early and late unplanned rehospitalizations for survivors of critical illness. Crit Care Med. 2015;43:430–438.
- , , , , , . Hospital readmission and healthcare utilization following sepsis in community settings. J Hosp Med. 2014;9:502–507.
- , , , , . Increased 1‐year healthcare use in survivors of severe sepsis. Am J Respir Crit Care Med. 2014;190:62–69.
- , , , , . Multi‐drug resistance, inappropriate initial antibiotic therapy and mortality in Gram‐negative severe sepsis and septic shock: a retrospective cohort study. Crit Care. 2014;18:596.
- , , . Does combination antimicrobial therapy reduce mortality in Gram‐negative bacteraemia? A meta‐analysis. Lancet Infect Dis. 2004;4:519–527.
- , , , et al. Multidrug‐resistant, extensively drug‐resistant and pandrug‐resistant bacteria: an international expert proposal for interim standard definitions for acquired resistance. Clin Microbiol Infect. 2012;18:268–281.
- , , , , ; Acute Dialysis Quality Initiative Workgroup. Acute renal failure—definition, outcome measures, animal models, fluid therapy and information technology needs: the Second International Consensus Conference of the Acute Dialysis Quality Initiative (ADQI) Group. Crit Care. 2004;8:R204–R212.
- , , , . APACHE II: a severity of disease classification system. Crit Care Med. 1985;13:818–829.
- , , , et al. RIFLE criteria for acute kidney injury are associated with hospital mortality in critically ill patients: a cohort analysis. Crit Care. 2006;10:R73
- , , , , , . The association of acute kidney injury in the critically ill and postdischarge outcomes: a cohort study. Crit Care Med. 2015;43:354–364.
- , , , . Frequency, cost, and risk factors of readmissions among severe sepsis survivors. Crit Care Med. 2015;43:738–746.
- Acute Kidney Injury Work Group. Kidney disease: improving global outcomes (KDIGO). KDIGO clinical practice guideline for acute kidney injury. Kidney Int Suppl. 2012;2:1–138. Available at: http://www.kdigo.org/clinical_practice_guidelines/pdf/KDIGO%20AKI%20Guideline.pdf. Accessed March 4, 2015.
- , , , , , . Validity of administrative data in recording sepsis: a systematic review. Crit Care. 2015;19(1):139.
- , , , , , . Severe sepsis cohorts derived from claims‐based strategies appear to be biased toward a more severely ill patient population. Crit Care Med. 2013;41:945–953.
Despite its decreasing mortality, sepsis remains a leading reason for intensive care unit (ICU) admission and is associated with crude mortality in excess of 25%.[1, 2] In the United States there are between 660,000 and 750,000 sepsis hospitalizations annually, with the direct costs surpassing $24 billion.[3, 4, 5] As mortality rates have begun to fall, attention has shifted to issues of morbidity and recovery, the intermediate and longer‐term consequences associated with survivorship, and how interventions made while the patient is acutely ill in the ICU alter later health outcomes.[3, 5, 6, 7, 8]
One area of particular interest is the need for healthcare utilization following an acute admission for sepsis, and specifically rehospitalization within 30 days of discharge. This outcome is important not just from the perspective of the patient's well‐being, but also from the point of view of healthcare financing. Through the establishment of Hospital Readmission Reduction Program, the Centers for Medicare and Medicaid Services have sharply reduced reimbursement to hospitals for excessive rates of 30‐day readmissions.[9]
For sepsis, little is known about such readmissions, and even less about how to prevent them. A handful of studies suggest that this rate is between 5% and 26%.[10, 11, 12, 13] Whereas some of these studies looked at some of the factors that impact readmissions,[11, 12] none examined the potential contribution of microbiology of sepsis to this outcome.
To explore these questions, we conducted a single‐center retrospective cohort study among critically ill patients admitted to the ICU with severe culture‐positive sepsis and/or septic shock and determined the rate of early posthospital discharge readmission. In addition, we sought to elucidate predictors of subsequent readmission.
METHODS
Study Design and Ethical Standards
We conducted a single‐center retrospective cohort study from January 2008 to December 2012. The study was approved by the Washington University School of Medicine Human Studies Committee, and informed consent was waived because the data collection was retrospective without any patient‐identifying information. The study was performed in accordance with the ethical standards of the 1964 Declaration of Helsinki and its later amendments. Aspects of our methodology have been previously published.[14]
Primary Endpoint
All‐cause readmission to an acute‐care facility in the 30 days following discharge after the index hospitalization with sepsis served as the primary endpoint. The index hospitalizations occurred at the Barnes‐Jewish Hospital, a 1200‐bed inner‐city academic institution that serves as the main teaching institution for BJC HealthCare, a large integrated healthcare system of both inpatient and outpatient care. BJC includes a total of 13 hospitals in a compact geographic region surrounding and including St. Louis, Missouri, and we included readmission to any of these hospitals in our analysis. Persons treated within this healthcare system are, in nearly all cases, readmitted to 1 of the system's participating 13 hospitals. If a patient who receives healthcare in the system presents to an out‐of‐system hospital, he/she is often transferred back into the integrated system because of issues of insurance coverage.
Study Cohort
All consecutive adult ICU patients were included if (1) They had a positive blood culture for a pathogen (Cultures positive only for coagulase negative Staphylococcus aureus were excluded as contaminants.), (2) there was an International Classification of Diseases, Ninth Revision, Clinical Modification (ICD‐9‐CM) code corresponding to an acute organ dysfunction,[4] and (3) they survived their index hospitalization. Only the first episode of sepsis was included as the index hospitalization.
Definitions
All‐cause 30‐day readmission, was defined as a repeat hospitalization within 30 days of discharge from the index hospitalization among survivors of culture‐positive severe sepsis or septic shock. The definition of severe sepsis was based on discharge ICD‐9‐CM codes for acute organ dysfunction.[3] Patients were classified as having septic shock if vasopressors (norepinephrine, dopamine, epinephrine, phenylephrine, or vasopressin) were initiated within 24 hours of the blood culture collection date and time.
Initially appropriate antimicrobial treatment (IAAT) was deemed appropriate if the initially prescribed antibiotic regimen was active against the identified pathogen based on in vitro susceptibility testing and administered for at least 24 hours within 24 hours following blood culture collection. All other regimens were classified as non‐IAAT. Combination antimicrobial treatment was not required for IAAT designation.[15] Prior antibiotic exposure and prior hospitalization occurred within the preceding 90 days, and prior bacteremia within 30 days of the index episode. Multidrug resistance (MDR) among Gram‐negative bacteria was defined as nonsusceptibility to at least 1 antimicrobial agent from at least 3 different antimicrobial classes.[16] Both extended spectrum ‐lactamase (ESBL) organisms and carbapenemase‐producing Enterobacteriaceae were identified via molecular testing.
Healthcare‐associated (HCA) infections were defined by the presence of at least 1 of the following: (1) recent hospitalization, (2) immune suppression (defined as any primary immune deficiency or acquired immune deficiency syndrome or exposure within 3 prior months to immunosuppressive treatmentschemotherapy, radiation therapy, or steroids), (3) nursing home residence, (4) hemodialysis, (5) prior antibiotics. and (6) index bacteremia deemed a hospital‐acquired bloodstream infection (occurring >2 days following index admission date). Acute kidney injury (AKI) was defined according to the RIFLE (Risk, Injury, Failure, Loss, End‐stage) criteria based on the greatest change in serum creatinine (SCr).[17]
Data Elements
Patient‐specific baseline characteristics and process of care variables were collected from the automated hospital medical record, microbiology database, and pharmacy database of Barnes‐Jewish Hospital. Electronic inpatient and outpatient medical records available for all patients in the BJC HealthCare system were reviewed to determine prior antibiotic exposure. The baseline characteristics collected during the index hospitalization included demographics and comorbid conditions. The comorbidities were identified based on their corresponding ICD‐9‐CM codes. The Acute Physiology and Chronic Health Evaluation (APACHE) II and Charlson comorbidity scores were calculated based on clinical data present during the 24 hours after the positive blood cultures were obtained.[18] This was done to accommodate patients with community‐acquired and healthcare‐associated community‐onset infections who only had clinical data available after blood cultures were drawn. Lowest and highest SCr levels were collected during the index hospitalization to determine each patient's AKI status.
Statistical Analyses
Continuous variables were reported as means with standard deviations and as medians with 25th and 75th percentiles. Differences between mean values were tested via the Student t test, and between medians using the Mann‐Whitney U test. Categorical data were summarized as proportions, and the 2 test or Fisher exact test for small samples was used to examine differences between groups. We developed multiple logistic regression models to identify clinical risk factors that were associated with 30‐day all‐cause readmission. All risk factors that were significant at 0.20 in the univariate analyses, as well as all biologically plausible factors even if they did not reach this level of significance, were included in the models. All variables entered into the models were assessed for collinearity, and interaction terms were tested. The most parsimonious models were derived using the backward manual elimination method, and the best‐fitting model was chosen based on the area under the receiver operating characteristics curve (AUROC or the C statistic). The model's calibration was assessed with the Hosmer‐Lemeshow goodness‐of‐fit test. All tests were 2‐tailed, and a P value <0.05 represented statistical significance.
All computations were performed in Stata/SE, version 9 (StataCorp, College Station, TX).
Role of Sponsor
The sponsor had no role in the design, analyses, interpretation, or publication of the study.
RESULTS
Among the 1697 patients with severe sepsis or septic shock who were discharged alive from the hospital, 543 (32.0%) required a rehospitalization within 30 days. There were no differences in age or gender distribution between the groups (Table 1). All comorbidities examined were more prevalent among those with a 30‐day readmission than among those without, with the median Charlson comorbidity score reflecting this imbalance (5 vs 4, P<0.001). Similarly, most of the HCA risk factors were more prevalent among the readmitted group than the comparator group, with HCA sepsis among 94.2% of the former and 90.7% of the latter (P = 0.014).
| 30‐Day Readmission = Yes | 30‐Day Readmission = No | ||||
|---|---|---|---|---|---|
| N = 543 | % = 32.00% | N = 1,154 | % = 68.00% | P Value | |
| |||||
| Baseline characteristics | |||||
| Age, y | |||||
| Mean SD | 58.5 15.7 | 59.5 15.8 | |||
| Median (25, 75) | 60 (49, 69) | 60 (50, 70) | 0.297 | ||
| Race | |||||
| Caucasian | 335 | 61.69% | 769 | 66.64% | 0.046 |
| African American | 157 | 28.91% | 305 | 26.43% | 0.284 |
| Other | 9 | 1.66% | 22 | 1.91% | 0.721 |
| Sex, female | 244 | 44.94% | 537 | 46.53% | 0.538 |
| Admission source | |||||
| Home | 374 | 68.88% | 726 | 62.91% | 0.016 |
| Nursing home, rehab, or LTAC | 39 | 7.81% | 104 | 9.01% | 0.206 |
| Transfer from another hospital | 117 | 21.55% | 297 | 25.74% | 0.061 |
| Comorbidities | |||||
| CHF | 131 | 24.13% | 227 | 19.67% | 0.036 |
| COPD | 156 | 28.73% | 253 | 21.92% | 0.002 |
| CLD | 83 | 15.29% | 144 | 12.48% | 0.113 |
| DM | 175 | 32.23% | 296 | 25.65% | 0.005 |
| CKD | 137 | 25.23% | 199 | 17.24% | <0.001 |
| Malignancy | 225 | 41.44% | 395 | 34.23% | 0.004 |
| HIV | 11 | 2.03% | 10 | 0.87% | 0.044 |
| Charlson comorbidity score | |||||
| Mean SD | 5.24 3.32 | 4.48 3.35 | |||
| Median (25, 75) | 5 (3, 8) | 4 (2, 7) | <0.001 | ||
| HCA RF | 503 | 94.19% | 1,019 | 90.66% | 0.014 |
| Hemodialysis | 65 | 12.01% | 114 | 9.92% | 0.192 |
| Immune suppression | 193 | 36.07% | 352 | 31.21% | 0.044 |
| Prior hospitalization | 339 | 65.07% | 620 | 57.09% | 0.002 |
| Nursing home residence | 39 | 7.81% | 104 | 9.01% | 0.206 |
| Prior antibiotics | 301 | 55.43% | 568 | 49.22% | 0.017 |
| Hospital‐acquired BSI* | 240 | 44.20% | 485 | 42.03% | 0.399 |
| Prior bacteremia within 30 days | 88 | 16.21% | 154 | 13.34% | 0.116 |
| Sepsis‐related parameters | |||||
| LOS prior to bacteremia, d | |||||
| Mean SD | 6.65 11.22 | 5.88 10.81 | |||
| Median (25, 75) | 1 (0, 10) | 0 (0, 8) | 0.250 | ||
| Surgery | |||||
| None | 362 | 66.67% | 836 | 72.44% | 0.015 |
| Abdominal | 104 | 19.15% | 167 | 14.47% | 0.014 |
| Extra‐abdominal | 73 | 13.44% | 135 | 11.70% | 0.306 |
| Status unknown | 4 | 0.74% | 16 | 1.39% | 0.247 |
| Central line | 333 | 64.41% | 637 | 57.80% | 0.011 |
| TPN at the time of bacteremia or prior to it during index hospitalization | 52 | 9.74% | 74 | 5.45% | 0.017 |
| APACHE II | |||||
| Mean SD | 15.08 5.47 | 15.35 5.43 | |||
| Median (25, 75) | 15 (11, 18) | 15 (12, 19) | 0.275 | ||
| Severe sepsis | 361 | 66.48% | 747 | 64.73% | 0.480 |
| Septic shock requiring vasopressors | 182 | 33.52% | 407 | 35.27% | |
| On MV | 104 | 19.22% | 251 | 21.90% | 0.208 |
| Peak WBC (103/L) | |||||
| Mean SD | 22.26 25.20 | 22.14 17.99 | |||
| Median (25, 75) | 17.1 (8.9, 30.6) | 16.9 (10, 31) | 0.654 | ||
| Lowest serum SCr, mg/dL | |||||
| Mean SD | 1.02 1.05 | 0.96 1.03 | |||
| Median (25, 75) | 0.68 (0.5, 1.06) | 0.66 (0.49, 0.96) | 0.006 | ||
| Highest serum SCr, mg/dL | |||||
| Mean SD | 2.81 2.79 | 2.46 2.67 | |||
| Median (25, 75) | 1.68 (1.04, 3.3) | 1.41 (0.94, 2.61) | 0.001 | ||
| RIFLE category | |||||
| None | 81 | 14.92% | 213 | 18.46% | 0.073 |
| Risk | 112 | 20.63% | 306 | 26.52% | 0.009 |
| Injury | 133 | 24.49% | 247 | 21.40% | 0.154 |
| Failure | 120 | 22.10% | 212 | 18.37% | 0.071 |
| Loss | 50 | 9.21% | 91 | 7.89% | 0.357 |
| End‐stage | 47 | 8.66% | 85 | 7.37% | 0.355 |
| Infection source | |||||
| Urine | 95 | 17.50% | 258 | 22.36% | 0.021 |
| Abdomen | 69 | 12.71% | 113 | 9.79% | 0.070 |
| Lung | 93 | 17.13% | 232 | 20.10% | 0.146 |
| Line | 91 | 16.76% | 150 | 13.00% | 0.038 |
| CNS | 1 | 0.18% | 16 | 1.39% | 0.012 |
| Skin | 51 | 9.39% | 82 | 7.11% | 0.102 |
| Unknown | 173 | 31.86% | 375 | 32.50% | 0.794 |
During the index hospitalization, 589 patients (34.7%) suffered from septic shock requiring vasopressors; this did not impact the 30‐day readmission risk (Table 1). Commensurately, markers of severity of acute illness (APACHE II score, mechanical ventilation, peak white blood cell count) did not differ between the groups. With respect to the primary source of sepsis, urine was less, whereas central nervous system was more likely among those readmitted within 30 days. Similarly, there was a significant imbalance between the groups in the prevalence of AKI (Table 1). Specifically, those who did require a readmission were slightly less likely to have sustained no AKI (RIFLE: None; 14.9% vs 18.5%, P = 0.073). Those requiring readmission were also less likely to be in the category RIFLE: Risk (20.6% vs 26.5%, P = 0.009). The direction of this disparity was reversed for the Injury and Failure categories. No differences between groups were seen among those with categories Loss and end‐stage kidney disease (ESKD) (Table 1).
The microbiology of sepsis did not differ in most respects between the 30‐day readmission groups, save for several organisms (Table 2). Most strikingly, those who required a readmission were more likely than those who did not to be infected with Bacteroides spp, Candida spp, an MDR or an ESBL organism (Table 2). As for the outcomes of the index hospitalization, those with a repeat admission had a longer overall and postonset of sepsis initial hospital length of stay, and were less likely to be discharged either home without home health care or transferred to another hospital at the end of their index hospitalization (Table 3).
| 30‐Day Readmission = Yes | 30‐Day Readmission = No | P Value | |||
|---|---|---|---|---|---|
| N | % | N | % | ||
| |||||
| 543 | 32.00% | 1,154 | 68.00% | ||
| Gram‐positive BSI | 260 | 47.88% | 580 | 50.26% | 0.376 |
| Staphylococcus aureus | 138 | 25.41% | 287 | 24.87% | 0.810 |
| MRSA | 78 | 14.36% | 147 | 12.74% | 0.358 |
| VISA | 6 | 1.10% | 9 | 0.78% | 0.580 |
| Streptococcus pneumoniae | 7 | 1.29% | 33 | 2.86% | 0.058 |
| Streptococcus spp | 34 | 6.26% | 81 | 7.02% | 0.606 |
| Peptostreptococcus spp | 5 | 0.92% | 15 | 1.30% | 0.633 |
| Clostridium perfringens | 4 | 0.74% | 10 | 0.87% | 1.000 |
| Enterococcus faecalis | 54 | 9.94% | 108 | 9.36% | 0.732 |
| Enterococcus faecium | 29 | 5.34% | 63 | 5.46% | 1.000 |
| VRE | 36 | 6.63% | 70 | 6.07% | 0.668 |
| Gram‐negative BSI | 231 | 42.54% | 515 | 44.63% | 0.419 |
| Escherichia coli | 54 | 9.94% | 151 | 13.08% | 0.067 |
| Klebsiella pneumoniae | 54 | 9.94% | 108 | 9.36% | 0.723 |
| Klebsiella oxytoca | 11 | 2.03% | 18 | 1.56% | 0.548 |
| Enterobacter aerogenes | 6 | 1.10% | 13 | 1.13% | 1.000 |
| Enterobacter cloacae | 21 | 3.87% | 44 | 3.81% | 1.000 |
| Pseudomonas aeruginosa | 28 | 5.16% | 65 | 5.63% | 0.733 |
| Acinetobacter spp | 8 | 1.47% | 27 | 2.34% | 0.276 |
| Bacteroides spp | 25 | 4.60% | 30 | 2.60% | 0.039 |
| Serratia marcescens | 14 | 2.58% | 21 | 1.82% | 0.360 |
| Stenotrophomonas maltophilia | 3 | 0.55% | 8 | 0.69% | 1.000 |
| Achromobacter spp | 2 | 0.37% | 3 | 0.17% | 0.597 |
| Aeromonas spp | 2 | 0.37% | 1 | 0.09% | 0.241 |
| Burkholderia cepacia | 0 | 0.00% | 6 | 0.52% | 0.186 |
| Citrobacter freundii | 2 | 0.37% | 15 | 1.39% | 0.073 |
| Fusobacterium spp | 7 | 1.29% | 10 | 0.87% | 0.438 |
| Haemophilus influenzae | 1 | 0.18% | 4 | 0.35% | 1.000 |
| Prevotella spp | 1 | 0.18% | 6 | 0.52% | 0.441 |
| Proteus mirabilis | 9 | 1.66% | 39 | 3.38% | 0.058 |
| MDR PA | 2 | 0.37% | 7 | 0.61% | 0.727 |
| ESBL | 10 | 6.25% | 8 | 2.06% | 0.017 |
| CRE | 2 | 1.25% | 0 | 0.00% | 0.028 |
| MDR Gram‐negative or Gram‐positive | 231 | 47.53% | 450 | 41.86% | 0.036 |
| Candida spp | 58 | 10.68% | 76 | 6.59% | 0.004 |
| Polymicrobal BSI | 50 | 9.21% | 111 | 9.62% | 0.788 |
| Initially inappropriate treatment | 119 | 21.92% | 207 | 17.94% | 0.052 |
| 30‐Day Readmission = Yes | 30‐Day Readmission = No | ||||
|---|---|---|---|---|---|
| N = 543 | % = 32.00% | N = 1,154 | % = 68.00% | P Value | |
| |||||
| Hospital LOS, days | |||||
| Mean SD | 26.44 23.27 | 23.58 21.79 | 0.019 | ||
| Median (25, 75) | 19.16 (9.66, 35.86) | 17.77 (8.9, 30.69) | |||
| Hospital LOS following BSI onset, days | |||||
| Mean SD | 19.80 18.54 | 17.69 17.08 | 0.022 | ||
| Median (25, 75) | 13.9 (7.9, 25.39) | 12.66 (7.05, 22.66) | |||
| Discharge destination | |||||
| Home | 125 | 23.02% | 334 | 28.94% | 0.010 |
| Home with home care | 163 | 30.02% | 303 | 26.26% | 0.105 |
| Rehab | 81 | 14.92% | 149 | 12.91% | 0.260 |
| LTAC | 41 | 7.55% | 87 | 7.54% | 0.993 |
| Transfer to another hospital | 1 | 0.18% | 19 | 1.65% | 0.007 |
| SNF | 132 | 24.31% | 262 | 22.70% | 0.465 |
In a logistic regression model, 5 factors emerged as predictors of 30‐day readmission (Table 4). Having RIFLE: Injury or RIFLE: Failure carried an approximately 2‐fold increase in the odds of 30‐day rehospitalization (odds ratio: 1.95, 95% confidence interval: 1.302.93, P = 0.001) relative to having a RIFLE: None or RIFLE: Risk. Although having strong association with this outcome, harboring an ESBL organism or Bacteroides spp were both relatively infrequent events (3.3% ESBL and 3.2% Bacteroides spp). Infection with Escherichia coli and urine as the source of sepsis both appeared to be significantly protective against a readmission (Table 4). The model's discrimination was moderate (AUROC = 0.653) and its calibration adequate (Hosmer‐Lemeshow P = 0.907). (See Supporting Information, Appendix 1, in the online version of this article for the steps in the development of the final model.)
| OR | 95% CI | P Value | |
|---|---|---|---|
| |||
| ESBL | 4.503 | 1.42914.190 | 0.010 |
| RIFLE: Injury or Failure (reference: RIFLE: None or Risk) | 1.951 | 1.2972.933 | 0.001 |
| Bacteroides spp | 2.044 | 1.0583.948 | 0.033 |
| Source: urine | 0.583 | 0.3470.979 | 0.041 |
| Escherichia coli | 0.494 | 0.2700.904 | 0.022 |
DISCUSSION
In this single‐center retrospective cohort study, nearly one‐third of survivors of culture‐positive severe sepsis or septic shock required a rehospitalization within 30 days of discharge from their index admission. Factors that contributed to a higher odds of rehospitalization were having mild‐to‐moderate AKI (RIFLE: Injury or RIFLE: Failure) and infection with ESBL organisms or Bacteroides spp, whereas urine as the source of sepsis and E coli as the pathogen appeared to be protective.
A recent study by Hua and colleagues examining the New York Statewide Planning and Research Cooperative System for the years 2008 to 2010 noted a 16.2% overall rate of 30‐day rehospitalization among survivors of initial critical illness.[11] Just as we observed, Hua et al. concluded that development of AKI correlated with readmission. Because they relied on administrative data for their analysis, AKI was diagnosed when hemodialysis was utilized. Examining AKI using SCr changes, our findings add a layer of granularity to the relationship between AKI stages and early readmission. Specifically, we failed to detect any rise in the odds of rehospitalization when either very mild (RIFLE: Risk) or severe (RIFLE: Loss or RIFLE: ESKD) AKI was present. Only when either RIFLE: Injury or RIFLE: Failure developed did the odds of readmission rise. In addition to diverging definitions between our studies, differences in populations also likely yielded different results.[11] Although Hua et al. examined all admissions to the ICU regardless of the diagnosis or illness severity, our cohort consisted of only those ICU patients who survived culture‐positive severe sepsis/septic shock. Because AKI is a known risk factor for mortality in sepsis,[19] the potential for immortal time bias leaves a smaller pool of surviving patients with ESKD at risk for readmission. Regardless of the explanation, it may be prudent to focus on preventing AKI not only to improve survival, but also from the standpoint of diminishing the risk of an early readmission.
Four additional studies have examined the frequency of early readmissions among survivors of critical illness. Liu et al. noted 17.9% 30‐day rehospitalization rate among sepsis survivors.[12] Factors associated with the risk of early readmission included acute and chronic diseases burdens, index hospital LOS, and the need for the ICU in the index sepsis admission. In contrast to our cohort, all of whom were in the ICU during their index episode, less than two‐thirds of the entire population studied by Liu had required an ICU admission. Additionally, Liu's study did not specifically examine the potential impact of AKI or of microbiology on this outcome.
Prescott and coworkers examined healthcare utilization following an episode of severe sepsis.[13] Among other findings, they reported a 30‐day readmission rate of 26.5% among survivors. Although closer to our estimate, this study included all patients surviving a severe sepsis hospitalization, and not only those with a positive culture. These investigators did not examine predictors of readmission.[13]
Horkan et al. examined specifically whether there was an association between AKI and postdischarge outcomes, including 30‐day readmission risk, in a large cohort of patients who survived their critical illness.[20] In it they found that readmission risk ranged from 19% to 21%, depending on the extent of the AKI. Moreover, similar to our findings, they reported that in an adjusted analysis RIFLE: Injury and RIFLE: Failure were associated with a rise in the odds of a 30‐day rehospitalizaiton. In contrast to our study, Horkan et al. did detect an increase in the odds of this outcome associated with RIFLE: Risk. There are likely at least 3 reasons for this difference. First, we focused only on patients with severe sepsis or septic shock, whereas Horkan and colleagues included all critical illness survivors. Second, we were able to explore the impact of microbiology on this outcome. Third, Horkan's study included an order of magnitude more patients than did ours, thus making it more likely either to have the power to detect a true association that we may have lacked or to be more susceptible to type I error.
Finally, Goodwin and colleagues utilized 3 states' databases included in the Health Care and Utilization Project (HCUP) from the Agency for Healthcare Research and Quality to study frequency and risk factors for 30‐day readmission among survivors of severe sepsis.[21] Patients were identified based on the use of the severe sepsis (995.92) and septic shock (785.52). These authors found a 30‐day readmission rate of 26%. Although chronic renal disease, among several other factors, was associated with an increase in this risk, the data source did not permit these investigators to examine the impact of AKI on the outcomes. Similarly, HCUP data do not contain microbiology, a distinct difference from our analysis.
If clinicians are to pursue strategies to reduce the risk of an all‐cause 30‐day readmission, the key goal is not simply to identify all variables associated with readmission, but to focus on factors that are potentially modifiable. Although neither Hua nor Liu and their teams identified any additional factors that are potentially modifiable,[11, 12] in the present study, among the 5 factors we identified, the development of mild to moderate AKI during the index hospitalization may deserve stronger consideration for efforts at prevention. Although one cannot conclude automatically that preventing AKI in this population could mitigate some of the early rehospitalization risk, critically ill patients are frequently exposed to a multitude of nephrotoxic agents. Those caring for subjects with sepsis should reevaluate the risk‐benefit equation of these factors more cautiously and apply guideline‐recommended AKI prevention strategies more aggressively, particularly because a relatively minor change in SCr resulted in an excess risk of readmission.[22]
In addition to AKI, which is potentially modifiable, we identified several other clinical factors predictive of 30‐day readmission, which are admittedly not preventable. Thus, microbiology was predictive of this outcome, with E coli engendering fewer and Bacteroides spp and ESBL organisms more early rehospitalizations. Similarly, urine as the source of sepsis was associated with a lower risk for this endpoint.
Our study has a number of limitations. As a retrospective cohort, it is subject to bias, most notably a selection bias. Specifically, because the flagship hospital of the BJC HealthCare system is a referral center, it is possible that we did not capture all readmissions. However, generally, if a patient who receives healthcare within 1 of the BJC hospitals presents to a nonsystem hospital, that patient is nearly always transferred back into the integrated system because of issues of insurance coverage. Analysis of certain diagnosis‐related groups has indicated that 73% of all patients overall discharged from 4 of the large BJC system institutions who require a readmission within 30 days of discharge return to a BJC hospital (personal communication, Financial Analysis and Decision Support Department at BJC to Dr. Kollef May 12, 2015). Therefore, we may have misclassified the outcome in as many as 180 patients. The fact that our readmission rate was fully double that seen in Hua et al.'s and Liu et al.'s studies, and somewhat higher than that reported by Prescott et al., attests not only to the population differences, but also to the fact that we are unlikely to have missed a substantial percentage of readmissions.[11, 12, 13] Furthermore, to mitigate biases, we enrolled all consecutive patients meeting the predetermined criteria. Missing from our analysis are events that occurred between the index discharge and the readmission. Likewise, we were unable to obtain such potentially important variables as code status or outpatient mortality following discharge. These intervening factors, if included in subsequent studies, may increase the predictive power of the model. Because we relied on administrative coding to identify cases of severe sepsis and septic shock, it is possible that there is misclassification within our cohort. Recent studies indicate, however, that the Angus definition, used in our study, has high negative and positive predictive values for severe sepsis identification.[23] It is still possible that our cohort is skewed toward a more severely ill population, making our results less generalizable to the less severely ill septic patients.[24] The study was performed at a single healthcare system and included only cases of severe sepsis or septic shock that had a positive blood culture, and thus the findings may not be broadly generalizable either to patients without a positive blood culture or to institutions that do not resemble it.
In summary, we have demonstrated that survivors of culture‐positive severe sepsis or septic shock have a high rate of 30‐day rehospitalization. Because the US federal government's initiatives deem 30‐day readmissions to be a quality metric and penalize institutions with higher‐than average readmission rates, a high volume of critically ill patients with culture‐positive severe sepsis and septic shock may disproportionately put an institution at risk for such penalties. Unfortunately, not many of the determinants of readmission are amenable to prevention. As sepsis survival continues to improve, hospitals will need to concentrate their resources on coordinating care of these complex patients so as to improve both individual quality of life and the quality of care that they provide.
Disclosures
This study was supported by a research grant from Cubist Pharmaceuticals, Lexington, Massachusetts. Dr. Kollef's time was in part supported by the Barnes‐Jewish Hospital Foundation. The authors report no conflicts of interest.
- , , , et al; Sepsis Occurrence in Acutely Ill Patients Investigators. Sepsis in European intensive care units: results of the SOAP study. Crit Care Med. 2006;34:344–353
- , , , et al. Death in the United States, 2007. NCHS Data Brief. 2009;26:1–8.
- , , , et al. The epidemiology of sepsis in the United States from 1979 through 2000. N Engl J Med. 2003;348:1548–1564.
- , , , , , . Epidemiology of severe sepsis in the United States: analysis of incidence, outcome, and associated costs of care. Crit Care Med. 2001;29:1303–1310.
- , , , et al: Hospitalizations, costs, and outcomes of severe sepsis in the United States 2003 to 2007. Crit Care Med. 2012;40:754–761.
- , , , et al. Facing the challenge: decreasing case fatality rates in severe sepsis despite increasing hospitalization. Crit Care Med. 2005;33:2555–2562.
- , , , et al. Rapid increase in hospitalization and mortality rates for severe sepsis in the United States: a trend analysis from 1993 to 2003. Crit Care Med. 2007;35:1244–1250.
- , , , , . Two decades of mortality trends among patients with severe sepsis: a comparative meta‐analysis. Crit Care Med. 2014;42:625–631.
- , , , et al. Preventing 30‐day hospital readmissions: a systematic review and meta‐analysis of randomized trials. JAMA Intern Med. 2014;174:1095–1107.
- , . Trends in septicemia hospitalizations and readmissions in selected HCUP states, 2005 and 2010. HCUP Statistical Brief #161. Agency for Healthcare Research and Quality, Rockville, MD. Available at: http://www.hcup‐us.ahrq.gov/reports/statbriefs/sb161.pdf. Published September 2013, Accessed January 13, 2015.
- , , , . Early and late unplanned rehospitalizations for survivors of critical illness. Crit Care Med. 2015;43:430–438.
- , , , , , . Hospital readmission and healthcare utilization following sepsis in community settings. J Hosp Med. 2014;9:502–507.
- , , , , . Increased 1‐year healthcare use in survivors of severe sepsis. Am J Respir Crit Care Med. 2014;190:62–69.
- , , , , . Multi‐drug resistance, inappropriate initial antibiotic therapy and mortality in Gram‐negative severe sepsis and septic shock: a retrospective cohort study. Crit Care. 2014;18:596.
- , , . Does combination antimicrobial therapy reduce mortality in Gram‐negative bacteraemia? A meta‐analysis. Lancet Infect Dis. 2004;4:519–527.
- , , , et al. Multidrug‐resistant, extensively drug‐resistant and pandrug‐resistant bacteria: an international expert proposal for interim standard definitions for acquired resistance. Clin Microbiol Infect. 2012;18:268–281.
- , , , , ; Acute Dialysis Quality Initiative Workgroup. Acute renal failure—definition, outcome measures, animal models, fluid therapy and information technology needs: the Second International Consensus Conference of the Acute Dialysis Quality Initiative (ADQI) Group. Crit Care. 2004;8:R204–R212.
- , , , . APACHE II: a severity of disease classification system. Crit Care Med. 1985;13:818–829.
- , , , et al. RIFLE criteria for acute kidney injury are associated with hospital mortality in critically ill patients: a cohort analysis. Crit Care. 2006;10:R73
- , , , , , . The association of acute kidney injury in the critically ill and postdischarge outcomes: a cohort study. Crit Care Med. 2015;43:354–364.
- , , , . Frequency, cost, and risk factors of readmissions among severe sepsis survivors. Crit Care Med. 2015;43:738–746.
- Acute Kidney Injury Work Group. Kidney disease: improving global outcomes (KDIGO). KDIGO clinical practice guideline for acute kidney injury. Kidney Int Suppl. 2012;2:1–138. Available at: http://www.kdigo.org/clinical_practice_guidelines/pdf/KDIGO%20AKI%20Guideline.pdf. Accessed March 4, 2015.
- , , , , , . Validity of administrative data in recording sepsis: a systematic review. Crit Care. 2015;19(1):139.
- , , , , , . Severe sepsis cohorts derived from claims‐based strategies appear to be biased toward a more severely ill patient population. Crit Care Med. 2013;41:945–953.
© 2015 Society of Hospital Medicine
Drug Resistance in Pneumonia and BSI
Administration of initially appropriate antimicrobial therapy represents a key determinant of outcome in patients with severe infection.[1, 2, 3, 4, 5, 6, 7, 8, 9] The variable patterns of antimicrobial resistance seen between and within healthcare institutions complicate the process of antibiotic selection. Although much attention has historically focused on Staphylococcus aureus, resistance among Gram‐negative pathogens has emerged as a major challenge in the care of hospitalized, and particularly critically ill, patients.[2, 10, 11] Multidrug, and more specifically carbapenem resistance, among such common organisms as Pseudomonas aeruginosa (PA) and Enterobacteriaceae represents a major treatment challenge.[2] A recent US‐based surveillance study reported that a quarter of device‐related infections in hospitalized patients were caused by carbapenem‐resistant PA.[10]
In addition to changes in resistance patterns seen among PA isolates, increasing rates of nonsusceptibility have been described among Enterobacteriaceae. Resistance rates to third‐generation cephalosporins in these pathogens have risen steadily since 1988, reaching 20% among Klebsiella pneumoniae and 5% among Escherichia coli isolates by 2004.[11] In response to this, clinicians have increasingly utilized carbapenems to treat patients with serious Gram‐negative infections. However, the development of several types of carbapenemases by Enterobacteriaceae has led to a greater prevalence of carbapenem‐resistant Enterobacteriaceae species (CRE).[12, 13, 14, 15, 16, 17, 18] In fact, a recent report from the Centers for Disease Control and Prevention (CDC) documents a rapid rise in both the prevalence and extent of CRE in the United States.[19]
These Gram‐negative multidrug‐resistant (MDR) organisms frequently cause serious infections including pneumonia and bloodstream infections (BSI). The fact that these conditions, if not addressed in a timely and appropriate manner, lead to high morbidity, mortality, and costs, makes understanding the patterns of resistance that much more critical. To gain a better understanding of the prevalence and characteristics of MDR rates among PA and carbapenem resistance in Enterobacteriaceae in patients hospitalized in the United States with pneumonia and BSI, we conducted a multicenter survey of microbiology data.
METHODS
To determine the prevalence of predefined resistance patterns among PA and Enterobacteriaceae in pneumonia and BSI specimens, we examined The Surveillance Network (TSN) database from Eurofins between years 2000 and 2009. The database has been used extensively for surveillance purposes since 1994 and has previously been described in detail.[17, 20, 21, 22, 23] Briefly, TSN is a warehouse of routine clinical microbiology data collected from a nationally representative sample of microbiology laboratories in 217 hospitals in the United States. To minimize selection bias, laboratories are included based on their geography and the demographics of the populations they serve.[20] Only clinically significant samples are reported. No personal identifying information for source patients is available in this database. Only source laboratories that perform antimicrobial susceptibility testing according standard US Food and Drug Administration‐approved testing methods and interpret susceptibility in accordance with the Clinical Laboratory Standards Institute breakpoints are included.[24] All enrolled laboratories undergo a pre‐enrollment site visit. Logical filters are used for routine quality control to detect unusual susceptibility profiles and to ensure appropriate testing methods. Repeat testing and reporting are done as necessary.[20]
Laboratory samples are reported as susceptible, intermediate, or resistant.[24] We required that samples have susceptibility data for each of the antimicrobials needed to determine their resistance phenotype. These susceptibility patterns served as phenotypic surrogates for resistance. We grouped intermediate samples together with the resistant ones for the purposes of the current analysis. Duplicate isolates were excluded. Only samples representing 1 of the 2 infections of interest, pneumonia and BSI, were included.
We defined MDR‐PA as any isolate resistant to 3 of the following drug classes: aminoglycoside (gentamicin), antipseudomonal penicillin (piperacillin‐tazobactam), antipseudomonal cephalosporin (ceftazidime), carbapenems (imipenem, meropenem), and fluoroquinolone (ciprofloxacin). Enterobacteriaceae were considered CRE if resistant to both a third‐generation cephalosporin and a carbapenem. We examined the data by infection type, year, the 9 US Census geographical divisions, and intensive care unit (ICU) origin.
We did not pursue hypothesis testing due to a high risk of type I error in this large dataset. Therefore, only clinically important trends are highlighted.
RESULTS
Source specimen characteristics for the 205,526 PA (187,343 pneumonia and 18,183 BSI) and 95,566 Enterobacteriaceae specimens (58,810 pneumonia and 36,756 BSI) identified are presented in Table 1. The median age of the patients from which the isolates derive was similar among the PA pneumonia, Enterobacteriaceae pneumonia, and Enterobacteriaceae BSI groups, but higher in the PA BSI group. Similarly, there were differences in the gender distribution of source patients between the organisms and infections. Namely, although females represented a stable 42% of each of the infections with PA, the proportions of females with Enterobacteriaceae pneumonia (36.2%) differed from that in the BSI group (48.6%). Pneumonia specimens (34.0% PA and 39.0% Enterobacteriaceae) were more likely to originate in the ICU than those from BSI (28.4% PA and 21.1% Enterobacteriaceae).
| Pseudomonas aeruginosa, N=205,526 | Enterobacteriaceae, N=95,566 | |
|---|---|---|
| ||
| Pneumonia, n | 187,343 | 58,810 |
| Age, y, median (IQR 25, 75) | 54 (23, 71) | 55 (21, 71) |
| Gender, female, n (%) | 78,418 (41.9) | 21,305 (36.2) |
| ICU origin, n (%) | 63,755 (34.0) | 22,942 (39.0) |
| Meeting definitions of resistance, n (%) | 41,180 (22.0) | 930 (1.6) |
| BSI, n | 18,183 | 36,756 |
| Age, y, median (IQR 25, 75) | 59 (31, 75) | 55 (24, 71) |
| Gender, female, n (%) | 7,448 (41.8) | 17,871 (48.6) |
| ICU origin, n (%) | 5,170 (28.4) | 7,751 (21.1) |
| Meeting definitions of resistance, n (%) | 2,668 (14.7) | 394 (1.1) |
The prevalence of resistance among PA isolates was approximately 15‐fold higher than among Enterobacteriaceae specimens in both infection types (Table 1). This pattern persisted when stratified by infection type (pneumonia: 22.0% MDR‐PA vs 1.6% CRE; BSI: 14.7% MDR‐PA vs 1.1% CRE).
Over the time frame of the study, we detected variable patterns of resistance in the 2 groups of organisms (Figure 1). Namely, among PA in both pneumonia and BSI there was an initial rise in the proportion of MDR specimens between 2000 and 2003, followed by a stabilization until 2005, an additional rise in 2006, and a gradual decline and stabilization through 2009. These fluctuations notwithstanding, there was a net rise in MDR‐PA as a proportion of all PA from 10.7% in 2000 to 13.5% in 2009 among BSI, and from 19.2% in 2000 to 21.7% in 2009 among pneumonia specimens. Among Enterobacteriaceae, the CRE phenotype emerged in 2002 in both infection types and peaked in 2008 at 3.6% in BSI and 5.3% in pneumonia. This peak was followed by a stabilization in 2009 in BSI (3.5%) and a further decline, albeit minor, to 4.6% in pneumonia.

We noted geographic differences in the distribution of resistance (Table 2). Although MDR‐PA was more likely to originate from the East and West North Central divisions, and least likely from the New England and Mountain states, most CRE was detected in the specimens from the latter 2 regions. When stratified by ICU as the location of specimen origin, there were differences in the prevalence of resistant organisms of both types, but these differences were observed only in BSI specimens and not in pneumonia (Figure 2). That is, in BSI, the likelihood of a resistant organism originating from the ICU was approximately double that from a non‐ICU location for both MDR‐PA (21.9% vs 11.8%) and CRE (2.0% vs 0.8%).
| Census Division | MDR‐PA | CRE | ||
|---|---|---|---|---|
| BSI | Pneumonia | BSI | Pneumonia | |
| ||||
| East North Central | 20.8% | 26.9% | 2.0% | 1.9% |
| West North Central | 18.0% | 22.1% | 0.8% | 0.7% |
| East South Central | 15.8% | 20.5% | 0.1% | 0.1% |
| West South Central | 13.5% | 21.7% | 0.3% | 0.5% |
| Pacific | 13.1% | 20.3% | 0.3% | 0.3% |
| Mid‐Atlantic | 12.6% | 20.5% | 2.5% | 3.8% |
| South Atlantic | 12.6% | 21.6% | 0.9% | 1.5% |
| New England | 10.7% | 19.7% | 1.3% | 2.9% |
| Mountain | 8.5% | 19.4% | 0.4% | 1.1% |
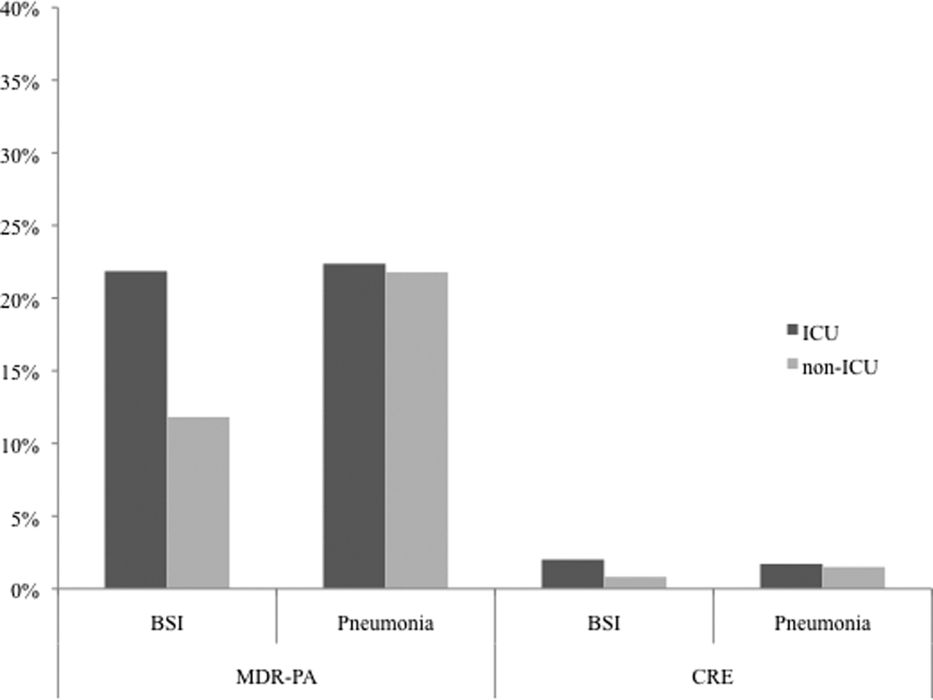
DISCUSSION
We have demonstrated that among both pneumonia and BSI specimens, PA and Enterobacteriaceae have a high prevalence of multidrug resistance. When examined cross‐sectionally, in both pneumonia and BSI, the prevalence of MDR‐PA was approximately 15‐fold higher than the prevalence of CRE among Enterobacteriaceae. Over the time frame of the study, MDR‐PA rose and then fell and stabilized to levels only slightly higher than those observed at the beginning of the observation period. In contrast, CRE emerged and rose precipitously between 2006 and 2008, and appeared to stabilize in 2009 in both infection types. Interestingly, we observed geographic variability among resistant isolates. Specifically, the prevalence of CRE was highest in the region with a relatively low prevalence of MDR‐PA. Despite this heterogeneity geographically, resistance for both isolate types in BSI but not in pneumonia was substantially higher in the ICU than outside the ICU.
Our data enhance the current understanding of distribution of Gram‐negative resistance in the United States. A recent study by Braykov and colleagues examined time trends in the development of CRE phenotype among Klebsiella pneumoniae in the United States.[17] By focusing on this single pathogen in various infections within Eurofin's TSN database between 1999 and 2010, they pinpointed its initial emergence to year 2002, with a notably steep rise between 2006 and 2009, with some reduction in the pace of growth in 2010. We have documented an analogous rise in the CRE phenotype among all Enterobacteriaceae, particularly in pneumonia and BSI within a similar time period. Thus, our data on the 1 hand broaden the concern about this pathogen beyond just a single organism within Enterobacteraceae and a single antimicrobial class, and on the other hand serve to focus attention on 2 clinically burdensome infection types, pneumonia and BSI.
Another recent investigation reported a rise in carbapenem‐resistant Enterobacteriaceae in US hospitals over the past decade.[19] Drawing on data from multiple sources, including the dataset used for the current analysis, this study examined the patterns of single‐class resistance to carbapenems among central line‐associated BSI (CLABSI) and catheter‐associated urinary tract infection specimens. Consistent with our findings, these authors noted that the highest percentage of hospitals reporting such single‐class carbapenem‐resistant specimens were located in the Northeastern United States. They also described that the proportion of Enterobacteriaceae with single‐class carbapenem resistance rose from 0% in 2001 to 1.4% in 2010. An additional CDC analysis reported that single‐class carbapenem resistance now exists in 4.2% of Enterobacteraciae as compared to 1.2% of isolates in 2001. We confirm that this rise in single‐class resistance is echoed by a rise in the prevalence of the CRE phenotype, and provides further granularity to this problem, specifically in the setting of pneumonia and BSI.
Although CRE has become an important concern in the treatment of patients with pneumonia and BSI, MDR‐PA remains a far larger challenge in these infections. CREs appear to occur more frequently than in the past but remain relatively dwarfed by the prevalence of MDR‐PA. Our data are generally in agreement with the 2009 to 2010 data from the National Healthcare Safety Network (NHSN) maintained by the CDC, which focuses on CLABSI and ventilator‐associated pneumonia (VAP) rather than general BSI and pneumonia in US hospitals.[25] In this report, the proportion of PA that were classified as MDR according to a definition similar to ours was 15.4% in CLABSI and 17.7% in VAP. In contrast, we document that 13.5% of PA causing BSI and 21.7% causing pneumonia were due to MDR‐PA organisms. This mild divergence likely reflects the slightly different antimicrobials utilized to define MDR‐PA in the 2 studies, as well as variance in the populations examined. An additional data point reported in the NHSN study is the proportion of MDR‐PA CLABSI originating in the ICU (16.8%) versus non‐ICU hospital locations (13.3%). Although the difference we found in the prevalence of BSI by the location in the hospital was greater, we confirm that ICU specimens carry a higher risk of harboring MDR‐PA.
Our study has a number of strengths and limitations. Because we used a nationally representative database to derive our estimates, our results are highly generalizable.
The TSN database consists of microbiology samples from hospital laboratories. Although we attempted to reduce the risk of duplication, because of how samples are numbered in the database, repeat sampling remains a possibility. The definitions of resistance were based on phenotypic patterns of resistance to various antimicrobial classes. This makes our resistant organisms subject to misclassification.
In summary, although carbapenem resistance among Enterobacteriaceae has emerged as an important phenomenon, multidrug resistance among PA remains relatively more prevalent in the United States. Furthermore, over the decade examined, MDR‐PA has remained an important pathogen in pneumonia and BSI that persists across all geographic regions of the United States. Although CRE is rightfully receiving a disproportionate share of attention from public health officials, it would be shortsighted to ignore the importance of MDR‐PA as a target, not only for transmission prevention and antimicrobial stewardship, but also for new therapeutic development. Because the patterns of resistance are rapidly evolving, it is incumbent upon our public health enterprise to perform more granular real‐time surveillance to allow changes in epidemiology to inform policy and treatment decisions.
ACKNOWLEDGEMENTS
Disclosures: This study was supported by a grant from Cubist Pharmaceuticals. The authors report no conflicts of interest.
- National Nosocomial Infections Surveillance (NNIS) System Report. Am J Infect Control. 2004;32:470.
- , , , . National surveillance of antimicrobial resistance in Pseudomonas aeruginosa isolates obtained from intensive care unit patients from 1993 to 2002. Antimicrob Agents Chemother. 2004;48:4606–4610.
- , , , et al. Health care‐associated pneumonia and community‐acquired pneumonia: a single‐center experience. Antimicrob Agents Chemother. 2007;51:3568–3573.
- , , , et al. Clinical importance of delays in the initiation of appropriate antibiotic treatment for ventilator‐associated pneumonia. Chest. 2002;122:262–268.
- . Modification of empiric antibiotic treatment in patients with pneumonia acquired in the intensive care unit. ICU‐Acquired Pneumonia Study Group. Intensive Care Med. 1996;22:387–394.
- , , , , . Antimicrobial therapy escalation and hospital mortality among patients with HCAP: a single center experience. Chest. 2008:134:963–968.
- , , , et al. Surviving Sepsis Campaign: international guidelines for management of severe sepsis and septic shock: 2008. Crit Care Med. 2008;36:296–327.
- , , , , , . Inappropriate antibiotic therapy in Gram‐negative sepsis increases hospital length of stay. Crit Care Med. 2011;39:46–51.
- , , , . Inadequate antimicrobial treatment of infections: a risk factor for hospital mortality among critically ill patients. Chest. 1999;115:462–474.
- , , , et al. Antimicrobial‐resistant pathogens associated with healthcare‐associated infections: annual summary of data reported to the National Healthcare Safety Network at the Centers for Disease Control and Prevention, 2006–2007. Infect Control Hospital Epidemiol. 2008;29:996–1011.
- , ; National Nosocomial Infections Surveillance (NNIS) System. Overview of nosocomial infections caused by Gram‐negative bacilli. Clin Infect Dis. 2005;41:848–854.
- , , . The real threat of Klebsiella pneumoniae carbapenemase‐producing bacteria. Lancet Infect Dis. 2009;9:228–236.
- , , , . Household transmission of carbapenemase‐producing Klebsiella pneumoniae. Emerg Infect Dis. 2008;14:859–860.
- , , , . Isolation of imipenem‐resistant Enterobacter species: emergence of KPC‐2 carbapenemase, molecular characterization, epidemiology, and outcomes. Antimicrob Agents Chemother. 2008;52:1413–1418.
- , , , , . Outcomes of carbapenem‐resistant Klebsiella pneumoniae infection and the impact of antimicrobial and adjunctive therapies. Infect Control Hosp Epidemiol. 2008;29:1099–1106.
- , , , , , ; for the Centers for Disease Control and Prevention Epicenter Program. Emergence and rapid regional spread of Klebsiella pneumoniae carbapenemase‐producing Enterobacteriaceae. Clin Infect Dis. 2011;53:532–540.
- , , , , . Trends in resistance to carbapenems and third‐generation cephalosporins among clinical isolates of Klebsiella pneumoniae in the United States, 1999–2010. Infect Control Hosp Epidemiol. 2013;34:259–268.
- , , , . Population‐based incidence of carbapenem‐resistant Klebsiella pneumoniae along the continuum of care, Los Angeles County. Infect Control Hosp Epidemiol. 2013;34:144–150.
- Centers for Disease Control and Prevention (CDC). Vital signs: carbapenem‐resistant enterobacteriaceae. MMWR Morb Mortal Wkly Rep. 2013;62:165–170.
- , , . Antimicrobial resistance in key bloodstream bacterial isolates: electronic surveillance with the Surveillance Network Database–USA. Clin Infect Dis. 1999;29:259–263.
- , , . Community‐associated methicillin‐resistant Staphylococcus aureus in outpatients, United States, 1999–2006. Emerg Infect Dis. 2009;15:1925–1930.
- , , . Increasing resistance of Acinetobacter species to imipenem in United States hospitals, 1999–2006. Infect Control Hosp Epidemiol. 2010;31:196–197.
- , , , , . Prevalence of antimicrobial resistance in bacteria isolated from central nervous system specimens as reported by U.S. hospital laboratories from 2000 to 2002. Ann Clin Microbiol Antimicrob. 2004;3:3.
- Clinical Laboratory Standards Institute. Available at: http://www.clsi.org. Accessed July 8, 2013.
- , , , et al. Antimicrobial‐resistant pathogens associates with healthcare‐associated infections: Summary of data reported to the National Healthcare Safety Network at the Centers for Disease Control and Prevention, 2009–2010. Infect Control Hosp Epidemiol. 2013;34:1–14.
Administration of initially appropriate antimicrobial therapy represents a key determinant of outcome in patients with severe infection.[1, 2, 3, 4, 5, 6, 7, 8, 9] The variable patterns of antimicrobial resistance seen between and within healthcare institutions complicate the process of antibiotic selection. Although much attention has historically focused on Staphylococcus aureus, resistance among Gram‐negative pathogens has emerged as a major challenge in the care of hospitalized, and particularly critically ill, patients.[2, 10, 11] Multidrug, and more specifically carbapenem resistance, among such common organisms as Pseudomonas aeruginosa (PA) and Enterobacteriaceae represents a major treatment challenge.[2] A recent US‐based surveillance study reported that a quarter of device‐related infections in hospitalized patients were caused by carbapenem‐resistant PA.[10]
In addition to changes in resistance patterns seen among PA isolates, increasing rates of nonsusceptibility have been described among Enterobacteriaceae. Resistance rates to third‐generation cephalosporins in these pathogens have risen steadily since 1988, reaching 20% among Klebsiella pneumoniae and 5% among Escherichia coli isolates by 2004.[11] In response to this, clinicians have increasingly utilized carbapenems to treat patients with serious Gram‐negative infections. However, the development of several types of carbapenemases by Enterobacteriaceae has led to a greater prevalence of carbapenem‐resistant Enterobacteriaceae species (CRE).[12, 13, 14, 15, 16, 17, 18] In fact, a recent report from the Centers for Disease Control and Prevention (CDC) documents a rapid rise in both the prevalence and extent of CRE in the United States.[19]
These Gram‐negative multidrug‐resistant (MDR) organisms frequently cause serious infections including pneumonia and bloodstream infections (BSI). The fact that these conditions, if not addressed in a timely and appropriate manner, lead to high morbidity, mortality, and costs, makes understanding the patterns of resistance that much more critical. To gain a better understanding of the prevalence and characteristics of MDR rates among PA and carbapenem resistance in Enterobacteriaceae in patients hospitalized in the United States with pneumonia and BSI, we conducted a multicenter survey of microbiology data.
METHODS
To determine the prevalence of predefined resistance patterns among PA and Enterobacteriaceae in pneumonia and BSI specimens, we examined The Surveillance Network (TSN) database from Eurofins between years 2000 and 2009. The database has been used extensively for surveillance purposes since 1994 and has previously been described in detail.[17, 20, 21, 22, 23] Briefly, TSN is a warehouse of routine clinical microbiology data collected from a nationally representative sample of microbiology laboratories in 217 hospitals in the United States. To minimize selection bias, laboratories are included based on their geography and the demographics of the populations they serve.[20] Only clinically significant samples are reported. No personal identifying information for source patients is available in this database. Only source laboratories that perform antimicrobial susceptibility testing according standard US Food and Drug Administration‐approved testing methods and interpret susceptibility in accordance with the Clinical Laboratory Standards Institute breakpoints are included.[24] All enrolled laboratories undergo a pre‐enrollment site visit. Logical filters are used for routine quality control to detect unusual susceptibility profiles and to ensure appropriate testing methods. Repeat testing and reporting are done as necessary.[20]
Laboratory samples are reported as susceptible, intermediate, or resistant.[24] We required that samples have susceptibility data for each of the antimicrobials needed to determine their resistance phenotype. These susceptibility patterns served as phenotypic surrogates for resistance. We grouped intermediate samples together with the resistant ones for the purposes of the current analysis. Duplicate isolates were excluded. Only samples representing 1 of the 2 infections of interest, pneumonia and BSI, were included.
We defined MDR‐PA as any isolate resistant to 3 of the following drug classes: aminoglycoside (gentamicin), antipseudomonal penicillin (piperacillin‐tazobactam), antipseudomonal cephalosporin (ceftazidime), carbapenems (imipenem, meropenem), and fluoroquinolone (ciprofloxacin). Enterobacteriaceae were considered CRE if resistant to both a third‐generation cephalosporin and a carbapenem. We examined the data by infection type, year, the 9 US Census geographical divisions, and intensive care unit (ICU) origin.
We did not pursue hypothesis testing due to a high risk of type I error in this large dataset. Therefore, only clinically important trends are highlighted.
RESULTS
Source specimen characteristics for the 205,526 PA (187,343 pneumonia and 18,183 BSI) and 95,566 Enterobacteriaceae specimens (58,810 pneumonia and 36,756 BSI) identified are presented in Table 1. The median age of the patients from which the isolates derive was similar among the PA pneumonia, Enterobacteriaceae pneumonia, and Enterobacteriaceae BSI groups, but higher in the PA BSI group. Similarly, there were differences in the gender distribution of source patients between the organisms and infections. Namely, although females represented a stable 42% of each of the infections with PA, the proportions of females with Enterobacteriaceae pneumonia (36.2%) differed from that in the BSI group (48.6%). Pneumonia specimens (34.0% PA and 39.0% Enterobacteriaceae) were more likely to originate in the ICU than those from BSI (28.4% PA and 21.1% Enterobacteriaceae).
| Pseudomonas aeruginosa, N=205,526 | Enterobacteriaceae, N=95,566 | |
|---|---|---|
| ||
| Pneumonia, n | 187,343 | 58,810 |
| Age, y, median (IQR 25, 75) | 54 (23, 71) | 55 (21, 71) |
| Gender, female, n (%) | 78,418 (41.9) | 21,305 (36.2) |
| ICU origin, n (%) | 63,755 (34.0) | 22,942 (39.0) |
| Meeting definitions of resistance, n (%) | 41,180 (22.0) | 930 (1.6) |
| BSI, n | 18,183 | 36,756 |
| Age, y, median (IQR 25, 75) | 59 (31, 75) | 55 (24, 71) |
| Gender, female, n (%) | 7,448 (41.8) | 17,871 (48.6) |
| ICU origin, n (%) | 5,170 (28.4) | 7,751 (21.1) |
| Meeting definitions of resistance, n (%) | 2,668 (14.7) | 394 (1.1) |
The prevalence of resistance among PA isolates was approximately 15‐fold higher than among Enterobacteriaceae specimens in both infection types (Table 1). This pattern persisted when stratified by infection type (pneumonia: 22.0% MDR‐PA vs 1.6% CRE; BSI: 14.7% MDR‐PA vs 1.1% CRE).
Over the time frame of the study, we detected variable patterns of resistance in the 2 groups of organisms (Figure 1). Namely, among PA in both pneumonia and BSI there was an initial rise in the proportion of MDR specimens between 2000 and 2003, followed by a stabilization until 2005, an additional rise in 2006, and a gradual decline and stabilization through 2009. These fluctuations notwithstanding, there was a net rise in MDR‐PA as a proportion of all PA from 10.7% in 2000 to 13.5% in 2009 among BSI, and from 19.2% in 2000 to 21.7% in 2009 among pneumonia specimens. Among Enterobacteriaceae, the CRE phenotype emerged in 2002 in both infection types and peaked in 2008 at 3.6% in BSI and 5.3% in pneumonia. This peak was followed by a stabilization in 2009 in BSI (3.5%) and a further decline, albeit minor, to 4.6% in pneumonia.
We noted geographic differences in the distribution of resistance (Table 2). Although MDR‐PA was more likely to originate from the East and West North Central divisions, and least likely from the New England and Mountain states, most CRE was detected in the specimens from the latter 2 regions. When stratified by ICU as the location of specimen origin, there were differences in the prevalence of resistant organisms of both types, but these differences were observed only in BSI specimens and not in pneumonia (Figure 2). That is, in BSI, the likelihood of a resistant organism originating from the ICU was approximately double that from a non‐ICU location for both MDR‐PA (21.9% vs 11.8%) and CRE (2.0% vs 0.8%).
| Census Division | MDR‐PA | CRE | ||
|---|---|---|---|---|
| BSI | Pneumonia | BSI | Pneumonia | |
| ||||
| East North Central | 20.8% | 26.9% | 2.0% | 1.9% |
| West North Central | 18.0% | 22.1% | 0.8% | 0.7% |
| East South Central | 15.8% | 20.5% | 0.1% | 0.1% |
| West South Central | 13.5% | 21.7% | 0.3% | 0.5% |
| Pacific | 13.1% | 20.3% | 0.3% | 0.3% |
| Mid‐Atlantic | 12.6% | 20.5% | 2.5% | 3.8% |
| South Atlantic | 12.6% | 21.6% | 0.9% | 1.5% |
| New England | 10.7% | 19.7% | 1.3% | 2.9% |
| Mountain | 8.5% | 19.4% | 0.4% | 1.1% |
DISCUSSION
We have demonstrated that among both pneumonia and BSI specimens, PA and Enterobacteriaceae have a high prevalence of multidrug resistance. When examined cross‐sectionally, in both pneumonia and BSI, the prevalence of MDR‐PA was approximately 15‐fold higher than the prevalence of CRE among Enterobacteriaceae. Over the time frame of the study, MDR‐PA rose and then fell and stabilized to levels only slightly higher than those observed at the beginning of the observation period. In contrast, CRE emerged and rose precipitously between 2006 and 2008, and appeared to stabilize in 2009 in both infection types. Interestingly, we observed geographic variability among resistant isolates. Specifically, the prevalence of CRE was highest in the region with a relatively low prevalence of MDR‐PA. Despite this heterogeneity geographically, resistance for both isolate types in BSI but not in pneumonia was substantially higher in the ICU than outside the ICU.
Our data enhance the current understanding of distribution of Gram‐negative resistance in the United States. A recent study by Braykov and colleagues examined time trends in the development of CRE phenotype among Klebsiella pneumoniae in the United States.[17] By focusing on this single pathogen in various infections within Eurofin's TSN database between 1999 and 2010, they pinpointed its initial emergence to year 2002, with a notably steep rise between 2006 and 2009, with some reduction in the pace of growth in 2010. We have documented an analogous rise in the CRE phenotype among all Enterobacteriaceae, particularly in pneumonia and BSI within a similar time period. Thus, our data on the 1 hand broaden the concern about this pathogen beyond just a single organism within Enterobacteraceae and a single antimicrobial class, and on the other hand serve to focus attention on 2 clinically burdensome infection types, pneumonia and BSI.
Another recent investigation reported a rise in carbapenem‐resistant Enterobacteriaceae in US hospitals over the past decade.[19] Drawing on data from multiple sources, including the dataset used for the current analysis, this study examined the patterns of single‐class resistance to carbapenems among central line‐associated BSI (CLABSI) and catheter‐associated urinary tract infection specimens. Consistent with our findings, these authors noted that the highest percentage of hospitals reporting such single‐class carbapenem‐resistant specimens were located in the Northeastern United States. They also described that the proportion of Enterobacteriaceae with single‐class carbapenem resistance rose from 0% in 2001 to 1.4% in 2010. An additional CDC analysis reported that single‐class carbapenem resistance now exists in 4.2% of Enterobacteraciae as compared to 1.2% of isolates in 2001. We confirm that this rise in single‐class resistance is echoed by a rise in the prevalence of the CRE phenotype, and provides further granularity to this problem, specifically in the setting of pneumonia and BSI.
Although CRE has become an important concern in the treatment of patients with pneumonia and BSI, MDR‐PA remains a far larger challenge in these infections. CREs appear to occur more frequently than in the past but remain relatively dwarfed by the prevalence of MDR‐PA. Our data are generally in agreement with the 2009 to 2010 data from the National Healthcare Safety Network (NHSN) maintained by the CDC, which focuses on CLABSI and ventilator‐associated pneumonia (VAP) rather than general BSI and pneumonia in US hospitals.[25] In this report, the proportion of PA that were classified as MDR according to a definition similar to ours was 15.4% in CLABSI and 17.7% in VAP. In contrast, we document that 13.5% of PA causing BSI and 21.7% causing pneumonia were due to MDR‐PA organisms. This mild divergence likely reflects the slightly different antimicrobials utilized to define MDR‐PA in the 2 studies, as well as variance in the populations examined. An additional data point reported in the NHSN study is the proportion of MDR‐PA CLABSI originating in the ICU (16.8%) versus non‐ICU hospital locations (13.3%). Although the difference we found in the prevalence of BSI by the location in the hospital was greater, we confirm that ICU specimens carry a higher risk of harboring MDR‐PA.
Our study has a number of strengths and limitations. Because we used a nationally representative database to derive our estimates, our results are highly generalizable.
The TSN database consists of microbiology samples from hospital laboratories. Although we attempted to reduce the risk of duplication, because of how samples are numbered in the database, repeat sampling remains a possibility. The definitions of resistance were based on phenotypic patterns of resistance to various antimicrobial classes. This makes our resistant organisms subject to misclassification.
In summary, although carbapenem resistance among Enterobacteriaceae has emerged as an important phenomenon, multidrug resistance among PA remains relatively more prevalent in the United States. Furthermore, over the decade examined, MDR‐PA has remained an important pathogen in pneumonia and BSI that persists across all geographic regions of the United States. Although CRE is rightfully receiving a disproportionate share of attention from public health officials, it would be shortsighted to ignore the importance of MDR‐PA as a target, not only for transmission prevention and antimicrobial stewardship, but also for new therapeutic development. Because the patterns of resistance are rapidly evolving, it is incumbent upon our public health enterprise to perform more granular real‐time surveillance to allow changes in epidemiology to inform policy and treatment decisions.
ACKNOWLEDGEMENTS
Disclosures: This study was supported by a grant from Cubist Pharmaceuticals. The authors report no conflicts of interest.
- National Nosocomial Infections Surveillance (NNIS) System Report. Am J Infect Control. 2004;32:470.
- , , , . National surveillance of antimicrobial resistance in Pseudomonas aeruginosa isolates obtained from intensive care unit patients from 1993 to 2002. Antimicrob Agents Chemother. 2004;48:4606–4610.
- , , , et al. Health care‐associated pneumonia and community‐acquired pneumonia: a single‐center experience. Antimicrob Agents Chemother. 2007;51:3568–3573.
- , , , et al. Clinical importance of delays in the initiation of appropriate antibiotic treatment for ventilator‐associated pneumonia. Chest. 2002;122:262–268.
- . Modification of empiric antibiotic treatment in patients with pneumonia acquired in the intensive care unit. ICU‐Acquired Pneumonia Study Group. Intensive Care Med. 1996;22:387–394.
- , , , , . Antimicrobial therapy escalation and hospital mortality among patients with HCAP: a single center experience. Chest. 2008:134:963–968.
- , , , et al. Surviving Sepsis Campaign: international guidelines for management of severe sepsis and septic shock: 2008. Crit Care Med. 2008;36:296–327.
- , , , , , . Inappropriate antibiotic therapy in Gram‐negative sepsis increases hospital length of stay. Crit Care Med. 2011;39:46–51.
- , , , . Inadequate antimicrobial treatment of infections: a risk factor for hospital mortality among critically ill patients. Chest. 1999;115:462–474.
- , , , et al. Antimicrobial‐resistant pathogens associated with healthcare‐associated infections: annual summary of data reported to the National Healthcare Safety Network at the Centers for Disease Control and Prevention, 2006–2007. Infect Control Hospital Epidemiol. 2008;29:996–1011.
- , ; National Nosocomial Infections Surveillance (NNIS) System. Overview of nosocomial infections caused by Gram‐negative bacilli. Clin Infect Dis. 2005;41:848–854.
- , , . The real threat of Klebsiella pneumoniae carbapenemase‐producing bacteria. Lancet Infect Dis. 2009;9:228–236.
- , , , . Household transmission of carbapenemase‐producing Klebsiella pneumoniae. Emerg Infect Dis. 2008;14:859–860.
- , , , . Isolation of imipenem‐resistant Enterobacter species: emergence of KPC‐2 carbapenemase, molecular characterization, epidemiology, and outcomes. Antimicrob Agents Chemother. 2008;52:1413–1418.
- , , , , . Outcomes of carbapenem‐resistant Klebsiella pneumoniae infection and the impact of antimicrobial and adjunctive therapies. Infect Control Hosp Epidemiol. 2008;29:1099–1106.
- , , , , , ; for the Centers for Disease Control and Prevention Epicenter Program. Emergence and rapid regional spread of Klebsiella pneumoniae carbapenemase‐producing Enterobacteriaceae. Clin Infect Dis. 2011;53:532–540.
- , , , , . Trends in resistance to carbapenems and third‐generation cephalosporins among clinical isolates of Klebsiella pneumoniae in the United States, 1999–2010. Infect Control Hosp Epidemiol. 2013;34:259–268.
- , , , . Population‐based incidence of carbapenem‐resistant Klebsiella pneumoniae along the continuum of care, Los Angeles County. Infect Control Hosp Epidemiol. 2013;34:144–150.
- Centers for Disease Control and Prevention (CDC). Vital signs: carbapenem‐resistant enterobacteriaceae. MMWR Morb Mortal Wkly Rep. 2013;62:165–170.
- , , . Antimicrobial resistance in key bloodstream bacterial isolates: electronic surveillance with the Surveillance Network Database–USA. Clin Infect Dis. 1999;29:259–263.
- , , . Community‐associated methicillin‐resistant Staphylococcus aureus in outpatients, United States, 1999–2006. Emerg Infect Dis. 2009;15:1925–1930.
- , , . Increasing resistance of Acinetobacter species to imipenem in United States hospitals, 1999–2006. Infect Control Hosp Epidemiol. 2010;31:196–197.
- , , , , . Prevalence of antimicrobial resistance in bacteria isolated from central nervous system specimens as reported by U.S. hospital laboratories from 2000 to 2002. Ann Clin Microbiol Antimicrob. 2004;3:3.
- Clinical Laboratory Standards Institute. Available at: http://www.clsi.org. Accessed July 8, 2013.
- , , , et al. Antimicrobial‐resistant pathogens associates with healthcare‐associated infections: Summary of data reported to the National Healthcare Safety Network at the Centers for Disease Control and Prevention, 2009–2010. Infect Control Hosp Epidemiol. 2013;34:1–14.
© 2013 Society of Hospital Medicine
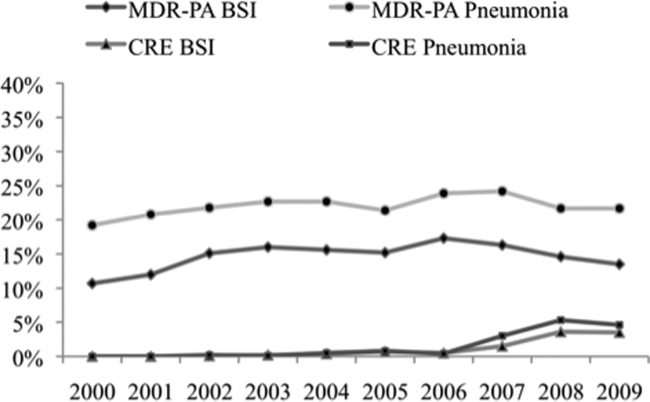
PESI vs PREP
Acute pulmonary embolism (PE) is associated with significant morbidity and mortality.1 While expeditious diagnosis and management results in reduced mortality, the ability to rapidly and accurately identify those at increased risk for death remains elusive. Multiple studies have utilized various biomarkers as risk stratification tools, however, these approaches have proven to have many limitations. For example, both serum brain natriuretic peptide (BNP) and troponin levels have been studied as possible risk stratification tools. Those with elevated levels of these following a PE may have concomitant right ventricular (RV) dysfunction and/or hemodynamic instability. Thus, they may face a greater risk for cardiovascular collapse and death. The low positive predictive value of these biomarkers (14%‐44%) has limited their clinical utility.24 Furthermore, imaging modalities, such as echocardiography, which is considered the clinical gold standard for determining the presence of acute RV dysfunction in PE, may not be readily available and may require special expertise for interpretation.5
Conversely, the need to identify acute PE patients at low risk for death is just as important. Recent studies suggest that carefully selected patients can successfully be managed as outpatients which can subsequently lead to significant cost savings and patient satisfaction. Movement towards enhanced outpatient resources and the advent of subcutaneous anticoagulants have made outpatient management of acute PE an appealing possibility. However, proper education, close follow‐up, and a rigorous selection process to recognize those at minimal risk for a fatal complication must all be available before clinicians prematurely discharge these patients to home.
Recently, clinical scoring tools have been developed to aid in risk stratifying patients with acute PE to accurately determine patient outcome. The pulmonary embolism severity index (PESI) is a reproducible scoring system that accurately predicts 30‐day and 90‐day mortality.6, 7 It consists of 11 clinical variables that can be quickly assessed at the time of diagnosis (Table 1A). The fact that biomarkers and imaging technology, such as echocardiography, are unnecessary to compute a PESI score demonstrates the appeal of this system. Similar to the PESI, Sanchez et al.8 have proposed the prognosis in pulmonary embolism (PREP) score as an alternate clinical risk tool in PE (Table 1B). Contrary to PESI, the PREP only uses 3 clinical variables to accurately predict vital outcome with an area under the receiver operating characteristic (AUROC) curve of 0.73 (95% confidence interval [CI], 0.65‐0.82). While both scoring systems have been developed to predict 30‐day mortality in acute PE, the comparative validity of these prognostic tools has not been assessed.
| Predictors | Points Assigned |
|---|---|
| |
| Demographic characteristics | |
| Age (yr) | Age (yr) |
| Male sex | +10 |
| Comorbid conditions | |
| Cancer | +30 |
| Heart failure | +10 |
| Chronic lung disease | +10 |
| Clinical findings | |
| Pulse 110 beats/min | +20 |
| Systolic blood pressure <100 mm Hg | +30 |
| Respiratory rate 30 breaths/min | +20 |
| Temperature <36C | +20 |
| Altered mental status* | +60 |
| Arterial oxygen saturation <90% | +20 |
| Prognostic Factor | Points Assigned |
|---|---|
| |
| Altered mental status* | +10 |
| Cardiogenic shock (systolic blood pressure <90 mm Hg) | +6 |
| Cancer | +6 |
We hypothesized that the PESI more precisely risk stratifies the risk for death in acute PE compared to the PREP. Furthermore, we theorized that the PESI more reliably predicts not only 30‐day but also 90‐day mortality. To test our hypothesis, we performed a retrospective analysis, of all consecutive patients diagnosed with acute PE at our hospital, to compare the prognostic accuracy of these 2 scoring systems.
METHODS
Subjects and Definitions
Between October 2007 and February 2009, adults (age 18 years) diagnosed the day prior with acute PE were identified on a daily basis. This study cohort has been described elsewhere.7 Patients with newly diagnosed PE were eligible for enrollment. Those expected to die within 30 days of their acute PE, such as individuals suffering from a terminal condition (metastatic cancer) or critical illness being transitioned to comfort care, were excluded (n = 32). Patients with multiple admissions for acute PE were included only during the first episode. PE was diagnosed using objective criteria through 1 of the following modalities: high probability ventilation‐perfusion (V/Q) scintigraphy, computed tomography (CT) of the chest with PE protocol, or magnetic resonance imaging (MRI) of the chest. A list of patients who had the above imaging studies to evaluate for PE was provided to study personnel daily by the radiology department; this list was generated every morning and consisted of the day prior's studies. Patient management was not influenced by the research team and was the responsibility of the primary team. This study was approved by our local institutional review board and consent was not required.
We calculated the PESI as described by Aujesky and colleagues.6 For outpatients admitted with acute PE, clinical findings available just prior to, and after, diagnosis were used for scoring. For inpatients diagnosed with PE, clinical findings available during the 24 hours just prior to diagnosis were included. Raw PESI scores were converted to risk class (I‐V), and then further dichotomized into low‐risk (class I‐II) and high‐risk (class III‐V) groups (Table 2). The PREP score was computed based on the presence of altered mental status (AMS), cancer, and cardiogenic shock defined as a systolic blood pressure <90 mm Hg (Table 1B). A raw PREP score of <7 was then characterized as low risk for mortality, while scores 7 were considered high risk.
| PESI Score | Class | n | 30‐Day Mortality by Class (%) | 90‐Day Mortality by Class (%) | Low vs High Risk |
|---|---|---|---|---|---|
| |||||
| 65 | I | 49 | 0 (0.0) | 0 (0.0) | Low |
| 66‐85 | II | 59 | 0 (0.0) | 0 (0.0) | |
| 86‐105 | III | 60 | 0 (0.0) | 0 (0.0) | High |
| 106‐125 | IV | 56 | 2 (3.4) | 4 (6.9) | |
| >125 | V | 69 | 7 (9.2) | 8 (10.5) | |
Finally, the PESI and PREP scores were compared based on their ability to predict all‐cause 30‐day and 90‐day mortality. To determine vital status and date of death, we reviewed the Social Security Death Index 90 days after enrollment of all subjects was completed.
Statistical Analysis
To assess the predictive ability of the 2 scoring tools for death, we determined the negative predictive value and computed the AUROC curves for both scoring systems. AUROC curves were constructed for raw scores and when scores were further segregated by class and risk groups. Additionally, 95% CIs were estimated to determine the accuracy of the discriminatory power of the PESI score versus the PREP score.
Post hoc, we calculated the power of our study to assess whether the difference noted in AUROC curves between the PESI and PREP was adequate to truly determine statistical significance. We used methodology described by Hanley and McNeil to compare continuous values.9 Assuming an alpha of 0.05 and a 20% difference in the AUROC curves, as described in our results, the power in our study was 0.35. Therefore, an approximate sample size of 1000 would be necessary to determine statistical significance. This analysis was performed using Power Analysis and Sample Size (PASS) 11.
RESULTS
The final cohort included 302 subjects (mean age: 59.7 17.2 years; 44.0% males). As Table 3 reveals, the majority of PEs was diagnosed via CT scan (76%). On presentation, 6.6% had cardiogenic shock, while 5.0% had altered censorium. In terms of comorbid conditions, 25.2% had congestive heart failure, 25.2% had cancer, and 22.2% had a prior venous thromboembolic event. Overall, 3.0% and 4.0% met our primary outcomes of death within 30‐days and 90‐days of their acute PEs, respectively.
| |
| Demographics | |
| Age (yr), mean SD | 59.7 17.2 |
| Male sex, % | 44% |
| Diagnostic methodology | |
| CT chest, n (%) | 230 (76.2) |
| V/Q scan, n (%) | 71 (23.5) |
| MRA chest, n (%) | 1 (0.3) |
| Comorbidities | |
| Malignancy, n (%) | 76 (25.2) |
| Congestive heart failure, n (%) | 76 (25.2) |
| Chronic lung disease, n (%) | 72 (23.8) |
| Recent orthopedic surgery, n (%) | 22 (7.3) |
| Prior cerebrovascular accident, n (%) | 31 (10.3) |
| Prior venous thromboembolic disease, n (%) | 67 (22.2) |
The rates of 30‐day and 90‐day mortality, respectively, increased with increasing score for both the PESI and the PREP. No patients in PESI class I died by either time point, while 9.2% of PESI class V subjects expired by 30 days (P < 0.0001) and 10.5% died by 90 days (P = 0.003) (Table 2). Based on PESI, 30‐day death rates were 4.6% in the high‐risk cohort versus 0% in the low‐risk group (P = 0.023). Conversely, 7.1% of high‐risk PREP subjects died by day 30 versus 1% of low‐risk subjects (P = 0.004) (Figure 1A). Those stratified into the PESI high‐risk group had a 90‐day mortality of 6.2% versus 0% for the low‐risk group (P = 0.008) versus 9.1% in those deemed high risk by PREP, as compared to 1.5% of those scored as low risk by PREP (P = 0.001) (Figure 1B).
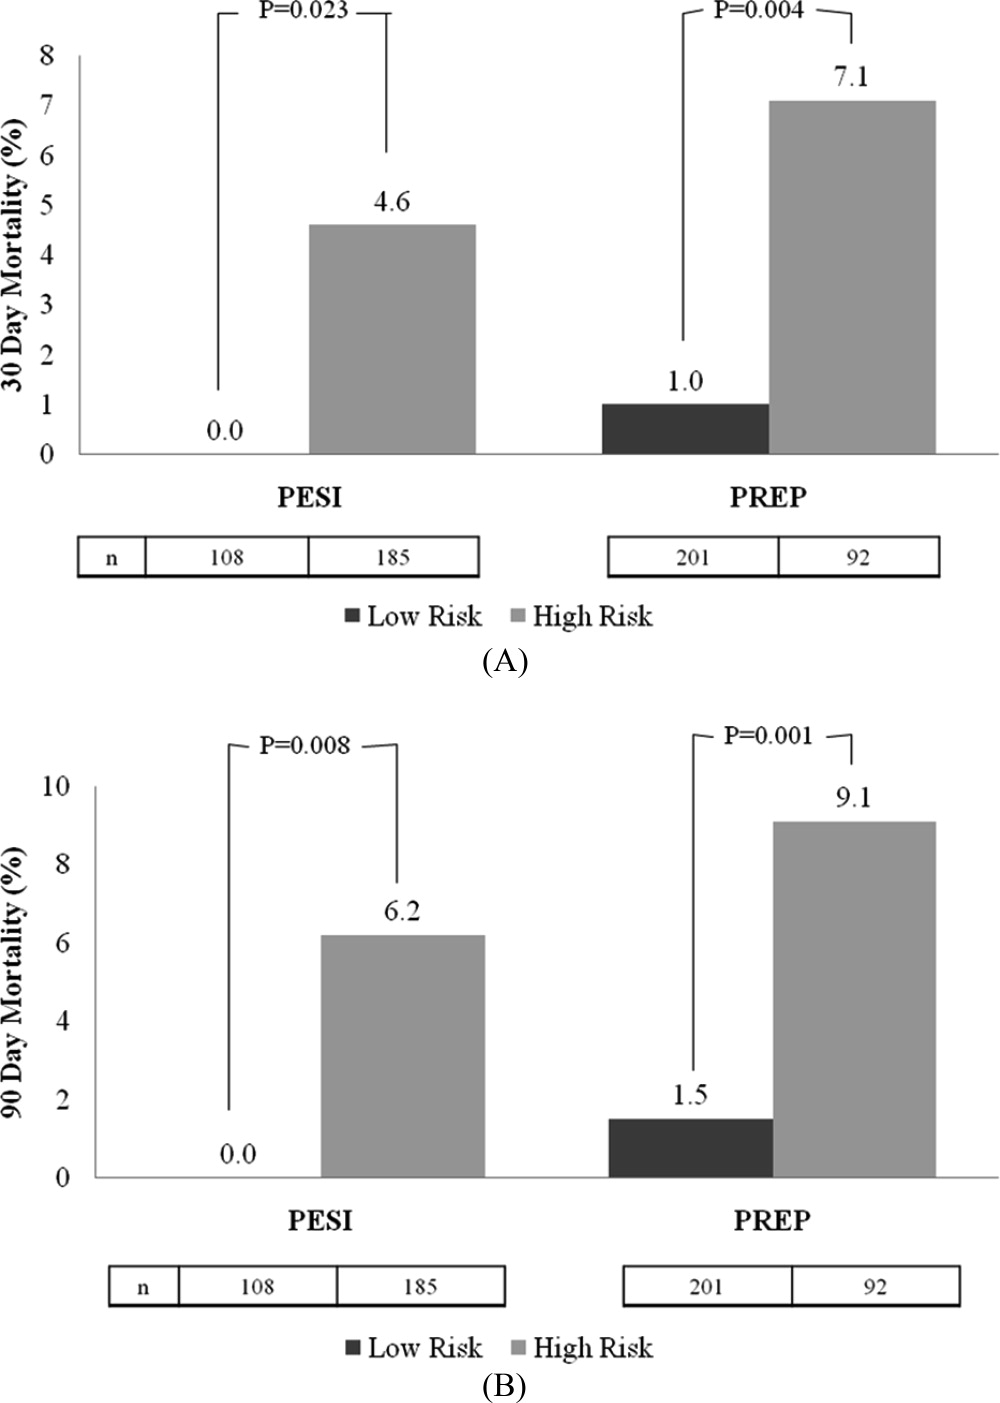
Regarding the 30‐day mortality, the negative predictive value of the PESI was 100% (95% CI, 98.6%‐100%) while that for PREP was 99.0% (95% CI, 97.6%‐99.7%); the ability of the PREP to predict 30‐day mortality was similar to the PESI (Table 4). The AUROCs for PESI and PREP for predicting 30‐day death were also equivalent; for the raw PESI score, this measured 0.858 (95% CI, 0.773‐0.943), compared to 0.719 (95% CI, 0.563‐0.875) for PREP. When these scores were dichotomized to high‐risk versus low‐risk groups, the AUROC for the PESI was 0.684 (95% CI, 0.559‐0.810) and 0.732 (95% CI, 0.571‐0.893) for PREP.
| 30‐Day Mortality | 90‐Day Mortality | |||
|---|---|---|---|---|
| Scoring System | AUROC | 95% CI | AUROC | 95% CI |
| ||||
| Raw PESI | 0.858 | 0.773‐0.943 | 0.835 | 0.762‐0.907 |
| PESI class | 0.835 | 0.756‐0.914 | 0.813 | 0.738‐0.888 |
| PESI high vs low risk | 0.684 | 0.559‐0.810 | 0.686 | 0.576‐0.796 |
| Raw PREP | 0.719 | 0.563‐0.875 | 0.704 | 0.564‐0.844 |
| PREP high vs low risk | 0.732 | 0.571‐0.893 | 0.720 | 0.574‐0.865 |
In terms of 90‐day mortality, the negative predictive values of PESI and PREP did not change: 100% (95% CI, 97.4%‐100%) and 98.5% (95% CI, 96.9%‐99.5%), respectively. The ability of PESI and PREP as predictors of 90‐day mortality was equivalent (Table 4). Here, the AUROC for the raw PESI score remained excellent at 0.835 (97% CI, 0.762‐0.907). The AUROC for PREP was akin to that of PESI at 0.704 (95% CI, 0.564‐0.844). Segregating scores into high‐risk versus low‐risk groups demonstrated that the AUROC for PESI was 0.686 (95% CI, 0.576‐0.796) compared to 0.720 (95% CI, 0.574‐0.865) for PREP.
DISCUSSION
This retrospective analysis of patients with acute PE confirms that both the PESI and the PREP are accurate scoring tools for identifying patients at low risk of death. Under both rubrics, as the score increases, the likelihood of death also increases. More importantly, we demonstrate that the negative predictive value for both the PREP and PESI are excellent. Thus, these scoring tools can distinguish those at higher risk for death versus those at low risk in a simple‐to‐apply manner. In comparing these 2 scoring systems, the PREP comparably identifies acute PE patients at risk for death when contrasted with the PESI. Given the fewer required scoring points to calculate PREP and its ability to accurately predict clinically relevant outcomes, this simpler scoring system may have greater clinical utility.
Prior studies have validated the PESI as a risk stratification tool to predict 30‐day and 90‐day mortalities. In their original derivation of the PESI, Aujesky et al. demonstrated that higher PESI scores correlated with death at 30 days.6 Acute PE patients classified into risk class I had a short‐term mortality rate of 1.1% compared to nearly 25% of patients risk stratified into risk class V. The same authors subsequently verified that there is a linear relationship between PESI score and risk of death at 90 days.10 We have also confirmed the accuracy of the PESI for identifying persons at high risk for death and documented the limited interobserver variability in this tool.7 In combination, there is evidence that the PESI can accurately predict vital outcome. Despite the effectiveness of the PESI, it is a somewhat cumbersome scoring system. It requires gathering information on 11 clinical variables, each with a different score allocation to ultimately compute the PESI score. In contrast, the PREP only requires knowing 3 clinical variables: presence of cancer, mental status, and the presence of cardiogenic shock. Akin to the PESI, the PREP and mortality are linearly related, where higher PREP scores result in higher 30‐day and 90‐day mortalities.
Our analysis helps expand the evidence regarding clinical risk stratification in PE in several ways. First, we verify that both the PESI and PREP are accurate predictors of short‐term mortality. While this has been accomplished for the PESI in prior studies, to our knowledge, this is the first confirmatory study for PREP's utility as a risk stratification tool. Second, we demonstrate that PREP is also an accurate predictor of intermediate‐term mortality. If the eventual goal is to develop tools that allow for the initial outpatient management of acute PE, clinicians require data on longer‐term outcomes to ensure that later harms do not arise based on a decision to defer hospitalization. Prior observational studies and randomized controlled clinical trials have proven that appropriately selected individuals face similar rates of complications following acute PE, whether they are managed in or outside of a hospital setting.1116 The key limitation of these earlier efforts, though, was that there was no clear standardized approach to determining whom could be safely managed solely as an outpatient. Finally, our study is unique in that we compare the discriminatory power of these 2 risk‐scoring schemes and illustrate their equivalence. As a scoring system that only requires 3 variables, the PREP is easier and simpler, and may therefore have more clinical utility than the PESI. The high negative predictive value of the PREP suggests that it has potential in identifying patients with acute PE who can safely be managed on an outpatient basis. However, given the complexity of factors associated with the decision for early discharge, these scores should be used in conjunction with, and not supplant, clinical judgment for outpatient management. Of course, formal prospective management trials incorporating both the PREP and PESI are needed to validate this concept.
Why does PREP perform so well despite the fact that it focuses on so few clinical variables? Essentially, the PREP is an effective scoring tool for acute PE because of its ability to identify individuals at risk for progressing to shock. The presence of AMS in acute PE has been associated with a greater likelihood of death, as it likely arises as a consequence of severe shock or RV strain resulting in decreased cerebral blood flow. Alternatively, altered censorium could represent a manifestation of hypoxemia from significant V/Q mismatching and/or pulmonary shunting due to the obstructive clot. This, too, portends a poorer prognosis secondary to impending respiratory failure from hypoxemia. Thus, individuals with an acute PE presenting with altered mentation merit very close observation. Similarly, pending hemodynamic instability is a concerning manifestation that warrants inpatient monitoring.5, 17, 18 At the very minimum, these individuals have RV strain and should therefore be admitted to the hospital to potentially administer more aggressive treatment modalities (ie, thrombolytics or thrombectomy). The last clinical criteria involves the presence of malignancy. The presence of a cancer may serve as a surrogate marker for those at increased risk for early recurrent thromboembolic phenomena, since malignancy is associated with a hypercoagulable state.17, 19 Perhaps there is a threshold whereby accumulating clot resulting in RV strain ensues with subsequent poorer outcomes. Thus, it clinically and physiologically seems logical that, in the absence of any of these findings, patients with acute PE will have lower mortality rates.
Thus far, other methods used for risk stratification may either be expensive, not really obtainable, or not routinely available at the time of presentation. For example, confirmation of RV strain with an echocardiogram requires a skilled technician and interpreter. In contrast, both the PESI and PREP are scored based on multiple clinical findings. Hence, they are not dependent upon a single test to determine outcome, but on various clinical variables making these scoring tools comprehensive, simple, and reliable approaches of recognizing low‐risk patients.
Our analysis has several limitations. First, the retrospective nature of this analysis subjects it to multiple forms of bias. We attempted to eliminate these biases by defining, a priori, the time frame from which vital signs can be used during scoring. We also used all‐cause mortality as our primary endpoint to minimize the possibility of ascertainment bias. However, this type of bias could not be completely eliminated since data collected was not specifically for the purpose of this study. Second, this single‐center study may limit the generalizability of these findings; yet, the diversity of patients admitted to this 900‐bed, tertiary care facility, as well as the inclusion of both inpatients and outpatients, helps to mitigate this concern. Third, the exclusion of individuals with expectant deaths within <30 days limits the applicability of these findings to this group. We chose to exclude persons with anticipated short‐term mortality to reduce the tally of patients who did not receive therapeutic treatment (ie, those transitioned to comfort care). Fourth, the use of the Social Security Death Index objectively determines death status for all‐cause mortality but cannot delineate cause‐specific death. Consequently, death strictly due to PE could not be assessed. Fifth, the original investigators for PREP assessed the PREP score with and without BNP and left‐to‐right ventricular diameter ratios. Although their results demonstrated similar AUROCs for the PREP score with and without BNP to predict 30‐day outcomes, this was a finding we could not confirm due to inconsistencies in measuring BNP and echocardiograms in our cohort. Also, our post hoc power analysis demonstrates that our findings may be limited by sample size. The lack of statistically significant differences between the PESI and the PREP may, in fact, be due to the small sample size versus true effect. Finally, tolerance for medical therapy and compliance with treatment were not documented and, therefore, were immeasurable. Poor compliance to anticoagulants or intolerability increases risk for recurrent PE, while excessive anticoagulation increases likelihood of bleeding.
In summary, the PREP and PESI can both safely predict 30‐day and 90‐day outcomes. However, the simplicity of the PREP renders it more clinician friendly. The fact that only 3 clinical noninvasive variables are required would ultimately make it the preferred bedside tool to risk stratify patients for acute PE. The high negative predictive value and comparable AUROCs establishes the effectiveness of these 2 scoring systems in recognizing low‐risk patients. Irrespective of the clinician's choice to use 1 tool over the other, both have potential for clinical application at the bedside and in clinical trials. Nevertheless, further evidence is required before they are utilized to triage patients for outpatient therapy.
- .Pulmonary embolism: what have we learned since Virchow? Natural history, pathophysiology, and diagnosis.Chest.2002;122:1440–1456.
- ,,, et al.The incidence and prognostic significance of elevated cardiac troponins in patients with submassive pulmonary embolism.J Thromb Haemost.2005;3:508–513.
- ,,, et al.Biomarker‐based risk assessment model in acute pulmonary embolism.Eur Heart J.2005;26:2166–2172.
- ,.Cardiac biomarkers for risk stratification of patients with acute pulmonary embolism.Circulation.2003;108:2191–2194.
- ,,, et al.Prognostic role of echocardiography among patients with acute pulmonary embolism and a systolic arterial pressure of 90 mm Hg or higher.Arch Intern Med.2005;165:1777–1781.
- ,,, et al.Derivation and validation of a prognostic model for pulmonary embolism.Am J Respir Crit Care Med.2005;172:1041–1046.
- ,,.The validation and reproducibility of the pulmonary embolism severity index.J Thromb Haemost.2010;8:1509–1514.
- ,,, et al.Prognostic factors for pulmonary embolism: the prep study, a prospective multicenter cohort study.Am J Respir Crit Care Med.2010;181:168–173.
- ,.A method of comparing the areas under receiver operating characteristic curves derived from the same cases.Radiology.1983;148:839–843.
- ,,, et al.Prospective validation of the pulmonary embolism severity index. A clinical prognostic model for pulmonary embolism.Thromb Haemost.2008;100:943–948.
- ,,, et al.Expanding eligibility for outpatient treatment of deep venous thrombosis and pulmonary embolism with low‐molecular‐weight heparin: a comparison of patient self‐injection with homecare injection.Arch Intern Med.1998;158:1809–1812.
- ,,, et al.Outpatient treatment of pulmonary embolism with dalteparin.Thromb Haemost.2000;83:209–211.
- ,,, et al.Outpatient treatment of pulmonary embolism is feasible and safe in a substantial proportion of patients.J Thromb Haemost.2003;1:186–187.
- ,,, et al.A randomized trial comparing 2 low‐molecular‐weight heparins for the outpatient treatment of deep vein thrombosis and pulmonary embolism.Arch Intern Med.2005;165:733–738.
- ,,, et al.Early discharge of patients with pulmonary embolism: a two‐phase observational study.Eur Respir J.2007;30:708–714.
- ,,, et al.Home treatment in pulmonary embolism.Thromb Res.2010;126:e1–e5.
- ,,.Acute pulmonary embolism: clinical outcomes in the International Cooperative Pulmonary Embolism Registry (ICOPER).Lancet.1999;353:1386–1389.
- ,,, et al.Thrombolysis compared with heparin for the initial treatment of pulmonary embolism: a meta‐analysis of the randomized controlled trials.Circulation.2004;110:744–749.
- ,,, et al.Predictors of survival after deep vein thrombosis and pulmonary embolism: a population‐based, cohort study.Arch Intern Med.1999;159:445–453.
Acute pulmonary embolism (PE) is associated with significant morbidity and mortality.1 While expeditious diagnosis and management results in reduced mortality, the ability to rapidly and accurately identify those at increased risk for death remains elusive. Multiple studies have utilized various biomarkers as risk stratification tools, however, these approaches have proven to have many limitations. For example, both serum brain natriuretic peptide (BNP) and troponin levels have been studied as possible risk stratification tools. Those with elevated levels of these following a PE may have concomitant right ventricular (RV) dysfunction and/or hemodynamic instability. Thus, they may face a greater risk for cardiovascular collapse and death. The low positive predictive value of these biomarkers (14%‐44%) has limited their clinical utility.24 Furthermore, imaging modalities, such as echocardiography, which is considered the clinical gold standard for determining the presence of acute RV dysfunction in PE, may not be readily available and may require special expertise for interpretation.5
Conversely, the need to identify acute PE patients at low risk for death is just as important. Recent studies suggest that carefully selected patients can successfully be managed as outpatients which can subsequently lead to significant cost savings and patient satisfaction. Movement towards enhanced outpatient resources and the advent of subcutaneous anticoagulants have made outpatient management of acute PE an appealing possibility. However, proper education, close follow‐up, and a rigorous selection process to recognize those at minimal risk for a fatal complication must all be available before clinicians prematurely discharge these patients to home.
Recently, clinical scoring tools have been developed to aid in risk stratifying patients with acute PE to accurately determine patient outcome. The pulmonary embolism severity index (PESI) is a reproducible scoring system that accurately predicts 30‐day and 90‐day mortality.6, 7 It consists of 11 clinical variables that can be quickly assessed at the time of diagnosis (Table 1A). The fact that biomarkers and imaging technology, such as echocardiography, are unnecessary to compute a PESI score demonstrates the appeal of this system. Similar to the PESI, Sanchez et al.8 have proposed the prognosis in pulmonary embolism (PREP) score as an alternate clinical risk tool in PE (Table 1B). Contrary to PESI, the PREP only uses 3 clinical variables to accurately predict vital outcome with an area under the receiver operating characteristic (AUROC) curve of 0.73 (95% confidence interval [CI], 0.65‐0.82). While both scoring systems have been developed to predict 30‐day mortality in acute PE, the comparative validity of these prognostic tools has not been assessed.
| Predictors | Points Assigned |
|---|---|
| |
| Demographic characteristics | |
| Age (yr) | Age (yr) |
| Male sex | +10 |
| Comorbid conditions | |
| Cancer | +30 |
| Heart failure | +10 |
| Chronic lung disease | +10 |
| Clinical findings | |
| Pulse 110 beats/min | +20 |
| Systolic blood pressure <100 mm Hg | +30 |
| Respiratory rate 30 breaths/min | +20 |
| Temperature <36C | +20 |
| Altered mental status* | +60 |
| Arterial oxygen saturation <90% | +20 |
| Prognostic Factor | Points Assigned |
|---|---|
| |
| Altered mental status* | +10 |
| Cardiogenic shock (systolic blood pressure <90 mm Hg) | +6 |
| Cancer | +6 |
We hypothesized that the PESI more precisely risk stratifies the risk for death in acute PE compared to the PREP. Furthermore, we theorized that the PESI more reliably predicts not only 30‐day but also 90‐day mortality. To test our hypothesis, we performed a retrospective analysis, of all consecutive patients diagnosed with acute PE at our hospital, to compare the prognostic accuracy of these 2 scoring systems.
METHODS
Subjects and Definitions
Between October 2007 and February 2009, adults (age 18 years) diagnosed the day prior with acute PE were identified on a daily basis. This study cohort has been described elsewhere.7 Patients with newly diagnosed PE were eligible for enrollment. Those expected to die within 30 days of their acute PE, such as individuals suffering from a terminal condition (metastatic cancer) or critical illness being transitioned to comfort care, were excluded (n = 32). Patients with multiple admissions for acute PE were included only during the first episode. PE was diagnosed using objective criteria through 1 of the following modalities: high probability ventilation‐perfusion (V/Q) scintigraphy, computed tomography (CT) of the chest with PE protocol, or magnetic resonance imaging (MRI) of the chest. A list of patients who had the above imaging studies to evaluate for PE was provided to study personnel daily by the radiology department; this list was generated every morning and consisted of the day prior's studies. Patient management was not influenced by the research team and was the responsibility of the primary team. This study was approved by our local institutional review board and consent was not required.
We calculated the PESI as described by Aujesky and colleagues.6 For outpatients admitted with acute PE, clinical findings available just prior to, and after, diagnosis were used for scoring. For inpatients diagnosed with PE, clinical findings available during the 24 hours just prior to diagnosis were included. Raw PESI scores were converted to risk class (I‐V), and then further dichotomized into low‐risk (class I‐II) and high‐risk (class III‐V) groups (Table 2). The PREP score was computed based on the presence of altered mental status (AMS), cancer, and cardiogenic shock defined as a systolic blood pressure <90 mm Hg (Table 1B). A raw PREP score of <7 was then characterized as low risk for mortality, while scores 7 were considered high risk.
| PESI Score | Class | n | 30‐Day Mortality by Class (%) | 90‐Day Mortality by Class (%) | Low vs High Risk |
|---|---|---|---|---|---|
| |||||
| 65 | I | 49 | 0 (0.0) | 0 (0.0) | Low |
| 66‐85 | II | 59 | 0 (0.0) | 0 (0.0) | |
| 86‐105 | III | 60 | 0 (0.0) | 0 (0.0) | High |
| 106‐125 | IV | 56 | 2 (3.4) | 4 (6.9) | |
| >125 | V | 69 | 7 (9.2) | 8 (10.5) | |
Finally, the PESI and PREP scores were compared based on their ability to predict all‐cause 30‐day and 90‐day mortality. To determine vital status and date of death, we reviewed the Social Security Death Index 90 days after enrollment of all subjects was completed.
Statistical Analysis
To assess the predictive ability of the 2 scoring tools for death, we determined the negative predictive value and computed the AUROC curves for both scoring systems. AUROC curves were constructed for raw scores and when scores were further segregated by class and risk groups. Additionally, 95% CIs were estimated to determine the accuracy of the discriminatory power of the PESI score versus the PREP score.
Post hoc, we calculated the power of our study to assess whether the difference noted in AUROC curves between the PESI and PREP was adequate to truly determine statistical significance. We used methodology described by Hanley and McNeil to compare continuous values.9 Assuming an alpha of 0.05 and a 20% difference in the AUROC curves, as described in our results, the power in our study was 0.35. Therefore, an approximate sample size of 1000 would be necessary to determine statistical significance. This analysis was performed using Power Analysis and Sample Size (PASS) 11.
RESULTS
The final cohort included 302 subjects (mean age: 59.7 17.2 years; 44.0% males). As Table 3 reveals, the majority of PEs was diagnosed via CT scan (76%). On presentation, 6.6% had cardiogenic shock, while 5.0% had altered censorium. In terms of comorbid conditions, 25.2% had congestive heart failure, 25.2% had cancer, and 22.2% had a prior venous thromboembolic event. Overall, 3.0% and 4.0% met our primary outcomes of death within 30‐days and 90‐days of their acute PEs, respectively.
| |
| Demographics | |
| Age (yr), mean SD | 59.7 17.2 |
| Male sex, % | 44% |
| Diagnostic methodology | |
| CT chest, n (%) | 230 (76.2) |
| V/Q scan, n (%) | 71 (23.5) |
| MRA chest, n (%) | 1 (0.3) |
| Comorbidities | |
| Malignancy, n (%) | 76 (25.2) |
| Congestive heart failure, n (%) | 76 (25.2) |
| Chronic lung disease, n (%) | 72 (23.8) |
| Recent orthopedic surgery, n (%) | 22 (7.3) |
| Prior cerebrovascular accident, n (%) | 31 (10.3) |
| Prior venous thromboembolic disease, n (%) | 67 (22.2) |
The rates of 30‐day and 90‐day mortality, respectively, increased with increasing score for both the PESI and the PREP. No patients in PESI class I died by either time point, while 9.2% of PESI class V subjects expired by 30 days (P < 0.0001) and 10.5% died by 90 days (P = 0.003) (Table 2). Based on PESI, 30‐day death rates were 4.6% in the high‐risk cohort versus 0% in the low‐risk group (P = 0.023). Conversely, 7.1% of high‐risk PREP subjects died by day 30 versus 1% of low‐risk subjects (P = 0.004) (Figure 1A). Those stratified into the PESI high‐risk group had a 90‐day mortality of 6.2% versus 0% for the low‐risk group (P = 0.008) versus 9.1% in those deemed high risk by PREP, as compared to 1.5% of those scored as low risk by PREP (P = 0.001) (Figure 1B).
Regarding the 30‐day mortality, the negative predictive value of the PESI was 100% (95% CI, 98.6%‐100%) while that for PREP was 99.0% (95% CI, 97.6%‐99.7%); the ability of the PREP to predict 30‐day mortality was similar to the PESI (Table 4). The AUROCs for PESI and PREP for predicting 30‐day death were also equivalent; for the raw PESI score, this measured 0.858 (95% CI, 0.773‐0.943), compared to 0.719 (95% CI, 0.563‐0.875) for PREP. When these scores were dichotomized to high‐risk versus low‐risk groups, the AUROC for the PESI was 0.684 (95% CI, 0.559‐0.810) and 0.732 (95% CI, 0.571‐0.893) for PREP.
| 30‐Day Mortality | 90‐Day Mortality | |||
|---|---|---|---|---|
| Scoring System | AUROC | 95% CI | AUROC | 95% CI |
| ||||
| Raw PESI | 0.858 | 0.773‐0.943 | 0.835 | 0.762‐0.907 |
| PESI class | 0.835 | 0.756‐0.914 | 0.813 | 0.738‐0.888 |
| PESI high vs low risk | 0.684 | 0.559‐0.810 | 0.686 | 0.576‐0.796 |
| Raw PREP | 0.719 | 0.563‐0.875 | 0.704 | 0.564‐0.844 |
| PREP high vs low risk | 0.732 | 0.571‐0.893 | 0.720 | 0.574‐0.865 |
In terms of 90‐day mortality, the negative predictive values of PESI and PREP did not change: 100% (95% CI, 97.4%‐100%) and 98.5% (95% CI, 96.9%‐99.5%), respectively. The ability of PESI and PREP as predictors of 90‐day mortality was equivalent (Table 4). Here, the AUROC for the raw PESI score remained excellent at 0.835 (97% CI, 0.762‐0.907). The AUROC for PREP was akin to that of PESI at 0.704 (95% CI, 0.564‐0.844). Segregating scores into high‐risk versus low‐risk groups demonstrated that the AUROC for PESI was 0.686 (95% CI, 0.576‐0.796) compared to 0.720 (95% CI, 0.574‐0.865) for PREP.
DISCUSSION
This retrospective analysis of patients with acute PE confirms that both the PESI and the PREP are accurate scoring tools for identifying patients at low risk of death. Under both rubrics, as the score increases, the likelihood of death also increases. More importantly, we demonstrate that the negative predictive value for both the PREP and PESI are excellent. Thus, these scoring tools can distinguish those at higher risk for death versus those at low risk in a simple‐to‐apply manner. In comparing these 2 scoring systems, the PREP comparably identifies acute PE patients at risk for death when contrasted with the PESI. Given the fewer required scoring points to calculate PREP and its ability to accurately predict clinically relevant outcomes, this simpler scoring system may have greater clinical utility.
Prior studies have validated the PESI as a risk stratification tool to predict 30‐day and 90‐day mortalities. In their original derivation of the PESI, Aujesky et al. demonstrated that higher PESI scores correlated with death at 30 days.6 Acute PE patients classified into risk class I had a short‐term mortality rate of 1.1% compared to nearly 25% of patients risk stratified into risk class V. The same authors subsequently verified that there is a linear relationship between PESI score and risk of death at 90 days.10 We have also confirmed the accuracy of the PESI for identifying persons at high risk for death and documented the limited interobserver variability in this tool.7 In combination, there is evidence that the PESI can accurately predict vital outcome. Despite the effectiveness of the PESI, it is a somewhat cumbersome scoring system. It requires gathering information on 11 clinical variables, each with a different score allocation to ultimately compute the PESI score. In contrast, the PREP only requires knowing 3 clinical variables: presence of cancer, mental status, and the presence of cardiogenic shock. Akin to the PESI, the PREP and mortality are linearly related, where higher PREP scores result in higher 30‐day and 90‐day mortalities.
Our analysis helps expand the evidence regarding clinical risk stratification in PE in several ways. First, we verify that both the PESI and PREP are accurate predictors of short‐term mortality. While this has been accomplished for the PESI in prior studies, to our knowledge, this is the first confirmatory study for PREP's utility as a risk stratification tool. Second, we demonstrate that PREP is also an accurate predictor of intermediate‐term mortality. If the eventual goal is to develop tools that allow for the initial outpatient management of acute PE, clinicians require data on longer‐term outcomes to ensure that later harms do not arise based on a decision to defer hospitalization. Prior observational studies and randomized controlled clinical trials have proven that appropriately selected individuals face similar rates of complications following acute PE, whether they are managed in or outside of a hospital setting.1116 The key limitation of these earlier efforts, though, was that there was no clear standardized approach to determining whom could be safely managed solely as an outpatient. Finally, our study is unique in that we compare the discriminatory power of these 2 risk‐scoring schemes and illustrate their equivalence. As a scoring system that only requires 3 variables, the PREP is easier and simpler, and may therefore have more clinical utility than the PESI. The high negative predictive value of the PREP suggests that it has potential in identifying patients with acute PE who can safely be managed on an outpatient basis. However, given the complexity of factors associated with the decision for early discharge, these scores should be used in conjunction with, and not supplant, clinical judgment for outpatient management. Of course, formal prospective management trials incorporating both the PREP and PESI are needed to validate this concept.
Why does PREP perform so well despite the fact that it focuses on so few clinical variables? Essentially, the PREP is an effective scoring tool for acute PE because of its ability to identify individuals at risk for progressing to shock. The presence of AMS in acute PE has been associated with a greater likelihood of death, as it likely arises as a consequence of severe shock or RV strain resulting in decreased cerebral blood flow. Alternatively, altered censorium could represent a manifestation of hypoxemia from significant V/Q mismatching and/or pulmonary shunting due to the obstructive clot. This, too, portends a poorer prognosis secondary to impending respiratory failure from hypoxemia. Thus, individuals with an acute PE presenting with altered mentation merit very close observation. Similarly, pending hemodynamic instability is a concerning manifestation that warrants inpatient monitoring.5, 17, 18 At the very minimum, these individuals have RV strain and should therefore be admitted to the hospital to potentially administer more aggressive treatment modalities (ie, thrombolytics or thrombectomy). The last clinical criteria involves the presence of malignancy. The presence of a cancer may serve as a surrogate marker for those at increased risk for early recurrent thromboembolic phenomena, since malignancy is associated with a hypercoagulable state.17, 19 Perhaps there is a threshold whereby accumulating clot resulting in RV strain ensues with subsequent poorer outcomes. Thus, it clinically and physiologically seems logical that, in the absence of any of these findings, patients with acute PE will have lower mortality rates.
Thus far, other methods used for risk stratification may either be expensive, not really obtainable, or not routinely available at the time of presentation. For example, confirmation of RV strain with an echocardiogram requires a skilled technician and interpreter. In contrast, both the PESI and PREP are scored based on multiple clinical findings. Hence, they are not dependent upon a single test to determine outcome, but on various clinical variables making these scoring tools comprehensive, simple, and reliable approaches of recognizing low‐risk patients.
Our analysis has several limitations. First, the retrospective nature of this analysis subjects it to multiple forms of bias. We attempted to eliminate these biases by defining, a priori, the time frame from which vital signs can be used during scoring. We also used all‐cause mortality as our primary endpoint to minimize the possibility of ascertainment bias. However, this type of bias could not be completely eliminated since data collected was not specifically for the purpose of this study. Second, this single‐center study may limit the generalizability of these findings; yet, the diversity of patients admitted to this 900‐bed, tertiary care facility, as well as the inclusion of both inpatients and outpatients, helps to mitigate this concern. Third, the exclusion of individuals with expectant deaths within <30 days limits the applicability of these findings to this group. We chose to exclude persons with anticipated short‐term mortality to reduce the tally of patients who did not receive therapeutic treatment (ie, those transitioned to comfort care). Fourth, the use of the Social Security Death Index objectively determines death status for all‐cause mortality but cannot delineate cause‐specific death. Consequently, death strictly due to PE could not be assessed. Fifth, the original investigators for PREP assessed the PREP score with and without BNP and left‐to‐right ventricular diameter ratios. Although their results demonstrated similar AUROCs for the PREP score with and without BNP to predict 30‐day outcomes, this was a finding we could not confirm due to inconsistencies in measuring BNP and echocardiograms in our cohort. Also, our post hoc power analysis demonstrates that our findings may be limited by sample size. The lack of statistically significant differences between the PESI and the PREP may, in fact, be due to the small sample size versus true effect. Finally, tolerance for medical therapy and compliance with treatment were not documented and, therefore, were immeasurable. Poor compliance to anticoagulants or intolerability increases risk for recurrent PE, while excessive anticoagulation increases likelihood of bleeding.
In summary, the PREP and PESI can both safely predict 30‐day and 90‐day outcomes. However, the simplicity of the PREP renders it more clinician friendly. The fact that only 3 clinical noninvasive variables are required would ultimately make it the preferred bedside tool to risk stratify patients for acute PE. The high negative predictive value and comparable AUROCs establishes the effectiveness of these 2 scoring systems in recognizing low‐risk patients. Irrespective of the clinician's choice to use 1 tool over the other, both have potential for clinical application at the bedside and in clinical trials. Nevertheless, further evidence is required before they are utilized to triage patients for outpatient therapy.
- .Pulmonary embolism: what have we learned since Virchow? Natural history, pathophysiology, and diagnosis.Chest.2002;122:1440–1456.
- ,,, et al.The incidence and prognostic significance of elevated cardiac troponins in patients with submassive pulmonary embolism.J Thromb Haemost.2005;3:508–513.
- ,,, et al.Biomarker‐based risk assessment model in acute pulmonary embolism.Eur Heart J.2005;26:2166–2172.
- ,.Cardiac biomarkers for risk stratification of patients with acute pulmonary embolism.Circulation.2003;108:2191–2194.
- ,,, et al.Prognostic role of echocardiography among patients with acute pulmonary embolism and a systolic arterial pressure of 90 mm Hg or higher.Arch Intern Med.2005;165:1777–1781.
- ,,, et al.Derivation and validation of a prognostic model for pulmonary embolism.Am J Respir Crit Care Med.2005;172:1041–1046.
- ,,.The validation and reproducibility of the pulmonary embolism severity index.J Thromb Haemost.2010;8:1509–1514.
- ,,, et al.Prognostic factors for pulmonary embolism: the prep study, a prospective multicenter cohort study.Am J Respir Crit Care Med.2010;181:168–173.
- ,.A method of comparing the areas under receiver operating characteristic curves derived from the same cases.Radiology.1983;148:839–843.
- ,,, et al.Prospective validation of the pulmonary embolism severity index. A clinical prognostic model for pulmonary embolism.Thromb Haemost.2008;100:943–948.
- ,,, et al.Expanding eligibility for outpatient treatment of deep venous thrombosis and pulmonary embolism with low‐molecular‐weight heparin: a comparison of patient self‐injection with homecare injection.Arch Intern Med.1998;158:1809–1812.
- ,,, et al.Outpatient treatment of pulmonary embolism with dalteparin.Thromb Haemost.2000;83:209–211.
- ,,, et al.Outpatient treatment of pulmonary embolism is feasible and safe in a substantial proportion of patients.J Thromb Haemost.2003;1:186–187.
- ,,, et al.A randomized trial comparing 2 low‐molecular‐weight heparins for the outpatient treatment of deep vein thrombosis and pulmonary embolism.Arch Intern Med.2005;165:733–738.
- ,,, et al.Early discharge of patients with pulmonary embolism: a two‐phase observational study.Eur Respir J.2007;30:708–714.
- ,,, et al.Home treatment in pulmonary embolism.Thromb Res.2010;126:e1–e5.
- ,,.Acute pulmonary embolism: clinical outcomes in the International Cooperative Pulmonary Embolism Registry (ICOPER).Lancet.1999;353:1386–1389.
- ,,, et al.Thrombolysis compared with heparin for the initial treatment of pulmonary embolism: a meta‐analysis of the randomized controlled trials.Circulation.2004;110:744–749.
- ,,, et al.Predictors of survival after deep vein thrombosis and pulmonary embolism: a population‐based, cohort study.Arch Intern Med.1999;159:445–453.
Copyright © 2011 Society of Hospital Medicine

Severe AH Among Inpatients From the ED
Chronic hypertension affects 32% of adults in the United States.1 Each year, over 20 million emergency department visits involve hypertension.2 While many studies describe the epidemiology and outcomes of chronic hypertension, less is known about severe acute hypertension (AH). Often classified as either hypertensive urgency or emergency, it receives little attention in national treatment guidelines.3 There is a limited understanding of the epidemiology of, and the relationship between, this syndrome and patient outcomes among hospitalized patients. One registry study suggested that severe AH was associated with high rates of new organ damage, need for treatment in the intensive care unit, and a 90‐day readmission rate of 10%.4 This investigation, however, lacked generalizability, because it only enrolled subjects requiring therapy with an intravenous antihypertensive agent and did not provide information on the prevalence of severe AH. Qureshi et al.5 analyzed information in a more representative sample from the national hospital ambulatory care survey, however, the only outcome examined was the correlation between acute blood pressure and stroke. Studies focusing on a selected patient population may be of limited value to hospitalists, because they are commonly required to treat a range of patients presenting to the hospital.
In light of severe syndromes that may be associated with, or complicated by, severe AH presented early during acute care, hospitalists require a better understanding of the prevalence and the relationship between severe AH and attendant mortality and morbidity. In addition, an assessment of the association of severe AH on the need for intensive care unit (ICU) admission and mechanical ventilation (MV) may aid the initial treatment assessments and triage decisions required of hospitalists.
Our objective was to describe the prevalence and implications of severe AH present at the time of evaluation in the ED among patients eventually hospitalized, using clinical data collected on all consecutive admissions across a range of clinical conditions. We sought to determine the independent contribution, if any, of severe AH to hospital mortality, need for MV on admission, as well as hospital length of stay (LOS).
METHODS
Study Design and Setting
This was a retrospective analysis of adults admitted to 114 acute‐care hospitals in the United States from 2005 through 2007. The New England Institutional Review Board/Human Subjects Research Committee (Wellesley, MA) reviewed and approved this study. It was conducted in compliance with the Health Insurance Portability and Accountability Act (HIPAA).
Data
Data were obtained from one of the Clinical Research Databases from CareFusion (formerly Cardinal Health [CareFusion Clinical Research Services, Marlborough, MA]).613 The database contains electronically imported or manually extracted demographic, clinical (eg, comorbidities, vital signs, laboratory values, other clinical findings), and administrative data (eg, diagnosis, procedures, and length of hospitalization). All vital signs were manually extracted, including the highest and the lowest ED systolic blood pressure (SBP) measurements during the ED stay, but before inpatient admission. Patients admitted for childbirth or mental health reasons were not included.
Patients
Our main analysis focused on patients whose highest and lowest SBP were collected in the ED. These patients accounted for approximately 90% of all inpatients admitted through the ED. For the approximately 9% of patients who had only 1 SBP collected, we conducted a sensitivity analysis by both including and excluding them in the main analysis to determine if the absence of a second SBP measurement altered our findings. Patients were grouped into 1 of the following 8 mutually exclusive strata based on the maximum SBP (mmHg) in the ED: <100, 101‐139, 140‐180, 181‐190, 191‐200, 201‐210, 211‐220, and >220.
Measures
The primary exposure of interest was the prevalence of severe AH, defined as at least 1 SBP measurement recorded in the ED in excess of 180 mmHg. Outcome measures included in‐hospital mortality, need for MV on admission day (defined by International Classification of Diseases, 9th revision, Clinical Modification [ICD‐9‐CM] procedure codes of 96.70, 96.71, and 96.72), and LOS. We stratified these outcomes for each inpatient admission according to 1 of 112 mutually exclusive groups of principal diagnoses (see Supporting Appendix A in the online version of this article). To simplify the presentations, we pooled the groups into 9 major disease categories based on organ systems.
Primary Data Analysis
All statistical analyses were performed using Statistical Analysis Software (SAS version 9.01; SAS Institute Inc, Cary, NC). For evaluating trending, we used the Cochran‐Armitage test for dichotomous variables (mortality and MV), and linear regression for continuous variable (LOS). We employed a logistic regression model to estimate risk of mortality and need for MV on admission. We used linear regression models to estimate the LOS associated with severe AH. We modeled each outcome as a function of patient disease severity and SBP strata. Because patients with the most severe AH tended to have higher mortality early in hospitalization, our analysis of LOS was limited to patients who survived index hospitalization.
The original disease‐specific risk‐adjustment models accounting for patient‐level confounding risk factors, including demographics, physiologic presentation on admission (vital signs, altered mental status, and laboratory findings), and chronic conditions, were previously developed and validated.12, 13 We recalibrated each of the 112 models, for the current study cohort, using the logit of predicted probability of death generated from the mortality risk‐adjustment model as a propensity score of disease severity. Using this propensity score as an aggregate severity adjuster, we refit 9 logistic regression models (1 for each major disease category) to estimate the odds ratios for mortality or need for MV for each of the 7 SBP strata in the regression models with 101‐139 mmHg as the reference group. To estimate the attributable LOS (if any) of severe AH among survivors, we fit the 9 LOS models using log transformed LOS (to normalize the potentially skewed distribution of LOS) as the outcome, controlling for disease severity. The attributable LOS and 95% confidence intervals (CI) were estimated from 1000 bootstrap iterations, with the median as the parameter estimate and 2.5th and 97.5th percentile as 95% CI.14, 15
Sensitivity Analysis
To address potential bias of LOS associated with inpatient mortality, we refit 9 LOS models, including both patients who died and those who survived the index hospitalization. The models adjusted for disease severity, mortality, and the interaction of severity and mortality. Because patients with only 1 SBP recorded at ED may be different from those with more than 1 SBP recorded, we conducted analysis by adding these patients in the study cohort to examine the potential change of overall prevalence of AH and associated mortality for the study population.
To address the potential for a center‐specific effect on outcomes, we refit all the models using a mixed model approach.16 The mixed model accounts for both patient‐level risk factors and hospital‐specific effects on the observed outcomes.
RESULTS
Patient Characteristics
The study cohort was comprised of 1,290,804 adults who were admitted through the ED, from 2005 through 2007, and whose highest and lowest SBP measurements were collected in the ED. Median age was 69 years (interquartile range, 53‐81) for the overall population. Median age was 74 (interquartile range, 60‐83) for patients with severe AH (Table 1). Hospital mortality was 3.6% (n = 46,033), with 6119 (13.3%) having severe AH.
| Characteristic | Prevalence, n (Column %) | Severe Acute Hypertension, n (Row %) |
|---|---|---|
| Total number of discharges | 1,290,804 (100.0) | 178,197 (13.8) |
| Mortality | 46,033 (3.6) | 6,119 (13.3) |
| Live discharges | 1,244,771 (96.4) | 172,078 (13.8) |
| Mechanical ventilation on admission | 39,238 (3.0) | 9,508 (24.2) |
| Demographics | ||
| Age, median (1st, 3rd quartiles) | 69 (53, 81) | 74 (60, 83) |
| Male | 587,553 (45.5) | 71,085 (12.1) |
| Female | 703,244 (54.5) | 107,109 (15.2) |
| Race | ||
| White | 949,869 (73.6) | 121,930 (12.8) |
| Black | 220,601 (17.1) | 39,667 (18.0) |
| Other | 120,334 (9.3) | 16,600 (13.8) |
| Insurance | ||
| Medicare | 668,420 (51.8) | 105,078 (15.7) |
| Medicaid | 108,538 (8.4) | 12,259 (11.3) |
| Commercial | 163,858 (12.7) | 18,669 (11.4) |
| Other | 349,988 (27.1) | 42,191 (12.1) |
| Disease system by the principal diagnosis | ||
| Nervous system | 76,744 (5.9) | 22,270 (29.0) |
| Respiratory system | 222,329 (17.2) | 24,678 (11.1) |
| Circulatory system | 416,847 (32.3) | 66,852 (16.0) |
| Digestive system | 186,282 (14.4) | 17,817 (9.6) |
| Hepatobiliary/pancreas system | 52,293 (4.1) | 5,664 (10.8) |
| Endocrine system | 45,050 (3.5) | 6,625 (14.7) |
| Kidney/urinary system | 81,782 (6.3) | 11,050 (13.5) |
| Infectious diseases | 60,353 (4.7) | 4,162 (6.9) |
| Other | 149,124 (11.6) | 19,079 (12.8) |
| Comorbidity by secondary diagnoses | ||
| Hypertension | 729,417 (56.5) | 135,498 (18.6) |
| Fluid and electrolyte disorders | 306,666 (23.8) | 37,836 (12.3) |
| Diabetes without chronic complications | 286,912 (22.2) | 47,979 (16.7) |
| Chronic pulmonary disease | 283,895 (22.0) | 35,977 (12.7) |
| Congestive heart failure | 213,523 (16.5) | 33,956 (15.9) |
| Deficiency anemias | 210,230 (16.3) | 30,266 (14.4) |
| Renal failure | 159,409 (12.3) | 31,984 (20.1) |
| Hypothyroidism | 153,911 (11.9) | 22,441 (14.6) |
| Valvular disease | 140,820 (10.9) | 21,453 (15.2) |
| Depression | 137,259 (10.6) | 16,886 (12.3) |
| Other neurological disorders | 126,954 (9.8) | 19,103 (15.0) |
| Peripheral vascular disease | 88,321 (6.8) | 16,180 (18.3) |
| Obesity | 84,000 (6.5) | 12,351 (14.7) |
| Diabetes with chronic complications | 65,989 (5.1) | 13,093 (19.8) |
| Psychoses | 54,769 (4.2) | 5,555 (10.1) |
| Alcohol abuse | 51,765 (4.0) | 6,014 (11.6) |
| Pulmonary circulation disease | 49,248 (3.8) | 7,128 (14.5) |
| Coagulopathy | 43,584 (3.4) | 4,339 (10.0) |
| Paralysis | 42,128 (3.3) | 8,125 (19.3) |
| Drug abuse | 36,134 (2.8) | 4,779 (13.2) |
| Liver disease | 36,094 (2.8) | 3,218 (8.9) |
| Weight loss | 35,795 (2.8) | 3,726 (10.4) |
| Metastatic cancer | 33,517 (2.6) | 2,498 (7.5) |
| Rheumatoid arthritis | 32,545 (2.5) | 4,300 (13.2) |
| Solid tumor without metastasis | 30,677 (2.4) | 3,035 (9.9) |
| Chronic blood loss anemia | 25,416 (2.0) | 2,268 (8.9) |
| Lymphoma | 9,972 (0.8) | 871 (8.7) |
| Acquired immune deficiency syndrome | 3,048 (0.2) | 307 (10.1) |
| Peptic ulcer disease | 915 (0.1) | 131 (14.3) |
| Discharges by hospital characteristics | ||
| Teaching status | ||
| Teaching hospitals | 899,786 (69.7) | 127,512 (14.2) |
| Nonteaching hospitals | 391,018 (30.3) | 50,685 (13.0) |
| Urban status | ||
| Urban hospitals | 1,164,802 (90.2) | 162,399 (13.9) |
| Rural hospitals | 126,002 (9.8) | 15,798 (12.5) |
| Bed size | ||
| Beds <100 | 36,624 (2.8) | 4,965 (13.6) |
| Beds 100‐300 | 623,327 (48.3) | 80,156 (12.9) |
| Beds >300 | 630,853 (48.9) | 93,076 (14.8) |
Prevalence of Acute Hypertension
A total of 763,634 (59.2%) patients had at least 1 SBP measurement of 140 mmHg during the ED stay, including 178,197 (13.8%) with SBP >180 mmHg. Body systems associated with the highest prevalence of severe AH (SBP >180 mmHg) were nervous (29.0%), circulatory (16.0%), endocrine (14.7%), and kidney/urinary (13.5%) (Figure 1 presents the data in graphic form; Supporting Appendix B, in the online version of this article, presents corresponding data in table form).
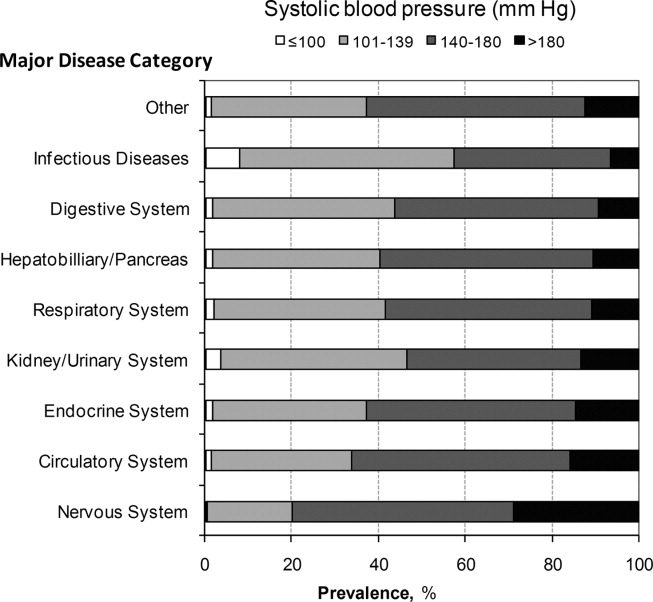
Mortality
Univariable analysis revealed a graded relationship between SBP stratum and mortality risk (Figure 2a; and see Supporting Appendix C in the online version of this article). This relationship was most pronounced for nervous system diseases; mortality rates for each 10 mmHg increase in SBP from 180 to >220 mmHg were 6.5%, 8.1%, 10.0%, 12.0%, and 19.7%, respectively (trending P < 0.0001). The risk‐adjusted increase in mortality odds ratio ranged from 1.04 (95% CI: 0.89, 1.21) to 1.44 (95% CI: 1.25, 1.67) for patients in the severe AH strata compared to patients with SBP of 101 to 139 mmHg (Figure 3). Severe AH was not an independent mortality predictor in other disease categories.
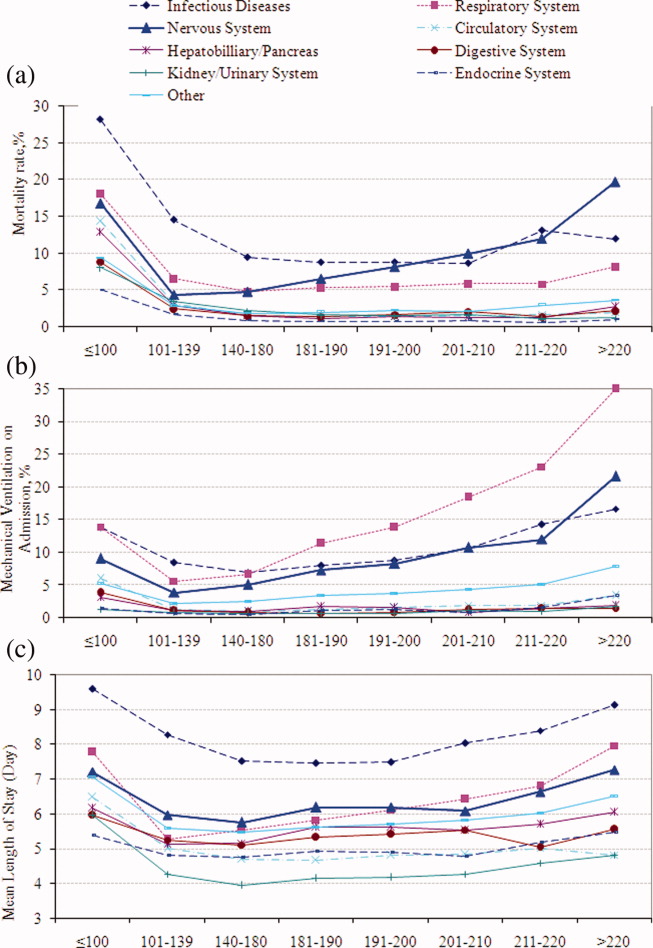
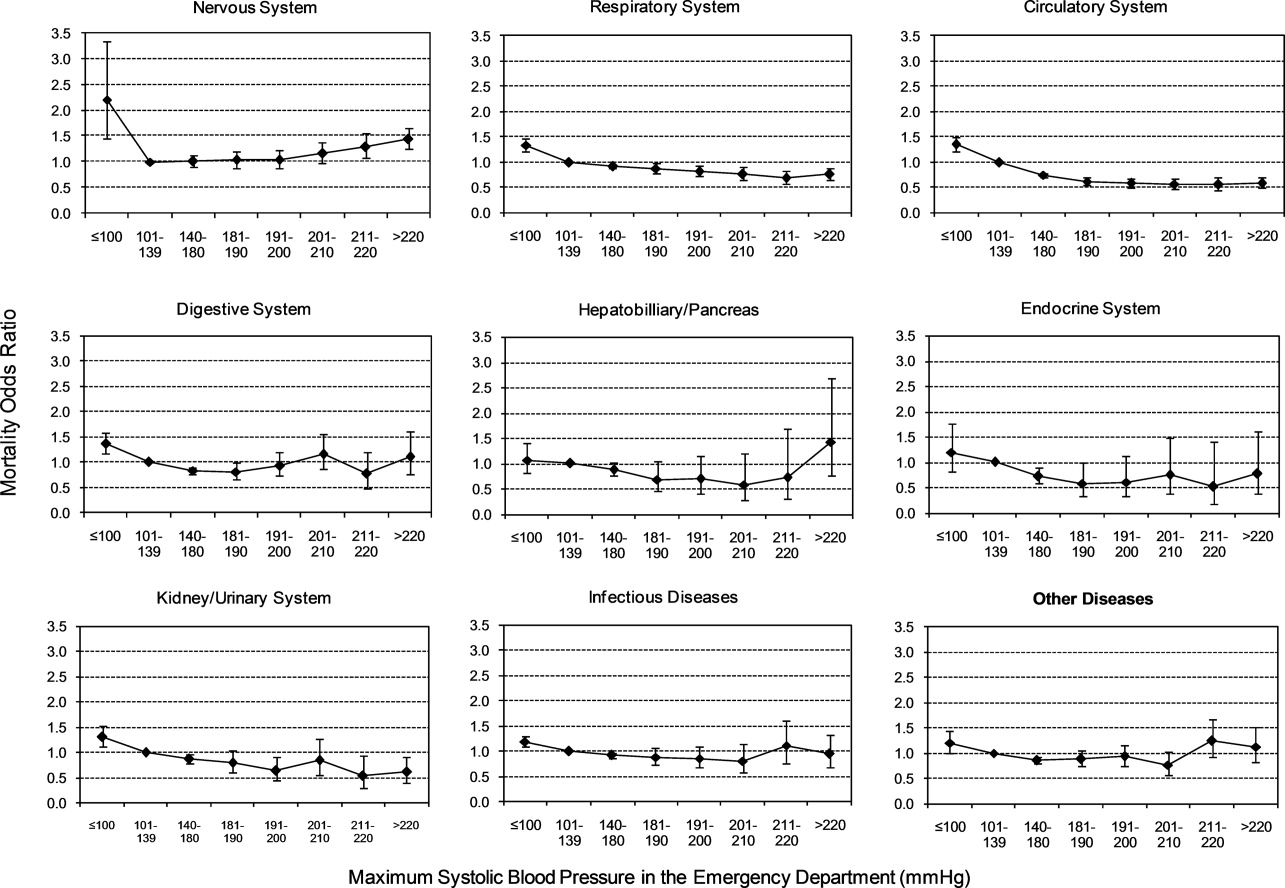
Mechanical Ventilation on Admission
Univariable analysis revealed a graded relationship between severe AH and a need for MV on admission, especially for respiratory, circulatory, and infectious conditions (trending P < 0.0001) (Figure 2b; and see Supporting Appendix C in the online version of this article). In the multivariable analysis, there was a relationship between severe AH stratum and adjusted risk for MV on admission across nearly all disease categories (Figure 4).
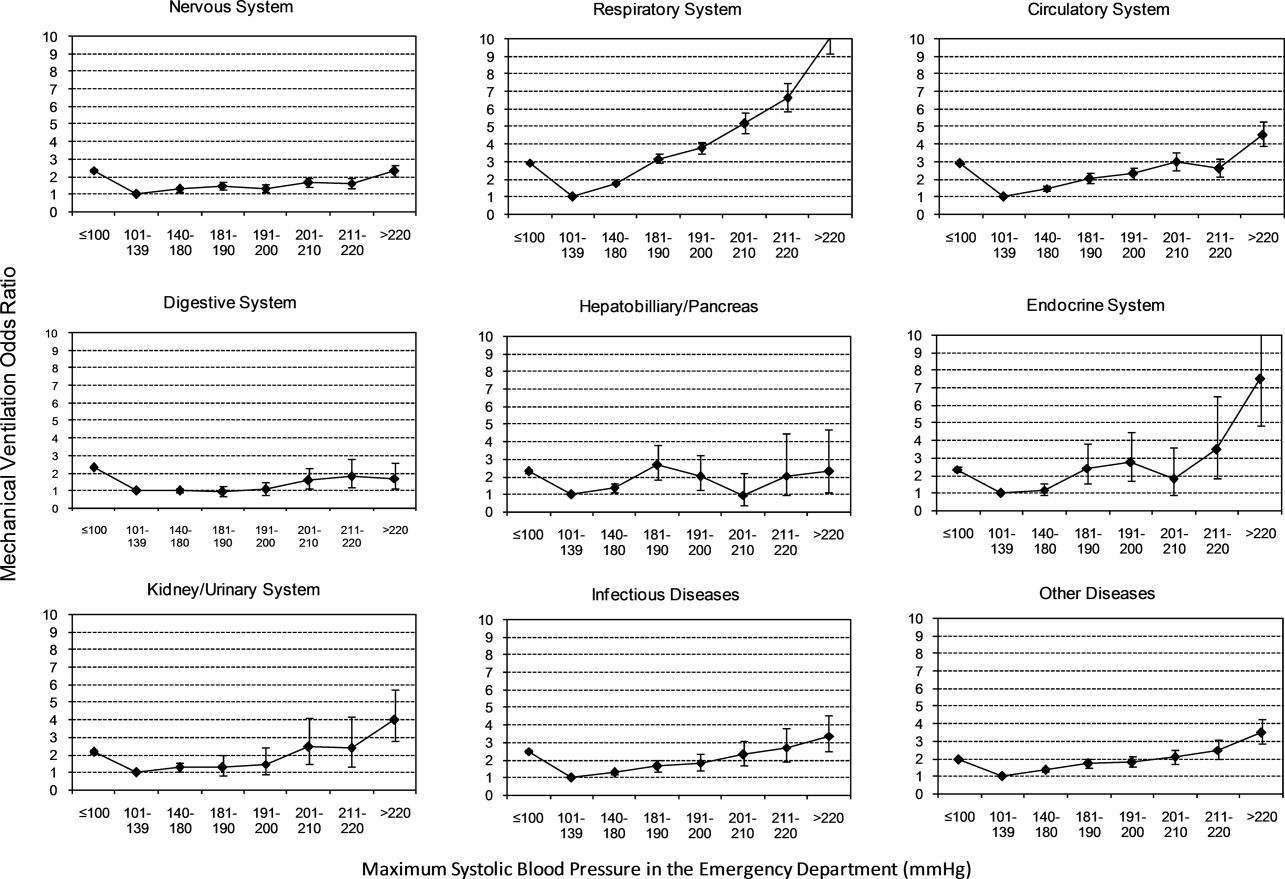
Length of Stay
Univariable analysis revealed a graded relationship between severe AH strata and LOS for nearly all disease categories in survivors (trending P < 0.0001), except for digestive, kidney, and infectious diseases (Figure 2c; and see Supporting Appendix C in the online version of this article). For patients with nervous system diseases, the unadjusted LOS for each 10 mmHg increase in SBP from 180 to >220 was 5.8, 6.1, 6.4, 6.8, and 8.0 days, respectively (trending P < 0.0001). The relationship was similar for other disease categories which showed significant trending.
In the multivariable analysis, the relationship between severe AH strata and adjusted attributable LOS was graded across most disease categories, especially nervous, circulatory, and hepatobiliary diseases (Figure 5). The total adjusted number of hospital days attributable to severe AH was 0.43 days per case for all survivors with severe AH.
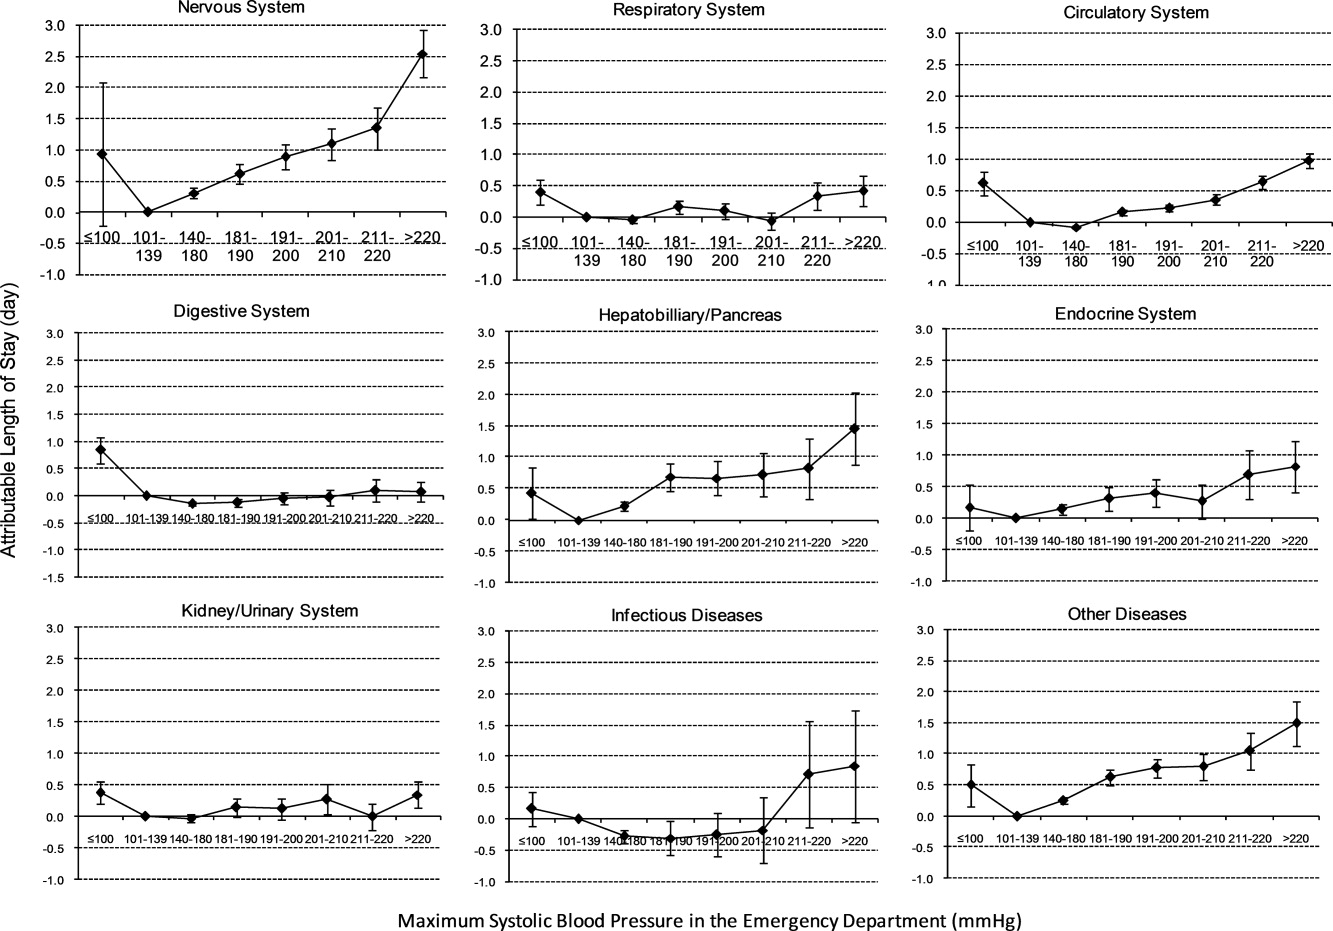
Sensitivity Analysis
Our sensitivity analysis of the LOS estimate, including those patients who died in the hospital, yielded similar findings in attributable LOS due to severe AH. In addition, when we added patients with only 1 SBP documented in the ED to the study cohort, the severe AH prevalence changed negligibly from 13.8% to 13.0%, and the associated mortality remained unchanged at 3.4%. Models using the mix model approach, which take into account hospital‐specific effects, showed similar results.
DISCUSSION
This large‐scale analysis demonstrated that severe AH was present in 13.8% of inpatients admitted through the ED. The prevalence of severe AH varied based on the primary reason for an acute care admission, ranging from 7% in infectious syndromes to nearly 30% in acute neurologic processes. Specific to patients with neurologic disease, initial severe blood pressure elevations independently correlated with mortality. Severe blood pressure elevations at ED were independently associated with an increased need for MV on admission and a prolonged LOS across a range of disease states.
Prior work on hypertension at admission has generally included single‐center analyses or only focused on patients with specific admitting diagnoses. For example, in a single ED analysis, Tilman et al.17 reported that 16% of 10,000 patients presented with elevated blood pressure (140/90 mmHg). In a multicenter review of 7000 persons, Karras et al.18, 19 described 423 patients with severe AH (180/110 mmHg) who comprised 6% of patients seen in the ED during a 1‐week period. Qureshi et al.5 noted severe AH in 13% of patients with acute stroke. While other ED‐based studies examined all ED patients, including those admitted and discharged from the ED, our study focused on those requiring hospitalization. This disparity in illness severity may, in part, explain the higher prevalence of severe AH we noted relative to others.
We further found that the prevalence of severe AH varied based on admitting diagnosis. This difference in prevalence rates by condition seems clinically plausible. Recognition of this pattern may prove valuable to hospitalists who, by the nature of their responsibilities, will encounter a broad range of patients. Because our data were derived from the largest analysis of blood pressure assessments for ED patients who were eventually hospitalized, and encompassed a multiplicity of hospitals, our findings are likely generalizable. Moreover, our large sample size enabled us to examine severe AH at each 10 mmHg increment across a variety of disease states, rather than restricting our analysis to 1 admitting diagnosis.
The independent relationship between severe blood pressure elevation and mortality was detected only in those with neurologic conditions. Incremental increases in SBP beyond 180 mmHg were associated with a stepwise escalation in the risk for death. Although recognition of the importance of blood pressure management in both ischemic and hemorrhagic stroke remains a cornerstone of therapy for these diseases, the stepwise relationship between escalating blood pressure and outcome suggests that further study is needed to determine the optimal management of severe AH among these patients. This relationship, along with the independent association between severe AH at presentation and the need for MV, underscores the importance of severe AH in critical care, representing a major challenge for intensivists and hospitalists, particularly those who practice in neurologic ICUs.
The independent association of severe AH and prolonged LOS represents a novel finding. Few reports have correlated the initial blood pressure with measures of resource use. Katz et al.4 found a median LOS of 6 days among 1000 patients who presented with severe AH and end organ dysfunction in 25 US hospitals. These investigators, however, did not explore the incremental independent contribution of initial blood pressure to LOS. Biologically, severe hypertension may exacerbate both acute and chronic conditions, thus complicating their management and resulting in longer hospitalizations.
Our analysis has limitations. While exposure misclassification is a potential concern, unlike other population‐based studies that use ICD‐9‐CM codes to identify AH cases, we relied on actual measures of blood pressure to identify subjects, thus minimizing this threat to validity. Similarly, since our end pointsmortality, MV on admission, and LOSwere also objective measures, the probability of their misclassification is minimal.
Another concerning contributor to exposure misclassification is the possibility that, in some instances, the initial elevation in BP meeting the inclusion criteria in our study cohort does not reflect the true BP. Indeed, a substantial body of research about BP measurement in the ED suggests that we may have included some persons who likely did not have AH. For example, Pitts and Adams described a regression to the mean phenomenon, with serial BP measurements in the ED, wherein the BP fell by approximately 11 mmHg over 4 hours.20 Baumann and colleagues reported a similar pattern.21 However, the findings of these 2 analyses do not necessarily apply to our study population; we focused on patients admitted to the hospital with an acute condition, while Pitts and Adams20 and Baumann et al.21 examined all ED patients. This distinction is crucial in that patients not admitted are likely less severely ill and systematically different from those who do merit hospitalization. Moreover, both Pitts and Adams20 and Cienki et al.22 observed that the regression to the mean and fall in serial BP measurements were less pronounced in those with the most extensive BP elevations. In our study, we found the strongest relationship between adverse outcomes and BP in patients with the most extreme BP elevations. Thus, misclassification is perhaps less likely to be an issue for these subjects.
In addition, misclassification may result when initially elevated BP simply represents the impact of untreated pain or anxiety in ED patients. However, Backer et al.23 and Tanabe and colleagues24 specifically explored the impact of pain and anxiety on BP in ED subjects, and neither group found a correlation between BP and either acute pain and/or anxiety scores. Our difficulties with case definitions and BP measurements for severe AH demonstrate the need for the creation and adoption of a formal, systematic approach to this syndrome, along with the need for prospective analyses to confirm our findings.
Selection bias represents a second potential threat to validity in our observational study, although this bias is mitigated by including all consecutive acute inpatient admissions to the participating hospitals. Furthermore, inclusion of the 9% of patients who had only 1 ED measurement of SBP collected did not alter the estimate of severe AH prevalence or associated outcomes.
Third, confounding may introduce the potential for false associations derived from observational data. The large sample size of our cohort allowed us to address this concern by adjusting for a large array of confounders. In addition, unlike other large‐scale population‐based studies which typically rely on administrative ICD‐9‐CM codes for risk adjustment, our analysis incorporated actual physiologic and laboratory results measured on admission, as well as a validated severity‐of‐illness scoring system for risk adjustment.12, 13
Although both SBP and diastolic blood pressure (DBP) thresholds are included in traditional definitions of hypertension, selecting SBP as the primary measure is reasonable because SBP >180 mmHg is a more important risk factor for cardiovascular disease than elevated DBP.25 Previous studies reported the relationship between the trend of SBP over time and clinical outcomes,26, 27 but we were not able to investigate the relationship of SBP trend and outcomes because the BP measurements in the our study were not collected in predefined intervals.
It would be ideal if serial blood pressure measures were to be collected at pre‐specified intervals and if more sophisticated schemas were to be used to refine the AH definition. This type of study may be possible in the future when vital signs can be collected automatically with advanced technology. Likewise, electronically captured treatment data could further help researchers to study the impact of process‐of‐care variables, including medications and other management strategies, in relation to outcomes. Finally, outpatient management of chronic hypertension is an integral part of clinical management. Unfortunately, these types of data are not available in our existing database. These limitations notwithstanding, an in‐depth understanding of the association between severe AH and potential adverse clinical and economic outcomes may direct further research in this field.
CONCLUSION
Severe AH appears common and its prevalence varies by underlying clinical condition in patients admitted from the ED. In those with acute neurologic syndromes, the degree of blood pressure elevation correlated with mortality, need for MV, and longer LOS. For many other conditions, elevation of blood pressure appeared to be linked to an increased need for MV and a prolongation in LOS. Future studies are needed to examine the potential impact of both 1) improved long‐term outpatient BP management, and 2) optimal management of severe AH upon admission on improving outcomes of patients hospitalized from the ED with severe AH.
- Health, United States, 2010.Hyattsville, MD:Centers for Disease Control and Prevention, National Center for Health Statistics;2011.
- Agency for Healthcare Research and Quality.Healthcare Cost and Utilization Project (HCUP).Rockville, MD:US Department of Health 289(19):2560–2572.
- ,,, et al.Practice patterns, outcomes, and end‐organ dysfunction for patients with acute severe hypertension: the Studying the Treatment of Acute hyperTension (STAT) registry.Am Heart J.2009;158(4):599–606.e1.
- ,,, et al.Prevalence of elevated blood pressure in 563,704 adult patients with stroke presenting to the ED in the United States.Am J Emerg Med.2007;25(1):32–38.
- ,,, et al.A prediction rule to identify low‐risk patients with community‐acquired pneumonia.N Engl J Med.1997;336(4):243–250.
- ,.A clinical assessment of MedisGroups.JAMA.1988;260(21):3159–3163.
- ,,,,,.Healthcare‐associated bloodstream infection: a distinct entity? Insights from a large U.S. database.Crit Care Med.2006;34(10):2588–2595.
- ,,,,,.Epidemiology and outcomes of health‐care‐associated pneumonia: results from a large US database of culture‐positive pneumonia.Chest.2005;128(6):3854–3862.
- ,,,,,.Morbidity and cost burden of methicillin‐resistant Staphylococcus aureus in early onset ventilator‐associated pneumonia.Crit Care.2006;10(3):R97.
- ,,,,.Evaluation of the complication rate as a measure of quality of care in coronary artery bypass graft surgery.JAMA.1995;274(4):317–323.
- ,,.Using automated clinical data for risk adjustment: development and validation of six disease‐specific mortality predictive models for pay‐for‐performance.Med Care.2007;45(8):789–805.
- ,,,,.Development and validation of a disease‐specific risk adjustment system using automated clinical data.Health Service Research.2010;45:1815–1835.
- ,.Estimating marginal and incremental effects on health outcomes using flexible link and variance function models.Biostatistics.2005;6(1):93–109.
- ,.An Introduction to the Bootstrap.London, England:Chapman 1993.
- ,.Applied Mixed Models in Medicine.2nd ed.Chichester, England:Wiley;2006.
- ,,,,,.Recognizing asymptomatic elevated blood pressure in ED patients: how good (bad) are we?Am J Emerg Med.2007;25(3):313–317.
- ,,, et al.Evaluation and treatment of patients with severely elevated blood pressure in academic emergency departments: a multicenter study.Ann Emerg Med.2006;47(3):230–236.
- ,,, et al.Elevated blood pressure in urban emergency department patients.Acad Emerg Med.2005;12(9):835–843.
- ,.Emergency department hypertension and regression to the mean.Ann Emerg Med.1998;31(2):214–218.
- ,,,.Differing prevalence estimates of elevated blood pressure in ED patients using 4 methods of categorization.Am J Emerg Med.2008;26(5):561–565.
- ,,.The validity of emergency department triage blood pressure measurements.Acad Emerg Med.2004;11(3):237–243.
- ,,.Reproducibility of increased blood pressure during an emergency department or urgent care visit.Ann Emerg Med.2003;41(4):507–512.
- ,,,,,.Increased blood pressure in the emergency department: pain, anxiety, or undiagnosed hypertension?Ann Emerg Med.2008;51(3):221–229.
- ,,.Clinical Advisory Statement. Importance of systolic blood pressure in older Americans.Hypertension.2000;35(5):1021–1024.
- ,,,.High blood pressure in early acute stroke: a sign of a poor outcome?J Hypertens.2006;24(2):381–386.
- ,,,,.Blood pressure as an independent prognostic factor in acute ischemic stroke.Can J Neurol Sci.2006;33(1):34–38.
Chronic hypertension affects 32% of adults in the United States.1 Each year, over 20 million emergency department visits involve hypertension.2 While many studies describe the epidemiology and outcomes of chronic hypertension, less is known about severe acute hypertension (AH). Often classified as either hypertensive urgency or emergency, it receives little attention in national treatment guidelines.3 There is a limited understanding of the epidemiology of, and the relationship between, this syndrome and patient outcomes among hospitalized patients. One registry study suggested that severe AH was associated with high rates of new organ damage, need for treatment in the intensive care unit, and a 90‐day readmission rate of 10%.4 This investigation, however, lacked generalizability, because it only enrolled subjects requiring therapy with an intravenous antihypertensive agent and did not provide information on the prevalence of severe AH. Qureshi et al.5 analyzed information in a more representative sample from the national hospital ambulatory care survey, however, the only outcome examined was the correlation between acute blood pressure and stroke. Studies focusing on a selected patient population may be of limited value to hospitalists, because they are commonly required to treat a range of patients presenting to the hospital.
In light of severe syndromes that may be associated with, or complicated by, severe AH presented early during acute care, hospitalists require a better understanding of the prevalence and the relationship between severe AH and attendant mortality and morbidity. In addition, an assessment of the association of severe AH on the need for intensive care unit (ICU) admission and mechanical ventilation (MV) may aid the initial treatment assessments and triage decisions required of hospitalists.
Our objective was to describe the prevalence and implications of severe AH present at the time of evaluation in the ED among patients eventually hospitalized, using clinical data collected on all consecutive admissions across a range of clinical conditions. We sought to determine the independent contribution, if any, of severe AH to hospital mortality, need for MV on admission, as well as hospital length of stay (LOS).
METHODS
Study Design and Setting
This was a retrospective analysis of adults admitted to 114 acute‐care hospitals in the United States from 2005 through 2007. The New England Institutional Review Board/Human Subjects Research Committee (Wellesley, MA) reviewed and approved this study. It was conducted in compliance with the Health Insurance Portability and Accountability Act (HIPAA).
Data
Data were obtained from one of the Clinical Research Databases from CareFusion (formerly Cardinal Health [CareFusion Clinical Research Services, Marlborough, MA]).613 The database contains electronically imported or manually extracted demographic, clinical (eg, comorbidities, vital signs, laboratory values, other clinical findings), and administrative data (eg, diagnosis, procedures, and length of hospitalization). All vital signs were manually extracted, including the highest and the lowest ED systolic blood pressure (SBP) measurements during the ED stay, but before inpatient admission. Patients admitted for childbirth or mental health reasons were not included.
Patients
Our main analysis focused on patients whose highest and lowest SBP were collected in the ED. These patients accounted for approximately 90% of all inpatients admitted through the ED. For the approximately 9% of patients who had only 1 SBP collected, we conducted a sensitivity analysis by both including and excluding them in the main analysis to determine if the absence of a second SBP measurement altered our findings. Patients were grouped into 1 of the following 8 mutually exclusive strata based on the maximum SBP (mmHg) in the ED: <100, 101‐139, 140‐180, 181‐190, 191‐200, 201‐210, 211‐220, and >220.
Measures
The primary exposure of interest was the prevalence of severe AH, defined as at least 1 SBP measurement recorded in the ED in excess of 180 mmHg. Outcome measures included in‐hospital mortality, need for MV on admission day (defined by International Classification of Diseases, 9th revision, Clinical Modification [ICD‐9‐CM] procedure codes of 96.70, 96.71, and 96.72), and LOS. We stratified these outcomes for each inpatient admission according to 1 of 112 mutually exclusive groups of principal diagnoses (see Supporting Appendix A in the online version of this article). To simplify the presentations, we pooled the groups into 9 major disease categories based on organ systems.
Primary Data Analysis
All statistical analyses were performed using Statistical Analysis Software (SAS version 9.01; SAS Institute Inc, Cary, NC). For evaluating trending, we used the Cochran‐Armitage test for dichotomous variables (mortality and MV), and linear regression for continuous variable (LOS). We employed a logistic regression model to estimate risk of mortality and need for MV on admission. We used linear regression models to estimate the LOS associated with severe AH. We modeled each outcome as a function of patient disease severity and SBP strata. Because patients with the most severe AH tended to have higher mortality early in hospitalization, our analysis of LOS was limited to patients who survived index hospitalization.
The original disease‐specific risk‐adjustment models accounting for patient‐level confounding risk factors, including demographics, physiologic presentation on admission (vital signs, altered mental status, and laboratory findings), and chronic conditions, were previously developed and validated.12, 13 We recalibrated each of the 112 models, for the current study cohort, using the logit of predicted probability of death generated from the mortality risk‐adjustment model as a propensity score of disease severity. Using this propensity score as an aggregate severity adjuster, we refit 9 logistic regression models (1 for each major disease category) to estimate the odds ratios for mortality or need for MV for each of the 7 SBP strata in the regression models with 101‐139 mmHg as the reference group. To estimate the attributable LOS (if any) of severe AH among survivors, we fit the 9 LOS models using log transformed LOS (to normalize the potentially skewed distribution of LOS) as the outcome, controlling for disease severity. The attributable LOS and 95% confidence intervals (CI) were estimated from 1000 bootstrap iterations, with the median as the parameter estimate and 2.5th and 97.5th percentile as 95% CI.14, 15
Sensitivity Analysis
To address potential bias of LOS associated with inpatient mortality, we refit 9 LOS models, including both patients who died and those who survived the index hospitalization. The models adjusted for disease severity, mortality, and the interaction of severity and mortality. Because patients with only 1 SBP recorded at ED may be different from those with more than 1 SBP recorded, we conducted analysis by adding these patients in the study cohort to examine the potential change of overall prevalence of AH and associated mortality for the study population.
To address the potential for a center‐specific effect on outcomes, we refit all the models using a mixed model approach.16 The mixed model accounts for both patient‐level risk factors and hospital‐specific effects on the observed outcomes.
RESULTS
Patient Characteristics
The study cohort was comprised of 1,290,804 adults who were admitted through the ED, from 2005 through 2007, and whose highest and lowest SBP measurements were collected in the ED. Median age was 69 years (interquartile range, 53‐81) for the overall population. Median age was 74 (interquartile range, 60‐83) for patients with severe AH (Table 1). Hospital mortality was 3.6% (n = 46,033), with 6119 (13.3%) having severe AH.
| Characteristic | Prevalence, n (Column %) | Severe Acute Hypertension, n (Row %) |
|---|---|---|
| Total number of discharges | 1,290,804 (100.0) | 178,197 (13.8) |
| Mortality | 46,033 (3.6) | 6,119 (13.3) |
| Live discharges | 1,244,771 (96.4) | 172,078 (13.8) |
| Mechanical ventilation on admission | 39,238 (3.0) | 9,508 (24.2) |
| Demographics | ||
| Age, median (1st, 3rd quartiles) | 69 (53, 81) | 74 (60, 83) |
| Male | 587,553 (45.5) | 71,085 (12.1) |
| Female | 703,244 (54.5) | 107,109 (15.2) |
| Race | ||
| White | 949,869 (73.6) | 121,930 (12.8) |
| Black | 220,601 (17.1) | 39,667 (18.0) |
| Other | 120,334 (9.3) | 16,600 (13.8) |
| Insurance | ||
| Medicare | 668,420 (51.8) | 105,078 (15.7) |
| Medicaid | 108,538 (8.4) | 12,259 (11.3) |
| Commercial | 163,858 (12.7) | 18,669 (11.4) |
| Other | 349,988 (27.1) | 42,191 (12.1) |
| Disease system by the principal diagnosis | ||
| Nervous system | 76,744 (5.9) | 22,270 (29.0) |
| Respiratory system | 222,329 (17.2) | 24,678 (11.1) |
| Circulatory system | 416,847 (32.3) | 66,852 (16.0) |
| Digestive system | 186,282 (14.4) | 17,817 (9.6) |
| Hepatobiliary/pancreas system | 52,293 (4.1) | 5,664 (10.8) |
| Endocrine system | 45,050 (3.5) | 6,625 (14.7) |
| Kidney/urinary system | 81,782 (6.3) | 11,050 (13.5) |
| Infectious diseases | 60,353 (4.7) | 4,162 (6.9) |
| Other | 149,124 (11.6) | 19,079 (12.8) |
| Comorbidity by secondary diagnoses | ||
| Hypertension | 729,417 (56.5) | 135,498 (18.6) |
| Fluid and electrolyte disorders | 306,666 (23.8) | 37,836 (12.3) |
| Diabetes without chronic complications | 286,912 (22.2) | 47,979 (16.7) |
| Chronic pulmonary disease | 283,895 (22.0) | 35,977 (12.7) |
| Congestive heart failure | 213,523 (16.5) | 33,956 (15.9) |
| Deficiency anemias | 210,230 (16.3) | 30,266 (14.4) |
| Renal failure | 159,409 (12.3) | 31,984 (20.1) |
| Hypothyroidism | 153,911 (11.9) | 22,441 (14.6) |
| Valvular disease | 140,820 (10.9) | 21,453 (15.2) |
| Depression | 137,259 (10.6) | 16,886 (12.3) |
| Other neurological disorders | 126,954 (9.8) | 19,103 (15.0) |
| Peripheral vascular disease | 88,321 (6.8) | 16,180 (18.3) |
| Obesity | 84,000 (6.5) | 12,351 (14.7) |
| Diabetes with chronic complications | 65,989 (5.1) | 13,093 (19.8) |
| Psychoses | 54,769 (4.2) | 5,555 (10.1) |
| Alcohol abuse | 51,765 (4.0) | 6,014 (11.6) |
| Pulmonary circulation disease | 49,248 (3.8) | 7,128 (14.5) |
| Coagulopathy | 43,584 (3.4) | 4,339 (10.0) |
| Paralysis | 42,128 (3.3) | 8,125 (19.3) |
| Drug abuse | 36,134 (2.8) | 4,779 (13.2) |
| Liver disease | 36,094 (2.8) | 3,218 (8.9) |
| Weight loss | 35,795 (2.8) | 3,726 (10.4) |
| Metastatic cancer | 33,517 (2.6) | 2,498 (7.5) |
| Rheumatoid arthritis | 32,545 (2.5) | 4,300 (13.2) |
| Solid tumor without metastasis | 30,677 (2.4) | 3,035 (9.9) |
| Chronic blood loss anemia | 25,416 (2.0) | 2,268 (8.9) |
| Lymphoma | 9,972 (0.8) | 871 (8.7) |
| Acquired immune deficiency syndrome | 3,048 (0.2) | 307 (10.1) |
| Peptic ulcer disease | 915 (0.1) | 131 (14.3) |
| Discharges by hospital characteristics | ||
| Teaching status | ||
| Teaching hospitals | 899,786 (69.7) | 127,512 (14.2) |
| Nonteaching hospitals | 391,018 (30.3) | 50,685 (13.0) |
| Urban status | ||
| Urban hospitals | 1,164,802 (90.2) | 162,399 (13.9) |
| Rural hospitals | 126,002 (9.8) | 15,798 (12.5) |
| Bed size | ||
| Beds <100 | 36,624 (2.8) | 4,965 (13.6) |
| Beds 100‐300 | 623,327 (48.3) | 80,156 (12.9) |
| Beds >300 | 630,853 (48.9) | 93,076 (14.8) |
Prevalence of Acute Hypertension
A total of 763,634 (59.2%) patients had at least 1 SBP measurement of 140 mmHg during the ED stay, including 178,197 (13.8%) with SBP >180 mmHg. Body systems associated with the highest prevalence of severe AH (SBP >180 mmHg) were nervous (29.0%), circulatory (16.0%), endocrine (14.7%), and kidney/urinary (13.5%) (Figure 1 presents the data in graphic form; Supporting Appendix B, in the online version of this article, presents corresponding data in table form).
Mortality
Univariable analysis revealed a graded relationship between SBP stratum and mortality risk (Figure 2a; and see Supporting Appendix C in the online version of this article). This relationship was most pronounced for nervous system diseases; mortality rates for each 10 mmHg increase in SBP from 180 to >220 mmHg were 6.5%, 8.1%, 10.0%, 12.0%, and 19.7%, respectively (trending P < 0.0001). The risk‐adjusted increase in mortality odds ratio ranged from 1.04 (95% CI: 0.89, 1.21) to 1.44 (95% CI: 1.25, 1.67) for patients in the severe AH strata compared to patients with SBP of 101 to 139 mmHg (Figure 3). Severe AH was not an independent mortality predictor in other disease categories.
Mechanical Ventilation on Admission
Univariable analysis revealed a graded relationship between severe AH and a need for MV on admission, especially for respiratory, circulatory, and infectious conditions (trending P < 0.0001) (Figure 2b; and see Supporting Appendix C in the online version of this article). In the multivariable analysis, there was a relationship between severe AH stratum and adjusted risk for MV on admission across nearly all disease categories (Figure 4).
Length of Stay
Univariable analysis revealed a graded relationship between severe AH strata and LOS for nearly all disease categories in survivors (trending P < 0.0001), except for digestive, kidney, and infectious diseases (Figure 2c; and see Supporting Appendix C in the online version of this article). For patients with nervous system diseases, the unadjusted LOS for each 10 mmHg increase in SBP from 180 to >220 was 5.8, 6.1, 6.4, 6.8, and 8.0 days, respectively (trending P < 0.0001). The relationship was similar for other disease categories which showed significant trending.
In the multivariable analysis, the relationship between severe AH strata and adjusted attributable LOS was graded across most disease categories, especially nervous, circulatory, and hepatobiliary diseases (Figure 5). The total adjusted number of hospital days attributable to severe AH was 0.43 days per case for all survivors with severe AH.
Sensitivity Analysis
Our sensitivity analysis of the LOS estimate, including those patients who died in the hospital, yielded similar findings in attributable LOS due to severe AH. In addition, when we added patients with only 1 SBP documented in the ED to the study cohort, the severe AH prevalence changed negligibly from 13.8% to 13.0%, and the associated mortality remained unchanged at 3.4%. Models using the mix model approach, which take into account hospital‐specific effects, showed similar results.
DISCUSSION
This large‐scale analysis demonstrated that severe AH was present in 13.8% of inpatients admitted through the ED. The prevalence of severe AH varied based on the primary reason for an acute care admission, ranging from 7% in infectious syndromes to nearly 30% in acute neurologic processes. Specific to patients with neurologic disease, initial severe blood pressure elevations independently correlated with mortality. Severe blood pressure elevations at ED were independently associated with an increased need for MV on admission and a prolonged LOS across a range of disease states.
Prior work on hypertension at admission has generally included single‐center analyses or only focused on patients with specific admitting diagnoses. For example, in a single ED analysis, Tilman et al.17 reported that 16% of 10,000 patients presented with elevated blood pressure (140/90 mmHg). In a multicenter review of 7000 persons, Karras et al.18, 19 described 423 patients with severe AH (180/110 mmHg) who comprised 6% of patients seen in the ED during a 1‐week period. Qureshi et al.5 noted severe AH in 13% of patients with acute stroke. While other ED‐based studies examined all ED patients, including those admitted and discharged from the ED, our study focused on those requiring hospitalization. This disparity in illness severity may, in part, explain the higher prevalence of severe AH we noted relative to others.
We further found that the prevalence of severe AH varied based on admitting diagnosis. This difference in prevalence rates by condition seems clinically plausible. Recognition of this pattern may prove valuable to hospitalists who, by the nature of their responsibilities, will encounter a broad range of patients. Because our data were derived from the largest analysis of blood pressure assessments for ED patients who were eventually hospitalized, and encompassed a multiplicity of hospitals, our findings are likely generalizable. Moreover, our large sample size enabled us to examine severe AH at each 10 mmHg increment across a variety of disease states, rather than restricting our analysis to 1 admitting diagnosis.
The independent relationship between severe blood pressure elevation and mortality was detected only in those with neurologic conditions. Incremental increases in SBP beyond 180 mmHg were associated with a stepwise escalation in the risk for death. Although recognition of the importance of blood pressure management in both ischemic and hemorrhagic stroke remains a cornerstone of therapy for these diseases, the stepwise relationship between escalating blood pressure and outcome suggests that further study is needed to determine the optimal management of severe AH among these patients. This relationship, along with the independent association between severe AH at presentation and the need for MV, underscores the importance of severe AH in critical care, representing a major challenge for intensivists and hospitalists, particularly those who practice in neurologic ICUs.
The independent association of severe AH and prolonged LOS represents a novel finding. Few reports have correlated the initial blood pressure with measures of resource use. Katz et al.4 found a median LOS of 6 days among 1000 patients who presented with severe AH and end organ dysfunction in 25 US hospitals. These investigators, however, did not explore the incremental independent contribution of initial blood pressure to LOS. Biologically, severe hypertension may exacerbate both acute and chronic conditions, thus complicating their management and resulting in longer hospitalizations.
Our analysis has limitations. While exposure misclassification is a potential concern, unlike other population‐based studies that use ICD‐9‐CM codes to identify AH cases, we relied on actual measures of blood pressure to identify subjects, thus minimizing this threat to validity. Similarly, since our end pointsmortality, MV on admission, and LOSwere also objective measures, the probability of their misclassification is minimal.
Another concerning contributor to exposure misclassification is the possibility that, in some instances, the initial elevation in BP meeting the inclusion criteria in our study cohort does not reflect the true BP. Indeed, a substantial body of research about BP measurement in the ED suggests that we may have included some persons who likely did not have AH. For example, Pitts and Adams described a regression to the mean phenomenon, with serial BP measurements in the ED, wherein the BP fell by approximately 11 mmHg over 4 hours.20 Baumann and colleagues reported a similar pattern.21 However, the findings of these 2 analyses do not necessarily apply to our study population; we focused on patients admitted to the hospital with an acute condition, while Pitts and Adams20 and Baumann et al.21 examined all ED patients. This distinction is crucial in that patients not admitted are likely less severely ill and systematically different from those who do merit hospitalization. Moreover, both Pitts and Adams20 and Cienki et al.22 observed that the regression to the mean and fall in serial BP measurements were less pronounced in those with the most extensive BP elevations. In our study, we found the strongest relationship between adverse outcomes and BP in patients with the most extreme BP elevations. Thus, misclassification is perhaps less likely to be an issue for these subjects.
In addition, misclassification may result when initially elevated BP simply represents the impact of untreated pain or anxiety in ED patients. However, Backer et al.23 and Tanabe and colleagues24 specifically explored the impact of pain and anxiety on BP in ED subjects, and neither group found a correlation between BP and either acute pain and/or anxiety scores. Our difficulties with case definitions and BP measurements for severe AH demonstrate the need for the creation and adoption of a formal, systematic approach to this syndrome, along with the need for prospective analyses to confirm our findings.
Selection bias represents a second potential threat to validity in our observational study, although this bias is mitigated by including all consecutive acute inpatient admissions to the participating hospitals. Furthermore, inclusion of the 9% of patients who had only 1 ED measurement of SBP collected did not alter the estimate of severe AH prevalence or associated outcomes.
Third, confounding may introduce the potential for false associations derived from observational data. The large sample size of our cohort allowed us to address this concern by adjusting for a large array of confounders. In addition, unlike other large‐scale population‐based studies which typically rely on administrative ICD‐9‐CM codes for risk adjustment, our analysis incorporated actual physiologic and laboratory results measured on admission, as well as a validated severity‐of‐illness scoring system for risk adjustment.12, 13
Although both SBP and diastolic blood pressure (DBP) thresholds are included in traditional definitions of hypertension, selecting SBP as the primary measure is reasonable because SBP >180 mmHg is a more important risk factor for cardiovascular disease than elevated DBP.25 Previous studies reported the relationship between the trend of SBP over time and clinical outcomes,26, 27 but we were not able to investigate the relationship of SBP trend and outcomes because the BP measurements in the our study were not collected in predefined intervals.
It would be ideal if serial blood pressure measures were to be collected at pre‐specified intervals and if more sophisticated schemas were to be used to refine the AH definition. This type of study may be possible in the future when vital signs can be collected automatically with advanced technology. Likewise, electronically captured treatment data could further help researchers to study the impact of process‐of‐care variables, including medications and other management strategies, in relation to outcomes. Finally, outpatient management of chronic hypertension is an integral part of clinical management. Unfortunately, these types of data are not available in our existing database. These limitations notwithstanding, an in‐depth understanding of the association between severe AH and potential adverse clinical and economic outcomes may direct further research in this field.
CONCLUSION
Severe AH appears common and its prevalence varies by underlying clinical condition in patients admitted from the ED. In those with acute neurologic syndromes, the degree of blood pressure elevation correlated with mortality, need for MV, and longer LOS. For many other conditions, elevation of blood pressure appeared to be linked to an increased need for MV and a prolongation in LOS. Future studies are needed to examine the potential impact of both 1) improved long‐term outpatient BP management, and 2) optimal management of severe AH upon admission on improving outcomes of patients hospitalized from the ED with severe AH.
- Health, United States, 2010.Hyattsville, MD:Centers for Disease Control and Prevention, National Center for Health Statistics;2011.
- Agency for Healthcare Research and Quality.Healthcare Cost and Utilization Project (HCUP).Rockville, MD:US Department of Health 289(19):2560–2572.
- ,,, et al.Practice patterns, outcomes, and end‐organ dysfunction for patients with acute severe hypertension: the Studying the Treatment of Acute hyperTension (STAT) registry.Am Heart J.2009;158(4):599–606.e1.
- ,,, et al.Prevalence of elevated blood pressure in 563,704 adult patients with stroke presenting to the ED in the United States.Am J Emerg Med.2007;25(1):32–38.
- ,,, et al.A prediction rule to identify low‐risk patients with community‐acquired pneumonia.N Engl J Med.1997;336(4):243–250.
- ,.A clinical assessment of MedisGroups.JAMA.1988;260(21):3159–3163.
- ,,,,,.Healthcare‐associated bloodstream infection: a distinct entity? Insights from a large U.S. database.Crit Care Med.2006;34(10):2588–2595.
- ,,,,,.Epidemiology and outcomes of health‐care‐associated pneumonia: results from a large US database of culture‐positive pneumonia.Chest.2005;128(6):3854–3862.
- ,,,,,.Morbidity and cost burden of methicillin‐resistant Staphylococcus aureus in early onset ventilator‐associated pneumonia.Crit Care.2006;10(3):R97.
- ,,,,.Evaluation of the complication rate as a measure of quality of care in coronary artery bypass graft surgery.JAMA.1995;274(4):317–323.
- ,,.Using automated clinical data for risk adjustment: development and validation of six disease‐specific mortality predictive models for pay‐for‐performance.Med Care.2007;45(8):789–805.
- ,,,,.Development and validation of a disease‐specific risk adjustment system using automated clinical data.Health Service Research.2010;45:1815–1835.
- ,.Estimating marginal and incremental effects on health outcomes using flexible link and variance function models.Biostatistics.2005;6(1):93–109.
- ,.An Introduction to the Bootstrap.London, England:Chapman 1993.
- ,.Applied Mixed Models in Medicine.2nd ed.Chichester, England:Wiley;2006.
- ,,,,,.Recognizing asymptomatic elevated blood pressure in ED patients: how good (bad) are we?Am J Emerg Med.2007;25(3):313–317.
- ,,, et al.Evaluation and treatment of patients with severely elevated blood pressure in academic emergency departments: a multicenter study.Ann Emerg Med.2006;47(3):230–236.
- ,,, et al.Elevated blood pressure in urban emergency department patients.Acad Emerg Med.2005;12(9):835–843.
- ,.Emergency department hypertension and regression to the mean.Ann Emerg Med.1998;31(2):214–218.
- ,,,.Differing prevalence estimates of elevated blood pressure in ED patients using 4 methods of categorization.Am J Emerg Med.2008;26(5):561–565.
- ,,.The validity of emergency department triage blood pressure measurements.Acad Emerg Med.2004;11(3):237–243.
- ,,.Reproducibility of increased blood pressure during an emergency department or urgent care visit.Ann Emerg Med.2003;41(4):507–512.
- ,,,,,.Increased blood pressure in the emergency department: pain, anxiety, or undiagnosed hypertension?Ann Emerg Med.2008;51(3):221–229.
- ,,.Clinical Advisory Statement. Importance of systolic blood pressure in older Americans.Hypertension.2000;35(5):1021–1024.
- ,,,.High blood pressure in early acute stroke: a sign of a poor outcome?J Hypertens.2006;24(2):381–386.
- ,,,,.Blood pressure as an independent prognostic factor in acute ischemic stroke.Can J Neurol Sci.2006;33(1):34–38.
Copyright © 2011 Society of Hospital Medicine

Inappropriate Treatment of HCA‐cSSTI
Classically, infections have been categorized as either community‐acquired (CAI) or nosocomial in origin. Until recently, this scheme was thought adequate to capture the differences in the microbiology and outcomes in the corresponding scenarios. However, recent evidence suggests that this distinction may no longer be valid. For example, with the spread and diffusion of healthcare delivery beyond the confines of the hospital along with the increasing use of broad spectrum antibiotics both in and out of the hospital, pathogens such as methicillin‐resistant Staphylococcus aureus (MRSA) and Pseudomonas aeruginosa (PA), traditionally thought to be confined to the hospital, are now seen in patients presenting from the community to the emergency department (ED).1, 2 Reflecting this shift in epidemiology, some national guidelines now recognize healthcare‐associated infection (HCAI) as a distinct entity.3 The concept of HCAI allows the clinician to identify patients who, despite suffering a community onset infection, still may be at risk for a resistant bacterial pathogen. Recent studies in both bloodstream infection and pneumonia have clearly demonstrated that those with HCAI have distinct microbiology and outcomes relative to those with pure CAI.47
Most work focusing on establishing HCAI has not addressed skin and soft tissue infections. These infections, although not often fatal, account for an increasing number of admissions to the hospital.8, 9 In addition, they may be associated with substantial morbidity and cost.8 Given that many pathogens such as S. aureus, which may be resistant to typical antimicrobials used in the ED, are also major culprits in complicated skin and skin structure infections (cSSSI), the HCAI paradigm may apply in cSSSI. Furthermore, because of these patterns of increased resistance, HCA‐cSSSI patients, similar to other HCAI groups, may be at an increased risk of being treated with initially inappropriate antibiotic therapy.7, 10
Since in the setting of other types of infection inappropriate empiric treatment has been shown to be associated with increased mortality and costs,7, 1015 and since indirect evidence suggests a similar impact on healthcare utilization among cSSSI patients,8 we hypothesized that among a cohort of patients hospitalized with a cSSSI, the initial empiric choice of therapy is independently associated with hospital length of stay (LOS). We performed a retrospective cohort study to address this question.
Methods
Study Design
We performed a single‐center retrospective cohort study of patients with cSSSI admitted to the hospital through the ED. All consecutive patients hospitalized between April 2006 and December 2007 meeting predefined inclusion criteria (see below) were enrolled. The study was approved by the Washington University School of Medicine Human Studies Committee, and informed consent was waived. We have previously reported on the characteristics and outcomes of this cohort, including both community‐acquired and HCA‐cSSSI patients.16
Study Cohort
All consecutive patients admitted from the community through the ED between April 2006 and December 2007 at the Barnes‐Jewish Hospital, a 1200‐bed university‐affiliated, urban teaching hospital in St. Louis, MO were included if: (1) they had a diagnosis of a predefined cSSSI (see Appendix Table A1, based on reference 8) and (2) they had a positive microbiology culture obtained within 24 hours of hospital admission. Similar to the work by Edelsberg et al.8 we excluded patients if certain diagnoses and procedures were present (Appendix Table A2). Cases were also excluded if they represented a readmission for the same diagnosis within 30 days of the original hospitalization.
Definitions
HCAI was defined as any cSSSI in a patient with a history of recent hospitalization (within the previous year, consistent with the previous study16), receiving antibiotics prior to admission (previous 90 days), transferring from a nursing home, or needing chronic dialysis. We defined a polymicrobial infection as one with more than one organism, and mixed infection as an infection with both a gram‐positive and a gram‐negative organism. Inappropriate empiric therapy took place if a patient did not receive treatment within 24 hours of the time the culture was obtained with an agent exhibiting in vitro activity against the isolated pathogen(s). In mixed infections, appropriate therapy was treatment within 24 hours of culture being obtained with agent(s) active against all pathogens recovered.
Data Elements
We collected information about multiple baseline demographic and clinical factors including: age, gender, race/ethnicity, comorbidities, the presence of risk factors for HCAI, the presence of bacteremia at admission, and the location of admission (ward vs. intensive care unit [ICU]). Bacteriology data included information on specific bacterium/a recovered from culture, the site of the culture (eg, tissue, blood), susceptibility patterns, and whether the infection was monomicrobial, polymicrobial, or mixed. When blood culture was available and positive, we prioritized this over wound and other cultures and designated the corresponding organism as the culprit in the index infection. Cultures growing our coagulase‐negative S. aureus were excluded as a probable contaminant. Treatment data included information on the choice of the antimicrobial therapy and the timing of its institution relative to the timing of obtaining the culture specimen. The presence of such procedures as incision and drainage (I&D) or debridement was recorded.
Statistical Analyses
Descriptive statistics comparing HCAI patients treated appropriately to those receiving inappropriate empiric coverage based on their clinical, demographic, microbiologic and treatment characteristics were computed. Hospital LOS served as the primary and hospital mortality as the secondary outcomes, comparing patients with HCAI treated appropriately to those treated inappropriately. All continuous variables were compared using Student's t test or the Mann‐Whitney U test as appropriate. All categorical variables were compared using the chi‐square test or Fisher's exact test. To assess the attributable impact of inappropriate therapy in HCAI on the outcomes of interest, general linear models with log transformation were developed to model hospital LOS parameters; all means are presented as geometric means. All potential risk factors significant at the 0.1 level in univariate analyses were entered into the model. All calculations were performed in Stata version 9 (Statacorp, College Station, TX).
Results
Of the 717 patients with culture‐positive cSSSI admitted during the study period, 527 (73.5%) were classified as HCAI. The most common reason for classification as an HCAI was recent hospitalization. Among those with an HCA‐cSSSI, 405 (76.9%) received appropriate empiric treatment, with nearly one‐quarter receiving inappropriate initial coverage. Those receiving inappropriate antibiotic were more likely to be African American, and had a higher likelihood of having end‐stage renal disease (ESRD) than those with appropriate coverage (Table 1). While those patients treated appropriately had higher rates of both cellulitis and abscess as the presenting infection, a substantially higher proportion of those receiving inappropriate initial treatment had a decubitus ulcer (29.5% vs. 10.9%, P <0.001), a device‐associated infection (42.6% vs. 28.6%, P = 0.004), and had evidence of bacteremia (68.9% vs. 57.8%, P = 0.028) than those receiving appropriate empiric coverage (Table 2).
| Inappropriate (n = 122), n (%) | Appropriate (n = 405), n (%) | P Value | |
|---|---|---|---|
| |||
| Age, years | 56.3 18.0 | 53.6 16.7 | 0.147 |
| Gender (F) | 62 (50.8) | 190 (46.9) | 0.449 |
| Race | |||
| Caucasian | 51 (41.8) | 219 (54.1) | 0.048 |
| African American | 68 (55.7) | 178 (43.9) | |
| Other | 3 (2.5) | 8 (2.0) | |
| HCAI risk factors | |||
| Recent hospitalization* | 110 (90.2) | 373 (92.1) | 0.498 |
| Within 90 days | 98 (80.3) | 274 (67.7) | 0.007 |
| >90 and 180 days | 52 (42.6) | 170 (42.0) | 0.899 |
| >180 days and 1 year | 46 (37.7) | 164 (40.5) | 0.581 |
| Prior antibiotics | 26 (21.3) | 90 (22.2) | 0.831 |
| Nursing home resident | 29 (23.8) | 54 (13.3) | 0.006 |
| Hemodialysis | 19 (15.6) | 39 (9.7) | 0.067 |
| Comorbidities | |||
| DM | 40 (37.8) | 128 (31.6) | 0.806 |
| PVD | 5 (4.1) | 15 (3.7) | 0.841 |
| Liver disease | 6 (4.9) | 33 (8.2) | 0.232 |
| Cancer | 21 (17.2) | 85 (21.0) | 0.362 |
| HIV | 1 (0.8) | 12 (3.0) | 0.316 |
| Organ transplant | 2 (1.6) | 8 (2.0) | 1.000 |
| Autoimmune disease | 5 (4.1) | 8 (2.0) | 0.185 |
| ESRD | 22 (18.0) | 46 (11.4) | 0.054 |
| Inappropriate (n = 122), n (%) | Appropriate (n = 405), n (%) | P Value | |
|---|---|---|---|
| |||
| Cellulitis | 28 (23.0) | 171 (42.2) | <0.001 |
| Decubitus ulcer | 36 (29.5) | 44 (10.9) | <0.001 |
| Post‐op wound | 25 (20.5) | 75 (18.5) | 0.626 |
| Device‐associated infection | 52 (42.6) | 116 (28.6) | 0.004 |
| Diabetic foot ulcer | 9 (7.4) | 24 (5.9) | 0.562 |
| Abscess | 22 (18.0) | 108 (26.7) | 0.052 |
| Other* | 2 (1.6) | 17 (4.2) | 0.269 |
| Presence of bacteremia | 84 (68.9) | 234 (57.8) | 0.028 |
The pathogens recovered from the appropriately and inappropriately treated groups are listed in Figure 1. While S. aureus overall was more common among those treated appropriately, the frequency of MRSA did not differ between the groups. Both E. faecalis and E. faecium were recovered more frequently in the inappropriate group, resulting in a similar pattern among the vancomycin‐resistant enterococcal species. Likewise, P. aeruginosa, P. mirabilis, and A. baumannii were all more frequently seen in the group treated inappropriately than in the group getting appropriate empiric coverage. A mixed infection was also more likely to be present among those not exposed (16.5%) than among those exposed (7.5%) to appropriate early therapy (P = 0.001) (Figure 1).
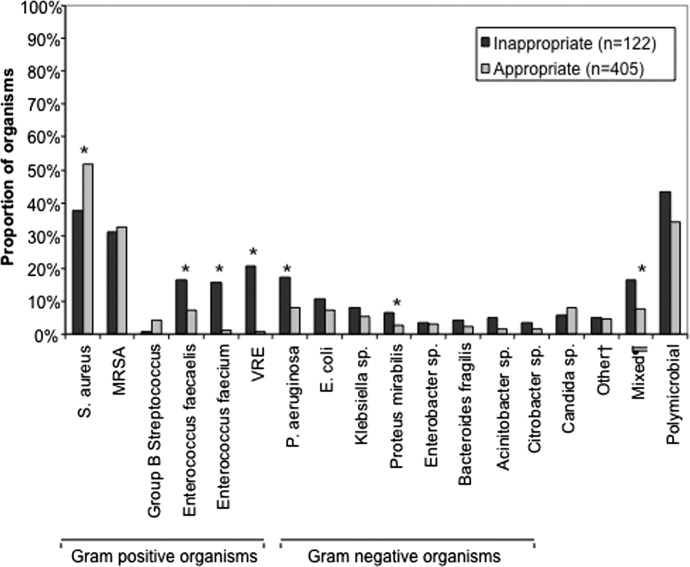
In terms of processes of care and outcomes (Table 3), commensurate with the higher prevalence of abscess in the appropriately treated group, the rate of I&D was significantly higher in this cohort (36.8%) than in the inappropriately treated (23.0%) group (P = 0.005). Need for initial ICU care did not differ as a function of appropriateness of therapy (P = 0.635).
| Inappropriate (n = 122) | Appropriate (n = 405) | P Value | |
|---|---|---|---|
| |||
| I&D/debridement | 28 (23.0%) | 149 (36.8%) | 0.005 |
| I&D in ED | 0 | 7 (1.7) | 0.361 |
| ICU | 9 (7.4%) | 25 (6.2%) | 0.635 |
| Hospital LOS, days | |||
| Median (IQR 25, 75) [Range] | 7.0 (4.2, 13.6) [0.686.6] | 6 (3.3, 10.1) [0.748.3] | 0.026 |
| Hospital mortality | 9 (7.4%) | 26 (6.4%) | 0.710 |
The unadjusted mortality rate was low overall and did not vary based on initial treatment (Table 3). In a generalized linear model with the log‐transformed LOS as the dependent variable, adjusting for multiple potential confounders, initial inappropriate antibiotic therapy had an attributable incremental increase in the hospital LOS of 1.8 days (95% CI, 1.42.3) (Table 4).
| Factor | Attributable LOS (days) | 95% CI | P Value |
|---|---|---|---|
| |||
| Infection type: device | 3.6 | 2.74.8 | <0.001 |
| Infection type: decubitus ulcer | 3.3 | 2.64.2 | <0.001 |
| Infection type: abscess | 2.5 | 1.64.0 | <0.001 |
| Organism: P. mirabilis | 2.2 | 1.43.4 | <0.001 |
| Organism: E. faecalis | 2.1 | 1.72.6 | <0.001 |
| Nursing home resident | 2.1 | 1.62.6 | <0.001 |
| Inappropriate antibiotic | 1.8 | 1.42.3 | <0.001 |
| Race: Non‐Caucasian | 0.31 | 0.240.41 | <0.001 |
| Organism: E. faecium | 0.23 | 0.150.35 | <0.001 |
Because bacteremia is known to be an effect modifier of the relationship between the empiric choice of antibiotic and infection outcomes, we further explored its role in the HCAI cSSSI on the outcomes of interest (Table 5). Similar to the effect detected in the overall cohort, treatment with inappropriate therapy was associated with an increase in the hospital LOS, but not hospital mortality in those with bacteremia, though this phenomenon was observed only among patients with secondary bacteremia, and not among those without (Table 5).
| Bacteremia Present (n = 318) | Bacteremia Absent (n = 209) | |||||
|---|---|---|---|---|---|---|
| I (n = 84) | A (n = 234) | P Value | I (n = 38) | A (n = 171) | P Value | |
| ||||||
| Hospital LOS, days | ||||||
| Mean SD | 14.4 27.5 | 9.8 9.7 | 0.041 | 6.6 6.8 | 6.9 8.2 | 0.761 |
| Median (IQR 25, 75) | 8.8 (5.4, 13.9) | 7.0 (4.3, 11.7) | 4.4 (2.4, 7.7) | 3.9 (2.0, 8.2) | ||
| Hospital mortality | 8 (9.5%) | 24 (10.3%) | 0.848 | 1 (2.6%) | 2 (1.2%) | 0.454 |
Discussion
This retrospective analysis provides evidence that inappropriate empiric antibiotic therapy for HCA‐cSSSI independently prolongs hospital LOS. The impact of inappropriate initial treatment on LOS is independent of many important confounders. In addition, we observed that this effect, while present among patients with secondary bacteremia, is absent among those without a blood stream infection.
To the best of our knowledge, ours is the first cohort study to examine the outcomes associated with inappropriate treatment of a HCAI cSSSI within the context of available microbiology data. Edelsberg et al.8 examined clinical and economic outcomes associated with the failure of the initial treatment of cSSSI. While not specifically focusing on HCAI patients, these authors noted an overall 23% initial therapy failure rate. Among those patients who failed initial therapy, the risk of hospital death was nearly 3‐fold higher (adjusted odds ratio [OR], 2.91; 95% CI, 2.343.62), and they incurred the mean of 5.4 additional hospital days, compared to patients treated successfully with the initial regimen.8 Our study confirms Edelsberg et al.'s8 observation of prolonged hospital LOS in association with treatment failure, and builds upon it by defining the actual LOS increment attributable to inappropriate empiric therapy. It is worth noting that the study by Edelsberg et al.,8 however, lacked explicit definition of the HCAI population and microbiology data, and used treatment failure as a surrogate marker for inappropriate treatment. It is likely these differences between our two studies in the underlying population and exposure definitions that account for the differences in the mortality data between that study and ours.
It is not fundamentally surprising that early exposure to inappropriate empiric therapy alters healthcare resource utilization outcomes for the worse. Others have demonstrated that infection with a resistant organism results in prolongation of hospital LOS and costs. For example, in a large cohort of over 600 surgical hospitalizations requiring treatment for a gram‐negative infection, antibiotic resistance was an independent predictor of increased LOS and costs.15 These authors quantified the incremental burden of early gram‐negative resistance at over $11,000 in hospital costs.15 Unfortunately, the treatment differences for resistant and sensitive organisms were not examined.15 Similarly, Shorr et al. examined risk factors for prolonged hospital LOS and increased costs in a cohort of 291 patients with MRSA sterile site infection.17 Because in this study 23% of the patients received inappropriate empiric therapy, the authors were able to examine the impact of this exposure on utilization outcomes.17 In an adjusted analysis, inappropriate initial treatment was associated with an incremental increase in the LOS of 2.5 days, corresponding to the unadjusted cost differential of nearly $6,000.17 Although focusing on a different population, our results are consistent with these previous observations that antibiotic resistance and early inappropriate therapy affect hospital utilization parameters, in our case by adding nearly 2 days to the hospital LOS.
Our study has a number of limitations. First, as a retrospective cohort study it is prone to various forms of bias, most notably selection bias. To minimize the possibility of such, we established a priori case definitions and enrolled consecutive patients over a specific period of time. Second, as in any observational study, confounding is an issue. We dealt with this statistically by constructing a multivariable regression model; however, the possibility of residual confounding remains. Third, because some of the wound and ulcer cultures likely were obtained with a swab and thus represented colonization, rather than infection, we may have over‐estimated the rate of inappropriate therapy, and this needs to be followed up in future prospective studies. Similarly, we may have over‐estimated the likelihood of inappropriate therapy among polymicrobial and mixed infections as well, given that, for example, a gram‐negative organism may carry a different clinical significance when cultured from blood (infection) than when it is detected in a decubitus ulcer (potential colonization). Fourth, because we limited our cohort to patients without deep‐seated infections, such as necrotizing fasciitis, other procedures were not collected. This omission may have led to either over‐estimation or under‐estimation of the impact of inappropriate therapy on the outcomes of interest.
The fact that our cohort represents a single large urban academic tertiary care medical center may limit the generalizability of our results only to centers that share similar characteristics. Finally, similar to most other studies of this type, ours lacks data on posthospitalization outcomes and for this reason limits itself to hospital outcomes only.
In summary, we have shown that, similar to other populations with HCAI, a substantial proportion (nearly 1/4) of cSSSI patients with HCAI receive inappropriate empiric therapy for their infection, and this early exposure, though not affecting hospital mortality, is associated with a significant prolongation of the hospitalization by as much as 2 days. Studies are needed to refine decision rules for risk‐stratifying patients with cSSSI HCAI in order to determine the probability of infection with a resistant organism. In turn, such instruments at the bedside may assure improved utilization of appropriately targeted empiric therapy that will both optimize individual patient outcomes and reduce the risk of emergence of antimicrobial resistance.
Appendix
| Principal diagnosis code | Description |
|---|---|
| 680 | Carbuncle and furuncle |
| 681 | Cellulitis and abscess of finger and toe |
| 682 | Other cellulitis and abscess |
| 683 | Acute lymphadenitis |
| 685 | Pilonidal cyst with abscess |
| 686 | Other local infections of skin and subcutaneous tissue |
| 707 | Decubitus ulcer |
| 707.1 | Ulcers of lower limbs, except decubitus |
| 707.8 | Chronic ulcer of other specified sites |
| 707.9 | Chronic ulcer of unspecified site |
| 958.3 | Posttraumatic wound infection, not elsewhere classified |
| 996.62 | Infection due to other vascular device, implant, and graft |
| 997.62 | Infection (chronic) of amputation stump |
| 998.5 | Postoperative wound infection |
| Diagnosis code | Description |
|---|---|
| 728.86 | Necrotizing fasciitis |
| 785.4 | Gangrene |
| 686.09 | Ecthyma gangrenosum |
| 730.00730.2 | Osteomyelitis |
| 630677 | Complications of pregnancy, childbirth and puerperium |
| 288.0 | Neutropenia |
| 684 | Impetigo |
| Procedure code | |
| 39.95 | Plasmapheresis |
| 99.71 | Hemoperfusion |
- ,,, et al.Invasive methicillin‐resistant Staphylococcus aureus infections in the United States.JAMA.2007;298:1762–1771.
- ,,, et al.Methicillin‐resistant S. aureus infections among patients in the emergency department.N Engl J Med.2006;17;355:666–674.
- Hospital‐Acquired Pneumonia Guideline Committee of the American Thoracic Society and Infectious Diseases Society of America.Guidelines for the management of adults with hospital‐acquired pneumonia, ventilator‐associated pneumonia, and healthcare‐associated pneumonia.Am J Respir Crit Care Med.2005;171:388–416.
- ,,, et al.Epidemiology and outcomes of health‐care‐associated pneumonia: Results from a large US database of culture‐positive pneumonia.Chest.2005;128:3854–3862.
- ,,, et al.Health care‐associated bloodstream infections in adults: A reason to change the accepted definition of community‐acquired infections.Ann Intern Med.2002;137:791–797.
- ,,,,,.Healthcare‐associated bloodstream infection: A distinct entity? Insights from a large U.S. database.Crit Care Med.2006;34:2588–2595.
- ,,, et al.Health care‐associated pneumonia and community‐acquired pneumonia: a single‐center experience.Antimicrob Agents Chemother.2007;51:3568–3573.
- ,,,,,.Clinical and economic consequences of failure of initial antibiotic therapy for hospitalized patients with complicated skin and skin‐structure infections.Infect Control Hosp Epidemiol.2008;29:160–169.
- ,,, et al.Skin, soft tissue, bone, and joint infections in hospitalized patients: Epidemiology and microbiological, clinical, and economic outcomes.Infect Control Hosp Epidemiol.2007;28:1290–1298.
- ,,, et al.Methicillin‐resistant Staphylococcus aureus sterile‐site infection: The importance of appropriate initial antimicrobial treatment.Crit Care Med.2006;34:2069–2074.
- ,,, et al.The influence of inadequate antimicrobial treatment of bloodstream infections on patient outcomes in the ICU setting.Chest.2000;118:146–155.
- ,.Modification of empiric antibiotic treatment in patients with pneumonia acquired in the intensive care unit.Intensive Care Med.1996;22:387–394.
- ,,, et al.Clinical importance of delays in the initiation of appropriate antibiotic treatment for ventilator‐associated pneumonia.Chest.2002;122:262–268.
- ,,,,.Antimicrobial therapy escalation and hospital mortality among patients with HCAP: A single center experience.Chest.2008;134:963–968.
- ,,, et al.Cost of gram‐negative resistance.Crit Care Med.2007;35:89–95.
- ,,, et al.Epidemiology and outcomes of hospitalizations with complicated skin and skin‐structure infections: implications of healthcare‐associated infection risk factors.Infect Control Hosp Epidemiol.2009;30:1203–1210.
- ,,.Inappropriate therapy for methicillin‐resistant Staphylococcus aureus: resource utilization and cost implications.Crit Care Med.2008;36:2335–2340.
Classically, infections have been categorized as either community‐acquired (CAI) or nosocomial in origin. Until recently, this scheme was thought adequate to capture the differences in the microbiology and outcomes in the corresponding scenarios. However, recent evidence suggests that this distinction may no longer be valid. For example, with the spread and diffusion of healthcare delivery beyond the confines of the hospital along with the increasing use of broad spectrum antibiotics both in and out of the hospital, pathogens such as methicillin‐resistant Staphylococcus aureus (MRSA) and Pseudomonas aeruginosa (PA), traditionally thought to be confined to the hospital, are now seen in patients presenting from the community to the emergency department (ED).1, 2 Reflecting this shift in epidemiology, some national guidelines now recognize healthcare‐associated infection (HCAI) as a distinct entity.3 The concept of HCAI allows the clinician to identify patients who, despite suffering a community onset infection, still may be at risk for a resistant bacterial pathogen. Recent studies in both bloodstream infection and pneumonia have clearly demonstrated that those with HCAI have distinct microbiology and outcomes relative to those with pure CAI.47
Most work focusing on establishing HCAI has not addressed skin and soft tissue infections. These infections, although not often fatal, account for an increasing number of admissions to the hospital.8, 9 In addition, they may be associated with substantial morbidity and cost.8 Given that many pathogens such as S. aureus, which may be resistant to typical antimicrobials used in the ED, are also major culprits in complicated skin and skin structure infections (cSSSI), the HCAI paradigm may apply in cSSSI. Furthermore, because of these patterns of increased resistance, HCA‐cSSSI patients, similar to other HCAI groups, may be at an increased risk of being treated with initially inappropriate antibiotic therapy.7, 10
Since in the setting of other types of infection inappropriate empiric treatment has been shown to be associated with increased mortality and costs,7, 1015 and since indirect evidence suggests a similar impact on healthcare utilization among cSSSI patients,8 we hypothesized that among a cohort of patients hospitalized with a cSSSI, the initial empiric choice of therapy is independently associated with hospital length of stay (LOS). We performed a retrospective cohort study to address this question.
Methods
Study Design
We performed a single‐center retrospective cohort study of patients with cSSSI admitted to the hospital through the ED. All consecutive patients hospitalized between April 2006 and December 2007 meeting predefined inclusion criteria (see below) were enrolled. The study was approved by the Washington University School of Medicine Human Studies Committee, and informed consent was waived. We have previously reported on the characteristics and outcomes of this cohort, including both community‐acquired and HCA‐cSSSI patients.16
Study Cohort
All consecutive patients admitted from the community through the ED between April 2006 and December 2007 at the Barnes‐Jewish Hospital, a 1200‐bed university‐affiliated, urban teaching hospital in St. Louis, MO were included if: (1) they had a diagnosis of a predefined cSSSI (see Appendix Table A1, based on reference 8) and (2) they had a positive microbiology culture obtained within 24 hours of hospital admission. Similar to the work by Edelsberg et al.8 we excluded patients if certain diagnoses and procedures were present (Appendix Table A2). Cases were also excluded if they represented a readmission for the same diagnosis within 30 days of the original hospitalization.
Definitions
HCAI was defined as any cSSSI in a patient with a history of recent hospitalization (within the previous year, consistent with the previous study16), receiving antibiotics prior to admission (previous 90 days), transferring from a nursing home, or needing chronic dialysis. We defined a polymicrobial infection as one with more than one organism, and mixed infection as an infection with both a gram‐positive and a gram‐negative organism. Inappropriate empiric therapy took place if a patient did not receive treatment within 24 hours of the time the culture was obtained with an agent exhibiting in vitro activity against the isolated pathogen(s). In mixed infections, appropriate therapy was treatment within 24 hours of culture being obtained with agent(s) active against all pathogens recovered.
Data Elements
We collected information about multiple baseline demographic and clinical factors including: age, gender, race/ethnicity, comorbidities, the presence of risk factors for HCAI, the presence of bacteremia at admission, and the location of admission (ward vs. intensive care unit [ICU]). Bacteriology data included information on specific bacterium/a recovered from culture, the site of the culture (eg, tissue, blood), susceptibility patterns, and whether the infection was monomicrobial, polymicrobial, or mixed. When blood culture was available and positive, we prioritized this over wound and other cultures and designated the corresponding organism as the culprit in the index infection. Cultures growing our coagulase‐negative S. aureus were excluded as a probable contaminant. Treatment data included information on the choice of the antimicrobial therapy and the timing of its institution relative to the timing of obtaining the culture specimen. The presence of such procedures as incision and drainage (I&D) or debridement was recorded.
Statistical Analyses
Descriptive statistics comparing HCAI patients treated appropriately to those receiving inappropriate empiric coverage based on their clinical, demographic, microbiologic and treatment characteristics were computed. Hospital LOS served as the primary and hospital mortality as the secondary outcomes, comparing patients with HCAI treated appropriately to those treated inappropriately. All continuous variables were compared using Student's t test or the Mann‐Whitney U test as appropriate. All categorical variables were compared using the chi‐square test or Fisher's exact test. To assess the attributable impact of inappropriate therapy in HCAI on the outcomes of interest, general linear models with log transformation were developed to model hospital LOS parameters; all means are presented as geometric means. All potential risk factors significant at the 0.1 level in univariate analyses were entered into the model. All calculations were performed in Stata version 9 (Statacorp, College Station, TX).
Results
Of the 717 patients with culture‐positive cSSSI admitted during the study period, 527 (73.5%) were classified as HCAI. The most common reason for classification as an HCAI was recent hospitalization. Among those with an HCA‐cSSSI, 405 (76.9%) received appropriate empiric treatment, with nearly one‐quarter receiving inappropriate initial coverage. Those receiving inappropriate antibiotic were more likely to be African American, and had a higher likelihood of having end‐stage renal disease (ESRD) than those with appropriate coverage (Table 1). While those patients treated appropriately had higher rates of both cellulitis and abscess as the presenting infection, a substantially higher proportion of those receiving inappropriate initial treatment had a decubitus ulcer (29.5% vs. 10.9%, P <0.001), a device‐associated infection (42.6% vs. 28.6%, P = 0.004), and had evidence of bacteremia (68.9% vs. 57.8%, P = 0.028) than those receiving appropriate empiric coverage (Table 2).
| Inappropriate (n = 122), n (%) | Appropriate (n = 405), n (%) | P Value | |
|---|---|---|---|
| |||
| Age, years | 56.3 18.0 | 53.6 16.7 | 0.147 |
| Gender (F) | 62 (50.8) | 190 (46.9) | 0.449 |
| Race | |||
| Caucasian | 51 (41.8) | 219 (54.1) | 0.048 |
| African American | 68 (55.7) | 178 (43.9) | |
| Other | 3 (2.5) | 8 (2.0) | |
| HCAI risk factors | |||
| Recent hospitalization* | 110 (90.2) | 373 (92.1) | 0.498 |
| Within 90 days | 98 (80.3) | 274 (67.7) | 0.007 |
| >90 and 180 days | 52 (42.6) | 170 (42.0) | 0.899 |
| >180 days and 1 year | 46 (37.7) | 164 (40.5) | 0.581 |
| Prior antibiotics | 26 (21.3) | 90 (22.2) | 0.831 |
| Nursing home resident | 29 (23.8) | 54 (13.3) | 0.006 |
| Hemodialysis | 19 (15.6) | 39 (9.7) | 0.067 |
| Comorbidities | |||
| DM | 40 (37.8) | 128 (31.6) | 0.806 |
| PVD | 5 (4.1) | 15 (3.7) | 0.841 |
| Liver disease | 6 (4.9) | 33 (8.2) | 0.232 |
| Cancer | 21 (17.2) | 85 (21.0) | 0.362 |
| HIV | 1 (0.8) | 12 (3.0) | 0.316 |
| Organ transplant | 2 (1.6) | 8 (2.0) | 1.000 |
| Autoimmune disease | 5 (4.1) | 8 (2.0) | 0.185 |
| ESRD | 22 (18.0) | 46 (11.4) | 0.054 |
| Inappropriate (n = 122), n (%) | Appropriate (n = 405), n (%) | P Value | |
|---|---|---|---|
| |||
| Cellulitis | 28 (23.0) | 171 (42.2) | <0.001 |
| Decubitus ulcer | 36 (29.5) | 44 (10.9) | <0.001 |
| Post‐op wound | 25 (20.5) | 75 (18.5) | 0.626 |
| Device‐associated infection | 52 (42.6) | 116 (28.6) | 0.004 |
| Diabetic foot ulcer | 9 (7.4) | 24 (5.9) | 0.562 |
| Abscess | 22 (18.0) | 108 (26.7) | 0.052 |
| Other* | 2 (1.6) | 17 (4.2) | 0.269 |
| Presence of bacteremia | 84 (68.9) | 234 (57.8) | 0.028 |
The pathogens recovered from the appropriately and inappropriately treated groups are listed in Figure 1. While S. aureus overall was more common among those treated appropriately, the frequency of MRSA did not differ between the groups. Both E. faecalis and E. faecium were recovered more frequently in the inappropriate group, resulting in a similar pattern among the vancomycin‐resistant enterococcal species. Likewise, P. aeruginosa, P. mirabilis, and A. baumannii were all more frequently seen in the group treated inappropriately than in the group getting appropriate empiric coverage. A mixed infection was also more likely to be present among those not exposed (16.5%) than among those exposed (7.5%) to appropriate early therapy (P = 0.001) (Figure 1).
In terms of processes of care and outcomes (Table 3), commensurate with the higher prevalence of abscess in the appropriately treated group, the rate of I&D was significantly higher in this cohort (36.8%) than in the inappropriately treated (23.0%) group (P = 0.005). Need for initial ICU care did not differ as a function of appropriateness of therapy (P = 0.635).
| Inappropriate (n = 122) | Appropriate (n = 405) | P Value | |
|---|---|---|---|
| |||
| I&D/debridement | 28 (23.0%) | 149 (36.8%) | 0.005 |
| I&D in ED | 0 | 7 (1.7) | 0.361 |
| ICU | 9 (7.4%) | 25 (6.2%) | 0.635 |
| Hospital LOS, days | |||
| Median (IQR 25, 75) [Range] | 7.0 (4.2, 13.6) [0.686.6] | 6 (3.3, 10.1) [0.748.3] | 0.026 |
| Hospital mortality | 9 (7.4%) | 26 (6.4%) | 0.710 |
The unadjusted mortality rate was low overall and did not vary based on initial treatment (Table 3). In a generalized linear model with the log‐transformed LOS as the dependent variable, adjusting for multiple potential confounders, initial inappropriate antibiotic therapy had an attributable incremental increase in the hospital LOS of 1.8 days (95% CI, 1.42.3) (Table 4).
| Factor | Attributable LOS (days) | 95% CI | P Value |
|---|---|---|---|
| |||
| Infection type: device | 3.6 | 2.74.8 | <0.001 |
| Infection type: decubitus ulcer | 3.3 | 2.64.2 | <0.001 |
| Infection type: abscess | 2.5 | 1.64.0 | <0.001 |
| Organism: P. mirabilis | 2.2 | 1.43.4 | <0.001 |
| Organism: E. faecalis | 2.1 | 1.72.6 | <0.001 |
| Nursing home resident | 2.1 | 1.62.6 | <0.001 |
| Inappropriate antibiotic | 1.8 | 1.42.3 | <0.001 |
| Race: Non‐Caucasian | 0.31 | 0.240.41 | <0.001 |
| Organism: E. faecium | 0.23 | 0.150.35 | <0.001 |
Because bacteremia is known to be an effect modifier of the relationship between the empiric choice of antibiotic and infection outcomes, we further explored its role in the HCAI cSSSI on the outcomes of interest (Table 5). Similar to the effect detected in the overall cohort, treatment with inappropriate therapy was associated with an increase in the hospital LOS, but not hospital mortality in those with bacteremia, though this phenomenon was observed only among patients with secondary bacteremia, and not among those without (Table 5).
| Bacteremia Present (n = 318) | Bacteremia Absent (n = 209) | |||||
|---|---|---|---|---|---|---|
| I (n = 84) | A (n = 234) | P Value | I (n = 38) | A (n = 171) | P Value | |
| ||||||
| Hospital LOS, days | ||||||
| Mean SD | 14.4 27.5 | 9.8 9.7 | 0.041 | 6.6 6.8 | 6.9 8.2 | 0.761 |
| Median (IQR 25, 75) | 8.8 (5.4, 13.9) | 7.0 (4.3, 11.7) | 4.4 (2.4, 7.7) | 3.9 (2.0, 8.2) | ||
| Hospital mortality | 8 (9.5%) | 24 (10.3%) | 0.848 | 1 (2.6%) | 2 (1.2%) | 0.454 |
Discussion
This retrospective analysis provides evidence that inappropriate empiric antibiotic therapy for HCA‐cSSSI independently prolongs hospital LOS. The impact of inappropriate initial treatment on LOS is independent of many important confounders. In addition, we observed that this effect, while present among patients with secondary bacteremia, is absent among those without a blood stream infection.
To the best of our knowledge, ours is the first cohort study to examine the outcomes associated with inappropriate treatment of a HCAI cSSSI within the context of available microbiology data. Edelsberg et al.8 examined clinical and economic outcomes associated with the failure of the initial treatment of cSSSI. While not specifically focusing on HCAI patients, these authors noted an overall 23% initial therapy failure rate. Among those patients who failed initial therapy, the risk of hospital death was nearly 3‐fold higher (adjusted odds ratio [OR], 2.91; 95% CI, 2.343.62), and they incurred the mean of 5.4 additional hospital days, compared to patients treated successfully with the initial regimen.8 Our study confirms Edelsberg et al.'s8 observation of prolonged hospital LOS in association with treatment failure, and builds upon it by defining the actual LOS increment attributable to inappropriate empiric therapy. It is worth noting that the study by Edelsberg et al.,8 however, lacked explicit definition of the HCAI population and microbiology data, and used treatment failure as a surrogate marker for inappropriate treatment. It is likely these differences between our two studies in the underlying population and exposure definitions that account for the differences in the mortality data between that study and ours.
It is not fundamentally surprising that early exposure to inappropriate empiric therapy alters healthcare resource utilization outcomes for the worse. Others have demonstrated that infection with a resistant organism results in prolongation of hospital LOS and costs. For example, in a large cohort of over 600 surgical hospitalizations requiring treatment for a gram‐negative infection, antibiotic resistance was an independent predictor of increased LOS and costs.15 These authors quantified the incremental burden of early gram‐negative resistance at over $11,000 in hospital costs.15 Unfortunately, the treatment differences for resistant and sensitive organisms were not examined.15 Similarly, Shorr et al. examined risk factors for prolonged hospital LOS and increased costs in a cohort of 291 patients with MRSA sterile site infection.17 Because in this study 23% of the patients received inappropriate empiric therapy, the authors were able to examine the impact of this exposure on utilization outcomes.17 In an adjusted analysis, inappropriate initial treatment was associated with an incremental increase in the LOS of 2.5 days, corresponding to the unadjusted cost differential of nearly $6,000.17 Although focusing on a different population, our results are consistent with these previous observations that antibiotic resistance and early inappropriate therapy affect hospital utilization parameters, in our case by adding nearly 2 days to the hospital LOS.
Our study has a number of limitations. First, as a retrospective cohort study it is prone to various forms of bias, most notably selection bias. To minimize the possibility of such, we established a priori case definitions and enrolled consecutive patients over a specific period of time. Second, as in any observational study, confounding is an issue. We dealt with this statistically by constructing a multivariable regression model; however, the possibility of residual confounding remains. Third, because some of the wound and ulcer cultures likely were obtained with a swab and thus represented colonization, rather than infection, we may have over‐estimated the rate of inappropriate therapy, and this needs to be followed up in future prospective studies. Similarly, we may have over‐estimated the likelihood of inappropriate therapy among polymicrobial and mixed infections as well, given that, for example, a gram‐negative organism may carry a different clinical significance when cultured from blood (infection) than when it is detected in a decubitus ulcer (potential colonization). Fourth, because we limited our cohort to patients without deep‐seated infections, such as necrotizing fasciitis, other procedures were not collected. This omission may have led to either over‐estimation or under‐estimation of the impact of inappropriate therapy on the outcomes of interest.
The fact that our cohort represents a single large urban academic tertiary care medical center may limit the generalizability of our results only to centers that share similar characteristics. Finally, similar to most other studies of this type, ours lacks data on posthospitalization outcomes and for this reason limits itself to hospital outcomes only.
In summary, we have shown that, similar to other populations with HCAI, a substantial proportion (nearly 1/4) of cSSSI patients with HCAI receive inappropriate empiric therapy for their infection, and this early exposure, though not affecting hospital mortality, is associated with a significant prolongation of the hospitalization by as much as 2 days. Studies are needed to refine decision rules for risk‐stratifying patients with cSSSI HCAI in order to determine the probability of infection with a resistant organism. In turn, such instruments at the bedside may assure improved utilization of appropriately targeted empiric therapy that will both optimize individual patient outcomes and reduce the risk of emergence of antimicrobial resistance.
Appendix
| Principal diagnosis code | Description |
|---|---|
| 680 | Carbuncle and furuncle |
| 681 | Cellulitis and abscess of finger and toe |
| 682 | Other cellulitis and abscess |
| 683 | Acute lymphadenitis |
| 685 | Pilonidal cyst with abscess |
| 686 | Other local infections of skin and subcutaneous tissue |
| 707 | Decubitus ulcer |
| 707.1 | Ulcers of lower limbs, except decubitus |
| 707.8 | Chronic ulcer of other specified sites |
| 707.9 | Chronic ulcer of unspecified site |
| 958.3 | Posttraumatic wound infection, not elsewhere classified |
| 996.62 | Infection due to other vascular device, implant, and graft |
| 997.62 | Infection (chronic) of amputation stump |
| 998.5 | Postoperative wound infection |
| Diagnosis code | Description |
|---|---|
| 728.86 | Necrotizing fasciitis |
| 785.4 | Gangrene |
| 686.09 | Ecthyma gangrenosum |
| 730.00730.2 | Osteomyelitis |
| 630677 | Complications of pregnancy, childbirth and puerperium |
| 288.0 | Neutropenia |
| 684 | Impetigo |
| Procedure code | |
| 39.95 | Plasmapheresis |
| 99.71 | Hemoperfusion |
- ,,, et al.Invasive methicillin‐resistant Staphylococcus aureus infections in the United States.JAMA.2007;298:1762–1771.
- ,,, et al.Methicillin‐resistant S. aureus infections among patients in the emergency department.N Engl J Med.2006;17;355:666–674.
- Hospital‐Acquired Pneumonia Guideline Committee of the American Thoracic Society and Infectious Diseases Society of America.Guidelines for the management of adults with hospital‐acquired pneumonia, ventilator‐associated pneumonia, and healthcare‐associated pneumonia.Am J Respir Crit Care Med.2005;171:388–416.
- ,,, et al.Epidemiology and outcomes of health‐care‐associated pneumonia: Results from a large US database of culture‐positive pneumonia.Chest.2005;128:3854–3862.
- ,,, et al.Health care‐associated bloodstream infections in adults: A reason to change the accepted definition of community‐acquired infections.Ann Intern Med.2002;137:791–797.
- ,,,,,.Healthcare‐associated bloodstream infection: A distinct entity? Insights from a large U.S. database.Crit Care Med.2006;34:2588–2595.
- ,,, et al.Health care‐associated pneumonia and community‐acquired pneumonia: a single‐center experience.Antimicrob Agents Chemother.2007;51:3568–3573.
- ,,,,,.Clinical and economic consequences of failure of initial antibiotic therapy for hospitalized patients with complicated skin and skin‐structure infections.Infect Control Hosp Epidemiol.2008;29:160–169.
- ,,, et al.Skin, soft tissue, bone, and joint infections in hospitalized patients: Epidemiology and microbiological, clinical, and economic outcomes.Infect Control Hosp Epidemiol.2007;28:1290–1298.
- ,,, et al.Methicillin‐resistant Staphylococcus aureus sterile‐site infection: The importance of appropriate initial antimicrobial treatment.Crit Care Med.2006;34:2069–2074.
- ,,, et al.The influence of inadequate antimicrobial treatment of bloodstream infections on patient outcomes in the ICU setting.Chest.2000;118:146–155.
- ,.Modification of empiric antibiotic treatment in patients with pneumonia acquired in the intensive care unit.Intensive Care Med.1996;22:387–394.
- ,,, et al.Clinical importance of delays in the initiation of appropriate antibiotic treatment for ventilator‐associated pneumonia.Chest.2002;122:262–268.
- ,,,,.Antimicrobial therapy escalation and hospital mortality among patients with HCAP: A single center experience.Chest.2008;134:963–968.
- ,,, et al.Cost of gram‐negative resistance.Crit Care Med.2007;35:89–95.
- ,,, et al.Epidemiology and outcomes of hospitalizations with complicated skin and skin‐structure infections: implications of healthcare‐associated infection risk factors.Infect Control Hosp Epidemiol.2009;30:1203–1210.
- ,,.Inappropriate therapy for methicillin‐resistant Staphylococcus aureus: resource utilization and cost implications.Crit Care Med.2008;36:2335–2340.
Copyright © 2010 Society of Hospital Medicine

Clinical and Economic Outcomes of Community‐Acquired Pneumonia
Staphylococcus aureus (S. aureus) is well recognized as a major cause of nosocomial and healthcare‐associated pneumonia (HCAP). These infections are associated with substantial morbidity and mortality, and generate high medical costs.14 The significance of S. aureus in community‐acquired pneumonia (CAP) is less clear. Historically, S. aureus has not been considered a common pathogen in CAP, usually arising in association with or following influenza or an influenza‐like syndrome.58 However, with the increasing prevalence of methicillin‐resistant S. aureus (MRSA) as a cause of HCAPand most recently, serious community‐acquired non‐pulmonary infectionsinterest in this pathogen and its impact beyond the hospital have been expanding. During the 2003 to 2004 influenza season, 15 cases of influenza‐associated MRSA CAP were identified.6 In January 2007, the US Centers for Disease Control and Prevention (CDC) received reports of an additional 10 cases of severe MRSA CAP, resulting in six deaths, among previously healthy children and adults in Louisiana and Georgia.7 Kallen et al.9 recently reported 51 cases from 19 states between November 2006 and April 2007. To the best of our knowledge, these reports represent the largest case series describing MRSA in CAP.
Earlier studies have suggested a relationship between the outcome of S. aureus infection and the presence of various patient and strain characteristics.1013 Most observations regarding the adverse impact of MRSA on patient outcomes have arisen from analyses of cohorts of patients with either mixed infections, bacteremias, or nosocomial infection. There is little information on outcomes in patients with S. aureus CAP. To address this issue, we conducted a retrospective study of patients with culture‐proven S. aureus pneumonia admitted to a large urban hospital.
Materials and Methods
Data Source
This retrospective study was conducted at Henry Ford Hospital in Detroit, MI, a 903‐bed tertiary care center. (Preliminary findings from the study have been presented at annual meetings of the Infectious Diseases Society of America [IDSA], the American College of Chest Physicians [ACCP], and the Interscience Conference on Antimicrobial Agents and Chemotherapy [ICAAC].) Data were obtained from the Henry Ford CarePlus Electronic Medical Record database, the Henry Ford Infectious Diseases Research Laboratory database, and the cost component of the Corporate Data Store, which is a central repository of data on patient encounters at Henry Ford Hospital and all Henry Ford Health System (HFHS) ambulatory care sites.
Sample Selection
The source population for the study consisted of all admissions to Henry Ford Hospital between January 2005 and May 2008 (study period) Patients were included in the study sample if they had: (1) a discharge diagnosis (principal or secondary) of pneumonia (International Classification of Diseases 9th Edition, Clinical Modification [ICD‐9‐CM] diagnosis codes 481.X 486.X) on their discharge summary or in their medical record; (2) a positive chest x‐ray (ie, infiltrate, consolidation, pleural effusion) within 48 hours of hospital admission; (3) an abnormal temperature (>38.3C [101.0F] or <36C [96.8F]), an abnormal white blood count (WBC) (>12,000/mm3 or <4,000/mm3), or increased sputum production on their day of hospital admission; and (4) a positive blood or respiratory culture for S. aureus within 48 hours of hospital admission.
Among these identified patients, those with probable HCAP were excluded from the study sample, based on evidence of: (1) hospitalization for 2 days during the 90‐day period preceding the index hospitalization; (2) admission to hospital from a nursing home or long‐term care facility; (3) hemodialysis 30 days prior to hospital admission; (4) receipt of cancer chemotherapy, IV antibiotic therapy, or wound care 30 days prior to hospital admission; or (5) receipt of an immunosuppressant at the time of hospital admission. All remaining patients were assumed to have CAP.
Data Extraction
For each admission in the study sample, selected demographic and clinical information was extracted from inpatient and outpatient medical records, beginning 1 year prior to the date of hospital admission and ending 30 days subsequent to the date of hospital discharge or the date of discontinuation of antibiotic therapy, whichever occurred later. All data were extracted by trained medical abstractors, using a set of case‐report forms developed specifically for this study.
Study Measures
Baseline demographic and clinical characteristics of study subjects were examined, including age, sex, race, evidence of positive S. aureus culture during the 1‐year period prior to hospital admission, history of selected disease conditions, and clinical status at admission (eg, comorbidities, vital signs, WBC, platelet count). A Confusion, Urea nitrogen, Respiratory rate, Blood pressure, 65 years of age and older score (CURB‐65) was calculated for each patient, based on clinical information at hospital admission.14 (A CURB‐65 score of 0 indicates a low [<1%] risk of death from pneumonia, while a score of 5 indicates a very high [57%] risk of death.)
Patients were designated as having MRSA or MSSA CAP based on the results of blood or respiratory cultures obtained within 48 hours of hospital admission. MRSA isolates were initially identified using automated dilution testing, in accordance with guidelines of the Clinical and Laboratory Standards Institute.15 The genotypic and phenotypic characteristics of MRSA isolates were examined, including susceptibility to vancomycin and presence of the Panton‐Valentine leukocidin (PVL) gene. Minimum inhibitory concentrations (MICs) for vancomycin were ascertained using the E‐test (AB BIODISK, Solna, Sweden).16 The PVL gene was detected using pulse field gel electrophoresis patterns (PFGE) and polymerase chain reaction. PFGE was performed using the restriction endonuclease SmaI. All S. aureus isolates were entered into a database using Gel Doc 2000 (BioRad) gel documentation system, and PFGE patterns were analyzed using BioNumerics Version 3.5, and grouped into Pulse‐field types using DICE coefficients and 80% relatedness.17
Initial antibiotic therapy was defined to consist of all antibiotics received within the first 48 hours in the hospital, regardless of sequence. Appropriateness of initial antibiotic therapy was ascertained based on susceptibility of the organism to the initial regimen received. Patients with MRSA isolates were designated as having received appropriate initial therapy if they were given vancomycin, linezolid or tigecycline. Those with MSSA isolates were designated as having received appropriate initial therapy if they were given a beta‐lactam, vancomycin, linezolid, or tigecycline. For patients with MRSA or MSSA that received doxycycline, clindamycin, or sulfamethoxazole/trimethoprim, each culture was evaluated individually to determine appropriateness, defined as in vitro susceptibility of the antimicrobial received to the organism. Clinical and economic outcomes of interest included: (1) thoracic surgery for pneumonia any time prior to hospital discharge; (2) receipt of mechanical ventilation any time prior to hospital discharge; (3) admission to an intensive care unit (ICU), irrespective of reason, anytime prior to hospital discharge; (4) length of stay in hospital; (5) total hospital charges for all services provided between hospital admission and hospital discharge; and (6) in‐hospital death (case‐fatality)
Statistical Analyses
We examined the baseline demographic and clinical characteristics of patients in the study sample, on an overall basis and for those with MRSA vs. MSSA isolates respectively. Categorical measures were summarized using frequency distributions and percentages; means, standard deviations (SDs) and medians were employed for continuous measures.
Clinical and economic outcomes were similarly examined, on an overall basis and for patients with MSSA vs. MRSA isolates. For patients with MRSA, we also examined outcomes in relation to selected genotypic and phenotypic characteristics of MRSA isolates, including MIC to vancomycin (1.00 g/mL, 1.50 g/mL, and 2.00 g/mL) and presence of the gene for PVL toxin.
Statistical significance of differences between patients with MRSA vs. MSSA isolates was assessed using t‐tests for continuous measures, and chi‐square tests for categorical measures; statistical significance was similarly assessed for patients with the PVL toxin gene vs. those without it. Because the distribution of vancomycin MICs was highly skewed, statistical significance of differences in outcomes was not assessed in relation to this measure.
All analyses were conducted using SAS Proprietary Software, Release 9.1 (SAS Institute Inc., Cary, NC). Missing and/or incomplete case‐report form data were not imputed, as observations were presumed not to be missing at random.
Results
There were 282 admissions to Henry Ford Hospital between January 2005 and May 2008 of patients with pneumonia who had positive blood or respiratory cultures for S. aureus within 48 hours of admission. (The total number of admissions over this period of patients with a principal diagnosis of pneumonia was 3894). Twelve patients had a negative chest x‐ray or negative clinical findings for pneumonia on the day of hospital admission and were excluded from the analysis. An additional 142 (53%) patients had evidence of HCAP and were excluded from the analysis. The final study sample therefore consisted of 128 patients with S. aureus CAP; their demographic and clinical characteristics are presented in Table 1.
| Characteristic | Overall (n = 128) | MSSA (n = 73) | MRSA (n = 55) | MSSA vs. MRSA P Value |
|---|---|---|---|---|
| ||||
| Age, years | ||||
| 1734 | 10 (7.8) | 6 (8.2) | 4 (7.3) | 1.000 |
| 3549 | 22 (17.2) | 12 (16.4) | 10 (18.2) | 0.817 |
| 5064 | 47 (36.7) | 26 (35.6) | 21 (38.2) | 0.854 |
| 65 | 49 (38.3) | 29 (39.7) | 20 (36.4) | 0.717 |
| Mean (SD) | 59.8 (17.0) | 59.8 (16.6) | 59.8 (17.8) | 0.999 |
| Sex | ||||
| Male | 74 (57.8) | 35 (47.9) | 39 (70.9) | 0.011 |
| Female | 54 (42.2) | 38 (52.1) | 16 (29.1) | |
| Race | ||||
| African American | 86 (67.2) | 46 (63.0) | 40 (72.7) | 0.261 |
| Caucasian | 36 (28.1) | 24 (32.9) | 12 (21.8) | 0.233 |
| Other/unknown | 6 (4.7) | 3 (4.1) | 3 (5.5) | 1.000 |
| Prior positive S. aureus culture* | ||||
| MSSA | 4 (3.1) | 4 (5.5) | 0 (0.0) | 0.134 |
| MRSA | 4 (3.1) | 1 (1.4) | 3 (5.5) | 0.314 |
| Both | 0 (0.0) | 0 (0.0) | 0 (0.0) | |
| Comorbidities | ||||
| Active malignancy | 11 (8.6) | 6 (8.2) | 5 (9.1) | 1.000 |
| Acute renal failure | 60 (46.9) | 31 (42.5) | 29 (52.7) | 0.285 |
| Coronary artery bypass grafting | 7 (5.5) | 5 (6.8) | 2 (3.6) | 0.698 |
| Coronary artery disease | 39 (30.5) | 21 (28.8) | 18 (32.7) | 0.700 |
| Cerebrovascular disease | 23 (18.0) | 15 (20.5) | 8 (14.5) | 0.487 |
| Congestive heart failure | 40 (31.3) | 22 (30.1) | 18 (32.7) | 0.848 |
| Chronic renal failure | 23 (18.0) | 12 (16.4) | 11 (20.0) | 0.647 |
| Chronic obstructive pulmonary disease | 31 (24.2) | 14 (19.2) | 17 (30.9) | 0.147 |
| Diabetes | 38 (29.7) | 19 (26.0) | 19 (34.5) | 0.332 |
| Diabetes mellitus with organ damage | 4 (3.1) | 2 (2.7) | 2 (3.6) | 1.000 |
| End‐stage renal disease with receipt of dialysis | 1 (0.8) | 1 (1.4) | 0 (0.0) | 1.000 |
| HIV/AIDS | 7 (5.5) | 2 (2.7) | 5 (9.1) | 0.138 |
| Myocardial infarction | 27 (21.1) | 15 (20.5) | 12 (21.8) | 1.000 |
| Peripheral vascular disease | 26 (20.3) | 10 (13.7) | 16 (29.1) | 0.045 |
| CURB‐65 | ||||
| 0 | 15 (11.7) | 6 (8.2) | 9 (16.4) | 0.175 |
| 1 | 36 (28.1) | 21 (28.8) | 15 (27.3) | 1.000 |
| 2 | 48 (37.5) | 28 (38.4) | 20 (36.4) | 0.855 |
| 3 | 20 (15.6) | 14 (19.2) | 6 (10.9) | 0.229 |
| 4 | 8 (6.3) | 3 (4.1) | 5 (9.1) | 0.288 |
| 5 | 1 (0.8) | 1 (1.4) | 0 (0.0) | 1.000 |
| Mean(SD) | 1.8 (1.1) | 2 (1.0) | 2 (1.2) | 0.379 |
Mean (SD) age of study subjects was 60 (17.0) years; 72% were nonwhite, and 58% were males. Prevalence of selected comorbidities, including acute renal failure, coronary artery disease, congestive heart failure, chronic obstructive pulmonary disease, diabetes, myocardial infarction, and peripheral vascular disease was high (>20%). Mean (SD) CURB score at admission was 1.8 (1.1); scores did not differ significantly between MRSA vs. MSSA patients. Eight patients (6%) had evidence of positive S. aureus cultures in the year prior to admission.
A total of 55 (43%) patients had positive MRSA cultures within the first 48 hours of admission, while the remainder (n = 73 [57%]) had cultures positive for MSSA. Among the 55 patients with MRSA, 23 (42%) had USA300 MRSA strains that produced PVL toxin. Only 18% of MRSA patients had MICs to vancomycin of 1 g/mL; most remaining patients (73%) had 1.5 g/mL MIC values. Thirty‐one patients (24%) died prior to hospital discharge (Table 2). Eighty‐eight (69%) patients received mechanical ventilation, and 79% were admitted to ICU; 25% of patients underwent thoracic surgery for pneumonia. Mean (SD) length of stay in hospital was 17.0 (15.7) days, and mean (SD) total charges per hospitalization were $127,922 ($154,605). (Mean length of stay in hospital was 5.8 days for all 3894 patients with a principal discharge diagnosis of pneumonia, and mean total charges were $29,448).
| Study Outcomes | Overall (n = 128) | MSSA (n = 73) | MRSA (n = 55) | P Value | PVL Toxin* (n = 23) | No PVL Toxin* (n = 28) | P Value |
|---|---|---|---|---|---|---|---|
| |||||||
| Case fatality | 31 (24.2) | 19 (26.0) | 12 (21.8) | 0.678 | 4 (17.4) | 6 (21.4) | 1.000 |
| Surgery for pneumonia | 32 (25.0) | 19 (26.0) | 13 (23.6) | 0.838 | 7 (30.4) | 5 (17.9) | 0.329 |
| Receipt of mechanical ventilation | 88 (68.8) | 56 (76.7) | 32 (58.2) | 0.034 | 12 (52.2) | 18 (64.3) | 0.576 |
| ICU admission | 101 (78.9) | 60 (82.2) | 41 (74.5) | 0.382 | 15 (65.2) | 22 (78.6) | 0.348 |
| Length of stay, days | |||||||
| Mean (SD) | 17.2 (15.7) | 16.4 (15.0) | 18.2 (16.6) | 0.525 | 25.3 (22.6) | 13.2 (7.7) | 0.020 |
| Median | 13.0 | 13.0 | 13.0 | 16.0 | 12.0 | ||
| Total charges, $ | |||||||
| Mean (SD) | 127,922 (154,605) | 135,784 (170,046) | 117,489 (132,164) | 0.510 | 162,124 (186,923) | 85,215 (57,957) | 0.066 |
| Median | 81,374 | 84,593 | 71,868 | 106,599 | 67,328 | ||
Notwithstanding the fact that patients with MRSA were more than twice as likely to receive inappropriate initial therapy (44% for MRSA vs. 18% for MSSA; odds ratio [OR], 3.57; 95% confidence interval [CI], 1.607.97; P = 0.0015), there were no statistically significant differences in in‐hospital mortality (26% for MSSA vs. 22% for MRSA; P = 0.678), surgery for pneumonia (26% vs. 24%; P = 0.838), or admission to ICU (82% vs. 74%; P = 0.382). Patients with MSSA CAP were more likely to receive mechanical ventilation (77% vs. 58%; P = 0.034). Mean (SD) total charges per admission did not differ between patients with MSSA vs. MRSA CAP ($135,784 [$170,046] vs $117,489 [$132,164], respectively [P = 0.510]). (30‐day mortality following hospital discharge was 24% for MRSA CAP patients and 30% for MSSA CAP patients.)
Among patients with MRSA CAP, there were no notable differences in outcomes between those with strains with the PVL toxin vs. those without it (Table 2). Mean (SD) length of stay in hospital, however, was significantly longer among the former patients (25 [22.6] days vs. 13 [7.7] days for those without PVL toxin; P = 0.020). Reflecting this difference, mean (SD) total charges per admission were $76,909 higher among MRSA patients with PVL‐positive strains vs. those with PVL‐negative strains ($162,124 [$186,923] vs. $85,215 [$57,957] respectively; P = 0.066).
Among MRSA patients with MICs to vancomycin of 1.5 g/mL, 17% died in hospital, 20% underwent surgery for pneumonia, 60% received mechanical ventilation, and 75% were admitted to ICU. Mean (SD) total charges per admission were $104,514 ($112,606) (Table 2).
Discussion
To the best of our knowledge, this is the largest observational study to date of outcomes in patients with S. aureus CAP. Our results indicate that MRSA represents almost one‐half of all such infections, with USA300 strains accounting for a substantial proportion of these cases. In addition, for most outcome measures, there were no significant differences between patients with MSSA vs. MRSA CAP. In patients with MRSA CAP, however, those with PVL‐positive strains had longer stays in the hospital and had higher total costs of hospitalization.
Our study highlights the significant clinical and economic burden of S. aureus CAP. In the US, the mortality rate in patients hospitalized with CAP is about 8%, while mean length of stay is approximately 5 days (it was 5.8 days in our institution among all patients with CAP). In contrast, we found that most patients with S. aureus CAP were admitted to ICU, and that nearly one in four died during hospitalization. One possible explanation for these findings is that patients with S. aureus CAP may often receive inappropriate initial antibiotic therapy, a major predictor of adverse outcome in infection. The overall rate of inappropriate treatment, however, was low in our study (although we note that optimal antibiotic treatment is not clearly defined for the USA300 strain, and as a result, we assumed that vancomycin would be appropriate for all MRSA infections). A more likely explanation for our findings is the severity of CAP associated with S. aureus, whether MRSA or MSSA. Given the nature of S. aureus infections, the need for prevention (and potentially, development of a vaccine) remains crucial.
While MRSA has been studied extensively as a cause of bacteremia, as well as HCAP and VAP, it has not been well studied in CAP. Patients with MRSA bacteremia have been shown to have a higher mortality risk and higher healthcare costs than those with MSSA infections, and a meta‐analysis of 31 studies of patients with S. aureus bloodstream infections demonstrated a significant increase in mortality among patients with MRSA vs. MSSA bacteremia.1820 Outcomes when comparing MRSA and MSSA in VAP are slightly more variable. A higher rate of mortality has been reported in patients with pneumonia caused by MRSA vs. MSSA, but others found no difference after controlling for potential confounders.21, 22 We found that case fatality, surgery for pneumonia, ICU admission, length of stay, and total hospital charges do not differ significantly between patients with MRSA vs. MSSA CAP. This suggests that appreciation of the burden of MRSA can only be done in the context of the syndrome in question, and that conclusions from analyses of bacteremia and VAP may not be generalizable to CAP.
In the US, an increasing number of community‐associated infections are due to MRSA. Skin and skin structure infections comprise the majority of community‐associated MRSA infections and are caused by a single pulsed field type, termed USA300. These strains are believed to have distinctive virulence and epidemiologic characteristics. USA300 isolates typically are resistant only to beta‐lactam and macrolide antimicrobial agents and contain genes for the PVL toxin, which typically are not present in strains of healthcare‐associated MRSA.23 Recent studies of acute pneumonia with animal models and in humans have suggested that the PVL toxinalone or in combination with other virulence factorsis associated with the development of necrotizing pneumonia.2430 In our study, 23 patients with MRSA CAP had strains that contained PVL toxin, and these patients had longer stays in hospital and higher total hospital charges than those with MRSA CAP not containing the PVL toxin. This is an important finding, as length of stay is an important proxy for morbidity and case severity. This also extends the finding of previous case studies reporting that MRSA CAP with PVL toxin is associated with worse outcomes.2430 Moreover, we clearly document that PVL‐positive strains are emerging as a cause of pulmonary infection in broader clinical scenarios. As such, physicians must remain vigilant for this toxin‐producing strain. The full extent of the impact of PVL‐positive strains in our study is unknown, as we cannot ascertain whether morbidity was worse because of the PVL toxin itself, or because most patients were not treated with clindamycin or linezolid, which inhibit toxin production.
We failed to observe a correlation between MICs to vancomycin and the outcomes we studied. The clinical significance of reduced susceptibility of S. aureus to vancomycin remains a controversial issue. In our study, there was no significant association between MICs to vancomycin and mortality, need for surgery, ICU admission, length of stay, or total hospital charges. Sakoulas et al.11 reported that as vancomycin MICs for MRSA isolates rose within the susceptible range from 0.5 mcg/mL to 2.0 mcg/mL, so too did the number of clinical failures among bacteremic patients receiving vancomycin. Moise‐Broder et al.31 reported a similar finding in a study of 63 patients with MRSA bacteremia, of whom 45 failed or were intolerant of vancomycin therapy. In a more recent report, Soriano et al.12 prospectively evaluated 414 episodes of bacteremia. The authors concluded that mortality in patients with MRSA bacteremia is significantly higher when the empiric antimicrobial agent is inappropriate and when vancomycin is used to treat infections involving strains with MICs >1.0 mcg/mL. In pneumonia, Hidayat et al.13 reported that patients with infections due to pathogens with higher MICs to vancomycin had a higher rate of mortality than those with lower MICs. Our findings likely differ from this report because of the proportion of subjects with PVL‐positive strains, and because of the skew in the distribution of vancomycin MICs. More specifically, the majority of patients had higher MIC strains, clustered around 1.5 mg/L, leaving us with few lower MIC strains and fewer strains with MICs of 2.0 mcg/mL for comparison, and therefore limited statistical power to assess the relationship between MICs and outcomes.
There were no clinical features that clearly distinguished patients with MRSA vs. MSSA CAP. This suggests that if physicians hope to ensure that patients with MRSA CAP receive appropriate initial antibiotic therapy, they cannot base therapeutic decision‐making (ie, use of an anti‐MRSA treatment) on clinical criteria. Presently, national guidelines recommend diagnostic testing only if the results might affect clinical decisions (eg, antimicrobial management).32 Furthermore, the IDSA/ATS guidelines recommend sputum cultures along with blood cultures and other diagnostic tests only in select cases (eg, those with severe disease). Since beginning optimal therapy quickly can reduce mortality in pneumonia,33 our results indicate a need for both rapid diagnostic tests to identify patients with MRSA, and reevaluation of current recommendations for diagnostic testing in CAP.
Our study has several important limitations. First, its retrospective design exposes it to many forms of bias. Second, because the diagnosis of pneumonia can be challenging, we required that all patients have both clinical and radiologic evidence of the disease. However, we may have thereby excluded some admissions for S. aureus pneumonia among the over 3000 pneumonia admissions to our hospital during the study period.
Third, we only included patients with culture evidence of infection. This was necessary by design, but as a result we may have failed to identify some patients with S. aureus infections because of the limitations of respiratory culture technology. Patients on general practice units often do not get cultured, and accordingly we may have missed those with milder disease caused by S. aureus.
Fourth, we used only one method of MIC testing to determine vancomycin susceptibility. It would have been of interest to have used automated dilution testing also and to have compared both methods. Comparison of laboratory methods was not among our study objectives, and most of the earlier studies examining epidemiology and outcomes used a single laboratory testing method only.
Finally, since the study was conducted at a large urban teaching hospital in a city with a long history of issues with MRSA and resistance, the generalizability of our results may be limited.
In summary, our study provides further evidence that S. aureus is an important pathogen in CAP. MRSA CAP has few obvious characteristics that differentiate it from MSSA CAP. MRSA and MSSA CAP are both very serious infections that should be treated aggressively to avoid poor outcomes.
- .Staphylococcus aureus: a well‐armed pathogen.Clin Infect Dis.1998;26:1179–1181.
- .Staphylococcus aureus infections.N Engl J Med.1998;339:520–532.
- .The growing menace of community‐acquired methicillin‐resistant Staphylococcus aureus.Ann Intern Med.2006;144:368–370.
- ,,, et al.Predictors of mortality for methicillin‐resistant Staphylococcus aureus health‐care‐associated pneumonia: specific evaluation of vancomycin pharmacokinetic indices.Chest.2006;130:947–955.
- ,,,.Bacterial pneumonia during the Hong Kong influenza epidemic of 1968–1969.Arch Intern Med.1971;127:1037–1041.
- ,,, et al.Severe community‐acquired pneumonia due to Staphylococcus aureus, 2003–04 influenza season.Emerg Infect Dis.2006;12:894–899.
- Centers for Disease Control and Prevention.Severe methicillin‐resistant Staphylococcus aureus community‐acquired pneumonia associated with influenza—Louisiana and Georgia, December 2006‐January 2007.Morb Mortal Wkly Rep.2007;56:325–329.
- ,,.Incidence, characteristics and outcomes of patients with severe community acquired‐MRSA pneumonia.Eur Respir J.2009;34:1148–1158.
- ,,, et al.Staphylococcus aureus community‐acquired pneumonia during the 2006 to 2007 influenza season.Ann Emerg Med.2009;53:358–365.
- ,,, et al.Treatment outcomes for serious infections caused by methicillin‐resistant Staphylococcus aureus with reduced vancomycin susceptibility.Clin Infect Dis.2004;38:521–528.
- ,,, et al.Relationship of MIC and bactericidal activity to efficacy of vancomycin for treatment of methicillin‐resistant Staphylococcus aureus bacteremia.J Clin Microbiol.2004;42:2398–2402.
- ,,, et al.Influence of vancomycin minimum inhibitory concentration on the treatment of Methicillin‐resistant Staphylococcus aureus bacteremia.Clin Infect Dis.2008;46:193–200.
- ,,, et al.High‐dose vancomycin therapy for methicillin‐resistant Staphylococcus aureus infections.Arch Intern Med.2006;166:2138–2144.
- ,,, et al.Defining community acquired pneumonia severity on presentation to hospital: An international derivation and validation study.Thorax.2003;58(5):377–382.
- Clinical and Laboratory Standards Institute (CLSI).Methods for Dilution Antimicrobial Susceptibility Tests for Bacteria That Grow Aerobically: Approved Standard. 8th ed. CLSI document M07‐A8 2008;29(2):1–65. Available at: www.clsi.org/source/orders/free/m07‐a8.pdf.
- ,,,.A multicenter study evaluating the current strategies for isolating Staphylococcus aureus strains with reduced susceptibility to glycopeptides.J Clin Microbiol.2007;45:329–332.
- ,,,,.Application of molecular techniques to the study of hospital infection.Clin Microbiol Rev.2006;19:512–530.
- ,,.Nosocomial methicillin‐resistant Staphylococcus aureus bacteremia: Is it any worse than nosocomial methicillin‐sensitive Staphylococcus aureus bacteremia?Infect Control Hosp Epidemiol.2000;21:645–648.
- ,.Clinical and economic impact of methicillin resistance in patients with Staphylococcus aureus bacteremia.Diagn Microbiol Infect Dis.2005;52:113–122.
- ,,, et al.Comparison of mortality associated with methicillin‐resistant and methicillin‐susceptible Staphylococcus aureus bacteremia: A meta‐analysis.Clin Infect Dis.2003;36:53–59.
- ,,, et al.Ventilator‐associated pneumonia by Staphylococcus aureus: Comparison of methicillin‐resistant and methicillin‐sensitive episodes.Am J Respir Crit Care Med.1994;150:1545–1549.
- ,,, et al.Is methicillin resistance associated with a worse prognosis in Staphylococcus aureus ventilator‐associated pneumonia?Clin Infect Dis.2005;41:1224–1231.
- ,,, et al.Characterization of a strain of community‐associated methicillin‐resistant Staphylococcus aureus widely disseminated in the United States.J Clin Microbiol.2006;44:108–111.
- .Staphylococcus aureus, Panton‐Valentine leukocidin, and necrotising pneumonia.BMJ.2005;331:793–794.
- ,,, et al.Methicillin‐resistant Staphylococcus aureus necrotizing pneumonia.Emerg Infect Dis.2005;11:1647–1648.
- ,.Fatal necrotizing pneumonia due to community‐acquired methicillin‐resistant Staphylococcus aureus (MRSA).Med J Aust.2004;181:228–229.
- ,,.Pleuropulmonary complications of Panton‐Valentine leukocidin‐positive community‐acquired methicillin‐resistant Staphylococcus aureus: Importance of treatment with antimicrobials inhibiting exotoxin production.Chest.2005;128:2732–2738.
- ,,, et al.Severe community‐onset pneumonia in healthy adults caused by methicillin‐resistant Staphylococcus aureus carrying the Panton‐Valentine leukocidin genes.Clin Infect Dis.2005;40:100–107.
- ,,, et al.Staphylococcus aureus Panton‐Valentine leukocidin causes necrotizing pneumonia.Science.2007;315:1130–1133.
- ,,, et al.Association between Staphylococcus aureus strains carrying gene for Panton‐Valentine leukocidin and highly lethal necrotizing pneumonia in young immunocompetent patients.Lancet.2002;359:753–759.
- ,,, et al.Accessory gene regulator group II polymorphism in methicillin‐resistant Staphylococcus aureus is predictive of failure of vancomycin therapy.Clin Infect Dis.2004;38:1700–1705.
- ,,, et al.Infectious Diseases Society of America/American Thoracic Society consensus guidelines on the management of community‐acquired pneumonia in adults.Clin Infect Dis.2007;44(Suppl 2):S27–S72.
- ,,, et al.Antimicrobial therapy escalation and hospital mortality among patients with health‐care‐associated pneumonia: a single center experience.Chest.2008;134:963–968.
Staphylococcus aureus (S. aureus) is well recognized as a major cause of nosocomial and healthcare‐associated pneumonia (HCAP). These infections are associated with substantial morbidity and mortality, and generate high medical costs.14 The significance of S. aureus in community‐acquired pneumonia (CAP) is less clear. Historically, S. aureus has not been considered a common pathogen in CAP, usually arising in association with or following influenza or an influenza‐like syndrome.58 However, with the increasing prevalence of methicillin‐resistant S. aureus (MRSA) as a cause of HCAPand most recently, serious community‐acquired non‐pulmonary infectionsinterest in this pathogen and its impact beyond the hospital have been expanding. During the 2003 to 2004 influenza season, 15 cases of influenza‐associated MRSA CAP were identified.6 In January 2007, the US Centers for Disease Control and Prevention (CDC) received reports of an additional 10 cases of severe MRSA CAP, resulting in six deaths, among previously healthy children and adults in Louisiana and Georgia.7 Kallen et al.9 recently reported 51 cases from 19 states between November 2006 and April 2007. To the best of our knowledge, these reports represent the largest case series describing MRSA in CAP.
Earlier studies have suggested a relationship between the outcome of S. aureus infection and the presence of various patient and strain characteristics.1013 Most observations regarding the adverse impact of MRSA on patient outcomes have arisen from analyses of cohorts of patients with either mixed infections, bacteremias, or nosocomial infection. There is little information on outcomes in patients with S. aureus CAP. To address this issue, we conducted a retrospective study of patients with culture‐proven S. aureus pneumonia admitted to a large urban hospital.
Materials and Methods
Data Source
This retrospective study was conducted at Henry Ford Hospital in Detroit, MI, a 903‐bed tertiary care center. (Preliminary findings from the study have been presented at annual meetings of the Infectious Diseases Society of America [IDSA], the American College of Chest Physicians [ACCP], and the Interscience Conference on Antimicrobial Agents and Chemotherapy [ICAAC].) Data were obtained from the Henry Ford CarePlus Electronic Medical Record database, the Henry Ford Infectious Diseases Research Laboratory database, and the cost component of the Corporate Data Store, which is a central repository of data on patient encounters at Henry Ford Hospital and all Henry Ford Health System (HFHS) ambulatory care sites.
Sample Selection
The source population for the study consisted of all admissions to Henry Ford Hospital between January 2005 and May 2008 (study period) Patients were included in the study sample if they had: (1) a discharge diagnosis (principal or secondary) of pneumonia (International Classification of Diseases 9th Edition, Clinical Modification [ICD‐9‐CM] diagnosis codes 481.X 486.X) on their discharge summary or in their medical record; (2) a positive chest x‐ray (ie, infiltrate, consolidation, pleural effusion) within 48 hours of hospital admission; (3) an abnormal temperature (>38.3C [101.0F] or <36C [96.8F]), an abnormal white blood count (WBC) (>12,000/mm3 or <4,000/mm3), or increased sputum production on their day of hospital admission; and (4) a positive blood or respiratory culture for S. aureus within 48 hours of hospital admission.
Among these identified patients, those with probable HCAP were excluded from the study sample, based on evidence of: (1) hospitalization for 2 days during the 90‐day period preceding the index hospitalization; (2) admission to hospital from a nursing home or long‐term care facility; (3) hemodialysis 30 days prior to hospital admission; (4) receipt of cancer chemotherapy, IV antibiotic therapy, or wound care 30 days prior to hospital admission; or (5) receipt of an immunosuppressant at the time of hospital admission. All remaining patients were assumed to have CAP.
Data Extraction
For each admission in the study sample, selected demographic and clinical information was extracted from inpatient and outpatient medical records, beginning 1 year prior to the date of hospital admission and ending 30 days subsequent to the date of hospital discharge or the date of discontinuation of antibiotic therapy, whichever occurred later. All data were extracted by trained medical abstractors, using a set of case‐report forms developed specifically for this study.
Study Measures
Baseline demographic and clinical characteristics of study subjects were examined, including age, sex, race, evidence of positive S. aureus culture during the 1‐year period prior to hospital admission, history of selected disease conditions, and clinical status at admission (eg, comorbidities, vital signs, WBC, platelet count). A Confusion, Urea nitrogen, Respiratory rate, Blood pressure, 65 years of age and older score (CURB‐65) was calculated for each patient, based on clinical information at hospital admission.14 (A CURB‐65 score of 0 indicates a low [<1%] risk of death from pneumonia, while a score of 5 indicates a very high [57%] risk of death.)
Patients were designated as having MRSA or MSSA CAP based on the results of blood or respiratory cultures obtained within 48 hours of hospital admission. MRSA isolates were initially identified using automated dilution testing, in accordance with guidelines of the Clinical and Laboratory Standards Institute.15 The genotypic and phenotypic characteristics of MRSA isolates were examined, including susceptibility to vancomycin and presence of the Panton‐Valentine leukocidin (PVL) gene. Minimum inhibitory concentrations (MICs) for vancomycin were ascertained using the E‐test (AB BIODISK, Solna, Sweden).16 The PVL gene was detected using pulse field gel electrophoresis patterns (PFGE) and polymerase chain reaction. PFGE was performed using the restriction endonuclease SmaI. All S. aureus isolates were entered into a database using Gel Doc 2000 (BioRad) gel documentation system, and PFGE patterns were analyzed using BioNumerics Version 3.5, and grouped into Pulse‐field types using DICE coefficients and 80% relatedness.17
Initial antibiotic therapy was defined to consist of all antibiotics received within the first 48 hours in the hospital, regardless of sequence. Appropriateness of initial antibiotic therapy was ascertained based on susceptibility of the organism to the initial regimen received. Patients with MRSA isolates were designated as having received appropriate initial therapy if they were given vancomycin, linezolid or tigecycline. Those with MSSA isolates were designated as having received appropriate initial therapy if they were given a beta‐lactam, vancomycin, linezolid, or tigecycline. For patients with MRSA or MSSA that received doxycycline, clindamycin, or sulfamethoxazole/trimethoprim, each culture was evaluated individually to determine appropriateness, defined as in vitro susceptibility of the antimicrobial received to the organism. Clinical and economic outcomes of interest included: (1) thoracic surgery for pneumonia any time prior to hospital discharge; (2) receipt of mechanical ventilation any time prior to hospital discharge; (3) admission to an intensive care unit (ICU), irrespective of reason, anytime prior to hospital discharge; (4) length of stay in hospital; (5) total hospital charges for all services provided between hospital admission and hospital discharge; and (6) in‐hospital death (case‐fatality)
Statistical Analyses
We examined the baseline demographic and clinical characteristics of patients in the study sample, on an overall basis and for those with MRSA vs. MSSA isolates respectively. Categorical measures were summarized using frequency distributions and percentages; means, standard deviations (SDs) and medians were employed for continuous measures.
Clinical and economic outcomes were similarly examined, on an overall basis and for patients with MSSA vs. MRSA isolates. For patients with MRSA, we also examined outcomes in relation to selected genotypic and phenotypic characteristics of MRSA isolates, including MIC to vancomycin (1.00 g/mL, 1.50 g/mL, and 2.00 g/mL) and presence of the gene for PVL toxin.
Statistical significance of differences between patients with MRSA vs. MSSA isolates was assessed using t‐tests for continuous measures, and chi‐square tests for categorical measures; statistical significance was similarly assessed for patients with the PVL toxin gene vs. those without it. Because the distribution of vancomycin MICs was highly skewed, statistical significance of differences in outcomes was not assessed in relation to this measure.
All analyses were conducted using SAS Proprietary Software, Release 9.1 (SAS Institute Inc., Cary, NC). Missing and/or incomplete case‐report form data were not imputed, as observations were presumed not to be missing at random.
Results
There were 282 admissions to Henry Ford Hospital between January 2005 and May 2008 of patients with pneumonia who had positive blood or respiratory cultures for S. aureus within 48 hours of admission. (The total number of admissions over this period of patients with a principal diagnosis of pneumonia was 3894). Twelve patients had a negative chest x‐ray or negative clinical findings for pneumonia on the day of hospital admission and were excluded from the analysis. An additional 142 (53%) patients had evidence of HCAP and were excluded from the analysis. The final study sample therefore consisted of 128 patients with S. aureus CAP; their demographic and clinical characteristics are presented in Table 1.
| Characteristic | Overall (n = 128) | MSSA (n = 73) | MRSA (n = 55) | MSSA vs. MRSA P Value |
|---|---|---|---|---|
| ||||
| Age, years | ||||
| 1734 | 10 (7.8) | 6 (8.2) | 4 (7.3) | 1.000 |
| 3549 | 22 (17.2) | 12 (16.4) | 10 (18.2) | 0.817 |
| 5064 | 47 (36.7) | 26 (35.6) | 21 (38.2) | 0.854 |
| 65 | 49 (38.3) | 29 (39.7) | 20 (36.4) | 0.717 |
| Mean (SD) | 59.8 (17.0) | 59.8 (16.6) | 59.8 (17.8) | 0.999 |
| Sex | ||||
| Male | 74 (57.8) | 35 (47.9) | 39 (70.9) | 0.011 |
| Female | 54 (42.2) | 38 (52.1) | 16 (29.1) | |
| Race | ||||
| African American | 86 (67.2) | 46 (63.0) | 40 (72.7) | 0.261 |
| Caucasian | 36 (28.1) | 24 (32.9) | 12 (21.8) | 0.233 |
| Other/unknown | 6 (4.7) | 3 (4.1) | 3 (5.5) | 1.000 |
| Prior positive S. aureus culture* | ||||
| MSSA | 4 (3.1) | 4 (5.5) | 0 (0.0) | 0.134 |
| MRSA | 4 (3.1) | 1 (1.4) | 3 (5.5) | 0.314 |
| Both | 0 (0.0) | 0 (0.0) | 0 (0.0) | |
| Comorbidities | ||||
| Active malignancy | 11 (8.6) | 6 (8.2) | 5 (9.1) | 1.000 |
| Acute renal failure | 60 (46.9) | 31 (42.5) | 29 (52.7) | 0.285 |
| Coronary artery bypass grafting | 7 (5.5) | 5 (6.8) | 2 (3.6) | 0.698 |
| Coronary artery disease | 39 (30.5) | 21 (28.8) | 18 (32.7) | 0.700 |
| Cerebrovascular disease | 23 (18.0) | 15 (20.5) | 8 (14.5) | 0.487 |
| Congestive heart failure | 40 (31.3) | 22 (30.1) | 18 (32.7) | 0.848 |
| Chronic renal failure | 23 (18.0) | 12 (16.4) | 11 (20.0) | 0.647 |
| Chronic obstructive pulmonary disease | 31 (24.2) | 14 (19.2) | 17 (30.9) | 0.147 |
| Diabetes | 38 (29.7) | 19 (26.0) | 19 (34.5) | 0.332 |
| Diabetes mellitus with organ damage | 4 (3.1) | 2 (2.7) | 2 (3.6) | 1.000 |
| End‐stage renal disease with receipt of dialysis | 1 (0.8) | 1 (1.4) | 0 (0.0) | 1.000 |
| HIV/AIDS | 7 (5.5) | 2 (2.7) | 5 (9.1) | 0.138 |
| Myocardial infarction | 27 (21.1) | 15 (20.5) | 12 (21.8) | 1.000 |
| Peripheral vascular disease | 26 (20.3) | 10 (13.7) | 16 (29.1) | 0.045 |
| CURB‐65 | ||||
| 0 | 15 (11.7) | 6 (8.2) | 9 (16.4) | 0.175 |
| 1 | 36 (28.1) | 21 (28.8) | 15 (27.3) | 1.000 |
| 2 | 48 (37.5) | 28 (38.4) | 20 (36.4) | 0.855 |
| 3 | 20 (15.6) | 14 (19.2) | 6 (10.9) | 0.229 |
| 4 | 8 (6.3) | 3 (4.1) | 5 (9.1) | 0.288 |
| 5 | 1 (0.8) | 1 (1.4) | 0 (0.0) | 1.000 |
| Mean(SD) | 1.8 (1.1) | 2 (1.0) | 2 (1.2) | 0.379 |
Mean (SD) age of study subjects was 60 (17.0) years; 72% were nonwhite, and 58% were males. Prevalence of selected comorbidities, including acute renal failure, coronary artery disease, congestive heart failure, chronic obstructive pulmonary disease, diabetes, myocardial infarction, and peripheral vascular disease was high (>20%). Mean (SD) CURB score at admission was 1.8 (1.1); scores did not differ significantly between MRSA vs. MSSA patients. Eight patients (6%) had evidence of positive S. aureus cultures in the year prior to admission.
A total of 55 (43%) patients had positive MRSA cultures within the first 48 hours of admission, while the remainder (n = 73 [57%]) had cultures positive for MSSA. Among the 55 patients with MRSA, 23 (42%) had USA300 MRSA strains that produced PVL toxin. Only 18% of MRSA patients had MICs to vancomycin of 1 g/mL; most remaining patients (73%) had 1.5 g/mL MIC values. Thirty‐one patients (24%) died prior to hospital discharge (Table 2). Eighty‐eight (69%) patients received mechanical ventilation, and 79% were admitted to ICU; 25% of patients underwent thoracic surgery for pneumonia. Mean (SD) length of stay in hospital was 17.0 (15.7) days, and mean (SD) total charges per hospitalization were $127,922 ($154,605). (Mean length of stay in hospital was 5.8 days for all 3894 patients with a principal discharge diagnosis of pneumonia, and mean total charges were $29,448).
| Study Outcomes | Overall (n = 128) | MSSA (n = 73) | MRSA (n = 55) | P Value | PVL Toxin* (n = 23) | No PVL Toxin* (n = 28) | P Value |
|---|---|---|---|---|---|---|---|
| |||||||
| Case fatality | 31 (24.2) | 19 (26.0) | 12 (21.8) | 0.678 | 4 (17.4) | 6 (21.4) | 1.000 |
| Surgery for pneumonia | 32 (25.0) | 19 (26.0) | 13 (23.6) | 0.838 | 7 (30.4) | 5 (17.9) | 0.329 |
| Receipt of mechanical ventilation | 88 (68.8) | 56 (76.7) | 32 (58.2) | 0.034 | 12 (52.2) | 18 (64.3) | 0.576 |
| ICU admission | 101 (78.9) | 60 (82.2) | 41 (74.5) | 0.382 | 15 (65.2) | 22 (78.6) | 0.348 |
| Length of stay, days | |||||||
| Mean (SD) | 17.2 (15.7) | 16.4 (15.0) | 18.2 (16.6) | 0.525 | 25.3 (22.6) | 13.2 (7.7) | 0.020 |
| Median | 13.0 | 13.0 | 13.0 | 16.0 | 12.0 | ||
| Total charges, $ | |||||||
| Mean (SD) | 127,922 (154,605) | 135,784 (170,046) | 117,489 (132,164) | 0.510 | 162,124 (186,923) | 85,215 (57,957) | 0.066 |
| Median | 81,374 | 84,593 | 71,868 | 106,599 | 67,328 | ||
Notwithstanding the fact that patients with MRSA were more than twice as likely to receive inappropriate initial therapy (44% for MRSA vs. 18% for MSSA; odds ratio [OR], 3.57; 95% confidence interval [CI], 1.607.97; P = 0.0015), there were no statistically significant differences in in‐hospital mortality (26% for MSSA vs. 22% for MRSA; P = 0.678), surgery for pneumonia (26% vs. 24%; P = 0.838), or admission to ICU (82% vs. 74%; P = 0.382). Patients with MSSA CAP were more likely to receive mechanical ventilation (77% vs. 58%; P = 0.034). Mean (SD) total charges per admission did not differ between patients with MSSA vs. MRSA CAP ($135,784 [$170,046] vs $117,489 [$132,164], respectively [P = 0.510]). (30‐day mortality following hospital discharge was 24% for MRSA CAP patients and 30% for MSSA CAP patients.)
Among patients with MRSA CAP, there were no notable differences in outcomes between those with strains with the PVL toxin vs. those without it (Table 2). Mean (SD) length of stay in hospital, however, was significantly longer among the former patients (25 [22.6] days vs. 13 [7.7] days for those without PVL toxin; P = 0.020). Reflecting this difference, mean (SD) total charges per admission were $76,909 higher among MRSA patients with PVL‐positive strains vs. those with PVL‐negative strains ($162,124 [$186,923] vs. $85,215 [$57,957] respectively; P = 0.066).
Among MRSA patients with MICs to vancomycin of 1.5 g/mL, 17% died in hospital, 20% underwent surgery for pneumonia, 60% received mechanical ventilation, and 75% were admitted to ICU. Mean (SD) total charges per admission were $104,514 ($112,606) (Table 2).
Discussion
To the best of our knowledge, this is the largest observational study to date of outcomes in patients with S. aureus CAP. Our results indicate that MRSA represents almost one‐half of all such infections, with USA300 strains accounting for a substantial proportion of these cases. In addition, for most outcome measures, there were no significant differences between patients with MSSA vs. MRSA CAP. In patients with MRSA CAP, however, those with PVL‐positive strains had longer stays in the hospital and had higher total costs of hospitalization.
Our study highlights the significant clinical and economic burden of S. aureus CAP. In the US, the mortality rate in patients hospitalized with CAP is about 8%, while mean length of stay is approximately 5 days (it was 5.8 days in our institution among all patients with CAP). In contrast, we found that most patients with S. aureus CAP were admitted to ICU, and that nearly one in four died during hospitalization. One possible explanation for these findings is that patients with S. aureus CAP may often receive inappropriate initial antibiotic therapy, a major predictor of adverse outcome in infection. The overall rate of inappropriate treatment, however, was low in our study (although we note that optimal antibiotic treatment is not clearly defined for the USA300 strain, and as a result, we assumed that vancomycin would be appropriate for all MRSA infections). A more likely explanation for our findings is the severity of CAP associated with S. aureus, whether MRSA or MSSA. Given the nature of S. aureus infections, the need for prevention (and potentially, development of a vaccine) remains crucial.
While MRSA has been studied extensively as a cause of bacteremia, as well as HCAP and VAP, it has not been well studied in CAP. Patients with MRSA bacteremia have been shown to have a higher mortality risk and higher healthcare costs than those with MSSA infections, and a meta‐analysis of 31 studies of patients with S. aureus bloodstream infections demonstrated a significant increase in mortality among patients with MRSA vs. MSSA bacteremia.1820 Outcomes when comparing MRSA and MSSA in VAP are slightly more variable. A higher rate of mortality has been reported in patients with pneumonia caused by MRSA vs. MSSA, but others found no difference after controlling for potential confounders.21, 22 We found that case fatality, surgery for pneumonia, ICU admission, length of stay, and total hospital charges do not differ significantly between patients with MRSA vs. MSSA CAP. This suggests that appreciation of the burden of MRSA can only be done in the context of the syndrome in question, and that conclusions from analyses of bacteremia and VAP may not be generalizable to CAP.
In the US, an increasing number of community‐associated infections are due to MRSA. Skin and skin structure infections comprise the majority of community‐associated MRSA infections and are caused by a single pulsed field type, termed USA300. These strains are believed to have distinctive virulence and epidemiologic characteristics. USA300 isolates typically are resistant only to beta‐lactam and macrolide antimicrobial agents and contain genes for the PVL toxin, which typically are not present in strains of healthcare‐associated MRSA.23 Recent studies of acute pneumonia with animal models and in humans have suggested that the PVL toxinalone or in combination with other virulence factorsis associated with the development of necrotizing pneumonia.2430 In our study, 23 patients with MRSA CAP had strains that contained PVL toxin, and these patients had longer stays in hospital and higher total hospital charges than those with MRSA CAP not containing the PVL toxin. This is an important finding, as length of stay is an important proxy for morbidity and case severity. This also extends the finding of previous case studies reporting that MRSA CAP with PVL toxin is associated with worse outcomes.2430 Moreover, we clearly document that PVL‐positive strains are emerging as a cause of pulmonary infection in broader clinical scenarios. As such, physicians must remain vigilant for this toxin‐producing strain. The full extent of the impact of PVL‐positive strains in our study is unknown, as we cannot ascertain whether morbidity was worse because of the PVL toxin itself, or because most patients were not treated with clindamycin or linezolid, which inhibit toxin production.
We failed to observe a correlation between MICs to vancomycin and the outcomes we studied. The clinical significance of reduced susceptibility of S. aureus to vancomycin remains a controversial issue. In our study, there was no significant association between MICs to vancomycin and mortality, need for surgery, ICU admission, length of stay, or total hospital charges. Sakoulas et al.11 reported that as vancomycin MICs for MRSA isolates rose within the susceptible range from 0.5 mcg/mL to 2.0 mcg/mL, so too did the number of clinical failures among bacteremic patients receiving vancomycin. Moise‐Broder et al.31 reported a similar finding in a study of 63 patients with MRSA bacteremia, of whom 45 failed or were intolerant of vancomycin therapy. In a more recent report, Soriano et al.12 prospectively evaluated 414 episodes of bacteremia. The authors concluded that mortality in patients with MRSA bacteremia is significantly higher when the empiric antimicrobial agent is inappropriate and when vancomycin is used to treat infections involving strains with MICs >1.0 mcg/mL. In pneumonia, Hidayat et al.13 reported that patients with infections due to pathogens with higher MICs to vancomycin had a higher rate of mortality than those with lower MICs. Our findings likely differ from this report because of the proportion of subjects with PVL‐positive strains, and because of the skew in the distribution of vancomycin MICs. More specifically, the majority of patients had higher MIC strains, clustered around 1.5 mg/L, leaving us with few lower MIC strains and fewer strains with MICs of 2.0 mcg/mL for comparison, and therefore limited statistical power to assess the relationship between MICs and outcomes.
There were no clinical features that clearly distinguished patients with MRSA vs. MSSA CAP. This suggests that if physicians hope to ensure that patients with MRSA CAP receive appropriate initial antibiotic therapy, they cannot base therapeutic decision‐making (ie, use of an anti‐MRSA treatment) on clinical criteria. Presently, national guidelines recommend diagnostic testing only if the results might affect clinical decisions (eg, antimicrobial management).32 Furthermore, the IDSA/ATS guidelines recommend sputum cultures along with blood cultures and other diagnostic tests only in select cases (eg, those with severe disease). Since beginning optimal therapy quickly can reduce mortality in pneumonia,33 our results indicate a need for both rapid diagnostic tests to identify patients with MRSA, and reevaluation of current recommendations for diagnostic testing in CAP.
Our study has several important limitations. First, its retrospective design exposes it to many forms of bias. Second, because the diagnosis of pneumonia can be challenging, we required that all patients have both clinical and radiologic evidence of the disease. However, we may have thereby excluded some admissions for S. aureus pneumonia among the over 3000 pneumonia admissions to our hospital during the study period.
Third, we only included patients with culture evidence of infection. This was necessary by design, but as a result we may have failed to identify some patients with S. aureus infections because of the limitations of respiratory culture technology. Patients on general practice units often do not get cultured, and accordingly we may have missed those with milder disease caused by S. aureus.
Fourth, we used only one method of MIC testing to determine vancomycin susceptibility. It would have been of interest to have used automated dilution testing also and to have compared both methods. Comparison of laboratory methods was not among our study objectives, and most of the earlier studies examining epidemiology and outcomes used a single laboratory testing method only.
Finally, since the study was conducted at a large urban teaching hospital in a city with a long history of issues with MRSA and resistance, the generalizability of our results may be limited.
In summary, our study provides further evidence that S. aureus is an important pathogen in CAP. MRSA CAP has few obvious characteristics that differentiate it from MSSA CAP. MRSA and MSSA CAP are both very serious infections that should be treated aggressively to avoid poor outcomes.
- .Staphylococcus aureus: a well‐armed pathogen.Clin Infect Dis.1998;26:1179–1181.
- .Staphylococcus aureus infections.N Engl J Med.1998;339:520–532.
- .The growing menace of community‐acquired methicillin‐resistant Staphylococcus aureus.Ann Intern Med.2006;144:368–370.
- ,,, et al.Predictors of mortality for methicillin‐resistant Staphylococcus aureus health‐care‐associated pneumonia: specific evaluation of vancomycin pharmacokinetic indices.Chest.2006;130:947–955.
- ,,,.Bacterial pneumonia during the Hong Kong influenza epidemic of 1968–1969.Arch Intern Med.1971;127:1037–1041.
- ,,, et al.Severe community‐acquired pneumonia due to Staphylococcus aureus, 2003–04 influenza season.Emerg Infect Dis.2006;12:894–899.
- Centers for Disease Control and Prevention.Severe methicillin‐resistant Staphylococcus aureus community‐acquired pneumonia associated with influenza—Louisiana and Georgia, December 2006‐January 2007.Morb Mortal Wkly Rep.2007;56:325–329.
- ,,.Incidence, characteristics and outcomes of patients with severe community acquired‐MRSA pneumonia.Eur Respir J.2009;34:1148–1158.
- ,,, et al.Staphylococcus aureus community‐acquired pneumonia during the 2006 to 2007 influenza season.Ann Emerg Med.2009;53:358–365.
- ,,, et al.Treatment outcomes for serious infections caused by methicillin‐resistant Staphylococcus aureus with reduced vancomycin susceptibility.Clin Infect Dis.2004;38:521–528.
- ,,, et al.Relationship of MIC and bactericidal activity to efficacy of vancomycin for treatment of methicillin‐resistant Staphylococcus aureus bacteremia.J Clin Microbiol.2004;42:2398–2402.
- ,,, et al.Influence of vancomycin minimum inhibitory concentration on the treatment of Methicillin‐resistant Staphylococcus aureus bacteremia.Clin Infect Dis.2008;46:193–200.
- ,,, et al.High‐dose vancomycin therapy for methicillin‐resistant Staphylococcus aureus infections.Arch Intern Med.2006;166:2138–2144.
- ,,, et al.Defining community acquired pneumonia severity on presentation to hospital: An international derivation and validation study.Thorax.2003;58(5):377–382.
- Clinical and Laboratory Standards Institute (CLSI).Methods for Dilution Antimicrobial Susceptibility Tests for Bacteria That Grow Aerobically: Approved Standard. 8th ed. CLSI document M07‐A8 2008;29(2):1–65. Available at: www.clsi.org/source/orders/free/m07‐a8.pdf.
- ,,,.A multicenter study evaluating the current strategies for isolating Staphylococcus aureus strains with reduced susceptibility to glycopeptides.J Clin Microbiol.2007;45:329–332.
- ,,,,.Application of molecular techniques to the study of hospital infection.Clin Microbiol Rev.2006;19:512–530.
- ,,.Nosocomial methicillin‐resistant Staphylococcus aureus bacteremia: Is it any worse than nosocomial methicillin‐sensitive Staphylococcus aureus bacteremia?Infect Control Hosp Epidemiol.2000;21:645–648.
- ,.Clinical and economic impact of methicillin resistance in patients with Staphylococcus aureus bacteremia.Diagn Microbiol Infect Dis.2005;52:113–122.
- ,,, et al.Comparison of mortality associated with methicillin‐resistant and methicillin‐susceptible Staphylococcus aureus bacteremia: A meta‐analysis.Clin Infect Dis.2003;36:53–59.
- ,,, et al.Ventilator‐associated pneumonia by Staphylococcus aureus: Comparison of methicillin‐resistant and methicillin‐sensitive episodes.Am J Respir Crit Care Med.1994;150:1545–1549.
- ,,, et al.Is methicillin resistance associated with a worse prognosis in Staphylococcus aureus ventilator‐associated pneumonia?Clin Infect Dis.2005;41:1224–1231.
- ,,, et al.Characterization of a strain of community‐associated methicillin‐resistant Staphylococcus aureus widely disseminated in the United States.J Clin Microbiol.2006;44:108–111.
- .Staphylococcus aureus, Panton‐Valentine leukocidin, and necrotising pneumonia.BMJ.2005;331:793–794.
- ,,, et al.Methicillin‐resistant Staphylococcus aureus necrotizing pneumonia.Emerg Infect Dis.2005;11:1647–1648.
- ,.Fatal necrotizing pneumonia due to community‐acquired methicillin‐resistant Staphylococcus aureus (MRSA).Med J Aust.2004;181:228–229.
- ,,.Pleuropulmonary complications of Panton‐Valentine leukocidin‐positive community‐acquired methicillin‐resistant Staphylococcus aureus: Importance of treatment with antimicrobials inhibiting exotoxin production.Chest.2005;128:2732–2738.
- ,,, et al.Severe community‐onset pneumonia in healthy adults caused by methicillin‐resistant Staphylococcus aureus carrying the Panton‐Valentine leukocidin genes.Clin Infect Dis.2005;40:100–107.
- ,,, et al.Staphylococcus aureus Panton‐Valentine leukocidin causes necrotizing pneumonia.Science.2007;315:1130–1133.
- ,,, et al.Association between Staphylococcus aureus strains carrying gene for Panton‐Valentine leukocidin and highly lethal necrotizing pneumonia in young immunocompetent patients.Lancet.2002;359:753–759.
- ,,, et al.Accessory gene regulator group II polymorphism in methicillin‐resistant Staphylococcus aureus is predictive of failure of vancomycin therapy.Clin Infect Dis.2004;38:1700–1705.
- ,,, et al.Infectious Diseases Society of America/American Thoracic Society consensus guidelines on the management of community‐acquired pneumonia in adults.Clin Infect Dis.2007;44(Suppl 2):S27–S72.
- ,,, et al.Antimicrobial therapy escalation and hospital mortality among patients with health‐care‐associated pneumonia: a single center experience.Chest.2008;134:963–968.
Copyright © 2010 Society of Hospital Medicine
Health Care‐Associated Candidemia
In the United States, candida now accounts for between 8% and 12% of all catheter‐associated blood stream infections (BSIs).1 Additionally, crude mortality rates in candidemia exceed 40%, and a recent systematic review demonstrated that the attributable mortality of candidemia ranges from 5% to 71%.2 Candidal BSIs also affect resource utilization. These infections independently increase length of stay and result in substantial excess costs.3 Most cases of candidemia arise in noncritically ill patients and thus may be managed by hospitalists.
Historically, the majority of candidal BSIs were caused by C. albicans. Presently, C. albicans accounts for only half of all yeast BSIs, and approximately 20% of these infections are caused by organisms such as C. glabrata and C. krusei.4 These 2 organisms have either variable or no susceptibility to agents, such as fluconazole, empirically employed against yeast. Parallel with the evolution in microbiology of candidemia has been recognition that inappropriate treatment of these infections independently increases mortality.5 These factors underscore the need for the clinician to treat suspected candidal BSIs aggressively in order to avoid the risks associated with inappropriate treatment.
Efforts to enhance rates of initial appropriate therapy for bacterial infections have encompassed the realization that health care‐associated infections (HAIs) represent a distinct syndrome.6, 7 Traditionally, infections were considered either community‐acquired or nosocomial in origin. However, with the spread of health care delivery beyond the hospital, multiple studies indicate that patients may now present to the emergency department with infections caused by pathogens such as Methicillin‐resistant Staphylococcus aureus (MRSA) and P. aeruginosaorganisms that were previously thought limited to hospital‐acquired processes.69 Furthermore, hospitalists often encounter subjects presenting to the hospital with suspected BSIs who have an active and ongoing interaction with the healthcare system.
The importance of candida as a health care‐associated pathogen in BSI remains unclear. We hypothesized that health care‐associated candidemia (HCAC) represented a distinct clinical entity. In order to confirm our theory, we conducted a retrospective analysis of all cases of candidal BSI at our institution over a 3‐year period.
Methods
We reviewed the records of all patients diagnosed with candidemia at our hospital between January 1, 2004 and December 31, 2006. Our institutional review board approved this study. We included adult patients diagnosed with candidemia. The diagnosis of candidemia was based on the isolation of yeast from the blood in at least one blood culture. We employ the BACTEC 9240 blood Culture System (Becton Dickinson Microbiology Systems, Sparks, MD). We excluded subjects who were admitted to the hospital within one month of a known diagnosis of candidemia.
We defined a nosocomial candidal BSI as the diagnosis of candidemia based on cultures drawn after the patient had been hospitalized for >48 hours. We considered HCAC to be present based on previously employed criteria for identifying HAI.69 Specifically, for patients with candidemia based on blood cultures obtained within 48 hours of hospitalization, a patient had to meet at least 1 of the following criteria: (1) receipt of intravenous therapy outside the hospital, (2) end stage renal disease necessitating hemodialysis (ESRD requiring HD), (3) hospitalization within previous 30 days, (4) residence in a nursing home or long term care facility, or (5) underwent an invasive procedure as an outpatient within 30 days of presentation. Community‐acquired candidemia was restricted to patients whose index culture was drawn within 48 hours of admission but who failed to meet the definition for HCAC.
The prevalence of the various forms of candidemia served as our primary endpoint. In addition, we compared patients with respect to demographic factors, comorbidities, and severity of illness. Severity of illness was calculated based on the Acute Physiology and Chronic Health Evaluation (APACHE) II score. We further noted rates of immune suppression in the cohort and defined this as treatment with corticosteroids (10 mg of prednisone or equivalent daily for more than 30 consecutive days), other immunosuppressants (eg, methotrexate), or chemotherapy. Those with acquired immune deficiency syndrome (AIDS) or another immunodeficiency syndrome were defined as immunosuppressed as well. We examined the distribution of yeast species across the 3 forms of candidemia. Finally, we assessed the prevalence of fluconazole resistance. Fluconazole susceptibilities were determined based on Etest (AB BIODISK, Solna, Sweden). An isolate was considered resistant to fluconazole if the minimum inhibitory concentration was >64 g/mL.
We compared categorical variables with the Fisher's exact test. Continuous variables were analyzed with either the Student's t‐test or a Mann‐Whitney test, as appropriate. All tests were 2 tailed and a P value of <0.05 was assumed to represent statistical significance. Analyses were performed with Stata 9.1 (Stata Corp., College Station, TX).
Results
The final cohort included 223 subjects. The mean age of the patients was 59.6 15.7 years and 49% were male. Nearly one quarter (n = 55) fulfilled our criteria for HCAC. The remainder met the definition for nosocomial candidemia. We observed no cases of community‐acquired candidemia. Most (n = 33) patients with HCAC had exposure to more than 1 health care‐related source and many were initially admitted to the medicine/hospitalist service as opposed to the intensive care unit (ICU). The most common criteria leading to categorization as HCAC was recent hospitalization (n = 30, 54.5% of all HCAC). The median time from recent hospitalization to admission was 17 days (Range: 5‐28 days). Other common reasons for classification as HCAC included ESRD requiring HD (30.9%), residence in a nursing home (25.5%), and undergoing an invasive outpatient procedure (16.4%). More than 75% of subjects with HCAC (n = 42) had central venous catheters in place at presentation. Between 2004 and 2006, the proportion of all candidemia due to HCAC increased from 20.9% to 26.9%, but this difference was not statistically significant.
Patients with HCAC were similar to those with nosocomial candidemia (Table 1). There was no difference in either severity of illness or the frequency of neutropenia. The prevalence of most comorbidities did not differ between those with nosocomial candidemia and persons with HCAC. However, immunosuppression was more prevalent among patients with HCAC (prevalence ratio, 1.67; 95% CI, 1.13‐3.08; P = 0.004). In part this finding is expected given that our definition of HCAC includes exposure to agents which may lead to immunosuppression, such as chemotherapy. Of patients with HCAC, the majority (n = 38, 69.1%) were initially admitted to the general medicine service and not to the ICU.
| Characteristic | Healthcare‐Associated Candidemia (n = 55) | Nosocomial Candidemia (n = 168) | P |
|---|---|---|---|
| |||
| Demographics | |||
| Age, mean SD | 61.0 12.9 | 59.1 16.6 | 0.45 |
| Male, % | 60.0 | 45.8 | 0.08 |
| Severity of illness | |||
| APACHE II score, mean SD | 15.9 6.8 | 14.6 6.3 | 0.21 |
| Co‐morbid illnesses | |||
| Diabetes mellitus, % | 36.4 | 32.7 | 0.87 |
| Malignancy, % | 36.4 | 22.6 | 0.04 |
| ESRD on HD, % | 30.9 | 23.2 | 0.25 |
| AIDS, % | 7.2 | 6.0 | 0.73 |
| Immunosupressed, % | 54.5 | 32.7 | 0.004 |
| White cell status | |||
| ANC, 1000/mm3, mean SD | 10.7 7.2 | 12.3 8.0 | 0.20 |
| Neutropenic, % | 2.0 | 2.2 | 0.91 |
A multitude of various yeast species were recovered (Figure 1). Overall, nonalbicans candida were responsible for nearly 60% of all infections. Nonalbicans yeast were as likely to be recovered in HCAC as in nosocomial yeast infection. Among both types of Candidemia, C. krusei was a rare culprit accounting for fewer than 2% of infections. C. glabrata, however, occurred more often in HCAC. Specifically, C. glabrata represented 1 in 5 cases of HCAC as opposed to approximately 10% of all nosocomial yeast BSIs (P = 0.05). In part reflecting this, fluconazole resistance was noted more often in HCAC (18.2% of patients vs. 7.7% among nosocomial candidemia, P = 0.036). There was no difference in the eventual diagnosis of deep‐seeded yeast infections (ie, endocarditis, endopthlamitis, or osteomyelitis) between those with HCAC and persons with nosocomial candidemia (3 cases in each group).

Discussion
This analysis demonstrates that HCAC accounts for approximately a quarter of all candidemia. Our findings underscore that candidemia can present to the emergency department as an HAI and may potentially be initially cared for by a hospitalist. In addition, patients with HCAC and nosocomial candidemia share many attributes. Furthermore, nonalbicans yeast are as prevalent in HCAC as in nosocomial candidal infection. Nonetheless, there appear to be important differences in these syndromes. Immunosuppression appears to be more common in HCAC as does infection due to C. glabrata.
Others have explored the concept of HCAC. Kung et al.10 described community‐onset candidemia at a single center over a 10‐year period. They described 56 patients and noted that the majority had been recently hospitalized or had ongoing interaction with the healthcare system. Sofair et al.11 followed subjects presenting to emergency departments with candidemia. Overall, more than one‐third met criteria for community‐onset infection. In this analysis, though, Sofair et al.11 did not distinguish between community‐acquired processes and HCAC. From a population perspective, Chen et al.12 explored candidemia in Australia. Among over 1000 patients, the noted that 11.6% represented HCAC and, as we note, that select nonalbicans yeast occurred more often in HCAC than in nosocomial candidemia. Our project builds on and adds to these earlier efforts. First, we confirm the general observation that candidemia is no longer solely a nosocomial pathogen. Second, unlike several of these earlier reports we examined a larger cohort of candidemia. Third, beyond the observations of Chen et al.,12 we note that currently, the proportion of Candidal BSI classified as HACA relative to nosocomial candidemia seems larger than reported in the past. Finally, a unique aspect of our report is that we employed express criteria to define HAI.
Our findings have several implications. First, hospitalists and emergency department physicians, along with others, must remain vigilant when approaching patients presenting to the hospital with signs and symptoms of BSI and multiple risk factors for candidal BSI. The fact that the patient has not been hospitalized should not preclude consideration of and treatment for candidemia. The current evidence does not support broad, empiric use of antifungal agents, as this would lead to excessive costs and potentially expose many patients to unnecessary antifungal coverage. On the other hand, given the association between delayed antifungal therapy and the risk for death in candidemia, failure to consider this infection in at‐risk subjects may have adverse consequences. Second, our observations emphasize the need for clinical risk stratification schemes and rapid diagnostic modalities. Such tools are urgently needed if physicians hope to target antifungal therapies more appropriately. Third, if the clinician opts to initiate therapy for possible HCAC, reliance on fluconazole alone may prove inadequate. As the generalizability of our conclusions is necessarily limited, we recommend that infection control practitioners review local epidemiologic data regarding HCAC so that physicians can have the best available guidance.
Our study has several important limitations. Its retrospective nature exposes it to several forms of bias. The single center design limits the generalizability of our findings. Prospective, multicenter studies are needed to validate our results. Additionally, no universally accepted criteria exist to define HAI syndromes. Nonetheless, the criteria we employed have been used by others. We also lacked data on exposure to recent broad spectrum antimicrobials. Selection pressure via exposure to such agents is a risk factor for candidemia and without this data we cannot gauge the impact of this on our findings. Finally, we cannot control for the possibility that some patients were miscategorized. This could have arisen because of: (1) either limitations inherent in the definition of HCAC or (2) because the clinician delayed the decision to obtain blood cultures. Some patients classified as nosocomial may actually have had HCAC or community‐acquired diseasebut for some reason blood cultures were not drawn at time of admission but were deferred until later. Although a difficult issue to address in any study of the epidemiology of infection, the significance of this misclassification bias must be considered a significant concern.
In summary, Candidemia can be the cause of BSI presenting to the hospital. Moreover, HCAC represents a significant proportion of all Candidemia. Although patients with HCAC and nosocomial candidemia share select characteristics, there appear to be some differences in the microbiology of these syndromes.
- CDC.National Nosocomial Infections Surveillance (NNIS) System report, data summary from January 1990‐‐May 1999, issued June 1999.Am J Infect Control.1999;27:520–532.
- ,,.Attributable mortality of candidemia: a systematic review of matched cohort and case‐control studies.Eur J Clin Microbiol Infect Dis.2006;25:419–425.
- ,,, et al.Excess mortality, hospital stay, and cost due to candidemia: a case‐control study using data from population‐based candidemia surveillance.Infect Control Hosp Epidemiol.2005;26:540–547.
- .Shifting patterns in the epidemiology of nosocomial Candida infections.Chest.2003;123:500S–503S.
- ,,.Delaying the empiric treatment of candida bloodstream infection until positive blood culture results are obtained: a potential risk factor for hospital mortality.Antimicrob Agents Chemother.2005;49:3640–3645.
- ,,, et al.Healthcare‐associated bloodstream infection: A distinct entity? Insights from a large U.S. database.Crit Care Med.2006;34:2588–2595.
- ,,, et al.Health care‐‐associated bloodstream infections in adults: a reason to change the accepted definition of community‐acquired infections.Ann Intern Med.2002;137:791–797.
- ,.Epidemiology of healthcare‐associated pneumonia (HCAP).Semin Respir Crit Care Med.2009;30:10–15.
- ,,, et al.Health care associated pneumonia and community‐acquired pneumonia: a single‐center experience.Antimicrob Agents Chemother.2007;51:3568–3573.
- ,,, et al.Communtiy‐onset candidemia at a university hospital, 1995‐2005.J Microbiol Immunol Infect.2007;40:355–363.
- ,,, et al.Epidemiology of community‐onset candidemia in Connecticut and Maryland.Clin Infect Dis.2006;43:32–39.
- ,,, et al.Active surveillance for candidemia, Australia.Emerg Infect Dis.2006;12:1508–1516.
In the United States, candida now accounts for between 8% and 12% of all catheter‐associated blood stream infections (BSIs).1 Additionally, crude mortality rates in candidemia exceed 40%, and a recent systematic review demonstrated that the attributable mortality of candidemia ranges from 5% to 71%.2 Candidal BSIs also affect resource utilization. These infections independently increase length of stay and result in substantial excess costs.3 Most cases of candidemia arise in noncritically ill patients and thus may be managed by hospitalists.
Historically, the majority of candidal BSIs were caused by C. albicans. Presently, C. albicans accounts for only half of all yeast BSIs, and approximately 20% of these infections are caused by organisms such as C. glabrata and C. krusei.4 These 2 organisms have either variable or no susceptibility to agents, such as fluconazole, empirically employed against yeast. Parallel with the evolution in microbiology of candidemia has been recognition that inappropriate treatment of these infections independently increases mortality.5 These factors underscore the need for the clinician to treat suspected candidal BSIs aggressively in order to avoid the risks associated with inappropriate treatment.
Efforts to enhance rates of initial appropriate therapy for bacterial infections have encompassed the realization that health care‐associated infections (HAIs) represent a distinct syndrome.6, 7 Traditionally, infections were considered either community‐acquired or nosocomial in origin. However, with the spread of health care delivery beyond the hospital, multiple studies indicate that patients may now present to the emergency department with infections caused by pathogens such as Methicillin‐resistant Staphylococcus aureus (MRSA) and P. aeruginosaorganisms that were previously thought limited to hospital‐acquired processes.69 Furthermore, hospitalists often encounter subjects presenting to the hospital with suspected BSIs who have an active and ongoing interaction with the healthcare system.
The importance of candida as a health care‐associated pathogen in BSI remains unclear. We hypothesized that health care‐associated candidemia (HCAC) represented a distinct clinical entity. In order to confirm our theory, we conducted a retrospective analysis of all cases of candidal BSI at our institution over a 3‐year period.
Methods
We reviewed the records of all patients diagnosed with candidemia at our hospital between January 1, 2004 and December 31, 2006. Our institutional review board approved this study. We included adult patients diagnosed with candidemia. The diagnosis of candidemia was based on the isolation of yeast from the blood in at least one blood culture. We employ the BACTEC 9240 blood Culture System (Becton Dickinson Microbiology Systems, Sparks, MD). We excluded subjects who were admitted to the hospital within one month of a known diagnosis of candidemia.
We defined a nosocomial candidal BSI as the diagnosis of candidemia based on cultures drawn after the patient had been hospitalized for >48 hours. We considered HCAC to be present based on previously employed criteria for identifying HAI.69 Specifically, for patients with candidemia based on blood cultures obtained within 48 hours of hospitalization, a patient had to meet at least 1 of the following criteria: (1) receipt of intravenous therapy outside the hospital, (2) end stage renal disease necessitating hemodialysis (ESRD requiring HD), (3) hospitalization within previous 30 days, (4) residence in a nursing home or long term care facility, or (5) underwent an invasive procedure as an outpatient within 30 days of presentation. Community‐acquired candidemia was restricted to patients whose index culture was drawn within 48 hours of admission but who failed to meet the definition for HCAC.
The prevalence of the various forms of candidemia served as our primary endpoint. In addition, we compared patients with respect to demographic factors, comorbidities, and severity of illness. Severity of illness was calculated based on the Acute Physiology and Chronic Health Evaluation (APACHE) II score. We further noted rates of immune suppression in the cohort and defined this as treatment with corticosteroids (10 mg of prednisone or equivalent daily for more than 30 consecutive days), other immunosuppressants (eg, methotrexate), or chemotherapy. Those with acquired immune deficiency syndrome (AIDS) or another immunodeficiency syndrome were defined as immunosuppressed as well. We examined the distribution of yeast species across the 3 forms of candidemia. Finally, we assessed the prevalence of fluconazole resistance. Fluconazole susceptibilities were determined based on Etest (AB BIODISK, Solna, Sweden). An isolate was considered resistant to fluconazole if the minimum inhibitory concentration was >64 g/mL.
We compared categorical variables with the Fisher's exact test. Continuous variables were analyzed with either the Student's t‐test or a Mann‐Whitney test, as appropriate. All tests were 2 tailed and a P value of <0.05 was assumed to represent statistical significance. Analyses were performed with Stata 9.1 (Stata Corp., College Station, TX).
Results
The final cohort included 223 subjects. The mean age of the patients was 59.6 15.7 years and 49% were male. Nearly one quarter (n = 55) fulfilled our criteria for HCAC. The remainder met the definition for nosocomial candidemia. We observed no cases of community‐acquired candidemia. Most (n = 33) patients with HCAC had exposure to more than 1 health care‐related source and many were initially admitted to the medicine/hospitalist service as opposed to the intensive care unit (ICU). The most common criteria leading to categorization as HCAC was recent hospitalization (n = 30, 54.5% of all HCAC). The median time from recent hospitalization to admission was 17 days (Range: 5‐28 days). Other common reasons for classification as HCAC included ESRD requiring HD (30.9%), residence in a nursing home (25.5%), and undergoing an invasive outpatient procedure (16.4%). More than 75% of subjects with HCAC (n = 42) had central venous catheters in place at presentation. Between 2004 and 2006, the proportion of all candidemia due to HCAC increased from 20.9% to 26.9%, but this difference was not statistically significant.
Patients with HCAC were similar to those with nosocomial candidemia (Table 1). There was no difference in either severity of illness or the frequency of neutropenia. The prevalence of most comorbidities did not differ between those with nosocomial candidemia and persons with HCAC. However, immunosuppression was more prevalent among patients with HCAC (prevalence ratio, 1.67; 95% CI, 1.13‐3.08; P = 0.004). In part this finding is expected given that our definition of HCAC includes exposure to agents which may lead to immunosuppression, such as chemotherapy. Of patients with HCAC, the majority (n = 38, 69.1%) were initially admitted to the general medicine service and not to the ICU.
| Characteristic | Healthcare‐Associated Candidemia (n = 55) | Nosocomial Candidemia (n = 168) | P |
|---|---|---|---|
| |||
| Demographics | |||
| Age, mean SD | 61.0 12.9 | 59.1 16.6 | 0.45 |
| Male, % | 60.0 | 45.8 | 0.08 |
| Severity of illness | |||
| APACHE II score, mean SD | 15.9 6.8 | 14.6 6.3 | 0.21 |
| Co‐morbid illnesses | |||
| Diabetes mellitus, % | 36.4 | 32.7 | 0.87 |
| Malignancy, % | 36.4 | 22.6 | 0.04 |
| ESRD on HD, % | 30.9 | 23.2 | 0.25 |
| AIDS, % | 7.2 | 6.0 | 0.73 |
| Immunosupressed, % | 54.5 | 32.7 | 0.004 |
| White cell status | |||
| ANC, 1000/mm3, mean SD | 10.7 7.2 | 12.3 8.0 | 0.20 |
| Neutropenic, % | 2.0 | 2.2 | 0.91 |
A multitude of various yeast species were recovered (Figure 1). Overall, nonalbicans candida were responsible for nearly 60% of all infections. Nonalbicans yeast were as likely to be recovered in HCAC as in nosocomial yeast infection. Among both types of Candidemia, C. krusei was a rare culprit accounting for fewer than 2% of infections. C. glabrata, however, occurred more often in HCAC. Specifically, C. glabrata represented 1 in 5 cases of HCAC as opposed to approximately 10% of all nosocomial yeast BSIs (P = 0.05). In part reflecting this, fluconazole resistance was noted more often in HCAC (18.2% of patients vs. 7.7% among nosocomial candidemia, P = 0.036). There was no difference in the eventual diagnosis of deep‐seeded yeast infections (ie, endocarditis, endopthlamitis, or osteomyelitis) between those with HCAC and persons with nosocomial candidemia (3 cases in each group).
Discussion
This analysis demonstrates that HCAC accounts for approximately a quarter of all candidemia. Our findings underscore that candidemia can present to the emergency department as an HAI and may potentially be initially cared for by a hospitalist. In addition, patients with HCAC and nosocomial candidemia share many attributes. Furthermore, nonalbicans yeast are as prevalent in HCAC as in nosocomial candidal infection. Nonetheless, there appear to be important differences in these syndromes. Immunosuppression appears to be more common in HCAC as does infection due to C. glabrata.
Others have explored the concept of HCAC. Kung et al.10 described community‐onset candidemia at a single center over a 10‐year period. They described 56 patients and noted that the majority had been recently hospitalized or had ongoing interaction with the healthcare system. Sofair et al.11 followed subjects presenting to emergency departments with candidemia. Overall, more than one‐third met criteria for community‐onset infection. In this analysis, though, Sofair et al.11 did not distinguish between community‐acquired processes and HCAC. From a population perspective, Chen et al.12 explored candidemia in Australia. Among over 1000 patients, the noted that 11.6% represented HCAC and, as we note, that select nonalbicans yeast occurred more often in HCAC than in nosocomial candidemia. Our project builds on and adds to these earlier efforts. First, we confirm the general observation that candidemia is no longer solely a nosocomial pathogen. Second, unlike several of these earlier reports we examined a larger cohort of candidemia. Third, beyond the observations of Chen et al.,12 we note that currently, the proportion of Candidal BSI classified as HACA relative to nosocomial candidemia seems larger than reported in the past. Finally, a unique aspect of our report is that we employed express criteria to define HAI.
Our findings have several implications. First, hospitalists and emergency department physicians, along with others, must remain vigilant when approaching patients presenting to the hospital with signs and symptoms of BSI and multiple risk factors for candidal BSI. The fact that the patient has not been hospitalized should not preclude consideration of and treatment for candidemia. The current evidence does not support broad, empiric use of antifungal agents, as this would lead to excessive costs and potentially expose many patients to unnecessary antifungal coverage. On the other hand, given the association between delayed antifungal therapy and the risk for death in candidemia, failure to consider this infection in at‐risk subjects may have adverse consequences. Second, our observations emphasize the need for clinical risk stratification schemes and rapid diagnostic modalities. Such tools are urgently needed if physicians hope to target antifungal therapies more appropriately. Third, if the clinician opts to initiate therapy for possible HCAC, reliance on fluconazole alone may prove inadequate. As the generalizability of our conclusions is necessarily limited, we recommend that infection control practitioners review local epidemiologic data regarding HCAC so that physicians can have the best available guidance.
Our study has several important limitations. Its retrospective nature exposes it to several forms of bias. The single center design limits the generalizability of our findings. Prospective, multicenter studies are needed to validate our results. Additionally, no universally accepted criteria exist to define HAI syndromes. Nonetheless, the criteria we employed have been used by others. We also lacked data on exposure to recent broad spectrum antimicrobials. Selection pressure via exposure to such agents is a risk factor for candidemia and without this data we cannot gauge the impact of this on our findings. Finally, we cannot control for the possibility that some patients were miscategorized. This could have arisen because of: (1) either limitations inherent in the definition of HCAC or (2) because the clinician delayed the decision to obtain blood cultures. Some patients classified as nosocomial may actually have had HCAC or community‐acquired diseasebut for some reason blood cultures were not drawn at time of admission but were deferred until later. Although a difficult issue to address in any study of the epidemiology of infection, the significance of this misclassification bias must be considered a significant concern.
In summary, Candidemia can be the cause of BSI presenting to the hospital. Moreover, HCAC represents a significant proportion of all Candidemia. Although patients with HCAC and nosocomial candidemia share select characteristics, there appear to be some differences in the microbiology of these syndromes.
- CDC.National Nosocomial Infections Surveillance (NNIS) System report, data summary from January 1990‐‐May 1999, issued June 1999.Am J Infect Control.1999;27:520–532.
- ,,.Attributable mortality of candidemia: a systematic review of matched cohort and case‐control studies.Eur J Clin Microbiol Infect Dis.2006;25:419–425.
- ,,, et al.Excess mortality, hospital stay, and cost due to candidemia: a case‐control study using data from population‐based candidemia surveillance.Infect Control Hosp Epidemiol.2005;26:540–547.
- .Shifting patterns in the epidemiology of nosocomial Candida infections.Chest.2003;123:500S–503S.
- ,,.Delaying the empiric treatment of candida bloodstream infection until positive blood culture results are obtained: a potential risk factor for hospital mortality.Antimicrob Agents Chemother.2005;49:3640–3645.
- ,,, et al.Healthcare‐associated bloodstream infection: A distinct entity? Insights from a large U.S. database.Crit Care Med.2006;34:2588–2595.
- ,,, et al.Health care‐‐associated bloodstream infections in adults: a reason to change the accepted definition of community‐acquired infections.Ann Intern Med.2002;137:791–797.
- ,.Epidemiology of healthcare‐associated pneumonia (HCAP).Semin Respir Crit Care Med.2009;30:10–15.
- ,,, et al.Health care associated pneumonia and community‐acquired pneumonia: a single‐center experience.Antimicrob Agents Chemother.2007;51:3568–3573.
- ,,, et al.Communtiy‐onset candidemia at a university hospital, 1995‐2005.J Microbiol Immunol Infect.2007;40:355–363.
- ,,, et al.Epidemiology of community‐onset candidemia in Connecticut and Maryland.Clin Infect Dis.2006;43:32–39.
- ,,, et al.Active surveillance for candidemia, Australia.Emerg Infect Dis.2006;12:1508–1516.