User login
Rapid response systems (RRSs) have been developed to identify and treat deteriorating patients on general hospital units.[1] The most commonly proposed approach to the problem of identifying and stabilizing deteriorating hospitalized patients includes some combination of an early warning system to detect the deterioration and an RRS to deal with it. We previously demonstrated that a relatively simple hospital‐specific prediction model employing routine laboratory values and vital sign data is capable of predicting clinical deterioration, the need for intensive care unit (ICU) transfer, and hospital mortality in patients admitted to general medicine units.[2, 3, 4, 5, 6]
Hospital readmissions within 30 days of hospital discharge occur often and are difficult to predict. Starting in 2013, readmission penalties have been applied to specific conditions in the United States (acute myocardial infarction, heart failure, and pneumonia), with the expectation that additional conditions will be added to this group in years to come.[7, 8] Unfortunately, interventions developed to date have not been universally successful in preventing hospital readmissions for various medical conditions and patient types.[9] One potential explanation for this is the inability to reliably predict which patients are at risk for readmission to better target preventative interventions. Predictors of hospital readmission can be disease specific, such as the presence of multivessel disease in patients hospitalized with myocardial infarction,[10] or more general, such as lack of available medical follow‐up postdischarge.[11] Therefore, we performed a study to determine whether the occurrence of automated clinical deterioration alerts (CDAs) predicted 30‐day hospital readmission.
METHODS
Study Location
The study was conducted on 8 general medicine units of Barnes‐Jewish Hospital, a 1250‐bed academic medical center in St. Louis, Missouri (January 15, 2015December 12, 2015). Patient care on the inpatient medicine units is delivered by either attending hospitalist physicians or housestaff physicians under the supervision of an attending physician. The study was approved by the Washington University School of Medicine Human Studies Committee, and informed consent was waived.
Study Overview
We retrospectively evaluated all adult patients (aged >18 years) admitted through the emergency department or transferred directly to the general medicine units from other institutions. We excluded patients who died while hospitalized. All data were derived from the hospital informatics database provided by the Center for Clinical Excellence, BJC HealthCare.
Primary End Point
Readmission for any reason (ie, all‐cause readmission) to an acute care facility in the 30 days following discharge after the index hospitalization served as the primary end point. Barnes‐Jewish Hospital serves as the main teaching institution for BJC Healthcare, a large integrated healthcare system of both inpatient and outpatient care. The system includes a total of 12 hospitals and multiple community health locations in a compact geographic region surrounding and including St. Louis, Missouri, and we included readmission to any of these hospitals in our analysis. Persons treated within this healthcare system are, in nearly all cases, readmitted to 1 of the system's participating 12 hospitals. If a patient who receives healthcare in the system presents to a nonsystem hospital, he/she is often transferred back into the integrated system because of issues of insurance coverage. Patients with a 30‐day readmission were compared to those without a 30‐day readmission.
Variables
We recorded information regarding demographics, median income of the zip code of residence as a marker of socioeconomic status, admission to any BJC Healthcare facility within 6 months of the index admission, and comorbidities. To represent the global burden of comorbidities in each patient, we calculated their Charlson Comorbidity Index score.[12] Severity of illness was assessed using the All Patient RefinedDiagnosis Related Groups severity of illness score.
CDA Algorithm Overview
Details regarding the CDA model development and its implementation have been previously described in detail.[4, 5, 6] In brief, we applied logistic regression techniques to develop the CDA algorithm. Manually obtained vital signs, laboratory data, and pharmacy data inputted real time into the electronic medical record (EMR) were continuously assessed. The CDA algorithm searched for the 36 input variables (Table 1) as previously described from the EMR for all patients admitted to the 8 medicine units 24 hours per day and 7 days a week.[4, 5, 6] Values for every continuous parameter were scaled so that all measurements lay in the interval (0, 1) and were normalized by the minimum and maximum of the parameter. To capture the temporal effects in our data, we retain a sliding window of all the collected data points within the last 24 hours. We then subdivide these data into a series of n equally sized buckets (eg, 6 sequential buckets of 4 hours each). To capture variations within a bucket, we compute 3 values for each bucket: the minimum, maximum, and mean data points. Each of the resulting 3 n values are input to the logistic regression equation as separate variables.
| Age |
| Alanine aminotransferase |
| Alternative medicines |
| Anion gap |
| Anti‐infectives |
| Antineoplastics |
| Aspartate aminotransferase |
| Biologicals |
| Blood pressure, diastolic |
| Blood pressure, systolic |
| Calcium, serum |
| Calcium, serum, ionized |
| Cardiovascular agents |
| Central nervous system agents |
| Charlson Comorbidity Index |
| Coagulation modifiers |
| Estimated creatinine clearance |
| Gastrointestinal agents |
| Genitourinary tract agents |
| Hormones/hormone modifiers |
| Immunologic agents |
| Magnesium, serum |
| Metabolic agents |
| Miscellaneous agents |
| Nutritional products |
| Oxygen saturation, pulse oximetry |
| Phosphate, serum |
| Potassium, serum |
| Psychotherapeutic agents |
| Pulse |
| Radiologic agents |
| Respirations |
| Respiratory agents |
| Shock Index |
| Temperature |
| Topical agents |
The algorithm was first implemented in MATLAB (MathWorks, Natick, MA). For the purposes of training, we used a single 24‐hour window of data from each patient. The dataset's 36 input variables were divided into buckets and minimum/mean/maximum features wherever applicable, resulting in 398 variables. The first half of the original dataset was used to train the model. We then used the second half of the dataset as the validation dataset. We generated a predicted outcome for each case in the validation data, using the model parameter coefficients derived from the training data. We also employed bootstrap aggregation to improve classification accuracy and to address overfitting. We then applied various threshold cut points to convert these predictions into binary values and compared the results against the ICU transfer outcome. A threshold of 0.9760 for specificity was chosen to achieve a sensitivity of approximately 40%. These operating characteristics were chosen in turn to generate a manageable number of alerts per hospital nursing unit per day (estimated at 12 per nursing unit per day). At this cut point the C statistic was 0.8834, with an overall accuracy of 0.9292.[5] Patients with inputted data meeting the CDA threshold had a real‐time alert sent to the hospital rapid response team prompting a patient evaluation.
Statistical Analysis
The number of patients admitted to the 8 general medicine units of Barnes‐Jewish Hospital during the study period determined the sample size. Categorical variables were compared using 2 or Fisher exact test as appropriate. Continuous variables were compared using the Mann‐Whitney U test. All analyses were 2‐tailed, and a P value of <0.05 was assumed to represent statistical significance. We relied on logistic regression for identifying variables independently associated with 30‐day readmission. Based on univariate analysis, variables significant at P < 0.15 were entered into the model. To arrive at the most parsimonious model, we utilized a stepwise backward elimination approach. We evaluated collinearity with the variance inflation factor. We report adjusted odds ratios (ORs) and 95% confidence intervals (CIs) where appropriate. The model's goodness of fit was assessed via calculation of the Hosmer‐Lemeshow test. Receiver operating characteristic (ROC) curves were used to compare the predictive models for 30‐day readmission with or without the CDA variable. All statistical analyses were performed using SPSS (version 22.0; IBM, Armonk, NY).
RESULTS
The final cohort had 3015 patients with a mean age of 57.5 17.5 years and 47.8% males. The most common reasons for hospital admission were infection or sepsis syndrome including pneumonia and urinary tract infections (23.6%), congestive heart failure or other cardiac conditions (18.4%), respiratory distress including chronic obstructive pulmonary disease (16.2%), acute or chronic renal failure (9.7%), gastrointestinal disorders (8.4%), and diabetes mellitus management (7.4%). Overall, there were 567 (18.8%) patients who were readmitted within 30 days of their hospital discharge date.
Table 2 shows the characteristics of patients readmitted within 30 days and of patients not requiring hospital readmission within 30 days. Patients requiring hospital readmission within 30 days were younger and had significantly more comorbidities as manifested by significantly greater Charlson scores and individual comorbidities including coronary artery disease, congestive heart disease, peripheral vascular disease, connective tissue disease, cirrhosis, diabetes mellitus with end‐organ complications, renal failure, and metastatic cancer. Patients with a 30‐day readmission had significantly longer duration of hospitalization, more emergency department visits in the 6 months prior to the index hospitalization, lower minimum hemoglobin measurements, higher minimum serum creatinine values, and were more likely to have Medicare or Medicaid insurance compared to patients without a 30‐day readmission.
| Variable | 30‐Day Readmission | P Value | |
|---|---|---|---|
| Yes (n = 567) | No (n = 2,448) | ||
| |||
| Age, y | 56.1 17.0 | 57.8 17.6 | 0.046 |
| Gender | |||
| Male | 252 (44.4) | 1,188 (48.5) | 0.079 |
| Female | 315 (55.6) | 1,260 (51.5) | |
| Race | |||
| Caucasian | 277 (48.9) | 1,234 (50.4) | 0.800 |
| African American | 257 (45.3) | 1,076 (44.0) | |
| Other | 33 (5.8) | 138 (5.6) | |
| Median income, dollars | 30,149 [25,23436,453] | 29,271 [24,83037,026] | 0.903 |
| BMI | 29.4 10.0 | 29.0 9.2 | 0.393 |
| APR‐DRG Severity of Illness Score | 2.6 0.4 | 2.5 0.5 | 0.152 |
| Charlson Comorbidity Index | 6 [39] | 5 [27] | <0.001 |
| ICU transfer during admission | 93 (16.4) | 410 (16.7) | 0.842 |
| Myocardial infarction | 83 (14.6) | 256 (10.5) | 0.005 |
| Congestive heart failure | 177 (31.2) | 540 (22.1) | <0.001 |
| Peripheral vascular disease | 76 (13.4) | 214 (8.7) | 0.001 |
| Cardiovascular disease | 69 (12.2) | 224 (9.2) | 0.029 |
| Dementia | 15 (2.6) | 80 (3.3) | 0.445 |
| Chronic obstructive pulmonary disease | 220 (38.8) | 855 (34.9) | 0.083 |
| Connective tissue disease | 45 (7.9) | 118 (4.8) | 0.003 |
| Peptic ulcer disease | 26 (4.6) | 111 (4.5) | 0.958 |
| Cirrhosis | 60 (10.6) | 141 (5.8) | <0.001 |
| Diabetes mellitus without end‐organ complications | 148 (26.1) | 625 (25.5) | 0.779 |
| Diabetes mellitus with end‐organ complications | 92 (16.2) | 197 (8.0) | <0.001 |
| Paralysis | 25 (4.4) | 77 (3.1) | 0.134 |
| Renal failure | 214 (37.7) | 620 (25.3) | <0.001 |
| Underlying malignancy | 85 (15.0) | 314 (12.8) | 0.171 |
| Metastatic cancer | 64 (11.3) | 163 (6.7) | <0.001 |
| Human immunodeficiency virus | 10 (1.8) | 47 (1.9) | 0.806 |
| Minimum hemoglobin, g/dL | 9.1 [7.411.4] | 10.7 [8.712.4] | <0.001 |
| Minimum creatinine, mg/dL | 1.12 [0.792.35] | 1.03 [0.791.63] | 0.006 |
| Length of stay, d | 3.8 [1.97.8] | 3.3 [1.85.9] | <0.001 |
| ED visit in the past year | 1 [03] | 0 [01] | <0.001 |
| Clinical deterioration alert triggered | 269 (47.4) | 872 (35.6%) | <0.001 |
| Insurance | |||
| Private | 111 (19.6) | 528 (21.6) | 0.020 |
| Medicare | 299 (52.7) | 1,217 (49.7) | |
| Medicaid | 129 (22.8) | 499 (20.4) | |
| Patient pay | 28 (4.9) | 204 (8.3) | |
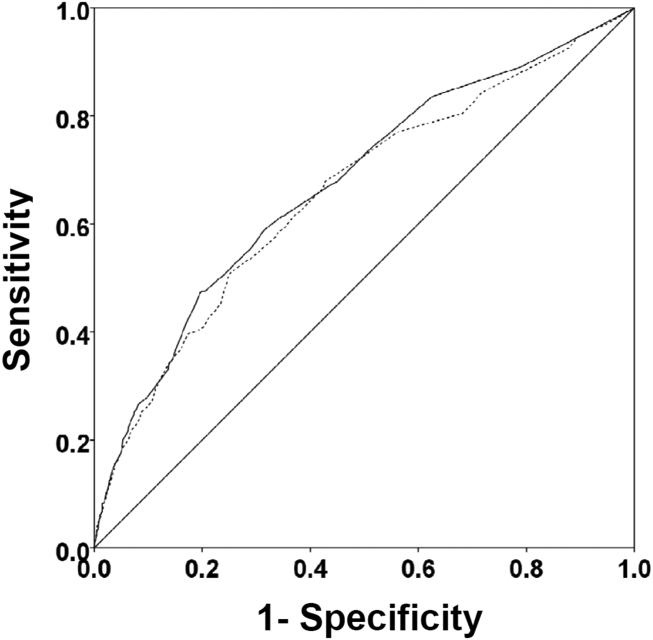
There were 1141 (34.4%) patients that triggered a CDA. Patients triggering a CDA were significantly more likely to have a 30‐day readmission compared to those who did not trigger a CDA (23.6% vs 15.9%; P < 0.001). Patients triggering a CDA were also significantly more likely to be readmitted within 60 days (31.7% vs 22.1%; P < 0.001) and 90 days (35.8% vs 26.2%; P < 0.001) compared to patients who did not trigger a CDA. Multiple logistic regression identified the triggering of a CDA to be independently associated with 30‐day readmission (OR: 1.40; 95% CI: 1.26‐1.55; P = 0.001) (Table 3). Other independent predictors of 30‐day readmission were: an emergency department visit in the previous 6 months, increasing age in 1‐year increments, presence of connective tissue disease, diabetes mellitus with end‐organ complications, chronic renal disease, cirrhosis, and metastatic cancer (Hosmer‐Lemeshow goodness of fit test, 0.363). Figure 1 reveals the ROC curves for the logistic regression model (Table 3) with and without the CDA variable. As the ROC curves document, the 2 models had similar sensitivity for the entire range of specificities. Reflecting this, the area under the ROC curve for the model inclusive of the CDA variable equaled 0.675 (95% CI: 0.649‐0.700), whereas the area under the ROC curve for the model excluding the CDA variable equaled 0.658 (95% CI: 0.632‐0.684).
| Variables | OR | 95% CI | P Value |
|---|---|---|---|
| |||
| Clinical deterioration alert | 1.40 | 1.261.55 | 0.001 |
| Age (1‐point increments) | 1.01 | 1.011.02 | 0.003 |
| Connective tissue disease | 1.63 | 1.341.98 | 0.012 |
| Cirrhosis | 1.25 | 1.171.33 | <0.001 |
| Diabetes mellitus with end‐organ complications | 1.23 | 1.131.33 | 0.010 |
| Chronic renal disease | 1.16 | 1.081.24 | 0.034 |
| Metastatic cancer | 1.12 | 1.081.17 | 0.002 |
| Emergency department visit in previous 6 months | 1.23 | 1.201.26 | <0.001 |

DISCUSSION
We demonstrated that the occurrence of an automated CDA is associated with increased risk for 30‐day hospital readmission. However, the addition of the CDA variable to the other variables identified to be independently associated with 30‐day readmission (Table 3) did not significantly add to the overall predictive accuracy of the derived logistic regression model. Other investigators have previously attempted to develop automated predictors of hospital readmission. Amarasingham et al. developed a real‐time electronic predictive model that identifies hospitalized heart failure patients at high risk for readmission or death from clinical and nonclinical risk factors present on admission.[13] Their electronic model demonstrated good discrimination for 30‐day mortality and readmission and performed as well, or better than, models developed by the Center for Medicaid and Medicare Services and the Acute Decompensated Heart Failure Registry. Similarly, Baillie et al. developed an automated prediction model that was effectively integrated into an existing EMR and identified patients on admission who were at risk for readmission within 30 days of discharge.[14] Our automated CDA differs from these previous risk predictors by surveying patients throughout their hospital stay as opposed to identifying risk for readmission at a single time point.
Several limitations of our study should be recognized. First, this was a noninterventional study aimed at examining the ability of CDAs to predict hospital readmission. Future studies are needed to assess whether the use of enhanced readmission prediction algorithms can be utilized to avert hospital readmissions. Second, the data derive from a single center, and this necessarily limits the generalizability of our findings. As such, our results may not reflect what one might see at other institutions. For example, Barnes‐Jewish Hospital has a regional referral pattern that includes community hospitals, regional long‐term acute care hospitals, nursing homes, and chronic wound, dialysis, and infusion clinics. This may explain, in part, the relatively high rate of hospital readmission observed in our cohort. Third, there is the possibility that CDAs were associated with readmission by chance given the number of potential predictor variables examined. The importance of CDAs as a determinant of rehospitalization requires confirmation in other independent populations. Fourth, it is likely that we did not capture all hospital readmissions, primarily those occurring outside of our hospital system. Therefore, we may have underestimated the actual rates of readmission for this cohort. Finally, we cannot be certain that all important predictors of hospital readmission were captured in this study.
The development of an accurate real‐time early warning system has the potential to identify patients at risk for various adverse outcomes including clinical deterioration, hospital death, and postdischarge readmission. By identifying patients at greatest risk for readmission, valuable healthcare resources can be better targeted to such populations. Our findings suggest that existing readmission predictors may suboptimally risk‐stratify patients, and it may be important to include additional clinical variables if pay for performance and other across‐institution comparisons are to be fair to institutions that care for more seriously ill patients. The variables identified as predictors of 30‐day hospital readmission in our study, with the exception of a CDA, are all readily identifiable clinical characteristics. The modest incremental value of a CDA to these clinical characteristics suggests that they would suffice for the identification of patients at high risk for hospital readmission. This is especially important for safety‐net institutions not routinely employing automated CDAs. These safety‐net hospitals provide a disproportionate level of care for patients who otherwise would have difficulty obtaining inpatient medical care and disproportionately carry the greatest burden of hospital readmissions.[15]
Disclosure
This study was funded in part by the Barnes‐Jewish Hospital Foundation and by grant number UL1 RR024992 from the National Center for Research Resources (NCRR), a component of the National Institutes of Health (NIH), and NIH Roadmap for Medical Research. Its contents are solely the responsibility of the authors and do not necessarily represent the official views of the NCRR or NIH.
- , , . Rapid‐response teams. N Engl J Med. 2011;365:139–146.
- , , , , , . Early prediction of septic shock in hospitalized patients. J Hosp Med. 2010;5:19–25.
- , , , et al. Implementation of a real‐time computerized sepsis alert in nonintensive care unit patients. Crit Care Med. 2011;39:469–473.
- , , , et al. Toward a two‐tier clinical warning system for hospitalized patients. AMIA Annu Symp Proc. 2011;2011:511–519.
- , , , et al. A trial of a real‐time alert for clinical deterioration in patients hospitalized on general medical wards. J Hosp Med. 2013;8:236–242.
- , , , et al. A randomized trial of real‐time automated clinical deterioration alerts sent to a rapid response team. J Hosp Med. 2014;9:424–429.
- , . Revisiting hospital readmissions JAMA. 2013;309:398–400.
- , , , . Adverse outcomes associated with delayed intensive care unit transfers in an integrated healthcare system. J Hosp Med. 2012;7:224–230.
- , , , , . Interventions to reduce 30‐day rehospitalization: a systematic review. Ann Intern Med. 2011; 155:520–528.
- , , , et al. International variation in and factors associated with hospital readmission after myocardial infarction. JAMA. 2012;307:66–74.
- , , , , . Predictors of early readmission among patients 40 to 64 years of age hospitalized for chronic obstructive pulmonary disease. Ann Am Thorac Soc. 2014;11:685–694.
- , , , , , . Assessing illness severity: does clinical judgement work? J Chronic Dis. 1986;39:439–452.
- , , , et al. An automated model to identify heart failure patients at risk for 30‐day readmission or death using electronic medical record data. Med Care. 2010;48:981–988.
- , , , et al. The readmission risk flag: using the electronic health record to automatically identify patients at risk for 30‐day readmission. J Hosp Med. 2013;8:689–695.
- , , . The Medicare hospital readmissions reduction program: time for reform. JAMA. 2015;314:347–348.
Rapid response systems (RRSs) have been developed to identify and treat deteriorating patients on general hospital units.[1] The most commonly proposed approach to the problem of identifying and stabilizing deteriorating hospitalized patients includes some combination of an early warning system to detect the deterioration and an RRS to deal with it. We previously demonstrated that a relatively simple hospital‐specific prediction model employing routine laboratory values and vital sign data is capable of predicting clinical deterioration, the need for intensive care unit (ICU) transfer, and hospital mortality in patients admitted to general medicine units.[2, 3, 4, 5, 6]
Hospital readmissions within 30 days of hospital discharge occur often and are difficult to predict. Starting in 2013, readmission penalties have been applied to specific conditions in the United States (acute myocardial infarction, heart failure, and pneumonia), with the expectation that additional conditions will be added to this group in years to come.[7, 8] Unfortunately, interventions developed to date have not been universally successful in preventing hospital readmissions for various medical conditions and patient types.[9] One potential explanation for this is the inability to reliably predict which patients are at risk for readmission to better target preventative interventions. Predictors of hospital readmission can be disease specific, such as the presence of multivessel disease in patients hospitalized with myocardial infarction,[10] or more general, such as lack of available medical follow‐up postdischarge.[11] Therefore, we performed a study to determine whether the occurrence of automated clinical deterioration alerts (CDAs) predicted 30‐day hospital readmission.
METHODS
Study Location
The study was conducted on 8 general medicine units of Barnes‐Jewish Hospital, a 1250‐bed academic medical center in St. Louis, Missouri (January 15, 2015December 12, 2015). Patient care on the inpatient medicine units is delivered by either attending hospitalist physicians or housestaff physicians under the supervision of an attending physician. The study was approved by the Washington University School of Medicine Human Studies Committee, and informed consent was waived.
Study Overview
We retrospectively evaluated all adult patients (aged >18 years) admitted through the emergency department or transferred directly to the general medicine units from other institutions. We excluded patients who died while hospitalized. All data were derived from the hospital informatics database provided by the Center for Clinical Excellence, BJC HealthCare.
Primary End Point
Readmission for any reason (ie, all‐cause readmission) to an acute care facility in the 30 days following discharge after the index hospitalization served as the primary end point. Barnes‐Jewish Hospital serves as the main teaching institution for BJC Healthcare, a large integrated healthcare system of both inpatient and outpatient care. The system includes a total of 12 hospitals and multiple community health locations in a compact geographic region surrounding and including St. Louis, Missouri, and we included readmission to any of these hospitals in our analysis. Persons treated within this healthcare system are, in nearly all cases, readmitted to 1 of the system's participating 12 hospitals. If a patient who receives healthcare in the system presents to a nonsystem hospital, he/she is often transferred back into the integrated system because of issues of insurance coverage. Patients with a 30‐day readmission were compared to those without a 30‐day readmission.
Variables
We recorded information regarding demographics, median income of the zip code of residence as a marker of socioeconomic status, admission to any BJC Healthcare facility within 6 months of the index admission, and comorbidities. To represent the global burden of comorbidities in each patient, we calculated their Charlson Comorbidity Index score.[12] Severity of illness was assessed using the All Patient RefinedDiagnosis Related Groups severity of illness score.
CDA Algorithm Overview
Details regarding the CDA model development and its implementation have been previously described in detail.[4, 5, 6] In brief, we applied logistic regression techniques to develop the CDA algorithm. Manually obtained vital signs, laboratory data, and pharmacy data inputted real time into the electronic medical record (EMR) were continuously assessed. The CDA algorithm searched for the 36 input variables (Table 1) as previously described from the EMR for all patients admitted to the 8 medicine units 24 hours per day and 7 days a week.[4, 5, 6] Values for every continuous parameter were scaled so that all measurements lay in the interval (0, 1) and were normalized by the minimum and maximum of the parameter. To capture the temporal effects in our data, we retain a sliding window of all the collected data points within the last 24 hours. We then subdivide these data into a series of n equally sized buckets (eg, 6 sequential buckets of 4 hours each). To capture variations within a bucket, we compute 3 values for each bucket: the minimum, maximum, and mean data points. Each of the resulting 3 n values are input to the logistic regression equation as separate variables.
| Age |
| Alanine aminotransferase |
| Alternative medicines |
| Anion gap |
| Anti‐infectives |
| Antineoplastics |
| Aspartate aminotransferase |
| Biologicals |
| Blood pressure, diastolic |
| Blood pressure, systolic |
| Calcium, serum |
| Calcium, serum, ionized |
| Cardiovascular agents |
| Central nervous system agents |
| Charlson Comorbidity Index |
| Coagulation modifiers |
| Estimated creatinine clearance |
| Gastrointestinal agents |
| Genitourinary tract agents |
| Hormones/hormone modifiers |
| Immunologic agents |
| Magnesium, serum |
| Metabolic agents |
| Miscellaneous agents |
| Nutritional products |
| Oxygen saturation, pulse oximetry |
| Phosphate, serum |
| Potassium, serum |
| Psychotherapeutic agents |
| Pulse |
| Radiologic agents |
| Respirations |
| Respiratory agents |
| Shock Index |
| Temperature |
| Topical agents |
The algorithm was first implemented in MATLAB (MathWorks, Natick, MA). For the purposes of training, we used a single 24‐hour window of data from each patient. The dataset's 36 input variables were divided into buckets and minimum/mean/maximum features wherever applicable, resulting in 398 variables. The first half of the original dataset was used to train the model. We then used the second half of the dataset as the validation dataset. We generated a predicted outcome for each case in the validation data, using the model parameter coefficients derived from the training data. We also employed bootstrap aggregation to improve classification accuracy and to address overfitting. We then applied various threshold cut points to convert these predictions into binary values and compared the results against the ICU transfer outcome. A threshold of 0.9760 for specificity was chosen to achieve a sensitivity of approximately 40%. These operating characteristics were chosen in turn to generate a manageable number of alerts per hospital nursing unit per day (estimated at 12 per nursing unit per day). At this cut point the C statistic was 0.8834, with an overall accuracy of 0.9292.[5] Patients with inputted data meeting the CDA threshold had a real‐time alert sent to the hospital rapid response team prompting a patient evaluation.
Statistical Analysis
The number of patients admitted to the 8 general medicine units of Barnes‐Jewish Hospital during the study period determined the sample size. Categorical variables were compared using 2 or Fisher exact test as appropriate. Continuous variables were compared using the Mann‐Whitney U test. All analyses were 2‐tailed, and a P value of <0.05 was assumed to represent statistical significance. We relied on logistic regression for identifying variables independently associated with 30‐day readmission. Based on univariate analysis, variables significant at P < 0.15 were entered into the model. To arrive at the most parsimonious model, we utilized a stepwise backward elimination approach. We evaluated collinearity with the variance inflation factor. We report adjusted odds ratios (ORs) and 95% confidence intervals (CIs) where appropriate. The model's goodness of fit was assessed via calculation of the Hosmer‐Lemeshow test. Receiver operating characteristic (ROC) curves were used to compare the predictive models for 30‐day readmission with or without the CDA variable. All statistical analyses were performed using SPSS (version 22.0; IBM, Armonk, NY).
RESULTS
The final cohort had 3015 patients with a mean age of 57.5 17.5 years and 47.8% males. The most common reasons for hospital admission were infection or sepsis syndrome including pneumonia and urinary tract infections (23.6%), congestive heart failure or other cardiac conditions (18.4%), respiratory distress including chronic obstructive pulmonary disease (16.2%), acute or chronic renal failure (9.7%), gastrointestinal disorders (8.4%), and diabetes mellitus management (7.4%). Overall, there were 567 (18.8%) patients who were readmitted within 30 days of their hospital discharge date.
Table 2 shows the characteristics of patients readmitted within 30 days and of patients not requiring hospital readmission within 30 days. Patients requiring hospital readmission within 30 days were younger and had significantly more comorbidities as manifested by significantly greater Charlson scores and individual comorbidities including coronary artery disease, congestive heart disease, peripheral vascular disease, connective tissue disease, cirrhosis, diabetes mellitus with end‐organ complications, renal failure, and metastatic cancer. Patients with a 30‐day readmission had significantly longer duration of hospitalization, more emergency department visits in the 6 months prior to the index hospitalization, lower minimum hemoglobin measurements, higher minimum serum creatinine values, and were more likely to have Medicare or Medicaid insurance compared to patients without a 30‐day readmission.
| Variable | 30‐Day Readmission | P Value | |
|---|---|---|---|
| Yes (n = 567) | No (n = 2,448) | ||
| |||
| Age, y | 56.1 17.0 | 57.8 17.6 | 0.046 |
| Gender | |||
| Male | 252 (44.4) | 1,188 (48.5) | 0.079 |
| Female | 315 (55.6) | 1,260 (51.5) | |
| Race | |||
| Caucasian | 277 (48.9) | 1,234 (50.4) | 0.800 |
| African American | 257 (45.3) | 1,076 (44.0) | |
| Other | 33 (5.8) | 138 (5.6) | |
| Median income, dollars | 30,149 [25,23436,453] | 29,271 [24,83037,026] | 0.903 |
| BMI | 29.4 10.0 | 29.0 9.2 | 0.393 |
| APR‐DRG Severity of Illness Score | 2.6 0.4 | 2.5 0.5 | 0.152 |
| Charlson Comorbidity Index | 6 [39] | 5 [27] | <0.001 |
| ICU transfer during admission | 93 (16.4) | 410 (16.7) | 0.842 |
| Myocardial infarction | 83 (14.6) | 256 (10.5) | 0.005 |
| Congestive heart failure | 177 (31.2) | 540 (22.1) | <0.001 |
| Peripheral vascular disease | 76 (13.4) | 214 (8.7) | 0.001 |
| Cardiovascular disease | 69 (12.2) | 224 (9.2) | 0.029 |
| Dementia | 15 (2.6) | 80 (3.3) | 0.445 |
| Chronic obstructive pulmonary disease | 220 (38.8) | 855 (34.9) | 0.083 |
| Connective tissue disease | 45 (7.9) | 118 (4.8) | 0.003 |
| Peptic ulcer disease | 26 (4.6) | 111 (4.5) | 0.958 |
| Cirrhosis | 60 (10.6) | 141 (5.8) | <0.001 |
| Diabetes mellitus without end‐organ complications | 148 (26.1) | 625 (25.5) | 0.779 |
| Diabetes mellitus with end‐organ complications | 92 (16.2) | 197 (8.0) | <0.001 |
| Paralysis | 25 (4.4) | 77 (3.1) | 0.134 |
| Renal failure | 214 (37.7) | 620 (25.3) | <0.001 |
| Underlying malignancy | 85 (15.0) | 314 (12.8) | 0.171 |
| Metastatic cancer | 64 (11.3) | 163 (6.7) | <0.001 |
| Human immunodeficiency virus | 10 (1.8) | 47 (1.9) | 0.806 |
| Minimum hemoglobin, g/dL | 9.1 [7.411.4] | 10.7 [8.712.4] | <0.001 |
| Minimum creatinine, mg/dL | 1.12 [0.792.35] | 1.03 [0.791.63] | 0.006 |
| Length of stay, d | 3.8 [1.97.8] | 3.3 [1.85.9] | <0.001 |
| ED visit in the past year | 1 [03] | 0 [01] | <0.001 |
| Clinical deterioration alert triggered | 269 (47.4) | 872 (35.6%) | <0.001 |
| Insurance | |||
| Private | 111 (19.6) | 528 (21.6) | 0.020 |
| Medicare | 299 (52.7) | 1,217 (49.7) | |
| Medicaid | 129 (22.8) | 499 (20.4) | |
| Patient pay | 28 (4.9) | 204 (8.3) | |
There were 1141 (34.4%) patients that triggered a CDA. Patients triggering a CDA were significantly more likely to have a 30‐day readmission compared to those who did not trigger a CDA (23.6% vs 15.9%; P < 0.001). Patients triggering a CDA were also significantly more likely to be readmitted within 60 days (31.7% vs 22.1%; P < 0.001) and 90 days (35.8% vs 26.2%; P < 0.001) compared to patients who did not trigger a CDA. Multiple logistic regression identified the triggering of a CDA to be independently associated with 30‐day readmission (OR: 1.40; 95% CI: 1.26‐1.55; P = 0.001) (Table 3). Other independent predictors of 30‐day readmission were: an emergency department visit in the previous 6 months, increasing age in 1‐year increments, presence of connective tissue disease, diabetes mellitus with end‐organ complications, chronic renal disease, cirrhosis, and metastatic cancer (Hosmer‐Lemeshow goodness of fit test, 0.363). Figure 1 reveals the ROC curves for the logistic regression model (Table 3) with and without the CDA variable. As the ROC curves document, the 2 models had similar sensitivity for the entire range of specificities. Reflecting this, the area under the ROC curve for the model inclusive of the CDA variable equaled 0.675 (95% CI: 0.649‐0.700), whereas the area under the ROC curve for the model excluding the CDA variable equaled 0.658 (95% CI: 0.632‐0.684).
| Variables | OR | 95% CI | P Value |
|---|---|---|---|
| |||
| Clinical deterioration alert | 1.40 | 1.261.55 | 0.001 |
| Age (1‐point increments) | 1.01 | 1.011.02 | 0.003 |
| Connective tissue disease | 1.63 | 1.341.98 | 0.012 |
| Cirrhosis | 1.25 | 1.171.33 | <0.001 |
| Diabetes mellitus with end‐organ complications | 1.23 | 1.131.33 | 0.010 |
| Chronic renal disease | 1.16 | 1.081.24 | 0.034 |
| Metastatic cancer | 1.12 | 1.081.17 | 0.002 |
| Emergency department visit in previous 6 months | 1.23 | 1.201.26 | <0.001 |
DISCUSSION
We demonstrated that the occurrence of an automated CDA is associated with increased risk for 30‐day hospital readmission. However, the addition of the CDA variable to the other variables identified to be independently associated with 30‐day readmission (Table 3) did not significantly add to the overall predictive accuracy of the derived logistic regression model. Other investigators have previously attempted to develop automated predictors of hospital readmission. Amarasingham et al. developed a real‐time electronic predictive model that identifies hospitalized heart failure patients at high risk for readmission or death from clinical and nonclinical risk factors present on admission.[13] Their electronic model demonstrated good discrimination for 30‐day mortality and readmission and performed as well, or better than, models developed by the Center for Medicaid and Medicare Services and the Acute Decompensated Heart Failure Registry. Similarly, Baillie et al. developed an automated prediction model that was effectively integrated into an existing EMR and identified patients on admission who were at risk for readmission within 30 days of discharge.[14] Our automated CDA differs from these previous risk predictors by surveying patients throughout their hospital stay as opposed to identifying risk for readmission at a single time point.
Several limitations of our study should be recognized. First, this was a noninterventional study aimed at examining the ability of CDAs to predict hospital readmission. Future studies are needed to assess whether the use of enhanced readmission prediction algorithms can be utilized to avert hospital readmissions. Second, the data derive from a single center, and this necessarily limits the generalizability of our findings. As such, our results may not reflect what one might see at other institutions. For example, Barnes‐Jewish Hospital has a regional referral pattern that includes community hospitals, regional long‐term acute care hospitals, nursing homes, and chronic wound, dialysis, and infusion clinics. This may explain, in part, the relatively high rate of hospital readmission observed in our cohort. Third, there is the possibility that CDAs were associated with readmission by chance given the number of potential predictor variables examined. The importance of CDAs as a determinant of rehospitalization requires confirmation in other independent populations. Fourth, it is likely that we did not capture all hospital readmissions, primarily those occurring outside of our hospital system. Therefore, we may have underestimated the actual rates of readmission for this cohort. Finally, we cannot be certain that all important predictors of hospital readmission were captured in this study.
The development of an accurate real‐time early warning system has the potential to identify patients at risk for various adverse outcomes including clinical deterioration, hospital death, and postdischarge readmission. By identifying patients at greatest risk for readmission, valuable healthcare resources can be better targeted to such populations. Our findings suggest that existing readmission predictors may suboptimally risk‐stratify patients, and it may be important to include additional clinical variables if pay for performance and other across‐institution comparisons are to be fair to institutions that care for more seriously ill patients. The variables identified as predictors of 30‐day hospital readmission in our study, with the exception of a CDA, are all readily identifiable clinical characteristics. The modest incremental value of a CDA to these clinical characteristics suggests that they would suffice for the identification of patients at high risk for hospital readmission. This is especially important for safety‐net institutions not routinely employing automated CDAs. These safety‐net hospitals provide a disproportionate level of care for patients who otherwise would have difficulty obtaining inpatient medical care and disproportionately carry the greatest burden of hospital readmissions.[15]
Disclosure
This study was funded in part by the Barnes‐Jewish Hospital Foundation and by grant number UL1 RR024992 from the National Center for Research Resources (NCRR), a component of the National Institutes of Health (NIH), and NIH Roadmap for Medical Research. Its contents are solely the responsibility of the authors and do not necessarily represent the official views of the NCRR or NIH.
- , , . Rapid‐response teams. N Engl J Med. 2011;365:139–146.
- , , , , , . Early prediction of septic shock in hospitalized patients. J Hosp Med. 2010;5:19–25.
- , , , et al. Implementation of a real‐time computerized sepsis alert in nonintensive care unit patients. Crit Care Med. 2011;39:469–473.
- , , , et al. Toward a two‐tier clinical warning system for hospitalized patients. AMIA Annu Symp Proc. 2011;2011:511–519.
- , , , et al. A trial of a real‐time alert for clinical deterioration in patients hospitalized on general medical wards. J Hosp Med. 2013;8:236–242.
- , , , et al. A randomized trial of real‐time automated clinical deterioration alerts sent to a rapid response team. J Hosp Med. 2014;9:424–429.
- , . Revisiting hospital readmissions JAMA. 2013;309:398–400.
- , , , . Adverse outcomes associated with delayed intensive care unit transfers in an integrated healthcare system. J Hosp Med. 2012;7:224–230.
- , , , , . Interventions to reduce 30‐day rehospitalization: a systematic review. Ann Intern Med. 2011; 155:520–528.
- , , , et al. International variation in and factors associated with hospital readmission after myocardial infarction. JAMA. 2012;307:66–74.
- , , , , . Predictors of early readmission among patients 40 to 64 years of age hospitalized for chronic obstructive pulmonary disease. Ann Am Thorac Soc. 2014;11:685–694.
- , , , , , . Assessing illness severity: does clinical judgement work? J Chronic Dis. 1986;39:439–452.
- , , , et al. An automated model to identify heart failure patients at risk for 30‐day readmission or death using electronic medical record data. Med Care. 2010;48:981–988.
- , , , et al. The readmission risk flag: using the electronic health record to automatically identify patients at risk for 30‐day readmission. J Hosp Med. 2013;8:689–695.
- , , . The Medicare hospital readmissions reduction program: time for reform. JAMA. 2015;314:347–348.