User login
Clinical Alerts Predict Readmission
Rapid response systems (RRSs) have been developed to identify and treat deteriorating patients on general hospital units.[1] The most commonly proposed approach to the problem of identifying and stabilizing deteriorating hospitalized patients includes some combination of an early warning system to detect the deterioration and an RRS to deal with it. We previously demonstrated that a relatively simple hospital‐specific prediction model employing routine laboratory values and vital sign data is capable of predicting clinical deterioration, the need for intensive care unit (ICU) transfer, and hospital mortality in patients admitted to general medicine units.[2, 3, 4, 5, 6]
Hospital readmissions within 30 days of hospital discharge occur often and are difficult to predict. Starting in 2013, readmission penalties have been applied to specific conditions in the United States (acute myocardial infarction, heart failure, and pneumonia), with the expectation that additional conditions will be added to this group in years to come.[7, 8] Unfortunately, interventions developed to date have not been universally successful in preventing hospital readmissions for various medical conditions and patient types.[9] One potential explanation for this is the inability to reliably predict which patients are at risk for readmission to better target preventative interventions. Predictors of hospital readmission can be disease specific, such as the presence of multivessel disease in patients hospitalized with myocardial infarction,[10] or more general, such as lack of available medical follow‐up postdischarge.[11] Therefore, we performed a study to determine whether the occurrence of automated clinical deterioration alerts (CDAs) predicted 30‐day hospital readmission.
METHODS
Study Location
The study was conducted on 8 general medicine units of Barnes‐Jewish Hospital, a 1250‐bed academic medical center in St. Louis, Missouri (January 15, 2015December 12, 2015). Patient care on the inpatient medicine units is delivered by either attending hospitalist physicians or housestaff physicians under the supervision of an attending physician. The study was approved by the Washington University School of Medicine Human Studies Committee, and informed consent was waived.
Study Overview
We retrospectively evaluated all adult patients (aged >18 years) admitted through the emergency department or transferred directly to the general medicine units from other institutions. We excluded patients who died while hospitalized. All data were derived from the hospital informatics database provided by the Center for Clinical Excellence, BJC HealthCare.
Primary End Point
Readmission for any reason (ie, all‐cause readmission) to an acute care facility in the 30 days following discharge after the index hospitalization served as the primary end point. Barnes‐Jewish Hospital serves as the main teaching institution for BJC Healthcare, a large integrated healthcare system of both inpatient and outpatient care. The system includes a total of 12 hospitals and multiple community health locations in a compact geographic region surrounding and including St. Louis, Missouri, and we included readmission to any of these hospitals in our analysis. Persons treated within this healthcare system are, in nearly all cases, readmitted to 1 of the system's participating 12 hospitals. If a patient who receives healthcare in the system presents to a nonsystem hospital, he/she is often transferred back into the integrated system because of issues of insurance coverage. Patients with a 30‐day readmission were compared to those without a 30‐day readmission.
Variables
We recorded information regarding demographics, median income of the zip code of residence as a marker of socioeconomic status, admission to any BJC Healthcare facility within 6 months of the index admission, and comorbidities. To represent the global burden of comorbidities in each patient, we calculated their Charlson Comorbidity Index score.[12] Severity of illness was assessed using the All Patient RefinedDiagnosis Related Groups severity of illness score.
CDA Algorithm Overview
Details regarding the CDA model development and its implementation have been previously described in detail.[4, 5, 6] In brief, we applied logistic regression techniques to develop the CDA algorithm. Manually obtained vital signs, laboratory data, and pharmacy data inputted real time into the electronic medical record (EMR) were continuously assessed. The CDA algorithm searched for the 36 input variables (Table 1) as previously described from the EMR for all patients admitted to the 8 medicine units 24 hours per day and 7 days a week.[4, 5, 6] Values for every continuous parameter were scaled so that all measurements lay in the interval (0, 1) and were normalized by the minimum and maximum of the parameter. To capture the temporal effects in our data, we retain a sliding window of all the collected data points within the last 24 hours. We then subdivide these data into a series of n equally sized buckets (eg, 6 sequential buckets of 4 hours each). To capture variations within a bucket, we compute 3 values for each bucket: the minimum, maximum, and mean data points. Each of the resulting 3 n values are input to the logistic regression equation as separate variables.
| Age |
| Alanine aminotransferase |
| Alternative medicines |
| Anion gap |
| Anti‐infectives |
| Antineoplastics |
| Aspartate aminotransferase |
| Biologicals |
| Blood pressure, diastolic |
| Blood pressure, systolic |
| Calcium, serum |
| Calcium, serum, ionized |
| Cardiovascular agents |
| Central nervous system agents |
| Charlson Comorbidity Index |
| Coagulation modifiers |
| Estimated creatinine clearance |
| Gastrointestinal agents |
| Genitourinary tract agents |
| Hormones/hormone modifiers |
| Immunologic agents |
| Magnesium, serum |
| Metabolic agents |
| Miscellaneous agents |
| Nutritional products |
| Oxygen saturation, pulse oximetry |
| Phosphate, serum |
| Potassium, serum |
| Psychotherapeutic agents |
| Pulse |
| Radiologic agents |
| Respirations |
| Respiratory agents |
| Shock Index |
| Temperature |
| Topical agents |
The algorithm was first implemented in MATLAB (MathWorks, Natick, MA). For the purposes of training, we used a single 24‐hour window of data from each patient. The dataset's 36 input variables were divided into buckets and minimum/mean/maximum features wherever applicable, resulting in 398 variables. The first half of the original dataset was used to train the model. We then used the second half of the dataset as the validation dataset. We generated a predicted outcome for each case in the validation data, using the model parameter coefficients derived from the training data. We also employed bootstrap aggregation to improve classification accuracy and to address overfitting. We then applied various threshold cut points to convert these predictions into binary values and compared the results against the ICU transfer outcome. A threshold of 0.9760 for specificity was chosen to achieve a sensitivity of approximately 40%. These operating characteristics were chosen in turn to generate a manageable number of alerts per hospital nursing unit per day (estimated at 12 per nursing unit per day). At this cut point the C statistic was 0.8834, with an overall accuracy of 0.9292.[5] Patients with inputted data meeting the CDA threshold had a real‐time alert sent to the hospital rapid response team prompting a patient evaluation.
Statistical Analysis
The number of patients admitted to the 8 general medicine units of Barnes‐Jewish Hospital during the study period determined the sample size. Categorical variables were compared using 2 or Fisher exact test as appropriate. Continuous variables were compared using the Mann‐Whitney U test. All analyses were 2‐tailed, and a P value of <0.05 was assumed to represent statistical significance. We relied on logistic regression for identifying variables independently associated with 30‐day readmission. Based on univariate analysis, variables significant at P < 0.15 were entered into the model. To arrive at the most parsimonious model, we utilized a stepwise backward elimination approach. We evaluated collinearity with the variance inflation factor. We report adjusted odds ratios (ORs) and 95% confidence intervals (CIs) where appropriate. The model's goodness of fit was assessed via calculation of the Hosmer‐Lemeshow test. Receiver operating characteristic (ROC) curves were used to compare the predictive models for 30‐day readmission with or without the CDA variable. All statistical analyses were performed using SPSS (version 22.0; IBM, Armonk, NY).
RESULTS
The final cohort had 3015 patients with a mean age of 57.5 17.5 years and 47.8% males. The most common reasons for hospital admission were infection or sepsis syndrome including pneumonia and urinary tract infections (23.6%), congestive heart failure or other cardiac conditions (18.4%), respiratory distress including chronic obstructive pulmonary disease (16.2%), acute or chronic renal failure (9.7%), gastrointestinal disorders (8.4%), and diabetes mellitus management (7.4%). Overall, there were 567 (18.8%) patients who were readmitted within 30 days of their hospital discharge date.
Table 2 shows the characteristics of patients readmitted within 30 days and of patients not requiring hospital readmission within 30 days. Patients requiring hospital readmission within 30 days were younger and had significantly more comorbidities as manifested by significantly greater Charlson scores and individual comorbidities including coronary artery disease, congestive heart disease, peripheral vascular disease, connective tissue disease, cirrhosis, diabetes mellitus with end‐organ complications, renal failure, and metastatic cancer. Patients with a 30‐day readmission had significantly longer duration of hospitalization, more emergency department visits in the 6 months prior to the index hospitalization, lower minimum hemoglobin measurements, higher minimum serum creatinine values, and were more likely to have Medicare or Medicaid insurance compared to patients without a 30‐day readmission.
| Variable | 30‐Day Readmission | P Value | |
|---|---|---|---|
| Yes (n = 567) | No (n = 2,448) | ||
| |||
| Age, y | 56.1 17.0 | 57.8 17.6 | 0.046 |
| Gender | |||
| Male | 252 (44.4) | 1,188 (48.5) | 0.079 |
| Female | 315 (55.6) | 1,260 (51.5) | |
| Race | |||
| Caucasian | 277 (48.9) | 1,234 (50.4) | 0.800 |
| African American | 257 (45.3) | 1,076 (44.0) | |
| Other | 33 (5.8) | 138 (5.6) | |
| Median income, dollars | 30,149 [25,23436,453] | 29,271 [24,83037,026] | 0.903 |
| BMI | 29.4 10.0 | 29.0 9.2 | 0.393 |
| APR‐DRG Severity of Illness Score | 2.6 0.4 | 2.5 0.5 | 0.152 |
| Charlson Comorbidity Index | 6 [39] | 5 [27] | <0.001 |
| ICU transfer during admission | 93 (16.4) | 410 (16.7) | 0.842 |
| Myocardial infarction | 83 (14.6) | 256 (10.5) | 0.005 |
| Congestive heart failure | 177 (31.2) | 540 (22.1) | <0.001 |
| Peripheral vascular disease | 76 (13.4) | 214 (8.7) | 0.001 |
| Cardiovascular disease | 69 (12.2) | 224 (9.2) | 0.029 |
| Dementia | 15 (2.6) | 80 (3.3) | 0.445 |
| Chronic obstructive pulmonary disease | 220 (38.8) | 855 (34.9) | 0.083 |
| Connective tissue disease | 45 (7.9) | 118 (4.8) | 0.003 |
| Peptic ulcer disease | 26 (4.6) | 111 (4.5) | 0.958 |
| Cirrhosis | 60 (10.6) | 141 (5.8) | <0.001 |
| Diabetes mellitus without end‐organ complications | 148 (26.1) | 625 (25.5) | 0.779 |
| Diabetes mellitus with end‐organ complications | 92 (16.2) | 197 (8.0) | <0.001 |
| Paralysis | 25 (4.4) | 77 (3.1) | 0.134 |
| Renal failure | 214 (37.7) | 620 (25.3) | <0.001 |
| Underlying malignancy | 85 (15.0) | 314 (12.8) | 0.171 |
| Metastatic cancer | 64 (11.3) | 163 (6.7) | <0.001 |
| Human immunodeficiency virus | 10 (1.8) | 47 (1.9) | 0.806 |
| Minimum hemoglobin, g/dL | 9.1 [7.411.4] | 10.7 [8.712.4] | <0.001 |
| Minimum creatinine, mg/dL | 1.12 [0.792.35] | 1.03 [0.791.63] | 0.006 |
| Length of stay, d | 3.8 [1.97.8] | 3.3 [1.85.9] | <0.001 |
| ED visit in the past year | 1 [03] | 0 [01] | <0.001 |
| Clinical deterioration alert triggered | 269 (47.4) | 872 (35.6%) | <0.001 |
| Insurance | |||
| Private | 111 (19.6) | 528 (21.6) | 0.020 |
| Medicare | 299 (52.7) | 1,217 (49.7) | |
| Medicaid | 129 (22.8) | 499 (20.4) | |
| Patient pay | 28 (4.9) | 204 (8.3) | |
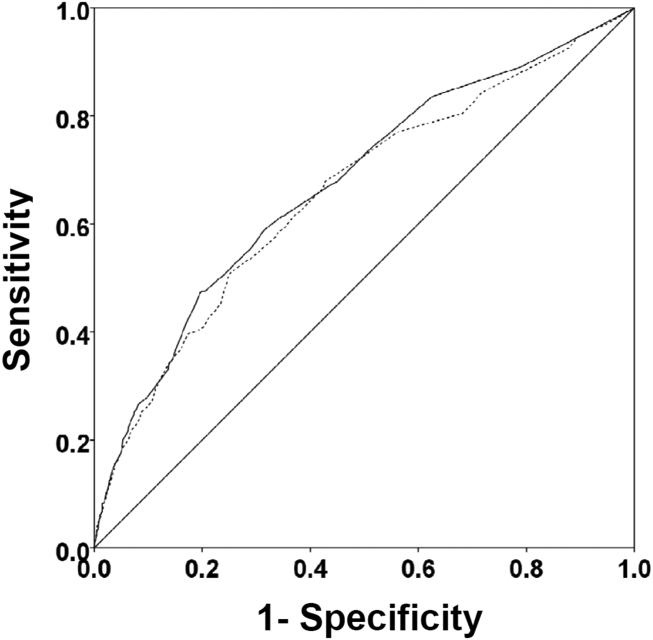
There were 1141 (34.4%) patients that triggered a CDA. Patients triggering a CDA were significantly more likely to have a 30‐day readmission compared to those who did not trigger a CDA (23.6% vs 15.9%; P < 0.001). Patients triggering a CDA were also significantly more likely to be readmitted within 60 days (31.7% vs 22.1%; P < 0.001) and 90 days (35.8% vs 26.2%; P < 0.001) compared to patients who did not trigger a CDA. Multiple logistic regression identified the triggering of a CDA to be independently associated with 30‐day readmission (OR: 1.40; 95% CI: 1.26‐1.55; P = 0.001) (Table 3). Other independent predictors of 30‐day readmission were: an emergency department visit in the previous 6 months, increasing age in 1‐year increments, presence of connective tissue disease, diabetes mellitus with end‐organ complications, chronic renal disease, cirrhosis, and metastatic cancer (Hosmer‐Lemeshow goodness of fit test, 0.363). Figure 1 reveals the ROC curves for the logistic regression model (Table 3) with and without the CDA variable. As the ROC curves document, the 2 models had similar sensitivity for the entire range of specificities. Reflecting this, the area under the ROC curve for the model inclusive of the CDA variable equaled 0.675 (95% CI: 0.649‐0.700), whereas the area under the ROC curve for the model excluding the CDA variable equaled 0.658 (95% CI: 0.632‐0.684).
| Variables | OR | 95% CI | P Value |
|---|---|---|---|
| |||
| Clinical deterioration alert | 1.40 | 1.261.55 | 0.001 |
| Age (1‐point increments) | 1.01 | 1.011.02 | 0.003 |
| Connective tissue disease | 1.63 | 1.341.98 | 0.012 |
| Cirrhosis | 1.25 | 1.171.33 | <0.001 |
| Diabetes mellitus with end‐organ complications | 1.23 | 1.131.33 | 0.010 |
| Chronic renal disease | 1.16 | 1.081.24 | 0.034 |
| Metastatic cancer | 1.12 | 1.081.17 | 0.002 |
| Emergency department visit in previous 6 months | 1.23 | 1.201.26 | <0.001 |

DISCUSSION
We demonstrated that the occurrence of an automated CDA is associated with increased risk for 30‐day hospital readmission. However, the addition of the CDA variable to the other variables identified to be independently associated with 30‐day readmission (Table 3) did not significantly add to the overall predictive accuracy of the derived logistic regression model. Other investigators have previously attempted to develop automated predictors of hospital readmission. Amarasingham et al. developed a real‐time electronic predictive model that identifies hospitalized heart failure patients at high risk for readmission or death from clinical and nonclinical risk factors present on admission.[13] Their electronic model demonstrated good discrimination for 30‐day mortality and readmission and performed as well, or better than, models developed by the Center for Medicaid and Medicare Services and the Acute Decompensated Heart Failure Registry. Similarly, Baillie et al. developed an automated prediction model that was effectively integrated into an existing EMR and identified patients on admission who were at risk for readmission within 30 days of discharge.[14] Our automated CDA differs from these previous risk predictors by surveying patients throughout their hospital stay as opposed to identifying risk for readmission at a single time point.
Several limitations of our study should be recognized. First, this was a noninterventional study aimed at examining the ability of CDAs to predict hospital readmission. Future studies are needed to assess whether the use of enhanced readmission prediction algorithms can be utilized to avert hospital readmissions. Second, the data derive from a single center, and this necessarily limits the generalizability of our findings. As such, our results may not reflect what one might see at other institutions. For example, Barnes‐Jewish Hospital has a regional referral pattern that includes community hospitals, regional long‐term acute care hospitals, nursing homes, and chronic wound, dialysis, and infusion clinics. This may explain, in part, the relatively high rate of hospital readmission observed in our cohort. Third, there is the possibility that CDAs were associated with readmission by chance given the number of potential predictor variables examined. The importance of CDAs as a determinant of rehospitalization requires confirmation in other independent populations. Fourth, it is likely that we did not capture all hospital readmissions, primarily those occurring outside of our hospital system. Therefore, we may have underestimated the actual rates of readmission for this cohort. Finally, we cannot be certain that all important predictors of hospital readmission were captured in this study.
The development of an accurate real‐time early warning system has the potential to identify patients at risk for various adverse outcomes including clinical deterioration, hospital death, and postdischarge readmission. By identifying patients at greatest risk for readmission, valuable healthcare resources can be better targeted to such populations. Our findings suggest that existing readmission predictors may suboptimally risk‐stratify patients, and it may be important to include additional clinical variables if pay for performance and other across‐institution comparisons are to be fair to institutions that care for more seriously ill patients. The variables identified as predictors of 30‐day hospital readmission in our study, with the exception of a CDA, are all readily identifiable clinical characteristics. The modest incremental value of a CDA to these clinical characteristics suggests that they would suffice for the identification of patients at high risk for hospital readmission. This is especially important for safety‐net institutions not routinely employing automated CDAs. These safety‐net hospitals provide a disproportionate level of care for patients who otherwise would have difficulty obtaining inpatient medical care and disproportionately carry the greatest burden of hospital readmissions.[15]
Disclosure
This study was funded in part by the Barnes‐Jewish Hospital Foundation and by grant number UL1 RR024992 from the National Center for Research Resources (NCRR), a component of the National Institutes of Health (NIH), and NIH Roadmap for Medical Research. Its contents are solely the responsibility of the authors and do not necessarily represent the official views of the NCRR or NIH.
- , , . Rapid‐response teams. N Engl J Med. 2011;365:139–146.
- , , , , , . Early prediction of septic shock in hospitalized patients. J Hosp Med. 2010;5:19–25.
- , , , et al. Implementation of a real‐time computerized sepsis alert in nonintensive care unit patients. Crit Care Med. 2011;39:469–473.
- , , , et al. Toward a two‐tier clinical warning system for hospitalized patients. AMIA Annu Symp Proc. 2011;2011:511–519.
- , , , et al. A trial of a real‐time alert for clinical deterioration in patients hospitalized on general medical wards. J Hosp Med. 2013;8:236–242.
- , , , et al. A randomized trial of real‐time automated clinical deterioration alerts sent to a rapid response team. J Hosp Med. 2014;9:424–429.
- , . Revisiting hospital readmissions JAMA. 2013;309:398–400.
- , , , . Adverse outcomes associated with delayed intensive care unit transfers in an integrated healthcare system. J Hosp Med. 2012;7:224–230.
- , , , , . Interventions to reduce 30‐day rehospitalization: a systematic review. Ann Intern Med. 2011; 155:520–528.
- , , , et al. International variation in and factors associated with hospital readmission after myocardial infarction. JAMA. 2012;307:66–74.
- , , , , . Predictors of early readmission among patients 40 to 64 years of age hospitalized for chronic obstructive pulmonary disease. Ann Am Thorac Soc. 2014;11:685–694.
- , , , , , . Assessing illness severity: does clinical judgement work? J Chronic Dis. 1986;39:439–452.
- , , , et al. An automated model to identify heart failure patients at risk for 30‐day readmission or death using electronic medical record data. Med Care. 2010;48:981–988.
- , , , et al. The readmission risk flag: using the electronic health record to automatically identify patients at risk for 30‐day readmission. J Hosp Med. 2013;8:689–695.
- , , . The Medicare hospital readmissions reduction program: time for reform. JAMA. 2015;314:347–348.
Rapid response systems (RRSs) have been developed to identify and treat deteriorating patients on general hospital units.[1] The most commonly proposed approach to the problem of identifying and stabilizing deteriorating hospitalized patients includes some combination of an early warning system to detect the deterioration and an RRS to deal with it. We previously demonstrated that a relatively simple hospital‐specific prediction model employing routine laboratory values and vital sign data is capable of predicting clinical deterioration, the need for intensive care unit (ICU) transfer, and hospital mortality in patients admitted to general medicine units.[2, 3, 4, 5, 6]
Hospital readmissions within 30 days of hospital discharge occur often and are difficult to predict. Starting in 2013, readmission penalties have been applied to specific conditions in the United States (acute myocardial infarction, heart failure, and pneumonia), with the expectation that additional conditions will be added to this group in years to come.[7, 8] Unfortunately, interventions developed to date have not been universally successful in preventing hospital readmissions for various medical conditions and patient types.[9] One potential explanation for this is the inability to reliably predict which patients are at risk for readmission to better target preventative interventions. Predictors of hospital readmission can be disease specific, such as the presence of multivessel disease in patients hospitalized with myocardial infarction,[10] or more general, such as lack of available medical follow‐up postdischarge.[11] Therefore, we performed a study to determine whether the occurrence of automated clinical deterioration alerts (CDAs) predicted 30‐day hospital readmission.
METHODS
Study Location
The study was conducted on 8 general medicine units of Barnes‐Jewish Hospital, a 1250‐bed academic medical center in St. Louis, Missouri (January 15, 2015December 12, 2015). Patient care on the inpatient medicine units is delivered by either attending hospitalist physicians or housestaff physicians under the supervision of an attending physician. The study was approved by the Washington University School of Medicine Human Studies Committee, and informed consent was waived.
Study Overview
We retrospectively evaluated all adult patients (aged >18 years) admitted through the emergency department or transferred directly to the general medicine units from other institutions. We excluded patients who died while hospitalized. All data were derived from the hospital informatics database provided by the Center for Clinical Excellence, BJC HealthCare.
Primary End Point
Readmission for any reason (ie, all‐cause readmission) to an acute care facility in the 30 days following discharge after the index hospitalization served as the primary end point. Barnes‐Jewish Hospital serves as the main teaching institution for BJC Healthcare, a large integrated healthcare system of both inpatient and outpatient care. The system includes a total of 12 hospitals and multiple community health locations in a compact geographic region surrounding and including St. Louis, Missouri, and we included readmission to any of these hospitals in our analysis. Persons treated within this healthcare system are, in nearly all cases, readmitted to 1 of the system's participating 12 hospitals. If a patient who receives healthcare in the system presents to a nonsystem hospital, he/she is often transferred back into the integrated system because of issues of insurance coverage. Patients with a 30‐day readmission were compared to those without a 30‐day readmission.
Variables
We recorded information regarding demographics, median income of the zip code of residence as a marker of socioeconomic status, admission to any BJC Healthcare facility within 6 months of the index admission, and comorbidities. To represent the global burden of comorbidities in each patient, we calculated their Charlson Comorbidity Index score.[12] Severity of illness was assessed using the All Patient RefinedDiagnosis Related Groups severity of illness score.
CDA Algorithm Overview
Details regarding the CDA model development and its implementation have been previously described in detail.[4, 5, 6] In brief, we applied logistic regression techniques to develop the CDA algorithm. Manually obtained vital signs, laboratory data, and pharmacy data inputted real time into the electronic medical record (EMR) were continuously assessed. The CDA algorithm searched for the 36 input variables (Table 1) as previously described from the EMR for all patients admitted to the 8 medicine units 24 hours per day and 7 days a week.[4, 5, 6] Values for every continuous parameter were scaled so that all measurements lay in the interval (0, 1) and were normalized by the minimum and maximum of the parameter. To capture the temporal effects in our data, we retain a sliding window of all the collected data points within the last 24 hours. We then subdivide these data into a series of n equally sized buckets (eg, 6 sequential buckets of 4 hours each). To capture variations within a bucket, we compute 3 values for each bucket: the minimum, maximum, and mean data points. Each of the resulting 3 n values are input to the logistic regression equation as separate variables.
| Age |
| Alanine aminotransferase |
| Alternative medicines |
| Anion gap |
| Anti‐infectives |
| Antineoplastics |
| Aspartate aminotransferase |
| Biologicals |
| Blood pressure, diastolic |
| Blood pressure, systolic |
| Calcium, serum |
| Calcium, serum, ionized |
| Cardiovascular agents |
| Central nervous system agents |
| Charlson Comorbidity Index |
| Coagulation modifiers |
| Estimated creatinine clearance |
| Gastrointestinal agents |
| Genitourinary tract agents |
| Hormones/hormone modifiers |
| Immunologic agents |
| Magnesium, serum |
| Metabolic agents |
| Miscellaneous agents |
| Nutritional products |
| Oxygen saturation, pulse oximetry |
| Phosphate, serum |
| Potassium, serum |
| Psychotherapeutic agents |
| Pulse |
| Radiologic agents |
| Respirations |
| Respiratory agents |
| Shock Index |
| Temperature |
| Topical agents |
The algorithm was first implemented in MATLAB (MathWorks, Natick, MA). For the purposes of training, we used a single 24‐hour window of data from each patient. The dataset's 36 input variables were divided into buckets and minimum/mean/maximum features wherever applicable, resulting in 398 variables. The first half of the original dataset was used to train the model. We then used the second half of the dataset as the validation dataset. We generated a predicted outcome for each case in the validation data, using the model parameter coefficients derived from the training data. We also employed bootstrap aggregation to improve classification accuracy and to address overfitting. We then applied various threshold cut points to convert these predictions into binary values and compared the results against the ICU transfer outcome. A threshold of 0.9760 for specificity was chosen to achieve a sensitivity of approximately 40%. These operating characteristics were chosen in turn to generate a manageable number of alerts per hospital nursing unit per day (estimated at 12 per nursing unit per day). At this cut point the C statistic was 0.8834, with an overall accuracy of 0.9292.[5] Patients with inputted data meeting the CDA threshold had a real‐time alert sent to the hospital rapid response team prompting a patient evaluation.
Statistical Analysis
The number of patients admitted to the 8 general medicine units of Barnes‐Jewish Hospital during the study period determined the sample size. Categorical variables were compared using 2 or Fisher exact test as appropriate. Continuous variables were compared using the Mann‐Whitney U test. All analyses were 2‐tailed, and a P value of <0.05 was assumed to represent statistical significance. We relied on logistic regression for identifying variables independently associated with 30‐day readmission. Based on univariate analysis, variables significant at P < 0.15 were entered into the model. To arrive at the most parsimonious model, we utilized a stepwise backward elimination approach. We evaluated collinearity with the variance inflation factor. We report adjusted odds ratios (ORs) and 95% confidence intervals (CIs) where appropriate. The model's goodness of fit was assessed via calculation of the Hosmer‐Lemeshow test. Receiver operating characteristic (ROC) curves were used to compare the predictive models for 30‐day readmission with or without the CDA variable. All statistical analyses were performed using SPSS (version 22.0; IBM, Armonk, NY).
RESULTS
The final cohort had 3015 patients with a mean age of 57.5 17.5 years and 47.8% males. The most common reasons for hospital admission were infection or sepsis syndrome including pneumonia and urinary tract infections (23.6%), congestive heart failure or other cardiac conditions (18.4%), respiratory distress including chronic obstructive pulmonary disease (16.2%), acute or chronic renal failure (9.7%), gastrointestinal disorders (8.4%), and diabetes mellitus management (7.4%). Overall, there were 567 (18.8%) patients who were readmitted within 30 days of their hospital discharge date.
Table 2 shows the characteristics of patients readmitted within 30 days and of patients not requiring hospital readmission within 30 days. Patients requiring hospital readmission within 30 days were younger and had significantly more comorbidities as manifested by significantly greater Charlson scores and individual comorbidities including coronary artery disease, congestive heart disease, peripheral vascular disease, connective tissue disease, cirrhosis, diabetes mellitus with end‐organ complications, renal failure, and metastatic cancer. Patients with a 30‐day readmission had significantly longer duration of hospitalization, more emergency department visits in the 6 months prior to the index hospitalization, lower minimum hemoglobin measurements, higher minimum serum creatinine values, and were more likely to have Medicare or Medicaid insurance compared to patients without a 30‐day readmission.
| Variable | 30‐Day Readmission | P Value | |
|---|---|---|---|
| Yes (n = 567) | No (n = 2,448) | ||
| |||
| Age, y | 56.1 17.0 | 57.8 17.6 | 0.046 |
| Gender | |||
| Male | 252 (44.4) | 1,188 (48.5) | 0.079 |
| Female | 315 (55.6) | 1,260 (51.5) | |
| Race | |||
| Caucasian | 277 (48.9) | 1,234 (50.4) | 0.800 |
| African American | 257 (45.3) | 1,076 (44.0) | |
| Other | 33 (5.8) | 138 (5.6) | |
| Median income, dollars | 30,149 [25,23436,453] | 29,271 [24,83037,026] | 0.903 |
| BMI | 29.4 10.0 | 29.0 9.2 | 0.393 |
| APR‐DRG Severity of Illness Score | 2.6 0.4 | 2.5 0.5 | 0.152 |
| Charlson Comorbidity Index | 6 [39] | 5 [27] | <0.001 |
| ICU transfer during admission | 93 (16.4) | 410 (16.7) | 0.842 |
| Myocardial infarction | 83 (14.6) | 256 (10.5) | 0.005 |
| Congestive heart failure | 177 (31.2) | 540 (22.1) | <0.001 |
| Peripheral vascular disease | 76 (13.4) | 214 (8.7) | 0.001 |
| Cardiovascular disease | 69 (12.2) | 224 (9.2) | 0.029 |
| Dementia | 15 (2.6) | 80 (3.3) | 0.445 |
| Chronic obstructive pulmonary disease | 220 (38.8) | 855 (34.9) | 0.083 |
| Connective tissue disease | 45 (7.9) | 118 (4.8) | 0.003 |
| Peptic ulcer disease | 26 (4.6) | 111 (4.5) | 0.958 |
| Cirrhosis | 60 (10.6) | 141 (5.8) | <0.001 |
| Diabetes mellitus without end‐organ complications | 148 (26.1) | 625 (25.5) | 0.779 |
| Diabetes mellitus with end‐organ complications | 92 (16.2) | 197 (8.0) | <0.001 |
| Paralysis | 25 (4.4) | 77 (3.1) | 0.134 |
| Renal failure | 214 (37.7) | 620 (25.3) | <0.001 |
| Underlying malignancy | 85 (15.0) | 314 (12.8) | 0.171 |
| Metastatic cancer | 64 (11.3) | 163 (6.7) | <0.001 |
| Human immunodeficiency virus | 10 (1.8) | 47 (1.9) | 0.806 |
| Minimum hemoglobin, g/dL | 9.1 [7.411.4] | 10.7 [8.712.4] | <0.001 |
| Minimum creatinine, mg/dL | 1.12 [0.792.35] | 1.03 [0.791.63] | 0.006 |
| Length of stay, d | 3.8 [1.97.8] | 3.3 [1.85.9] | <0.001 |
| ED visit in the past year | 1 [03] | 0 [01] | <0.001 |
| Clinical deterioration alert triggered | 269 (47.4) | 872 (35.6%) | <0.001 |
| Insurance | |||
| Private | 111 (19.6) | 528 (21.6) | 0.020 |
| Medicare | 299 (52.7) | 1,217 (49.7) | |
| Medicaid | 129 (22.8) | 499 (20.4) | |
| Patient pay | 28 (4.9) | 204 (8.3) | |
There were 1141 (34.4%) patients that triggered a CDA. Patients triggering a CDA were significantly more likely to have a 30‐day readmission compared to those who did not trigger a CDA (23.6% vs 15.9%; P < 0.001). Patients triggering a CDA were also significantly more likely to be readmitted within 60 days (31.7% vs 22.1%; P < 0.001) and 90 days (35.8% vs 26.2%; P < 0.001) compared to patients who did not trigger a CDA. Multiple logistic regression identified the triggering of a CDA to be independently associated with 30‐day readmission (OR: 1.40; 95% CI: 1.26‐1.55; P = 0.001) (Table 3). Other independent predictors of 30‐day readmission were: an emergency department visit in the previous 6 months, increasing age in 1‐year increments, presence of connective tissue disease, diabetes mellitus with end‐organ complications, chronic renal disease, cirrhosis, and metastatic cancer (Hosmer‐Lemeshow goodness of fit test, 0.363). Figure 1 reveals the ROC curves for the logistic regression model (Table 3) with and without the CDA variable. As the ROC curves document, the 2 models had similar sensitivity for the entire range of specificities. Reflecting this, the area under the ROC curve for the model inclusive of the CDA variable equaled 0.675 (95% CI: 0.649‐0.700), whereas the area under the ROC curve for the model excluding the CDA variable equaled 0.658 (95% CI: 0.632‐0.684).
| Variables | OR | 95% CI | P Value |
|---|---|---|---|
| |||
| Clinical deterioration alert | 1.40 | 1.261.55 | 0.001 |
| Age (1‐point increments) | 1.01 | 1.011.02 | 0.003 |
| Connective tissue disease | 1.63 | 1.341.98 | 0.012 |
| Cirrhosis | 1.25 | 1.171.33 | <0.001 |
| Diabetes mellitus with end‐organ complications | 1.23 | 1.131.33 | 0.010 |
| Chronic renal disease | 1.16 | 1.081.24 | 0.034 |
| Metastatic cancer | 1.12 | 1.081.17 | 0.002 |
| Emergency department visit in previous 6 months | 1.23 | 1.201.26 | <0.001 |
DISCUSSION
We demonstrated that the occurrence of an automated CDA is associated with increased risk for 30‐day hospital readmission. However, the addition of the CDA variable to the other variables identified to be independently associated with 30‐day readmission (Table 3) did not significantly add to the overall predictive accuracy of the derived logistic regression model. Other investigators have previously attempted to develop automated predictors of hospital readmission. Amarasingham et al. developed a real‐time electronic predictive model that identifies hospitalized heart failure patients at high risk for readmission or death from clinical and nonclinical risk factors present on admission.[13] Their electronic model demonstrated good discrimination for 30‐day mortality and readmission and performed as well, or better than, models developed by the Center for Medicaid and Medicare Services and the Acute Decompensated Heart Failure Registry. Similarly, Baillie et al. developed an automated prediction model that was effectively integrated into an existing EMR and identified patients on admission who were at risk for readmission within 30 days of discharge.[14] Our automated CDA differs from these previous risk predictors by surveying patients throughout their hospital stay as opposed to identifying risk for readmission at a single time point.
Several limitations of our study should be recognized. First, this was a noninterventional study aimed at examining the ability of CDAs to predict hospital readmission. Future studies are needed to assess whether the use of enhanced readmission prediction algorithms can be utilized to avert hospital readmissions. Second, the data derive from a single center, and this necessarily limits the generalizability of our findings. As such, our results may not reflect what one might see at other institutions. For example, Barnes‐Jewish Hospital has a regional referral pattern that includes community hospitals, regional long‐term acute care hospitals, nursing homes, and chronic wound, dialysis, and infusion clinics. This may explain, in part, the relatively high rate of hospital readmission observed in our cohort. Third, there is the possibility that CDAs were associated with readmission by chance given the number of potential predictor variables examined. The importance of CDAs as a determinant of rehospitalization requires confirmation in other independent populations. Fourth, it is likely that we did not capture all hospital readmissions, primarily those occurring outside of our hospital system. Therefore, we may have underestimated the actual rates of readmission for this cohort. Finally, we cannot be certain that all important predictors of hospital readmission were captured in this study.
The development of an accurate real‐time early warning system has the potential to identify patients at risk for various adverse outcomes including clinical deterioration, hospital death, and postdischarge readmission. By identifying patients at greatest risk for readmission, valuable healthcare resources can be better targeted to such populations. Our findings suggest that existing readmission predictors may suboptimally risk‐stratify patients, and it may be important to include additional clinical variables if pay for performance and other across‐institution comparisons are to be fair to institutions that care for more seriously ill patients. The variables identified as predictors of 30‐day hospital readmission in our study, with the exception of a CDA, are all readily identifiable clinical characteristics. The modest incremental value of a CDA to these clinical characteristics suggests that they would suffice for the identification of patients at high risk for hospital readmission. This is especially important for safety‐net institutions not routinely employing automated CDAs. These safety‐net hospitals provide a disproportionate level of care for patients who otherwise would have difficulty obtaining inpatient medical care and disproportionately carry the greatest burden of hospital readmissions.[15]
Disclosure
This study was funded in part by the Barnes‐Jewish Hospital Foundation and by grant number UL1 RR024992 from the National Center for Research Resources (NCRR), a component of the National Institutes of Health (NIH), and NIH Roadmap for Medical Research. Its contents are solely the responsibility of the authors and do not necessarily represent the official views of the NCRR or NIH.
- , , . Rapid‐response teams. N Engl J Med. 2011;365:139–146.
- , , , , , . Early prediction of septic shock in hospitalized patients. J Hosp Med. 2010;5:19–25.
- , , , et al. Implementation of a real‐time computerized sepsis alert in nonintensive care unit patients. Crit Care Med. 2011;39:469–473.
- , , , et al. Toward a two‐tier clinical warning system for hospitalized patients. AMIA Annu Symp Proc. 2011;2011:511–519.
- , , , et al. A trial of a real‐time alert for clinical deterioration in patients hospitalized on general medical wards. J Hosp Med. 2013;8:236–242.
- , , , et al. A randomized trial of real‐time automated clinical deterioration alerts sent to a rapid response team. J Hosp Med. 2014;9:424–429.
- , . Revisiting hospital readmissions JAMA. 2013;309:398–400.
- , , , . Adverse outcomes associated with delayed intensive care unit transfers in an integrated healthcare system. J Hosp Med. 2012;7:224–230.
- , , , , . Interventions to reduce 30‐day rehospitalization: a systematic review. Ann Intern Med. 2011; 155:520–528.
- , , , et al. International variation in and factors associated with hospital readmission after myocardial infarction. JAMA. 2012;307:66–74.
- , , , , . Predictors of early readmission among patients 40 to 64 years of age hospitalized for chronic obstructive pulmonary disease. Ann Am Thorac Soc. 2014;11:685–694.
- , , , , , . Assessing illness severity: does clinical judgement work? J Chronic Dis. 1986;39:439–452.
- , , , et al. An automated model to identify heart failure patients at risk for 30‐day readmission or death using electronic medical record data. Med Care. 2010;48:981–988.
- , , , et al. The readmission risk flag: using the electronic health record to automatically identify patients at risk for 30‐day readmission. J Hosp Med. 2013;8:689–695.
- , , . The Medicare hospital readmissions reduction program: time for reform. JAMA. 2015;314:347–348.
Clinical Deterioration Alerts
Patients deemed suitable for care on a general hospital unit are not expected to deteriorate; however, triage systems are not perfect, and some patients on general nursing units do develop critical illness during their hospitalization. Fortunately, there is mounting evidence that deteriorating patients exhibit measurable pathologic changes that could possibly be used to identify them prior to significant adverse outcomes, such as cardiac arrest.[1, 2, 3] Given the evidence that unplanned intensive care unit (ICU) transfers of patients on general units result in worse outcomes than more controlled ICU admissions,[1, 4, 5, 6] it is logical to assume that earlier identification of a deteriorating patient could provide a window of opportunity to prevent adverse outcomes.
The most commonly proposed systematic solution to the problem of identifying and stabilizing deteriorating patients on general hospital units includes some combination of an early warning system (EWS) to detect the deterioration and a rapid response team (RRT) to deal with it.[7, 8, 9, 10] We previously demonstrated that a relatively simple hospital‐specific method for generating EWS alerts derived from the electronic medical record (EMR) database is capable of predicting clinical deterioration and the need for ICU transfer, as well as hospital mortality, in non‐ICU patients admitted to general inpatient medicine units.[11, 12, 13, 14] However, our data also showed that simply providing the EWS alerts to these nursing units did not result in any demonstrable improvement in patient outcomes.[14] Therefore, we set out to determine whether linking real‐time EWS alerts to an intervention and notification of the RRT for patient evaluation could improve the outcomes of patients cared for on general inpatient units.
METHODS
Study Location
The study was conducted on 8 adult inpatient medicine units of Barnes‐Jewish Hospital, a 1250‐bed academic medical center in St. Louis, MO (January 15, 2013May 9, 2013). Patient care on the inpatient medicine units is delivered by either attending hospitalist physicians or dedicated housestaff physicians under the supervision of an attending physician. Continuous electronic vital sign monitoring is not provided on these units. The study was approved by the Washington University School of Medicine Human Studies Committee, and informed consent was waived. This was a nonblinded study (
Patients and Procedures
Patients admitted to the 8 medicine units received usual care during the study except as noted below. Manually obtained vital signs, laboratory data, and pharmacy data inputted in real time into the EMR were continuously assessed. The EWS searched for the 36 input variables previously described[11, 14] from the EMR for all patients admitted to the 8 medicine units 24 hours per day and 7 days a week. Values for every continuous parameter were scaled so that all measurements lay in the interval (0, 1) and were normalized by the minimum and maximum of the parameter as previously described.[14] To capture the temporal effects in our data, we retained a sliding window of all the collected data points within the last 24 hours. We then subdivided these data into a series of 6 sequential buckets of 4 hours each. We excluded the 2 hours of data prior to ICU transfer in building the model (so the data were 26 hours to 2 hours prior to ICU transfer for ICU transfer patients, and the first 24 hours of admission for everyone else). Eligible patients were selected for study entry when they triggered an alert for clinical deterioration as determined by the EWS.[11, 14]
The EWS alert was implemented in an internally developed, Java‐based clinical decision support rules engine, which identified when new data relevant to the model were available in a real‐time central data repository. In a clinical application, it is important to capture unusual changes in vital‐sign data over time. Such changes may precede clinical deterioration by hours, providing a chance to intervene if detected early enough. In addition, not all readings in time‐series data should be treated equally; the value of some kinds of data may change depending on their age. For example, a patient's condition may be better reflected by a blood‐oxygenation reading collected 1 hour ago than a reading collected 12 hours ago. This is the rationale for our use of a sliding window of all collected data points within the last 24 hours performed on a real‐time basis to determine the alert status of the patient.[11, 14]
We applied various threshold cut points to convert the EWS alert predictions into binary values and compared the results against the actual ICU transfer outcome.[14] A threshold of 0.9760 for specificity was chosen to achieve a sensitivity of approximately 40%. These operating characteristics were chosen in turn to generate a manageable number of alerts per hospital nursing unit per day (estimated at 12 per nursing unit per day). At this cut point, the C statistic was 0.8834, with an overall accuracy of 0.9292. In other words, our EWS alert system is calibrated so that for every 1000 patient discharges per year from these 8 hospital units, there would be 75 patients generating an alert, of which 30 patients would be expected to have the study outcome (ie, clinical deterioration requiring ICU transfer).
Once patients on the study units were identified as at risk for clinical deterioration by the EWS, they were assigned by a computerized random number generator to the intervention group or the control group. The control group was managed according to the usual care provided on the medicine units. The EWS alerts generated for the control patients were electronically stored, but these alerts were not sent to the RRT nurse, instead they were hidden from all clinical staff. The intervention group had their EWS alerts sent real time to the nursing member of the hospital's RRT. The RRT is composed of a registered nurse, a second‐ or third‐year internal medicine resident, and a respiratory therapist. The RRT was introduced in 2009 for the study units involved in this investigation. For 2009, 2010, and 2011 the RRT nurse was pulled from the staff of 1 of the hospital's ICUs in a rotating manner to respond to calls to the RRT as they occurred. Starting in 2012, the RRT nurse was established as a dedicated position without other clinical responsibilities. The RRT nurse carries a hospital‐issued mobile phone, to which the automated alert messages were sent real time, and was instructed to respond to all EWS alerts within 20 minutes of their receipt.
The RRT nurse would initially evaluate the alerted intervention patients using the Modified Early Warning Score[15, 16] and make further clinical and triage decisions based on those criteria and discussions with the RRT physician or the patient's treating physicians. The RRT focused their interventions using an internally developed tool called the Four Ds (discuss goals of care, drugs needing to be administered, diagnostics needing to be performed, and damage control with the use of oxygen, intravenous fluids, ventilation, and blood products). Patients evaluated by the RRT could have their current level of care maintained, have the frequency of vital sign monitoring increased, be transferred to an ICU, or have a code blue called for emergent resuscitation. The RRT reviewed goals of care for all patients to determine the appropriateness of interventions, especially for patients near the end of life who did not desire intensive care interventions. Nursing staff on the hospital units could also make calls to the RRT for patient evaluation at any time based on their clinical assessments performed during routine nursing rounds.
The primary efficacy outcome was the need for ICU transfer. Secondary outcome measures were hospital mortality and hospital length of stay. Pertinent demographic, laboratory, and clinical data were gathered prospectively including age, gender, race, underlying comorbidities, and severity of illness assessed by the Charlson comorbidity score and Elixhauser comorbidities.[17, 18]
Statistical Analysis
We required a sample size of 514 patients (257 per group) to achieve 80% power at a 5% significance level, based on the superiority design, a baseline event rate for ICU transfer of 20.0%, and an absolute reduction of 8.0% (PS Power and Sample Size Calculations, version 3.0, Vanderbilt Biostatistics, Nashville, TN). Continuous variables were reported as means with standard deviations or medians with 25th and 75th percentiles according to their distribution. The Student t test was used when comparing normally distributed data, and the Mann‐Whitney U test was employed to analyze non‐normally distributed data (eg, hospital length of stay). Categorical data were expressed as frequency distributions, and the [2] test was used to determine if differences existed between groups. A P value <0.05 was regarded as statistically significant. An interim analysis was planned for the data safety monitoring board to evaluate patient safety after 50% of the patients were recruited. The primary analysis was by intention to treat. Analyses were performed using SPSS version 11.0 for Windows (SPSS, Inc., Chicago, IL).
Data Safety Monitoring Board
An independent data safety and monitoring board was convened to monitor the study and to review and approve protocol amendments by the steering committee.
RESULTS
Between January 15, 2013 and May 9, 2013, there were 4731 consecutive patients admitted to the 8 inpatient units and electronically screened as the base population for this investigation. Five hundred seventy‐one (12.1%) patients triggered an alert and were enrolled into the study (Figure 1). There were 286 patients assigned to the intervention group and 285 assigned to the control group. No patients were lost to follow‐up. Demographics, reason for hospital admission, and comorbidities of the 2 groups were similar (Table 1). The number of patients having a separate RRT call by the primary nursing team on the hospital units within 24 hours of generating an alert was greater for the intervention group but did not reach statistical significance (19.9% vs 16.5%; odds ratio: 1.260; 95% confidence interval [CI]: 0.8231.931). Table 2 provides the new diagnostic and therapeutic interventions initiated within 24 hours after a EWS alert was generated. Patients in the intervention group were significantly more likely to have their primary care team physician notified by an RRT nurse regarding medical condition issues and to have oximetry and telemetry started, whereas control patients were significantly more likely to have new antibiotic orders written within 24 hours of generating an alert.

| Variable | Intervention Group, n=286 | Control Group, n=285 | P Value |
|---|---|---|---|
| Age, y | 63.7 16.0 | 63.1 15.4 | 0.495 |
| Gender, n (%) | |||
| Male | 132 (46.2) | 140 (49.1) | 0.503 |
| Female | 154 (53.8) | 145 (50.9) | |
| Race, n (%) | |||
| Caucasian | 155 (54.2) | 154 (54.0) | 0.417 |
| African American | 105 (36.7) | 113 (39.6) | |
| Other | 26 (9.1) | 18 (6.3) | |
| Reason for hospital admission | |||
| Cardiac | 12 (4.2) | 15 (5.3) | 0.548 |
| Pulmonary | 64 (22.4) | 72 (25.3) | 0.418 |
| Underlying malignancy | 6 (2.1) | 3 (1.1) | 0.504 |
| Renal disease | 31 (10.8) | 22 (7.7) | 0.248 |
| Thromboembolism | 4 (1.4) | 5 (1.8) | 0.752 |
| Infection | 55 (19.2) | 50 (17.5) | 0.603 |
| Neurologic disease | 33 (11.5) | 22 (7.7) | 0.122 |
| Intra‐abdominal disease | 41 (14.3) | 47 (16.5) | 0.476 |
| Hematologic condition | 4 (1.4) | 5 (1.8) | 0.752 |
| Endocrine disorder | 12 (4.2) | 6 (2.1) | 0.153 |
| Source of hospital admission | |||
| Emergency department | 201 (70.3) | 203 (71.2) | 0.200 |
| Direct admission | 36 (12.6) | 46 (16.1) | |
| Hospital transfer | 49 (17.1) | 36 (12.6) | |
| Charlson score | 6.7 3.6 | 6.6 3.2 | 0.879 |
| Elixhauser comorbidities score | 7.4 3.5 | 7.5 3.4 | 0.839 |
| Variable | Intervention Group, n=286 | Control Group, n=285 | P Value |
|---|---|---|---|
| |||
| Medications, n (%) | |||
| Antibiotics | 92 (32.2) | 121 (42.5) | 0.011 |
| Antiarrhythmics | 48 (16.8) | 44 (15.4) | 0.662 |
| Anticoagulants | 83 (29.0) | 97 (34.0) | 0.197 |
| Diuretics/antihypertensives | 71 (24.8) | 55 (19.3) | 0.111 |
| Bronchodilators | 78 (27.3) | 73 (25.6) | 0.653 |
| Anticonvulsives | 26 (9.1) | 27 (9.5) | 0.875 |
| Sedatives/narcotics | 0 (0.0) | 1 (0.4) | 0.499 |
| Respiratory support, n (%) | |||
| Noninvasive ventilation | 17 (6.0) | 9 (3.1) | 0.106 |
| Escalated oxygen support | 12 (4.2) | 7 (2.5) | 0.247 |
| Enhanced vital signs, n (%) | 50 (17.5) | 47 (16.5) | 0.752 |
| Maintenance intravenous fluids, n (%) | 48 (16.8) | 41 (14.4) | 0.430 |
| Vasopressors, n (%) | 57 (19.9) | 61 (21.4) | 0.664 |
| Bolus intravenous fluids, n (%) | 7 (2.4) | 14 (4.9) | 0.118 |
| Telemetry, n (%) | 198 (69.2) | 176 (61.8) | 0.052 |
| Oximetry, n (%) | 20 (7.0) | 6 (2.1) | 0.005 |
| New intravenous access, n (%) | 26 (9.1) | 35 (12.3) | 0.217 |
| Primary care team physician called by RRT nurse, n (%) | 82 (28.7) | 56 (19.6) | 0.012 |
Fifty‐one patients (17.8%) randomly assigned to the intervention group required ICU transfer compared with 52 of 285 patients (18.2%) in the control group (odds ratio: 0.972; 95% CI: 0.6351.490; P=0.898) (Table 3). Twenty‐one patients (7.3%) randomly assigned to the intervention group expired during their hospitalization compared with 22 of 285 patients (7.7%) in the control group (odds ratio: 0.947; 95%CI: 0.5091.764; P=0.865). Hospital length of stay was 8.49.5 days (median, 4.5 days; interquartile range, 2.311.4 days) for patients randomized to the intervention group and 9.411.1 days (median, 5.3 days; interquartile range, 3.211.2 days) for patients randomized to the control group (P=0.038). The ICU length of stay was 4.86.6 days (median, 2.9 days; interquartile range, 1.76.5 days) for patients randomized to the intervention group and 5.86.4 days (median, 2.9 days; interquartile range, 1.57.4) for patients randomized to the control group (P=0.812).The number of patients requiring transfer to a nursing home or long‐term acute care hospital was similar for patients in the intervention and control groups (26.9% vs 26.3%; odds ratio: 1.032; 95% CI: 0.7121.495; P=0.870). Similarly, the number of patients requiring hospital readmission before 30 days and 180 days, respectively, was similar for the 2 treatment groups (Table 3). For the combined study population, the EWS alerts were triggered 94138 hours (median, 27 hours; interquartile range, 7132 hours) prior to ICU transfer and 250204 hours (median200 hours; interquartile range, 54347 hours) prior to hospital mortality. The number of RRT calls for the 8 medicine units studied progressively increased from the start of the RRT program in 2009 through 2013 (121 in 2009, 194 in 2010, 298 in 2011, 415 in 2012, 415 in 2013; P<0.001 for the trend).
| Outcome | Intervention Group, n=286 | Control Group, n=285 | P Value |
|---|---|---|---|
| |||
| ICU transfer, n (%) | 51 (17.8) | 52 (18.2) | 0.898 |
| All‐cause hospital mortality, n (%) | 21 (7.3) | 22 (7.7) | 0.865 |
| Transfer to nursing home or LTAC, n (%) | 77 (26.9) | 75 (26.3) | 0.870 |
| 30‐day readmission, n (%) | 53 (18.5) | 62 (21.8) | 0.337 |
| 180‐day readmission, n (%) | 124 (43.4) | 117 (41.1) | 0.577 |
| Hospital length of stay, d* | 8.49.5, 4.5 [2.311.4] | 9.411.1, 5.3 [3.211.2] | 0.038 |
| ICU length of stay, d* | 4.86.6, 2.9 [1.76.5] | 5.86.4, 2.9 [1.57.4] | 0.812 |
DISCUSSION
We demonstrated that a real‐time EWS alert sent to a RRT nurse was associated with a modest reduction in hospital length of stay, but similar rates of hospital mortality, ICU transfer, and subsequent need for placement in a long‐term care setting compared with usual care. We also found the number of RRT calls to have increased progressively from 2009 to the present on the study units examined.
Unplanned ICU transfers occurring as early as within 8 hours of hospitalization are relatively common and associated with increased mortality.[6] Bapoje et al. evaluated a total of 152 patients over 1 year who had unplanned ICU transfers.[19] The most common reason was worsening of the problem for which the patient was admitted (48%). Other investigators have also attempted to identify predictors for clinical deterioration resulting in unplanned ICU transfer that could be employed in an EWS.[20, 21] Organizations like the Institute for Healthcare Improvement have called for the development and routine implementation of EWSs to direct the activities of RRTs and improve outcomes.[22] However, a recent systematic review found that much of the evidence in support of EWSs and emergency response teams is of poor quality and lacking prospective randomized trials.[23]
Our earlier experience demonstrated that simply providing an alert to nursing units did not result in any demonstrable improvements in the outcomes of high‐risk patients identified by our EWS.[14] Previous investigations have also had difficulty in demonstrating consistent outcome improvements with the use of EWSs and RRTs.[24, 25, 26, 27, 28, 29, 30, 31, 32] As a result of mandates from quality improvement organizations, most US hospitals currently employ RRTs for emergent mobilization of resources when a clinically deteriorating patient is identified on a hospital ward.[33, 34] Linking RRT actions with a validated real‐time alert may represent a way of improving the overall effectiveness of such teams for monitoring general hospital units, short of having all hospitalized patients in units staffed and monitored to provide higher levels of supervision (eg, ICUs, step‐down units).[9, 35]
An alternative approach to preventing patient deterioration is to provide closer overall monitoring. This has been accomplished by employing nursing personnel to increase monitoring, or with the use of automated monitoring equipment. Bellomo et al. showed that the deployment of electronic automated vital sign monitors on general hospital units was associated with improved utilization of RRTs, increased patient survival, and decreased time for vital sign measurement and recording.[36] Laurens and Dwyer found that implementation of medical emergency teams (METs) to respond to predefined MET activation criteria as observed by hospital staff resulted in reduced hospital mortality and reduced need for ICU transfer.[37] However, other investigators have observed that imperfect implementation of nursing‐performed observational monitoring resulted in no demonstrable benefit, illustrating the limitations of this approach.[38] Our findings suggest that nursing care of patients on general hospital units may be enhanced with the use of an EWS alert sent to the RRT. This is supported by the observation that communications between the RRT and the primary care teams was greater as was the use of telemetry and oximetry in the intervention arm. Moreover, there appears to have been a learning effect for the nursing staff that occurred on our study units, as evidenced by the increased number of RRT calls that occurred between 2009 and 2013. This change in nursing practices on these units certainly made it more difficult for us to observe outcome differences in our current study with the prescribed intervention, reinforcing the notion that evaluating an already established practice is a difficult proposition.[39]
Our study has several important limitations. First, the EWS alert was developed and validated at Barnes‐Jewish Hospital.[11, 12, 13, 14] We cannot say whether this alert will perform similarly in another hospital. Second, the EWS alert only contains data from medical patients. Development and validation of EWS alerts for other hospitalized populations, including surgical and pediatric patients, are needed to make such systems more generalizable. Third, the primary clinical outcome employed for this trial was problematic. Transfer to an ICU may not be an optimal outcome variable, as it may be desirable to transfer alerted patients to an ICU, which can be perceived to represent a soft landing for such patients once an alert has been generated. A better measure could be 30‐day all‐cause mortality, which would not be subject to clinician biases. Finally, we could not specifically identify explanations for the greater use of antibiotics in the control group despite similar rates of infection for both study arms. Future studies should closely evaluate the ability of EWS alerts to alter specific therapies (eg, reduce antibiotic utilization).
In summary, we have demonstrated that an EWS alert linked to a RRT likely contributed to a modest reduction in hospital length of stay, but no reductions in hospital mortality and ICU transfer. These findings suggest that inpatient deterioration on general hospital units can be identified and linked to a specific intervention. Continued efforts are needed to identify and implement systems that will not only accurately identify high‐risk patients on general hospital units but also intervene to improve their outcomes. We are moving forward with the development of a 2‐tiered EWS utilizing both EMR data and real‐time streamed vital sign data, to determine if we can further improve the prediction of clinical deterioration and potentially intervene in a more clinically meaningful manner.
Acknowledgements
The authors thank Ann Doyle, BSN, Lisa Mayfield, BSN, and Darain Mitchell for their assistance in carrying out this research protocol; and William Shannon, PhD, from the Division of General Medical Sciences at Washington University, for statistical support.
Disclosures: This study was funded in part by the Barnes‐Jewish Hospital Foundation, the Chest Foundation of the American College of Chest Physicians, and by grant number UL1 RR024992 from the National Center for Research Resources (NCRR), a component of the National Institutes of Health (NIH), and NIH Roadmap for Medical Research. Its contents are solely the responsibility of the authors and do not necessarily represent the official view of the NCRR or NIH. The steering committee was responsible for the study design, execution, analysis, and content of the article. The Barnes‐Jewish Hospital Foundation, the American College of Chest Physicians, and the Chest Foundation were not involved in the design, conduct, or analysis of the trial. The authors report no conflicts of interest. Marin Kollef, Yixin Chen, Kevin Heard, Gina LaRossa, Chenyang Lu, Nathan Martin, Nelda Martin, Scott Micek, and Thomas Bailey have all made substantial contributions to conception and design, or acquisition of data, or analysis and interpretation of data; have drafted the submitted article or revised it critically for important intellectual content; have provided final approval of the version to be published; and have agreed to be accountable for all aspects of the work in ensuring that questions related to the accuracy or integrity of any part of the work are appropriately investigated and resolved.
- , , , et al. Duration of life‐threatening antecedents prior to intensive care admission. Intensive Care Med. 2002;28(11):1629–1634.
- , , , et al. A comparison of antecedents to cardiac arrests, deaths and emergency intensive care admissions in Australia and New Zealand, and the United Kingdom—the ACADEMIA study. Resuscitation. 2004;62(3):275–282.
- , , . Abnormal vital signs are associated with an increased risk for critical events in US veteran inpatients. Resuscitation. 2009;80(11):1264–1269.
- , , , et al. Septic shock: an analysis of outcomes for patients with onset on hospital wards versus intensive care units. Crit Care Med. 1998;26(6):1020–1024.
- , , , , . Inpatient transfers to the intensive care unit: delays are associated with increased mortality and morbidity. J Gen Intern Med. 2003;18(2):77–83.
- , , , . Adverse outcomes associated with delayed intensive care unit transfers in an integrated healthcare system. J Hosp Med. 2012;7(3):224–230.
- , , , et al. Findings of the first consensus conference on medical emergency teams. Crit Care Med. 2006;34(9):2463–2478.
- , , , et al. “Identifying the hospitalised patient in crisis”—a consensus conference on the afferent limb of rapid response systems. Resuscitation. 2010;81(4):375–382.
- , , . Rapid‐response teams. N Engl J Med. 2011;365(2):139–146.
- , , , , . Acute care teams: a systematic review and meta‐analysis. Arch Intern Med. 2010;170(1):18–26.
- , , , et al. Toward a two‐tier clinical warning system for hospitalized patients. AMIA Annu Symp Proc. 2011;2011:511–519.
- , , , , , . Early prediction of septic shock in hospitalized patients. J Hosp Med. 2010;5(1):19–25.
- , , , et al. Implementation of a real‐time computerized sepsis alert in nonintensive care unit patients. Crit Care Med. 2011;39(3):469–473.
- , , , et al. A trial of a real‐time Alert for clinical deterioration in Patients hospitalized on general medical wards. J Hosp Med. 2013;8(5):236–242.
- , , , , . Prospective evaluation of a modified Early Warning Score to aid earlier detection of patients developing critical illness on a general surgical ward. Br J Anaesth. 2000;84:663P.
- , , , . Validation of a modified Early Warning Score in medical admissions. QJM. 2001;94(10):521–526.
- , , . Adapting a clinical comorbidity index for use with ICD‐9‐CM administrative databases. J Clin Epidemiol. 1992;45(6):613–619.
- , , , . Comorbidity measures for use with administrative data. Med Care. 1998;36(1):8–27.
- , , , . Unplanned transfers to a medical intensive care unit: causes and relationship to preventable errors in care. J Hosp Med. 2011;6(2):68–72.
- , , , , , . Unplanned transfers to the intensive care unit: the role of the shock index. J Hosp Med. 2010;5(8):460–465.
- , , , , , . Early detection of impending physiologic deterioration among patients who are not in intensive care: development of predictive models using data from an automated electronic medical record. J Hosp Med. 2012;7(5):388–395.
- Institute for Healthcare Improvement. Early warning systems: the next level of rapid response; 2011. Available at: http://www.ihi.org/Engage/Memberships/MentorHospitalRegistry/Pages/RapidResponseSystems.aspx. Accessed April 6, 2011.
- , . Do either early warning systems or emergency response teams improve hospital patient survival? A systematic review. Resuscitation. 2013;84(12):1652–1667.
- , , , et al. Introducing critical care outreach: a ward‐randomised trial of phased introduction in a general hospital. Intensive Care Med. 2004;30(7):1398–1404.
- . Out of our reach? Assessing the impact of introducing critical care outreach service. Anaesthesiology. 2003;58(9):882–885.
- , , . Effect of the critical care outreach team on patient survival to discharge from hospital and readmission to critical care: non‐randomised population based study. BMJ. 2003;327(7422):1014.
- , , . Reducing mortality and avoiding preventable ICU utilization: analysis of a successful rapid response program using APR DRGs. J Healthc Qual. 2011;33(5):7–16.
- , , , et al. Introduction of the medical emergency team (MET) system: a cluster‐randomised control trial. Lancet. 2005;365(9477):2091–2097.
- , , , , , . The impact of the introduction of critical care outreach services in England: a multicentre interrupted time‐series analysis. Crit Care. 2007;11(5):R113.
- , , , et al. Systematic review and evaluation of physiological track and trigger warning systems for identifying at‐risk patients on the ward. Intensive Care Med. 2007;33(4):667–679.
- , , , . Timing and teamwork—an observational pilot study of patients referred to a Rapid Response Team with the aim of identifying factors amenable to re‐design of a Rapid Response System. Resuscitation. 2012;83(6):782–787.
- , , , , , . The impact of rapid response team on outcome of patients transferred from the ward to the ICU: a single‐center study. Crit Care Med. 2013;41(10):2284–2291.
- , , , . Rapid response: a quality improvement conundrum. J Hosp Med. 2009;4(4):255–257.
- . Rapid response systems now established at 2,900 hospitals. Hospitalist News. 2010;3:1.
- , , . Early warning systems. Hosp Chron. 2012;7:37–43.
- , , , et al. A controlled trial of electronic automated advisory vital signs monitoring in general hospital wards. Crit Care Med. 2012;40(8):2349–2361.
- , . The impact of medical emergency teams on ICU admission rates, cardiopulmonary arrests and mortality in a regional hospital. Resuscitation. 2011;82(6):707–712.
- , , . Imperfect implementation of an early warning scoring system in a danish teaching hospital: a cross‐sectional study. PLoS One. 2013;8:e70068.
- , . Introduction of medical emergency teams in Australia and New Zealand: A multicentre study. Crit Care. 2008;12(3):151.
Patients deemed suitable for care on a general hospital unit are not expected to deteriorate; however, triage systems are not perfect, and some patients on general nursing units do develop critical illness during their hospitalization. Fortunately, there is mounting evidence that deteriorating patients exhibit measurable pathologic changes that could possibly be used to identify them prior to significant adverse outcomes, such as cardiac arrest.[1, 2, 3] Given the evidence that unplanned intensive care unit (ICU) transfers of patients on general units result in worse outcomes than more controlled ICU admissions,[1, 4, 5, 6] it is logical to assume that earlier identification of a deteriorating patient could provide a window of opportunity to prevent adverse outcomes.
The most commonly proposed systematic solution to the problem of identifying and stabilizing deteriorating patients on general hospital units includes some combination of an early warning system (EWS) to detect the deterioration and a rapid response team (RRT) to deal with it.[7, 8, 9, 10] We previously demonstrated that a relatively simple hospital‐specific method for generating EWS alerts derived from the electronic medical record (EMR) database is capable of predicting clinical deterioration and the need for ICU transfer, as well as hospital mortality, in non‐ICU patients admitted to general inpatient medicine units.[11, 12, 13, 14] However, our data also showed that simply providing the EWS alerts to these nursing units did not result in any demonstrable improvement in patient outcomes.[14] Therefore, we set out to determine whether linking real‐time EWS alerts to an intervention and notification of the RRT for patient evaluation could improve the outcomes of patients cared for on general inpatient units.
METHODS
Study Location
The study was conducted on 8 adult inpatient medicine units of Barnes‐Jewish Hospital, a 1250‐bed academic medical center in St. Louis, MO (January 15, 2013May 9, 2013). Patient care on the inpatient medicine units is delivered by either attending hospitalist physicians or dedicated housestaff physicians under the supervision of an attending physician. Continuous electronic vital sign monitoring is not provided on these units. The study was approved by the Washington University School of Medicine Human Studies Committee, and informed consent was waived. This was a nonblinded study (
Patients and Procedures
Patients admitted to the 8 medicine units received usual care during the study except as noted below. Manually obtained vital signs, laboratory data, and pharmacy data inputted in real time into the EMR were continuously assessed. The EWS searched for the 36 input variables previously described[11, 14] from the EMR for all patients admitted to the 8 medicine units 24 hours per day and 7 days a week. Values for every continuous parameter were scaled so that all measurements lay in the interval (0, 1) and were normalized by the minimum and maximum of the parameter as previously described.[14] To capture the temporal effects in our data, we retained a sliding window of all the collected data points within the last 24 hours. We then subdivided these data into a series of 6 sequential buckets of 4 hours each. We excluded the 2 hours of data prior to ICU transfer in building the model (so the data were 26 hours to 2 hours prior to ICU transfer for ICU transfer patients, and the first 24 hours of admission for everyone else). Eligible patients were selected for study entry when they triggered an alert for clinical deterioration as determined by the EWS.[11, 14]
The EWS alert was implemented in an internally developed, Java‐based clinical decision support rules engine, which identified when new data relevant to the model were available in a real‐time central data repository. In a clinical application, it is important to capture unusual changes in vital‐sign data over time. Such changes may precede clinical deterioration by hours, providing a chance to intervene if detected early enough. In addition, not all readings in time‐series data should be treated equally; the value of some kinds of data may change depending on their age. For example, a patient's condition may be better reflected by a blood‐oxygenation reading collected 1 hour ago than a reading collected 12 hours ago. This is the rationale for our use of a sliding window of all collected data points within the last 24 hours performed on a real‐time basis to determine the alert status of the patient.[11, 14]
We applied various threshold cut points to convert the EWS alert predictions into binary values and compared the results against the actual ICU transfer outcome.[14] A threshold of 0.9760 for specificity was chosen to achieve a sensitivity of approximately 40%. These operating characteristics were chosen in turn to generate a manageable number of alerts per hospital nursing unit per day (estimated at 12 per nursing unit per day). At this cut point, the C statistic was 0.8834, with an overall accuracy of 0.9292. In other words, our EWS alert system is calibrated so that for every 1000 patient discharges per year from these 8 hospital units, there would be 75 patients generating an alert, of which 30 patients would be expected to have the study outcome (ie, clinical deterioration requiring ICU transfer).
Once patients on the study units were identified as at risk for clinical deterioration by the EWS, they were assigned by a computerized random number generator to the intervention group or the control group. The control group was managed according to the usual care provided on the medicine units. The EWS alerts generated for the control patients were electronically stored, but these alerts were not sent to the RRT nurse, instead they were hidden from all clinical staff. The intervention group had their EWS alerts sent real time to the nursing member of the hospital's RRT. The RRT is composed of a registered nurse, a second‐ or third‐year internal medicine resident, and a respiratory therapist. The RRT was introduced in 2009 for the study units involved in this investigation. For 2009, 2010, and 2011 the RRT nurse was pulled from the staff of 1 of the hospital's ICUs in a rotating manner to respond to calls to the RRT as they occurred. Starting in 2012, the RRT nurse was established as a dedicated position without other clinical responsibilities. The RRT nurse carries a hospital‐issued mobile phone, to which the automated alert messages were sent real time, and was instructed to respond to all EWS alerts within 20 minutes of their receipt.
The RRT nurse would initially evaluate the alerted intervention patients using the Modified Early Warning Score[15, 16] and make further clinical and triage decisions based on those criteria and discussions with the RRT physician or the patient's treating physicians. The RRT focused their interventions using an internally developed tool called the Four Ds (discuss goals of care, drugs needing to be administered, diagnostics needing to be performed, and damage control with the use of oxygen, intravenous fluids, ventilation, and blood products). Patients evaluated by the RRT could have their current level of care maintained, have the frequency of vital sign monitoring increased, be transferred to an ICU, or have a code blue called for emergent resuscitation. The RRT reviewed goals of care for all patients to determine the appropriateness of interventions, especially for patients near the end of life who did not desire intensive care interventions. Nursing staff on the hospital units could also make calls to the RRT for patient evaluation at any time based on their clinical assessments performed during routine nursing rounds.
The primary efficacy outcome was the need for ICU transfer. Secondary outcome measures were hospital mortality and hospital length of stay. Pertinent demographic, laboratory, and clinical data were gathered prospectively including age, gender, race, underlying comorbidities, and severity of illness assessed by the Charlson comorbidity score and Elixhauser comorbidities.[17, 18]
Statistical Analysis
We required a sample size of 514 patients (257 per group) to achieve 80% power at a 5% significance level, based on the superiority design, a baseline event rate for ICU transfer of 20.0%, and an absolute reduction of 8.0% (PS Power and Sample Size Calculations, version 3.0, Vanderbilt Biostatistics, Nashville, TN). Continuous variables were reported as means with standard deviations or medians with 25th and 75th percentiles according to their distribution. The Student t test was used when comparing normally distributed data, and the Mann‐Whitney U test was employed to analyze non‐normally distributed data (eg, hospital length of stay). Categorical data were expressed as frequency distributions, and the [2] test was used to determine if differences existed between groups. A P value <0.05 was regarded as statistically significant. An interim analysis was planned for the data safety monitoring board to evaluate patient safety after 50% of the patients were recruited. The primary analysis was by intention to treat. Analyses were performed using SPSS version 11.0 for Windows (SPSS, Inc., Chicago, IL).
Data Safety Monitoring Board
An independent data safety and monitoring board was convened to monitor the study and to review and approve protocol amendments by the steering committee.
RESULTS
Between January 15, 2013 and May 9, 2013, there were 4731 consecutive patients admitted to the 8 inpatient units and electronically screened as the base population for this investigation. Five hundred seventy‐one (12.1%) patients triggered an alert and were enrolled into the study (Figure 1). There were 286 patients assigned to the intervention group and 285 assigned to the control group. No patients were lost to follow‐up. Demographics, reason for hospital admission, and comorbidities of the 2 groups were similar (Table 1). The number of patients having a separate RRT call by the primary nursing team on the hospital units within 24 hours of generating an alert was greater for the intervention group but did not reach statistical significance (19.9% vs 16.5%; odds ratio: 1.260; 95% confidence interval [CI]: 0.8231.931). Table 2 provides the new diagnostic and therapeutic interventions initiated within 24 hours after a EWS alert was generated. Patients in the intervention group were significantly more likely to have their primary care team physician notified by an RRT nurse regarding medical condition issues and to have oximetry and telemetry started, whereas control patients were significantly more likely to have new antibiotic orders written within 24 hours of generating an alert.
| Variable | Intervention Group, n=286 | Control Group, n=285 | P Value |
|---|---|---|---|
| Age, y | 63.7 16.0 | 63.1 15.4 | 0.495 |
| Gender, n (%) | |||
| Male | 132 (46.2) | 140 (49.1) | 0.503 |
| Female | 154 (53.8) | 145 (50.9) | |
| Race, n (%) | |||
| Caucasian | 155 (54.2) | 154 (54.0) | 0.417 |
| African American | 105 (36.7) | 113 (39.6) | |
| Other | 26 (9.1) | 18 (6.3) | |
| Reason for hospital admission | |||
| Cardiac | 12 (4.2) | 15 (5.3) | 0.548 |
| Pulmonary | 64 (22.4) | 72 (25.3) | 0.418 |
| Underlying malignancy | 6 (2.1) | 3 (1.1) | 0.504 |
| Renal disease | 31 (10.8) | 22 (7.7) | 0.248 |
| Thromboembolism | 4 (1.4) | 5 (1.8) | 0.752 |
| Infection | 55 (19.2) | 50 (17.5) | 0.603 |
| Neurologic disease | 33 (11.5) | 22 (7.7) | 0.122 |
| Intra‐abdominal disease | 41 (14.3) | 47 (16.5) | 0.476 |
| Hematologic condition | 4 (1.4) | 5 (1.8) | 0.752 |
| Endocrine disorder | 12 (4.2) | 6 (2.1) | 0.153 |
| Source of hospital admission | |||
| Emergency department | 201 (70.3) | 203 (71.2) | 0.200 |
| Direct admission | 36 (12.6) | 46 (16.1) | |
| Hospital transfer | 49 (17.1) | 36 (12.6) | |
| Charlson score | 6.7 3.6 | 6.6 3.2 | 0.879 |
| Elixhauser comorbidities score | 7.4 3.5 | 7.5 3.4 | 0.839 |
| Variable | Intervention Group, n=286 | Control Group, n=285 | P Value |
|---|---|---|---|
| |||
| Medications, n (%) | |||
| Antibiotics | 92 (32.2) | 121 (42.5) | 0.011 |
| Antiarrhythmics | 48 (16.8) | 44 (15.4) | 0.662 |
| Anticoagulants | 83 (29.0) | 97 (34.0) | 0.197 |
| Diuretics/antihypertensives | 71 (24.8) | 55 (19.3) | 0.111 |
| Bronchodilators | 78 (27.3) | 73 (25.6) | 0.653 |
| Anticonvulsives | 26 (9.1) | 27 (9.5) | 0.875 |
| Sedatives/narcotics | 0 (0.0) | 1 (0.4) | 0.499 |
| Respiratory support, n (%) | |||
| Noninvasive ventilation | 17 (6.0) | 9 (3.1) | 0.106 |
| Escalated oxygen support | 12 (4.2) | 7 (2.5) | 0.247 |
| Enhanced vital signs, n (%) | 50 (17.5) | 47 (16.5) | 0.752 |
| Maintenance intravenous fluids, n (%) | 48 (16.8) | 41 (14.4) | 0.430 |
| Vasopressors, n (%) | 57 (19.9) | 61 (21.4) | 0.664 |
| Bolus intravenous fluids, n (%) | 7 (2.4) | 14 (4.9) | 0.118 |
| Telemetry, n (%) | 198 (69.2) | 176 (61.8) | 0.052 |
| Oximetry, n (%) | 20 (7.0) | 6 (2.1) | 0.005 |
| New intravenous access, n (%) | 26 (9.1) | 35 (12.3) | 0.217 |
| Primary care team physician called by RRT nurse, n (%) | 82 (28.7) | 56 (19.6) | 0.012 |
Fifty‐one patients (17.8%) randomly assigned to the intervention group required ICU transfer compared with 52 of 285 patients (18.2%) in the control group (odds ratio: 0.972; 95% CI: 0.6351.490; P=0.898) (Table 3). Twenty‐one patients (7.3%) randomly assigned to the intervention group expired during their hospitalization compared with 22 of 285 patients (7.7%) in the control group (odds ratio: 0.947; 95%CI: 0.5091.764; P=0.865). Hospital length of stay was 8.49.5 days (median, 4.5 days; interquartile range, 2.311.4 days) for patients randomized to the intervention group and 9.411.1 days (median, 5.3 days; interquartile range, 3.211.2 days) for patients randomized to the control group (P=0.038). The ICU length of stay was 4.86.6 days (median, 2.9 days; interquartile range, 1.76.5 days) for patients randomized to the intervention group and 5.86.4 days (median, 2.9 days; interquartile range, 1.57.4) for patients randomized to the control group (P=0.812).The number of patients requiring transfer to a nursing home or long‐term acute care hospital was similar for patients in the intervention and control groups (26.9% vs 26.3%; odds ratio: 1.032; 95% CI: 0.7121.495; P=0.870). Similarly, the number of patients requiring hospital readmission before 30 days and 180 days, respectively, was similar for the 2 treatment groups (Table 3). For the combined study population, the EWS alerts were triggered 94138 hours (median, 27 hours; interquartile range, 7132 hours) prior to ICU transfer and 250204 hours (median200 hours; interquartile range, 54347 hours) prior to hospital mortality. The number of RRT calls for the 8 medicine units studied progressively increased from the start of the RRT program in 2009 through 2013 (121 in 2009, 194 in 2010, 298 in 2011, 415 in 2012, 415 in 2013; P<0.001 for the trend).
| Outcome | Intervention Group, n=286 | Control Group, n=285 | P Value |
|---|---|---|---|
| |||
| ICU transfer, n (%) | 51 (17.8) | 52 (18.2) | 0.898 |
| All‐cause hospital mortality, n (%) | 21 (7.3) | 22 (7.7) | 0.865 |
| Transfer to nursing home or LTAC, n (%) | 77 (26.9) | 75 (26.3) | 0.870 |
| 30‐day readmission, n (%) | 53 (18.5) | 62 (21.8) | 0.337 |
| 180‐day readmission, n (%) | 124 (43.4) | 117 (41.1) | 0.577 |
| Hospital length of stay, d* | 8.49.5, 4.5 [2.311.4] | 9.411.1, 5.3 [3.211.2] | 0.038 |
| ICU length of stay, d* | 4.86.6, 2.9 [1.76.5] | 5.86.4, 2.9 [1.57.4] | 0.812 |
DISCUSSION
We demonstrated that a real‐time EWS alert sent to a RRT nurse was associated with a modest reduction in hospital length of stay, but similar rates of hospital mortality, ICU transfer, and subsequent need for placement in a long‐term care setting compared with usual care. We also found the number of RRT calls to have increased progressively from 2009 to the present on the study units examined.
Unplanned ICU transfers occurring as early as within 8 hours of hospitalization are relatively common and associated with increased mortality.[6] Bapoje et al. evaluated a total of 152 patients over 1 year who had unplanned ICU transfers.[19] The most common reason was worsening of the problem for which the patient was admitted (48%). Other investigators have also attempted to identify predictors for clinical deterioration resulting in unplanned ICU transfer that could be employed in an EWS.[20, 21] Organizations like the Institute for Healthcare Improvement have called for the development and routine implementation of EWSs to direct the activities of RRTs and improve outcomes.[22] However, a recent systematic review found that much of the evidence in support of EWSs and emergency response teams is of poor quality and lacking prospective randomized trials.[23]
Our earlier experience demonstrated that simply providing an alert to nursing units did not result in any demonstrable improvements in the outcomes of high‐risk patients identified by our EWS.[14] Previous investigations have also had difficulty in demonstrating consistent outcome improvements with the use of EWSs and RRTs.[24, 25, 26, 27, 28, 29, 30, 31, 32] As a result of mandates from quality improvement organizations, most US hospitals currently employ RRTs for emergent mobilization of resources when a clinically deteriorating patient is identified on a hospital ward.[33, 34] Linking RRT actions with a validated real‐time alert may represent a way of improving the overall effectiveness of such teams for monitoring general hospital units, short of having all hospitalized patients in units staffed and monitored to provide higher levels of supervision (eg, ICUs, step‐down units).[9, 35]
An alternative approach to preventing patient deterioration is to provide closer overall monitoring. This has been accomplished by employing nursing personnel to increase monitoring, or with the use of automated monitoring equipment. Bellomo et al. showed that the deployment of electronic automated vital sign monitors on general hospital units was associated with improved utilization of RRTs, increased patient survival, and decreased time for vital sign measurement and recording.[36] Laurens and Dwyer found that implementation of medical emergency teams (METs) to respond to predefined MET activation criteria as observed by hospital staff resulted in reduced hospital mortality and reduced need for ICU transfer.[37] However, other investigators have observed that imperfect implementation of nursing‐performed observational monitoring resulted in no demonstrable benefit, illustrating the limitations of this approach.[38] Our findings suggest that nursing care of patients on general hospital units may be enhanced with the use of an EWS alert sent to the RRT. This is supported by the observation that communications between the RRT and the primary care teams was greater as was the use of telemetry and oximetry in the intervention arm. Moreover, there appears to have been a learning effect for the nursing staff that occurred on our study units, as evidenced by the increased number of RRT calls that occurred between 2009 and 2013. This change in nursing practices on these units certainly made it more difficult for us to observe outcome differences in our current study with the prescribed intervention, reinforcing the notion that evaluating an already established practice is a difficult proposition.[39]
Our study has several important limitations. First, the EWS alert was developed and validated at Barnes‐Jewish Hospital.[11, 12, 13, 14] We cannot say whether this alert will perform similarly in another hospital. Second, the EWS alert only contains data from medical patients. Development and validation of EWS alerts for other hospitalized populations, including surgical and pediatric patients, are needed to make such systems more generalizable. Third, the primary clinical outcome employed for this trial was problematic. Transfer to an ICU may not be an optimal outcome variable, as it may be desirable to transfer alerted patients to an ICU, which can be perceived to represent a soft landing for such patients once an alert has been generated. A better measure could be 30‐day all‐cause mortality, which would not be subject to clinician biases. Finally, we could not specifically identify explanations for the greater use of antibiotics in the control group despite similar rates of infection for both study arms. Future studies should closely evaluate the ability of EWS alerts to alter specific therapies (eg, reduce antibiotic utilization).
In summary, we have demonstrated that an EWS alert linked to a RRT likely contributed to a modest reduction in hospital length of stay, but no reductions in hospital mortality and ICU transfer. These findings suggest that inpatient deterioration on general hospital units can be identified and linked to a specific intervention. Continued efforts are needed to identify and implement systems that will not only accurately identify high‐risk patients on general hospital units but also intervene to improve their outcomes. We are moving forward with the development of a 2‐tiered EWS utilizing both EMR data and real‐time streamed vital sign data, to determine if we can further improve the prediction of clinical deterioration and potentially intervene in a more clinically meaningful manner.
Acknowledgements
The authors thank Ann Doyle, BSN, Lisa Mayfield, BSN, and Darain Mitchell for their assistance in carrying out this research protocol; and William Shannon, PhD, from the Division of General Medical Sciences at Washington University, for statistical support.
Disclosures: This study was funded in part by the Barnes‐Jewish Hospital Foundation, the Chest Foundation of the American College of Chest Physicians, and by grant number UL1 RR024992 from the National Center for Research Resources (NCRR), a component of the National Institutes of Health (NIH), and NIH Roadmap for Medical Research. Its contents are solely the responsibility of the authors and do not necessarily represent the official view of the NCRR or NIH. The steering committee was responsible for the study design, execution, analysis, and content of the article. The Barnes‐Jewish Hospital Foundation, the American College of Chest Physicians, and the Chest Foundation were not involved in the design, conduct, or analysis of the trial. The authors report no conflicts of interest. Marin Kollef, Yixin Chen, Kevin Heard, Gina LaRossa, Chenyang Lu, Nathan Martin, Nelda Martin, Scott Micek, and Thomas Bailey have all made substantial contributions to conception and design, or acquisition of data, or analysis and interpretation of data; have drafted the submitted article or revised it critically for important intellectual content; have provided final approval of the version to be published; and have agreed to be accountable for all aspects of the work in ensuring that questions related to the accuracy or integrity of any part of the work are appropriately investigated and resolved.
- , , , et al. Duration of life‐threatening antecedents prior to intensive care admission. Intensive Care Med. 2002;28(11):1629–1634.
- , , , et al. A comparison of antecedents to cardiac arrests, deaths and emergency intensive care admissions in Australia and New Zealand, and the United Kingdom—the ACADEMIA study. Resuscitation. 2004;62(3):275–282.
- , , . Abnormal vital signs are associated with an increased risk for critical events in US veteran inpatients. Resuscitation. 2009;80(11):1264–1269.
- , , , et al. Septic shock: an analysis of outcomes for patients with onset on hospital wards versus intensive care units. Crit Care Med. 1998;26(6):1020–1024.
- , , , , . Inpatient transfers to the intensive care unit: delays are associated with increased mortality and morbidity. J Gen Intern Med. 2003;18(2):77–83.
- , , , . Adverse outcomes associated with delayed intensive care unit transfers in an integrated healthcare system. J Hosp Med. 2012;7(3):224–230.
- , , , et al. Findings of the first consensus conference on medical emergency teams. Crit Care Med. 2006;34(9):2463–2478.
- , , , et al. “Identifying the hospitalised patient in crisis”—a consensus conference on the afferent limb of rapid response systems. Resuscitation. 2010;81(4):375–382.
- , , . Rapid‐response teams. N Engl J Med. 2011;365(2):139–146.
- , , , , . Acute care teams: a systematic review and meta‐analysis. Arch Intern Med. 2010;170(1):18–26.
- , , , et al. Toward a two‐tier clinical warning system for hospitalized patients. AMIA Annu Symp Proc. 2011;2011:511–519.
- , , , , , . Early prediction of septic shock in hospitalized patients. J Hosp Med. 2010;5(1):19–25.
- , , , et al. Implementation of a real‐time computerized sepsis alert in nonintensive care unit patients. Crit Care Med. 2011;39(3):469–473.
- , , , et al. A trial of a real‐time Alert for clinical deterioration in Patients hospitalized on general medical wards. J Hosp Med. 2013;8(5):236–242.
- , , , , . Prospective evaluation of a modified Early Warning Score to aid earlier detection of patients developing critical illness on a general surgical ward. Br J Anaesth. 2000;84:663P.
- , , , . Validation of a modified Early Warning Score in medical admissions. QJM. 2001;94(10):521–526.
- , , . Adapting a clinical comorbidity index for use with ICD‐9‐CM administrative databases. J Clin Epidemiol. 1992;45(6):613–619.
- , , , . Comorbidity measures for use with administrative data. Med Care. 1998;36(1):8–27.
- , , , . Unplanned transfers to a medical intensive care unit: causes and relationship to preventable errors in care. J Hosp Med. 2011;6(2):68–72.
- , , , , , . Unplanned transfers to the intensive care unit: the role of the shock index. J Hosp Med. 2010;5(8):460–465.
- , , , , , . Early detection of impending physiologic deterioration among patients who are not in intensive care: development of predictive models using data from an automated electronic medical record. J Hosp Med. 2012;7(5):388–395.
- Institute for Healthcare Improvement. Early warning systems: the next level of rapid response; 2011. Available at: http://www.ihi.org/Engage/Memberships/MentorHospitalRegistry/Pages/RapidResponseSystems.aspx. Accessed April 6, 2011.
- , . Do either early warning systems or emergency response teams improve hospital patient survival? A systematic review. Resuscitation. 2013;84(12):1652–1667.
- , , , et al. Introducing critical care outreach: a ward‐randomised trial of phased introduction in a general hospital. Intensive Care Med. 2004;30(7):1398–1404.
- . Out of our reach? Assessing the impact of introducing critical care outreach service. Anaesthesiology. 2003;58(9):882–885.
- , , . Effect of the critical care outreach team on patient survival to discharge from hospital and readmission to critical care: non‐randomised population based study. BMJ. 2003;327(7422):1014.
- , , . Reducing mortality and avoiding preventable ICU utilization: analysis of a successful rapid response program using APR DRGs. J Healthc Qual. 2011;33(5):7–16.
- , , , et al. Introduction of the medical emergency team (MET) system: a cluster‐randomised control trial. Lancet. 2005;365(9477):2091–2097.
- , , , , , . The impact of the introduction of critical care outreach services in England: a multicentre interrupted time‐series analysis. Crit Care. 2007;11(5):R113.
- , , , et al. Systematic review and evaluation of physiological track and trigger warning systems for identifying at‐risk patients on the ward. Intensive Care Med. 2007;33(4):667–679.
- , , , . Timing and teamwork—an observational pilot study of patients referred to a Rapid Response Team with the aim of identifying factors amenable to re‐design of a Rapid Response System. Resuscitation. 2012;83(6):782–787.
- , , , , , . The impact of rapid response team on outcome of patients transferred from the ward to the ICU: a single‐center study. Crit Care Med. 2013;41(10):2284–2291.
- , , , . Rapid response: a quality improvement conundrum. J Hosp Med. 2009;4(4):255–257.
- . Rapid response systems now established at 2,900 hospitals. Hospitalist News. 2010;3:1.
- , , . Early warning systems. Hosp Chron. 2012;7:37–43.
- , , , et al. A controlled trial of electronic automated advisory vital signs monitoring in general hospital wards. Crit Care Med. 2012;40(8):2349–2361.
- , . The impact of medical emergency teams on ICU admission rates, cardiopulmonary arrests and mortality in a regional hospital. Resuscitation. 2011;82(6):707–712.
- , , . Imperfect implementation of an early warning scoring system in a danish teaching hospital: a cross‐sectional study. PLoS One. 2013;8:e70068.
- , . Introduction of medical emergency teams in Australia and New Zealand: A multicentre study. Crit Care. 2008;12(3):151.
© 2014 Society of Hospital Medicine
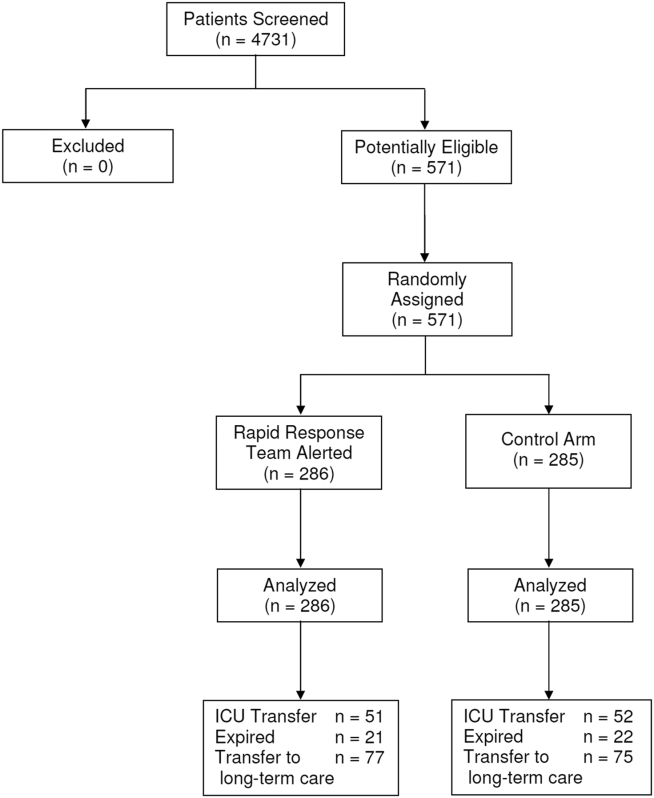
Deterioration Alerts on Medical Wards
Timely interventions are essential in the management of complex medical conditions such as new‐onset sepsis in order to prevent rapid progression to severe sepsis and septic shock.[1, 2, 3, 4, 5] Similarly, rapid identification and appropriate treatment of other medical and surgical conditions have been associated with improved outcomes.[6, 7, 8] We previously developed a real‐time, computerized prediction tool (PT) using recursive partitioning regression tree analysis for the identification of impending sepsis for use on general hospital wards.[9] We also showed that implementation of a real‐time computerized sepsis alert on hospital wards based on the PT resulted in increased use of early interventions, including antibiotic escalation, intravenous fluids, oxygen therapy, and diagnostics in patients identified as at risk.[10]
The first goal of this study was to develop an updated PT for use on hospital wards that could be used to predict subsequent global clinical deterioration and the need for a higher level of care. The second goal was to determine whether simply providing a real‐time alert to nursing staff based on the updated PT resulted in any demonstrable changes in patient outcomes.
METHODS
Study Location
The study was conducted at Barnes‐Jewish Hospital, a 1250‐bed academic medical center in St. Louis, Missouri. Eight adult medicine wards were assessed from July 2007 through December 2011. The medicine wards are closed areas with patient care delivered by dedicated house staff physicians under the supervision of a board‐certified attending physician. The study was approved by the Washington University School of Medicine Human Studies Committee.
Study Period
The period from July 2007 through January 2010 was used to train and retrospectively test the prediction model. The period from January 2011 through December 2011 was used to prospectively validate the model during a randomized trial using alerts generated from the prediction model.
Patients
Electronically captured clinical data were housed in a centralized clinical data repository. This repository cataloged 28,927 hospital visits from 19,116 distinct patients between July 2007 and January 2010. It contained a rich set of demographic and medical data for each of the visits, such as patient age, manually collected vital‐sign data, pharmacy data, laboratory data, and intensive care unit (ICU) transfer. This study served as a proof of concept for our vision of using machine learning to identify at‐risk patients and ultimately to perform real‐time event detection and interventions.
Algorithm Overview
Details regarding the predictive model development have been previously described.[11] To predict ICU transfer for patients housed on general medical wards, we used logistic regression, employing a novel framework to analyze the data stream from each patient, assigning scores to reflect the probability of ICU transfer to each patient.
Before building the model, several preprocessing steps were applied to eliminate outliers and find an appropriate representation of patients' states. For each of 36 input variables we specified acceptable ranges based on the domain knowledge of the medical experts on our team. For any value that was outside of the medically conceivable range, we replaced it by the mean value for that patient, if available. Values for every continuous parameter were scaled so that all measurements lay in the interval [0, 1] and were normalized by the minimum and maximum of the parameter. To capture the temporal effects in our data, we retained a sliding window of all the collected data points within the last 24 hours. We then subdivided these data into a series of 6 sequential buckets of 4 hours each.
To capture variations within a bucket, we computed 3 values for each feature in the bucket: the minimum, maximum, and mean data points. Each of the resulting 3n values was input to the logistic regression equation as separate variables. To deal with missing data points within the buckets, we used the patients' most recent reading from any time earlier in the hospital stay, if available. If no prior values existed, we used mean values calculated over the entire historical dataset. Bucket 6 max/min/mean represents the most recent 4‐hour window from the preceding 24‐hour time period for the maximum, minimum, and mean values, respectively. By itself, logistic regression does not operate on time‐series data. That is, each variable input to the logistic equation corresponds to exactly 1 data point (eg, a blood‐pressure variable would consist of a single blood‐pressure reading). In a clinical application, however, it is important to capture unusual changes in vital‐sign data over time. Such changes may precede clinical deterioration by hours, providing a chance to intervene if detected early enough. In addition, not all readings in time‐series data should be treated equally; the value of some kinds of data may change depending on their age. For example, a patient's condition may be better reflected by a blood‐oxygenation reading collected 1 hour ago than a reading collected 12 hours ago. This is the rationale for our use of a sliding window of all collected data points within the last 24 hours performed in a real‐time basis.
The algorithm was first implemented in MATLAB (Natick, MA). For the purposes of training, we used a single 24‐hour window of data from each patient. For patients admitted to ICU, this window was 26 hours to 2 hours prior to ICU admission; for all other patients, this window consisted of the first 24 hours of their hospital stay. The dataset's 36 input variables were divided into buckets and min/mean/max features wherever applicable, resulting in 398 variables. The first half of the dataset was used to train the model. We then used the second half of the dataset as the validation dataset. We generated a predicted outcome for each case in the validation data, using the model parameter coefficients derived from the training data. We also employed bootstrap aggregation to improve classification accuracy and to address overfitting. We then applied various threshold cut‐points to convert these predictions into binary values and compared the results against the ICU transfer outcome. A threshold of 0.9760 for specificity was chosen to achieve a sensitivity of approximately 40%. These operating characteristics were chosen in turn to generate a manageable number of alerts per hospital nursing unit per day (estimated at 12 per nursing unit per day). At this cut‐point the C‐statistic was 0.8834, with an overall accuracy of 0.9292.
In order to train the logistic model, we used a single 24‐hour window of data for each patient. However, in a system that predicts patients' outcomes in real time, scores are recomputed each time new data are entered into the database. Hence, patients have a series of scores over the length of their hospital stay, and an alert is triggered when any one of these scores is above the chosen threshold.
Once the model was developed, we implemented it in an internally developed, Java‐based clinical decision support rules engine, which identified when new data relevant to the model were available in a real‐time central data repository. The rules engine queried the data repository to acquire all data needed to evaluate the model. The score was calculated with each relevant new data point, and an alert was generated when the score exceeded the cut‐point threshold. We then prospectively validated these alerts on patients on 8 general medical wards at Barnes Jewish Hospital. Details regarding the architecture of our clinical decision support system have been previously published.[12] The sensitivity and positive predictive values for ICU transfer for these alerts were tracked during an intervention trial that ran from January 24, 2011, through December 31, 2011. Four general medical wards were randomized to the intervention group and 4 wards were randomized to the control group. The 8 general medical wards were ordered according to their alert rates based upon the historical data from July 2007 through January 2010, creating 4 pairs of wards in ascending order of alert rate. Within each of the 4 pairs, 1 member of the pair was randomized to the intervention group and the other to the control group using a random number generator.
Real‐time automated alerts generated 24 hours per day, 7 days per week from the predictive algorithm were sent to the charge‐nurse pager on the intervention units. Alerts were also generated and stored in the database on the control units, but these alerts were not sent to the charge nurse on those units. The alerts were sent to the charge nurses on the respective wards, as these individuals were thought to be in the best position to perform the initial assessment of the alerted patients, especially during evening hours when physician staffing was reduced. The charge nurses assessed the intervention‐group patients and were instructed to contact the responsible physician (hospitalist or internal medicine house officer) to inform them of the alert, or to call the rapid response team (RRT) if the patient's condition already appeared to be significantly deteriorating.
Descriptive statistics for algorithm sensitivity and positive predictive value and for patient outcomes were performed. Associations between alerts and the primary outcome, ICU transfer, were determined, as well as the impact of alerts in the intervention group compared with the control group, using [2] tests. The same analyses were performed for patient death. Differences in length of stay (LOS) were assessed using the Wilcoxon rank sum test.
RESULTS
Predictive Model
The variables with the greatest coefficients contributing to the PT model included respiratory rate, oxygen saturation, shock index, systolic blood pressure, anticoagulation use, heart rate, and diastolic blood pressure. A complete list of variables is provided in the Appendix (see Supporting Information in the online version of this article). All but 1 are routinely collected vital‐sign measures, and all but 1 occur in the 4‐hour period immediately prior to the alert (bucket 6).
Prospective Trial
Patient characteristics are presented in Table 1. Patients were well matched for race, sex, age, and underlying diagnoses. All alerts reported to the charge nurses were to be associated with a call from the charge nurse to the responsible physician caring for the alerted patient. The mean number of alerts per alerted patient was 1.8 (standard deviation=1.7). Patients meeting the alert threshold were at nearly 5.3‐fold greater risk of ICU transfer (95% confidence interval [CI]: 4.6‐6.0) than those not satisfying the alert threshold (358 of 2353 [15.2%; 95% CI: 13.8%‐16.7%] vs 512 of 17678 [2.9%; 95% CI: 2.7%‐3.2%], respectively; P<0.0001). Patients with alerts were at 8.9‐fold greater risk of death (95% CI: 7.4‐10.7) than those without alerts (244 of 2353 [10.4%; 95% CI: 9.2%‐11.7%] vs 206 of 17678 [1.2%; 95% CI: 1.0%‐1.3%], respectively; P<0.0001). Operating characteristics of the PT from the prospective trial are shown in Table 2. Alerts occurred a median of 25.5 hours prior to ICU transfer (interquartile range, 7.00‐81.75) and 8 hours prior to death (interquartile range, 4.09‐15.66).
| Study Group | ||||||
|---|---|---|---|---|---|---|
| Control (N=10,120) | Intervention (N=9911) | |||||
| ||||||
| Race | N | % | N | % | ||
| White | 5,062 | 50 | 4,934 | 50 | ||
| Black | 4,864 | 48 | 4,790 | 48 | ||
| Other | 194 | 2 | 187 | 2 | ||
| Sex | ||||||
| F | 5,355 | 53 | 5,308 | 54 | ||
| M | 4,765 | 47 | 4,603 | 46 | ||
| Age at discharge, median (IQR), y | 57 (4469) | 57 (4470) | ||||
| Top 10 ICD‐9 descriptions and counts, n (%) | ||||||
| 1 | Diseases of the digestive system | 1,774 (17.5) | Diseases of the digestive system | 1,664 (16.7) | ||
| 2 | Diseases of the circulatory system | 1,252 (12.4) | Diseases of the circulatory system | 1,253 (12.6) | ||
| 3 | Diseases of the respiratory system | 1,236 (12.2) | Diseases of the respiratory system | 1,210 (12.2) | ||
| 4 | Injury and poisoning | 864 (8.5) | Injury and poisoning | 849 (8.6) | ||
| 5 | Endocrine, nutritional, and metabolic diseases, and immunity disorders | 797 (7.9) | Diseases of the genitourinary system | 795 (8.0) | ||
| 6 | Diseases of the genitourinary system | 762 (7.5) | Endocrine, nutritional, and metabolic diseases, and immunity disorders | 780 (7.9) | ||
| 7 | Infectious and parasitic diseases | 555 (5.5) | Infectious and parasitic diseases | 549 (5.5) | ||
| 8 | Neoplasms | 547 (5.4) | Neoplasms | 465 (4.7) | ||
| 9 | Diseases of the blood and blood‐forming organs | 426 (4.2) | Diseases of the blood and blood‐forming organs | 429 (4.3) | ||
| 10 | Symptoms, signs, and ill‐defined conditions and factors influencing health status | 410 (4.1) | Diseases of the musculoskeletal system and connective tissue | 399 (4.0) | ||
| Sensitivity, % | Specificity, % | PPV, % | NPV, % | Positive Likelihood Ratio | Negative Likelihood Ratio | |||
|---|---|---|---|---|---|---|---|---|
| ||||||||
| ICU Transfer | Yes (N=870) | No (N=19,161) | ||||||
| Alert | 358 | 1,995 | 41.1 (95% CI: 37.944.5) | 89.6 (95% CI: 89.290.0) | 15.2 (95% CI: 13.816.7) | 97.1 (95% CI: 96.897.3) | 3.95 (95% CI: 3.614.30) | 0.66 (95% CI: 0.620.70) |
| No Alert | 512 | 17,166 | ||||||
| Death | Yes (N=450) | No (N=19,581) | ||||||
| Alert | 244 | 2109 | 54.2 (95% CI: 49.658.8) | 89.2 (95% CI: 88.889.7) | 10.4 (95% CI: 9.211.7) | 98.8 (95% CI: 98.799.0) | 5.03 (95% CI: 4.585.53) | 0.51 (95% CI: 0.460.57) |
| No Alert | 206 | 17,472 | ||||||
Among patients identified by the PT, there were no differences in the proportion of patients who were transferred to the ICU or who died in the intervention group as compared with the control group (Table 3). In addition, although there was no difference in LOS in the intervention group compared with the control group, identification by the PT was associated with a significantly longer median LOS (7.01 days vs 2.94 days, P<0.001). The largest numbers of patients who were transferred to the ICU or died did so in the first hospital day, and 60% of patients who were transferred to the ICU did so in the first 4 days, whereas deaths were more evenly distributed across the hospital stay.
| Outcomes by Alert Statusa | ||||||||
|---|---|---|---|---|---|---|---|---|
| Alert Study Group | No‐Alert Study Group | |||||||
| Intervention, N=1194 | Control, N=1159 | Intervention, N=8717 | Control, N=8961 | |||||
| N | % | N | % | N | % | N | % | |
| ||||||||
| ICU Transfer | ||||||||
| Yes | 192 | 16 | 166 | 14 | 252 | 3 | 260 | 3 |
| No | 1002 | 84 | 993 | 86 | 8465 | 97 | 8701 | 97 |
| Death | ||||||||
| Yes | 127 | 11 | 117 | 10 | 96 | 1 | 110 | 1 |
| No | 1067 | 89 | 1042 | 90 | 8621 | 99 | 8851 | 99 |
| LOS from admit to discharge, median (IQR), da | 7.07 (3.9912.15) | 6.92 (3.8212.67) | 2.97 (1.775.33) | 2.91 (1.745.19) | ||||
DISCUSSION
We have demonstrated that a relatively simple hospital‐specific method for generating a PT derived from routine laboratory and hemodynamic values is capable of predicting clinical deterioration and the need for ICU transfer, as well as hospital mortality, in non‐ICU patients admitted to general hospital wards. We also found that the PT identified a sicker patient population as manifest by longer hospital LOS. The methods used in generating this real‐time PT are relatively simple and easily executed with the use of an electronic medical record (EMR) system. However, our data also showed that simply providing an alert to nursing units based on the PT did not result in any demonstrable improvement in patient outcomes. Moreover, our PT and intervention in their current form have substantial limitations, including low sensitivity and positive predictive value, high possibility of alert fatigue, and no clear clinical impact. These limitations suggest that this approach has limited applicability in its current form.
Unplanned ICU transfers occurring as early as within 8 hours of hospitalization are relatively common and associated with increased mortality.[13] Bapoje et al evaluated a total of 152 patients over 1 year who had unplanned ICU transfers.[14] The most common reason was worsening of the problem for which the patient was admitted (48%). Other investigators have also attempted to identify predictors for clinical deterioration resulting in unplanned ICU transfer that could be employed in a PT or early warning system (EWS). Keller et al evaluated 50 consecutive general medical patients with unplanned ICU transfers between 2003 and 2004.[15] Using a case‐control methodology, these investigators found shock index values>0.85 to be the best predictor for subsequent unplanned ICU transfer (P<0.02; odds ratio: 3.0).
Organizations such as the Institute for Healthcare Improvement have called for the development and implementation of EWSs in order to direct the activities of RRTs and improve outcomes.[16] Escobar et al carried out a retrospective case‐control study using as the unit of analysis 12‐hour patient shifts on hospital wards.[17] Using logistic regression and split validation, they developed a PT for ICU transfer from clinical variables available in their EMR. The EMR derived PT had a C‐statistic of 0.845 in the derivation dataset and 0.775 in the validation dataset, concluding that EMR‐based detection of impending deterioration outside the ICU is feasible in integrated healthcare delivery systems.
We found that simply providing an alert to nursing units did not result in any demonstrable improvements in the outcomes of high‐risk patients identified by our PT. This may have been due to simply relying on the alerted nursing staff to make phone calls to physicians and not linking a specific and effective patient‐directed intervention to the PT. Other investigators have similarly observed that the use of an EWS or PT may not result in outcome improvements.[18] Gao et al performed an analysis of 31 studies describing hospital track and trigger EWSs.[19] They found little evidence of reliability, validity, and utility of these systems. Peebles et al showed that even when high‐risk non‐ICU patients are identified, delays in providing appropriate therapies occur, which may explain the lack of efficacy of EWSs and RRTs.[20] These observations suggest that there is currently a paucity of validated interventions available to improve outcome in deteriorating patients, despite our ability to identify patients who are at risk for such deterioration.
As a result of mandates from quality‐improvement organizations, most US hospitals currently employ RRTs for emergent mobilization of resources when a clinically deteriorating patient is identified on a hospital ward.[21] However, as noted above, there is limited evidence to suggest that RRTs contribute to improved patient outcomes.[22, 23, 24, 25, 26, 27] The potential importance of this is reflected in a recent report suggesting that 2900 US hospitals now have rapid‐response systems in place without clear demonstration of their overall efficacy.[28] Linking rapid‐response interventions with a validated real‐time alert may represent a way of improving the effectiveness of such interventions.[29, 30, 31, 32, 33, 34] Our data showed that hospital LOS was statistically longer among alerted patients compared with nonalerted patients. This supports the conclusion that the alerts helped identify a sicker group of patients, but the nursing alerts did not appear to change outcomes. This finding also seems to refute the hypothesis that simply linking an intervention to a PT will improve outcomes, albeit the intervention we employed may not have been robust enough to influence patient outcomes.
The development of accurate real‐time EWSs holds the potential to identify patients at risk for clinical deterioration at an earlier point in time when rescue interventions can be implemented in a potentially more effective manner in both adults and children.[35] Unfortunately, the ideal intervention to be applied in this situation is unknown. Our experience suggests that successful interventions will require a more integrated approach than simply providing an alert with general management principles. As a result of our experience, we are undertaking a randomized clinical trial in 2013 to determine whether linking a patient‐specific intervention to a PT will result in improved outcomes. The intervention we will be testing is to have the RRT immediately notified about alerted patients so as to formally evaluate them and to determine the need for therapeutic interventions, and to administer such interventions as needed and/or transfer the alerted patients to a higher level of care as deemed necessary. Additionally, we are updating our PT with more temporal data to determine if this will improve its accuracy. One of these updates will include linking the PT to wirelessly obtained continuous oximetry and heart‐rate data, using minimally intrusive sensors, to establish a 2‐tiered EWS.[11]
Our study has several important limitations. First, the PT was developed using local data, and thus the results may not be applicable to other settings. However, our model shares many of the characteristics identified in other clinical‐deterioration PTs.[15, 17] Second, the positive prediction value of 15.2% for ICU transfer may not be clinically useful due to the large number of false‐positive results. Moreover, the large number of false positives could result in alert fatigue, causing alerts to be ignored. Third, although the charge nurses were supposed to call the responsible physicians for the alerted patients, we did not determine whether all these calls occurred or whether they resulted in any meaningful changes in monitoring or patient treatment. This is important because lack of an effective intervention or treatment would make the intervention group much more like our control group. Future studies are needed to assess the impact of an integrated intervention (eg, notification of experienced RRT members with adequate resource access) to determine if patient outcomes can be impacted by the use of an EWS. Finally, we did not compare the performance of our PT to other models such as the modified early warning score (MEWS).
An additional limitation to consider is that our PT offered no new information to the nurse manager, or the PT did not change the opinions of the charge nurses. This is supported by a recent study of 63 serious adverse outcomes in a Belgian teaching hospital where death was the final outcome.[36] Survey results revealed that nurses were often unaware that their patients were deteriorating before the crisis. Nurses also reported threshold levels for concern for abnormal vital signs that suggested they would call for assistance relatively late in clinical crises. The limited ability of nursing staff to identify deteriorating patients is also supported by a recent simulation study demonstrating that nurses did identify that patients were deteriorating, but as each patient deteriorated staff performance declined, with a reduction in all observational records and actions.[37]
In summary, we have demonstrated that a relatively simple hospital‐specific PT could accurately identify patients on general medicine wards who subsequently developed clinical deterioration and the need for ICU transfer, as well as hospital mortality. However, no improvements in patient outcomes were found from reporting this information to nursing wards on a real‐time basis. The low positive predictive value of the alerts, local development of the EWS, and absence of improved outcomes substantially limits the broader application of this system in its current form. Continued efforts are needed to identify and implement systems that will not only accurately identify high‐risk patients on general wards but also intervene to improve their outcomes.
Acknowledgments
Disclosures: This study was funded in part by the Barnes‐Jewish Hospital Foundation and by Grant No. UL1 RR024992 from the National Center for Research Resources (NCRR), a component of the National Institutes of Health (NIH), and the NIH Roadmap for Medical Research. Its contents are solely the responsibility of the authors and do not necessarily represent the official view of NCRR or NIH.
- , , , et al. Improvement in process of care and outcome after a multicenter severe sepsis educational program in Spain. JAMA. 2008;299:2294–2303.
- , , , et al. Early goal‐directed therapy in the treatment of severe sepsis and septic shock. N Engl J Med. 2001;345:1368–1377.
- , , , et al. Before‐after study of a standardized hospital order set for the management of septic shock. Crit Care Med. 2007;34:2707–2713.
- , , . Surviving Sepsis Campaign: international guidelines for management of severe sepsis and septic shock: 2008. Crit Care Med. 2008;36:296–327.
- , , , et al. Septic shock: an analysis of outcomes for patients with onset on hospital wards versus intensive care units. Crit Care Med. 1998;26:1020–1024.
- , , , , . Inpatient transfers to the intensive care unit: delays are associated with increased mortality and morbidity. J Gen Intern Med. 2003;18:77–83.
- , , , , , . Causes and effects of surgical delay in patients with hip fracture: a cohort study. Ann Intern Med. 2011;155:226–233.
- , , , . Comprehensive stroke centers overcome the weekend versus weekday gap in stroke treatment and mortality. Stroke. 2011;42:2403–2409.
- , , , , , . Hospital‐wide impact of a standardized order set for the management of bacteremic severe sepsis. Crit Care Med. 2009;37:819–824.
- , , , et al. Implementation of a real‐time computerized sepsis alert in non–intensive care unit patients. Crit Care Med. 2011;39:469–473.
- , , , et al. Toward a two‐tier clinical warning system for hospitalized patients. AMIA Annu Symp Proc. 2011;2011:511–519.
- , , , , , . Migrating toward a next‐generation clinical decision support application: the BJC HealthCare experience. AMIA Annu Symp Proc. 2007;344–348.
- , , , . Adverse outcomes associated with delayed intensive care unit transfers in an integrated healthcare system. J Hosp Med. 2011;7:224–230.
- , , , . Unplanned transfers to a medical intensive care unit: causes and relationship to preventable errors in care. J Hosp Med. 2011;6:68–72.
- , , , , , . Unplanned transfers to the intensive care unit: the role of the shock index. J Hosp Med. 2010;5:460–465.
- Institute for Healthcare Improvement. Early warning systems: the next level of rapid response. Available at: http://www.ihi.org/IHI/Programs/AudioAndWebPrograms/ExpeditionEarlyWarningSystemsTheNextLevelofRapidResponse.htmplayerwmp. Accessed April 6, 2011.
- , , , , , . Early detection of impending physiologic deterioration among patients who are not in intensive care: development of predictive models using data from an automated electronic medical record. J Hosp Med. 2012;7:388–395.
- , , . Early warning systems: the next level of rapid response. Nursing. 2012;42:38–44.
- , , , et al. Systematic review and evaluation of physiological track and trigger warning systems for identifying at‐risk patients on the ward. Intensive Care Med. 2007;33:667–679.
- , , , . Timing and teamwork—an observational pilot study of patients referred to a Rapid Response Team with the aim of identifying factors amenable to re‐design of a Rapid Response System. Resuscitation. 2012;83:782–787.
- , , , . Rapid response: a quality improvement conundrum. J Hosp Med. 2009;4:255–257.
- , , , et al. Introducing critical care outreach: a ward‐randomised trial of phased introduction in a general hospital. Intensive Care Med. 2004;30:1398–1404.
- . Out of our reach? Assessing the impact of introducing critical care outreach service. Anaesthesiology. 2003;58:882–885.
- , , . Effect of the critical care outreach team on patient survival to discharge from hospital and readmission to critical care: non‐randomised population based study. BMJ. 2003;327:1014–1016.
- , , . Reducing mortality and avoiding preventable ICU utilization: analysis of a successful rapid response program using APR DRGs [published online ahead of print March 10, 2010]. J Healthc Qual. doi: 10.1111/j.1945‐1474.2010.00084.x.
- , , , et al. Introduction of the medical emergency team (MET) system: a cluster‐randomised control trial. Lancet. 2005;365:2091–2097.
- , , , , , . The impact of the introduction of critical care outreach services in England: a multicentre interrupted time‐series analysis. Crit Care. 2007;11:R113.
- . Rapid response systems now established at 2,900 hospitals. Hospitalist News. March 2010;3:1.
- , , , , . Rapid response teams: a systematic review and meta‐analysis. Arch Intern Med. 2010;170:18–26.
- , , , et al. Outreach and early warning systems (EWS) for the prevention of intensive care admission and death of critically ill adult patients on general hospital wards. Cochrane Database Syst Rev. 2007;3:CD005529.
- , , . Rapid‐response teams. N Engl J Med. 2011;365:139–146.
- , , . Early warning systems. Hosp Chron. 2012;7(suppl 1):37–43.
- , , , et al. Grand challenges in clinical decision support. J Biomed Inform. 2008;41(2):387–392.
- , , , et al. Utility of commonly captured data from an EHR to identify hospitalized patients at risk for clinical deterioration. AMIA Annu Symp Proc. 2007;404–408.
- , , , , , . Sensitivity of the pediatric early warning score to identify patient deterioration. Pediatrics. 2010;125(4)e763–e769.
- , , , . In‐hospital mortality after serious adverse events on medical and surgical nursing units: a mixed methods study [published online ahead of print July 24, 2012]. J Clin Nurs. doi: 10.1111/j.1365‐2702.2012.04154.x.
- , , , et al. Managing deteriorating patients: registered nurses' performance in a simulated setting. Open Nurs J. 2011;5:120–126.
Timely interventions are essential in the management of complex medical conditions such as new‐onset sepsis in order to prevent rapid progression to severe sepsis and septic shock.[1, 2, 3, 4, 5] Similarly, rapid identification and appropriate treatment of other medical and surgical conditions have been associated with improved outcomes.[6, 7, 8] We previously developed a real‐time, computerized prediction tool (PT) using recursive partitioning regression tree analysis for the identification of impending sepsis for use on general hospital wards.[9] We also showed that implementation of a real‐time computerized sepsis alert on hospital wards based on the PT resulted in increased use of early interventions, including antibiotic escalation, intravenous fluids, oxygen therapy, and diagnostics in patients identified as at risk.[10]
The first goal of this study was to develop an updated PT for use on hospital wards that could be used to predict subsequent global clinical deterioration and the need for a higher level of care. The second goal was to determine whether simply providing a real‐time alert to nursing staff based on the updated PT resulted in any demonstrable changes in patient outcomes.
METHODS
Study Location
The study was conducted at Barnes‐Jewish Hospital, a 1250‐bed academic medical center in St. Louis, Missouri. Eight adult medicine wards were assessed from July 2007 through December 2011. The medicine wards are closed areas with patient care delivered by dedicated house staff physicians under the supervision of a board‐certified attending physician. The study was approved by the Washington University School of Medicine Human Studies Committee.
Study Period
The period from July 2007 through January 2010 was used to train and retrospectively test the prediction model. The period from January 2011 through December 2011 was used to prospectively validate the model during a randomized trial using alerts generated from the prediction model.
Patients
Electronically captured clinical data were housed in a centralized clinical data repository. This repository cataloged 28,927 hospital visits from 19,116 distinct patients between July 2007 and January 2010. It contained a rich set of demographic and medical data for each of the visits, such as patient age, manually collected vital‐sign data, pharmacy data, laboratory data, and intensive care unit (ICU) transfer. This study served as a proof of concept for our vision of using machine learning to identify at‐risk patients and ultimately to perform real‐time event detection and interventions.
Algorithm Overview
Details regarding the predictive model development have been previously described.[11] To predict ICU transfer for patients housed on general medical wards, we used logistic regression, employing a novel framework to analyze the data stream from each patient, assigning scores to reflect the probability of ICU transfer to each patient.
Before building the model, several preprocessing steps were applied to eliminate outliers and find an appropriate representation of patients' states. For each of 36 input variables we specified acceptable ranges based on the domain knowledge of the medical experts on our team. For any value that was outside of the medically conceivable range, we replaced it by the mean value for that patient, if available. Values for every continuous parameter were scaled so that all measurements lay in the interval [0, 1] and were normalized by the minimum and maximum of the parameter. To capture the temporal effects in our data, we retained a sliding window of all the collected data points within the last 24 hours. We then subdivided these data into a series of 6 sequential buckets of 4 hours each.
To capture variations within a bucket, we computed 3 values for each feature in the bucket: the minimum, maximum, and mean data points. Each of the resulting 3n values was input to the logistic regression equation as separate variables. To deal with missing data points within the buckets, we used the patients' most recent reading from any time earlier in the hospital stay, if available. If no prior values existed, we used mean values calculated over the entire historical dataset. Bucket 6 max/min/mean represents the most recent 4‐hour window from the preceding 24‐hour time period for the maximum, minimum, and mean values, respectively. By itself, logistic regression does not operate on time‐series data. That is, each variable input to the logistic equation corresponds to exactly 1 data point (eg, a blood‐pressure variable would consist of a single blood‐pressure reading). In a clinical application, however, it is important to capture unusual changes in vital‐sign data over time. Such changes may precede clinical deterioration by hours, providing a chance to intervene if detected early enough. In addition, not all readings in time‐series data should be treated equally; the value of some kinds of data may change depending on their age. For example, a patient's condition may be better reflected by a blood‐oxygenation reading collected 1 hour ago than a reading collected 12 hours ago. This is the rationale for our use of a sliding window of all collected data points within the last 24 hours performed in a real‐time basis.
The algorithm was first implemented in MATLAB (Natick, MA). For the purposes of training, we used a single 24‐hour window of data from each patient. For patients admitted to ICU, this window was 26 hours to 2 hours prior to ICU admission; for all other patients, this window consisted of the first 24 hours of their hospital stay. The dataset's 36 input variables were divided into buckets and min/mean/max features wherever applicable, resulting in 398 variables. The first half of the dataset was used to train the model. We then used the second half of the dataset as the validation dataset. We generated a predicted outcome for each case in the validation data, using the model parameter coefficients derived from the training data. We also employed bootstrap aggregation to improve classification accuracy and to address overfitting. We then applied various threshold cut‐points to convert these predictions into binary values and compared the results against the ICU transfer outcome. A threshold of 0.9760 for specificity was chosen to achieve a sensitivity of approximately 40%. These operating characteristics were chosen in turn to generate a manageable number of alerts per hospital nursing unit per day (estimated at 12 per nursing unit per day). At this cut‐point the C‐statistic was 0.8834, with an overall accuracy of 0.9292.
In order to train the logistic model, we used a single 24‐hour window of data for each patient. However, in a system that predicts patients' outcomes in real time, scores are recomputed each time new data are entered into the database. Hence, patients have a series of scores over the length of their hospital stay, and an alert is triggered when any one of these scores is above the chosen threshold.
Once the model was developed, we implemented it in an internally developed, Java‐based clinical decision support rules engine, which identified when new data relevant to the model were available in a real‐time central data repository. The rules engine queried the data repository to acquire all data needed to evaluate the model. The score was calculated with each relevant new data point, and an alert was generated when the score exceeded the cut‐point threshold. We then prospectively validated these alerts on patients on 8 general medical wards at Barnes Jewish Hospital. Details regarding the architecture of our clinical decision support system have been previously published.[12] The sensitivity and positive predictive values for ICU transfer for these alerts were tracked during an intervention trial that ran from January 24, 2011, through December 31, 2011. Four general medical wards were randomized to the intervention group and 4 wards were randomized to the control group. The 8 general medical wards were ordered according to their alert rates based upon the historical data from July 2007 through January 2010, creating 4 pairs of wards in ascending order of alert rate. Within each of the 4 pairs, 1 member of the pair was randomized to the intervention group and the other to the control group using a random number generator.
Real‐time automated alerts generated 24 hours per day, 7 days per week from the predictive algorithm were sent to the charge‐nurse pager on the intervention units. Alerts were also generated and stored in the database on the control units, but these alerts were not sent to the charge nurse on those units. The alerts were sent to the charge nurses on the respective wards, as these individuals were thought to be in the best position to perform the initial assessment of the alerted patients, especially during evening hours when physician staffing was reduced. The charge nurses assessed the intervention‐group patients and were instructed to contact the responsible physician (hospitalist or internal medicine house officer) to inform them of the alert, or to call the rapid response team (RRT) if the patient's condition already appeared to be significantly deteriorating.
Descriptive statistics for algorithm sensitivity and positive predictive value and for patient outcomes were performed. Associations between alerts and the primary outcome, ICU transfer, were determined, as well as the impact of alerts in the intervention group compared with the control group, using [2] tests. The same analyses were performed for patient death. Differences in length of stay (LOS) were assessed using the Wilcoxon rank sum test.
RESULTS
Predictive Model
The variables with the greatest coefficients contributing to the PT model included respiratory rate, oxygen saturation, shock index, systolic blood pressure, anticoagulation use, heart rate, and diastolic blood pressure. A complete list of variables is provided in the Appendix (see Supporting Information in the online version of this article). All but 1 are routinely collected vital‐sign measures, and all but 1 occur in the 4‐hour period immediately prior to the alert (bucket 6).
Prospective Trial
Patient characteristics are presented in Table 1. Patients were well matched for race, sex, age, and underlying diagnoses. All alerts reported to the charge nurses were to be associated with a call from the charge nurse to the responsible physician caring for the alerted patient. The mean number of alerts per alerted patient was 1.8 (standard deviation=1.7). Patients meeting the alert threshold were at nearly 5.3‐fold greater risk of ICU transfer (95% confidence interval [CI]: 4.6‐6.0) than those not satisfying the alert threshold (358 of 2353 [15.2%; 95% CI: 13.8%‐16.7%] vs 512 of 17678 [2.9%; 95% CI: 2.7%‐3.2%], respectively; P<0.0001). Patients with alerts were at 8.9‐fold greater risk of death (95% CI: 7.4‐10.7) than those without alerts (244 of 2353 [10.4%; 95% CI: 9.2%‐11.7%] vs 206 of 17678 [1.2%; 95% CI: 1.0%‐1.3%], respectively; P<0.0001). Operating characteristics of the PT from the prospective trial are shown in Table 2. Alerts occurred a median of 25.5 hours prior to ICU transfer (interquartile range, 7.00‐81.75) and 8 hours prior to death (interquartile range, 4.09‐15.66).
| Study Group | ||||||
|---|---|---|---|---|---|---|
| Control (N=10,120) | Intervention (N=9911) | |||||
| ||||||
| Race | N | % | N | % | ||
| White | 5,062 | 50 | 4,934 | 50 | ||
| Black | 4,864 | 48 | 4,790 | 48 | ||
| Other | 194 | 2 | 187 | 2 | ||
| Sex | ||||||
| F | 5,355 | 53 | 5,308 | 54 | ||
| M | 4,765 | 47 | 4,603 | 46 | ||
| Age at discharge, median (IQR), y | 57 (4469) | 57 (4470) | ||||
| Top 10 ICD‐9 descriptions and counts, n (%) | ||||||
| 1 | Diseases of the digestive system | 1,774 (17.5) | Diseases of the digestive system | 1,664 (16.7) | ||
| 2 | Diseases of the circulatory system | 1,252 (12.4) | Diseases of the circulatory system | 1,253 (12.6) | ||
| 3 | Diseases of the respiratory system | 1,236 (12.2) | Diseases of the respiratory system | 1,210 (12.2) | ||
| 4 | Injury and poisoning | 864 (8.5) | Injury and poisoning | 849 (8.6) | ||
| 5 | Endocrine, nutritional, and metabolic diseases, and immunity disorders | 797 (7.9) | Diseases of the genitourinary system | 795 (8.0) | ||
| 6 | Diseases of the genitourinary system | 762 (7.5) | Endocrine, nutritional, and metabolic diseases, and immunity disorders | 780 (7.9) | ||
| 7 | Infectious and parasitic diseases | 555 (5.5) | Infectious and parasitic diseases | 549 (5.5) | ||
| 8 | Neoplasms | 547 (5.4) | Neoplasms | 465 (4.7) | ||
| 9 | Diseases of the blood and blood‐forming organs | 426 (4.2) | Diseases of the blood and blood‐forming organs | 429 (4.3) | ||
| 10 | Symptoms, signs, and ill‐defined conditions and factors influencing health status | 410 (4.1) | Diseases of the musculoskeletal system and connective tissue | 399 (4.0) | ||
| Sensitivity, % | Specificity, % | PPV, % | NPV, % | Positive Likelihood Ratio | Negative Likelihood Ratio | |||
|---|---|---|---|---|---|---|---|---|
| ||||||||
| ICU Transfer | Yes (N=870) | No (N=19,161) | ||||||
| Alert | 358 | 1,995 | 41.1 (95% CI: 37.944.5) | 89.6 (95% CI: 89.290.0) | 15.2 (95% CI: 13.816.7) | 97.1 (95% CI: 96.897.3) | 3.95 (95% CI: 3.614.30) | 0.66 (95% CI: 0.620.70) |
| No Alert | 512 | 17,166 | ||||||
| Death | Yes (N=450) | No (N=19,581) | ||||||
| Alert | 244 | 2109 | 54.2 (95% CI: 49.658.8) | 89.2 (95% CI: 88.889.7) | 10.4 (95% CI: 9.211.7) | 98.8 (95% CI: 98.799.0) | 5.03 (95% CI: 4.585.53) | 0.51 (95% CI: 0.460.57) |
| No Alert | 206 | 17,472 | ||||||
Among patients identified by the PT, there were no differences in the proportion of patients who were transferred to the ICU or who died in the intervention group as compared with the control group (Table 3). In addition, although there was no difference in LOS in the intervention group compared with the control group, identification by the PT was associated with a significantly longer median LOS (7.01 days vs 2.94 days, P<0.001). The largest numbers of patients who were transferred to the ICU or died did so in the first hospital day, and 60% of patients who were transferred to the ICU did so in the first 4 days, whereas deaths were more evenly distributed across the hospital stay.
| Outcomes by Alert Statusa | ||||||||
|---|---|---|---|---|---|---|---|---|
| Alert Study Group | No‐Alert Study Group | |||||||
| Intervention, N=1194 | Control, N=1159 | Intervention, N=8717 | Control, N=8961 | |||||
| N | % | N | % | N | % | N | % | |
| ||||||||
| ICU Transfer | ||||||||
| Yes | 192 | 16 | 166 | 14 | 252 | 3 | 260 | 3 |
| No | 1002 | 84 | 993 | 86 | 8465 | 97 | 8701 | 97 |
| Death | ||||||||
| Yes | 127 | 11 | 117 | 10 | 96 | 1 | 110 | 1 |
| No | 1067 | 89 | 1042 | 90 | 8621 | 99 | 8851 | 99 |
| LOS from admit to discharge, median (IQR), da | 7.07 (3.9912.15) | 6.92 (3.8212.67) | 2.97 (1.775.33) | 2.91 (1.745.19) | ||||
DISCUSSION
We have demonstrated that a relatively simple hospital‐specific method for generating a PT derived from routine laboratory and hemodynamic values is capable of predicting clinical deterioration and the need for ICU transfer, as well as hospital mortality, in non‐ICU patients admitted to general hospital wards. We also found that the PT identified a sicker patient population as manifest by longer hospital LOS. The methods used in generating this real‐time PT are relatively simple and easily executed with the use of an electronic medical record (EMR) system. However, our data also showed that simply providing an alert to nursing units based on the PT did not result in any demonstrable improvement in patient outcomes. Moreover, our PT and intervention in their current form have substantial limitations, including low sensitivity and positive predictive value, high possibility of alert fatigue, and no clear clinical impact. These limitations suggest that this approach has limited applicability in its current form.
Unplanned ICU transfers occurring as early as within 8 hours of hospitalization are relatively common and associated with increased mortality.[13] Bapoje et al evaluated a total of 152 patients over 1 year who had unplanned ICU transfers.[14] The most common reason was worsening of the problem for which the patient was admitted (48%). Other investigators have also attempted to identify predictors for clinical deterioration resulting in unplanned ICU transfer that could be employed in a PT or early warning system (EWS). Keller et al evaluated 50 consecutive general medical patients with unplanned ICU transfers between 2003 and 2004.[15] Using a case‐control methodology, these investigators found shock index values>0.85 to be the best predictor for subsequent unplanned ICU transfer (P<0.02; odds ratio: 3.0).
Organizations such as the Institute for Healthcare Improvement have called for the development and implementation of EWSs in order to direct the activities of RRTs and improve outcomes.[16] Escobar et al carried out a retrospective case‐control study using as the unit of analysis 12‐hour patient shifts on hospital wards.[17] Using logistic regression and split validation, they developed a PT for ICU transfer from clinical variables available in their EMR. The EMR derived PT had a C‐statistic of 0.845 in the derivation dataset and 0.775 in the validation dataset, concluding that EMR‐based detection of impending deterioration outside the ICU is feasible in integrated healthcare delivery systems.
We found that simply providing an alert to nursing units did not result in any demonstrable improvements in the outcomes of high‐risk patients identified by our PT. This may have been due to simply relying on the alerted nursing staff to make phone calls to physicians and not linking a specific and effective patient‐directed intervention to the PT. Other investigators have similarly observed that the use of an EWS or PT may not result in outcome improvements.[18] Gao et al performed an analysis of 31 studies describing hospital track and trigger EWSs.[19] They found little evidence of reliability, validity, and utility of these systems. Peebles et al showed that even when high‐risk non‐ICU patients are identified, delays in providing appropriate therapies occur, which may explain the lack of efficacy of EWSs and RRTs.[20] These observations suggest that there is currently a paucity of validated interventions available to improve outcome in deteriorating patients, despite our ability to identify patients who are at risk for such deterioration.
As a result of mandates from quality‐improvement organizations, most US hospitals currently employ RRTs for emergent mobilization of resources when a clinically deteriorating patient is identified on a hospital ward.[21] However, as noted above, there is limited evidence to suggest that RRTs contribute to improved patient outcomes.[22, 23, 24, 25, 26, 27] The potential importance of this is reflected in a recent report suggesting that 2900 US hospitals now have rapid‐response systems in place without clear demonstration of their overall efficacy.[28] Linking rapid‐response interventions with a validated real‐time alert may represent a way of improving the effectiveness of such interventions.[29, 30, 31, 32, 33, 34] Our data showed that hospital LOS was statistically longer among alerted patients compared with nonalerted patients. This supports the conclusion that the alerts helped identify a sicker group of patients, but the nursing alerts did not appear to change outcomes. This finding also seems to refute the hypothesis that simply linking an intervention to a PT will improve outcomes, albeit the intervention we employed may not have been robust enough to influence patient outcomes.
The development of accurate real‐time EWSs holds the potential to identify patients at risk for clinical deterioration at an earlier point in time when rescue interventions can be implemented in a potentially more effective manner in both adults and children.[35] Unfortunately, the ideal intervention to be applied in this situation is unknown. Our experience suggests that successful interventions will require a more integrated approach than simply providing an alert with general management principles. As a result of our experience, we are undertaking a randomized clinical trial in 2013 to determine whether linking a patient‐specific intervention to a PT will result in improved outcomes. The intervention we will be testing is to have the RRT immediately notified about alerted patients so as to formally evaluate them and to determine the need for therapeutic interventions, and to administer such interventions as needed and/or transfer the alerted patients to a higher level of care as deemed necessary. Additionally, we are updating our PT with more temporal data to determine if this will improve its accuracy. One of these updates will include linking the PT to wirelessly obtained continuous oximetry and heart‐rate data, using minimally intrusive sensors, to establish a 2‐tiered EWS.[11]
Our study has several important limitations. First, the PT was developed using local data, and thus the results may not be applicable to other settings. However, our model shares many of the characteristics identified in other clinical‐deterioration PTs.[15, 17] Second, the positive prediction value of 15.2% for ICU transfer may not be clinically useful due to the large number of false‐positive results. Moreover, the large number of false positives could result in alert fatigue, causing alerts to be ignored. Third, although the charge nurses were supposed to call the responsible physicians for the alerted patients, we did not determine whether all these calls occurred or whether they resulted in any meaningful changes in monitoring or patient treatment. This is important because lack of an effective intervention or treatment would make the intervention group much more like our control group. Future studies are needed to assess the impact of an integrated intervention (eg, notification of experienced RRT members with adequate resource access) to determine if patient outcomes can be impacted by the use of an EWS. Finally, we did not compare the performance of our PT to other models such as the modified early warning score (MEWS).
An additional limitation to consider is that our PT offered no new information to the nurse manager, or the PT did not change the opinions of the charge nurses. This is supported by a recent study of 63 serious adverse outcomes in a Belgian teaching hospital where death was the final outcome.[36] Survey results revealed that nurses were often unaware that their patients were deteriorating before the crisis. Nurses also reported threshold levels for concern for abnormal vital signs that suggested they would call for assistance relatively late in clinical crises. The limited ability of nursing staff to identify deteriorating patients is also supported by a recent simulation study demonstrating that nurses did identify that patients were deteriorating, but as each patient deteriorated staff performance declined, with a reduction in all observational records and actions.[37]
In summary, we have demonstrated that a relatively simple hospital‐specific PT could accurately identify patients on general medicine wards who subsequently developed clinical deterioration and the need for ICU transfer, as well as hospital mortality. However, no improvements in patient outcomes were found from reporting this information to nursing wards on a real‐time basis. The low positive predictive value of the alerts, local development of the EWS, and absence of improved outcomes substantially limits the broader application of this system in its current form. Continued efforts are needed to identify and implement systems that will not only accurately identify high‐risk patients on general wards but also intervene to improve their outcomes.
Acknowledgments
Disclosures: This study was funded in part by the Barnes‐Jewish Hospital Foundation and by Grant No. UL1 RR024992 from the National Center for Research Resources (NCRR), a component of the National Institutes of Health (NIH), and the NIH Roadmap for Medical Research. Its contents are solely the responsibility of the authors and do not necessarily represent the official view of NCRR or NIH.
- , , , et al. Improvement in process of care and outcome after a multicenter severe sepsis educational program in Spain. JAMA. 2008;299:2294–2303.
- , , , et al. Early goal‐directed therapy in the treatment of severe sepsis and septic shock. N Engl J Med. 2001;345:1368–1377.
- , , , et al. Before‐after study of a standardized hospital order set for the management of septic shock. Crit Care Med. 2007;34:2707–2713.
- , , . Surviving Sepsis Campaign: international guidelines for management of severe sepsis and septic shock: 2008. Crit Care Med. 2008;36:296–327.
- , , , et al. Septic shock: an analysis of outcomes for patients with onset on hospital wards versus intensive care units. Crit Care Med. 1998;26:1020–1024.
- , , , , . Inpatient transfers to the intensive care unit: delays are associated with increased mortality and morbidity. J Gen Intern Med. 2003;18:77–83.
- , , , , , . Causes and effects of surgical delay in patients with hip fracture: a cohort study. Ann Intern Med. 2011;155:226–233.
- , , , . Comprehensive stroke centers overcome the weekend versus weekday gap in stroke treatment and mortality. Stroke. 2011;42:2403–2409.
- , , , , , . Hospital‐wide impact of a standardized order set for the management of bacteremic severe sepsis. Crit Care Med. 2009;37:819–824.
- , , , et al. Implementation of a real‐time computerized sepsis alert in non–intensive care unit patients. Crit Care Med. 2011;39:469–473.
- , , , et al. Toward a two‐tier clinical warning system for hospitalized patients. AMIA Annu Symp Proc. 2011;2011:511–519.
- , , , , , . Migrating toward a next‐generation clinical decision support application: the BJC HealthCare experience. AMIA Annu Symp Proc. 2007;344–348.
- , , , . Adverse outcomes associated with delayed intensive care unit transfers in an integrated healthcare system. J Hosp Med. 2011;7:224–230.
- , , , . Unplanned transfers to a medical intensive care unit: causes and relationship to preventable errors in care. J Hosp Med. 2011;6:68–72.
- , , , , , . Unplanned transfers to the intensive care unit: the role of the shock index. J Hosp Med. 2010;5:460–465.
- Institute for Healthcare Improvement. Early warning systems: the next level of rapid response. Available at: http://www.ihi.org/IHI/Programs/AudioAndWebPrograms/ExpeditionEarlyWarningSystemsTheNextLevelofRapidResponse.htmplayerwmp. Accessed April 6, 2011.
- , , , , , . Early detection of impending physiologic deterioration among patients who are not in intensive care: development of predictive models using data from an automated electronic medical record. J Hosp Med. 2012;7:388–395.
- , , . Early warning systems: the next level of rapid response. Nursing. 2012;42:38–44.
- , , , et al. Systematic review and evaluation of physiological track and trigger warning systems for identifying at‐risk patients on the ward. Intensive Care Med. 2007;33:667–679.
- , , , . Timing and teamwork—an observational pilot study of patients referred to a Rapid Response Team with the aim of identifying factors amenable to re‐design of a Rapid Response System. Resuscitation. 2012;83:782–787.
- , , , . Rapid response: a quality improvement conundrum. J Hosp Med. 2009;4:255–257.
- , , , et al. Introducing critical care outreach: a ward‐randomised trial of phased introduction in a general hospital. Intensive Care Med. 2004;30:1398–1404.
- . Out of our reach? Assessing the impact of introducing critical care outreach service. Anaesthesiology. 2003;58:882–885.
- , , . Effect of the critical care outreach team on patient survival to discharge from hospital and readmission to critical care: non‐randomised population based study. BMJ. 2003;327:1014–1016.
- , , . Reducing mortality and avoiding preventable ICU utilization: analysis of a successful rapid response program using APR DRGs [published online ahead of print March 10, 2010]. J Healthc Qual. doi: 10.1111/j.1945‐1474.2010.00084.x.
- , , , et al. Introduction of the medical emergency team (MET) system: a cluster‐randomised control trial. Lancet. 2005;365:2091–2097.
- , , , , , . The impact of the introduction of critical care outreach services in England: a multicentre interrupted time‐series analysis. Crit Care. 2007;11:R113.
- . Rapid response systems now established at 2,900 hospitals. Hospitalist News. March 2010;3:1.
- , , , , . Rapid response teams: a systematic review and meta‐analysis. Arch Intern Med. 2010;170:18–26.
- , , , et al. Outreach and early warning systems (EWS) for the prevention of intensive care admission and death of critically ill adult patients on general hospital wards. Cochrane Database Syst Rev. 2007;3:CD005529.
- , , . Rapid‐response teams. N Engl J Med. 2011;365:139–146.
- , , . Early warning systems. Hosp Chron. 2012;7(suppl 1):37–43.
- , , , et al. Grand challenges in clinical decision support. J Biomed Inform. 2008;41(2):387–392.
- , , , et al. Utility of commonly captured data from an EHR to identify hospitalized patients at risk for clinical deterioration. AMIA Annu Symp Proc. 2007;404–408.
- , , , , , . Sensitivity of the pediatric early warning score to identify patient deterioration. Pediatrics. 2010;125(4)e763–e769.
- , , , . In‐hospital mortality after serious adverse events on medical and surgical nursing units: a mixed methods study [published online ahead of print July 24, 2012]. J Clin Nurs. doi: 10.1111/j.1365‐2702.2012.04154.x.
- , , , et al. Managing deteriorating patients: registered nurses' performance in a simulated setting. Open Nurs J. 2011;5:120–126.
Copyright © 2013 Society of Hospital Medicine