User login
Thousands of hospitals have implemented rapid response systems in recent years in attempts to reduce mortality outside the intensive care unit (ICU).1 These systems have 2 components, a response arm and an identification arm. The response arm is usually comprised of a multidisciplinary critical care team that responds to calls for urgent assistance outside the ICU; this team is often called a rapid response team or a medical emergency team. The identification arm comes in 2 forms, predictive and detective. Predictive tools estimate a patient's risk of deterioration over time based on factors that are not rapidly changing, such as elements of the patient's history. In contrast, detective tools include highly time‐varying signs of active deterioration, such as vital sign abnormalities.2 To date, most pediatric studies have focused on developing detective tools, including several early warning scores.38
In this study, we sought to identify the characteristics that increase the probability that a hospitalized child will deteriorate, and combine these characteristics into a predictive score. Tools like this may be helpful in identifying and triaging the subset of high‐risk children who should be intensively monitored for early signs of deterioration at the time of admission, as well as in identifying very low‐risk children who, in the absence of other clinical concerns, may be monitored less intensively.
METHODS
Detailed methods, including the inclusion/exclusion criteria, the matching procedures, and a full description of the statistical analysis are provided as an appendix (see Supporting Online Appendix: Supplement to Methods Section in the online version of this article). An abbreviated version follows.
Design
We performed a case‐control study among children, younger than 18 years old, hospitalized for >24 hours between January 1, 2005 and December 31, 2008. The case group consisted of children who experienced clinical deterioration, a composite outcome defined as cardiopulmonary arrest (CPA), acute respiratory compromise (ARC), or urgent ICU transfer, while on a non‐ICU unit. ICU transfers were considered urgent if they included at least one of the following outcomes in the 12 hours after transfer: death, CPA, intubation, initiation of noninvasive ventilation, or administration of a vasoactive medication infusion used for the treatment of shock. The control group consisted of a random sample of patients matched 3:1 to cases if they met the criteria of being on a non‐ICU unit at the same time as their matched case.
Variables and Measurements
We collected data on demographics, complex chronic conditions (CCCs), other patient characteristics, and laboratory studies. CCCs were specific diagnoses divided into the following 9 categories according to an established framework: neuromuscular, cardiovascular, respiratory, renal, gastrointestinal, hematologic/emmmunologic, metabolic, malignancy, and genetic/congenital defects.9 Other patient characteristics evaluated included age, weight‐for‐age, gestational age, history of transplant, time from hospital admission to event, recent ICU stays, administration of total parenteral nutrition, use of a patient‐controlled analgesia pump, and presence of medical devices including central venous lines and enteral tubes (naso‐gastric, gastrostomy, or jejunostomy).
Laboratory studies evaluated included hemoglobin value, white blood cell count, and blood culture drawn in the preceding 72 hours. We included these laboratory studies in this predictive score because we hypothesized that they represented factors that increased a child's risk of deterioration over time, as opposed to signs of acute deterioration that would be more appropriate for a detective score.
Statistical Analysis
We used conditional logistic regression for the bivariable and multivariable analyses to account for the matching. We derived the predictive score using an established method10 in which the regression coefficients for each covariate were divided by the smallest coefficient, and then rounded to the nearest integer, to establish each variable's sub‐score. We grouped the total scores into very low, low, intermediate, and high‐risk groups, calculated overall stratum‐specific likelihood ratios (SSLRs), and estimated stratum‐specific probabilities of deterioration for each group.
RESULTS
Patient Characteristics
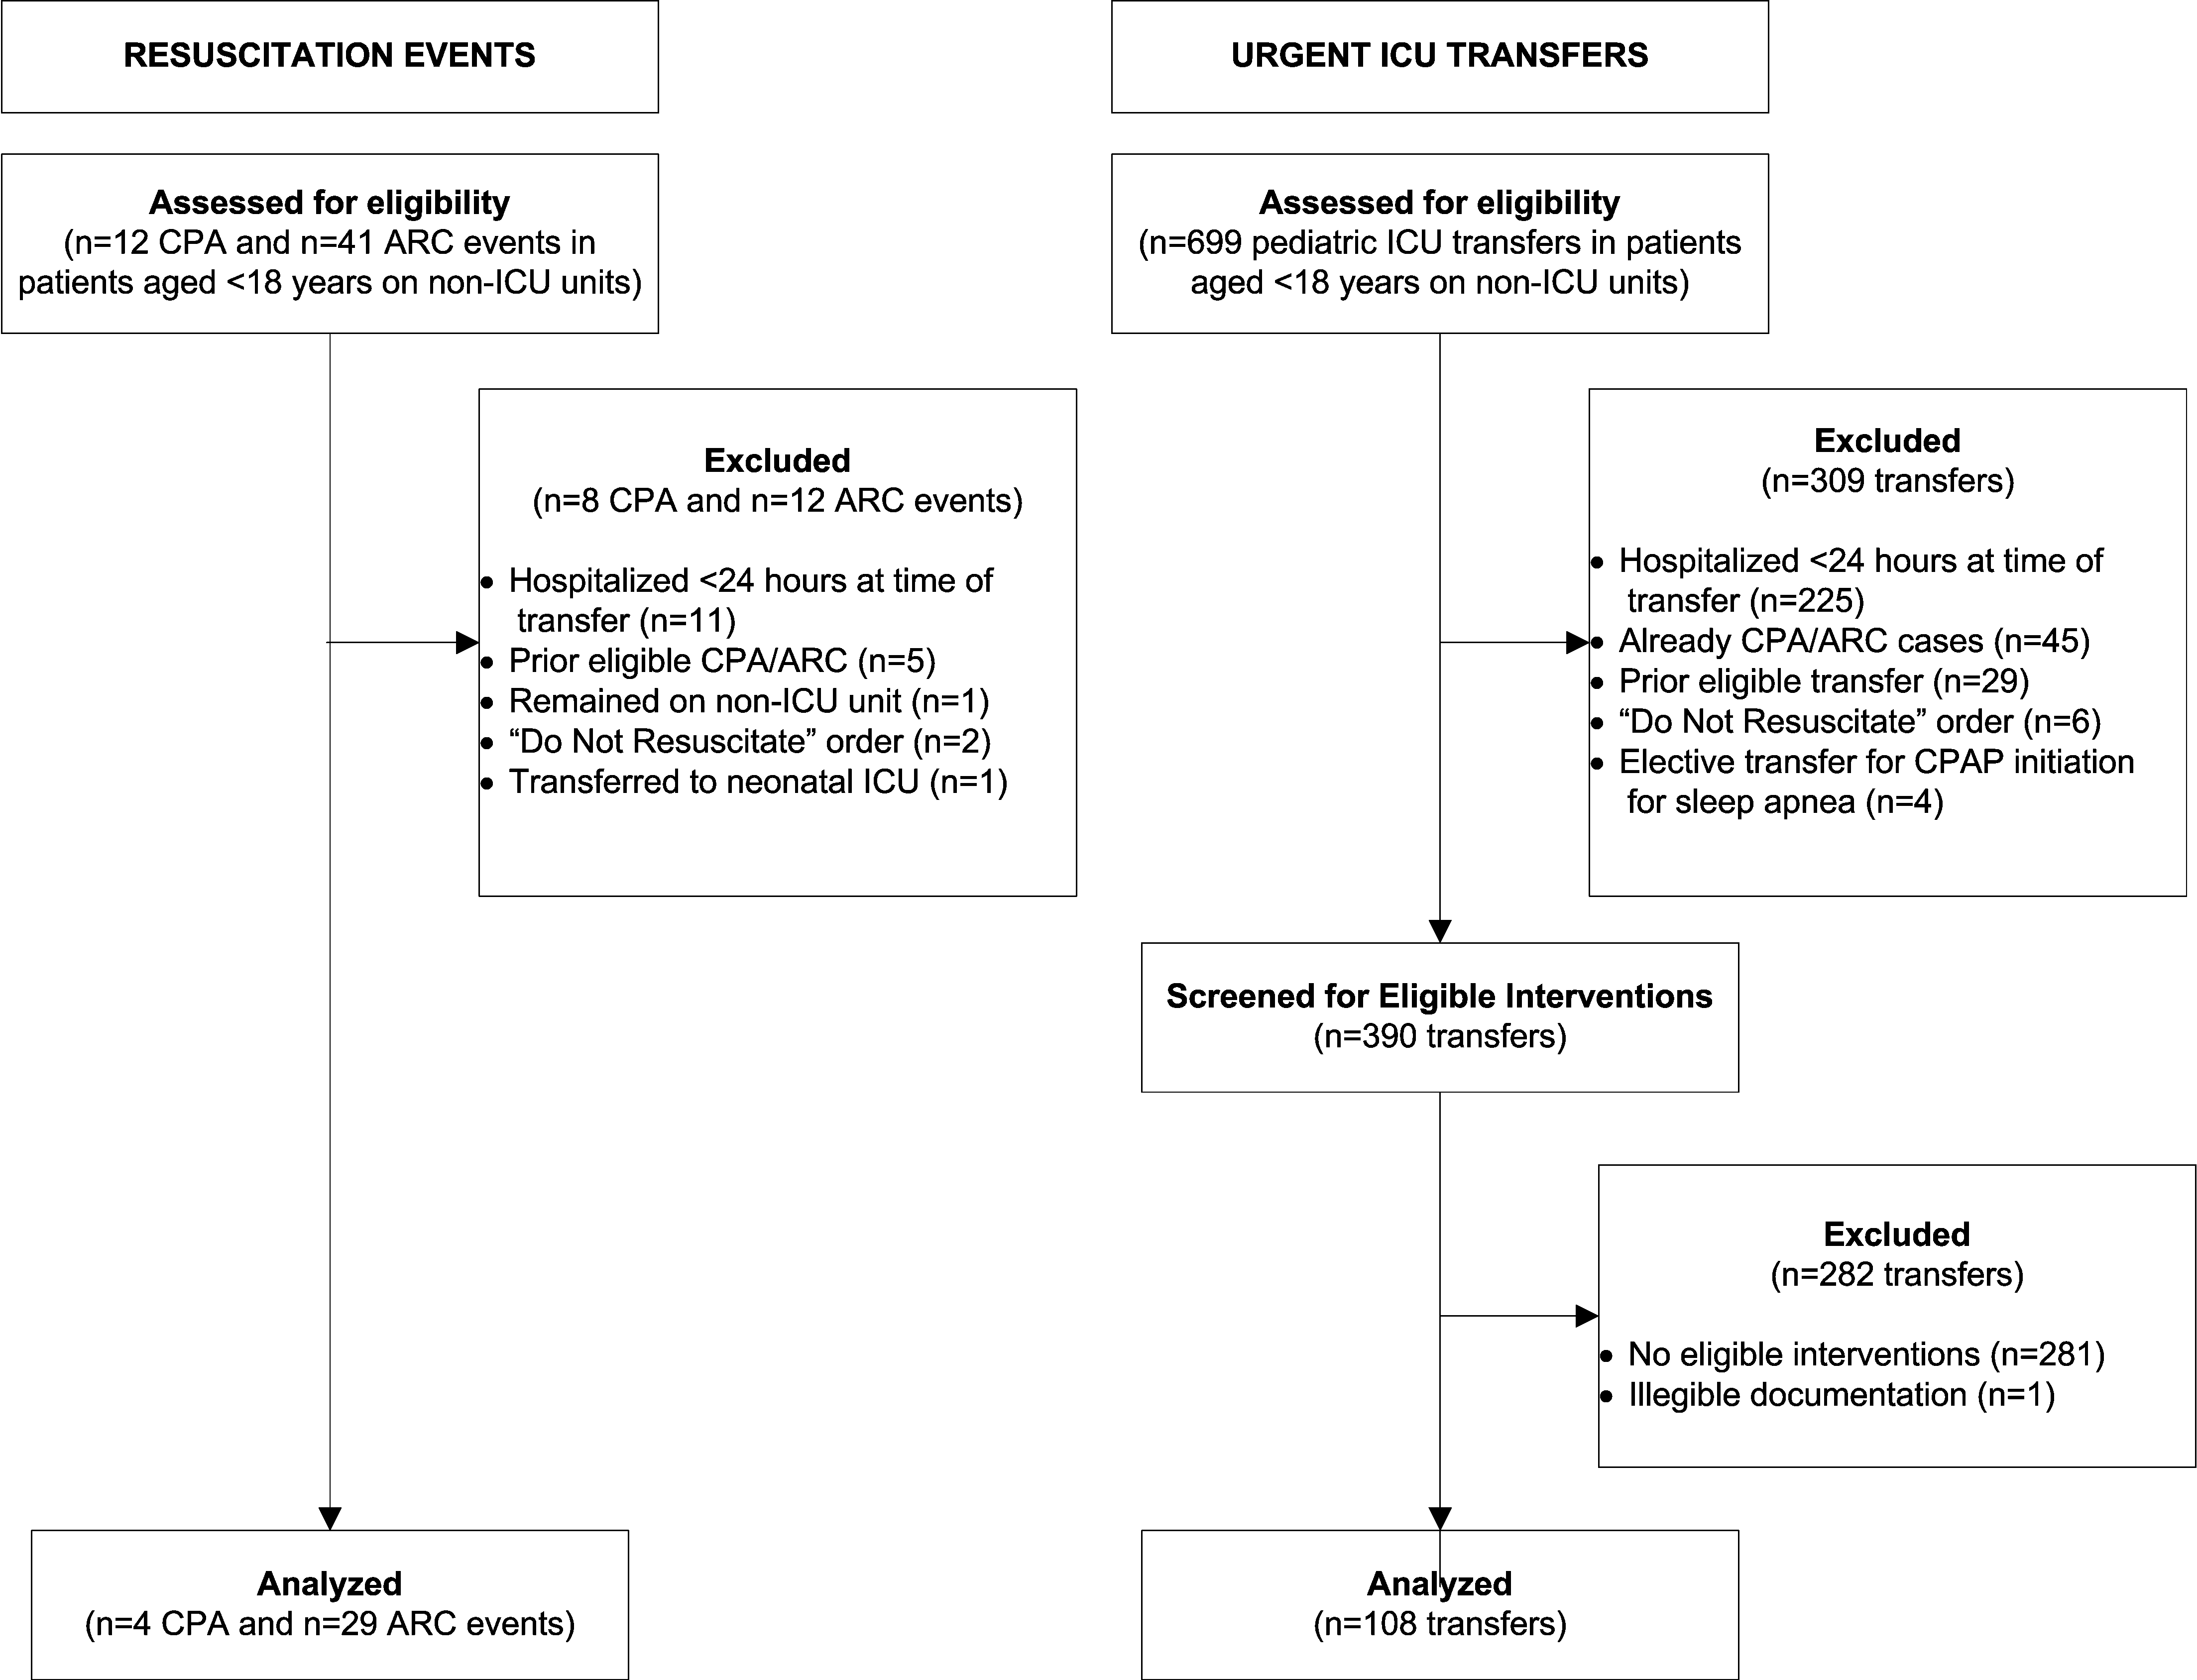
We identified 12 CPAs, 41 ARCs, and 699 urgent ICU transfers during the study period. A total of 141 cases met our strict criteria for inclusion (see Figure in Supporting Online Appendix: Supplement to Methods Section in the online version of this article) among approximately 96,000 admissions during the study period, making the baseline incidence of events (pre‐test probability) approximately 0.15%. The case and control groups were similar in age, sex, and family‐reported race/ethnicity. Cases had been hospitalized longer than controls at the time of their event, were less likely to have been on a surgical service, and were less likely to survive to hospital discharge (Table 1). There was a high prevalence of CCCs among both cases and controls; 78% of cases and 52% of controls had at least 1 CCC.
| Cases (n = 141) | Controls (n = 423) | ||
|---|---|---|---|
| n (%) | n (%) | P Value | |
| |||
| Type of event | |||
| Cardiopulmonary arrest | 4 (3) | 0 | NA |
| Acute respiratory compromise | 29 (20) | 0 | NA |
| Urgent ICU transfer | 108 (77) | 0 | NA |
| Demographics | |||
| Age | 0.34 | ||
| 0‐<6 mo | 17 (12) | 62 (15) | |
| 6‐<12 mo | 22 (16) | 41 (10) | |
| 1‐<4 yr | 34 (24) | 97 (23) | |
| 4‐<10 yr | 26 (18) | 78 (18) | |
| 10‐<18 yr | 42 (30) | 145 (34) | |
| Sex | 0.70 | ||
| Female | 60 (43) | 188 (44) | |
| Male | 81 (57) | 235 (56) | |
| Race | 0.40 | ||
| White | 69 (49) | 189 (45) | |
| Black/African‐American | 49 (35) | 163 (38) | |
| Asian/Pacific Islander | 0 (0) | 7 (2) | |
| Other | 23 (16) | 62 (15) | |
| Not reported | 0 (0) | 2 (<1) | |
| Ethnicity | 0.53 | ||
| Non‐Hispanic | 127 (90) | 388 (92) | |
| Hispanic | 14 (10) | 33 (8) | |
| Unknown/not reported | 0 (0) | 2 (<1) | |
| Hospitalization | |||
| Length of stay in days, median (interquartile range) | 7.8 (2.6‐18.2) | 3.9 (1.9‐11.2) | <0.001 |
| Surgical service | 4 (3) | 67 (16) | <0.001 |
| Survived to hospital discharge | 107 (76) | 421 (99.5) | <0.001 |
Unadjusted (Bivariable) Analysis
Results of bivariable analysis are shown in Table 2.
| Variable | Cases n (%) | Controls n (%) | OR* | 95% CI | P Value |
|---|---|---|---|---|---|
| |||||
| Complex chronic conditions categories | |||||
| Congenital/genetic | 19 (13) | 21 (5) | 3.0 | 1.6‐5.8 | 0.001 |
| Neuromuscular | 31 (22) | 48 (11) | 2.2 | 1.3‐3.7 | 0.002 |
| Respiratory | 18 (13) | 27 (6) | 2.0 | 1.1‐3.7 | 0.02 |
| Cardiovascular | 15 (10) | 24 (6) | 2.0 | 1.0‐3.9 | 0.05 |
| Metabolic | 5 (3) | 6 (1) | 2.5 | 0.8‐8.2 | 0.13 |
| Gastrointestinal | 10 (7) | 24 (6) | 1.3 | 0.6‐2.7 | 0.54 |
| Renal | 3 (2) | 8 (2) | 1.1 | 0.3‐4.2 | 0.86 |
| Hematology/emmmunodeficiency | 6 (4) | 19 (4) | 0.9 | 0.4‐2.4 | 0.91 |
| Specific conditions | |||||
| Mental retardation | 21 (15) | 25 (6) | 2.7 | 1.5‐4.9 | 0.001 |
| Malignancy | 49 (35) | 90 (21) | 1.9 | 1.3‐2.8 | 0.002 |
| Epilepsy | 22 (15) | 30 (7) | 2.4 | 1.3‐4.3 | 0.004 |
| Cardiac malformations | 14 (10) | 19 (4) | 2.2 | 1.1‐4.4 | 0.02 |
| Chronic respiratory disease arising in the perinatal period | 11 (8) | 15 (4) | 2.2 | 1.0‐4.8 | 0.05 |
| Cerebral palsy | 7 (5) | 13 (3) | 1.7 | 0.6‐4.2 | 0.30 |
| Cystic fibrosis | 1 (1) | 9 (2) | 0.3 | <0.1‐2.6 | 0.30 |
| Other patient characteristics | |||||
| Time from hospital admission to event 7 days | 74 (52) | 146 (35) | 2.1 | 1.4‐3.1 | <0.001 |
| History of any transplant | 27 (19) | 17 (4) | 5.7 | 2.9‐11.1 | <0.001 |
| Enteral tube | 65 (46) | 102 (24) | 2.6 | 1.8‐3.9 | <0.001 |
| Hospitalized in an intensive care unit during the same admission | 43 (31) | 77 (18) | 2.0 | 1.3‐3.1 | 0.002 |
| Administration of TPN in preceding 24 hr | 26 (18) | 36 (9) | 2.3 | 1.4‐3.9 | 0.002 |
| Administration of an opioid via a patient‐controlled analgesia pump in the preceding 24 hr | 14 (9) | 14 (3) | 3.6 | 1.6‐8.3 | 0.002 |
| Weight‐for‐age <5th percentile | 49 (35) | 94 (22) | 1.9 | 1.2‐2.9 | 0.003 |
| Central venous line | 55 (39) | 113 (27) | 1.8 | 1.2‐2.7 | 0.005 |
| Age <1 yr | 39 (28) | 103 (24) | 1.2 | 0.8‐1.9 | 0.42 |
| Gestational age <37 wk or documentation of prematurity | 21 (15) | 60 (14) | 1.1 | 0.6‐1.8 | 0.84 |
| Laboratory studies | |||||
| Hemoglobin in preceding 72 hr | |||||
| Not tested | 28 (20) | 190 (45) | 1.0 | [reference] | |
| 10 g/dL | 42 (30) | 144 (34) | 2.0 | 1.2‐3.5 | 0.01 |
| <10 g/dL | 71 (50) | 89 (21) | 5.6 | 3.3‐9.5 | <0.001 |
| White blood cell count in preceding 72 hr | |||||
| Not tested | 28 (20) | 190 (45) | 1.0 | [reference] | |
| 5000 to <15,000/l | 45 (32) | 131 (31) | 2.4 | 1.4‐4.1 | 0.001 |
| 15,000/l | 19 (13) | 25 (6) | 5.7 | 2.7‐12.0 | <0.001 |
| <5000/l | 49 (35) | 77 (18) | 4.5 | 2.6‐7.8 | <0.001 |
| Blood culture drawn in preceding 72 hr | 78 (55) | 85 (20) | 5.2 | 3.3‐8.1 | <0.001 |
Adjusted (Multivariable) Analysis
The multivariable conditional logistic regression model included 7 independent risk factors for deterioration (Table 3): age <1 year, epilepsy, congenital/genetic defects, history of transplant, enteral tubes, hemoglobin <10 g/dL, and blood culture drawn in the preceding 72 hours.
| Predictor | Adjusted OR (95% CI) | P Value | Regression Coefficient (95% CI) | Score* |
|---|---|---|---|---|
| ||||
| Age <1 yr | 1.9 (1.0‐3.4) | 0.038 | 0.6 (<0.1‐1.2) | 1 |
| Epilepsy | 4.4 (1.9‐9.8) | <0.001 | 1.5 (0.7‐2.3) | 2 |
| Congenital/genetic defects | 2.1 (0.9‐4.9) | 0.075 | 0.8 (0.1‐1.6) | 1 |
| History of any transplant | 3.0 (1.3‐6.9) | 0.010 | 1.1 (0.3‐1.9) | 2 |
| Enteral tube | 2.1 (1.3‐3.6) | 0.003 | 0.8 (0.3‐1.3) | 1 |
| Hemoglobin <10 g/dL in preceding 72 hr | 3.0 (1.8‐5.1) | <0.001 | 1.1 (0.6‐1.6) | 2 |
| Blood culture drawn in preceding 72 hr | 5.8 (3.3‐10.3) | <0.001 | 1.8 (1.2‐2.3) | 3 |
Predictive Score
The range of the resulting predictive score was 0 to 12. The median score among cases was 4, and the median score among controls was 1 (P < 0.001). The area under the receiver operating characteristic curve was 0.78 (95% confidence interval 0.74‐0.83).
We grouped the scores by SSLRs into 4 risk strata and calculated each group's estimated post‐test probability of deterioration based on the pre‐test probability of deterioration of 0.15% (Table 4). The very low‐risk group had a probability of deterioration of 0.06%, less than one‐half the pre‐test probability. The low‐risk group had a probability of deterioration of 0.18%, similar to the pre‐test probability. The intermediate‐risk group had a probability of deterioration of 0.39%, 2.6 times higher than the pre‐test probability. The high‐risk group had a probability of deterioration of 12.60%, 84 times higher than the pre‐test probability.
| Risk stratum | Score range | Cases in stratumn (%) | Controls in stratumn (%) | SSLR (95% CI) | Probability of deterioration (%)* |
|---|---|---|---|---|---|
| |||||
| Very low | 0‐2 | 37 (26) | 288 (68) | 0.4 (0.3‐0.5) | 0.06 |
| Low | 3‐4 | 37 (26) | 94 (22) | 1.2 (0.9‐1.6) | 0.2 |
| Intermediate | 5‐6 | 35 (25) | 40 (9) | 2.6 (1.7‐4.0) | 0.4 |
| High | 7‐12 | 32 (23) | 1 (<1) | 96.0 (13.2‐696.2) | 12.6 |
DISCUSSION
Despite the widespread adoption of rapid response systems, we know little about the optimal methods to identify patients whose clinical characteristics alone put them at increased risk of deterioration, and triage the care they receive based on this risk. Pediatric case series have suggested that younger children and those with chronic illnesses are more likely to require assistance from a medical emergency team,1112 but this is the first study to measure their association with this outcome in children.
Most studies with the objective of identifying patients at risk have focused on tools designed to detect symptoms of deterioration that have already begun, using single‐parameter medical emergency team calling criteria1316 or multi‐parameter early warning scores.38 Rather than create a tool to detect deterioration that has already begun, we developed a predictive score that incorporates patient characteristics independently associated with deterioration in hospitalized children, including age <1 year, epilepsy, congenital/genetic defects, history of transplant, enteral tube, hemoglobin <10 g/dL, and blood culture drawn in the preceding 72 hours. The score has the potential to help clinicians identify the children at highest risk of deterioration who might benefit most from the use of vital sign‐based methods to detect deterioration, as well as the children at lowest risk for whom monitoring may be unnecessary. For example, this score could be performed at the time of admission, and those at very low risk of deterioration and without other clinically concerning findings might be considered for a low‐intensity schedule of vital signs and monitoring (such as vital signs every 8 hours, no continuous cardiorespiratory monitoring or pulse oximetry, and early warning score calculation daily), while patients in the intermediate and high‐risk groups might be considered for a more intensive schedule of vital signs and monitoring (such as vital signs every 4 hours, continuous cardiorespiratory monitoring and pulse oximetry, and early warning score calculation every 4 hours). It should be noted, however, that 37 cases (26%) fell into the very low‐risk category, raising the importance of external validation at the point of admission from the emergency department, before the score can be implemented for the potential clinical use described above. If the score performs well in validation studies, then its use in tailoring monitoring parameters has the potential to reduce the amount of time nurses spend responding to false monitor alarms and calculating early warning scores on patients at very low risk of deterioration.
Of note, we excluded children hospitalized for fewer than 24 hours, resulting in the exclusion of 31% of the potentially eligible events. We also excluded 40% of the potentially eligible ICU transfers because they did not meet urgent criteria. These may be limitations because: (1) the first 24 hours of hospitalization may be a high‐risk period; and (2) patients who were on trajectories toward severe deterioration and received interventions that prevented further deterioration, but did not meet urgent criteria, were excluded. It may be that the children we included as cases were at increased risk of deterioration that is either more difficult to recognize early, or more difficult to treat effectively without ICU interventions. In addition, the population of patients meeting urgent criteria may vary across hospitals, limiting generalizability of this score.
In summary, we developed a predictive score and risk stratification tool that may be useful in triaging the intensity of monitoring and surveillance for deterioration that children receive when hospitalized on non‐ICU units. External validation using the setting and frequency of score measurement that would be most valuable clinically (for example, in the emergency department at the time of admission) is needed before clinical use can be recommended.
Acknowledgements
The authors thank Annie Chung, BA, Emily Huang, and Susan Lipsett, MD, for their assistance with data collection.
- Institute for Healthcare Improvement. About IHI. Available at: http://www.ihi.org/ihi/about. Accessed July 18,2010.
- ,,, et al.“Identifying the hospitalised patient in crisis”—a consensus conference on the afferent limb of Rapid Response Systems.Resuscitation.2010;81(4):375–382.
- ,,.The Pediatric Early Warning System score: a severity of illness score to predict urgent medical need in hospitalized children.J Crit Care.2006;21(3):271–278.
- ,,.Development and initial validation of the Bedside Paediatric Early Warning System score.Crit Care.2009;13(4):R135.
- .Detecting and managing deterioration in children.Paediatr Nurs.2005;17(1):32–35.
- ,,.Promoting care for acutely ill children—development and evaluation of a Paediatric Early Warning Tool.Intensive Crit Care Nurs.2006;22(2):73–81.
- ,,,,.Prospective evaluation of a pediatric inpatient early warning scoring system.J Spec Pediatr Nurs.2009;14(2):79–85.
- ,,,.Prospective cohort study to test the predictability of the Cardiff and Vale paediatric early warning system.Arch Dis Child.2009;94(8):602–606.
- ,,,,,.Deaths attributed to pediatric complex chronic conditions: national trends and implications for supportive care services.Pediatrics.2001;107(6):e99.
- ,,,,.Early prediction of neurological sequelae or death after bacterial meningitis.Acta Paediatr.2002;91(4):391–398.
- ,,,,.Retrospective review of emergency response activations during a 13‐year period at a tertiary care children's hospital.J Hosp Med.2011;6(3):131–135.
- ,,,.Clinical profile of hospitalized children provided with urgent assistance from a medical emergency team.Pediatrics.2008;121(6):e1577–e1584.
- ,,, et al.Implementation of a medical emergency team in a large pediatric teaching hospital prevents respiratory and cardiopulmonary arrests outside the intensive care unit.Pediatr Crit Care Med.2007;8(3):236–246.
- ,,, et al.Effect of a rapid response team on hospital‐wide mortality and code rates outside the ICU in a children's hospital.JAMA.2007;298(19):2267–2274.
- ,,, et al.Transition from a traditional code team to a medical emergency team and categorization of cardiopulmonary arrests in a children's center.Arch Pediatr Adolesc Med.2008;162(2):117–122.
- ,.Reduction of hospital mortality and of preventable cardiac arrest and death on introduction of a pediatric medical emergency team.Pediatr Crit Care Med.2009;10(3):306–312.
Thousands of hospitals have implemented rapid response systems in recent years in attempts to reduce mortality outside the intensive care unit (ICU).1 These systems have 2 components, a response arm and an identification arm. The response arm is usually comprised of a multidisciplinary critical care team that responds to calls for urgent assistance outside the ICU; this team is often called a rapid response team or a medical emergency team. The identification arm comes in 2 forms, predictive and detective. Predictive tools estimate a patient's risk of deterioration over time based on factors that are not rapidly changing, such as elements of the patient's history. In contrast, detective tools include highly time‐varying signs of active deterioration, such as vital sign abnormalities.2 To date, most pediatric studies have focused on developing detective tools, including several early warning scores.38
In this study, we sought to identify the characteristics that increase the probability that a hospitalized child will deteriorate, and combine these characteristics into a predictive score. Tools like this may be helpful in identifying and triaging the subset of high‐risk children who should be intensively monitored for early signs of deterioration at the time of admission, as well as in identifying very low‐risk children who, in the absence of other clinical concerns, may be monitored less intensively.
METHODS
Detailed methods, including the inclusion/exclusion criteria, the matching procedures, and a full description of the statistical analysis are provided as an appendix (see Supporting Online Appendix: Supplement to Methods Section in the online version of this article). An abbreviated version follows.
Design
We performed a case‐control study among children, younger than 18 years old, hospitalized for >24 hours between January 1, 2005 and December 31, 2008. The case group consisted of children who experienced clinical deterioration, a composite outcome defined as cardiopulmonary arrest (CPA), acute respiratory compromise (ARC), or urgent ICU transfer, while on a non‐ICU unit. ICU transfers were considered urgent if they included at least one of the following outcomes in the 12 hours after transfer: death, CPA, intubation, initiation of noninvasive ventilation, or administration of a vasoactive medication infusion used for the treatment of shock. The control group consisted of a random sample of patients matched 3:1 to cases if they met the criteria of being on a non‐ICU unit at the same time as their matched case.
Variables and Measurements
We collected data on demographics, complex chronic conditions (CCCs), other patient characteristics, and laboratory studies. CCCs were specific diagnoses divided into the following 9 categories according to an established framework: neuromuscular, cardiovascular, respiratory, renal, gastrointestinal, hematologic/emmmunologic, metabolic, malignancy, and genetic/congenital defects.9 Other patient characteristics evaluated included age, weight‐for‐age, gestational age, history of transplant, time from hospital admission to event, recent ICU stays, administration of total parenteral nutrition, use of a patient‐controlled analgesia pump, and presence of medical devices including central venous lines and enteral tubes (naso‐gastric, gastrostomy, or jejunostomy).
Laboratory studies evaluated included hemoglobin value, white blood cell count, and blood culture drawn in the preceding 72 hours. We included these laboratory studies in this predictive score because we hypothesized that they represented factors that increased a child's risk of deterioration over time, as opposed to signs of acute deterioration that would be more appropriate for a detective score.
Statistical Analysis
We used conditional logistic regression for the bivariable and multivariable analyses to account for the matching. We derived the predictive score using an established method10 in which the regression coefficients for each covariate were divided by the smallest coefficient, and then rounded to the nearest integer, to establish each variable's sub‐score. We grouped the total scores into very low, low, intermediate, and high‐risk groups, calculated overall stratum‐specific likelihood ratios (SSLRs), and estimated stratum‐specific probabilities of deterioration for each group.
RESULTS
Patient Characteristics
We identified 12 CPAs, 41 ARCs, and 699 urgent ICU transfers during the study period. A total of 141 cases met our strict criteria for inclusion (see Figure in Supporting Online Appendix: Supplement to Methods Section in the online version of this article) among approximately 96,000 admissions during the study period, making the baseline incidence of events (pre‐test probability) approximately 0.15%. The case and control groups were similar in age, sex, and family‐reported race/ethnicity. Cases had been hospitalized longer than controls at the time of their event, were less likely to have been on a surgical service, and were less likely to survive to hospital discharge (Table 1). There was a high prevalence of CCCs among both cases and controls; 78% of cases and 52% of controls had at least 1 CCC.
| Cases (n = 141) | Controls (n = 423) | ||
|---|---|---|---|
| n (%) | n (%) | P Value | |
| |||
| Type of event | |||
| Cardiopulmonary arrest | 4 (3) | 0 | NA |
| Acute respiratory compromise | 29 (20) | 0 | NA |
| Urgent ICU transfer | 108 (77) | 0 | NA |
| Demographics | |||
| Age | 0.34 | ||
| 0‐<6 mo | 17 (12) | 62 (15) | |
| 6‐<12 mo | 22 (16) | 41 (10) | |
| 1‐<4 yr | 34 (24) | 97 (23) | |
| 4‐<10 yr | 26 (18) | 78 (18) | |
| 10‐<18 yr | 42 (30) | 145 (34) | |
| Sex | 0.70 | ||
| Female | 60 (43) | 188 (44) | |
| Male | 81 (57) | 235 (56) | |
| Race | 0.40 | ||
| White | 69 (49) | 189 (45) | |
| Black/African‐American | 49 (35) | 163 (38) | |
| Asian/Pacific Islander | 0 (0) | 7 (2) | |
| Other | 23 (16) | 62 (15) | |
| Not reported | 0 (0) | 2 (<1) | |
| Ethnicity | 0.53 | ||
| Non‐Hispanic | 127 (90) | 388 (92) | |
| Hispanic | 14 (10) | 33 (8) | |
| Unknown/not reported | 0 (0) | 2 (<1) | |
| Hospitalization | |||
| Length of stay in days, median (interquartile range) | 7.8 (2.6‐18.2) | 3.9 (1.9‐11.2) | <0.001 |
| Surgical service | 4 (3) | 67 (16) | <0.001 |
| Survived to hospital discharge | 107 (76) | 421 (99.5) | <0.001 |
Unadjusted (Bivariable) Analysis
Results of bivariable analysis are shown in Table 2.
| Variable | Cases n (%) | Controls n (%) | OR* | 95% CI | P Value |
|---|---|---|---|---|---|
| |||||
| Complex chronic conditions categories | |||||
| Congenital/genetic | 19 (13) | 21 (5) | 3.0 | 1.6‐5.8 | 0.001 |
| Neuromuscular | 31 (22) | 48 (11) | 2.2 | 1.3‐3.7 | 0.002 |
| Respiratory | 18 (13) | 27 (6) | 2.0 | 1.1‐3.7 | 0.02 |
| Cardiovascular | 15 (10) | 24 (6) | 2.0 | 1.0‐3.9 | 0.05 |
| Metabolic | 5 (3) | 6 (1) | 2.5 | 0.8‐8.2 | 0.13 |
| Gastrointestinal | 10 (7) | 24 (6) | 1.3 | 0.6‐2.7 | 0.54 |
| Renal | 3 (2) | 8 (2) | 1.1 | 0.3‐4.2 | 0.86 |
| Hematology/emmmunodeficiency | 6 (4) | 19 (4) | 0.9 | 0.4‐2.4 | 0.91 |
| Specific conditions | |||||
| Mental retardation | 21 (15) | 25 (6) | 2.7 | 1.5‐4.9 | 0.001 |
| Malignancy | 49 (35) | 90 (21) | 1.9 | 1.3‐2.8 | 0.002 |
| Epilepsy | 22 (15) | 30 (7) | 2.4 | 1.3‐4.3 | 0.004 |
| Cardiac malformations | 14 (10) | 19 (4) | 2.2 | 1.1‐4.4 | 0.02 |
| Chronic respiratory disease arising in the perinatal period | 11 (8) | 15 (4) | 2.2 | 1.0‐4.8 | 0.05 |
| Cerebral palsy | 7 (5) | 13 (3) | 1.7 | 0.6‐4.2 | 0.30 |
| Cystic fibrosis | 1 (1) | 9 (2) | 0.3 | <0.1‐2.6 | 0.30 |
| Other patient characteristics | |||||
| Time from hospital admission to event 7 days | 74 (52) | 146 (35) | 2.1 | 1.4‐3.1 | <0.001 |
| History of any transplant | 27 (19) | 17 (4) | 5.7 | 2.9‐11.1 | <0.001 |
| Enteral tube | 65 (46) | 102 (24) | 2.6 | 1.8‐3.9 | <0.001 |
| Hospitalized in an intensive care unit during the same admission | 43 (31) | 77 (18) | 2.0 | 1.3‐3.1 | 0.002 |
| Administration of TPN in preceding 24 hr | 26 (18) | 36 (9) | 2.3 | 1.4‐3.9 | 0.002 |
| Administration of an opioid via a patient‐controlled analgesia pump in the preceding 24 hr | 14 (9) | 14 (3) | 3.6 | 1.6‐8.3 | 0.002 |
| Weight‐for‐age <5th percentile | 49 (35) | 94 (22) | 1.9 | 1.2‐2.9 | 0.003 |
| Central venous line | 55 (39) | 113 (27) | 1.8 | 1.2‐2.7 | 0.005 |
| Age <1 yr | 39 (28) | 103 (24) | 1.2 | 0.8‐1.9 | 0.42 |
| Gestational age <37 wk or documentation of prematurity | 21 (15) | 60 (14) | 1.1 | 0.6‐1.8 | 0.84 |
| Laboratory studies | |||||
| Hemoglobin in preceding 72 hr | |||||
| Not tested | 28 (20) | 190 (45) | 1.0 | [reference] | |
| 10 g/dL | 42 (30) | 144 (34) | 2.0 | 1.2‐3.5 | 0.01 |
| <10 g/dL | 71 (50) | 89 (21) | 5.6 | 3.3‐9.5 | <0.001 |
| White blood cell count in preceding 72 hr | |||||
| Not tested | 28 (20) | 190 (45) | 1.0 | [reference] | |
| 5000 to <15,000/l | 45 (32) | 131 (31) | 2.4 | 1.4‐4.1 | 0.001 |
| 15,000/l | 19 (13) | 25 (6) | 5.7 | 2.7‐12.0 | <0.001 |
| <5000/l | 49 (35) | 77 (18) | 4.5 | 2.6‐7.8 | <0.001 |
| Blood culture drawn in preceding 72 hr | 78 (55) | 85 (20) | 5.2 | 3.3‐8.1 | <0.001 |
Adjusted (Multivariable) Analysis
The multivariable conditional logistic regression model included 7 independent risk factors for deterioration (Table 3): age <1 year, epilepsy, congenital/genetic defects, history of transplant, enteral tubes, hemoglobin <10 g/dL, and blood culture drawn in the preceding 72 hours.
| Predictor | Adjusted OR (95% CI) | P Value | Regression Coefficient (95% CI) | Score* |
|---|---|---|---|---|
| ||||
| Age <1 yr | 1.9 (1.0‐3.4) | 0.038 | 0.6 (<0.1‐1.2) | 1 |
| Epilepsy | 4.4 (1.9‐9.8) | <0.001 | 1.5 (0.7‐2.3) | 2 |
| Congenital/genetic defects | 2.1 (0.9‐4.9) | 0.075 | 0.8 (0.1‐1.6) | 1 |
| History of any transplant | 3.0 (1.3‐6.9) | 0.010 | 1.1 (0.3‐1.9) | 2 |
| Enteral tube | 2.1 (1.3‐3.6) | 0.003 | 0.8 (0.3‐1.3) | 1 |
| Hemoglobin <10 g/dL in preceding 72 hr | 3.0 (1.8‐5.1) | <0.001 | 1.1 (0.6‐1.6) | 2 |
| Blood culture drawn in preceding 72 hr | 5.8 (3.3‐10.3) | <0.001 | 1.8 (1.2‐2.3) | 3 |
Predictive Score
The range of the resulting predictive score was 0 to 12. The median score among cases was 4, and the median score among controls was 1 (P < 0.001). The area under the receiver operating characteristic curve was 0.78 (95% confidence interval 0.74‐0.83).
We grouped the scores by SSLRs into 4 risk strata and calculated each group's estimated post‐test probability of deterioration based on the pre‐test probability of deterioration of 0.15% (Table 4). The very low‐risk group had a probability of deterioration of 0.06%, less than one‐half the pre‐test probability. The low‐risk group had a probability of deterioration of 0.18%, similar to the pre‐test probability. The intermediate‐risk group had a probability of deterioration of 0.39%, 2.6 times higher than the pre‐test probability. The high‐risk group had a probability of deterioration of 12.60%, 84 times higher than the pre‐test probability.
| Risk stratum | Score range | Cases in stratumn (%) | Controls in stratumn (%) | SSLR (95% CI) | Probability of deterioration (%)* |
|---|---|---|---|---|---|
| |||||
| Very low | 0‐2 | 37 (26) | 288 (68) | 0.4 (0.3‐0.5) | 0.06 |
| Low | 3‐4 | 37 (26) | 94 (22) | 1.2 (0.9‐1.6) | 0.2 |
| Intermediate | 5‐6 | 35 (25) | 40 (9) | 2.6 (1.7‐4.0) | 0.4 |
| High | 7‐12 | 32 (23) | 1 (<1) | 96.0 (13.2‐696.2) | 12.6 |
DISCUSSION
Despite the widespread adoption of rapid response systems, we know little about the optimal methods to identify patients whose clinical characteristics alone put them at increased risk of deterioration, and triage the care they receive based on this risk. Pediatric case series have suggested that younger children and those with chronic illnesses are more likely to require assistance from a medical emergency team,1112 but this is the first study to measure their association with this outcome in children.
Most studies with the objective of identifying patients at risk have focused on tools designed to detect symptoms of deterioration that have already begun, using single‐parameter medical emergency team calling criteria1316 or multi‐parameter early warning scores.38 Rather than create a tool to detect deterioration that has already begun, we developed a predictive score that incorporates patient characteristics independently associated with deterioration in hospitalized children, including age <1 year, epilepsy, congenital/genetic defects, history of transplant, enteral tube, hemoglobin <10 g/dL, and blood culture drawn in the preceding 72 hours. The score has the potential to help clinicians identify the children at highest risk of deterioration who might benefit most from the use of vital sign‐based methods to detect deterioration, as well as the children at lowest risk for whom monitoring may be unnecessary. For example, this score could be performed at the time of admission, and those at very low risk of deterioration and without other clinically concerning findings might be considered for a low‐intensity schedule of vital signs and monitoring (such as vital signs every 8 hours, no continuous cardiorespiratory monitoring or pulse oximetry, and early warning score calculation daily), while patients in the intermediate and high‐risk groups might be considered for a more intensive schedule of vital signs and monitoring (such as vital signs every 4 hours, continuous cardiorespiratory monitoring and pulse oximetry, and early warning score calculation every 4 hours). It should be noted, however, that 37 cases (26%) fell into the very low‐risk category, raising the importance of external validation at the point of admission from the emergency department, before the score can be implemented for the potential clinical use described above. If the score performs well in validation studies, then its use in tailoring monitoring parameters has the potential to reduce the amount of time nurses spend responding to false monitor alarms and calculating early warning scores on patients at very low risk of deterioration.
Of note, we excluded children hospitalized for fewer than 24 hours, resulting in the exclusion of 31% of the potentially eligible events. We also excluded 40% of the potentially eligible ICU transfers because they did not meet urgent criteria. These may be limitations because: (1) the first 24 hours of hospitalization may be a high‐risk period; and (2) patients who were on trajectories toward severe deterioration and received interventions that prevented further deterioration, but did not meet urgent criteria, were excluded. It may be that the children we included as cases were at increased risk of deterioration that is either more difficult to recognize early, or more difficult to treat effectively without ICU interventions. In addition, the population of patients meeting urgent criteria may vary across hospitals, limiting generalizability of this score.
In summary, we developed a predictive score and risk stratification tool that may be useful in triaging the intensity of monitoring and surveillance for deterioration that children receive when hospitalized on non‐ICU units. External validation using the setting and frequency of score measurement that would be most valuable clinically (for example, in the emergency department at the time of admission) is needed before clinical use can be recommended.
Acknowledgements
The authors thank Annie Chung, BA, Emily Huang, and Susan Lipsett, MD, for their assistance with data collection.
- Institute for Healthcare Improvement. About IHI. Available at: http://www.ihi.org/ihi/about. Accessed July 18,2010.
- ,,, et al.“Identifying the hospitalised patient in crisis”—a consensus conference on the afferent limb of Rapid Response Systems.Resuscitation.2010;81(4):375–382.
- ,,.The Pediatric Early Warning System score: a severity of illness score to predict urgent medical need in hospitalized children.J Crit Care.2006;21(3):271–278.
- ,,.Development and initial validation of the Bedside Paediatric Early Warning System score.Crit Care.2009;13(4):R135.
- .Detecting and managing deterioration in children.Paediatr Nurs.2005;17(1):32–35.
- ,,.Promoting care for acutely ill children—development and evaluation of a Paediatric Early Warning Tool.Intensive Crit Care Nurs.2006;22(2):73–81.
- ,,,,.Prospective evaluation of a pediatric inpatient early warning scoring system.J Spec Pediatr Nurs.2009;14(2):79–85.
- ,,,.Prospective cohort study to test the predictability of the Cardiff and Vale paediatric early warning system.Arch Dis Child.2009;94(8):602–606.
- ,,,,,.Deaths attributed to pediatric complex chronic conditions: national trends and implications for supportive care services.Pediatrics.2001;107(6):e99.
- ,,,,.Early prediction of neurological sequelae or death after bacterial meningitis.Acta Paediatr.2002;91(4):391–398.
- ,,,,.Retrospective review of emergency response activations during a 13‐year period at a tertiary care children's hospital.J Hosp Med.2011;6(3):131–135.
- ,,,.Clinical profile of hospitalized children provided with urgent assistance from a medical emergency team.Pediatrics.2008;121(6):e1577–e1584.
- ,,, et al.Implementation of a medical emergency team in a large pediatric teaching hospital prevents respiratory and cardiopulmonary arrests outside the intensive care unit.Pediatr Crit Care Med.2007;8(3):236–246.
- ,,, et al.Effect of a rapid response team on hospital‐wide mortality and code rates outside the ICU in a children's hospital.JAMA.2007;298(19):2267–2274.
- ,,, et al.Transition from a traditional code team to a medical emergency team and categorization of cardiopulmonary arrests in a children's center.Arch Pediatr Adolesc Med.2008;162(2):117–122.
- ,.Reduction of hospital mortality and of preventable cardiac arrest and death on introduction of a pediatric medical emergency team.Pediatr Crit Care Med.2009;10(3):306–312.