User login
Paracentesis in Cirrhosis Patients/
Ascites is the most common complication of cirrhosis leading to hospital admission.[1] Approximately 12% of hospitalized patients who present with decompensated cirrhosis and ascites have spontaneous bacterial peritonitis (SBP); half of these patients do not present with abdominal pain, fever, nausea, or vomiting.[2] Guidelines published by the American Association for the Study of Liver Diseases (AASLD) recommend paracentesis for all hospitalized patients with cirrhosis and ascites and also recommend long‐term antibiotic prophylaxis for survivors of an SBP episode.[3] Despite evidence that in‐hospital mortality is reduced in those patients who receive paracentesis in a timely manner,[4, 5] only 40% to 60% of eligible patients receive paracentesis.[4, 6, 7] We aimed to describe clinical predictors of paracentesis and use of antibiotics following an episode of SBP in patients with decompensated cirrhosis and ascites.
METHODS
We conducted a retrospective cohort study of adults admitted to a single tertiary care center between January 1, 2009 and December 31, 2009.7 We included patients with an International Classification of Diseases, Ninth Revision discharge code consistent with decompensated cirrhosis who met clinical criteria for decompensated cirrhosis (see
RESULTS
We identified 193 admissions for 103 patients with decompensated cirrhosis and ascites (Table 1). Of these, 41% (80/193) received diagnostic paracentesis. Mean/standard deviation for age was 53.6/12.4 years; 71% of patients were male and 63% were English speaking. Common comorbidities included diabetes mellitus (33%), psychiatric diagnosis (29%), substance abuse (18%), and renal failure (17%). Excluding SBP, 31% of patients had another documented infection. Gastroenterology was consulted in 50% of the admissions. Fever was present in 27% of patients, elevated white blood cell (WBC) count (ie, WBC >11 k/mm3) was present in 27% of patients, International Normalized Ratio (INR) was elevated (>1.1) in 92% of patients, and 16% of patients had a platelet count of <50,000/mm3. Patients who received paracentesis were less likely to have a fever on presentation (19% vs 32%, P=0.06), low (ie, <50,000/mm3) platelet count (11% vs 19%, P=0.14), or concurrent gastrointestinal (GI) bleed (6% vs 16%, P=0.05). In a multiple logistic regression model including characteristics associated at P0.2 with paracentesis, fever, low platelet count, and concurrent GI bleeding were associated with decreased odds of receiving paracentesis (Appendix 1).
| Overall, N=193, Mean/SD or N (%)* | Paracentesis (), n=113, Mean/SD or N (%) | Paracentesis (+), n=80, Mean/SD or N (%) | Odds Ratio (95% CI) | |
|---|---|---|---|---|
| ||||
| Age, y | 53.6/12.4 | 54.1/13.4 | 53.2/11.7 | 1.00 (0.981.03) |
| Sex (male) | 137 (71.0%) | 78 (69.0%) | 59 (73.8%) | 1.26 (0.672.39) |
| English speaking | 122 (63.2%) | 69 (61.1%) | 53 (66.3%) | 1.25 (0.692.28) |
| Etiology | ||||
| Alcohol | 120 (62.2%) | 74 (65.5%) | 46 (57.5%) | 0.71 (0.401.29) |
| Hepatitis C | 94 (48.7%) | 57 (50.4%) | 37 (46.3%) | 0.85 (0.481.50) |
| Hepatitis B | 16 (8.3%) | 7 (6.2%) | 9 (11.3%) | 1.92 (0.685.39) |
| NASH | 8 (4.2%) | 4 (3.5%) | 4 (5.0%) | 1.43 (0.355.91) |
| Cryptogenic | 11 (5.7%) | 6 (5.3%) | 5 (6.3%) | 1.19 (0.354.04) |
| Comorbidities | ||||
| Substance abuse | 34 (17.6%) | 22 (19.5%) | 12 (15.0%) | 0.73 (0.341.58) |
| Psychiatric diagnosis | 55 (28.5%) | 38 (33.6%) | 17 (21.3%) | 0.53 (0.271.03) |
| Diabetes mellitus | 63 (32.6%) | 37 (32.7%) | 26 (32.5%) | 0.99 (0.541.82) |
| Renal failure | 33 (17.1%) | 20 (17.7%) | 13 (16.3%) | 0.90 (0.421.94) |
| GI bleed | 23 (11.9%) | 18 (15.9%) | 5 (6.3%) | 0.35 (0.120.99) |
| Admission MELD | 17.3/7.3 | 17.5/7.3 | 17.0/7.3 | 0.99 (0.951.03) |
| Creatinine, median/IQR | 0.9/0.7 | 0.9/0.7 | 0.9/0.8 | 1.02 (0.821.27) |
| Gastroenterology consult | 97 (50.3%) | 46 (40.7%) | 51 (63.8%) | 2.56 (1.424.63) |
| Infection, UTI, pneumonia, other | 60 (31.1%) | 38 (33.6%) | 22 (27.5%) | 0.75 (0.401.40) |
| Temperature 100.4F | 49 (26.8%) | 34 (32.4%) | 15 (19.2%) | 0.50 (0.251.00) |
| WBC >11 k/mm3 | 50 (27.3%) | 28 (26.7%) | 22 (28.2%) | 1.08 (0.562.08) |
| WBC <4 k/mm3 | 43 (23.5%) | 23 (21.9%) | 20 (25.6%) | 1.23 (0.622.44) |
| INR >1.1 | 149 (92.0%) | 83 (93.3%) | 66 (90.4%) | 0.68 (0.222.13) |
| Highest temperature, F | 98.9/1.1 | 99.1/1.3 | 98.8/0.8 | 0.82 (0.621.09) |
| Highest HR | 98.2/20.4 | 97.4/22.4 | 99.2/17.4 | 1.00 (0.991.02) |
| Highest RR | 24.5/13.7 | 25.2/16.8 | 23.5/7.8 | 0.99 (0.961.02) |
| Lowest SBP | 101.0/20.0 | 99.4/20.3 | 102.2/19.7 | 0.99 (0.981.01) |
| Lowest MAP | 73.0/12.2 | 73.2/13.3 | 72.7/10.6 | 1.00 (0.971.02) |
| Lowest O2Sat | 92.6/13.6 | 91.0/17.7 | 94.9/2.8 | 1.04 (0.991.10) |
| Highest PT | 15.8/3.8 | 15.9/3.7 | 15.7/3.9 | 0.98 (0.901.08) |
| Platelets 50 k/mm3 | 30 (15.9%) | 21 (19.3%) | 9 (11.3%) | 0.53 (0.231.23) |
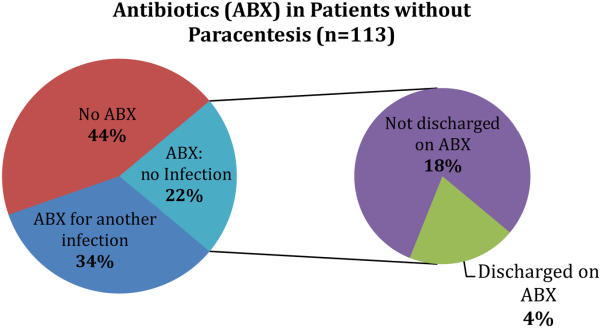
Of the patients who received paracentesis (n=80), 14% were diagnosed with SBP. Of these, 55% received prophylaxis on discharge. Among the patients who did not receive paracentesis (n=113), 38 (34%) received antibiotics for another documented infection (eg, pneumonia), and 25 patients (22%) received antibiotics with no other documented infection or evidence of variceal bleeding. Of these 25 patients who were presumed to be empirically treated for SBP (Figure 1), only 20% were prescribed prophylactic antibiotics on discharge.

CONCLUSION
We found that many patients with decompensated cirrhosis and ascites did not receive paracentesis when hospitalized, which is similar to previously published data.[4, 6, 7] Clinical evidence of infection, such as fever or elevated WBC count, did not increase the odds of receiving paracentesis. Many patients treated for SBP were not discharged on prophylaxis.
This study is limited by its small single‐center design. We could only use data from 1 year (2009), because study data collection was part of a quality‐improvement project that took place for that year only. We did not adjust for the number of red blood cells in the ascitic fluid samples. We were also unable to determine the timing of gastroenterology consultation (whether it was done prior to paracentesis), admission venue (floor vs intensive care), or patient history of SBP.
Despite these limitations, there are important implications. First, the decision to perform paracentesis was not associated with symptoms of infection, although some clinical factors (eg, low platelets or GI bleeding) were associated with reduced odds of receiving paracentesis. Second, a majority of patients treated for SBP did not receive prophylactic antibiotics at discharge. These findings suggest a clear opportunity to increase awareness and acceptance of AASLD guidelines among hospital medicine practitioners. Quality‐improvement efforts should focus on the education of providers, and future research should identify barriers to paracentesis at both the practitioner and system levels (eg, availability of interventional radiology). Checklists or decision support within electronic order entry systems may also help reduce the low rates of paracentesis seen in our and prior studies.[4, 6, 7]
Disclosures: Dr. Lagu is supported by the National Heart, Lung, and Blood Institute of the National Institutes of Health under award number K01HL114745. Drs. Lagu, Ghaoui, and Brooling had full access to all of the data in the study. They take responsibility for the integrity of the data and the accuracy of the data analysis. Drs. Lagu, Ghaoui, and Brooling conceived of the study. Dr. Ghaoui acquired the data. Ms. Friderici carried out the statistical analyses. Drs. Lagu, Ghaoui, Brooling, Lindenauer, and Ms. Friderici analyzed and interpreted the data, drafted the manuscript, and critically reviewed the manuscript for important intellectual content. The authors report no conflicts of interest.
- , , , , ; Spanish Collaborative Study Group On Therapeutic Management In Liver Disease. Multicenter hospital study on prescribing patterns for prophylaxis and treatment of complications of cirrhosis. Eur J Clin Pharmacol. 2002;58(6):435–440.
- , , , et al. Bacterial infection in patients with advanced cirrhosis: a multicentre prospective study. Dig Liver Dis. 2001;33(1):41–48.
- , AASLD. Introduction to the revised American Association for the Study of Liver Diseases Practice Guideline management of adult patients with ascites due to cirrhosis 2012. Hepatology. 2013;57(4):1651–1653.
- , , , . Paracentesis is associated with reduced mortality in patients hospitalized with cirrhosis and ascites. Clin Gastroenterol Hepatol. 2014;12(3):496–503.e1.
- , , , et al. Delayed paracentesis is associated with increased in‐hospital mortality in patients with spontaneous bacterial peritonitis. Am J Gastroenterol. 2014;109(9):1436–1442.
- , , , et al. The quality of care provided to patients with cirrhosis and ascites in the Department of Veterans Affairs. Gastroenterology. 2012;143(1):70–77.
- , , , , , . Measurement of the quality of care of patients admitted with decompensated cirrhosis. Liver Int. 2014;34(2):204–210.
Ascites is the most common complication of cirrhosis leading to hospital admission.[1] Approximately 12% of hospitalized patients who present with decompensated cirrhosis and ascites have spontaneous bacterial peritonitis (SBP); half of these patients do not present with abdominal pain, fever, nausea, or vomiting.[2] Guidelines published by the American Association for the Study of Liver Diseases (AASLD) recommend paracentesis for all hospitalized patients with cirrhosis and ascites and also recommend long‐term antibiotic prophylaxis for survivors of an SBP episode.[3] Despite evidence that in‐hospital mortality is reduced in those patients who receive paracentesis in a timely manner,[4, 5] only 40% to 60% of eligible patients receive paracentesis.[4, 6, 7] We aimed to describe clinical predictors of paracentesis and use of antibiotics following an episode of SBP in patients with decompensated cirrhosis and ascites.
METHODS
We conducted a retrospective cohort study of adults admitted to a single tertiary care center between January 1, 2009 and December 31, 2009.7 We included patients with an International Classification of Diseases, Ninth Revision discharge code consistent with decompensated cirrhosis who met clinical criteria for decompensated cirrhosis (see
RESULTS
We identified 193 admissions for 103 patients with decompensated cirrhosis and ascites (Table 1). Of these, 41% (80/193) received diagnostic paracentesis. Mean/standard deviation for age was 53.6/12.4 years; 71% of patients were male and 63% were English speaking. Common comorbidities included diabetes mellitus (33%), psychiatric diagnosis (29%), substance abuse (18%), and renal failure (17%). Excluding SBP, 31% of patients had another documented infection. Gastroenterology was consulted in 50% of the admissions. Fever was present in 27% of patients, elevated white blood cell (WBC) count (ie, WBC >11 k/mm3) was present in 27% of patients, International Normalized Ratio (INR) was elevated (>1.1) in 92% of patients, and 16% of patients had a platelet count of <50,000/mm3. Patients who received paracentesis were less likely to have a fever on presentation (19% vs 32%, P=0.06), low (ie, <50,000/mm3) platelet count (11% vs 19%, P=0.14), or concurrent gastrointestinal (GI) bleed (6% vs 16%, P=0.05). In a multiple logistic regression model including characteristics associated at P0.2 with paracentesis, fever, low platelet count, and concurrent GI bleeding were associated with decreased odds of receiving paracentesis (Appendix 1).
| Overall, N=193, Mean/SD or N (%)* | Paracentesis (), n=113, Mean/SD or N (%) | Paracentesis (+), n=80, Mean/SD or N (%) | Odds Ratio (95% CI) | |
|---|---|---|---|---|
| ||||
| Age, y | 53.6/12.4 | 54.1/13.4 | 53.2/11.7 | 1.00 (0.981.03) |
| Sex (male) | 137 (71.0%) | 78 (69.0%) | 59 (73.8%) | 1.26 (0.672.39) |
| English speaking | 122 (63.2%) | 69 (61.1%) | 53 (66.3%) | 1.25 (0.692.28) |
| Etiology | ||||
| Alcohol | 120 (62.2%) | 74 (65.5%) | 46 (57.5%) | 0.71 (0.401.29) |
| Hepatitis C | 94 (48.7%) | 57 (50.4%) | 37 (46.3%) | 0.85 (0.481.50) |
| Hepatitis B | 16 (8.3%) | 7 (6.2%) | 9 (11.3%) | 1.92 (0.685.39) |
| NASH | 8 (4.2%) | 4 (3.5%) | 4 (5.0%) | 1.43 (0.355.91) |
| Cryptogenic | 11 (5.7%) | 6 (5.3%) | 5 (6.3%) | 1.19 (0.354.04) |
| Comorbidities | ||||
| Substance abuse | 34 (17.6%) | 22 (19.5%) | 12 (15.0%) | 0.73 (0.341.58) |
| Psychiatric diagnosis | 55 (28.5%) | 38 (33.6%) | 17 (21.3%) | 0.53 (0.271.03) |
| Diabetes mellitus | 63 (32.6%) | 37 (32.7%) | 26 (32.5%) | 0.99 (0.541.82) |
| Renal failure | 33 (17.1%) | 20 (17.7%) | 13 (16.3%) | 0.90 (0.421.94) |
| GI bleed | 23 (11.9%) | 18 (15.9%) | 5 (6.3%) | 0.35 (0.120.99) |
| Admission MELD | 17.3/7.3 | 17.5/7.3 | 17.0/7.3 | 0.99 (0.951.03) |
| Creatinine, median/IQR | 0.9/0.7 | 0.9/0.7 | 0.9/0.8 | 1.02 (0.821.27) |
| Gastroenterology consult | 97 (50.3%) | 46 (40.7%) | 51 (63.8%) | 2.56 (1.424.63) |
| Infection, UTI, pneumonia, other | 60 (31.1%) | 38 (33.6%) | 22 (27.5%) | 0.75 (0.401.40) |
| Temperature 100.4F | 49 (26.8%) | 34 (32.4%) | 15 (19.2%) | 0.50 (0.251.00) |
| WBC >11 k/mm3 | 50 (27.3%) | 28 (26.7%) | 22 (28.2%) | 1.08 (0.562.08) |
| WBC <4 k/mm3 | 43 (23.5%) | 23 (21.9%) | 20 (25.6%) | 1.23 (0.622.44) |
| INR >1.1 | 149 (92.0%) | 83 (93.3%) | 66 (90.4%) | 0.68 (0.222.13) |
| Highest temperature, F | 98.9/1.1 | 99.1/1.3 | 98.8/0.8 | 0.82 (0.621.09) |
| Highest HR | 98.2/20.4 | 97.4/22.4 | 99.2/17.4 | 1.00 (0.991.02) |
| Highest RR | 24.5/13.7 | 25.2/16.8 | 23.5/7.8 | 0.99 (0.961.02) |
| Lowest SBP | 101.0/20.0 | 99.4/20.3 | 102.2/19.7 | 0.99 (0.981.01) |
| Lowest MAP | 73.0/12.2 | 73.2/13.3 | 72.7/10.6 | 1.00 (0.971.02) |
| Lowest O2Sat | 92.6/13.6 | 91.0/17.7 | 94.9/2.8 | 1.04 (0.991.10) |
| Highest PT | 15.8/3.8 | 15.9/3.7 | 15.7/3.9 | 0.98 (0.901.08) |
| Platelets 50 k/mm3 | 30 (15.9%) | 21 (19.3%) | 9 (11.3%) | 0.53 (0.231.23) |
Of the patients who received paracentesis (n=80), 14% were diagnosed with SBP. Of these, 55% received prophylaxis on discharge. Among the patients who did not receive paracentesis (n=113), 38 (34%) received antibiotics for another documented infection (eg, pneumonia), and 25 patients (22%) received antibiotics with no other documented infection or evidence of variceal bleeding. Of these 25 patients who were presumed to be empirically treated for SBP (Figure 1), only 20% were prescribed prophylactic antibiotics on discharge.
CONCLUSION
We found that many patients with decompensated cirrhosis and ascites did not receive paracentesis when hospitalized, which is similar to previously published data.[4, 6, 7] Clinical evidence of infection, such as fever or elevated WBC count, did not increase the odds of receiving paracentesis. Many patients treated for SBP were not discharged on prophylaxis.
This study is limited by its small single‐center design. We could only use data from 1 year (2009), because study data collection was part of a quality‐improvement project that took place for that year only. We did not adjust for the number of red blood cells in the ascitic fluid samples. We were also unable to determine the timing of gastroenterology consultation (whether it was done prior to paracentesis), admission venue (floor vs intensive care), or patient history of SBP.
Despite these limitations, there are important implications. First, the decision to perform paracentesis was not associated with symptoms of infection, although some clinical factors (eg, low platelets or GI bleeding) were associated with reduced odds of receiving paracentesis. Second, a majority of patients treated for SBP did not receive prophylactic antibiotics at discharge. These findings suggest a clear opportunity to increase awareness and acceptance of AASLD guidelines among hospital medicine practitioners. Quality‐improvement efforts should focus on the education of providers, and future research should identify barriers to paracentesis at both the practitioner and system levels (eg, availability of interventional radiology). Checklists or decision support within electronic order entry systems may also help reduce the low rates of paracentesis seen in our and prior studies.[4, 6, 7]
Disclosures: Dr. Lagu is supported by the National Heart, Lung, and Blood Institute of the National Institutes of Health under award number K01HL114745. Drs. Lagu, Ghaoui, and Brooling had full access to all of the data in the study. They take responsibility for the integrity of the data and the accuracy of the data analysis. Drs. Lagu, Ghaoui, and Brooling conceived of the study. Dr. Ghaoui acquired the data. Ms. Friderici carried out the statistical analyses. Drs. Lagu, Ghaoui, Brooling, Lindenauer, and Ms. Friderici analyzed and interpreted the data, drafted the manuscript, and critically reviewed the manuscript for important intellectual content. The authors report no conflicts of interest.
- , , , , ; Spanish Collaborative Study Group On Therapeutic Management In Liver Disease. Multicenter hospital study on prescribing patterns for prophylaxis and treatment of complications of cirrhosis. Eur J Clin Pharmacol. 2002;58(6):435–440.
- , , , et al. Bacterial infection in patients with advanced cirrhosis: a multicentre prospective study. Dig Liver Dis. 2001;33(1):41–48.
- , AASLD. Introduction to the revised American Association for the Study of Liver Diseases Practice Guideline management of adult patients with ascites due to cirrhosis 2012. Hepatology. 2013;57(4):1651–1653.
- , , , . Paracentesis is associated with reduced mortality in patients hospitalized with cirrhosis and ascites. Clin Gastroenterol Hepatol. 2014;12(3):496–503.e1.
- , , , et al. Delayed paracentesis is associated with increased in‐hospital mortality in patients with spontaneous bacterial peritonitis. Am J Gastroenterol. 2014;109(9):1436–1442.
- , , , et al. The quality of care provided to patients with cirrhosis and ascites in the Department of Veterans Affairs. Gastroenterology. 2012;143(1):70–77.
- , , , , , . Measurement of the quality of care of patients admitted with decompensated cirrhosis. Liver Int. 2014;34(2):204–210.
Antipsychotics in Hospitalized Elders
Antipsychotic (AP) medications are often used in the hospitalized geriatric population for the treatment of delirium.[1] Because of adverse events associated with APs, efforts have been made to reduce their use in hospitalized elders,[2] but it is not clear if these recommendations have been widely adopted. We studied the use of APs in a cohort of hospitalized elders to better understand why APs are started and how often they are continued on discharge.
METHODS
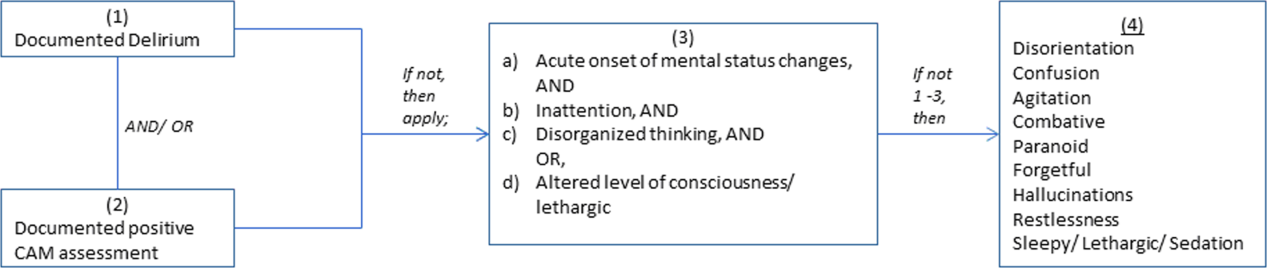
We conducted a retrospective cohort study of patients aged 65 years or older admitted to a tertiary care hospital between October 1, 2012 and September 31, 2013. Using Stata's (StataCorp., College Station, TX) sample command,[3] we included a subset of randomly selected inpatients who received more than 1 dose of oral APs (determined using the electronic medication administration summary). We excluded patients admitted under observation status or to the psychiatric service, those who were on APs prior to admission, and those who only received prochloperazine for nausea. Using prior literature to identify terms frequently used to describe delirium (Figure 1), we created an algorithm and a chart abstraction form (see Supporting Information, Appendix 1, in the online version of this article).[4] We tested these instruments in a preliminary chart review involving 30 patients. Disagreements were discussed with coauthors and resolved through consensus, resulting in some algorithm changes (eg, excluding a large number of patients who received only 1 dose of haloperidol postoperatively, because we hypothesized that this use could be a prophylactic measure).[5] Two investigators extracted the remaining charts independently. We used descriptive statistics and performed cross‐tabulations on the selected variables.

RESULTS
Of 12,817 geriatric hospitalizations during the study period, 1120 (9%) were treated with antipsychotics. We randomly selected 300 of these for extraction: 54% were male, and 67% were admitted to the medical service (Table 1). The inpatient mortality rate was 10% (30/300). The most frequent indication for AP use was delirium (83%, 249/300). Only 35% of delirious patients received a formal assessment with the Confusion Assessment Method (CAM). The most commonly used atypical antipsychotic was quetiapine (86%); 55% received more than 1 antipsychotic medication during hospitalization, and 48% (143/297) of patients were continued on APs at discharge (excluding 3 patients transferred to other acute care hospitals).
| Variable | N (%), Total=300 |
|---|---|
| |
| Gender | |
| Male | 161 (54) |
| Female | 139 (46) |
| Inpatient mortality rate | 30 (10) |
| Services | |
| Medicine | 202 (67) |
| Surgery | 98 (33) |
| Indication for APs use | |
| Delirium | 249 (83) |
| Hallucinations | 19 (6) |
| Anxiety | 20 (7) |
| Other | 38 (13) |
| Atypical APs | |
| Quetiapine | 257 (86) |
| Olanzapine | 29 (10) |
| Risperidone | 26 (9) |
| Typical APs | |
| Haloperidol | 166 (55) |
| Thorazine | 4 (1) |
| Use of CAM | 79 (32)a |
| Physical restraints | 89 (30) |
| Documented or suspected dementia | 134 (45) |
| Geriatrics consults | 120 (40) |
| Psychiatric consults | 29 (10) |
| ECG | |
| Prior to APs administration | 265 (88) |
| After APs administration | 157 (52) |
| QTc prolongation >500 ms | |
| Prior to APs administration | 41 (15)b |
| After APs administration | 39 (25)c |
| Admitted from SNF | 36 (12) |
| Discharge destination | |
| Home | 68 (23) |
| SNFs, short and long‐term rehabilitations | 199 (66) |
| Transfer to other acute care hospitals | 3 (1) |
| Continuation of APs at discharge | 143 (48)d |
Approximately 45% (134/300) had documented or suspected dementia, and 30% (89/300) were physically restrained during the hospital stay. Consultations with geriatrics were obtained in 40% (120/300) of the cases and with psychiatry in 10% (29/300) of the cases. Neurology is rarely consulted for delirium in our institution; thus, we did not collect data on those referrals. Electrocardiography (ECG) (recommended for patients at high cardiac risk[6]) was performed in 88% (265/300) of patients prior to AP administration and 52% (157/300) after. The corrected QT interval exceeded 500 ms in 15% (41/265) of patients prior to AP administration and 25% (39/157) after. Although few patients (12%) were admitted from nursing facilities, 66% (199/300) were eventually discharged to skilled nursing facilities (SNFs) or rehabilitation facilities; most of these patients (117/199, 59%) received AP treatment, compared to 38% of patients discharged to home (26/68).
DISCUSSION
In a cohort of hospitalized elders, we found that 9% were treated with APs. Most received APs for perceived delirium; in‐hospital ECG monitoring was suboptimal. Half of the patients started on APs remained on them at discharge; those discharged to SNFs were more likely to receive ongoing AP treatment.
Our study is limited by its retrospective, single‐center design, a lack of inter‐rater reliability measurement (although our training process was designed to standardize extraction methods), and the infrequent use of formal CAM assessment. Additionally, we were unable to determine how frequently APs were initiated in the intensive care unit. Any retrospective study is limited by the difficulty of distinguishing delirium from the behavioral and psychiatric symptoms of dementia, but we identified delirium using standard terms described in previous literature.
Our study also has a number of important implications. Because of a reported association between the use of APs and risk of death in the postacute setting,[7] national provider organizations have called for a reduction in AP initiation in hospitalized elders.[2] However, this study indicates that APs continue to be prescribed for delirium, which may be attributed to the lack of behavioral modification options in most hospitals, such as acute care for elders (ACE) units and hospital elder life programs (HELP).[8, 9] Our findings suggest that this problem would be further amplified in hospitals that lack access to geriatrics expertise.
Without alternative behavioral options, patients are at risk for prolonged delirium, which is associated with significant suffering and subsequent risk of further cognitive impairment and death.[10] Although evidence for the efficacy of APs in the treatment of delirium is limited and inconclusive, no better pharmacologic options exist. Hospitals that wish to reduce use of APs should therefore consider investing in environmental interventions (eg, ACE units, HELP), which lower the incidence of delirium and could, in turn, decrease the prescription and continuation of antipsychotics.[8, 9]
Acknowledgements
The authors acknowledge Mihaela Stefan, MD, FACP, for her comments on an earlier draft of this manuscript.
Disclosures: Drs. Lagu and Loh had full access to all of the data in the study. They take responsibility for the integrity of the data and the accuracy of the analysis. Drs. Loh, Brennan, Lindenauer, and Lagu conceived of the study. Drs. Loh and Ramdass acquired the data. Ms. Garb analyzed and interpreted the data. Dr. Loh drafted the manuscript. Drs Brennan, Lindenauer, and Lagu, and Ms. Garb critically reviewed the manuscript for important intellectual content. Dr. Lagu is supported by the National Heart, Lung, and Blood Institute of the National Institutes of Health under award number K01HL114745. The authors report no conflicts of interest.
- , , , , , . Delirium in elderly patients and the risk of postdischarge mortality, institutionalization, and dementia: a meta‐analysis. JAMA. 2010;304(4):443–451.
- . Off‐label use of antipsychotics for dementia patients discouraged. The Hospitalist. November 2012\http://www.the‐hospitalist.org/details/article/2785121/Off‐Label_Use_of_Antipsychotics_for_Dementia_Patients_Discouraged.html. Accessed June 29, 2014.
- STATA/MP [computer program]. Version 13.1 for Windows. College Station, TX: StataCorp; 2013.
- , , , , , . Association between sedating medications and delirium in older inpatients. J Am Geriatr Soc. 2013;61(6):923–930.
- , , , et al. Haloperidol prophylaxis decreases delirium incidence in elderly patients after noncardiac surgery: a randomized controlled trial. Crit Care Med. 2012;40(3):731–739.
- , , . QTc prolongation with antipsychotics: is routine ECG monitoring recommended? J Psychiatr Pract. 2014;20(3):196–206.
- , , , , . Risk of death associated with the use of conventional versus atypical antipsychotic drugs among elderly patients. CMAJ. 2007;176(5):627–632.
- , , , et al. Effectiveness of acute geriatric unit care using acute care for elders components: a systematic review and meta‐analysis. J Am Geriatr Soc. 2012;60(12):2237–2245.
- , , , , . The Hospital Elder Life Program: a model of care to prevent cognitive and functional decline in older hospitalized patients. J Am Geriatr Soc. 2000;48(12):1697–1706.
- , , , . Persistent delirium in older hospital patients: a systematic review of frequency and prognosis. Age Ageing. 2009;38(1):19–26.
Antipsychotic (AP) medications are often used in the hospitalized geriatric population for the treatment of delirium.[1] Because of adverse events associated with APs, efforts have been made to reduce their use in hospitalized elders,[2] but it is not clear if these recommendations have been widely adopted. We studied the use of APs in a cohort of hospitalized elders to better understand why APs are started and how often they are continued on discharge.
METHODS
We conducted a retrospective cohort study of patients aged 65 years or older admitted to a tertiary care hospital between October 1, 2012 and September 31, 2013. Using Stata's (StataCorp., College Station, TX) sample command,[3] we included a subset of randomly selected inpatients who received more than 1 dose of oral APs (determined using the electronic medication administration summary). We excluded patients admitted under observation status or to the psychiatric service, those who were on APs prior to admission, and those who only received prochloperazine for nausea. Using prior literature to identify terms frequently used to describe delirium (Figure 1), we created an algorithm and a chart abstraction form (see Supporting Information, Appendix 1, in the online version of this article).[4] We tested these instruments in a preliminary chart review involving 30 patients. Disagreements were discussed with coauthors and resolved through consensus, resulting in some algorithm changes (eg, excluding a large number of patients who received only 1 dose of haloperidol postoperatively, because we hypothesized that this use could be a prophylactic measure).[5] Two investigators extracted the remaining charts independently. We used descriptive statistics and performed cross‐tabulations on the selected variables.
RESULTS
Of 12,817 geriatric hospitalizations during the study period, 1120 (9%) were treated with antipsychotics. We randomly selected 300 of these for extraction: 54% were male, and 67% were admitted to the medical service (Table 1). The inpatient mortality rate was 10% (30/300). The most frequent indication for AP use was delirium (83%, 249/300). Only 35% of delirious patients received a formal assessment with the Confusion Assessment Method (CAM). The most commonly used atypical antipsychotic was quetiapine (86%); 55% received more than 1 antipsychotic medication during hospitalization, and 48% (143/297) of patients were continued on APs at discharge (excluding 3 patients transferred to other acute care hospitals).
| Variable | N (%), Total=300 |
|---|---|
| |
| Gender | |
| Male | 161 (54) |
| Female | 139 (46) |
| Inpatient mortality rate | 30 (10) |
| Services | |
| Medicine | 202 (67) |
| Surgery | 98 (33) |
| Indication for APs use | |
| Delirium | 249 (83) |
| Hallucinations | 19 (6) |
| Anxiety | 20 (7) |
| Other | 38 (13) |
| Atypical APs | |
| Quetiapine | 257 (86) |
| Olanzapine | 29 (10) |
| Risperidone | 26 (9) |
| Typical APs | |
| Haloperidol | 166 (55) |
| Thorazine | 4 (1) |
| Use of CAM | 79 (32)a |
| Physical restraints | 89 (30) |
| Documented or suspected dementia | 134 (45) |
| Geriatrics consults | 120 (40) |
| Psychiatric consults | 29 (10) |
| ECG | |
| Prior to APs administration | 265 (88) |
| After APs administration | 157 (52) |
| QTc prolongation >500 ms | |
| Prior to APs administration | 41 (15)b |
| After APs administration | 39 (25)c |
| Admitted from SNF | 36 (12) |
| Discharge destination | |
| Home | 68 (23) |
| SNFs, short and long‐term rehabilitations | 199 (66) |
| Transfer to other acute care hospitals | 3 (1) |
| Continuation of APs at discharge | 143 (48)d |
Approximately 45% (134/300) had documented or suspected dementia, and 30% (89/300) were physically restrained during the hospital stay. Consultations with geriatrics were obtained in 40% (120/300) of the cases and with psychiatry in 10% (29/300) of the cases. Neurology is rarely consulted for delirium in our institution; thus, we did not collect data on those referrals. Electrocardiography (ECG) (recommended for patients at high cardiac risk[6]) was performed in 88% (265/300) of patients prior to AP administration and 52% (157/300) after. The corrected QT interval exceeded 500 ms in 15% (41/265) of patients prior to AP administration and 25% (39/157) after. Although few patients (12%) were admitted from nursing facilities, 66% (199/300) were eventually discharged to skilled nursing facilities (SNFs) or rehabilitation facilities; most of these patients (117/199, 59%) received AP treatment, compared to 38% of patients discharged to home (26/68).
DISCUSSION
In a cohort of hospitalized elders, we found that 9% were treated with APs. Most received APs for perceived delirium; in‐hospital ECG monitoring was suboptimal. Half of the patients started on APs remained on them at discharge; those discharged to SNFs were more likely to receive ongoing AP treatment.
Our study is limited by its retrospective, single‐center design, a lack of inter‐rater reliability measurement (although our training process was designed to standardize extraction methods), and the infrequent use of formal CAM assessment. Additionally, we were unable to determine how frequently APs were initiated in the intensive care unit. Any retrospective study is limited by the difficulty of distinguishing delirium from the behavioral and psychiatric symptoms of dementia, but we identified delirium using standard terms described in previous literature.
Our study also has a number of important implications. Because of a reported association between the use of APs and risk of death in the postacute setting,[7] national provider organizations have called for a reduction in AP initiation in hospitalized elders.[2] However, this study indicates that APs continue to be prescribed for delirium, which may be attributed to the lack of behavioral modification options in most hospitals, such as acute care for elders (ACE) units and hospital elder life programs (HELP).[8, 9] Our findings suggest that this problem would be further amplified in hospitals that lack access to geriatrics expertise.
Without alternative behavioral options, patients are at risk for prolonged delirium, which is associated with significant suffering and subsequent risk of further cognitive impairment and death.[10] Although evidence for the efficacy of APs in the treatment of delirium is limited and inconclusive, no better pharmacologic options exist. Hospitals that wish to reduce use of APs should therefore consider investing in environmental interventions (eg, ACE units, HELP), which lower the incidence of delirium and could, in turn, decrease the prescription and continuation of antipsychotics.[8, 9]
Acknowledgements
The authors acknowledge Mihaela Stefan, MD, FACP, for her comments on an earlier draft of this manuscript.
Disclosures: Drs. Lagu and Loh had full access to all of the data in the study. They take responsibility for the integrity of the data and the accuracy of the analysis. Drs. Loh, Brennan, Lindenauer, and Lagu conceived of the study. Drs. Loh and Ramdass acquired the data. Ms. Garb analyzed and interpreted the data. Dr. Loh drafted the manuscript. Drs Brennan, Lindenauer, and Lagu, and Ms. Garb critically reviewed the manuscript for important intellectual content. Dr. Lagu is supported by the National Heart, Lung, and Blood Institute of the National Institutes of Health under award number K01HL114745. The authors report no conflicts of interest.
- , , , , , . Delirium in elderly patients and the risk of postdischarge mortality, institutionalization, and dementia: a meta‐analysis. JAMA. 2010;304(4):443–451.
- . Off‐label use of antipsychotics for dementia patients discouraged. The Hospitalist. November 2012\http://www.the‐hospitalist.org/details/article/2785121/Off‐Label_Use_of_Antipsychotics_for_Dementia_Patients_Discouraged.html. Accessed June 29, 2014.
- STATA/MP [computer program]. Version 13.1 for Windows. College Station, TX: StataCorp; 2013.
- , , , , , . Association between sedating medications and delirium in older inpatients. J Am Geriatr Soc. 2013;61(6):923–930.
- , , , et al. Haloperidol prophylaxis decreases delirium incidence in elderly patients after noncardiac surgery: a randomized controlled trial. Crit Care Med. 2012;40(3):731–739.
- , , . QTc prolongation with antipsychotics: is routine ECG monitoring recommended? J Psychiatr Pract. 2014;20(3):196–206.
- , , , , . Risk of death associated with the use of conventional versus atypical antipsychotic drugs among elderly patients. CMAJ. 2007;176(5):627–632.
- , , , et al. Effectiveness of acute geriatric unit care using acute care for elders components: a systematic review and meta‐analysis. J Am Geriatr Soc. 2012;60(12):2237–2245.
- , , , , . The Hospital Elder Life Program: a model of care to prevent cognitive and functional decline in older hospitalized patients. J Am Geriatr Soc. 2000;48(12):1697–1706.
- , , , . Persistent delirium in older hospital patients: a systematic review of frequency and prognosis. Age Ageing. 2009;38(1):19–26.
Impact of HOCDI on Sepsis Patients
There are approximately 3 million cases of Clostridium difficile infection (CDI) per year in the United States.[1, 2, 3, 4] Of these, 10% result in a hospitalization or occur as a consequence of the exposures and treatments associated with hospitalization.[1, 2, 3, 4] Some patients with CDI experience mild diarrhea that is responsive to therapy, but other patients experience severe, life‐threatening disease that is refractory to treatment, leading to pseudomembranous colitis, toxic megacolon, and sepsis with a 60‐day mortality rate that exceeds 12%.[5, 6, 7, 8, 9, 10, 11, 12, 13, 14]
Hospital‐onset CDI (HOCDI), defined as C difficile‐associated diarrhea and related symptoms with onset more than 48 hours after admission to a healthcare facility,[15] represents a unique marriage of CDI risk factors.[5] A vulnerable patient is introduced into an environment that contains both exposure to C difficile (through other patients or healthcare workers) and treatment with antibacterial agents that may diminish normal flora. Consequently, CDI is common among hospitalized patients.[16, 17, 18] A particularly important group for understanding the burden of disease is patients who initially present to the hospital with sepsis and subsequently develop HOCDI. Sepsis patients are often critically ill and are universally treated with antibiotics.
Determining the incremental cost and mortality risk attributable to HOCDI is methodologically challenging. Because HOCDI is associated with presenting severity, the sickest patients are also the most likely to contract the disease. HOCDI is also associated with time of exposure or length of stay (LOS). Because LOS is a risk factor, comparing LOS between those with and without HOCDI will overestimate the impact if the time to diagnosis is not taken into account.[16, 17, 19, 20] We aimed to examine the impact of HOCDI in hospitalized patients with sepsis using a large, multihospital database with statistical methods that took presenting severity and time to diagnosis into account.
METHODS
Data Source and Subjects
Permission to conduct this study was obtained from the institutional review board at Baystate Medical Center. We used the Premier Healthcare Informatics database, a voluntary, fee‐supported database created to measure quality and healthcare utilization, which has been used extensively in health services research.[21, 22, 23] In addition to the elements found in hospital claims derived from the uniform billing 04 form, Premier data include an itemized, date‐stamped log of all items and services charged to the patient or their insurer, including medications, laboratory tests, and diagnostic and therapeutic services. Approximately 75% of hospitals that submit data also provide information on actual hospital costs, taken from internal cost accounting systems. The rest provide cost estimates based on Medicare cost‐to‐charge ratios. Participating hospitals are similar to the composition of acute care hospitals nationwide, although they are more commonly small‐ to midsized nonteaching facilities and are more likely to be located in the southern United States.
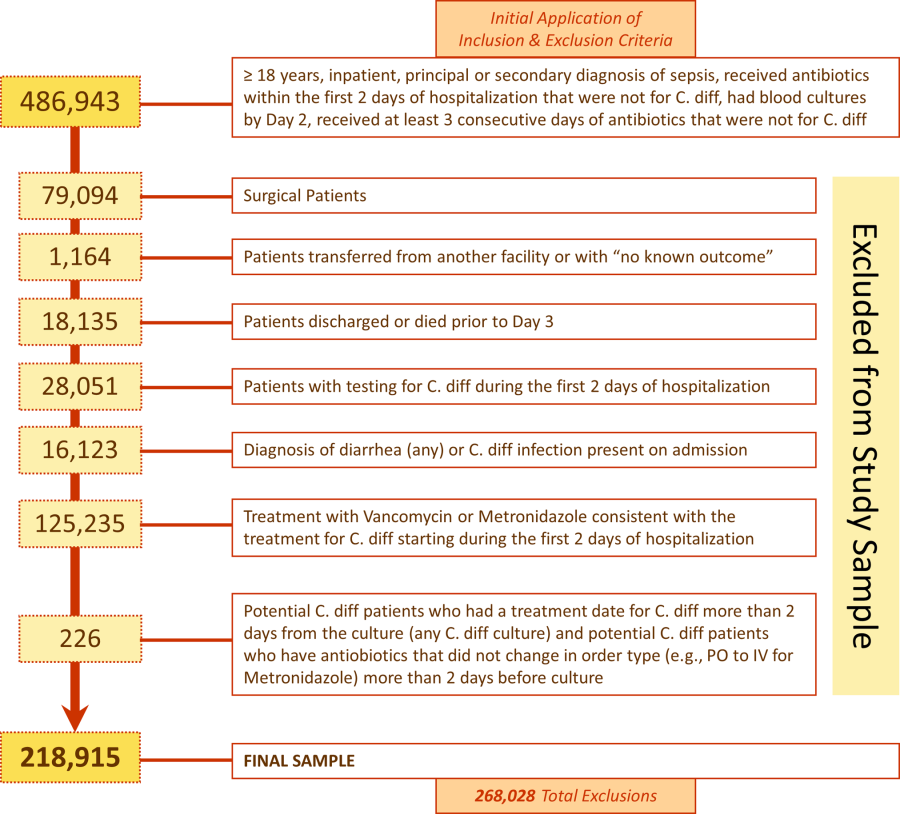
We included medical (nonsurgical) adult patients with sepsis who were admitted to a participating hospital between July 1, 2004 and December 31, 2010. Because we sought to focus on the care of patients who present to the hospital with sepsis, we defined sepsis as the presence of a diagnosis of sepsis plus evidence of both blood cultures and antibiotic treatment within the first 2 days of hospitalization; we used the first 2 days of hospitalization rather than just the first day because, in administrative datasets, the duration of the first hospital day includes partial days that can vary in length. We excluded patients who died or were discharged prior to day 3, because HOCDI is defined as onset after 48 hours in a healthcare facility.[15] We also excluded surviving patients who received less than 3 consecutive days of antibiotics, and patients who were transferred from or to another acute‐care facility; the latter exclusion criterion was used because we could not accurately determine the onset or subsequent course of their illness.
Identification of Patients at Risk for and Diagnosed With HOCDI
Among eligible patients with sepsis, we aimed to identify a cohort at risk for developing CDI during the hospital stay. We excluded patients: (1) with a diagnosis indicating that diarrhea was present on admission, (2) with a diagnosis of CDI that was indicated to be present on admission, (3) who were tested for CDI on the first or second hospital day, and (4) who received an antibiotic that could be consistent with treatment for CDI (oral or intravenous [IV] metronidazole or oral vancomycin) on hospital days 1 or 2.
Next, we aimed to identify sepsis patients at risk for HOCDI who developed HOCDI during their hospital stay. Among eligible patients described above, we considered a patient to have HOCDI if they had an International Classification of Diseases, Ninth Revision, Clinical Modification diagnosis of CDI (primary or secondary but not present on admission), plus evidence of testing for CDI after hospital day 2, and treatment with oral vancomycin or oral or IV metronidazole that was started after hospital day 2 and within 2 days of the C difficile test, and evidence of treatment for CDI for at least 3 days unless the patient was discharged or died.
Patient Information
We recorded patient age, gender, marital status, insurance status, race, and ethnicity. Using software provided by the Healthcare Costs and Utilization Project of the Agency for Healthcare Research and Quality, we categorized information on 30 comorbid conditions. We also created a single numerical comorbidity score based on a previously published and validated combined comorbidity score that predicts 1‐year mortality.[24] Based on a previously described algorithm,[25] we used diagnosis codes to assess the source (lung, abdomen, urinary tract, blood, other) and type of sepsis (Gram positive, Gram negative, mixed, anaerobic, fungal). Because patients can have more than 1 potential source of sepsis (eg, pneumonia and urinary tract infection) and more than 1 organism causing infection (eg, urine with Gram negative rods and blood culture with Gram positive cocci), these categories are not mutually exclusive (see Supporting Table 1 in the online version of this article). We used billing codes to identify the use of therapies, monitoring devices, and pharmacologic treatments to characterize both initial severity of illness and severity at the time of CDI diagnosis. These therapies are included in a validated sepsis mortality prediction model (designed for administrative datasets) with similar discrimination and calibration to clinical intensive care unit (ICU) risk‐adjustment models such as the mortality probability model, version III.[26, 27]
Outcomes
Our primary outcome of interest was in‐hospital mortality. Secondary outcomes included LOS and costs for survivors only and for all patients.
Statistical Methods
We calculated patient‐level summary statistics for all patients using frequencies for binary variables and medians and interquartile percentiles for continuous variables. P values <0.05 were considered statistically significant.
To account for presenting severity and time to diagnosis, we used methods that have been described elsewhere.[12, 13, 18, 20, 28] First, we identified patients who were eligible to develop HOCDI. Second, for all eligible patients, we identified a date of disease onset (index date). For patients who met criteria for HOCDI, this was the date on which the patient was tested for CDI. For eligible patients without disease, this was a date randomly assigned to any time during the hospital stay.[29] Next, we developed a nonparsimonious propensity score model that included all patient characteristics (demographics, comorbidities, sepsis source, and severity of illness on presentation and on the index date; all variables listed in Table 1 were included in the propensity model). Some of the variables for this model (eg, mechanical ventilation and vasopressors) were derived from a validated severity model.[26] We adjusted for correlation within hospital when creating the propensity score using Huber‐White robust standard error estimators clustered at the hospital level.[30] We then created matched pairs with the same LOS prior to the index date and similar propensity for developing CDI. We first matched on index date, and then, within each index‐datematched subset, matched patients with and without HOCDI by their propensity score using a 5‐to‐1 greedy match algorithm.[31] We used the differences in LOS between the cases and controls after the index date to calculate the additional attributable LOS estimates; we also separately estimated the impact on cost and LOS in a group limited to those who survived after discharge because of concerns that death could shorten LOS and reduce costs.
| Before Matching | After Matching | |||||
|---|---|---|---|---|---|---|
| HOCDI, n=2,368, % | No CDI, n=216,547, % | P | HOCDI, n=2,368, % | No CDI, n=2,368, % | P | |
| ||||||
| Age, y | 70.9 (15.1) | 68.6 (16.8) | <0.01 | 70.9 (15.1) | 69.8 (15.9) | 0.02 |
| Male | 46.8 | 46.0 | 0.44 | 46.8 | 47.2 | 0.79 |
| Race | ||||||
| White | 61.0 | 63.3 | 61.0 | 58.1 | ||
| Black | 15.6 | 14.5 | <0.01 | 15.6 | 17.0 | 0.11 |
| Hispanic | 3.2 | 5.4 | 3.2 | 4.1 | ||
| Other race | 20.2 | 16.8 | 20.2 | 20.9 | ||
| Marital status | ||||||
| Married | 31.6 | 36.3 | <0.01 | 31.6 | 32.6 | 0.74 |
| Single/divorced | 52.8 | 51.1 | 52.8 | 52.0 | ||
| Other/unknown | 15.7 | 12.6 | 15.7 | 14.5 | ||
| Insurance status | ||||||
| Medicare traditional | 63.2 | 59.5 | 63.2 | 60.3 | ||
| Medicare managed | 10.6 | 10.1 | 10.6 | 10.9 | ||
| Medicaid traditional | 7.6 | 6.9 | 7.6 | 8.2 | ||
| Medicaid managed | 1.8 | 2.0 | <0.01 | 1.8 | 1.8 | 0.50 |
| Managed care | 10.8 | 12.3 | 10.8 | 12.0 | ||
| Commercial | 2.0 | 3.5 | 2.0 | 2.2 | ||
| Self‐pay/other/unknown | 4.0 | 5.7 | 4.0 | 4.7 | ||
| Infection source | ||||||
| Respiratory | 46.5 | 37.0 | <0.01 | 46.5 | 49.6 | 0.03 |
| Skin/bone | 10.1 | 8.6 | 0.01 | 10.1 | 11.2 | 0.21 |
| Urinary | 52.2 | 51.3 | 0.38 | 52.2 | 50.3 | 0.18 |
| Blood | 11.1 | 15.1 | <0.01 | 11.1 | 11.5 | 0.65 |
| Infecting organism | ||||||
| Gram negative | 35.0 | 36.6 | <0.01 | 35.0 | 33.1 | 0.18 |
| Anaerobe | 1.4 | 0.7 | <0.01 | 1.4 | 1.1 | 0.24 |
| Fungal | 17.5 | 7.5 | <0.01 | 17.5 | 18.3 | 0.44 |
| Most common comorbid conditions | ||||||
| Congestive heart failure | 35.1 | 24.6 | <0.01 | 35.1 | 37.5 | 0.06 |
| Chronic lung disease | 31.6 | 27.6 | <0.01 | 31.6 | 32.1 | 0.71 |
| Hypertension | 31.5 | 37.7 | <0.01 | 31.5 | 29.7 | 0.16 |
| Renal Failure | 29.7 | 23.8 | <0.01 | 29.7 | 31.2 | 0.28 |
| Weight Loss | 27.7 | 13.3 | <0.01 | 27.7 | 29.4 | 0.17 |
| Treatments by day 2 | ||||||
| ICU admission | 40.0 | 29.5 | <0.01 | 40.0 | 40.7 | 0.64 |
| Use of bicarbonate | 12.2 | 7.1 | <0.01 | 12.2 | 13.6 | 0.15 |
| Fresh frozen plasma | 1.4 | 1.0 | 0.03 | 1.4 | 1.1 | 0.36 |
| Inotropes | 1.4 | 0.9 | 0.01 | 1.4 | 2.2 | 0.04 |
| Hydrocortisone | 6.7 | 4.7 | <0.01 | 6.7 | 7.4 | 0.33 |
| Thiamine | 4.2 | 3.3 | 0.01 | 4.2 | 4.1 | 0.83 |
| Psychotropics (eg, haldol for delirium) | 10.0 | 9.2 | 0.21 | 10.0 | 10.8 | 0.36 |
| Restraints (eg, for delirium) | 2.0 | 1.5 | 0.05 | 2.0 | 2.5 | 0.29 |
| Angiotensin‐converting enzyme inhibitors | 12.1 | 13.2 | 0.12 | 12.1 | 10.9 | 0.20 |
| Statins | 18.8 | 21.1 | 0.01 | 18.8 | 16.9 | 0.09 |
| Drotrecogin alfa | 0.6 | 0.3 | 0.00 | 0.6 | 0.6 | 0.85 |
| Foley catheter | 19.2 | 19.8 | 0.50 | 19.2 | 22.0 | 0.02 |
| Diuretics | 28.5 | 25.4 | 0.01 | 28.5 | 29.6 | 0.42 |
| Red blood cells | 15.5 | 10.6 | <0.01 | 15.5 | 15.8 | 0.81 |
| Calcium channel blockers | 19.3 | 16.8 | 0.01 | 19.3 | 19.1 | 0.82 |
| ‐Blockers | 32.7 | 29.6 | 0.01 | 32.7 | 30.6 | 0.12 |
| Proton pump inhibitors | 59.6 | 53.1 | <0.01 | 59.6 | 61.0 | 0.31 |
Analysis Across Clinical Subgroups
In a secondary analysis, we examined heterogeneity in the association between HOCDI and outcomes within subsets of patients defined by age, combined comorbidity score, and admission to the ICU by day 2. We created separate propensity scores using the same covariates in the primary analysis, but limited matches to within these subsets. For each group, we examined how the covariates in the HOCDI and control groups differed after matching with inference tests that took the paired nature of the data into account. All analyses were carried out using Stata/SE 11.1 (StataCorp, College Station, TX).
RESULTS
We identified 486,943 adult sepsis admissions to a Premier hospital between July 1, 2004 and December 31, 2010. After applying all exclusion criteria, we had a final sample of 218,915 admissions with sepsis (from 400 hospitals) at risk for HOCDI (Figure 1). Of these, 2368 (1.08%) met criteria for diagnosis of CDI after hospital day 2 and were matched to controls using index date and propensity score.
Patient and Hospital Factors
After matching, the median age was 71 years in cases and 70 years in controls (Table 1). Less than half (46%) of the population was male. Most cases (61%) and controls (58%) were white. Heart failure, hypertension, chronic lung disease, renal failure, and weight loss were the most common comorbid conditions. Our propensity model, which had a C statistic of 0.75, identified patients whose risk varied from a mean of 0.1% in the first decile to a mean of 3.8% in the tenth decile. Before matching, 40% of cases and 29% of controls were treated in the ICU by hospital day 2; after matching, 40% of both cases and controls were treated in the ICU by hospital day 2.
Distribution by LOS, Index Day, and Risk for Mortality
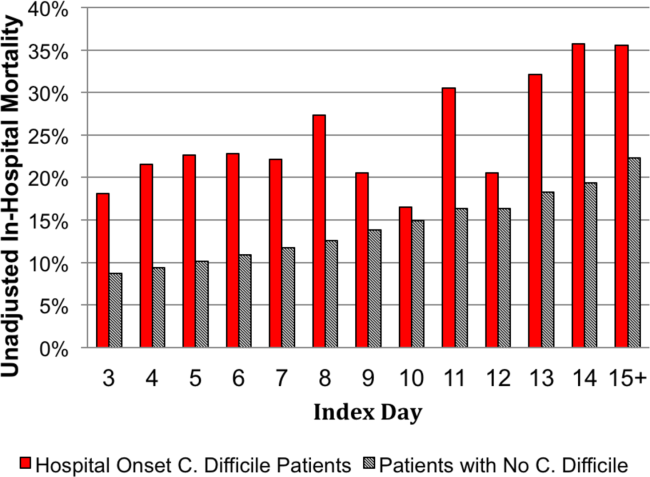
The unadjusted and unmatched LOS was longer for cases than controls (19 days vs 8 days, Table 2) (see Supporting Figure 1 in the online version of this article). Approximately 90% of the patients had an index day of 14 or less (Figure 2). Among patients both with and without CDI, the unadjusted mortality risk increased as the index day (and thus the total LOS) increased.
| Outcome | HOCDI | No HOCDI | Difference (95% CI) | P |
|---|---|---|---|---|
| ||||
| Length of stay, d | ||||
| Raw results | 19.2 | 8.3 | 8.4 (8.48.5) | <0.01 |
| Raw results for survivors only | 18.6 | 8.0 | 10.6 (10.311.0) | <0.01 |
| Matched results | 19.2 | 14.2 | 5.1(4.45.7) | <0.01 |
| Matched results for survivors only | 18.6 | 13.6 | 5.1 (4.45.8) | <0.01 |
| Mortality, % | ||||
| Raw results | 24.0 | 10.1 | 13.9 (12.615.1), RR=2.4 (2.22.5) | <0.01 |
| Matched results | 24.0 | 15.4 | 8.6 (6.410.9), RR=1.6 (1.41.8) | <0.01 |
| Costs, US$ | ||||
| Raw results median costs [interquartile range] | $26,187 [$15,117$46,273] | $9,988 [$6,296$17,351] | $16,190 ($15,826$16,555) | <0.01 |
| Raw results for survivors only [interquartile range] | $24,038 [$14,169$41,654] | $9,429 [$6,070$15,875] | $14,620 ($14,246$14,996) | <0.01 |
| Matched results [interquartile range] | $26,187 [$15,117$46,273] | $19,160 [$12,392$33,777] | $5,308 ($4,521$6,108) | |
| Matched results for survivors only [interquartile range] | $24,038 [$14,169$41,654] | $17,811 [$11,614$29,298] | $4,916 ($4,088$5,768) | <0.01 |
Adjusted Results
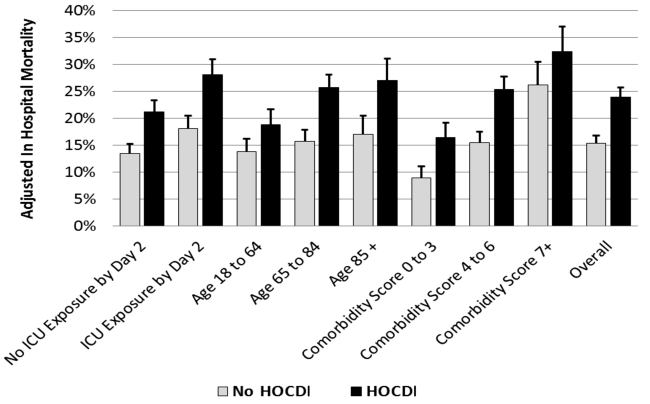
Compared to patients without disease, HOCDI patients had an increased unadjusted mortality (24% vs 10%, P<0.001). This translates into a relative risk of 2.4 (95% confidence interval [CI]: 2.2, 2.5). In the matched cohort, the difference in the mortality rates was attenuated, but still significantly higher in the HOCDI patients (24% versus 15%, P<0.001, an absolute difference of 9%; 95% CI: 6.410.8). The adjusted relative risk of mortality for HOCDI was 1.6 (95% CI: 1.41.8; Table 2). After matching, patients with CDI had a LOS of 19.2 days versus 14.2 days in matched controls (difference of 5.1 days; 95% CI: 4.45.7; P<0.001). When the LOS analysis was limited to survivors only, this difference of 5 days remained (P<0.001). In an analysis limited to survivors only, the difference in median costs between cases and controls was $4916 (95% CI: $4088$5768; P<0.001). In a secondary analysis examining heterogeneity between HOCDI and outcomes across clinical subgroups, the absolute difference in mortality and costs between cases and controls varied across demographics, comorbidity, and ICU admission, but the relative risks were similar (Figure 3) (see Supporting Figure 3 in the online version of this article).
DISCUSSION
In this large cohort of patients with sepsis, we found that approximately 1 in 100 patients with sepsis developed HOCDI. Even after matching with controls based on the date of symptom onset and propensity score, patients who developed HOCDI were more than 1.6 times more likely to die in the hospital. HOCDI also added 5 days to the average hospitalization for patients with sepsis and increased median costs by approximately $5000. These findings suggest that a hospital that prevents 1 case of HOCDI per month in sepsis patients could avoid 1 death and 60 inpatient days annually, achieving an approximate yearly savings of $60,000.
Until now, the incremental cost and mortality attributable to HOCDI in sepsis patients have been poorly understood. Attributing outcomes can be methodologically challenging because patients who are at greatest risk for poor outcomes are the most likely to contract the disease and are at risk for longer periods of time. Therefore, it is necessary to take into account differences in severity of illness and time at risk between diseased and nondiseased populations and to ensure that outcomes attributed to the disease occur after disease onset.[28, 32] The majority of prior studies examining the impact of CDI on hospitalized patients have been limited by a lack of adequate matching to controls, small sample size, or failure to take into account time to infection.[16, 17, 19, 20]
A few studies have taken into account severity, time to infection, or both in estimating the impact of HOCDI. Using a time‐dependent Cox model that accounted for time to infection, Micek et al. found no difference in mortality but a longer LOS in mechanically ventilated patients (not limited to sepsis) with CDI.[33] However, their study was conducted at only 3 centers, did not take into account severity at the time of diagnosis, and did not clearly distinguish between community‐onset CDI and HOCDI. Oake et al. and Forster et al. examined the impact of CDI on patients hospitalized in a 2‐hospital health system in Canada.[12, 13] Using the baseline mortality estimate in a Cox multivariate proportional hazards regression model that accounted for the time‐varying nature of CDI, they found that HOCDI increased absolute risk of death by approximately 10%. Also, notably similar to our study were their findings that HOCDI occurred in approximately 1 in 100 patients and that the attributable median increase in LOS due to hospital‐onset CDI was 6 days. Although methodologically rigorous, these 2 small studies did not assess the impact of CDI on costs of care, were not focused on sepsis patients or even patients who received antibiotics, and also did not clearly distinguish between community‐onset CDI and HOCDI.
Our study therefore has important strengths. It is the first to examine the impact of HOCDI, including costs, on the outcomes of patients hospitalized with sepsis. The fact that we took into account both time to diagnosis and severity at the time of diagnosis (by using an index date for both cases and controls and determining severity on that date) prevented us from overestimating the impact of HOCDI on outcomes. The large differences in outcomes we observed in unadjusted and unmatched data were tempered after multivariate adjustment (eg, difference in LOS from 10.6 days to 5.1 additional days, costs from $14,620 to $4916 additional costs after adjustment). Our patient sample was derived from a large, multihospital database that contains actual hospital costs as derived from internal accounting systems. The fact that our study used data from hundreds of hospitals means that our estimates of cost, LOS, and mortality may be more generalizable than the work of Micek et al., Oake et al., and Forster et al.
This work also has important implications. First, hospital administrators, clinicians, and researchers can use our results to evaluate the cost‐effectiveness of HOCDI prevention measures (eg, hand hygiene programs, antibiotic stewardship). By quantifying the cost per case in sepsis patients, we allow administrators and researchers to compare the incremental costs of HOCDI prevention programs to the dollars and lives saved due to prevention efforts. Second, we found that our propensity model identified patients whose risk varied greatly. This suggests that an opportunity exists to identify subgroups of patients that are at highest risk. Identifying high‐risk subgroups will allow for targeted risk reduction interventions and the opportunity to reduce transmission (eg, by placing high‐risk patients in a private room). Finally, we have reaffirmed that time to diagnosis and presenting severity need to be rigorously addressed prior to making estimates of the impact of CDI burden and other hospital‐acquired conditions and injuries.
There are limitations to this study as well. We did not have access to microbiological data. However, we required a diagnosis code of CDI, evidence of testing, and treatment after the date of testing to confirm a diagnosis. We also adopted detailed exclusion criteria to ensure that CDI that was not present on admission and that controls did not have CDI. These stringent inclusion and exclusion criteria strengthened the internal validity of our estimates of disease impact. We used administrative claims data, which limited our ability to adjust for severity. However, the detailed nature of the database allowed us to use treatments, such as vasopressors and antibiotics, to identify cases; treatments were also used as a validated indicator of severity,[26] which may have helped to reduce some of this potential bias. Although our propensity model included many predictors of CDI, such as use of proton pump inhibitors and factors associated with mortality, not every confounder was completely balanced after propensity matching, although the statistical differences may have been related to our large sample size and therefore might not be clinically significant. We also may have failed to include all possible predictors of CDI in the propensity model.
In a large, diverse cohort of hospitalized patients with sepsis, we found that HOCDI lengthened hospital stay by approximately 5 days, increased risk of in‐hospital mortality by 9%, and increased hospital cost by approximately $5000 per patient. These findings highlight the importance of identifying effective prevention measures and of determining the patient populations at greatest risk for HOCDI.
Disclosures: The study was conducted with funding from the Division of Critical Care and the Center for Quality of Care Research at Baystate Medical Center. Dr. Lagu is supported by the National Heart, Lung, and Blood Institute of the National Institutes of Health under award number K01HL114745. Dr. Stefan is supported by the National Heart, Lung, and Blood Institute of the National Institutes of Health under award number K01HL114631. Drs. Lagu and Lindenauer had full access to all of the data in the study; they take responsibility for the integrity of the data and the accuracy of the data analysis. Drs. Lagu, Lindenauer, Steingrub, Higgins, Stefan, Haessler, and Rothberg conceived of the study. Dr. Lindenauer acquired the data. Drs. Lagu, Lindenauer, Rothberg, Steingrub, Nathanson, Stefan, Haessler, Higgins, and Mr. Hannon analyzed and interpreted the data. Dr. Lagu drafted the manuscript. Drs. Lagu, Lindenauer, Rothberg, Steingrub, Nathanson, Stefan, Haessler, Higgins, and Mr. Hannon critically reviewed the manuscript for important intellectual content. Dr. Nathanson carried out the statistical analyses. Dr. Nathanson, through his company OptiStatim LLC, was paid by the investigators with funding from the Department of Medicine at Baystate Medical Center to assist in conducting the statistical analyses in this study. The authors report no further conflicts of interest.
- , , , . Increasing prevalence and severity of Clostridium difficile colitis in hospitalized patients in the United States. Arch Surg. 2007;142(7):624–631; discussion 631.
- , , , et al. The changing epidemiology of Clostridium difficile infections. Clin Microbiol Rev. 2010;23(3):529–549.
- , . Clostridium Difficile‐Associated Disease in U.S. Hospitals, 1993–2005. HCUP Statistical Brief #50. April 2008. Agency for Healthcare Research and Quality, Rockville, MD. Available at: http://www.hcup‐us.ahrq.gov/reports/statbriefs/sb50.pdf. Accessed April 4, 2014.
- , , , . National point prevalence of Clostridium difficile in US health care facility inpatients, 2008. Am J Infect Control. 2009;37(4):263–270.
- . A 76‐year‐old man with recurrent Clostridium difficile‐associated diarrhea: review of C. difficile infection. JAMA. 2009;301(9):954–962.
- , , , , , . Recurrent Clostridium difficile disease: epidemiology and clinical characteristics. Infect Control Hosp Epidemiol. 1999;20(1):43–50.
- , , , , , . Recurrent Clostridium difficile diarrhea: characteristics of and risk factors for patients enrolled in a prospective, randomized, double‐blinded trial. Clin Infect Dis. 1997;24(3):324–333.
- . Narrative review: the new epidemic of Clostridium difficile‐associated enteric disease. Ann Intern Med. 2006;145(10):758–764.
- , , , et al. Impact of emergency colectomy on survival of patients with fulminant Clostridium difficile colitis during an epidemic caused by a hypervirulent strain. Ann Surg. 2007;245(2):267–272.
- , , , . Hospital‐acquired Clostridium difficile‐associated disease in the intensive care unit setting: epidemiology, clinical course and outcome. BMC Infect Dis. 2007;7:42.
- , , , , , . Factors associated with prolonged symptoms and severe disease due to Clostridium difficile. Age Ageing. 1999;28(2):107–113.
- , , , , , . The effect of hospital‐acquired Clostridium difficile infection on in‐hospital mortality. Arch Intern Med. 2010;170(20):1804–1810.
- , , , , , . The effect of hospital‐acquired infection with Clostridium difficile on length of stay in hospital. CMAJ. 2012;184(1):37–42.
- , . Clostridium difficile—more difficult than ever. N Engl J Med. 2008;359(18):1932–1940.
- , , , et al. Clinical practice guidelines for Clostridium difficile infection in adults: 2010 update by the society for healthcare epidemiology of America (SHEA) and the infectious diseases society of America (IDSA). Infect Control Hosp Epidemiol. 2010;31(5):431–455.
- , , , . Health care costs and mortality associated with nosocomial diarrhea due to Clostridium difficile. Clin Infect Dis. 2002;34(3):346–353.
- , , , , . Short‐ and long‐term attributable costs of Clostridium difficile‐associated disease in nonsurgical inpatients. Clin Infect Dis. 2008;46(4):497–504.
- , , , , . Estimation of extra hospital stay attributable to nosocomial infections: heterogeneity and timing of events. J Clin Epidemiol. 2000;53(4):409–417.
- , , , et al. Attributable outcomes of endemic Clostridium difficile‐associated disease in nonsurgical patients. Emerging Infect Dis. 2008;14(7):1031–1038.
- , . Excess length of stay, charges, and mortality attributable to medical injuries during hospitalization. JAMA. 2003;290(14):1868–1874.
- , , , , , . Association of corticosteroid dose and route of administration with risk of treatment failure in acute exacerbation of chronic obstructive pulmonary disease. JAMA. 2010;303(23):2359–2367.
- , , , , , . The relationship between hospital spending and mortality in patients with sepsis. Arch Intern Med. 2011;171(4):292–299.
- , , , , , . Comparative effectiveness of macrolides and quinolones for patients hospitalized with acute exacerbations of chronic obstructive pulmonary disease (AECOPD). J Hosp Med. 2010;5(5):261–267.
- , , , , . A combined comorbidity score predicted mortality in elderly patients better than existing scores. J Clin Epidemiol. 2011;64(7):749–759.
- , , , , , . Epidemiology of severe sepsis in the United States: analysis of incidence, outcome, and associated costs of care. Crit Care Med. 2001;29(7):1303–1310.
- , , , et al. Development and validation of a model that uses enhanced administrative data to predict mortality in patients with sepsis. Crit Care Med. 2011;39(11):2425–2430.
- , , , , . Incorporating initial treatments improves performance of a mortality prediction model for patients with sepsis. Pharmacoepidemiol Drug Saf. 2012;21(suppl 2):44–52.
- , , , . Nosocomial infection, length of stay, and time‐dependent bias. Infect Control Hosp Epidemiol. 2009;30(3):273–276.
- , , , , , . Length of stay and hospital costs among high‐risk patients with hospital‐origin Clostridium difficile‐associated diarrhea. J Med Econ. 2013;16(3):440–448.
- Rogers. Regression standard errors in clustered samples. Stata Technical Bulletin. 1993;13(13):19–23.
- . Reducing bias in a propensity score matched‐pair sample using greedy matching techniques. In: Proceedings of the 26th Annual SAS Users Group International Conference; April 22–25, 2001; Long Beach, CA. Paper 214‐26. Available at: http://www2.sas.com/proceedings/sugi26/p214‐26.pdf. Accessed April 4, 2014.
- , . Prolongation of length of stay and Clostridium difficile infection: a review of the methods used to examine length of stay due to healthcare associated infections. Antimicrob Resist Infect Control. 2012;1(1):14.
- , , , et al. Clostridium difficile Infection: a multicenter study of epidemiology and outcomes in mechanically ventilated patients. Crit Care Med. 2013;41(8):1968–1975.
There are approximately 3 million cases of Clostridium difficile infection (CDI) per year in the United States.[1, 2, 3, 4] Of these, 10% result in a hospitalization or occur as a consequence of the exposures and treatments associated with hospitalization.[1, 2, 3, 4] Some patients with CDI experience mild diarrhea that is responsive to therapy, but other patients experience severe, life‐threatening disease that is refractory to treatment, leading to pseudomembranous colitis, toxic megacolon, and sepsis with a 60‐day mortality rate that exceeds 12%.[5, 6, 7, 8, 9, 10, 11, 12, 13, 14]
Hospital‐onset CDI (HOCDI), defined as C difficile‐associated diarrhea and related symptoms with onset more than 48 hours after admission to a healthcare facility,[15] represents a unique marriage of CDI risk factors.[5] A vulnerable patient is introduced into an environment that contains both exposure to C difficile (through other patients or healthcare workers) and treatment with antibacterial agents that may diminish normal flora. Consequently, CDI is common among hospitalized patients.[16, 17, 18] A particularly important group for understanding the burden of disease is patients who initially present to the hospital with sepsis and subsequently develop HOCDI. Sepsis patients are often critically ill and are universally treated with antibiotics.
Determining the incremental cost and mortality risk attributable to HOCDI is methodologically challenging. Because HOCDI is associated with presenting severity, the sickest patients are also the most likely to contract the disease. HOCDI is also associated with time of exposure or length of stay (LOS). Because LOS is a risk factor, comparing LOS between those with and without HOCDI will overestimate the impact if the time to diagnosis is not taken into account.[16, 17, 19, 20] We aimed to examine the impact of HOCDI in hospitalized patients with sepsis using a large, multihospital database with statistical methods that took presenting severity and time to diagnosis into account.
METHODS
Data Source and Subjects
Permission to conduct this study was obtained from the institutional review board at Baystate Medical Center. We used the Premier Healthcare Informatics database, a voluntary, fee‐supported database created to measure quality and healthcare utilization, which has been used extensively in health services research.[21, 22, 23] In addition to the elements found in hospital claims derived from the uniform billing 04 form, Premier data include an itemized, date‐stamped log of all items and services charged to the patient or their insurer, including medications, laboratory tests, and diagnostic and therapeutic services. Approximately 75% of hospitals that submit data also provide information on actual hospital costs, taken from internal cost accounting systems. The rest provide cost estimates based on Medicare cost‐to‐charge ratios. Participating hospitals are similar to the composition of acute care hospitals nationwide, although they are more commonly small‐ to midsized nonteaching facilities and are more likely to be located in the southern United States.
We included medical (nonsurgical) adult patients with sepsis who were admitted to a participating hospital between July 1, 2004 and December 31, 2010. Because we sought to focus on the care of patients who present to the hospital with sepsis, we defined sepsis as the presence of a diagnosis of sepsis plus evidence of both blood cultures and antibiotic treatment within the first 2 days of hospitalization; we used the first 2 days of hospitalization rather than just the first day because, in administrative datasets, the duration of the first hospital day includes partial days that can vary in length. We excluded patients who died or were discharged prior to day 3, because HOCDI is defined as onset after 48 hours in a healthcare facility.[15] We also excluded surviving patients who received less than 3 consecutive days of antibiotics, and patients who were transferred from or to another acute‐care facility; the latter exclusion criterion was used because we could not accurately determine the onset or subsequent course of their illness.
Identification of Patients at Risk for and Diagnosed With HOCDI
Among eligible patients with sepsis, we aimed to identify a cohort at risk for developing CDI during the hospital stay. We excluded patients: (1) with a diagnosis indicating that diarrhea was present on admission, (2) with a diagnosis of CDI that was indicated to be present on admission, (3) who were tested for CDI on the first or second hospital day, and (4) who received an antibiotic that could be consistent with treatment for CDI (oral or intravenous [IV] metronidazole or oral vancomycin) on hospital days 1 or 2.
Next, we aimed to identify sepsis patients at risk for HOCDI who developed HOCDI during their hospital stay. Among eligible patients described above, we considered a patient to have HOCDI if they had an International Classification of Diseases, Ninth Revision, Clinical Modification diagnosis of CDI (primary or secondary but not present on admission), plus evidence of testing for CDI after hospital day 2, and treatment with oral vancomycin or oral or IV metronidazole that was started after hospital day 2 and within 2 days of the C difficile test, and evidence of treatment for CDI for at least 3 days unless the patient was discharged or died.
Patient Information
We recorded patient age, gender, marital status, insurance status, race, and ethnicity. Using software provided by the Healthcare Costs and Utilization Project of the Agency for Healthcare Research and Quality, we categorized information on 30 comorbid conditions. We also created a single numerical comorbidity score based on a previously published and validated combined comorbidity score that predicts 1‐year mortality.[24] Based on a previously described algorithm,[25] we used diagnosis codes to assess the source (lung, abdomen, urinary tract, blood, other) and type of sepsis (Gram positive, Gram negative, mixed, anaerobic, fungal). Because patients can have more than 1 potential source of sepsis (eg, pneumonia and urinary tract infection) and more than 1 organism causing infection (eg, urine with Gram negative rods and blood culture with Gram positive cocci), these categories are not mutually exclusive (see Supporting Table 1 in the online version of this article). We used billing codes to identify the use of therapies, monitoring devices, and pharmacologic treatments to characterize both initial severity of illness and severity at the time of CDI diagnosis. These therapies are included in a validated sepsis mortality prediction model (designed for administrative datasets) with similar discrimination and calibration to clinical intensive care unit (ICU) risk‐adjustment models such as the mortality probability model, version III.[26, 27]
Outcomes
Our primary outcome of interest was in‐hospital mortality. Secondary outcomes included LOS and costs for survivors only and for all patients.
Statistical Methods
We calculated patient‐level summary statistics for all patients using frequencies for binary variables and medians and interquartile percentiles for continuous variables. P values <0.05 were considered statistically significant.
To account for presenting severity and time to diagnosis, we used methods that have been described elsewhere.[12, 13, 18, 20, 28] First, we identified patients who were eligible to develop HOCDI. Second, for all eligible patients, we identified a date of disease onset (index date). For patients who met criteria for HOCDI, this was the date on which the patient was tested for CDI. For eligible patients without disease, this was a date randomly assigned to any time during the hospital stay.[29] Next, we developed a nonparsimonious propensity score model that included all patient characteristics (demographics, comorbidities, sepsis source, and severity of illness on presentation and on the index date; all variables listed in Table 1 were included in the propensity model). Some of the variables for this model (eg, mechanical ventilation and vasopressors) were derived from a validated severity model.[26] We adjusted for correlation within hospital when creating the propensity score using Huber‐White robust standard error estimators clustered at the hospital level.[30] We then created matched pairs with the same LOS prior to the index date and similar propensity for developing CDI. We first matched on index date, and then, within each index‐datematched subset, matched patients with and without HOCDI by their propensity score using a 5‐to‐1 greedy match algorithm.[31] We used the differences in LOS between the cases and controls after the index date to calculate the additional attributable LOS estimates; we also separately estimated the impact on cost and LOS in a group limited to those who survived after discharge because of concerns that death could shorten LOS and reduce costs.
| Before Matching | After Matching | |||||
|---|---|---|---|---|---|---|
| HOCDI, n=2,368, % | No CDI, n=216,547, % | P | HOCDI, n=2,368, % | No CDI, n=2,368, % | P | |
| ||||||
| Age, y | 70.9 (15.1) | 68.6 (16.8) | <0.01 | 70.9 (15.1) | 69.8 (15.9) | 0.02 |
| Male | 46.8 | 46.0 | 0.44 | 46.8 | 47.2 | 0.79 |
| Race | ||||||
| White | 61.0 | 63.3 | 61.0 | 58.1 | ||
| Black | 15.6 | 14.5 | <0.01 | 15.6 | 17.0 | 0.11 |
| Hispanic | 3.2 | 5.4 | 3.2 | 4.1 | ||
| Other race | 20.2 | 16.8 | 20.2 | 20.9 | ||
| Marital status | ||||||
| Married | 31.6 | 36.3 | <0.01 | 31.6 | 32.6 | 0.74 |
| Single/divorced | 52.8 | 51.1 | 52.8 | 52.0 | ||
| Other/unknown | 15.7 | 12.6 | 15.7 | 14.5 | ||
| Insurance status | ||||||
| Medicare traditional | 63.2 | 59.5 | 63.2 | 60.3 | ||
| Medicare managed | 10.6 | 10.1 | 10.6 | 10.9 | ||
| Medicaid traditional | 7.6 | 6.9 | 7.6 | 8.2 | ||
| Medicaid managed | 1.8 | 2.0 | <0.01 | 1.8 | 1.8 | 0.50 |
| Managed care | 10.8 | 12.3 | 10.8 | 12.0 | ||
| Commercial | 2.0 | 3.5 | 2.0 | 2.2 | ||
| Self‐pay/other/unknown | 4.0 | 5.7 | 4.0 | 4.7 | ||
| Infection source | ||||||
| Respiratory | 46.5 | 37.0 | <0.01 | 46.5 | 49.6 | 0.03 |
| Skin/bone | 10.1 | 8.6 | 0.01 | 10.1 | 11.2 | 0.21 |
| Urinary | 52.2 | 51.3 | 0.38 | 52.2 | 50.3 | 0.18 |
| Blood | 11.1 | 15.1 | <0.01 | 11.1 | 11.5 | 0.65 |
| Infecting organism | ||||||
| Gram negative | 35.0 | 36.6 | <0.01 | 35.0 | 33.1 | 0.18 |
| Anaerobe | 1.4 | 0.7 | <0.01 | 1.4 | 1.1 | 0.24 |
| Fungal | 17.5 | 7.5 | <0.01 | 17.5 | 18.3 | 0.44 |
| Most common comorbid conditions | ||||||
| Congestive heart failure | 35.1 | 24.6 | <0.01 | 35.1 | 37.5 | 0.06 |
| Chronic lung disease | 31.6 | 27.6 | <0.01 | 31.6 | 32.1 | 0.71 |
| Hypertension | 31.5 | 37.7 | <0.01 | 31.5 | 29.7 | 0.16 |
| Renal Failure | 29.7 | 23.8 | <0.01 | 29.7 | 31.2 | 0.28 |
| Weight Loss | 27.7 | 13.3 | <0.01 | 27.7 | 29.4 | 0.17 |
| Treatments by day 2 | ||||||
| ICU admission | 40.0 | 29.5 | <0.01 | 40.0 | 40.7 | 0.64 |
| Use of bicarbonate | 12.2 | 7.1 | <0.01 | 12.2 | 13.6 | 0.15 |
| Fresh frozen plasma | 1.4 | 1.0 | 0.03 | 1.4 | 1.1 | 0.36 |
| Inotropes | 1.4 | 0.9 | 0.01 | 1.4 | 2.2 | 0.04 |
| Hydrocortisone | 6.7 | 4.7 | <0.01 | 6.7 | 7.4 | 0.33 |
| Thiamine | 4.2 | 3.3 | 0.01 | 4.2 | 4.1 | 0.83 |
| Psychotropics (eg, haldol for delirium) | 10.0 | 9.2 | 0.21 | 10.0 | 10.8 | 0.36 |
| Restraints (eg, for delirium) | 2.0 | 1.5 | 0.05 | 2.0 | 2.5 | 0.29 |
| Angiotensin‐converting enzyme inhibitors | 12.1 | 13.2 | 0.12 | 12.1 | 10.9 | 0.20 |
| Statins | 18.8 | 21.1 | 0.01 | 18.8 | 16.9 | 0.09 |
| Drotrecogin alfa | 0.6 | 0.3 | 0.00 | 0.6 | 0.6 | 0.85 |
| Foley catheter | 19.2 | 19.8 | 0.50 | 19.2 | 22.0 | 0.02 |
| Diuretics | 28.5 | 25.4 | 0.01 | 28.5 | 29.6 | 0.42 |
| Red blood cells | 15.5 | 10.6 | <0.01 | 15.5 | 15.8 | 0.81 |
| Calcium channel blockers | 19.3 | 16.8 | 0.01 | 19.3 | 19.1 | 0.82 |
| ‐Blockers | 32.7 | 29.6 | 0.01 | 32.7 | 30.6 | 0.12 |
| Proton pump inhibitors | 59.6 | 53.1 | <0.01 | 59.6 | 61.0 | 0.31 |
Analysis Across Clinical Subgroups
In a secondary analysis, we examined heterogeneity in the association between HOCDI and outcomes within subsets of patients defined by age, combined comorbidity score, and admission to the ICU by day 2. We created separate propensity scores using the same covariates in the primary analysis, but limited matches to within these subsets. For each group, we examined how the covariates in the HOCDI and control groups differed after matching with inference tests that took the paired nature of the data into account. All analyses were carried out using Stata/SE 11.1 (StataCorp, College Station, TX).
RESULTS
We identified 486,943 adult sepsis admissions to a Premier hospital between July 1, 2004 and December 31, 2010. After applying all exclusion criteria, we had a final sample of 218,915 admissions with sepsis (from 400 hospitals) at risk for HOCDI (Figure 1). Of these, 2368 (1.08%) met criteria for diagnosis of CDI after hospital day 2 and were matched to controls using index date and propensity score.
Patient and Hospital Factors
After matching, the median age was 71 years in cases and 70 years in controls (Table 1). Less than half (46%) of the population was male. Most cases (61%) and controls (58%) were white. Heart failure, hypertension, chronic lung disease, renal failure, and weight loss were the most common comorbid conditions. Our propensity model, which had a C statistic of 0.75, identified patients whose risk varied from a mean of 0.1% in the first decile to a mean of 3.8% in the tenth decile. Before matching, 40% of cases and 29% of controls were treated in the ICU by hospital day 2; after matching, 40% of both cases and controls were treated in the ICU by hospital day 2.
Distribution by LOS, Index Day, and Risk for Mortality
The unadjusted and unmatched LOS was longer for cases than controls (19 days vs 8 days, Table 2) (see Supporting Figure 1 in the online version of this article). Approximately 90% of the patients had an index day of 14 or less (Figure 2). Among patients both with and without CDI, the unadjusted mortality risk increased as the index day (and thus the total LOS) increased.
| Outcome | HOCDI | No HOCDI | Difference (95% CI) | P |
|---|---|---|---|---|
| ||||
| Length of stay, d | ||||
| Raw results | 19.2 | 8.3 | 8.4 (8.48.5) | <0.01 |
| Raw results for survivors only | 18.6 | 8.0 | 10.6 (10.311.0) | <0.01 |
| Matched results | 19.2 | 14.2 | 5.1(4.45.7) | <0.01 |
| Matched results for survivors only | 18.6 | 13.6 | 5.1 (4.45.8) | <0.01 |
| Mortality, % | ||||
| Raw results | 24.0 | 10.1 | 13.9 (12.615.1), RR=2.4 (2.22.5) | <0.01 |
| Matched results | 24.0 | 15.4 | 8.6 (6.410.9), RR=1.6 (1.41.8) | <0.01 |
| Costs, US$ | ||||
| Raw results median costs [interquartile range] | $26,187 [$15,117$46,273] | $9,988 [$6,296$17,351] | $16,190 ($15,826$16,555) | <0.01 |
| Raw results for survivors only [interquartile range] | $24,038 [$14,169$41,654] | $9,429 [$6,070$15,875] | $14,620 ($14,246$14,996) | <0.01 |
| Matched results [interquartile range] | $26,187 [$15,117$46,273] | $19,160 [$12,392$33,777] | $5,308 ($4,521$6,108) | |
| Matched results for survivors only [interquartile range] | $24,038 [$14,169$41,654] | $17,811 [$11,614$29,298] | $4,916 ($4,088$5,768) | <0.01 |
Adjusted Results
Compared to patients without disease, HOCDI patients had an increased unadjusted mortality (24% vs 10%, P<0.001). This translates into a relative risk of 2.4 (95% confidence interval [CI]: 2.2, 2.5). In the matched cohort, the difference in the mortality rates was attenuated, but still significantly higher in the HOCDI patients (24% versus 15%, P<0.001, an absolute difference of 9%; 95% CI: 6.410.8). The adjusted relative risk of mortality for HOCDI was 1.6 (95% CI: 1.41.8; Table 2). After matching, patients with CDI had a LOS of 19.2 days versus 14.2 days in matched controls (difference of 5.1 days; 95% CI: 4.45.7; P<0.001). When the LOS analysis was limited to survivors only, this difference of 5 days remained (P<0.001). In an analysis limited to survivors only, the difference in median costs between cases and controls was $4916 (95% CI: $4088$5768; P<0.001). In a secondary analysis examining heterogeneity between HOCDI and outcomes across clinical subgroups, the absolute difference in mortality and costs between cases and controls varied across demographics, comorbidity, and ICU admission, but the relative risks were similar (Figure 3) (see Supporting Figure 3 in the online version of this article).
DISCUSSION
In this large cohort of patients with sepsis, we found that approximately 1 in 100 patients with sepsis developed HOCDI. Even after matching with controls based on the date of symptom onset and propensity score, patients who developed HOCDI were more than 1.6 times more likely to die in the hospital. HOCDI also added 5 days to the average hospitalization for patients with sepsis and increased median costs by approximately $5000. These findings suggest that a hospital that prevents 1 case of HOCDI per month in sepsis patients could avoid 1 death and 60 inpatient days annually, achieving an approximate yearly savings of $60,000.
Until now, the incremental cost and mortality attributable to HOCDI in sepsis patients have been poorly understood. Attributing outcomes can be methodologically challenging because patients who are at greatest risk for poor outcomes are the most likely to contract the disease and are at risk for longer periods of time. Therefore, it is necessary to take into account differences in severity of illness and time at risk between diseased and nondiseased populations and to ensure that outcomes attributed to the disease occur after disease onset.[28, 32] The majority of prior studies examining the impact of CDI on hospitalized patients have been limited by a lack of adequate matching to controls, small sample size, or failure to take into account time to infection.[16, 17, 19, 20]
A few studies have taken into account severity, time to infection, or both in estimating the impact of HOCDI. Using a time‐dependent Cox model that accounted for time to infection, Micek et al. found no difference in mortality but a longer LOS in mechanically ventilated patients (not limited to sepsis) with CDI.[33] However, their study was conducted at only 3 centers, did not take into account severity at the time of diagnosis, and did not clearly distinguish between community‐onset CDI and HOCDI. Oake et al. and Forster et al. examined the impact of CDI on patients hospitalized in a 2‐hospital health system in Canada.[12, 13] Using the baseline mortality estimate in a Cox multivariate proportional hazards regression model that accounted for the time‐varying nature of CDI, they found that HOCDI increased absolute risk of death by approximately 10%. Also, notably similar to our study were their findings that HOCDI occurred in approximately 1 in 100 patients and that the attributable median increase in LOS due to hospital‐onset CDI was 6 days. Although methodologically rigorous, these 2 small studies did not assess the impact of CDI on costs of care, were not focused on sepsis patients or even patients who received antibiotics, and also did not clearly distinguish between community‐onset CDI and HOCDI.
Our study therefore has important strengths. It is the first to examine the impact of HOCDI, including costs, on the outcomes of patients hospitalized with sepsis. The fact that we took into account both time to diagnosis and severity at the time of diagnosis (by using an index date for both cases and controls and determining severity on that date) prevented us from overestimating the impact of HOCDI on outcomes. The large differences in outcomes we observed in unadjusted and unmatched data were tempered after multivariate adjustment (eg, difference in LOS from 10.6 days to 5.1 additional days, costs from $14,620 to $4916 additional costs after adjustment). Our patient sample was derived from a large, multihospital database that contains actual hospital costs as derived from internal accounting systems. The fact that our study used data from hundreds of hospitals means that our estimates of cost, LOS, and mortality may be more generalizable than the work of Micek et al., Oake et al., and Forster et al.
This work also has important implications. First, hospital administrators, clinicians, and researchers can use our results to evaluate the cost‐effectiveness of HOCDI prevention measures (eg, hand hygiene programs, antibiotic stewardship). By quantifying the cost per case in sepsis patients, we allow administrators and researchers to compare the incremental costs of HOCDI prevention programs to the dollars and lives saved due to prevention efforts. Second, we found that our propensity model identified patients whose risk varied greatly. This suggests that an opportunity exists to identify subgroups of patients that are at highest risk. Identifying high‐risk subgroups will allow for targeted risk reduction interventions and the opportunity to reduce transmission (eg, by placing high‐risk patients in a private room). Finally, we have reaffirmed that time to diagnosis and presenting severity need to be rigorously addressed prior to making estimates of the impact of CDI burden and other hospital‐acquired conditions and injuries.
There are limitations to this study as well. We did not have access to microbiological data. However, we required a diagnosis code of CDI, evidence of testing, and treatment after the date of testing to confirm a diagnosis. We also adopted detailed exclusion criteria to ensure that CDI that was not present on admission and that controls did not have CDI. These stringent inclusion and exclusion criteria strengthened the internal validity of our estimates of disease impact. We used administrative claims data, which limited our ability to adjust for severity. However, the detailed nature of the database allowed us to use treatments, such as vasopressors and antibiotics, to identify cases; treatments were also used as a validated indicator of severity,[26] which may have helped to reduce some of this potential bias. Although our propensity model included many predictors of CDI, such as use of proton pump inhibitors and factors associated with mortality, not every confounder was completely balanced after propensity matching, although the statistical differences may have been related to our large sample size and therefore might not be clinically significant. We also may have failed to include all possible predictors of CDI in the propensity model.
In a large, diverse cohort of hospitalized patients with sepsis, we found that HOCDI lengthened hospital stay by approximately 5 days, increased risk of in‐hospital mortality by 9%, and increased hospital cost by approximately $5000 per patient. These findings highlight the importance of identifying effective prevention measures and of determining the patient populations at greatest risk for HOCDI.
Disclosures: The study was conducted with funding from the Division of Critical Care and the Center for Quality of Care Research at Baystate Medical Center. Dr. Lagu is supported by the National Heart, Lung, and Blood Institute of the National Institutes of Health under award number K01HL114745. Dr. Stefan is supported by the National Heart, Lung, and Blood Institute of the National Institutes of Health under award number K01HL114631. Drs. Lagu and Lindenauer had full access to all of the data in the study; they take responsibility for the integrity of the data and the accuracy of the data analysis. Drs. Lagu, Lindenauer, Steingrub, Higgins, Stefan, Haessler, and Rothberg conceived of the study. Dr. Lindenauer acquired the data. Drs. Lagu, Lindenauer, Rothberg, Steingrub, Nathanson, Stefan, Haessler, Higgins, and Mr. Hannon analyzed and interpreted the data. Dr. Lagu drafted the manuscript. Drs. Lagu, Lindenauer, Rothberg, Steingrub, Nathanson, Stefan, Haessler, Higgins, and Mr. Hannon critically reviewed the manuscript for important intellectual content. Dr. Nathanson carried out the statistical analyses. Dr. Nathanson, through his company OptiStatim LLC, was paid by the investigators with funding from the Department of Medicine at Baystate Medical Center to assist in conducting the statistical analyses in this study. The authors report no further conflicts of interest.
- , , , . Increasing prevalence and severity of Clostridium difficile colitis in hospitalized patients in the United States. Arch Surg. 2007;142(7):624–631; discussion 631.
- , , , et al. The changing epidemiology of Clostridium difficile infections. Clin Microbiol Rev. 2010;23(3):529–549.
- , . Clostridium Difficile‐Associated Disease in U.S. Hospitals, 1993–2005. HCUP Statistical Brief #50. April 2008. Agency for Healthcare Research and Quality, Rockville, MD. Available at: http://www.hcup‐us.ahrq.gov/reports/statbriefs/sb50.pdf. Accessed April 4, 2014.
- , , , . National point prevalence of Clostridium difficile in US health care facility inpatients, 2008. Am J Infect Control. 2009;37(4):263–270.
- . A 76‐year‐old man with recurrent Clostridium difficile‐associated diarrhea: review of C. difficile infection. JAMA. 2009;301(9):954–962.
- , , , , , . Recurrent Clostridium difficile disease: epidemiology and clinical characteristics. Infect Control Hosp Epidemiol. 1999;20(1):43–50.
- , , , , , . Recurrent Clostridium difficile diarrhea: characteristics of and risk factors for patients enrolled in a prospective, randomized, double‐blinded trial. Clin Infect Dis. 1997;24(3):324–333.
- . Narrative review: the new epidemic of Clostridium difficile‐associated enteric disease. Ann Intern Med. 2006;145(10):758–764.
- , , , et al. Impact of emergency colectomy on survival of patients with fulminant Clostridium difficile colitis during an epidemic caused by a hypervirulent strain. Ann Surg. 2007;245(2):267–272.
- , , , . Hospital‐acquired Clostridium difficile‐associated disease in the intensive care unit setting: epidemiology, clinical course and outcome. BMC Infect Dis. 2007;7:42.
- , , , , , . Factors associated with prolonged symptoms and severe disease due to Clostridium difficile. Age Ageing. 1999;28(2):107–113.
- , , , , , . The effect of hospital‐acquired Clostridium difficile infection on in‐hospital mortality. Arch Intern Med. 2010;170(20):1804–1810.
- , , , , , . The effect of hospital‐acquired infection with Clostridium difficile on length of stay in hospital. CMAJ. 2012;184(1):37–42.
- , . Clostridium difficile—more difficult than ever. N Engl J Med. 2008;359(18):1932–1940.
- , , , et al. Clinical practice guidelines for Clostridium difficile infection in adults: 2010 update by the society for healthcare epidemiology of America (SHEA) and the infectious diseases society of America (IDSA). Infect Control Hosp Epidemiol. 2010;31(5):431–455.
- , , , . Health care costs and mortality associated with nosocomial diarrhea due to Clostridium difficile. Clin Infect Dis. 2002;34(3):346–353.
- , , , , . Short‐ and long‐term attributable costs of Clostridium difficile‐associated disease in nonsurgical inpatients. Clin Infect Dis. 2008;46(4):497–504.
- , , , , . Estimation of extra hospital stay attributable to nosocomial infections: heterogeneity and timing of events. J Clin Epidemiol. 2000;53(4):409–417.
- , , , et al. Attributable outcomes of endemic Clostridium difficile‐associated disease in nonsurgical patients. Emerging Infect Dis. 2008;14(7):1031–1038.
- , . Excess length of stay, charges, and mortality attributable to medical injuries during hospitalization. JAMA. 2003;290(14):1868–1874.
- , , , , , . Association of corticosteroid dose and route of administration with risk of treatment failure in acute exacerbation of chronic obstructive pulmonary disease. JAMA. 2010;303(23):2359–2367.
- , , , , , . The relationship between hospital spending and mortality in patients with sepsis. Arch Intern Med. 2011;171(4):292–299.
- , , , , , . Comparative effectiveness of macrolides and quinolones for patients hospitalized with acute exacerbations of chronic obstructive pulmonary disease (AECOPD). J Hosp Med. 2010;5(5):261–267.
- , , , , . A combined comorbidity score predicted mortality in elderly patients better than existing scores. J Clin Epidemiol. 2011;64(7):749–759.
- , , , , , . Epidemiology of severe sepsis in the United States: analysis of incidence, outcome, and associated costs of care. Crit Care Med. 2001;29(7):1303–1310.
- , , , et al. Development and validation of a model that uses enhanced administrative data to predict mortality in patients with sepsis. Crit Care Med. 2011;39(11):2425–2430.
- , , , , . Incorporating initial treatments improves performance of a mortality prediction model for patients with sepsis. Pharmacoepidemiol Drug Saf. 2012;21(suppl 2):44–52.
- , , , . Nosocomial infection, length of stay, and time‐dependent bias. Infect Control Hosp Epidemiol. 2009;30(3):273–276.
- , , , , , . Length of stay and hospital costs among high‐risk patients with hospital‐origin Clostridium difficile‐associated diarrhea. J Med Econ. 2013;16(3):440–448.
- Rogers. Regression standard errors in clustered samples. Stata Technical Bulletin. 1993;13(13):19–23.
- . Reducing bias in a propensity score matched‐pair sample using greedy matching techniques. In: Proceedings of the 26th Annual SAS Users Group International Conference; April 22–25, 2001; Long Beach, CA. Paper 214‐26. Available at: http://www2.sas.com/proceedings/sugi26/p214‐26.pdf. Accessed April 4, 2014.
- , . Prolongation of length of stay and Clostridium difficile infection: a review of the methods used to examine length of stay due to healthcare associated infections. Antimicrob Resist Infect Control. 2012;1(1):14.
- , , , et al. Clostridium difficile Infection: a multicenter study of epidemiology and outcomes in mechanically ventilated patients. Crit Care Med. 2013;41(8):1968–1975.
© 2014 Society of Hospital Medicine

Hospital Mortality Measure for COPD
Chronic obstructive pulmonary disease (COPD) affects as many as 24 million individuals in the United States, is responsible for more than 700,000 annual hospital admissions, and is currently the nation's third leading cause of death, accounting for nearly $49.9 billion in medical spending in 2010.[1, 2] Reported in‐hospital mortality rates for patients hospitalized for exacerbations of COPD range from 2% to 5%.[3, 4, 5, 6, 7] Information about 30‐day mortality rates following hospitalization for COPD is more limited; however, international studies suggest that rates range from 3% to 9%,[8, 9] and 90‐day mortality rates exceed 15%.[10]
Despite this significant clinical and economic impact, there have been no large‐scale, sustained efforts to measure the quality or outcomes of hospital care for patients with COPD in the United States. What little is known about the treatment of patients with COPD suggests widespread opportunities to increase adherence to guideline‐recommended therapies, to reduce the use of ineffective treatments and tests, and to address variation in care across institutions.[5, 11, 12]
Public reporting of hospital performance is a key strategy for improving the quality and safety of hospital care, both in the United States and internationally.[13] Since 2007, the Centers for Medicare and Medicaid Services (CMS) has reported hospital mortality rates on the Hospital Compare Web site, and COPD is 1 of the conditions highlighted in the Affordable Care Act for future consideration.[14] Such initiatives rely on validated, risk‐adjusted performance measures for comparisons across institutions and to enable outcomes to be tracked over time. We present the development, validation, and results of a model intended for public reporting of risk‐standardized mortality rates for patients hospitalized with exacerbations of COPD that has been endorsed by the National Quality Forum.[15]
METHODS
Approach to Measure Development
We developed this measure in accordance with guidelines described by the National Quality Forum,[16] CMS' Measure Management System,[17] and the American Heart Association scientific statement, Standards for Statistical Models Used for Public Reporting of Health Outcomes.[18] Throughout the process we obtained expert clinical and stakeholder input through meetings with a clinical advisory group and a national technical expert panel (see Acknowledgments). Last, we presented the proposed measure specifications and a summary of the technical expert panel discussions online and made a widely distributed call for public comments. We took the comments into consideration during the final stages of measure development (available at
Data Sources
We used claims data from Medicare inpatient, outpatient, and carrier (physician) Standard Analytic Files from 2008 to develop and validate the model, and examined model reliability using data from 2007 and 2009. The Medicare enrollment database was used to determine Medicare Fee‐for‐Service enrollment and mortality.
Study Cohort
Admissions were considered eligible for inclusion if the patient was 65 years or older, was admitted to a nonfederal acute care hospital in the United States, and had a principal diagnosis of COPD or a principal diagnosis of acute respiratory failure or respiratory arrest when paired with a secondary diagnosis of COPD with exacerbation (Table 1).
| ICD‐9‐CM | Description |
|---|---|
| |
| 491.21 | Obstructive chronic bronchitis; with (acute) exacerbation; acute exacerbation of COPD, decompensated COPD, decompensated COPD with exacerbation |
| 491.22 | Obstructive chronic bronchitis; with acute bronchitis |
| 491.8 | Other chronic bronchitis; chronic: tracheitis, tracheobronchitis |
| 491.9 | Unspecified chronic bronchitis |
| 492.8 | Other emphysema; emphysema (lung or pulmonary): NOS, centriacinar, centrilobular, obstructive, panacinar, panlobular, unilateral, vesicular; MacLeod's syndrome; Swyer‐James syndrome; unilateral hyperlucent lung |
| 493.20 | Chronic obstructive asthma; asthma with COPD, chronic asthmatic bronchitis, unspecified |
| 493.21 | Chronic obstructive asthma; asthma with COPD, chronic asthmatic bronchitis, with status asthmaticus |
| 493.22 | Chronic obstructive asthma; asthma with COPD, chronic asthmatic bronchitis, with (acute) exacerbation |
| 496 | Chronic: nonspecific lung disease, obstructive lung disease, obstructive pulmonary disease (COPD) NOS. (Note: This code is not to be used with any code from categories 491493.) |
| 518.81a | Other diseases of lung; acute respiratory failure; respiratory failure NOS |
| 518.82a | Other diseases of lung; acute respiratory failure; other pulmonary insufficiency, acute respiratory distress |
| 518.84a | Other diseases of lung; acute respiratory failure; acute and chronic respiratory failure |
| 799.1a | Other ill‐defined and unknown causes of morbidity and mortality; respiratory arrest, cardiorespiratory failure |
If a patient was discharged and readmitted to a second hospital on the same or the next day, we combined the 2 acute care admissions into a single episode of care and assigned the mortality outcome to the first admitting hospital. We excluded admissions for patients who were enrolled in Medicare Hospice in the 12 months prior to or on the first day of the index hospitalization. An index admission was any eligible admission assessed in the measure for the outcome. We also excluded admissions for patients who were discharged against medical advice, those for whom vital status at 30 days was unknown or recorded inconsistently, and patients with unreliable data (eg, age >115 years). For patients with multiple hospitalizations during a single year, we randomly selected 1 admission per patient to avoid survival bias. Finally, to assure adequate risk adjustment we limited the analysis to patients who had continuous enrollment in Medicare Fee‐for‐Service Parts A and B for the 12 months prior to their index admission so that we could identify comorbid conditions coded during all prior encounters.
Outcomes
The outcome of 30‐day mortality was defined as death from any cause within 30 days of the admission date for the index hospitalization. Mortality was assessed at 30 days to standardize the period of outcome ascertainment,[19] and because 30 days is a clinically meaningful time frame, during which differences in the quality of hospital care may be revealed.
Risk‐Adjustment Variables
We randomly selected half of all COPD admissions in 2008 that met the inclusion and exclusion criteria to create a model development sample. Candidate variables for inclusion in the risk‐standardized model were selected by a clinician team from diagnostic groups included in the Hierarchical Condition Category clinical classification system[20] and included age and comorbid conditions. Sleep apnea (International Classification of Diseases, 9th Revision, Clinical Modification [ICD‐9‐CM] condition codes 327.20, 327.21, 327.23, 327.27, 327.29, 780.51, 780.53, and 780.57) and mechanical ventilation (ICD‐9‐CM procedure codes 93.90, 96.70, 96.71, and 96.72) were also included as candidate variables.
We defined a condition as present for a given patient if it was coded in the inpatient, outpatient, or physician claims data sources in the preceding 12 months, including the index admission. Because a subset of the condition category variables can represent a complication of care, we did not consider them to be risk factors if they appeared only as secondary diagnosis codes for the index admission and not in claims submitted during the prior year.
We selected final variables for inclusion in the risk‐standardized model based on clinical considerations and a modified approach to stepwise logistic regression. The final patient‐level risk‐adjustment model included 42 variables (Table 2).
| Variable | Development Sample (150,035 Admissions at 4537 Hospitals) | Validation Sample (149,646 Admissions at 4535 Hospitals) | ||||
|---|---|---|---|---|---|---|
| Frequency, % | OR | 95% CI | Frequency, % | OR | 95% CI | |
| ||||||
| Demographics | ||||||
| Age 65 years (continuous) | 1.03 | 1.03‐1.04 | 1.03 | 1.03‐1.04 | ||
| Cardiovascular/respiratory | ||||||
| Sleep apnea (ICD‐9‐CM: 327.20, 327.21, 327.23, 327.27, 327.29, 780.51, 780.53, 780.57)a | 9.57 | 0.87 | 0.81‐0.94 | 9.72 | 0.84 | 0.78‐0.90 |
| History of mechanical ventilation (ICD‐9‐CM: 93.90, 96.70, 96.71, 96.72)a | 6.00 | 1.19 | 1.11‐1.27 | 6.00 | 1.15 | 1.08‐1.24 |
| Respirator dependence/respiratory failure (CC 7778)a | 1.15 | 0.89 | 0.77‐1.02 | 1.20 | 0.78 | 0.68‐0.91 |
| Cardiorespiratory failure and shock (CC 79) | 26.35 | 1.60 | 1.53‐1.68 | 26.34 | 1.59 | 1.52‐1.66 |
| Congestive heart failure (CC 80) | 41.50 | 1.34 | 1.28‐1.39 | 41.39 | 1.31 | 1.25‐1.36 |
| Chronic atherosclerosis (CC 8384)a | 50.44 | 0.87 | 0.83‐0.90 | 50.12 | 0.91 | 0.87‐0.94 |
| Arrhythmias (CC 9293) | 37.15 | 1.17 | 1.12‐1.22 | 37.06 | 1.15 | 1.10‐1.20 |
| Vascular or circulatory disease (CC 104106) | 38.20 | 1.09 | 1.05‐1.14 | 38.09 | 1.02 | 0.98‐1.06 |
| Fibrosis of lung and other chronic lung disorder (CC 109) | 16.96 | 1.08 | 1.03‐1.13 | 17.08 | 1.11 | 1.06‐1.17 |
| Asthma (CC 110) | 17.05 | 0.67 | 0.63‐0.70 | 16.90 | 0.67 | 0.63‐0.70 |
| Pneumonia (CC 111113) | 49.46 | 1.29 | 1.24‐1.35 | 49.41 | 1.27 | 1.22‐1.33 |
| Pleural effusion/pneumothorax (CC 114) | 11.78 | 1.17 | 1.11‐1.23 | 11.54 | 1.18 | 1.12‐1.25 |
| Other lung disorders (CC 115) | 53.07 | 0.80 | 0.77‐0.83 | 53.17 | 0.83 | 0.80‐0.87 |
| Other comorbid conditions | ||||||
| Metastatic cancer and acute leukemia (CC 7) | 2.76 | 2.34 | 2.14‐2.56 | 2.79 | 2.15 | 1.97‐2.35 |
| Lung, upper digestive tract, and other severe cancers (CC 8)a | 5.98 | 1.80 | 1.68‐1.92 | 6.02 | 1.98 | 1.85‐2.11 |
| Lymphatic, head and neck, brain, and other major cancers; breast, prostate, colorectal and other cancers and tumors; other respiratory and heart neoplasms (CC 911) | 14.13 | 1.03 | 0.97‐1.08 | 14.19 | 1.01 | 0.95‐1.06 |
| Other digestive and urinary neoplasms (CC 12) | 6.91 | 0.91 | 0.84‐0.98 | 7.05 | 0.85 | 0.79‐0.92 |
| Diabetes and DM complications (CC 1520, 119120) | 38.31 | 0.91 | 0.87‐0.94 | 38.29 | 0.91 | 0.87‐0.94 |
| Protein‐calorie malnutrition (CC 21) | 7.40 | 2.18 | 2.07‐2.30 | 7.44 | 2.09 | 1.98‐2.20 |
| Disorders of fluid/electrolyte/acid‐base (CC 2223) | 32.05 | 1.13 | 1.08‐1.18 | 32.16 | 1.24 | 1.19‐1.30 |
| Other endocrine/metabolic/nutritional disorders (CC 24) | 67.99 | 0.75 | 0.72‐0.78 | 67.88 | 0.76 | 0.73‐0.79 |
| Other gastrointestinal disorders (CC 36) | 56.21 | 0.81 | 0.78‐0.84 | 56.18 | 0.78 | 0.75‐0.81 |
| Osteoarthritis of hip or knee (CC 40) | 9.32 | 0.74 | 0.69‐0.79 | 9.33 | 0.80 | 0.74‐0.85 |
| Other musculoskeletal and connective tissue disorders (CC 43) | 64.14 | 0.83 | 0.80‐0.86 | 64.20 | 0.83 | 0.80‐0.87 |
| Iron deficiency and other/unspecified anemias and blood disease (CC 47) | 40.80 | 1.08 | 1.04‐1.12 | 40.72 | 1.08 | 1.04‐1.13 |
| Dementia and senility (CC 4950) | 17.06 | 1.09 | 1.04‐1.14 | 16.97 | 1.09 | 1.04‐1.15 |
| Drug/alcohol abuse, without dependence (CC 53)a | 23.51 | 0.78 | 0.75‐0.82 | 23.38 | 0.76 | 0.72‐0.80 |
| Other psychiatric disorders (CC 60)a | 16.49 | 1.12 | 1.07‐1.18 | 16.43 | 1.12 | 1.06‐1.17 |
| Quadriplegia, paraplegia, functional disability (CC 6769, 100102, 177178) | 4.92 | 1.03 | 0.95‐1.12 | 4.92 | 1.08 | 0.99‐1.17 |
| Mononeuropathy, other neurological conditions/emnjuries (CC 76) | 11.35 | 0.85 | 0.80‐0.91 | 11.28 | 0.88 | 0.83‐0.93 |
| Hypertension and hypertensive disease (CC 9091) | 80.40 | 0.78 | 0.75‐0.82 | 80.35 | 0.79 | 0.75‐0.83 |
| Stroke (CC 9596)a | 6.77 | 1.00 | 0.93‐1.08 | 6.73 | 0.98 | 0.91‐1.05 |
| Retinal disorders, except detachment and vascular retinopathies (CC 121) | 10.79 | 0.87 | 0.82‐0.93 | 10.69 | 0.90 | 0.85‐0.96 |
| Other eye disorders (CC 124)a | 19.05 | 0.90 | 0.86‐0.95 | 19.13 | 0.98 | 0.85‐0.93 |
| Other ear, nose, throat, and mouth disorders (CC 127) | 35.21 | 0.83 | 0.80‐0.87 | 35.02 | 0.80 | 0.77‐0.83 |
| Renal failure (CC 131)a | 17.92 | 1.12 | 1.07‐1.18 | 18.16 | 1.13 | 1.08‐1.19 |
| Decubitus ulcer or chronic skin ulcer (CC 148149) | 7.42 | 1.27 | 1.19‐1.35 | 7.42 | 1.33 | 1.25‐1.42 |
| Other dermatological disorders (CC 153) | 28.46 | 0.90 | 0.87‐0.94 | 28.32 | 0.89 | 0.86‐0.93 |
| Trauma (CC 154156, 158161) | 9.04 | 1.09 | 1.03‐1.16 | 8.99 | 1.15 | 1.08‐1.22 |
| Vertebral fractures (CC 157) | 5.01 | 1.33 | 1.24‐1.44 | 4.97 | 1.29 | 1.20‐1.39 |
| Major complications of medical care and trauma (CC 164) | 5.47 | 0.81 | 0.75‐0.88 | 5.55 | 0.82 | 0.76‐0.89 |
Model Derivation
We used hierarchical logistic regression models to model the log‐odds of mortality as a function of patient‐level clinical characteristics and a random hospital‐level intercept. At the patient level, each model adjusts the log‐odds of mortality for age and the selected clinical covariates. The second level models the hospital‐specific intercepts as arising from a normal distribution. The hospital intercept represents the underlying risk of mortality, after accounting for patient risk. If there were no differences among hospitals, then after adjusting for patient risk, the hospital intercepts should be identical across all hospitals.
Estimation of Hospital Risk‐Standardized Mortality Rate
We calculated a risk‐standardized mortality rate, defined as the ratio of predicted to expected deaths (similar to observed‐to‐expected), multiplied by the national unadjusted mortality rate.[21] The expected number of deaths for each hospital was estimated by applying the estimated regression coefficients to the characteristics of each hospital's patients, adding the average of the hospital‐specific intercepts, transforming the data by using an inverse logit function, and summing the data from all patients in the hospital to obtain the count. The predicted number of deaths was calculated in the same way, substituting the hospital‐specific intercept for the average hospital‐specific intercept.
Model Performance, Validation, and Reliability Testing
We used the remaining admissions in 2008 as the model validation sample. We computed several summary statistics to assess the patient‐level model performance in both the development and validation samples,[22] including over‐fitting indices, predictive ability, area under the receiver operating characteristic (ROC) curve, distribution of residuals, and model 2. In addition, we assessed face validity through a survey of members of the technical expert panel. To assess reliability of the model across data years, we repeated the modeling process using qualifying COPD admissions in both 2007 and 2009. Finally, to assess generalizability we evaluated the model's performance in an all‐payer sample of data from patients admitted to California hospitals in 2006.
Analyses were conducted using SAS version 9.1.3 (SAS Institute Inc., Cary, NC). We estimated the hierarchical models using the GLIMMIX procedure in SAS.
The Human Investigation Committee at the Yale University School of Medicine/Yale New Haven Hospital approved an exemption (HIC#0903004927) for the authors to use CMS claims and enrollment data for research analyses and publication.
RESULTS
Model Derivation
After exclusions were applied, the development sample included 150,035 admissions in 2008 at 4537 US hospitals (Figure 1). Factors that were most strongly associated with the risk of mortality included metastatic cancer (odds ratio [OR] 2.34), protein calorie malnutrition (OR 2.18), nonmetastatic cancers of the lung and upper digestive tract, (OR 1.80) cardiorespiratory failure and shock (OR 1.60), and congestive heart failure (OR 1.34) (Table 2).

Model Performance, Validation, and Reliability
The model had a C statistic of 0.72, indicating good discrimination, and predicted mortality in the development sample ranged from 1.52% in the lowest decile to 23.74% in the highest. The model validation sample, using the remaining cases from 2008, included 149,646 admissions from 4535 hospitals. Variable frequencies and ORs were similar in both samples (Table 2). Model performance was also similar in the validation samples, with good model discrimination and fit (Table 3). Ten of 12 technical expert panel members responded to the survey, of whom 90% at least somewhat agreed with the statement, the COPD mortality measure provides an accurate reflection of quality. When the model was applied to patients age 18 years and older in the 2006 California Patient Discharge Data, overall discrimination was good (C statistic, 0.74), including in those age 18 to 64 years (C statistic, 0.75; 65 and above C statistic, 0.70).
| Development | Validation | Data Years | ||
|---|---|---|---|---|
| Indices | Sample, 2008 | Sample, 2008 | 2007 | 2009 |
| ||||
| Number of admissions | 150,035 | 149,646 | 259,911 | 279,377 |
| Number of hospitals | 4537 | 4535 | 4636 | 4571 |
| Mean risk‐standardized mortality rate, % (SD) | 8.62 (0.94) | 8.64 (1.07) | 8.97 (1.12) | 8.08 (1.09) |
| Calibration, 0, 1 | 0.034, 0.985 | 0.009, 1.004 | 0.095, 1.022 | 0.120, 0.981 |
| Discriminationpredictive ability, lowest decile %highest decile % | 1.5223.74 | 1.6023.78 | 1.5424.64 | 1.4222.36 |
| Discriminationarea under the ROC curve, C statistic | 0.720 | 0.723 | 0.728 | 0.722 |
| Residuals lack of fit, Pearson residual fall % | ||||
| 2 | 0 | 0 | 0 | 0 |
| 2, 0 | 91.14 | 91.4 | 91.08 | 91.93 |
| 0, 2 | 1.66 | 1.7 | 1.96 | 1.42 |
| 2+ | 6.93 | 6.91 | 6.96 | 6.65 |
| Model Wald 2 (number of covariates) | 6982.11 (42) | 7051.50 (42) | 13042.35 (42) | 12542.15 (42) |
| P value | <0.0001 | <0.0001 | <0.0001 | <0.0001 |
| Between‐hospital variance, (standard error) | 0.067 (0.008) | 0.078 (0.009) | 0.067 (0.006) | 0.072 (0.006) |
Reliability testing demonstrated consistent performance over several years. The frequency and ORs of the variables included in the model showed only minor changes over time. The area under the ROC curve (C statistic) was 0.73 for the model in the 2007 sample and 0.72 for the model using 2009 data (Table 3).
Hospital Risk‐Standardized Mortality Rates
The mean unadjusted hospital 30‐day mortality rate was 8.6% and ranged from 0% to 100% (Figure 2a). Risk‐standardized mortality rates varied across hospitals (Figure 2b). The mean risk‐standardized mortality rate was 8.6% and ranged from 5.9% to 13.5%. The odds of mortality at a hospital 1 standard deviation above average was 1.20 times that of a hospital 1 standard deviation below average.
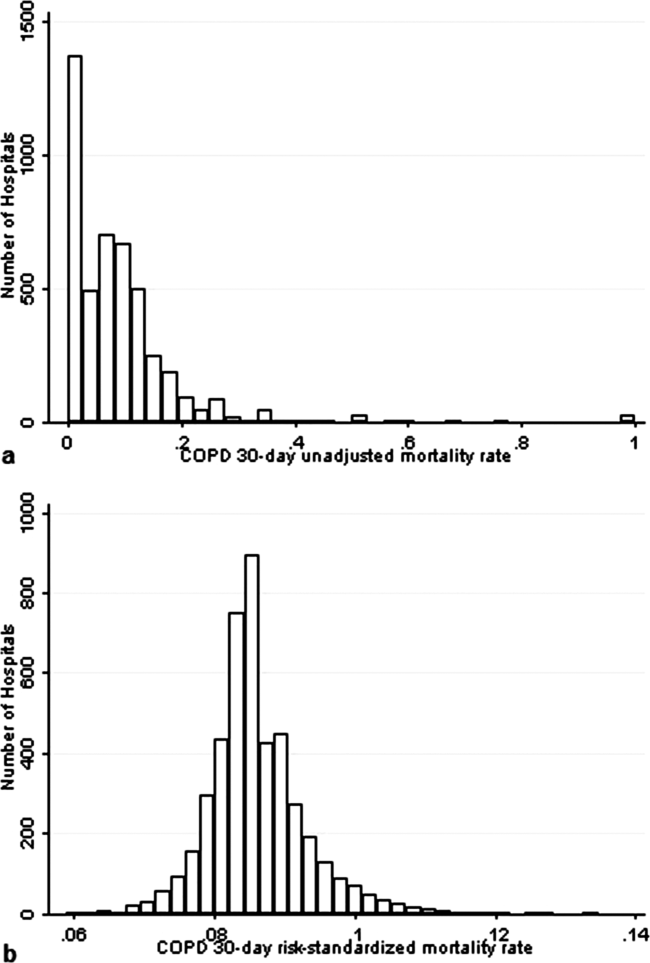
DISCUSSION
We present a hospital‐level risk‐standardized mortality measure for patients admitted with COPD based on administrative claims data that are intended for public reporting and that have achieved endorsement by the National Quality Forum, a voluntary consensus standards‐setting organization. Across more than 4500 US hospitals, the mean 30‐day risk‐standardized mortality rate in 2008 was 8.6%, and we observed considerable variation across institutions, despite adjustment for case mix, suggesting that improvement by lower‐performing institutions may be an achievable goal.
Although improving the delivery of evidence‐based care processes and outcomes of patients with acute myocardial infarction, heart failure, and pneumonia has been the focus of national quality improvement efforts for more than a decade, COPD has largely been overlooked.[23] Within this context, this analysis represents the first attempt to systematically measure, at the hospital level, 30‐day all‐cause mortality for patients admitted to US hospitals for exacerbation of COPD. The model we have developed and validated is intended to be used to compare the performance of hospitals while controlling for differences in the pretreatment risk of mortality of patients and accounting for the clustering of patients within hospitals, and will facilitate surveillance of hospital‐level risk‐adjusted outcomes over time.
In contrast to process‐based measures of quality, such as the percentage of patients with pneumonia who receive appropriate antibiotic therapy, performance measures based on patient outcomes provide a more comprehensive view of care and are more consistent with patients' goals.[24] Additionally, it is well established that hospital performance on individual and composite process measures explains only a small amount of the observed variation in patient outcomes between institutions.[25] In this regard, outcome measures incorporate important, but difficult to measure aspects of care, such as diagnostic accuracy and timing, communication and teamwork, the recognition and response to complications, care coordination at the time of transfers between levels of care, and care settings. Nevertheless, when used for making inferences about the quality of hospital care, individual measures such as the risk‐standardized hospital mortality rate should be interpreted in the context of other performance measures, including readmission, patient experience, and costs of care.
A number of prior investigators have described the outcomes of care for patients hospitalized with exacerbations of COPD, including identifying risk factors for mortality. Patil et al. carried out an analysis of the 1996 Nationwide Inpatient Sample and described an overall in‐hospital mortality rate of 2.5% among patients with COPD, and reported that a multivariable model containing sociodemographic characteristics about the patient and comorbidities had an area under the ROC curve of 0.70.[3] In contrast, this hospital‐level measure includes patients with a principal diagnosis of respiratory failure and focuses on 30‐day rather than inpatient mortality, accounting for the nearly 3‐fold higher mortality rate we observed. In a more recent study that used clinical from a large multistate database, Tabak et al. developed a prediction model for inpatient mortality for patients with COPD that contained only 4 factors: age, blood urea nitrogen, mental status, and pulse, and achieved an area under the ROC curve of 0.72.[4] The simplicity of such a model and its reliance on clinical measurements makes it particularly well suited for bedside application by clinicians, but less valuable for large‐scale public reporting programs that rely on administrative data. In the only other study identified that focused on the assessment of hospital mortality rates, Agabiti et al. analyzed the outcomes of 12,756 patients hospitalized for exacerbations of COPD, using similar ICD‐9‐CM diagnostic criteria as in this study, at 21 hospitals in Rome, Italy.[26] They reported an average crude 30‐day mortality rate of 3.8% among a group of 5 benchmark hospitals and an average mortality of 7.5% (range, 5.2%17.2%) among the remaining institutions.
To put the variation we observed in mortality rates into a broader context, the relative difference in the risk‐standardized hospital mortality rates across the 10th to 90th percentiles of hospital performance was 25% for acute myocardial infarction and 39% for heart failure, whereas rates varied 30% for COPD, from 7.6% to 9.9%.[27] Model discrimination in COPD (C statistic, 0.72) was also similar to that reported for models used for public reporting of hospital mortality in acute myocardial infarction (C statistic, 0.71) and pneumonia (C statistic, 0.72).
This study has a number of important strengths. First, the model was developed from a large sample of recent Medicare claims, achieved good discrimination, and was validated in samples not limited to Medicare beneficiaries. Second, by including patients with a principal diagnosis of COPD, as well as those with a principal diagnosis of acute respiratory failure when accompanied by a secondary diagnosis of COPD with acute exacerbation, this model can be used to assess hospital performance across the full spectrum of disease severity. This broad set of ICD‐9‐CM codes used to define the cohort also ensures that efforts to measure hospital performance will be less influenced by differences in documentation and coding practices across hospitals relating to the diagnosis or sequencing of acute respiratory failure diagnoses. Moreover, the inclusion of patients with respiratory failure is important because these patients have the greatest risk of mortality, and are those in whom efforts to improve the quality and safety of care may have the greatest impact. Third, rather than relying solely on information documented during the index admission, we used ambulatory and inpatient claims from the full year prior to the index admission to identify comorbidities and to distinguish them from potential complications of care. Finally, we did not include factors such as hospital characteristics (eg, number of beds, teaching status) in the model. Although they might have improved overall predictive ability, the goal of the hospital mortality measure is to enable comparisons of mortality rates among hospitals while controlling for differences in patient characteristics. To the extent that factors such as size or teaching status might be independently associated with hospital outcomes, it would be inappropriate to adjust away their effects, because mortality risk should not be influenced by hospital characteristics other than through their effects on quality.
These results should be viewed in light of several limitations. First, we used ICD‐9‐CM codes derived from claims files to define the patient populations included in the measure rather than collecting clinical or physiologic information prospectively or through manual review of medical records, such as the forced expiratory volume in 1 second or whether the patient required long‐term oxygen therapy. Nevertheless, we included a broad set of potential diagnosis codes to capture the full spectrum of COPD exacerbations and to minimize differences in coding across hospitals. Second, because the risk‐adjustment included diagnoses coded in the year prior to the index admission, it is potentially subject to bias due to regional differences in medical care utilization that are not driven by underlying differences in patient illness.[28] Third, using administrative claims data, we observed some paradoxical associations in the model that are difficult to explain on clinical grounds, such as a protective effect of substance and alcohol abuse or prior episodes of respiratory failure. Fourth, although we excluded patients from the analysis who were enrolled in hospice prior to, or on the day of, the index admission, we did not exclude those who choose to withdraw support, transition to comfort measures only, or enrolled in hospice care during a hospitalization. We do not seek to penalize hospitals for being sensitive to the preferences of patients at the end of life. At the same time, it is equally important that the measure is capable of detecting the outcomes of suboptimal care that may in some instances lead a patient or their family to withdraw support or choose hospice. Finally, we did not have the opportunity to validate the model against a clinical registry of patients with COPD, because such data do not currently exist. Nevertheless, the use of claims as a surrogate for chart data for risk adjustment has been validated for several conditions, including acute myocardial infarction, heart failure, and pneumonia.[29, 30]
CONCLUSIONS
Risk‐standardized 30‐day mortality rates for Medicare beneficiaries with COPD vary across hospitals in the US. Calculating and reporting hospital outcomes using validated performance measures may catalyze quality improvement activities and lead to better outcomes. Additional research would be helpful to confirm that hospitals with lower mortality rates achieve care that meets the goals of patients and their families better than at hospitals with higher mortality rates.
Acknowledgment
The authors thank the following members of the technical expert panel: Darlene Bainbridge, RN, MS, NHA, CPHQ, CPHRM, President/CEO, Darlene D. Bainbridge & Associates, Inc.; Robert A. Balk, MD, Director of Pulmonary and Critical Care Medicine, Rush University Medical Center; Dale Bratzler, DO, MPH, President and CEO, Oklahoma Foundation for Medical Quality; Scott Cerreta, RRT, Director of Education, COPD Foundation; Gerard J. Criner, MD, Director of Temple Lung Center and Divisions of Pulmonary and Critical Care Medicine, Temple University; Guy D'Andrea, MBA, President, Discern Consulting; Jonathan Fine, MD, Director of Pulmonary Fellowship, Research and Medical Education, Norwalk Hospital; David Hopkins, MS, PhD, Senior Advisor, Pacific Business Group on Health; Fred Martin Jacobs, MD, JD, FACP, FCCP, FCLM, Executive Vice President and Director, Saint Barnabas Quality Institute; Natalie Napolitano, MPH, RRT‐NPS, Respiratory Therapist, Inova Fairfax Hospital; Russell Robbins, MD, MBA, Principal and Senior Clinical Consultant, Mercer. In addition, the authors acknowledge and thank Angela Merrill, Sandi Nelson, Marian Wrobel, and Eric Schone from Mathematica Policy Research, Inc., Sharon‐Lise T. Normand from Harvard Medical School, and Lein Han and Michael Rapp at The Centers for Medicare & Medicaid Services for their contributions to this work.
Disclosures
Peter K. Lindenauer, MD, MSc, is the guarantor of this article, taking responsibility for the integrity of the work as a whole, from inception to published article, and takes responsibility for the content of the manuscript, including the data and data analysis. All authors have made substantial contributions to the conception and design, or acquisition of data, or analysis and interpretation of data; have drafted the submitted article or revised it critically for important intellectual content; and have provided final approval of the version to be published. Preparation of this manuscript was completed under Contract Number: HHSM‐5002008‐0025I/HHSM‐500‐T0001, Modification No. 000007, Option Year 2 Measure Instrument Development and Support (MIDS). Sponsors did not contribute to the development of the research or manuscript. Dr. Au reports being an unpaid research consultant for Bosch Inc. He receives research funding from the NIH, Department of Veterans Affairs, AHRQ, and Gilead Sciences. The views of the this manuscript represent the authors and do not necessarily represent those of the Department of Veterans Affairs. Drs. Drye and Bernheim report receiving contract funding from CMS to develop and maintain quality measures.
- FASTSTATS—chronic lower respiratory disease. Available at: http://www.cdc.gov/nchs/fastats/copd.htm. Accessed September 18, 2010.
- National Heart, Lung and Blood Institute. Morbidity and mortality chartbook. Available at: http://www.nhlbi.nih.gov/resources/docs/cht‐book.htm. Accessed April 27, 2010.
- , , , . In‐hospital mortality following acute exacerbations of chronic obstructive pulmonary disease. Arch Intern Med. 2003;163(10):1180–1186.
- , , , , . Mortality and need for mechanical ventilation in acute exacerbations of chronic obstructive pulmonary disease: development and validation of a simple risk score. Arch Intern Med. 2009;169(17):1595–1602.
- , , , , , . Quality of care for patients hospitalized for acute exacerbations of chronic obstructive pulmonary disease. Ann Intern Med. 2006;144(12):894–903.
- , , , , . Use of beta blockers and the risk of death in hospitalised patients with acute exacerbations of COPD. Thorax. 2008;63(4):301–305.
- , , , , . HCUP facts and figures: statistics on hospital‐based care in the United States, 2007. 2009. Available at: http://www.hcup‐us.ahrq.gov/reports.jsp. Accessed August 6, 2012.
- , . Predictors of long‐term survival in elderly patients hospitalized for acute exacerbations of chronic obstructive pulmonary disease. Respirology. 2008;13(6):851–855.
- , , , , , . The impact on risk‐factor analysis of different mortality outcomes in COPD patients. Eur Respir J 2008;32(3):629–636.
- , , , , , . Clinical audit indicators of outcome following admission to hospital with acute exacerbation of chronic obstructive pulmonary disease. Thorax. 2002;57(2):137–141.
- , , , et al. The quality of obstructive lung disease care for adults in the United States as measured by adherence to recommended processes. Chest. 2006;130(6):1844–1850.
- , , , , , . Management of acute exacerbations of chronic obstructive pulmonary disease in the elderly: physician practices in the community hospital setting. J Okla State Med Assoc. 2004;97(6):227–232.
- , , . Leadership by Example: Coordinating Government Roles in Improving Health Care Quality. Washington, DC: National Academies Press; 2002.
- Patient Protection and Affordable Care Act [H.R. 3590], Pub. L. No. 111–148, §2702, 124 Stat. 119, 318–319 (March 23, 2010). Available at: http://www.gpo.gov/fdsys/pkg/PLAW‐111publ148/html/PLAW‐111publ148.htm. Accessed July 15, 2012.
- National Quality Forum. NQF Endorses Additional Pulmonary Measure. 2013. Available at: http://www.qualityforum.org/News_And_Resources/Press_Releases/2013/NQF_Endorses_Additional_Pulmonary_Measure.aspx. Accessed January 11, 2013.
- National Quality Forum. National voluntary consensus standards for patient outcomes: a consensus report. Washington, DC: National Quality Forum; 2011.
- The Measures Management System. The Centers for Medicare and Medicaid Services. Available at: http://www.cms.gov/Medicare/Quality‐Initiatives‐Patient‐Assessment‐Instruments/MMS/index.html?redirect=/MMS/. Accessed August 6, 2012.
- , , , et al. Standards for statistical models used for public reporting of health outcomes: an American Heart Association Scientific Statement from the Quality of Care and Outcomes Research Interdisciplinary Writing Group: cosponsored by the Council on Epidemiology and Prevention and the Stroke Council. Endorsed by the American College of Cardiology Foundation. Circulation. 2006;113(3):456–462.
- , , , et al. Comparison of hospital risk‐standardized mortality rates calculated by using in‐hospital and 30‐day models: an observational study with implications for hospital profiling. Ann Intern Med. 2012;156(1 pt 1):19–26.
- , , , et al. Diagnostic cost group hierarchical condition category models for Medicare risk adjustment. Report prepared for the Health Care Financing Administration. Health Economics Research, Inc.; 2000. Available at: http://www.cms.gov/Research‐Statistics‐Data‐and‐Systems/Statistics‐Trends‐and‐Reports/Reports/downloads/pope_2000_2.pdf. Accessed November 7, 2009.
- , . Statistical and clinical aspects of hospital outcomes profiling. Stat Sci. 2007;22(2):206–226.
- , . Using full probability models to compute probabilities of actual interest to decision makers. Int J Technol Assess Health Care. 2001;17(1):17–26.
- , , . COPD performance measures: missing opportunities for improving care. Chest. 2010;137(5):1181–1189.
- , , , , . Measuring Performance For Treating Heart Attacks And Heart Failure: The Case For Outcomes Measurement. Health Aff. 2007;26(1):75–85.
- , , , et al. Hospital quality for acute myocardial infarction: correlation among process measures and relationship with short‐term mortality. JAMA. 2006;296(1):72–78.
- , , , et al. Profiling hospital performance to monitor the quality of care: the case of COPD. Eur Respir J. 2010;35(5):1031–1038.
- , , , et al. Patterns of hospital performance in acute myocardial infarction and heart failure 30‐day mortality and readmission. Circ Cardiovasc Qual Outcomes. 2009;2(5):407–413.
- , , , , . Geographic variation in diagnosis frequency and risk of death among Medicare beneficiaries. JAMA. 2011;305(11):1113–1118.
- , , , et al. An administrative claims model for profiling hospital 30‐day mortality rates for pneumonia patients. PLoS ONE. 2011;6(4):e17401.
- , , , et al. An Administrative Claims Model Suitable for Profiling Hospital Performance Based on 30‐Day Mortality Rates Among Patients With Heart Failure. Circulation. 2006;113(13):1693–1701.
Chronic obstructive pulmonary disease (COPD) affects as many as 24 million individuals in the United States, is responsible for more than 700,000 annual hospital admissions, and is currently the nation's third leading cause of death, accounting for nearly $49.9 billion in medical spending in 2010.[1, 2] Reported in‐hospital mortality rates for patients hospitalized for exacerbations of COPD range from 2% to 5%.[3, 4, 5, 6, 7] Information about 30‐day mortality rates following hospitalization for COPD is more limited; however, international studies suggest that rates range from 3% to 9%,[8, 9] and 90‐day mortality rates exceed 15%.[10]
Despite this significant clinical and economic impact, there have been no large‐scale, sustained efforts to measure the quality or outcomes of hospital care for patients with COPD in the United States. What little is known about the treatment of patients with COPD suggests widespread opportunities to increase adherence to guideline‐recommended therapies, to reduce the use of ineffective treatments and tests, and to address variation in care across institutions.[5, 11, 12]
Public reporting of hospital performance is a key strategy for improving the quality and safety of hospital care, both in the United States and internationally.[13] Since 2007, the Centers for Medicare and Medicaid Services (CMS) has reported hospital mortality rates on the Hospital Compare Web site, and COPD is 1 of the conditions highlighted in the Affordable Care Act for future consideration.[14] Such initiatives rely on validated, risk‐adjusted performance measures for comparisons across institutions and to enable outcomes to be tracked over time. We present the development, validation, and results of a model intended for public reporting of risk‐standardized mortality rates for patients hospitalized with exacerbations of COPD that has been endorsed by the National Quality Forum.[15]
METHODS
Approach to Measure Development
We developed this measure in accordance with guidelines described by the National Quality Forum,[16] CMS' Measure Management System,[17] and the American Heart Association scientific statement, Standards for Statistical Models Used for Public Reporting of Health Outcomes.[18] Throughout the process we obtained expert clinical and stakeholder input through meetings with a clinical advisory group and a national technical expert panel (see Acknowledgments). Last, we presented the proposed measure specifications and a summary of the technical expert panel discussions online and made a widely distributed call for public comments. We took the comments into consideration during the final stages of measure development (available at
Data Sources
We used claims data from Medicare inpatient, outpatient, and carrier (physician) Standard Analytic Files from 2008 to develop and validate the model, and examined model reliability using data from 2007 and 2009. The Medicare enrollment database was used to determine Medicare Fee‐for‐Service enrollment and mortality.
Study Cohort
Admissions were considered eligible for inclusion if the patient was 65 years or older, was admitted to a nonfederal acute care hospital in the United States, and had a principal diagnosis of COPD or a principal diagnosis of acute respiratory failure or respiratory arrest when paired with a secondary diagnosis of COPD with exacerbation (Table 1).
| ICD‐9‐CM | Description |
|---|---|
| |
| 491.21 | Obstructive chronic bronchitis; with (acute) exacerbation; acute exacerbation of COPD, decompensated COPD, decompensated COPD with exacerbation |
| 491.22 | Obstructive chronic bronchitis; with acute bronchitis |
| 491.8 | Other chronic bronchitis; chronic: tracheitis, tracheobronchitis |
| 491.9 | Unspecified chronic bronchitis |
| 492.8 | Other emphysema; emphysema (lung or pulmonary): NOS, centriacinar, centrilobular, obstructive, panacinar, panlobular, unilateral, vesicular; MacLeod's syndrome; Swyer‐James syndrome; unilateral hyperlucent lung |
| 493.20 | Chronic obstructive asthma; asthma with COPD, chronic asthmatic bronchitis, unspecified |
| 493.21 | Chronic obstructive asthma; asthma with COPD, chronic asthmatic bronchitis, with status asthmaticus |
| 493.22 | Chronic obstructive asthma; asthma with COPD, chronic asthmatic bronchitis, with (acute) exacerbation |
| 496 | Chronic: nonspecific lung disease, obstructive lung disease, obstructive pulmonary disease (COPD) NOS. (Note: This code is not to be used with any code from categories 491493.) |
| 518.81a | Other diseases of lung; acute respiratory failure; respiratory failure NOS |
| 518.82a | Other diseases of lung; acute respiratory failure; other pulmonary insufficiency, acute respiratory distress |
| 518.84a | Other diseases of lung; acute respiratory failure; acute and chronic respiratory failure |
| 799.1a | Other ill‐defined and unknown causes of morbidity and mortality; respiratory arrest, cardiorespiratory failure |
If a patient was discharged and readmitted to a second hospital on the same or the next day, we combined the 2 acute care admissions into a single episode of care and assigned the mortality outcome to the first admitting hospital. We excluded admissions for patients who were enrolled in Medicare Hospice in the 12 months prior to or on the first day of the index hospitalization. An index admission was any eligible admission assessed in the measure for the outcome. We also excluded admissions for patients who were discharged against medical advice, those for whom vital status at 30 days was unknown or recorded inconsistently, and patients with unreliable data (eg, age >115 years). For patients with multiple hospitalizations during a single year, we randomly selected 1 admission per patient to avoid survival bias. Finally, to assure adequate risk adjustment we limited the analysis to patients who had continuous enrollment in Medicare Fee‐for‐Service Parts A and B for the 12 months prior to their index admission so that we could identify comorbid conditions coded during all prior encounters.
Outcomes
The outcome of 30‐day mortality was defined as death from any cause within 30 days of the admission date for the index hospitalization. Mortality was assessed at 30 days to standardize the period of outcome ascertainment,[19] and because 30 days is a clinically meaningful time frame, during which differences in the quality of hospital care may be revealed.
Risk‐Adjustment Variables
We randomly selected half of all COPD admissions in 2008 that met the inclusion and exclusion criteria to create a model development sample. Candidate variables for inclusion in the risk‐standardized model were selected by a clinician team from diagnostic groups included in the Hierarchical Condition Category clinical classification system[20] and included age and comorbid conditions. Sleep apnea (International Classification of Diseases, 9th Revision, Clinical Modification [ICD‐9‐CM] condition codes 327.20, 327.21, 327.23, 327.27, 327.29, 780.51, 780.53, and 780.57) and mechanical ventilation (ICD‐9‐CM procedure codes 93.90, 96.70, 96.71, and 96.72) were also included as candidate variables.
We defined a condition as present for a given patient if it was coded in the inpatient, outpatient, or physician claims data sources in the preceding 12 months, including the index admission. Because a subset of the condition category variables can represent a complication of care, we did not consider them to be risk factors if they appeared only as secondary diagnosis codes for the index admission and not in claims submitted during the prior year.
We selected final variables for inclusion in the risk‐standardized model based on clinical considerations and a modified approach to stepwise logistic regression. The final patient‐level risk‐adjustment model included 42 variables (Table 2).
| Variable | Development Sample (150,035 Admissions at 4537 Hospitals) | Validation Sample (149,646 Admissions at 4535 Hospitals) | ||||
|---|---|---|---|---|---|---|
| Frequency, % | OR | 95% CI | Frequency, % | OR | 95% CI | |
| ||||||
| Demographics | ||||||
| Age 65 years (continuous) | 1.03 | 1.03‐1.04 | 1.03 | 1.03‐1.04 | ||
| Cardiovascular/respiratory | ||||||
| Sleep apnea (ICD‐9‐CM: 327.20, 327.21, 327.23, 327.27, 327.29, 780.51, 780.53, 780.57)a | 9.57 | 0.87 | 0.81‐0.94 | 9.72 | 0.84 | 0.78‐0.90 |
| History of mechanical ventilation (ICD‐9‐CM: 93.90, 96.70, 96.71, 96.72)a | 6.00 | 1.19 | 1.11‐1.27 | 6.00 | 1.15 | 1.08‐1.24 |
| Respirator dependence/respiratory failure (CC 7778)a | 1.15 | 0.89 | 0.77‐1.02 | 1.20 | 0.78 | 0.68‐0.91 |
| Cardiorespiratory failure and shock (CC 79) | 26.35 | 1.60 | 1.53‐1.68 | 26.34 | 1.59 | 1.52‐1.66 |
| Congestive heart failure (CC 80) | 41.50 | 1.34 | 1.28‐1.39 | 41.39 | 1.31 | 1.25‐1.36 |
| Chronic atherosclerosis (CC 8384)a | 50.44 | 0.87 | 0.83‐0.90 | 50.12 | 0.91 | 0.87‐0.94 |
| Arrhythmias (CC 9293) | 37.15 | 1.17 | 1.12‐1.22 | 37.06 | 1.15 | 1.10‐1.20 |
| Vascular or circulatory disease (CC 104106) | 38.20 | 1.09 | 1.05‐1.14 | 38.09 | 1.02 | 0.98‐1.06 |
| Fibrosis of lung and other chronic lung disorder (CC 109) | 16.96 | 1.08 | 1.03‐1.13 | 17.08 | 1.11 | 1.06‐1.17 |
| Asthma (CC 110) | 17.05 | 0.67 | 0.63‐0.70 | 16.90 | 0.67 | 0.63‐0.70 |
| Pneumonia (CC 111113) | 49.46 | 1.29 | 1.24‐1.35 | 49.41 | 1.27 | 1.22‐1.33 |
| Pleural effusion/pneumothorax (CC 114) | 11.78 | 1.17 | 1.11‐1.23 | 11.54 | 1.18 | 1.12‐1.25 |
| Other lung disorders (CC 115) | 53.07 | 0.80 | 0.77‐0.83 | 53.17 | 0.83 | 0.80‐0.87 |
| Other comorbid conditions | ||||||
| Metastatic cancer and acute leukemia (CC 7) | 2.76 | 2.34 | 2.14‐2.56 | 2.79 | 2.15 | 1.97‐2.35 |
| Lung, upper digestive tract, and other severe cancers (CC 8)a | 5.98 | 1.80 | 1.68‐1.92 | 6.02 | 1.98 | 1.85‐2.11 |
| Lymphatic, head and neck, brain, and other major cancers; breast, prostate, colorectal and other cancers and tumors; other respiratory and heart neoplasms (CC 911) | 14.13 | 1.03 | 0.97‐1.08 | 14.19 | 1.01 | 0.95‐1.06 |
| Other digestive and urinary neoplasms (CC 12) | 6.91 | 0.91 | 0.84‐0.98 | 7.05 | 0.85 | 0.79‐0.92 |
| Diabetes and DM complications (CC 1520, 119120) | 38.31 | 0.91 | 0.87‐0.94 | 38.29 | 0.91 | 0.87‐0.94 |
| Protein‐calorie malnutrition (CC 21) | 7.40 | 2.18 | 2.07‐2.30 | 7.44 | 2.09 | 1.98‐2.20 |
| Disorders of fluid/electrolyte/acid‐base (CC 2223) | 32.05 | 1.13 | 1.08‐1.18 | 32.16 | 1.24 | 1.19‐1.30 |
| Other endocrine/metabolic/nutritional disorders (CC 24) | 67.99 | 0.75 | 0.72‐0.78 | 67.88 | 0.76 | 0.73‐0.79 |
| Other gastrointestinal disorders (CC 36) | 56.21 | 0.81 | 0.78‐0.84 | 56.18 | 0.78 | 0.75‐0.81 |
| Osteoarthritis of hip or knee (CC 40) | 9.32 | 0.74 | 0.69‐0.79 | 9.33 | 0.80 | 0.74‐0.85 |
| Other musculoskeletal and connective tissue disorders (CC 43) | 64.14 | 0.83 | 0.80‐0.86 | 64.20 | 0.83 | 0.80‐0.87 |
| Iron deficiency and other/unspecified anemias and blood disease (CC 47) | 40.80 | 1.08 | 1.04‐1.12 | 40.72 | 1.08 | 1.04‐1.13 |
| Dementia and senility (CC 4950) | 17.06 | 1.09 | 1.04‐1.14 | 16.97 | 1.09 | 1.04‐1.15 |
| Drug/alcohol abuse, without dependence (CC 53)a | 23.51 | 0.78 | 0.75‐0.82 | 23.38 | 0.76 | 0.72‐0.80 |
| Other psychiatric disorders (CC 60)a | 16.49 | 1.12 | 1.07‐1.18 | 16.43 | 1.12 | 1.06‐1.17 |
| Quadriplegia, paraplegia, functional disability (CC 6769, 100102, 177178) | 4.92 | 1.03 | 0.95‐1.12 | 4.92 | 1.08 | 0.99‐1.17 |
| Mononeuropathy, other neurological conditions/emnjuries (CC 76) | 11.35 | 0.85 | 0.80‐0.91 | 11.28 | 0.88 | 0.83‐0.93 |
| Hypertension and hypertensive disease (CC 9091) | 80.40 | 0.78 | 0.75‐0.82 | 80.35 | 0.79 | 0.75‐0.83 |
| Stroke (CC 9596)a | 6.77 | 1.00 | 0.93‐1.08 | 6.73 | 0.98 | 0.91‐1.05 |
| Retinal disorders, except detachment and vascular retinopathies (CC 121) | 10.79 | 0.87 | 0.82‐0.93 | 10.69 | 0.90 | 0.85‐0.96 |
| Other eye disorders (CC 124)a | 19.05 | 0.90 | 0.86‐0.95 | 19.13 | 0.98 | 0.85‐0.93 |
| Other ear, nose, throat, and mouth disorders (CC 127) | 35.21 | 0.83 | 0.80‐0.87 | 35.02 | 0.80 | 0.77‐0.83 |
| Renal failure (CC 131)a | 17.92 | 1.12 | 1.07‐1.18 | 18.16 | 1.13 | 1.08‐1.19 |
| Decubitus ulcer or chronic skin ulcer (CC 148149) | 7.42 | 1.27 | 1.19‐1.35 | 7.42 | 1.33 | 1.25‐1.42 |
| Other dermatological disorders (CC 153) | 28.46 | 0.90 | 0.87‐0.94 | 28.32 | 0.89 | 0.86‐0.93 |
| Trauma (CC 154156, 158161) | 9.04 | 1.09 | 1.03‐1.16 | 8.99 | 1.15 | 1.08‐1.22 |
| Vertebral fractures (CC 157) | 5.01 | 1.33 | 1.24‐1.44 | 4.97 | 1.29 | 1.20‐1.39 |
| Major complications of medical care and trauma (CC 164) | 5.47 | 0.81 | 0.75‐0.88 | 5.55 | 0.82 | 0.76‐0.89 |
Model Derivation
We used hierarchical logistic regression models to model the log‐odds of mortality as a function of patient‐level clinical characteristics and a random hospital‐level intercept. At the patient level, each model adjusts the log‐odds of mortality for age and the selected clinical covariates. The second level models the hospital‐specific intercepts as arising from a normal distribution. The hospital intercept represents the underlying risk of mortality, after accounting for patient risk. If there were no differences among hospitals, then after adjusting for patient risk, the hospital intercepts should be identical across all hospitals.
Estimation of Hospital Risk‐Standardized Mortality Rate
We calculated a risk‐standardized mortality rate, defined as the ratio of predicted to expected deaths (similar to observed‐to‐expected), multiplied by the national unadjusted mortality rate.[21] The expected number of deaths for each hospital was estimated by applying the estimated regression coefficients to the characteristics of each hospital's patients, adding the average of the hospital‐specific intercepts, transforming the data by using an inverse logit function, and summing the data from all patients in the hospital to obtain the count. The predicted number of deaths was calculated in the same way, substituting the hospital‐specific intercept for the average hospital‐specific intercept.
Model Performance, Validation, and Reliability Testing
We used the remaining admissions in 2008 as the model validation sample. We computed several summary statistics to assess the patient‐level model performance in both the development and validation samples,[22] including over‐fitting indices, predictive ability, area under the receiver operating characteristic (ROC) curve, distribution of residuals, and model 2. In addition, we assessed face validity through a survey of members of the technical expert panel. To assess reliability of the model across data years, we repeated the modeling process using qualifying COPD admissions in both 2007 and 2009. Finally, to assess generalizability we evaluated the model's performance in an all‐payer sample of data from patients admitted to California hospitals in 2006.
Analyses were conducted using SAS version 9.1.3 (SAS Institute Inc., Cary, NC). We estimated the hierarchical models using the GLIMMIX procedure in SAS.
The Human Investigation Committee at the Yale University School of Medicine/Yale New Haven Hospital approved an exemption (HIC#0903004927) for the authors to use CMS claims and enrollment data for research analyses and publication.
RESULTS
Model Derivation
After exclusions were applied, the development sample included 150,035 admissions in 2008 at 4537 US hospitals (Figure 1). Factors that were most strongly associated with the risk of mortality included metastatic cancer (odds ratio [OR] 2.34), protein calorie malnutrition (OR 2.18), nonmetastatic cancers of the lung and upper digestive tract, (OR 1.80) cardiorespiratory failure and shock (OR 1.60), and congestive heart failure (OR 1.34) (Table 2).
Model Performance, Validation, and Reliability
The model had a C statistic of 0.72, indicating good discrimination, and predicted mortality in the development sample ranged from 1.52% in the lowest decile to 23.74% in the highest. The model validation sample, using the remaining cases from 2008, included 149,646 admissions from 4535 hospitals. Variable frequencies and ORs were similar in both samples (Table 2). Model performance was also similar in the validation samples, with good model discrimination and fit (Table 3). Ten of 12 technical expert panel members responded to the survey, of whom 90% at least somewhat agreed with the statement, the COPD mortality measure provides an accurate reflection of quality. When the model was applied to patients age 18 years and older in the 2006 California Patient Discharge Data, overall discrimination was good (C statistic, 0.74), including in those age 18 to 64 years (C statistic, 0.75; 65 and above C statistic, 0.70).
| Development | Validation | Data Years | ||
|---|---|---|---|---|
| Indices | Sample, 2008 | Sample, 2008 | 2007 | 2009 |
| ||||
| Number of admissions | 150,035 | 149,646 | 259,911 | 279,377 |
| Number of hospitals | 4537 | 4535 | 4636 | 4571 |
| Mean risk‐standardized mortality rate, % (SD) | 8.62 (0.94) | 8.64 (1.07) | 8.97 (1.12) | 8.08 (1.09) |
| Calibration, 0, 1 | 0.034, 0.985 | 0.009, 1.004 | 0.095, 1.022 | 0.120, 0.981 |
| Discriminationpredictive ability, lowest decile %highest decile % | 1.5223.74 | 1.6023.78 | 1.5424.64 | 1.4222.36 |
| Discriminationarea under the ROC curve, C statistic | 0.720 | 0.723 | 0.728 | 0.722 |
| Residuals lack of fit, Pearson residual fall % | ||||
| 2 | 0 | 0 | 0 | 0 |
| 2, 0 | 91.14 | 91.4 | 91.08 | 91.93 |
| 0, 2 | 1.66 | 1.7 | 1.96 | 1.42 |
| 2+ | 6.93 | 6.91 | 6.96 | 6.65 |
| Model Wald 2 (number of covariates) | 6982.11 (42) | 7051.50 (42) | 13042.35 (42) | 12542.15 (42) |
| P value | <0.0001 | <0.0001 | <0.0001 | <0.0001 |
| Between‐hospital variance, (standard error) | 0.067 (0.008) | 0.078 (0.009) | 0.067 (0.006) | 0.072 (0.006) |
Reliability testing demonstrated consistent performance over several years. The frequency and ORs of the variables included in the model showed only minor changes over time. The area under the ROC curve (C statistic) was 0.73 for the model in the 2007 sample and 0.72 for the model using 2009 data (Table 3).
Hospital Risk‐Standardized Mortality Rates
The mean unadjusted hospital 30‐day mortality rate was 8.6% and ranged from 0% to 100% (Figure 2a). Risk‐standardized mortality rates varied across hospitals (Figure 2b). The mean risk‐standardized mortality rate was 8.6% and ranged from 5.9% to 13.5%. The odds of mortality at a hospital 1 standard deviation above average was 1.20 times that of a hospital 1 standard deviation below average.
DISCUSSION
We present a hospital‐level risk‐standardized mortality measure for patients admitted with COPD based on administrative claims data that are intended for public reporting and that have achieved endorsement by the National Quality Forum, a voluntary consensus standards‐setting organization. Across more than 4500 US hospitals, the mean 30‐day risk‐standardized mortality rate in 2008 was 8.6%, and we observed considerable variation across institutions, despite adjustment for case mix, suggesting that improvement by lower‐performing institutions may be an achievable goal.
Although improving the delivery of evidence‐based care processes and outcomes of patients with acute myocardial infarction, heart failure, and pneumonia has been the focus of national quality improvement efforts for more than a decade, COPD has largely been overlooked.[23] Within this context, this analysis represents the first attempt to systematically measure, at the hospital level, 30‐day all‐cause mortality for patients admitted to US hospitals for exacerbation of COPD. The model we have developed and validated is intended to be used to compare the performance of hospitals while controlling for differences in the pretreatment risk of mortality of patients and accounting for the clustering of patients within hospitals, and will facilitate surveillance of hospital‐level risk‐adjusted outcomes over time.
In contrast to process‐based measures of quality, such as the percentage of patients with pneumonia who receive appropriate antibiotic therapy, performance measures based on patient outcomes provide a more comprehensive view of care and are more consistent with patients' goals.[24] Additionally, it is well established that hospital performance on individual and composite process measures explains only a small amount of the observed variation in patient outcomes between institutions.[25] In this regard, outcome measures incorporate important, but difficult to measure aspects of care, such as diagnostic accuracy and timing, communication and teamwork, the recognition and response to complications, care coordination at the time of transfers between levels of care, and care settings. Nevertheless, when used for making inferences about the quality of hospital care, individual measures such as the risk‐standardized hospital mortality rate should be interpreted in the context of other performance measures, including readmission, patient experience, and costs of care.
A number of prior investigators have described the outcomes of care for patients hospitalized with exacerbations of COPD, including identifying risk factors for mortality. Patil et al. carried out an analysis of the 1996 Nationwide Inpatient Sample and described an overall in‐hospital mortality rate of 2.5% among patients with COPD, and reported that a multivariable model containing sociodemographic characteristics about the patient and comorbidities had an area under the ROC curve of 0.70.[3] In contrast, this hospital‐level measure includes patients with a principal diagnosis of respiratory failure and focuses on 30‐day rather than inpatient mortality, accounting for the nearly 3‐fold higher mortality rate we observed. In a more recent study that used clinical from a large multistate database, Tabak et al. developed a prediction model for inpatient mortality for patients with COPD that contained only 4 factors: age, blood urea nitrogen, mental status, and pulse, and achieved an area under the ROC curve of 0.72.[4] The simplicity of such a model and its reliance on clinical measurements makes it particularly well suited for bedside application by clinicians, but less valuable for large‐scale public reporting programs that rely on administrative data. In the only other study identified that focused on the assessment of hospital mortality rates, Agabiti et al. analyzed the outcomes of 12,756 patients hospitalized for exacerbations of COPD, using similar ICD‐9‐CM diagnostic criteria as in this study, at 21 hospitals in Rome, Italy.[26] They reported an average crude 30‐day mortality rate of 3.8% among a group of 5 benchmark hospitals and an average mortality of 7.5% (range, 5.2%17.2%) among the remaining institutions.
To put the variation we observed in mortality rates into a broader context, the relative difference in the risk‐standardized hospital mortality rates across the 10th to 90th percentiles of hospital performance was 25% for acute myocardial infarction and 39% for heart failure, whereas rates varied 30% for COPD, from 7.6% to 9.9%.[27] Model discrimination in COPD (C statistic, 0.72) was also similar to that reported for models used for public reporting of hospital mortality in acute myocardial infarction (C statistic, 0.71) and pneumonia (C statistic, 0.72).
This study has a number of important strengths. First, the model was developed from a large sample of recent Medicare claims, achieved good discrimination, and was validated in samples not limited to Medicare beneficiaries. Second, by including patients with a principal diagnosis of COPD, as well as those with a principal diagnosis of acute respiratory failure when accompanied by a secondary diagnosis of COPD with acute exacerbation, this model can be used to assess hospital performance across the full spectrum of disease severity. This broad set of ICD‐9‐CM codes used to define the cohort also ensures that efforts to measure hospital performance will be less influenced by differences in documentation and coding practices across hospitals relating to the diagnosis or sequencing of acute respiratory failure diagnoses. Moreover, the inclusion of patients with respiratory failure is important because these patients have the greatest risk of mortality, and are those in whom efforts to improve the quality and safety of care may have the greatest impact. Third, rather than relying solely on information documented during the index admission, we used ambulatory and inpatient claims from the full year prior to the index admission to identify comorbidities and to distinguish them from potential complications of care. Finally, we did not include factors such as hospital characteristics (eg, number of beds, teaching status) in the model. Although they might have improved overall predictive ability, the goal of the hospital mortality measure is to enable comparisons of mortality rates among hospitals while controlling for differences in patient characteristics. To the extent that factors such as size or teaching status might be independently associated with hospital outcomes, it would be inappropriate to adjust away their effects, because mortality risk should not be influenced by hospital characteristics other than through their effects on quality.
These results should be viewed in light of several limitations. First, we used ICD‐9‐CM codes derived from claims files to define the patient populations included in the measure rather than collecting clinical or physiologic information prospectively or through manual review of medical records, such as the forced expiratory volume in 1 second or whether the patient required long‐term oxygen therapy. Nevertheless, we included a broad set of potential diagnosis codes to capture the full spectrum of COPD exacerbations and to minimize differences in coding across hospitals. Second, because the risk‐adjustment included diagnoses coded in the year prior to the index admission, it is potentially subject to bias due to regional differences in medical care utilization that are not driven by underlying differences in patient illness.[28] Third, using administrative claims data, we observed some paradoxical associations in the model that are difficult to explain on clinical grounds, such as a protective effect of substance and alcohol abuse or prior episodes of respiratory failure. Fourth, although we excluded patients from the analysis who were enrolled in hospice prior to, or on the day of, the index admission, we did not exclude those who choose to withdraw support, transition to comfort measures only, or enrolled in hospice care during a hospitalization. We do not seek to penalize hospitals for being sensitive to the preferences of patients at the end of life. At the same time, it is equally important that the measure is capable of detecting the outcomes of suboptimal care that may in some instances lead a patient or their family to withdraw support or choose hospice. Finally, we did not have the opportunity to validate the model against a clinical registry of patients with COPD, because such data do not currently exist. Nevertheless, the use of claims as a surrogate for chart data for risk adjustment has been validated for several conditions, including acute myocardial infarction, heart failure, and pneumonia.[29, 30]
CONCLUSIONS
Risk‐standardized 30‐day mortality rates for Medicare beneficiaries with COPD vary across hospitals in the US. Calculating and reporting hospital outcomes using validated performance measures may catalyze quality improvement activities and lead to better outcomes. Additional research would be helpful to confirm that hospitals with lower mortality rates achieve care that meets the goals of patients and their families better than at hospitals with higher mortality rates.
Acknowledgment
The authors thank the following members of the technical expert panel: Darlene Bainbridge, RN, MS, NHA, CPHQ, CPHRM, President/CEO, Darlene D. Bainbridge & Associates, Inc.; Robert A. Balk, MD, Director of Pulmonary and Critical Care Medicine, Rush University Medical Center; Dale Bratzler, DO, MPH, President and CEO, Oklahoma Foundation for Medical Quality; Scott Cerreta, RRT, Director of Education, COPD Foundation; Gerard J. Criner, MD, Director of Temple Lung Center and Divisions of Pulmonary and Critical Care Medicine, Temple University; Guy D'Andrea, MBA, President, Discern Consulting; Jonathan Fine, MD, Director of Pulmonary Fellowship, Research and Medical Education, Norwalk Hospital; David Hopkins, MS, PhD, Senior Advisor, Pacific Business Group on Health; Fred Martin Jacobs, MD, JD, FACP, FCCP, FCLM, Executive Vice President and Director, Saint Barnabas Quality Institute; Natalie Napolitano, MPH, RRT‐NPS, Respiratory Therapist, Inova Fairfax Hospital; Russell Robbins, MD, MBA, Principal and Senior Clinical Consultant, Mercer. In addition, the authors acknowledge and thank Angela Merrill, Sandi Nelson, Marian Wrobel, and Eric Schone from Mathematica Policy Research, Inc., Sharon‐Lise T. Normand from Harvard Medical School, and Lein Han and Michael Rapp at The Centers for Medicare & Medicaid Services for their contributions to this work.
Disclosures
Peter K. Lindenauer, MD, MSc, is the guarantor of this article, taking responsibility for the integrity of the work as a whole, from inception to published article, and takes responsibility for the content of the manuscript, including the data and data analysis. All authors have made substantial contributions to the conception and design, or acquisition of data, or analysis and interpretation of data; have drafted the submitted article or revised it critically for important intellectual content; and have provided final approval of the version to be published. Preparation of this manuscript was completed under Contract Number: HHSM‐5002008‐0025I/HHSM‐500‐T0001, Modification No. 000007, Option Year 2 Measure Instrument Development and Support (MIDS). Sponsors did not contribute to the development of the research or manuscript. Dr. Au reports being an unpaid research consultant for Bosch Inc. He receives research funding from the NIH, Department of Veterans Affairs, AHRQ, and Gilead Sciences. The views of the this manuscript represent the authors and do not necessarily represent those of the Department of Veterans Affairs. Drs. Drye and Bernheim report receiving contract funding from CMS to develop and maintain quality measures.
- FASTSTATS—chronic lower respiratory disease. Available at: http://www.cdc.gov/nchs/fastats/copd.htm. Accessed September 18, 2010.
- National Heart, Lung and Blood Institute. Morbidity and mortality chartbook. Available at: http://www.nhlbi.nih.gov/resources/docs/cht‐book.htm. Accessed April 27, 2010.
- , , , . In‐hospital mortality following acute exacerbations of chronic obstructive pulmonary disease. Arch Intern Med. 2003;163(10):1180–1186.
- , , , , . Mortality and need for mechanical ventilation in acute exacerbations of chronic obstructive pulmonary disease: development and validation of a simple risk score. Arch Intern Med. 2009;169(17):1595–1602.
- , , , , , . Quality of care for patients hospitalized for acute exacerbations of chronic obstructive pulmonary disease. Ann Intern Med. 2006;144(12):894–903.
- , , , , . Use of beta blockers and the risk of death in hospitalised patients with acute exacerbations of COPD. Thorax. 2008;63(4):301–305.
- , , , , . HCUP facts and figures: statistics on hospital‐based care in the United States, 2007. 2009. Available at: http://www.hcup‐us.ahrq.gov/reports.jsp. Accessed August 6, 2012.
- , . Predictors of long‐term survival in elderly patients hospitalized for acute exacerbations of chronic obstructive pulmonary disease. Respirology. 2008;13(6):851–855.
- , , , , , . The impact on risk‐factor analysis of different mortality outcomes in COPD patients. Eur Respir J 2008;32(3):629–636.
- , , , , , . Clinical audit indicators of outcome following admission to hospital with acute exacerbation of chronic obstructive pulmonary disease. Thorax. 2002;57(2):137–141.
- , , , et al. The quality of obstructive lung disease care for adults in the United States as measured by adherence to recommended processes. Chest. 2006;130(6):1844–1850.
- , , , , , . Management of acute exacerbations of chronic obstructive pulmonary disease in the elderly: physician practices in the community hospital setting. J Okla State Med Assoc. 2004;97(6):227–232.
- , , . Leadership by Example: Coordinating Government Roles in Improving Health Care Quality. Washington, DC: National Academies Press; 2002.
- Patient Protection and Affordable Care Act [H.R. 3590], Pub. L. No. 111–148, §2702, 124 Stat. 119, 318–319 (March 23, 2010). Available at: http://www.gpo.gov/fdsys/pkg/PLAW‐111publ148/html/PLAW‐111publ148.htm. Accessed July 15, 2012.
- National Quality Forum. NQF Endorses Additional Pulmonary Measure. 2013. Available at: http://www.qualityforum.org/News_And_Resources/Press_Releases/2013/NQF_Endorses_Additional_Pulmonary_Measure.aspx. Accessed January 11, 2013.
- National Quality Forum. National voluntary consensus standards for patient outcomes: a consensus report. Washington, DC: National Quality Forum; 2011.
- The Measures Management System. The Centers for Medicare and Medicaid Services. Available at: http://www.cms.gov/Medicare/Quality‐Initiatives‐Patient‐Assessment‐Instruments/MMS/index.html?redirect=/MMS/. Accessed August 6, 2012.
- , , , et al. Standards for statistical models used for public reporting of health outcomes: an American Heart Association Scientific Statement from the Quality of Care and Outcomes Research Interdisciplinary Writing Group: cosponsored by the Council on Epidemiology and Prevention and the Stroke Council. Endorsed by the American College of Cardiology Foundation. Circulation. 2006;113(3):456–462.
- , , , et al. Comparison of hospital risk‐standardized mortality rates calculated by using in‐hospital and 30‐day models: an observational study with implications for hospital profiling. Ann Intern Med. 2012;156(1 pt 1):19–26.
- , , , et al. Diagnostic cost group hierarchical condition category models for Medicare risk adjustment. Report prepared for the Health Care Financing Administration. Health Economics Research, Inc.; 2000. Available at: http://www.cms.gov/Research‐Statistics‐Data‐and‐Systems/Statistics‐Trends‐and‐Reports/Reports/downloads/pope_2000_2.pdf. Accessed November 7, 2009.
- , . Statistical and clinical aspects of hospital outcomes profiling. Stat Sci. 2007;22(2):206–226.
- , . Using full probability models to compute probabilities of actual interest to decision makers. Int J Technol Assess Health Care. 2001;17(1):17–26.
- , , . COPD performance measures: missing opportunities for improving care. Chest. 2010;137(5):1181–1189.
- , , , , . Measuring Performance For Treating Heart Attacks And Heart Failure: The Case For Outcomes Measurement. Health Aff. 2007;26(1):75–85.
- , , , et al. Hospital quality for acute myocardial infarction: correlation among process measures and relationship with short‐term mortality. JAMA. 2006;296(1):72–78.
- , , , et al. Profiling hospital performance to monitor the quality of care: the case of COPD. Eur Respir J. 2010;35(5):1031–1038.
- , , , et al. Patterns of hospital performance in acute myocardial infarction and heart failure 30‐day mortality and readmission. Circ Cardiovasc Qual Outcomes. 2009;2(5):407–413.
- , , , , . Geographic variation in diagnosis frequency and risk of death among Medicare beneficiaries. JAMA. 2011;305(11):1113–1118.
- , , , et al. An administrative claims model for profiling hospital 30‐day mortality rates for pneumonia patients. PLoS ONE. 2011;6(4):e17401.
- , , , et al. An Administrative Claims Model Suitable for Profiling Hospital Performance Based on 30‐Day Mortality Rates Among Patients With Heart Failure. Circulation. 2006;113(13):1693–1701.
Copyright © 2013 Society of Hospital Medicine
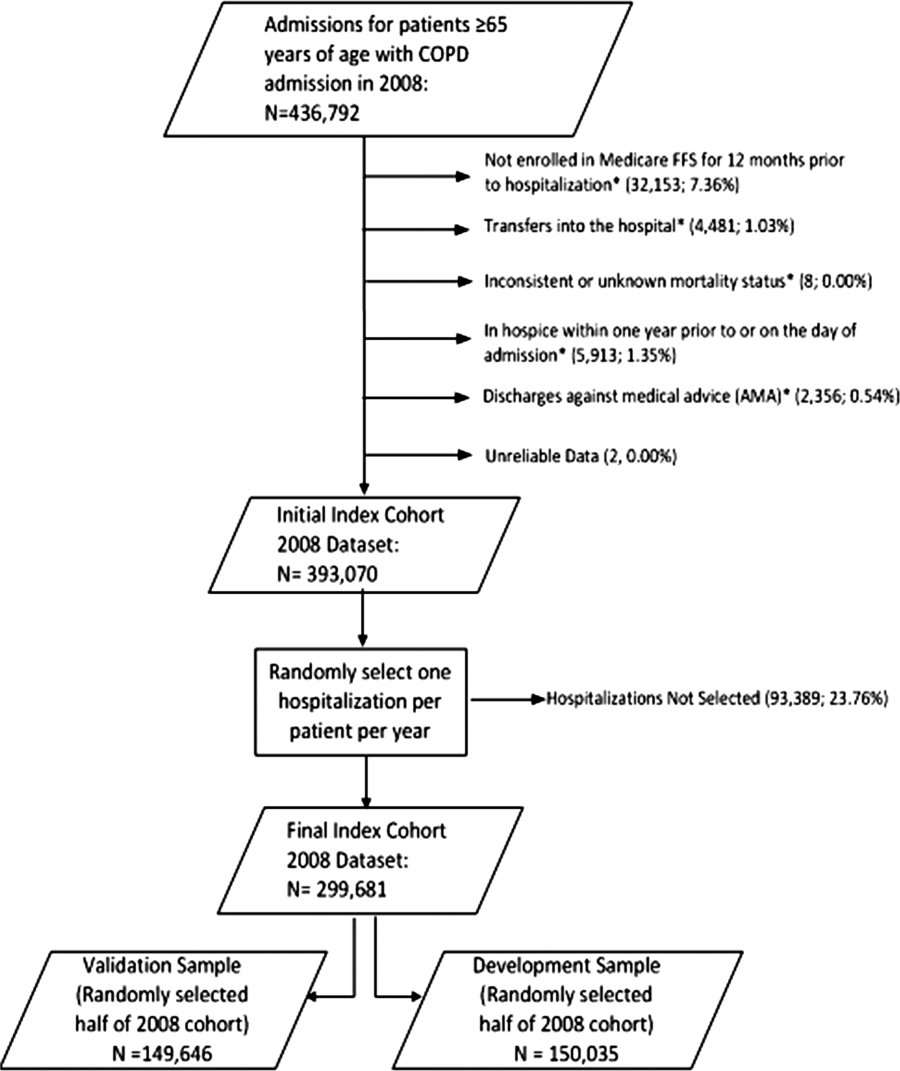
Quantifying Treatment Intensity
Healthcare spending exceeded $2.5 trillion in 2007, and payments to hospitals represented the largest portion of this spending (more than 30%), equaling the combined cost of physician services and prescription drugs.[1, 2] Researchers and policymakers have emphasized the need to improve the value of hospital care in the United States, but this has been challenging, in part because of the difficulty in identifying hospitals that have high resource utilization relative to their peers.[3, 4, 5, 6, 7, 8, 9, 10, 11]
Most hospitals calculate their costs using internal accounting systems that determine resource utilization via relative value units (RVUs).[7, 8] RVU‐derived costs, also known as hospital reported costs, have proven to be an excellent method for quantifying what it costs a given hospital to provide a treatment, test, or procedure. However, RVU‐based costs are less useful for comparing resource utilization across hospitals because the cost to provide a treatment or service varies widely across hospitals. The cost of an item calculated using RVUs includes not just the item itself, but also a portion of the fixed costs of the hospital (overhead, labor, and infrastructure investments such as electronic records, new buildings, or expensive radiological or surgical equipment).[12] These costs vary by institution, patient population, region of the country, teaching status, and many other variables, making it difficult to identify resource utilization across hospitals.[13, 14]
Recently, a few claims‐based multi‐institutional datasets have begun incorporating item‐level RVU‐based costs derived directly from the cost accounting systems of participating institutions.[15] Such datasets allow researchers to compare reported costs of care from hospital to hospital, but because of the limitations we described above, they still cannot be used to answer the question: Which hospitals with higher costs of care are actually providing more treatments and services to patients?
To better facilitate the comparison of resource utilization patterns across hospitals, we standardized the unit costs of all treatments and services across hospitals by applying a single cost to every item across hospitals. This standardized cost allowed to compare utilization of that item (and the 15,000 other items in the database) across hospitals. We then compared estimates of resource utilization as measured by the 2 approaches: standardized and RVU‐based costs.
METHODS
Ethics Statement
All data were deidentified, by Premier, Inc., at both the hospital and patient level in accordance with the Health Insurance Portability and Accountability Act. The Yale University Human Investigation Committee reviewed the protocol for this study and determined that it is not considered to be human subjects research as defined by the Office of Human Research Protections.
Data Source
We conducted a cross‐sectional study using data from hospitals that participated in the database maintained by Premier Healthcare Informatics (Charlotte, NC) in the years 2009 to 2010. The Premier database is a voluntary, fee‐supported database created to measure quality and healthcare utilization.[3, 16, 17, 18] In 2010, it included detailed billing data from 500 hospitals in the United States, with more than 130 million cumulative hospital discharges. The detailed billing data includes all elements found in hospital claims derived from the uniform billing‐04 form, as well as an itemized, date‐stamped log of all items and services charged to the patient or insurer, such as medications, laboratory tests, and diagnostic and therapeutic services. The database includes approximately 15% of all US hospitalizations. Participating hospitals are similar to the composition of acute care hospitals nationwide. They represent all regions of the United States, and represent predominantly small‐ to mid‐sized nonteaching facilities that serve a largely urban population. The database also contains hospital reported costs at the item level as well as the total cost of the hospitalization. Approximately 75% of hospitals that participate submit RVU‐based costs taken from internal cost accounting systems. Because of our focus on comparing standardized costs to reported costs, we included only data from hospitals that use RVU‐based costs in this study.
Study Subjects
We included adult patients with a hospitalization recorded in the Premier database between January 1, 2009 and December 31, 2010, and a principal discharge diagnosis of heart failure (HF) (International Classification of Diseases, Ninth Revision, Clinical Modification codes: 402.01, 402.11, 402.91, 404.01, 404.03, 404.11, 404.13, 404.91, 404.93, 428.xx). We excluded transfers, patients assigned a pediatrician as the attending of record, and those who received a heart transplant or ventricular assist device during their stay. Because cost data are prone to extreme outliers, we excluded hospitalizations that were in the top 0.1% of length of stay, number of billing records, quantity of items billed, or total standardized cost. We also excluded hospitals that admitted fewer than 25 HF patients during the study period to reduce the possibility that a single high‐cost patient affected the hospital's cost profile.
Hospital Information
For each hospital included in the study, we recorded number of beds, teaching status, geographic region, and whether it served an urban or rural population.
Assignment of Standardized Costs
We defined reported cost as the RVU‐based cost per item in the database. We then calculated the median across hospitals for each item in the database and set this as the standardized unit cost of that item at every hospital (Figure 1). Once standardized costs were assigned at the item level, we summed the costs of all items assigned to each patient and calculated the standardized cost of a hospitalization per patient at each hospital.

Examination of Cost Variation
We compared the standardized and reported costs of hospitalizations using medians, interquartile ranges, and interquartile ratios (Q75/Q25). To examine whether standardized costs can reduce the noise due to differences in overhead and other fixed costs, we calculated, for each hospital, the coefficients of variation (CV) for per‐day reported and standardized costs and per‐hospitalization reported and standardized costs. We used the Fligner‐Killeen test to determine whether the variance of CVs was different for reported and standardized costs.[19]
Creation of Basket of Goods
Because there can be differences in the costs of items, the number and types of items administered during hospitalizations, 2 hospitals with similar reported costs for a hospitalization might deliver different quantities and combinations of treatments (Figure 1). We wished to demonstrate that there is variation in reported costs of items when the quantity and type of item is held constant, so we created a basket of items. We chose items that are commonly administered to patients with heart failure, but could have chosen any combination of items. The basket included a day of medical room and board, a day of intensive care unit (ICU) room and board, a single dose of ‐blocker, a single dose of angiotensin‐converting enzyme inhibitor, complete blood count, a B‐natriuretic peptide level, a chest radiograph, a chest computed tomography, and an echocardiogram. We then examined the range of hospitals' reported costs for this basket of goods using percentiles, medians, and interquartile ranges.
Reported to Standardized Cost Ratio
Next, we calculated standardized costs of hospitalizations for included hospitals and examined the relationship between hospitals' mean reported costs and mean standardized costs. This ratio could help diagnose the mechanism of high reported costs for a hospital, because high reported costs with low utilization would indicate high fixed costs, while high reported costs with high utilization would indicate greater use of tests and treatments. We assigned hospitals to strata based on reported costs greater than standardized costs by more than 25%, reported costs within 25% of standardized costs, and reported costs less than standardized costs by more than 25%. We examined the association between hospital characteristics and strata using a 2 test. All analyses were carried out using SAS version 9.3 (SAS Institute Inc., Cary, NC).
RESULTS
The 234 hospitals included in the analysis contributed a total of 165,647 hospitalizations, with the number of hospitalizations ranging from 33 to 2,772 hospitalizations per hospital (see Supporting Table 1 in the online version of this article). Most were located in urban areas (84%), and many were in the southern United States (42%). The median hospital reported cost per hospitalization was $6,535, with an interquartile range of $5,541 to $7,454. The median standardized cost per hospitalization was $6,602, with a range of $5,866 to $7,386. The interquartile ratio (Q75/Q25) of the reported costs of a hospitalization was 1.35. After costs were standardized, the interquartile ratio fell to 1.26, indicating that variation decreased. We found that the median hospital reported cost per day was $1,651, with an IQR of $1,400 to $1,933 (ratio 1.38), whereas the median standardized cost per day was $1,640, with an IQR of $1,511 to $1,812 (ratio 1.20).
There were more than 15,000 items (eg, treatments, tests, and supplies) that received a standardized charge code in our cohort. These were divided into 11 summary departments and 40 standard departments (see Supporting Table 2 in the online version of this article). We observed a high level of variation in the reported costs of individual items: the reported costs of a day of room and board in an ICU ranged from $773 at hospitals at the 10th percentile to $2,471 at the 90th percentile (Table 1.). The standardized cost of a day of ICU room and board was $1,577. We also observed variation in the reported costs of items across item categories. Although a day of medical room and board showed a 3‐fold difference between the 10th and 90th percentile, we observed a more than 10‐fold difference in the reported cost of an echocardiogram, from $31 at the 10th percentile to $356 at the 90th percentile. After examining the hospital‐level cost for a basket of goods, we found variation in the reported costs for these items across hospitals, with a 10th percentile cost of $1,552 and a 90th percentile cost of $3,967.
| Reported Costs | 10th Percentile | 25th Percentile | 75th Percentile | 90th Percentile | Median (Standardized Cost) |
|---|---|---|---|---|---|
| |||||
| Item | |||||
| Day of medical | 490.03 | 586.41 | 889.95 | 1121.20 | 722.59 |
| Day of ICU | 773.01 | 1275.84 | 1994.81 | 2471.75 | 1577.93 |
| Complete blood count | 6.87 | 9.34 | 18.34 | 23.46 | 13.07 |
| B‐natriuretic peptide | 12.13 | 19.22 | 44.19 | 60.56 | 28.23 |
| Metoprolol | 0.20 | 0.68 | 2.67 | 3.74 | 1.66 |
| Lisinopril | 0.28 | 1.02 | 2.79 | 4.06 | 1.72 |
| Spironolactone | 0.22 | 0.53 | 2.68 | 3.83 | 1.63 |
| Furosemide | 1.27 | 2.45 | 5.73 | 8.12 | 3.82 |
| Chest x‐ray | 43.88 | 51.54 | 89.96 | 117.16 | 67.45 |
| Echocardiogram | 31.53 | 98.63 | 244.63 | 356.50 | 159.07 |
| Chest CT (w & w/o contrast) | 65.17 | 83.99 | 157.23 | 239.27 | 110.76 |
| Noninvasive positive pressure ventilation | 126.23 | 127.25 | 370.44 | 514.67 | 177.24 |
| Electrocardiogram | 12.08 | 18.77 | 42.74 | 64.94 | 29.78 |
| Total basket | 1552.50 | 2157.85 | 3417.34 | 3967.78 | 2710.49 |
We found that 46 (20%) hospitals had reported costs of hospitalizations that were 25% greater than standardized costs (Figure 2). This group of hospitals had overestimated reported costs of utilization; 146 (62%) had reported costs within 25% of standardized costs, and 42 (17%) had reported costs that were 25% less than standardized costs (indicating that reported costs underestimated utilization). We examined the relationship between hospital characteristics and strata and found no significant association between the reported to standardized cost ratio and number of beds, teaching status, or urban location (Table 2). Hospitals in the Midwest and South were more likely to have a lower reported cost of hospitalizations, whereas hospitals in the West were more likely to have higher reported costs (P<0.001). When using the CV to compare reported costs to standardized costs, we found that per‐day standardized costs showed reduced variance (P=0.0238), but there was no significant difference in variance of the reported and standardized costs when examining the entire hospitalization (P=0.1423). At the level of the hospitalization, the Spearman correlation coefficient between reported and standardized cost was 0.89.
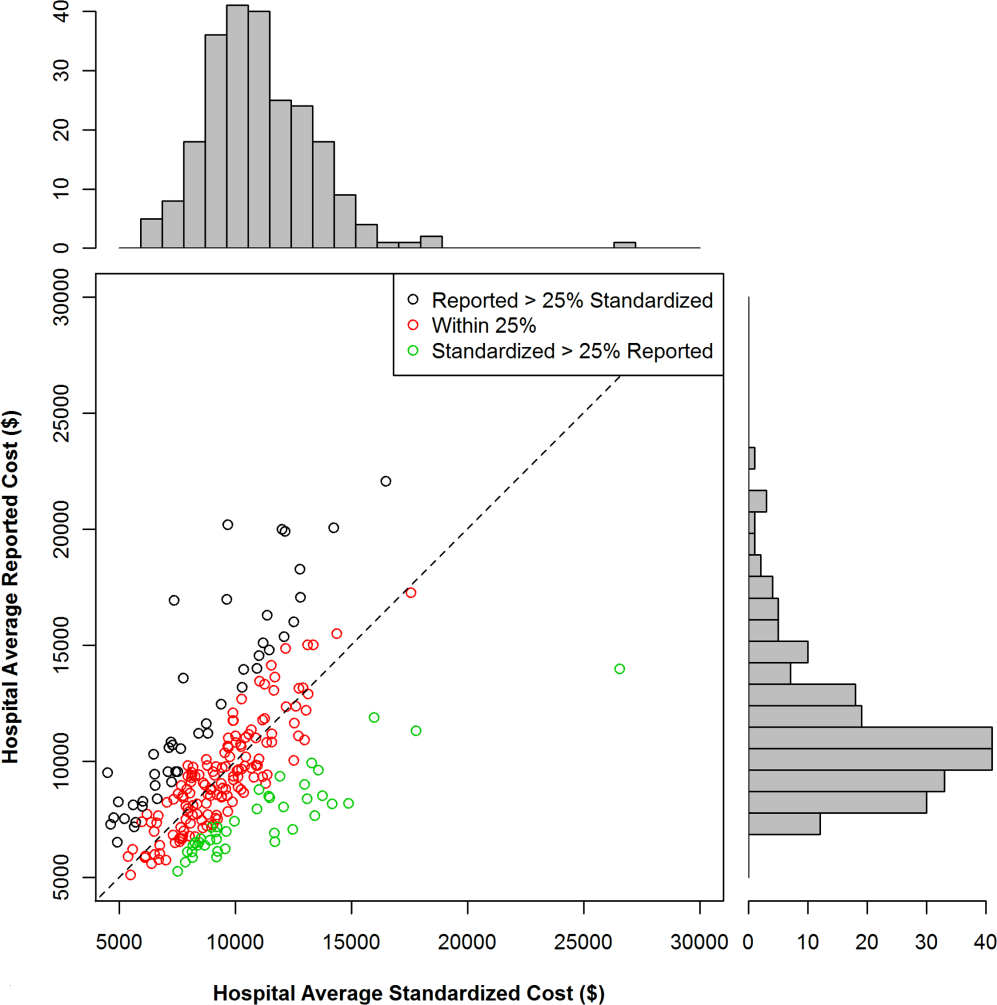
| Reported Greater Than Standardized by >25%, n (%) | Reported Within 25% (2‐tailed) of Standardized, n (%) | Reported Less Than Standardized by >25%, n (%) | P for 2 Test | |
|---|---|---|---|---|
| Total | 46 (19.7) | 146 (62.4) | 42 (17.0) | |
| No. of beds | 0.2313 | |||
| <200 | 19 (41.3) | 40 (27.4) | 12 (28.6) | |
| 200400 | 14 (30.4) | 67 (45.9) | 15 (35.7) | |
| >400 | 13 (28.3) | 39 (26.7) | 15 (35.7) | |
| Teaching | 0.8278 | |||
| Yes | 13 (28.3) | 45 (30.8) | 11 (26.2) | |
| No | 33 (71.7) | 101 (69.2) | 31 (73.8) | |
| Region | <0.0001 | |||
| Midwest | 7 (15.2) | 43 (29.5) | 19 (45.2) | |
| Northeast | 6 (13.0) | 18 (12.3) | 3 (7.1) | |
| South | 14 (30.4) | 64 (43.8) | 20 (47.6) | |
| West | 19 (41.3) | 21 (14.4) | 0 (0) | |
| Urban vs rural | 36 (78.3) | 128 (87.7) | 33 (78.6) | 0.1703 |
To better understand how hospitals can achieve high reported costs through different mechanisms, we more closely examined 3 hospitals with similar reported costs (Figure 3). These hospitals represented low, average, and high utilization according to their standardized costs, but had similar average per‐hospitalization reported costs: $11,643, $11,787, and $11,892, respectively. The corresponding standardized costs were $8,757, $11,169, and $15,978. The hospital with high utilization ($15,978 in standardized costs) was accounted for by increased use of supplies and other services. In contrast, the low‐ and average‐utilization hospitals had proportionally lower standardized costs across categories, with the greatest percentage of spending going toward room and board (includes nursing).
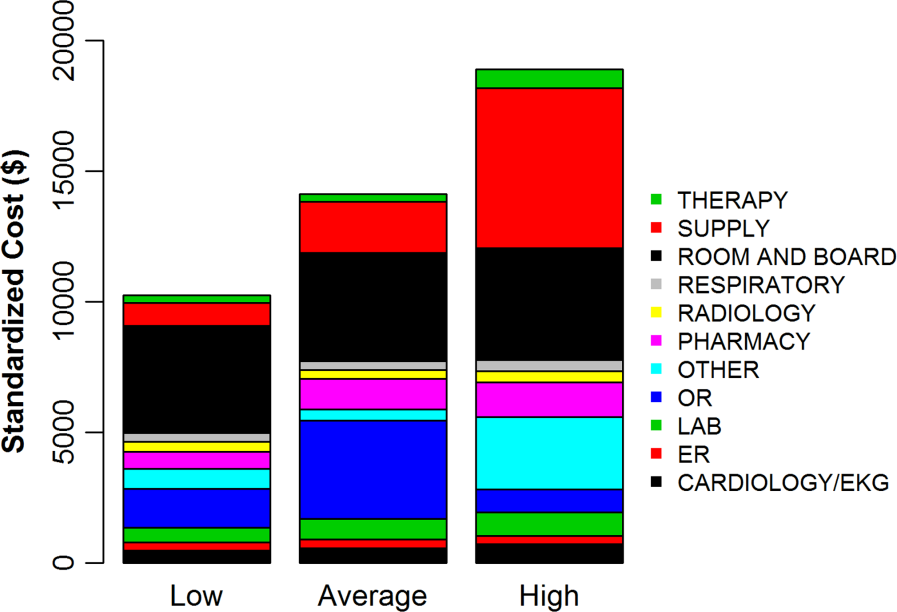
DISCUSSION
In a large national sample of hospitals, we observed variation in the reported costs for a uniform basket of goods, with a more than 2‐fold difference in cost between the 10th and 90th percentile hospitals. These findings suggest that reported costs have limited ability to reliably describe differences in utilization across hospitals. In contrast, when we applied standardized costs, the variance of per‐day costs decreased significantly, and the interquartile ratio of per‐day and hospitalization costs decreased as well, suggesting less variation in utilization across hospitals than would have been inferred from a comparison of reported costs. Applying a single, standard cost to all items can facilitate comparisons of utilization between hospitals (Figure 1). Standardized costs will give hospitals the potential to compare their utilization to their competitors and will facilitate research that examines the comparative effectiveness of high and low utilization in the management of medical and surgical conditions.
The reported to standardized cost ratio is another useful tool. It indicates whether the hospital's reported costs exaggerate its utilization relative to other hospitals. In this study, we found that a significant proportion of hospitals (20%) had reported costs that exceeded standardized costs by more than 25%. These hospitals have higher infrastructure, labor, or acquisition costs relative to their peers. To the extent that these hospitals might wish to lower the cost of care at their institution, they could focus on renegotiating purchasing or labor contracts, identifying areas where they may be overstaffed, or holding off on future infrastructure investments (Table 3).[14] In contrast, 17% of hospitals had reported costs that were 25% less than standardized costs. High‐cost hospitals in this group are therefore providing more treatments and testing to patients relative to their peers and could focus cost‐control efforts on reducing unnecessary utilization and duplicative testing.[20] Our examination of the hospital with high reported costs and very high utilization revealed a high percentage of supplies and other items, which is a category used primarily for nursing expenditures (Figure 3). Because the use of nursing services is directly related to days spent in the hospital, this hospital may wish to more closely examine specific strategies for reducing length of stay.
| High Reported Costs/High Standardized Costs | High Reported Costs/Low Standardized Costs | Low Reported Costs/High Standardized Costs | Low Reported Costs/Low Standardized Costs | |
|---|---|---|---|---|
| Utilization | High | Low | High | Low |
| Severity of illness | Likely to be higher | Likely to be lower | Likely to be higher | Likely to be lower |
| Practice style | Likely to be more intense | Likely to be less intense | Likely to be more intense | Likely to be less intense |
| Fixed costs | High or average | High | Low | Low |
| Infrastructure costs | Likely to be higher | Likely to be higher | Likely to be lower | Likely to be lower |
| Labor costs | Likely to be higher | Likely to be higher | Likely to be lower | Likely to be lower |
| Reported‐to‐standardized cost ratio | Close to 1 | >1 | <1 | Close to 1 |
| Causes of high costs | High utilization, high fixed costs, or both | High acquisition costs, high labor costs, or expensive infrastructure | High utilization | |
| Interventions to reduce costs | Work with clinicians to alter practice style, consider renegotiating cost of acquisitions, hold off on new infrastructure investments | Consider renegotiating cost of acquisitions, hold off on new infrastructure investments, consider reducing size of labor force | Work with clinicians to alter practice style | |
| Usefulness of reported‐ to‐standardized cost ratio | Less useful | More useful | More useful | Less useful |
We did not find a consistent association between the reported to standardized cost ratio and hospital characteristics. This is an important finding that contradicts prior work examining associations between hospital characteristics and costs for heart failure patients,[21] further indicating the complexity of the relationship between fixed costs and variable costs and the difficulty in adjusting reported costs to calculate utilization. For example, small hospitals may have higher acquisition costs and more supply chain difficulties, but they may also have less technology, lower overhead costs, and fewer specialists to order tests and procedures. Hospital characteristics, such as urban location and teaching status, are commonly used as adjustors in cost studies because hospitals in urban areas with teaching missions (which often provide care to low‐income populations) are assumed to have higher fixed costs,[3, 4, 5, 6] but the lack of a consistent relationship between these characteristics and the standardized cost ratio may indicate that using these factors as adjustors for cost may not be effective and could even obscure differences in utilization between hospitals. Notably, we did find an association between hospital region and the reported to standardized cost ratio, but we hesitate to draw conclusions from this finding because the Premier database is imbalanced in terms of regional representation, with fewer hospitals in the Midwest and West and the bulk of the hospitals in the South.
Although standardized costs have great potential, this method has limitations as well. Standardized costs can only be applied when detailed billing data with item‐level costs are available. This is because calculation of standardized costs requires taking the median of item costs and applying the median cost across the database, maintaining the integrity of the relative cost of items to one another. The relative cost of items is preserved (ie, magnetic resonance imaging still costs more than an aspirin), which maintains the general scheme of RVU‐based costs while removing the noise of varying RVU‐based costs across hospitals.[7] Application of an arbitrary item cost would result in the loss of this relative cost difference. Because item costs are not available in traditional administrative datasets, these datasets would not be amenable to this method. However, highly detailed billing data are now being shared by hundreds of hospitals in the Premier network and the University Health System Consortium. These data are widely available to investigators, meaning that the generalizability of this method will only improve over time. It was also a limitation of the study that we chose a limited basket of items common to patients with heart failure to describe the range of reported costs and to provide a standardized snapshot by which to compare hospitals. Because we only included a few items, we may have overestimated or underestimated the range of reported costs for such a basket.
Standardized costs are a novel method for comparing utilization across hospitals. Used properly, they will help identify high‐ and low‐intensity providers of hospital care.
- Health care costs–a primer. Kaiser Family Foundation Web site. Available at: http://www.kff.org/insurance/7670.cfm. Accessed July 20, 2012.
- . Explaining high health care spending in the United States: an international comparison of supply, utilization, prices, and quality. The Commonwealth Fund. 2012. Available at: http://www.commonwealthfund.org/Publications/Issue‐Briefs/2012/May/High‐Health‐Care‐Spending. aspx. Accessed on July 20, 2012.
- , , , , , . The relationship between hospital spending and mortality in patients with sepsis. Arch Intern Med. 2011;171(4):292–299.
- , , , . The elusive connection between health care spending and quality. Health Aff (Millwood). 2009;28(1):w119–w123.
- , , , . Hospital quality and intensity of spending: is there an association? Health Aff (Millwood). 2009;28(4):w566–w572.
- , , , , . Measuring efficiency: the association of hospital costs and quality of care. Health Aff (Millwood). 2009;28(3):897–906.
- , . Assigning resources to health care use for health services research: options and consequences. Med Care. 2009;47(7 suppl 1):S70–S75.
- , , , , . Health care costing: data, methods, current applications. Med Care. 2009;47(7 suppl 1):S1–S6.
- . Determination of VA health care costs. Med Care Res Rev. 2003;60(3 suppl):124S–141S.
- . An improved set of standards for finding cost for cost‐effectiveness analysis. Med Care. 2009;47(7 suppl 1):S82–S88.
- , , , et al. Comparison of approaches for estimating prevalence costs of care for cancer patients: what is the impact of data source? Med Care. 2009;47(7 suppl 1):S64–S69.
- . Principles involved in costing. Med J Aust. 1990;153Suppl:S10–S12.
- . Spending more through “cost control:” our obsessive quest to gut the hospital. Health Aff (Millwood). 1996;15(2):145–154.
- , , , et al. Distribution of variable vs. fixed costs of hospital care. JAMA. 1999;281(7):644–649.
- . Administrative and claims records as sources of health care cost data. Med Care. 2009;47(7 suppl 1):S51–S55.
- , , , , , . Perioperative beta‐blocker therapy and mortality after major noncardiac surgery. N Engl J Med. 2005;353(4):349–361.
- , , , et al. Public reporting and pay for performance in hospital quality improvement. N Engl J Med. 2007;356(5):486–496.
- , , , et al. Procedure intensity and the cost of care. Circ Cardiovasc Qual Outcomes. 2012;5(3):308–313.
- , , . A comparative study of tests for homogeneity of variances, with applications to the outer continental shelf bidding data. Technometrics. 1981;23:351–361.
- , , . Beyond the efficiency index: finding a better way to reduce overuse and increase efficiency in physician care. Health Aff (Millwood). 2008;27(4):w250–w259.
- , , . The association between hospital volume and processes, outcomes, and costs of care for congestive heart failure. Ann Intern Med. 2011;154(2):94–102.
Healthcare spending exceeded $2.5 trillion in 2007, and payments to hospitals represented the largest portion of this spending (more than 30%), equaling the combined cost of physician services and prescription drugs.[1, 2] Researchers and policymakers have emphasized the need to improve the value of hospital care in the United States, but this has been challenging, in part because of the difficulty in identifying hospitals that have high resource utilization relative to their peers.[3, 4, 5, 6, 7, 8, 9, 10, 11]
Most hospitals calculate their costs using internal accounting systems that determine resource utilization via relative value units (RVUs).[7, 8] RVU‐derived costs, also known as hospital reported costs, have proven to be an excellent method for quantifying what it costs a given hospital to provide a treatment, test, or procedure. However, RVU‐based costs are less useful for comparing resource utilization across hospitals because the cost to provide a treatment or service varies widely across hospitals. The cost of an item calculated using RVUs includes not just the item itself, but also a portion of the fixed costs of the hospital (overhead, labor, and infrastructure investments such as electronic records, new buildings, or expensive radiological or surgical equipment).[12] These costs vary by institution, patient population, region of the country, teaching status, and many other variables, making it difficult to identify resource utilization across hospitals.[13, 14]
Recently, a few claims‐based multi‐institutional datasets have begun incorporating item‐level RVU‐based costs derived directly from the cost accounting systems of participating institutions.[15] Such datasets allow researchers to compare reported costs of care from hospital to hospital, but because of the limitations we described above, they still cannot be used to answer the question: Which hospitals with higher costs of care are actually providing more treatments and services to patients?
To better facilitate the comparison of resource utilization patterns across hospitals, we standardized the unit costs of all treatments and services across hospitals by applying a single cost to every item across hospitals. This standardized cost allowed to compare utilization of that item (and the 15,000 other items in the database) across hospitals. We then compared estimates of resource utilization as measured by the 2 approaches: standardized and RVU‐based costs.
METHODS
Ethics Statement
All data were deidentified, by Premier, Inc., at both the hospital and patient level in accordance with the Health Insurance Portability and Accountability Act. The Yale University Human Investigation Committee reviewed the protocol for this study and determined that it is not considered to be human subjects research as defined by the Office of Human Research Protections.
Data Source
We conducted a cross‐sectional study using data from hospitals that participated in the database maintained by Premier Healthcare Informatics (Charlotte, NC) in the years 2009 to 2010. The Premier database is a voluntary, fee‐supported database created to measure quality and healthcare utilization.[3, 16, 17, 18] In 2010, it included detailed billing data from 500 hospitals in the United States, with more than 130 million cumulative hospital discharges. The detailed billing data includes all elements found in hospital claims derived from the uniform billing‐04 form, as well as an itemized, date‐stamped log of all items and services charged to the patient or insurer, such as medications, laboratory tests, and diagnostic and therapeutic services. The database includes approximately 15% of all US hospitalizations. Participating hospitals are similar to the composition of acute care hospitals nationwide. They represent all regions of the United States, and represent predominantly small‐ to mid‐sized nonteaching facilities that serve a largely urban population. The database also contains hospital reported costs at the item level as well as the total cost of the hospitalization. Approximately 75% of hospitals that participate submit RVU‐based costs taken from internal cost accounting systems. Because of our focus on comparing standardized costs to reported costs, we included only data from hospitals that use RVU‐based costs in this study.
Study Subjects
We included adult patients with a hospitalization recorded in the Premier database between January 1, 2009 and December 31, 2010, and a principal discharge diagnosis of heart failure (HF) (International Classification of Diseases, Ninth Revision, Clinical Modification codes: 402.01, 402.11, 402.91, 404.01, 404.03, 404.11, 404.13, 404.91, 404.93, 428.xx). We excluded transfers, patients assigned a pediatrician as the attending of record, and those who received a heart transplant or ventricular assist device during their stay. Because cost data are prone to extreme outliers, we excluded hospitalizations that were in the top 0.1% of length of stay, number of billing records, quantity of items billed, or total standardized cost. We also excluded hospitals that admitted fewer than 25 HF patients during the study period to reduce the possibility that a single high‐cost patient affected the hospital's cost profile.
Hospital Information
For each hospital included in the study, we recorded number of beds, teaching status, geographic region, and whether it served an urban or rural population.
Assignment of Standardized Costs
We defined reported cost as the RVU‐based cost per item in the database. We then calculated the median across hospitals for each item in the database and set this as the standardized unit cost of that item at every hospital (Figure 1). Once standardized costs were assigned at the item level, we summed the costs of all items assigned to each patient and calculated the standardized cost of a hospitalization per patient at each hospital.
Examination of Cost Variation
We compared the standardized and reported costs of hospitalizations using medians, interquartile ranges, and interquartile ratios (Q75/Q25). To examine whether standardized costs can reduce the noise due to differences in overhead and other fixed costs, we calculated, for each hospital, the coefficients of variation (CV) for per‐day reported and standardized costs and per‐hospitalization reported and standardized costs. We used the Fligner‐Killeen test to determine whether the variance of CVs was different for reported and standardized costs.[19]
Creation of Basket of Goods
Because there can be differences in the costs of items, the number and types of items administered during hospitalizations, 2 hospitals with similar reported costs for a hospitalization might deliver different quantities and combinations of treatments (Figure 1). We wished to demonstrate that there is variation in reported costs of items when the quantity and type of item is held constant, so we created a basket of items. We chose items that are commonly administered to patients with heart failure, but could have chosen any combination of items. The basket included a day of medical room and board, a day of intensive care unit (ICU) room and board, a single dose of ‐blocker, a single dose of angiotensin‐converting enzyme inhibitor, complete blood count, a B‐natriuretic peptide level, a chest radiograph, a chest computed tomography, and an echocardiogram. We then examined the range of hospitals' reported costs for this basket of goods using percentiles, medians, and interquartile ranges.
Reported to Standardized Cost Ratio
Next, we calculated standardized costs of hospitalizations for included hospitals and examined the relationship between hospitals' mean reported costs and mean standardized costs. This ratio could help diagnose the mechanism of high reported costs for a hospital, because high reported costs with low utilization would indicate high fixed costs, while high reported costs with high utilization would indicate greater use of tests and treatments. We assigned hospitals to strata based on reported costs greater than standardized costs by more than 25%, reported costs within 25% of standardized costs, and reported costs less than standardized costs by more than 25%. We examined the association between hospital characteristics and strata using a 2 test. All analyses were carried out using SAS version 9.3 (SAS Institute Inc., Cary, NC).
RESULTS
The 234 hospitals included in the analysis contributed a total of 165,647 hospitalizations, with the number of hospitalizations ranging from 33 to 2,772 hospitalizations per hospital (see Supporting Table 1 in the online version of this article). Most were located in urban areas (84%), and many were in the southern United States (42%). The median hospital reported cost per hospitalization was $6,535, with an interquartile range of $5,541 to $7,454. The median standardized cost per hospitalization was $6,602, with a range of $5,866 to $7,386. The interquartile ratio (Q75/Q25) of the reported costs of a hospitalization was 1.35. After costs were standardized, the interquartile ratio fell to 1.26, indicating that variation decreased. We found that the median hospital reported cost per day was $1,651, with an IQR of $1,400 to $1,933 (ratio 1.38), whereas the median standardized cost per day was $1,640, with an IQR of $1,511 to $1,812 (ratio 1.20).
There were more than 15,000 items (eg, treatments, tests, and supplies) that received a standardized charge code in our cohort. These were divided into 11 summary departments and 40 standard departments (see Supporting Table 2 in the online version of this article). We observed a high level of variation in the reported costs of individual items: the reported costs of a day of room and board in an ICU ranged from $773 at hospitals at the 10th percentile to $2,471 at the 90th percentile (Table 1.). The standardized cost of a day of ICU room and board was $1,577. We also observed variation in the reported costs of items across item categories. Although a day of medical room and board showed a 3‐fold difference between the 10th and 90th percentile, we observed a more than 10‐fold difference in the reported cost of an echocardiogram, from $31 at the 10th percentile to $356 at the 90th percentile. After examining the hospital‐level cost for a basket of goods, we found variation in the reported costs for these items across hospitals, with a 10th percentile cost of $1,552 and a 90th percentile cost of $3,967.
| Reported Costs | 10th Percentile | 25th Percentile | 75th Percentile | 90th Percentile | Median (Standardized Cost) |
|---|---|---|---|---|---|
| |||||
| Item | |||||
| Day of medical | 490.03 | 586.41 | 889.95 | 1121.20 | 722.59 |
| Day of ICU | 773.01 | 1275.84 | 1994.81 | 2471.75 | 1577.93 |
| Complete blood count | 6.87 | 9.34 | 18.34 | 23.46 | 13.07 |
| B‐natriuretic peptide | 12.13 | 19.22 | 44.19 | 60.56 | 28.23 |
| Metoprolol | 0.20 | 0.68 | 2.67 | 3.74 | 1.66 |
| Lisinopril | 0.28 | 1.02 | 2.79 | 4.06 | 1.72 |
| Spironolactone | 0.22 | 0.53 | 2.68 | 3.83 | 1.63 |
| Furosemide | 1.27 | 2.45 | 5.73 | 8.12 | 3.82 |
| Chest x‐ray | 43.88 | 51.54 | 89.96 | 117.16 | 67.45 |
| Echocardiogram | 31.53 | 98.63 | 244.63 | 356.50 | 159.07 |
| Chest CT (w & w/o contrast) | 65.17 | 83.99 | 157.23 | 239.27 | 110.76 |
| Noninvasive positive pressure ventilation | 126.23 | 127.25 | 370.44 | 514.67 | 177.24 |
| Electrocardiogram | 12.08 | 18.77 | 42.74 | 64.94 | 29.78 |
| Total basket | 1552.50 | 2157.85 | 3417.34 | 3967.78 | 2710.49 |
We found that 46 (20%) hospitals had reported costs of hospitalizations that were 25% greater than standardized costs (Figure 2). This group of hospitals had overestimated reported costs of utilization; 146 (62%) had reported costs within 25% of standardized costs, and 42 (17%) had reported costs that were 25% less than standardized costs (indicating that reported costs underestimated utilization). We examined the relationship between hospital characteristics and strata and found no significant association between the reported to standardized cost ratio and number of beds, teaching status, or urban location (Table 2). Hospitals in the Midwest and South were more likely to have a lower reported cost of hospitalizations, whereas hospitals in the West were more likely to have higher reported costs (P<0.001). When using the CV to compare reported costs to standardized costs, we found that per‐day standardized costs showed reduced variance (P=0.0238), but there was no significant difference in variance of the reported and standardized costs when examining the entire hospitalization (P=0.1423). At the level of the hospitalization, the Spearman correlation coefficient between reported and standardized cost was 0.89.
| Reported Greater Than Standardized by >25%, n (%) | Reported Within 25% (2‐tailed) of Standardized, n (%) | Reported Less Than Standardized by >25%, n (%) | P for 2 Test | |
|---|---|---|---|---|
| Total | 46 (19.7) | 146 (62.4) | 42 (17.0) | |
| No. of beds | 0.2313 | |||
| <200 | 19 (41.3) | 40 (27.4) | 12 (28.6) | |
| 200400 | 14 (30.4) | 67 (45.9) | 15 (35.7) | |
| >400 | 13 (28.3) | 39 (26.7) | 15 (35.7) | |
| Teaching | 0.8278 | |||
| Yes | 13 (28.3) | 45 (30.8) | 11 (26.2) | |
| No | 33 (71.7) | 101 (69.2) | 31 (73.8) | |
| Region | <0.0001 | |||
| Midwest | 7 (15.2) | 43 (29.5) | 19 (45.2) | |
| Northeast | 6 (13.0) | 18 (12.3) | 3 (7.1) | |
| South | 14 (30.4) | 64 (43.8) | 20 (47.6) | |
| West | 19 (41.3) | 21 (14.4) | 0 (0) | |
| Urban vs rural | 36 (78.3) | 128 (87.7) | 33 (78.6) | 0.1703 |
To better understand how hospitals can achieve high reported costs through different mechanisms, we more closely examined 3 hospitals with similar reported costs (Figure 3). These hospitals represented low, average, and high utilization according to their standardized costs, but had similar average per‐hospitalization reported costs: $11,643, $11,787, and $11,892, respectively. The corresponding standardized costs were $8,757, $11,169, and $15,978. The hospital with high utilization ($15,978 in standardized costs) was accounted for by increased use of supplies and other services. In contrast, the low‐ and average‐utilization hospitals had proportionally lower standardized costs across categories, with the greatest percentage of spending going toward room and board (includes nursing).
DISCUSSION
In a large national sample of hospitals, we observed variation in the reported costs for a uniform basket of goods, with a more than 2‐fold difference in cost between the 10th and 90th percentile hospitals. These findings suggest that reported costs have limited ability to reliably describe differences in utilization across hospitals. In contrast, when we applied standardized costs, the variance of per‐day costs decreased significantly, and the interquartile ratio of per‐day and hospitalization costs decreased as well, suggesting less variation in utilization across hospitals than would have been inferred from a comparison of reported costs. Applying a single, standard cost to all items can facilitate comparisons of utilization between hospitals (Figure 1). Standardized costs will give hospitals the potential to compare their utilization to their competitors and will facilitate research that examines the comparative effectiveness of high and low utilization in the management of medical and surgical conditions.
The reported to standardized cost ratio is another useful tool. It indicates whether the hospital's reported costs exaggerate its utilization relative to other hospitals. In this study, we found that a significant proportion of hospitals (20%) had reported costs that exceeded standardized costs by more than 25%. These hospitals have higher infrastructure, labor, or acquisition costs relative to their peers. To the extent that these hospitals might wish to lower the cost of care at their institution, they could focus on renegotiating purchasing or labor contracts, identifying areas where they may be overstaffed, or holding off on future infrastructure investments (Table 3).[14] In contrast, 17% of hospitals had reported costs that were 25% less than standardized costs. High‐cost hospitals in this group are therefore providing more treatments and testing to patients relative to their peers and could focus cost‐control efforts on reducing unnecessary utilization and duplicative testing.[20] Our examination of the hospital with high reported costs and very high utilization revealed a high percentage of supplies and other items, which is a category used primarily for nursing expenditures (Figure 3). Because the use of nursing services is directly related to days spent in the hospital, this hospital may wish to more closely examine specific strategies for reducing length of stay.
| High Reported Costs/High Standardized Costs | High Reported Costs/Low Standardized Costs | Low Reported Costs/High Standardized Costs | Low Reported Costs/Low Standardized Costs | |
|---|---|---|---|---|
| Utilization | High | Low | High | Low |
| Severity of illness | Likely to be higher | Likely to be lower | Likely to be higher | Likely to be lower |
| Practice style | Likely to be more intense | Likely to be less intense | Likely to be more intense | Likely to be less intense |
| Fixed costs | High or average | High | Low | Low |
| Infrastructure costs | Likely to be higher | Likely to be higher | Likely to be lower | Likely to be lower |
| Labor costs | Likely to be higher | Likely to be higher | Likely to be lower | Likely to be lower |
| Reported‐to‐standardized cost ratio | Close to 1 | >1 | <1 | Close to 1 |
| Causes of high costs | High utilization, high fixed costs, or both | High acquisition costs, high labor costs, or expensive infrastructure | High utilization | |
| Interventions to reduce costs | Work with clinicians to alter practice style, consider renegotiating cost of acquisitions, hold off on new infrastructure investments | Consider renegotiating cost of acquisitions, hold off on new infrastructure investments, consider reducing size of labor force | Work with clinicians to alter practice style | |
| Usefulness of reported‐ to‐standardized cost ratio | Less useful | More useful | More useful | Less useful |
We did not find a consistent association between the reported to standardized cost ratio and hospital characteristics. This is an important finding that contradicts prior work examining associations between hospital characteristics and costs for heart failure patients,[21] further indicating the complexity of the relationship between fixed costs and variable costs and the difficulty in adjusting reported costs to calculate utilization. For example, small hospitals may have higher acquisition costs and more supply chain difficulties, but they may also have less technology, lower overhead costs, and fewer specialists to order tests and procedures. Hospital characteristics, such as urban location and teaching status, are commonly used as adjustors in cost studies because hospitals in urban areas with teaching missions (which often provide care to low‐income populations) are assumed to have higher fixed costs,[3, 4, 5, 6] but the lack of a consistent relationship between these characteristics and the standardized cost ratio may indicate that using these factors as adjustors for cost may not be effective and could even obscure differences in utilization between hospitals. Notably, we did find an association between hospital region and the reported to standardized cost ratio, but we hesitate to draw conclusions from this finding because the Premier database is imbalanced in terms of regional representation, with fewer hospitals in the Midwest and West and the bulk of the hospitals in the South.
Although standardized costs have great potential, this method has limitations as well. Standardized costs can only be applied when detailed billing data with item‐level costs are available. This is because calculation of standardized costs requires taking the median of item costs and applying the median cost across the database, maintaining the integrity of the relative cost of items to one another. The relative cost of items is preserved (ie, magnetic resonance imaging still costs more than an aspirin), which maintains the general scheme of RVU‐based costs while removing the noise of varying RVU‐based costs across hospitals.[7] Application of an arbitrary item cost would result in the loss of this relative cost difference. Because item costs are not available in traditional administrative datasets, these datasets would not be amenable to this method. However, highly detailed billing data are now being shared by hundreds of hospitals in the Premier network and the University Health System Consortium. These data are widely available to investigators, meaning that the generalizability of this method will only improve over time. It was also a limitation of the study that we chose a limited basket of items common to patients with heart failure to describe the range of reported costs and to provide a standardized snapshot by which to compare hospitals. Because we only included a few items, we may have overestimated or underestimated the range of reported costs for such a basket.
Standardized costs are a novel method for comparing utilization across hospitals. Used properly, they will help identify high‐ and low‐intensity providers of hospital care.
- Health care costs–a primer. Kaiser Family Foundation Web site. Available at: http://www.kff.org/insurance/7670.cfm. Accessed July 20, 2012.
- . Explaining high health care spending in the United States: an international comparison of supply, utilization, prices, and quality. The Commonwealth Fund. 2012. Available at: http://www.commonwealthfund.org/Publications/Issue‐Briefs/2012/May/High‐Health‐Care‐Spending. aspx. Accessed on July 20, 2012.
- , , , , , . The relationship between hospital spending and mortality in patients with sepsis. Arch Intern Med. 2011;171(4):292–299.
- , , , . The elusive connection between health care spending and quality. Health Aff (Millwood). 2009;28(1):w119–w123.
- , , , . Hospital quality and intensity of spending: is there an association? Health Aff (Millwood). 2009;28(4):w566–w572.
- , , , , . Measuring efficiency: the association of hospital costs and quality of care. Health Aff (Millwood). 2009;28(3):897–906.
- , . Assigning resources to health care use for health services research: options and consequences. Med Care. 2009;47(7 suppl 1):S70–S75.
- , , , , . Health care costing: data, methods, current applications. Med Care. 2009;47(7 suppl 1):S1–S6.
- . Determination of VA health care costs. Med Care Res Rev. 2003;60(3 suppl):124S–141S.
- . An improved set of standards for finding cost for cost‐effectiveness analysis. Med Care. 2009;47(7 suppl 1):S82–S88.
- , , , et al. Comparison of approaches for estimating prevalence costs of care for cancer patients: what is the impact of data source? Med Care. 2009;47(7 suppl 1):S64–S69.
- . Principles involved in costing. Med J Aust. 1990;153Suppl:S10–S12.
- . Spending more through “cost control:” our obsessive quest to gut the hospital. Health Aff (Millwood). 1996;15(2):145–154.
- , , , et al. Distribution of variable vs. fixed costs of hospital care. JAMA. 1999;281(7):644–649.
- . Administrative and claims records as sources of health care cost data. Med Care. 2009;47(7 suppl 1):S51–S55.
- , , , , , . Perioperative beta‐blocker therapy and mortality after major noncardiac surgery. N Engl J Med. 2005;353(4):349–361.
- , , , et al. Public reporting and pay for performance in hospital quality improvement. N Engl J Med. 2007;356(5):486–496.
- , , , et al. Procedure intensity and the cost of care. Circ Cardiovasc Qual Outcomes. 2012;5(3):308–313.
- , , . A comparative study of tests for homogeneity of variances, with applications to the outer continental shelf bidding data. Technometrics. 1981;23:351–361.
- , , . Beyond the efficiency index: finding a better way to reduce overuse and increase efficiency in physician care. Health Aff (Millwood). 2008;27(4):w250–w259.
- , , . The association between hospital volume and processes, outcomes, and costs of care for congestive heart failure. Ann Intern Med. 2011;154(2):94–102.
© 2013 Society of Hospital Medicine
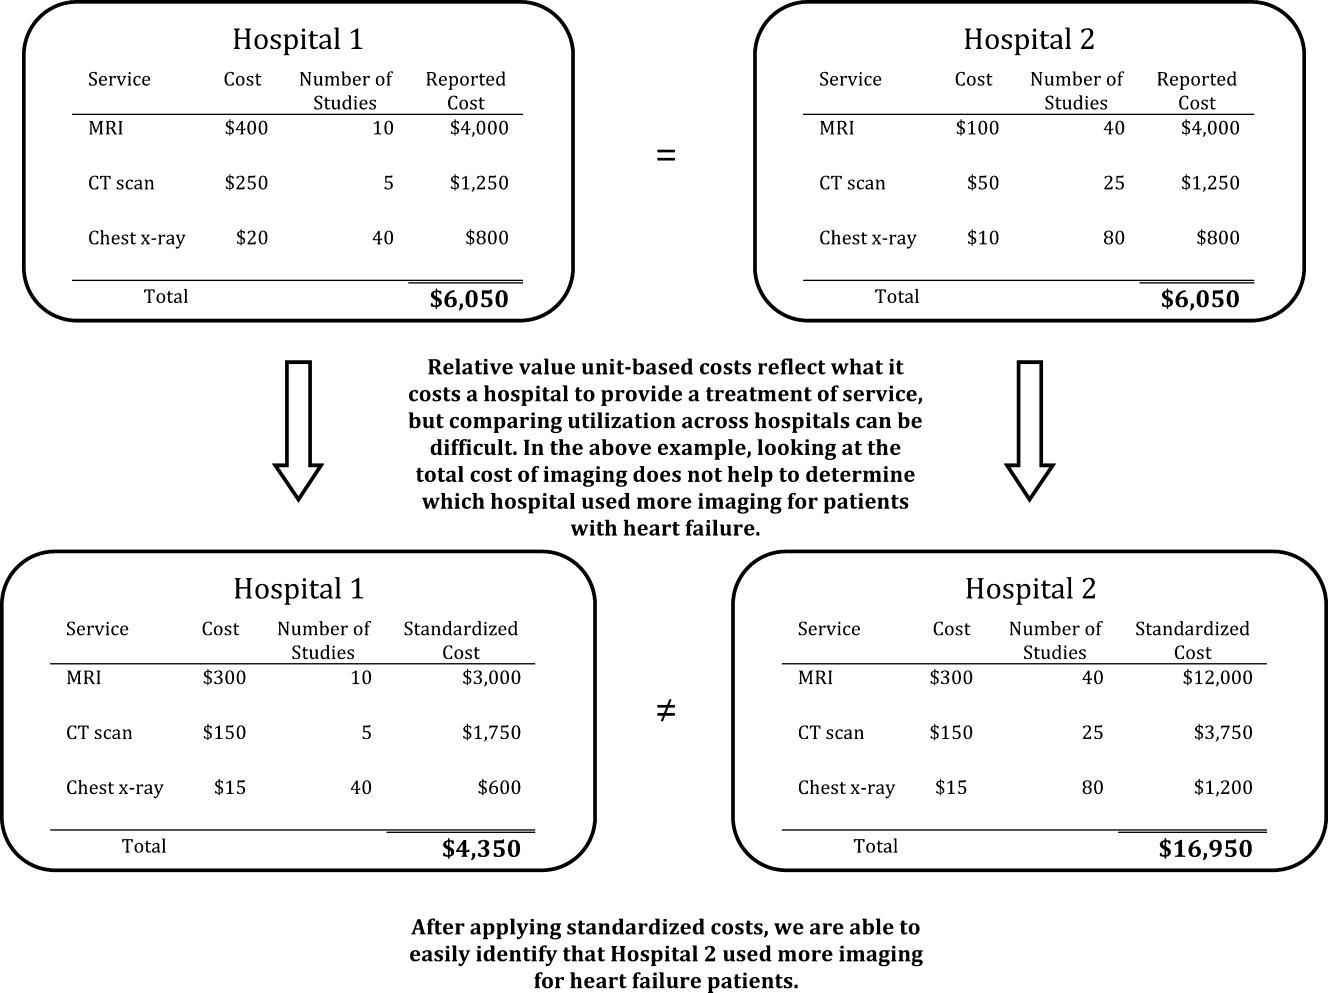
Acute Respiratory Failure Epidemiology
Acute respiratory failure (ARF), a common and serious complication in hospitalized patients, may be caused by several conditions including pneumonia, chronic obstructive pulmonary disease (COPD), adult respiratory distress syndrome (ARDS), and congestive heart failure (CHF). Although ARF is conventionally defined by an arterial oxygen tension of <60 mm Hg, an arterial carbon dioxide tension of >45 mm Hg, or both, these thresholds serve as a guide to be used in combination with history and clinical assessment of the patient.[1, 2] Supplemental oxygen and treatment of the underlying cause is the mainstay of therapy for ARF, but in severe cases patients are treated with invasive mechanical ventilation (IMV) or noninvasive ventilation (NIV). ARF is the most frequent reason for admission to the intensive care unit (ICU)[3, 4] and has an in‐hospital mortality rate of 33% to 37% among those who require IMV.[5, 6] The majority of epidemiologic studies of ARF have been limited to patients requiring mechanical ventilation or those admitted to the ICU, and information about the characteristics and outcomes of patients across the full spectrum of severity is much more limited.[5, 7, 8, 9, 10, 11] General improvements in the management of underlying conditions, implementation of more effective ventilation strategies,[12, 13] and increasing use of NIV[14, 15] may have led to better outcomes for patients with ARF, yet empirical evidence of a change in the adjusted mortality rate over time is lacking.
The objective of this study was to provide a broad characterization of the epidemiology of ARF among adults hospitalized in the United States using a large nationally representative database. We sought to evaluate whether incidence, mortality, cost, or ventilation practice associated with ARF in the United States changed over the period of 2001 to 2009.
METHODS
Data Source
We utilized data from the Nationwide Inpatient Sample (NIS) of the Health Care Cost and Utilization Project,[16] which is a 20% stratified probability sample of all US acute‐care hospitals each year. These data are drawn from a sampling frame that contains close to 95% of all discharges in the United States, with the hospital discharge record as the unit of analysis. The NIS has been used to study trends in many different diagnoses.[17, 18, 19] The database contains demographic information, payer information, principal and secondary diagnoses, cost, discharge disposition, and death during hospitalization. It also contains information on hospital characteristics including ownership, size, teaching status, and geographic region.
Definitions
We included patients 18 years old discharged between 2001 and 2009 with a primary or secondary diagnosis of ARF. We identified cases of ARF using diagnostic codes (International Classification of Diseases, Ninth Revision, Clinical Modification [ICD‐9‐CM]) previously used in studies of acute organ dysfunction in sepsis (518.81, 518.82, 518.84, 518.4, 799.1, 786.09).[17, 20, 21] To define ARDS we relied on ICD‐9‐CM codes (518.4, 518.82, 518.5, 786.09) used in prior studies that showed good sensitivity and specificity.[22, 23] The use of ventilatory support was identified using the ICD‐9‐CM procedure codes[24] (93.90, 93.70, 93.71, 93.76). Comorbidities were classified using the Agency for Healthcare Research and Quality's (Rockville, MD) Healthcare Cost and Utilization Project's (HCUP) Comorbidity Software version 3.103.5.[25]
Outcomes
The primary outcomes included the annual number of hospitalizations, population incidence, hospital mortality, and costs of care. Secondary outcomes included length of stay, most common diagnoses associated with ARF, disposition at discharge, and use and type of ventilatory support.
Analysis
We estimated the number of hospitalizations with a diagnosis of ARF/year, and we calculated the weighted frequencies following HCUP‐NIS recommendations using SAS/STAT survey procedures. Using population estimates for the years 2001 to 2009 from the US Census Bureau, we employed direct standardization to calculate age‐, gender‐, and race‐adjusted population incidence and mortality rates of ARF per 100,000 population. Hospital mortality was defined as the ratio of ARF hospitalizations ending in death divided by total number of ARF hospitalizations. Mechanical ventilation rates and rates of selected comorbidities were similarly defined.
We employed indirect standardization to adjust hospital mortality rates for age, sex, race/ethnicity, comorbidities, and hospital characteristics using logistic regression models from 2001 to predict hospital mortality for 2002 to 2009. We used linear regression models to test whether the slope of year was significant for trends in outcomes overtime. Costs were calculated using hospital‐specific cost‐to‐charge ratios when available and a weighted group average at the state level for remaining hospitals. We converted all costs to 2009 US dollars using the Consumer Price Index. Costs and lengths of stay were not normally distributed, so we calculated weighted geometric means (the average of all logarithmic values), then converted back to a base‐10 number. Using a Taylor series expansion, we then calculated standard errors. All analyses were performed using SAS version 9.2 (SAS Institute, Inc., Cary, NC).
The Baystate Medical Center institutional review board determined that the project did not constitute human subjects research.
RESULTS
Hospitalization Trends
The number of hospitalizations with an ARF diagnosis code increased at an average annual rate of 11.3% from 1,007,549 (standard deviation [SD] = 19,268) in 2001 to 1,917,910 (SD = 47,558) in 2009. More than two‐thirds of ARF admissions were associated with medical, rather than surgical, conditions (69.5% in 2001 and 71.2% in 2009). The median age, racial make‐up, and gender did not change significantly. Over the study period we observed an increase in ARF‐related hospitalizations in large, urban, teaching hospitals and in hospitals located in the Midwest (Table 1).
| 2001 | 2003 | 2005 | 2007 | 2009 | |
|---|---|---|---|---|---|
| |||||
| Patient characteristics | |||||
| All, N (SD) | 1,007,549 (19,268) | 1,184,928 (25,542) | 1,288,594 (30,493) | 1,480,270 (32,002) | 1,917,910 (47,558) |
| Age, mean (SE), y | 66.6 (0.2) | 66.0 (0.2) | 66.1 (0.2) | 65.8 (0.2) | 65.8 (0.2) |
| Age group, % | |||||
| 1844 | 11.5 | 12.0 | 11.5 | 11.6 | 10.9 |
| 4564* | 26.7 | 28.9 | 29.6 | 30.7 | 31.7 |
| 6584* | 50.2 | 47.8 | 47.0 | 45.7 | 45.3 |
| 85+ | 11.5 | 11.4 | 11.9 | 12.0 | 12.1 |
| Male* | 48.1 | 48.2 | 48.6 | 49.3 | 49.2 |
| Race | |||||
| White | 75.8 | 71.9 | 76.5 | 71.8 | 73.4 |
| Black | 12.7 | 13.6 | 11.2 | 14.2 | 12.5 |
| Hispanic | 7.2 | 9.8 | 7.7 | 8.5 | 7.8 |
| Other | 4.2 | 4.7 | 4.7 | 5.5 | 6.3 |
| Primary ARF | 20.7 | 20.9 | 25.9 | 26.1 | 19.9 |
| Secondary ARF | 79.3 | 79.1 | 74.1 | 73.9 | 80.1 |
| Medical* | 69.5 | 69.1 | 69.9 | 70.2 | 71.2 |
| Surgical* | 30.5 | 30.8 | 30.1 | 29.8 | 28.8 |
| Hospital characteristics, % | |||||
| Number of beds | |||||
| Small | 10.0 | 10.1 | 10.5 | 10.8 | 11.3 |
| Medium | 25.2 | 25.3 | 24.6 | 24.0 | 22.7 |
| Large | 64.7 | 64.6 | 64.9 | 65.2 | 66.0 |
| Region | |||||
| South* | 18.5 | 18.5 | 17.6 | 17.0 | 16.3 |
| Midwest | 21.4 | 22.0 | 23.6 | 23.2 | 23.5 |
| Northeast | 42.6 | 41.7 | 41.4 | 42.2 | 42.1 |
| West* | 17.5 | 17.8 | 17.3 | 17.6 | 18.1 |
| Hospital type | |||||
| Rural | 13.6 | 13.0 | 11.8 | 11.0 | 10.8 |
| Urban nonteaching | 45.5 | 44.5 | 50.1 | 45.3 | 45.7 |
| Urban teaching | 40.9 | 42.5 | 38.1 | 43.7 | 43.6 |
| Patient outcomes | |||||
| Ventilation strategy | |||||
| IMV* | 48.5 | 48.4 | 47.5 | 46.5 | 42.1 |
| NIV* | 3.8 | 5.3 | 6.9 | 9.4 | 10.1 |
| IMV or NIV | 50.9 | 51.7 | 52.1 | 52.9 | 49.7 |
| Disposition | |||||
| Home/home healthcare* | 42.1 | 43.8 | 42.8 | 43.4 | 45.7 |
| Transfer to acute care | 5.2 | 4.7 | 4.6 | 4.6 | 4.4 |
| Nursing facility* | 24.4 | 24.9 | 27.4 | 28.6 | 29.0 |
| Other | 0.7 | 0.8 | 0.9 | 0.9 | 1.0 |
| Adjusted mortality, % (SE)* | 27.6 (0.3) | 26.4 (0.4) | 24.9 (0.4) | 22.7 (0.4) | 20.6 (0.3) |
| Adjusted mean, LOS/case, d (SE)* | 7.8 (0.1) | 7.9 (0.1) | 7.7 (0.1) | 7.5 (0.1) | 7.1 (0.1) |
| Adjusted mean cost/case, 2009 US$, (SE) | 15,818 (251) | 16,981 (419) | 17,236 (411) | 16,941 (436) | 15,987 (402) |
After adjusting for age and sex, the population incidence of ARF increased from 502 (standard error [SE] = 10) cases per 100,000 in 2001 to 784 (SE = 19) cases per 100,000 in 2009 (a 56% increase, P < 0.0001). Hispanics had the lowest rates of ARF, with both black and white groups having similar rates (Table 2).
| 2001 | 2003 | 2005 | 2007 | 2009 | |
|---|---|---|---|---|---|
| |||||
| All* | 502 (10) | 569 (12) | 595 (14) | 627 (14) | 784 (19) |
| Age group | |||||
| 1844* | 107 (3) | 130 (4) | 137 (4) | 153 (5) | 189 (6) |
| 4564* | 422 (9) | 500 (12) | 521 (13) | 580 (14) | 739 (19) |
| 6584* | 1697 (35) | 1863 (42) | 1950 (50) | 2066 (46) | 2578 (69) |
| 85+ | 3449 (86) | 3792 (106) | 3981 (120) | 3429 (97) | 4163 (123) |
| Sex | |||||
| Male* | 491 (10) | 553 (13) | 582 (14) | 629 (14) | 782 (20) |
| Female* | 512 (10) | 583 (12) | 607 (15) | 625 (13) | 786 (19) |
| Race/ethnicity | |||||
| White* | 398 (11) | 427 (12) | 466 (16) | 450 (13) | 699 (21) |
| Black* | 423 (27) | 513 (33) | 432 (26) | 574 (38) | 738 (37) |
| Hispanic* | 247 (24) | 381 (42) | 307 (27) | 353 (34) | 478 (42) |
| Other* | 268 (20) | 342 (29) | 347 (26) | 424 (29) | 713 (77) |
| In‐hospital mortality | 140 (3) | 148 (3) | 146 (3) | 140 (3) | 154 (4) |
The most common etiologies of ARF among medical patients were pneumonia, CHF, ARDS, COPD exacerbation, and sepsis. Over the 9‐year study, the proportion of cases secondary to pneumonia and sepsis rose significantly: from 39% to 46% and 13% to 21%, respectively (Figure 1).

Mortality and Other Outcomes
The number of in‐hospital deaths related to ARF increased from 277,407 deaths in 2001 to 381,155 in 2009 (a 37% increase, P < 0.001). Standardized to the population, deaths increased from 140 in 2001 to 154 cases per 100,000 in 2009 (a 10% increase, P = 0.027). Despite slightly increasing mortality rates at a population level, adjusted in‐hospital mortality improved from 27.6% in 2001 to 20.6% in 2009 (P < 0.001). Mortality declined for both IMV and NIV patients from 35.3% in 2001 to 30.2% in 2009 and from 23.5% to 19%, respectively, but increased for those who required both NIV and IMV (from 26.9% in 2001 to 28% in 2009).
Adjusted hospital length of stay decreased from 7.8 days per patient in 2001 to 7.1 days in 2009 (P < 0.001), with a concomitant increase in discharges to nursing facilities, from 24% in 2001 to 29% in 2009. There was no linear trend in adjusted cost per case, with $15,818 in 2001 and $15,987 in 2009 (in 2009 US dollars) (Table 1).
Ventilation Practices
Overall, 50.9% patients received ventilatory support (NIV or IMV or both) in 2001 and 49.7% in 2009 (P= 0.25). The use of NIV increased from 3.8% to 10.1% (P < 0.001), a 169% increase, whereas the utilization of IMV decreased from 48.5% in 2001 to 42.1% in 2009 (P for trend < 0.0001), a 13% decrease. Uses of both NIV and IMV during hospitalization were seen in 1.4% of cases in 2001 and 2.5% of cases in 2009.
2009 Data Analysis
In 2009 the 1,917,910 hospitalizations with ARF resulted in 381,155 (SD = 8965) deaths and a total inpatient cost of $54 billion. The most common etiologies in patients over 65 years old were pneumonia, CHF, COPD, ARDS, and sepsis. In patients younger than 45 years the most frequent diagnoses were pneumonia, ARDS, sepsis, asthma, drug ingestion, and trauma. Stratified analysis by gender and by age groups showed that mortality rates among men were higher than for women and were highest in patients older than 85 years (Table 3).
| Disease | Total | Age <45 Years | 4565 Years | 6584 Years | 85+ Years | Male | Female |
|---|---|---|---|---|---|---|---|
| |||||||
| Medical | |||||||
| Total, N (%) | 1,364,624 (71.2) | 144,715 (10.6) | 416,922 (30.6) | 615,009 (45.1) | 187,977 (13.8) | 647,894 (47.5) | 716,635 (52.5) |
| Pneumonia, %* | 46.1 | 41.7 | 42.8 | 46.9 | 54.3 | 48.8 | 43.7 |
| CHF, %* | 36.6 | 10.4 | 27.3 | 43.6 | 54.8 | 35.0 | 38.1 |
| ARDS, %* | 16.1 | 22.9 | 16.2 | 14.5 | 15.9 | 15.5 | 16.7 |
| Sepsis, %* | 21.2 | 18.1 | 21.3 | 21.3 | 23.1 | 22.8 | 19.8 |
| COPD, %* | 25.4 | 4.2 | 25.6 | 32.3 | 18.3 | 25.0 | 25.7 |
| AMI, %* | 9.0 | 2.6 | 7.1 | 10.5 | 13.3 | 9.3 | 8.8 |
| Asthma, %* | 9.2 | 18.1 | 11.6 | 6.7 | 5.4 | 6.2 | 12.0 |
| Stroke, %* | 4.8 | 2.3 | 4.1 | 5.5 | 6.0 | 5.0 | 4.7 |
| Trauma or burns, %* | 3.4 | 5.4 | 2.9 | 3.0 | 4.1 | 4.3 | 2.5 |
| Cardiorespiratory arrest, %* | 4.1 | 3.9 | 4.4 | 4.1 | 3.8 | 4.6 | 3.7 |
| Drug, %* | 3.7 | 16.6 | 5.1 | 0.8 | 0.3 | 3.8 | 3.6 |
| IMV, %* | 37.7 | 54.6 | 43.7 | 33.5 | 24.8 | 41.1 | 34.5 |
| NIV, %* | 11.9 | 7.1 | 11.5 | 13.0 | 12.7 | 11.4 | 12.3 |
| In‐hospital mortality (CI) | 22 (21.322.7) | 12.9 (11.913.9) | 18.5 (17.619.4) | 23.9 (23.024.9) | 31.8 (30.633.1) | 24.2 (23.325.1) | 20.9 (20.121.7) |
| Surgical | |||||||
| Total, N (%) | 552971 (28.8) | 64983 (11.8) | 190225 (34.4) | 254336 (46) | 43426 (7.9) | 295660 (53.5) | 257287 (46.5) |
| Pneumonia, %* | 34.9 | 33.0 | 34.0 | 35.0 | 40.5 | 37.1 | 32.2 |
| CHF, %* | 27.2 | 8.9 | 21.7 | 33.3 | 42.6 | 26.7 | 27.7 |
| ARDS, %* | 45.5 | 51.5 | 45.2 | 44.7 | 42.7 | 45.0 | 46.1 |
| Sepsis, %* | 25.1 | 22.8 | 25.4 | 25.2 | 26.1 | 25.4 | 24.7 |
| COPD, %* | 8.2 | 1.1 | 7.4 | 10.8 | 7.5 | 8.3 | 8.1 |
| AMI, %* | 16.9 | 4.9 | 17.0 | 19.8 | 17.9 | 19.1 | 14.4 |
| Asthma, %* | 6.1 | 7.6 | 7.2 | 5.4 | 3.6 | 4.1 | 8.5 |
| Stroke, %* | 8.9 | 6.6 | 9.2 | 9.4 | 7.2 | 8.9 | 8.8 |
| Trauma or burns, %* | 12.2 | 26.5 | 9.6 | 9.2 | 20.3 | 13.8 | 10.4 |
| Cardiorespiratory arrest, %* | 5.5 | 4.4 | 6.0 | 5.4 | 5.2 | 6.1 | 4.7 |
| Drug, %* | 0.5 | 1.3 | 0.7 | 0.2 | 0.2 | 0.4 | 0.6 |
| IMV, %* | 52.9 | 57.1 | 54.3 | 51.3 | 50.0 | 54.5 | 51.0 |
| NIV, %* | 5.8 | 3.5 | 5.5 | 6.4 | 6.4 | 5.6 | 6.0 |
| In‐hospital mortality, % (CI) | 18.6 (17.819.5) | 10.7 (9.312.0) | 15.5 (14.216.8) | 20.8 (19.821.9) | 29.4 (27.831.1) | 19.0 (18.219.8) | 18.3 (17.319.2) |
When we examined ventilation practices among medical patients we found that patients older than 85 years, when compared to patients younger than 45 years, were less likely to be treated with IMV (25% vs 55%) and more likely to be treated with NIV (12.7% vs 7%). At the same time, the average cost per case was lowest among patients 85 years and older, and hospital costs per case fell sharply after age 70 years. Costs were considerably higher for those who did not survive during hospitalization, particularly for patients younger than 45 years (Figure 2).
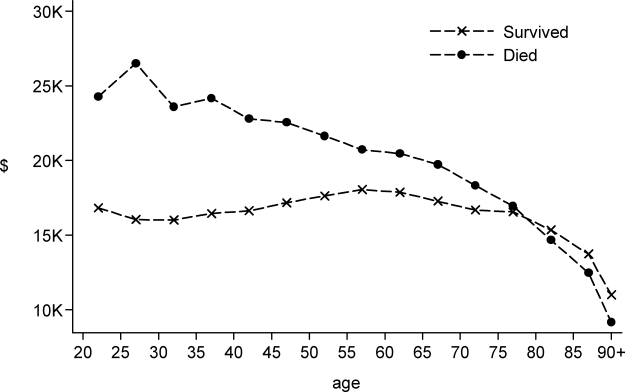
DISCUSSION
In this large population‐based study, we found that the number of hospitalizations associated with a diagnosis of ARF almost doubled over a 9‐year period. In 2009 there were nearly 2 million hospitalizations with ARF in the United States, resulting in approximately 380,000 deaths and inpatient costs of over $54 billion. The population‐adjusted ARF hospitalization rates increased in all age groups, and patients 85 years and older had the highest age‐specific hospitalization rate. Although overall rates of mechanical ventilation (NIV or IMV) remained stable over the 9‐year period, there was an important shift away from IMV (which decreased from 48% in 2001 to 42% in 2009) toward NIV (which increased from 4% in 2001 to 10% in 2009). Overall, there was a significant increase in the number of total deaths despite a decline in adjusted in‐hospital mortality rates. In‐hospital mortality rates decreased for all cases of ARF regardless of ventilation choice.
The findings of this study mirror results of others that have shown that although the incidence of critical care illnesses like sepsis[17, 20, 21, 26] and acute renal failure[27] has increased over the last decade, in‐hospital mortality rates have decreased.[20, 21, 28] Our results also compliment the results of a recent study that looked at hospitalizations for noncardiogenic ARF, which observed a 3.7‐fold increase in the number of cases and a steady decline in case fatality.[11]
Most prior studies addressing the incidence of ARF have included only patients receiving mechanical ventilation. In 1994, the estimated number of cases of ARF requiring IMV was 329,766,[9] which increased to 790,257 in 2005.[10] In our study we found that in 2009, the number of patients with ARF hospitalizations with IMV increased to 806,538. The increase in the overall number of cases with ARF was mainly driven by a surge in cases of sepsis and pneumonia. Our findings are consistent with national trends over time in noncardiogenic ARF[11] and in conditions that predispose patients to ARF such as sepsis[17, 20, 28] and acute renal failure.[27] As the number of claims for ARF doubled and the number of deaths increased, we found that adjusted hospital mortality improved from 27.6% in 2001 to 20.6% in 2009. This decline in hospital mortality was observed among all patients groups, regardless of ventilation choice. The decline in overall case fatality is consistent with prior findings in noncardiogenic ARF,[11] sepsis,[17, 28] and CHF.[29]
There are a number of potential explanations for the reduction in mortality observed over the study period, including improvements in hospital management of the underlying conditions leading to ARF, an increase in the proportion of patients being treated with NIV,[30] and advances in the care of critically ill patients such as the use of low‐tidal volume ventilation.[31, 32] Another contributor may be an increase in the proportion of discharges to nursing facilities, although this change in discharge disposition cannot fully explain our findings. For example, from 2007 to 2009, mortality decreased by 2 percentage points, and nursing home discharges increased by only 0.4 percentage points. Growth and aging of the US population only partially explain the increase we observed in the incidence of ARF, as age‐ and sex‐adjusted population rates increased by 56% from 2001 to 2009. In addition, the NIS captures data on hospital discharges and not individual patients; thus, a patient may have had multiple admissions. Over the last decade adoption of a more intensive practice style has been associated with improved in‐hospital mortality,[33, 34] and although these patients may be living longer they may have multiple readmissions.[35, 36]
We also observed that older patients were less likely to be treated with IMV, had a higher mortality rate, and less expensive care. These results are consistent with other studies and suggest that the intensity of treatment decreases with increasing age, and decisions to withhold or withdraw life‐supporting treatments are more frequent in the elderly.[26, 37] Prior research has shown that severity of illness is more important than age on patients' prognosis,[38, 39] and aggressive treatment strategies are not less cost‐effective when provided to older patients.[40]
Another important finding of this study is the marked increase in the use of NIV paired with a modest reduction in the use of IMV in the treatment of patients with ARF. This finding adds to evidence from other studies, which have similarly reported a dramatic increase in the use of NIV and a decrease in the use of IMV in patients with COPD as well as in ARF of other etiologies.[30, 41]
Our work has several limitations. First, we identified ARF based on ICD‐9‐CM codes and therefore cannot exclude disease misclassification. We did not find any studies in the literature addressing the accuracy and the completeness of ARF coding. However, we employed the same codes used to define ARF as has been used to define organ dysfunction in studies of severe sepsis,[17, 20] and the ICD‐9‐CM codes that we used to identify cases of ARDS have been used in prior studies.[11, 22, 23] Another limitation is that it is not clear to what extent the trends we observed may be due to changes over time in documentation and coding practices. Although this should be considered given the additional reimbursement associated with the diagnosis of ARF, our observation that rates of assisted ventilation have remained almost flat over the 9‐year period of the study suggest that would not wholly account for the rise in ARF. Second, because we did not have access to physiological data such as results of blood gas testing, we could not determine whether the threshold for applying the diagnosis of ARF or for delivering ventilatory support has changed over time. Third, for the purpose of this study we employed a broad definition of ARF, not limiting cases to those requiring mechanical ventilation, and this led to a more heterogeneous cohort including less severe cases of ARF. However, this is not dissimilar to the heterogeneity in disease severity observed among patients who receive a diagnosis of heart failure or acute renal failure. Fourth, survivors of ARF remain at high risk of death in the months after hospitalization,[42] but we assessed only in‐hospital mortality. It is possible that although in‐hospital mortality has improved, 30‐day mortality remained stable. Finally, as the NIS contains only discharge‐level data, we could not distinguish between patients admitted for ARF from those who developed ARF (potentially iatrogenic) after admission.
In summary, over the period of 2001 to 2009, there was a large increase in the number of patients given a diagnosis of ARF and a concomitant reduction in inpatient mortality. Although rates of mechanical ventilation remained relatively constant, there was a significant shift toward greater use of NIV at the expense of IMV.
Disclosures
Dr. Stefan is supported by KM1 CA156726 from the National Cancer Institute (NCI) and by the National Center for Research Resources and the National Center for Advancing Translational Sciences, National Institutes of Health (NIH), through grant UL1 RR025752. The work on this study was supported by a Charlton grant from Tufts University School of Medicine. Dr. Lindenauer and Dr. Pekow are supported by 1R18HL108810‐01 from the National Heart, Lung, and Blood Institute (NHLBI). The content of this publication is solely the responsibility of the authors and does not represent the official views of the NIH, NHLBI, or NCI.
All authors have read and approved the manuscript and none of them have any potential conflicts of interest to report.
Dr. Stefan had full access to all of the data in the study and takes responsibility for the integrity of the data and the accuracy of the data analysis. Conception and design: Mihaela S. Stefan, Penelope S. Pekow, Michael B. Rothberg, Jay Steingrub, Peter K. Lindenauer; analysis and interpretation: Meng‐Shiou Shieh, Mihaela S. Stefan, Penelope S. Pekow, Michael B. Rothberg, Tara Lagu, Peter K. Lindenauer; drafting the manuscript for important intellectual content: Mihaela S. Stefan, Penelope S. Pekow, Michael B. Rothberg, Jay Steingrub, Tara Lagu, and Peter K. Lindenauer.
- , . Goldman's Cecil Medicine. 24th ed. Amsterdam, the Netherlands: Elsevier Inc.; 2012.
- , . Textbook of Respiratory Medicine. 5th ed. Philadelphia, PA: Saunders; 2010.
- , , . Epidemiology and outcome of acute respiratory failure in intensive care unit patients. Crit Care Med. 2003;31(4 suppl):S296–S299.
- , , , et al. Epidemiology of critical care syndromes, organ failures, and life‐support interventions in a suburban US community. Chest. 2011;140(6):1447–1455.
- , , , , . The changing epidemiology of mechanical ventilation: a population‐based study. J Intensive Care Med. 2006;21(3):173–182.
- , , , , . Mechanical ventilation in Ontario, 1992–2000: incidence, survival, and hospital bed utilization of noncardiac surgery adult patients. Crit Care Med. 2004;32(7):1504–1509.
- . Contributions to the epidemiology of acute respiratory failure. Crit Care. 2003;7(4):288–290.
- , , , et al. Incidence, severity, and mortality of acute respiratory failure in Berlin, Germany. Am J Respir Crit Care Med. 1995;151(4):1121–1125.
- . Acute respiratory failure in the United States: incidence and 31‐day survival. Chest. 2000;118(4):1100–1105.
- , , , , , . The epidemiology of mechanical ventilation use in the United States. Crit Care Med. 2010;38(10):1947–1953.
- , , , . Trends in the incidence of noncardiogenic acute respiratory failure: the role of race. Crit Care Med. 2012;40(5):1532–1538.
- , , , , . Secular trends in nosocomial infections and mortality associated with noninvasive ventilation in patients with exacerbation of COPD and pulmonary edema. JAMA. 2003;290(22):2985–2991.
- , , , et al. Association of noninvasive ventilation with nosocomial infections and survival in critically ill patients. JAMA. 2000;284(18):2361–2367.
- , , , , . Noninvasive versus conventional mechanical ventilation. An epidemiologic survey. Am J Respir Crit Care Med. 2001;163(4):874–880.
- , , , , , . Does noninvasive ventilation reduce the ICU nosocomial infection risk? A prospective clinical survey. Intensive Care Med. 1999;25(6):567–573.
- Heathcare Cost and Utilization Project (HCUP). Overview of the Nationwide Inpatient Sample. Available at: http://www.hcup‐us.ahrq.gov/nisoverview.jsp. Accessed December 6, 2011.
- , , , , , . Hospitalizations, costs, and outcomes of severe sepsis in the United States 2003 to 2007. Crit Care Med. 2011;40(3):754–761.
- , , , , . Association of diagnostic coding with trends in hospitalizations and mortality of patients with pneumonia, 2003–2009. JAMA. 2012;307(13):1405–1413.
- , , , , . Little evidence of correlation between growth in health care spending and reduced mortality. Health Aff (Millwood). 2010;29(8):1523–1531.
- , , , . The epidemiology of sepsis in the United States from 1979 through 2000. N Engl J Med. 2003;348(16):1546–1554.
- , , , . Rapid increase in hospitalization and mortality rates for severe sepsis in the United States: a trend analysis from 1993 to 2003. Crit Care Med. 2007;35(5):1244–1250.
- , , . Risk factors for ARDS in the United States: analysis of the 1993 National Mortality Followback Study. Chest. 2001;119(4):1179–1184.
- , , , , , . Acute respiratory distress syndrome: estimated incidence and mortality rate in a 5 million‐person population base. Crit Care. 1998;2(1):29–34.
- , , . Validity of procedure codes in International Classification of Diseases, 9th Revision, Clinical Modification administrative data. Med Care. 2004;42(8):801–809.
- , , , . Comorbidity measures for use with administrative data. Med Care. 1998;36(1):8–27.
- , . Epidemiology of sepsis: an update. Crit Care Med. 2001;29(7 suppl):S109–S116.
- , , , , , . Epidemiology and outcomes of acute renal failure in hospitalized patients: a national survey. Clin J Am Soc Nephrol. 2006;1(1):43–51.
- , , , . Facing the challenge: decreasing case fatality rates in severe sepsis despite increasing hospitalizations. Crit Care Med. 2005;33(11):2555–2562.
- , , , . National and regional trends in heart failure hospitalization and mortality rates for Medicare beneficiaries,1998–2008. JAMA. 2011;306(15):1669–1678.
- , , , et al. Outcomes of noninvasive ventilation for acute exacerbations of chronic obstructive pulmonary disease in the United States, 1998–2008. Am J Respir Crit Care Med. 2011;185(2):152–159.
- , , , et al. A trial of goal‐oriented hemodynamic therapy in critically ill patients. SvO2 Collaborative Group. N Engl J Med. 1995;333(16):1025–1032.
- , . Ventilation with lower tidal volumes as compared with traditional tidal volumes for acute lung injury. N Engl J Med. 2000;343(11):813; author reply 813–814.
- , , . Short‐ and long‐term survival of nonsurgical intensive care patients and its relation to diagnosis, severity of disease, age and comorbidities. Curr Aging Sci. 2009;2(3):240–248.
- , , , , , . The impact of COPD on management and outcomes of patients hospitalized with acute myocardial infarction—a ten‐year retrospective observational study. Chest. 2012;141(6):1441–1448.
- . The paradox of health. N Engl J Med. 1988;318(7):414–418.
- , , . Rehospitalizations among patients in the Medicare fee‐for‐service program. N Engl J Med. 2009;360(14):1418–1428.
- , , , et al. Outcomes and cost‐effectiveness of ventilator support and aggressive care for patients with acute respiratory failure due to pneumonia or acute respiratory distress syndrome. Am J Med. 2000;109(8):614–620.
- , , , et al. Older age, aggressiveness of care, and survival for seriously ill, hospitalized adults. SUPPORT Investigators. Study to Understand Prognoses and Preferences for Outcomes and Risks of Treatments. Ann Intern Med. 1999;131(10):721–728.
- , , , et al. Patient age and decisions to withhold life‐sustaining treatments from seriously ill, hospitalized adults. SUPPORT Investigators. Study to Understand Prognoses and Preferences for Outcomes and Risks of Treatment. Ann Intern Med. 1999;130(2):116–125.
- , , , et al. Are aggressive treatment strategies less cost‐effective for older patients? The case of ventilator support and aggressive care for patients with acute respiratory failure. J Am Geriatr Soc. 2001;49(4):382–390.
- , . Utilization of non‐invasive ventilation in patients with acute respiratory failure from 2000–2009: a population‐based study. Am J Respir Crit Care Med. 2012;185:A6488.
- , , , et al. One‐year outcomes in survivors of the acute respiratory distress syndrome. N Engl J Med. 2003;348(8):683–693.
Acute respiratory failure (ARF), a common and serious complication in hospitalized patients, may be caused by several conditions including pneumonia, chronic obstructive pulmonary disease (COPD), adult respiratory distress syndrome (ARDS), and congestive heart failure (CHF). Although ARF is conventionally defined by an arterial oxygen tension of <60 mm Hg, an arterial carbon dioxide tension of >45 mm Hg, or both, these thresholds serve as a guide to be used in combination with history and clinical assessment of the patient.[1, 2] Supplemental oxygen and treatment of the underlying cause is the mainstay of therapy for ARF, but in severe cases patients are treated with invasive mechanical ventilation (IMV) or noninvasive ventilation (NIV). ARF is the most frequent reason for admission to the intensive care unit (ICU)[3, 4] and has an in‐hospital mortality rate of 33% to 37% among those who require IMV.[5, 6] The majority of epidemiologic studies of ARF have been limited to patients requiring mechanical ventilation or those admitted to the ICU, and information about the characteristics and outcomes of patients across the full spectrum of severity is much more limited.[5, 7, 8, 9, 10, 11] General improvements in the management of underlying conditions, implementation of more effective ventilation strategies,[12, 13] and increasing use of NIV[14, 15] may have led to better outcomes for patients with ARF, yet empirical evidence of a change in the adjusted mortality rate over time is lacking.
The objective of this study was to provide a broad characterization of the epidemiology of ARF among adults hospitalized in the United States using a large nationally representative database. We sought to evaluate whether incidence, mortality, cost, or ventilation practice associated with ARF in the United States changed over the period of 2001 to 2009.
METHODS
Data Source
We utilized data from the Nationwide Inpatient Sample (NIS) of the Health Care Cost and Utilization Project,[16] which is a 20% stratified probability sample of all US acute‐care hospitals each year. These data are drawn from a sampling frame that contains close to 95% of all discharges in the United States, with the hospital discharge record as the unit of analysis. The NIS has been used to study trends in many different diagnoses.[17, 18, 19] The database contains demographic information, payer information, principal and secondary diagnoses, cost, discharge disposition, and death during hospitalization. It also contains information on hospital characteristics including ownership, size, teaching status, and geographic region.
Definitions
We included patients 18 years old discharged between 2001 and 2009 with a primary or secondary diagnosis of ARF. We identified cases of ARF using diagnostic codes (International Classification of Diseases, Ninth Revision, Clinical Modification [ICD‐9‐CM]) previously used in studies of acute organ dysfunction in sepsis (518.81, 518.82, 518.84, 518.4, 799.1, 786.09).[17, 20, 21] To define ARDS we relied on ICD‐9‐CM codes (518.4, 518.82, 518.5, 786.09) used in prior studies that showed good sensitivity and specificity.[22, 23] The use of ventilatory support was identified using the ICD‐9‐CM procedure codes[24] (93.90, 93.70, 93.71, 93.76). Comorbidities were classified using the Agency for Healthcare Research and Quality's (Rockville, MD) Healthcare Cost and Utilization Project's (HCUP) Comorbidity Software version 3.103.5.[25]
Outcomes
The primary outcomes included the annual number of hospitalizations, population incidence, hospital mortality, and costs of care. Secondary outcomes included length of stay, most common diagnoses associated with ARF, disposition at discharge, and use and type of ventilatory support.
Analysis
We estimated the number of hospitalizations with a diagnosis of ARF/year, and we calculated the weighted frequencies following HCUP‐NIS recommendations using SAS/STAT survey procedures. Using population estimates for the years 2001 to 2009 from the US Census Bureau, we employed direct standardization to calculate age‐, gender‐, and race‐adjusted population incidence and mortality rates of ARF per 100,000 population. Hospital mortality was defined as the ratio of ARF hospitalizations ending in death divided by total number of ARF hospitalizations. Mechanical ventilation rates and rates of selected comorbidities were similarly defined.
We employed indirect standardization to adjust hospital mortality rates for age, sex, race/ethnicity, comorbidities, and hospital characteristics using logistic regression models from 2001 to predict hospital mortality for 2002 to 2009. We used linear regression models to test whether the slope of year was significant for trends in outcomes overtime. Costs were calculated using hospital‐specific cost‐to‐charge ratios when available and a weighted group average at the state level for remaining hospitals. We converted all costs to 2009 US dollars using the Consumer Price Index. Costs and lengths of stay were not normally distributed, so we calculated weighted geometric means (the average of all logarithmic values), then converted back to a base‐10 number. Using a Taylor series expansion, we then calculated standard errors. All analyses were performed using SAS version 9.2 (SAS Institute, Inc., Cary, NC).
The Baystate Medical Center institutional review board determined that the project did not constitute human subjects research.
RESULTS
Hospitalization Trends
The number of hospitalizations with an ARF diagnosis code increased at an average annual rate of 11.3% from 1,007,549 (standard deviation [SD] = 19,268) in 2001 to 1,917,910 (SD = 47,558) in 2009. More than two‐thirds of ARF admissions were associated with medical, rather than surgical, conditions (69.5% in 2001 and 71.2% in 2009). The median age, racial make‐up, and gender did not change significantly. Over the study period we observed an increase in ARF‐related hospitalizations in large, urban, teaching hospitals and in hospitals located in the Midwest (Table 1).
| 2001 | 2003 | 2005 | 2007 | 2009 | |
|---|---|---|---|---|---|
| |||||
| Patient characteristics | |||||
| All, N (SD) | 1,007,549 (19,268) | 1,184,928 (25,542) | 1,288,594 (30,493) | 1,480,270 (32,002) | 1,917,910 (47,558) |
| Age, mean (SE), y | 66.6 (0.2) | 66.0 (0.2) | 66.1 (0.2) | 65.8 (0.2) | 65.8 (0.2) |
| Age group, % | |||||
| 1844 | 11.5 | 12.0 | 11.5 | 11.6 | 10.9 |
| 4564* | 26.7 | 28.9 | 29.6 | 30.7 | 31.7 |
| 6584* | 50.2 | 47.8 | 47.0 | 45.7 | 45.3 |
| 85+ | 11.5 | 11.4 | 11.9 | 12.0 | 12.1 |
| Male* | 48.1 | 48.2 | 48.6 | 49.3 | 49.2 |
| Race | |||||
| White | 75.8 | 71.9 | 76.5 | 71.8 | 73.4 |
| Black | 12.7 | 13.6 | 11.2 | 14.2 | 12.5 |
| Hispanic | 7.2 | 9.8 | 7.7 | 8.5 | 7.8 |
| Other | 4.2 | 4.7 | 4.7 | 5.5 | 6.3 |
| Primary ARF | 20.7 | 20.9 | 25.9 | 26.1 | 19.9 |
| Secondary ARF | 79.3 | 79.1 | 74.1 | 73.9 | 80.1 |
| Medical* | 69.5 | 69.1 | 69.9 | 70.2 | 71.2 |
| Surgical* | 30.5 | 30.8 | 30.1 | 29.8 | 28.8 |
| Hospital characteristics, % | |||||
| Number of beds | |||||
| Small | 10.0 | 10.1 | 10.5 | 10.8 | 11.3 |
| Medium | 25.2 | 25.3 | 24.6 | 24.0 | 22.7 |
| Large | 64.7 | 64.6 | 64.9 | 65.2 | 66.0 |
| Region | |||||
| South* | 18.5 | 18.5 | 17.6 | 17.0 | 16.3 |
| Midwest | 21.4 | 22.0 | 23.6 | 23.2 | 23.5 |
| Northeast | 42.6 | 41.7 | 41.4 | 42.2 | 42.1 |
| West* | 17.5 | 17.8 | 17.3 | 17.6 | 18.1 |
| Hospital type | |||||
| Rural | 13.6 | 13.0 | 11.8 | 11.0 | 10.8 |
| Urban nonteaching | 45.5 | 44.5 | 50.1 | 45.3 | 45.7 |
| Urban teaching | 40.9 | 42.5 | 38.1 | 43.7 | 43.6 |
| Patient outcomes | |||||
| Ventilation strategy | |||||
| IMV* | 48.5 | 48.4 | 47.5 | 46.5 | 42.1 |
| NIV* | 3.8 | 5.3 | 6.9 | 9.4 | 10.1 |
| IMV or NIV | 50.9 | 51.7 | 52.1 | 52.9 | 49.7 |
| Disposition | |||||
| Home/home healthcare* | 42.1 | 43.8 | 42.8 | 43.4 | 45.7 |
| Transfer to acute care | 5.2 | 4.7 | 4.6 | 4.6 | 4.4 |
| Nursing facility* | 24.4 | 24.9 | 27.4 | 28.6 | 29.0 |
| Other | 0.7 | 0.8 | 0.9 | 0.9 | 1.0 |
| Adjusted mortality, % (SE)* | 27.6 (0.3) | 26.4 (0.4) | 24.9 (0.4) | 22.7 (0.4) | 20.6 (0.3) |
| Adjusted mean, LOS/case, d (SE)* | 7.8 (0.1) | 7.9 (0.1) | 7.7 (0.1) | 7.5 (0.1) | 7.1 (0.1) |
| Adjusted mean cost/case, 2009 US$, (SE) | 15,818 (251) | 16,981 (419) | 17,236 (411) | 16,941 (436) | 15,987 (402) |
After adjusting for age and sex, the population incidence of ARF increased from 502 (standard error [SE] = 10) cases per 100,000 in 2001 to 784 (SE = 19) cases per 100,000 in 2009 (a 56% increase, P < 0.0001). Hispanics had the lowest rates of ARF, with both black and white groups having similar rates (Table 2).
| 2001 | 2003 | 2005 | 2007 | 2009 | |
|---|---|---|---|---|---|
| |||||
| All* | 502 (10) | 569 (12) | 595 (14) | 627 (14) | 784 (19) |
| Age group | |||||
| 1844* | 107 (3) | 130 (4) | 137 (4) | 153 (5) | 189 (6) |
| 4564* | 422 (9) | 500 (12) | 521 (13) | 580 (14) | 739 (19) |
| 6584* | 1697 (35) | 1863 (42) | 1950 (50) | 2066 (46) | 2578 (69) |
| 85+ | 3449 (86) | 3792 (106) | 3981 (120) | 3429 (97) | 4163 (123) |
| Sex | |||||
| Male* | 491 (10) | 553 (13) | 582 (14) | 629 (14) | 782 (20) |
| Female* | 512 (10) | 583 (12) | 607 (15) | 625 (13) | 786 (19) |
| Race/ethnicity | |||||
| White* | 398 (11) | 427 (12) | 466 (16) | 450 (13) | 699 (21) |
| Black* | 423 (27) | 513 (33) | 432 (26) | 574 (38) | 738 (37) |
| Hispanic* | 247 (24) | 381 (42) | 307 (27) | 353 (34) | 478 (42) |
| Other* | 268 (20) | 342 (29) | 347 (26) | 424 (29) | 713 (77) |
| In‐hospital mortality | 140 (3) | 148 (3) | 146 (3) | 140 (3) | 154 (4) |
The most common etiologies of ARF among medical patients were pneumonia, CHF, ARDS, COPD exacerbation, and sepsis. Over the 9‐year study, the proportion of cases secondary to pneumonia and sepsis rose significantly: from 39% to 46% and 13% to 21%, respectively (Figure 1).
Mortality and Other Outcomes
The number of in‐hospital deaths related to ARF increased from 277,407 deaths in 2001 to 381,155 in 2009 (a 37% increase, P < 0.001). Standardized to the population, deaths increased from 140 in 2001 to 154 cases per 100,000 in 2009 (a 10% increase, P = 0.027). Despite slightly increasing mortality rates at a population level, adjusted in‐hospital mortality improved from 27.6% in 2001 to 20.6% in 2009 (P < 0.001). Mortality declined for both IMV and NIV patients from 35.3% in 2001 to 30.2% in 2009 and from 23.5% to 19%, respectively, but increased for those who required both NIV and IMV (from 26.9% in 2001 to 28% in 2009).
Adjusted hospital length of stay decreased from 7.8 days per patient in 2001 to 7.1 days in 2009 (P < 0.001), with a concomitant increase in discharges to nursing facilities, from 24% in 2001 to 29% in 2009. There was no linear trend in adjusted cost per case, with $15,818 in 2001 and $15,987 in 2009 (in 2009 US dollars) (Table 1).
Ventilation Practices
Overall, 50.9% patients received ventilatory support (NIV or IMV or both) in 2001 and 49.7% in 2009 (P= 0.25). The use of NIV increased from 3.8% to 10.1% (P < 0.001), a 169% increase, whereas the utilization of IMV decreased from 48.5% in 2001 to 42.1% in 2009 (P for trend < 0.0001), a 13% decrease. Uses of both NIV and IMV during hospitalization were seen in 1.4% of cases in 2001 and 2.5% of cases in 2009.
2009 Data Analysis
In 2009 the 1,917,910 hospitalizations with ARF resulted in 381,155 (SD = 8965) deaths and a total inpatient cost of $54 billion. The most common etiologies in patients over 65 years old were pneumonia, CHF, COPD, ARDS, and sepsis. In patients younger than 45 years the most frequent diagnoses were pneumonia, ARDS, sepsis, asthma, drug ingestion, and trauma. Stratified analysis by gender and by age groups showed that mortality rates among men were higher than for women and were highest in patients older than 85 years (Table 3).
| Disease | Total | Age <45 Years | 4565 Years | 6584 Years | 85+ Years | Male | Female |
|---|---|---|---|---|---|---|---|
| |||||||
| Medical | |||||||
| Total, N (%) | 1,364,624 (71.2) | 144,715 (10.6) | 416,922 (30.6) | 615,009 (45.1) | 187,977 (13.8) | 647,894 (47.5) | 716,635 (52.5) |
| Pneumonia, %* | 46.1 | 41.7 | 42.8 | 46.9 | 54.3 | 48.8 | 43.7 |
| CHF, %* | 36.6 | 10.4 | 27.3 | 43.6 | 54.8 | 35.0 | 38.1 |
| ARDS, %* | 16.1 | 22.9 | 16.2 | 14.5 | 15.9 | 15.5 | 16.7 |
| Sepsis, %* | 21.2 | 18.1 | 21.3 | 21.3 | 23.1 | 22.8 | 19.8 |
| COPD, %* | 25.4 | 4.2 | 25.6 | 32.3 | 18.3 | 25.0 | 25.7 |
| AMI, %* | 9.0 | 2.6 | 7.1 | 10.5 | 13.3 | 9.3 | 8.8 |
| Asthma, %* | 9.2 | 18.1 | 11.6 | 6.7 | 5.4 | 6.2 | 12.0 |
| Stroke, %* | 4.8 | 2.3 | 4.1 | 5.5 | 6.0 | 5.0 | 4.7 |
| Trauma or burns, %* | 3.4 | 5.4 | 2.9 | 3.0 | 4.1 | 4.3 | 2.5 |
| Cardiorespiratory arrest, %* | 4.1 | 3.9 | 4.4 | 4.1 | 3.8 | 4.6 | 3.7 |
| Drug, %* | 3.7 | 16.6 | 5.1 | 0.8 | 0.3 | 3.8 | 3.6 |
| IMV, %* | 37.7 | 54.6 | 43.7 | 33.5 | 24.8 | 41.1 | 34.5 |
| NIV, %* | 11.9 | 7.1 | 11.5 | 13.0 | 12.7 | 11.4 | 12.3 |
| In‐hospital mortality (CI) | 22 (21.322.7) | 12.9 (11.913.9) | 18.5 (17.619.4) | 23.9 (23.024.9) | 31.8 (30.633.1) | 24.2 (23.325.1) | 20.9 (20.121.7) |
| Surgical | |||||||
| Total, N (%) | 552971 (28.8) | 64983 (11.8) | 190225 (34.4) | 254336 (46) | 43426 (7.9) | 295660 (53.5) | 257287 (46.5) |
| Pneumonia, %* | 34.9 | 33.0 | 34.0 | 35.0 | 40.5 | 37.1 | 32.2 |
| CHF, %* | 27.2 | 8.9 | 21.7 | 33.3 | 42.6 | 26.7 | 27.7 |
| ARDS, %* | 45.5 | 51.5 | 45.2 | 44.7 | 42.7 | 45.0 | 46.1 |
| Sepsis, %* | 25.1 | 22.8 | 25.4 | 25.2 | 26.1 | 25.4 | 24.7 |
| COPD, %* | 8.2 | 1.1 | 7.4 | 10.8 | 7.5 | 8.3 | 8.1 |
| AMI, %* | 16.9 | 4.9 | 17.0 | 19.8 | 17.9 | 19.1 | 14.4 |
| Asthma, %* | 6.1 | 7.6 | 7.2 | 5.4 | 3.6 | 4.1 | 8.5 |
| Stroke, %* | 8.9 | 6.6 | 9.2 | 9.4 | 7.2 | 8.9 | 8.8 |
| Trauma or burns, %* | 12.2 | 26.5 | 9.6 | 9.2 | 20.3 | 13.8 | 10.4 |
| Cardiorespiratory arrest, %* | 5.5 | 4.4 | 6.0 | 5.4 | 5.2 | 6.1 | 4.7 |
| Drug, %* | 0.5 | 1.3 | 0.7 | 0.2 | 0.2 | 0.4 | 0.6 |
| IMV, %* | 52.9 | 57.1 | 54.3 | 51.3 | 50.0 | 54.5 | 51.0 |
| NIV, %* | 5.8 | 3.5 | 5.5 | 6.4 | 6.4 | 5.6 | 6.0 |
| In‐hospital mortality, % (CI) | 18.6 (17.819.5) | 10.7 (9.312.0) | 15.5 (14.216.8) | 20.8 (19.821.9) | 29.4 (27.831.1) | 19.0 (18.219.8) | 18.3 (17.319.2) |
When we examined ventilation practices among medical patients we found that patients older than 85 years, when compared to patients younger than 45 years, were less likely to be treated with IMV (25% vs 55%) and more likely to be treated with NIV (12.7% vs 7%). At the same time, the average cost per case was lowest among patients 85 years and older, and hospital costs per case fell sharply after age 70 years. Costs were considerably higher for those who did not survive during hospitalization, particularly for patients younger than 45 years (Figure 2).
DISCUSSION
In this large population‐based study, we found that the number of hospitalizations associated with a diagnosis of ARF almost doubled over a 9‐year period. In 2009 there were nearly 2 million hospitalizations with ARF in the United States, resulting in approximately 380,000 deaths and inpatient costs of over $54 billion. The population‐adjusted ARF hospitalization rates increased in all age groups, and patients 85 years and older had the highest age‐specific hospitalization rate. Although overall rates of mechanical ventilation (NIV or IMV) remained stable over the 9‐year period, there was an important shift away from IMV (which decreased from 48% in 2001 to 42% in 2009) toward NIV (which increased from 4% in 2001 to 10% in 2009). Overall, there was a significant increase in the number of total deaths despite a decline in adjusted in‐hospital mortality rates. In‐hospital mortality rates decreased for all cases of ARF regardless of ventilation choice.
The findings of this study mirror results of others that have shown that although the incidence of critical care illnesses like sepsis[17, 20, 21, 26] and acute renal failure[27] has increased over the last decade, in‐hospital mortality rates have decreased.[20, 21, 28] Our results also compliment the results of a recent study that looked at hospitalizations for noncardiogenic ARF, which observed a 3.7‐fold increase in the number of cases and a steady decline in case fatality.[11]
Most prior studies addressing the incidence of ARF have included only patients receiving mechanical ventilation. In 1994, the estimated number of cases of ARF requiring IMV was 329,766,[9] which increased to 790,257 in 2005.[10] In our study we found that in 2009, the number of patients with ARF hospitalizations with IMV increased to 806,538. The increase in the overall number of cases with ARF was mainly driven by a surge in cases of sepsis and pneumonia. Our findings are consistent with national trends over time in noncardiogenic ARF[11] and in conditions that predispose patients to ARF such as sepsis[17, 20, 28] and acute renal failure.[27] As the number of claims for ARF doubled and the number of deaths increased, we found that adjusted hospital mortality improved from 27.6% in 2001 to 20.6% in 2009. This decline in hospital mortality was observed among all patients groups, regardless of ventilation choice. The decline in overall case fatality is consistent with prior findings in noncardiogenic ARF,[11] sepsis,[17, 28] and CHF.[29]
There are a number of potential explanations for the reduction in mortality observed over the study period, including improvements in hospital management of the underlying conditions leading to ARF, an increase in the proportion of patients being treated with NIV,[30] and advances in the care of critically ill patients such as the use of low‐tidal volume ventilation.[31, 32] Another contributor may be an increase in the proportion of discharges to nursing facilities, although this change in discharge disposition cannot fully explain our findings. For example, from 2007 to 2009, mortality decreased by 2 percentage points, and nursing home discharges increased by only 0.4 percentage points. Growth and aging of the US population only partially explain the increase we observed in the incidence of ARF, as age‐ and sex‐adjusted population rates increased by 56% from 2001 to 2009. In addition, the NIS captures data on hospital discharges and not individual patients; thus, a patient may have had multiple admissions. Over the last decade adoption of a more intensive practice style has been associated with improved in‐hospital mortality,[33, 34] and although these patients may be living longer they may have multiple readmissions.[35, 36]
We also observed that older patients were less likely to be treated with IMV, had a higher mortality rate, and less expensive care. These results are consistent with other studies and suggest that the intensity of treatment decreases with increasing age, and decisions to withhold or withdraw life‐supporting treatments are more frequent in the elderly.[26, 37] Prior research has shown that severity of illness is more important than age on patients' prognosis,[38, 39] and aggressive treatment strategies are not less cost‐effective when provided to older patients.[40]
Another important finding of this study is the marked increase in the use of NIV paired with a modest reduction in the use of IMV in the treatment of patients with ARF. This finding adds to evidence from other studies, which have similarly reported a dramatic increase in the use of NIV and a decrease in the use of IMV in patients with COPD as well as in ARF of other etiologies.[30, 41]
Our work has several limitations. First, we identified ARF based on ICD‐9‐CM codes and therefore cannot exclude disease misclassification. We did not find any studies in the literature addressing the accuracy and the completeness of ARF coding. However, we employed the same codes used to define ARF as has been used to define organ dysfunction in studies of severe sepsis,[17, 20] and the ICD‐9‐CM codes that we used to identify cases of ARDS have been used in prior studies.[11, 22, 23] Another limitation is that it is not clear to what extent the trends we observed may be due to changes over time in documentation and coding practices. Although this should be considered given the additional reimbursement associated with the diagnosis of ARF, our observation that rates of assisted ventilation have remained almost flat over the 9‐year period of the study suggest that would not wholly account for the rise in ARF. Second, because we did not have access to physiological data such as results of blood gas testing, we could not determine whether the threshold for applying the diagnosis of ARF or for delivering ventilatory support has changed over time. Third, for the purpose of this study we employed a broad definition of ARF, not limiting cases to those requiring mechanical ventilation, and this led to a more heterogeneous cohort including less severe cases of ARF. However, this is not dissimilar to the heterogeneity in disease severity observed among patients who receive a diagnosis of heart failure or acute renal failure. Fourth, survivors of ARF remain at high risk of death in the months after hospitalization,[42] but we assessed only in‐hospital mortality. It is possible that although in‐hospital mortality has improved, 30‐day mortality remained stable. Finally, as the NIS contains only discharge‐level data, we could not distinguish between patients admitted for ARF from those who developed ARF (potentially iatrogenic) after admission.
In summary, over the period of 2001 to 2009, there was a large increase in the number of patients given a diagnosis of ARF and a concomitant reduction in inpatient mortality. Although rates of mechanical ventilation remained relatively constant, there was a significant shift toward greater use of NIV at the expense of IMV.
Disclosures
Dr. Stefan is supported by KM1 CA156726 from the National Cancer Institute (NCI) and by the National Center for Research Resources and the National Center for Advancing Translational Sciences, National Institutes of Health (NIH), through grant UL1 RR025752. The work on this study was supported by a Charlton grant from Tufts University School of Medicine. Dr. Lindenauer and Dr. Pekow are supported by 1R18HL108810‐01 from the National Heart, Lung, and Blood Institute (NHLBI). The content of this publication is solely the responsibility of the authors and does not represent the official views of the NIH, NHLBI, or NCI.
All authors have read and approved the manuscript and none of them have any potential conflicts of interest to report.
Dr. Stefan had full access to all of the data in the study and takes responsibility for the integrity of the data and the accuracy of the data analysis. Conception and design: Mihaela S. Stefan, Penelope S. Pekow, Michael B. Rothberg, Jay Steingrub, Peter K. Lindenauer; analysis and interpretation: Meng‐Shiou Shieh, Mihaela S. Stefan, Penelope S. Pekow, Michael B. Rothberg, Tara Lagu, Peter K. Lindenauer; drafting the manuscript for important intellectual content: Mihaela S. Stefan, Penelope S. Pekow, Michael B. Rothberg, Jay Steingrub, Tara Lagu, and Peter K. Lindenauer.
- , . Goldman's Cecil Medicine. 24th ed. Amsterdam, the Netherlands: Elsevier Inc.; 2012.
- , . Textbook of Respiratory Medicine. 5th ed. Philadelphia, PA: Saunders; 2010.
- , , . Epidemiology and outcome of acute respiratory failure in intensive care unit patients. Crit Care Med. 2003;31(4 suppl):S296–S299.
- , , , et al. Epidemiology of critical care syndromes, organ failures, and life‐support interventions in a suburban US community. Chest. 2011;140(6):1447–1455.
- , , , , . The changing epidemiology of mechanical ventilation: a population‐based study. J Intensive Care Med. 2006;21(3):173–182.
- , , , , . Mechanical ventilation in Ontario, 1992–2000: incidence, survival, and hospital bed utilization of noncardiac surgery adult patients. Crit Care Med. 2004;32(7):1504–1509.
- . Contributions to the epidemiology of acute respiratory failure. Crit Care. 2003;7(4):288–290.
- , , , et al. Incidence, severity, and mortality of acute respiratory failure in Berlin, Germany. Am J Respir Crit Care Med. 1995;151(4):1121–1125.
- . Acute respiratory failure in the United States: incidence and 31‐day survival. Chest. 2000;118(4):1100–1105.
- , , , , , . The epidemiology of mechanical ventilation use in the United States. Crit Care Med. 2010;38(10):1947–1953.
- , , , . Trends in the incidence of noncardiogenic acute respiratory failure: the role of race. Crit Care Med. 2012;40(5):1532–1538.
- , , , , . Secular trends in nosocomial infections and mortality associated with noninvasive ventilation in patients with exacerbation of COPD and pulmonary edema. JAMA. 2003;290(22):2985–2991.
- , , , et al. Association of noninvasive ventilation with nosocomial infections and survival in critically ill patients. JAMA. 2000;284(18):2361–2367.
- , , , , . Noninvasive versus conventional mechanical ventilation. An epidemiologic survey. Am J Respir Crit Care Med. 2001;163(4):874–880.
- , , , , , . Does noninvasive ventilation reduce the ICU nosocomial infection risk? A prospective clinical survey. Intensive Care Med. 1999;25(6):567–573.
- Heathcare Cost and Utilization Project (HCUP). Overview of the Nationwide Inpatient Sample. Available at: http://www.hcup‐us.ahrq.gov/nisoverview.jsp. Accessed December 6, 2011.
- , , , , , . Hospitalizations, costs, and outcomes of severe sepsis in the United States 2003 to 2007. Crit Care Med. 2011;40(3):754–761.
- , , , , . Association of diagnostic coding with trends in hospitalizations and mortality of patients with pneumonia, 2003–2009. JAMA. 2012;307(13):1405–1413.
- , , , , . Little evidence of correlation between growth in health care spending and reduced mortality. Health Aff (Millwood). 2010;29(8):1523–1531.
- , , , . The epidemiology of sepsis in the United States from 1979 through 2000. N Engl J Med. 2003;348(16):1546–1554.
- , , , . Rapid increase in hospitalization and mortality rates for severe sepsis in the United States: a trend analysis from 1993 to 2003. Crit Care Med. 2007;35(5):1244–1250.
- , , . Risk factors for ARDS in the United States: analysis of the 1993 National Mortality Followback Study. Chest. 2001;119(4):1179–1184.
- , , , , , . Acute respiratory distress syndrome: estimated incidence and mortality rate in a 5 million‐person population base. Crit Care. 1998;2(1):29–34.
- , , . Validity of procedure codes in International Classification of Diseases, 9th Revision, Clinical Modification administrative data. Med Care. 2004;42(8):801–809.
- , , , . Comorbidity measures for use with administrative data. Med Care. 1998;36(1):8–27.
- , . Epidemiology of sepsis: an update. Crit Care Med. 2001;29(7 suppl):S109–S116.
- , , , , , . Epidemiology and outcomes of acute renal failure in hospitalized patients: a national survey. Clin J Am Soc Nephrol. 2006;1(1):43–51.
- , , , . Facing the challenge: decreasing case fatality rates in severe sepsis despite increasing hospitalizations. Crit Care Med. 2005;33(11):2555–2562.
- , , , . National and regional trends in heart failure hospitalization and mortality rates for Medicare beneficiaries,1998–2008. JAMA. 2011;306(15):1669–1678.
- , , , et al. Outcomes of noninvasive ventilation for acute exacerbations of chronic obstructive pulmonary disease in the United States, 1998–2008. Am J Respir Crit Care Med. 2011;185(2):152–159.
- , , , et al. A trial of goal‐oriented hemodynamic therapy in critically ill patients. SvO2 Collaborative Group. N Engl J Med. 1995;333(16):1025–1032.
- , . Ventilation with lower tidal volumes as compared with traditional tidal volumes for acute lung injury. N Engl J Med. 2000;343(11):813; author reply 813–814.
- , , . Short‐ and long‐term survival of nonsurgical intensive care patients and its relation to diagnosis, severity of disease, age and comorbidities. Curr Aging Sci. 2009;2(3):240–248.
- , , , , , . The impact of COPD on management and outcomes of patients hospitalized with acute myocardial infarction—a ten‐year retrospective observational study. Chest. 2012;141(6):1441–1448.
- . The paradox of health. N Engl J Med. 1988;318(7):414–418.
- , , . Rehospitalizations among patients in the Medicare fee‐for‐service program. N Engl J Med. 2009;360(14):1418–1428.
- , , , et al. Outcomes and cost‐effectiveness of ventilator support and aggressive care for patients with acute respiratory failure due to pneumonia or acute respiratory distress syndrome. Am J Med. 2000;109(8):614–620.
- , , , et al. Older age, aggressiveness of care, and survival for seriously ill, hospitalized adults. SUPPORT Investigators. Study to Understand Prognoses and Preferences for Outcomes and Risks of Treatments. Ann Intern Med. 1999;131(10):721–728.
- , , , et al. Patient age and decisions to withhold life‐sustaining treatments from seriously ill, hospitalized adults. SUPPORT Investigators. Study to Understand Prognoses and Preferences for Outcomes and Risks of Treatment. Ann Intern Med. 1999;130(2):116–125.
- , , , et al. Are aggressive treatment strategies less cost‐effective for older patients? The case of ventilator support and aggressive care for patients with acute respiratory failure. J Am Geriatr Soc. 2001;49(4):382–390.
- , . Utilization of non‐invasive ventilation in patients with acute respiratory failure from 2000–2009: a population‐based study. Am J Respir Crit Care Med. 2012;185:A6488.
- , , , et al. One‐year outcomes in survivors of the acute respiratory distress syndrome. N Engl J Med. 2003;348(8):683–693.
Copyright © 2012 Society of Hospital Medicine
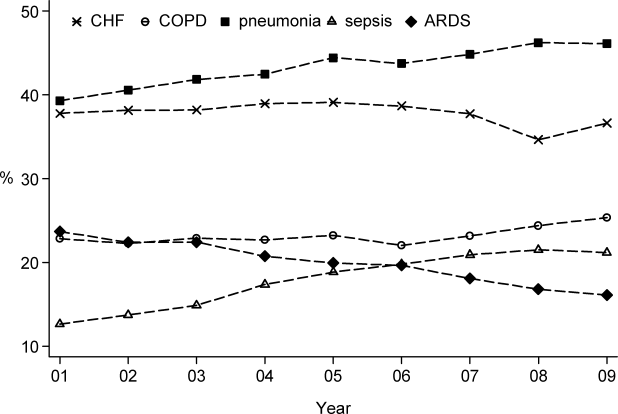
LMW vs UF Heparin
Venous thromboembolism (VTE) is a major source of morbidity and mortality for hospitalized patients, with as many as 16% of high‐risk medical patients developing VTE during their hospital stay.1, 2 Pharmacologic prophylaxis with subcutaneous heparin reduces the risk of VTE by approximately 50%,3, 4 and guidelines produced by the American College of Chest Physicians (ACCP) recommend thromboprophylaxis for patients at moderate‐to‐high risk of VTE with either low‐molecular‐weight heparin (LMWH) or unfractionated heparin (UFH).2 UFH is less expensive per dose, but meta‐analyses have suggested that UFH may be either less effective than LMWH3 or more likely to cause complications, such as bleeding5 or heparin‐induced thrombocytopenia (HIT).6 Others have argued that the efficacy and risk of bleeding with UFH and LMWH are similar.7, 8 In either case, there are few head‐to‐head studies of LMWH and UFH in medical patients and they tend to be small. In the most recent meta‐analysis, which included fewer than 4500 patients, several different low‐molecular‐weight heparins were assessed together, and the observed rate of deep vein thrombosis (DVT) with UFH was high (5.4%), with evidence suggesting publication bias.3
Given the current Joint Commission requirement9 that all medical patients either receive VTE prophylaxis or have documented a reason not to, the implications related to choosing one form of VTE prophylaxis over another are substantial on a national scale. In order to compare the effectiveness of UFH and LMWH in routine practice among hospitalized medical patients, we conducted a retrospective cohort study in a national sample of hospitals and compared the risk of VTE, bleeding, HIT, and death associated with each treatment.
METHODS
Setting and Patients
We conducted a retrospective cohort study of patients discharged between January 1, 2004 and June 30, 2005 from 333 acute care facilities in the United States that participated in Premier's Perspective, a database we have described previously.10 Compared to US hospitals as a whole, Perspective hospitals are more likely to be located in the South and in urban areas. Perspective contains the following data elements: sociodemographic information, International Classification of Diseases, Ninth Revision, Clinical Modification (ICD‐9‐CM) diagnosis and procedure codes, as well as a list of all billed items with a date of service, including diagnostic tests, medications, and other treatments. Hospitals' characteristics include size, region, setting, and teaching status. The Institutional Review Board at Baystate Medical Center granted permission to conduct the study (#132280‐1).
We included general medical patients aged 18 years whose ICD‐9‐CM primary diagnosis code (congestive heart failure, stroke, pneumonia, and urinary tract infection) placed them at moderate‐to‐high risk of VTE according to the ACCP recommendations,2 and who received daily prophylactic dosages of either LMWH (40 mg daily) or UFH (10,00015,000 units daily) initiated by hospital day 2 and continued to discharge or until the patient developed a VTE or a complication attributable to heparin. Patients were included so long as they missed no more than 1 day of prophylaxis or had no more than 1 unusual dose recorded. Patients who switched between heparin types were included and analyzed according to their initial therapy. Patients who received any other regimen were excluded. We also excluded patients who received warfarin on hospital day 1 or 2, because they would not be considered candidates for heparin prophylaxis, and patients whose length of stay was 2 days, because the value of VTE prophylaxis in such cases is unknown.
Data Elements
For each patient, we extracted age, gender, race, and insurance status, principal diagnosis, comorbidities, and specialty of the attending physician. Comorbidities were identified from ICD‐9‐CM secondary diagnosis codes and Diagnosis Related Groups using Healthcare Cost and Utilization Project Comorbidity Software, version 3.1, based on the work of Elixhauser and colleagues.11 We also identified additional risk factors for VTE using a combination of ICD‐9‐CM codes and specific charges. These included cancer, chemotherapy/radiation, prior VTE, use of estrogens and estrogen modulators, inflammatory bowel disease, nephrotic syndrome, myeloproliferative disorders, smoking, central venous catheter, inherited or acquired thrombophilia, mechanical ventilation, urinary catheter, decubitus ulcer, 3‐hydroxy‐3‐methylglutaryl coenzyme A (HMG‐CoA) reductase inhibitors, restraints, and varicose veins. Hospitals were categorized by region (Northeast, South, Midwest, or West), bed size, setting (urban vs rural), and teaching status.
Outcome Variables
We defined hospital‐acquired VTE as a secondary diagnosis of VTE (ICD‐9‐CM diagnoses 453.4, 453.40, 453.41, 453.42, 453.8, 453.9, 415.1, 415.11, 415.19), combined with a diagnostic test for VTE (lower extremity ultrasound, venography, computed tomography (CT) angiogram, ventilation‐perfusion scan, or pulmonary angiogram) after hospital day 2, followed by treatment for VTE (intravenous unfractionated heparin, >60 mg of enoxaparin, 7500 mg of dalteparin, or placement of an inferior vena cava filter) for at least 50% of the remaining hospital days or until initiation of warfarin or appearance of a complication (eg, transfusion or treatment for heparin‐induced thrombocytopenia). We chose this definition to differentiate hospital‐acquired VTE from VTE present on admission.12 In addition, patients who were readmitted within 30 days of discharge with a primary diagnosis of VTE were also considered to have hospital‐acquired VTE.
We also assessed complications of VTE prophylaxis. Major bleeding was defined as the receipt of 2 or more units of packed red blood cells on a single day or a secondary diagnosis of intracranial bleeding. Because there was no ICD‐9‐CM code for HIT, we assessed codes for all thrombocytopenia, as well as secondary thrombocytopenia. Definite HIT was defined as an ICD‐9‐CM code for thrombocytopenia, together with discontinuation of heparin and initiation of treatment with argatroban. A definite complication was defined as HIT or evidence of major bleeding coupled with discontinuation of heparin. Finally, we evaluated all‐cause in‐hospital mortality and total hospital costs.
Statistical Analysis
We computed summary statistics using frequencies and percents for categorical variables, and means, medians, and standard deviations and interquartile range for continuous variables. Associations of prophylaxis type with patient and hospital characteristics and outcomes were assessed using chi‐square tests or Fisher's exact test for categorical variables, and z‐tests or Wilcoxon tests for continuous variables.
We developed a propensity model for treatment with UFH as the outcome; the model included patient characteristics, early treatments, comorbidities, risk factors for VTE, physician specialty, and selected interaction terms. We then developed a series of multivariable models to evaluate the impact of heparin choice on the risk of VTE, complications of treatment, mortality, and total cost. Generalized estimating equation models with a logit link were used to assess the association between the choice of heparin and the risk of VTE, and of complications and mortality, while adjusting for the effects of within‐hospital correlation; identity link models were used for analyses of cost. Costs were trimmed at 3 standard deviations above the mean, and natural log‐transformed values were modeled due to extreme positive skew.
Unadjusted and covariate‐adjusted models were evaluated with and without adjustments for propensity score. In addition, since the hospital was the single strongest predictor of treatment, we developed grouped treatment models, in which a patient's actual treatment was replaced by a probability equal to the proportion of prophylaxed patients receiving UFH at that hospital. This adaptation of instrumental variable analysis uses the hospital as the instrument, and attempts to assess whether patients treated at a hospital which uses UFH more frequently have outcomes that differ from those of patients treated at hospitals which use LMWH more frequently, while adjusting for other patient, physician, and hospital variables. By relying on treatment at the hospital level, this method reduces the opportunity for selection bias at the patient level.
Finally, in order to exclude the possibility that our surrogate bleeding outcome was due to transfusion practices at hospitals that use a particular form of heparin, we compared the hospital rates of transfusion of 2 or more units of packed red cells to the hospital rates of prophylaxis with UFH in a larger dataset of the same hospitals. This set included patients with congestive heart failure, stroke, pneumonia, and urinary tract infection who did not receive daily prophylaxis, as well as patients admitted for chronic obstructive pulmonary disease (COPD) or acute myocardial infarction, and patients who received either warfarin or a treatment dose of heparin in the first 2 hospital days. We also compared the transfusion rates at hospitals that used unfractionated heparin in 80% of patients to hospitals that used LMWH in 80%. All analyses were performed using SAS version 9.1 (SAS Institute Inc, Cary, NC).
RESULTS
Our final sample included 32,104 patients who received prophylaxis at 333 hospitals (see Supporting Information, e‐Figure, in the online version of this article). Patient characteristics appear in Table 1. Most patients (66%) were over age 65; 59% were female and 61% were white. The most common primary diagnoses were pneumonia (40%) and congestive heart failure (25%). Additional risk factors for thromboembolism included cancer (13%), paralysis (8%), or diabetes (35%). Most patients' attending physicians were either internists (61%) or family practitioners (14%). Almost half of the patients were cared for at hospitals in the South (46%).
| Total | UFH | LMWH | ||
|---|---|---|---|---|
| 32,104 (100) | 14,591 (45.4) | 17,513 (54.6) | ||
| N (%) | N (%) | N (%) | P | |
| ||||
| Demographics | ||||
| Age | 0.0002 | |||
| 1849 | 4,061 (12.7) | 1,950 (13.4) | 2,111 (12.1) | |
| 5064 | 6,962 (21.7) | 3,225 (22.1) | 3,737 (21.3) | |
| 6579 | 10,909 (34.0) | 4,921 (33.7) | 5,988 (34.2) | |
| 80+ | 10,172 (31.7) | 4,495 (30.8) | 5,677 (32.4) | |
| Sex | 0.0071 | |||
| Male | 13,234 (41.2) | 6,133 (42.0) | 7,101 (40.5) | |
| Female | 18,870 (58.8) | 8,458 (58.0) | 10,412 (59.5) | |
| Race/ethnicity | <0.0001 | |||
| White | 19,489 (60.7) | 8,063 (55.3) | 11,426 (65.2) | |
| Black | 7,429 (23.1) | 4,101 (28.1) | 3,328 (19.0) | |
| Hispanic | 1,304 (4.1) | 591 (4.1) | 713 (4.1) | |
| Other | 3,882 (12.1) | 1,836 (12.6) | 2,046 (11.7) | |
| Primary diagnosis | <0.0001 | |||
| Pneumonia | 12,768 (39.8) | 5,354 (36.7) | 7,414 (42.3) | |
| Sepsis* | 1,217 (3.8) | 562 (3.9) | 655 (3.7) | |
| Respiratory failure* | 2,017 (6.3) | 814 (5.6) | 1,203 (6.9) | |
| Heart failure | 8,157 (25.4) | 3,825 (26.2) | 4,332 (24.7) | |
| Stroke | 4,416 (13.8) | 2,295 (15.7) | 2,121 (12.1) | |
| Urinary tract infection | 3,529 (11.0) | 1,741 (11.9) | 1,788 (10.2) | |
| Attending specialty | <0.0001 | |||
| Internist | 19,511 (60.8) | 8,945 (61.3) | 10,566 (60.3) | |
| General practice/Family medicine | 4,326 (13.5) | 1,964 (13.5) | 2,362 (13.5) | |
| Cardiologist | 1,606 (5.0) | 730 (5.0) | 876 (5.0) | |
| Pulmonologist | 2,179 (6.8) | 854 (5.9) | 1,325 (7.6) | |
| Nephrology | 583 (1.8) | 380 (2.6) | 203 (1.2) | |
| Critical care/Intensivist | 150 (0.5) | 93 (0.6) | 57 (0.3) | |
| Other | 3,749 (11.7) | 1,625 (11.1) | 2,124 (12.1) | |
| Insurance | <0.0001 | |||
| Medicare traditional | 20,281 (63.2) | 8,929 (61.2) | 11,352 (64.8) | |
| Medicare managed care | 1,737 (5.4) | 826 (5.7) | 911 (5.2) | |
| Medicaid | 2,629 (8.2) | 1,401 (9.6) | 1,228 (7.0) | |
| Private | 5,967 (18.6) | 2,830 (19.4) | 3,137 (17.9) | |
| Self‐pay/uninsured/other | 1,490 (4.6) | 605 (4.1) | 885 (5.1) | |
| Risk factors for VTE | ||||
| Admit from skilled nursing facility | 476 (1.5) | 277 (1.9) | 199 (1.1) | <0.0001 |
| Paralysis | 2,608 (8.1) | 1,317 (9.0) | 1,291 (7.4) | <0.0001 |
| Restraints | 417 (1.3) | 147 (1.0) | 270 (1.5) | <0.0001 |
| Decubitus ulcer | 1,190 (3.7) | 631 (4.3) | 559 (3.2) | <0.0001 |
| Cancer | 4,154 (12.9) | 1,858 (12.7) | 2,296 (13.1) | 0.3171 |
| Chemotherapy | 86 (0.3) | 41 (0.3) | 45 (0.3) | 0.6781 |
| Prior venous thromboembolism | 494 (1.5) | 202 (1.4) | 292 (1.7) | 0.0403 |
| Pregnancy | 1 (0) | 1 (0) | 0 (0) | 0.2733 |
| Estrogens | 438 (1.4) | 143 (1.0) | 295 (1.7) | <0.0001 |
| Estrogen modulators | 246 (0.8) | 80 (0.5) | 166 (0.9) | <0.0001 |
| Congestive heart failure | 3,107 (9.7) | 1,438 (9.9) | 1,669 (9.5) | 0.3263 |
| Respiratory failure | 2,210 (6.9) | 1,037 (7.1) | 1,173 (6.7) | 0.1493 |
| Inflammatory bowel disease | 108 (0.3) | 41 (0.3) | 67 (0.4) | 0.1176 |
| Nephrotic syndrome | 92 (0.3) | 50 (0.3) | 42 (0.2) | 0.0860 |
| Myeloproliferative disorder | 198 (0.6) | 68 (0.5) | 130 (0.7) | 0.0016 |
| Obesity | 2,973 (9.3) | 1,211 (8.3) | 1,762 (10.1) | <0.0001 |
| Smoking | 4,476 (13.9) | 1,887 (12.9) | 2,589 (14.8) | <0.0001 |
| Varicose veins | 19 (0.1) | 6 (0) | 13 (0.1) | 0.2245 |
| Central line | 1,070 (3.3) | 502 (3.4) | 568 (3.2) | 0.3271 |
| Inherited or acquired thrombophilia | 16 (0) | 9 (0.1) | 7 (0) | 0.3855 |
| Diabetes | 11,136 (34.7) | 5,157 (35.3) | 5,979 (34.1) | 0.0241 |
| Procedures associated with VTE or bleed | ||||
| Mechanical ventilation | 2,282 (7.1) | 1,111 (7.6) | 1,171 (6.7) | 0.0013 |
| Urinary catheter | 4,496 (14.0) | 1,545 (10.6) | 2,951 (16.9) | <0.0001 |
| Aspirin | 12,865 (40.1) | 6,101 (41.8) | 6,764 (38.6) | <0.0001 |
| Clopidogrel | 4,575 (14.3) | 2,087 (14.3) | 2,488 (14.2) | 0.8050 |
| Non‐steroidal anti‐inflammatory drugs | 2,147 (6.7) | 867 (5.9) | 1,280 (7.3) | <0.0001 |
| Steroids | 7,938 (24.7) | 3,136 (21.5) | 4,802 (27.4) | <0.0001 |
| Statins | 7,376 (23.0) | 3,462 (23.7) | 3,914 (22.3) | 0.0035 |
| Comorbidities | ||||
| AIDS | 124 (0.4) | 73 (0.5) | 51 (0.3) | 0.0026 |
| Alcohol abuse | 1,048 (3.3) | 523 (3.6) | 525 (3.0) | 0.0032 |
| Deficiency anemia | 7,010 (21.8) | 3,228 (22.1) | 3,782 (21.6) | 0.2543 |
| Rheumatoid arthritis/collagen vas | 967 (3.0) | 426 (2.9) | 541 (3.1) | 0.3762 |
| Chronic blood loss anemia | 177 (0.6) | 79 (0.5) | 98 (0.6) | 0.8269 |
| Chronic pulmonary disease | 12,418 (38.7) | 5,314 (36.4) | 7,104 (40.6) | <0.0001 |
| Depression | 3,334 (10.4) | 1433 (9.8) | 1901 (10.9) | 0.0025 |
| Drug abuse | 694 (2.2) | 412 (2.8) | 282 (1.6) | <0.0001 |
| Hypertension | 16,979 (52.9) | 7,658 (52.5) | 9,321 (53.2) | 0.1866 |
| Hypothyroidism | 4,016 (12.5) | 1,716 (11.8) | 2,300 (13.1) | 0.0002 |
| Liver disease | 453 (1.4) | 227 (1.6) | 226 (1.3) | 0.0448 |
| Other neurological disorders | 4,682 (14.6) | 2,202 (15.1) | 2,480 (14.2) | 0.0187 |
| Peripheral vascular disease | 2,134 (6.6) | 980 (6.7) | 1,154 (6.6) | 0.6490 |
| Psychoses | 1,295 (4.0) | 574 (3.9) | 721 (4.1) | 0.4066 |
| Pulmonary circulation disease | 1,034 (3.2) | 442 (3.0) | 592 (3.4) | 0.0760 |
| Renal failure | 2,794 (8.7) | 1,636 (11.2) | 1,158 (6.6) | 0.0000 |
| Peptic ulcer disease with bleeding | 563 (1.8) | 232 (1.6) | 331 (1.9) | 0.0414 |
| Valvular disease | 2,079 (6.5) | 899 (6.2) | 1,180 (6.7) | 0.0366 |
| Weight loss | 1,231 (3.8) | 556 (3.8) | 675 (3.9) | 0.8391 |
| Other prophylaxis | ||||
| Intermittent pneumatic compression | 1,003 (3.1) | 456 (3.1) | 547 (3.1) | 0.9926 |
| Mechanical prophylaxis | 1,281 (4.0) | 524 (3.6) | 757 (4.3) | 0.0009 |
Fifty‐five percent of patients received LMWH and the remainder received UFH; 1274 (4%) patients switched type of heparin during their stay. The proportion of patients receiving LMWH at an individual hospital varied from 0% to 100% with a u‐shaped distribution, with almost one‐third of hospitals prescribing one treatment or the other exclusively (Figure 1). Similarly, the proportion of an individual physician's patients who received prophylaxis with UFH (vs LMWH) varied from 0% to 100% (Figure 1), with 51% prescribing LMWH exclusively and 31% prescribing UFH exclusively. Compared to patients who received UFH, patients receiving LMWH were older and were more likely to be white, female, and to have pneumonia. By far the biggest difference between the groups was the hospitals at which they received their care (see Supporting Information, e‐Table, in the online version of this article). Patients receiving LMWH were much more likely to be from smaller, rural, non‐teaching hospitals in the South or the West. There were also numerous small differences in comorbidities and individual VTE risk factors between the 2 groups. The only large difference was that patients with a secondary diagnosis of renal failure (for which LMWH is not US Food and Drug Administration [FDA] approved) were almost twice as likely to receive UFH.
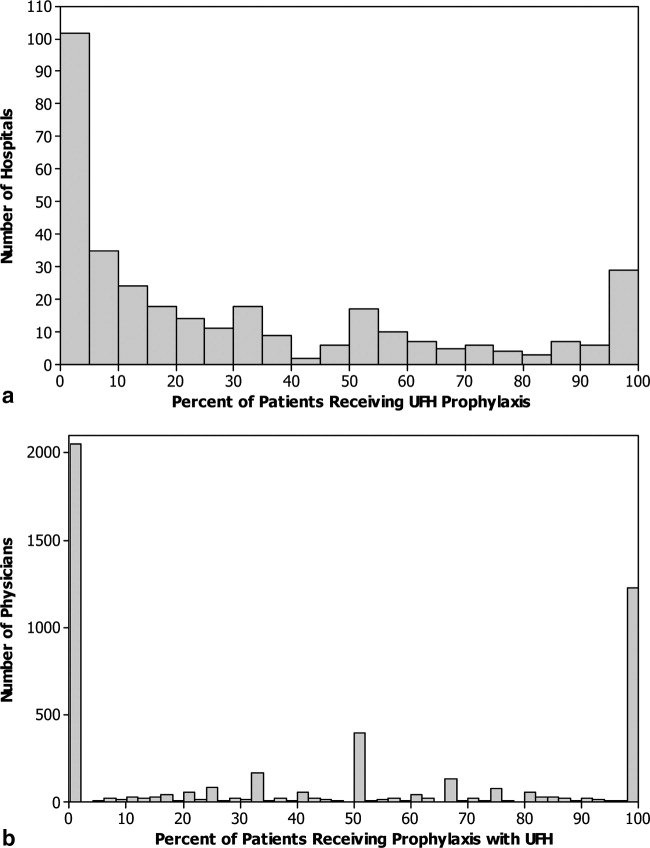
We identified 163 (0.51%) episodes of VTE (Table 2). Compared to patients receiving UFH, those receiving standard LMWH had similar unadjusted rates of VTE (0.53% vs 0.48%; P = 0.54), major bleeding (0.77% vs 0.76%; P = 0.88), thrombocytopenia (1.9% vs 2.0%; P = 0.48), definite HIT (n = 1 vs n = 3; P = 0.34), and mortality (2.8% vs 3.1%; P = 0.07). Definite complications of prophylaxis (HIT or major bleed combined with the discontinuation of heparin) were more common among patients receiving UFH (0.2% vs 0.1%; P = 0.022). Patients treated with UFH had longer unadjusted lengths of stay (P < 0.0001) and higher unadjusted costs (P < 0.0001).
| Total | UFH | LMWH | P | |
|---|---|---|---|---|
| 32,104 (100) | 14,591 (45.4) | 17,513 (54.6) | ||
| n (%) | n (%) | n (%) | ||
| ||||
| Venous thromboembolism | 163 (0.5) | 78 (0.5) | 85 (0.5) | 0.54 |
| Heparin‐induced thrombocytopenia | 4 (0) | 3 (0) | 1 (0) | 0.34* |
| Any major bleeding | 246 (0.8) | 113 (0.8) | 133 (0.8) | 0.88 |
| Transfusion with 2 units of packed red blood cells | 218 (0.7) | 97 (0.7) | 121 (0.7) | 0.78 |
| Intracranial hemorrhage | 30 (0.1) | 17 (0.1) | 13 (0.1) | 0.22 |
| Complication resulting in stopping heparin | 44 (0.1) | 28 (0.2) | 16 (0.1) | 0.02 |
| In‐hospital mortality | 944 (2.9) | 456 (3.1) | 488 (2.8) | 0.07 |
| LOS in days; mean (SD) | 6.2 (5.9) | 6.4 (6.2) | 6.0 (5.6) | <0.001 |
| Median (IQR) | 5 (37) | 5 (37) | 5 (37) | |
| Cost in USD; median (IQR) | 5873 (41718982) | 6007 (41779456) | 5774 (41658660) | <0.001 |
A propensity model for UFH treatment based upon patient characteristics and treatments was not strongly predictive of treatment (c = 0.58) and propensity matching failed to balance many of the patient characteristics. However, hospital alone, ignoring patient characteristics was strongly predictive (c = 0.91) of treatment.
In a model adjusting only for clustering within hospitals, patients treated with UFH had an odds ratio (OR) for VTE of 1.08 (95% confidence interval [CI] 0.79 to 1.49) compared to patients receiving LMWH (Figure 2). Adjustment for propensity for UFH and other covariates attenuated the effect of LMWH (OR 1.04, 95% CI 0.76 to 1.43). When individual patients were assigned a probability of treatment with UFH equal to the hospital rate where they received care, UFH use was associated with a nonsignificant change in the odds of VTE (OR 1.14, 95% CI 0.72 to 1.81).
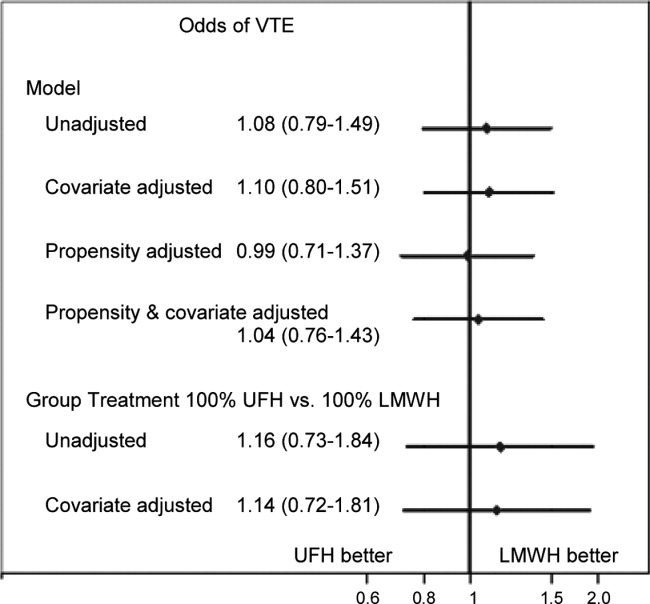
Adjusted for clustering within hospital only, patients treated with UFH had an odds ratio for major bleed of 1.38 (95% CI 1.00 to 1.91) compared to patients receiving LMWH (Figure 3). Adjustment for propensity for UFH and other covariates gave similar results (OR 1.34, 95% CI 0.97 to 1.84). When individual patients were assigned a probability of treatment with UFH equal to the hospital rate where they received care, UFH treatment was associated with a nonsignificant increase in the odds of major bleed (OR 1.64, 95% CI 0.50 to 5.33). When we compared the rate of transfusion across hospitals, including 576,231 additional patients who were excluded from the original analyses because they did not receive daily prophylaxis or had a diagnosis of myocardial infarction or COPD, there was a slight negative correlation between transfusion rates and use of UFH (Spearman Correlation Coefficient 0.03; P = 0.61). Hospitals that used primarily UFH had a transfusion rate of 0.60% versus 0.76% at hospitals using primarily LMWH (P = 0.54), indicating that the increased risk of major bleeding associated with UFH was not confounded by local transfusion practices.
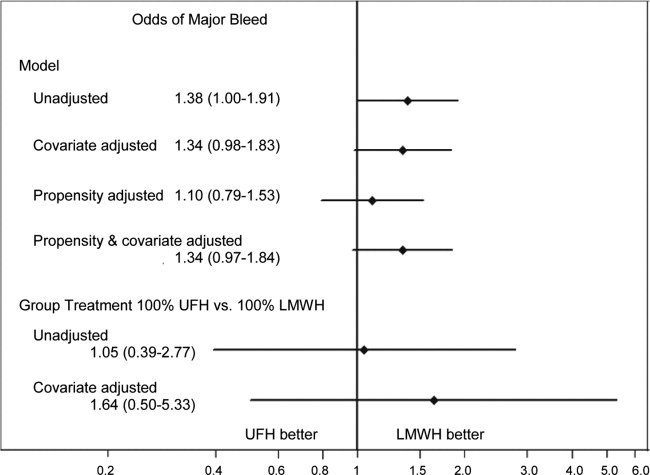
Adjusted for clustering only, patients treated with UFH had an odds ratio for definite complication of 2.35 (95% CI 1.17 to 4.72) compared to those treated with LMWH. Adjustment for propensity and covariates accentuated the association (OR 2.84, 95% CI 1.43 to 5.66). When assigned a probability of treatment with UFH equal to the hospital rate where they received care, UFH treatment was associated with an increase in the risk of definite complication (OR 2.79, 95% CI 1.00 to 7.74).
Adjusted for clustering only, patients treated with UFH had higher costs than those treated with LMWH (cost ratio 1.07, 95% CI 1.05 to 1.09). Adjustment for propensity for UFH and other covariates attenuated the association (cost ratio 1.02, 95% CI 1.00 to 1.03). Finally, when individual patients were assigned a probability of initial treatment with UFH equal to the hospital rate where they received care, treatment with UFH was associated with a nonsignificant change in the relative cost (cost ratio 0.97, 95% CI 0.90 to 1.05).
DISCUSSION
In this retrospective cohort study, we found that low‐molecular‐weight heparin and unfractionated heparin were associated with similar rates of VTE in moderate‐to‐high risk medical patients. However, unfractionated heparin was associated with a small, but higher risk of complications, even after adjustment. There were no statistical differences in rates of heparin‐induced thrombocytopenia, but this complication was exceedingly rare. Finally, overall costs associated with both treatments were similar.
A number of industry‐funded studies have compared LMWH to UFH in randomized clinical trials. These trials have generally been small and used endpoints of uncertain significance, such as asymptomatic deep vein thrombosis assessed by ultrasound. At least 3 meta‐analyses of these trials have been published. Each used different inclusion criteria. The only one to find an efficacy benefit to LMWH over UFH was heavily influenced by the inclusion of a number of studies of stroke patients.3 In that study, LMWH reduced VTE by approximately one‐third relative to UFH. The other 2 analyses found smaller reductions in DVT and pulmonary embolism (PE), and these results were not statistically significant.5, 8 Similarly, 1 analysis5 found a reduction in major bleeding events with LMWH versus UFH, whereas the other 2 studies found smaller reductions which were not statistically significant. The assessment of major bleeding is further complicated by differences in the definition of major bleeding across studies. Using a standard definition of 2 units of packed red blood cells transfused in 1 day to denote major bleeding, we found an associated reduction in bleeding with LMWH that was similar to that observed in the meta‐analyses. Moreover, patients receiving UFH were twice as likely to have a complication that resulted in stopping the prophylaxis, although these complications were overall quite rare. Lastly, there are no cost comparisons based on randomized trials. Several comparisons based on modeling have favored LMWH. One assumed that 3% of patients receiving UFH would develop HIT;13 something we did not observe. At least 3 additional analyses,1416 all funded by the manufacturer of enoxaparin, assumed that LMWH was both more effective and safer than UFH. We found that adjusted costs were similar or slightly lower with UFH than LMWH.
Our study has a number of limitations. First, its observational design makes it vulnerable to selection bias. We attempted to overcome this with rigorous multivariable adjustment, including the propensity for treatment and by using an adaptation of the instrumental variable approach. This method is of particular interest because individual hospitals were strongly predictive of choice of heparin. Still, we cannot exclude the possibility of residual confounding, especially if other outcomes, such as transfusion decisions, were also tied to specific hospital practices. Second, our study used administrative data, and therefore we could not directly adjust for certain differences which may exist between patients who received LMWH and those who received UFH. However, we did adjust for many classic risk factors for VTE. More importantly, it seems that the chance of being treated with a particular form of heparin depends more on the hospital where one receives care than on any combination of patient characteristics. Thus, apart from renal failure, for which we adjusted, it seems unlikely that there were major differences in unmeasured physiological confounders. Third, we limited our analysis to patients who received standard dosing of either type of heparin. We did this to bolster the validity of our findings, but they may not apply to unconventional dosing often observed in clinical practice. Fourth, we measured only outcomes that occurred in the hospital or that prompted a return to the hospital. VTEs which were diagnosed and treated in ambulatory care were not included. While this may have led us to underestimate the true risk of VTE, we have little reason to believe that the choice of whether to admit a patient with VTE is influenced by the original choice of VTE prophylaxis. Finally, our study was conducted before the introduction of generic LMWH, which would be expected to reduce costs associated with LMWH prophylaxis.
VTE prophylaxis for medical patients has emerged as a major focus for quality improvement initiatives. As a result, a significant proportion of general medical patients receive some form of chemoprophylaxis during their hospital stay. Small differences in efficacy or safety of different forms of prophylaxis multiplied by millions of admissions each year can have profound effects on the health of hospitalized patients. Similarly, differences in cost could also have a substantial impact on the healthcare system. We found no difference in efficacy or cost, but treatment with LMWH was less likely to be associated with subsequent transfusion of 2 or more units of packed red blood cells, a surrogate marker for bleeding. In addition, LMWH is more convenient since it can be dosed once daily, and for that reason may be more acceptable to patients. For these reasons, LMWH may be the drug of choice for inpatient prophylaxis of general medical patients. In situations where the cost of the medication itself is important, UFH represents an equally effective alternative.
Acknowledgements
All authors have contributed sufficiently to this study and have provided written permission to be named in the manuscript. No other persons have made substantial contributions to this manuscript. Michael B. Rothberg is the guarantor of the entire manuscript.
Disclosures: This study was supported by a Clinical Scientist Development Award from the Doris Duke Charitable Foundation. The funding source had no role in the study design, analysis, or interpretation of the data. Dr Rothberg served for 1 day as a consultant to Novartis Pharma about an influenza vaccine model. Sandoz, a division of Novartis, was recently granted approval to manufacture a generic form of low‐molecular‐weight heparin. None of the other authors have any conflicts of interest.
- ,,, et al.A comparison of enoxaparin with placebo for the prevention of venous thromboembolism in acutely ill medical patients. Prophylaxis in Medical Patients with Enoxaparin Study Group.N Engl J Med.1999;341:793–800.
- ,,, et al.Prevention of venous thromboembolism: American College of Chest Physicians Evidence‐Based Clinical Practice Guidelines (8th Edition).Chest.2008;133:381S–453S.
- ,,,,.Pharmacological venous thromboembolism prophylaxis in hospitalized medical patients: a meta‐analysis of randomized controlled trials.Arch Intern Med.2007;167:1476–1486.
- ,,,,.Meta‐analysis: anticoagulant prophylaxis to prevent symptomatic venous thromboembolism in hospitalized medical patients.Ann Intern Med.2007;146:278–288.
- ,,, et al.Prevention of venous thromboembolism in internal medicine with unfractionated or low‐molecular‐weight heparins: a meta‐analysis of randomised clinical trials.Thromb Haemost.2000;83:14–19.
- ,,.Risk for heparin‐induced thrombocytopenia with unfractionated and low‐molecular‐weight heparin thromboprophylaxis: a meta‐analysis.Blood.2005;106:2710–2715.
- ,.A safety analysis of thromboprophylaxis in acute medical illness.Thromb Haemost.2003;89:590–591.
- ,,,,.How complete is the evidence for thromboembolism prophylaxis in general medicine patients? A meta‐analysis of randomized controlled trials.J Hosp Med.2009;4:289–297.
- The Joint Commission on the Accreditation of Healthcare Organizations. Venous Thromboembolism (VTE) Core Measure Set. Available at: http://www.jointcommission.org/PerformanceMeasurement/PerformanceMeasurement/VTE.htm. Accessed June 1,2009.
- ,,, et al.Potentially inappropriate medication use in hospitalized elders.J Hosp Med.2008;3:91–102.
- ,,,.Comorbidity measures for use with administrative data.Med Care.1998;36:8–27.
- ,,,,,.Identification of in‐hospital complications from claims data. Is it valid?Med Care.2000;38:785–795.
- ,,,.Cost utility of substituting enoxaparin for unfractionated heparin for prophylaxis of venous thrombosis in the hospitalized medical patient.J Hosp Med.2006;1:168–176.
- ,,,.Cost effectiveness of thromboprophylaxis with a low‐molecular‐weight heparin versus unfractionated heparin in acutely ill medical inpatients.Am J Manag Care.2004;10:632–642.
- ,,,.Comparison of the two‐year outcomes and costs of prophylaxis in medical patients at risk of venous thromboembolism.Thromb Haemost.2008;100:810–820.
- ,,, et al.Cost effectiveness of enoxaparin as prophylaxis against venous thromboembolic complications in acutely ill medical inpatients: modelling study from the hospital perspective in Germany.Pharmacoeconomics.2006;24:571–591.
Venous thromboembolism (VTE) is a major source of morbidity and mortality for hospitalized patients, with as many as 16% of high‐risk medical patients developing VTE during their hospital stay.1, 2 Pharmacologic prophylaxis with subcutaneous heparin reduces the risk of VTE by approximately 50%,3, 4 and guidelines produced by the American College of Chest Physicians (ACCP) recommend thromboprophylaxis for patients at moderate‐to‐high risk of VTE with either low‐molecular‐weight heparin (LMWH) or unfractionated heparin (UFH).2 UFH is less expensive per dose, but meta‐analyses have suggested that UFH may be either less effective than LMWH3 or more likely to cause complications, such as bleeding5 or heparin‐induced thrombocytopenia (HIT).6 Others have argued that the efficacy and risk of bleeding with UFH and LMWH are similar.7, 8 In either case, there are few head‐to‐head studies of LMWH and UFH in medical patients and they tend to be small. In the most recent meta‐analysis, which included fewer than 4500 patients, several different low‐molecular‐weight heparins were assessed together, and the observed rate of deep vein thrombosis (DVT) with UFH was high (5.4%), with evidence suggesting publication bias.3
Given the current Joint Commission requirement9 that all medical patients either receive VTE prophylaxis or have documented a reason not to, the implications related to choosing one form of VTE prophylaxis over another are substantial on a national scale. In order to compare the effectiveness of UFH and LMWH in routine practice among hospitalized medical patients, we conducted a retrospective cohort study in a national sample of hospitals and compared the risk of VTE, bleeding, HIT, and death associated with each treatment.
METHODS
Setting and Patients
We conducted a retrospective cohort study of patients discharged between January 1, 2004 and June 30, 2005 from 333 acute care facilities in the United States that participated in Premier's Perspective, a database we have described previously.10 Compared to US hospitals as a whole, Perspective hospitals are more likely to be located in the South and in urban areas. Perspective contains the following data elements: sociodemographic information, International Classification of Diseases, Ninth Revision, Clinical Modification (ICD‐9‐CM) diagnosis and procedure codes, as well as a list of all billed items with a date of service, including diagnostic tests, medications, and other treatments. Hospitals' characteristics include size, region, setting, and teaching status. The Institutional Review Board at Baystate Medical Center granted permission to conduct the study (#132280‐1).
We included general medical patients aged 18 years whose ICD‐9‐CM primary diagnosis code (congestive heart failure, stroke, pneumonia, and urinary tract infection) placed them at moderate‐to‐high risk of VTE according to the ACCP recommendations,2 and who received daily prophylactic dosages of either LMWH (40 mg daily) or UFH (10,00015,000 units daily) initiated by hospital day 2 and continued to discharge or until the patient developed a VTE or a complication attributable to heparin. Patients were included so long as they missed no more than 1 day of prophylaxis or had no more than 1 unusual dose recorded. Patients who switched between heparin types were included and analyzed according to their initial therapy. Patients who received any other regimen were excluded. We also excluded patients who received warfarin on hospital day 1 or 2, because they would not be considered candidates for heparin prophylaxis, and patients whose length of stay was 2 days, because the value of VTE prophylaxis in such cases is unknown.
Data Elements
For each patient, we extracted age, gender, race, and insurance status, principal diagnosis, comorbidities, and specialty of the attending physician. Comorbidities were identified from ICD‐9‐CM secondary diagnosis codes and Diagnosis Related Groups using Healthcare Cost and Utilization Project Comorbidity Software, version 3.1, based on the work of Elixhauser and colleagues.11 We also identified additional risk factors for VTE using a combination of ICD‐9‐CM codes and specific charges. These included cancer, chemotherapy/radiation, prior VTE, use of estrogens and estrogen modulators, inflammatory bowel disease, nephrotic syndrome, myeloproliferative disorders, smoking, central venous catheter, inherited or acquired thrombophilia, mechanical ventilation, urinary catheter, decubitus ulcer, 3‐hydroxy‐3‐methylglutaryl coenzyme A (HMG‐CoA) reductase inhibitors, restraints, and varicose veins. Hospitals were categorized by region (Northeast, South, Midwest, or West), bed size, setting (urban vs rural), and teaching status.
Outcome Variables
We defined hospital‐acquired VTE as a secondary diagnosis of VTE (ICD‐9‐CM diagnoses 453.4, 453.40, 453.41, 453.42, 453.8, 453.9, 415.1, 415.11, 415.19), combined with a diagnostic test for VTE (lower extremity ultrasound, venography, computed tomography (CT) angiogram, ventilation‐perfusion scan, or pulmonary angiogram) after hospital day 2, followed by treatment for VTE (intravenous unfractionated heparin, >60 mg of enoxaparin, 7500 mg of dalteparin, or placement of an inferior vena cava filter) for at least 50% of the remaining hospital days or until initiation of warfarin or appearance of a complication (eg, transfusion or treatment for heparin‐induced thrombocytopenia). We chose this definition to differentiate hospital‐acquired VTE from VTE present on admission.12 In addition, patients who were readmitted within 30 days of discharge with a primary diagnosis of VTE were also considered to have hospital‐acquired VTE.
We also assessed complications of VTE prophylaxis. Major bleeding was defined as the receipt of 2 or more units of packed red blood cells on a single day or a secondary diagnosis of intracranial bleeding. Because there was no ICD‐9‐CM code for HIT, we assessed codes for all thrombocytopenia, as well as secondary thrombocytopenia. Definite HIT was defined as an ICD‐9‐CM code for thrombocytopenia, together with discontinuation of heparin and initiation of treatment with argatroban. A definite complication was defined as HIT or evidence of major bleeding coupled with discontinuation of heparin. Finally, we evaluated all‐cause in‐hospital mortality and total hospital costs.
Statistical Analysis
We computed summary statistics using frequencies and percents for categorical variables, and means, medians, and standard deviations and interquartile range for continuous variables. Associations of prophylaxis type with patient and hospital characteristics and outcomes were assessed using chi‐square tests or Fisher's exact test for categorical variables, and z‐tests or Wilcoxon tests for continuous variables.
We developed a propensity model for treatment with UFH as the outcome; the model included patient characteristics, early treatments, comorbidities, risk factors for VTE, physician specialty, and selected interaction terms. We then developed a series of multivariable models to evaluate the impact of heparin choice on the risk of VTE, complications of treatment, mortality, and total cost. Generalized estimating equation models with a logit link were used to assess the association between the choice of heparin and the risk of VTE, and of complications and mortality, while adjusting for the effects of within‐hospital correlation; identity link models were used for analyses of cost. Costs were trimmed at 3 standard deviations above the mean, and natural log‐transformed values were modeled due to extreme positive skew.
Unadjusted and covariate‐adjusted models were evaluated with and without adjustments for propensity score. In addition, since the hospital was the single strongest predictor of treatment, we developed grouped treatment models, in which a patient's actual treatment was replaced by a probability equal to the proportion of prophylaxed patients receiving UFH at that hospital. This adaptation of instrumental variable analysis uses the hospital as the instrument, and attempts to assess whether patients treated at a hospital which uses UFH more frequently have outcomes that differ from those of patients treated at hospitals which use LMWH more frequently, while adjusting for other patient, physician, and hospital variables. By relying on treatment at the hospital level, this method reduces the opportunity for selection bias at the patient level.
Finally, in order to exclude the possibility that our surrogate bleeding outcome was due to transfusion practices at hospitals that use a particular form of heparin, we compared the hospital rates of transfusion of 2 or more units of packed red cells to the hospital rates of prophylaxis with UFH in a larger dataset of the same hospitals. This set included patients with congestive heart failure, stroke, pneumonia, and urinary tract infection who did not receive daily prophylaxis, as well as patients admitted for chronic obstructive pulmonary disease (COPD) or acute myocardial infarction, and patients who received either warfarin or a treatment dose of heparin in the first 2 hospital days. We also compared the transfusion rates at hospitals that used unfractionated heparin in 80% of patients to hospitals that used LMWH in 80%. All analyses were performed using SAS version 9.1 (SAS Institute Inc, Cary, NC).
RESULTS
Our final sample included 32,104 patients who received prophylaxis at 333 hospitals (see Supporting Information, e‐Figure, in the online version of this article). Patient characteristics appear in Table 1. Most patients (66%) were over age 65; 59% were female and 61% were white. The most common primary diagnoses were pneumonia (40%) and congestive heart failure (25%). Additional risk factors for thromboembolism included cancer (13%), paralysis (8%), or diabetes (35%). Most patients' attending physicians were either internists (61%) or family practitioners (14%). Almost half of the patients were cared for at hospitals in the South (46%).
| Total | UFH | LMWH | ||
|---|---|---|---|---|
| 32,104 (100) | 14,591 (45.4) | 17,513 (54.6) | ||
| N (%) | N (%) | N (%) | P | |
| ||||
| Demographics | ||||
| Age | 0.0002 | |||
| 1849 | 4,061 (12.7) | 1,950 (13.4) | 2,111 (12.1) | |
| 5064 | 6,962 (21.7) | 3,225 (22.1) | 3,737 (21.3) | |
| 6579 | 10,909 (34.0) | 4,921 (33.7) | 5,988 (34.2) | |
| 80+ | 10,172 (31.7) | 4,495 (30.8) | 5,677 (32.4) | |
| Sex | 0.0071 | |||
| Male | 13,234 (41.2) | 6,133 (42.0) | 7,101 (40.5) | |
| Female | 18,870 (58.8) | 8,458 (58.0) | 10,412 (59.5) | |
| Race/ethnicity | <0.0001 | |||
| White | 19,489 (60.7) | 8,063 (55.3) | 11,426 (65.2) | |
| Black | 7,429 (23.1) | 4,101 (28.1) | 3,328 (19.0) | |
| Hispanic | 1,304 (4.1) | 591 (4.1) | 713 (4.1) | |
| Other | 3,882 (12.1) | 1,836 (12.6) | 2,046 (11.7) | |
| Primary diagnosis | <0.0001 | |||
| Pneumonia | 12,768 (39.8) | 5,354 (36.7) | 7,414 (42.3) | |
| Sepsis* | 1,217 (3.8) | 562 (3.9) | 655 (3.7) | |
| Respiratory failure* | 2,017 (6.3) | 814 (5.6) | 1,203 (6.9) | |
| Heart failure | 8,157 (25.4) | 3,825 (26.2) | 4,332 (24.7) | |
| Stroke | 4,416 (13.8) | 2,295 (15.7) | 2,121 (12.1) | |
| Urinary tract infection | 3,529 (11.0) | 1,741 (11.9) | 1,788 (10.2) | |
| Attending specialty | <0.0001 | |||
| Internist | 19,511 (60.8) | 8,945 (61.3) | 10,566 (60.3) | |
| General practice/Family medicine | 4,326 (13.5) | 1,964 (13.5) | 2,362 (13.5) | |
| Cardiologist | 1,606 (5.0) | 730 (5.0) | 876 (5.0) | |
| Pulmonologist | 2,179 (6.8) | 854 (5.9) | 1,325 (7.6) | |
| Nephrology | 583 (1.8) | 380 (2.6) | 203 (1.2) | |
| Critical care/Intensivist | 150 (0.5) | 93 (0.6) | 57 (0.3) | |
| Other | 3,749 (11.7) | 1,625 (11.1) | 2,124 (12.1) | |
| Insurance | <0.0001 | |||
| Medicare traditional | 20,281 (63.2) | 8,929 (61.2) | 11,352 (64.8) | |
| Medicare managed care | 1,737 (5.4) | 826 (5.7) | 911 (5.2) | |
| Medicaid | 2,629 (8.2) | 1,401 (9.6) | 1,228 (7.0) | |
| Private | 5,967 (18.6) | 2,830 (19.4) | 3,137 (17.9) | |
| Self‐pay/uninsured/other | 1,490 (4.6) | 605 (4.1) | 885 (5.1) | |
| Risk factors for VTE | ||||
| Admit from skilled nursing facility | 476 (1.5) | 277 (1.9) | 199 (1.1) | <0.0001 |
| Paralysis | 2,608 (8.1) | 1,317 (9.0) | 1,291 (7.4) | <0.0001 |
| Restraints | 417 (1.3) | 147 (1.0) | 270 (1.5) | <0.0001 |
| Decubitus ulcer | 1,190 (3.7) | 631 (4.3) | 559 (3.2) | <0.0001 |
| Cancer | 4,154 (12.9) | 1,858 (12.7) | 2,296 (13.1) | 0.3171 |
| Chemotherapy | 86 (0.3) | 41 (0.3) | 45 (0.3) | 0.6781 |
| Prior venous thromboembolism | 494 (1.5) | 202 (1.4) | 292 (1.7) | 0.0403 |
| Pregnancy | 1 (0) | 1 (0) | 0 (0) | 0.2733 |
| Estrogens | 438 (1.4) | 143 (1.0) | 295 (1.7) | <0.0001 |
| Estrogen modulators | 246 (0.8) | 80 (0.5) | 166 (0.9) | <0.0001 |
| Congestive heart failure | 3,107 (9.7) | 1,438 (9.9) | 1,669 (9.5) | 0.3263 |
| Respiratory failure | 2,210 (6.9) | 1,037 (7.1) | 1,173 (6.7) | 0.1493 |
| Inflammatory bowel disease | 108 (0.3) | 41 (0.3) | 67 (0.4) | 0.1176 |
| Nephrotic syndrome | 92 (0.3) | 50 (0.3) | 42 (0.2) | 0.0860 |
| Myeloproliferative disorder | 198 (0.6) | 68 (0.5) | 130 (0.7) | 0.0016 |
| Obesity | 2,973 (9.3) | 1,211 (8.3) | 1,762 (10.1) | <0.0001 |
| Smoking | 4,476 (13.9) | 1,887 (12.9) | 2,589 (14.8) | <0.0001 |
| Varicose veins | 19 (0.1) | 6 (0) | 13 (0.1) | 0.2245 |
| Central line | 1,070 (3.3) | 502 (3.4) | 568 (3.2) | 0.3271 |
| Inherited or acquired thrombophilia | 16 (0) | 9 (0.1) | 7 (0) | 0.3855 |
| Diabetes | 11,136 (34.7) | 5,157 (35.3) | 5,979 (34.1) | 0.0241 |
| Procedures associated with VTE or bleed | ||||
| Mechanical ventilation | 2,282 (7.1) | 1,111 (7.6) | 1,171 (6.7) | 0.0013 |
| Urinary catheter | 4,496 (14.0) | 1,545 (10.6) | 2,951 (16.9) | <0.0001 |
| Aspirin | 12,865 (40.1) | 6,101 (41.8) | 6,764 (38.6) | <0.0001 |
| Clopidogrel | 4,575 (14.3) | 2,087 (14.3) | 2,488 (14.2) | 0.8050 |
| Non‐steroidal anti‐inflammatory drugs | 2,147 (6.7) | 867 (5.9) | 1,280 (7.3) | <0.0001 |
| Steroids | 7,938 (24.7) | 3,136 (21.5) | 4,802 (27.4) | <0.0001 |
| Statins | 7,376 (23.0) | 3,462 (23.7) | 3,914 (22.3) | 0.0035 |
| Comorbidities | ||||
| AIDS | 124 (0.4) | 73 (0.5) | 51 (0.3) | 0.0026 |
| Alcohol abuse | 1,048 (3.3) | 523 (3.6) | 525 (3.0) | 0.0032 |
| Deficiency anemia | 7,010 (21.8) | 3,228 (22.1) | 3,782 (21.6) | 0.2543 |
| Rheumatoid arthritis/collagen vas | 967 (3.0) | 426 (2.9) | 541 (3.1) | 0.3762 |
| Chronic blood loss anemia | 177 (0.6) | 79 (0.5) | 98 (0.6) | 0.8269 |
| Chronic pulmonary disease | 12,418 (38.7) | 5,314 (36.4) | 7,104 (40.6) | <0.0001 |
| Depression | 3,334 (10.4) | 1433 (9.8) | 1901 (10.9) | 0.0025 |
| Drug abuse | 694 (2.2) | 412 (2.8) | 282 (1.6) | <0.0001 |
| Hypertension | 16,979 (52.9) | 7,658 (52.5) | 9,321 (53.2) | 0.1866 |
| Hypothyroidism | 4,016 (12.5) | 1,716 (11.8) | 2,300 (13.1) | 0.0002 |
| Liver disease | 453 (1.4) | 227 (1.6) | 226 (1.3) | 0.0448 |
| Other neurological disorders | 4,682 (14.6) | 2,202 (15.1) | 2,480 (14.2) | 0.0187 |
| Peripheral vascular disease | 2,134 (6.6) | 980 (6.7) | 1,154 (6.6) | 0.6490 |
| Psychoses | 1,295 (4.0) | 574 (3.9) | 721 (4.1) | 0.4066 |
| Pulmonary circulation disease | 1,034 (3.2) | 442 (3.0) | 592 (3.4) | 0.0760 |
| Renal failure | 2,794 (8.7) | 1,636 (11.2) | 1,158 (6.6) | 0.0000 |
| Peptic ulcer disease with bleeding | 563 (1.8) | 232 (1.6) | 331 (1.9) | 0.0414 |
| Valvular disease | 2,079 (6.5) | 899 (6.2) | 1,180 (6.7) | 0.0366 |
| Weight loss | 1,231 (3.8) | 556 (3.8) | 675 (3.9) | 0.8391 |
| Other prophylaxis | ||||
| Intermittent pneumatic compression | 1,003 (3.1) | 456 (3.1) | 547 (3.1) | 0.9926 |
| Mechanical prophylaxis | 1,281 (4.0) | 524 (3.6) | 757 (4.3) | 0.0009 |
Fifty‐five percent of patients received LMWH and the remainder received UFH; 1274 (4%) patients switched type of heparin during their stay. The proportion of patients receiving LMWH at an individual hospital varied from 0% to 100% with a u‐shaped distribution, with almost one‐third of hospitals prescribing one treatment or the other exclusively (Figure 1). Similarly, the proportion of an individual physician's patients who received prophylaxis with UFH (vs LMWH) varied from 0% to 100% (Figure 1), with 51% prescribing LMWH exclusively and 31% prescribing UFH exclusively. Compared to patients who received UFH, patients receiving LMWH were older and were more likely to be white, female, and to have pneumonia. By far the biggest difference between the groups was the hospitals at which they received their care (see Supporting Information, e‐Table, in the online version of this article). Patients receiving LMWH were much more likely to be from smaller, rural, non‐teaching hospitals in the South or the West. There were also numerous small differences in comorbidities and individual VTE risk factors between the 2 groups. The only large difference was that patients with a secondary diagnosis of renal failure (for which LMWH is not US Food and Drug Administration [FDA] approved) were almost twice as likely to receive UFH.
We identified 163 (0.51%) episodes of VTE (Table 2). Compared to patients receiving UFH, those receiving standard LMWH had similar unadjusted rates of VTE (0.53% vs 0.48%; P = 0.54), major bleeding (0.77% vs 0.76%; P = 0.88), thrombocytopenia (1.9% vs 2.0%; P = 0.48), definite HIT (n = 1 vs n = 3; P = 0.34), and mortality (2.8% vs 3.1%; P = 0.07). Definite complications of prophylaxis (HIT or major bleed combined with the discontinuation of heparin) were more common among patients receiving UFH (0.2% vs 0.1%; P = 0.022). Patients treated with UFH had longer unadjusted lengths of stay (P < 0.0001) and higher unadjusted costs (P < 0.0001).
| Total | UFH | LMWH | P | |
|---|---|---|---|---|
| 32,104 (100) | 14,591 (45.4) | 17,513 (54.6) | ||
| n (%) | n (%) | n (%) | ||
| ||||
| Venous thromboembolism | 163 (0.5) | 78 (0.5) | 85 (0.5) | 0.54 |
| Heparin‐induced thrombocytopenia | 4 (0) | 3 (0) | 1 (0) | 0.34* |
| Any major bleeding | 246 (0.8) | 113 (0.8) | 133 (0.8) | 0.88 |
| Transfusion with 2 units of packed red blood cells | 218 (0.7) | 97 (0.7) | 121 (0.7) | 0.78 |
| Intracranial hemorrhage | 30 (0.1) | 17 (0.1) | 13 (0.1) | 0.22 |
| Complication resulting in stopping heparin | 44 (0.1) | 28 (0.2) | 16 (0.1) | 0.02 |
| In‐hospital mortality | 944 (2.9) | 456 (3.1) | 488 (2.8) | 0.07 |
| LOS in days; mean (SD) | 6.2 (5.9) | 6.4 (6.2) | 6.0 (5.6) | <0.001 |
| Median (IQR) | 5 (37) | 5 (37) | 5 (37) | |
| Cost in USD; median (IQR) | 5873 (41718982) | 6007 (41779456) | 5774 (41658660) | <0.001 |
A propensity model for UFH treatment based upon patient characteristics and treatments was not strongly predictive of treatment (c = 0.58) and propensity matching failed to balance many of the patient characteristics. However, hospital alone, ignoring patient characteristics was strongly predictive (c = 0.91) of treatment.
In a model adjusting only for clustering within hospitals, patients treated with UFH had an odds ratio (OR) for VTE of 1.08 (95% confidence interval [CI] 0.79 to 1.49) compared to patients receiving LMWH (Figure 2). Adjustment for propensity for UFH and other covariates attenuated the effect of LMWH (OR 1.04, 95% CI 0.76 to 1.43). When individual patients were assigned a probability of treatment with UFH equal to the hospital rate where they received care, UFH use was associated with a nonsignificant change in the odds of VTE (OR 1.14, 95% CI 0.72 to 1.81).
Adjusted for clustering within hospital only, patients treated with UFH had an odds ratio for major bleed of 1.38 (95% CI 1.00 to 1.91) compared to patients receiving LMWH (Figure 3). Adjustment for propensity for UFH and other covariates gave similar results (OR 1.34, 95% CI 0.97 to 1.84). When individual patients were assigned a probability of treatment with UFH equal to the hospital rate where they received care, UFH treatment was associated with a nonsignificant increase in the odds of major bleed (OR 1.64, 95% CI 0.50 to 5.33). When we compared the rate of transfusion across hospitals, including 576,231 additional patients who were excluded from the original analyses because they did not receive daily prophylaxis or had a diagnosis of myocardial infarction or COPD, there was a slight negative correlation between transfusion rates and use of UFH (Spearman Correlation Coefficient 0.03; P = 0.61). Hospitals that used primarily UFH had a transfusion rate of 0.60% versus 0.76% at hospitals using primarily LMWH (P = 0.54), indicating that the increased risk of major bleeding associated with UFH was not confounded by local transfusion practices.
Adjusted for clustering only, patients treated with UFH had an odds ratio for definite complication of 2.35 (95% CI 1.17 to 4.72) compared to those treated with LMWH. Adjustment for propensity and covariates accentuated the association (OR 2.84, 95% CI 1.43 to 5.66). When assigned a probability of treatment with UFH equal to the hospital rate where they received care, UFH treatment was associated with an increase in the risk of definite complication (OR 2.79, 95% CI 1.00 to 7.74).
Adjusted for clustering only, patients treated with UFH had higher costs than those treated with LMWH (cost ratio 1.07, 95% CI 1.05 to 1.09). Adjustment for propensity for UFH and other covariates attenuated the association (cost ratio 1.02, 95% CI 1.00 to 1.03). Finally, when individual patients were assigned a probability of initial treatment with UFH equal to the hospital rate where they received care, treatment with UFH was associated with a nonsignificant change in the relative cost (cost ratio 0.97, 95% CI 0.90 to 1.05).
DISCUSSION
In this retrospective cohort study, we found that low‐molecular‐weight heparin and unfractionated heparin were associated with similar rates of VTE in moderate‐to‐high risk medical patients. However, unfractionated heparin was associated with a small, but higher risk of complications, even after adjustment. There were no statistical differences in rates of heparin‐induced thrombocytopenia, but this complication was exceedingly rare. Finally, overall costs associated with both treatments were similar.
A number of industry‐funded studies have compared LMWH to UFH in randomized clinical trials. These trials have generally been small and used endpoints of uncertain significance, such as asymptomatic deep vein thrombosis assessed by ultrasound. At least 3 meta‐analyses of these trials have been published. Each used different inclusion criteria. The only one to find an efficacy benefit to LMWH over UFH was heavily influenced by the inclusion of a number of studies of stroke patients.3 In that study, LMWH reduced VTE by approximately one‐third relative to UFH. The other 2 analyses found smaller reductions in DVT and pulmonary embolism (PE), and these results were not statistically significant.5, 8 Similarly, 1 analysis5 found a reduction in major bleeding events with LMWH versus UFH, whereas the other 2 studies found smaller reductions which were not statistically significant. The assessment of major bleeding is further complicated by differences in the definition of major bleeding across studies. Using a standard definition of 2 units of packed red blood cells transfused in 1 day to denote major bleeding, we found an associated reduction in bleeding with LMWH that was similar to that observed in the meta‐analyses. Moreover, patients receiving UFH were twice as likely to have a complication that resulted in stopping the prophylaxis, although these complications were overall quite rare. Lastly, there are no cost comparisons based on randomized trials. Several comparisons based on modeling have favored LMWH. One assumed that 3% of patients receiving UFH would develop HIT;13 something we did not observe. At least 3 additional analyses,1416 all funded by the manufacturer of enoxaparin, assumed that LMWH was both more effective and safer than UFH. We found that adjusted costs were similar or slightly lower with UFH than LMWH.
Our study has a number of limitations. First, its observational design makes it vulnerable to selection bias. We attempted to overcome this with rigorous multivariable adjustment, including the propensity for treatment and by using an adaptation of the instrumental variable approach. This method is of particular interest because individual hospitals were strongly predictive of choice of heparin. Still, we cannot exclude the possibility of residual confounding, especially if other outcomes, such as transfusion decisions, were also tied to specific hospital practices. Second, our study used administrative data, and therefore we could not directly adjust for certain differences which may exist between patients who received LMWH and those who received UFH. However, we did adjust for many classic risk factors for VTE. More importantly, it seems that the chance of being treated with a particular form of heparin depends more on the hospital where one receives care than on any combination of patient characteristics. Thus, apart from renal failure, for which we adjusted, it seems unlikely that there were major differences in unmeasured physiological confounders. Third, we limited our analysis to patients who received standard dosing of either type of heparin. We did this to bolster the validity of our findings, but they may not apply to unconventional dosing often observed in clinical practice. Fourth, we measured only outcomes that occurred in the hospital or that prompted a return to the hospital. VTEs which were diagnosed and treated in ambulatory care were not included. While this may have led us to underestimate the true risk of VTE, we have little reason to believe that the choice of whether to admit a patient with VTE is influenced by the original choice of VTE prophylaxis. Finally, our study was conducted before the introduction of generic LMWH, which would be expected to reduce costs associated with LMWH prophylaxis.
VTE prophylaxis for medical patients has emerged as a major focus for quality improvement initiatives. As a result, a significant proportion of general medical patients receive some form of chemoprophylaxis during their hospital stay. Small differences in efficacy or safety of different forms of prophylaxis multiplied by millions of admissions each year can have profound effects on the health of hospitalized patients. Similarly, differences in cost could also have a substantial impact on the healthcare system. We found no difference in efficacy or cost, but treatment with LMWH was less likely to be associated with subsequent transfusion of 2 or more units of packed red blood cells, a surrogate marker for bleeding. In addition, LMWH is more convenient since it can be dosed once daily, and for that reason may be more acceptable to patients. For these reasons, LMWH may be the drug of choice for inpatient prophylaxis of general medical patients. In situations where the cost of the medication itself is important, UFH represents an equally effective alternative.
Acknowledgements
All authors have contributed sufficiently to this study and have provided written permission to be named in the manuscript. No other persons have made substantial contributions to this manuscript. Michael B. Rothberg is the guarantor of the entire manuscript.
Disclosures: This study was supported by a Clinical Scientist Development Award from the Doris Duke Charitable Foundation. The funding source had no role in the study design, analysis, or interpretation of the data. Dr Rothberg served for 1 day as a consultant to Novartis Pharma about an influenza vaccine model. Sandoz, a division of Novartis, was recently granted approval to manufacture a generic form of low‐molecular‐weight heparin. None of the other authors have any conflicts of interest.
- ,,, et al.A comparison of enoxaparin with placebo for the prevention of venous thromboembolism in acutely ill medical patients. Prophylaxis in Medical Patients with Enoxaparin Study Group.N Engl J Med.1999;341:793–800.
- ,,, et al.Prevention of venous thromboembolism: American College of Chest Physicians Evidence‐Based Clinical Practice Guidelines (8th Edition).Chest.2008;133:381S–453S.
- ,,,,.Pharmacological venous thromboembolism prophylaxis in hospitalized medical patients: a meta‐analysis of randomized controlled trials.Arch Intern Med.2007;167:1476–1486.
- ,,,,.Meta‐analysis: anticoagulant prophylaxis to prevent symptomatic venous thromboembolism in hospitalized medical patients.Ann Intern Med.2007;146:278–288.
- ,,, et al.Prevention of venous thromboembolism in internal medicine with unfractionated or low‐molecular‐weight heparins: a meta‐analysis of randomised clinical trials.Thromb Haemost.2000;83:14–19.
- ,,.Risk for heparin‐induced thrombocytopenia with unfractionated and low‐molecular‐weight heparin thromboprophylaxis: a meta‐analysis.Blood.2005;106:2710–2715.
- ,.A safety analysis of thromboprophylaxis in acute medical illness.Thromb Haemost.2003;89:590–591.
- ,,,,.How complete is the evidence for thromboembolism prophylaxis in general medicine patients? A meta‐analysis of randomized controlled trials.J Hosp Med.2009;4:289–297.
- The Joint Commission on the Accreditation of Healthcare Organizations. Venous Thromboembolism (VTE) Core Measure Set. Available at: http://www.jointcommission.org/PerformanceMeasurement/PerformanceMeasurement/VTE.htm. Accessed June 1,2009.
- ,,, et al.Potentially inappropriate medication use in hospitalized elders.J Hosp Med.2008;3:91–102.
- ,,,.Comorbidity measures for use with administrative data.Med Care.1998;36:8–27.
- ,,,,,.Identification of in‐hospital complications from claims data. Is it valid?Med Care.2000;38:785–795.
- ,,,.Cost utility of substituting enoxaparin for unfractionated heparin for prophylaxis of venous thrombosis in the hospitalized medical patient.J Hosp Med.2006;1:168–176.
- ,,,.Cost effectiveness of thromboprophylaxis with a low‐molecular‐weight heparin versus unfractionated heparin in acutely ill medical inpatients.Am J Manag Care.2004;10:632–642.
- ,,,.Comparison of the two‐year outcomes and costs of prophylaxis in medical patients at risk of venous thromboembolism.Thromb Haemost.2008;100:810–820.
- ,,, et al.Cost effectiveness of enoxaparin as prophylaxis against venous thromboembolic complications in acutely ill medical inpatients: modelling study from the hospital perspective in Germany.Pharmacoeconomics.2006;24:571–591.
Copyright © 2012 Society of Hospital Medicine

PCP Referral
Over the past decade, research has demonstrated a value gap in US healthcare, characterized by rapidly rising costs and substandard quality.1, 2 Public reporting of hospital performance data is one of several strategies promoted to help address these deficiencies. To this end, a number of hospital rating services have created Web sites aimed at healthcare consumers.3 These services provide information about multiple aspects of healthcare quality, which in theory might be used by patients when deciding where to seek medical care.
Despite the increasing availability of publicly reported quality data comparing doctors and hospitals, a 2008 survey found that only 14% of Americans have seen and used such information in the past year, a decrease from 2006 (36%).4 A similar study in 2007 found that after seeking input from family and friends, patients generally rely on their primary care physician (PCP) to assist them to make decisions about where to have elective surgery.5 Surprisingly, almost nothing is known about how publicly reported data is used, if at all, by PCPs in the referral of patients to hospitals.
The physician is an important intermediary in the buying process for many healthcare services.6 Tertiary care hospitals depend on physician referrals for much of their patient volume.7 Until the emergence of the hospitalist model of care, most primary care physicians cared for their own hospitalized patients, and thus hospital referral decisions were largely driven by the PCP's admitting privileges. However, following the rapid expansion of the hospitalist movement,8, 9 there has been a sharp decrease in the number of PCPs who provide direct patient care for their hospitalized patients.8 As a result, PCPs may now have more choice in regards to hospital referrals for general medical conditions. Potential factors influencing a PCP's referral decisions might include familiarity with the hospital, care quality, patient convenience, satisfaction with the hospital, or hospital reputation.
Studies of cardiac surgery report cards in New York9 and Pennsylvania,10 conducted in the mid‐1990s, found that cardiologists did not use publicly reported mortality data in referral decisions, nor did they share it with patients. Over the past 2 decades, public reporting has grown exponentially, and now includes many measures of structure, processes, and outcomes for almost all US hospitals, available for free over the Internet. The growth of the patient safety movement and mandated public reporting might also have affected physicians' views about publicly reported quality data. We surveyed primary care physicians to determine the extent to which they use information about hospital quality in their referral decisions for community‐acquired pneumonia, and to identify other factors that might influence referral decisions.
METHODS
We obtained an e‐mail list of primary care physicians from the medical staff offices of all area hospitals within a 10‐mile radius of Springfield, MA (Baystate Medical Center, Holyoke Medical Center, and Mercy Medical Center). Baystate Medical Center is a 659‐bed academic medical center and Level 1 trauma center, while Holyoke and Mercy Medical Center are both 180‐bed acute care hospitals. Physicians were contacted via e‐mail from June through September of 2009, and asked to participate in an anonymous, 10‐minute, online survey accessible through an Internet link (SurveyMonkey.com) about factors influencing a primary care physician's hospital referral choice for a patient with pneumonia. To facilitate participation, we sent 2 follow‐up e‐mail reminders, and respondents who completed the entire survey received a $15 gift card. The study was approved by the institutional review board of Baystate Medical Center and closed to participation on September 23, 2009.
We created the online survey based on previous research7 and approximately 10 key informant interviews. The survey (see Supporting Information, Appendix, in the online version of this article) contained 13 demographic questions and 10 questions based on a case study of pneumonia (Figure 1). The instrument was pilot tested for clarity with a small group of primary care physicians at the author's institution and subsequently modified. We chose pneumonia because it is a common reason for a PCP to make an urgent hospital referral,11 and because there is a well‐established set of quality measures that are publicly reported.12 Unlike elective surgery, for which patients might research hospitals or surgeons on their own, patients with pneumonia would likely rely on their PCP to recommend a hospital for urgent referral. In contrast, PCPs know they will refer a number of pneumonia patients to hospitals each year and therefore might have an interest in comparing the publicly reported quality measures for local hospitals.

Respondents were shown the case study and asked to refer the hypothetical patient to 1 of 4 area hospitals. Respondents were asked to rate (on a 3‐point scale: not at all, somewhat, or very) the importance of the following factors in their referral decision: waiting time in the emergency room, distance traveled by the patient, experience of other patients, severity of patient's illness, patient's insurance, hospital's reputation among other physicians and partners, admitting privileges with a specific hospital, admitting arrangements with a hospitalist group, familiarity with the hospital, availability of subspecialists, quality of subspecialists, nursing quality, nursing staffing ratios, hospital's case volume for pneumonia, publicly available quality measures, patient preference, distance from your practice, shared electronic record system, and quality of hospital discharge summaries. Next, we measured provider's awareness of publicly reported hospital quality data and whether they used such data in referring patients or choosing their own medical care. Specifically, we asked about familiarity with the following 4 Web sites: Massachusetts Quality and Cost (a state‐specific Web site produced by the Massachusetts Executive Office of Health and Human Services)13; Hospital Compare (a Web site developed and maintained by Centers for Medicare and Medicaid Services [CMS] and the Department of Health and Human Services)14; Leapfrog Group (a private, nonprofit organization)15; and Health Grades (a private, for‐profit company).16
We then asked participants to rate the importance of the following performance measures when judging a hospital's performance: antibiotics within 6 hours of arrival to the hospital, appropriate initial antibiotic, blood culture drawn before antibiotics given, smoking cessation advice/counseling, oxygenation assessment, risk‐adjusted mortality, intensive care unit staffing, influenza vaccination, pneumococcal vaccination, Leapfrog's never events,15 volume, Leapfrog safe practices score, cost, computerized physician order entry system, Magnet status,17 and U.S. News & World Report's Best Hospitals designation.18 Lastly, we asked participants to state, using a 3‐point scale (agree, disagree, neutral), their level of agreement that the following factors, adapted from Schneider and Epstein,10 represented limitations of public reporting: 1) risk‐adjusted methods are inadequate to compare hospitals fairly; 2) mortality rates are an incomplete indication of the quality of a hospital's care; 3) hospitals can manipulate the data; and 4) ratings are inaccurate for hospitals with small caseloads.
Factors associated with physicians' knowledge of publicly reported data were analyzed with bivariate analysis. Since all factors are categorical, chi‐square analysis was used for bivariate analysis. No factor had a P value <0.2 on bivariate analysis, thus multiple logistic regression was not performed.
RESULTS
Of 194 primary care physicians who received invitations, 92 responded (response rate of 47%). See Table 1 for respondents' characteristics. All age groups were represented; most were male and between 3554 years of age. Respondents were evenly divided between those who owned their own practices (54%) and those working for a health system (46%). Ninety‐three percent of PCPs maintained admitting privileges (45% to more than 1 hospital), but only 20% continued to admit their own patients. When asked where they would send a hypothetical pneumonia patient, only 4% of PCPs chose a hospital to which they had never had admitting privileges.
| Variable | No. (%) of Respondents |
|---|---|
| Age | |
| 2534 | 5 (5) |
| 3544 | 27 (29) |
| 4554 | 24 (26) |
| >55 | 36 (39) |
| Gender | |
| Male | 65 (71) |
| Female | 27 (29) |
| Years out of medical school | |
| <6 | 6 (7) |
| 610 | 9 (10) |
| 1115 | 17 (18) |
| >15 | 60 (65) |
| % Patients seen who are covered by | |
| Medicaid: Mean (SD) | 28 (26) |
| Medicare: Mean (SD) | 31 (18) |
| Private: Mean (SD) | 40 (25) |
| Number of time doing patient care: Mean (SD) | 85 (23) |
| Number of patients admitted/sent to hospital/mo | |
| <6 | 40 (47) |
| 610 | 25 (29) |
| 1120 | 12 (14) |
| >20 | 8 (9) |
| Practice type | |
| Solo | 13 (15) |
| Single specialty group | 36 (42) |
| Multi‐specialty group | 36 (42) |
| Practice ownership | |
| Independent | 45 (54) |
| Health system | 38 (46) |
| Currently admits own patients | |
| Yes | 17 (20) |
| No | 66 (80) |
| Current hospital admitting privileges | |
| A | 63 (76) |
| B | 41 (49) |
| C | 3 (4) |
| D | 12 (14) |
| None | 6 (7) |
| Other | 2 (2) |
Physician's ratings of the importance of various factors in their referral decision are shown in Figure 2. The following factors were most often considered very important: familiarity with the hospital (70%), patient preference (62%), and admitting arrangements with a hospitalist group (62%). In contrast, only 18% of physicians viewed publicly available hospital quality measures as very important when making a referral decision. Factors most often rated not at all important to participants' decisions were patient insurance (48%), hospital's case volume for pneumonia (48%), and publicly available quality measures (42%).
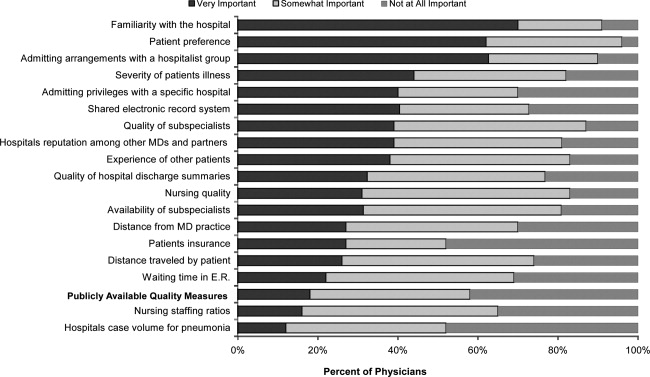
Of the 61% who were aware of Web sites that report hospital quality, most (52%) were familiar with Massachusetts Quality and Cost, while few (27%) were familiar with Hospital Compare. None of the physicians we surveyed reported having used publicly reported quality information when making a referral decision or having discussed such data with their patients. However, 49% stated that publicly reported performance data was somewhat and 10% very important to decisions regarding the medical care they receive. None of the demographic characteristics that we assessed (including age, gender, or years out of medical school) were associated with awareness of publicly reported data in bivariate analyses.
Respondents' ratings of specific quality measures appear in Figure 3. PCPs most often identified the following factors as being very important when judging hospital quality: percent of pneumonia patients given initial antibiotics within 6 hours after arrival (66%), percent of pneumonia patients given the most appropriate initial antibiotic (63%), and percent of pneumonia patients whose initial emergency room (ER) blood culture was performed prior to the administration of the first hospital dose of antibiotics (51%). The factors most often rated not at all important included: U.S. News & World Report's Best Hospitals designation (57%), Magnet Status (42%), and computer physician order entry system (40%).
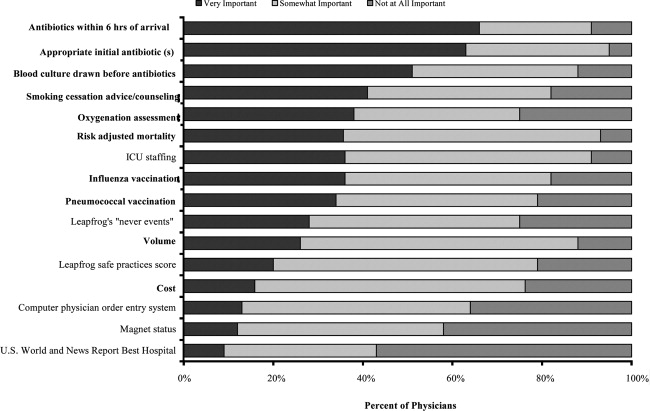
When asked about limitations of publicly reported performance data, 42% agreed that risk‐adjusted methods were inadequate to compare hospitals fairly, 76% agreed that mortality rates were an incomplete indication of the quality of hospitals care, 62% agreed that hospitals could manipulate the data, and 72% agreed that the ratings were inaccurate for hospitals with small caseloads.
DISCUSSION
In 2003, the Hospital Quality Alliance began a voluntary public reporting program of hospital performance measures, for pneumonia, acute myocardial infarction, and congestive heart failure, that was intended to encourage quality improvement activity by hospitals, and to provide patients and referring physicians with information to make better‐informed choices.19 These data are now easily available to the public through a free Web site (
Despite their lack of familiarity with Hospital Compare, it was the quality measures that are reported by Hospital Compare that they identified as the best indicators of hospital quality: appropriate initial antibiotic, antibiotics within 6 hours, and blood cultures performed prior to the administration of antibiotics. In fact, the 5 measures most often cited as very important to judging hospital quality were all measures reported on Hospital Compare.
As the US healthcare system becomes increasingly complex and costly, there is a growing interest in providing patients with physician and hospital performance data to help them select the provider.21 It is postulated that if patients took a more active role in choosing healthcare providers, and were forced to assume greater financial responsibility, then consumerism will force improvements in quality of care while maintaining or even lowering costs.21 However, studies demonstrate that most patients are unaware of performance data and, if they are aware, still value familiarity over quality ratings.4 Moreover, patients rely on the knowledge of their primary care physician to guide them.5
This is the first study we are aware of that examines how primary care physicians use publicly reported quality data in hospital referral decisions. Studies from more than a decade ago found that publicly reported data had minimal impact on referral decisions from cardiologists to cardiac surgeons. A survey of Pennsylvania's cardiologists and cardiac surgeons showed that although 82% were aware of risk‐adjusted mortality rates published for surgeons, only 10% of cardiologists reported these to be very important when evaluating the performance of a cardiothoracic surgeon. Furthermore, 87% of cardiologists stated that mortality and case volume information reported on cardiac surgeons had minimal or no influence on their referral practices.10 In 1997, a survey of cardiologists in New York found that only 38% of respondents reported that risk‐adjusted outcome data had affected their referrals to surgeons very much or somewhat.9 In addition, most authors conclude that public reporting has had little or no effect on market share.22 Despite growth in the number of measures and improved accessibility, our physicians were even less likely to be aware of, or use, publicly reported data than physicians a decade earlier.
Of course, even if public reporting does not influence referral patterns, it could still improve healthcare quality in several ways. First, feedback about performance may focus quality improvement activities in specific areas that represent gaps in care.10 This could take the form of an appeal to professionalism,23 or the desire to preserve one's reputation by not appearing on a list of poor performers.24 Second, hospitals' desire to appear on lists of high performers, such as U.S. News & World Report's hospital rankings, for marketing purposes, might stimulate improvement activities.10 Finally, publicly reported measures could form the basis for pay‐for‐performance incentives that further speed improvement.25
Our study has several limitations. First, our sample size was small and restricted to 1 region of 1 state, and may not be representative of either the state or nation as a whole. Still, our area has a high level of Internet use, and several local hospitals have been at the vanguard of the quality movement, generally scoring above both state and national averages on Hospital Compare. In addition, Massachusetts has made substantial efforts to promote its own public reporting program, and half the surveyed physicians reported being aware of the Massachusetts Quality and Cost Web site. The fact that not a single area physician surveyed used publicly reported data when making referral decisions is sobering. We believe it is unlikely that other areas of the country will have a substantially higher rate of use. Similarly, our response rate was under 50%. Physicians who did not take the survey may have differed in important ways from those who did. Nevertheless, our sample included a broad range of physician ages, practice types, and affiliations. It seems unlikely that those who did not respond would be more inclined to use publicly reported data than those who did. Second, we assessed decision‐making around a single medical condition. Physicians may have used publicly reported data for other decisions. However, the condition we chose was both urgent (as opposed to emergent) and possesses a robust set of publicly reported quality measures. If physicians do not use publicly reported data for this decision, it seems unlikely they would use it for conditions that have fewer reliable measures (eg, gall bladder surgery) or where the choice of hospital is generally made in an ambulance (eg, myocardial infarction). Finally, the low awareness of public reporting made it difficult for some physicians to answer some of the questions regarding publicly reported hospital quality data because they were unfamiliar with the language utilized by the Web sites (eg, magnet status, Leapfrog never events). It is possible that our results may have been altered slightly if a glossary had been provided.
Despite these limitations, our study suggests that more than 6 years after the launch of the Hospital Quality Alliance, primary care physicians do not appear to make use of these data when choosing a hospital for their patients suffering from pneumonia. Instead, they rely on familiarity with a hospital and past relationships. Even though a majority of the physicians surveyed no longer admitted their own patients, they continue to send patients to hospitals where they had privileges. This finding is not surprising, as physicians also cling to familiar therapies, and may be reluctant to prescribe a new medication or perform an unfamiliar procedure, even if it is indicated. Such reliance on familiarity may make physicians feel comfortable, but does not always result in the best care for patients. Acquiring familiarity, however, requires time and effort, something that physicians generally have in short supply; and while there are plenty of industry representatives to overcome physicians' hesitancy to prescribe new treatments, there are no analogous agents to educate physicians about public reporting or to help them overcome hesitancy about trying a new hospital.
Suspicion about the validity of public reporting may also play a role in the physicians' reported behavior. In past studies of cardiac report cards, cardiologists were most concerned that risk adjustment methods were inadequate (77%) and that mortality rates were an incomplete indicator of the quality of surgical care (74%). They were less concerned about manipulation of data (52%) or small caseloads (15%).10 Our physicians were also concerned that mortality rates were an incomplete measure of quality (76%) but less concerned about risk adjustment (42%), perhaps because many structure and process measures are not subject to risk adjustment. In contrast, they were somewhat more concerned that hospitals could manipulate the data (62%), which again may reflect process measures versus mortality statistics. Other reasons for not using the data may include a lack of awareness of the data or how to access it, or a belief that hospitals do not vary in quality.
Interestingly, even though most respondents were not aware of Hospital Compare, they found the information presented there to best reflect the overall hospital quality. Also, while respondents indicated that they did not use publicly reported data when referring patients, almost half of PCPs reported that publicly reported performance data was at least somewhat important in choosing their own medical care. Thus, although public reporting appears not to have reached its full potential, some publicly reported quality measures have clearly entered the consciousness of PCPs. In contrast, other highly touted measures such as computerized physician order entry systems were not appreciated, and popular designations such as U.S. News & World Report's Best Hospitals were least valued, even though 1 area hospital carries this designation. One conclusion might be that CMS should abandon Hospital Compare since neither patients4 nor providers use it. However, public reporting may improve quality in other ways. Moreover, physicians appear interested in the data even if they are not aware of it. Therefore, given the large investment by CMS and individual hospitals in collecting the data required for Hospital Compare, CMS might consider making greater efforts to increase primary care physician awareness of the Hospital Compare Web site. At the same time, high‐performing hospitals may want to communicate their performance scores to local PCPs as part of their marketing strategy. Future studies could assess whether such practices affect physician referral decisions and subsequent market share of high‐performing hospitals.
Acknowledgements
The authors of this study thank Jane Garb for her help with statistical analysis.
- Centers for Medicare and Medicaid Services. National Health Care Expenditures Data.2010. Available at: http://www.2.cms.gov/NationalHealthExpendData/25_NHE_Fact_Sheet.asp. Accessed April 22,year="2010"2010.
- ,,, et al.The quality of health care delivered to adults in the United States.N Engl J Med.2003;348(26):2635–2645.
- ,. The State‐of‐the‐Art of Online Hospital Public Reporting: a Review of Fifty‐One Websites. 2005. Available at: http://www.delmarvafoundation.org/newsAndPublications/reports/documents/WebSummariesFinal9.2.04.pdf. Accessed February 24,2012.
- . Kaiser Family Foundation. 2008 Update on Consumers' Views of Patient Safety and Quality Information. 2010. Available at: http://www.kff.org/kaiserpolls/upload/7819.pdf. Accessed April 20,2010.
- ,,.Choosing where to have major surgery: who makes the decision?Arch Surg.2007;142(3):242–246.
- ,,, et al.Resolving the gatekeeper conundrum: what patients value in primary care and referrals to specialists.JAMA.1999;282(3):261–266.
- ,,,.How physicians make referrals.J Health Care Mark.1993;13(2):6–17.
- ,,,.Growth in the care of older patients by hospitalists in the United States.N Engl J Med.2009;360(11):1102–1112.
- ,,,DeBuono BA. Public release of cardiac surgery outcomes data in New York: what do New York state cardiologists think of it?Am Heart J.1997;134(6):1120–1128.
- ,.Influence of cardiac‐surgery performance reports on referral practices and access to care. A survey of cardiovascular specialists.N Engl J Med.1996;335(4):251–256.
- ,,,,.Primary care summary of the British Thoracic Society Guidelines for the management of community acquired pneumonia in adults: 2009 update. Endorsed by the Royal College of General Practitioners and the Primary Care Respiratory Society UK.Prim Care Respir J.2010;19(1):21–27.
- Hospital Quality Alliance Quality Measures.2010. Available at: http://www.hospitalqualityalliance.org/hospitalqualityalliance/qualitymeasures/qualitymeasures.html. Accessed April 25,year="2010"2010.
- Massachusetts Executive Office of Health and Human Services. Massachusetts Executive Quality and Cost.2010. Available at: http://www.mass.gov/healthcareqc. Accessed February 24,year="2012"2012.
- Centers for Medicare and Medicaid Services. Hospital Compare.2010. Available at: http://www.hospitalcompare.hhs.gov. Accessed April 19,year="2010"2010.
- The Leapfrog Group for Patient Safety.2010. Available at: http://www.leapfroggroup.org/. Accessed April 23,year="2010"2010.
- Health Grades. 2010. Available at: http://www.healthgrades.com. Accessed April 19,2010.
- American Nurses Credentialing Center. Magnet Recognition Program. 2010. Available at: http://www.nursecredentialing.org/Magnet.aspx. Accessed April 15,2010.
- U.S. News 353(3):265–274.
- . US ads push patients to shop for hospitals. USA Today. May 20, 2008. Available at: http://www.usatoday.com/news/health/2008‐05‐20‐Hospitalads_N.htm. Accessed February 24, 2012.
- ,,.How do elderly patients decide where to go for major surgery? Telephone interview survey.BMJ.2005;331(7520):821.
- ,,, et al.Public reporting of cardiac surgery performance: part 1—history, rationale, consequences.Ann Thorac Surg.2011;92(3 suppl):S2–S11.
- ,,.Public reporting of hospital quality: recommendations to benefit patients and hospitals.J Hosp Med.2009;4(9):541–545.
- ,,, et al.When things go wrong: the impact of being a statistical outlier in publicly reported coronary artery bypass graft surgery mortality data.Am J Med Qual.2008;23(2):90–95.
- ,,, et al.Public reporting and pay for performance in hospital quality improvement.N Engl J Med.2007;356(5):486–496.
Over the past decade, research has demonstrated a value gap in US healthcare, characterized by rapidly rising costs and substandard quality.1, 2 Public reporting of hospital performance data is one of several strategies promoted to help address these deficiencies. To this end, a number of hospital rating services have created Web sites aimed at healthcare consumers.3 These services provide information about multiple aspects of healthcare quality, which in theory might be used by patients when deciding where to seek medical care.
Despite the increasing availability of publicly reported quality data comparing doctors and hospitals, a 2008 survey found that only 14% of Americans have seen and used such information in the past year, a decrease from 2006 (36%).4 A similar study in 2007 found that after seeking input from family and friends, patients generally rely on their primary care physician (PCP) to assist them to make decisions about where to have elective surgery.5 Surprisingly, almost nothing is known about how publicly reported data is used, if at all, by PCPs in the referral of patients to hospitals.
The physician is an important intermediary in the buying process for many healthcare services.6 Tertiary care hospitals depend on physician referrals for much of their patient volume.7 Until the emergence of the hospitalist model of care, most primary care physicians cared for their own hospitalized patients, and thus hospital referral decisions were largely driven by the PCP's admitting privileges. However, following the rapid expansion of the hospitalist movement,8, 9 there has been a sharp decrease in the number of PCPs who provide direct patient care for their hospitalized patients.8 As a result, PCPs may now have more choice in regards to hospital referrals for general medical conditions. Potential factors influencing a PCP's referral decisions might include familiarity with the hospital, care quality, patient convenience, satisfaction with the hospital, or hospital reputation.
Studies of cardiac surgery report cards in New York9 and Pennsylvania,10 conducted in the mid‐1990s, found that cardiologists did not use publicly reported mortality data in referral decisions, nor did they share it with patients. Over the past 2 decades, public reporting has grown exponentially, and now includes many measures of structure, processes, and outcomes for almost all US hospitals, available for free over the Internet. The growth of the patient safety movement and mandated public reporting might also have affected physicians' views about publicly reported quality data. We surveyed primary care physicians to determine the extent to which they use information about hospital quality in their referral decisions for community‐acquired pneumonia, and to identify other factors that might influence referral decisions.
METHODS
We obtained an e‐mail list of primary care physicians from the medical staff offices of all area hospitals within a 10‐mile radius of Springfield, MA (Baystate Medical Center, Holyoke Medical Center, and Mercy Medical Center). Baystate Medical Center is a 659‐bed academic medical center and Level 1 trauma center, while Holyoke and Mercy Medical Center are both 180‐bed acute care hospitals. Physicians were contacted via e‐mail from June through September of 2009, and asked to participate in an anonymous, 10‐minute, online survey accessible through an Internet link (SurveyMonkey.com) about factors influencing a primary care physician's hospital referral choice for a patient with pneumonia. To facilitate participation, we sent 2 follow‐up e‐mail reminders, and respondents who completed the entire survey received a $15 gift card. The study was approved by the institutional review board of Baystate Medical Center and closed to participation on September 23, 2009.
We created the online survey based on previous research7 and approximately 10 key informant interviews. The survey (see Supporting Information, Appendix, in the online version of this article) contained 13 demographic questions and 10 questions based on a case study of pneumonia (Figure 1). The instrument was pilot tested for clarity with a small group of primary care physicians at the author's institution and subsequently modified. We chose pneumonia because it is a common reason for a PCP to make an urgent hospital referral,11 and because there is a well‐established set of quality measures that are publicly reported.12 Unlike elective surgery, for which patients might research hospitals or surgeons on their own, patients with pneumonia would likely rely on their PCP to recommend a hospital for urgent referral. In contrast, PCPs know they will refer a number of pneumonia patients to hospitals each year and therefore might have an interest in comparing the publicly reported quality measures for local hospitals.
Respondents were shown the case study and asked to refer the hypothetical patient to 1 of 4 area hospitals. Respondents were asked to rate (on a 3‐point scale: not at all, somewhat, or very) the importance of the following factors in their referral decision: waiting time in the emergency room, distance traveled by the patient, experience of other patients, severity of patient's illness, patient's insurance, hospital's reputation among other physicians and partners, admitting privileges with a specific hospital, admitting arrangements with a hospitalist group, familiarity with the hospital, availability of subspecialists, quality of subspecialists, nursing quality, nursing staffing ratios, hospital's case volume for pneumonia, publicly available quality measures, patient preference, distance from your practice, shared electronic record system, and quality of hospital discharge summaries. Next, we measured provider's awareness of publicly reported hospital quality data and whether they used such data in referring patients or choosing their own medical care. Specifically, we asked about familiarity with the following 4 Web sites: Massachusetts Quality and Cost (a state‐specific Web site produced by the Massachusetts Executive Office of Health and Human Services)13; Hospital Compare (a Web site developed and maintained by Centers for Medicare and Medicaid Services [CMS] and the Department of Health and Human Services)14; Leapfrog Group (a private, nonprofit organization)15; and Health Grades (a private, for‐profit company).16
We then asked participants to rate the importance of the following performance measures when judging a hospital's performance: antibiotics within 6 hours of arrival to the hospital, appropriate initial antibiotic, blood culture drawn before antibiotics given, smoking cessation advice/counseling, oxygenation assessment, risk‐adjusted mortality, intensive care unit staffing, influenza vaccination, pneumococcal vaccination, Leapfrog's never events,15 volume, Leapfrog safe practices score, cost, computerized physician order entry system, Magnet status,17 and U.S. News & World Report's Best Hospitals designation.18 Lastly, we asked participants to state, using a 3‐point scale (agree, disagree, neutral), their level of agreement that the following factors, adapted from Schneider and Epstein,10 represented limitations of public reporting: 1) risk‐adjusted methods are inadequate to compare hospitals fairly; 2) mortality rates are an incomplete indication of the quality of a hospital's care; 3) hospitals can manipulate the data; and 4) ratings are inaccurate for hospitals with small caseloads.
Factors associated with physicians' knowledge of publicly reported data were analyzed with bivariate analysis. Since all factors are categorical, chi‐square analysis was used for bivariate analysis. No factor had a P value <0.2 on bivariate analysis, thus multiple logistic regression was not performed.
RESULTS
Of 194 primary care physicians who received invitations, 92 responded (response rate of 47%). See Table 1 for respondents' characteristics. All age groups were represented; most were male and between 3554 years of age. Respondents were evenly divided between those who owned their own practices (54%) and those working for a health system (46%). Ninety‐three percent of PCPs maintained admitting privileges (45% to more than 1 hospital), but only 20% continued to admit their own patients. When asked where they would send a hypothetical pneumonia patient, only 4% of PCPs chose a hospital to which they had never had admitting privileges.
| Variable | No. (%) of Respondents |
|---|---|
| Age | |
| 2534 | 5 (5) |
| 3544 | 27 (29) |
| 4554 | 24 (26) |
| >55 | 36 (39) |
| Gender | |
| Male | 65 (71) |
| Female | 27 (29) |
| Years out of medical school | |
| <6 | 6 (7) |
| 610 | 9 (10) |
| 1115 | 17 (18) |
| >15 | 60 (65) |
| % Patients seen who are covered by | |
| Medicaid: Mean (SD) | 28 (26) |
| Medicare: Mean (SD) | 31 (18) |
| Private: Mean (SD) | 40 (25) |
| Number of time doing patient care: Mean (SD) | 85 (23) |
| Number of patients admitted/sent to hospital/mo | |
| <6 | 40 (47) |
| 610 | 25 (29) |
| 1120 | 12 (14) |
| >20 | 8 (9) |
| Practice type | |
| Solo | 13 (15) |
| Single specialty group | 36 (42) |
| Multi‐specialty group | 36 (42) |
| Practice ownership | |
| Independent | 45 (54) |
| Health system | 38 (46) |
| Currently admits own patients | |
| Yes | 17 (20) |
| No | 66 (80) |
| Current hospital admitting privileges | |
| A | 63 (76) |
| B | 41 (49) |
| C | 3 (4) |
| D | 12 (14) |
| None | 6 (7) |
| Other | 2 (2) |
Physician's ratings of the importance of various factors in their referral decision are shown in Figure 2. The following factors were most often considered very important: familiarity with the hospital (70%), patient preference (62%), and admitting arrangements with a hospitalist group (62%). In contrast, only 18% of physicians viewed publicly available hospital quality measures as very important when making a referral decision. Factors most often rated not at all important to participants' decisions were patient insurance (48%), hospital's case volume for pneumonia (48%), and publicly available quality measures (42%).
Of the 61% who were aware of Web sites that report hospital quality, most (52%) were familiar with Massachusetts Quality and Cost, while few (27%) were familiar with Hospital Compare. None of the physicians we surveyed reported having used publicly reported quality information when making a referral decision or having discussed such data with their patients. However, 49% stated that publicly reported performance data was somewhat and 10% very important to decisions regarding the medical care they receive. None of the demographic characteristics that we assessed (including age, gender, or years out of medical school) were associated with awareness of publicly reported data in bivariate analyses.
Respondents' ratings of specific quality measures appear in Figure 3. PCPs most often identified the following factors as being very important when judging hospital quality: percent of pneumonia patients given initial antibiotics within 6 hours after arrival (66%), percent of pneumonia patients given the most appropriate initial antibiotic (63%), and percent of pneumonia patients whose initial emergency room (ER) blood culture was performed prior to the administration of the first hospital dose of antibiotics (51%). The factors most often rated not at all important included: U.S. News & World Report's Best Hospitals designation (57%), Magnet Status (42%), and computer physician order entry system (40%).
When asked about limitations of publicly reported performance data, 42% agreed that risk‐adjusted methods were inadequate to compare hospitals fairly, 76% agreed that mortality rates were an incomplete indication of the quality of hospitals care, 62% agreed that hospitals could manipulate the data, and 72% agreed that the ratings were inaccurate for hospitals with small caseloads.
DISCUSSION
In 2003, the Hospital Quality Alliance began a voluntary public reporting program of hospital performance measures, for pneumonia, acute myocardial infarction, and congestive heart failure, that was intended to encourage quality improvement activity by hospitals, and to provide patients and referring physicians with information to make better‐informed choices.19 These data are now easily available to the public through a free Web site (
Despite their lack of familiarity with Hospital Compare, it was the quality measures that are reported by Hospital Compare that they identified as the best indicators of hospital quality: appropriate initial antibiotic, antibiotics within 6 hours, and blood cultures performed prior to the administration of antibiotics. In fact, the 5 measures most often cited as very important to judging hospital quality were all measures reported on Hospital Compare.
As the US healthcare system becomes increasingly complex and costly, there is a growing interest in providing patients with physician and hospital performance data to help them select the provider.21 It is postulated that if patients took a more active role in choosing healthcare providers, and were forced to assume greater financial responsibility, then consumerism will force improvements in quality of care while maintaining or even lowering costs.21 However, studies demonstrate that most patients are unaware of performance data and, if they are aware, still value familiarity over quality ratings.4 Moreover, patients rely on the knowledge of their primary care physician to guide them.5
This is the first study we are aware of that examines how primary care physicians use publicly reported quality data in hospital referral decisions. Studies from more than a decade ago found that publicly reported data had minimal impact on referral decisions from cardiologists to cardiac surgeons. A survey of Pennsylvania's cardiologists and cardiac surgeons showed that although 82% were aware of risk‐adjusted mortality rates published for surgeons, only 10% of cardiologists reported these to be very important when evaluating the performance of a cardiothoracic surgeon. Furthermore, 87% of cardiologists stated that mortality and case volume information reported on cardiac surgeons had minimal or no influence on their referral practices.10 In 1997, a survey of cardiologists in New York found that only 38% of respondents reported that risk‐adjusted outcome data had affected their referrals to surgeons very much or somewhat.9 In addition, most authors conclude that public reporting has had little or no effect on market share.22 Despite growth in the number of measures and improved accessibility, our physicians were even less likely to be aware of, or use, publicly reported data than physicians a decade earlier.
Of course, even if public reporting does not influence referral patterns, it could still improve healthcare quality in several ways. First, feedback about performance may focus quality improvement activities in specific areas that represent gaps in care.10 This could take the form of an appeal to professionalism,23 or the desire to preserve one's reputation by not appearing on a list of poor performers.24 Second, hospitals' desire to appear on lists of high performers, such as U.S. News & World Report's hospital rankings, for marketing purposes, might stimulate improvement activities.10 Finally, publicly reported measures could form the basis for pay‐for‐performance incentives that further speed improvement.25
Our study has several limitations. First, our sample size was small and restricted to 1 region of 1 state, and may not be representative of either the state or nation as a whole. Still, our area has a high level of Internet use, and several local hospitals have been at the vanguard of the quality movement, generally scoring above both state and national averages on Hospital Compare. In addition, Massachusetts has made substantial efforts to promote its own public reporting program, and half the surveyed physicians reported being aware of the Massachusetts Quality and Cost Web site. The fact that not a single area physician surveyed used publicly reported data when making referral decisions is sobering. We believe it is unlikely that other areas of the country will have a substantially higher rate of use. Similarly, our response rate was under 50%. Physicians who did not take the survey may have differed in important ways from those who did. Nevertheless, our sample included a broad range of physician ages, practice types, and affiliations. It seems unlikely that those who did not respond would be more inclined to use publicly reported data than those who did. Second, we assessed decision‐making around a single medical condition. Physicians may have used publicly reported data for other decisions. However, the condition we chose was both urgent (as opposed to emergent) and possesses a robust set of publicly reported quality measures. If physicians do not use publicly reported data for this decision, it seems unlikely they would use it for conditions that have fewer reliable measures (eg, gall bladder surgery) or where the choice of hospital is generally made in an ambulance (eg, myocardial infarction). Finally, the low awareness of public reporting made it difficult for some physicians to answer some of the questions regarding publicly reported hospital quality data because they were unfamiliar with the language utilized by the Web sites (eg, magnet status, Leapfrog never events). It is possible that our results may have been altered slightly if a glossary had been provided.
Despite these limitations, our study suggests that more than 6 years after the launch of the Hospital Quality Alliance, primary care physicians do not appear to make use of these data when choosing a hospital for their patients suffering from pneumonia. Instead, they rely on familiarity with a hospital and past relationships. Even though a majority of the physicians surveyed no longer admitted their own patients, they continue to send patients to hospitals where they had privileges. This finding is not surprising, as physicians also cling to familiar therapies, and may be reluctant to prescribe a new medication or perform an unfamiliar procedure, even if it is indicated. Such reliance on familiarity may make physicians feel comfortable, but does not always result in the best care for patients. Acquiring familiarity, however, requires time and effort, something that physicians generally have in short supply; and while there are plenty of industry representatives to overcome physicians' hesitancy to prescribe new treatments, there are no analogous agents to educate physicians about public reporting or to help them overcome hesitancy about trying a new hospital.
Suspicion about the validity of public reporting may also play a role in the physicians' reported behavior. In past studies of cardiac report cards, cardiologists were most concerned that risk adjustment methods were inadequate (77%) and that mortality rates were an incomplete indicator of the quality of surgical care (74%). They were less concerned about manipulation of data (52%) or small caseloads (15%).10 Our physicians were also concerned that mortality rates were an incomplete measure of quality (76%) but less concerned about risk adjustment (42%), perhaps because many structure and process measures are not subject to risk adjustment. In contrast, they were somewhat more concerned that hospitals could manipulate the data (62%), which again may reflect process measures versus mortality statistics. Other reasons for not using the data may include a lack of awareness of the data or how to access it, or a belief that hospitals do not vary in quality.
Interestingly, even though most respondents were not aware of Hospital Compare, they found the information presented there to best reflect the overall hospital quality. Also, while respondents indicated that they did not use publicly reported data when referring patients, almost half of PCPs reported that publicly reported performance data was at least somewhat important in choosing their own medical care. Thus, although public reporting appears not to have reached its full potential, some publicly reported quality measures have clearly entered the consciousness of PCPs. In contrast, other highly touted measures such as computerized physician order entry systems were not appreciated, and popular designations such as U.S. News & World Report's Best Hospitals were least valued, even though 1 area hospital carries this designation. One conclusion might be that CMS should abandon Hospital Compare since neither patients4 nor providers use it. However, public reporting may improve quality in other ways. Moreover, physicians appear interested in the data even if they are not aware of it. Therefore, given the large investment by CMS and individual hospitals in collecting the data required for Hospital Compare, CMS might consider making greater efforts to increase primary care physician awareness of the Hospital Compare Web site. At the same time, high‐performing hospitals may want to communicate their performance scores to local PCPs as part of their marketing strategy. Future studies could assess whether such practices affect physician referral decisions and subsequent market share of high‐performing hospitals.
Acknowledgements
The authors of this study thank Jane Garb for her help with statistical analysis.
- Centers for Medicare and Medicaid Services. National Health Care Expenditures Data.2010. Available at: http://www.2.cms.gov/NationalHealthExpendData/25_NHE_Fact_Sheet.asp. Accessed April 22,year="2010"2010.
- ,,, et al.The quality of health care delivered to adults in the United States.N Engl J Med.2003;348(26):2635–2645.
- ,. The State‐of‐the‐Art of Online Hospital Public Reporting: a Review of Fifty‐One Websites. 2005. Available at: http://www.delmarvafoundation.org/newsAndPublications/reports/documents/WebSummariesFinal9.2.04.pdf. Accessed February 24,2012.
- . Kaiser Family Foundation. 2008 Update on Consumers' Views of Patient Safety and Quality Information. 2010. Available at: http://www.kff.org/kaiserpolls/upload/7819.pdf. Accessed April 20,2010.
- ,,.Choosing where to have major surgery: who makes the decision?Arch Surg.2007;142(3):242–246.
- ,,, et al.Resolving the gatekeeper conundrum: what patients value in primary care and referrals to specialists.JAMA.1999;282(3):261–266.
- ,,,.How physicians make referrals.J Health Care Mark.1993;13(2):6–17.
- ,,,.Growth in the care of older patients by hospitalists in the United States.N Engl J Med.2009;360(11):1102–1112.
- ,,,DeBuono BA. Public release of cardiac surgery outcomes data in New York: what do New York state cardiologists think of it?Am Heart J.1997;134(6):1120–1128.
- ,.Influence of cardiac‐surgery performance reports on referral practices and access to care. A survey of cardiovascular specialists.N Engl J Med.1996;335(4):251–256.
- ,,,,.Primary care summary of the British Thoracic Society Guidelines for the management of community acquired pneumonia in adults: 2009 update. Endorsed by the Royal College of General Practitioners and the Primary Care Respiratory Society UK.Prim Care Respir J.2010;19(1):21–27.
- Hospital Quality Alliance Quality Measures.2010. Available at: http://www.hospitalqualityalliance.org/hospitalqualityalliance/qualitymeasures/qualitymeasures.html. Accessed April 25,year="2010"2010.
- Massachusetts Executive Office of Health and Human Services. Massachusetts Executive Quality and Cost.2010. Available at: http://www.mass.gov/healthcareqc. Accessed February 24,year="2012"2012.
- Centers for Medicare and Medicaid Services. Hospital Compare.2010. Available at: http://www.hospitalcompare.hhs.gov. Accessed April 19,year="2010"2010.
- The Leapfrog Group for Patient Safety.2010. Available at: http://www.leapfroggroup.org/. Accessed April 23,year="2010"2010.
- Health Grades. 2010. Available at: http://www.healthgrades.com. Accessed April 19,2010.
- American Nurses Credentialing Center. Magnet Recognition Program. 2010. Available at: http://www.nursecredentialing.org/Magnet.aspx. Accessed April 15,2010.
- U.S. News 353(3):265–274.
- . US ads push patients to shop for hospitals. USA Today. May 20, 2008. Available at: http://www.usatoday.com/news/health/2008‐05‐20‐Hospitalads_N.htm. Accessed February 24, 2012.
- ,,.How do elderly patients decide where to go for major surgery? Telephone interview survey.BMJ.2005;331(7520):821.
- ,,, et al.Public reporting of cardiac surgery performance: part 1—history, rationale, consequences.Ann Thorac Surg.2011;92(3 suppl):S2–S11.
- ,,.Public reporting of hospital quality: recommendations to benefit patients and hospitals.J Hosp Med.2009;4(9):541–545.
- ,,, et al.When things go wrong: the impact of being a statistical outlier in publicly reported coronary artery bypass graft surgery mortality data.Am J Med Qual.2008;23(2):90–95.
- ,,, et al.Public reporting and pay for performance in hospital quality improvement.N Engl J Med.2007;356(5):486–496.
Copyright © 2012 Society of Hospital Medicine
Risk Model for VTE
Venous thromboembolism (VTE) is a major source of morbidity and mortality for hospitalized patients. Among medical patients at the highest risk, as many as 15% can be expected to develop a VTE during their hospital stay1, 2; however, among general medical patients, the incidence of symptomatic VTE is less than 1%,1 and potentially as low as 0.3%.3 Thromboprophylaxis with subcutaneous heparin reduces the risk of VTE by approximately 50%,4 and is therefore recommended for medical patients at high risk. However, heparin also increases the risk of bleeding and thrombocytopenia and thus should be avoided for patients at low risk of VTE. Consequently, the Joint Commission on Accreditation of Healthcare Organizations (JCAHO) recommends that all hospitalized medical patients receive a risk assessment for VTE.5
Certain disease states, including stroke, acute myocardial infarction, heart failure, respiratory disease, sepsis, and cancer, have been associated with increased risk for VTE, and, based on the inclusion criteria of several randomized trials, current American College of Chest Physicians (ACCP) guidelines recommend thromboprophylaxis for patients hospitalized with these diagnoses.2 However, evidence that these factors actually increase a patient's risk for VTE comes from studies of ambulatory patients and is often weak or conflicting. Existing risk‐stratification tools,6, 7 as well as the ACCP guidelines, have not been validated, and accordingly JCAHO does not specify how risk assessment should be conducted. In order to help clinicians better estimate the risk of VTE in medical patients and therefore to provide more targeted thromboprophylaxis, we examined a large cohort of patients with high‐risk diagnoses and created a risk stratification model.
Methods
Setting and Patients
We identified a retrospective cohort of patients discharged between January 1, 2004 and June 30, 2005 from 374 acute care facilities in the US that participated in Premier's Perspective, a database developed for measuring quality and healthcare utilization. Participating hospitals represent all regions of the US, and are generally similar in composition to US hospitals; however, in comparison to information contained in the American Hospital Association annual survey, Perspective hospitals are more likely to be located in the South and in urban areas. Available data elements include those derived from the uniform billing 04 form, such as sociodemographic information about each patient, their International Classification of Diseases, Ninth Revision, Clinical Modification (ICD‐9‐CM) diagnosis and procedure codes, as well as hospital and physician information. This information is supplemented with a date‐stamped log of all items and services billed to the patient or insurer, including diagnostic tests, medications, and other treatments. Permission to conduct the study was obtained from the Institutional Review Board at Baystate Medical Center.
We included all patients age 18 years at moderate‐to‐high risk of VTE according to the ACCP recommendations,8 based on a principal diagnosis of pneumonia, septicemia or respiratory failure with pneumonia, heart failure, chronic obstructive pulmonary disease (COPD), stroke, and urinary tract infection. Diagnoses were assessed using ICD‐9‐CM codes. Patients who were prescribed warfarin or therapeutic doses of heparin on hospital day 1 or 2, and those who received >1 therapeutic dose of heparin but otherwise did not fulfill criteria for VTE, were excluded because we could not evaluate whether they experienced a VTE event during hospitalization. We also excluded patients whose length of stay was <3 days, because our definition of hospital‐acquired VTE required treatment begun on day 3 or later, and those with an indication for anticoagulation other than VTE (eg, prosthetic cardiac valve or atrial fibrillation), because we could not reliably distinguish treatment for VTE from treatment of the underlying condition.
Risk Factors
For each patient, we extracted age, gender, race/ethnicity, and insurance status, principal diagnosis, comorbidities, and specialty of the attending physician. Comorbidities were identified from ICD‐9‐CM secondary diagnosis codes and Diagnosis Related Groups using Healthcare Cost and Utilization Project Comorbidity Software, version 3.1, based on the work of Elixhauser et al.9 We also assessed risk factors which have been previously linked to VTE: paralysis, cancer (metastatic, solid tumor, and lymphoma), chemotherapy/radiation, prior VTE, use of estrogens and estrogen modulators, inflammatory bowel disease, nephrotic syndrome, myeloproliferative disorders, obesity, smoking, central venous catheter, inherited or acquired thrombophilia, steroid use, mechanical ventilation, urinary catheter, decubitus ulcer, HMGco‐A reductase inhibitors, restraints, diabetes, varicose veins, and length‐of‐stay 6 days. These additional comorbidities were defined based on the presence of specific ICD‐9 codes, while use of HMG‐co‐A reductase inhibitors were identified from medication charge files. We also noted whether patients received anticoagulants, the dosages and days of administration, as well as intermittent pneumatic compression devices.
Identification of VTE
Because the presence of a secondary diagnosis of VTE in medical patients is not a reliable way of differentiating hospital‐acquired VTE from those present at the time of admission,10 subjects were considered to have experienced a hospital‐acquired VTE only if they underwent a diagnostic test for VTE (lower extremity ultrasound, venography, CT angiogram, ventilation‐perfusion scan, or pulmonary angiogram) on hospital day 3 or later, received treatment for VTE for at least 50% of the remaining hospital stay, or until initiation of warfarin or appearance of a complication (eg, transfusion or treatment for heparin‐induced thrombocytopenia) and were given a secondary diagnosis of VTE (ICD‐9 diagnoses 453.4, 453.40, 453.41, 453.42, 453.8, 453.9, 415.1, 415.11, 415.19). We considered the following to be treatments for VTE: intravenous unfractionated heparin, >60 mg of enoxaparin, 7500 mg of dalteparin, or placement of an inferior vena cava filter. In addition, patients who were readmitted within 30 days of discharge with a primary diagnosis of VTE were also considered to have developed a VTE as a complication of their previous hospital stay.
Statistical Analysis
Univariate predictors of VTE were assessed using chi‐square tests. We developed a multivariable logistic regression model for VTE on an 80% randomly selected subset of the eligible admissions (the derivation cohort) using all measured risk factors for VTE and selected interaction terms. Generalized estimating equations (GEE) models with a logit link (SAS PROC GENMOD) were used to account for the clustering of patients within hospitals. Initial models were stratified on VTE prophylaxis. Factors significant at P < 0.05 were retained. Parameter estimates derived from the model were used to compute individual VTE risk in the remaining 20% of the admissions (the validation cohort). Discrimination in the validation model was assessed by the c‐statistic, as well as the expected/observed ratio. Both cohorts were categorized by decile of risk, based on the probability distribution in the derivation cohort, and observed VTE events compared to those predicted by the model. All analyses were performed using the Statistical Analysis System (version 9.1, SAS Institute, Inc., Cary, NC).
Role of the Funding Source
This study was supported by a Clinical Scientist Development Award from the Doris Duke Charitable Foundation. The funding source had no role in the study design, analysis, or interpretation of the data.
Results
Our sample contained 242,738 patients, 194,198 (80%) assigned to the derivation set and 48,540 (20%) to the validation set. Patient characteristics were similar in both sets (Supporting Information Appendix Table 1). Most patients were over age 65, 59% were female, and 64% were white (Table 1). The most common primary diagnoses were pneumonia (33%) and congestive heart failure (19%). The most common comorbidities were hypertension (50%), diabetes (31%), chronic pulmonary disease (30%), and anemia (20%). Most patients were cared for by internists (54%) or family practitioners (21%), and 30% received some form of anticoagulant VTE prophylaxis (Table 2). Of patients with an ICD‐9 code for VTE during hospitalization, just over half lacked either diagnostic testing, treatment, or both, leaving 612 (0.25%) patients who fulfilled our criteria for VTE; an additional 440 (0.18%) were readmitted for VTE, for an overall incidence of 0.43%. Patients with a length of stay 6 days had an incidence of 0.79% vs 0.19% for patients with shorter stays.
| Total | No VTE | VTE | |||||
|---|---|---|---|---|---|---|---|
| Variable | N | % | N | % | N | % | P‐Value |
| Total | 242,738 | 100 | 241,686 | 100.0 | 1,052 | 100.0 | |
| Demographics | |||||||
| Age | 0.20 | ||||||
| 18‐49 | 31,065 | 12.8 | 30,952 | 12.8 | 113 | 10.7 | |
| 50‐64 | 51,309 | 21.1 | 51,083 | 21.1 | 226 | 21.5 | |
| 65‐74 | 51,230 | 21.1 | 50,993 | 21.1 | 237 | 22.5 | |
| 75+ | 109,134 | 45.0 | 108,658 | 45.0 | 476 | 45.2 | |
| Female | 142,910 | 58.9 | 142,330 | 58.9 | 580 | 55.1 | 0.01 |
| Race/ethnicity | 0.49 | ||||||
| White | 155,866 | 64.2 | 155,189 | 64.2 | 677 | 64.4 | |
| Black | 41,556 | 17.1 | 41,374 | 17.1 | 182 | 17.3 | |
| Hispanic | 9,809 | 4.0 | 9,776 | 4.0 | 33 | 3.1 | |
| Other | 35,507 | 14.6 | 35,347 | 14.6 | 160 | 15.2 | |
| Marital status | 0.28 | ||||||
| Married/life partner | 88,035 | 36.3 | 87,627 | 36.3 | 408 | 38.8 | |
| Single | 39,254 | 16.2 | 39,103 | 16.2 | 151 | 14.4 | |
| Separated/divorced | 23,492 | 9.7 | 23,394 | 9.7 | 98 | 9.3 | |
| Widowed | 58,669 | 24.2 | 58,426 | 24.2 | 243 | 23.1 | |
| Other | 33,288 | 13.7 | 33,136 | 13.7 | 152 | 14.4 | |
| Admission characteristics | |||||||
| Primary diagnosis | <0.001 | ||||||
| Community‐acquired pneumonia | 81,171 | 33.4 | 80,792 | 33.4 | 379 | 36.0 | |
| Septicemia | 7,643 | 3.2 | 7,568 | 3.1 | 75 | 7.1 | |
| Chronic obstructive pulmonary disease | 35,116 | 14.5 | 35,027 | 14.5 | 89 | 8.5 | |
| Respiratory failure | 7,098 | 2.9 | 7,012 | 2.9 | 86 | 8.2 | |
| Congestive heart failure | 46,503 | 19.2 | 46,336 | 19.2 | 167 | 15.9 | |
| Cardiovascular disease | 33,044 | 13.6 | 32,931 | 13.6 | 113 | 10.7 | |
| Urinary tract infection | 32,163 | 13.3 | 32,020 | 13.2 | 143 | 13.6 | |
| Insurance payer | 0.93 | ||||||
| Medicare traditional | 157,609 | 64.9 | 156,927 | 64.9 | 682 | 64.8 | |
| Medicare managed care | 10,649 | 4.4 | 10,597 | 4.4 | 52 | 4.9 | |
| Medicaid | 17,796 | 7.3 | 17,720 | 7.3 | 76 | 7.2 | |
| Private | 44,858 | 18.5 | 44,665 | 18.5 | 193 | 18.3 | |
| Self‐pay/uninsured/other | 11,826 | 4.9 | 11,777 | 4.9 | 49 | 4.7 | |
| Admitted from skilled nursing facility | 3,003 | 1.2 | 2,980 | 1.2 | 23 | 2.2 | 0.005 |
| Risk factors | |||||||
| Any VTE prophylaxis | 72,558 | 29.9 | 72,164 | 29.9 | 394 | 37.5 | <0.001 |
| Length of stay 6 days | 99,463 | 41.0 | 98,680 | 40.8 | 783 | 74.4 | <0.001 |
| Paralysis | 16,764 | 6.9 | 16,689 | 6.9 | 75 | 7.1 | 0.77 |
| Metastatic cancer | 5,013 | 2.1 | 4,928 | 2.0 | 85 | 8.1 | <0.001 |
| Solid tumor without metastasis | 25,127 | 10.4 | 24,995 | 10.3 | 132 | 12.5 | 0.02 |
| Lymphoma | 3,026 | 1.2 | 2,995 | 1.2 | 31 | 2.9 | <0.001 |
| Cancer chemotherapy/radiation | 1,254 | 0.5 | 1,231 | 0.5 | 23 | 2.2 | <0.001 |
| Prior venous thromboembolism | 2,945 | 1.2 | 2,926 | 1.2 | 19 | 1.8 | 0.08 |
| Estrogens | 4,819 | 2.0 | 4,807 | 2.0 | 12 | 1.1 | 0.05 |
| Estrogen modulators | 2,102 | 0.9 | 2,091 | 0.9 | 11 | 1.0 | 0.53 |
| Inflammatory bowel disease | 814 | 0.3 | 803 | 0.3 | 11 | 1.0 | <0.001 |
| Nephrotic syndrome | 520 | 0.2 | 517 | 0.2 | 3 | 0.3 | 0.62 |
| Myeloproliferative disorder | 1,983 | 0.8 | 1,973 | 0.8 | 10 | 1.0 | 0.63 |
| Obesity | 16,938 | 7.0 | 16,856 | 7.0 | 82 | 7.8 | 0.30 |
| Smoking | 35,386 | 14.6 | 35,284 | 14.6 | 102 | 9.7 | <0.001 |
| Central venous catheter | 14,754 | 6.1 | 14,525 | 6.0 | 229 | 21.8 | <0.001 |
| Inherited or acquired thrombophilia | 114 | 0.1 | 108 | 0.0 | 6 | 0.6 | <0.001 |
| Steroids | 82,606 | 34.0 | 82,185 | 34.0 | 421 | 40.0 | <0.001 |
| Mechanical ventilation | 13,347 | 5.5 | 13,167 | 5.4 | 180 | 17.1 | <0.001 |
| Urinary catheter | 39,080 | 16.1 | 38,816 | 16.1 | 264 | 25.1 | <0.001 |
| Decubitus ulcer | 6,829 | 2.8 | 6,776 | 2.8 | 53 | 5.0 | <0.001 |
| Statins use | 57,282 | 23.6 | 57,068 | 23.6 | 214 | 20.3 | 0.01 |
| Use of restraints | 5,970 | 2.5 | 5,914 | 2.4 | 56 | 5.3 | <0.001 |
| Diabetes mellitus | 75,103 | 30.9 | 74,799 | 30.9 | 304 | 28.9 | 0.15 |
| Varicose veins | 166 | 0.1 | 165 | 0.1 | 1 | 0.1 | 0.74 |
| Comorbidities | |||||||
| Hypertension | 120,606 | 49.7 | 120,126 | 49.7 | 480 | 45.6 | 0.008 |
| Congestive heart failure | 18,900 | 7.8 | 18,793 | 7.8 | 107 | 10.2 | 0.004 |
| Peripheral vascular disease | 16,705 | 6.9 | 16,639 | 6.9 | 66 | 6.3 | 0.43 |
| Valvular disease | 13,683 | 5.6 | 13,628 | 5.6 | 55 | 5.2 | 0.56 |
| Pulmonary circulation disease | 5,530 | 2.3 | 5,492 | 2.3 | 38 | 3.6 | 0.004 |
| Chronic pulmonary disease | 72,028 | 29.7 | 71,698 | 29.7 | 330 | 31.4 | 0.23 |
| Respiratory failure second diagnosis | 13,027 | 5.4 | 12,893 | 5.3 | 134 | 12.7 | <0.001 |
| Rheumatoid arthritis/collagen vascular disease | 7,090 | 2.9 | 7,050 | 2.9 | 40 | 3.8 | 0.09 |
| Deficiency anemias | 49,605 | 20.4 | 49,352 | 20.4 | 253 | 24.0 | 0.004 |
| Weight loss | 8,810 | 3.6 | 8,714 | 3.6 | 96 | 9.1 | <0.001 |
| Peptic ulcer disease bleeding | 4,736 | 2.0 | 4,723 | 2.0 | 13 | 1.2 | 0.09 |
| Chronic blood loss anemia | 2,354 | 1.0 | 2,338 | 1.0 | 16 | 1.5 | 0.07 |
| Hypothyroidism | 28,773 | 11.9 | 28,668 | 11.9 | 105 | 10.0 | 0.06 |
| Renal failure | 19,768 | 8.1 | 19,669 | 8.1 | 99 | 9.4 | 0.13 |
| Liver disease | 4,682 | 1.9 | 4,657 | 1.9 | 25 | 2.4 | 0.29 |
| Other neurological disorders | 33,094 | 13.6 | 32,905 | 13.6 | 189 | 18.0 | <0.001 |
| Psychoses | 9,330 | 3.8 | 9,283 | 3.8 | 47 | 4.5 | 0.29 |
| Depression | 25,561 | 10.5 | 25,442 | 10.5 | 119 | 11.3 | 0.41 |
| Alcohol abuse | 7,756 | 3.2 | 7,727 | 3.2 | 29 | 2.8 | 0.42 |
| Drug abuse | 4,336 | 1.8 | 4,318 | 1.8 | 18 | 1.7 | 0.85 |
| Acquired immune deficiency syndrome | 1,048 | 0.4 | 1,045 | 0.4 | 3 | 0.3 | 0.47 |
| Total | Derivation | Validation | |||||
|---|---|---|---|---|---|---|---|
| Variable | N | % | N | % | N | % | P‐Value |
| |||||||
| Total | 242,738 | 100 | 194,198 | 100 | 48,540 | 100 | |
| VTE prophylaxis | 0.97 | ||||||
| No prophylaxis | 170,180 | 70.1 | 136,153 | 70.1 | 34,027 | 70.1 | |
| Any prophylaxis | 72,558 | 29.9 | 58,045 | 29.9 | 14,513 | 29.9 | |
| Outcomes | |||||||
| ICD‐9 code for VTE | 1,304 | 0.5 | 1,025 | 0.5 | 279 | 0.6 | 0.21 |
| ICD‐9 code + diagnostic test | 989 | 0.4 | 777 | 0.4 | 212 | 0.4 | 0.26 |
| ICD‐9 code + diagnostic test + treatment for VTE | 612 | 0.3 | 471 | 0.2 | 141 | 0.3 | 0.06 |
| Readmission for VTE within 30 days | 446 | 0.2 | 363 | 0.2 | 83 | 0.2 | 0.46 |
| Total hospital‐acquired VTE | 1,052 | 0.4 | 829 | 0.4 | 223 | 0.5 | 0.33 |
| In‐hospital mortality | 8,019 | 3.3 | 6,403 | 3.3 | 1,616 | 3.3 | 0.72 |
| Any readmission within 30 days | 28,664 | 11.8 | 22,885 | 11.8 | 5,779 | 11.9 | 0.46 |
Risk factors for VTE
A large number of patient and hospital factors were associated with the development of VTE (Table 1). Due to the large sample size, even weak associations appear highly statistically significant. Compared to patients without VTE, those with VTE were more likely to have received VTE prophylaxis (37% vs 30%, P < 0.001). However, models of patients receiving prophylaxis and of patients not receiving prophylaxis produced similar odds ratios for the various risk factors (Supporting Information Appendix Table 2); therefore, the final model includes both patients who did, and did not, receive VTE prophylaxis. In the multivariable model (Supporting Information Appendix Table 3), age, length of stay, gender, primary diagnosis, cancer, inflammatory bowel disease, obesity, central venous catheter, inherited thrombophilia, steroid use, mechanical ventilation, active chemotherapy, and urinary catheters were all associated with VTE (Table 3). The strongest risk factors were length of stay 6 days (OR 3.22, 95% CI 2.73, 3.79), central venous catheter (OR 1.87, 95% CI 1.52, 2.29), inflammatory bowel disease (OR 3.11, 95% CI 1.59, 6.08), and inherited thrombophilia (OR 4.00, 95% CI 0.98, 16.40). In addition, there were important interactions between age and cancer; cancer was a strong risk factor among younger patients, but is not as strong a risk factor among older patients (OR compared to young patients without cancer was 4.62 (95% CI 2.72, 7.87) for those age 1849 years, and 3.64 (95% CI 2.52, 5.25) for those aged 5064 years).
| Risk Factor | OR | 95% CI |
|---|---|---|
| ||
| Any prophylaxis | 0.98 | (0.84, 1.14) |
| Female | 0.85 | (0.74, 0.98) |
| Length of stay 6 days | 3.22 | (2.73, 3.79) |
| Age* | ||
| 18‐49 years | 1 | Referent |
| 50‐64 years | 1.15 | (0.86, 1.56) |
| >65 years | 1.51 | (1.17, 1.96) |
| Primary diagnosis | ||
| Pneumonia | 1 | Referent |
| Chronic obstructive pulmonary disease | 0.57 | (0.44, 0.75) |
| Stroke | 0.84 | (0.66, 1.08) |
| Congestive heart failure | 0.86 | (0.70, 1.06) |
| Urinary tract infection | 1.19 | (0.95, 1.50) |
| Respiratory failure | 1.15 | (0.85, 1.55) |
| Septicemia | 1.11 | (0.82, 1.50) |
| Comorbidities | ||
| Inflammatory bowel disease | 3.11 | (1.59, 6.08) |
| Obesity | 1.28 | (0.99, 1.66) |
| Inherited thrombophilia | 4.00 | (0.98, 16.40) |
| Cancer | ||
| 18‐49 years | 4.62 | (2.72, 7.87) |
| 50‐64 years | 3.64 | (2.52, 5.25) |
| >65 years | 2.17 | (1.61, 2.92) |
| Treatments | ||
| Central venous catheter | 1.87 | (1.52, 2.29) |
| Mechanical ventilation | 1.61 | (1.27, 2.05) |
| Urinary catheter | 1.17 | (0.99, 1.38) |
| Chemotherapy | 1.71 | (1.03, 2.83) |
| Steroids | 1.22 | (1.04, 1.43) |
In the derivation set, the multivariable model produced deciles of mean predicted risk from 0.11% to 1.45%, while mean observed risk over the same deciles ranged from 0.12% to 1.42% (Figure 1). Within the validation cohort, the observed rate of VTE was 0.46% (223 cases among 48,543 subjects). The expected rate according to the model was 0.43% (expected/observed ratio: 0.93 [95% CI 0.82, 1.06]). Model discrimination measured by the c‐statistic in the validation set was 0.75 (95% CI 0.71, 0.78). The model produced deciles of mean predicted risk from 0.11% to 1.46%, with mean observed risk over the same deciles from 0.17% to 1.81%. Risk gradient was relatively flat across the first 6 deciles, began to rise at the seventh decile, and rose sharply in the highest one. Using a risk threshold of 1%, the model had a sensitivity of 28% and a specificity of 93%. In the validation set, this translated into a positive predictive value of 2.2% and a negative predictive value of 99.7%. Assuming that VTE prophylaxis has an efficacy of 50%, the number‐needed‐to‐treat to prevent one VTE among high‐risk patients (predicted risk >1%) would be 91. In contrast, providing prophylaxis to the entire validation sample would result in a number‐needed‐to‐treat of 435. Using a lower treatment threshold of 0.4% produced a positive predictive value of 1% and a negative predictive value of 99.8%. At this threshold, the model would detect 73% of patients with VTE and the number‐needed‐to‐treat to prevent one VTE would be 200.

Discussion
In a representative sample of 243,000 hospitalized medical patients with at least one major risk factor for VTE, we found that symptomatic VTE was an uncommon event, occurring in approximately 1 in 231 patients. We identified a number of factors that were associated with an increased risk of VTE, but many previously cited risk factors did not show an association in multivariable models. In particular, patients with a primary diagnosis of COPD appeared not to share the same high risk of VTE as patients with the other diagnoses we examined, a finding reported by others.11 The risk model we developed accurately stratifies patients across a wide range of VTE probabilities, but even among those with the highest predicted rates, symptomatic VTE occurred in less than 2%.
VTE is often described as a frequent complication of hospitalization for medical illness and one of the most common potentially preventable causes of death. Indeed, rates of asymptomatic VTE have been demonstrated to be 3.7% to 26%.12 Although some of these might have fatal consequences, most are distal vein thromboses and their significance is unknown. In contrast, symptomatic events are uncommon, with previous estimates among general medical patients in observational studies in the range of 0.3%3 to 0.8%,12 similar to the rate observed in our study. Symptomatic event rates among control patients in landmark randomized trials have ranged from 0.86%13 to 2.3%,14 but these studies enrolled only very high‐risk patients with more extended hospitalizations, and may involve follow‐up periods of a month or more.
Because it is unlikely that our diagnostic algorithm was 100% sensitive, and because 30% of our patients received chemoprophylaxis, it is probable that we have underestimated the true rate of VTE in our sample. Among the patients who received prophylaxis, the observed rate of VTE was 0.54%. If we assume that prophylaxis is 50% effective, then had these patients not received prophylaxis, their rate of VTE would have been 1.08% (vs 0.39% among those patients who received no prophylaxis) and the overall rate of VTE for the sample would have been 0.60% (1.08 0.30 + 0.39 0.70). If we further assume that our algorithm was only 80% sensitive and 100% specific, the true underlying rate of symptomatic VTE could have been as high as 0.75%, still less than half that seen in randomized trials.
Prophylaxis with heparin has been shown to decrease the rate of both asymptomatic and symptomatic events, but because of the low prevalence, the number‐needed‐to‐treat to prevent one symptomatic pulmonary embolism has been estimated at 345, and prophylaxis has not been shown to affect all‐cause mortality.4, 15 At the same time, prophylaxis costs money, is uncomfortable, and carries a small risk of bleeding and heparin‐induced thrombocytopenia. Given the generally low incidence of symptomatic VTE, it therefore makes sense to reserve prophylaxis for patients at higher risk of thromboembolism.
To decide whether prophylaxis is appropriate for a given patient, it is necessary to quantify the patient's risk and then apply an appropriate threshold for treatment. The National Quality Forum (NQF) recommends,16 and JCAHO has adopted, that a clinician must evaluate each patient upon admission, and regularly thereafter, for the risk of developing DVT [deep vein thrombosis]/VTE. Until now, however, there has been no widely accepted, validated method to risk stratify medical patients. The ACCP recommendations cite just three studies of VTE risk factors in hospitalized medical patients.11, 17, 18 Together they examined 477 cases and 1197 controls, identifying congestive heart failure, pneumonia, cancer, and previous VTE as risk factors. Predictive models based on these factors17, 1921 have not been subjected to validation or have performed poorly.18 Acknowledging this lack of standardized risk assessment, JCAHO leaves the means of assessment to individual hospitals. A quality improvement guide published by the Agency for Healthcare Research and Quality goes one step further, stating that In a typical hospital, it is estimated that fewer than 5% of medical patients could be considered at low risk by most VTE risk stratification methods.22 The guide recommends near universal VTE prophylaxis.
In light of the JCAHO requirements, our model should be welcomed by hospitalists. Rather than assuming that all patients over 40 years of age are at high risk, our model will enable clinicians to risk stratify patients from a low of 0.1% to >1.4% (>10‐fold increase in risk). Moreover, the model was derived from more than 800 episodes of symptomatic VTE among almost 190,000 general medical patients and validated on almost 50,000 more. The observed patients were cared for in clinical practice at a nationally representative group of US hospitals, not in a highly selected clinical trial, increasing the generalizability of our findings. Finally, the model includes ten common risk factors that can easily be entered into decision support software or extracted automatically from the electronic medical record. Electronic reminder systems have already been shown to increase use of VTE prophylaxis, and prevent VTE, especially among cancer patients.23
A more challenging task is defining the appropriate risk threshold to initiate VTE prophylaxis. The Thromboembolic Risk Factors (THRIFT) Consensus Group classified patients according to risk of proximal DVT as low (<1%), moderate (1%‐10%), and high (>10%).21 They recommended heparin prophylaxis for all patients at moderate risk or higher. Although the patients included in our study all had a diagnosis that warranted prophylaxis according to the ACCP guidelines, using the THRIFT threshold for moderate‐to‐high risk, only 7% of our patients should have received prophylaxis. The recommendation not to offer heparin prophylaxis to patients with less than 1% chance of developing symptomatic VTE seems reasonable, given the large number‐needed‐to‐treat, but formal decision analyses should be conducted to better define this threshold. Many hospitalists, however, may feel uncomfortable using the 1% threshold, because our model failed to identify almost three out of four patients who ultimately experienced symptomatic VTE. At that threshold, it would seem that hospital‐acquired VTE is not a preventable complication in most medical patients, as others have pointed out.3, 24 Alternatively, if the threshold were lowered to 0.4%, our model could reduce the use of prophylaxis by 60%, while still identifying three‐fourths of all VTE cases. Further research is needed to know whether such a threshold is reasonable.
Our study has a number of important limitations. First, we relied on claims data, not chart review. We do not know for certain which patients experienced VTE, although our definition of VTE required diagnosis codes plus charges for both diagnosis and treatment. Moreover, our rates are similar to those observed in other trials where symptomatic events were confirmed. Second, about 30% of our patients received at least some VTE prophylaxis, and this may have prevented as many as half of the VTEs in that group. Without prophylaxis, rates might have been 20%30% higher. Similarly, we could not detect patients who were diagnosed after discharge but not admitted to hospital. While we believe this number to be small, it would again increase the rate slightly. Third, we could not assess certain clinical circumstances that are not associated with hospital charges or diagnosis codes, especially prolonged bed rest. Other risk factors, such as the urinary catheter, were probably surrogate markers for immobilization rather than true risk factors. Fourth, we included length of stay in our prediction model. We did this because most randomized trials of VTE prophylaxis included only patients with an expected length of stay 6 days. Physicians' estimates about probable length of stay may be less accurate than actual length of stay as a predictor of VTE. Moreover, the relationship may have been confounded if hospital‐acquired VTE led to longer lengths of stay. We think this unlikely since many of the events were discovered on readmission. Fifth, we studied only patients carrying high‐risk diagnoses, and therefore do not know the baseline risk for patients with less risky conditions, although it should be lower than what we observed. It seems probable that COPD, rather than being protective, as it appears in our model, actually represents the baseline risk for low‐risk diagnoses. It should be noted that we did include a number of other high‐risk diagnoses, such as cancer and inflammatory bowel disease, as secondary diagnoses. A larger, more inclusive study should be conducted to validate our model in other populations. Finally, we cannot know who died of undiagnosed VTE, either in the hospital or after discharge. Such an outcome would be important, but those events are likely to be rare, and VTE prophylaxis has not been shown to affect mortality.
VTE remains a daunting problem in hospitalized medical patients. Although VTE is responsible for a large number of hospital deaths each year, identifying patients at high risk for clinically important VTE is challenging, and may contribute to the persistently low rates of VTE prophylaxis seen in hospitals.25 Current efforts to treat nearly all patients are likely to lead to unnecessary cost, discomfort, and side effects. We present a simple logistic regression model that can easily identify patients at moderate‐to‐high risk (>1%) of developing symptomatic VTE. Future studies should focus on prospectively validating the model in a wider spectrum of medical illness, and better defining the appropriate risk cutoff for general prophylaxis.
Acknowledgements
The authors thank Aruna Priya, MS, for her help with some of the statistical analyses.
- ,,, et al.A comparison of enoxaparin with placebo for the prevention of venous thromboembolism in acutely ill medical patients. Prophylaxis in Medical Patients with Enoxaparin Study Group.N Engl J Med.1999;341(11):793–800.
- ,,, et al.Prevention of venous thromboembolism: American College of Chest Physicians Evidence‐Based Clinical Practice Guidelines (8th ed).Chest.2008;133(6 suppl):381S–453S.
- ,,.Thrombosis prophylaxis in hospitalised medical patients: does prophylaxis in all patients make sense?Neth J Med.2000;56(5):171–176.
- ,,,,.Pharmacological venous thromboembolism prophylaxis in hospitalized medical patients: a meta‐analysis of randomized controlled trials.Arch Intern Med.2007;167(14):1476–1486.
- The Joint Commission on the Accreditation of Healthcare Organizations. Venous thromboembolism (VTE) core measure set. Available at: http://www. jointcommission.org/PerformanceMeasurement/PerformanceMeasurement/VTE.htm. Accessed June 1,2009.
- ,,.Effective risk stratification of surgical and nonsurgical patients for venous thromboembolic disease.Semin Hematol.2001;38(2 suppl 5):12–19.
- ,,, et al.Assessment of venous thromboembolism risk and the benefits of thromboprophylaxis in medical patients.Thromb Haemost.2005;94(4):750–759.
- ,,, et al.Prevention of venous thromboembolism: the Seventh ACCP Conference on Antithrombotic and Thrombolytic Therapy.Chest.2004;126(3 suppl):338S–400S.
- ,,,.Comorbidity measures for use with administrative data.Med Care.1998;36(1):8–27.
- ,,,,,.Identification of in‐hospital complications from claims data. Is it valid?Med Care.2000;38(8):785–795.
- ,,, et al.Risk factors for venous thromboembolism in hospitalized patients with acute medical illness: analysis of the MEDENOX Study.Arch Intern Med.2004;164(9):963–968.
- ,,.The magnitude of an iatrogenic disorder: a systematic review of the incidence of venous thromboembolism for general medical inpatients.Thromb Haemost.2006;95(5):758–762.
- ,,,,,.Randomized, placebo‐controlled trial of dalteparin for the prevention of venous thromboembolism in acutely ill medical patients.Circulation.2004;110(7):874–879.
- .Randomised, controlled trial of low‐dose heparin for prevention of fatal pulmonary embolism in patients with infectious diseases. The Heparin Prophylaxis Study Group.Lancet.1996;347(9012):1357–1361.
- ,,,,.Meta‐analysis: anticoagulant prophylaxis to prevent symptomatic venous thromboembolism in hospitalized medical patients.Ann Intern Med.2007;146(4):278–288.
- National Quality Forum.National Voluntary Consensus Standards for Prevention and Care of Venous Thromboembolism: Policy, Preferred Practices, and Initial Performance Measures.Washington, DC;2006.
- ,,, et al.Risk factors for deep vein thrombosis in inpatients aged 65 and older: a case‐control multicenter study.J Am Geriatr Soc.2004;52(8):1299–1304.
- ,,.Risk factors for venous thrombosis in medical inpatients: validation of a thrombosis risk score.J Thromb Haemost.2004;2(12):2156–2161.
- ,,,,,.Venous thromboembolism prophylaxis and risk assessment in medical patients.Semin Thromb Hemost.1991;17(suppl 3):313–318.
- ,,, et al.A population‐based perspective of the hospital incidence and case‐fatality rates of deep vein thrombosis and pulmonary embolism. The Worcester DVT Study.Arch Intern Med.1991;151(5):933–938.
- Thromboembolic Risk Factors (THRIFT) Consensus Group.Risk of and prophylaxis for venous thromboembolism in hospital patients.BMJ.1992;305(6853):567–574.
- ,.Preventing Hospital‐Acquired Venous Thromboembolism: A Guide for Effective Quality Improvement. AHRQ Publication No. 08–0075.Rockville, MD:Agency for Healthcare Research and Quality;2008.
- ,,, et al.Electronic alerts to prevent venous thromboembolism among hospitalized patients.N Engl J Med.2005;352(10):969–977.
- ,,.Prophylaxis against venous thromboembolism.BMJ.1992;305(6862):1156.
- ,.Prevention of in‐hospital VTE: why can't we do better?Lancet.2008;371(9610):361–362.
Venous thromboembolism (VTE) is a major source of morbidity and mortality for hospitalized patients. Among medical patients at the highest risk, as many as 15% can be expected to develop a VTE during their hospital stay1, 2; however, among general medical patients, the incidence of symptomatic VTE is less than 1%,1 and potentially as low as 0.3%.3 Thromboprophylaxis with subcutaneous heparin reduces the risk of VTE by approximately 50%,4 and is therefore recommended for medical patients at high risk. However, heparin also increases the risk of bleeding and thrombocytopenia and thus should be avoided for patients at low risk of VTE. Consequently, the Joint Commission on Accreditation of Healthcare Organizations (JCAHO) recommends that all hospitalized medical patients receive a risk assessment for VTE.5
Certain disease states, including stroke, acute myocardial infarction, heart failure, respiratory disease, sepsis, and cancer, have been associated with increased risk for VTE, and, based on the inclusion criteria of several randomized trials, current American College of Chest Physicians (ACCP) guidelines recommend thromboprophylaxis for patients hospitalized with these diagnoses.2 However, evidence that these factors actually increase a patient's risk for VTE comes from studies of ambulatory patients and is often weak or conflicting. Existing risk‐stratification tools,6, 7 as well as the ACCP guidelines, have not been validated, and accordingly JCAHO does not specify how risk assessment should be conducted. In order to help clinicians better estimate the risk of VTE in medical patients and therefore to provide more targeted thromboprophylaxis, we examined a large cohort of patients with high‐risk diagnoses and created a risk stratification model.
Methods
Setting and Patients
We identified a retrospective cohort of patients discharged between January 1, 2004 and June 30, 2005 from 374 acute care facilities in the US that participated in Premier's Perspective, a database developed for measuring quality and healthcare utilization. Participating hospitals represent all regions of the US, and are generally similar in composition to US hospitals; however, in comparison to information contained in the American Hospital Association annual survey, Perspective hospitals are more likely to be located in the South and in urban areas. Available data elements include those derived from the uniform billing 04 form, such as sociodemographic information about each patient, their International Classification of Diseases, Ninth Revision, Clinical Modification (ICD‐9‐CM) diagnosis and procedure codes, as well as hospital and physician information. This information is supplemented with a date‐stamped log of all items and services billed to the patient or insurer, including diagnostic tests, medications, and other treatments. Permission to conduct the study was obtained from the Institutional Review Board at Baystate Medical Center.
We included all patients age 18 years at moderate‐to‐high risk of VTE according to the ACCP recommendations,8 based on a principal diagnosis of pneumonia, septicemia or respiratory failure with pneumonia, heart failure, chronic obstructive pulmonary disease (COPD), stroke, and urinary tract infection. Diagnoses were assessed using ICD‐9‐CM codes. Patients who were prescribed warfarin or therapeutic doses of heparin on hospital day 1 or 2, and those who received >1 therapeutic dose of heparin but otherwise did not fulfill criteria for VTE, were excluded because we could not evaluate whether they experienced a VTE event during hospitalization. We also excluded patients whose length of stay was <3 days, because our definition of hospital‐acquired VTE required treatment begun on day 3 or later, and those with an indication for anticoagulation other than VTE (eg, prosthetic cardiac valve or atrial fibrillation), because we could not reliably distinguish treatment for VTE from treatment of the underlying condition.
Risk Factors
For each patient, we extracted age, gender, race/ethnicity, and insurance status, principal diagnosis, comorbidities, and specialty of the attending physician. Comorbidities were identified from ICD‐9‐CM secondary diagnosis codes and Diagnosis Related Groups using Healthcare Cost and Utilization Project Comorbidity Software, version 3.1, based on the work of Elixhauser et al.9 We also assessed risk factors which have been previously linked to VTE: paralysis, cancer (metastatic, solid tumor, and lymphoma), chemotherapy/radiation, prior VTE, use of estrogens and estrogen modulators, inflammatory bowel disease, nephrotic syndrome, myeloproliferative disorders, obesity, smoking, central venous catheter, inherited or acquired thrombophilia, steroid use, mechanical ventilation, urinary catheter, decubitus ulcer, HMGco‐A reductase inhibitors, restraints, diabetes, varicose veins, and length‐of‐stay 6 days. These additional comorbidities were defined based on the presence of specific ICD‐9 codes, while use of HMG‐co‐A reductase inhibitors were identified from medication charge files. We also noted whether patients received anticoagulants, the dosages and days of administration, as well as intermittent pneumatic compression devices.
Identification of VTE
Because the presence of a secondary diagnosis of VTE in medical patients is not a reliable way of differentiating hospital‐acquired VTE from those present at the time of admission,10 subjects were considered to have experienced a hospital‐acquired VTE only if they underwent a diagnostic test for VTE (lower extremity ultrasound, venography, CT angiogram, ventilation‐perfusion scan, or pulmonary angiogram) on hospital day 3 or later, received treatment for VTE for at least 50% of the remaining hospital stay, or until initiation of warfarin or appearance of a complication (eg, transfusion or treatment for heparin‐induced thrombocytopenia) and were given a secondary diagnosis of VTE (ICD‐9 diagnoses 453.4, 453.40, 453.41, 453.42, 453.8, 453.9, 415.1, 415.11, 415.19). We considered the following to be treatments for VTE: intravenous unfractionated heparin, >60 mg of enoxaparin, 7500 mg of dalteparin, or placement of an inferior vena cava filter. In addition, patients who were readmitted within 30 days of discharge with a primary diagnosis of VTE were also considered to have developed a VTE as a complication of their previous hospital stay.
Statistical Analysis
Univariate predictors of VTE were assessed using chi‐square tests. We developed a multivariable logistic regression model for VTE on an 80% randomly selected subset of the eligible admissions (the derivation cohort) using all measured risk factors for VTE and selected interaction terms. Generalized estimating equations (GEE) models with a logit link (SAS PROC GENMOD) were used to account for the clustering of patients within hospitals. Initial models were stratified on VTE prophylaxis. Factors significant at P < 0.05 were retained. Parameter estimates derived from the model were used to compute individual VTE risk in the remaining 20% of the admissions (the validation cohort). Discrimination in the validation model was assessed by the c‐statistic, as well as the expected/observed ratio. Both cohorts were categorized by decile of risk, based on the probability distribution in the derivation cohort, and observed VTE events compared to those predicted by the model. All analyses were performed using the Statistical Analysis System (version 9.1, SAS Institute, Inc., Cary, NC).
Role of the Funding Source
This study was supported by a Clinical Scientist Development Award from the Doris Duke Charitable Foundation. The funding source had no role in the study design, analysis, or interpretation of the data.
Results
Our sample contained 242,738 patients, 194,198 (80%) assigned to the derivation set and 48,540 (20%) to the validation set. Patient characteristics were similar in both sets (Supporting Information Appendix Table 1). Most patients were over age 65, 59% were female, and 64% were white (Table 1). The most common primary diagnoses were pneumonia (33%) and congestive heart failure (19%). The most common comorbidities were hypertension (50%), diabetes (31%), chronic pulmonary disease (30%), and anemia (20%). Most patients were cared for by internists (54%) or family practitioners (21%), and 30% received some form of anticoagulant VTE prophylaxis (Table 2). Of patients with an ICD‐9 code for VTE during hospitalization, just over half lacked either diagnostic testing, treatment, or both, leaving 612 (0.25%) patients who fulfilled our criteria for VTE; an additional 440 (0.18%) were readmitted for VTE, for an overall incidence of 0.43%. Patients with a length of stay 6 days had an incidence of 0.79% vs 0.19% for patients with shorter stays.
| Total | No VTE | VTE | |||||
|---|---|---|---|---|---|---|---|
| Variable | N | % | N | % | N | % | P‐Value |
| Total | 242,738 | 100 | 241,686 | 100.0 | 1,052 | 100.0 | |
| Demographics | |||||||
| Age | 0.20 | ||||||
| 18‐49 | 31,065 | 12.8 | 30,952 | 12.8 | 113 | 10.7 | |
| 50‐64 | 51,309 | 21.1 | 51,083 | 21.1 | 226 | 21.5 | |
| 65‐74 | 51,230 | 21.1 | 50,993 | 21.1 | 237 | 22.5 | |
| 75+ | 109,134 | 45.0 | 108,658 | 45.0 | 476 | 45.2 | |
| Female | 142,910 | 58.9 | 142,330 | 58.9 | 580 | 55.1 | 0.01 |
| Race/ethnicity | 0.49 | ||||||
| White | 155,866 | 64.2 | 155,189 | 64.2 | 677 | 64.4 | |
| Black | 41,556 | 17.1 | 41,374 | 17.1 | 182 | 17.3 | |
| Hispanic | 9,809 | 4.0 | 9,776 | 4.0 | 33 | 3.1 | |
| Other | 35,507 | 14.6 | 35,347 | 14.6 | 160 | 15.2 | |
| Marital status | 0.28 | ||||||
| Married/life partner | 88,035 | 36.3 | 87,627 | 36.3 | 408 | 38.8 | |
| Single | 39,254 | 16.2 | 39,103 | 16.2 | 151 | 14.4 | |
| Separated/divorced | 23,492 | 9.7 | 23,394 | 9.7 | 98 | 9.3 | |
| Widowed | 58,669 | 24.2 | 58,426 | 24.2 | 243 | 23.1 | |
| Other | 33,288 | 13.7 | 33,136 | 13.7 | 152 | 14.4 | |
| Admission characteristics | |||||||
| Primary diagnosis | <0.001 | ||||||
| Community‐acquired pneumonia | 81,171 | 33.4 | 80,792 | 33.4 | 379 | 36.0 | |
| Septicemia | 7,643 | 3.2 | 7,568 | 3.1 | 75 | 7.1 | |
| Chronic obstructive pulmonary disease | 35,116 | 14.5 | 35,027 | 14.5 | 89 | 8.5 | |
| Respiratory failure | 7,098 | 2.9 | 7,012 | 2.9 | 86 | 8.2 | |
| Congestive heart failure | 46,503 | 19.2 | 46,336 | 19.2 | 167 | 15.9 | |
| Cardiovascular disease | 33,044 | 13.6 | 32,931 | 13.6 | 113 | 10.7 | |
| Urinary tract infection | 32,163 | 13.3 | 32,020 | 13.2 | 143 | 13.6 | |
| Insurance payer | 0.93 | ||||||
| Medicare traditional | 157,609 | 64.9 | 156,927 | 64.9 | 682 | 64.8 | |
| Medicare managed care | 10,649 | 4.4 | 10,597 | 4.4 | 52 | 4.9 | |
| Medicaid | 17,796 | 7.3 | 17,720 | 7.3 | 76 | 7.2 | |
| Private | 44,858 | 18.5 | 44,665 | 18.5 | 193 | 18.3 | |
| Self‐pay/uninsured/other | 11,826 | 4.9 | 11,777 | 4.9 | 49 | 4.7 | |
| Admitted from skilled nursing facility | 3,003 | 1.2 | 2,980 | 1.2 | 23 | 2.2 | 0.005 |
| Risk factors | |||||||
| Any VTE prophylaxis | 72,558 | 29.9 | 72,164 | 29.9 | 394 | 37.5 | <0.001 |
| Length of stay 6 days | 99,463 | 41.0 | 98,680 | 40.8 | 783 | 74.4 | <0.001 |
| Paralysis | 16,764 | 6.9 | 16,689 | 6.9 | 75 | 7.1 | 0.77 |
| Metastatic cancer | 5,013 | 2.1 | 4,928 | 2.0 | 85 | 8.1 | <0.001 |
| Solid tumor without metastasis | 25,127 | 10.4 | 24,995 | 10.3 | 132 | 12.5 | 0.02 |
| Lymphoma | 3,026 | 1.2 | 2,995 | 1.2 | 31 | 2.9 | <0.001 |
| Cancer chemotherapy/radiation | 1,254 | 0.5 | 1,231 | 0.5 | 23 | 2.2 | <0.001 |
| Prior venous thromboembolism | 2,945 | 1.2 | 2,926 | 1.2 | 19 | 1.8 | 0.08 |
| Estrogens | 4,819 | 2.0 | 4,807 | 2.0 | 12 | 1.1 | 0.05 |
| Estrogen modulators | 2,102 | 0.9 | 2,091 | 0.9 | 11 | 1.0 | 0.53 |
| Inflammatory bowel disease | 814 | 0.3 | 803 | 0.3 | 11 | 1.0 | <0.001 |
| Nephrotic syndrome | 520 | 0.2 | 517 | 0.2 | 3 | 0.3 | 0.62 |
| Myeloproliferative disorder | 1,983 | 0.8 | 1,973 | 0.8 | 10 | 1.0 | 0.63 |
| Obesity | 16,938 | 7.0 | 16,856 | 7.0 | 82 | 7.8 | 0.30 |
| Smoking | 35,386 | 14.6 | 35,284 | 14.6 | 102 | 9.7 | <0.001 |
| Central venous catheter | 14,754 | 6.1 | 14,525 | 6.0 | 229 | 21.8 | <0.001 |
| Inherited or acquired thrombophilia | 114 | 0.1 | 108 | 0.0 | 6 | 0.6 | <0.001 |
| Steroids | 82,606 | 34.0 | 82,185 | 34.0 | 421 | 40.0 | <0.001 |
| Mechanical ventilation | 13,347 | 5.5 | 13,167 | 5.4 | 180 | 17.1 | <0.001 |
| Urinary catheter | 39,080 | 16.1 | 38,816 | 16.1 | 264 | 25.1 | <0.001 |
| Decubitus ulcer | 6,829 | 2.8 | 6,776 | 2.8 | 53 | 5.0 | <0.001 |
| Statins use | 57,282 | 23.6 | 57,068 | 23.6 | 214 | 20.3 | 0.01 |
| Use of restraints | 5,970 | 2.5 | 5,914 | 2.4 | 56 | 5.3 | <0.001 |
| Diabetes mellitus | 75,103 | 30.9 | 74,799 | 30.9 | 304 | 28.9 | 0.15 |
| Varicose veins | 166 | 0.1 | 165 | 0.1 | 1 | 0.1 | 0.74 |
| Comorbidities | |||||||
| Hypertension | 120,606 | 49.7 | 120,126 | 49.7 | 480 | 45.6 | 0.008 |
| Congestive heart failure | 18,900 | 7.8 | 18,793 | 7.8 | 107 | 10.2 | 0.004 |
| Peripheral vascular disease | 16,705 | 6.9 | 16,639 | 6.9 | 66 | 6.3 | 0.43 |
| Valvular disease | 13,683 | 5.6 | 13,628 | 5.6 | 55 | 5.2 | 0.56 |
| Pulmonary circulation disease | 5,530 | 2.3 | 5,492 | 2.3 | 38 | 3.6 | 0.004 |
| Chronic pulmonary disease | 72,028 | 29.7 | 71,698 | 29.7 | 330 | 31.4 | 0.23 |
| Respiratory failure second diagnosis | 13,027 | 5.4 | 12,893 | 5.3 | 134 | 12.7 | <0.001 |
| Rheumatoid arthritis/collagen vascular disease | 7,090 | 2.9 | 7,050 | 2.9 | 40 | 3.8 | 0.09 |
| Deficiency anemias | 49,605 | 20.4 | 49,352 | 20.4 | 253 | 24.0 | 0.004 |
| Weight loss | 8,810 | 3.6 | 8,714 | 3.6 | 96 | 9.1 | <0.001 |
| Peptic ulcer disease bleeding | 4,736 | 2.0 | 4,723 | 2.0 | 13 | 1.2 | 0.09 |
| Chronic blood loss anemia | 2,354 | 1.0 | 2,338 | 1.0 | 16 | 1.5 | 0.07 |
| Hypothyroidism | 28,773 | 11.9 | 28,668 | 11.9 | 105 | 10.0 | 0.06 |
| Renal failure | 19,768 | 8.1 | 19,669 | 8.1 | 99 | 9.4 | 0.13 |
| Liver disease | 4,682 | 1.9 | 4,657 | 1.9 | 25 | 2.4 | 0.29 |
| Other neurological disorders | 33,094 | 13.6 | 32,905 | 13.6 | 189 | 18.0 | <0.001 |
| Psychoses | 9,330 | 3.8 | 9,283 | 3.8 | 47 | 4.5 | 0.29 |
| Depression | 25,561 | 10.5 | 25,442 | 10.5 | 119 | 11.3 | 0.41 |
| Alcohol abuse | 7,756 | 3.2 | 7,727 | 3.2 | 29 | 2.8 | 0.42 |
| Drug abuse | 4,336 | 1.8 | 4,318 | 1.8 | 18 | 1.7 | 0.85 |
| Acquired immune deficiency syndrome | 1,048 | 0.4 | 1,045 | 0.4 | 3 | 0.3 | 0.47 |
| Total | Derivation | Validation | |||||
|---|---|---|---|---|---|---|---|
| Variable | N | % | N | % | N | % | P‐Value |
| |||||||
| Total | 242,738 | 100 | 194,198 | 100 | 48,540 | 100 | |
| VTE prophylaxis | 0.97 | ||||||
| No prophylaxis | 170,180 | 70.1 | 136,153 | 70.1 | 34,027 | 70.1 | |
| Any prophylaxis | 72,558 | 29.9 | 58,045 | 29.9 | 14,513 | 29.9 | |
| Outcomes | |||||||
| ICD‐9 code for VTE | 1,304 | 0.5 | 1,025 | 0.5 | 279 | 0.6 | 0.21 |
| ICD‐9 code + diagnostic test | 989 | 0.4 | 777 | 0.4 | 212 | 0.4 | 0.26 |
| ICD‐9 code + diagnostic test + treatment for VTE | 612 | 0.3 | 471 | 0.2 | 141 | 0.3 | 0.06 |
| Readmission for VTE within 30 days | 446 | 0.2 | 363 | 0.2 | 83 | 0.2 | 0.46 |
| Total hospital‐acquired VTE | 1,052 | 0.4 | 829 | 0.4 | 223 | 0.5 | 0.33 |
| In‐hospital mortality | 8,019 | 3.3 | 6,403 | 3.3 | 1,616 | 3.3 | 0.72 |
| Any readmission within 30 days | 28,664 | 11.8 | 22,885 | 11.8 | 5,779 | 11.9 | 0.46 |
Risk factors for VTE
A large number of patient and hospital factors were associated with the development of VTE (Table 1). Due to the large sample size, even weak associations appear highly statistically significant. Compared to patients without VTE, those with VTE were more likely to have received VTE prophylaxis (37% vs 30%, P < 0.001). However, models of patients receiving prophylaxis and of patients not receiving prophylaxis produced similar odds ratios for the various risk factors (Supporting Information Appendix Table 2); therefore, the final model includes both patients who did, and did not, receive VTE prophylaxis. In the multivariable model (Supporting Information Appendix Table 3), age, length of stay, gender, primary diagnosis, cancer, inflammatory bowel disease, obesity, central venous catheter, inherited thrombophilia, steroid use, mechanical ventilation, active chemotherapy, and urinary catheters were all associated with VTE (Table 3). The strongest risk factors were length of stay 6 days (OR 3.22, 95% CI 2.73, 3.79), central venous catheter (OR 1.87, 95% CI 1.52, 2.29), inflammatory bowel disease (OR 3.11, 95% CI 1.59, 6.08), and inherited thrombophilia (OR 4.00, 95% CI 0.98, 16.40). In addition, there were important interactions between age and cancer; cancer was a strong risk factor among younger patients, but is not as strong a risk factor among older patients (OR compared to young patients without cancer was 4.62 (95% CI 2.72, 7.87) for those age 1849 years, and 3.64 (95% CI 2.52, 5.25) for those aged 5064 years).
| Risk Factor | OR | 95% CI |
|---|---|---|
| ||
| Any prophylaxis | 0.98 | (0.84, 1.14) |
| Female | 0.85 | (0.74, 0.98) |
| Length of stay 6 days | 3.22 | (2.73, 3.79) |
| Age* | ||
| 18‐49 years | 1 | Referent |
| 50‐64 years | 1.15 | (0.86, 1.56) |
| >65 years | 1.51 | (1.17, 1.96) |
| Primary diagnosis | ||
| Pneumonia | 1 | Referent |
| Chronic obstructive pulmonary disease | 0.57 | (0.44, 0.75) |
| Stroke | 0.84 | (0.66, 1.08) |
| Congestive heart failure | 0.86 | (0.70, 1.06) |
| Urinary tract infection | 1.19 | (0.95, 1.50) |
| Respiratory failure | 1.15 | (0.85, 1.55) |
| Septicemia | 1.11 | (0.82, 1.50) |
| Comorbidities | ||
| Inflammatory bowel disease | 3.11 | (1.59, 6.08) |
| Obesity | 1.28 | (0.99, 1.66) |
| Inherited thrombophilia | 4.00 | (0.98, 16.40) |
| Cancer | ||
| 18‐49 years | 4.62 | (2.72, 7.87) |
| 50‐64 years | 3.64 | (2.52, 5.25) |
| >65 years | 2.17 | (1.61, 2.92) |
| Treatments | ||
| Central venous catheter | 1.87 | (1.52, 2.29) |
| Mechanical ventilation | 1.61 | (1.27, 2.05) |
| Urinary catheter | 1.17 | (0.99, 1.38) |
| Chemotherapy | 1.71 | (1.03, 2.83) |
| Steroids | 1.22 | (1.04, 1.43) |
In the derivation set, the multivariable model produced deciles of mean predicted risk from 0.11% to 1.45%, while mean observed risk over the same deciles ranged from 0.12% to 1.42% (Figure 1). Within the validation cohort, the observed rate of VTE was 0.46% (223 cases among 48,543 subjects). The expected rate according to the model was 0.43% (expected/observed ratio: 0.93 [95% CI 0.82, 1.06]). Model discrimination measured by the c‐statistic in the validation set was 0.75 (95% CI 0.71, 0.78). The model produced deciles of mean predicted risk from 0.11% to 1.46%, with mean observed risk over the same deciles from 0.17% to 1.81%. Risk gradient was relatively flat across the first 6 deciles, began to rise at the seventh decile, and rose sharply in the highest one. Using a risk threshold of 1%, the model had a sensitivity of 28% and a specificity of 93%. In the validation set, this translated into a positive predictive value of 2.2% and a negative predictive value of 99.7%. Assuming that VTE prophylaxis has an efficacy of 50%, the number‐needed‐to‐treat to prevent one VTE among high‐risk patients (predicted risk >1%) would be 91. In contrast, providing prophylaxis to the entire validation sample would result in a number‐needed‐to‐treat of 435. Using a lower treatment threshold of 0.4% produced a positive predictive value of 1% and a negative predictive value of 99.8%. At this threshold, the model would detect 73% of patients with VTE and the number‐needed‐to‐treat to prevent one VTE would be 200.
Discussion
In a representative sample of 243,000 hospitalized medical patients with at least one major risk factor for VTE, we found that symptomatic VTE was an uncommon event, occurring in approximately 1 in 231 patients. We identified a number of factors that were associated with an increased risk of VTE, but many previously cited risk factors did not show an association in multivariable models. In particular, patients with a primary diagnosis of COPD appeared not to share the same high risk of VTE as patients with the other diagnoses we examined, a finding reported by others.11 The risk model we developed accurately stratifies patients across a wide range of VTE probabilities, but even among those with the highest predicted rates, symptomatic VTE occurred in less than 2%.
VTE is often described as a frequent complication of hospitalization for medical illness and one of the most common potentially preventable causes of death. Indeed, rates of asymptomatic VTE have been demonstrated to be 3.7% to 26%.12 Although some of these might have fatal consequences, most are distal vein thromboses and their significance is unknown. In contrast, symptomatic events are uncommon, with previous estimates among general medical patients in observational studies in the range of 0.3%3 to 0.8%,12 similar to the rate observed in our study. Symptomatic event rates among control patients in landmark randomized trials have ranged from 0.86%13 to 2.3%,14 but these studies enrolled only very high‐risk patients with more extended hospitalizations, and may involve follow‐up periods of a month or more.
Because it is unlikely that our diagnostic algorithm was 100% sensitive, and because 30% of our patients received chemoprophylaxis, it is probable that we have underestimated the true rate of VTE in our sample. Among the patients who received prophylaxis, the observed rate of VTE was 0.54%. If we assume that prophylaxis is 50% effective, then had these patients not received prophylaxis, their rate of VTE would have been 1.08% (vs 0.39% among those patients who received no prophylaxis) and the overall rate of VTE for the sample would have been 0.60% (1.08 0.30 + 0.39 0.70). If we further assume that our algorithm was only 80% sensitive and 100% specific, the true underlying rate of symptomatic VTE could have been as high as 0.75%, still less than half that seen in randomized trials.
Prophylaxis with heparin has been shown to decrease the rate of both asymptomatic and symptomatic events, but because of the low prevalence, the number‐needed‐to‐treat to prevent one symptomatic pulmonary embolism has been estimated at 345, and prophylaxis has not been shown to affect all‐cause mortality.4, 15 At the same time, prophylaxis costs money, is uncomfortable, and carries a small risk of bleeding and heparin‐induced thrombocytopenia. Given the generally low incidence of symptomatic VTE, it therefore makes sense to reserve prophylaxis for patients at higher risk of thromboembolism.
To decide whether prophylaxis is appropriate for a given patient, it is necessary to quantify the patient's risk and then apply an appropriate threshold for treatment. The National Quality Forum (NQF) recommends,16 and JCAHO has adopted, that a clinician must evaluate each patient upon admission, and regularly thereafter, for the risk of developing DVT [deep vein thrombosis]/VTE. Until now, however, there has been no widely accepted, validated method to risk stratify medical patients. The ACCP recommendations cite just three studies of VTE risk factors in hospitalized medical patients.11, 17, 18 Together they examined 477 cases and 1197 controls, identifying congestive heart failure, pneumonia, cancer, and previous VTE as risk factors. Predictive models based on these factors17, 1921 have not been subjected to validation or have performed poorly.18 Acknowledging this lack of standardized risk assessment, JCAHO leaves the means of assessment to individual hospitals. A quality improvement guide published by the Agency for Healthcare Research and Quality goes one step further, stating that In a typical hospital, it is estimated that fewer than 5% of medical patients could be considered at low risk by most VTE risk stratification methods.22 The guide recommends near universal VTE prophylaxis.
In light of the JCAHO requirements, our model should be welcomed by hospitalists. Rather than assuming that all patients over 40 years of age are at high risk, our model will enable clinicians to risk stratify patients from a low of 0.1% to >1.4% (>10‐fold increase in risk). Moreover, the model was derived from more than 800 episodes of symptomatic VTE among almost 190,000 general medical patients and validated on almost 50,000 more. The observed patients were cared for in clinical practice at a nationally representative group of US hospitals, not in a highly selected clinical trial, increasing the generalizability of our findings. Finally, the model includes ten common risk factors that can easily be entered into decision support software or extracted automatically from the electronic medical record. Electronic reminder systems have already been shown to increase use of VTE prophylaxis, and prevent VTE, especially among cancer patients.23
A more challenging task is defining the appropriate risk threshold to initiate VTE prophylaxis. The Thromboembolic Risk Factors (THRIFT) Consensus Group classified patients according to risk of proximal DVT as low (<1%), moderate (1%‐10%), and high (>10%).21 They recommended heparin prophylaxis for all patients at moderate risk or higher. Although the patients included in our study all had a diagnosis that warranted prophylaxis according to the ACCP guidelines, using the THRIFT threshold for moderate‐to‐high risk, only 7% of our patients should have received prophylaxis. The recommendation not to offer heparin prophylaxis to patients with less than 1% chance of developing symptomatic VTE seems reasonable, given the large number‐needed‐to‐treat, but formal decision analyses should be conducted to better define this threshold. Many hospitalists, however, may feel uncomfortable using the 1% threshold, because our model failed to identify almost three out of four patients who ultimately experienced symptomatic VTE. At that threshold, it would seem that hospital‐acquired VTE is not a preventable complication in most medical patients, as others have pointed out.3, 24 Alternatively, if the threshold were lowered to 0.4%, our model could reduce the use of prophylaxis by 60%, while still identifying three‐fourths of all VTE cases. Further research is needed to know whether such a threshold is reasonable.
Our study has a number of important limitations. First, we relied on claims data, not chart review. We do not know for certain which patients experienced VTE, although our definition of VTE required diagnosis codes plus charges for both diagnosis and treatment. Moreover, our rates are similar to those observed in other trials where symptomatic events were confirmed. Second, about 30% of our patients received at least some VTE prophylaxis, and this may have prevented as many as half of the VTEs in that group. Without prophylaxis, rates might have been 20%30% higher. Similarly, we could not detect patients who were diagnosed after discharge but not admitted to hospital. While we believe this number to be small, it would again increase the rate slightly. Third, we could not assess certain clinical circumstances that are not associated with hospital charges or diagnosis codes, especially prolonged bed rest. Other risk factors, such as the urinary catheter, were probably surrogate markers for immobilization rather than true risk factors. Fourth, we included length of stay in our prediction model. We did this because most randomized trials of VTE prophylaxis included only patients with an expected length of stay 6 days. Physicians' estimates about probable length of stay may be less accurate than actual length of stay as a predictor of VTE. Moreover, the relationship may have been confounded if hospital‐acquired VTE led to longer lengths of stay. We think this unlikely since many of the events were discovered on readmission. Fifth, we studied only patients carrying high‐risk diagnoses, and therefore do not know the baseline risk for patients with less risky conditions, although it should be lower than what we observed. It seems probable that COPD, rather than being protective, as it appears in our model, actually represents the baseline risk for low‐risk diagnoses. It should be noted that we did include a number of other high‐risk diagnoses, such as cancer and inflammatory bowel disease, as secondary diagnoses. A larger, more inclusive study should be conducted to validate our model in other populations. Finally, we cannot know who died of undiagnosed VTE, either in the hospital or after discharge. Such an outcome would be important, but those events are likely to be rare, and VTE prophylaxis has not been shown to affect mortality.
VTE remains a daunting problem in hospitalized medical patients. Although VTE is responsible for a large number of hospital deaths each year, identifying patients at high risk for clinically important VTE is challenging, and may contribute to the persistently low rates of VTE prophylaxis seen in hospitals.25 Current efforts to treat nearly all patients are likely to lead to unnecessary cost, discomfort, and side effects. We present a simple logistic regression model that can easily identify patients at moderate‐to‐high risk (>1%) of developing symptomatic VTE. Future studies should focus on prospectively validating the model in a wider spectrum of medical illness, and better defining the appropriate risk cutoff for general prophylaxis.
Acknowledgements
The authors thank Aruna Priya, MS, for her help with some of the statistical analyses.
- ,,, et al.A comparison of enoxaparin with placebo for the prevention of venous thromboembolism in acutely ill medical patients. Prophylaxis in Medical Patients with Enoxaparin Study Group.N Engl J Med.1999;341(11):793–800.
- ,,, et al.Prevention of venous thromboembolism: American College of Chest Physicians Evidence‐Based Clinical Practice Guidelines (8th ed).Chest.2008;133(6 suppl):381S–453S.
- ,,.Thrombosis prophylaxis in hospitalised medical patients: does prophylaxis in all patients make sense?Neth J Med.2000;56(5):171–176.
- ,,,,.Pharmacological venous thromboembolism prophylaxis in hospitalized medical patients: a meta‐analysis of randomized controlled trials.Arch Intern Med.2007;167(14):1476–1486.
- The Joint Commission on the Accreditation of Healthcare Organizations. Venous thromboembolism (VTE) core measure set. Available at: http://www. jointcommission.org/PerformanceMeasurement/PerformanceMeasurement/VTE.htm. Accessed June 1,2009.
- ,,.Effective risk stratification of surgical and nonsurgical patients for venous thromboembolic disease.Semin Hematol.2001;38(2 suppl 5):12–19.
- ,,, et al.Assessment of venous thromboembolism risk and the benefits of thromboprophylaxis in medical patients.Thromb Haemost.2005;94(4):750–759.
- ,,, et al.Prevention of venous thromboembolism: the Seventh ACCP Conference on Antithrombotic and Thrombolytic Therapy.Chest.2004;126(3 suppl):338S–400S.
- ,,,.Comorbidity measures for use with administrative data.Med Care.1998;36(1):8–27.
- ,,,,,.Identification of in‐hospital complications from claims data. Is it valid?Med Care.2000;38(8):785–795.
- ,,, et al.Risk factors for venous thromboembolism in hospitalized patients with acute medical illness: analysis of the MEDENOX Study.Arch Intern Med.2004;164(9):963–968.
- ,,.The magnitude of an iatrogenic disorder: a systematic review of the incidence of venous thromboembolism for general medical inpatients.Thromb Haemost.2006;95(5):758–762.
- ,,,,,.Randomized, placebo‐controlled trial of dalteparin for the prevention of venous thromboembolism in acutely ill medical patients.Circulation.2004;110(7):874–879.
- .Randomised, controlled trial of low‐dose heparin for prevention of fatal pulmonary embolism in patients with infectious diseases. The Heparin Prophylaxis Study Group.Lancet.1996;347(9012):1357–1361.
- ,,,,.Meta‐analysis: anticoagulant prophylaxis to prevent symptomatic venous thromboembolism in hospitalized medical patients.Ann Intern Med.2007;146(4):278–288.
- National Quality Forum.National Voluntary Consensus Standards for Prevention and Care of Venous Thromboembolism: Policy, Preferred Practices, and Initial Performance Measures.Washington, DC;2006.
- ,,, et al.Risk factors for deep vein thrombosis in inpatients aged 65 and older: a case‐control multicenter study.J Am Geriatr Soc.2004;52(8):1299–1304.
- ,,.Risk factors for venous thrombosis in medical inpatients: validation of a thrombosis risk score.J Thromb Haemost.2004;2(12):2156–2161.
- ,,,,,.Venous thromboembolism prophylaxis and risk assessment in medical patients.Semin Thromb Hemost.1991;17(suppl 3):313–318.
- ,,, et al.A population‐based perspective of the hospital incidence and case‐fatality rates of deep vein thrombosis and pulmonary embolism. The Worcester DVT Study.Arch Intern Med.1991;151(5):933–938.
- Thromboembolic Risk Factors (THRIFT) Consensus Group.Risk of and prophylaxis for venous thromboembolism in hospital patients.BMJ.1992;305(6853):567–574.
- ,.Preventing Hospital‐Acquired Venous Thromboembolism: A Guide for Effective Quality Improvement. AHRQ Publication No. 08–0075.Rockville, MD:Agency for Healthcare Research and Quality;2008.
- ,,, et al.Electronic alerts to prevent venous thromboembolism among hospitalized patients.N Engl J Med.2005;352(10):969–977.
- ,,.Prophylaxis against venous thromboembolism.BMJ.1992;305(6862):1156.
- ,.Prevention of in‐hospital VTE: why can't we do better?Lancet.2008;371(9610):361–362.
Copyright © 2011 Society of Hospital Medicine
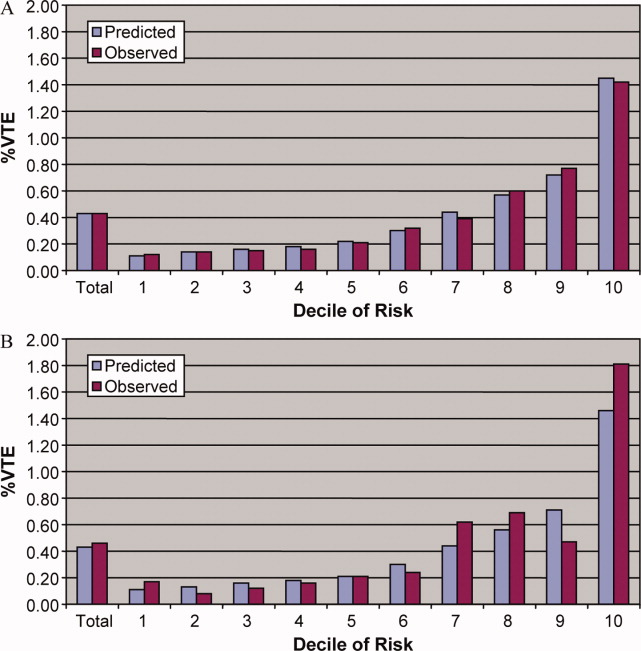
Continuing Medical Education Program in
If you wish to receive credit for this activity, which beginson the next page, please refer to the website:
Accreditation and Designation Statement
Blackwell Futura Media Services designates this educational activity for a 1 AMA PRA Category 1 Credit. Physicians should only claim credit commensurate with the extent of their participation in the activity.
Blackwell Futura Media Services is accredited by the Accreditation Council for Continuing Medical Education to provide continuing medical education for physicians.
Educational Objectives
Upon completion of this educational activity, participants will be better able to:
-
Identify the approximate 30‐day readmission rate of Medicare patient hospitalized initially for pneumonia.
-
Distinguish which variables were accounted and unaccounted for in the development of a pneumonia readmission model.
Continuous participation in the Journal of Hospital Medicine CME program will enable learners to be better able to:
-
Interpret clinical guidelines and their applications for higher quality and more efficient care for all hospitalized patients.
-
Describe the standard of care for common illnesses and conditions treated in the hospital; such as pneumonia, COPD exacerbation, acute coronary syndrome, HF exacerbation, glycemic control, venous thromboembolic disease, stroke, etc.
-
Discuss evidence‐based recommendations involving transitions of care, including the hospital discharge process.
-
Gain insights into the roles of hospitalists as medical educators, researchers, medical ethicists, palliative care providers, and hospital‐based geriatricians.
-
Incorporate best practices for hospitalist administration, including quality improvement, patient safety, practice management, leadership, and demonstrating hospitalist value.
-
Identify evidence‐based best practices and trends for both adult and pediatric hospital medicine.
Instructions on Receiving Credit
For information on applicability and acceptance of continuing medical education credit for this activity, please consult your professional licensing board.
This activity is designed to be completed within the time designated on the title page; physicians should claim only those credits that reflect the time actually spent in the activity. To successfully earn credit, participants must complete the activity during the valid credit period that is noted on the title page.
Follow these steps to earn credit:
-
Log on to
www.blackwellpublishing.com/cme . -
Read the target audience, learning objectives, and author disclosures.
-
Read the article in print or online format.
-
Reflect on the article.
-
Access the CME Exam, and choose the best answer to each question.
-
Complete the required evaluation component of the activity.