User login
Treatment Trends and Outcomes in Healthcare-Associated Pneumonia
Bacterial pneumonia remains an important cause of morbidity and mortality in the United States, and is the 8th leading cause of death with 55,227 deaths among adults annually.1 In 2005, the American Thoracic Society (ATS) and the Infectious Diseases Society of America (IDSA) collaborated to update guidelines for hospital-acquired pneumonia (HAP), ventilator-associated pneumonia, and healthcare-associated pneumonia (HCAP).2 This broad document outlines an evidence-based approach to diagnostic testing and antibiotic management based on the epidemiology and risk factors for these conditions. The guideline specifies the following criteria for HCAP: hospitalization in the past 90 days, residence in a skilled nursing facility (SNF), home infusion therapy, hemodialysis, home wound care, family members with multidrug resistant organisms (MDRO), and immunosuppressive diseases or medications, with the presumption that these patients are more likely to be harboring MDRO and should thus be treated empirically with broad-spectrum antibiotic therapy. Prior studies have shown that patients with HCAP have a more severe illness, are more likely to have MDRO, are more likely to be inadequately treated, and are at a higher risk for mortality than patients with community-acquired pneumonia (CAP).3,4
These guidelines are controversial, especially in regard to the recommendations to empirically treat broadly with 2 antibiotics targeting Pseudomonas species, whether patients with HCAP merit broader spectrum coverage than patients with CAP, and whether the criteria for defining HCAP are adequate to predict which patients are harboring MDRO. It has subsequently been proposed that HCAP is more related to CAP than to HAP, and a recent update to the guideline removed recommendations for treatment of HCAP and will be placing HCAP into the guidelines for CAP instead.5 We sought to investigate the degree of uptake of the ATS and IDSA guideline recommendations by physicians over time, and whether this led to a change in outcomes among patients who met the criteria for HCAP.
METHODS
Setting and Patients
We identified patients discharged between July 1, 2007, and November 30, 2011, from 488 US hospitals that participated in the Premier database (Premier Inc., Charlotte, North Carolina), an inpatient database developed for measuring quality and healthcare utilization. The database is frequently used for healthcare research and has been described previously.6 Member hospitals are in all regions of the US and are generally reflective of US hospitals. This database contains multiple data elements, including sociodemographic information, International Classification of Diseases, 9th Revision-Clinical Modification (ICD-9-CM) diagnosis and procedure codes, hospital and physician information, source of admission, and discharge status. It also includes a date-stamped log of all billed items and services, including diagnostic tests, medications, and other treatments. Because the data do not contain identifiable information, the institutional review board at our medical center determined that this study did not constitute human subjects research.
We included all patients aged ≥18 years with a principal diagnosis of pneumonia or with a secondary diagnosis of pneumonia paired with a principal diagnosis of respiratory failure, acute respiratory distress syndrome, respiratory arrest, sepsis, or influenza. Patients were excluded if they were transferred to or from another acute care institution, had a length of stay of 1 day or less, had cystic fibrosis, did not have a chest radiograph, or did not receive antibiotics within 48 hours of admission.
For each patient, we extracted age, gender, principal diagnosis, comorbidities, and the specialty of the attending physician. Comorbidities were identified from ICD-9-CM secondary diagnosis codes and Diagnosis Related Groups by using Healthcare Cost and Utilization Project Comorbidity Software, version 3.1, based on the work of Elixhauser (Agency for Healthcare Research and Quality, Rockville, Maryland).7 In order to ensure that patients had HCAP, we required the presence of ≥1 HCAP criteria, including hospitalization in the past 90 days, hemodialysis, admission from an SNF, or immune suppression (which was derived from either a secondary diagnosis for neutropenia, hematological malignancy, organ transplant, acquired immunodeficiency virus, or receiving immunosuppressant drugs or corticosteroids [equivalent to ≥20 mg/day of prednisone]).
Definitions of Guideline-Concordant and Discordant Antibiotic Therapy
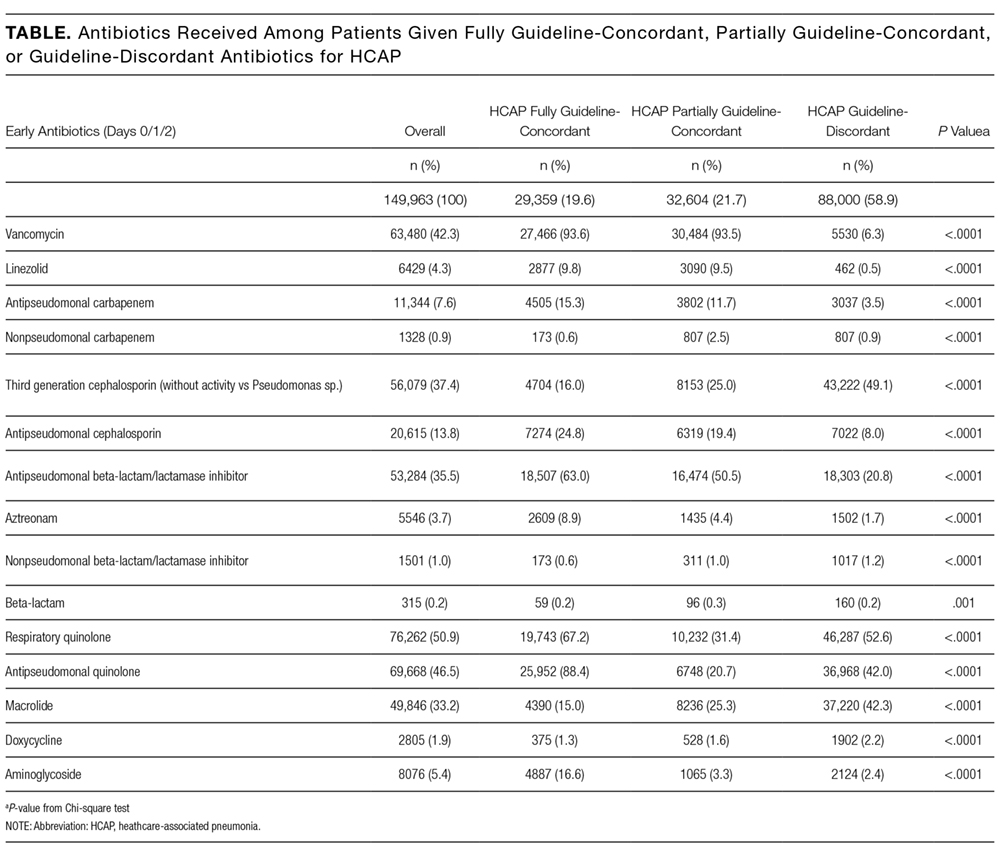
The ATS and IDSA guidelines recommended the following antibiotic combinations for HCAP: an antipseudomonal cephalosporin or carbapenem or a beta-lactam/lactamase inhibitor, plus an antipseudomonal quinolone or aminoglycoside, plus an antibiotic with activity versus methicillin resistant Staphylococcus aureus (MRSA), such as vancomycin or linezolid. Based on these guidelines, we defined the receipt of fully guideline-concordant antibiotics as 2 recommended antibiotics for Pseudomonas species plus 1 for MRSA administered by the second day of admission. Partially guideline-concordant antibiotics were defined as 1 recommended antibiotic for Pseudomonas species plus 1 for MRSA by the second day of hospitalization. Guideline-discordant antibiotics were defined as all other combinations.
Statistical Analysis
Descriptive statistics on patient characteristics are presented as frequency, proportions for categorical factors, and median with interquartile range (IQR) for continuous variables for the full cohort and by treatment group, defined as fully or partially guideline-concordant antibiotic therapy or discordant therapy. Hospital rates of fully guideline-concordant treatment are presented overall and by hospital characteristics. The association of hospital characteristics with rates of fully guideline-concordant therapy were assessed by using 1-way analysis of variance tests.
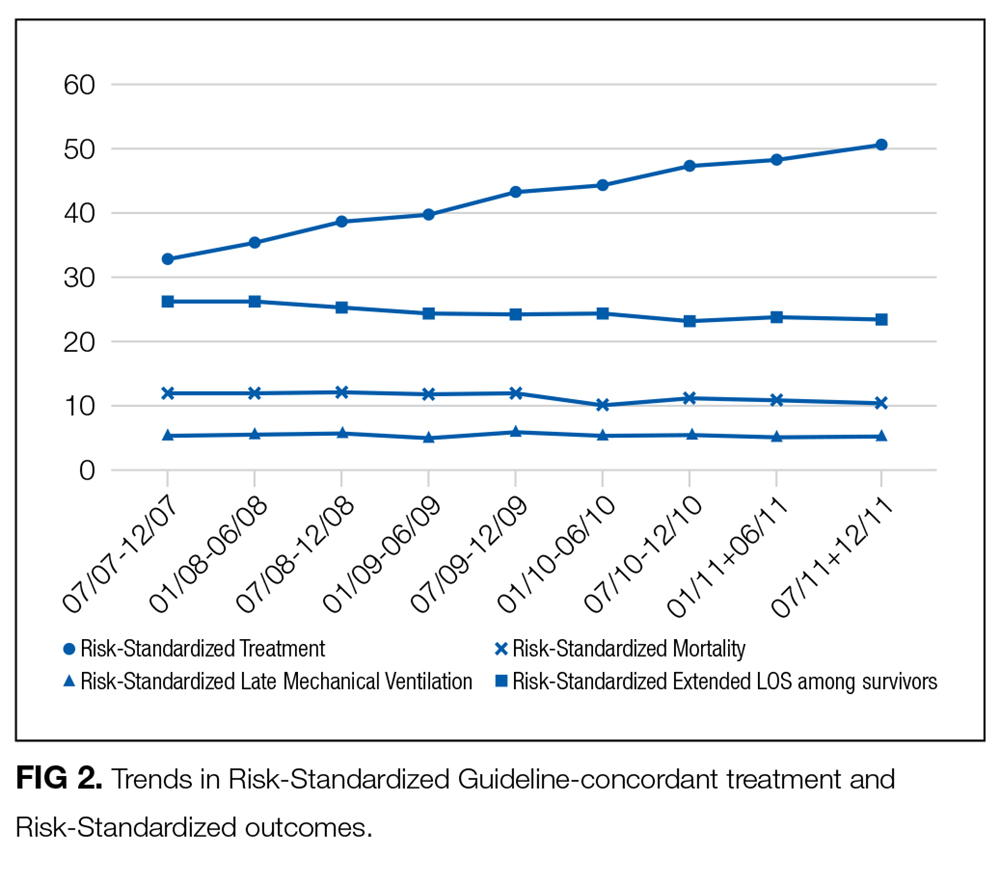
To assess trends across hospitals for the association between the use of guideline-concordant therapy and mortality, progression to respiratory failure as measured by the late initiation of invasive mechanical ventilation (day 3 or later), and the length of stay among survivors, we divided the 4.5-year study period into 9 intervals of 6 months each; 292 hospitals that submitted data for all 9 time points were examined in this analysis. Based on the distribution of length of stay in the first time period, we created an indicator variable for extended length of stay with length of stay at or above the 75th percentile, defined as extended. For each hospital at each 6-month interval, we then computed risk-standardized guideline-concordant treatment (RS-treatment) rates and risk-standardized in-hospital outcome rates similar to methods used by the Centers for Medicare and Medicaid Services for public reporting.8 For each hospital at each time interval, we estimated a predicted rate of guideline-concordant treatment as the sum of predicted probabilities of guideline-concordant treatment from patient factors and the random intercept for the hospital in which they were admitted. We then calculated the expected rate of guideline-concordant treatment as the sum of expected probabilities of treatment received from patient factors only. RS-treatment was then calculated as the ratio of predicted to expected rates multiplied by the overall unadjusted mean treatment rate from all patients.9 We repeated the same modeling strategy to calculate risk-standardized outcome (RS-outcome) rates for each hospital across all time points. All models were adjusted for patient demographics and comorbidities. Similar models using administrative data have moderate discrimination for mortality.10
We then fit mixed-effects linear models with random hospital intercept and slope across time for the RS-treatment and outcome rates, respectively. From these models, we estimated the mean slope for RS-treatment and for RS-outcome over time. In addition, we estimated a slope or trend over time for each hospital for treatment and for outcome and evaluated the correlation between the treatment and outcome trends.
All analyses were performed using the Statistical Analysis System version 9.4 (SAS Institute Inc., Cary, NC) and STATA release 13 (StataCorp, LLC, College Station, Texas).
RESULTS

DISCUSSION
In this large, retrospective cohort study, we found that there was a substantial gap between the empiric antibiotics recommended by the ATS and IDSA guidelines and the empiric antibiotics that patients actually received. Over the study period, we saw an increased adherence to guidelines, in spite of growing evidence that HCAP risk factors do not adequately predict which patients are at risk for infection with an MDRO.11 We used this change in antibiotic prescribing behavior over time to determine if there was a clinical impact on patient outcomes and found that at the hospital level, there were no improvements in mortality, excess length of stay, or progression to respiratory failure despite a doubling in guideline-concordant antibiotic use.
At least 2 other large studies have assessed the association between guideline-concordant therapy and outcomes in HCAP.12,13 Both found that guideline-concordant therapy was associated with increased mortality, despite propensity matching. Both were conducted at the individual patient level by using administrative data, and results were likely affected by unmeasured clinical confounders, with sicker patients being more likely to receive guideline-concordant therapy. Our focus on the outcomes at the hospital level avoids this selection bias because the overall severity of illness of patients at any given hospital would not be expected to change over the study period, while physician uptake of antibiotic prescribing guidelines would be expected to increase over time. Determining the correlation between increases in guideline adherence and changes in patient outcome may offer a better assessment of the impact of guideline adherence. In this regard, our results are similar to those achieved by 1 quality improvement collaborative that was aimed at increasing guideline concordant therapy in ICUs. Despite an increase in guideline concordance from 33% to 47% of patients, they found no change in overall mortality.14
There were several limitations to our study. We did not have access to microbiologic data, so we were unable to determine which patients had MDRO infection or determine antibiotic-pathogen matching. However, the treating physicians in our study population presumably did not have access to this data at the time of treatment either because the time period we examined was within the first 48 hours of hospitalization, the interval during which cultures are incubating and the patients are being treated empirically. In addition, there may have been HCAP patients that we failed to identify, such as patients who were admitted in the past 90 days to a hospital that does not submit data to Premier. However, it is unlikely that prescribing for such patients should differ systematically from what we observed. While the database draws from 488 hospitals nationwide, it is possible that practices may be different at facilities that are not contained within the Premier database, such as Veterans Administration Hospitals. Similarly, we did not have readings for chest x-rays; hence, there could be some patients in the dataset who did not have pneumonia. However, we tried to overcome this by including only those patients with a principal diagnosis of pneumonia or sepsis with a secondary pneumonia diagnosis, a chest x-ray, and antibiotics administered within the first 48 hours of admission.
There are likely several reasons why so few HCAP patients in our study received guideline-concordant antibiotics. A lack of knowledge about the ATS and IDSA guidelines may have impacted the physicians in our study population. El-Solh et al.15 surveyed physicians about the ATS-IDSA guidelines 4 years after publication and found that only 45% were familiar with the document. We found that the rate of prescribing at least partially guideline-concordant antibiotics rose steadily over time, supporting the idea that the newness of the guidelines was 1 barrier. Additionally, prior studies have shown that many physicians may not agree with or choose to follow guidelines, with only 20% of physicians indicating that guidelines have a major impact on their clinical decision making,16 and the majority do not choose HCAP guideline-concordant antibiotics when tested.17 Alternatively, clinicians may not follow the guidelines because of a belief that the HCAP criteria do not adequately indicate patients who are at risk for MDRO. Previous studies have demonstrated the relative inability of HCAP risk factors to predict patients who harbor MDRO18 and suggest that better tools such as clinical scoring systems, which include not only the traditional HCAP risk factors but also prior exposure to antibiotics, prior culture data, and a cumulative assessment of both intrinsic and extrinsic factors, could more accurately predict MDRO and lead to a more judicious use of broad-spectrum antimicrobial agents.19-25 Indeed, these collective findings have led the authors of the recently updated guidelines to remove HCAP as a clinical entity from the hospital-acquired or ventilator-associated pneumonia guidelines and place them instead in the upcoming updated guidelines on the management of CAP.5 Of these 3 explanations, the lack of familiarity fits best with our observation that guideline-concordant therapy increased steadily over time with no evidence of reaching a plateau. Ironically, as consensus was building that HCAP is a poor marker for MDROs, routine empiric treatment with vancomycin and piperacillin-tazobactam (“vanco and zosyn”) have become routine in many hospitals. Additional studies are needed to know if this trend has stabilized or reversed.
CONCLUSIONS
In conclusion, clinicians in our large, nationally representative sample treated the majority of HCAP patients as though they had CAP. Although there was an increase in the administration of guideline-concordant therapy over time, this increase was not associated with improved outcomes. This study supports the growing consensus that HCAP criteria do not accurately predict which patients benefit from broad-spectrum antibiotics for pneumonia, and most patients fare well with antibiotics targeting common community-acquired organisms.
Disclosure
This work was supported by grant # R01HS018723 from the Agency for Healthcare Research and Quality. Dr. Lagu is also supported by the National Heart, Lung, and Blood Institute of the National Institutes of Health under award number K01HL114745. Dr. Lindenauer is supported by grant K24HL132008 from the National Heart, Lung, and Blood Institute. The funding agency had no role in the data acquisition, analysis, or manuscript preparation for this study. Drs. Haessler and Rothberg had full access to all the data in the study and take responsibility for the integrity of the data and the accuracy of the data analysis. Drs. Haessler, Lagu, Lindenauer, Skiest, Zilberberg, Higgins, and Rothberg conceived of the study and analyzed and interpreted the data. Dr. Lindenauer acquired the data. Dr. Pekow and Ms. Priya carried out the statistical analyses. Dr. Haessler drafted the manuscript. All authors critically reviewed the manuscript for accuracy and integrity. All authors certify no potential conflicts of interest. Preliminary results from this study were presented in oral and poster format at IDWeek in 2012 and 2013.
1. Kochanek KD, Murphy SL, Xu JQ, Tejada-Vera B. Deaths: Final data for 2014. National vital statistics reports; vol 65 no 4. Hyattsville, MD: National Center for Health Statistics. 2016. PubMed
2. American Thoracic Society, Infectious Diseases Society of America. Guidelines for the Management of Adults with Hospital-acquired, Ventilator-associated, and Healthcare-associated Pneumonia. Am J Respir Crit Care Med. 2005;171(4):388-416. PubMed
3. Zilberberg MD, Shorr A. Healthcare-associated pneumonia: the state of the evidence to date. Curr Opin Pulm Med. 2011;17(3):142-147. PubMed
4. Kollef MK, Shorr A, Tabak YP, Gupta V, Liu LZ, Johannes RS. Epidemiology and Outcomes of Health-care-associated pneumonia. Chest. 2005;128(6):3854-3862. PubMed
5. Kalil AC, Metersky ML, Klompas M, et al. Management of Adults With Hospital-acquired and Ventilator-associated Pneumonia: 2016 Clinical Practice Guidelines by the Infectious Diseases Society of America and the American Thoracic Society. Clin Infect Dis. 2016;63(5):575-582. PubMed
6. Lindenauer PK, Pekow PS, Lahti MC, Lee Y, Benjamin EM, Rothberg MB. Association of corticosteroid dose and route of administration with risk of treatment failure in acute exacerbation of chronic obstructive pulmonary disease. JAMA. 2010;303(23):2359-2367. PubMed
7. Elixhauser A, Steiner C, Harris DR, Coffey RM. Comorbidity measures for use with administrative data. Med Care. 1998;36(1):8-27. PubMed
8. Centers for Medicare & Medicaid Services. Frequently asked questions (FAQs): Implementation and maintenance of CMS mortality measures for AMI & HF. 2007. https://www.cms.gov/Medicare/Quality-Initiatives-Patient-Assessment-Instruments/HospitalQualityInits/downloads/HospitalMortalityAboutAMI_HF.pdf. Accessed November 1, 2016.
9. Normand SL, Shahian DM. Statistical and Clinical Aspects of Hospital Outcomes Profiling. Stat Sci. 2007;22(2):206-226.
10. Rothberg MB, Pekow PS, Priya A, et al. Using highly detailed administrative data to predict pneumonia mortality. PLoS One. 2014;9(1):e87382. PubMed
11. Jones BE, Jones MM, Huttner B, et al. Trends in antibiotic use and nosocomial pathogens in hospitalized veterans with pneumonia at 128 medical centers, 2006-2010. Clin Infect Dis. 2015;61(9):1403-1410. PubMed
12. Attridge RT, Frei CR, Restrepo MI, et al. Guideline-concordant therapy and outcomes in healthcare-associated pneumonia. Eur Respir J. 2011;38(4):878-887. PubMed
13. Rothberg MB, Zilberberg MD, Pekow PS, et al. Association of Guideline-based Antimicrobial Therapy and Outcomes in Healthcare-Associated Pneumonia. J Antimicrob Chemother. 2015;70(5):1573-1579. PubMed
14. Kett DH, Cano E, Quartin AA, et al. Improving Medicine through Pathway Assessment of Critical Therapy of Hospital-Acquired Pneumonia (IMPACT-HAP) Investigators. Implementation of guidelines for management of possible multidrug-resistant pneumonia in intensive care: an observational, multicentre cohort study. Lancet Infect Dis. 2011;11(3):181-189. PubMed
15. El-Solh AA, Alhajhusain A, Saliba RG, Drinka P. Physicians’ Attitudes Toward Guidelines for the Treatment of Hospitalized Nursing-Home -Acquired Pneumonia. J Am Med Dir Assoc. 2011;12(4):270-276. PubMed
16. Tunis S, Hayward R, Wilson M, et al. Internists’ Attitudes about Clinical Practice Guidelines. Ann Intern Med. 1994;120(11):956-963. PubMed
17. Seymann GB, Di Francesco L, Sharpe B, et al. The HCAP Gap: Differences between Self-Reported Practice Patterns and Published Guidelines for Health Care-Associated Pneumonia. Clin Infect Dis. 2009;49(12):1868-1874. PubMed
18. Chalmers JD, Rother C, Salih W, Ewig S. Healthcare associated pneumonia does not accurately identify potentially resistant pathogens: a systematic review and meta-analysis. Clin Infect Dis. 2014;58(3):330-339. PubMed
19. Shorr A, Zilberberg MD, Reichley R, et al. Validation of a Clinical Score for Assessing the Risk of Resistant Pathogens in Patients with Pneumonia Presenting to the Emergency Department. Clin Infect Dis. 2012;54(2):193-198. PubMed
20. Aliberti S, Pasquale MD, Zanaboni AM, et al. Stratifying Risk Factors for Multidrug-Resistant Pathogens in Hospitalized Patients Coming from the Community with Pneumonia. Clin Infect Dis. 2012;54(4):470-478. PubMed
21. Schreiber MP, Chan CM, Shorr AF. Resistant Pathogens in Nonnosocomial Pneumonia and Respiratory Failure: Is it Time to Refine the Definition of Health-care-Associated Pneumonia? Chest. 2010;137(6):1283-1288. PubMed
22. Madaras-Kelly KJ, Remington RE, Fan VS, Sloan KL. Predicting antibiotic resistance to community-acquired pneumonia antibiotics in culture-positive patients with healthcare-associated pneumonia. J Hosp Med. 2012;7(3):195-202. PubMed
23. Shindo Y, Ito R, Kobayashi D, et al. Risk factors for drug-resistant pathogens in community-acquired and healthcare-associated pneumonia. Am J Respir Crit Care Med. 2013;188(8):985-995. PubMed
24. Metersky ML, Frei CR, Mortensen EM. Predictors of Pseudomonas and methicillin-resistant Staphylococcus aureus in hospitalized patients with healthcare-associated pneumonia. Respirology. 2016;21(1):157-163. PubMed
25. Webb BJ, Dascomb K, Stenehjem E, Dean N. Predicting risk of drug-resistant organisms in pneumonia: moving beyond the HCAP model. Respir Med. 2015;109(1):1-10. PubMed
Bacterial pneumonia remains an important cause of morbidity and mortality in the United States, and is the 8th leading cause of death with 55,227 deaths among adults annually.1 In 2005, the American Thoracic Society (ATS) and the Infectious Diseases Society of America (IDSA) collaborated to update guidelines for hospital-acquired pneumonia (HAP), ventilator-associated pneumonia, and healthcare-associated pneumonia (HCAP).2 This broad document outlines an evidence-based approach to diagnostic testing and antibiotic management based on the epidemiology and risk factors for these conditions. The guideline specifies the following criteria for HCAP: hospitalization in the past 90 days, residence in a skilled nursing facility (SNF), home infusion therapy, hemodialysis, home wound care, family members with multidrug resistant organisms (MDRO), and immunosuppressive diseases or medications, with the presumption that these patients are more likely to be harboring MDRO and should thus be treated empirically with broad-spectrum antibiotic therapy. Prior studies have shown that patients with HCAP have a more severe illness, are more likely to have MDRO, are more likely to be inadequately treated, and are at a higher risk for mortality than patients with community-acquired pneumonia (CAP).3,4
These guidelines are controversial, especially in regard to the recommendations to empirically treat broadly with 2 antibiotics targeting Pseudomonas species, whether patients with HCAP merit broader spectrum coverage than patients with CAP, and whether the criteria for defining HCAP are adequate to predict which patients are harboring MDRO. It has subsequently been proposed that HCAP is more related to CAP than to HAP, and a recent update to the guideline removed recommendations for treatment of HCAP and will be placing HCAP into the guidelines for CAP instead.5 We sought to investigate the degree of uptake of the ATS and IDSA guideline recommendations by physicians over time, and whether this led to a change in outcomes among patients who met the criteria for HCAP.
METHODS
Setting and Patients
We identified patients discharged between July 1, 2007, and November 30, 2011, from 488 US hospitals that participated in the Premier database (Premier Inc., Charlotte, North Carolina), an inpatient database developed for measuring quality and healthcare utilization. The database is frequently used for healthcare research and has been described previously.6 Member hospitals are in all regions of the US and are generally reflective of US hospitals. This database contains multiple data elements, including sociodemographic information, International Classification of Diseases, 9th Revision-Clinical Modification (ICD-9-CM) diagnosis and procedure codes, hospital and physician information, source of admission, and discharge status. It also includes a date-stamped log of all billed items and services, including diagnostic tests, medications, and other treatments. Because the data do not contain identifiable information, the institutional review board at our medical center determined that this study did not constitute human subjects research.
We included all patients aged ≥18 years with a principal diagnosis of pneumonia or with a secondary diagnosis of pneumonia paired with a principal diagnosis of respiratory failure, acute respiratory distress syndrome, respiratory arrest, sepsis, or influenza. Patients were excluded if they were transferred to or from another acute care institution, had a length of stay of 1 day or less, had cystic fibrosis, did not have a chest radiograph, or did not receive antibiotics within 48 hours of admission.
For each patient, we extracted age, gender, principal diagnosis, comorbidities, and the specialty of the attending physician. Comorbidities were identified from ICD-9-CM secondary diagnosis codes and Diagnosis Related Groups by using Healthcare Cost and Utilization Project Comorbidity Software, version 3.1, based on the work of Elixhauser (Agency for Healthcare Research and Quality, Rockville, Maryland).7 In order to ensure that patients had HCAP, we required the presence of ≥1 HCAP criteria, including hospitalization in the past 90 days, hemodialysis, admission from an SNF, or immune suppression (which was derived from either a secondary diagnosis for neutropenia, hematological malignancy, organ transplant, acquired immunodeficiency virus, or receiving immunosuppressant drugs or corticosteroids [equivalent to ≥20 mg/day of prednisone]).
Definitions of Guideline-Concordant and Discordant Antibiotic Therapy
The ATS and IDSA guidelines recommended the following antibiotic combinations for HCAP: an antipseudomonal cephalosporin or carbapenem or a beta-lactam/lactamase inhibitor, plus an antipseudomonal quinolone or aminoglycoside, plus an antibiotic with activity versus methicillin resistant Staphylococcus aureus (MRSA), such as vancomycin or linezolid. Based on these guidelines, we defined the receipt of fully guideline-concordant antibiotics as 2 recommended antibiotics for Pseudomonas species plus 1 for MRSA administered by the second day of admission. Partially guideline-concordant antibiotics were defined as 1 recommended antibiotic for Pseudomonas species plus 1 for MRSA by the second day of hospitalization. Guideline-discordant antibiotics were defined as all other combinations.
Statistical Analysis
Descriptive statistics on patient characteristics are presented as frequency, proportions for categorical factors, and median with interquartile range (IQR) for continuous variables for the full cohort and by treatment group, defined as fully or partially guideline-concordant antibiotic therapy or discordant therapy. Hospital rates of fully guideline-concordant treatment are presented overall and by hospital characteristics. The association of hospital characteristics with rates of fully guideline-concordant therapy were assessed by using 1-way analysis of variance tests.
To assess trends across hospitals for the association between the use of guideline-concordant therapy and mortality, progression to respiratory failure as measured by the late initiation of invasive mechanical ventilation (day 3 or later), and the length of stay among survivors, we divided the 4.5-year study period into 9 intervals of 6 months each; 292 hospitals that submitted data for all 9 time points were examined in this analysis. Based on the distribution of length of stay in the first time period, we created an indicator variable for extended length of stay with length of stay at or above the 75th percentile, defined as extended. For each hospital at each 6-month interval, we then computed risk-standardized guideline-concordant treatment (RS-treatment) rates and risk-standardized in-hospital outcome rates similar to methods used by the Centers for Medicare and Medicaid Services for public reporting.8 For each hospital at each time interval, we estimated a predicted rate of guideline-concordant treatment as the sum of predicted probabilities of guideline-concordant treatment from patient factors and the random intercept for the hospital in which they were admitted. We then calculated the expected rate of guideline-concordant treatment as the sum of expected probabilities of treatment received from patient factors only. RS-treatment was then calculated as the ratio of predicted to expected rates multiplied by the overall unadjusted mean treatment rate from all patients.9 We repeated the same modeling strategy to calculate risk-standardized outcome (RS-outcome) rates for each hospital across all time points. All models were adjusted for patient demographics and comorbidities. Similar models using administrative data have moderate discrimination for mortality.10
We then fit mixed-effects linear models with random hospital intercept and slope across time for the RS-treatment and outcome rates, respectively. From these models, we estimated the mean slope for RS-treatment and for RS-outcome over time. In addition, we estimated a slope or trend over time for each hospital for treatment and for outcome and evaluated the correlation between the treatment and outcome trends.
All analyses were performed using the Statistical Analysis System version 9.4 (SAS Institute Inc., Cary, NC) and STATA release 13 (StataCorp, LLC, College Station, Texas).
RESULTS
DISCUSSION
In this large, retrospective cohort study, we found that there was a substantial gap between the empiric antibiotics recommended by the ATS and IDSA guidelines and the empiric antibiotics that patients actually received. Over the study period, we saw an increased adherence to guidelines, in spite of growing evidence that HCAP risk factors do not adequately predict which patients are at risk for infection with an MDRO.11 We used this change in antibiotic prescribing behavior over time to determine if there was a clinical impact on patient outcomes and found that at the hospital level, there were no improvements in mortality, excess length of stay, or progression to respiratory failure despite a doubling in guideline-concordant antibiotic use.
At least 2 other large studies have assessed the association between guideline-concordant therapy and outcomes in HCAP.12,13 Both found that guideline-concordant therapy was associated with increased mortality, despite propensity matching. Both were conducted at the individual patient level by using administrative data, and results were likely affected by unmeasured clinical confounders, with sicker patients being more likely to receive guideline-concordant therapy. Our focus on the outcomes at the hospital level avoids this selection bias because the overall severity of illness of patients at any given hospital would not be expected to change over the study period, while physician uptake of antibiotic prescribing guidelines would be expected to increase over time. Determining the correlation between increases in guideline adherence and changes in patient outcome may offer a better assessment of the impact of guideline adherence. In this regard, our results are similar to those achieved by 1 quality improvement collaborative that was aimed at increasing guideline concordant therapy in ICUs. Despite an increase in guideline concordance from 33% to 47% of patients, they found no change in overall mortality.14
There were several limitations to our study. We did not have access to microbiologic data, so we were unable to determine which patients had MDRO infection or determine antibiotic-pathogen matching. However, the treating physicians in our study population presumably did not have access to this data at the time of treatment either because the time period we examined was within the first 48 hours of hospitalization, the interval during which cultures are incubating and the patients are being treated empirically. In addition, there may have been HCAP patients that we failed to identify, such as patients who were admitted in the past 90 days to a hospital that does not submit data to Premier. However, it is unlikely that prescribing for such patients should differ systematically from what we observed. While the database draws from 488 hospitals nationwide, it is possible that practices may be different at facilities that are not contained within the Premier database, such as Veterans Administration Hospitals. Similarly, we did not have readings for chest x-rays; hence, there could be some patients in the dataset who did not have pneumonia. However, we tried to overcome this by including only those patients with a principal diagnosis of pneumonia or sepsis with a secondary pneumonia diagnosis, a chest x-ray, and antibiotics administered within the first 48 hours of admission.
There are likely several reasons why so few HCAP patients in our study received guideline-concordant antibiotics. A lack of knowledge about the ATS and IDSA guidelines may have impacted the physicians in our study population. El-Solh et al.15 surveyed physicians about the ATS-IDSA guidelines 4 years after publication and found that only 45% were familiar with the document. We found that the rate of prescribing at least partially guideline-concordant antibiotics rose steadily over time, supporting the idea that the newness of the guidelines was 1 barrier. Additionally, prior studies have shown that many physicians may not agree with or choose to follow guidelines, with only 20% of physicians indicating that guidelines have a major impact on their clinical decision making,16 and the majority do not choose HCAP guideline-concordant antibiotics when tested.17 Alternatively, clinicians may not follow the guidelines because of a belief that the HCAP criteria do not adequately indicate patients who are at risk for MDRO. Previous studies have demonstrated the relative inability of HCAP risk factors to predict patients who harbor MDRO18 and suggest that better tools such as clinical scoring systems, which include not only the traditional HCAP risk factors but also prior exposure to antibiotics, prior culture data, and a cumulative assessment of both intrinsic and extrinsic factors, could more accurately predict MDRO and lead to a more judicious use of broad-spectrum antimicrobial agents.19-25 Indeed, these collective findings have led the authors of the recently updated guidelines to remove HCAP as a clinical entity from the hospital-acquired or ventilator-associated pneumonia guidelines and place them instead in the upcoming updated guidelines on the management of CAP.5 Of these 3 explanations, the lack of familiarity fits best with our observation that guideline-concordant therapy increased steadily over time with no evidence of reaching a plateau. Ironically, as consensus was building that HCAP is a poor marker for MDROs, routine empiric treatment with vancomycin and piperacillin-tazobactam (“vanco and zosyn”) have become routine in many hospitals. Additional studies are needed to know if this trend has stabilized or reversed.
CONCLUSIONS
In conclusion, clinicians in our large, nationally representative sample treated the majority of HCAP patients as though they had CAP. Although there was an increase in the administration of guideline-concordant therapy over time, this increase was not associated with improved outcomes. This study supports the growing consensus that HCAP criteria do not accurately predict which patients benefit from broad-spectrum antibiotics for pneumonia, and most patients fare well with antibiotics targeting common community-acquired organisms.
Disclosure
This work was supported by grant # R01HS018723 from the Agency for Healthcare Research and Quality. Dr. Lagu is also supported by the National Heart, Lung, and Blood Institute of the National Institutes of Health under award number K01HL114745. Dr. Lindenauer is supported by grant K24HL132008 from the National Heart, Lung, and Blood Institute. The funding agency had no role in the data acquisition, analysis, or manuscript preparation for this study. Drs. Haessler and Rothberg had full access to all the data in the study and take responsibility for the integrity of the data and the accuracy of the data analysis. Drs. Haessler, Lagu, Lindenauer, Skiest, Zilberberg, Higgins, and Rothberg conceived of the study and analyzed and interpreted the data. Dr. Lindenauer acquired the data. Dr. Pekow and Ms. Priya carried out the statistical analyses. Dr. Haessler drafted the manuscript. All authors critically reviewed the manuscript for accuracy and integrity. All authors certify no potential conflicts of interest. Preliminary results from this study were presented in oral and poster format at IDWeek in 2012 and 2013.
1. Kochanek KD, Murphy SL, Xu JQ, Tejada-Vera B. Deaths: Final data for 2014. National vital statistics reports; vol 65 no 4. Hyattsville, MD: National Center for Health Statistics. 2016. PubMed
2. American Thoracic Society, Infectious Diseases Society of America. Guidelines for the Management of Adults with Hospital-acquired, Ventilator-associated, and Healthcare-associated Pneumonia. Am J Respir Crit Care Med. 2005;171(4):388-416. PubMed
3. Zilberberg MD, Shorr A. Healthcare-associated pneumonia: the state of the evidence to date. Curr Opin Pulm Med. 2011;17(3):142-147. PubMed
4. Kollef MK, Shorr A, Tabak YP, Gupta V, Liu LZ, Johannes RS. Epidemiology and Outcomes of Health-care-associated pneumonia. Chest. 2005;128(6):3854-3862. PubMed
5. Kalil AC, Metersky ML, Klompas M, et al. Management of Adults With Hospital-acquired and Ventilator-associated Pneumonia: 2016 Clinical Practice Guidelines by the Infectious Diseases Society of America and the American Thoracic Society. Clin Infect Dis. 2016;63(5):575-582. PubMed
6. Lindenauer PK, Pekow PS, Lahti MC, Lee Y, Benjamin EM, Rothberg MB. Association of corticosteroid dose and route of administration with risk of treatment failure in acute exacerbation of chronic obstructive pulmonary disease. JAMA. 2010;303(23):2359-2367. PubMed
7. Elixhauser A, Steiner C, Harris DR, Coffey RM. Comorbidity measures for use with administrative data. Med Care. 1998;36(1):8-27. PubMed
8. Centers for Medicare & Medicaid Services. Frequently asked questions (FAQs): Implementation and maintenance of CMS mortality measures for AMI & HF. 2007. https://www.cms.gov/Medicare/Quality-Initiatives-Patient-Assessment-Instruments/HospitalQualityInits/downloads/HospitalMortalityAboutAMI_HF.pdf. Accessed November 1, 2016.
9. Normand SL, Shahian DM. Statistical and Clinical Aspects of Hospital Outcomes Profiling. Stat Sci. 2007;22(2):206-226.
10. Rothberg MB, Pekow PS, Priya A, et al. Using highly detailed administrative data to predict pneumonia mortality. PLoS One. 2014;9(1):e87382. PubMed
11. Jones BE, Jones MM, Huttner B, et al. Trends in antibiotic use and nosocomial pathogens in hospitalized veterans with pneumonia at 128 medical centers, 2006-2010. Clin Infect Dis. 2015;61(9):1403-1410. PubMed
12. Attridge RT, Frei CR, Restrepo MI, et al. Guideline-concordant therapy and outcomes in healthcare-associated pneumonia. Eur Respir J. 2011;38(4):878-887. PubMed
13. Rothberg MB, Zilberberg MD, Pekow PS, et al. Association of Guideline-based Antimicrobial Therapy and Outcomes in Healthcare-Associated Pneumonia. J Antimicrob Chemother. 2015;70(5):1573-1579. PubMed
14. Kett DH, Cano E, Quartin AA, et al. Improving Medicine through Pathway Assessment of Critical Therapy of Hospital-Acquired Pneumonia (IMPACT-HAP) Investigators. Implementation of guidelines for management of possible multidrug-resistant pneumonia in intensive care: an observational, multicentre cohort study. Lancet Infect Dis. 2011;11(3):181-189. PubMed
15. El-Solh AA, Alhajhusain A, Saliba RG, Drinka P. Physicians’ Attitudes Toward Guidelines for the Treatment of Hospitalized Nursing-Home -Acquired Pneumonia. J Am Med Dir Assoc. 2011;12(4):270-276. PubMed
16. Tunis S, Hayward R, Wilson M, et al. Internists’ Attitudes about Clinical Practice Guidelines. Ann Intern Med. 1994;120(11):956-963. PubMed
17. Seymann GB, Di Francesco L, Sharpe B, et al. The HCAP Gap: Differences between Self-Reported Practice Patterns and Published Guidelines for Health Care-Associated Pneumonia. Clin Infect Dis. 2009;49(12):1868-1874. PubMed
18. Chalmers JD, Rother C, Salih W, Ewig S. Healthcare associated pneumonia does not accurately identify potentially resistant pathogens: a systematic review and meta-analysis. Clin Infect Dis. 2014;58(3):330-339. PubMed
19. Shorr A, Zilberberg MD, Reichley R, et al. Validation of a Clinical Score for Assessing the Risk of Resistant Pathogens in Patients with Pneumonia Presenting to the Emergency Department. Clin Infect Dis. 2012;54(2):193-198. PubMed
20. Aliberti S, Pasquale MD, Zanaboni AM, et al. Stratifying Risk Factors for Multidrug-Resistant Pathogens in Hospitalized Patients Coming from the Community with Pneumonia. Clin Infect Dis. 2012;54(4):470-478. PubMed
21. Schreiber MP, Chan CM, Shorr AF. Resistant Pathogens in Nonnosocomial Pneumonia and Respiratory Failure: Is it Time to Refine the Definition of Health-care-Associated Pneumonia? Chest. 2010;137(6):1283-1288. PubMed
22. Madaras-Kelly KJ, Remington RE, Fan VS, Sloan KL. Predicting antibiotic resistance to community-acquired pneumonia antibiotics in culture-positive patients with healthcare-associated pneumonia. J Hosp Med. 2012;7(3):195-202. PubMed
23. Shindo Y, Ito R, Kobayashi D, et al. Risk factors for drug-resistant pathogens in community-acquired and healthcare-associated pneumonia. Am J Respir Crit Care Med. 2013;188(8):985-995. PubMed
24. Metersky ML, Frei CR, Mortensen EM. Predictors of Pseudomonas and methicillin-resistant Staphylococcus aureus in hospitalized patients with healthcare-associated pneumonia. Respirology. 2016;21(1):157-163. PubMed
25. Webb BJ, Dascomb K, Stenehjem E, Dean N. Predicting risk of drug-resistant organisms in pneumonia: moving beyond the HCAP model. Respir Med. 2015;109(1):1-10. PubMed
© 2017 Society of Hospital Medicine
Pediatric Hospitalization Epidemiology
Improvement in the quality of hospital care in the United States is a national priority, both to advance patient safety and because our expenditures exceed any other nation's, but our health outcomes lag behind.[1, 2] Healthcare spending for children is growing at a faster rate than any other age group, with hospital care accounting for more than 40% of pediatric healthcare expenditures.[3] Inpatient healthcare comprises a greater proportion of healthcare costs for children than for adults, yet we have limited knowledge about where this care is provided.[4]
There is substantial variability in the settings in which children are hospitalized. Children may be hospitalized in freestanding children's hospitals, where all services are designed for children and which operate independently of adult‐focused institutions. They may also be hospitalized in general hospitals where care may be provided in a general inpatient bed, on a dedicated pediatric ward, or in a children's hospital nested within a hospital, which may have specialized nursing and physician care but often shares other resources such as laboratory and radiology with the primarily adult‐focused institution. Medical students and residents may be trained in all of these settings. We know little about how these hospital types differ with respect to patient populations, disease volumes, and resource utilization, and this knowledge is important to inform clinical programs, implementation research, and quality improvement (QI) priorities. To this end, we aimed to describe the volume and characteristics of pediatric hospitalizations at acute care general hospitals and freestanding children's hospitals in the United States.
METHODS
Study Design and Eligibility
The data source for this analysis was the Healthcare Cost and Utilization Project's (HCUP) 2012 Kids' Inpatient Database (KID). We conducted a cross‐sectional study of hospitalizations in children and adolescents less than 18 years of age, excluding in‐hospital births and hospitalizations for pregnancy and delivery (identified using All Patient Refined‐Diagnostic Related Groups [APR‐DRGs]).[5] Neonatal hospitalizations not representing in‐hospital births but resulting from transfers or new admissions were retained. Because the dataset does not contain identifiable information, the institutional review board at Baystate Medical Center determined that our study did not constitute human subjects research.
The KID is released every 3 years and is the only publicly available, nationally representative database developed to study pediatric hospitalizations, including an 80% sample of noninborn pediatric discharges from all community, nonrehabilitation hospitals from 44 participating states.[6] Short‐term rehabilitation hospitals, long‐term nonacute care hospitals, psychiatric hospitals, and alcoholism/chemical dependency treatment facilities are excluded. The KID contains information on all patients, regardless of payer, and provides discharge weights to calculate national estimates.[6] It contains both hospital‐level and patient‐level variables, including demographic characteristics, charges, and other clinical and resource use data available from discharge abstracts. Beginning in 2012, freestanding children's hospitals (FCHs) are assigned to a separate stratum in the KID, with data from the Children's Hospital Association used by HCUP to verify the American Hospital Association's (AHA) list of FCHs.[6] Hospitals that are not FCHs were categorized as general hospitals (GHs). We were interested in examining patterns of care at acute care hospitals and not specialty hospitals; unlike previous years, the KID 2012 does not include a specialty hospital identifier.[6] Therefore, as a proxy for specialty hospital status, we excluded hospitals that had 2% hospitalizations for 12 common medical conditions (pneumonia, asthma, bronchiolitis, cellulitis, dehydration, urinary tract infection, neonatal hyperbilirubinemia, fever, upper respiratory infection, infectious gastroenteritis, unspecified viral infection, and croup). These medical conditions were the 12 most common reasons for medical hospitalizations identified using Keren's pediatric diagnosis code grouper,[7] excluding chronic diseases, and represented 26.2% of all pediatric hospitalizations. This 2% threshold was developed empirically, based on visual analysis of the distribution of cases across hospitals and was limited to hospitals with total pediatric volumes >25/year, allowing for stable case‐mix estimates.
Descriptor Variables
Hospital level characteristics included US Census region; teaching status classified in the KID based on results of the AHA Annual Survey; urban/rural location; hospital ownership, classified as public, private nonprofit and private investor‐owned; and total volume of pediatric hospitalizations, in deciles.[6] At the patient level, we examined age, gender, race/ethnicity, expected primary payer, and median household income (in quartiles) for patient's zip code. Medical complexity was categorized as (1) nonchronic disease, (2) complex chronic disease, or (3) noncomplex chronic disease, using the previously validated Pediatric Medical Complexity Algorithm (PMCA) based on International Classification of Diseases, 9th Revision, Clinical Modification (ICD‐9‐CM) codes.[8] Disease severity was classified based on APR‐DRG severity of illness coding, which classifies illnesses severity as minor, moderate, major, or extreme.[9]
We examined the following characteristics of the hospitalizations: (1) length of hospital stay (LOS) measured in calendar days; (2) high‐turnover hospitalization defined as LOS less than 2 days[10, 11, 12]; (3) long LOS, defined as greater than 4 days, equivalent to LOS greater than the 75th percentile; (4) neonatal versus non‐neonatal hospitalization, identified using APR‐DRGs; (5) admission type categorized as elective and nonelective; (6) admission source, categorized as transfer from another acute care hospital, admission from the emergency department, or direct admission; (7) discharge status, categorized as routine discharge, transfer to another hospital or healthcare facility, and discharge against medical advice; and (8) total hospital costs, calculated by applying the cost‐to‐charge ratios available in the KID to total hospital charges.
Reasons for hospitalization were categorized using the pediatric diagnosis code grouper by Keren, which uses ICD‐9‐CM codes to group common and costly principal diagnoses into distinct conditions (eg, pneumonia, idiopathic scoliosis), excluding children who have ICD‐9‐CM principal procedure codes unlikely related to their principal diagnosis (for example, appendectomy for a child with a principal diagnosis of pneumonia).[7] This pediatric grouper classifies diagnoses as medical, surgical, or medical‐surgical based on whether <20% (medical), >80% (surgical) or between 20% and 80% (medical‐surgical) of encounters for the condition had an ICD‐9‐CM principal procedure code for a surgery related to that condition. We further characterized medical hospitalizations as either medical or mental health hospitalizations.
Statistical Analysis
We categorized each discharge record as a hospitalization at a GH or an FCH. We then calculated patient‐level summary statistics, applying weights to calculate national estimates with an associated standard deviation (SD). We assessed differences in characteristics of hospitalizations at GHs and FCHs using Rao‐Scott 2 tests for categorical variables and Wald F tests for continuous variables.[6] We identified the most common reasons for hospitalization, including those responsible for at least 2% of all medical or surgical hospitalizations and at least 0.5% of medical hospitalizations for mental health diagnoses, given the lower prevalence of these conditions and our desire to include mental health diagnoses in our analysis. For these common conditions, we calculated the proportion of condition‐specific hospitalizations and aggregate hospital costs at GHs and FCHs. We also determined the number of hospitalizations at each hospital and calculated the median and interquartile range for the number of hospitalizations for each of these conditions according to hospital type, assessing for differences using Kruskal‐Wallis tests. Finally, we identified the most common and costly conditions at GHs and FCHs by ranking frequency and aggregate costs for each condition according to hospital type, limited to the 20 most costly and/or prevalent pediatric diagnoses. Because we used a novel method to identify specialty hospitals in this dataset, we repeated these analyses using all hospitals classified as a GH and FCH as a sensitivity analysis.
RESULTS
Overall, 3866 hospitals were categorized as a GH, whereas 70 hospitals were categorized as FCHs. Following exclusion of specialty hospitals, 3758 GHs and 50 FCHs were retained in this study. The geographic distribution of hospitals was similar, but although GHs included those in both urban and rural regions, all FCHs were located in urban regions (Table 1).
| General Hospitals, n = 3,758 | Children's Hospitals, n = 50 | ||||
|---|---|---|---|---|---|
| Hospital characteristics | n | % | n | % | P Value |
| |||||
| Geographic region | |||||
| Northeast | 458 | 12.2 | 4 | 8.0 | 0.50 |
| Midwest | 1,209 | 32.2 | 15 | 30.0 | |
| South | 1,335 | 35.6 | 17 | 34.0 | |
| West | 753 | 20.1 | 14 | 28.0 | |
| Location and teaching status | |||||
| Rural | 1,524 | 40.6 | 0 | 0 | <0.0001 |
| Urban nonteaching | 1,506 | 40.1 | 7 | 14.0 | |
| Urban teaching | 725 | 19.3 | 43 | 86.0 | |
| Hospital ownership | |||||
| Government, nonfederal | 741 | 19.7 | 0 | 0 | <0.0001 |
| Private, nonprofit | 2,364 | 63.0 | 48 | 96.0 | |
| Private, investor‐owned | 650 | 17.3 | 2 | 4.0 | |
| Volume of pediatric hospitalizations (deciles) | |||||
| <185 hospitalizations/year (<8th decile) | 2,664 | 71.0 | 0 | 0 | <0.0001 |
| 186375 hospitalizations/year (8th decile) | 378 | 10.1 | 2 | 4.0 | |
| 376996 hospitalizations/year (9th decile) | 380 | 10.1 | 1 | 2.0 | |
| >986 hospitalizations/year (10th decile) | 333 | 8.9 | 47 | 94.0 | |
| Volume of pediatric hospitalizations, median [IQR] | 56 | [14240] | 12,001 | [5,83815,448] | <0.0001 |
A total of 1,407,822 (SD 50,456) hospitalizations occurred at GHs, representing 71.7% of pediatric hospitalizations, whereas 554,458 (SD 45,046) hospitalizations occurred at FCHs. Hospitalizations at GHs accounted for 63.6% of days in hospital and 50.0% of pediatric inpatient healthcare costs. Eighty percent of the GHs had total pediatric patient volumes of less than 375 hospitalizations yearly; 11.1% of pediatric hospitalizations occurred at these lower‐volume centers. At FCHs, the median volume of pediatric hospitalizations was 12,001 (interquartile range [IQR]: 583815,448). A total of 36 GHs had pediatric hospitalization volumes in this IQR.
The median age for pediatric patients was slightly higher at GHs, whereas gender, race/ethnicity, primary payer, and median household income for zip code did not differ significantly between hospital types (Table 2). Medical complexity differed between hospital types: children with complex chronic diseases represented 20.2% of hospitalizations at GHs and 35.6% of hospitalizations at FCHs. Severity of illness differed between hospital types, with fewer hospitalizations categorized at the highest level of severity at GHs than FCHs. There were no significant differences between hospital types with respect to the proportion of hospitalizations categorized as neonatal hospitalizations or as elective hospitalizations. The median LOS was shorter at GHs than FCHs. Approximately 1 in 5 children hospitalized at GHs had LOS greater than 4 days, whereas almost 30% of children hospitalized at FCHs had LOS of this duration.
| Patient Characteristics |
General Hospitals,1,407,822 (50,456), 71.7% |
Children's Hospitals,554,458 (45,046), 28.3% |
P Value | ||||
|---|---|---|---|---|---|---|---|
| n | (SD Weighted Frequency) | (%) | n | (SD Weighted Frequency) | % | ||
| |||||||
| Age, y, median [IQR] | 3.6 [011.7] | 3.4 [010.8] | 0.001 | ||||
| Gender (% female) | 644,250 | (23,089) | 45.8 | 254,505 | (20,688) | 45.9 | 0.50 |
| Race* | |||||||
| White | 668,876 | (27,741) | 47.5 | 233,930 | (26,349) | 42.2 | 0.05 |
| Black | 231,586 | (12,890) | 16.5 | 80,568 | (11,739) | 14.5 | |
| Hispanic | 279,021 | (16,843) | 19.8 | 12,1425 | (21,183) | 21.9 | |
| Other | 133,062 | (8,572) | 9.5 | 41,190 | (6,394) | 7.4 | |
| Insurance status | |||||||
| Public | 740,033 | (28,675) | 52.6 | 284,795 | (25,324) | 51.4 | 0.90 |
| Private | 563,562 | (21,930) | 40.0 | 224,042 | (21,613) | 40.4 | |
| Uninsured | 37,265 | (1,445) | 2.7 | 16,355 | (3,804) | 3.0 | |
| No charge/other/unknown | 66,962 | (5,807) | 4.8 | 29,266 | (6,789) | 5.3 | |
| Median household income for zip code, quartiles | |||||||
| <$38,999 | 457,139 | (19,725) | 33.3 | 164,831 | (17,016) | 30.1 | 0.07 |
| $39,000$47,999 | 347,229 | (14,104) | 25.3 | 125,105 | (10,712) | 22.9 | |
| $48,000$62,999 | 304,795 | (13,427) | 22.2 | 134,915 | (13,999) | 24.7 | |
| >$63,000 | 263,171 | (15,418) | 19.2 | 122,164 | (16,279) | 22.3 | |
| Medical complexity | |||||||
| Nonchronic disease | 717,009 | (21,807) | 50.9 | 211,089 | (17,023) | 38.1 | <0.001 |
| Noncomplex chronic disease | 406,070 | (14,951) | 28.8 | 146,077 | (12,442) | 26.4 | |
| Complex chronic disease | 284,742 | (17,111) | 20.2 | 197,292 | (18,236) | 35.6 | |
| APR‐DRG severity of illness | |||||||
| 1 (lowest severity) | 730,134 | (23,162) | 51.9 | 217,202 | (18,433) | 39.2 | <0.001 |
| 2 | 486,748 | (18,395) | 34.6 | 202,931 | (16,864) | 36.6 | |
| 3 | 146,921 | (8,432) | 10.4 | 100,566 | (9,041) | 18.1 | |
| 4 (highest severity) | 41,749 | (3,002) | 3.0 | 33,340 | (3,199) | 6.0 | |
| Hospitalization characteristics | |||||||
| Neonatal hospitalization | 98,512 | (3,336) | 7.0 | 39,584 | (4,274) | 7.1 | 0.84 |
| Admission type | |||||||
| Elective | 255,774 | (12,285) | 18.3 | 109,854 | (13,061) | 19.8 | 0.05 |
| Length of stay, d, (median [IQR]) | 1.8 (0.01) [0.8‐3.6] | 2.2 (0.06) [1.1‐4.7] | <0.001 | ||||
| High turnover hospitalizations | 416,790 | (14,995) | 29.6 | 130,441 | (12,405) | 23.5 | <0.001 |
| Length of stay >4 days | 298,315 | (14,421) | 21.2 | 161,804 | (14,354) | 29.2 | <0.001 |
| Admission source | |||||||
| Transfer from another acute care hospital | 154,058 | (10,067) | 10.9 | 82,118 | (8,952) | 14.8 | 0.05 |
| Direct admission | 550,123 | (21,954) | 39.1 | 211,117 | (20,203) | 38.1 | |
| Admission from ED | 703,641 | (26,155) | 50.0 | 261,223 | (28,708) | 47.1 | |
| Discharge status | |||||||
| Routine | 1,296,638 | (46,012) | 92.1 | 519,785 | (42,613) | 93.8 | <0.01 |
| Transfer to another hospital or healthcare facility | 56,115 | (1,922) | 4.0 | 13,035 | (1,437) | 2.4 | |
| Discharge against medical advice | 2,792 | (181) | 0.2 | 382 | (70) | 0.1 | |
| Other | 52,276 | (4,223) | 3.7 | 21,256 | (4,501) | 3.8 | |
The most common pediatric medical, mental health, and surgical conditions are shown in Figure 1, together representing 32% of pediatric hospitalizations during the study period. For these medical conditions, 77.9% of hospitalizations occurred at GHs, ranging from 52.6% of chemotherapy hospitalizations to 89.0% of hospitalizations for neonatal hyperbilirubinemia. Sixty‐two percent of total hospital costs for these conditions were incurred at GHs. For the common mental health hospitalizations, 86% of hospitalizations occurred at GHs. The majority of hospitalizations and aggregate hospital costs for common surgical conditions also occurred at GHs.

Whereas pneumonia, asthma, and bronchiolitis were the most common reasons for hospitalization at both GHs and FCHs, the most costly conditions differed (see Supporting Table 1 in the online version of this article). At GHs, these respiratory diseases were responsible for the highest condition‐specific total hospital costs. At FCHs, the highest aggregate costs were due to respiratory distress syndrome and chemotherapy. Congenital heart diseases, including hypoplastic left heart syndrome, transposition of the great vessels, tetralogy of Fallot, endocardial cushion defects, coarctation of the aorta and ventricular septal defects accounted for 6 of the 20 most costly conditions at FCHs.
Figure 2 illustrates the volume of hospitalizations, per hospital, at GHs and FCHs for the most common medical hospitalizations. The median number of hospitalizations, per hospital, was consistently significantly lower at GHs than at FCHs (all P values <0.001). Similar results for surgical and mental health hospitalizations are shown as Supporting Figures 1 and 2 in the online version of this article. In our sensitivity analyses that included all hospitals classified as GH and FCH, all results were essentially unchanged.
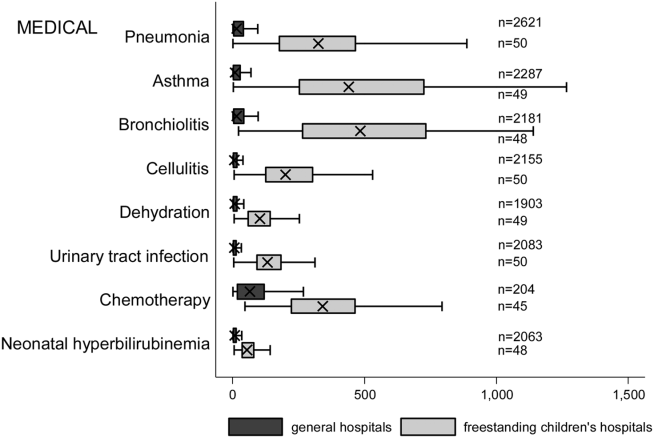
Recognizing the wide range of pediatric volumes at GHs (Table 1) and our inability to differentiate children's hospitals nested within GHs from GHs with pediatric beds, we examined differences in patient and hospitalization characteristics at GHs with volumes 5838 hospitalizations (the 25th percentile for FCH volume) and GHs with pediatric volumes <5838/year (see Supporting Table 2 in the online version of this article). We also compared patient and hospitalization characteristics at FCHs and the higher‐volume GHs. A total of 36 GHs had pediatric volumes 5838, with hospitalizations at these sites together accounting for 15.4% of all pediatric hospitalizations. Characteristics of patients hospitalized at these higher‐volume GHs were similar to patients hospitalized at FCHs, but they had significantly lower disease severity, fewer neonatal hospitalizations, shorter LOS, and more high‐turnover hospitalizations than patients hospitalized at FCHs. We also observed several differences between children hospitalized at higher‐ and lower‐volume GHs (see Supporting Table 2 in the online version of this article). Children hospitalized at the lower‐volume GHs were more likely to have public health insurance and less likely to have complex chronic diseases, although overall, 39.0% of all hospitalizations for children with complex chronic diseases occurred at these lower‐volume GHs. Compared to children hospitalized at higher‐volume GHs, children hospitalized at the lower‐volume hospitals had significantly lower disease severity, shorter LOS, more direct admissions, and a greater proportion of routine discharges.
DISCUSSION
Of the 2 million pediatric hospitalizations in the United States in 2012, more than 70% occurred at GHs. We observed considerable heterogeneity in pediatric volumes across GHs, with 11% of pediatric hospitalizations occurring at hospitals with pediatric volumes of <375 hospitalizations annually, whereas 15% of pediatric hospitalizations occurred at GHs with volumes similar to those observed at FCHs. The remaining pediatric hospitalizations at GHs occurred at centers with intermediate volumes. The most common reasons for hospitalization were similar at GHs and FCHs, but the most costly conditions differed substantially. These findings have important implications for pediatric clinical care programs, research, and QI efforts.
Our finding that more than 70% of pediatric hospitalizations occurred at GHs speaks to the importance of quality measurement at these hospitals, whereas low per‐hospital pediatric volumes at the majority of GHs makes such measurement particularly challenging. Several previous studies have illustrated that volumes of pediatric hospitalizations are too small to detect meaningful differences in quality between hospitals using established condition‐specific metrics.[13, 14, 15] Our finding that more than 10% of pediatric hospitalizations occurred at GHs with pediatric volumes <375 year supports previous research suggesting that cross‐cutting, all‐condition quality metrics, composite measures, and/or multihospital reporting networks may be needed to enable quality measurement at these sites. In addition, the heterogeneity in patient volumes and characteristics across GHs raise questions about the applicability of quality metrics developed and validated at FCHs to the many GH settings. Field‐testing quality measures to ensure their validity at diverse GHs, particularly those with patient volumes and infrastructure different from FCHs, will be important to meaningful pediatric quality measurement.
Our results illustrating differences in the most common and costly conditions at GHs and FCHs have further implications for prioritization and implementation of research and QI efforts. Implementation research and QI efforts focused on cardiac and neurosurgical procedures, as well as neonatal intensive care, may have considerable impact on cost and quality at FCHs. At GHs, research and QI efforts focused on common conditions are needed to increase our knowledge of contextually relevant barriers to and facilitators of high‐quality pediatric care. This, however, can be made more difficult by small sample sizes, limited resources, and infrastructure, and competing priorities in adult‐focused GH settings.[16, 17, 18] Multihospital learning collaboratives and partnerships between FCHs and GHs can begin to address these challenges, but their success is contingent upon national advocacy and funding to support pediatric research and quality measures at GHs.
One of the most notable differences in the characteristics of pediatric hospitalizations at GHs and FCHs was the proportion of hospitalizations attributable to children with medical complexity (CMC); more than one‐third of hospitalizations at FCHs were for CMC compared to 1 in 5 at GHs. These findings align with the results of several previous studies describing the substantial resource utilization attributed to CMC, and with growing research, innovation, and quality metrics focused on improving both inpatient and outpatient care for these vulnerable children.[19, 20, 21, 22] Structured complex care programs, developed to improve care coordination and healthcare quality for CMC, are common at FCHs, and have been associated with decreased resource utilization and improved outcomes.[23, 24, 25] Notably, however, more than half of all hospitalizations for CMC, exceeding 250,000 annually, occurred at GHs, and almost 40% of hospitalizations for CMC occurred at the lower‐volume GHs. These findings speak to the importance of translating effective and innovative programs of care for CMC to GHs as resources allow, accompanied by robust evaluations of their effectiveness. Lower patient volume at most GHs, however, may be a barrier to dedicated CMC programs. As a result, decentralized community‐based programs of care for CMC, linking primary care programs with regional and tertiary care hospitals, warrant further consideration.[26, 27, 28]
This analysis should be interpreted in light of several limitations. First, we were unable to distinguish between GHs with scant pediatric‐specific resources from those with a large volume of dedicated pediatric resources, such as children's hospitals nested within GHs. We did identify 36 GHs with pediatric volumes similar to those observed at FCHs (see Supporting Table 2 in the online version of this article); patient and hospitalization characteristics at these higher‐volume GHs were similar in many ways to children hospitalized at FCHs. Several of these higher‐volume GHs may have considerable resources dedicated to the care of children, including subspecialty care, and may represent children's hospitals nested within GHs. Because nested children's hospitals are included in the GH categorization, our results may have underestimated the proportion of children cared for at children's hospitals. Further work is needed to identify the health systems challenges and opportunities that may be unique to these institutions. Second, because the 2012 KID does not include a specialty hospital indicator, we developed a proxy method for identifying these hospitals, which may have resulted in some misclassification. We are reassured that the results of our analyses did not change substantively when we included all hospitals. Similarly, although we are reassured that the number of hospitals classified in our analysis as acute care FCHs aligns, approximately, with the number of hospitals classified as such by the Children's Hospital Association, we were unable to assess the validity of this variable within the KID. Third, the KID does not link records at the patient level, so we are unable to report the number of unique children included in this analysis. In addition, the KID includes only inpatient stays with exclusion of observation status stays; potential differences between GH and FCH in the use of observation status could have biased our findings. Fifth, we used the PMCA to identify CMC; although this algorithm has been shown to have excellent sensitivity in identifying children with chronic diseases, using up to 3 years of Medicaid claims data, the sensitivity using the KID, where only 1 inpatient stay is available for assessment, is unknown.[8, 29] Similarly, use of Keren's pediatric diagnosis grouper to classify reasons for hospitalization may have resulted in misclassification, though there are few other nonproprietary pediatric‐specific diagnostic groupers available.
In 2012, more than 70% of pediatric hospitalizations occurred at GHs in the United States. The considerably higher pediatric volumes at FCHs makes these institutions well suited for research, innovation, and the development and application of disease‐specific QI initiatives. Recognizing that the majority of pediatric hospitalizations occurred at GHs, there is a clear need for implementation research, program development, and quality metrics that align with the characteristics of hospitalizations at these centers. National support for research and quality improvement that reflects the diverse hospital settings where children receive their hospital care is critical to further our nation's goal of improving hospital quality for children.
Disclosures
Dr. Leyenaar was supported by grant number K08HS024133 from the Agency for Healthcare Research and Quality. The content is solely the responsibility of the authors and does not necessarily represent the official views of the Agency for Healthcare Research and Quality. The authors have no conflicts of interest relevant to this article to disclose.
- , , , . Mirror, Mirror on the wall: how the performance of the US health care system compares internationally. The Commonwealth Fund. Available at: http://www.commonwealthfund.org/publications/fund‐reports/2014/jun/mirror‐mirror. Published June 16, 2014. Accessed August 26, 2015.
- , , , , , . Higher cost, but poorer outcomes: the US health disadvantage and implications for pediatrics. Pediatrics. 2015;135(6):961–964.
- , , , , . US health spending trends by age and gender: selected years 2002–10. Health Aff (Millwood). 2014;33(5):815–822.
- , , . Costs for hospital stays in the United States, 2012. Healthcare Cost and Utilization Project 181. Available at: http://www.hcup‐us.ahrq.gov/reports/statbriefs/sb181‐Hospital‐Costs‐United‐States‐2012.pdf. Published October 2014. Accessed September 2015.
- , , , et al. All Patient Refined Diagnosis Related Groups: Methodology Overview. 3M Health Information Systems. Available at: https://www.hcup‐us.ahrq.gov/db/nation/nis/APR‐DRGsV20MethodologyOverviewandBibliography.pdf. Accessed February 8, 2016.
- Agency for Healthcare Research and Quality. Healthcare Cost and Utilization Project. Introduction to the HCUP Kids' Inpatient Database (KID) 2012. Available at: https://www.hcup‐us.ahrq.gov/db/nation/kid/kid_2012_introduction.jsp. Published Issued July 2014. Accessed February 8, 2016.
- . Prioritization of comparative effectiveness research topics in hospital pediatrics. Arch Pediatr Adolesc Med. 2012;166(12):1155.
- , , , et al. Pediatric medical complexity algorithm: a new method to stratify children by medical complexity. Pediatrics. 2014;133(6):e1647–e1654.
- , , , et al. 3M APR DRG Classification System. 3M Health Information Systems. Available at: http://www.hcup‐us.ahrq.gov/db/nation/nis/v261_aprdrg_meth_ovrview.pdf. Accessed August 7, 2015.
- , , , , , . Trends in high‐turnover stays among children hospitalized in the United States, 1993–2003. Pediatrics. 2009;123(3):996–1002.
- , , , . High turnover stays for pediatric asthma in the United States. Med Care. 2010;48(9):827–833.
- , , , , . Variation and outcomes associated with direct admission among children with pneumonia in the United States. JAMA Pediatr. 2014;168(9):829–836.
- , , , et al. Recognizing differences in hospital quality performance for pediatric inpatient care. Pediatrics. 2015;136(2):251–262.
- , , . Small numbers limit the use of the inpatient pediatric quality indicators for hospital comparison. Acad Pediatr. 2010;10(4):266–273.
- , , , et al. Statistical uncertainty of mortality rates and rankings for children's hospitals. Pediatrics. 2011;128(4):e966–e972.
- , , , , . Determinants of career satisfaction among pediatric hospitalists: a qualitative exploration. Acad Pediatr. 2014;14(4):361–368.
- , , , et al. Quality improvement research in pediatric hospital medicine and the role of the Pediatric Research in Inpatient Settings (PRIS) network. Acad Pediatr. 2013;13(6 suppl):S54–S60.
- . Roles for children's hospitals in pediatric collaborative improvement networks. Pediatrics. 2013;131(suppl 4):S215–S218.
- , , , et al. Children with medical complexity: an emerging population for clinical and research initiatives. Pediatrics. 2011;127(3):529–538.
- , , , et al. Children with complex chronic conditions in inpatient hospital settings in the United States. Pediatrics. 2010;126(4):647–655.
- , , , , , . Patterns and costs of health care use of children with medical complexity. Pediatrics. 2012;130(6):e1463–e1470.
- , , , , , . Hospital utilization and characteristics of patients experiencing recurrent readmissions within children's hospitals. JAMA. 2011;305(7):682–690.
- , , , et al. Characteristics of hospitalizations for patients who use a structured clinical care program for children with medical complexity. J Pediatr. 2011;159(2):284–290.
- , , , . Hospital‐based comprehensive care programs for children with special health care needs: a systematic review. Arch Pediatr Adolesc Med. 2011;165(6):554–561.
- , , , , , . A tertiary care–primary care partnership model for medically complex and fragile children and youth with special health care needs. Arch Pediatr Adolesc Med. 2007;161(10):937–944.
- , , , et al. Integrated complex care coordination for children with medical complexity: a mixed‐methods evaluation of tertiary care‐community collaboration. BMC Health Serv Res. 2012;12:366.
- , , , . Medical transport of children with complex chronic conditions. Emerg Med Int. 2012;2012:837020.
- , , . Comanagement of medically complex children by subspecialists, generalists, and care coordinators. Pediatrics. 2014;134(2):203–205.
- , , , , . Ways to identify children with medical complexity and the importance of why. J Pediatr. 2015;167(2):229–237.
Improvement in the quality of hospital care in the United States is a national priority, both to advance patient safety and because our expenditures exceed any other nation's, but our health outcomes lag behind.[1, 2] Healthcare spending for children is growing at a faster rate than any other age group, with hospital care accounting for more than 40% of pediatric healthcare expenditures.[3] Inpatient healthcare comprises a greater proportion of healthcare costs for children than for adults, yet we have limited knowledge about where this care is provided.[4]
There is substantial variability in the settings in which children are hospitalized. Children may be hospitalized in freestanding children's hospitals, where all services are designed for children and which operate independently of adult‐focused institutions. They may also be hospitalized in general hospitals where care may be provided in a general inpatient bed, on a dedicated pediatric ward, or in a children's hospital nested within a hospital, which may have specialized nursing and physician care but often shares other resources such as laboratory and radiology with the primarily adult‐focused institution. Medical students and residents may be trained in all of these settings. We know little about how these hospital types differ with respect to patient populations, disease volumes, and resource utilization, and this knowledge is important to inform clinical programs, implementation research, and quality improvement (QI) priorities. To this end, we aimed to describe the volume and characteristics of pediatric hospitalizations at acute care general hospitals and freestanding children's hospitals in the United States.
METHODS
Study Design and Eligibility
The data source for this analysis was the Healthcare Cost and Utilization Project's (HCUP) 2012 Kids' Inpatient Database (KID). We conducted a cross‐sectional study of hospitalizations in children and adolescents less than 18 years of age, excluding in‐hospital births and hospitalizations for pregnancy and delivery (identified using All Patient Refined‐Diagnostic Related Groups [APR‐DRGs]).[5] Neonatal hospitalizations not representing in‐hospital births but resulting from transfers or new admissions were retained. Because the dataset does not contain identifiable information, the institutional review board at Baystate Medical Center determined that our study did not constitute human subjects research.
The KID is released every 3 years and is the only publicly available, nationally representative database developed to study pediatric hospitalizations, including an 80% sample of noninborn pediatric discharges from all community, nonrehabilitation hospitals from 44 participating states.[6] Short‐term rehabilitation hospitals, long‐term nonacute care hospitals, psychiatric hospitals, and alcoholism/chemical dependency treatment facilities are excluded. The KID contains information on all patients, regardless of payer, and provides discharge weights to calculate national estimates.[6] It contains both hospital‐level and patient‐level variables, including demographic characteristics, charges, and other clinical and resource use data available from discharge abstracts. Beginning in 2012, freestanding children's hospitals (FCHs) are assigned to a separate stratum in the KID, with data from the Children's Hospital Association used by HCUP to verify the American Hospital Association's (AHA) list of FCHs.[6] Hospitals that are not FCHs were categorized as general hospitals (GHs). We were interested in examining patterns of care at acute care hospitals and not specialty hospitals; unlike previous years, the KID 2012 does not include a specialty hospital identifier.[6] Therefore, as a proxy for specialty hospital status, we excluded hospitals that had 2% hospitalizations for 12 common medical conditions (pneumonia, asthma, bronchiolitis, cellulitis, dehydration, urinary tract infection, neonatal hyperbilirubinemia, fever, upper respiratory infection, infectious gastroenteritis, unspecified viral infection, and croup). These medical conditions were the 12 most common reasons for medical hospitalizations identified using Keren's pediatric diagnosis code grouper,[7] excluding chronic diseases, and represented 26.2% of all pediatric hospitalizations. This 2% threshold was developed empirically, based on visual analysis of the distribution of cases across hospitals and was limited to hospitals with total pediatric volumes >25/year, allowing for stable case‐mix estimates.
Descriptor Variables
Hospital level characteristics included US Census region; teaching status classified in the KID based on results of the AHA Annual Survey; urban/rural location; hospital ownership, classified as public, private nonprofit and private investor‐owned; and total volume of pediatric hospitalizations, in deciles.[6] At the patient level, we examined age, gender, race/ethnicity, expected primary payer, and median household income (in quartiles) for patient's zip code. Medical complexity was categorized as (1) nonchronic disease, (2) complex chronic disease, or (3) noncomplex chronic disease, using the previously validated Pediatric Medical Complexity Algorithm (PMCA) based on International Classification of Diseases, 9th Revision, Clinical Modification (ICD‐9‐CM) codes.[8] Disease severity was classified based on APR‐DRG severity of illness coding, which classifies illnesses severity as minor, moderate, major, or extreme.[9]
We examined the following characteristics of the hospitalizations: (1) length of hospital stay (LOS) measured in calendar days; (2) high‐turnover hospitalization defined as LOS less than 2 days[10, 11, 12]; (3) long LOS, defined as greater than 4 days, equivalent to LOS greater than the 75th percentile; (4) neonatal versus non‐neonatal hospitalization, identified using APR‐DRGs; (5) admission type categorized as elective and nonelective; (6) admission source, categorized as transfer from another acute care hospital, admission from the emergency department, or direct admission; (7) discharge status, categorized as routine discharge, transfer to another hospital or healthcare facility, and discharge against medical advice; and (8) total hospital costs, calculated by applying the cost‐to‐charge ratios available in the KID to total hospital charges.
Reasons for hospitalization were categorized using the pediatric diagnosis code grouper by Keren, which uses ICD‐9‐CM codes to group common and costly principal diagnoses into distinct conditions (eg, pneumonia, idiopathic scoliosis), excluding children who have ICD‐9‐CM principal procedure codes unlikely related to their principal diagnosis (for example, appendectomy for a child with a principal diagnosis of pneumonia).[7] This pediatric grouper classifies diagnoses as medical, surgical, or medical‐surgical based on whether <20% (medical), >80% (surgical) or between 20% and 80% (medical‐surgical) of encounters for the condition had an ICD‐9‐CM principal procedure code for a surgery related to that condition. We further characterized medical hospitalizations as either medical or mental health hospitalizations.
Statistical Analysis
We categorized each discharge record as a hospitalization at a GH or an FCH. We then calculated patient‐level summary statistics, applying weights to calculate national estimates with an associated standard deviation (SD). We assessed differences in characteristics of hospitalizations at GHs and FCHs using Rao‐Scott 2 tests for categorical variables and Wald F tests for continuous variables.[6] We identified the most common reasons for hospitalization, including those responsible for at least 2% of all medical or surgical hospitalizations and at least 0.5% of medical hospitalizations for mental health diagnoses, given the lower prevalence of these conditions and our desire to include mental health diagnoses in our analysis. For these common conditions, we calculated the proportion of condition‐specific hospitalizations and aggregate hospital costs at GHs and FCHs. We also determined the number of hospitalizations at each hospital and calculated the median and interquartile range for the number of hospitalizations for each of these conditions according to hospital type, assessing for differences using Kruskal‐Wallis tests. Finally, we identified the most common and costly conditions at GHs and FCHs by ranking frequency and aggregate costs for each condition according to hospital type, limited to the 20 most costly and/or prevalent pediatric diagnoses. Because we used a novel method to identify specialty hospitals in this dataset, we repeated these analyses using all hospitals classified as a GH and FCH as a sensitivity analysis.
RESULTS
Overall, 3866 hospitals were categorized as a GH, whereas 70 hospitals were categorized as FCHs. Following exclusion of specialty hospitals, 3758 GHs and 50 FCHs were retained in this study. The geographic distribution of hospitals was similar, but although GHs included those in both urban and rural regions, all FCHs were located in urban regions (Table 1).
| General Hospitals, n = 3,758 | Children's Hospitals, n = 50 | ||||
|---|---|---|---|---|---|
| Hospital characteristics | n | % | n | % | P Value |
| |||||
| Geographic region | |||||
| Northeast | 458 | 12.2 | 4 | 8.0 | 0.50 |
| Midwest | 1,209 | 32.2 | 15 | 30.0 | |
| South | 1,335 | 35.6 | 17 | 34.0 | |
| West | 753 | 20.1 | 14 | 28.0 | |
| Location and teaching status | |||||
| Rural | 1,524 | 40.6 | 0 | 0 | <0.0001 |
| Urban nonteaching | 1,506 | 40.1 | 7 | 14.0 | |
| Urban teaching | 725 | 19.3 | 43 | 86.0 | |
| Hospital ownership | |||||
| Government, nonfederal | 741 | 19.7 | 0 | 0 | <0.0001 |
| Private, nonprofit | 2,364 | 63.0 | 48 | 96.0 | |
| Private, investor‐owned | 650 | 17.3 | 2 | 4.0 | |
| Volume of pediatric hospitalizations (deciles) | |||||
| <185 hospitalizations/year (<8th decile) | 2,664 | 71.0 | 0 | 0 | <0.0001 |
| 186375 hospitalizations/year (8th decile) | 378 | 10.1 | 2 | 4.0 | |
| 376996 hospitalizations/year (9th decile) | 380 | 10.1 | 1 | 2.0 | |
| >986 hospitalizations/year (10th decile) | 333 | 8.9 | 47 | 94.0 | |
| Volume of pediatric hospitalizations, median [IQR] | 56 | [14240] | 12,001 | [5,83815,448] | <0.0001 |
A total of 1,407,822 (SD 50,456) hospitalizations occurred at GHs, representing 71.7% of pediatric hospitalizations, whereas 554,458 (SD 45,046) hospitalizations occurred at FCHs. Hospitalizations at GHs accounted for 63.6% of days in hospital and 50.0% of pediatric inpatient healthcare costs. Eighty percent of the GHs had total pediatric patient volumes of less than 375 hospitalizations yearly; 11.1% of pediatric hospitalizations occurred at these lower‐volume centers. At FCHs, the median volume of pediatric hospitalizations was 12,001 (interquartile range [IQR]: 583815,448). A total of 36 GHs had pediatric hospitalization volumes in this IQR.
The median age for pediatric patients was slightly higher at GHs, whereas gender, race/ethnicity, primary payer, and median household income for zip code did not differ significantly between hospital types (Table 2). Medical complexity differed between hospital types: children with complex chronic diseases represented 20.2% of hospitalizations at GHs and 35.6% of hospitalizations at FCHs. Severity of illness differed between hospital types, with fewer hospitalizations categorized at the highest level of severity at GHs than FCHs. There were no significant differences between hospital types with respect to the proportion of hospitalizations categorized as neonatal hospitalizations or as elective hospitalizations. The median LOS was shorter at GHs than FCHs. Approximately 1 in 5 children hospitalized at GHs had LOS greater than 4 days, whereas almost 30% of children hospitalized at FCHs had LOS of this duration.
| Patient Characteristics |
General Hospitals,1,407,822 (50,456), 71.7% |
Children's Hospitals,554,458 (45,046), 28.3% |
P Value | ||||
|---|---|---|---|---|---|---|---|
| n | (SD Weighted Frequency) | (%) | n | (SD Weighted Frequency) | % | ||
| |||||||
| Age, y, median [IQR] | 3.6 [011.7] | 3.4 [010.8] | 0.001 | ||||
| Gender (% female) | 644,250 | (23,089) | 45.8 | 254,505 | (20,688) | 45.9 | 0.50 |
| Race* | |||||||
| White | 668,876 | (27,741) | 47.5 | 233,930 | (26,349) | 42.2 | 0.05 |
| Black | 231,586 | (12,890) | 16.5 | 80,568 | (11,739) | 14.5 | |
| Hispanic | 279,021 | (16,843) | 19.8 | 12,1425 | (21,183) | 21.9 | |
| Other | 133,062 | (8,572) | 9.5 | 41,190 | (6,394) | 7.4 | |
| Insurance status | |||||||
| Public | 740,033 | (28,675) | 52.6 | 284,795 | (25,324) | 51.4 | 0.90 |
| Private | 563,562 | (21,930) | 40.0 | 224,042 | (21,613) | 40.4 | |
| Uninsured | 37,265 | (1,445) | 2.7 | 16,355 | (3,804) | 3.0 | |
| No charge/other/unknown | 66,962 | (5,807) | 4.8 | 29,266 | (6,789) | 5.3 | |
| Median household income for zip code, quartiles | |||||||
| <$38,999 | 457,139 | (19,725) | 33.3 | 164,831 | (17,016) | 30.1 | 0.07 |
| $39,000$47,999 | 347,229 | (14,104) | 25.3 | 125,105 | (10,712) | 22.9 | |
| $48,000$62,999 | 304,795 | (13,427) | 22.2 | 134,915 | (13,999) | 24.7 | |
| >$63,000 | 263,171 | (15,418) | 19.2 | 122,164 | (16,279) | 22.3 | |
| Medical complexity | |||||||
| Nonchronic disease | 717,009 | (21,807) | 50.9 | 211,089 | (17,023) | 38.1 | <0.001 |
| Noncomplex chronic disease | 406,070 | (14,951) | 28.8 | 146,077 | (12,442) | 26.4 | |
| Complex chronic disease | 284,742 | (17,111) | 20.2 | 197,292 | (18,236) | 35.6 | |
| APR‐DRG severity of illness | |||||||
| 1 (lowest severity) | 730,134 | (23,162) | 51.9 | 217,202 | (18,433) | 39.2 | <0.001 |
| 2 | 486,748 | (18,395) | 34.6 | 202,931 | (16,864) | 36.6 | |
| 3 | 146,921 | (8,432) | 10.4 | 100,566 | (9,041) | 18.1 | |
| 4 (highest severity) | 41,749 | (3,002) | 3.0 | 33,340 | (3,199) | 6.0 | |
| Hospitalization characteristics | |||||||
| Neonatal hospitalization | 98,512 | (3,336) | 7.0 | 39,584 | (4,274) | 7.1 | 0.84 |
| Admission type | |||||||
| Elective | 255,774 | (12,285) | 18.3 | 109,854 | (13,061) | 19.8 | 0.05 |
| Length of stay, d, (median [IQR]) | 1.8 (0.01) [0.8‐3.6] | 2.2 (0.06) [1.1‐4.7] | <0.001 | ||||
| High turnover hospitalizations | 416,790 | (14,995) | 29.6 | 130,441 | (12,405) | 23.5 | <0.001 |
| Length of stay >4 days | 298,315 | (14,421) | 21.2 | 161,804 | (14,354) | 29.2 | <0.001 |
| Admission source | |||||||
| Transfer from another acute care hospital | 154,058 | (10,067) | 10.9 | 82,118 | (8,952) | 14.8 | 0.05 |
| Direct admission | 550,123 | (21,954) | 39.1 | 211,117 | (20,203) | 38.1 | |
| Admission from ED | 703,641 | (26,155) | 50.0 | 261,223 | (28,708) | 47.1 | |
| Discharge status | |||||||
| Routine | 1,296,638 | (46,012) | 92.1 | 519,785 | (42,613) | 93.8 | <0.01 |
| Transfer to another hospital or healthcare facility | 56,115 | (1,922) | 4.0 | 13,035 | (1,437) | 2.4 | |
| Discharge against medical advice | 2,792 | (181) | 0.2 | 382 | (70) | 0.1 | |
| Other | 52,276 | (4,223) | 3.7 | 21,256 | (4,501) | 3.8 | |
The most common pediatric medical, mental health, and surgical conditions are shown in Figure 1, together representing 32% of pediatric hospitalizations during the study period. For these medical conditions, 77.9% of hospitalizations occurred at GHs, ranging from 52.6% of chemotherapy hospitalizations to 89.0% of hospitalizations for neonatal hyperbilirubinemia. Sixty‐two percent of total hospital costs for these conditions were incurred at GHs. For the common mental health hospitalizations, 86% of hospitalizations occurred at GHs. The majority of hospitalizations and aggregate hospital costs for common surgical conditions also occurred at GHs.
Whereas pneumonia, asthma, and bronchiolitis were the most common reasons for hospitalization at both GHs and FCHs, the most costly conditions differed (see Supporting Table 1 in the online version of this article). At GHs, these respiratory diseases were responsible for the highest condition‐specific total hospital costs. At FCHs, the highest aggregate costs were due to respiratory distress syndrome and chemotherapy. Congenital heart diseases, including hypoplastic left heart syndrome, transposition of the great vessels, tetralogy of Fallot, endocardial cushion defects, coarctation of the aorta and ventricular septal defects accounted for 6 of the 20 most costly conditions at FCHs.
Figure 2 illustrates the volume of hospitalizations, per hospital, at GHs and FCHs for the most common medical hospitalizations. The median number of hospitalizations, per hospital, was consistently significantly lower at GHs than at FCHs (all P values <0.001). Similar results for surgical and mental health hospitalizations are shown as Supporting Figures 1 and 2 in the online version of this article. In our sensitivity analyses that included all hospitals classified as GH and FCH, all results were essentially unchanged.
Recognizing the wide range of pediatric volumes at GHs (Table 1) and our inability to differentiate children's hospitals nested within GHs from GHs with pediatric beds, we examined differences in patient and hospitalization characteristics at GHs with volumes 5838 hospitalizations (the 25th percentile for FCH volume) and GHs with pediatric volumes <5838/year (see Supporting Table 2 in the online version of this article). We also compared patient and hospitalization characteristics at FCHs and the higher‐volume GHs. A total of 36 GHs had pediatric volumes 5838, with hospitalizations at these sites together accounting for 15.4% of all pediatric hospitalizations. Characteristics of patients hospitalized at these higher‐volume GHs were similar to patients hospitalized at FCHs, but they had significantly lower disease severity, fewer neonatal hospitalizations, shorter LOS, and more high‐turnover hospitalizations than patients hospitalized at FCHs. We also observed several differences between children hospitalized at higher‐ and lower‐volume GHs (see Supporting Table 2 in the online version of this article). Children hospitalized at the lower‐volume GHs were more likely to have public health insurance and less likely to have complex chronic diseases, although overall, 39.0% of all hospitalizations for children with complex chronic diseases occurred at these lower‐volume GHs. Compared to children hospitalized at higher‐volume GHs, children hospitalized at the lower‐volume hospitals had significantly lower disease severity, shorter LOS, more direct admissions, and a greater proportion of routine discharges.
DISCUSSION
Of the 2 million pediatric hospitalizations in the United States in 2012, more than 70% occurred at GHs. We observed considerable heterogeneity in pediatric volumes across GHs, with 11% of pediatric hospitalizations occurring at hospitals with pediatric volumes of <375 hospitalizations annually, whereas 15% of pediatric hospitalizations occurred at GHs with volumes similar to those observed at FCHs. The remaining pediatric hospitalizations at GHs occurred at centers with intermediate volumes. The most common reasons for hospitalization were similar at GHs and FCHs, but the most costly conditions differed substantially. These findings have important implications for pediatric clinical care programs, research, and QI efforts.
Our finding that more than 70% of pediatric hospitalizations occurred at GHs speaks to the importance of quality measurement at these hospitals, whereas low per‐hospital pediatric volumes at the majority of GHs makes such measurement particularly challenging. Several previous studies have illustrated that volumes of pediatric hospitalizations are too small to detect meaningful differences in quality between hospitals using established condition‐specific metrics.[13, 14, 15] Our finding that more than 10% of pediatric hospitalizations occurred at GHs with pediatric volumes <375 year supports previous research suggesting that cross‐cutting, all‐condition quality metrics, composite measures, and/or multihospital reporting networks may be needed to enable quality measurement at these sites. In addition, the heterogeneity in patient volumes and characteristics across GHs raise questions about the applicability of quality metrics developed and validated at FCHs to the many GH settings. Field‐testing quality measures to ensure their validity at diverse GHs, particularly those with patient volumes and infrastructure different from FCHs, will be important to meaningful pediatric quality measurement.
Our results illustrating differences in the most common and costly conditions at GHs and FCHs have further implications for prioritization and implementation of research and QI efforts. Implementation research and QI efforts focused on cardiac and neurosurgical procedures, as well as neonatal intensive care, may have considerable impact on cost and quality at FCHs. At GHs, research and QI efforts focused on common conditions are needed to increase our knowledge of contextually relevant barriers to and facilitators of high‐quality pediatric care. This, however, can be made more difficult by small sample sizes, limited resources, and infrastructure, and competing priorities in adult‐focused GH settings.[16, 17, 18] Multihospital learning collaboratives and partnerships between FCHs and GHs can begin to address these challenges, but their success is contingent upon national advocacy and funding to support pediatric research and quality measures at GHs.
One of the most notable differences in the characteristics of pediatric hospitalizations at GHs and FCHs was the proportion of hospitalizations attributable to children with medical complexity (CMC); more than one‐third of hospitalizations at FCHs were for CMC compared to 1 in 5 at GHs. These findings align with the results of several previous studies describing the substantial resource utilization attributed to CMC, and with growing research, innovation, and quality metrics focused on improving both inpatient and outpatient care for these vulnerable children.[19, 20, 21, 22] Structured complex care programs, developed to improve care coordination and healthcare quality for CMC, are common at FCHs, and have been associated with decreased resource utilization and improved outcomes.[23, 24, 25] Notably, however, more than half of all hospitalizations for CMC, exceeding 250,000 annually, occurred at GHs, and almost 40% of hospitalizations for CMC occurred at the lower‐volume GHs. These findings speak to the importance of translating effective and innovative programs of care for CMC to GHs as resources allow, accompanied by robust evaluations of their effectiveness. Lower patient volume at most GHs, however, may be a barrier to dedicated CMC programs. As a result, decentralized community‐based programs of care for CMC, linking primary care programs with regional and tertiary care hospitals, warrant further consideration.[26, 27, 28]
This analysis should be interpreted in light of several limitations. First, we were unable to distinguish between GHs with scant pediatric‐specific resources from those with a large volume of dedicated pediatric resources, such as children's hospitals nested within GHs. We did identify 36 GHs with pediatric volumes similar to those observed at FCHs (see Supporting Table 2 in the online version of this article); patient and hospitalization characteristics at these higher‐volume GHs were similar in many ways to children hospitalized at FCHs. Several of these higher‐volume GHs may have considerable resources dedicated to the care of children, including subspecialty care, and may represent children's hospitals nested within GHs. Because nested children's hospitals are included in the GH categorization, our results may have underestimated the proportion of children cared for at children's hospitals. Further work is needed to identify the health systems challenges and opportunities that may be unique to these institutions. Second, because the 2012 KID does not include a specialty hospital indicator, we developed a proxy method for identifying these hospitals, which may have resulted in some misclassification. We are reassured that the results of our analyses did not change substantively when we included all hospitals. Similarly, although we are reassured that the number of hospitals classified in our analysis as acute care FCHs aligns, approximately, with the number of hospitals classified as such by the Children's Hospital Association, we were unable to assess the validity of this variable within the KID. Third, the KID does not link records at the patient level, so we are unable to report the number of unique children included in this analysis. In addition, the KID includes only inpatient stays with exclusion of observation status stays; potential differences between GH and FCH in the use of observation status could have biased our findings. Fifth, we used the PMCA to identify CMC; although this algorithm has been shown to have excellent sensitivity in identifying children with chronic diseases, using up to 3 years of Medicaid claims data, the sensitivity using the KID, where only 1 inpatient stay is available for assessment, is unknown.[8, 29] Similarly, use of Keren's pediatric diagnosis grouper to classify reasons for hospitalization may have resulted in misclassification, though there are few other nonproprietary pediatric‐specific diagnostic groupers available.
In 2012, more than 70% of pediatric hospitalizations occurred at GHs in the United States. The considerably higher pediatric volumes at FCHs makes these institutions well suited for research, innovation, and the development and application of disease‐specific QI initiatives. Recognizing that the majority of pediatric hospitalizations occurred at GHs, there is a clear need for implementation research, program development, and quality metrics that align with the characteristics of hospitalizations at these centers. National support for research and quality improvement that reflects the diverse hospital settings where children receive their hospital care is critical to further our nation's goal of improving hospital quality for children.
Disclosures
Dr. Leyenaar was supported by grant number K08HS024133 from the Agency for Healthcare Research and Quality. The content is solely the responsibility of the authors and does not necessarily represent the official views of the Agency for Healthcare Research and Quality. The authors have no conflicts of interest relevant to this article to disclose.
- , , , . Mirror, Mirror on the wall: how the performance of the US health care system compares internationally. The Commonwealth Fund. Available at: http://www.commonwealthfund.org/publications/fund‐reports/2014/jun/mirror‐mirror. Published June 16, 2014. Accessed August 26, 2015.
- , , , , , . Higher cost, but poorer outcomes: the US health disadvantage and implications for pediatrics. Pediatrics. 2015;135(6):961–964.
- , , , , . US health spending trends by age and gender: selected years 2002–10. Health Aff (Millwood). 2014;33(5):815–822.
- , , . Costs for hospital stays in the United States, 2012. Healthcare Cost and Utilization Project 181. Available at: http://www.hcup‐us.ahrq.gov/reports/statbriefs/sb181‐Hospital‐Costs‐United‐States‐2012.pdf. Published October 2014. Accessed September 2015.
- , , , et al. All Patient Refined Diagnosis Related Groups: Methodology Overview. 3M Health Information Systems. Available at: https://www.hcup‐us.ahrq.gov/db/nation/nis/APR‐DRGsV20MethodologyOverviewandBibliography.pdf. Accessed February 8, 2016.
- Agency for Healthcare Research and Quality. Healthcare Cost and Utilization Project. Introduction to the HCUP Kids' Inpatient Database (KID) 2012. Available at: https://www.hcup‐us.ahrq.gov/db/nation/kid/kid_2012_introduction.jsp. Published Issued July 2014. Accessed February 8, 2016.
- . Prioritization of comparative effectiveness research topics in hospital pediatrics. Arch Pediatr Adolesc Med. 2012;166(12):1155.
- , , , et al. Pediatric medical complexity algorithm: a new method to stratify children by medical complexity. Pediatrics. 2014;133(6):e1647–e1654.
- , , , et al. 3M APR DRG Classification System. 3M Health Information Systems. Available at: http://www.hcup‐us.ahrq.gov/db/nation/nis/v261_aprdrg_meth_ovrview.pdf. Accessed August 7, 2015.
- , , , , , . Trends in high‐turnover stays among children hospitalized in the United States, 1993–2003. Pediatrics. 2009;123(3):996–1002.
- , , , . High turnover stays for pediatric asthma in the United States. Med Care. 2010;48(9):827–833.
- , , , , . Variation and outcomes associated with direct admission among children with pneumonia in the United States. JAMA Pediatr. 2014;168(9):829–836.
- , , , et al. Recognizing differences in hospital quality performance for pediatric inpatient care. Pediatrics. 2015;136(2):251–262.
- , , . Small numbers limit the use of the inpatient pediatric quality indicators for hospital comparison. Acad Pediatr. 2010;10(4):266–273.
- , , , et al. Statistical uncertainty of mortality rates and rankings for children's hospitals. Pediatrics. 2011;128(4):e966–e972.
- , , , , . Determinants of career satisfaction among pediatric hospitalists: a qualitative exploration. Acad Pediatr. 2014;14(4):361–368.
- , , , et al. Quality improvement research in pediatric hospital medicine and the role of the Pediatric Research in Inpatient Settings (PRIS) network. Acad Pediatr. 2013;13(6 suppl):S54–S60.
- . Roles for children's hospitals in pediatric collaborative improvement networks. Pediatrics. 2013;131(suppl 4):S215–S218.
- , , , et al. Children with medical complexity: an emerging population for clinical and research initiatives. Pediatrics. 2011;127(3):529–538.
- , , , et al. Children with complex chronic conditions in inpatient hospital settings in the United States. Pediatrics. 2010;126(4):647–655.
- , , , , , . Patterns and costs of health care use of children with medical complexity. Pediatrics. 2012;130(6):e1463–e1470.
- , , , , , . Hospital utilization and characteristics of patients experiencing recurrent readmissions within children's hospitals. JAMA. 2011;305(7):682–690.
- , , , et al. Characteristics of hospitalizations for patients who use a structured clinical care program for children with medical complexity. J Pediatr. 2011;159(2):284–290.
- , , , . Hospital‐based comprehensive care programs for children with special health care needs: a systematic review. Arch Pediatr Adolesc Med. 2011;165(6):554–561.
- , , , , , . A tertiary care–primary care partnership model for medically complex and fragile children and youth with special health care needs. Arch Pediatr Adolesc Med. 2007;161(10):937–944.
- , , , et al. Integrated complex care coordination for children with medical complexity: a mixed‐methods evaluation of tertiary care‐community collaboration. BMC Health Serv Res. 2012;12:366.
- , , , . Medical transport of children with complex chronic conditions. Emerg Med Int. 2012;2012:837020.
- , , . Comanagement of medically complex children by subspecialists, generalists, and care coordinators. Pediatrics. 2014;134(2):203–205.
- , , , , . Ways to identify children with medical complexity and the importance of why. J Pediatr. 2015;167(2):229–237.
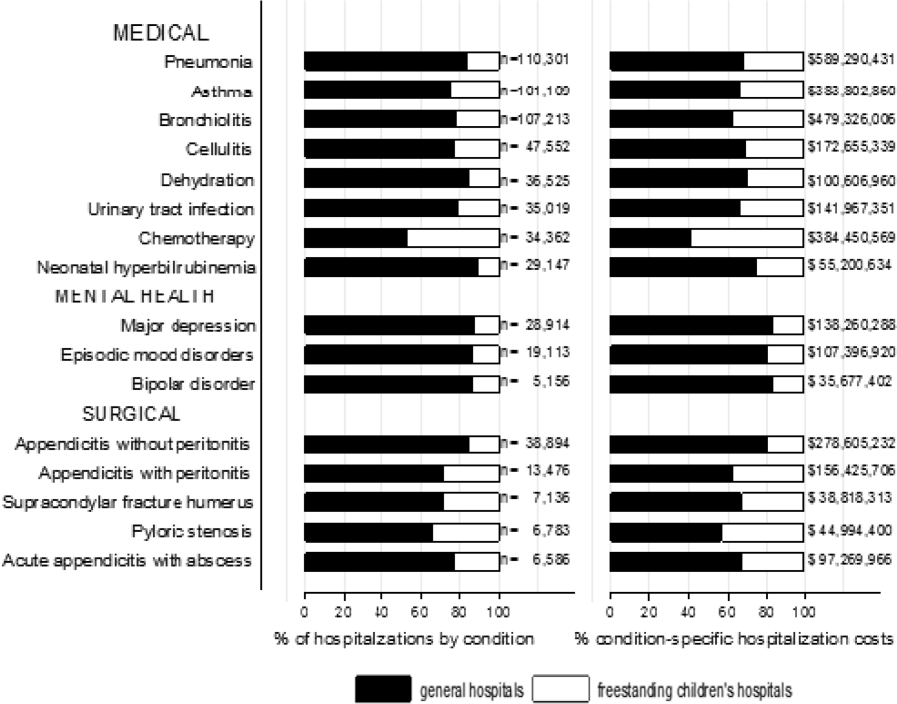
Agreement on Dyspnea Severity
Breathlessness, or dyspnea, is defined as a subjective experience of breathing discomfort that is comprised of qualitatively distinct sensations that vary in intensity.[1] Dyspnea is a leading reason for patients presenting for emergency care,[2] and it is an important predictor for hospitalization and mortality in patients with cardiopulmonary disease.[3, 4, 5]
Several professional societies' guidelines recommend that patients should be asked to quantify the intensity of their breathlessness using a standardized scale, and that these ratings should be documented in medical records to guide dyspnea awareness and management.[1, 6, 7] During the evaluation and treatment of patients with acute cardiopulmonary conditions, the clinician estimates the severity of the illness and response to therapy based on multiple objective measures as well as the patient's perception of dyspnea. A patient‐centered care approach depends upon the physicians having a shared understanding of what the patient is experiencing. Without this appreciation, the healthcare provider cannot make appropriate treatment decisions to ensure alleviation of presenting symptoms. Understanding the severity of patients' dyspnea is critical to avoid under‐ or overtreatment of patients with acute cardiopulmonary conditions, but only a few studies have compared patient and provider perceptions of dyspnea intensity.[8, 9] Discordance between physician's impression of severity of dyspnea and patient's perception may result in suboptimal management and patient dissatisfaction with care. Furthermore, several studies have shown that, when physicians and patients agree with the assessment of well‐being, treatment adherence and outcomes improve.[10, 11]
Therefore, we evaluated the extent and directionality of agreement between patients' perception and healthcare providers' impression of dyspnea and explored which factors contribute to discordance. Additionally, we examined how healthcare providers document dyspnea severity.
METHODS
Study Setting and Population
The study was conducted between June 2012 and August 2012 at Baystate Medical Center (BMC), a 740‐bed tertiary care hospital in western Massachusetts. In 2012, the BMC hospitalist group had 48 attending physicians, of whom 47% were female, 48% had 0 to 3 years of attending experience, and 16% had 10 years of experience.
We enrolled consecutive admissions of English‐speaking adult patients, with a working diagnosis of heart failure (HF), chronic obstructive pulmonary disease (COPD), asthma, pneumonia, or a generic diagnosis of shortness of breath. Because we surveyed only hospitalists, we did not include patients admitted to an intensive care unit.
All participants gave informed consent to be part of the study. The research protocol was approved by the Baystate Health Institutional Review Board, Springfield, Massachusetts.
Dyspnea Assessment
Dyspnea intensity was assessed on an 11‐point (010) numerical rating scale (NRS).[12, 13] A trained research assistant interviewed patients on day 1 and 2 after admission, and on the day of discharge between 8 am and 12 pm on weekdays. The patient was asked: On a scale from 0 to 10, how bad is your shortness of breath at rest now, with 0 being no shortness of breath and 10 the worst shortness of breath you could ever imagine? The hospitalist or the senior resident and day‐shift nurse taking care of the patients were asked by the research assistant to rate the patient's dyspnea using the same scoring instrument shortly after they saw the patient. The physicians and nurses based their determination of dyspnea on their usual interview/examination of the patient. The patient, physician and the nurse were not aware of each other's rating. The research assistant scheduled the interviews to minimize the time intervals between the patient assessment and provider's rating. For this reason, the number of assessments per patient varied. Nurses were more readily available than physicians, which resulted in a larger number of patient‐nurse response pairs than patient‐physician pairs. All assessments were done in the morning, between 9 am and 12 pm, with a range of 3 hours between provider's assessment of the patient and the interview.
Dyspnea Agreement
Agreement was defined as a score within 1 between patient and healthcare provider; differences of 2 points were considered over‐ or underestimations. The decision to use this cutoff was based on prior studies, which found that a difference in the range of 1.6 to 2.2 cm was meaningful for the patient when assessment was done on the visual analog scale.[8, 14, 15] We also evaluated the direction of discordance. If the patient's rating of dyspnea severity was higher than the provider's rating, we defined this as underestimation by the provider; in the instance where a provider's score of dyspnea severity was higher than the patient's score, we defined this as overestimation. In a sensitivity analysis, agreement was defined as a score within 2 between patient and healthcare provider, and any difference 3 was considered disagreement.
Other Variables
We obtained information from the medical records about patient demographics, body mass index (BMI), smoking status, and vital signs. We calculated the oxygen saturation index as the ratio between the oxygen saturation and the fractional inspired oxygen (SpO2/FIO2). Comorbidities were assessed based on the International Classification od Diseases, Ninth Revision, Clinical Modification codes from the hospital financial decision support system. We calculated an overall combined comorbidity score based on the method described by Gagne, which is based on elements from the Charlson Comorbidity Index and from the Elixhauser comorbidities.[16]
Charts of the patients included in the study were retrospectively reviewed for physicians' and nurses' documentation of dyspnea at admission and at discharge. We recorded if dyspnea was mentioned and how it was assessed: whether it was described as present/absent; graded as mild, moderate, or severe; used a quantitative scale (010); used descriptors (eg, dyspnea when climbing stairs); and whether it was defined as improved or worsened without other qualifiers.
Statistical Analysis
Descriptive statistics of dyspnea scores, patient characteristics, comorbidities and vital signs were calculated and presented as medians with interquartile range (IQR) for continuous variables, and counts with percentages for categorical factors. Every patient‐provider concurrent scoring was included in the analysis as 1 dyad, which resulted in patients being included multiple times in the analysis. Patient‐physician and patient‐nurse dyads of dyspnea assessment were examined separately. Analyses included all dyads that were within same assessment period (same day and same time window).
The relationship between patient self‐perceived dyspnea severity and provider rating of was assessed in several ways. First, a weighted kappa coefficient was used as a measure of agreement between patient and nurse or physician scores. A weighted kappa analysis was chosen because it penalizes disagreements that are further apart from each other.
Second, we defined an indicator of discordance and constructed multivariable generalized estimating equation models that account for clustering of multiple dyads per patient, to assess the relationship of patient characteristics with discordance. Finally, we developed additional models to predict underestimation when compared to agreement or overestimation of dyspnea by the healthcare provider relative to the patient. Using the same definitions for agreement, we also compared the dyspnea assessment estimation between physicians and nurses.
We present the differences in dyspnea assessment between patient and healthcare provider and between nurses and physicians by Bland‐Altman plots.
All analyses were performed using SAS (version 9.3; SAS institute, Inc., Cary, NC), Stata (Stata statistical software release 13; StataCorp, College Station, TX), and RStudio version 0.99.892 (Bland‐Altman plots, R package version 0.3.1; The R Foundation for Statistical Computing, Vienna, Austria).[8, 9, 17]
RESULTS
Patient Characteristics
Among the 219 patients who met the screening criteria, 81 were not enrolled (Figure 1). Data from 138 patients, with both patient information and provider data on dyspnea assessment, were included. The median age of the patients was 72 years (IQR, 5880 years), 56.5% were women, 75.4% were white, and 28.3% were current smokers. Approximately 30% had a diagnosis of HF, 30% of COPD, and 13.0% of pneumonia. The median comorbidity score was 4 (IQR, 26), and 37.0% of the patients had a BMI 30. At admission, the median oxygen saturation index was 346 (IQR, 287.5460) indicating mild to moderate levels of hypoxia. (Table 1).
| Value | |
|---|---|
| |
| Age, median (IQR), y | 72 (5880) |
| Gender | |
| Female | 78 (56.5) |
| Male | 60 (43.5) |
| Race | |
| White | 104 (75.4) |
| Black | 16 (11.6) |
| Hispanic | 17 (12.3) |
| Other | 1 (0.7) |
| Body mass index, median (IQR) | 28 (23.334.6) |
| Obese (BMI 30) | 51 (37.0) |
| Smoker, current | 39 (28.3) |
| Admitting diagnosis | |
| Heart failure | 46 (33.3) |
| COPD/asthma | 41 (29.7) |
| Pneumonia | 18 (13.0) |
| Other | 33 (23.9) |
| Depression | 32 (23.2) |
| Comorbidity score, median (IQR) | 4 (26) |
| Respiratory rate at admission, median (IQR) | 20 (1924) |
| Oxygen saturation index at admission, median (IQR) | 346.4 (287.5460) |
| Patient NRS, median (IQR) | |
| At admission | 9 (710) |
| At discharge | 2 (14) |
| Discharged on home oxygen | 45 (32.6) |
| Respiratory rate at discharge, median (IQR) | 20 (1820) |
| Oxygen saturation index at discharge, median (IQR) | 475 (350485) |

Agreement Between Patients' Self‐Assessment and Providers' Assessment of Dyspnea Severity
Not all patients had complete data points, and more nurses were interviewed than physicians. Overall, 96 patient‐physician and 138 patient‐nurse pairs participated in the study. A total of 336 patient‐nurse rating dyad assessments of dyspnea and 124 patient‐physician rating dyads assessments were collected (Figure 1). The mean difference between patient and physicians and patient and nurses assessments of dyspnea was 1.23 (IQR, 3 to 0) and 0.21 (IQR, 2 to 2) respectively (a negative score means underestimation by the provider, a positive score means overestimation).
The unadjusted agreement on the severity of dyspnea was 36.3% for the patient‐physician dyads and 44.1% for the patient‐nurse dyads. Physicians underestimated their patients' dyspnea 37.9% of the time and overestimated it 25.8% of the time; nurses underestimated it 43.5% of the time and overestimated it in 12.4% of the study patients (Table 2). In 28.2% of the time, physicians were discordant more than 4 points of the patient assessment. Bland‐Altman plots show that there is greater variation in differences of dyspnea assessments with increase in shortness of breath scores (Figure 2). Nurses underestimated more when the dyspnea score was on the lower end. Physicians also tended to estimate either lower or higher when compared to patients when the dyspnea scores were <2 (Figure 2A,B).
| Underestimation | Concordance | Overestimation | |||||||
|---|---|---|---|---|---|---|---|---|---|
| 3 | 2 | %* | 0 | 1 | % | 2 | 3 | % | |
| |||||||||
| Patient‐nurse dyads | 110 | 48 | 43.5 | 82 | 78 | 44.1 | 17 | 28 | 12.4 |
| Patient‐physician dyads | 33 | 14 | 37.9 | 21 | 24 | 36.3 | 12 | 20 | 25.8 |
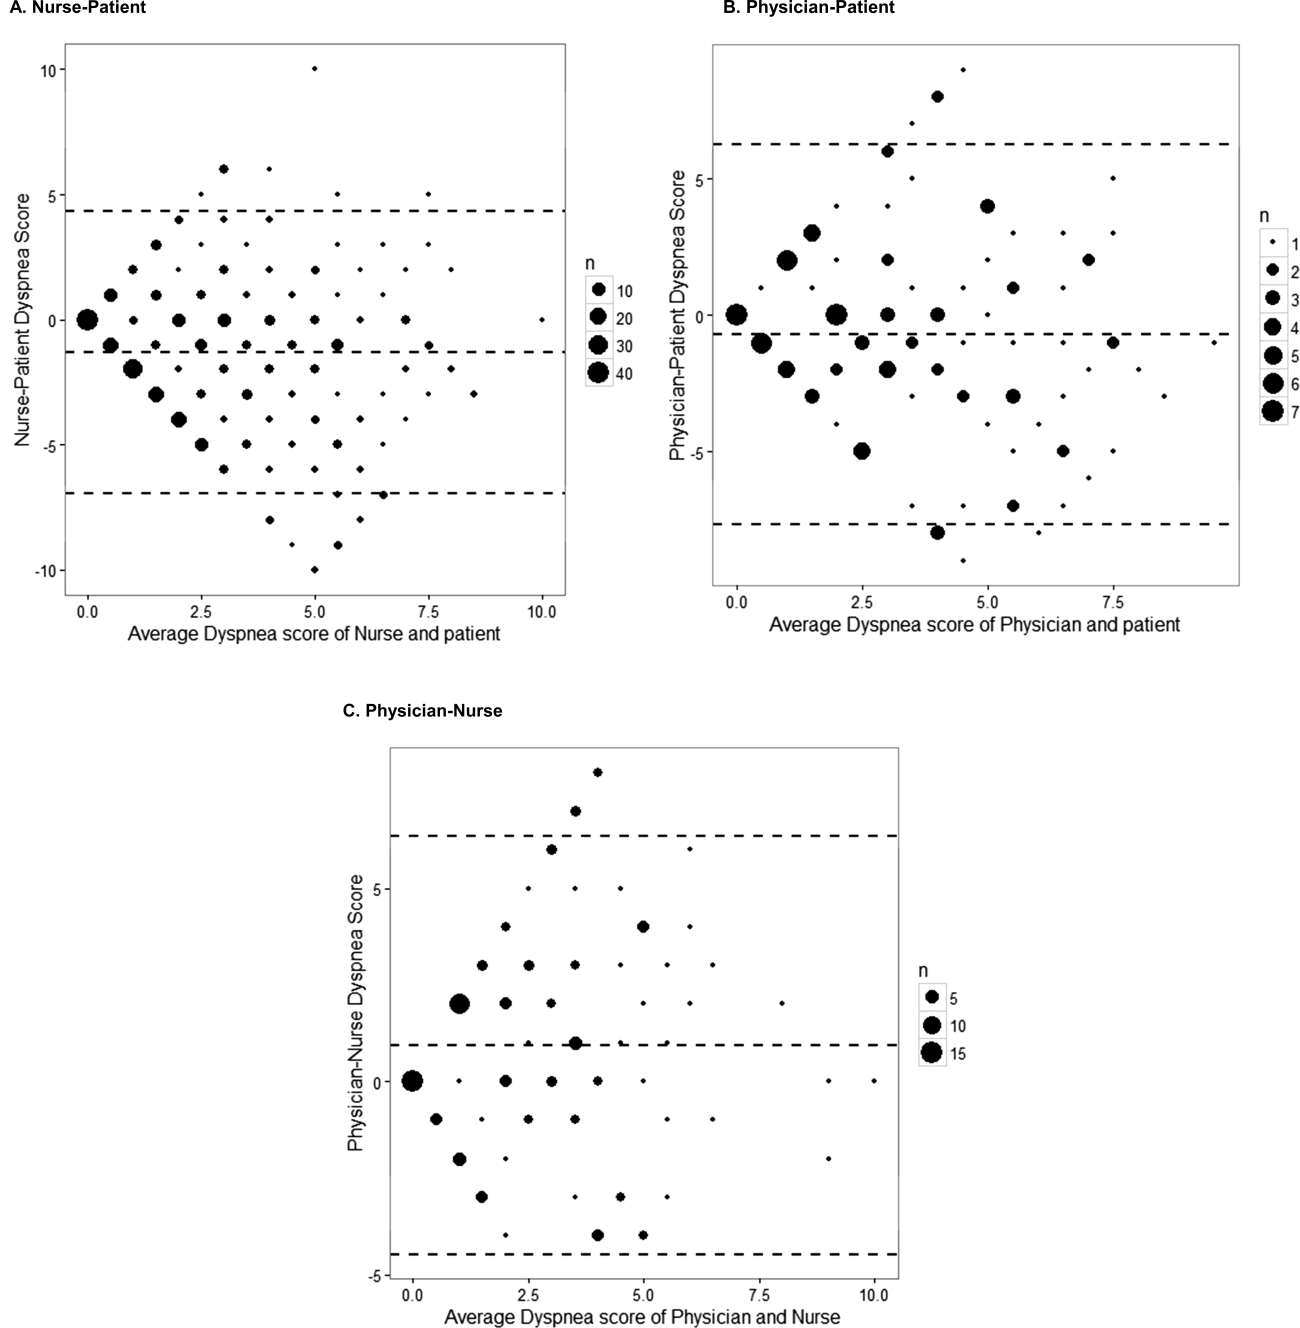
The weighted kappa coefficient for agreement was 0.11 (95% confidence interval [CI]: 0.01 to 0.21) for patient‐physician assessment, 0.18 (95% CI: 0.12 to 0.24) for patient‐nurse, and 0.09 (0.02 to 0.20) for physician‐nurse indicating poor agreement. In a sensitivity analysis in which we used a higher threshold for defining discordance (difference of more than 2 points), the kappa coefficient increased to 0.21 (95% CI: 0.06 to 0.36) for patient‐physician assessments, to 0.24 (95% CI: 0.15 to 0.33) for patient‐nurse, and to 0.24 (95% CI: 0.09 to 0.39) for nurse‐physician assessments.
Predictors of Discordance and Underestimation of Dyspnea Severity Assessment
Principal diagnosis was the only factor associated with the physicians' discordant assessment of patients' dyspnea. Patients with admission diagnoses other than HF, COPD, or pneumonia (eg, pulmonary embolism) were more likely to have an accurate assessment of their dyspnea by providers (Table 3). Similar results were obtained in the sensitivity analysis by using a higher cutoff for defining discordance and when assessing predictors for underestimation (results not shown).
| Modeling Probability of Discordance | ||
|---|---|---|
| Physician‐Patient Dyads, OR (95% CI), N = 124 | Nurse‐Patient Dyads, OR (95% CI), N = 363 | |
| ||
| Univariate Analysis | ||
| Body mass index | 1.00 (0.991.01) | 1.00 (0.991.00) |
| Comorbidity score | 1.01 (0.981.05) | 0.99 (0.961.01) |
| Respiratory rate at admission | 1.00 (0.991.02) | 0.99 (0.981.00) |
| Oxygen saturation at admission | 1.00 (1.001.00) | 1.00 (1.001.00) |
| Age (binary) | ||
| 65 years | Referent | Referent |
| >65 years | 1.21 (0.572.55) | 0.96 (0.571.64) |
| Gender | ||
| Female | Referent | Referent |
| Male | 1.10 (0.522.32) | 0.81 (0.481.37) |
| Race | ||
| White | Referent | Referent |
| Nonwhite | 1.02 (0.442.37) | 1.06 (0.581.95) |
| Obese (BMI >30) | 1.43 (0.663.11) | 0.76 (0.441.30) |
| Smoker | 1.36 (0.613.05) | 1.04 (0.591.85) |
| Admitting diagnosis | ||
| Heart failure | Referent | Referent |
| COPD/asthma | 0.68 (0.251.83) | 1.91 (0.983.73)* |
| Pneumonia | 0.38 (0.101.40) | 1.07 (0.462.45) |
| Other | 0.30 (0.110.82)* | 1.54 (0.763.11) |
| Depression | 1.21 (0.572.55) | 1.01 (0.541.86) |
| Multivariable analysis | ||
| Admitting diagnosis | ||
| Congestive heart failure | Referent | Referent |
| COPD | 0.68 (0.251.83) | 1.91 (0.983.73)* |
| Pneumonia | 0.38 (0.101.40) | 1.07 (0.462.45) |
| Other | 0.30 (0.110.82)* | 1.54 (0.763.11) |
In the multivariable analysis that assessed patient‐nurse dyads, the diagnosis of COPD was associated with a marginally significant likelihood of discordance (OR: 1.91; 95% CI: 0.98 to 3.73) (Table 3). Similarly, multivariable analysis identified principal diagnosis to be the only predictor of underestimation, and COPD diagnosis was associated with increased odds of dyspnea underestimation by nurses. When we used a higher cutoff to define discordance, the principal diagnosis of COPD (OR: 3.43, 95% CI: 1.76 to 6.69) was associated with an increased risk of discordance, and smoking (OR: 0.54, 95% CI: 0.29 to 0.99) was associated with a decreased risk of discordance. Overall, 45 patients (32.6%) were discharged on oxygen. The odds of discrepancy (under‐ or overestimation) in dyspnea scores between patient and nurse were 1.7 times higher compared to patients who were not discharged on oxygen, but this association did not reach statistical significance; the odds of discrepancy between patient and physician were 3.88 (95% CI: 1.07 to 14.13).
Documentation of Dyspnea
We found that dyspnea was mentioned in the admission notes in 96% of the charts reviewed; physicians used a qualitative rating (mild, moderate, or severe) to indicate the severity of dyspnea in only 16% of cases, and in 53% a descriptor was added (eg, dyspnea with climbing stairs, gradually increased in the prior week). Nurses were more likely than physicians to use qualitative ratings of dyspnea (26% of cases), and they used a more uniform description of the patient's dyspnea (eg, at rest, at rest and on exertion, or on exertion) than physicians. At discharge, 83% of physicians noted in their discharge summary that dyspnea improved compared with admission but did not refer to the patient's baseline level of dyspnea.
DISCUSSION
In this prospective study of 138 patients hospitalized with cardiopulmonary disease, we found that the agreement between patient's experience of dyspnea and providers' assessment was poor, and the discordance was higher for physicians than for nurses. In more than half of the cases, differences between patient and healthcare providers' assessment of dyspnea were present. One‐third of the time, both physicians and nurses underestimated patients' reported levels of dyspnea. Admitting diagnosis was the only patient factor predicting lack of agreement, and patients with COPD were more likely to have their dyspnea underestimated by nurses. Healthcare providers predominantly documented the presence or absence of dyspnea and rarely used a more nuanced scale.
Discrepancies between patient and provider assessments for pain, depression, and overall health have been reported.[8, 18, 19, 20, 21] One explanation is that patients and healthcare providers measure different factors despite using the same terminology. Furthermore, patient's assessment may be confounded by other symptoms such as anxiety, fatigue, or pain. Physicians and nurses may underevaluate and underestimate the level of breathlessness; however, from the physician perspective, dyspnea is only 1 data point, and providers rely on other measures, such as oxygen saturation, heart rate, respiratory rate, evidence of increasing breathing effort, and arterial blood gas to drive decision making. In a recent study that evaluated the attitudes and beliefs of hospitalists regarding the assessment and management of dyspnea, we found that most hospitalists indicated that awareness of dyspnea severity influences their decision for treatment, diagnostic testing, and timing of the discharge. Moreover, whereas less than half of the respondents reported experience with standardized assessment of dyspnea severity, most stated that such data would be very useful in their practice.[22]
What is the clinical significance of having discordance between patients self‐assessment and providers impression of the patient's severity of dyspnea? First, inaccurate assessment of dyspnea by providers can lead to inadequate treatment and workup. For example, a physician who underestimates the severity of dyspnea may fail to recognize when a complication of the underlying disease develops or may underutilize symptomatic methods for relief of dyspnea. In contrast, a physician who overestimates dyspnea may continue with aggressive treatment when this is not necessary. Second, lack of awareness of dyspnea severity experienced by the patient may result in premature discharge and patient's frustration with the provider, as was shown in several studies evaluating physician‐patient agreement for pain perception.[21, 23] We found that discrepancy between patients and healthcare providers was more pronounced for patients with COPD. In another study using the same patient cohort, we reported that compared to patients with congestive heart failure, those with COPD had more residual dyspnea at discharge; 1 in 4 patients was discharged with a dyspnea score of 5 of greater, and almost half reported symptoms above their baseline.[24] The results from the current study may explain in part why patients with COPD are discharged with higher levels of dyspnea and should alert healthcare providers on the importance of patient‐reported breathlessness. Third, the high level of discordance between healthcare providers and patients may explain the undertreatment of dyspnea in patients with advanced disease. This is supported by our findings that the discordance between patients and physicians was higher if the patient was discharged on oxygen.
One key role of the provider during a clinical encounter is to elicit the patient's symptoms and achieve a shared understanding of what the patient is experiencing. From the patient's perspective, their self‐assessment of dyspnea is more important that the physician's assessment. Fortunately, there is a growing recognition and emphasis on using outcomes that matter to patients, such as dyspnea, to inform judgment about patient care and for clinical research. Numerical measures for assessment of dyspnea exist, are easy to use, and are sensitive to change in patients' dyspnea.[6, 25, 26, 27] Still, it is not standard practice for healthcare providers to ask patients to provide a rating of their dyspnea. When we examined the documentation of dyspnea in the medical record, we found that the description was vague, and providers did not use a standardized validated assessment. Although the dyspnea score decreased during hospitalization, the respiratory rate did not significantly change, indicating that this objective measure may not be reliable in patient assessment. The providers' knowledge of the intensity of the symptom expressed by patients will enable them to track improvement in symptoms over time or in response to therapy. In addition, in this era of multiple handoffs within a hospitalization or from primary care to the hospital, a more uniform assessment could allow providers to follow the severity and time course of dyspnea. The low level of agreement we found between patients and the providers lends support to recommendations regarding a structured dyspnea assessment into routine hospital practice.
Study Strengths and Limitations
This study has several strengths. This is 1 of the very few studies to report on the level of agreement between patients' and providers' assessments of dyspnea. We used a validated, simple dyspnea scale that provides consistency in rating.[28, 29] We enrolled patients with a broad set of diagnoses and complaints, which increases the generalizability of our results, and we surveyed both physicians and nurses. Last, our findings were robust across different cutoff points utilized to characterize discordance and across 3 frequent diagnoses.
The study has several limitations. First, we included only English‐speaking patients, and the results cannot be generalized to patients from other cultures who do not speak English. Second, this is a single‐center study, and practices may be different in other centers; for example, some hospitals may have already implemented a dyspnea assessment tool. Third, we did not collect information on the physician and nurse characteristics such as years in practice. However, a recent study that describes the agreement of breathlessness assessment between nurses, physicians, and mechanically ventilated patients found that underestimation of breathlessness by providers was not associated with professional competencies, previous patient care, or years of working in an intensive care unit.[9] In addition, a systematic review found that length of professional experience is often unrelated to performance measures and outcomes.[30] Finally, although we asked for physicians and nurses assessment close to their visit to the patient, assessment was done from memory, not at the bedside observing the patient.
CONCLUSION
We found that the extent of agreement between a structured patient self‐assessment of dyspnea and healthcare providers' assessment was low. Future studies should prospectively test whether routine assessment of dyspnea results in better acute and long‐term patient outcomes.
Acknowledgements
The authors acknowledge Ms. Anu Joshi for her help with formatting the manuscript and assisting with table preparations. The authors also acknowledge Ms. Katherine Dempsey, Jahnavi Sagi, Sashi Ariyaratne, and Mr. Pradeep Kumbaham for their help with collecting the data.
Disclosures: M.S.S. is the guarantor for this article and had full access to all of the data in the study, and takes responsibility for the integrity and accuracy of the data analysis. M.S.S., P.K.L., E.N., and M.B.R. conceived of the study. M.S.S. and B.M. acquired the data. M.S.S., A.P., P.S.P., R.J.G., and P.K.L. analyzed and interpreted the data. M.S.S. drafted the manuscript. All authors critically reviewed the manuscript for intellectual content. M.S.S. is supported by grant 1K01HL114631‐01A1 from the National Heart, Lung, and Blood Institute of the National Institutes of Health and by the National Center for Research Resources and the National Center for Advancing Translational Sciences, National Institutes of Health, through grant UL1RR025752. The authors report no conflicts of interest.
- , , , et al. An official American Thoracic Society statement: update on the mechanisms, assessment, and management of dyspnea. Am J Respir Crit Care Med. 2012;185(4):435–452.
- , , . National Hospital Ambulatory Medical Care Survey: 2007 emergency department summary. Natl Health Stat Report. 2010;(26):1–31.
- , , , et al. The body‐mass index, airflow obstruction, dyspnea, and exercise capacity index in chronic obstructive pulmonary disease. N Engl J Med. 2004;350(10):1005–1012.
- , , , . Dyspnea is a better predictor of 5‐year survival than airway obstruction in patients with COPD. Chest. 2002;121(5):1434–1440.
- , , . A multidimensional grading system (BODE index) as predictor of hospitalization for COPD. Chest. 2005;128(6):3810–3816.
- , , , et al. American College of Chest Physicians consensus statement on the management of dyspnea in patients with advanced lung or heart disease. Chest. 2010;137(3):674–691.
- , , , et al. Managing dyspnea in patients with advanced chronic obstructive pulmonary disease: a Canadian Thoracic Society clinical practice guideline. Can Respir J. 2011;18(2):69–78.
- , , . Physician vs patient assessment of dyspnea during acute decompensated heart failure. Congest Heart Fail. 2010;16(2):60–64.
- , , , , , . Underestimation of Patient Breathlessness by Nurses and Physicians during a Spontaneous Breathing Trial. Am J Respir Crit Care Med. 2015;192(12):1440–1448.
- , , , , , . The influence of patient‐practitioner agreement on outcome of care. Am J Public Health. 1981;71(2):127–131.
- , , , , , . Listening to parents: The role of symptom perception in pediatric palliative home care. Palliat Support Care. 2016;14(1):13–19.
- , . Validity of the numeric rating scale as a measure of dyspnea. Am J Crit Care. 1998;7(3):200–204.
- , , , , , . Dyspnea scales in the assessment of illiterate patients with chronic obstructive pulmonary disease. Am J Med Sci. 2000;320(4):240–243.
- , , , , . Measuring the dyspnea of decompensated heart failure with a visual analog scale: how much improvement is meaningful? Congest Heart Fail. 2004;10(4):188–191.
- , , , , , . Clinically meaningful changes in quantitative measures of asthma severity. Acad Emerg Med. 2000;7(4):327–334.
- , , , , . A combined comorbidity score predicted mortality in elderly patients better than existing scores. J Clin Epidemiol. 2011;64(7):749–759.
- . BlandAltmanLeh: plots (slightly extended) Bland‐Altman plots. Available at: https://cran.r‐project.org/web/packages/BlandAltmanLeh/index.html. Published December 23, 2015. Accessed March 10, 2016.
- , , , , . Correlation of patient and caregiver ratings of cancer pain. J Pain Symptom Manage. 1991;6(2):53–57.
- , , , et al. Depression symptomatology and diagnosis: discordance between patients and physicians in primary care settings. BMC Fam Pract. 2008;9:1.
- , , , , , . Patient‐physician discordance in assessments of global disease severity in rheumatoid arthritis. Arthritis Care Res (Hoboken) 2010;62(6):857–864.
- , , , et al. The influence of discordance in pain assessment on the functional status of patients with chronic nonmalignant pain. Am J Med Sci. 2006;332(1):18–23.
- , , , et al. Hospitalist attitudes toward the assessment and management of dyspnea in patients with acute cardiopulmonary diseases. J Hosp Med. 2015;10(11):724–730.
- , , , , . Brief report: patient‐physician agreement as a predictor of outcomes in patients with back pain. J Gen Intern Med. 2005;20(10):935–937.
- , , , , , . The trajectory of dyspnea in hospitalized patients [published online November 24, 2015]. J Pain Symptom Manage. doi: 10.1016/j.jpainsymman.2015.11.005.
- , , , , . Measurement of breathlessness in advanced disease: a systematic review. Respir Med. 2007;101(3):399–410.
- . Review of dyspnoea quantification in the emergency department: is a rating scale for breathlessness suitable for use as an admission prediction tool? Emerg Med Australas. 2007;19(5):394–404.
- , , , . Validation of a verbal dyspnoea rating scale in the emergency department. Emerg Med Australas. 2008;20(6):475–481.
- , , . Measurement of dyspnea: word labeled visual analog scale vs. verbal ordinal scale. Respir Physiol Neurobiol. 2003;134(2):77–83.
- , , , , , . Verbal numerical scales are as reliable and sensitive as visual analog scales for rating dyspnea in young and older subjects. Respir Physiol Neurobiol. 2007;157(2–3):360–365.
- , , . Systematic review: the relationship between clinical experience and quality of health care. Ann Intern Med. 2005;142(4):260–273.
Breathlessness, or dyspnea, is defined as a subjective experience of breathing discomfort that is comprised of qualitatively distinct sensations that vary in intensity.[1] Dyspnea is a leading reason for patients presenting for emergency care,[2] and it is an important predictor for hospitalization and mortality in patients with cardiopulmonary disease.[3, 4, 5]
Several professional societies' guidelines recommend that patients should be asked to quantify the intensity of their breathlessness using a standardized scale, and that these ratings should be documented in medical records to guide dyspnea awareness and management.[1, 6, 7] During the evaluation and treatment of patients with acute cardiopulmonary conditions, the clinician estimates the severity of the illness and response to therapy based on multiple objective measures as well as the patient's perception of dyspnea. A patient‐centered care approach depends upon the physicians having a shared understanding of what the patient is experiencing. Without this appreciation, the healthcare provider cannot make appropriate treatment decisions to ensure alleviation of presenting symptoms. Understanding the severity of patients' dyspnea is critical to avoid under‐ or overtreatment of patients with acute cardiopulmonary conditions, but only a few studies have compared patient and provider perceptions of dyspnea intensity.[8, 9] Discordance between physician's impression of severity of dyspnea and patient's perception may result in suboptimal management and patient dissatisfaction with care. Furthermore, several studies have shown that, when physicians and patients agree with the assessment of well‐being, treatment adherence and outcomes improve.[10, 11]
Therefore, we evaluated the extent and directionality of agreement between patients' perception and healthcare providers' impression of dyspnea and explored which factors contribute to discordance. Additionally, we examined how healthcare providers document dyspnea severity.
METHODS
Study Setting and Population
The study was conducted between June 2012 and August 2012 at Baystate Medical Center (BMC), a 740‐bed tertiary care hospital in western Massachusetts. In 2012, the BMC hospitalist group had 48 attending physicians, of whom 47% were female, 48% had 0 to 3 years of attending experience, and 16% had 10 years of experience.
We enrolled consecutive admissions of English‐speaking adult patients, with a working diagnosis of heart failure (HF), chronic obstructive pulmonary disease (COPD), asthma, pneumonia, or a generic diagnosis of shortness of breath. Because we surveyed only hospitalists, we did not include patients admitted to an intensive care unit.
All participants gave informed consent to be part of the study. The research protocol was approved by the Baystate Health Institutional Review Board, Springfield, Massachusetts.
Dyspnea Assessment
Dyspnea intensity was assessed on an 11‐point (010) numerical rating scale (NRS).[12, 13] A trained research assistant interviewed patients on day 1 and 2 after admission, and on the day of discharge between 8 am and 12 pm on weekdays. The patient was asked: On a scale from 0 to 10, how bad is your shortness of breath at rest now, with 0 being no shortness of breath and 10 the worst shortness of breath you could ever imagine? The hospitalist or the senior resident and day‐shift nurse taking care of the patients were asked by the research assistant to rate the patient's dyspnea using the same scoring instrument shortly after they saw the patient. The physicians and nurses based their determination of dyspnea on their usual interview/examination of the patient. The patient, physician and the nurse were not aware of each other's rating. The research assistant scheduled the interviews to minimize the time intervals between the patient assessment and provider's rating. For this reason, the number of assessments per patient varied. Nurses were more readily available than physicians, which resulted in a larger number of patient‐nurse response pairs than patient‐physician pairs. All assessments were done in the morning, between 9 am and 12 pm, with a range of 3 hours between provider's assessment of the patient and the interview.
Dyspnea Agreement
Agreement was defined as a score within 1 between patient and healthcare provider; differences of 2 points were considered over‐ or underestimations. The decision to use this cutoff was based on prior studies, which found that a difference in the range of 1.6 to 2.2 cm was meaningful for the patient when assessment was done on the visual analog scale.[8, 14, 15] We also evaluated the direction of discordance. If the patient's rating of dyspnea severity was higher than the provider's rating, we defined this as underestimation by the provider; in the instance where a provider's score of dyspnea severity was higher than the patient's score, we defined this as overestimation. In a sensitivity analysis, agreement was defined as a score within 2 between patient and healthcare provider, and any difference 3 was considered disagreement.
Other Variables
We obtained information from the medical records about patient demographics, body mass index (BMI), smoking status, and vital signs. We calculated the oxygen saturation index as the ratio between the oxygen saturation and the fractional inspired oxygen (SpO2/FIO2). Comorbidities were assessed based on the International Classification od Diseases, Ninth Revision, Clinical Modification codes from the hospital financial decision support system. We calculated an overall combined comorbidity score based on the method described by Gagne, which is based on elements from the Charlson Comorbidity Index and from the Elixhauser comorbidities.[16]
Charts of the patients included in the study were retrospectively reviewed for physicians' and nurses' documentation of dyspnea at admission and at discharge. We recorded if dyspnea was mentioned and how it was assessed: whether it was described as present/absent; graded as mild, moderate, or severe; used a quantitative scale (010); used descriptors (eg, dyspnea when climbing stairs); and whether it was defined as improved or worsened without other qualifiers.
Statistical Analysis
Descriptive statistics of dyspnea scores, patient characteristics, comorbidities and vital signs were calculated and presented as medians with interquartile range (IQR) for continuous variables, and counts with percentages for categorical factors. Every patient‐provider concurrent scoring was included in the analysis as 1 dyad, which resulted in patients being included multiple times in the analysis. Patient‐physician and patient‐nurse dyads of dyspnea assessment were examined separately. Analyses included all dyads that were within same assessment period (same day and same time window).
The relationship between patient self‐perceived dyspnea severity and provider rating of was assessed in several ways. First, a weighted kappa coefficient was used as a measure of agreement between patient and nurse or physician scores. A weighted kappa analysis was chosen because it penalizes disagreements that are further apart from each other.
Second, we defined an indicator of discordance and constructed multivariable generalized estimating equation models that account for clustering of multiple dyads per patient, to assess the relationship of patient characteristics with discordance. Finally, we developed additional models to predict underestimation when compared to agreement or overestimation of dyspnea by the healthcare provider relative to the patient. Using the same definitions for agreement, we also compared the dyspnea assessment estimation between physicians and nurses.
We present the differences in dyspnea assessment between patient and healthcare provider and between nurses and physicians by Bland‐Altman plots.
All analyses were performed using SAS (version 9.3; SAS institute, Inc., Cary, NC), Stata (Stata statistical software release 13; StataCorp, College Station, TX), and RStudio version 0.99.892 (Bland‐Altman plots, R package version 0.3.1; The R Foundation for Statistical Computing, Vienna, Austria).[8, 9, 17]
RESULTS
Patient Characteristics
Among the 219 patients who met the screening criteria, 81 were not enrolled (Figure 1). Data from 138 patients, with both patient information and provider data on dyspnea assessment, were included. The median age of the patients was 72 years (IQR, 5880 years), 56.5% were women, 75.4% were white, and 28.3% were current smokers. Approximately 30% had a diagnosis of HF, 30% of COPD, and 13.0% of pneumonia. The median comorbidity score was 4 (IQR, 26), and 37.0% of the patients had a BMI 30. At admission, the median oxygen saturation index was 346 (IQR, 287.5460) indicating mild to moderate levels of hypoxia. (Table 1).
| Value | |
|---|---|
| |
| Age, median (IQR), y | 72 (5880) |
| Gender | |
| Female | 78 (56.5) |
| Male | 60 (43.5) |
| Race | |
| White | 104 (75.4) |
| Black | 16 (11.6) |
| Hispanic | 17 (12.3) |
| Other | 1 (0.7) |
| Body mass index, median (IQR) | 28 (23.334.6) |
| Obese (BMI 30) | 51 (37.0) |
| Smoker, current | 39 (28.3) |
| Admitting diagnosis | |
| Heart failure | 46 (33.3) |
| COPD/asthma | 41 (29.7) |
| Pneumonia | 18 (13.0) |
| Other | 33 (23.9) |
| Depression | 32 (23.2) |
| Comorbidity score, median (IQR) | 4 (26) |
| Respiratory rate at admission, median (IQR) | 20 (1924) |
| Oxygen saturation index at admission, median (IQR) | 346.4 (287.5460) |
| Patient NRS, median (IQR) | |
| At admission | 9 (710) |
| At discharge | 2 (14) |
| Discharged on home oxygen | 45 (32.6) |
| Respiratory rate at discharge, median (IQR) | 20 (1820) |
| Oxygen saturation index at discharge, median (IQR) | 475 (350485) |
Agreement Between Patients' Self‐Assessment and Providers' Assessment of Dyspnea Severity
Not all patients had complete data points, and more nurses were interviewed than physicians. Overall, 96 patient‐physician and 138 patient‐nurse pairs participated in the study. A total of 336 patient‐nurse rating dyad assessments of dyspnea and 124 patient‐physician rating dyads assessments were collected (Figure 1). The mean difference between patient and physicians and patient and nurses assessments of dyspnea was 1.23 (IQR, 3 to 0) and 0.21 (IQR, 2 to 2) respectively (a negative score means underestimation by the provider, a positive score means overestimation).
The unadjusted agreement on the severity of dyspnea was 36.3% for the patient‐physician dyads and 44.1% for the patient‐nurse dyads. Physicians underestimated their patients' dyspnea 37.9% of the time and overestimated it 25.8% of the time; nurses underestimated it 43.5% of the time and overestimated it in 12.4% of the study patients (Table 2). In 28.2% of the time, physicians were discordant more than 4 points of the patient assessment. Bland‐Altman plots show that there is greater variation in differences of dyspnea assessments with increase in shortness of breath scores (Figure 2). Nurses underestimated more when the dyspnea score was on the lower end. Physicians also tended to estimate either lower or higher when compared to patients when the dyspnea scores were <2 (Figure 2A,B).
| Underestimation | Concordance | Overestimation | |||||||
|---|---|---|---|---|---|---|---|---|---|
| 3 | 2 | %* | 0 | 1 | % | 2 | 3 | % | |
| |||||||||
| Patient‐nurse dyads | 110 | 48 | 43.5 | 82 | 78 | 44.1 | 17 | 28 | 12.4 |
| Patient‐physician dyads | 33 | 14 | 37.9 | 21 | 24 | 36.3 | 12 | 20 | 25.8 |
The weighted kappa coefficient for agreement was 0.11 (95% confidence interval [CI]: 0.01 to 0.21) for patient‐physician assessment, 0.18 (95% CI: 0.12 to 0.24) for patient‐nurse, and 0.09 (0.02 to 0.20) for physician‐nurse indicating poor agreement. In a sensitivity analysis in which we used a higher threshold for defining discordance (difference of more than 2 points), the kappa coefficient increased to 0.21 (95% CI: 0.06 to 0.36) for patient‐physician assessments, to 0.24 (95% CI: 0.15 to 0.33) for patient‐nurse, and to 0.24 (95% CI: 0.09 to 0.39) for nurse‐physician assessments.
Predictors of Discordance and Underestimation of Dyspnea Severity Assessment
Principal diagnosis was the only factor associated with the physicians' discordant assessment of patients' dyspnea. Patients with admission diagnoses other than HF, COPD, or pneumonia (eg, pulmonary embolism) were more likely to have an accurate assessment of their dyspnea by providers (Table 3). Similar results were obtained in the sensitivity analysis by using a higher cutoff for defining discordance and when assessing predictors for underestimation (results not shown).
| Modeling Probability of Discordance | ||
|---|---|---|
| Physician‐Patient Dyads, OR (95% CI), N = 124 | Nurse‐Patient Dyads, OR (95% CI), N = 363 | |
| ||
| Univariate Analysis | ||
| Body mass index | 1.00 (0.991.01) | 1.00 (0.991.00) |
| Comorbidity score | 1.01 (0.981.05) | 0.99 (0.961.01) |
| Respiratory rate at admission | 1.00 (0.991.02) | 0.99 (0.981.00) |
| Oxygen saturation at admission | 1.00 (1.001.00) | 1.00 (1.001.00) |
| Age (binary) | ||
| 65 years | Referent | Referent |
| >65 years | 1.21 (0.572.55) | 0.96 (0.571.64) |
| Gender | ||
| Female | Referent | Referent |
| Male | 1.10 (0.522.32) | 0.81 (0.481.37) |
| Race | ||
| White | Referent | Referent |
| Nonwhite | 1.02 (0.442.37) | 1.06 (0.581.95) |
| Obese (BMI >30) | 1.43 (0.663.11) | 0.76 (0.441.30) |
| Smoker | 1.36 (0.613.05) | 1.04 (0.591.85) |
| Admitting diagnosis | ||
| Heart failure | Referent | Referent |
| COPD/asthma | 0.68 (0.251.83) | 1.91 (0.983.73)* |
| Pneumonia | 0.38 (0.101.40) | 1.07 (0.462.45) |
| Other | 0.30 (0.110.82)* | 1.54 (0.763.11) |
| Depression | 1.21 (0.572.55) | 1.01 (0.541.86) |
| Multivariable analysis | ||
| Admitting diagnosis | ||
| Congestive heart failure | Referent | Referent |
| COPD | 0.68 (0.251.83) | 1.91 (0.983.73)* |
| Pneumonia | 0.38 (0.101.40) | 1.07 (0.462.45) |
| Other | 0.30 (0.110.82)* | 1.54 (0.763.11) |
In the multivariable analysis that assessed patient‐nurse dyads, the diagnosis of COPD was associated with a marginally significant likelihood of discordance (OR: 1.91; 95% CI: 0.98 to 3.73) (Table 3). Similarly, multivariable analysis identified principal diagnosis to be the only predictor of underestimation, and COPD diagnosis was associated with increased odds of dyspnea underestimation by nurses. When we used a higher cutoff to define discordance, the principal diagnosis of COPD (OR: 3.43, 95% CI: 1.76 to 6.69) was associated with an increased risk of discordance, and smoking (OR: 0.54, 95% CI: 0.29 to 0.99) was associated with a decreased risk of discordance. Overall, 45 patients (32.6%) were discharged on oxygen. The odds of discrepancy (under‐ or overestimation) in dyspnea scores between patient and nurse were 1.7 times higher compared to patients who were not discharged on oxygen, but this association did not reach statistical significance; the odds of discrepancy between patient and physician were 3.88 (95% CI: 1.07 to 14.13).
Documentation of Dyspnea
We found that dyspnea was mentioned in the admission notes in 96% of the charts reviewed; physicians used a qualitative rating (mild, moderate, or severe) to indicate the severity of dyspnea in only 16% of cases, and in 53% a descriptor was added (eg, dyspnea with climbing stairs, gradually increased in the prior week). Nurses were more likely than physicians to use qualitative ratings of dyspnea (26% of cases), and they used a more uniform description of the patient's dyspnea (eg, at rest, at rest and on exertion, or on exertion) than physicians. At discharge, 83% of physicians noted in their discharge summary that dyspnea improved compared with admission but did not refer to the patient's baseline level of dyspnea.
DISCUSSION
In this prospective study of 138 patients hospitalized with cardiopulmonary disease, we found that the agreement between patient's experience of dyspnea and providers' assessment was poor, and the discordance was higher for physicians than for nurses. In more than half of the cases, differences between patient and healthcare providers' assessment of dyspnea were present. One‐third of the time, both physicians and nurses underestimated patients' reported levels of dyspnea. Admitting diagnosis was the only patient factor predicting lack of agreement, and patients with COPD were more likely to have their dyspnea underestimated by nurses. Healthcare providers predominantly documented the presence or absence of dyspnea and rarely used a more nuanced scale.
Discrepancies between patient and provider assessments for pain, depression, and overall health have been reported.[8, 18, 19, 20, 21] One explanation is that patients and healthcare providers measure different factors despite using the same terminology. Furthermore, patient's assessment may be confounded by other symptoms such as anxiety, fatigue, or pain. Physicians and nurses may underevaluate and underestimate the level of breathlessness; however, from the physician perspective, dyspnea is only 1 data point, and providers rely on other measures, such as oxygen saturation, heart rate, respiratory rate, evidence of increasing breathing effort, and arterial blood gas to drive decision making. In a recent study that evaluated the attitudes and beliefs of hospitalists regarding the assessment and management of dyspnea, we found that most hospitalists indicated that awareness of dyspnea severity influences their decision for treatment, diagnostic testing, and timing of the discharge. Moreover, whereas less than half of the respondents reported experience with standardized assessment of dyspnea severity, most stated that such data would be very useful in their practice.[22]
What is the clinical significance of having discordance between patients self‐assessment and providers impression of the patient's severity of dyspnea? First, inaccurate assessment of dyspnea by providers can lead to inadequate treatment and workup. For example, a physician who underestimates the severity of dyspnea may fail to recognize when a complication of the underlying disease develops or may underutilize symptomatic methods for relief of dyspnea. In contrast, a physician who overestimates dyspnea may continue with aggressive treatment when this is not necessary. Second, lack of awareness of dyspnea severity experienced by the patient may result in premature discharge and patient's frustration with the provider, as was shown in several studies evaluating physician‐patient agreement for pain perception.[21, 23] We found that discrepancy between patients and healthcare providers was more pronounced for patients with COPD. In another study using the same patient cohort, we reported that compared to patients with congestive heart failure, those with COPD had more residual dyspnea at discharge; 1 in 4 patients was discharged with a dyspnea score of 5 of greater, and almost half reported symptoms above their baseline.[24] The results from the current study may explain in part why patients with COPD are discharged with higher levels of dyspnea and should alert healthcare providers on the importance of patient‐reported breathlessness. Third, the high level of discordance between healthcare providers and patients may explain the undertreatment of dyspnea in patients with advanced disease. This is supported by our findings that the discordance between patients and physicians was higher if the patient was discharged on oxygen.
One key role of the provider during a clinical encounter is to elicit the patient's symptoms and achieve a shared understanding of what the patient is experiencing. From the patient's perspective, their self‐assessment of dyspnea is more important that the physician's assessment. Fortunately, there is a growing recognition and emphasis on using outcomes that matter to patients, such as dyspnea, to inform judgment about patient care and for clinical research. Numerical measures for assessment of dyspnea exist, are easy to use, and are sensitive to change in patients' dyspnea.[6, 25, 26, 27] Still, it is not standard practice for healthcare providers to ask patients to provide a rating of their dyspnea. When we examined the documentation of dyspnea in the medical record, we found that the description was vague, and providers did not use a standardized validated assessment. Although the dyspnea score decreased during hospitalization, the respiratory rate did not significantly change, indicating that this objective measure may not be reliable in patient assessment. The providers' knowledge of the intensity of the symptom expressed by patients will enable them to track improvement in symptoms over time or in response to therapy. In addition, in this era of multiple handoffs within a hospitalization or from primary care to the hospital, a more uniform assessment could allow providers to follow the severity and time course of dyspnea. The low level of agreement we found between patients and the providers lends support to recommendations regarding a structured dyspnea assessment into routine hospital practice.
Study Strengths and Limitations
This study has several strengths. This is 1 of the very few studies to report on the level of agreement between patients' and providers' assessments of dyspnea. We used a validated, simple dyspnea scale that provides consistency in rating.[28, 29] We enrolled patients with a broad set of diagnoses and complaints, which increases the generalizability of our results, and we surveyed both physicians and nurses. Last, our findings were robust across different cutoff points utilized to characterize discordance and across 3 frequent diagnoses.
The study has several limitations. First, we included only English‐speaking patients, and the results cannot be generalized to patients from other cultures who do not speak English. Second, this is a single‐center study, and practices may be different in other centers; for example, some hospitals may have already implemented a dyspnea assessment tool. Third, we did not collect information on the physician and nurse characteristics such as years in practice. However, a recent study that describes the agreement of breathlessness assessment between nurses, physicians, and mechanically ventilated patients found that underestimation of breathlessness by providers was not associated with professional competencies, previous patient care, or years of working in an intensive care unit.[9] In addition, a systematic review found that length of professional experience is often unrelated to performance measures and outcomes.[30] Finally, although we asked for physicians and nurses assessment close to their visit to the patient, assessment was done from memory, not at the bedside observing the patient.
CONCLUSION
We found that the extent of agreement between a structured patient self‐assessment of dyspnea and healthcare providers' assessment was low. Future studies should prospectively test whether routine assessment of dyspnea results in better acute and long‐term patient outcomes.
Acknowledgements
The authors acknowledge Ms. Anu Joshi for her help with formatting the manuscript and assisting with table preparations. The authors also acknowledge Ms. Katherine Dempsey, Jahnavi Sagi, Sashi Ariyaratne, and Mr. Pradeep Kumbaham for their help with collecting the data.
Disclosures: M.S.S. is the guarantor for this article and had full access to all of the data in the study, and takes responsibility for the integrity and accuracy of the data analysis. M.S.S., P.K.L., E.N., and M.B.R. conceived of the study. M.S.S. and B.M. acquired the data. M.S.S., A.P., P.S.P., R.J.G., and P.K.L. analyzed and interpreted the data. M.S.S. drafted the manuscript. All authors critically reviewed the manuscript for intellectual content. M.S.S. is supported by grant 1K01HL114631‐01A1 from the National Heart, Lung, and Blood Institute of the National Institutes of Health and by the National Center for Research Resources and the National Center for Advancing Translational Sciences, National Institutes of Health, through grant UL1RR025752. The authors report no conflicts of interest.
- , , , et al. An official American Thoracic Society statement: update on the mechanisms, assessment, and management of dyspnea. Am J Respir Crit Care Med. 2012;185(4):435–452.
- , , . National Hospital Ambulatory Medical Care Survey: 2007 emergency department summary. Natl Health Stat Report. 2010;(26):1–31.
- , , , et al. The body‐mass index, airflow obstruction, dyspnea, and exercise capacity index in chronic obstructive pulmonary disease. N Engl J Med. 2004;350(10):1005–1012.
- , , , . Dyspnea is a better predictor of 5‐year survival than airway obstruction in patients with COPD. Chest. 2002;121(5):1434–1440.
- , , . A multidimensional grading system (BODE index) as predictor of hospitalization for COPD. Chest. 2005;128(6):3810–3816.
- , , , et al. American College of Chest Physicians consensus statement on the management of dyspnea in patients with advanced lung or heart disease. Chest. 2010;137(3):674–691.
- , , , et al. Managing dyspnea in patients with advanced chronic obstructive pulmonary disease: a Canadian Thoracic Society clinical practice guideline. Can Respir J. 2011;18(2):69–78.
- , , . Physician vs patient assessment of dyspnea during acute decompensated heart failure. Congest Heart Fail. 2010;16(2):60–64.
- , , , , , . Underestimation of Patient Breathlessness by Nurses and Physicians during a Spontaneous Breathing Trial. Am J Respir Crit Care Med. 2015;192(12):1440–1448.
- , , , , , . The influence of patient‐practitioner agreement on outcome of care. Am J Public Health. 1981;71(2):127–131.
- , , , , , . Listening to parents: The role of symptom perception in pediatric palliative home care. Palliat Support Care. 2016;14(1):13–19.
- , . Validity of the numeric rating scale as a measure of dyspnea. Am J Crit Care. 1998;7(3):200–204.
- , , , , , . Dyspnea scales in the assessment of illiterate patients with chronic obstructive pulmonary disease. Am J Med Sci. 2000;320(4):240–243.
- , , , , . Measuring the dyspnea of decompensated heart failure with a visual analog scale: how much improvement is meaningful? Congest Heart Fail. 2004;10(4):188–191.
- , , , , , . Clinically meaningful changes in quantitative measures of asthma severity. Acad Emerg Med. 2000;7(4):327–334.
- , , , , . A combined comorbidity score predicted mortality in elderly patients better than existing scores. J Clin Epidemiol. 2011;64(7):749–759.
- . BlandAltmanLeh: plots (slightly extended) Bland‐Altman plots. Available at: https://cran.r‐project.org/web/packages/BlandAltmanLeh/index.html. Published December 23, 2015. Accessed March 10, 2016.
- , , , , . Correlation of patient and caregiver ratings of cancer pain. J Pain Symptom Manage. 1991;6(2):53–57.
- , , , et al. Depression symptomatology and diagnosis: discordance between patients and physicians in primary care settings. BMC Fam Pract. 2008;9:1.
- , , , , , . Patient‐physician discordance in assessments of global disease severity in rheumatoid arthritis. Arthritis Care Res (Hoboken) 2010;62(6):857–864.
- , , , et al. The influence of discordance in pain assessment on the functional status of patients with chronic nonmalignant pain. Am J Med Sci. 2006;332(1):18–23.
- , , , et al. Hospitalist attitudes toward the assessment and management of dyspnea in patients with acute cardiopulmonary diseases. J Hosp Med. 2015;10(11):724–730.
- , , , , . Brief report: patient‐physician agreement as a predictor of outcomes in patients with back pain. J Gen Intern Med. 2005;20(10):935–937.
- , , , , , . The trajectory of dyspnea in hospitalized patients [published online November 24, 2015]. J Pain Symptom Manage. doi: 10.1016/j.jpainsymman.2015.11.005.
- , , , , . Measurement of breathlessness in advanced disease: a systematic review. Respir Med. 2007;101(3):399–410.
- . Review of dyspnoea quantification in the emergency department: is a rating scale for breathlessness suitable for use as an admission prediction tool? Emerg Med Australas. 2007;19(5):394–404.
- , , , . Validation of a verbal dyspnoea rating scale in the emergency department. Emerg Med Australas. 2008;20(6):475–481.
- , , . Measurement of dyspnea: word labeled visual analog scale vs. verbal ordinal scale. Respir Physiol Neurobiol. 2003;134(2):77–83.
- , , , , , . Verbal numerical scales are as reliable and sensitive as visual analog scales for rating dyspnea in young and older subjects. Respir Physiol Neurobiol. 2007;157(2–3):360–365.
- , , . Systematic review: the relationship between clinical experience and quality of health care. Ann Intern Med. 2005;142(4):260–273.
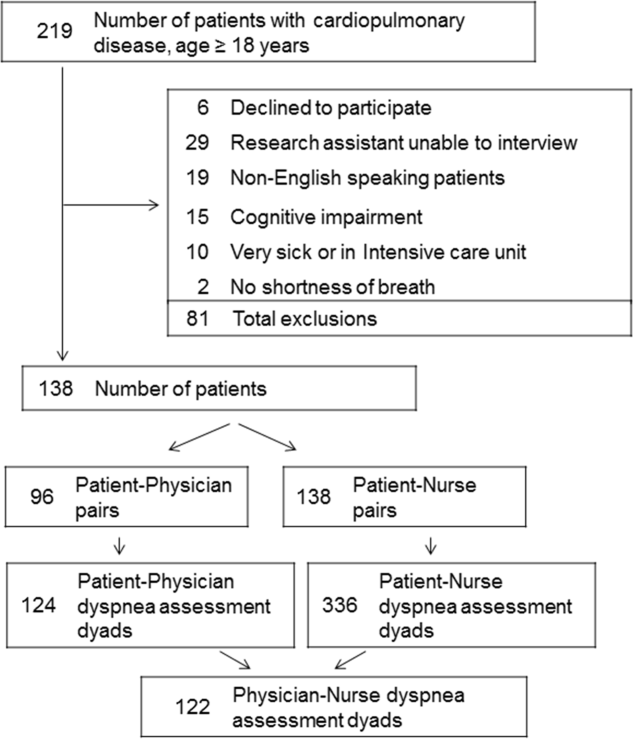
PICC Use in Adults With Pneumonia
Pneumonia is the most common cause of unplanned hospitalization in the United States.[1] Despite its clinical toll, the management of this disease has evolved markedly. Expanding vaccination programs, efforts to improve timeliness of antibiotic therapy, and improved processes of care are but a few developments that have improved outcomes for patients afflicted with this illness.[2, 3]
Use of peripherally inserted central catheters (PICCs) is an example of a modern development in the management of patients with pneumonia.[4, 5, 6, 7] PICCs provide many of the benefits associated with central venous catheters (CVCs) including reliable venous access for delivery of antibiotics, phlebotomy, and invasive hemodynamic monitoring. However, as they are placed in veins of the upper extremity, PICCs bypass insertion risks (eg, injury to the carotid vessels or pneumothorax) associated with placement of traditional CVCs.[8] Because they offer durable venous access, PICCs also facilitate care transitions while continuing intravenous antimicrobial therapy in patients with pneumonia.
However, accumulating evidence also suggests that PICCs are associated with important complications, including central lineassociated bloodstream infectionand venous thromboembolism.[9, 10] Furthermore, knowledge gaps in clinicians regarding indications for appropriate use and management of complications associated with PICCs have been recognized.[10, 11] These elements are problematic because reports of unjustified and inappropriate PICC use are growing in the literature.[12, 13] Such concerns have prompted a number of policy calls to improve PICC use, including Choosing Wisely recommendations by various professional societies.[14, 15]
As little is known about the prevalence or patterns of PICC use in adults hospitalized with pneumonia, we conducted a retrospective cohort study using data from a large network of US hospitals.
METHODS
Setting and Participants
We included patients from hospitals that participated in Premier's inpatient dataset, a large, fee‐supported, multipayer administrative database that has been used extensively in health services research to measure quality of care and comparative effectiveness of interventions.[16] Participating hospitals represent all regions of the United States and include teaching and nonteaching facilities in rural and urban locations. In addition to variables found in the uniform billing form, the Premier inpatient database also includes a date‐stamped list of charges for procedures conducted during hospitalization such as PICC placement. As PICC‐specific data are not available in most nationally representative datasets, Premier offers unique insights into utilization, timing, and factors associated with use of PICCs in hospitalized settings.
We included adult patients aged 18 years who were (1) admitted with a principal diagnosis of pneumonia present on admission, or secondary diagnosis of pneumonia if paired with a principal diagnosis of sepsis, respiratory failure, or influenza; (2) received at least 1 day of antibiotics between July 1, 2007 and November 30, 2011, and (3) underwent chest x‐ray or computed tomography (CT) at the time of admission. International Classification of Disease, 9th Revision, Clinical Modification (ICD‐9‐CM) codes were used for patient selection. Patients who were not admitted (eg, observation cases), had cystic fibrosis, or marked as pneumonia not present on admission were excluded. For patients who had more than 1 hospitalization during the study period, a single admission was randomly selected for inclusion.
Patient, Physician, and Hospital Data
For all patients, age, gender, marital status, insurance, race, and ethnicity were captured. Using software provided by the Healthcare Costs and Utilization Project, we categorized information on 29 comorbid conditions and computed a combined comorbidity score as described by Gagne et al.[17] Patients were considered to have healthcare‐associated pneumonia (HCAP) if they were: (1) admitted from a skilled nursing or a long‐term care facility, (2) hospitalized in the previous 90 days, (3) on dialysis, or (4) receiving immunosuppressing medications (eg, chemotherapy or steroids equivalent to at least 20 mg of prednisone per day) at the time of admission. Information on specialty of the admitting physician and hospital characteristics (eg, size, location, teaching status) were sourced through Premier data.
Receipt of PICCs and Related Therapies
Among eligible adult patients hospitalized with pneumonia, we identified patients who received a PICC at any time during hospitalization via PICC‐specific billing codes. Non‐PICC devices (eg, midlines, Hickman catheters) were not included. For all insertions, we assessed day of PICC placement relative to admission date. Data on type of PICC (eg, power‐injection capable, antibiotic coating) or PICC characteristics (size, number of lumens) were not available. We used billing codes to assess use of invasive or noninvasive ventilation, vasopressors, and administration of pneumonia‐specific antibiotics (eg, ‐lactams, macrolides, fluoroquinolones). Early exposure was defined when a billing code appeared within 2 days of hospital admission.
Outcomes of Interest
The primary outcome of interest was receipt of a PICC. Additionally, we assessed factors associated with PICC placement and variation in risk‐standardized rates of PICC use between hospitals.
Statistical Analyses
Patient and hospital characteristics were summarized using frequencies for categorical variables and medians with interquartile ranges for continuous variables. We examined association of individual patient and hospital characteristics with use of PICCs using generalized estimating equations models with a logit link for categorical variables and identity link for continuous variables, accounting for patient clustering within hospitals.
| Characteristic | Total, No. (%) | No PICC, No. (%) | PICC, No. (%) | P Value* |
|---|---|---|---|---|
| ||||
| 545,250 (100) | 503,401 (92.3) | 41,849 (7.7) | ||
| Demographics | ||||
| Age, median (Q1Q3), y | 71 (5782) | 72 (5782) | 69 (5780) | <0.001 |
| Gender | <0.001 | |||
| Male | 256,448 (47.0) | 237,232 (47.1) | 19,216 (45.9) | |
| Female | 288,802 (53.0) | 266,169 (52.9) | 22,633 (54.1) | |
| Race/ethnicity | <0.001 | |||
| White | 377,255 (69.2) | 346,689 (68.9) | 30,566 (73.0) | |
| Black | 63,345 (11.6) | 58,407 (11.6) | 4,938 (11.8) | |
| Hispanic | 22,855 (4.2) | 21,716 (4.3) | 1,139 (2.7) | |
| Other | 81,795 (15.0) | 76,589 (15.2) | 5,206 (12.4) | |
| Admitting specialty | <0.001 | |||
| Internal medicine | 236,859 (43.4) | 218,689 (43.4) | 18,170 (43.4) | |
| Hospital medicine | 116,499 (21.4) | 107,671 (21.4) | 8,828 (21.1) | |
| Family practice | 80,388 (14.7) | 75,482 (15.0) | 4,906 (11.7) | |
| Critical care and pulmonary | 35,670 (6.5) | 30,529 (6.1) | 41,849 (12.3) | |
| Geriatrics | 4,812 (0.9) | 4,098 (0.8) | 714 (1.7) | |
| Other | 71,022 (13.0) | 66,932 (13.3) | 4,090 (9.8) | |
| Insurance | <0.001 | |||
| Medicare | 370,303 (67.9) | 341,379 (67.8) | 28,924 (69.1) | |
| Medicaid | 45,505 (8.3) | 41,100 (8.2) | 4,405 (10.5) | |
| Managed care | 69,984 (12.8) | 65,280 (13.0) | 4,704 (11.2) | |
| Commercialindemnity | 20,672 (3.8) | 19,251 (3.8) | 1,421 (3.4) | |
| Other | 38,786 (7.1) | 36,391 (7.2) | 2,395 (5.7) | |
| Comorbidities | ||||
| Gagne combined comorbidity score, median (Q1Q3) | 2 (15) | 2 (14) | 4 (26) | <0.001 |
| Hypertension | 332,347 (60.9) | 306,964 (61.0) | 25,383 (60.7) | 0.13 |
| Chronic pulmonary disease | 255,403 (46.8) | 234,619 (46.6) | 20,784 (49.7) | <0.001 |
| Diabetes | 171,247 (31.4) | 155,540 (30.9) | 15,707 (37.5) | <0.001 |
| Congestive heart failure | 146,492 (26.9) | 131,041 (26.0) | 15,451 (36.9) | <0.001 |
| Atrial fibrillation | 108,405 (19.9) | 97,124 (19.3) | 11,281 (27.0) | <0.001 |
| Renal failure | 104,404 (19.1) | 94,277 (18.7) | 10,127 (24.2) | <0.001 |
| Nicotine replacement therapy/tobacco use | 89,938 (16.5) | 83,247 (16.5) | 6,691 (16.0) | <0.001 |
| Obesity | 60,242 (11.0) | 53,268 (10.6) | 6,974 (16.7) | <0.001 |
| Coagulopathy | 41,717 (7.6) | 35,371 (7.0) | 6,346 (15.2) | <0.001 |
| Prior stroke (1 year) | 26,787 (4.9) | 24,046 (4.78) | 2,741 (6.55) | <0.001 |
| Metastatic cancer | 21,868 (4.0) | 20,244 (4.0) | 1,624 (3.9) | 0.16 |
| Solid tumor w/out metastasis | 21,083 (3.9) | 19,380 (3.8) | 1,703 (4.1) | 0.12 |
| Prior VTE (1 year) | 19,090 (3.5) | 16,906 (3.4) | 2,184 (5.2) | <0.001 |
| Chronic liver disease | 16,273 (3.0) | 14,207 (2.8) | 2,066 (4.9) | <0.001 |
| Prior bacteremia (1 year) | 4,106 (0.7) | 3,584 (0.7) | 522 (1.2) | <0.001 |
| Nephrotic syndrome | 671 (0.1) | 607 (0.1) | 64 (0.2) | 0.03 |
| Morbidity markers | ||||
| Type of pneumonia | <0.001 | |||
| CAP | 376,370 (69.1) | 352,900 (70.1) | 23,830 (56.9) | |
| HCAP | 168,520 (30.9) | 150,501 (29.9) | 18,019 (43.1) | |
| Sepsis present on admission | 114,578 (21.0) | 96,467 (19.2) | 18,111 (43.3) | <0.001 |
| Non‐invasive ventilation | 47,913(8.8) | 40,599 (8.1) | 7,314 (17.5) | <0.001 |
| Invasive mechanical ventilation | 56,179 (10.3) | 44,228 (8.8) | 11,951 (28.6) | <0.001 |
| ICU status | 97,703 (17.9) | 80,380 (16.0) | 17,323 (41.4) | <0.001 |
| Vasopressor use | 48,353 (8.9) | 38,030 (7.6) | 10,323 (24.7) | <0.001 |
| Antibiotic/medication use | ||||
| Anti‐MRSA agent (vancomycin) | 146,068 (26.8) | 123,327 (24.5) | 22,741 (54.3) | <0.001 |
| Third‐generation cephalosporin | 250,782 (46.0) | 235,556 (46.8) | 15,226 (36.4) | <0.001 |
| Anti‐Pseudomonal cephalosporin | 41,798 (7.7) | 36,982 (7.3) | 4,816 (11.5) | <0.001 |
| Anti‐Pseudomonal ‐lactam | 122,215 (22.4) | 105,741 (21.0) | 16,474 (39.4) | <0.001 |
| Fluroquinolone | 288,051 (52.8) | 267,131 (53.1) | 20,920 (50.0) | <0.001 |
| Macrolide | 223,737 (41.0) | 210,954 (41.9) | 12,783 (30.5) | <0.001 |
| Aminoglycoside | 15,415 (2.8) | 12,661 (2.5) | 2,754 (6.6) | <0.001 |
| Oral steroids | 44,486 (8.2) | 41,586 (8.3) | 2,900 (6.9) | <0.001 |
| Intravenous steroids | 146,308 (26.8) | 133,920 (26.6) | 12,388 (29.6) | <0.001 |
| VTE prophylaxis with LMWH | 190,735 (35.0) | 174,612 (34.7) | 16,123 (38.5) | 0.01 |
| Discharge disposition | ||||
| Home | 282,146 (51.7) | 272,604(54.1) | 9,542 (22.8) | <0.001 |
| Home with home health | 71,977 (13.2) | 65,289 (13.0) | 6,688 (16.0) | <0.001 |
| Skilled nursing facility | 111,541 (20.5) | 97,113 (19.3) | 14,428 (34.5) | <0.001 |
| Hospice | 20,428 (3.7) | 17,902 (3.6) | 2,526 (6.0) | <0.001 |
| Expired | 47,733 (8.7) | 40,768 (8.1) | 6,965 (16.6) | <0.001 |
| Other | 11,425 (2.1) | 9,725 (1.9) | 1,700 (4.1) | <0.001 |
We then developed a multivariable hierarchical generalized linear model (HGLM) for PICC placement with a random effect for hospital. In this model, we included patient demographics, comorbidities, sepsis on admission, type of pneumonia (eg, HCAP vs community‐associated pneumonia [CAP]), admitting physician specialty, and indicators for early receipt of specific treatments such as guideline‐recommended antibiotics, vasopressors, ventilation (invasive or noninvasive), and pneumatic compression devices for prophylaxis of deep vein thrombosis.
To understand and estimate between‐hospital variation in PICC use, we calculated risk‐standardized rates of PICC use (RSPICC) across hospitals using HGLM methods. These methods are also employed by the Centers for Medicare and Medicaid Services to calculate risk‐standardized measures for public reporting.[18] Because hospital rates of PICC use were highly skewed (21.2% [n = 105] of hospitals had no patients with PICCs), we restricted this model to the 343 hospitals that had at least 5 patients with a PICC to obtain stable estimates. For each hospital, we estimated a predicted rate of PICC use (pPICC) as the sum of predicted probabilities of PICC receipt from patient factors and the random intercept for hospital in which they were admitted. We then calculated an expected rate of PICC use (ePICC) per hospital as the sum of expected probabilities of PICC receipt from patient factors only. RSPICC for each hospital was then computed as the product of the overall unadjusted mean PICC rate (PICC) from all patients and the ratio of the predicted to expected PICC rate (uPICC*[pPICC/ePICC]).[19] Kruskal‐Wallis tests were used to evaluate the association between hospital characteristics with RSPICC rates. To evaluate the impact of the hospital in variation in PICC use, we assessed the change in likelihood ratio of a hierarchical model with hospital random effects compared to a logistic regression model with patient factors only. In addition, we estimated the intraclass correlation (ICC) to assess the proportion of variation in PICC use associated with the hospital, and the median odds ratio (MOR) from the hierarchical model. The MOR is the median of a set of odds ratios comparing 2 patients with the same set of characteristics treated at 2 randomly selected hospitals.[20, 21, 22] All analyses were performed using the Statistical Analysis System version 9.3 (SAS Institute, Inc., Cary, NC) and Stata 13 (StataCorp Inc., College Station, TX).
Ethical and Regulatory Oversight
Permission to conduct this study was obtained from the institutional review board at Baystate Medical Center, Springfield, Massachusetts. The study did not qualify as human subjects research and made use of fully deidentified data.
RESULTS
Between July 2007 and November 2011, 634,285 admissions representing 545,250 unique patients from 495 hospitals met eligibility criteria and were included in the study (Figure 1). Included patients had a median age of 71 years (interquartile range [IQR]: 5782), and 53.0% were female. Most patients were Caucasian (69.2%), unmarried (51.6%), and insured by Medicare (67.9%). Patients were admitted to the hospital by internal medicine providers (43.4%), hospitalists (21.4%), and family practice providers (14.7%); notably, critical care and pulmonary medicine providers admitted 6.5% of patients. The median Gagne comorbidity score was 2 (IQR: 15). Hypertension, chronic obstructive pulmonary disease, diabetes, and congestive heart failure were among the most common comorbidities observed (Table 1).

Among eligible patients, 41,849 (7.7%) received a PICC during hospitalization. Approximately a quarter of all patients who received PICCs did so by hospital day 2; 90% underwent insertion by hospital day 11 (mean = 5.4 days, median = 4 days). Patients who received PICCs were younger (median IQR: 69 years, 5780 years) but otherwise demographically similar to those that did not receive PICCs (median IQR: 72 years, 5782 years). Compared to other specialties, patients admitted by critical care/pulmonary providers were twice as likely to receive PICCs (12.3% vs 6.1%, P < .001). Patients who received PICCs had higher comorbidity scores than those who did not (median Gagne comorbidity score 4 vs 2, P < 0.001) and were more likely to be diagnosed with HCAP (43.1% vs 29.9%, P < 0.001) than CAP (56.9% vs 70.1%, P < 0.001).
PICC recipients were also more likely to receive intensive care unit (ICU) level of care (41.4% vs 16%, P < 0.001) and both noninvasive (17.5% vs 8.1%, P < 0.001) and invasive ventilation (28.6% vs 8.8%, P < 0.001) upon admission. Vasopressor use was also significantly more frequent in patients who received PICCs (24.7% vs 7.6%, P < 0.001) compared to those who did not receive these devices. Patients with PICCs were more often discharged to skilled nursing facilities (34.5% vs 19.3%) than those without PICCs.
Characteristics Associated With PICC Use Following Multivariable Modeling
Using HGLM with a random hospital effect, multiple patient characteristics were associated with PICC use (Table 2). Patients 65 years of age were less likely to receive a PICC compared to younger patients (odds ratio [OR]: 0.81, 95% confidence interval [CI]: 0.79‐0.84). Weight loss (OR: 2.03, 95% CI: 1.97‐2.10), sepsis on admission (OR: 1.80, 95% CI: 1.75‐1.85), and ICU status on hospital day 1 or 2 (OR: 1.70, 95% CI: 1.64‐1.75) represented 3 factors most strongly associated with PICC use.
| Patient Characteristic | Odds Ratio | 95% Confidence Intervals |
|---|---|---|
| ||
| Age group (>66 vs 65 years) | 0.82 | 0.790.84 |
| Race/ethnicity | ||
| Other | 1.02 | 0.971.06 |
| Black | 0.99 | 0.951.03 |
| Hispanic | 0.82 | 0.760.88 |
| White | Referent | |
| Marital status | ||
| Other/missing | 1.07 | 1.011.14 |
| Single | 1.02 | 1.001.05 |
| Married | Referent | |
| Insurance payor | ||
| Other | 0.85 | 0.800.89 |
| Medicaid | 1.13 | 1.081.18 |
| Managed care | 0.95 | 0.910.99 |
| Commercialindemnity | 0.93 | 0.871.00 |
| Medicare | Referent | |
| Admitting physician specialty | ||
| Pulmonary/critical care medicine | 1.18 | 1.131.24 |
| Family practice | 1.01 | 0.971.05 |
| Geriatric medicine (FP and IM) | 1.85 | 1.662.05 |
| Hospitalist | 0.94 | 0.910.98 |
| Other specialties | 1.02 | 0.971.06 |
| Internal medicine | Referent | |
| Comorbidities | ||
| Congestive heart failure | 1.27 | 1.241.31 |
| Valvular disease | 1.11 | 1.071.15 |
| Pulmonary circulation disorders | 1.37 | 1.321.42 |
| Peripheral vascular disease | 1.09 | 1.051.13 |
| Hypertension | 0.94 | 0.920.97 |
| Paralysis | 1.59 | 1.511.67 |
| Other neurological disorders | 1.20 | 1.161.23 |
| Chronic lung disease | 1.10 | 1.071.12 |
| Diabetes | 1.13 | 1.101.16 |
| Hypothyroidism | 1.03 | 1.001.06 |
| Liver disease | 1.16 | 1.101.23 |
| Ulcer | 1.86 | 1.153.02 |
| Lymphoma | 0.88 | 0.810.96 |
| Metastatic cancer | 0.75 | 0.710.80 |
| Solid tumor without metastasis | 0.93 | 0.880.98 |
| Arthritis | 1.22 | 1.161.28 |
| Obesity | 1.47 | 1.421.52 |
| Weight loss | 2.03 | 1.972.10 |
| Blood loss | 1.69 | 1.551.85 |
| Deficiency anemias | 1.40 | 1.371.44 |
| Alcohol abuse | 1.19 | 1.131.26 |
| Drug abuse | 1.31 | 1.231.39 |
| Psychoses | 1.16 | 1.111.21 |
| Depression | 1.10 | 1.061.13 |
| Renal failure | 0.96 | 0.930.98 |
| Type of pneumonia | ||
| HCAP | 1.03 | 1.011.06 |
| CAP | Referent | |
| Sepsis (POA) | 1.80 | 1.751.85 |
| Antibiotic exposure | ||
| Anti‐MRSA agent | 1.72 | 1.671.76 |
| Anti‐Pseudomonal carbapenem | 1.37 | 1.311.44 |
| Non‐Pseudomonal carbapenem | 1.48 | 1.331.66 |
| Third‐generation cephalosporin | 1.04 | 1.011.07 |
| Anti‐Pseudomonal cephalosporin | 1.25 | 1.201.30 |
| Anti‐Pseudomonal ‐lactam | 1.27 | 1.231.31 |
| Aztreonam | 1.31 | 1.231.40 |
| Non‐Pseudomonal ‐lactam | 1.36 | 1.231.50 |
| ‐lactam | 1.55 | 1.261.90 |
| Respiratory quinolone | 0.90 | 0.870.92 |
| Macrolide | 0.85 | 0.820.88 |
| Doxycycline | 0.94 | 0.871.01 |
| Aminoglycoside | 1.21 | 1.141.27 |
| Vasopressors | 1.06 | 1.031.10 |
| Noninvasive ventilation | 1.29 | 1.251.34 |
| Invasive ventilation | 1.66 | 1.611.72 |
| Intensive care unit on admission | 1.70 | 1.641.75 |
| Atrial fibrillation | 1.26 | 1.221.29 |
| Upper extremity chronic DVT | 1.61 | 1.132.28 |
| Nicotine replacement therapy/tobacco abuse | 0.91 | 0.880.94 |
| Aspirin | 0.94 | 0.920.97 |
| Warfarin | 0.90 | 0.860.94 |
| LMWH, prophylactic dose | 1.10 | 1.081.13 |
| LMWH, treatment dose | 1.22 | 1.161.29 |
| Intravenous steroids | 1.05 | 1.021.08 |
| Bacteremia (prior year) | 1.14 | 1.021.27 |
| VTE (prior year) | 1.11 | 1.061.18 |
| Pneumatic compression device | 1.25 | 1.081.45 |
| Invasive ventilation (prior year) | 1.17 | 1.111.24 |
| Irritable bowel disease | 1.19 | 1.051.36 |
Therapy with potent parenteral antimicrobials including antimethicillin‐resistant Staphylococcus aureus agents (OR: 1.72, 95% CI: 1.67‐1.76), antipseudomonal ‐lactamases (OR: 1.27, 95% CI: 1.23‐1.31), and carbapenems (OR: 1.37, 95% CI: 1.31‐1.44) were significantly associated with PICC use. Conversely, use of macrolides (OR: 0.85, 95% CI: 0.82‐0.88) or respiratory fluoroquinolones (OR: 0.90, 95% CI: 0.87‐0.92) were associated with lower likelihood of PICC use. After adjusting for antimicrobial therapy, HCAP was only slightly more likely to result in PICC use than CAP (OR: 1.03, 95% CI: 1.01‐1.06). Compared to internal medicine providers, admission by geriatricians and critical care/pulmonary specialists was associated with greater likelihood of PICC use (OR: 1.85, 95% CI: 1.66‐2.05 and OR: 1.18, 95% CI: =1.13‐1.24, respectively). Admission by hospitalists was associated with a modestly lower likelihood of PICC placement (OR: 0.94, 95% CI: 0.91‐0.98).
Hospital Level Variation in PICC Use
To ensure stable estimates of hospital PICC use, we excluded 152 facilities (31%): 10% had no patients with PICCs and 21% had <5 patients who received a PICC. Therefore, RSPICC was estimated for 343 of 495 facilities (69%) (Figure 2). In these facilities, RSPICC varied from 0.3% to 41.7%. Hospital RSPICC was significantly associated with hospital location (median 11.9% vs 7.8% for urban vs rural hospitals respectively, P = 0.05). RSPICCs were also greater among hospitals in Southern (11.3%), Western (12.7%), and Midwest (12.0%) regions of the nation compared to those in the Northeast (8.4%) (P = 0.02) (Table 3).
| Hospital Characteristic (No.) | Median (IQR), % | P Value |
|---|---|---|
| ||
| Bed size | 0.12 | |
| 200 beds (106) | 9.1 (4.816.3) | |
| 201 beds (237) | 11.6 (5.817.6) | |
| Rural/urban | 0.05 | |
| Urban (275) | 11.9 (5.517.4) | |
| Rural (68) | 7.8 (5.014.0) | |
| Region | 0.02 | |
| Northeast (50) | 8.4 (3.913.0) | |
| Midwest (69) | 12.0 (5.817.4) | |
| West (57) | 12.7 (7.617.0) | |
| South (167) | 11.3 (4.817.8) | |
| Teaching status | 0.77 | |
| Nonteaching (246) | 10.9 (5.017.4) | |
| Teaching (97) | 12.0 (5.816.9) | |
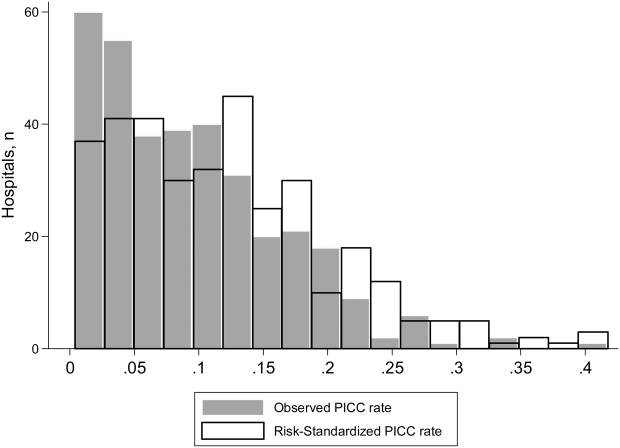
A likelihood ratio test comparing the hierarchical model to a logistic model with patient factors only was highly significant (P < 0.001), indicating that the hospital where the patient was treated had a major impact on receipt of PICC after accounting for patient factors. The MOR was 2.71, which is a larger effect than we found for any of the individual patient characteristics. The proportion of variance explained by hospitals was 25% (95% CI: 22%‐28%), as measured by the ICC.
DISCUSSION
In this study of 545,250 adults hospitalized with pneumonia, we found that approximately 8% of patients received a PICC. Patients who received PICCs had more comorbidities, were more frequently diagnosed with HCAP, and were more often admitted to the ICU, where they experienced greater rates of mechanical ventilation, noninvasive ventilation, and vasopressor use compared to those who did not receive a PICC. Additionally, risk‐adjusted rates of PICC use varied as much as 10‐fold across institutions. In fact, almost 70% of the total variation in rates of PICC use remained unexplained by hospital or patient characteristics. Although use of PICCs is often clinically nuanced in ways that are difficult to capture in large datasets (eg, difficult venous access or inability to tolerate oral medications), the substantial variation of PICC use observed suggests that physician and institutional practice styles are the major determinants of PICC placement during a hospitalization for pneumonia. Because PICCs are associated with serious complications, and evidence regarding discretionary use is accumulating, a research agenda examining reasons for such use and related outcomes appears necessary.
The placement of PICCs has grown substantially in hospitalized patients all over the world.[23, 24] Although originally developed for total parenteral nutrition in surgical patients,[25] contemporary reports of PICC use in critical illness,[26] diseases such as cystic fibrosis,[27] and even pregnancy[28] are now common. Although PICCs are clinically invaluable in many of these conditions, growing use of these devices has led to the realization that benefits may be offset by complications.[9, 10, 29, 30] Additionally, recent data suggest that not all PICCs may be used for appropriate reasons. For instance, in a decade‐long study at a tertiary care center, changes in patterns of PICC use including shortened dwell times, multiple insertions in a single patient, and unclear indications for use were reported.[11] In another study at an academic medical center, a substantial proportion of PICCs were found to be idle or unjustified.[12] It comes as little surprise, then, that a recent multicenter study found that 1 out of every 5 clinicians did not even know that their patient had a PICC.[29] Although calls to improve PICC use in the hospital setting have emerged, strategies to do so are limited by data that emanate from single‐center reports or retrospective designs. No other studies reporting use of PICCs across US hospitals for any clinical condition currently exist.[31]
We found that patients with weight loss, those with greater combined comorbidity scores, and those who were critically ill or diagnosed with sepsis were more likely to receive PICCs than others. These observations suggest that PICC use may reflect underlying severity of illness, as advanced care such as ventilator support was often associated with PICC use. Additionally, discharge to a skilled nursing facility was frequently associated with PICC placement, a finding consistent with a recent study evaluating the use of PICCs in these settings.[32] However, a substantial proportion of PICC use remained unexplained by available patient or hospital factors. Although our study was not specifically designed to examine this question, a possible reason may relate to unmeasured institutional factors that influence the propensity to use a PICC, recently termed as PICC culture.[33] For example, it is plausible that hospitals with nursing‐led PICC teams or interventional radiology (such as teaching hospitals) are more likely to use PICCs than those without such operators. This hypothesis may explain why urban, larger, and teaching hospitals exhibited higher rates of PICC use. Conversely, providers may have an affinity toward PICC use that is predicated not just by operator availability, but also local hospital norms. Understanding why some facilities use PICCs at higher rates than others and implications of such variation with respect to patient safety, cost, and outcomes is important. Study designs that use mixed‐methods approaches or seek to qualitatively understand reasons behind PICC use are likely to be valuable in this enquiry.
Our study has limitations. First, we used an administrative dataset and ICD‐9‐CM codes rather than clinical data from medical records to identify cases of pneumonia or comorbidities. Our estimates of PICC use across hospitals thus may not fully account for differences in severity of illness, and it is possible that patients needed a PICC for reasons that we could not observe. However, the substantial variation observed in rates of PICC use across hospitals is unlikely to be explained by differences in patient severity of illness, documentation, or coding practices. Second, as PICC removal codes were not available, we are unable to comment on how often hospitalized pneumonia patients were discharged with PICCs or received antimicrobial therapy beyond their inpatient stay. Third, although we observed that a number of patient and hospital factors were associated with PICC receipt, our study was not designed to determine the reasons underlying these patterns.
These limitations aside, our study has important strengths. To our knowledge, this is the first study to report utilization and outcomes associated with PICC use among those hospitalized with pneumonia across the United States. The inclusion of a large number of patients receiving care in diverse facilities lends a high degree of external validity to our findings. Second, we used advanced modeling to identify factors associated with PICC use in hospitalized patients with pneumonia, producing innovative and novel findings. Third, our study is the first to show the existence of substantial variation in rates of PICC use across US hospitals within the single disease state of pneumonia. Understanding the drivers of this variability is important as it may inform future studies, policies, and practices to improve PICC use in hospitalized patients.
In conclusion, we found that PICC use in patients hospitalized with pneumonia is common and highly variable. Future studies examining the contextual factors behind PICC use and their association with outcomes are needed to facilitate efforts to standardize PICC use across hospitals.
Disclosures
Dr. Chopra is supported by a career development award (1‐K08‐HS022835‐01) from the Agency of Healthcare Research and Quality. The authors report no conflicts of interest.
- , . Reasons for being admitted to the hospital through the emergency department, 2003. Healthcare Cost and Utilization Project Statistical Brief 2. Rockville, MD: Agency for Healthcare Research and Quality. Available at: www.hcup‐us.ahrq.gov/reports/statbriefs/sb2.pdf. Published February 2006. Accessed June 27, 2014.
- , , , et al. National patterns of risk‐standardized mortality and readmission after hospitalization for acute myocardial infarction, heart failure, and pneumonia: update on publicly reported outcomes measures based on the 2013 release. J Gen Intern Med. 2014;29(10):1333–1340.
- , , , et al. Quality of care for elderly patients hospitalized for pneumonia in the United States, 2006 to 2010. JAMA Intern Med. 2014;174(11):1806–1814.
- , . PICC lines: the latest home care challenge. RN. 1990;53(1):44–51.
- , , , . Peripherally inserted central catheters in an acute‐care hospital. Arch Intern Med. 1994;154(16):1833–1837.
- , . The peripherally inserted central catheter: a retrospective look at three years of insertions. J Intraven Nurs. 1993;16(2):92–103.
- , , , . Peripherally inserted central catheters in general medicine. Mayo Clin Proc. 1997;72(3):225–233.
- , , . Two‐year trends of peripherally inserted central catheter‐line complications at a tertiary‐care hospital: role of nursing expertise. Infect Control Hosp Epidemiol. 2001;22(6):377–379.
- , , , , , . PICC‐associated bloodstream infections: prevalence, patterns, and predictors. Am J Med. 2014;127(4):319–328.
- , , , , . The risk of bloodstream infection associated with peripherally inserted central catheters compared with central venous catheters in adults: a systematic review and meta‐analysis. Infect Control Hosp Epidemiol. 2013;34(9):908–918.
- , , , , , . Peripherally inserted central catheters: use at a tertiary care pediatric center. J Vasc Interv Radiol. 2013;24(9):1323–1331.
- , , , et al. Temporary central venous catheter utilization patterns in a large tertiary care center: tracking the “idle central venous catheter”. Infect Control Hosp Epidemiol. 2012;33(1):50–57.
- , , , , . Inappropriate intravascular device use: a prospective study. Journal Hosp Infect. 2011;78(2):128–132.
- , , , et al. Enhancing patient‐centered care: SGIM and choosing wisely. J Gen Intern Med. 2014;29(3):432–433.
- , , , et al. Critical and honest conversations: the evidence behind the “Choosing Wisely” campaign recommendations by the American Society of Nephrology. Clin J Am Soc Nephrol. 2012;7(10):1664–1672.
- , , , et al. Using highly detailed administrative data to predict pneumonia mortality. PLoS One. 2014;9(1):e87382.
- , , , , . A combined comorbidity score predicted mortality in elderly patients better than existing scores. J Clin Epidemiol. 2011;64(7):749–759.
- , , , , . Hospitals with the highest intensive care utilization provide lower quality pneumonia care to the elderly. Crit Care Med. 2015;43(6):1178–1186.
- , . Statistical and clinical aspects of hospital outcomes profiling. Stat Sci. 2007;22(2):206–226.
- , . Appropriate assessment of neighborhood effects on individual health: integrating random and fixed effects in multilevel logistic regression. Am J Epidemiol. 2005;161(1):81–88.
- , , , . Interpreting parameters in the logistic regression model with random effects. Biometrics. 2000;56(3):909–914.
- , , , . Hospital‐level associations with 30‐day patient mortality after cardiac surgery: a tutorial on the application and interpretation of marginal and multilevel logistic regression. BMC Med Res Methodol. 2012;12:28.
- , , , . Experiences of the first PICC team in the Czech Republic. Br J Nurs. 2015;24(suppl 2):S4–S10.
- , , , et al. Greece reports prototype intervention with first peripherally inserted central catheter: case report and literature review. J Vasc Nurs. 2012;30(3):88–93.
- Total intravenous nutrition with peripherally inserted silicone elastomer central venous catheters. Arch Surg. 1975;110(5):644–646.
- , . Focus on peripherally inserted central catheters in critically ill patients. World J Crit Care Med. 2014;3(4):80–94.
- , , , et al. Quality improvement initiative to reduce deep vein thrombosis associated with peripherally inserted central catheters in adults with cystic fibrosis. Ann Am Thorac Soc. 2014;11(9):1404–1410.
- , , , . Peripherally Inserted central catheter (PICC) complications during pregnancy. JPEN J Parenter Enteral Nutr. 2013;38(5):595–601.
- , , , et al. Do clinicians know which of their patients have central venous catheters?: a multicenter observational study. Ann Intern Med. 2014;161(8):562–567.
- , , , et al. Risk of venous thromboembolism associated with peripherally inserted central catheters: a systematic review and meta‐analysis. Lancet. 2013;382(9889):311–325.
- , , . The problem with peripherally inserted central catheters. JAMA. 2012;308(15):1527–1528.
- , , , et al. Peripherally inserted central catheter use in skilled nursing facilities: a pilot study. J Am Geriatr Soc. 2015;63(9):1894–1899.
- , , , , . Inpatient venous access practices: PICC culture and the kidney patient. J Vasc Access. 2015;16(3):206–210.
Pneumonia is the most common cause of unplanned hospitalization in the United States.[1] Despite its clinical toll, the management of this disease has evolved markedly. Expanding vaccination programs, efforts to improve timeliness of antibiotic therapy, and improved processes of care are but a few developments that have improved outcomes for patients afflicted with this illness.[2, 3]
Use of peripherally inserted central catheters (PICCs) is an example of a modern development in the management of patients with pneumonia.[4, 5, 6, 7] PICCs provide many of the benefits associated with central venous catheters (CVCs) including reliable venous access for delivery of antibiotics, phlebotomy, and invasive hemodynamic monitoring. However, as they are placed in veins of the upper extremity, PICCs bypass insertion risks (eg, injury to the carotid vessels or pneumothorax) associated with placement of traditional CVCs.[8] Because they offer durable venous access, PICCs also facilitate care transitions while continuing intravenous antimicrobial therapy in patients with pneumonia.
However, accumulating evidence also suggests that PICCs are associated with important complications, including central lineassociated bloodstream infectionand venous thromboembolism.[9, 10] Furthermore, knowledge gaps in clinicians regarding indications for appropriate use and management of complications associated with PICCs have been recognized.[10, 11] These elements are problematic because reports of unjustified and inappropriate PICC use are growing in the literature.[12, 13] Such concerns have prompted a number of policy calls to improve PICC use, including Choosing Wisely recommendations by various professional societies.[14, 15]
As little is known about the prevalence or patterns of PICC use in adults hospitalized with pneumonia, we conducted a retrospective cohort study using data from a large network of US hospitals.
METHODS
Setting and Participants
We included patients from hospitals that participated in Premier's inpatient dataset, a large, fee‐supported, multipayer administrative database that has been used extensively in health services research to measure quality of care and comparative effectiveness of interventions.[16] Participating hospitals represent all regions of the United States and include teaching and nonteaching facilities in rural and urban locations. In addition to variables found in the uniform billing form, the Premier inpatient database also includes a date‐stamped list of charges for procedures conducted during hospitalization such as PICC placement. As PICC‐specific data are not available in most nationally representative datasets, Premier offers unique insights into utilization, timing, and factors associated with use of PICCs in hospitalized settings.
We included adult patients aged 18 years who were (1) admitted with a principal diagnosis of pneumonia present on admission, or secondary diagnosis of pneumonia if paired with a principal diagnosis of sepsis, respiratory failure, or influenza; (2) received at least 1 day of antibiotics between July 1, 2007 and November 30, 2011, and (3) underwent chest x‐ray or computed tomography (CT) at the time of admission. International Classification of Disease, 9th Revision, Clinical Modification (ICD‐9‐CM) codes were used for patient selection. Patients who were not admitted (eg, observation cases), had cystic fibrosis, or marked as pneumonia not present on admission were excluded. For patients who had more than 1 hospitalization during the study period, a single admission was randomly selected for inclusion.
Patient, Physician, and Hospital Data
For all patients, age, gender, marital status, insurance, race, and ethnicity were captured. Using software provided by the Healthcare Costs and Utilization Project, we categorized information on 29 comorbid conditions and computed a combined comorbidity score as described by Gagne et al.[17] Patients were considered to have healthcare‐associated pneumonia (HCAP) if they were: (1) admitted from a skilled nursing or a long‐term care facility, (2) hospitalized in the previous 90 days, (3) on dialysis, or (4) receiving immunosuppressing medications (eg, chemotherapy or steroids equivalent to at least 20 mg of prednisone per day) at the time of admission. Information on specialty of the admitting physician and hospital characteristics (eg, size, location, teaching status) were sourced through Premier data.
Receipt of PICCs and Related Therapies
Among eligible adult patients hospitalized with pneumonia, we identified patients who received a PICC at any time during hospitalization via PICC‐specific billing codes. Non‐PICC devices (eg, midlines, Hickman catheters) were not included. For all insertions, we assessed day of PICC placement relative to admission date. Data on type of PICC (eg, power‐injection capable, antibiotic coating) or PICC characteristics (size, number of lumens) were not available. We used billing codes to assess use of invasive or noninvasive ventilation, vasopressors, and administration of pneumonia‐specific antibiotics (eg, ‐lactams, macrolides, fluoroquinolones). Early exposure was defined when a billing code appeared within 2 days of hospital admission.
Outcomes of Interest
The primary outcome of interest was receipt of a PICC. Additionally, we assessed factors associated with PICC placement and variation in risk‐standardized rates of PICC use between hospitals.
Statistical Analyses
Patient and hospital characteristics were summarized using frequencies for categorical variables and medians with interquartile ranges for continuous variables. We examined association of individual patient and hospital characteristics with use of PICCs using generalized estimating equations models with a logit link for categorical variables and identity link for continuous variables, accounting for patient clustering within hospitals.
| Characteristic | Total, No. (%) | No PICC, No. (%) | PICC, No. (%) | P Value* |
|---|---|---|---|---|
| ||||
| 545,250 (100) | 503,401 (92.3) | 41,849 (7.7) | ||
| Demographics | ||||
| Age, median (Q1Q3), y | 71 (5782) | 72 (5782) | 69 (5780) | <0.001 |
| Gender | <0.001 | |||
| Male | 256,448 (47.0) | 237,232 (47.1) | 19,216 (45.9) | |
| Female | 288,802 (53.0) | 266,169 (52.9) | 22,633 (54.1) | |
| Race/ethnicity | <0.001 | |||
| White | 377,255 (69.2) | 346,689 (68.9) | 30,566 (73.0) | |
| Black | 63,345 (11.6) | 58,407 (11.6) | 4,938 (11.8) | |
| Hispanic | 22,855 (4.2) | 21,716 (4.3) | 1,139 (2.7) | |
| Other | 81,795 (15.0) | 76,589 (15.2) | 5,206 (12.4) | |
| Admitting specialty | <0.001 | |||
| Internal medicine | 236,859 (43.4) | 218,689 (43.4) | 18,170 (43.4) | |
| Hospital medicine | 116,499 (21.4) | 107,671 (21.4) | 8,828 (21.1) | |
| Family practice | 80,388 (14.7) | 75,482 (15.0) | 4,906 (11.7) | |
| Critical care and pulmonary | 35,670 (6.5) | 30,529 (6.1) | 41,849 (12.3) | |
| Geriatrics | 4,812 (0.9) | 4,098 (0.8) | 714 (1.7) | |
| Other | 71,022 (13.0) | 66,932 (13.3) | 4,090 (9.8) | |
| Insurance | <0.001 | |||
| Medicare | 370,303 (67.9) | 341,379 (67.8) | 28,924 (69.1) | |
| Medicaid | 45,505 (8.3) | 41,100 (8.2) | 4,405 (10.5) | |
| Managed care | 69,984 (12.8) | 65,280 (13.0) | 4,704 (11.2) | |
| Commercialindemnity | 20,672 (3.8) | 19,251 (3.8) | 1,421 (3.4) | |
| Other | 38,786 (7.1) | 36,391 (7.2) | 2,395 (5.7) | |
| Comorbidities | ||||
| Gagne combined comorbidity score, median (Q1Q3) | 2 (15) | 2 (14) | 4 (26) | <0.001 |
| Hypertension | 332,347 (60.9) | 306,964 (61.0) | 25,383 (60.7) | 0.13 |
| Chronic pulmonary disease | 255,403 (46.8) | 234,619 (46.6) | 20,784 (49.7) | <0.001 |
| Diabetes | 171,247 (31.4) | 155,540 (30.9) | 15,707 (37.5) | <0.001 |
| Congestive heart failure | 146,492 (26.9) | 131,041 (26.0) | 15,451 (36.9) | <0.001 |
| Atrial fibrillation | 108,405 (19.9) | 97,124 (19.3) | 11,281 (27.0) | <0.001 |
| Renal failure | 104,404 (19.1) | 94,277 (18.7) | 10,127 (24.2) | <0.001 |
| Nicotine replacement therapy/tobacco use | 89,938 (16.5) | 83,247 (16.5) | 6,691 (16.0) | <0.001 |
| Obesity | 60,242 (11.0) | 53,268 (10.6) | 6,974 (16.7) | <0.001 |
| Coagulopathy | 41,717 (7.6) | 35,371 (7.0) | 6,346 (15.2) | <0.001 |
| Prior stroke (1 year) | 26,787 (4.9) | 24,046 (4.78) | 2,741 (6.55) | <0.001 |
| Metastatic cancer | 21,868 (4.0) | 20,244 (4.0) | 1,624 (3.9) | 0.16 |
| Solid tumor w/out metastasis | 21,083 (3.9) | 19,380 (3.8) | 1,703 (4.1) | 0.12 |
| Prior VTE (1 year) | 19,090 (3.5) | 16,906 (3.4) | 2,184 (5.2) | <0.001 |
| Chronic liver disease | 16,273 (3.0) | 14,207 (2.8) | 2,066 (4.9) | <0.001 |
| Prior bacteremia (1 year) | 4,106 (0.7) | 3,584 (0.7) | 522 (1.2) | <0.001 |
| Nephrotic syndrome | 671 (0.1) | 607 (0.1) | 64 (0.2) | 0.03 |
| Morbidity markers | ||||
| Type of pneumonia | <0.001 | |||
| CAP | 376,370 (69.1) | 352,900 (70.1) | 23,830 (56.9) | |
| HCAP | 168,520 (30.9) | 150,501 (29.9) | 18,019 (43.1) | |
| Sepsis present on admission | 114,578 (21.0) | 96,467 (19.2) | 18,111 (43.3) | <0.001 |
| Non‐invasive ventilation | 47,913(8.8) | 40,599 (8.1) | 7,314 (17.5) | <0.001 |
| Invasive mechanical ventilation | 56,179 (10.3) | 44,228 (8.8) | 11,951 (28.6) | <0.001 |
| ICU status | 97,703 (17.9) | 80,380 (16.0) | 17,323 (41.4) | <0.001 |
| Vasopressor use | 48,353 (8.9) | 38,030 (7.6) | 10,323 (24.7) | <0.001 |
| Antibiotic/medication use | ||||
| Anti‐MRSA agent (vancomycin) | 146,068 (26.8) | 123,327 (24.5) | 22,741 (54.3) | <0.001 |
| Third‐generation cephalosporin | 250,782 (46.0) | 235,556 (46.8) | 15,226 (36.4) | <0.001 |
| Anti‐Pseudomonal cephalosporin | 41,798 (7.7) | 36,982 (7.3) | 4,816 (11.5) | <0.001 |
| Anti‐Pseudomonal ‐lactam | 122,215 (22.4) | 105,741 (21.0) | 16,474 (39.4) | <0.001 |
| Fluroquinolone | 288,051 (52.8) | 267,131 (53.1) | 20,920 (50.0) | <0.001 |
| Macrolide | 223,737 (41.0) | 210,954 (41.9) | 12,783 (30.5) | <0.001 |
| Aminoglycoside | 15,415 (2.8) | 12,661 (2.5) | 2,754 (6.6) | <0.001 |
| Oral steroids | 44,486 (8.2) | 41,586 (8.3) | 2,900 (6.9) | <0.001 |
| Intravenous steroids | 146,308 (26.8) | 133,920 (26.6) | 12,388 (29.6) | <0.001 |
| VTE prophylaxis with LMWH | 190,735 (35.0) | 174,612 (34.7) | 16,123 (38.5) | 0.01 |
| Discharge disposition | ||||
| Home | 282,146 (51.7) | 272,604(54.1) | 9,542 (22.8) | <0.001 |
| Home with home health | 71,977 (13.2) | 65,289 (13.0) | 6,688 (16.0) | <0.001 |
| Skilled nursing facility | 111,541 (20.5) | 97,113 (19.3) | 14,428 (34.5) | <0.001 |
| Hospice | 20,428 (3.7) | 17,902 (3.6) | 2,526 (6.0) | <0.001 |
| Expired | 47,733 (8.7) | 40,768 (8.1) | 6,965 (16.6) | <0.001 |
| Other | 11,425 (2.1) | 9,725 (1.9) | 1,700 (4.1) | <0.001 |
We then developed a multivariable hierarchical generalized linear model (HGLM) for PICC placement with a random effect for hospital. In this model, we included patient demographics, comorbidities, sepsis on admission, type of pneumonia (eg, HCAP vs community‐associated pneumonia [CAP]), admitting physician specialty, and indicators for early receipt of specific treatments such as guideline‐recommended antibiotics, vasopressors, ventilation (invasive or noninvasive), and pneumatic compression devices for prophylaxis of deep vein thrombosis.
To understand and estimate between‐hospital variation in PICC use, we calculated risk‐standardized rates of PICC use (RSPICC) across hospitals using HGLM methods. These methods are also employed by the Centers for Medicare and Medicaid Services to calculate risk‐standardized measures for public reporting.[18] Because hospital rates of PICC use were highly skewed (21.2% [n = 105] of hospitals had no patients with PICCs), we restricted this model to the 343 hospitals that had at least 5 patients with a PICC to obtain stable estimates. For each hospital, we estimated a predicted rate of PICC use (pPICC) as the sum of predicted probabilities of PICC receipt from patient factors and the random intercept for hospital in which they were admitted. We then calculated an expected rate of PICC use (ePICC) per hospital as the sum of expected probabilities of PICC receipt from patient factors only. RSPICC for each hospital was then computed as the product of the overall unadjusted mean PICC rate (PICC) from all patients and the ratio of the predicted to expected PICC rate (uPICC*[pPICC/ePICC]).[19] Kruskal‐Wallis tests were used to evaluate the association between hospital characteristics with RSPICC rates. To evaluate the impact of the hospital in variation in PICC use, we assessed the change in likelihood ratio of a hierarchical model with hospital random effects compared to a logistic regression model with patient factors only. In addition, we estimated the intraclass correlation (ICC) to assess the proportion of variation in PICC use associated with the hospital, and the median odds ratio (MOR) from the hierarchical model. The MOR is the median of a set of odds ratios comparing 2 patients with the same set of characteristics treated at 2 randomly selected hospitals.[20, 21, 22] All analyses were performed using the Statistical Analysis System version 9.3 (SAS Institute, Inc., Cary, NC) and Stata 13 (StataCorp Inc., College Station, TX).
Ethical and Regulatory Oversight
Permission to conduct this study was obtained from the institutional review board at Baystate Medical Center, Springfield, Massachusetts. The study did not qualify as human subjects research and made use of fully deidentified data.
RESULTS
Between July 2007 and November 2011, 634,285 admissions representing 545,250 unique patients from 495 hospitals met eligibility criteria and were included in the study (Figure 1). Included patients had a median age of 71 years (interquartile range [IQR]: 5782), and 53.0% were female. Most patients were Caucasian (69.2%), unmarried (51.6%), and insured by Medicare (67.9%). Patients were admitted to the hospital by internal medicine providers (43.4%), hospitalists (21.4%), and family practice providers (14.7%); notably, critical care and pulmonary medicine providers admitted 6.5% of patients. The median Gagne comorbidity score was 2 (IQR: 15). Hypertension, chronic obstructive pulmonary disease, diabetes, and congestive heart failure were among the most common comorbidities observed (Table 1).
Among eligible patients, 41,849 (7.7%) received a PICC during hospitalization. Approximately a quarter of all patients who received PICCs did so by hospital day 2; 90% underwent insertion by hospital day 11 (mean = 5.4 days, median = 4 days). Patients who received PICCs were younger (median IQR: 69 years, 5780 years) but otherwise demographically similar to those that did not receive PICCs (median IQR: 72 years, 5782 years). Compared to other specialties, patients admitted by critical care/pulmonary providers were twice as likely to receive PICCs (12.3% vs 6.1%, P < .001). Patients who received PICCs had higher comorbidity scores than those who did not (median Gagne comorbidity score 4 vs 2, P < 0.001) and were more likely to be diagnosed with HCAP (43.1% vs 29.9%, P < 0.001) than CAP (56.9% vs 70.1%, P < 0.001).
PICC recipients were also more likely to receive intensive care unit (ICU) level of care (41.4% vs 16%, P < 0.001) and both noninvasive (17.5% vs 8.1%, P < 0.001) and invasive ventilation (28.6% vs 8.8%, P < 0.001) upon admission. Vasopressor use was also significantly more frequent in patients who received PICCs (24.7% vs 7.6%, P < 0.001) compared to those who did not receive these devices. Patients with PICCs were more often discharged to skilled nursing facilities (34.5% vs 19.3%) than those without PICCs.
Characteristics Associated With PICC Use Following Multivariable Modeling
Using HGLM with a random hospital effect, multiple patient characteristics were associated with PICC use (Table 2). Patients 65 years of age were less likely to receive a PICC compared to younger patients (odds ratio [OR]: 0.81, 95% confidence interval [CI]: 0.79‐0.84). Weight loss (OR: 2.03, 95% CI: 1.97‐2.10), sepsis on admission (OR: 1.80, 95% CI: 1.75‐1.85), and ICU status on hospital day 1 or 2 (OR: 1.70, 95% CI: 1.64‐1.75) represented 3 factors most strongly associated with PICC use.
| Patient Characteristic | Odds Ratio | 95% Confidence Intervals |
|---|---|---|
| ||
| Age group (>66 vs 65 years) | 0.82 | 0.790.84 |
| Race/ethnicity | ||
| Other | 1.02 | 0.971.06 |
| Black | 0.99 | 0.951.03 |
| Hispanic | 0.82 | 0.760.88 |
| White | Referent | |
| Marital status | ||
| Other/missing | 1.07 | 1.011.14 |
| Single | 1.02 | 1.001.05 |
| Married | Referent | |
| Insurance payor | ||
| Other | 0.85 | 0.800.89 |
| Medicaid | 1.13 | 1.081.18 |
| Managed care | 0.95 | 0.910.99 |
| Commercialindemnity | 0.93 | 0.871.00 |
| Medicare | Referent | |
| Admitting physician specialty | ||
| Pulmonary/critical care medicine | 1.18 | 1.131.24 |
| Family practice | 1.01 | 0.971.05 |
| Geriatric medicine (FP and IM) | 1.85 | 1.662.05 |
| Hospitalist | 0.94 | 0.910.98 |
| Other specialties | 1.02 | 0.971.06 |
| Internal medicine | Referent | |
| Comorbidities | ||
| Congestive heart failure | 1.27 | 1.241.31 |
| Valvular disease | 1.11 | 1.071.15 |
| Pulmonary circulation disorders | 1.37 | 1.321.42 |
| Peripheral vascular disease | 1.09 | 1.051.13 |
| Hypertension | 0.94 | 0.920.97 |
| Paralysis | 1.59 | 1.511.67 |
| Other neurological disorders | 1.20 | 1.161.23 |
| Chronic lung disease | 1.10 | 1.071.12 |
| Diabetes | 1.13 | 1.101.16 |
| Hypothyroidism | 1.03 | 1.001.06 |
| Liver disease | 1.16 | 1.101.23 |
| Ulcer | 1.86 | 1.153.02 |
| Lymphoma | 0.88 | 0.810.96 |
| Metastatic cancer | 0.75 | 0.710.80 |
| Solid tumor without metastasis | 0.93 | 0.880.98 |
| Arthritis | 1.22 | 1.161.28 |
| Obesity | 1.47 | 1.421.52 |
| Weight loss | 2.03 | 1.972.10 |
| Blood loss | 1.69 | 1.551.85 |
| Deficiency anemias | 1.40 | 1.371.44 |
| Alcohol abuse | 1.19 | 1.131.26 |
| Drug abuse | 1.31 | 1.231.39 |
| Psychoses | 1.16 | 1.111.21 |
| Depression | 1.10 | 1.061.13 |
| Renal failure | 0.96 | 0.930.98 |
| Type of pneumonia | ||
| HCAP | 1.03 | 1.011.06 |
| CAP | Referent | |
| Sepsis (POA) | 1.80 | 1.751.85 |
| Antibiotic exposure | ||
| Anti‐MRSA agent | 1.72 | 1.671.76 |
| Anti‐Pseudomonal carbapenem | 1.37 | 1.311.44 |
| Non‐Pseudomonal carbapenem | 1.48 | 1.331.66 |
| Third‐generation cephalosporin | 1.04 | 1.011.07 |
| Anti‐Pseudomonal cephalosporin | 1.25 | 1.201.30 |
| Anti‐Pseudomonal ‐lactam | 1.27 | 1.231.31 |
| Aztreonam | 1.31 | 1.231.40 |
| Non‐Pseudomonal ‐lactam | 1.36 | 1.231.50 |
| ‐lactam | 1.55 | 1.261.90 |
| Respiratory quinolone | 0.90 | 0.870.92 |
| Macrolide | 0.85 | 0.820.88 |
| Doxycycline | 0.94 | 0.871.01 |
| Aminoglycoside | 1.21 | 1.141.27 |
| Vasopressors | 1.06 | 1.031.10 |
| Noninvasive ventilation | 1.29 | 1.251.34 |
| Invasive ventilation | 1.66 | 1.611.72 |
| Intensive care unit on admission | 1.70 | 1.641.75 |
| Atrial fibrillation | 1.26 | 1.221.29 |
| Upper extremity chronic DVT | 1.61 | 1.132.28 |
| Nicotine replacement therapy/tobacco abuse | 0.91 | 0.880.94 |
| Aspirin | 0.94 | 0.920.97 |
| Warfarin | 0.90 | 0.860.94 |
| LMWH, prophylactic dose | 1.10 | 1.081.13 |
| LMWH, treatment dose | 1.22 | 1.161.29 |
| Intravenous steroids | 1.05 | 1.021.08 |
| Bacteremia (prior year) | 1.14 | 1.021.27 |
| VTE (prior year) | 1.11 | 1.061.18 |
| Pneumatic compression device | 1.25 | 1.081.45 |
| Invasive ventilation (prior year) | 1.17 | 1.111.24 |
| Irritable bowel disease | 1.19 | 1.051.36 |
Therapy with potent parenteral antimicrobials including antimethicillin‐resistant Staphylococcus aureus agents (OR: 1.72, 95% CI: 1.67‐1.76), antipseudomonal ‐lactamases (OR: 1.27, 95% CI: 1.23‐1.31), and carbapenems (OR: 1.37, 95% CI: 1.31‐1.44) were significantly associated with PICC use. Conversely, use of macrolides (OR: 0.85, 95% CI: 0.82‐0.88) or respiratory fluoroquinolones (OR: 0.90, 95% CI: 0.87‐0.92) were associated with lower likelihood of PICC use. After adjusting for antimicrobial therapy, HCAP was only slightly more likely to result in PICC use than CAP (OR: 1.03, 95% CI: 1.01‐1.06). Compared to internal medicine providers, admission by geriatricians and critical care/pulmonary specialists was associated with greater likelihood of PICC use (OR: 1.85, 95% CI: 1.66‐2.05 and OR: 1.18, 95% CI: =1.13‐1.24, respectively). Admission by hospitalists was associated with a modestly lower likelihood of PICC placement (OR: 0.94, 95% CI: 0.91‐0.98).
Hospital Level Variation in PICC Use
To ensure stable estimates of hospital PICC use, we excluded 152 facilities (31%): 10% had no patients with PICCs and 21% had <5 patients who received a PICC. Therefore, RSPICC was estimated for 343 of 495 facilities (69%) (Figure 2). In these facilities, RSPICC varied from 0.3% to 41.7%. Hospital RSPICC was significantly associated with hospital location (median 11.9% vs 7.8% for urban vs rural hospitals respectively, P = 0.05). RSPICCs were also greater among hospitals in Southern (11.3%), Western (12.7%), and Midwest (12.0%) regions of the nation compared to those in the Northeast (8.4%) (P = 0.02) (Table 3).
| Hospital Characteristic (No.) | Median (IQR), % | P Value |
|---|---|---|
| ||
| Bed size | 0.12 | |
| 200 beds (106) | 9.1 (4.816.3) | |
| 201 beds (237) | 11.6 (5.817.6) | |
| Rural/urban | 0.05 | |
| Urban (275) | 11.9 (5.517.4) | |
| Rural (68) | 7.8 (5.014.0) | |
| Region | 0.02 | |
| Northeast (50) | 8.4 (3.913.0) | |
| Midwest (69) | 12.0 (5.817.4) | |
| West (57) | 12.7 (7.617.0) | |
| South (167) | 11.3 (4.817.8) | |
| Teaching status | 0.77 | |
| Nonteaching (246) | 10.9 (5.017.4) | |
| Teaching (97) | 12.0 (5.816.9) | |
A likelihood ratio test comparing the hierarchical model to a logistic model with patient factors only was highly significant (P < 0.001), indicating that the hospital where the patient was treated had a major impact on receipt of PICC after accounting for patient factors. The MOR was 2.71, which is a larger effect than we found for any of the individual patient characteristics. The proportion of variance explained by hospitals was 25% (95% CI: 22%‐28%), as measured by the ICC.
DISCUSSION
In this study of 545,250 adults hospitalized with pneumonia, we found that approximately 8% of patients received a PICC. Patients who received PICCs had more comorbidities, were more frequently diagnosed with HCAP, and were more often admitted to the ICU, where they experienced greater rates of mechanical ventilation, noninvasive ventilation, and vasopressor use compared to those who did not receive a PICC. Additionally, risk‐adjusted rates of PICC use varied as much as 10‐fold across institutions. In fact, almost 70% of the total variation in rates of PICC use remained unexplained by hospital or patient characteristics. Although use of PICCs is often clinically nuanced in ways that are difficult to capture in large datasets (eg, difficult venous access or inability to tolerate oral medications), the substantial variation of PICC use observed suggests that physician and institutional practice styles are the major determinants of PICC placement during a hospitalization for pneumonia. Because PICCs are associated with serious complications, and evidence regarding discretionary use is accumulating, a research agenda examining reasons for such use and related outcomes appears necessary.
The placement of PICCs has grown substantially in hospitalized patients all over the world.[23, 24] Although originally developed for total parenteral nutrition in surgical patients,[25] contemporary reports of PICC use in critical illness,[26] diseases such as cystic fibrosis,[27] and even pregnancy[28] are now common. Although PICCs are clinically invaluable in many of these conditions, growing use of these devices has led to the realization that benefits may be offset by complications.[9, 10, 29, 30] Additionally, recent data suggest that not all PICCs may be used for appropriate reasons. For instance, in a decade‐long study at a tertiary care center, changes in patterns of PICC use including shortened dwell times, multiple insertions in a single patient, and unclear indications for use were reported.[11] In another study at an academic medical center, a substantial proportion of PICCs were found to be idle or unjustified.[12] It comes as little surprise, then, that a recent multicenter study found that 1 out of every 5 clinicians did not even know that their patient had a PICC.[29] Although calls to improve PICC use in the hospital setting have emerged, strategies to do so are limited by data that emanate from single‐center reports or retrospective designs. No other studies reporting use of PICCs across US hospitals for any clinical condition currently exist.[31]
We found that patients with weight loss, those with greater combined comorbidity scores, and those who were critically ill or diagnosed with sepsis were more likely to receive PICCs than others. These observations suggest that PICC use may reflect underlying severity of illness, as advanced care such as ventilator support was often associated with PICC use. Additionally, discharge to a skilled nursing facility was frequently associated with PICC placement, a finding consistent with a recent study evaluating the use of PICCs in these settings.[32] However, a substantial proportion of PICC use remained unexplained by available patient or hospital factors. Although our study was not specifically designed to examine this question, a possible reason may relate to unmeasured institutional factors that influence the propensity to use a PICC, recently termed as PICC culture.[33] For example, it is plausible that hospitals with nursing‐led PICC teams or interventional radiology (such as teaching hospitals) are more likely to use PICCs than those without such operators. This hypothesis may explain why urban, larger, and teaching hospitals exhibited higher rates of PICC use. Conversely, providers may have an affinity toward PICC use that is predicated not just by operator availability, but also local hospital norms. Understanding why some facilities use PICCs at higher rates than others and implications of such variation with respect to patient safety, cost, and outcomes is important. Study designs that use mixed‐methods approaches or seek to qualitatively understand reasons behind PICC use are likely to be valuable in this enquiry.
Our study has limitations. First, we used an administrative dataset and ICD‐9‐CM codes rather than clinical data from medical records to identify cases of pneumonia or comorbidities. Our estimates of PICC use across hospitals thus may not fully account for differences in severity of illness, and it is possible that patients needed a PICC for reasons that we could not observe. However, the substantial variation observed in rates of PICC use across hospitals is unlikely to be explained by differences in patient severity of illness, documentation, or coding practices. Second, as PICC removal codes were not available, we are unable to comment on how often hospitalized pneumonia patients were discharged with PICCs or received antimicrobial therapy beyond their inpatient stay. Third, although we observed that a number of patient and hospital factors were associated with PICC receipt, our study was not designed to determine the reasons underlying these patterns.
These limitations aside, our study has important strengths. To our knowledge, this is the first study to report utilization and outcomes associated with PICC use among those hospitalized with pneumonia across the United States. The inclusion of a large number of patients receiving care in diverse facilities lends a high degree of external validity to our findings. Second, we used advanced modeling to identify factors associated with PICC use in hospitalized patients with pneumonia, producing innovative and novel findings. Third, our study is the first to show the existence of substantial variation in rates of PICC use across US hospitals within the single disease state of pneumonia. Understanding the drivers of this variability is important as it may inform future studies, policies, and practices to improve PICC use in hospitalized patients.
In conclusion, we found that PICC use in patients hospitalized with pneumonia is common and highly variable. Future studies examining the contextual factors behind PICC use and their association with outcomes are needed to facilitate efforts to standardize PICC use across hospitals.
Disclosures
Dr. Chopra is supported by a career development award (1‐K08‐HS022835‐01) from the Agency of Healthcare Research and Quality. The authors report no conflicts of interest.
- , . Reasons for being admitted to the hospital through the emergency department, 2003. Healthcare Cost and Utilization Project Statistical Brief 2. Rockville, MD: Agency for Healthcare Research and Quality. Available at: www.hcup‐us.ahrq.gov/reports/statbriefs/sb2.pdf. Published February 2006. Accessed June 27, 2014.
- , , , et al. National patterns of risk‐standardized mortality and readmission after hospitalization for acute myocardial infarction, heart failure, and pneumonia: update on publicly reported outcomes measures based on the 2013 release. J Gen Intern Med. 2014;29(10):1333–1340.
- , , , et al. Quality of care for elderly patients hospitalized for pneumonia in the United States, 2006 to 2010. JAMA Intern Med. 2014;174(11):1806–1814.
- , . PICC lines: the latest home care challenge. RN. 1990;53(1):44–51.
- , , , . Peripherally inserted central catheters in an acute‐care hospital. Arch Intern Med. 1994;154(16):1833–1837.
- , . The peripherally inserted central catheter: a retrospective look at three years of insertions. J Intraven Nurs. 1993;16(2):92–103.
- , , , . Peripherally inserted central catheters in general medicine. Mayo Clin Proc. 1997;72(3):225–233.
- , , . Two‐year trends of peripherally inserted central catheter‐line complications at a tertiary‐care hospital: role of nursing expertise. Infect Control Hosp Epidemiol. 2001;22(6):377–379.
- , , , , , . PICC‐associated bloodstream infections: prevalence, patterns, and predictors. Am J Med. 2014;127(4):319–328.
- , , , , . The risk of bloodstream infection associated with peripherally inserted central catheters compared with central venous catheters in adults: a systematic review and meta‐analysis. Infect Control Hosp Epidemiol. 2013;34(9):908–918.
- , , , , , . Peripherally inserted central catheters: use at a tertiary care pediatric center. J Vasc Interv Radiol. 2013;24(9):1323–1331.
- , , , et al. Temporary central venous catheter utilization patterns in a large tertiary care center: tracking the “idle central venous catheter”. Infect Control Hosp Epidemiol. 2012;33(1):50–57.
- , , , , . Inappropriate intravascular device use: a prospective study. Journal Hosp Infect. 2011;78(2):128–132.
- , , , et al. Enhancing patient‐centered care: SGIM and choosing wisely. J Gen Intern Med. 2014;29(3):432–433.
- , , , et al. Critical and honest conversations: the evidence behind the “Choosing Wisely” campaign recommendations by the American Society of Nephrology. Clin J Am Soc Nephrol. 2012;7(10):1664–1672.
- , , , et al. Using highly detailed administrative data to predict pneumonia mortality. PLoS One. 2014;9(1):e87382.
- , , , , . A combined comorbidity score predicted mortality in elderly patients better than existing scores. J Clin Epidemiol. 2011;64(7):749–759.
- , , , , . Hospitals with the highest intensive care utilization provide lower quality pneumonia care to the elderly. Crit Care Med. 2015;43(6):1178–1186.
- , . Statistical and clinical aspects of hospital outcomes profiling. Stat Sci. 2007;22(2):206–226.
- , . Appropriate assessment of neighborhood effects on individual health: integrating random and fixed effects in multilevel logistic regression. Am J Epidemiol. 2005;161(1):81–88.
- , , , . Interpreting parameters in the logistic regression model with random effects. Biometrics. 2000;56(3):909–914.
- , , , . Hospital‐level associations with 30‐day patient mortality after cardiac surgery: a tutorial on the application and interpretation of marginal and multilevel logistic regression. BMC Med Res Methodol. 2012;12:28.
- , , , . Experiences of the first PICC team in the Czech Republic. Br J Nurs. 2015;24(suppl 2):S4–S10.
- , , , et al. Greece reports prototype intervention with first peripherally inserted central catheter: case report and literature review. J Vasc Nurs. 2012;30(3):88–93.
- Total intravenous nutrition with peripherally inserted silicone elastomer central venous catheters. Arch Surg. 1975;110(5):644–646.
- , . Focus on peripherally inserted central catheters in critically ill patients. World J Crit Care Med. 2014;3(4):80–94.
- , , , et al. Quality improvement initiative to reduce deep vein thrombosis associated with peripherally inserted central catheters in adults with cystic fibrosis. Ann Am Thorac Soc. 2014;11(9):1404–1410.
- , , , . Peripherally Inserted central catheter (PICC) complications during pregnancy. JPEN J Parenter Enteral Nutr. 2013;38(5):595–601.
- , , , et al. Do clinicians know which of their patients have central venous catheters?: a multicenter observational study. Ann Intern Med. 2014;161(8):562–567.
- , , , et al. Risk of venous thromboembolism associated with peripherally inserted central catheters: a systematic review and meta‐analysis. Lancet. 2013;382(9889):311–325.
- , , . The problem with peripherally inserted central catheters. JAMA. 2012;308(15):1527–1528.
- , , , et al. Peripherally inserted central catheter use in skilled nursing facilities: a pilot study. J Am Geriatr Soc. 2015;63(9):1894–1899.
- , , , , . Inpatient venous access practices: PICC culture and the kidney patient. J Vasc Access. 2015;16(3):206–210.
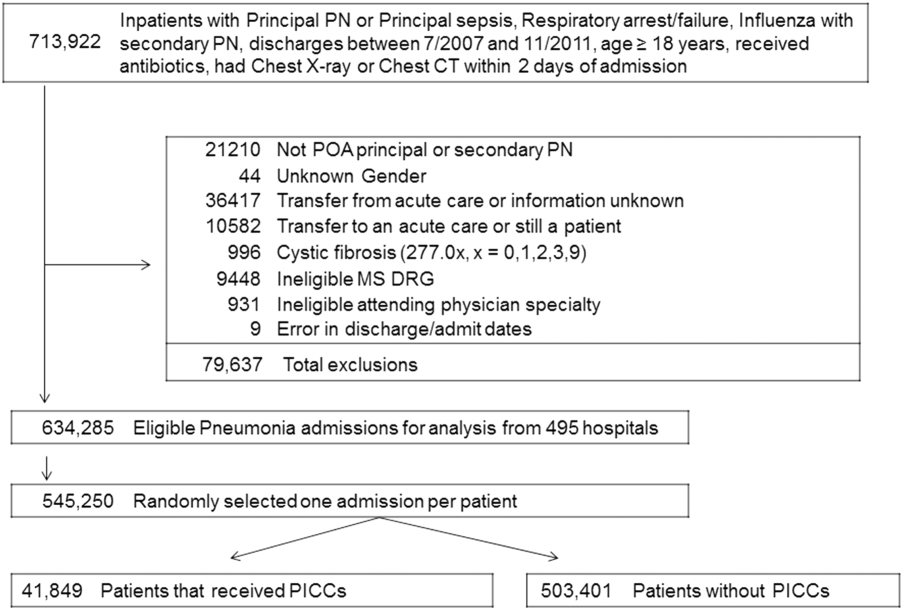
Dyspnea Assessment and Management Survey
Dyspnea, defined as a subjective experience of breathing discomfort,[1] is the seventh most frequent reason adult patients present to the emergency room and the most frequent cause for emergency room visits in patients 65 years or older.[2] Moreover, dyspnea is experienced by 49% of patients hospitalized with a medical condition[3, 4, 5] and by 70% of patients who are seriously ill.[6]
Based on evidence that patients are not treated consistently and effectively for relief of their shortness of breath, the American College of Chest Physicians (ACCP) statement on dyspnea management in patients with advanced lung or heart disease recommended that patients should be asked to rate their dyspnea, and the rating should be routinely documented in the medical record to guide management.[7] Although clinicians may question the utility of routine assessment of dyspnea using a standardized scale, studies have found that the prevalence of dyspnea reported from chart review is much lower than when patients are directly interviewed.[8] This may be the result of underrecognition of dyspnea or poor documentation by physicians, or that patients may not communicate their symptoms unless the physician specifically asks. As is the case with pain, routine assessment of dyspnea severity could lead to improved clinical management and greater patient‐centered care. However, unlike in the case of pain, regulatory bodies, such as the Joint Commission for Accreditation of Healthcare Organization, do not require routine dyspnea assessment.[9]
Currently, there are more than 40,000 hospitalists in the United States, and the vast majority of hospitals with >200 beds have a hospitalist group.[10] Hospitalists care for over 60% of inpatients[11] and play a major role in the management of patients with acute cardiopulmonary diseases. If standardized approaches for the assessment and documentation of dyspnea are to be implemented, hospitalists would be a key stakeholder group for utilizing enhanced clinical information about dyspnea. Therefore, we evaluated attitudes and practices of hospitalists in regard to the assessment and management of dyspnea, including the potential benefits and challenges related to the implementation of standardized assessment. We hypothesized that hospitalists would believe that a dyspnea scale for assessment of severity could improve their management of patients with cardiovascular diseases. Further, we hypothesized that physicians who agreed with the general statement that dyspnea is an important clinical problem would be more likely to believe that routine dyspnea assessment would be valuable.
METHODS
Study Sample
We invited 255 attending hospitalists from 9 geographically and structurally diverse hospitals to complete a survey about the assessment and management of dyspnea. The 9 hospitals represent range of practice environments including 4 academic medical centers, 2 community teaching and 3 nonteaching hospitals, 1 Veterans Administration hospital, and 2 staff‐model HMOs (see Supporting Table 1 in the online version of this article). The survey was distributed online using REDCap (Research Electronic Data Capture), a secure web‐based interface application.[12] A coinvestigator who was a pulmonary critical‐care physician at each site sent an initial email to their hospitalist groups that alerted them to expect a survey from the principal investigator. This notification was subsequently followed by an email invitation containing an informational cover letter and a link to the online survey. The cover letter stated that the completed surveys would not be stored at the local sites and that all the analyzed data would be deidentified. Nonrespondents were sent reminders at 2 and 4 weeks after the initial mailing. A $25 electronic gift card was provided as a gesture of appreciation for their time. The survey was conducted between September 2013 and December 2013.
The study was approved by the Baystate Health Institutional Review Board, Springfield, Massachusetts, with a waiver for written informed consent.
Questionnaire
We developed a 17‐item instrument based on a review of the dyspnea literature and a prior ACCP survey.[12] Questions were piloted with 4 hospitalists at a single institution and modified to improve face validity and clarity (see Supporting Information in the online version of this article for the full survey).
Hospitalists were asked to consider the care of patients admitted for acute cardiopulmonary disease, including heart failure, chronic obstructive pulmonary disease, and pneumonia. A series of 5‐point Likert scales were used to assess the respondents level of agreement with statements related to the following domains: the importance of dyspnea in clinical care, the potential benefits and challenges of routine dyspnea assessment (statements such as: Having a standardized assessment of dyspnea severity would be helpful in management of patients with cardiopulmonary diseases. Dyspnea assessment by a scale should be part of the vital signs for patients with cardiopulmonary diseases.), and management of dyspnea (questions regarding the use of opioids and other nonpharmacological therapies). Additional questions were asked about current assessment practices (questions such as: How often do you assess severity of dyspnea? What is your approach in assessing dyspnea? with options of choosing a categorical or numerical scale), if dyspnea is assessed in their institution by nurses and how often, and the influence of dyspnea severity assessment on their management. The survey had 1 question that solicited comments from the participants: If you don't think that it would be useful to have a standardized dyspnea assessment, please tell us why.
Data Analysis
Responses to survey questions were summarized via counts and percentages in each response category. Adopting the methodology used in the ACCP consensus statement, strongly agree and somewhat agree were combined into a single category of agreement. We also presented percentage of responses in the 2 levels of agreement (strongly agree and somewhat agree) for each question in a bar graph.
Associations between tertiles of physicians' time in practice and attitude toward dyspnea were evaluated via 2 or Fisher exact test.
To examine how answers to the first 2 questions, which assessed attitude toward importance of dyspnea in clinical care, affect answers to the remaining questions, we grouped respondents in 3 categories (strongly agree, agree to these questions, do not agree) and tested the associations using 2 or Fisher exact test.
All analyses were performed using SAS version 9.3 (SAS institute, Inc., Cary, NC) and Stata release 13.1 (StataCorp, College Station, TX).
RESULTS
Overall, 178 (69.8%) of 255 identified hospitalists completed the survey, and all 9 participating hospitals had a response rate greater than 50%. The median number of years in practice was 6 (range, 038 years). A majority (77.5%) of respondents agreed with the statement that dyspnea is 1 of the major symptoms of patients with cardiopulmonary disease, and that its treatment is central to the management of these patients (77.0%) (Figure 1).
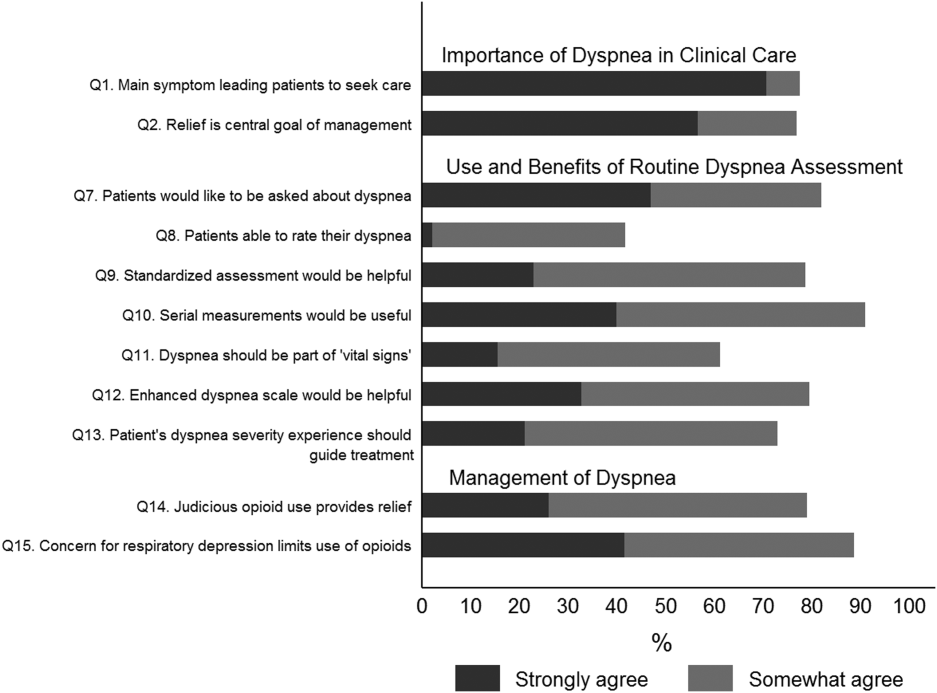
Attitude and Practices Surrounding Dyspnea Assessment
When asked about their current assessment of dyspnea, a majority (84.3%) of the hospitalists stated that they assess dyspnea on a daily basis; two‐thirds indicated that they use a categorical scale (ie, no shortness of breath, improved or worsened compared with a prior date), and one‐third indicated that they ask whether the patient is dyspneic or not. Fifty‐six percent of hospitalists stated that dyspnea is regularly assessed by nurses in their hospital.
The majority of respondents agreed (78.6%, 23.0% strongly and 55.6% somewhat agree) that standardized assessment of dyspnea severity, using a numeric scale and serial measurements as part of the vital signs, would benefit the management of patients with cardiopulmonary diseases. Furthermore, 79.6% (33.0% strongly and 46.6% somewhat agree) reported that using a dyspnea scale that included information to further characterize the patient‐reported experience, such as the level of distress associated with dyspnea, would be helpful in management.
Approximately 90% of the hospitalists indicated that awareness of dyspnea severity has an influence on clinical decision making, including whether to intensify treatment of underlying conditions, to pursue additional diagnostic testing, or to modify discharge timing. Additionally, two‐thirds of hospitalists agreed that awareness of dyspnea severity influences their decision to add opioids, whereas only one‐third prescribed nonpharmacologic symptom‐oriented treatment (Table 1).
| Frequency (%) | |
|---|---|
| |
| When caring for patients with acute cardiopulmonary diseases, how often do you assess severity of dyspnea?* | |
| At admission | 66 (37.1) |
| At discharge | 59 (33.2) |
| Daily until discharge | 150 (84.3) |
| More often than daily | 58 (32.6) |
| Which description best characterizes your approach to assessing dyspnea severity? | |
| I don't regularly ask about dyspnea severity | 3 (1.7) |
| I ask the patient whether or not they are having shortness of breath | 50 (28.3) |
| I ask the patient to rate the severity of shortness of breath using a numeric scale | 4 (2.3) |
| I ask the patient to rate the severity of shortness of breath using a categorical scale (eg, somewhat SOB, no SOB, improved or worsened compared with a prior date) | 120 (67.8) |
| When is dyspnea severity assessed and documented by nursing at your hospital?* | |
| Dyspnea is not routinely assessed | 60 (33.7) |
| At admission | 30 (16.9) |
| Daily | 43 (24.2) |
| Each shift | 64 (36.0) |
| Awareness of dyspnea severity affects my management by:* | |
| Influencing my decision to intensify treatment of the patient's underlying condition | 170 (95.5) |
| Influencing my decision to pursue additional diagnostic testing | 160 (89.9) |
| Influencing my decision to add pharmacologic‐based, symptom‐oriented treatment for dyspnea, such as opioids | 115 (64.6) |
| Influencing my decision to add nonpharmacologic‐based, symptom‐oriented treatment for dyspnea, such as fans or pursed lip breathing technique | 58 (32.6) |
| Influencing my decision regarding timing of discharge | 162 (91.0) |
| Which of the following nonpharmacologic therapies are effective for the relief of dyspnea?* | |
| Pursed lip breathing | 113 (63.5) |
| Relaxation techniques | 137 (77.0) |
| Noninvasive ventilation | 143 (80.3) |
| O2 for nonhypoxemic patients | 89 (50.0) |
| Cool air/fan | 125 (70.2) |
| Cognitive behavioral strategies | 101 (56.7) |
Forty‐two percent of the respondents agreed that patients are able to rate their dyspnea on a scale (2.3% strongly agree and 40.0% agree), and 73.0% indicated that patient experience of dyspnea should guide management independent of physiologic measures such as respiratory rate and oxygen saturation (Figure 1).
Several potential barriers were identified among the 18 participants who did not think that a standardized assessment of dyspnea would be beneficial, including concerns that (1) a dyspnea severity scale is too subjective and numerical scales are not useful for a subjective symptom (19.0%), (2) patients may overrate their symptom or will not be able to rate their dyspnea using a scale (31.0%), or (3) categorical description is sufficient (31.0%).
Practices in Dyspnea Management
Seventy‐nine percent of respondents agreed with the statement that judicious use of opioids can provide relief of dyspnea (26.1% strongly and 52.8% agreed), and 88.7% hospitalists identified the risk of respiratory depression as 1 of the barriers for the limited use of opioids. The majority of physicians (60%80%) considered nonpharmacologic therapies effective for symptomatic treatment of dyspnea, including in the order of agreement: noninvasive ventilation, relaxation techniques, cool air/fan, use of pursed lip breathing, and oxygen for nonhypoxemic patients (Table 1).
Physician Experience and Attitudes Toward Dyspnea Management
When we stratified hospitalists in tertiles of median years of time in practice (median [range]: 2 [04], 6 [58] and 15 [938]), we did not find an association with any of the responses to the questions.
Attitude Regarding the Importance of Dyspnea in Clinical Care and Responses to Subsequent Questions
Respondents who strongly agree or agree that dyspnea is the primary presenting symptom in patients with cardiovascular condition and that dyspnea relief is central to the management of these patients were more likely to believe that patients would like to be asked about their dyspnea (61.2% vs 30.2% vs 29.7%). They also had a more positive attitude about the usefulness of a standardized assessment of dyspnea and the inclusion of the assessment of dyspnea by a scale in the vital signs (Table 2).
| Description | Do Not Agree, n (%) | Somewhat Agree, n (%) | Strongly Agree, n (%) | P Value* |
|---|---|---|---|---|
| ||||
| 37 (20.9) | 43 (24.3) | 97 (54.8) | ||
| Which description best characterizes your approach to assessing dyspnea severity? | 0.552 | |||
| I don't regularly ask about dyspnea severity | 0 (0) | 0 (0) | 3 (3.1) | |
| I ask the patient whether or not they are having shortness of breath | 11 (29.7) | 14 (32.6) | 25 (25.8) | |
| I ask the patient to rate the severity of shortness of breath using a numeric scale | 2 (5.4) | 1 (2.3) | 1 (1.0) | |
| I ask the patient to rate the severity of shortness of breath using a categorical scale (e.g., somewhat shortness of breath, no shortness of breath, improved or worsened compared with a prior date) | 24 (64.9) | 28 (65.1) | 68 (70.1) | |
| Patients would like me to ask them about their dyspnea. | <0.0001 | |||
| Somewhat agree | 9 (24.3) | 21 (48.8) | 32 (32.7) | |
| Strongly agree | 11 (29.7) | 13 (30.2) | 60 (61.2) | |
| Patients are able to rate their own dyspnea intensity on a scale of 0‐10. | 0.432 | |||
| Somewhat agree | 12 (32.4) | 16 (37.2) | 42 (43.3) | |
| Strongly agree | 2 (5.4) | 0 (0) | 2 (2.1) | |
| Having a standardized assessment of dyspnea severity would be helpful to me in management of patients with cardiopulmonary diseases. | 0.026 | |||
| Somewhat agree | 17 (46.0) | 25 (58.1) | 57 (58.2) | |
| Strongly agree | 7 (18.9) | 6 (14.0) | 28 (28.6) | |
| Serial measurements of dyspnea would be useful for assessing response to therapy. | 0.042 | |||
| Somewhat agree | 14 (37.8) | 28 (65.1) | 48 (49.5) | |
| Strongly agree | 16 (43.2) | 12 (27.9) | 43 (44.3) | |
| Dyspnea assessment by a scale should be part of the vital signs for patients with cardiopulmonary diseases. | 0.042 | |||
| Somewhat agree | 13 (35.1) | 17 (39.5) | 51 (52.0) | |
| Strongly agree | 4 (10.8) | 5 (11.6) | 19 (19.4) | |
| Using an enhanced dyspnea scale that includes information about the following 4 features 1) Current dyspnea severity, 2) Worst dyspnea ever, 3) Improvement of dyspnea since admission, 4) Acceptability of current level of dyspnea, would be more helpful for my management than a single question focused on dyspnea severity. | 0.03 | |||
| Somewhat agree | 14 (40.0) | 24 (55.8) | 44 (44.9) | |
| Strongly agree | 9 (25.7) | 9 (20.9) | 40 (40.8) | |
| The patients experience of dyspnea should be used to guide treatment decisions independent of objective measures such as respiratory rate and oxygen saturation. | 0.10 | |||
| Somewhat agree | 20 (54.0) | 21 (48.8) | 51 (52.0) | |
| Strongly agree | 5 (13.5) | 6 (14.0) | 27 (27.6) | |
| Judicious use of oral and/or parenteral opioids can provide relief of dyspnea. | 0.21 | |||
| Somewhat agree | 20 (54.0) | 23 (54.8) | 50 (51.6) | |
| Strongly agree | 10 (27.0) | 6 (14.3) | 30 (30.9) | |
| Limited use of opioids for relief of dyspnea in patients with advanced cardiopulmonary disorders is often due to concerns of respiratory depression. | 0.71 | |||
| Somewhat agree | 17 (46.0) | 23 (54.8) | 43 (43.9) | |
| Strongly agree | 15 (40.5) | 14 (33.3) | 45 (45.9) | |
DISCUSSION
In this survey of 178 most hospitalists from a diverse group of 9 US hospitals, we found that most indicate that severity of dyspnea has a profound influence on their clinical practice (including their decision whether to intensify treatments such as diuretics or bronchodilators, to pursue additional diagnostic testing, add opioids or other nonpharmacological treatments) and ultimately their decision regarding the timing of hospital discharge. More importantly, whereas less than half reported experience with standardized assessment of dyspnea severity, most stated that such data would be very useful in their practice.
Despite being a highly prevalent symptom in diverse patient populations, several studies have shown that documentation of dyspnea is sporadic and evaluation of dyspnea quality of care is not routinely performed.[13, 14, 15] Statements from a number of professional societies, including the ACCP, the American Thoracic Society and the Canadian Respiratory Society, recommend that dyspnea management should rely on patient reporting, and that dyspnea severity should be recorded.[1, 4, 7] Assessment is an essential step to guide interventions; however, simply asking about the presence or absence of dyspnea is insufficient.
Several rating scales have been validated and might be implementable in the acute care setting, including the Numerical Rating Scale and the Visual Assessment Scale.[16, 17, 18, 19, 20] Our survey shows that standardized documentation of dyspnea severity in clinical practice is uncommon. However, most hospitalists in our study believed that assessment of dyspnea, using a standardized scale, would positively impact their management of patients with cardiopulmonary disease.
There are a number of potential benefits of routine assessment of dyspnea in hospitalized patients. Implementation of a standardized approach to dyspnea measurement would result in more uniform assessment and documentation practices, and in turn greater awareness among members of the patient‐care team. Though not sufficient to improve care, measurement is necessary because physicians do not always recognize the severity of patients' dyspnea or may not recognize its presence. A retrospective study that assessed the prevalence of symptoms in 410 ambulatory patients showed that one‐quarter of patients had dyspnea, but only half of them told their doctor about it.[21] Two other studies of patients with cancer diagnoses found that 30%70% of patients had dyspnea, but the symptom was recognized in only half of them; even when recognized, dyspnea severity was frequently underrated by physicians.[21, 22] Importantly, underestimation appears to correlate with underutilization of symptomatic management of dyspnea.[8]
Although the results of our survey are encouraging, they highlight a number of potential barriers and misconceptions among hospitalists. For example, although dyspnea can be characterized only by the person experiencing it, only 42% of our survey respondents believed that patients are able to rate their dyspnea intensity on a scale. Some of these responses may be influenced by the fact that dyspnea scales are not currently available to patients under their care. Another explanation is that similar to the case for pain, some hospitalists may believe that patients will exaggerate dyspnea severity. Almost one‐third of the respondents stated that objective measures, such as respiratory rate or oxygen saturation, are more important than a patient's experience of dyspnea in guiding the treatment, and that dyspnea is a subjective symptom and not a vital sign itself. Hospitalists who appreciated the importance of dyspnea in clinical practice were more likely to support the implementation of a standardized dyspnea scale for dyspnea assessment.
Although the potential benefits of including routine measurement of dyspnea in standard hospital practice may seem obvious, evidence that implementing routine assessment improves patient care or outcomes is lacking. Even if hospitalists see the value of dyspnea assessment, asking nurses to collect and document additional information would represent a substantial change in hospital workflow. Finally, without specific protocols to guide care, it is unclear whether physicians will be able to use new information about dyspnea severity effectively. Future studies need to evaluate the impact of implementing routine dyspnea assessment on the management of patients with cardiopulmonary diseases including the use of evidence‐based interventions and reducing the use of less valuable care.
Most hospitalists agreed with the basic principles of dyspnea treatment in patients with advanced cardiopulmonary disease after the primary disease had been stabilized. Effective measures are available, and several guidelines endorse opioids in dyspnea management.[1, 4, 7] However, many clinicians are uncomfortable with this approach for dyspnea, and opioids remain underused. In our study, almost 90% of physicians recognized that concerns about respiratory depression limits opioids use as a treatment. A qualitative study that explored the physicians' perspective toward opioids showed that most physicians were reluctant to prescribe opioids for refractory dyspnea, describing a lack of related knowledge and experience, and fears related to the potential adverse effects. The findings of our study also outline the need to better educate residents and hospitalists on the assessment and management of dyspnea, including prescribing opioids for refractory dyspnea.[23]
Study Strengths and Limitations
This study has several strengths. To our knowledge, it is the first to explore hospitalists' perspectives on incorporating dyspnea assessment in their clinical practice. Hospitalists are the attending physicians for a large majority of inpatients and would be the main users of a dyspnea severity scale. Our questionnaire survey included a large number of hospitalists, from 9 geographically and structurally diverse hospitals, which increased the generalizability of the findings to other hospitals around the country.
The study also has several limitations that need be kept in mind in interpreting the study results. First, desirability bias may have exaggerated some of the positive views expressed by hospitalists toward implementation of routine assessment of dyspnea. Second, because this was a survey, the estimates of dyspnea assessment and documentation practices of both physicians and nurses were based on the respondents' perception and not an objective review of medical records, and the results may be different from actual practice. Third, this was not a population‐based random sample of hospitalists, and it may not be entirely representative; however, those surveyed were from a diverse set of sites with different geographical location, size, academic affiliation, and practice environment, and their time in practice varied widely. Last, we do not have information on nonrespondents, and there is a possibility of nonresponse bias, although the high response rate lessens the risk.
CONCLUSIONS
The results of this survey suggest that most hospitalists believe that routine assessment of dyspnea severity would enhance their clinical decision making and improve patient care. Standardized assessment of dyspnea might result in better awareness of this symptom among providers, reduce undertreatment and mistreatment, and ultimately result in better outcomes for patients. However, implementation of the routine assessment of dyspnea would change current clinical practices and may have a significant effect on existing nursing and physician workflows. Additional research is needed to determine the feasibility and impact on outcomes of routine dyspnea assessment.
Acknowledgements
The authors wish to acknowledge Ms. Anu Joshi for her help with editing the manuscript and assisting with table preparations.
Disclosures
Dr. Stefan is supported by grant K01HL114631‐01A1 from the National Heart, Lung, and Blood Institute of the National Institutes of Health, and by the National Center for Research Resources and the National Center for Advancing Translational Sciences, National Institutes of Health, through grant UL1RR025752. The funder had no role in the design and conduct of the study; collection, management, analysis, and interpretation of the data; preparation, review, or approval of the manuscript; and decision to submit the manuscript for publication. M.S.S. and P.K.L. conceived of the study. M.S.S. acquired the data with the help of all collaborators. M.S.S., P.K.L., P.S.P., and A.P. analyzed and interpreted the data. M.S.S. drafted the manuscript. All authors critically reviewed the manuscript for intellectual content. M.S.S., P.K.L., and A.P. had full access to all of the data in the study and take responsibility for the integrity of the data and the accuracy of the data analysis. M.S.S. is the guarantor for this article, and is responsible for the content of the article, including data and analysis. The authors report no conflicts of interest.
- , , , et al. An Official American Thoracic Society Statement: Update on the Mechanisms, Assessment, and Management of Dyspnea. Am J Respir Crit Care Med. 2012;185(4):435–452.
- CDC/ National Center for Health Statistics. National Hospital Amulatory Medical Care Survey: 2011 Emergency Department Summary Tables. http://www.cdc.gov/nchs/data/ahcd/nhamcs_emergency/2011_ed_web_tables.pdf. Accessed May 15, 2015.
- , , , . Signs and symptoms of heart failure: are you asking the right questions? Am J Crit Care. 2010;19(5):443–452.
- , , , et al. Managing dyspnea in patients with advanced chronic obstructive pulmonary disease: a Canadian Thoracic Society clinical practice guideline. Can Respir J. 2011;18(2):69–78.
- , . Prevalence of distressing symptoms in hospitalised patients on medical wards: A cross‐sectional study. BMC Palliat Care. 2008;7:16.
- , . Dyspnea in terminally ill cancer patients. Chest. 1986;89(2):234–236.
- , , , et al. American College of Chest Physicians consensus statement on the management of dyspnea in patients with advanced lung or heart disease. Chest. 2010;137(3):674–691.
- , . Common symptoms in ambulatory care: incidence, evaluation, therapy, and outcome. Am J Med. 1989;86(3):262–266.
- The Joint Commission. Facts about Pain Management. http://www.jointcommission.org/pain_management/. Accessed May, 15, 2015.
- . Hospitalist programs in the age of healthcare reform. J Healthc Manag. 2010;55(6):378–380.
- , , , . The Use of Hospitalists by Small Rural Hospitals: Results of a National Survey. Med Care Res Rev. 2014;71(4):356–366.
- Tufts CTSI. REDCap [Internet]. Tufts Clinical and Translational Science Institute. http://www.tuftsctsi.org/Services-and-Consultation/REDCap.aspx. Accessed May, 15, 2015.
- , . Multi‐dimensional Assessment of Dyspnea. Dyspnoea in Advanced Disease: A guide to clinical management; 2005.
- , , , et al. Cancer care quality measures: symptoms and end‐of‐life care. Evid Rep Technol Assess (Full Rep). 2006(137):1–77.
- . Defining and measuring quality palliative and end‐of‐life care in the intensive care unit. Crit Care Med. 2006;34(11 Suppl):S309–316.
- . Validation of a vertical visual analogue scale as a measure of clinical dyspnea. Rehabil Nurs. 1989;14(6):323–325.
- . Can a self‐rating 0‐10 scale for dyspnea yield a common language that is understood by ED nurses, patients, and their families? J Emerg Nurs. 2000;26(3):233–234.
- , , . Measurement of dyspnea: word labeled visual analog scale vs. verbal ordinal scale. Respir Physiol Neurobiol. 2003;134(2):77–83.
- , , , , , . Verbal numerical scales are as reliable and sensitive as visual analog scales for rating dyspnea in young and older subjects. Respir Physiol Neurobiol. 2007;157(2‐3):360–365.
- , , , , . Validation of a three‐factor measurement model of dyspnea in hospitalized adults with heart failure. Heart Lung. 2011;41(1):44–56.
- , , . Patient reporting and doctor recognition of dyspnoea in a comprehensive cancer centre. Intern Med J. 2006;36(6):381–384.
- , , , . Lung cancer and dyspnea: the patient's perception. Oncol Nurs Forum. 1986;13(5):19–24.
- , , , . Opioids, respiratory function, and dyspnea. Am J Hosp Palliat Care. 2003;20(1):57–61.
Dyspnea, defined as a subjective experience of breathing discomfort,[1] is the seventh most frequent reason adult patients present to the emergency room and the most frequent cause for emergency room visits in patients 65 years or older.[2] Moreover, dyspnea is experienced by 49% of patients hospitalized with a medical condition[3, 4, 5] and by 70% of patients who are seriously ill.[6]
Based on evidence that patients are not treated consistently and effectively for relief of their shortness of breath, the American College of Chest Physicians (ACCP) statement on dyspnea management in patients with advanced lung or heart disease recommended that patients should be asked to rate their dyspnea, and the rating should be routinely documented in the medical record to guide management.[7] Although clinicians may question the utility of routine assessment of dyspnea using a standardized scale, studies have found that the prevalence of dyspnea reported from chart review is much lower than when patients are directly interviewed.[8] This may be the result of underrecognition of dyspnea or poor documentation by physicians, or that patients may not communicate their symptoms unless the physician specifically asks. As is the case with pain, routine assessment of dyspnea severity could lead to improved clinical management and greater patient‐centered care. However, unlike in the case of pain, regulatory bodies, such as the Joint Commission for Accreditation of Healthcare Organization, do not require routine dyspnea assessment.[9]
Currently, there are more than 40,000 hospitalists in the United States, and the vast majority of hospitals with >200 beds have a hospitalist group.[10] Hospitalists care for over 60% of inpatients[11] and play a major role in the management of patients with acute cardiopulmonary diseases. If standardized approaches for the assessment and documentation of dyspnea are to be implemented, hospitalists would be a key stakeholder group for utilizing enhanced clinical information about dyspnea. Therefore, we evaluated attitudes and practices of hospitalists in regard to the assessment and management of dyspnea, including the potential benefits and challenges related to the implementation of standardized assessment. We hypothesized that hospitalists would believe that a dyspnea scale for assessment of severity could improve their management of patients with cardiovascular diseases. Further, we hypothesized that physicians who agreed with the general statement that dyspnea is an important clinical problem would be more likely to believe that routine dyspnea assessment would be valuable.
METHODS
Study Sample
We invited 255 attending hospitalists from 9 geographically and structurally diverse hospitals to complete a survey about the assessment and management of dyspnea. The 9 hospitals represent range of practice environments including 4 academic medical centers, 2 community teaching and 3 nonteaching hospitals, 1 Veterans Administration hospital, and 2 staff‐model HMOs (see Supporting Table 1 in the online version of this article). The survey was distributed online using REDCap (Research Electronic Data Capture), a secure web‐based interface application.[12] A coinvestigator who was a pulmonary critical‐care physician at each site sent an initial email to their hospitalist groups that alerted them to expect a survey from the principal investigator. This notification was subsequently followed by an email invitation containing an informational cover letter and a link to the online survey. The cover letter stated that the completed surveys would not be stored at the local sites and that all the analyzed data would be deidentified. Nonrespondents were sent reminders at 2 and 4 weeks after the initial mailing. A $25 electronic gift card was provided as a gesture of appreciation for their time. The survey was conducted between September 2013 and December 2013.
The study was approved by the Baystate Health Institutional Review Board, Springfield, Massachusetts, with a waiver for written informed consent.
Questionnaire
We developed a 17‐item instrument based on a review of the dyspnea literature and a prior ACCP survey.[12] Questions were piloted with 4 hospitalists at a single institution and modified to improve face validity and clarity (see Supporting Information in the online version of this article for the full survey).
Hospitalists were asked to consider the care of patients admitted for acute cardiopulmonary disease, including heart failure, chronic obstructive pulmonary disease, and pneumonia. A series of 5‐point Likert scales were used to assess the respondents level of agreement with statements related to the following domains: the importance of dyspnea in clinical care, the potential benefits and challenges of routine dyspnea assessment (statements such as: Having a standardized assessment of dyspnea severity would be helpful in management of patients with cardiopulmonary diseases. Dyspnea assessment by a scale should be part of the vital signs for patients with cardiopulmonary diseases.), and management of dyspnea (questions regarding the use of opioids and other nonpharmacological therapies). Additional questions were asked about current assessment practices (questions such as: How often do you assess severity of dyspnea? What is your approach in assessing dyspnea? with options of choosing a categorical or numerical scale), if dyspnea is assessed in their institution by nurses and how often, and the influence of dyspnea severity assessment on their management. The survey had 1 question that solicited comments from the participants: If you don't think that it would be useful to have a standardized dyspnea assessment, please tell us why.
Data Analysis
Responses to survey questions were summarized via counts and percentages in each response category. Adopting the methodology used in the ACCP consensus statement, strongly agree and somewhat agree were combined into a single category of agreement. We also presented percentage of responses in the 2 levels of agreement (strongly agree and somewhat agree) for each question in a bar graph.
Associations between tertiles of physicians' time in practice and attitude toward dyspnea were evaluated via 2 or Fisher exact test.
To examine how answers to the first 2 questions, which assessed attitude toward importance of dyspnea in clinical care, affect answers to the remaining questions, we grouped respondents in 3 categories (strongly agree, agree to these questions, do not agree) and tested the associations using 2 or Fisher exact test.
All analyses were performed using SAS version 9.3 (SAS institute, Inc., Cary, NC) and Stata release 13.1 (StataCorp, College Station, TX).
RESULTS
Overall, 178 (69.8%) of 255 identified hospitalists completed the survey, and all 9 participating hospitals had a response rate greater than 50%. The median number of years in practice was 6 (range, 038 years). A majority (77.5%) of respondents agreed with the statement that dyspnea is 1 of the major symptoms of patients with cardiopulmonary disease, and that its treatment is central to the management of these patients (77.0%) (Figure 1).
Attitude and Practices Surrounding Dyspnea Assessment
When asked about their current assessment of dyspnea, a majority (84.3%) of the hospitalists stated that they assess dyspnea on a daily basis; two‐thirds indicated that they use a categorical scale (ie, no shortness of breath, improved or worsened compared with a prior date), and one‐third indicated that they ask whether the patient is dyspneic or not. Fifty‐six percent of hospitalists stated that dyspnea is regularly assessed by nurses in their hospital.
The majority of respondents agreed (78.6%, 23.0% strongly and 55.6% somewhat agree) that standardized assessment of dyspnea severity, using a numeric scale and serial measurements as part of the vital signs, would benefit the management of patients with cardiopulmonary diseases. Furthermore, 79.6% (33.0% strongly and 46.6% somewhat agree) reported that using a dyspnea scale that included information to further characterize the patient‐reported experience, such as the level of distress associated with dyspnea, would be helpful in management.
Approximately 90% of the hospitalists indicated that awareness of dyspnea severity has an influence on clinical decision making, including whether to intensify treatment of underlying conditions, to pursue additional diagnostic testing, or to modify discharge timing. Additionally, two‐thirds of hospitalists agreed that awareness of dyspnea severity influences their decision to add opioids, whereas only one‐third prescribed nonpharmacologic symptom‐oriented treatment (Table 1).
| Frequency (%) | |
|---|---|
| |
| When caring for patients with acute cardiopulmonary diseases, how often do you assess severity of dyspnea?* | |
| At admission | 66 (37.1) |
| At discharge | 59 (33.2) |
| Daily until discharge | 150 (84.3) |
| More often than daily | 58 (32.6) |
| Which description best characterizes your approach to assessing dyspnea severity? | |
| I don't regularly ask about dyspnea severity | 3 (1.7) |
| I ask the patient whether or not they are having shortness of breath | 50 (28.3) |
| I ask the patient to rate the severity of shortness of breath using a numeric scale | 4 (2.3) |
| I ask the patient to rate the severity of shortness of breath using a categorical scale (eg, somewhat SOB, no SOB, improved or worsened compared with a prior date) | 120 (67.8) |
| When is dyspnea severity assessed and documented by nursing at your hospital?* | |
| Dyspnea is not routinely assessed | 60 (33.7) |
| At admission | 30 (16.9) |
| Daily | 43 (24.2) |
| Each shift | 64 (36.0) |
| Awareness of dyspnea severity affects my management by:* | |
| Influencing my decision to intensify treatment of the patient's underlying condition | 170 (95.5) |
| Influencing my decision to pursue additional diagnostic testing | 160 (89.9) |
| Influencing my decision to add pharmacologic‐based, symptom‐oriented treatment for dyspnea, such as opioids | 115 (64.6) |
| Influencing my decision to add nonpharmacologic‐based, symptom‐oriented treatment for dyspnea, such as fans or pursed lip breathing technique | 58 (32.6) |
| Influencing my decision regarding timing of discharge | 162 (91.0) |
| Which of the following nonpharmacologic therapies are effective for the relief of dyspnea?* | |
| Pursed lip breathing | 113 (63.5) |
| Relaxation techniques | 137 (77.0) |
| Noninvasive ventilation | 143 (80.3) |
| O2 for nonhypoxemic patients | 89 (50.0) |
| Cool air/fan | 125 (70.2) |
| Cognitive behavioral strategies | 101 (56.7) |
Forty‐two percent of the respondents agreed that patients are able to rate their dyspnea on a scale (2.3% strongly agree and 40.0% agree), and 73.0% indicated that patient experience of dyspnea should guide management independent of physiologic measures such as respiratory rate and oxygen saturation (Figure 1).
Several potential barriers were identified among the 18 participants who did not think that a standardized assessment of dyspnea would be beneficial, including concerns that (1) a dyspnea severity scale is too subjective and numerical scales are not useful for a subjective symptom (19.0%), (2) patients may overrate their symptom or will not be able to rate their dyspnea using a scale (31.0%), or (3) categorical description is sufficient (31.0%).
Practices in Dyspnea Management
Seventy‐nine percent of respondents agreed with the statement that judicious use of opioids can provide relief of dyspnea (26.1% strongly and 52.8% agreed), and 88.7% hospitalists identified the risk of respiratory depression as 1 of the barriers for the limited use of opioids. The majority of physicians (60%80%) considered nonpharmacologic therapies effective for symptomatic treatment of dyspnea, including in the order of agreement: noninvasive ventilation, relaxation techniques, cool air/fan, use of pursed lip breathing, and oxygen for nonhypoxemic patients (Table 1).
Physician Experience and Attitudes Toward Dyspnea Management
When we stratified hospitalists in tertiles of median years of time in practice (median [range]: 2 [04], 6 [58] and 15 [938]), we did not find an association with any of the responses to the questions.
Attitude Regarding the Importance of Dyspnea in Clinical Care and Responses to Subsequent Questions
Respondents who strongly agree or agree that dyspnea is the primary presenting symptom in patients with cardiovascular condition and that dyspnea relief is central to the management of these patients were more likely to believe that patients would like to be asked about their dyspnea (61.2% vs 30.2% vs 29.7%). They also had a more positive attitude about the usefulness of a standardized assessment of dyspnea and the inclusion of the assessment of dyspnea by a scale in the vital signs (Table 2).
| Description | Do Not Agree, n (%) | Somewhat Agree, n (%) | Strongly Agree, n (%) | P Value* |
|---|---|---|---|---|
| ||||
| 37 (20.9) | 43 (24.3) | 97 (54.8) | ||
| Which description best characterizes your approach to assessing dyspnea severity? | 0.552 | |||
| I don't regularly ask about dyspnea severity | 0 (0) | 0 (0) | 3 (3.1) | |
| I ask the patient whether or not they are having shortness of breath | 11 (29.7) | 14 (32.6) | 25 (25.8) | |
| I ask the patient to rate the severity of shortness of breath using a numeric scale | 2 (5.4) | 1 (2.3) | 1 (1.0) | |
| I ask the patient to rate the severity of shortness of breath using a categorical scale (e.g., somewhat shortness of breath, no shortness of breath, improved or worsened compared with a prior date) | 24 (64.9) | 28 (65.1) | 68 (70.1) | |
| Patients would like me to ask them about their dyspnea. | <0.0001 | |||
| Somewhat agree | 9 (24.3) | 21 (48.8) | 32 (32.7) | |
| Strongly agree | 11 (29.7) | 13 (30.2) | 60 (61.2) | |
| Patients are able to rate their own dyspnea intensity on a scale of 0‐10. | 0.432 | |||
| Somewhat agree | 12 (32.4) | 16 (37.2) | 42 (43.3) | |
| Strongly agree | 2 (5.4) | 0 (0) | 2 (2.1) | |
| Having a standardized assessment of dyspnea severity would be helpful to me in management of patients with cardiopulmonary diseases. | 0.026 | |||
| Somewhat agree | 17 (46.0) | 25 (58.1) | 57 (58.2) | |
| Strongly agree | 7 (18.9) | 6 (14.0) | 28 (28.6) | |
| Serial measurements of dyspnea would be useful for assessing response to therapy. | 0.042 | |||
| Somewhat agree | 14 (37.8) | 28 (65.1) | 48 (49.5) | |
| Strongly agree | 16 (43.2) | 12 (27.9) | 43 (44.3) | |
| Dyspnea assessment by a scale should be part of the vital signs for patients with cardiopulmonary diseases. | 0.042 | |||
| Somewhat agree | 13 (35.1) | 17 (39.5) | 51 (52.0) | |
| Strongly agree | 4 (10.8) | 5 (11.6) | 19 (19.4) | |
| Using an enhanced dyspnea scale that includes information about the following 4 features 1) Current dyspnea severity, 2) Worst dyspnea ever, 3) Improvement of dyspnea since admission, 4) Acceptability of current level of dyspnea, would be more helpful for my management than a single question focused on dyspnea severity. | 0.03 | |||
| Somewhat agree | 14 (40.0) | 24 (55.8) | 44 (44.9) | |
| Strongly agree | 9 (25.7) | 9 (20.9) | 40 (40.8) | |
| The patients experience of dyspnea should be used to guide treatment decisions independent of objective measures such as respiratory rate and oxygen saturation. | 0.10 | |||
| Somewhat agree | 20 (54.0) | 21 (48.8) | 51 (52.0) | |
| Strongly agree | 5 (13.5) | 6 (14.0) | 27 (27.6) | |
| Judicious use of oral and/or parenteral opioids can provide relief of dyspnea. | 0.21 | |||
| Somewhat agree | 20 (54.0) | 23 (54.8) | 50 (51.6) | |
| Strongly agree | 10 (27.0) | 6 (14.3) | 30 (30.9) | |
| Limited use of opioids for relief of dyspnea in patients with advanced cardiopulmonary disorders is often due to concerns of respiratory depression. | 0.71 | |||
| Somewhat agree | 17 (46.0) | 23 (54.8) | 43 (43.9) | |
| Strongly agree | 15 (40.5) | 14 (33.3) | 45 (45.9) | |
DISCUSSION
In this survey of 178 most hospitalists from a diverse group of 9 US hospitals, we found that most indicate that severity of dyspnea has a profound influence on their clinical practice (including their decision whether to intensify treatments such as diuretics or bronchodilators, to pursue additional diagnostic testing, add opioids or other nonpharmacological treatments) and ultimately their decision regarding the timing of hospital discharge. More importantly, whereas less than half reported experience with standardized assessment of dyspnea severity, most stated that such data would be very useful in their practice.
Despite being a highly prevalent symptom in diverse patient populations, several studies have shown that documentation of dyspnea is sporadic and evaluation of dyspnea quality of care is not routinely performed.[13, 14, 15] Statements from a number of professional societies, including the ACCP, the American Thoracic Society and the Canadian Respiratory Society, recommend that dyspnea management should rely on patient reporting, and that dyspnea severity should be recorded.[1, 4, 7] Assessment is an essential step to guide interventions; however, simply asking about the presence or absence of dyspnea is insufficient.
Several rating scales have been validated and might be implementable in the acute care setting, including the Numerical Rating Scale and the Visual Assessment Scale.[16, 17, 18, 19, 20] Our survey shows that standardized documentation of dyspnea severity in clinical practice is uncommon. However, most hospitalists in our study believed that assessment of dyspnea, using a standardized scale, would positively impact their management of patients with cardiopulmonary disease.
There are a number of potential benefits of routine assessment of dyspnea in hospitalized patients. Implementation of a standardized approach to dyspnea measurement would result in more uniform assessment and documentation practices, and in turn greater awareness among members of the patient‐care team. Though not sufficient to improve care, measurement is necessary because physicians do not always recognize the severity of patients' dyspnea or may not recognize its presence. A retrospective study that assessed the prevalence of symptoms in 410 ambulatory patients showed that one‐quarter of patients had dyspnea, but only half of them told their doctor about it.[21] Two other studies of patients with cancer diagnoses found that 30%70% of patients had dyspnea, but the symptom was recognized in only half of them; even when recognized, dyspnea severity was frequently underrated by physicians.[21, 22] Importantly, underestimation appears to correlate with underutilization of symptomatic management of dyspnea.[8]
Although the results of our survey are encouraging, they highlight a number of potential barriers and misconceptions among hospitalists. For example, although dyspnea can be characterized only by the person experiencing it, only 42% of our survey respondents believed that patients are able to rate their dyspnea intensity on a scale. Some of these responses may be influenced by the fact that dyspnea scales are not currently available to patients under their care. Another explanation is that similar to the case for pain, some hospitalists may believe that patients will exaggerate dyspnea severity. Almost one‐third of the respondents stated that objective measures, such as respiratory rate or oxygen saturation, are more important than a patient's experience of dyspnea in guiding the treatment, and that dyspnea is a subjective symptom and not a vital sign itself. Hospitalists who appreciated the importance of dyspnea in clinical practice were more likely to support the implementation of a standardized dyspnea scale for dyspnea assessment.
Although the potential benefits of including routine measurement of dyspnea in standard hospital practice may seem obvious, evidence that implementing routine assessment improves patient care or outcomes is lacking. Even if hospitalists see the value of dyspnea assessment, asking nurses to collect and document additional information would represent a substantial change in hospital workflow. Finally, without specific protocols to guide care, it is unclear whether physicians will be able to use new information about dyspnea severity effectively. Future studies need to evaluate the impact of implementing routine dyspnea assessment on the management of patients with cardiopulmonary diseases including the use of evidence‐based interventions and reducing the use of less valuable care.
Most hospitalists agreed with the basic principles of dyspnea treatment in patients with advanced cardiopulmonary disease after the primary disease had been stabilized. Effective measures are available, and several guidelines endorse opioids in dyspnea management.[1, 4, 7] However, many clinicians are uncomfortable with this approach for dyspnea, and opioids remain underused. In our study, almost 90% of physicians recognized that concerns about respiratory depression limits opioids use as a treatment. A qualitative study that explored the physicians' perspective toward opioids showed that most physicians were reluctant to prescribe opioids for refractory dyspnea, describing a lack of related knowledge and experience, and fears related to the potential adverse effects. The findings of our study also outline the need to better educate residents and hospitalists on the assessment and management of dyspnea, including prescribing opioids for refractory dyspnea.[23]
Study Strengths and Limitations
This study has several strengths. To our knowledge, it is the first to explore hospitalists' perspectives on incorporating dyspnea assessment in their clinical practice. Hospitalists are the attending physicians for a large majority of inpatients and would be the main users of a dyspnea severity scale. Our questionnaire survey included a large number of hospitalists, from 9 geographically and structurally diverse hospitals, which increased the generalizability of the findings to other hospitals around the country.
The study also has several limitations that need be kept in mind in interpreting the study results. First, desirability bias may have exaggerated some of the positive views expressed by hospitalists toward implementation of routine assessment of dyspnea. Second, because this was a survey, the estimates of dyspnea assessment and documentation practices of both physicians and nurses were based on the respondents' perception and not an objective review of medical records, and the results may be different from actual practice. Third, this was not a population‐based random sample of hospitalists, and it may not be entirely representative; however, those surveyed were from a diverse set of sites with different geographical location, size, academic affiliation, and practice environment, and their time in practice varied widely. Last, we do not have information on nonrespondents, and there is a possibility of nonresponse bias, although the high response rate lessens the risk.
CONCLUSIONS
The results of this survey suggest that most hospitalists believe that routine assessment of dyspnea severity would enhance their clinical decision making and improve patient care. Standardized assessment of dyspnea might result in better awareness of this symptom among providers, reduce undertreatment and mistreatment, and ultimately result in better outcomes for patients. However, implementation of the routine assessment of dyspnea would change current clinical practices and may have a significant effect on existing nursing and physician workflows. Additional research is needed to determine the feasibility and impact on outcomes of routine dyspnea assessment.
Acknowledgements
The authors wish to acknowledge Ms. Anu Joshi for her help with editing the manuscript and assisting with table preparations.
Disclosures
Dr. Stefan is supported by grant K01HL114631‐01A1 from the National Heart, Lung, and Blood Institute of the National Institutes of Health, and by the National Center for Research Resources and the National Center for Advancing Translational Sciences, National Institutes of Health, through grant UL1RR025752. The funder had no role in the design and conduct of the study; collection, management, analysis, and interpretation of the data; preparation, review, or approval of the manuscript; and decision to submit the manuscript for publication. M.S.S. and P.K.L. conceived of the study. M.S.S. acquired the data with the help of all collaborators. M.S.S., P.K.L., P.S.P., and A.P. analyzed and interpreted the data. M.S.S. drafted the manuscript. All authors critically reviewed the manuscript for intellectual content. M.S.S., P.K.L., and A.P. had full access to all of the data in the study and take responsibility for the integrity of the data and the accuracy of the data analysis. M.S.S. is the guarantor for this article, and is responsible for the content of the article, including data and analysis. The authors report no conflicts of interest.
- , , , et al. An Official American Thoracic Society Statement: Update on the Mechanisms, Assessment, and Management of Dyspnea. Am J Respir Crit Care Med. 2012;185(4):435–452.
- CDC/ National Center for Health Statistics. National Hospital Amulatory Medical Care Survey: 2011 Emergency Department Summary Tables. http://www.cdc.gov/nchs/data/ahcd/nhamcs_emergency/2011_ed_web_tables.pdf. Accessed May 15, 2015.
- , , , . Signs and symptoms of heart failure: are you asking the right questions? Am J Crit Care. 2010;19(5):443–452.
- , , , et al. Managing dyspnea in patients with advanced chronic obstructive pulmonary disease: a Canadian Thoracic Society clinical practice guideline. Can Respir J. 2011;18(2):69–78.
- , . Prevalence of distressing symptoms in hospitalised patients on medical wards: A cross‐sectional study. BMC Palliat Care. 2008;7:16.
- , . Dyspnea in terminally ill cancer patients. Chest. 1986;89(2):234–236.
- , , , et al. American College of Chest Physicians consensus statement on the management of dyspnea in patients with advanced lung or heart disease. Chest. 2010;137(3):674–691.
- , . Common symptoms in ambulatory care: incidence, evaluation, therapy, and outcome. Am J Med. 1989;86(3):262–266.
- The Joint Commission. Facts about Pain Management. http://www.jointcommission.org/pain_management/. Accessed May, 15, 2015.
- . Hospitalist programs in the age of healthcare reform. J Healthc Manag. 2010;55(6):378–380.
- , , , . The Use of Hospitalists by Small Rural Hospitals: Results of a National Survey. Med Care Res Rev. 2014;71(4):356–366.
- Tufts CTSI. REDCap [Internet]. Tufts Clinical and Translational Science Institute. http://www.tuftsctsi.org/Services-and-Consultation/REDCap.aspx. Accessed May, 15, 2015.
- , . Multi‐dimensional Assessment of Dyspnea. Dyspnoea in Advanced Disease: A guide to clinical management; 2005.
- , , , et al. Cancer care quality measures: symptoms and end‐of‐life care. Evid Rep Technol Assess (Full Rep). 2006(137):1–77.
- . Defining and measuring quality palliative and end‐of‐life care in the intensive care unit. Crit Care Med. 2006;34(11 Suppl):S309–316.
- . Validation of a vertical visual analogue scale as a measure of clinical dyspnea. Rehabil Nurs. 1989;14(6):323–325.
- . Can a self‐rating 0‐10 scale for dyspnea yield a common language that is understood by ED nurses, patients, and their families? J Emerg Nurs. 2000;26(3):233–234.
- , , . Measurement of dyspnea: word labeled visual analog scale vs. verbal ordinal scale. Respir Physiol Neurobiol. 2003;134(2):77–83.
- , , , , , . Verbal numerical scales are as reliable and sensitive as visual analog scales for rating dyspnea in young and older subjects. Respir Physiol Neurobiol. 2007;157(2‐3):360–365.
- , , , , . Validation of a three‐factor measurement model of dyspnea in hospitalized adults with heart failure. Heart Lung. 2011;41(1):44–56.
- , , . Patient reporting and doctor recognition of dyspnoea in a comprehensive cancer centre. Intern Med J. 2006;36(6):381–384.
- , , , . Lung cancer and dyspnea: the patient's perception. Oncol Nurs Forum. 1986;13(5):19–24.
- , , , . Opioids, respiratory function, and dyspnea. Am J Hosp Palliat Care. 2003;20(1):57–61.
© 2015 Society of Hospital Medicine

Acute Respiratory Failure Epidemiology
Acute respiratory failure (ARF), a common and serious complication in hospitalized patients, may be caused by several conditions including pneumonia, chronic obstructive pulmonary disease (COPD), adult respiratory distress syndrome (ARDS), and congestive heart failure (CHF). Although ARF is conventionally defined by an arterial oxygen tension of <60 mm Hg, an arterial carbon dioxide tension of >45 mm Hg, or both, these thresholds serve as a guide to be used in combination with history and clinical assessment of the patient.[1, 2] Supplemental oxygen and treatment of the underlying cause is the mainstay of therapy for ARF, but in severe cases patients are treated with invasive mechanical ventilation (IMV) or noninvasive ventilation (NIV). ARF is the most frequent reason for admission to the intensive care unit (ICU)[3, 4] and has an in‐hospital mortality rate of 33% to 37% among those who require IMV.[5, 6] The majority of epidemiologic studies of ARF have been limited to patients requiring mechanical ventilation or those admitted to the ICU, and information about the characteristics and outcomes of patients across the full spectrum of severity is much more limited.[5, 7, 8, 9, 10, 11] General improvements in the management of underlying conditions, implementation of more effective ventilation strategies,[12, 13] and increasing use of NIV[14, 15] may have led to better outcomes for patients with ARF, yet empirical evidence of a change in the adjusted mortality rate over time is lacking.
The objective of this study was to provide a broad characterization of the epidemiology of ARF among adults hospitalized in the United States using a large nationally representative database. We sought to evaluate whether incidence, mortality, cost, or ventilation practice associated with ARF in the United States changed over the period of 2001 to 2009.
METHODS
Data Source
We utilized data from the Nationwide Inpatient Sample (NIS) of the Health Care Cost and Utilization Project,[16] which is a 20% stratified probability sample of all US acute‐care hospitals each year. These data are drawn from a sampling frame that contains close to 95% of all discharges in the United States, with the hospital discharge record as the unit of analysis. The NIS has been used to study trends in many different diagnoses.[17, 18, 19] The database contains demographic information, payer information, principal and secondary diagnoses, cost, discharge disposition, and death during hospitalization. It also contains information on hospital characteristics including ownership, size, teaching status, and geographic region.
Definitions
We included patients 18 years old discharged between 2001 and 2009 with a primary or secondary diagnosis of ARF. We identified cases of ARF using diagnostic codes (International Classification of Diseases, Ninth Revision, Clinical Modification [ICD‐9‐CM]) previously used in studies of acute organ dysfunction in sepsis (518.81, 518.82, 518.84, 518.4, 799.1, 786.09).[17, 20, 21] To define ARDS we relied on ICD‐9‐CM codes (518.4, 518.82, 518.5, 786.09) used in prior studies that showed good sensitivity and specificity.[22, 23] The use of ventilatory support was identified using the ICD‐9‐CM procedure codes[24] (93.90, 93.70, 93.71, 93.76). Comorbidities were classified using the Agency for Healthcare Research and Quality's (Rockville, MD) Healthcare Cost and Utilization Project's (HCUP) Comorbidity Software version 3.103.5.[25]
Outcomes
The primary outcomes included the annual number of hospitalizations, population incidence, hospital mortality, and costs of care. Secondary outcomes included length of stay, most common diagnoses associated with ARF, disposition at discharge, and use and type of ventilatory support.
Analysis
We estimated the number of hospitalizations with a diagnosis of ARF/year, and we calculated the weighted frequencies following HCUP‐NIS recommendations using SAS/STAT survey procedures. Using population estimates for the years 2001 to 2009 from the US Census Bureau, we employed direct standardization to calculate age‐, gender‐, and race‐adjusted population incidence and mortality rates of ARF per 100,000 population. Hospital mortality was defined as the ratio of ARF hospitalizations ending in death divided by total number of ARF hospitalizations. Mechanical ventilation rates and rates of selected comorbidities were similarly defined.
We employed indirect standardization to adjust hospital mortality rates for age, sex, race/ethnicity, comorbidities, and hospital characteristics using logistic regression models from 2001 to predict hospital mortality for 2002 to 2009. We used linear regression models to test whether the slope of year was significant for trends in outcomes overtime. Costs were calculated using hospital‐specific cost‐to‐charge ratios when available and a weighted group average at the state level for remaining hospitals. We converted all costs to 2009 US dollars using the Consumer Price Index. Costs and lengths of stay were not normally distributed, so we calculated weighted geometric means (the average of all logarithmic values), then converted back to a base‐10 number. Using a Taylor series expansion, we then calculated standard errors. All analyses were performed using SAS version 9.2 (SAS Institute, Inc., Cary, NC).
The Baystate Medical Center institutional review board determined that the project did not constitute human subjects research.
RESULTS
Hospitalization Trends
The number of hospitalizations with an ARF diagnosis code increased at an average annual rate of 11.3% from 1,007,549 (standard deviation [SD] = 19,268) in 2001 to 1,917,910 (SD = 47,558) in 2009. More than two‐thirds of ARF admissions were associated with medical, rather than surgical, conditions (69.5% in 2001 and 71.2% in 2009). The median age, racial make‐up, and gender did not change significantly. Over the study period we observed an increase in ARF‐related hospitalizations in large, urban, teaching hospitals and in hospitals located in the Midwest (Table 1).
| 2001 | 2003 | 2005 | 2007 | 2009 | |
|---|---|---|---|---|---|
| |||||
| Patient characteristics | |||||
| All, N (SD) | 1,007,549 (19,268) | 1,184,928 (25,542) | 1,288,594 (30,493) | 1,480,270 (32,002) | 1,917,910 (47,558) |
| Age, mean (SE), y | 66.6 (0.2) | 66.0 (0.2) | 66.1 (0.2) | 65.8 (0.2) | 65.8 (0.2) |
| Age group, % | |||||
| 1844 | 11.5 | 12.0 | 11.5 | 11.6 | 10.9 |
| 4564* | 26.7 | 28.9 | 29.6 | 30.7 | 31.7 |
| 6584* | 50.2 | 47.8 | 47.0 | 45.7 | 45.3 |
| 85+ | 11.5 | 11.4 | 11.9 | 12.0 | 12.1 |
| Male* | 48.1 | 48.2 | 48.6 | 49.3 | 49.2 |
| Race | |||||
| White | 75.8 | 71.9 | 76.5 | 71.8 | 73.4 |
| Black | 12.7 | 13.6 | 11.2 | 14.2 | 12.5 |
| Hispanic | 7.2 | 9.8 | 7.7 | 8.5 | 7.8 |
| Other | 4.2 | 4.7 | 4.7 | 5.5 | 6.3 |
| Primary ARF | 20.7 | 20.9 | 25.9 | 26.1 | 19.9 |
| Secondary ARF | 79.3 | 79.1 | 74.1 | 73.9 | 80.1 |
| Medical* | 69.5 | 69.1 | 69.9 | 70.2 | 71.2 |
| Surgical* | 30.5 | 30.8 | 30.1 | 29.8 | 28.8 |
| Hospital characteristics, % | |||||
| Number of beds | |||||
| Small | 10.0 | 10.1 | 10.5 | 10.8 | 11.3 |
| Medium | 25.2 | 25.3 | 24.6 | 24.0 | 22.7 |
| Large | 64.7 | 64.6 | 64.9 | 65.2 | 66.0 |
| Region | |||||
| South* | 18.5 | 18.5 | 17.6 | 17.0 | 16.3 |
| Midwest | 21.4 | 22.0 | 23.6 | 23.2 | 23.5 |
| Northeast | 42.6 | 41.7 | 41.4 | 42.2 | 42.1 |
| West* | 17.5 | 17.8 | 17.3 | 17.6 | 18.1 |
| Hospital type | |||||
| Rural | 13.6 | 13.0 | 11.8 | 11.0 | 10.8 |
| Urban nonteaching | 45.5 | 44.5 | 50.1 | 45.3 | 45.7 |
| Urban teaching | 40.9 | 42.5 | 38.1 | 43.7 | 43.6 |
| Patient outcomes | |||||
| Ventilation strategy | |||||
| IMV* | 48.5 | 48.4 | 47.5 | 46.5 | 42.1 |
| NIV* | 3.8 | 5.3 | 6.9 | 9.4 | 10.1 |
| IMV or NIV | 50.9 | 51.7 | 52.1 | 52.9 | 49.7 |
| Disposition | |||||
| Home/home healthcare* | 42.1 | 43.8 | 42.8 | 43.4 | 45.7 |
| Transfer to acute care | 5.2 | 4.7 | 4.6 | 4.6 | 4.4 |
| Nursing facility* | 24.4 | 24.9 | 27.4 | 28.6 | 29.0 |
| Other | 0.7 | 0.8 | 0.9 | 0.9 | 1.0 |
| Adjusted mortality, % (SE)* | 27.6 (0.3) | 26.4 (0.4) | 24.9 (0.4) | 22.7 (0.4) | 20.6 (0.3) |
| Adjusted mean, LOS/case, d (SE)* | 7.8 (0.1) | 7.9 (0.1) | 7.7 (0.1) | 7.5 (0.1) | 7.1 (0.1) |
| Adjusted mean cost/case, 2009 US$, (SE) | 15,818 (251) | 16,981 (419) | 17,236 (411) | 16,941 (436) | 15,987 (402) |
After adjusting for age and sex, the population incidence of ARF increased from 502 (standard error [SE] = 10) cases per 100,000 in 2001 to 784 (SE = 19) cases per 100,000 in 2009 (a 56% increase, P < 0.0001). Hispanics had the lowest rates of ARF, with both black and white groups having similar rates (Table 2).
| 2001 | 2003 | 2005 | 2007 | 2009 | |
|---|---|---|---|---|---|
| |||||
| All* | 502 (10) | 569 (12) | 595 (14) | 627 (14) | 784 (19) |
| Age group | |||||
| 1844* | 107 (3) | 130 (4) | 137 (4) | 153 (5) | 189 (6) |
| 4564* | 422 (9) | 500 (12) | 521 (13) | 580 (14) | 739 (19) |
| 6584* | 1697 (35) | 1863 (42) | 1950 (50) | 2066 (46) | 2578 (69) |
| 85+ | 3449 (86) | 3792 (106) | 3981 (120) | 3429 (97) | 4163 (123) |
| Sex | |||||
| Male* | 491 (10) | 553 (13) | 582 (14) | 629 (14) | 782 (20) |
| Female* | 512 (10) | 583 (12) | 607 (15) | 625 (13) | 786 (19) |
| Race/ethnicity | |||||
| White* | 398 (11) | 427 (12) | 466 (16) | 450 (13) | 699 (21) |
| Black* | 423 (27) | 513 (33) | 432 (26) | 574 (38) | 738 (37) |
| Hispanic* | 247 (24) | 381 (42) | 307 (27) | 353 (34) | 478 (42) |
| Other* | 268 (20) | 342 (29) | 347 (26) | 424 (29) | 713 (77) |
| In‐hospital mortality | 140 (3) | 148 (3) | 146 (3) | 140 (3) | 154 (4) |
The most common etiologies of ARF among medical patients were pneumonia, CHF, ARDS, COPD exacerbation, and sepsis. Over the 9‐year study, the proportion of cases secondary to pneumonia and sepsis rose significantly: from 39% to 46% and 13% to 21%, respectively (Figure 1).

Mortality and Other Outcomes
The number of in‐hospital deaths related to ARF increased from 277,407 deaths in 2001 to 381,155 in 2009 (a 37% increase, P < 0.001). Standardized to the population, deaths increased from 140 in 2001 to 154 cases per 100,000 in 2009 (a 10% increase, P = 0.027). Despite slightly increasing mortality rates at a population level, adjusted in‐hospital mortality improved from 27.6% in 2001 to 20.6% in 2009 (P < 0.001). Mortality declined for both IMV and NIV patients from 35.3% in 2001 to 30.2% in 2009 and from 23.5% to 19%, respectively, but increased for those who required both NIV and IMV (from 26.9% in 2001 to 28% in 2009).
Adjusted hospital length of stay decreased from 7.8 days per patient in 2001 to 7.1 days in 2009 (P < 0.001), with a concomitant increase in discharges to nursing facilities, from 24% in 2001 to 29% in 2009. There was no linear trend in adjusted cost per case, with $15,818 in 2001 and $15,987 in 2009 (in 2009 US dollars) (Table 1).
Ventilation Practices
Overall, 50.9% patients received ventilatory support (NIV or IMV or both) in 2001 and 49.7% in 2009 (P= 0.25). The use of NIV increased from 3.8% to 10.1% (P < 0.001), a 169% increase, whereas the utilization of IMV decreased from 48.5% in 2001 to 42.1% in 2009 (P for trend < 0.0001), a 13% decrease. Uses of both NIV and IMV during hospitalization were seen in 1.4% of cases in 2001 and 2.5% of cases in 2009.
2009 Data Analysis
In 2009 the 1,917,910 hospitalizations with ARF resulted in 381,155 (SD = 8965) deaths and a total inpatient cost of $54 billion. The most common etiologies in patients over 65 years old were pneumonia, CHF, COPD, ARDS, and sepsis. In patients younger than 45 years the most frequent diagnoses were pneumonia, ARDS, sepsis, asthma, drug ingestion, and trauma. Stratified analysis by gender and by age groups showed that mortality rates among men were higher than for women and were highest in patients older than 85 years (Table 3).
| Disease | Total | Age <45 Years | 4565 Years | 6584 Years | 85+ Years | Male | Female |
|---|---|---|---|---|---|---|---|
| |||||||
| Medical | |||||||
| Total, N (%) | 1,364,624 (71.2) | 144,715 (10.6) | 416,922 (30.6) | 615,009 (45.1) | 187,977 (13.8) | 647,894 (47.5) | 716,635 (52.5) |
| Pneumonia, %* | 46.1 | 41.7 | 42.8 | 46.9 | 54.3 | 48.8 | 43.7 |
| CHF, %* | 36.6 | 10.4 | 27.3 | 43.6 | 54.8 | 35.0 | 38.1 |
| ARDS, %* | 16.1 | 22.9 | 16.2 | 14.5 | 15.9 | 15.5 | 16.7 |
| Sepsis, %* | 21.2 | 18.1 | 21.3 | 21.3 | 23.1 | 22.8 | 19.8 |
| COPD, %* | 25.4 | 4.2 | 25.6 | 32.3 | 18.3 | 25.0 | 25.7 |
| AMI, %* | 9.0 | 2.6 | 7.1 | 10.5 | 13.3 | 9.3 | 8.8 |
| Asthma, %* | 9.2 | 18.1 | 11.6 | 6.7 | 5.4 | 6.2 | 12.0 |
| Stroke, %* | 4.8 | 2.3 | 4.1 | 5.5 | 6.0 | 5.0 | 4.7 |
| Trauma or burns, %* | 3.4 | 5.4 | 2.9 | 3.0 | 4.1 | 4.3 | 2.5 |
| Cardiorespiratory arrest, %* | 4.1 | 3.9 | 4.4 | 4.1 | 3.8 | 4.6 | 3.7 |
| Drug, %* | 3.7 | 16.6 | 5.1 | 0.8 | 0.3 | 3.8 | 3.6 |
| IMV, %* | 37.7 | 54.6 | 43.7 | 33.5 | 24.8 | 41.1 | 34.5 |
| NIV, %* | 11.9 | 7.1 | 11.5 | 13.0 | 12.7 | 11.4 | 12.3 |
| In‐hospital mortality (CI) | 22 (21.322.7) | 12.9 (11.913.9) | 18.5 (17.619.4) | 23.9 (23.024.9) | 31.8 (30.633.1) | 24.2 (23.325.1) | 20.9 (20.121.7) |
| Surgical | |||||||
| Total, N (%) | 552971 (28.8) | 64983 (11.8) | 190225 (34.4) | 254336 (46) | 43426 (7.9) | 295660 (53.5) | 257287 (46.5) |
| Pneumonia, %* | 34.9 | 33.0 | 34.0 | 35.0 | 40.5 | 37.1 | 32.2 |
| CHF, %* | 27.2 | 8.9 | 21.7 | 33.3 | 42.6 | 26.7 | 27.7 |
| ARDS, %* | 45.5 | 51.5 | 45.2 | 44.7 | 42.7 | 45.0 | 46.1 |
| Sepsis, %* | 25.1 | 22.8 | 25.4 | 25.2 | 26.1 | 25.4 | 24.7 |
| COPD, %* | 8.2 | 1.1 | 7.4 | 10.8 | 7.5 | 8.3 | 8.1 |
| AMI, %* | 16.9 | 4.9 | 17.0 | 19.8 | 17.9 | 19.1 | 14.4 |
| Asthma, %* | 6.1 | 7.6 | 7.2 | 5.4 | 3.6 | 4.1 | 8.5 |
| Stroke, %* | 8.9 | 6.6 | 9.2 | 9.4 | 7.2 | 8.9 | 8.8 |
| Trauma or burns, %* | 12.2 | 26.5 | 9.6 | 9.2 | 20.3 | 13.8 | 10.4 |
| Cardiorespiratory arrest, %* | 5.5 | 4.4 | 6.0 | 5.4 | 5.2 | 6.1 | 4.7 |
| Drug, %* | 0.5 | 1.3 | 0.7 | 0.2 | 0.2 | 0.4 | 0.6 |
| IMV, %* | 52.9 | 57.1 | 54.3 | 51.3 | 50.0 | 54.5 | 51.0 |
| NIV, %* | 5.8 | 3.5 | 5.5 | 6.4 | 6.4 | 5.6 | 6.0 |
| In‐hospital mortality, % (CI) | 18.6 (17.819.5) | 10.7 (9.312.0) | 15.5 (14.216.8) | 20.8 (19.821.9) | 29.4 (27.831.1) | 19.0 (18.219.8) | 18.3 (17.319.2) |
When we examined ventilation practices among medical patients we found that patients older than 85 years, when compared to patients younger than 45 years, were less likely to be treated with IMV (25% vs 55%) and more likely to be treated with NIV (12.7% vs 7%). At the same time, the average cost per case was lowest among patients 85 years and older, and hospital costs per case fell sharply after age 70 years. Costs were considerably higher for those who did not survive during hospitalization, particularly for patients younger than 45 years (Figure 2).
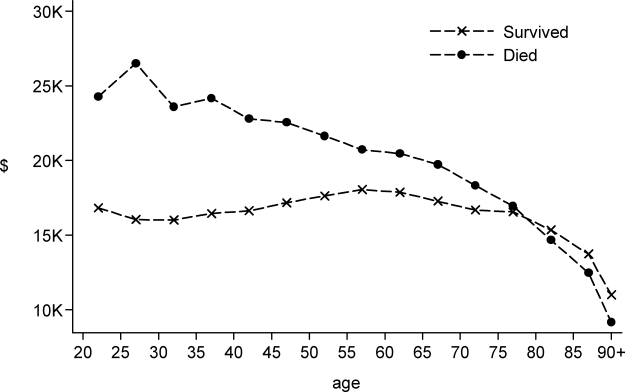
DISCUSSION
In this large population‐based study, we found that the number of hospitalizations associated with a diagnosis of ARF almost doubled over a 9‐year period. In 2009 there were nearly 2 million hospitalizations with ARF in the United States, resulting in approximately 380,000 deaths and inpatient costs of over $54 billion. The population‐adjusted ARF hospitalization rates increased in all age groups, and patients 85 years and older had the highest age‐specific hospitalization rate. Although overall rates of mechanical ventilation (NIV or IMV) remained stable over the 9‐year period, there was an important shift away from IMV (which decreased from 48% in 2001 to 42% in 2009) toward NIV (which increased from 4% in 2001 to 10% in 2009). Overall, there was a significant increase in the number of total deaths despite a decline in adjusted in‐hospital mortality rates. In‐hospital mortality rates decreased for all cases of ARF regardless of ventilation choice.
The findings of this study mirror results of others that have shown that although the incidence of critical care illnesses like sepsis[17, 20, 21, 26] and acute renal failure[27] has increased over the last decade, in‐hospital mortality rates have decreased.[20, 21, 28] Our results also compliment the results of a recent study that looked at hospitalizations for noncardiogenic ARF, which observed a 3.7‐fold increase in the number of cases and a steady decline in case fatality.[11]
Most prior studies addressing the incidence of ARF have included only patients receiving mechanical ventilation. In 1994, the estimated number of cases of ARF requiring IMV was 329,766,[9] which increased to 790,257 in 2005.[10] In our study we found that in 2009, the number of patients with ARF hospitalizations with IMV increased to 806,538. The increase in the overall number of cases with ARF was mainly driven by a surge in cases of sepsis and pneumonia. Our findings are consistent with national trends over time in noncardiogenic ARF[11] and in conditions that predispose patients to ARF such as sepsis[17, 20, 28] and acute renal failure.[27] As the number of claims for ARF doubled and the number of deaths increased, we found that adjusted hospital mortality improved from 27.6% in 2001 to 20.6% in 2009. This decline in hospital mortality was observed among all patients groups, regardless of ventilation choice. The decline in overall case fatality is consistent with prior findings in noncardiogenic ARF,[11] sepsis,[17, 28] and CHF.[29]
There are a number of potential explanations for the reduction in mortality observed over the study period, including improvements in hospital management of the underlying conditions leading to ARF, an increase in the proportion of patients being treated with NIV,[30] and advances in the care of critically ill patients such as the use of low‐tidal volume ventilation.[31, 32] Another contributor may be an increase in the proportion of discharges to nursing facilities, although this change in discharge disposition cannot fully explain our findings. For example, from 2007 to 2009, mortality decreased by 2 percentage points, and nursing home discharges increased by only 0.4 percentage points. Growth and aging of the US population only partially explain the increase we observed in the incidence of ARF, as age‐ and sex‐adjusted population rates increased by 56% from 2001 to 2009. In addition, the NIS captures data on hospital discharges and not individual patients; thus, a patient may have had multiple admissions. Over the last decade adoption of a more intensive practice style has been associated with improved in‐hospital mortality,[33, 34] and although these patients may be living longer they may have multiple readmissions.[35, 36]
We also observed that older patients were less likely to be treated with IMV, had a higher mortality rate, and less expensive care. These results are consistent with other studies and suggest that the intensity of treatment decreases with increasing age, and decisions to withhold or withdraw life‐supporting treatments are more frequent in the elderly.[26, 37] Prior research has shown that severity of illness is more important than age on patients' prognosis,[38, 39] and aggressive treatment strategies are not less cost‐effective when provided to older patients.[40]
Another important finding of this study is the marked increase in the use of NIV paired with a modest reduction in the use of IMV in the treatment of patients with ARF. This finding adds to evidence from other studies, which have similarly reported a dramatic increase in the use of NIV and a decrease in the use of IMV in patients with COPD as well as in ARF of other etiologies.[30, 41]
Our work has several limitations. First, we identified ARF based on ICD‐9‐CM codes and therefore cannot exclude disease misclassification. We did not find any studies in the literature addressing the accuracy and the completeness of ARF coding. However, we employed the same codes used to define ARF as has been used to define organ dysfunction in studies of severe sepsis,[17, 20] and the ICD‐9‐CM codes that we used to identify cases of ARDS have been used in prior studies.[11, 22, 23] Another limitation is that it is not clear to what extent the trends we observed may be due to changes over time in documentation and coding practices. Although this should be considered given the additional reimbursement associated with the diagnosis of ARF, our observation that rates of assisted ventilation have remained almost flat over the 9‐year period of the study suggest that would not wholly account for the rise in ARF. Second, because we did not have access to physiological data such as results of blood gas testing, we could not determine whether the threshold for applying the diagnosis of ARF or for delivering ventilatory support has changed over time. Third, for the purpose of this study we employed a broad definition of ARF, not limiting cases to those requiring mechanical ventilation, and this led to a more heterogeneous cohort including less severe cases of ARF. However, this is not dissimilar to the heterogeneity in disease severity observed among patients who receive a diagnosis of heart failure or acute renal failure. Fourth, survivors of ARF remain at high risk of death in the months after hospitalization,[42] but we assessed only in‐hospital mortality. It is possible that although in‐hospital mortality has improved, 30‐day mortality remained stable. Finally, as the NIS contains only discharge‐level data, we could not distinguish between patients admitted for ARF from those who developed ARF (potentially iatrogenic) after admission.
In summary, over the period of 2001 to 2009, there was a large increase in the number of patients given a diagnosis of ARF and a concomitant reduction in inpatient mortality. Although rates of mechanical ventilation remained relatively constant, there was a significant shift toward greater use of NIV at the expense of IMV.
Disclosures
Dr. Stefan is supported by KM1 CA156726 from the National Cancer Institute (NCI) and by the National Center for Research Resources and the National Center for Advancing Translational Sciences, National Institutes of Health (NIH), through grant UL1 RR025752. The work on this study was supported by a Charlton grant from Tufts University School of Medicine. Dr. Lindenauer and Dr. Pekow are supported by 1R18HL108810‐01 from the National Heart, Lung, and Blood Institute (NHLBI). The content of this publication is solely the responsibility of the authors and does not represent the official views of the NIH, NHLBI, or NCI.
All authors have read and approved the manuscript and none of them have any potential conflicts of interest to report.
Dr. Stefan had full access to all of the data in the study and takes responsibility for the integrity of the data and the accuracy of the data analysis. Conception and design: Mihaela S. Stefan, Penelope S. Pekow, Michael B. Rothberg, Jay Steingrub, Peter K. Lindenauer; analysis and interpretation: Meng‐Shiou Shieh, Mihaela S. Stefan, Penelope S. Pekow, Michael B. Rothberg, Tara Lagu, Peter K. Lindenauer; drafting the manuscript for important intellectual content: Mihaela S. Stefan, Penelope S. Pekow, Michael B. Rothberg, Jay Steingrub, Tara Lagu, and Peter K. Lindenauer.
- , . Goldman's Cecil Medicine. 24th ed. Amsterdam, the Netherlands: Elsevier Inc.; 2012.
- , . Textbook of Respiratory Medicine. 5th ed. Philadelphia, PA: Saunders; 2010.
- , , . Epidemiology and outcome of acute respiratory failure in intensive care unit patients. Crit Care Med. 2003;31(4 suppl):S296–S299.
- , , , et al. Epidemiology of critical care syndromes, organ failures, and life‐support interventions in a suburban US community. Chest. 2011;140(6):1447–1455.
- , , , , . The changing epidemiology of mechanical ventilation: a population‐based study. J Intensive Care Med. 2006;21(3):173–182.
- , , , , . Mechanical ventilation in Ontario, 1992–2000: incidence, survival, and hospital bed utilization of noncardiac surgery adult patients. Crit Care Med. 2004;32(7):1504–1509.
- . Contributions to the epidemiology of acute respiratory failure. Crit Care. 2003;7(4):288–290.
- , , , et al. Incidence, severity, and mortality of acute respiratory failure in Berlin, Germany. Am J Respir Crit Care Med. 1995;151(4):1121–1125.
- . Acute respiratory failure in the United States: incidence and 31‐day survival. Chest. 2000;118(4):1100–1105.
- , , , , , . The epidemiology of mechanical ventilation use in the United States. Crit Care Med. 2010;38(10):1947–1953.
- , , , . Trends in the incidence of noncardiogenic acute respiratory failure: the role of race. Crit Care Med. 2012;40(5):1532–1538.
- , , , , . Secular trends in nosocomial infections and mortality associated with noninvasive ventilation in patients with exacerbation of COPD and pulmonary edema. JAMA. 2003;290(22):2985–2991.
- , , , et al. Association of noninvasive ventilation with nosocomial infections and survival in critically ill patients. JAMA. 2000;284(18):2361–2367.
- , , , , . Noninvasive versus conventional mechanical ventilation. An epidemiologic survey. Am J Respir Crit Care Med. 2001;163(4):874–880.
- , , , , , . Does noninvasive ventilation reduce the ICU nosocomial infection risk? A prospective clinical survey. Intensive Care Med. 1999;25(6):567–573.
- Heathcare Cost and Utilization Project (HCUP). Overview of the Nationwide Inpatient Sample. Available at: http://www.hcup‐us.ahrq.gov/nisoverview.jsp. Accessed December 6, 2011.
- , , , , , . Hospitalizations, costs, and outcomes of severe sepsis in the United States 2003 to 2007. Crit Care Med. 2011;40(3):754–761.
- , , , , . Association of diagnostic coding with trends in hospitalizations and mortality of patients with pneumonia, 2003–2009. JAMA. 2012;307(13):1405–1413.
- , , , , . Little evidence of correlation between growth in health care spending and reduced mortality. Health Aff (Millwood). 2010;29(8):1523–1531.
- , , , . The epidemiology of sepsis in the United States from 1979 through 2000. N Engl J Med. 2003;348(16):1546–1554.
- , , , . Rapid increase in hospitalization and mortality rates for severe sepsis in the United States: a trend analysis from 1993 to 2003. Crit Care Med. 2007;35(5):1244–1250.
- , , . Risk factors for ARDS in the United States: analysis of the 1993 National Mortality Followback Study. Chest. 2001;119(4):1179–1184.
- , , , , , . Acute respiratory distress syndrome: estimated incidence and mortality rate in a 5 million‐person population base. Crit Care. 1998;2(1):29–34.
- , , . Validity of procedure codes in International Classification of Diseases, 9th Revision, Clinical Modification administrative data. Med Care. 2004;42(8):801–809.
- , , , . Comorbidity measures for use with administrative data. Med Care. 1998;36(1):8–27.
- , . Epidemiology of sepsis: an update. Crit Care Med. 2001;29(7 suppl):S109–S116.
- , , , , , . Epidemiology and outcomes of acute renal failure in hospitalized patients: a national survey. Clin J Am Soc Nephrol. 2006;1(1):43–51.
- , , , . Facing the challenge: decreasing case fatality rates in severe sepsis despite increasing hospitalizations. Crit Care Med. 2005;33(11):2555–2562.
- , , , . National and regional trends in heart failure hospitalization and mortality rates for Medicare beneficiaries,1998–2008. JAMA. 2011;306(15):1669–1678.
- , , , et al. Outcomes of noninvasive ventilation for acute exacerbations of chronic obstructive pulmonary disease in the United States, 1998–2008. Am J Respir Crit Care Med. 2011;185(2):152–159.
- , , , et al. A trial of goal‐oriented hemodynamic therapy in critically ill patients. SvO2 Collaborative Group. N Engl J Med. 1995;333(16):1025–1032.
- , . Ventilation with lower tidal volumes as compared with traditional tidal volumes for acute lung injury. N Engl J Med. 2000;343(11):813; author reply 813–814.
- , , . Short‐ and long‐term survival of nonsurgical intensive care patients and its relation to diagnosis, severity of disease, age and comorbidities. Curr Aging Sci. 2009;2(3):240–248.
- , , , , , . The impact of COPD on management and outcomes of patients hospitalized with acute myocardial infarction—a ten‐year retrospective observational study. Chest. 2012;141(6):1441–1448.
- . The paradox of health. N Engl J Med. 1988;318(7):414–418.
- , , . Rehospitalizations among patients in the Medicare fee‐for‐service program. N Engl J Med. 2009;360(14):1418–1428.
- , , , et al. Outcomes and cost‐effectiveness of ventilator support and aggressive care for patients with acute respiratory failure due to pneumonia or acute respiratory distress syndrome. Am J Med. 2000;109(8):614–620.
- , , , et al. Older age, aggressiveness of care, and survival for seriously ill, hospitalized adults. SUPPORT Investigators. Study to Understand Prognoses and Preferences for Outcomes and Risks of Treatments. Ann Intern Med. 1999;131(10):721–728.
- , , , et al. Patient age and decisions to withhold life‐sustaining treatments from seriously ill, hospitalized adults. SUPPORT Investigators. Study to Understand Prognoses and Preferences for Outcomes and Risks of Treatment. Ann Intern Med. 1999;130(2):116–125.
- , , , et al. Are aggressive treatment strategies less cost‐effective for older patients? The case of ventilator support and aggressive care for patients with acute respiratory failure. J Am Geriatr Soc. 2001;49(4):382–390.
- , . Utilization of non‐invasive ventilation in patients with acute respiratory failure from 2000–2009: a population‐based study. Am J Respir Crit Care Med. 2012;185:A6488.
- , , , et al. One‐year outcomes in survivors of the acute respiratory distress syndrome. N Engl J Med. 2003;348(8):683–693.
Acute respiratory failure (ARF), a common and serious complication in hospitalized patients, may be caused by several conditions including pneumonia, chronic obstructive pulmonary disease (COPD), adult respiratory distress syndrome (ARDS), and congestive heart failure (CHF). Although ARF is conventionally defined by an arterial oxygen tension of <60 mm Hg, an arterial carbon dioxide tension of >45 mm Hg, or both, these thresholds serve as a guide to be used in combination with history and clinical assessment of the patient.[1, 2] Supplemental oxygen and treatment of the underlying cause is the mainstay of therapy for ARF, but in severe cases patients are treated with invasive mechanical ventilation (IMV) or noninvasive ventilation (NIV). ARF is the most frequent reason for admission to the intensive care unit (ICU)[3, 4] and has an in‐hospital mortality rate of 33% to 37% among those who require IMV.[5, 6] The majority of epidemiologic studies of ARF have been limited to patients requiring mechanical ventilation or those admitted to the ICU, and information about the characteristics and outcomes of patients across the full spectrum of severity is much more limited.[5, 7, 8, 9, 10, 11] General improvements in the management of underlying conditions, implementation of more effective ventilation strategies,[12, 13] and increasing use of NIV[14, 15] may have led to better outcomes for patients with ARF, yet empirical evidence of a change in the adjusted mortality rate over time is lacking.
The objective of this study was to provide a broad characterization of the epidemiology of ARF among adults hospitalized in the United States using a large nationally representative database. We sought to evaluate whether incidence, mortality, cost, or ventilation practice associated with ARF in the United States changed over the period of 2001 to 2009.
METHODS
Data Source
We utilized data from the Nationwide Inpatient Sample (NIS) of the Health Care Cost and Utilization Project,[16] which is a 20% stratified probability sample of all US acute‐care hospitals each year. These data are drawn from a sampling frame that contains close to 95% of all discharges in the United States, with the hospital discharge record as the unit of analysis. The NIS has been used to study trends in many different diagnoses.[17, 18, 19] The database contains demographic information, payer information, principal and secondary diagnoses, cost, discharge disposition, and death during hospitalization. It also contains information on hospital characteristics including ownership, size, teaching status, and geographic region.
Definitions
We included patients 18 years old discharged between 2001 and 2009 with a primary or secondary diagnosis of ARF. We identified cases of ARF using diagnostic codes (International Classification of Diseases, Ninth Revision, Clinical Modification [ICD‐9‐CM]) previously used in studies of acute organ dysfunction in sepsis (518.81, 518.82, 518.84, 518.4, 799.1, 786.09).[17, 20, 21] To define ARDS we relied on ICD‐9‐CM codes (518.4, 518.82, 518.5, 786.09) used in prior studies that showed good sensitivity and specificity.[22, 23] The use of ventilatory support was identified using the ICD‐9‐CM procedure codes[24] (93.90, 93.70, 93.71, 93.76). Comorbidities were classified using the Agency for Healthcare Research and Quality's (Rockville, MD) Healthcare Cost and Utilization Project's (HCUP) Comorbidity Software version 3.103.5.[25]
Outcomes
The primary outcomes included the annual number of hospitalizations, population incidence, hospital mortality, and costs of care. Secondary outcomes included length of stay, most common diagnoses associated with ARF, disposition at discharge, and use and type of ventilatory support.
Analysis
We estimated the number of hospitalizations with a diagnosis of ARF/year, and we calculated the weighted frequencies following HCUP‐NIS recommendations using SAS/STAT survey procedures. Using population estimates for the years 2001 to 2009 from the US Census Bureau, we employed direct standardization to calculate age‐, gender‐, and race‐adjusted population incidence and mortality rates of ARF per 100,000 population. Hospital mortality was defined as the ratio of ARF hospitalizations ending in death divided by total number of ARF hospitalizations. Mechanical ventilation rates and rates of selected comorbidities were similarly defined.
We employed indirect standardization to adjust hospital mortality rates for age, sex, race/ethnicity, comorbidities, and hospital characteristics using logistic regression models from 2001 to predict hospital mortality for 2002 to 2009. We used linear regression models to test whether the slope of year was significant for trends in outcomes overtime. Costs were calculated using hospital‐specific cost‐to‐charge ratios when available and a weighted group average at the state level for remaining hospitals. We converted all costs to 2009 US dollars using the Consumer Price Index. Costs and lengths of stay were not normally distributed, so we calculated weighted geometric means (the average of all logarithmic values), then converted back to a base‐10 number. Using a Taylor series expansion, we then calculated standard errors. All analyses were performed using SAS version 9.2 (SAS Institute, Inc., Cary, NC).
The Baystate Medical Center institutional review board determined that the project did not constitute human subjects research.
RESULTS
Hospitalization Trends
The number of hospitalizations with an ARF diagnosis code increased at an average annual rate of 11.3% from 1,007,549 (standard deviation [SD] = 19,268) in 2001 to 1,917,910 (SD = 47,558) in 2009. More than two‐thirds of ARF admissions were associated with medical, rather than surgical, conditions (69.5% in 2001 and 71.2% in 2009). The median age, racial make‐up, and gender did not change significantly. Over the study period we observed an increase in ARF‐related hospitalizations in large, urban, teaching hospitals and in hospitals located in the Midwest (Table 1).
| 2001 | 2003 | 2005 | 2007 | 2009 | |
|---|---|---|---|---|---|
| |||||
| Patient characteristics | |||||
| All, N (SD) | 1,007,549 (19,268) | 1,184,928 (25,542) | 1,288,594 (30,493) | 1,480,270 (32,002) | 1,917,910 (47,558) |
| Age, mean (SE), y | 66.6 (0.2) | 66.0 (0.2) | 66.1 (0.2) | 65.8 (0.2) | 65.8 (0.2) |
| Age group, % | |||||
| 1844 | 11.5 | 12.0 | 11.5 | 11.6 | 10.9 |
| 4564* | 26.7 | 28.9 | 29.6 | 30.7 | 31.7 |
| 6584* | 50.2 | 47.8 | 47.0 | 45.7 | 45.3 |
| 85+ | 11.5 | 11.4 | 11.9 | 12.0 | 12.1 |
| Male* | 48.1 | 48.2 | 48.6 | 49.3 | 49.2 |
| Race | |||||
| White | 75.8 | 71.9 | 76.5 | 71.8 | 73.4 |
| Black | 12.7 | 13.6 | 11.2 | 14.2 | 12.5 |
| Hispanic | 7.2 | 9.8 | 7.7 | 8.5 | 7.8 |
| Other | 4.2 | 4.7 | 4.7 | 5.5 | 6.3 |
| Primary ARF | 20.7 | 20.9 | 25.9 | 26.1 | 19.9 |
| Secondary ARF | 79.3 | 79.1 | 74.1 | 73.9 | 80.1 |
| Medical* | 69.5 | 69.1 | 69.9 | 70.2 | 71.2 |
| Surgical* | 30.5 | 30.8 | 30.1 | 29.8 | 28.8 |
| Hospital characteristics, % | |||||
| Number of beds | |||||
| Small | 10.0 | 10.1 | 10.5 | 10.8 | 11.3 |
| Medium | 25.2 | 25.3 | 24.6 | 24.0 | 22.7 |
| Large | 64.7 | 64.6 | 64.9 | 65.2 | 66.0 |
| Region | |||||
| South* | 18.5 | 18.5 | 17.6 | 17.0 | 16.3 |
| Midwest | 21.4 | 22.0 | 23.6 | 23.2 | 23.5 |
| Northeast | 42.6 | 41.7 | 41.4 | 42.2 | 42.1 |
| West* | 17.5 | 17.8 | 17.3 | 17.6 | 18.1 |
| Hospital type | |||||
| Rural | 13.6 | 13.0 | 11.8 | 11.0 | 10.8 |
| Urban nonteaching | 45.5 | 44.5 | 50.1 | 45.3 | 45.7 |
| Urban teaching | 40.9 | 42.5 | 38.1 | 43.7 | 43.6 |
| Patient outcomes | |||||
| Ventilation strategy | |||||
| IMV* | 48.5 | 48.4 | 47.5 | 46.5 | 42.1 |
| NIV* | 3.8 | 5.3 | 6.9 | 9.4 | 10.1 |
| IMV or NIV | 50.9 | 51.7 | 52.1 | 52.9 | 49.7 |
| Disposition | |||||
| Home/home healthcare* | 42.1 | 43.8 | 42.8 | 43.4 | 45.7 |
| Transfer to acute care | 5.2 | 4.7 | 4.6 | 4.6 | 4.4 |
| Nursing facility* | 24.4 | 24.9 | 27.4 | 28.6 | 29.0 |
| Other | 0.7 | 0.8 | 0.9 | 0.9 | 1.0 |
| Adjusted mortality, % (SE)* | 27.6 (0.3) | 26.4 (0.4) | 24.9 (0.4) | 22.7 (0.4) | 20.6 (0.3) |
| Adjusted mean, LOS/case, d (SE)* | 7.8 (0.1) | 7.9 (0.1) | 7.7 (0.1) | 7.5 (0.1) | 7.1 (0.1) |
| Adjusted mean cost/case, 2009 US$, (SE) | 15,818 (251) | 16,981 (419) | 17,236 (411) | 16,941 (436) | 15,987 (402) |
After adjusting for age and sex, the population incidence of ARF increased from 502 (standard error [SE] = 10) cases per 100,000 in 2001 to 784 (SE = 19) cases per 100,000 in 2009 (a 56% increase, P < 0.0001). Hispanics had the lowest rates of ARF, with both black and white groups having similar rates (Table 2).
| 2001 | 2003 | 2005 | 2007 | 2009 | |
|---|---|---|---|---|---|
| |||||
| All* | 502 (10) | 569 (12) | 595 (14) | 627 (14) | 784 (19) |
| Age group | |||||
| 1844* | 107 (3) | 130 (4) | 137 (4) | 153 (5) | 189 (6) |
| 4564* | 422 (9) | 500 (12) | 521 (13) | 580 (14) | 739 (19) |
| 6584* | 1697 (35) | 1863 (42) | 1950 (50) | 2066 (46) | 2578 (69) |
| 85+ | 3449 (86) | 3792 (106) | 3981 (120) | 3429 (97) | 4163 (123) |
| Sex | |||||
| Male* | 491 (10) | 553 (13) | 582 (14) | 629 (14) | 782 (20) |
| Female* | 512 (10) | 583 (12) | 607 (15) | 625 (13) | 786 (19) |
| Race/ethnicity | |||||
| White* | 398 (11) | 427 (12) | 466 (16) | 450 (13) | 699 (21) |
| Black* | 423 (27) | 513 (33) | 432 (26) | 574 (38) | 738 (37) |
| Hispanic* | 247 (24) | 381 (42) | 307 (27) | 353 (34) | 478 (42) |
| Other* | 268 (20) | 342 (29) | 347 (26) | 424 (29) | 713 (77) |
| In‐hospital mortality | 140 (3) | 148 (3) | 146 (3) | 140 (3) | 154 (4) |
The most common etiologies of ARF among medical patients were pneumonia, CHF, ARDS, COPD exacerbation, and sepsis. Over the 9‐year study, the proportion of cases secondary to pneumonia and sepsis rose significantly: from 39% to 46% and 13% to 21%, respectively (Figure 1).
Mortality and Other Outcomes
The number of in‐hospital deaths related to ARF increased from 277,407 deaths in 2001 to 381,155 in 2009 (a 37% increase, P < 0.001). Standardized to the population, deaths increased from 140 in 2001 to 154 cases per 100,000 in 2009 (a 10% increase, P = 0.027). Despite slightly increasing mortality rates at a population level, adjusted in‐hospital mortality improved from 27.6% in 2001 to 20.6% in 2009 (P < 0.001). Mortality declined for both IMV and NIV patients from 35.3% in 2001 to 30.2% in 2009 and from 23.5% to 19%, respectively, but increased for those who required both NIV and IMV (from 26.9% in 2001 to 28% in 2009).
Adjusted hospital length of stay decreased from 7.8 days per patient in 2001 to 7.1 days in 2009 (P < 0.001), with a concomitant increase in discharges to nursing facilities, from 24% in 2001 to 29% in 2009. There was no linear trend in adjusted cost per case, with $15,818 in 2001 and $15,987 in 2009 (in 2009 US dollars) (Table 1).
Ventilation Practices
Overall, 50.9% patients received ventilatory support (NIV or IMV or both) in 2001 and 49.7% in 2009 (P= 0.25). The use of NIV increased from 3.8% to 10.1% (P < 0.001), a 169% increase, whereas the utilization of IMV decreased from 48.5% in 2001 to 42.1% in 2009 (P for trend < 0.0001), a 13% decrease. Uses of both NIV and IMV during hospitalization were seen in 1.4% of cases in 2001 and 2.5% of cases in 2009.
2009 Data Analysis
In 2009 the 1,917,910 hospitalizations with ARF resulted in 381,155 (SD = 8965) deaths and a total inpatient cost of $54 billion. The most common etiologies in patients over 65 years old were pneumonia, CHF, COPD, ARDS, and sepsis. In patients younger than 45 years the most frequent diagnoses were pneumonia, ARDS, sepsis, asthma, drug ingestion, and trauma. Stratified analysis by gender and by age groups showed that mortality rates among men were higher than for women and were highest in patients older than 85 years (Table 3).
| Disease | Total | Age <45 Years | 4565 Years | 6584 Years | 85+ Years | Male | Female |
|---|---|---|---|---|---|---|---|
| |||||||
| Medical | |||||||
| Total, N (%) | 1,364,624 (71.2) | 144,715 (10.6) | 416,922 (30.6) | 615,009 (45.1) | 187,977 (13.8) | 647,894 (47.5) | 716,635 (52.5) |
| Pneumonia, %* | 46.1 | 41.7 | 42.8 | 46.9 | 54.3 | 48.8 | 43.7 |
| CHF, %* | 36.6 | 10.4 | 27.3 | 43.6 | 54.8 | 35.0 | 38.1 |
| ARDS, %* | 16.1 | 22.9 | 16.2 | 14.5 | 15.9 | 15.5 | 16.7 |
| Sepsis, %* | 21.2 | 18.1 | 21.3 | 21.3 | 23.1 | 22.8 | 19.8 |
| COPD, %* | 25.4 | 4.2 | 25.6 | 32.3 | 18.3 | 25.0 | 25.7 |
| AMI, %* | 9.0 | 2.6 | 7.1 | 10.5 | 13.3 | 9.3 | 8.8 |
| Asthma, %* | 9.2 | 18.1 | 11.6 | 6.7 | 5.4 | 6.2 | 12.0 |
| Stroke, %* | 4.8 | 2.3 | 4.1 | 5.5 | 6.0 | 5.0 | 4.7 |
| Trauma or burns, %* | 3.4 | 5.4 | 2.9 | 3.0 | 4.1 | 4.3 | 2.5 |
| Cardiorespiratory arrest, %* | 4.1 | 3.9 | 4.4 | 4.1 | 3.8 | 4.6 | 3.7 |
| Drug, %* | 3.7 | 16.6 | 5.1 | 0.8 | 0.3 | 3.8 | 3.6 |
| IMV, %* | 37.7 | 54.6 | 43.7 | 33.5 | 24.8 | 41.1 | 34.5 |
| NIV, %* | 11.9 | 7.1 | 11.5 | 13.0 | 12.7 | 11.4 | 12.3 |
| In‐hospital mortality (CI) | 22 (21.322.7) | 12.9 (11.913.9) | 18.5 (17.619.4) | 23.9 (23.024.9) | 31.8 (30.633.1) | 24.2 (23.325.1) | 20.9 (20.121.7) |
| Surgical | |||||||
| Total, N (%) | 552971 (28.8) | 64983 (11.8) | 190225 (34.4) | 254336 (46) | 43426 (7.9) | 295660 (53.5) | 257287 (46.5) |
| Pneumonia, %* | 34.9 | 33.0 | 34.0 | 35.0 | 40.5 | 37.1 | 32.2 |
| CHF, %* | 27.2 | 8.9 | 21.7 | 33.3 | 42.6 | 26.7 | 27.7 |
| ARDS, %* | 45.5 | 51.5 | 45.2 | 44.7 | 42.7 | 45.0 | 46.1 |
| Sepsis, %* | 25.1 | 22.8 | 25.4 | 25.2 | 26.1 | 25.4 | 24.7 |
| COPD, %* | 8.2 | 1.1 | 7.4 | 10.8 | 7.5 | 8.3 | 8.1 |
| AMI, %* | 16.9 | 4.9 | 17.0 | 19.8 | 17.9 | 19.1 | 14.4 |
| Asthma, %* | 6.1 | 7.6 | 7.2 | 5.4 | 3.6 | 4.1 | 8.5 |
| Stroke, %* | 8.9 | 6.6 | 9.2 | 9.4 | 7.2 | 8.9 | 8.8 |
| Trauma or burns, %* | 12.2 | 26.5 | 9.6 | 9.2 | 20.3 | 13.8 | 10.4 |
| Cardiorespiratory arrest, %* | 5.5 | 4.4 | 6.0 | 5.4 | 5.2 | 6.1 | 4.7 |
| Drug, %* | 0.5 | 1.3 | 0.7 | 0.2 | 0.2 | 0.4 | 0.6 |
| IMV, %* | 52.9 | 57.1 | 54.3 | 51.3 | 50.0 | 54.5 | 51.0 |
| NIV, %* | 5.8 | 3.5 | 5.5 | 6.4 | 6.4 | 5.6 | 6.0 |
| In‐hospital mortality, % (CI) | 18.6 (17.819.5) | 10.7 (9.312.0) | 15.5 (14.216.8) | 20.8 (19.821.9) | 29.4 (27.831.1) | 19.0 (18.219.8) | 18.3 (17.319.2) |
When we examined ventilation practices among medical patients we found that patients older than 85 years, when compared to patients younger than 45 years, were less likely to be treated with IMV (25% vs 55%) and more likely to be treated with NIV (12.7% vs 7%). At the same time, the average cost per case was lowest among patients 85 years and older, and hospital costs per case fell sharply after age 70 years. Costs were considerably higher for those who did not survive during hospitalization, particularly for patients younger than 45 years (Figure 2).
DISCUSSION
In this large population‐based study, we found that the number of hospitalizations associated with a diagnosis of ARF almost doubled over a 9‐year period. In 2009 there were nearly 2 million hospitalizations with ARF in the United States, resulting in approximately 380,000 deaths and inpatient costs of over $54 billion. The population‐adjusted ARF hospitalization rates increased in all age groups, and patients 85 years and older had the highest age‐specific hospitalization rate. Although overall rates of mechanical ventilation (NIV or IMV) remained stable over the 9‐year period, there was an important shift away from IMV (which decreased from 48% in 2001 to 42% in 2009) toward NIV (which increased from 4% in 2001 to 10% in 2009). Overall, there was a significant increase in the number of total deaths despite a decline in adjusted in‐hospital mortality rates. In‐hospital mortality rates decreased for all cases of ARF regardless of ventilation choice.
The findings of this study mirror results of others that have shown that although the incidence of critical care illnesses like sepsis[17, 20, 21, 26] and acute renal failure[27] has increased over the last decade, in‐hospital mortality rates have decreased.[20, 21, 28] Our results also compliment the results of a recent study that looked at hospitalizations for noncardiogenic ARF, which observed a 3.7‐fold increase in the number of cases and a steady decline in case fatality.[11]
Most prior studies addressing the incidence of ARF have included only patients receiving mechanical ventilation. In 1994, the estimated number of cases of ARF requiring IMV was 329,766,[9] which increased to 790,257 in 2005.[10] In our study we found that in 2009, the number of patients with ARF hospitalizations with IMV increased to 806,538. The increase in the overall number of cases with ARF was mainly driven by a surge in cases of sepsis and pneumonia. Our findings are consistent with national trends over time in noncardiogenic ARF[11] and in conditions that predispose patients to ARF such as sepsis[17, 20, 28] and acute renal failure.[27] As the number of claims for ARF doubled and the number of deaths increased, we found that adjusted hospital mortality improved from 27.6% in 2001 to 20.6% in 2009. This decline in hospital mortality was observed among all patients groups, regardless of ventilation choice. The decline in overall case fatality is consistent with prior findings in noncardiogenic ARF,[11] sepsis,[17, 28] and CHF.[29]
There are a number of potential explanations for the reduction in mortality observed over the study period, including improvements in hospital management of the underlying conditions leading to ARF, an increase in the proportion of patients being treated with NIV,[30] and advances in the care of critically ill patients such as the use of low‐tidal volume ventilation.[31, 32] Another contributor may be an increase in the proportion of discharges to nursing facilities, although this change in discharge disposition cannot fully explain our findings. For example, from 2007 to 2009, mortality decreased by 2 percentage points, and nursing home discharges increased by only 0.4 percentage points. Growth and aging of the US population only partially explain the increase we observed in the incidence of ARF, as age‐ and sex‐adjusted population rates increased by 56% from 2001 to 2009. In addition, the NIS captures data on hospital discharges and not individual patients; thus, a patient may have had multiple admissions. Over the last decade adoption of a more intensive practice style has been associated with improved in‐hospital mortality,[33, 34] and although these patients may be living longer they may have multiple readmissions.[35, 36]
We also observed that older patients were less likely to be treated with IMV, had a higher mortality rate, and less expensive care. These results are consistent with other studies and suggest that the intensity of treatment decreases with increasing age, and decisions to withhold or withdraw life‐supporting treatments are more frequent in the elderly.[26, 37] Prior research has shown that severity of illness is more important than age on patients' prognosis,[38, 39] and aggressive treatment strategies are not less cost‐effective when provided to older patients.[40]
Another important finding of this study is the marked increase in the use of NIV paired with a modest reduction in the use of IMV in the treatment of patients with ARF. This finding adds to evidence from other studies, which have similarly reported a dramatic increase in the use of NIV and a decrease in the use of IMV in patients with COPD as well as in ARF of other etiologies.[30, 41]
Our work has several limitations. First, we identified ARF based on ICD‐9‐CM codes and therefore cannot exclude disease misclassification. We did not find any studies in the literature addressing the accuracy and the completeness of ARF coding. However, we employed the same codes used to define ARF as has been used to define organ dysfunction in studies of severe sepsis,[17, 20] and the ICD‐9‐CM codes that we used to identify cases of ARDS have been used in prior studies.[11, 22, 23] Another limitation is that it is not clear to what extent the trends we observed may be due to changes over time in documentation and coding practices. Although this should be considered given the additional reimbursement associated with the diagnosis of ARF, our observation that rates of assisted ventilation have remained almost flat over the 9‐year period of the study suggest that would not wholly account for the rise in ARF. Second, because we did not have access to physiological data such as results of blood gas testing, we could not determine whether the threshold for applying the diagnosis of ARF or for delivering ventilatory support has changed over time. Third, for the purpose of this study we employed a broad definition of ARF, not limiting cases to those requiring mechanical ventilation, and this led to a more heterogeneous cohort including less severe cases of ARF. However, this is not dissimilar to the heterogeneity in disease severity observed among patients who receive a diagnosis of heart failure or acute renal failure. Fourth, survivors of ARF remain at high risk of death in the months after hospitalization,[42] but we assessed only in‐hospital mortality. It is possible that although in‐hospital mortality has improved, 30‐day mortality remained stable. Finally, as the NIS contains only discharge‐level data, we could not distinguish between patients admitted for ARF from those who developed ARF (potentially iatrogenic) after admission.
In summary, over the period of 2001 to 2009, there was a large increase in the number of patients given a diagnosis of ARF and a concomitant reduction in inpatient mortality. Although rates of mechanical ventilation remained relatively constant, there was a significant shift toward greater use of NIV at the expense of IMV.
Disclosures
Dr. Stefan is supported by KM1 CA156726 from the National Cancer Institute (NCI) and by the National Center for Research Resources and the National Center for Advancing Translational Sciences, National Institutes of Health (NIH), through grant UL1 RR025752. The work on this study was supported by a Charlton grant from Tufts University School of Medicine. Dr. Lindenauer and Dr. Pekow are supported by 1R18HL108810‐01 from the National Heart, Lung, and Blood Institute (NHLBI). The content of this publication is solely the responsibility of the authors and does not represent the official views of the NIH, NHLBI, or NCI.
All authors have read and approved the manuscript and none of them have any potential conflicts of interest to report.
Dr. Stefan had full access to all of the data in the study and takes responsibility for the integrity of the data and the accuracy of the data analysis. Conception and design: Mihaela S. Stefan, Penelope S. Pekow, Michael B. Rothberg, Jay Steingrub, Peter K. Lindenauer; analysis and interpretation: Meng‐Shiou Shieh, Mihaela S. Stefan, Penelope S. Pekow, Michael B. Rothberg, Tara Lagu, Peter K. Lindenauer; drafting the manuscript for important intellectual content: Mihaela S. Stefan, Penelope S. Pekow, Michael B. Rothberg, Jay Steingrub, Tara Lagu, and Peter K. Lindenauer.
- , . Goldman's Cecil Medicine. 24th ed. Amsterdam, the Netherlands: Elsevier Inc.; 2012.
- , . Textbook of Respiratory Medicine. 5th ed. Philadelphia, PA: Saunders; 2010.
- , , . Epidemiology and outcome of acute respiratory failure in intensive care unit patients. Crit Care Med. 2003;31(4 suppl):S296–S299.
- , , , et al. Epidemiology of critical care syndromes, organ failures, and life‐support interventions in a suburban US community. Chest. 2011;140(6):1447–1455.
- , , , , . The changing epidemiology of mechanical ventilation: a population‐based study. J Intensive Care Med. 2006;21(3):173–182.
- , , , , . Mechanical ventilation in Ontario, 1992–2000: incidence, survival, and hospital bed utilization of noncardiac surgery adult patients. Crit Care Med. 2004;32(7):1504–1509.
- . Contributions to the epidemiology of acute respiratory failure. Crit Care. 2003;7(4):288–290.
- , , , et al. Incidence, severity, and mortality of acute respiratory failure in Berlin, Germany. Am J Respir Crit Care Med. 1995;151(4):1121–1125.
- . Acute respiratory failure in the United States: incidence and 31‐day survival. Chest. 2000;118(4):1100–1105.
- , , , , , . The epidemiology of mechanical ventilation use in the United States. Crit Care Med. 2010;38(10):1947–1953.
- , , , . Trends in the incidence of noncardiogenic acute respiratory failure: the role of race. Crit Care Med. 2012;40(5):1532–1538.
- , , , , . Secular trends in nosocomial infections and mortality associated with noninvasive ventilation in patients with exacerbation of COPD and pulmonary edema. JAMA. 2003;290(22):2985–2991.
- , , , et al. Association of noninvasive ventilation with nosocomial infections and survival in critically ill patients. JAMA. 2000;284(18):2361–2367.
- , , , , . Noninvasive versus conventional mechanical ventilation. An epidemiologic survey. Am J Respir Crit Care Med. 2001;163(4):874–880.
- , , , , , . Does noninvasive ventilation reduce the ICU nosocomial infection risk? A prospective clinical survey. Intensive Care Med. 1999;25(6):567–573.
- Heathcare Cost and Utilization Project (HCUP). Overview of the Nationwide Inpatient Sample. Available at: http://www.hcup‐us.ahrq.gov/nisoverview.jsp. Accessed December 6, 2011.
- , , , , , . Hospitalizations, costs, and outcomes of severe sepsis in the United States 2003 to 2007. Crit Care Med. 2011;40(3):754–761.
- , , , , . Association of diagnostic coding with trends in hospitalizations and mortality of patients with pneumonia, 2003–2009. JAMA. 2012;307(13):1405–1413.
- , , , , . Little evidence of correlation between growth in health care spending and reduced mortality. Health Aff (Millwood). 2010;29(8):1523–1531.
- , , , . The epidemiology of sepsis in the United States from 1979 through 2000. N Engl J Med. 2003;348(16):1546–1554.
- , , , . Rapid increase in hospitalization and mortality rates for severe sepsis in the United States: a trend analysis from 1993 to 2003. Crit Care Med. 2007;35(5):1244–1250.
- , , . Risk factors for ARDS in the United States: analysis of the 1993 National Mortality Followback Study. Chest. 2001;119(4):1179–1184.
- , , , , , . Acute respiratory distress syndrome: estimated incidence and mortality rate in a 5 million‐person population base. Crit Care. 1998;2(1):29–34.
- , , . Validity of procedure codes in International Classification of Diseases, 9th Revision, Clinical Modification administrative data. Med Care. 2004;42(8):801–809.
- , , , . Comorbidity measures for use with administrative data. Med Care. 1998;36(1):8–27.
- , . Epidemiology of sepsis: an update. Crit Care Med. 2001;29(7 suppl):S109–S116.
- , , , , , . Epidemiology and outcomes of acute renal failure in hospitalized patients: a national survey. Clin J Am Soc Nephrol. 2006;1(1):43–51.
- , , , . Facing the challenge: decreasing case fatality rates in severe sepsis despite increasing hospitalizations. Crit Care Med. 2005;33(11):2555–2562.
- , , , . National and regional trends in heart failure hospitalization and mortality rates for Medicare beneficiaries,1998–2008. JAMA. 2011;306(15):1669–1678.
- , , , et al. Outcomes of noninvasive ventilation for acute exacerbations of chronic obstructive pulmonary disease in the United States, 1998–2008. Am J Respir Crit Care Med. 2011;185(2):152–159.
- , , , et al. A trial of goal‐oriented hemodynamic therapy in critically ill patients. SvO2 Collaborative Group. N Engl J Med. 1995;333(16):1025–1032.
- , . Ventilation with lower tidal volumes as compared with traditional tidal volumes for acute lung injury. N Engl J Med. 2000;343(11):813; author reply 813–814.
- , , . Short‐ and long‐term survival of nonsurgical intensive care patients and its relation to diagnosis, severity of disease, age and comorbidities. Curr Aging Sci. 2009;2(3):240–248.
- , , , , , . The impact of COPD on management and outcomes of patients hospitalized with acute myocardial infarction—a ten‐year retrospective observational study. Chest. 2012;141(6):1441–1448.
- . The paradox of health. N Engl J Med. 1988;318(7):414–418.
- , , . Rehospitalizations among patients in the Medicare fee‐for‐service program. N Engl J Med. 2009;360(14):1418–1428.
- , , , et al. Outcomes and cost‐effectiveness of ventilator support and aggressive care for patients with acute respiratory failure due to pneumonia or acute respiratory distress syndrome. Am J Med. 2000;109(8):614–620.
- , , , et al. Older age, aggressiveness of care, and survival for seriously ill, hospitalized adults. SUPPORT Investigators. Study to Understand Prognoses and Preferences for Outcomes and Risks of Treatments. Ann Intern Med. 1999;131(10):721–728.
- , , , et al. Patient age and decisions to withhold life‐sustaining treatments from seriously ill, hospitalized adults. SUPPORT Investigators. Study to Understand Prognoses and Preferences for Outcomes and Risks of Treatment. Ann Intern Med. 1999;130(2):116–125.
- , , , et al. Are aggressive treatment strategies less cost‐effective for older patients? The case of ventilator support and aggressive care for patients with acute respiratory failure. J Am Geriatr Soc. 2001;49(4):382–390.
- , . Utilization of non‐invasive ventilation in patients with acute respiratory failure from 2000–2009: a population‐based study. Am J Respir Crit Care Med. 2012;185:A6488.
- , , , et al. One‐year outcomes in survivors of the acute respiratory distress syndrome. N Engl J Med. 2003;348(8):683–693.
Copyright © 2012 Society of Hospital Medicine
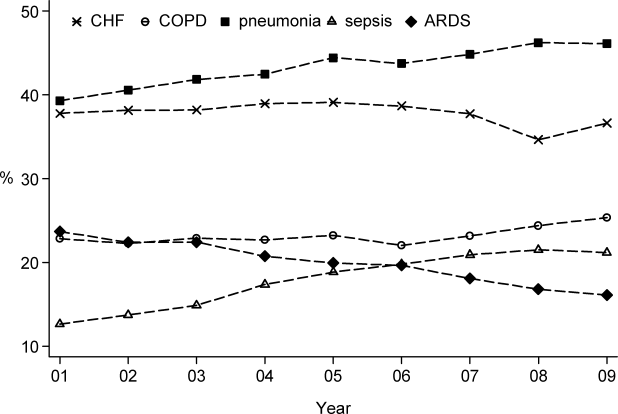
LMW vs UF Heparin
Venous thromboembolism (VTE) is a major source of morbidity and mortality for hospitalized patients, with as many as 16% of high‐risk medical patients developing VTE during their hospital stay.1, 2 Pharmacologic prophylaxis with subcutaneous heparin reduces the risk of VTE by approximately 50%,3, 4 and guidelines produced by the American College of Chest Physicians (ACCP) recommend thromboprophylaxis for patients at moderate‐to‐high risk of VTE with either low‐molecular‐weight heparin (LMWH) or unfractionated heparin (UFH).2 UFH is less expensive per dose, but meta‐analyses have suggested that UFH may be either less effective than LMWH3 or more likely to cause complications, such as bleeding5 or heparin‐induced thrombocytopenia (HIT).6 Others have argued that the efficacy and risk of bleeding with UFH and LMWH are similar.7, 8 In either case, there are few head‐to‐head studies of LMWH and UFH in medical patients and they tend to be small. In the most recent meta‐analysis, which included fewer than 4500 patients, several different low‐molecular‐weight heparins were assessed together, and the observed rate of deep vein thrombosis (DVT) with UFH was high (5.4%), with evidence suggesting publication bias.3
Given the current Joint Commission requirement9 that all medical patients either receive VTE prophylaxis or have documented a reason not to, the implications related to choosing one form of VTE prophylaxis over another are substantial on a national scale. In order to compare the effectiveness of UFH and LMWH in routine practice among hospitalized medical patients, we conducted a retrospective cohort study in a national sample of hospitals and compared the risk of VTE, bleeding, HIT, and death associated with each treatment.
METHODS
Setting and Patients
We conducted a retrospective cohort study of patients discharged between January 1, 2004 and June 30, 2005 from 333 acute care facilities in the United States that participated in Premier's Perspective, a database we have described previously.10 Compared to US hospitals as a whole, Perspective hospitals are more likely to be located in the South and in urban areas. Perspective contains the following data elements: sociodemographic information, International Classification of Diseases, Ninth Revision, Clinical Modification (ICD‐9‐CM) diagnosis and procedure codes, as well as a list of all billed items with a date of service, including diagnostic tests, medications, and other treatments. Hospitals' characteristics include size, region, setting, and teaching status. The Institutional Review Board at Baystate Medical Center granted permission to conduct the study (#132280‐1).
We included general medical patients aged 18 years whose ICD‐9‐CM primary diagnosis code (congestive heart failure, stroke, pneumonia, and urinary tract infection) placed them at moderate‐to‐high risk of VTE according to the ACCP recommendations,2 and who received daily prophylactic dosages of either LMWH (40 mg daily) or UFH (10,00015,000 units daily) initiated by hospital day 2 and continued to discharge or until the patient developed a VTE or a complication attributable to heparin. Patients were included so long as they missed no more than 1 day of prophylaxis or had no more than 1 unusual dose recorded. Patients who switched between heparin types were included and analyzed according to their initial therapy. Patients who received any other regimen were excluded. We also excluded patients who received warfarin on hospital day 1 or 2, because they would not be considered candidates for heparin prophylaxis, and patients whose length of stay was 2 days, because the value of VTE prophylaxis in such cases is unknown.
Data Elements
For each patient, we extracted age, gender, race, and insurance status, principal diagnosis, comorbidities, and specialty of the attending physician. Comorbidities were identified from ICD‐9‐CM secondary diagnosis codes and Diagnosis Related Groups using Healthcare Cost and Utilization Project Comorbidity Software, version 3.1, based on the work of Elixhauser and colleagues.11 We also identified additional risk factors for VTE using a combination of ICD‐9‐CM codes and specific charges. These included cancer, chemotherapy/radiation, prior VTE, use of estrogens and estrogen modulators, inflammatory bowel disease, nephrotic syndrome, myeloproliferative disorders, smoking, central venous catheter, inherited or acquired thrombophilia, mechanical ventilation, urinary catheter, decubitus ulcer, 3‐hydroxy‐3‐methylglutaryl coenzyme A (HMG‐CoA) reductase inhibitors, restraints, and varicose veins. Hospitals were categorized by region (Northeast, South, Midwest, or West), bed size, setting (urban vs rural), and teaching status.
Outcome Variables
We defined hospital‐acquired VTE as a secondary diagnosis of VTE (ICD‐9‐CM diagnoses 453.4, 453.40, 453.41, 453.42, 453.8, 453.9, 415.1, 415.11, 415.19), combined with a diagnostic test for VTE (lower extremity ultrasound, venography, computed tomography (CT) angiogram, ventilation‐perfusion scan, or pulmonary angiogram) after hospital day 2, followed by treatment for VTE (intravenous unfractionated heparin, >60 mg of enoxaparin, 7500 mg of dalteparin, or placement of an inferior vena cava filter) for at least 50% of the remaining hospital days or until initiation of warfarin or appearance of a complication (eg, transfusion or treatment for heparin‐induced thrombocytopenia). We chose this definition to differentiate hospital‐acquired VTE from VTE present on admission.12 In addition, patients who were readmitted within 30 days of discharge with a primary diagnosis of VTE were also considered to have hospital‐acquired VTE.
We also assessed complications of VTE prophylaxis. Major bleeding was defined as the receipt of 2 or more units of packed red blood cells on a single day or a secondary diagnosis of intracranial bleeding. Because there was no ICD‐9‐CM code for HIT, we assessed codes for all thrombocytopenia, as well as secondary thrombocytopenia. Definite HIT was defined as an ICD‐9‐CM code for thrombocytopenia, together with discontinuation of heparin and initiation of treatment with argatroban. A definite complication was defined as HIT or evidence of major bleeding coupled with discontinuation of heparin. Finally, we evaluated all‐cause in‐hospital mortality and total hospital costs.
Statistical Analysis
We computed summary statistics using frequencies and percents for categorical variables, and means, medians, and standard deviations and interquartile range for continuous variables. Associations of prophylaxis type with patient and hospital characteristics and outcomes were assessed using chi‐square tests or Fisher's exact test for categorical variables, and z‐tests or Wilcoxon tests for continuous variables.
We developed a propensity model for treatment with UFH as the outcome; the model included patient characteristics, early treatments, comorbidities, risk factors for VTE, physician specialty, and selected interaction terms. We then developed a series of multivariable models to evaluate the impact of heparin choice on the risk of VTE, complications of treatment, mortality, and total cost. Generalized estimating equation models with a logit link were used to assess the association between the choice of heparin and the risk of VTE, and of complications and mortality, while adjusting for the effects of within‐hospital correlation; identity link models were used for analyses of cost. Costs were trimmed at 3 standard deviations above the mean, and natural log‐transformed values were modeled due to extreme positive skew.
Unadjusted and covariate‐adjusted models were evaluated with and without adjustments for propensity score. In addition, since the hospital was the single strongest predictor of treatment, we developed grouped treatment models, in which a patient's actual treatment was replaced by a probability equal to the proportion of prophylaxed patients receiving UFH at that hospital. This adaptation of instrumental variable analysis uses the hospital as the instrument, and attempts to assess whether patients treated at a hospital which uses UFH more frequently have outcomes that differ from those of patients treated at hospitals which use LMWH more frequently, while adjusting for other patient, physician, and hospital variables. By relying on treatment at the hospital level, this method reduces the opportunity for selection bias at the patient level.
Finally, in order to exclude the possibility that our surrogate bleeding outcome was due to transfusion practices at hospitals that use a particular form of heparin, we compared the hospital rates of transfusion of 2 or more units of packed red cells to the hospital rates of prophylaxis with UFH in a larger dataset of the same hospitals. This set included patients with congestive heart failure, stroke, pneumonia, and urinary tract infection who did not receive daily prophylaxis, as well as patients admitted for chronic obstructive pulmonary disease (COPD) or acute myocardial infarction, and patients who received either warfarin or a treatment dose of heparin in the first 2 hospital days. We also compared the transfusion rates at hospitals that used unfractionated heparin in 80% of patients to hospitals that used LMWH in 80%. All analyses were performed using SAS version 9.1 (SAS Institute Inc, Cary, NC).
RESULTS
Our final sample included 32,104 patients who received prophylaxis at 333 hospitals (see Supporting Information, e‐Figure, in the online version of this article). Patient characteristics appear in Table 1. Most patients (66%) were over age 65; 59% were female and 61% were white. The most common primary diagnoses were pneumonia (40%) and congestive heart failure (25%). Additional risk factors for thromboembolism included cancer (13%), paralysis (8%), or diabetes (35%). Most patients' attending physicians were either internists (61%) or family practitioners (14%). Almost half of the patients were cared for at hospitals in the South (46%).
| Total | UFH | LMWH | ||
|---|---|---|---|---|
| 32,104 (100) | 14,591 (45.4) | 17,513 (54.6) | ||
| N (%) | N (%) | N (%) | P | |
| ||||
| Demographics | ||||
| Age | 0.0002 | |||
| 1849 | 4,061 (12.7) | 1,950 (13.4) | 2,111 (12.1) | |
| 5064 | 6,962 (21.7) | 3,225 (22.1) | 3,737 (21.3) | |
| 6579 | 10,909 (34.0) | 4,921 (33.7) | 5,988 (34.2) | |
| 80+ | 10,172 (31.7) | 4,495 (30.8) | 5,677 (32.4) | |
| Sex | 0.0071 | |||
| Male | 13,234 (41.2) | 6,133 (42.0) | 7,101 (40.5) | |
| Female | 18,870 (58.8) | 8,458 (58.0) | 10,412 (59.5) | |
| Race/ethnicity | <0.0001 | |||
| White | 19,489 (60.7) | 8,063 (55.3) | 11,426 (65.2) | |
| Black | 7,429 (23.1) | 4,101 (28.1) | 3,328 (19.0) | |
| Hispanic | 1,304 (4.1) | 591 (4.1) | 713 (4.1) | |
| Other | 3,882 (12.1) | 1,836 (12.6) | 2,046 (11.7) | |
| Primary diagnosis | <0.0001 | |||
| Pneumonia | 12,768 (39.8) | 5,354 (36.7) | 7,414 (42.3) | |
| Sepsis* | 1,217 (3.8) | 562 (3.9) | 655 (3.7) | |
| Respiratory failure* | 2,017 (6.3) | 814 (5.6) | 1,203 (6.9) | |
| Heart failure | 8,157 (25.4) | 3,825 (26.2) | 4,332 (24.7) | |
| Stroke | 4,416 (13.8) | 2,295 (15.7) | 2,121 (12.1) | |
| Urinary tract infection | 3,529 (11.0) | 1,741 (11.9) | 1,788 (10.2) | |
| Attending specialty | <0.0001 | |||
| Internist | 19,511 (60.8) | 8,945 (61.3) | 10,566 (60.3) | |
| General practice/Family medicine | 4,326 (13.5) | 1,964 (13.5) | 2,362 (13.5) | |
| Cardiologist | 1,606 (5.0) | 730 (5.0) | 876 (5.0) | |
| Pulmonologist | 2,179 (6.8) | 854 (5.9) | 1,325 (7.6) | |
| Nephrology | 583 (1.8) | 380 (2.6) | 203 (1.2) | |
| Critical care/Intensivist | 150 (0.5) | 93 (0.6) | 57 (0.3) | |
| Other | 3,749 (11.7) | 1,625 (11.1) | 2,124 (12.1) | |
| Insurance | <0.0001 | |||
| Medicare traditional | 20,281 (63.2) | 8,929 (61.2) | 11,352 (64.8) | |
| Medicare managed care | 1,737 (5.4) | 826 (5.7) | 911 (5.2) | |
| Medicaid | 2,629 (8.2) | 1,401 (9.6) | 1,228 (7.0) | |
| Private | 5,967 (18.6) | 2,830 (19.4) | 3,137 (17.9) | |
| Self‐pay/uninsured/other | 1,490 (4.6) | 605 (4.1) | 885 (5.1) | |
| Risk factors for VTE | ||||
| Admit from skilled nursing facility | 476 (1.5) | 277 (1.9) | 199 (1.1) | <0.0001 |
| Paralysis | 2,608 (8.1) | 1,317 (9.0) | 1,291 (7.4) | <0.0001 |
| Restraints | 417 (1.3) | 147 (1.0) | 270 (1.5) | <0.0001 |
| Decubitus ulcer | 1,190 (3.7) | 631 (4.3) | 559 (3.2) | <0.0001 |
| Cancer | 4,154 (12.9) | 1,858 (12.7) | 2,296 (13.1) | 0.3171 |
| Chemotherapy | 86 (0.3) | 41 (0.3) | 45 (0.3) | 0.6781 |
| Prior venous thromboembolism | 494 (1.5) | 202 (1.4) | 292 (1.7) | 0.0403 |
| Pregnancy | 1 (0) | 1 (0) | 0 (0) | 0.2733 |
| Estrogens | 438 (1.4) | 143 (1.0) | 295 (1.7) | <0.0001 |
| Estrogen modulators | 246 (0.8) | 80 (0.5) | 166 (0.9) | <0.0001 |
| Congestive heart failure | 3,107 (9.7) | 1,438 (9.9) | 1,669 (9.5) | 0.3263 |
| Respiratory failure | 2,210 (6.9) | 1,037 (7.1) | 1,173 (6.7) | 0.1493 |
| Inflammatory bowel disease | 108 (0.3) | 41 (0.3) | 67 (0.4) | 0.1176 |
| Nephrotic syndrome | 92 (0.3) | 50 (0.3) | 42 (0.2) | 0.0860 |
| Myeloproliferative disorder | 198 (0.6) | 68 (0.5) | 130 (0.7) | 0.0016 |
| Obesity | 2,973 (9.3) | 1,211 (8.3) | 1,762 (10.1) | <0.0001 |
| Smoking | 4,476 (13.9) | 1,887 (12.9) | 2,589 (14.8) | <0.0001 |
| Varicose veins | 19 (0.1) | 6 (0) | 13 (0.1) | 0.2245 |
| Central line | 1,070 (3.3) | 502 (3.4) | 568 (3.2) | 0.3271 |
| Inherited or acquired thrombophilia | 16 (0) | 9 (0.1) | 7 (0) | 0.3855 |
| Diabetes | 11,136 (34.7) | 5,157 (35.3) | 5,979 (34.1) | 0.0241 |
| Procedures associated with VTE or bleed | ||||
| Mechanical ventilation | 2,282 (7.1) | 1,111 (7.6) | 1,171 (6.7) | 0.0013 |
| Urinary catheter | 4,496 (14.0) | 1,545 (10.6) | 2,951 (16.9) | <0.0001 |
| Aspirin | 12,865 (40.1) | 6,101 (41.8) | 6,764 (38.6) | <0.0001 |
| Clopidogrel | 4,575 (14.3) | 2,087 (14.3) | 2,488 (14.2) | 0.8050 |
| Non‐steroidal anti‐inflammatory drugs | 2,147 (6.7) | 867 (5.9) | 1,280 (7.3) | <0.0001 |
| Steroids | 7,938 (24.7) | 3,136 (21.5) | 4,802 (27.4) | <0.0001 |
| Statins | 7,376 (23.0) | 3,462 (23.7) | 3,914 (22.3) | 0.0035 |
| Comorbidities | ||||
| AIDS | 124 (0.4) | 73 (0.5) | 51 (0.3) | 0.0026 |
| Alcohol abuse | 1,048 (3.3) | 523 (3.6) | 525 (3.0) | 0.0032 |
| Deficiency anemia | 7,010 (21.8) | 3,228 (22.1) | 3,782 (21.6) | 0.2543 |
| Rheumatoid arthritis/collagen vas | 967 (3.0) | 426 (2.9) | 541 (3.1) | 0.3762 |
| Chronic blood loss anemia | 177 (0.6) | 79 (0.5) | 98 (0.6) | 0.8269 |
| Chronic pulmonary disease | 12,418 (38.7) | 5,314 (36.4) | 7,104 (40.6) | <0.0001 |
| Depression | 3,334 (10.4) | 1433 (9.8) | 1901 (10.9) | 0.0025 |
| Drug abuse | 694 (2.2) | 412 (2.8) | 282 (1.6) | <0.0001 |
| Hypertension | 16,979 (52.9) | 7,658 (52.5) | 9,321 (53.2) | 0.1866 |
| Hypothyroidism | 4,016 (12.5) | 1,716 (11.8) | 2,300 (13.1) | 0.0002 |
| Liver disease | 453 (1.4) | 227 (1.6) | 226 (1.3) | 0.0448 |
| Other neurological disorders | 4,682 (14.6) | 2,202 (15.1) | 2,480 (14.2) | 0.0187 |
| Peripheral vascular disease | 2,134 (6.6) | 980 (6.7) | 1,154 (6.6) | 0.6490 |
| Psychoses | 1,295 (4.0) | 574 (3.9) | 721 (4.1) | 0.4066 |
| Pulmonary circulation disease | 1,034 (3.2) | 442 (3.0) | 592 (3.4) | 0.0760 |
| Renal failure | 2,794 (8.7) | 1,636 (11.2) | 1,158 (6.6) | 0.0000 |
| Peptic ulcer disease with bleeding | 563 (1.8) | 232 (1.6) | 331 (1.9) | 0.0414 |
| Valvular disease | 2,079 (6.5) | 899 (6.2) | 1,180 (6.7) | 0.0366 |
| Weight loss | 1,231 (3.8) | 556 (3.8) | 675 (3.9) | 0.8391 |
| Other prophylaxis | ||||
| Intermittent pneumatic compression | 1,003 (3.1) | 456 (3.1) | 547 (3.1) | 0.9926 |
| Mechanical prophylaxis | 1,281 (4.0) | 524 (3.6) | 757 (4.3) | 0.0009 |
Fifty‐five percent of patients received LMWH and the remainder received UFH; 1274 (4%) patients switched type of heparin during their stay. The proportion of patients receiving LMWH at an individual hospital varied from 0% to 100% with a u‐shaped distribution, with almost one‐third of hospitals prescribing one treatment or the other exclusively (Figure 1). Similarly, the proportion of an individual physician's patients who received prophylaxis with UFH (vs LMWH) varied from 0% to 100% (Figure 1), with 51% prescribing LMWH exclusively and 31% prescribing UFH exclusively. Compared to patients who received UFH, patients receiving LMWH were older and were more likely to be white, female, and to have pneumonia. By far the biggest difference between the groups was the hospitals at which they received their care (see Supporting Information, e‐Table, in the online version of this article). Patients receiving LMWH were much more likely to be from smaller, rural, non‐teaching hospitals in the South or the West. There were also numerous small differences in comorbidities and individual VTE risk factors between the 2 groups. The only large difference was that patients with a secondary diagnosis of renal failure (for which LMWH is not US Food and Drug Administration [FDA] approved) were almost twice as likely to receive UFH.
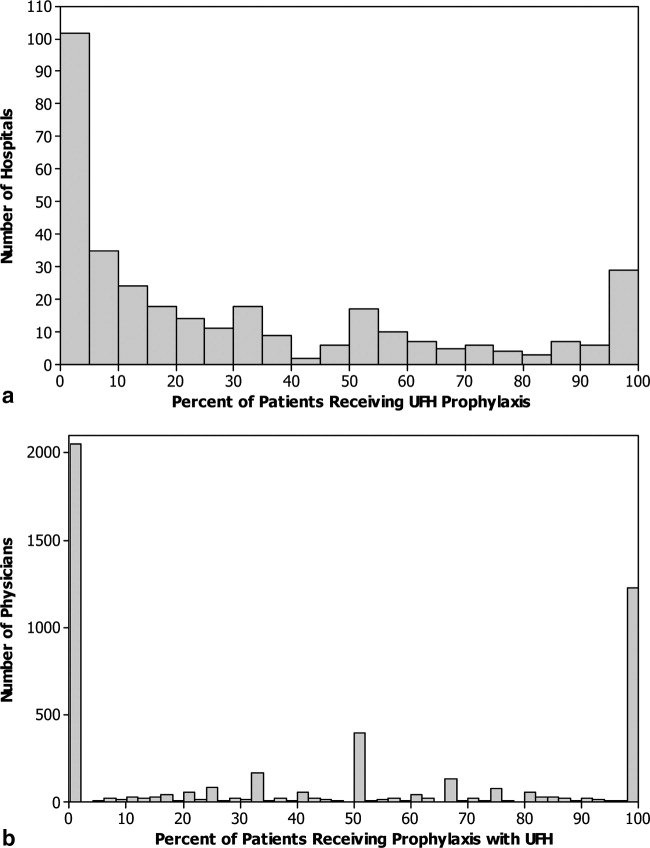
We identified 163 (0.51%) episodes of VTE (Table 2). Compared to patients receiving UFH, those receiving standard LMWH had similar unadjusted rates of VTE (0.53% vs 0.48%; P = 0.54), major bleeding (0.77% vs 0.76%; P = 0.88), thrombocytopenia (1.9% vs 2.0%; P = 0.48), definite HIT (n = 1 vs n = 3; P = 0.34), and mortality (2.8% vs 3.1%; P = 0.07). Definite complications of prophylaxis (HIT or major bleed combined with the discontinuation of heparin) were more common among patients receiving UFH (0.2% vs 0.1%; P = 0.022). Patients treated with UFH had longer unadjusted lengths of stay (P < 0.0001) and higher unadjusted costs (P < 0.0001).
| Total | UFH | LMWH | P | |
|---|---|---|---|---|
| 32,104 (100) | 14,591 (45.4) | 17,513 (54.6) | ||
| n (%) | n (%) | n (%) | ||
| ||||
| Venous thromboembolism | 163 (0.5) | 78 (0.5) | 85 (0.5) | 0.54 |
| Heparin‐induced thrombocytopenia | 4 (0) | 3 (0) | 1 (0) | 0.34* |
| Any major bleeding | 246 (0.8) | 113 (0.8) | 133 (0.8) | 0.88 |
| Transfusion with 2 units of packed red blood cells | 218 (0.7) | 97 (0.7) | 121 (0.7) | 0.78 |
| Intracranial hemorrhage | 30 (0.1) | 17 (0.1) | 13 (0.1) | 0.22 |
| Complication resulting in stopping heparin | 44 (0.1) | 28 (0.2) | 16 (0.1) | 0.02 |
| In‐hospital mortality | 944 (2.9) | 456 (3.1) | 488 (2.8) | 0.07 |
| LOS in days; mean (SD) | 6.2 (5.9) | 6.4 (6.2) | 6.0 (5.6) | <0.001 |
| Median (IQR) | 5 (37) | 5 (37) | 5 (37) | |
| Cost in USD; median (IQR) | 5873 (41718982) | 6007 (41779456) | 5774 (41658660) | <0.001 |
A propensity model for UFH treatment based upon patient characteristics and treatments was not strongly predictive of treatment (c = 0.58) and propensity matching failed to balance many of the patient characteristics. However, hospital alone, ignoring patient characteristics was strongly predictive (c = 0.91) of treatment.
In a model adjusting only for clustering within hospitals, patients treated with UFH had an odds ratio (OR) for VTE of 1.08 (95% confidence interval [CI] 0.79 to 1.49) compared to patients receiving LMWH (Figure 2). Adjustment for propensity for UFH and other covariates attenuated the effect of LMWH (OR 1.04, 95% CI 0.76 to 1.43). When individual patients were assigned a probability of treatment with UFH equal to the hospital rate where they received care, UFH use was associated with a nonsignificant change in the odds of VTE (OR 1.14, 95% CI 0.72 to 1.81).
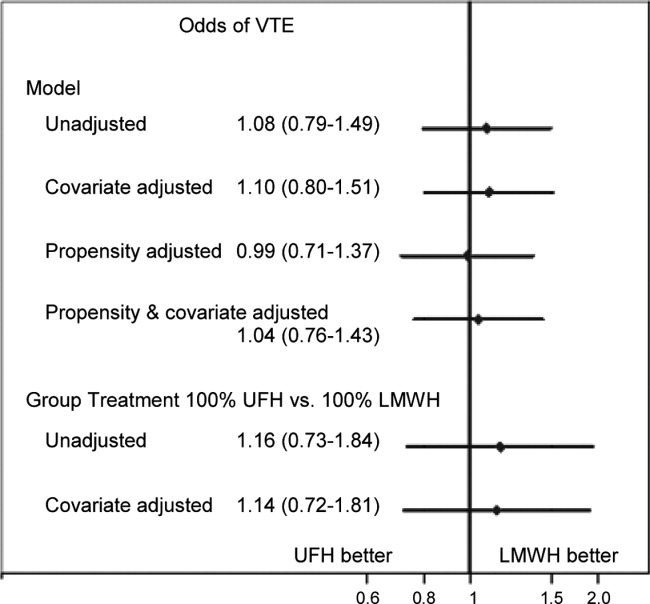
Adjusted for clustering within hospital only, patients treated with UFH had an odds ratio for major bleed of 1.38 (95% CI 1.00 to 1.91) compared to patients receiving LMWH (Figure 3). Adjustment for propensity for UFH and other covariates gave similar results (OR 1.34, 95% CI 0.97 to 1.84). When individual patients were assigned a probability of treatment with UFH equal to the hospital rate where they received care, UFH treatment was associated with a nonsignificant increase in the odds of major bleed (OR 1.64, 95% CI 0.50 to 5.33). When we compared the rate of transfusion across hospitals, including 576,231 additional patients who were excluded from the original analyses because they did not receive daily prophylaxis or had a diagnosis of myocardial infarction or COPD, there was a slight negative correlation between transfusion rates and use of UFH (Spearman Correlation Coefficient 0.03; P = 0.61). Hospitals that used primarily UFH had a transfusion rate of 0.60% versus 0.76% at hospitals using primarily LMWH (P = 0.54), indicating that the increased risk of major bleeding associated with UFH was not confounded by local transfusion practices.
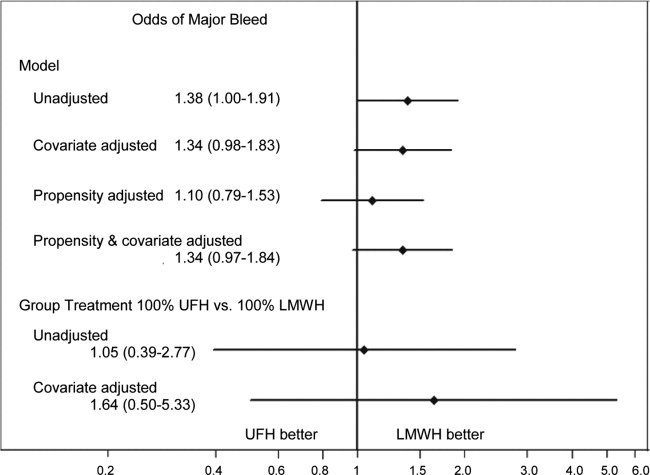
Adjusted for clustering only, patients treated with UFH had an odds ratio for definite complication of 2.35 (95% CI 1.17 to 4.72) compared to those treated with LMWH. Adjustment for propensity and covariates accentuated the association (OR 2.84, 95% CI 1.43 to 5.66). When assigned a probability of treatment with UFH equal to the hospital rate where they received care, UFH treatment was associated with an increase in the risk of definite complication (OR 2.79, 95% CI 1.00 to 7.74).
Adjusted for clustering only, patients treated with UFH had higher costs than those treated with LMWH (cost ratio 1.07, 95% CI 1.05 to 1.09). Adjustment for propensity for UFH and other covariates attenuated the association (cost ratio 1.02, 95% CI 1.00 to 1.03). Finally, when individual patients were assigned a probability of initial treatment with UFH equal to the hospital rate where they received care, treatment with UFH was associated with a nonsignificant change in the relative cost (cost ratio 0.97, 95% CI 0.90 to 1.05).
DISCUSSION
In this retrospective cohort study, we found that low‐molecular‐weight heparin and unfractionated heparin were associated with similar rates of VTE in moderate‐to‐high risk medical patients. However, unfractionated heparin was associated with a small, but higher risk of complications, even after adjustment. There were no statistical differences in rates of heparin‐induced thrombocytopenia, but this complication was exceedingly rare. Finally, overall costs associated with both treatments were similar.
A number of industry‐funded studies have compared LMWH to UFH in randomized clinical trials. These trials have generally been small and used endpoints of uncertain significance, such as asymptomatic deep vein thrombosis assessed by ultrasound. At least 3 meta‐analyses of these trials have been published. Each used different inclusion criteria. The only one to find an efficacy benefit to LMWH over UFH was heavily influenced by the inclusion of a number of studies of stroke patients.3 In that study, LMWH reduced VTE by approximately one‐third relative to UFH. The other 2 analyses found smaller reductions in DVT and pulmonary embolism (PE), and these results were not statistically significant.5, 8 Similarly, 1 analysis5 found a reduction in major bleeding events with LMWH versus UFH, whereas the other 2 studies found smaller reductions which were not statistically significant. The assessment of major bleeding is further complicated by differences in the definition of major bleeding across studies. Using a standard definition of 2 units of packed red blood cells transfused in 1 day to denote major bleeding, we found an associated reduction in bleeding with LMWH that was similar to that observed in the meta‐analyses. Moreover, patients receiving UFH were twice as likely to have a complication that resulted in stopping the prophylaxis, although these complications were overall quite rare. Lastly, there are no cost comparisons based on randomized trials. Several comparisons based on modeling have favored LMWH. One assumed that 3% of patients receiving UFH would develop HIT;13 something we did not observe. At least 3 additional analyses,1416 all funded by the manufacturer of enoxaparin, assumed that LMWH was both more effective and safer than UFH. We found that adjusted costs were similar or slightly lower with UFH than LMWH.
Our study has a number of limitations. First, its observational design makes it vulnerable to selection bias. We attempted to overcome this with rigorous multivariable adjustment, including the propensity for treatment and by using an adaptation of the instrumental variable approach. This method is of particular interest because individual hospitals were strongly predictive of choice of heparin. Still, we cannot exclude the possibility of residual confounding, especially if other outcomes, such as transfusion decisions, were also tied to specific hospital practices. Second, our study used administrative data, and therefore we could not directly adjust for certain differences which may exist between patients who received LMWH and those who received UFH. However, we did adjust for many classic risk factors for VTE. More importantly, it seems that the chance of being treated with a particular form of heparin depends more on the hospital where one receives care than on any combination of patient characteristics. Thus, apart from renal failure, for which we adjusted, it seems unlikely that there were major differences in unmeasured physiological confounders. Third, we limited our analysis to patients who received standard dosing of either type of heparin. We did this to bolster the validity of our findings, but they may not apply to unconventional dosing often observed in clinical practice. Fourth, we measured only outcomes that occurred in the hospital or that prompted a return to the hospital. VTEs which were diagnosed and treated in ambulatory care were not included. While this may have led us to underestimate the true risk of VTE, we have little reason to believe that the choice of whether to admit a patient with VTE is influenced by the original choice of VTE prophylaxis. Finally, our study was conducted before the introduction of generic LMWH, which would be expected to reduce costs associated with LMWH prophylaxis.
VTE prophylaxis for medical patients has emerged as a major focus for quality improvement initiatives. As a result, a significant proportion of general medical patients receive some form of chemoprophylaxis during their hospital stay. Small differences in efficacy or safety of different forms of prophylaxis multiplied by millions of admissions each year can have profound effects on the health of hospitalized patients. Similarly, differences in cost could also have a substantial impact on the healthcare system. We found no difference in efficacy or cost, but treatment with LMWH was less likely to be associated with subsequent transfusion of 2 or more units of packed red blood cells, a surrogate marker for bleeding. In addition, LMWH is more convenient since it can be dosed once daily, and for that reason may be more acceptable to patients. For these reasons, LMWH may be the drug of choice for inpatient prophylaxis of general medical patients. In situations where the cost of the medication itself is important, UFH represents an equally effective alternative.
Acknowledgements
All authors have contributed sufficiently to this study and have provided written permission to be named in the manuscript. No other persons have made substantial contributions to this manuscript. Michael B. Rothberg is the guarantor of the entire manuscript.
Disclosures: This study was supported by a Clinical Scientist Development Award from the Doris Duke Charitable Foundation. The funding source had no role in the study design, analysis, or interpretation of the data. Dr Rothberg served for 1 day as a consultant to Novartis Pharma about an influenza vaccine model. Sandoz, a division of Novartis, was recently granted approval to manufacture a generic form of low‐molecular‐weight heparin. None of the other authors have any conflicts of interest.
- ,,, et al.A comparison of enoxaparin with placebo for the prevention of venous thromboembolism in acutely ill medical patients. Prophylaxis in Medical Patients with Enoxaparin Study Group.N Engl J Med.1999;341:793–800.
- ,,, et al.Prevention of venous thromboembolism: American College of Chest Physicians Evidence‐Based Clinical Practice Guidelines (8th Edition).Chest.2008;133:381S–453S.
- ,,,,.Pharmacological venous thromboembolism prophylaxis in hospitalized medical patients: a meta‐analysis of randomized controlled trials.Arch Intern Med.2007;167:1476–1486.
- ,,,,.Meta‐analysis: anticoagulant prophylaxis to prevent symptomatic venous thromboembolism in hospitalized medical patients.Ann Intern Med.2007;146:278–288.
- ,,, et al.Prevention of venous thromboembolism in internal medicine with unfractionated or low‐molecular‐weight heparins: a meta‐analysis of randomised clinical trials.Thromb Haemost.2000;83:14–19.
- ,,.Risk for heparin‐induced thrombocytopenia with unfractionated and low‐molecular‐weight heparin thromboprophylaxis: a meta‐analysis.Blood.2005;106:2710–2715.
- ,.A safety analysis of thromboprophylaxis in acute medical illness.Thromb Haemost.2003;89:590–591.
- ,,,,.How complete is the evidence for thromboembolism prophylaxis in general medicine patients? A meta‐analysis of randomized controlled trials.J Hosp Med.2009;4:289–297.
- The Joint Commission on the Accreditation of Healthcare Organizations. Venous Thromboembolism (VTE) Core Measure Set. Available at: http://www.jointcommission.org/PerformanceMeasurement/PerformanceMeasurement/VTE.htm. Accessed June 1,2009.
- ,,, et al.Potentially inappropriate medication use in hospitalized elders.J Hosp Med.2008;3:91–102.
- ,,,.Comorbidity measures for use with administrative data.Med Care.1998;36:8–27.
- ,,,,,.Identification of in‐hospital complications from claims data. Is it valid?Med Care.2000;38:785–795.
- ,,,.Cost utility of substituting enoxaparin for unfractionated heparin for prophylaxis of venous thrombosis in the hospitalized medical patient.J Hosp Med.2006;1:168–176.
- ,,,.Cost effectiveness of thromboprophylaxis with a low‐molecular‐weight heparin versus unfractionated heparin in acutely ill medical inpatients.Am J Manag Care.2004;10:632–642.
- ,,,.Comparison of the two‐year outcomes and costs of prophylaxis in medical patients at risk of venous thromboembolism.Thromb Haemost.2008;100:810–820.
- ,,, et al.Cost effectiveness of enoxaparin as prophylaxis against venous thromboembolic complications in acutely ill medical inpatients: modelling study from the hospital perspective in Germany.Pharmacoeconomics.2006;24:571–591.
Venous thromboembolism (VTE) is a major source of morbidity and mortality for hospitalized patients, with as many as 16% of high‐risk medical patients developing VTE during their hospital stay.1, 2 Pharmacologic prophylaxis with subcutaneous heparin reduces the risk of VTE by approximately 50%,3, 4 and guidelines produced by the American College of Chest Physicians (ACCP) recommend thromboprophylaxis for patients at moderate‐to‐high risk of VTE with either low‐molecular‐weight heparin (LMWH) or unfractionated heparin (UFH).2 UFH is less expensive per dose, but meta‐analyses have suggested that UFH may be either less effective than LMWH3 or more likely to cause complications, such as bleeding5 or heparin‐induced thrombocytopenia (HIT).6 Others have argued that the efficacy and risk of bleeding with UFH and LMWH are similar.7, 8 In either case, there are few head‐to‐head studies of LMWH and UFH in medical patients and they tend to be small. In the most recent meta‐analysis, which included fewer than 4500 patients, several different low‐molecular‐weight heparins were assessed together, and the observed rate of deep vein thrombosis (DVT) with UFH was high (5.4%), with evidence suggesting publication bias.3
Given the current Joint Commission requirement9 that all medical patients either receive VTE prophylaxis or have documented a reason not to, the implications related to choosing one form of VTE prophylaxis over another are substantial on a national scale. In order to compare the effectiveness of UFH and LMWH in routine practice among hospitalized medical patients, we conducted a retrospective cohort study in a national sample of hospitals and compared the risk of VTE, bleeding, HIT, and death associated with each treatment.
METHODS
Setting and Patients
We conducted a retrospective cohort study of patients discharged between January 1, 2004 and June 30, 2005 from 333 acute care facilities in the United States that participated in Premier's Perspective, a database we have described previously.10 Compared to US hospitals as a whole, Perspective hospitals are more likely to be located in the South and in urban areas. Perspective contains the following data elements: sociodemographic information, International Classification of Diseases, Ninth Revision, Clinical Modification (ICD‐9‐CM) diagnosis and procedure codes, as well as a list of all billed items with a date of service, including diagnostic tests, medications, and other treatments. Hospitals' characteristics include size, region, setting, and teaching status. The Institutional Review Board at Baystate Medical Center granted permission to conduct the study (#132280‐1).
We included general medical patients aged 18 years whose ICD‐9‐CM primary diagnosis code (congestive heart failure, stroke, pneumonia, and urinary tract infection) placed them at moderate‐to‐high risk of VTE according to the ACCP recommendations,2 and who received daily prophylactic dosages of either LMWH (40 mg daily) or UFH (10,00015,000 units daily) initiated by hospital day 2 and continued to discharge or until the patient developed a VTE or a complication attributable to heparin. Patients were included so long as they missed no more than 1 day of prophylaxis or had no more than 1 unusual dose recorded. Patients who switched between heparin types were included and analyzed according to their initial therapy. Patients who received any other regimen were excluded. We also excluded patients who received warfarin on hospital day 1 or 2, because they would not be considered candidates for heparin prophylaxis, and patients whose length of stay was 2 days, because the value of VTE prophylaxis in such cases is unknown.
Data Elements
For each patient, we extracted age, gender, race, and insurance status, principal diagnosis, comorbidities, and specialty of the attending physician. Comorbidities were identified from ICD‐9‐CM secondary diagnosis codes and Diagnosis Related Groups using Healthcare Cost and Utilization Project Comorbidity Software, version 3.1, based on the work of Elixhauser and colleagues.11 We also identified additional risk factors for VTE using a combination of ICD‐9‐CM codes and specific charges. These included cancer, chemotherapy/radiation, prior VTE, use of estrogens and estrogen modulators, inflammatory bowel disease, nephrotic syndrome, myeloproliferative disorders, smoking, central venous catheter, inherited or acquired thrombophilia, mechanical ventilation, urinary catheter, decubitus ulcer, 3‐hydroxy‐3‐methylglutaryl coenzyme A (HMG‐CoA) reductase inhibitors, restraints, and varicose veins. Hospitals were categorized by region (Northeast, South, Midwest, or West), bed size, setting (urban vs rural), and teaching status.
Outcome Variables
We defined hospital‐acquired VTE as a secondary diagnosis of VTE (ICD‐9‐CM diagnoses 453.4, 453.40, 453.41, 453.42, 453.8, 453.9, 415.1, 415.11, 415.19), combined with a diagnostic test for VTE (lower extremity ultrasound, venography, computed tomography (CT) angiogram, ventilation‐perfusion scan, or pulmonary angiogram) after hospital day 2, followed by treatment for VTE (intravenous unfractionated heparin, >60 mg of enoxaparin, 7500 mg of dalteparin, or placement of an inferior vena cava filter) for at least 50% of the remaining hospital days or until initiation of warfarin or appearance of a complication (eg, transfusion or treatment for heparin‐induced thrombocytopenia). We chose this definition to differentiate hospital‐acquired VTE from VTE present on admission.12 In addition, patients who were readmitted within 30 days of discharge with a primary diagnosis of VTE were also considered to have hospital‐acquired VTE.
We also assessed complications of VTE prophylaxis. Major bleeding was defined as the receipt of 2 or more units of packed red blood cells on a single day or a secondary diagnosis of intracranial bleeding. Because there was no ICD‐9‐CM code for HIT, we assessed codes for all thrombocytopenia, as well as secondary thrombocytopenia. Definite HIT was defined as an ICD‐9‐CM code for thrombocytopenia, together with discontinuation of heparin and initiation of treatment with argatroban. A definite complication was defined as HIT or evidence of major bleeding coupled with discontinuation of heparin. Finally, we evaluated all‐cause in‐hospital mortality and total hospital costs.
Statistical Analysis
We computed summary statistics using frequencies and percents for categorical variables, and means, medians, and standard deviations and interquartile range for continuous variables. Associations of prophylaxis type with patient and hospital characteristics and outcomes were assessed using chi‐square tests or Fisher's exact test for categorical variables, and z‐tests or Wilcoxon tests for continuous variables.
We developed a propensity model for treatment with UFH as the outcome; the model included patient characteristics, early treatments, comorbidities, risk factors for VTE, physician specialty, and selected interaction terms. We then developed a series of multivariable models to evaluate the impact of heparin choice on the risk of VTE, complications of treatment, mortality, and total cost. Generalized estimating equation models with a logit link were used to assess the association between the choice of heparin and the risk of VTE, and of complications and mortality, while adjusting for the effects of within‐hospital correlation; identity link models were used for analyses of cost. Costs were trimmed at 3 standard deviations above the mean, and natural log‐transformed values were modeled due to extreme positive skew.
Unadjusted and covariate‐adjusted models were evaluated with and without adjustments for propensity score. In addition, since the hospital was the single strongest predictor of treatment, we developed grouped treatment models, in which a patient's actual treatment was replaced by a probability equal to the proportion of prophylaxed patients receiving UFH at that hospital. This adaptation of instrumental variable analysis uses the hospital as the instrument, and attempts to assess whether patients treated at a hospital which uses UFH more frequently have outcomes that differ from those of patients treated at hospitals which use LMWH more frequently, while adjusting for other patient, physician, and hospital variables. By relying on treatment at the hospital level, this method reduces the opportunity for selection bias at the patient level.
Finally, in order to exclude the possibility that our surrogate bleeding outcome was due to transfusion practices at hospitals that use a particular form of heparin, we compared the hospital rates of transfusion of 2 or more units of packed red cells to the hospital rates of prophylaxis with UFH in a larger dataset of the same hospitals. This set included patients with congestive heart failure, stroke, pneumonia, and urinary tract infection who did not receive daily prophylaxis, as well as patients admitted for chronic obstructive pulmonary disease (COPD) or acute myocardial infarction, and patients who received either warfarin or a treatment dose of heparin in the first 2 hospital days. We also compared the transfusion rates at hospitals that used unfractionated heparin in 80% of patients to hospitals that used LMWH in 80%. All analyses were performed using SAS version 9.1 (SAS Institute Inc, Cary, NC).
RESULTS
Our final sample included 32,104 patients who received prophylaxis at 333 hospitals (see Supporting Information, e‐Figure, in the online version of this article). Patient characteristics appear in Table 1. Most patients (66%) were over age 65; 59% were female and 61% were white. The most common primary diagnoses were pneumonia (40%) and congestive heart failure (25%). Additional risk factors for thromboembolism included cancer (13%), paralysis (8%), or diabetes (35%). Most patients' attending physicians were either internists (61%) or family practitioners (14%). Almost half of the patients were cared for at hospitals in the South (46%).
| Total | UFH | LMWH | ||
|---|---|---|---|---|
| 32,104 (100) | 14,591 (45.4) | 17,513 (54.6) | ||
| N (%) | N (%) | N (%) | P | |
| ||||
| Demographics | ||||
| Age | 0.0002 | |||
| 1849 | 4,061 (12.7) | 1,950 (13.4) | 2,111 (12.1) | |
| 5064 | 6,962 (21.7) | 3,225 (22.1) | 3,737 (21.3) | |
| 6579 | 10,909 (34.0) | 4,921 (33.7) | 5,988 (34.2) | |
| 80+ | 10,172 (31.7) | 4,495 (30.8) | 5,677 (32.4) | |
| Sex | 0.0071 | |||
| Male | 13,234 (41.2) | 6,133 (42.0) | 7,101 (40.5) | |
| Female | 18,870 (58.8) | 8,458 (58.0) | 10,412 (59.5) | |
| Race/ethnicity | <0.0001 | |||
| White | 19,489 (60.7) | 8,063 (55.3) | 11,426 (65.2) | |
| Black | 7,429 (23.1) | 4,101 (28.1) | 3,328 (19.0) | |
| Hispanic | 1,304 (4.1) | 591 (4.1) | 713 (4.1) | |
| Other | 3,882 (12.1) | 1,836 (12.6) | 2,046 (11.7) | |
| Primary diagnosis | <0.0001 | |||
| Pneumonia | 12,768 (39.8) | 5,354 (36.7) | 7,414 (42.3) | |
| Sepsis* | 1,217 (3.8) | 562 (3.9) | 655 (3.7) | |
| Respiratory failure* | 2,017 (6.3) | 814 (5.6) | 1,203 (6.9) | |
| Heart failure | 8,157 (25.4) | 3,825 (26.2) | 4,332 (24.7) | |
| Stroke | 4,416 (13.8) | 2,295 (15.7) | 2,121 (12.1) | |
| Urinary tract infection | 3,529 (11.0) | 1,741 (11.9) | 1,788 (10.2) | |
| Attending specialty | <0.0001 | |||
| Internist | 19,511 (60.8) | 8,945 (61.3) | 10,566 (60.3) | |
| General practice/Family medicine | 4,326 (13.5) | 1,964 (13.5) | 2,362 (13.5) | |
| Cardiologist | 1,606 (5.0) | 730 (5.0) | 876 (5.0) | |
| Pulmonologist | 2,179 (6.8) | 854 (5.9) | 1,325 (7.6) | |
| Nephrology | 583 (1.8) | 380 (2.6) | 203 (1.2) | |
| Critical care/Intensivist | 150 (0.5) | 93 (0.6) | 57 (0.3) | |
| Other | 3,749 (11.7) | 1,625 (11.1) | 2,124 (12.1) | |
| Insurance | <0.0001 | |||
| Medicare traditional | 20,281 (63.2) | 8,929 (61.2) | 11,352 (64.8) | |
| Medicare managed care | 1,737 (5.4) | 826 (5.7) | 911 (5.2) | |
| Medicaid | 2,629 (8.2) | 1,401 (9.6) | 1,228 (7.0) | |
| Private | 5,967 (18.6) | 2,830 (19.4) | 3,137 (17.9) | |
| Self‐pay/uninsured/other | 1,490 (4.6) | 605 (4.1) | 885 (5.1) | |
| Risk factors for VTE | ||||
| Admit from skilled nursing facility | 476 (1.5) | 277 (1.9) | 199 (1.1) | <0.0001 |
| Paralysis | 2,608 (8.1) | 1,317 (9.0) | 1,291 (7.4) | <0.0001 |
| Restraints | 417 (1.3) | 147 (1.0) | 270 (1.5) | <0.0001 |
| Decubitus ulcer | 1,190 (3.7) | 631 (4.3) | 559 (3.2) | <0.0001 |
| Cancer | 4,154 (12.9) | 1,858 (12.7) | 2,296 (13.1) | 0.3171 |
| Chemotherapy | 86 (0.3) | 41 (0.3) | 45 (0.3) | 0.6781 |
| Prior venous thromboembolism | 494 (1.5) | 202 (1.4) | 292 (1.7) | 0.0403 |
| Pregnancy | 1 (0) | 1 (0) | 0 (0) | 0.2733 |
| Estrogens | 438 (1.4) | 143 (1.0) | 295 (1.7) | <0.0001 |
| Estrogen modulators | 246 (0.8) | 80 (0.5) | 166 (0.9) | <0.0001 |
| Congestive heart failure | 3,107 (9.7) | 1,438 (9.9) | 1,669 (9.5) | 0.3263 |
| Respiratory failure | 2,210 (6.9) | 1,037 (7.1) | 1,173 (6.7) | 0.1493 |
| Inflammatory bowel disease | 108 (0.3) | 41 (0.3) | 67 (0.4) | 0.1176 |
| Nephrotic syndrome | 92 (0.3) | 50 (0.3) | 42 (0.2) | 0.0860 |
| Myeloproliferative disorder | 198 (0.6) | 68 (0.5) | 130 (0.7) | 0.0016 |
| Obesity | 2,973 (9.3) | 1,211 (8.3) | 1,762 (10.1) | <0.0001 |
| Smoking | 4,476 (13.9) | 1,887 (12.9) | 2,589 (14.8) | <0.0001 |
| Varicose veins | 19 (0.1) | 6 (0) | 13 (0.1) | 0.2245 |
| Central line | 1,070 (3.3) | 502 (3.4) | 568 (3.2) | 0.3271 |
| Inherited or acquired thrombophilia | 16 (0) | 9 (0.1) | 7 (0) | 0.3855 |
| Diabetes | 11,136 (34.7) | 5,157 (35.3) | 5,979 (34.1) | 0.0241 |
| Procedures associated with VTE or bleed | ||||
| Mechanical ventilation | 2,282 (7.1) | 1,111 (7.6) | 1,171 (6.7) | 0.0013 |
| Urinary catheter | 4,496 (14.0) | 1,545 (10.6) | 2,951 (16.9) | <0.0001 |
| Aspirin | 12,865 (40.1) | 6,101 (41.8) | 6,764 (38.6) | <0.0001 |
| Clopidogrel | 4,575 (14.3) | 2,087 (14.3) | 2,488 (14.2) | 0.8050 |
| Non‐steroidal anti‐inflammatory drugs | 2,147 (6.7) | 867 (5.9) | 1,280 (7.3) | <0.0001 |
| Steroids | 7,938 (24.7) | 3,136 (21.5) | 4,802 (27.4) | <0.0001 |
| Statins | 7,376 (23.0) | 3,462 (23.7) | 3,914 (22.3) | 0.0035 |
| Comorbidities | ||||
| AIDS | 124 (0.4) | 73 (0.5) | 51 (0.3) | 0.0026 |
| Alcohol abuse | 1,048 (3.3) | 523 (3.6) | 525 (3.0) | 0.0032 |
| Deficiency anemia | 7,010 (21.8) | 3,228 (22.1) | 3,782 (21.6) | 0.2543 |
| Rheumatoid arthritis/collagen vas | 967 (3.0) | 426 (2.9) | 541 (3.1) | 0.3762 |
| Chronic blood loss anemia | 177 (0.6) | 79 (0.5) | 98 (0.6) | 0.8269 |
| Chronic pulmonary disease | 12,418 (38.7) | 5,314 (36.4) | 7,104 (40.6) | <0.0001 |
| Depression | 3,334 (10.4) | 1433 (9.8) | 1901 (10.9) | 0.0025 |
| Drug abuse | 694 (2.2) | 412 (2.8) | 282 (1.6) | <0.0001 |
| Hypertension | 16,979 (52.9) | 7,658 (52.5) | 9,321 (53.2) | 0.1866 |
| Hypothyroidism | 4,016 (12.5) | 1,716 (11.8) | 2,300 (13.1) | 0.0002 |
| Liver disease | 453 (1.4) | 227 (1.6) | 226 (1.3) | 0.0448 |
| Other neurological disorders | 4,682 (14.6) | 2,202 (15.1) | 2,480 (14.2) | 0.0187 |
| Peripheral vascular disease | 2,134 (6.6) | 980 (6.7) | 1,154 (6.6) | 0.6490 |
| Psychoses | 1,295 (4.0) | 574 (3.9) | 721 (4.1) | 0.4066 |
| Pulmonary circulation disease | 1,034 (3.2) | 442 (3.0) | 592 (3.4) | 0.0760 |
| Renal failure | 2,794 (8.7) | 1,636 (11.2) | 1,158 (6.6) | 0.0000 |
| Peptic ulcer disease with bleeding | 563 (1.8) | 232 (1.6) | 331 (1.9) | 0.0414 |
| Valvular disease | 2,079 (6.5) | 899 (6.2) | 1,180 (6.7) | 0.0366 |
| Weight loss | 1,231 (3.8) | 556 (3.8) | 675 (3.9) | 0.8391 |
| Other prophylaxis | ||||
| Intermittent pneumatic compression | 1,003 (3.1) | 456 (3.1) | 547 (3.1) | 0.9926 |
| Mechanical prophylaxis | 1,281 (4.0) | 524 (3.6) | 757 (4.3) | 0.0009 |
Fifty‐five percent of patients received LMWH and the remainder received UFH; 1274 (4%) patients switched type of heparin during their stay. The proportion of patients receiving LMWH at an individual hospital varied from 0% to 100% with a u‐shaped distribution, with almost one‐third of hospitals prescribing one treatment or the other exclusively (Figure 1). Similarly, the proportion of an individual physician's patients who received prophylaxis with UFH (vs LMWH) varied from 0% to 100% (Figure 1), with 51% prescribing LMWH exclusively and 31% prescribing UFH exclusively. Compared to patients who received UFH, patients receiving LMWH were older and were more likely to be white, female, and to have pneumonia. By far the biggest difference between the groups was the hospitals at which they received their care (see Supporting Information, e‐Table, in the online version of this article). Patients receiving LMWH were much more likely to be from smaller, rural, non‐teaching hospitals in the South or the West. There were also numerous small differences in comorbidities and individual VTE risk factors between the 2 groups. The only large difference was that patients with a secondary diagnosis of renal failure (for which LMWH is not US Food and Drug Administration [FDA] approved) were almost twice as likely to receive UFH.
We identified 163 (0.51%) episodes of VTE (Table 2). Compared to patients receiving UFH, those receiving standard LMWH had similar unadjusted rates of VTE (0.53% vs 0.48%; P = 0.54), major bleeding (0.77% vs 0.76%; P = 0.88), thrombocytopenia (1.9% vs 2.0%; P = 0.48), definite HIT (n = 1 vs n = 3; P = 0.34), and mortality (2.8% vs 3.1%; P = 0.07). Definite complications of prophylaxis (HIT or major bleed combined with the discontinuation of heparin) were more common among patients receiving UFH (0.2% vs 0.1%; P = 0.022). Patients treated with UFH had longer unadjusted lengths of stay (P < 0.0001) and higher unadjusted costs (P < 0.0001).
| Total | UFH | LMWH | P | |
|---|---|---|---|---|
| 32,104 (100) | 14,591 (45.4) | 17,513 (54.6) | ||
| n (%) | n (%) | n (%) | ||
| ||||
| Venous thromboembolism | 163 (0.5) | 78 (0.5) | 85 (0.5) | 0.54 |
| Heparin‐induced thrombocytopenia | 4 (0) | 3 (0) | 1 (0) | 0.34* |
| Any major bleeding | 246 (0.8) | 113 (0.8) | 133 (0.8) | 0.88 |
| Transfusion with 2 units of packed red blood cells | 218 (0.7) | 97 (0.7) | 121 (0.7) | 0.78 |
| Intracranial hemorrhage | 30 (0.1) | 17 (0.1) | 13 (0.1) | 0.22 |
| Complication resulting in stopping heparin | 44 (0.1) | 28 (0.2) | 16 (0.1) | 0.02 |
| In‐hospital mortality | 944 (2.9) | 456 (3.1) | 488 (2.8) | 0.07 |
| LOS in days; mean (SD) | 6.2 (5.9) | 6.4 (6.2) | 6.0 (5.6) | <0.001 |
| Median (IQR) | 5 (37) | 5 (37) | 5 (37) | |
| Cost in USD; median (IQR) | 5873 (41718982) | 6007 (41779456) | 5774 (41658660) | <0.001 |
A propensity model for UFH treatment based upon patient characteristics and treatments was not strongly predictive of treatment (c = 0.58) and propensity matching failed to balance many of the patient characteristics. However, hospital alone, ignoring patient characteristics was strongly predictive (c = 0.91) of treatment.
In a model adjusting only for clustering within hospitals, patients treated with UFH had an odds ratio (OR) for VTE of 1.08 (95% confidence interval [CI] 0.79 to 1.49) compared to patients receiving LMWH (Figure 2). Adjustment for propensity for UFH and other covariates attenuated the effect of LMWH (OR 1.04, 95% CI 0.76 to 1.43). When individual patients were assigned a probability of treatment with UFH equal to the hospital rate where they received care, UFH use was associated with a nonsignificant change in the odds of VTE (OR 1.14, 95% CI 0.72 to 1.81).
Adjusted for clustering within hospital only, patients treated with UFH had an odds ratio for major bleed of 1.38 (95% CI 1.00 to 1.91) compared to patients receiving LMWH (Figure 3). Adjustment for propensity for UFH and other covariates gave similar results (OR 1.34, 95% CI 0.97 to 1.84). When individual patients were assigned a probability of treatment with UFH equal to the hospital rate where they received care, UFH treatment was associated with a nonsignificant increase in the odds of major bleed (OR 1.64, 95% CI 0.50 to 5.33). When we compared the rate of transfusion across hospitals, including 576,231 additional patients who were excluded from the original analyses because they did not receive daily prophylaxis or had a diagnosis of myocardial infarction or COPD, there was a slight negative correlation between transfusion rates and use of UFH (Spearman Correlation Coefficient 0.03; P = 0.61). Hospitals that used primarily UFH had a transfusion rate of 0.60% versus 0.76% at hospitals using primarily LMWH (P = 0.54), indicating that the increased risk of major bleeding associated with UFH was not confounded by local transfusion practices.
Adjusted for clustering only, patients treated with UFH had an odds ratio for definite complication of 2.35 (95% CI 1.17 to 4.72) compared to those treated with LMWH. Adjustment for propensity and covariates accentuated the association (OR 2.84, 95% CI 1.43 to 5.66). When assigned a probability of treatment with UFH equal to the hospital rate where they received care, UFH treatment was associated with an increase in the risk of definite complication (OR 2.79, 95% CI 1.00 to 7.74).
Adjusted for clustering only, patients treated with UFH had higher costs than those treated with LMWH (cost ratio 1.07, 95% CI 1.05 to 1.09). Adjustment for propensity for UFH and other covariates attenuated the association (cost ratio 1.02, 95% CI 1.00 to 1.03). Finally, when individual patients were assigned a probability of initial treatment with UFH equal to the hospital rate where they received care, treatment with UFH was associated with a nonsignificant change in the relative cost (cost ratio 0.97, 95% CI 0.90 to 1.05).
DISCUSSION
In this retrospective cohort study, we found that low‐molecular‐weight heparin and unfractionated heparin were associated with similar rates of VTE in moderate‐to‐high risk medical patients. However, unfractionated heparin was associated with a small, but higher risk of complications, even after adjustment. There were no statistical differences in rates of heparin‐induced thrombocytopenia, but this complication was exceedingly rare. Finally, overall costs associated with both treatments were similar.
A number of industry‐funded studies have compared LMWH to UFH in randomized clinical trials. These trials have generally been small and used endpoints of uncertain significance, such as asymptomatic deep vein thrombosis assessed by ultrasound. At least 3 meta‐analyses of these trials have been published. Each used different inclusion criteria. The only one to find an efficacy benefit to LMWH over UFH was heavily influenced by the inclusion of a number of studies of stroke patients.3 In that study, LMWH reduced VTE by approximately one‐third relative to UFH. The other 2 analyses found smaller reductions in DVT and pulmonary embolism (PE), and these results were not statistically significant.5, 8 Similarly, 1 analysis5 found a reduction in major bleeding events with LMWH versus UFH, whereas the other 2 studies found smaller reductions which were not statistically significant. The assessment of major bleeding is further complicated by differences in the definition of major bleeding across studies. Using a standard definition of 2 units of packed red blood cells transfused in 1 day to denote major bleeding, we found an associated reduction in bleeding with LMWH that was similar to that observed in the meta‐analyses. Moreover, patients receiving UFH were twice as likely to have a complication that resulted in stopping the prophylaxis, although these complications were overall quite rare. Lastly, there are no cost comparisons based on randomized trials. Several comparisons based on modeling have favored LMWH. One assumed that 3% of patients receiving UFH would develop HIT;13 something we did not observe. At least 3 additional analyses,1416 all funded by the manufacturer of enoxaparin, assumed that LMWH was both more effective and safer than UFH. We found that adjusted costs were similar or slightly lower with UFH than LMWH.
Our study has a number of limitations. First, its observational design makes it vulnerable to selection bias. We attempted to overcome this with rigorous multivariable adjustment, including the propensity for treatment and by using an adaptation of the instrumental variable approach. This method is of particular interest because individual hospitals were strongly predictive of choice of heparin. Still, we cannot exclude the possibility of residual confounding, especially if other outcomes, such as transfusion decisions, were also tied to specific hospital practices. Second, our study used administrative data, and therefore we could not directly adjust for certain differences which may exist between patients who received LMWH and those who received UFH. However, we did adjust for many classic risk factors for VTE. More importantly, it seems that the chance of being treated with a particular form of heparin depends more on the hospital where one receives care than on any combination of patient characteristics. Thus, apart from renal failure, for which we adjusted, it seems unlikely that there were major differences in unmeasured physiological confounders. Third, we limited our analysis to patients who received standard dosing of either type of heparin. We did this to bolster the validity of our findings, but they may not apply to unconventional dosing often observed in clinical practice. Fourth, we measured only outcomes that occurred in the hospital or that prompted a return to the hospital. VTEs which were diagnosed and treated in ambulatory care were not included. While this may have led us to underestimate the true risk of VTE, we have little reason to believe that the choice of whether to admit a patient with VTE is influenced by the original choice of VTE prophylaxis. Finally, our study was conducted before the introduction of generic LMWH, which would be expected to reduce costs associated with LMWH prophylaxis.
VTE prophylaxis for medical patients has emerged as a major focus for quality improvement initiatives. As a result, a significant proportion of general medical patients receive some form of chemoprophylaxis during their hospital stay. Small differences in efficacy or safety of different forms of prophylaxis multiplied by millions of admissions each year can have profound effects on the health of hospitalized patients. Similarly, differences in cost could also have a substantial impact on the healthcare system. We found no difference in efficacy or cost, but treatment with LMWH was less likely to be associated with subsequent transfusion of 2 or more units of packed red blood cells, a surrogate marker for bleeding. In addition, LMWH is more convenient since it can be dosed once daily, and for that reason may be more acceptable to patients. For these reasons, LMWH may be the drug of choice for inpatient prophylaxis of general medical patients. In situations where the cost of the medication itself is important, UFH represents an equally effective alternative.
Acknowledgements
All authors have contributed sufficiently to this study and have provided written permission to be named in the manuscript. No other persons have made substantial contributions to this manuscript. Michael B. Rothberg is the guarantor of the entire manuscript.
Disclosures: This study was supported by a Clinical Scientist Development Award from the Doris Duke Charitable Foundation. The funding source had no role in the study design, analysis, or interpretation of the data. Dr Rothberg served for 1 day as a consultant to Novartis Pharma about an influenza vaccine model. Sandoz, a division of Novartis, was recently granted approval to manufacture a generic form of low‐molecular‐weight heparin. None of the other authors have any conflicts of interest.
- ,,, et al.A comparison of enoxaparin with placebo for the prevention of venous thromboembolism in acutely ill medical patients. Prophylaxis in Medical Patients with Enoxaparin Study Group.N Engl J Med.1999;341:793–800.
- ,,, et al.Prevention of venous thromboembolism: American College of Chest Physicians Evidence‐Based Clinical Practice Guidelines (8th Edition).Chest.2008;133:381S–453S.
- ,,,,.Pharmacological venous thromboembolism prophylaxis in hospitalized medical patients: a meta‐analysis of randomized controlled trials.Arch Intern Med.2007;167:1476–1486.
- ,,,,.Meta‐analysis: anticoagulant prophylaxis to prevent symptomatic venous thromboembolism in hospitalized medical patients.Ann Intern Med.2007;146:278–288.
- ,,, et al.Prevention of venous thromboembolism in internal medicine with unfractionated or low‐molecular‐weight heparins: a meta‐analysis of randomised clinical trials.Thromb Haemost.2000;83:14–19.
- ,,.Risk for heparin‐induced thrombocytopenia with unfractionated and low‐molecular‐weight heparin thromboprophylaxis: a meta‐analysis.Blood.2005;106:2710–2715.
- ,.A safety analysis of thromboprophylaxis in acute medical illness.Thromb Haemost.2003;89:590–591.
- ,,,,.How complete is the evidence for thromboembolism prophylaxis in general medicine patients? A meta‐analysis of randomized controlled trials.J Hosp Med.2009;4:289–297.
- The Joint Commission on the Accreditation of Healthcare Organizations. Venous Thromboembolism (VTE) Core Measure Set. Available at: http://www.jointcommission.org/PerformanceMeasurement/PerformanceMeasurement/VTE.htm. Accessed June 1,2009.
- ,,, et al.Potentially inappropriate medication use in hospitalized elders.J Hosp Med.2008;3:91–102.
- ,,,.Comorbidity measures for use with administrative data.Med Care.1998;36:8–27.
- ,,,,,.Identification of in‐hospital complications from claims data. Is it valid?Med Care.2000;38:785–795.
- ,,,.Cost utility of substituting enoxaparin for unfractionated heparin for prophylaxis of venous thrombosis in the hospitalized medical patient.J Hosp Med.2006;1:168–176.
- ,,,.Cost effectiveness of thromboprophylaxis with a low‐molecular‐weight heparin versus unfractionated heparin in acutely ill medical inpatients.Am J Manag Care.2004;10:632–642.
- ,,,.Comparison of the two‐year outcomes and costs of prophylaxis in medical patients at risk of venous thromboembolism.Thromb Haemost.2008;100:810–820.
- ,,, et al.Cost effectiveness of enoxaparin as prophylaxis against venous thromboembolic complications in acutely ill medical inpatients: modelling study from the hospital perspective in Germany.Pharmacoeconomics.2006;24:571–591.
Copyright © 2012 Society of Hospital Medicine

Risk Model for VTE
Venous thromboembolism (VTE) is a major source of morbidity and mortality for hospitalized patients. Among medical patients at the highest risk, as many as 15% can be expected to develop a VTE during their hospital stay1, 2; however, among general medical patients, the incidence of symptomatic VTE is less than 1%,1 and potentially as low as 0.3%.3 Thromboprophylaxis with subcutaneous heparin reduces the risk of VTE by approximately 50%,4 and is therefore recommended for medical patients at high risk. However, heparin also increases the risk of bleeding and thrombocytopenia and thus should be avoided for patients at low risk of VTE. Consequently, the Joint Commission on Accreditation of Healthcare Organizations (JCAHO) recommends that all hospitalized medical patients receive a risk assessment for VTE.5
Certain disease states, including stroke, acute myocardial infarction, heart failure, respiratory disease, sepsis, and cancer, have been associated with increased risk for VTE, and, based on the inclusion criteria of several randomized trials, current American College of Chest Physicians (ACCP) guidelines recommend thromboprophylaxis for patients hospitalized with these diagnoses.2 However, evidence that these factors actually increase a patient's risk for VTE comes from studies of ambulatory patients and is often weak or conflicting. Existing risk‐stratification tools,6, 7 as well as the ACCP guidelines, have not been validated, and accordingly JCAHO does not specify how risk assessment should be conducted. In order to help clinicians better estimate the risk of VTE in medical patients and therefore to provide more targeted thromboprophylaxis, we examined a large cohort of patients with high‐risk diagnoses and created a risk stratification model.
Methods
Setting and Patients
We identified a retrospective cohort of patients discharged between January 1, 2004 and June 30, 2005 from 374 acute care facilities in the US that participated in Premier's Perspective, a database developed for measuring quality and healthcare utilization. Participating hospitals represent all regions of the US, and are generally similar in composition to US hospitals; however, in comparison to information contained in the American Hospital Association annual survey, Perspective hospitals are more likely to be located in the South and in urban areas. Available data elements include those derived from the uniform billing 04 form, such as sociodemographic information about each patient, their International Classification of Diseases, Ninth Revision, Clinical Modification (ICD‐9‐CM) diagnosis and procedure codes, as well as hospital and physician information. This information is supplemented with a date‐stamped log of all items and services billed to the patient or insurer, including diagnostic tests, medications, and other treatments. Permission to conduct the study was obtained from the Institutional Review Board at Baystate Medical Center.
We included all patients age 18 years at moderate‐to‐high risk of VTE according to the ACCP recommendations,8 based on a principal diagnosis of pneumonia, septicemia or respiratory failure with pneumonia, heart failure, chronic obstructive pulmonary disease (COPD), stroke, and urinary tract infection. Diagnoses were assessed using ICD‐9‐CM codes. Patients who were prescribed warfarin or therapeutic doses of heparin on hospital day 1 or 2, and those who received >1 therapeutic dose of heparin but otherwise did not fulfill criteria for VTE, were excluded because we could not evaluate whether they experienced a VTE event during hospitalization. We also excluded patients whose length of stay was <3 days, because our definition of hospital‐acquired VTE required treatment begun on day 3 or later, and those with an indication for anticoagulation other than VTE (eg, prosthetic cardiac valve or atrial fibrillation), because we could not reliably distinguish treatment for VTE from treatment of the underlying condition.
Risk Factors
For each patient, we extracted age, gender, race/ethnicity, and insurance status, principal diagnosis, comorbidities, and specialty of the attending physician. Comorbidities were identified from ICD‐9‐CM secondary diagnosis codes and Diagnosis Related Groups using Healthcare Cost and Utilization Project Comorbidity Software, version 3.1, based on the work of Elixhauser et al.9 We also assessed risk factors which have been previously linked to VTE: paralysis, cancer (metastatic, solid tumor, and lymphoma), chemotherapy/radiation, prior VTE, use of estrogens and estrogen modulators, inflammatory bowel disease, nephrotic syndrome, myeloproliferative disorders, obesity, smoking, central venous catheter, inherited or acquired thrombophilia, steroid use, mechanical ventilation, urinary catheter, decubitus ulcer, HMGco‐A reductase inhibitors, restraints, diabetes, varicose veins, and length‐of‐stay 6 days. These additional comorbidities were defined based on the presence of specific ICD‐9 codes, while use of HMG‐co‐A reductase inhibitors were identified from medication charge files. We also noted whether patients received anticoagulants, the dosages and days of administration, as well as intermittent pneumatic compression devices.
Identification of VTE
Because the presence of a secondary diagnosis of VTE in medical patients is not a reliable way of differentiating hospital‐acquired VTE from those present at the time of admission,10 subjects were considered to have experienced a hospital‐acquired VTE only if they underwent a diagnostic test for VTE (lower extremity ultrasound, venography, CT angiogram, ventilation‐perfusion scan, or pulmonary angiogram) on hospital day 3 or later, received treatment for VTE for at least 50% of the remaining hospital stay, or until initiation of warfarin or appearance of a complication (eg, transfusion or treatment for heparin‐induced thrombocytopenia) and were given a secondary diagnosis of VTE (ICD‐9 diagnoses 453.4, 453.40, 453.41, 453.42, 453.8, 453.9, 415.1, 415.11, 415.19). We considered the following to be treatments for VTE: intravenous unfractionated heparin, >60 mg of enoxaparin, 7500 mg of dalteparin, or placement of an inferior vena cava filter. In addition, patients who were readmitted within 30 days of discharge with a primary diagnosis of VTE were also considered to have developed a VTE as a complication of their previous hospital stay.
Statistical Analysis
Univariate predictors of VTE were assessed using chi‐square tests. We developed a multivariable logistic regression model for VTE on an 80% randomly selected subset of the eligible admissions (the derivation cohort) using all measured risk factors for VTE and selected interaction terms. Generalized estimating equations (GEE) models with a logit link (SAS PROC GENMOD) were used to account for the clustering of patients within hospitals. Initial models were stratified on VTE prophylaxis. Factors significant at P < 0.05 were retained. Parameter estimates derived from the model were used to compute individual VTE risk in the remaining 20% of the admissions (the validation cohort). Discrimination in the validation model was assessed by the c‐statistic, as well as the expected/observed ratio. Both cohorts were categorized by decile of risk, based on the probability distribution in the derivation cohort, and observed VTE events compared to those predicted by the model. All analyses were performed using the Statistical Analysis System (version 9.1, SAS Institute, Inc., Cary, NC).
Role of the Funding Source
This study was supported by a Clinical Scientist Development Award from the Doris Duke Charitable Foundation. The funding source had no role in the study design, analysis, or interpretation of the data.
Results
Our sample contained 242,738 patients, 194,198 (80%) assigned to the derivation set and 48,540 (20%) to the validation set. Patient characteristics were similar in both sets (Supporting Information Appendix Table 1). Most patients were over age 65, 59% were female, and 64% were white (Table 1). The most common primary diagnoses were pneumonia (33%) and congestive heart failure (19%). The most common comorbidities were hypertension (50%), diabetes (31%), chronic pulmonary disease (30%), and anemia (20%). Most patients were cared for by internists (54%) or family practitioners (21%), and 30% received some form of anticoagulant VTE prophylaxis (Table 2). Of patients with an ICD‐9 code for VTE during hospitalization, just over half lacked either diagnostic testing, treatment, or both, leaving 612 (0.25%) patients who fulfilled our criteria for VTE; an additional 440 (0.18%) were readmitted for VTE, for an overall incidence of 0.43%. Patients with a length of stay 6 days had an incidence of 0.79% vs 0.19% for patients with shorter stays.
| Total | No VTE | VTE | |||||
|---|---|---|---|---|---|---|---|
| Variable | N | % | N | % | N | % | P‐Value |
| Total | 242,738 | 100 | 241,686 | 100.0 | 1,052 | 100.0 | |
| Demographics | |||||||
| Age | 0.20 | ||||||
| 18‐49 | 31,065 | 12.8 | 30,952 | 12.8 | 113 | 10.7 | |
| 50‐64 | 51,309 | 21.1 | 51,083 | 21.1 | 226 | 21.5 | |
| 65‐74 | 51,230 | 21.1 | 50,993 | 21.1 | 237 | 22.5 | |
| 75+ | 109,134 | 45.0 | 108,658 | 45.0 | 476 | 45.2 | |
| Female | 142,910 | 58.9 | 142,330 | 58.9 | 580 | 55.1 | 0.01 |
| Race/ethnicity | 0.49 | ||||||
| White | 155,866 | 64.2 | 155,189 | 64.2 | 677 | 64.4 | |
| Black | 41,556 | 17.1 | 41,374 | 17.1 | 182 | 17.3 | |
| Hispanic | 9,809 | 4.0 | 9,776 | 4.0 | 33 | 3.1 | |
| Other | 35,507 | 14.6 | 35,347 | 14.6 | 160 | 15.2 | |
| Marital status | 0.28 | ||||||
| Married/life partner | 88,035 | 36.3 | 87,627 | 36.3 | 408 | 38.8 | |
| Single | 39,254 | 16.2 | 39,103 | 16.2 | 151 | 14.4 | |
| Separated/divorced | 23,492 | 9.7 | 23,394 | 9.7 | 98 | 9.3 | |
| Widowed | 58,669 | 24.2 | 58,426 | 24.2 | 243 | 23.1 | |
| Other | 33,288 | 13.7 | 33,136 | 13.7 | 152 | 14.4 | |
| Admission characteristics | |||||||
| Primary diagnosis | <0.001 | ||||||
| Community‐acquired pneumonia | 81,171 | 33.4 | 80,792 | 33.4 | 379 | 36.0 | |
| Septicemia | 7,643 | 3.2 | 7,568 | 3.1 | 75 | 7.1 | |
| Chronic obstructive pulmonary disease | 35,116 | 14.5 | 35,027 | 14.5 | 89 | 8.5 | |
| Respiratory failure | 7,098 | 2.9 | 7,012 | 2.9 | 86 | 8.2 | |
| Congestive heart failure | 46,503 | 19.2 | 46,336 | 19.2 | 167 | 15.9 | |
| Cardiovascular disease | 33,044 | 13.6 | 32,931 | 13.6 | 113 | 10.7 | |
| Urinary tract infection | 32,163 | 13.3 | 32,020 | 13.2 | 143 | 13.6 | |
| Insurance payer | 0.93 | ||||||
| Medicare traditional | 157,609 | 64.9 | 156,927 | 64.9 | 682 | 64.8 | |
| Medicare managed care | 10,649 | 4.4 | 10,597 | 4.4 | 52 | 4.9 | |
| Medicaid | 17,796 | 7.3 | 17,720 | 7.3 | 76 | 7.2 | |
| Private | 44,858 | 18.5 | 44,665 | 18.5 | 193 | 18.3 | |
| Self‐pay/uninsured/other | 11,826 | 4.9 | 11,777 | 4.9 | 49 | 4.7 | |
| Admitted from skilled nursing facility | 3,003 | 1.2 | 2,980 | 1.2 | 23 | 2.2 | 0.005 |
| Risk factors | |||||||
| Any VTE prophylaxis | 72,558 | 29.9 | 72,164 | 29.9 | 394 | 37.5 | <0.001 |
| Length of stay 6 days | 99,463 | 41.0 | 98,680 | 40.8 | 783 | 74.4 | <0.001 |
| Paralysis | 16,764 | 6.9 | 16,689 | 6.9 | 75 | 7.1 | 0.77 |
| Metastatic cancer | 5,013 | 2.1 | 4,928 | 2.0 | 85 | 8.1 | <0.001 |
| Solid tumor without metastasis | 25,127 | 10.4 | 24,995 | 10.3 | 132 | 12.5 | 0.02 |
| Lymphoma | 3,026 | 1.2 | 2,995 | 1.2 | 31 | 2.9 | <0.001 |
| Cancer chemotherapy/radiation | 1,254 | 0.5 | 1,231 | 0.5 | 23 | 2.2 | <0.001 |
| Prior venous thromboembolism | 2,945 | 1.2 | 2,926 | 1.2 | 19 | 1.8 | 0.08 |
| Estrogens | 4,819 | 2.0 | 4,807 | 2.0 | 12 | 1.1 | 0.05 |
| Estrogen modulators | 2,102 | 0.9 | 2,091 | 0.9 | 11 | 1.0 | 0.53 |
| Inflammatory bowel disease | 814 | 0.3 | 803 | 0.3 | 11 | 1.0 | <0.001 |
| Nephrotic syndrome | 520 | 0.2 | 517 | 0.2 | 3 | 0.3 | 0.62 |
| Myeloproliferative disorder | 1,983 | 0.8 | 1,973 | 0.8 | 10 | 1.0 | 0.63 |
| Obesity | 16,938 | 7.0 | 16,856 | 7.0 | 82 | 7.8 | 0.30 |
| Smoking | 35,386 | 14.6 | 35,284 | 14.6 | 102 | 9.7 | <0.001 |
| Central venous catheter | 14,754 | 6.1 | 14,525 | 6.0 | 229 | 21.8 | <0.001 |
| Inherited or acquired thrombophilia | 114 | 0.1 | 108 | 0.0 | 6 | 0.6 | <0.001 |
| Steroids | 82,606 | 34.0 | 82,185 | 34.0 | 421 | 40.0 | <0.001 |
| Mechanical ventilation | 13,347 | 5.5 | 13,167 | 5.4 | 180 | 17.1 | <0.001 |
| Urinary catheter | 39,080 | 16.1 | 38,816 | 16.1 | 264 | 25.1 | <0.001 |
| Decubitus ulcer | 6,829 | 2.8 | 6,776 | 2.8 | 53 | 5.0 | <0.001 |
| Statins use | 57,282 | 23.6 | 57,068 | 23.6 | 214 | 20.3 | 0.01 |
| Use of restraints | 5,970 | 2.5 | 5,914 | 2.4 | 56 | 5.3 | <0.001 |
| Diabetes mellitus | 75,103 | 30.9 | 74,799 | 30.9 | 304 | 28.9 | 0.15 |
| Varicose veins | 166 | 0.1 | 165 | 0.1 | 1 | 0.1 | 0.74 |
| Comorbidities | |||||||
| Hypertension | 120,606 | 49.7 | 120,126 | 49.7 | 480 | 45.6 | 0.008 |
| Congestive heart failure | 18,900 | 7.8 | 18,793 | 7.8 | 107 | 10.2 | 0.004 |
| Peripheral vascular disease | 16,705 | 6.9 | 16,639 | 6.9 | 66 | 6.3 | 0.43 |
| Valvular disease | 13,683 | 5.6 | 13,628 | 5.6 | 55 | 5.2 | 0.56 |
| Pulmonary circulation disease | 5,530 | 2.3 | 5,492 | 2.3 | 38 | 3.6 | 0.004 |
| Chronic pulmonary disease | 72,028 | 29.7 | 71,698 | 29.7 | 330 | 31.4 | 0.23 |
| Respiratory failure second diagnosis | 13,027 | 5.4 | 12,893 | 5.3 | 134 | 12.7 | <0.001 |
| Rheumatoid arthritis/collagen vascular disease | 7,090 | 2.9 | 7,050 | 2.9 | 40 | 3.8 | 0.09 |
| Deficiency anemias | 49,605 | 20.4 | 49,352 | 20.4 | 253 | 24.0 | 0.004 |
| Weight loss | 8,810 | 3.6 | 8,714 | 3.6 | 96 | 9.1 | <0.001 |
| Peptic ulcer disease bleeding | 4,736 | 2.0 | 4,723 | 2.0 | 13 | 1.2 | 0.09 |
| Chronic blood loss anemia | 2,354 | 1.0 | 2,338 | 1.0 | 16 | 1.5 | 0.07 |
| Hypothyroidism | 28,773 | 11.9 | 28,668 | 11.9 | 105 | 10.0 | 0.06 |
| Renal failure | 19,768 | 8.1 | 19,669 | 8.1 | 99 | 9.4 | 0.13 |
| Liver disease | 4,682 | 1.9 | 4,657 | 1.9 | 25 | 2.4 | 0.29 |
| Other neurological disorders | 33,094 | 13.6 | 32,905 | 13.6 | 189 | 18.0 | <0.001 |
| Psychoses | 9,330 | 3.8 | 9,283 | 3.8 | 47 | 4.5 | 0.29 |
| Depression | 25,561 | 10.5 | 25,442 | 10.5 | 119 | 11.3 | 0.41 |
| Alcohol abuse | 7,756 | 3.2 | 7,727 | 3.2 | 29 | 2.8 | 0.42 |
| Drug abuse | 4,336 | 1.8 | 4,318 | 1.8 | 18 | 1.7 | 0.85 |
| Acquired immune deficiency syndrome | 1,048 | 0.4 | 1,045 | 0.4 | 3 | 0.3 | 0.47 |
| Total | Derivation | Validation | |||||
|---|---|---|---|---|---|---|---|
| Variable | N | % | N | % | N | % | P‐Value |
| |||||||
| Total | 242,738 | 100 | 194,198 | 100 | 48,540 | 100 | |
| VTE prophylaxis | 0.97 | ||||||
| No prophylaxis | 170,180 | 70.1 | 136,153 | 70.1 | 34,027 | 70.1 | |
| Any prophylaxis | 72,558 | 29.9 | 58,045 | 29.9 | 14,513 | 29.9 | |
| Outcomes | |||||||
| ICD‐9 code for VTE | 1,304 | 0.5 | 1,025 | 0.5 | 279 | 0.6 | 0.21 |
| ICD‐9 code + diagnostic test | 989 | 0.4 | 777 | 0.4 | 212 | 0.4 | 0.26 |
| ICD‐9 code + diagnostic test + treatment for VTE | 612 | 0.3 | 471 | 0.2 | 141 | 0.3 | 0.06 |
| Readmission for VTE within 30 days | 446 | 0.2 | 363 | 0.2 | 83 | 0.2 | 0.46 |
| Total hospital‐acquired VTE | 1,052 | 0.4 | 829 | 0.4 | 223 | 0.5 | 0.33 |
| In‐hospital mortality | 8,019 | 3.3 | 6,403 | 3.3 | 1,616 | 3.3 | 0.72 |
| Any readmission within 30 days | 28,664 | 11.8 | 22,885 | 11.8 | 5,779 | 11.9 | 0.46 |
Risk factors for VTE
A large number of patient and hospital factors were associated with the development of VTE (Table 1). Due to the large sample size, even weak associations appear highly statistically significant. Compared to patients without VTE, those with VTE were more likely to have received VTE prophylaxis (37% vs 30%, P < 0.001). However, models of patients receiving prophylaxis and of patients not receiving prophylaxis produced similar odds ratios for the various risk factors (Supporting Information Appendix Table 2); therefore, the final model includes both patients who did, and did not, receive VTE prophylaxis. In the multivariable model (Supporting Information Appendix Table 3), age, length of stay, gender, primary diagnosis, cancer, inflammatory bowel disease, obesity, central venous catheter, inherited thrombophilia, steroid use, mechanical ventilation, active chemotherapy, and urinary catheters were all associated with VTE (Table 3). The strongest risk factors were length of stay 6 days (OR 3.22, 95% CI 2.73, 3.79), central venous catheter (OR 1.87, 95% CI 1.52, 2.29), inflammatory bowel disease (OR 3.11, 95% CI 1.59, 6.08), and inherited thrombophilia (OR 4.00, 95% CI 0.98, 16.40). In addition, there were important interactions between age and cancer; cancer was a strong risk factor among younger patients, but is not as strong a risk factor among older patients (OR compared to young patients without cancer was 4.62 (95% CI 2.72, 7.87) for those age 1849 years, and 3.64 (95% CI 2.52, 5.25) for those aged 5064 years).
| Risk Factor | OR | 95% CI |
|---|---|---|
| ||
| Any prophylaxis | 0.98 | (0.84, 1.14) |
| Female | 0.85 | (0.74, 0.98) |
| Length of stay 6 days | 3.22 | (2.73, 3.79) |
| Age* | ||
| 18‐49 years | 1 | Referent |
| 50‐64 years | 1.15 | (0.86, 1.56) |
| >65 years | 1.51 | (1.17, 1.96) |
| Primary diagnosis | ||
| Pneumonia | 1 | Referent |
| Chronic obstructive pulmonary disease | 0.57 | (0.44, 0.75) |
| Stroke | 0.84 | (0.66, 1.08) |
| Congestive heart failure | 0.86 | (0.70, 1.06) |
| Urinary tract infection | 1.19 | (0.95, 1.50) |
| Respiratory failure | 1.15 | (0.85, 1.55) |
| Septicemia | 1.11 | (0.82, 1.50) |
| Comorbidities | ||
| Inflammatory bowel disease | 3.11 | (1.59, 6.08) |
| Obesity | 1.28 | (0.99, 1.66) |
| Inherited thrombophilia | 4.00 | (0.98, 16.40) |
| Cancer | ||
| 18‐49 years | 4.62 | (2.72, 7.87) |
| 50‐64 years | 3.64 | (2.52, 5.25) |
| >65 years | 2.17 | (1.61, 2.92) |
| Treatments | ||
| Central venous catheter | 1.87 | (1.52, 2.29) |
| Mechanical ventilation | 1.61 | (1.27, 2.05) |
| Urinary catheter | 1.17 | (0.99, 1.38) |
| Chemotherapy | 1.71 | (1.03, 2.83) |
| Steroids | 1.22 | (1.04, 1.43) |
In the derivation set, the multivariable model produced deciles of mean predicted risk from 0.11% to 1.45%, while mean observed risk over the same deciles ranged from 0.12% to 1.42% (Figure 1). Within the validation cohort, the observed rate of VTE was 0.46% (223 cases among 48,543 subjects). The expected rate according to the model was 0.43% (expected/observed ratio: 0.93 [95% CI 0.82, 1.06]). Model discrimination measured by the c‐statistic in the validation set was 0.75 (95% CI 0.71, 0.78). The model produced deciles of mean predicted risk from 0.11% to 1.46%, with mean observed risk over the same deciles from 0.17% to 1.81%. Risk gradient was relatively flat across the first 6 deciles, began to rise at the seventh decile, and rose sharply in the highest one. Using a risk threshold of 1%, the model had a sensitivity of 28% and a specificity of 93%. In the validation set, this translated into a positive predictive value of 2.2% and a negative predictive value of 99.7%. Assuming that VTE prophylaxis has an efficacy of 50%, the number‐needed‐to‐treat to prevent one VTE among high‐risk patients (predicted risk >1%) would be 91. In contrast, providing prophylaxis to the entire validation sample would result in a number‐needed‐to‐treat of 435. Using a lower treatment threshold of 0.4% produced a positive predictive value of 1% and a negative predictive value of 99.8%. At this threshold, the model would detect 73% of patients with VTE and the number‐needed‐to‐treat to prevent one VTE would be 200.

Discussion
In a representative sample of 243,000 hospitalized medical patients with at least one major risk factor for VTE, we found that symptomatic VTE was an uncommon event, occurring in approximately 1 in 231 patients. We identified a number of factors that were associated with an increased risk of VTE, but many previously cited risk factors did not show an association in multivariable models. In particular, patients with a primary diagnosis of COPD appeared not to share the same high risk of VTE as patients with the other diagnoses we examined, a finding reported by others.11 The risk model we developed accurately stratifies patients across a wide range of VTE probabilities, but even among those with the highest predicted rates, symptomatic VTE occurred in less than 2%.
VTE is often described as a frequent complication of hospitalization for medical illness and one of the most common potentially preventable causes of death. Indeed, rates of asymptomatic VTE have been demonstrated to be 3.7% to 26%.12 Although some of these might have fatal consequences, most are distal vein thromboses and their significance is unknown. In contrast, symptomatic events are uncommon, with previous estimates among general medical patients in observational studies in the range of 0.3%3 to 0.8%,12 similar to the rate observed in our study. Symptomatic event rates among control patients in landmark randomized trials have ranged from 0.86%13 to 2.3%,14 but these studies enrolled only very high‐risk patients with more extended hospitalizations, and may involve follow‐up periods of a month or more.
Because it is unlikely that our diagnostic algorithm was 100% sensitive, and because 30% of our patients received chemoprophylaxis, it is probable that we have underestimated the true rate of VTE in our sample. Among the patients who received prophylaxis, the observed rate of VTE was 0.54%. If we assume that prophylaxis is 50% effective, then had these patients not received prophylaxis, their rate of VTE would have been 1.08% (vs 0.39% among those patients who received no prophylaxis) and the overall rate of VTE for the sample would have been 0.60% (1.08 0.30 + 0.39 0.70). If we further assume that our algorithm was only 80% sensitive and 100% specific, the true underlying rate of symptomatic VTE could have been as high as 0.75%, still less than half that seen in randomized trials.
Prophylaxis with heparin has been shown to decrease the rate of both asymptomatic and symptomatic events, but because of the low prevalence, the number‐needed‐to‐treat to prevent one symptomatic pulmonary embolism has been estimated at 345, and prophylaxis has not been shown to affect all‐cause mortality.4, 15 At the same time, prophylaxis costs money, is uncomfortable, and carries a small risk of bleeding and heparin‐induced thrombocytopenia. Given the generally low incidence of symptomatic VTE, it therefore makes sense to reserve prophylaxis for patients at higher risk of thromboembolism.
To decide whether prophylaxis is appropriate for a given patient, it is necessary to quantify the patient's risk and then apply an appropriate threshold for treatment. The National Quality Forum (NQF) recommends,16 and JCAHO has adopted, that a clinician must evaluate each patient upon admission, and regularly thereafter, for the risk of developing DVT [deep vein thrombosis]/VTE. Until now, however, there has been no widely accepted, validated method to risk stratify medical patients. The ACCP recommendations cite just three studies of VTE risk factors in hospitalized medical patients.11, 17, 18 Together they examined 477 cases and 1197 controls, identifying congestive heart failure, pneumonia, cancer, and previous VTE as risk factors. Predictive models based on these factors17, 1921 have not been subjected to validation or have performed poorly.18 Acknowledging this lack of standardized risk assessment, JCAHO leaves the means of assessment to individual hospitals. A quality improvement guide published by the Agency for Healthcare Research and Quality goes one step further, stating that In a typical hospital, it is estimated that fewer than 5% of medical patients could be considered at low risk by most VTE risk stratification methods.22 The guide recommends near universal VTE prophylaxis.
In light of the JCAHO requirements, our model should be welcomed by hospitalists. Rather than assuming that all patients over 40 years of age are at high risk, our model will enable clinicians to risk stratify patients from a low of 0.1% to >1.4% (>10‐fold increase in risk). Moreover, the model was derived from more than 800 episodes of symptomatic VTE among almost 190,000 general medical patients and validated on almost 50,000 more. The observed patients were cared for in clinical practice at a nationally representative group of US hospitals, not in a highly selected clinical trial, increasing the generalizability of our findings. Finally, the model includes ten common risk factors that can easily be entered into decision support software or extracted automatically from the electronic medical record. Electronic reminder systems have already been shown to increase use of VTE prophylaxis, and prevent VTE, especially among cancer patients.23
A more challenging task is defining the appropriate risk threshold to initiate VTE prophylaxis. The Thromboembolic Risk Factors (THRIFT) Consensus Group classified patients according to risk of proximal DVT as low (<1%), moderate (1%‐10%), and high (>10%).21 They recommended heparin prophylaxis for all patients at moderate risk or higher. Although the patients included in our study all had a diagnosis that warranted prophylaxis according to the ACCP guidelines, using the THRIFT threshold for moderate‐to‐high risk, only 7% of our patients should have received prophylaxis. The recommendation not to offer heparin prophylaxis to patients with less than 1% chance of developing symptomatic VTE seems reasonable, given the large number‐needed‐to‐treat, but formal decision analyses should be conducted to better define this threshold. Many hospitalists, however, may feel uncomfortable using the 1% threshold, because our model failed to identify almost three out of four patients who ultimately experienced symptomatic VTE. At that threshold, it would seem that hospital‐acquired VTE is not a preventable complication in most medical patients, as others have pointed out.3, 24 Alternatively, if the threshold were lowered to 0.4%, our model could reduce the use of prophylaxis by 60%, while still identifying three‐fourths of all VTE cases. Further research is needed to know whether such a threshold is reasonable.
Our study has a number of important limitations. First, we relied on claims data, not chart review. We do not know for certain which patients experienced VTE, although our definition of VTE required diagnosis codes plus charges for both diagnosis and treatment. Moreover, our rates are similar to those observed in other trials where symptomatic events were confirmed. Second, about 30% of our patients received at least some VTE prophylaxis, and this may have prevented as many as half of the VTEs in that group. Without prophylaxis, rates might have been 20%30% higher. Similarly, we could not detect patients who were diagnosed after discharge but not admitted to hospital. While we believe this number to be small, it would again increase the rate slightly. Third, we could not assess certain clinical circumstances that are not associated with hospital charges or diagnosis codes, especially prolonged bed rest. Other risk factors, such as the urinary catheter, were probably surrogate markers for immobilization rather than true risk factors. Fourth, we included length of stay in our prediction model. We did this because most randomized trials of VTE prophylaxis included only patients with an expected length of stay 6 days. Physicians' estimates about probable length of stay may be less accurate than actual length of stay as a predictor of VTE. Moreover, the relationship may have been confounded if hospital‐acquired VTE led to longer lengths of stay. We think this unlikely since many of the events were discovered on readmission. Fifth, we studied only patients carrying high‐risk diagnoses, and therefore do not know the baseline risk for patients with less risky conditions, although it should be lower than what we observed. It seems probable that COPD, rather than being protective, as it appears in our model, actually represents the baseline risk for low‐risk diagnoses. It should be noted that we did include a number of other high‐risk diagnoses, such as cancer and inflammatory bowel disease, as secondary diagnoses. A larger, more inclusive study should be conducted to validate our model in other populations. Finally, we cannot know who died of undiagnosed VTE, either in the hospital or after discharge. Such an outcome would be important, but those events are likely to be rare, and VTE prophylaxis has not been shown to affect mortality.
VTE remains a daunting problem in hospitalized medical patients. Although VTE is responsible for a large number of hospital deaths each year, identifying patients at high risk for clinically important VTE is challenging, and may contribute to the persistently low rates of VTE prophylaxis seen in hospitals.25 Current efforts to treat nearly all patients are likely to lead to unnecessary cost, discomfort, and side effects. We present a simple logistic regression model that can easily identify patients at moderate‐to‐high risk (>1%) of developing symptomatic VTE. Future studies should focus on prospectively validating the model in a wider spectrum of medical illness, and better defining the appropriate risk cutoff for general prophylaxis.
Acknowledgements
The authors thank Aruna Priya, MS, for her help with some of the statistical analyses.
- ,,, et al.A comparison of enoxaparin with placebo for the prevention of venous thromboembolism in acutely ill medical patients. Prophylaxis in Medical Patients with Enoxaparin Study Group.N Engl J Med.1999;341(11):793–800.
- ,,, et al.Prevention of venous thromboembolism: American College of Chest Physicians Evidence‐Based Clinical Practice Guidelines (8th ed).Chest.2008;133(6 suppl):381S–453S.
- ,,.Thrombosis prophylaxis in hospitalised medical patients: does prophylaxis in all patients make sense?Neth J Med.2000;56(5):171–176.
- ,,,,.Pharmacological venous thromboembolism prophylaxis in hospitalized medical patients: a meta‐analysis of randomized controlled trials.Arch Intern Med.2007;167(14):1476–1486.
- The Joint Commission on the Accreditation of Healthcare Organizations. Venous thromboembolism (VTE) core measure set. Available at: http://www. jointcommission.org/PerformanceMeasurement/PerformanceMeasurement/VTE.htm. Accessed June 1,2009.
- ,,.Effective risk stratification of surgical and nonsurgical patients for venous thromboembolic disease.Semin Hematol.2001;38(2 suppl 5):12–19.
- ,,, et al.Assessment of venous thromboembolism risk and the benefits of thromboprophylaxis in medical patients.Thromb Haemost.2005;94(4):750–759.
- ,,, et al.Prevention of venous thromboembolism: the Seventh ACCP Conference on Antithrombotic and Thrombolytic Therapy.Chest.2004;126(3 suppl):338S–400S.
- ,,,.Comorbidity measures for use with administrative data.Med Care.1998;36(1):8–27.
- ,,,,,.Identification of in‐hospital complications from claims data. Is it valid?Med Care.2000;38(8):785–795.
- ,,, et al.Risk factors for venous thromboembolism in hospitalized patients with acute medical illness: analysis of the MEDENOX Study.Arch Intern Med.2004;164(9):963–968.
- ,,.The magnitude of an iatrogenic disorder: a systematic review of the incidence of venous thromboembolism for general medical inpatients.Thromb Haemost.2006;95(5):758–762.
- ,,,,,.Randomized, placebo‐controlled trial of dalteparin for the prevention of venous thromboembolism in acutely ill medical patients.Circulation.2004;110(7):874–879.
- .Randomised, controlled trial of low‐dose heparin for prevention of fatal pulmonary embolism in patients with infectious diseases. The Heparin Prophylaxis Study Group.Lancet.1996;347(9012):1357–1361.
- ,,,,.Meta‐analysis: anticoagulant prophylaxis to prevent symptomatic venous thromboembolism in hospitalized medical patients.Ann Intern Med.2007;146(4):278–288.
- National Quality Forum.National Voluntary Consensus Standards for Prevention and Care of Venous Thromboembolism: Policy, Preferred Practices, and Initial Performance Measures.Washington, DC;2006.
- ,,, et al.Risk factors for deep vein thrombosis in inpatients aged 65 and older: a case‐control multicenter study.J Am Geriatr Soc.2004;52(8):1299–1304.
- ,,.Risk factors for venous thrombosis in medical inpatients: validation of a thrombosis risk score.J Thromb Haemost.2004;2(12):2156–2161.
- ,,,,,.Venous thromboembolism prophylaxis and risk assessment in medical patients.Semin Thromb Hemost.1991;17(suppl 3):313–318.
- ,,, et al.A population‐based perspective of the hospital incidence and case‐fatality rates of deep vein thrombosis and pulmonary embolism. The Worcester DVT Study.Arch Intern Med.1991;151(5):933–938.
- Thromboembolic Risk Factors (THRIFT) Consensus Group.Risk of and prophylaxis for venous thromboembolism in hospital patients.BMJ.1992;305(6853):567–574.
- ,.Preventing Hospital‐Acquired Venous Thromboembolism: A Guide for Effective Quality Improvement. AHRQ Publication No. 08–0075.Rockville, MD:Agency for Healthcare Research and Quality;2008.
- ,,, et al.Electronic alerts to prevent venous thromboembolism among hospitalized patients.N Engl J Med.2005;352(10):969–977.
- ,,.Prophylaxis against venous thromboembolism.BMJ.1992;305(6862):1156.
- ,.Prevention of in‐hospital VTE: why can't we do better?Lancet.2008;371(9610):361–362.
Venous thromboembolism (VTE) is a major source of morbidity and mortality for hospitalized patients. Among medical patients at the highest risk, as many as 15% can be expected to develop a VTE during their hospital stay1, 2; however, among general medical patients, the incidence of symptomatic VTE is less than 1%,1 and potentially as low as 0.3%.3 Thromboprophylaxis with subcutaneous heparin reduces the risk of VTE by approximately 50%,4 and is therefore recommended for medical patients at high risk. However, heparin also increases the risk of bleeding and thrombocytopenia and thus should be avoided for patients at low risk of VTE. Consequently, the Joint Commission on Accreditation of Healthcare Organizations (JCAHO) recommends that all hospitalized medical patients receive a risk assessment for VTE.5
Certain disease states, including stroke, acute myocardial infarction, heart failure, respiratory disease, sepsis, and cancer, have been associated with increased risk for VTE, and, based on the inclusion criteria of several randomized trials, current American College of Chest Physicians (ACCP) guidelines recommend thromboprophylaxis for patients hospitalized with these diagnoses.2 However, evidence that these factors actually increase a patient's risk for VTE comes from studies of ambulatory patients and is often weak or conflicting. Existing risk‐stratification tools,6, 7 as well as the ACCP guidelines, have not been validated, and accordingly JCAHO does not specify how risk assessment should be conducted. In order to help clinicians better estimate the risk of VTE in medical patients and therefore to provide more targeted thromboprophylaxis, we examined a large cohort of patients with high‐risk diagnoses and created a risk stratification model.
Methods
Setting and Patients
We identified a retrospective cohort of patients discharged between January 1, 2004 and June 30, 2005 from 374 acute care facilities in the US that participated in Premier's Perspective, a database developed for measuring quality and healthcare utilization. Participating hospitals represent all regions of the US, and are generally similar in composition to US hospitals; however, in comparison to information contained in the American Hospital Association annual survey, Perspective hospitals are more likely to be located in the South and in urban areas. Available data elements include those derived from the uniform billing 04 form, such as sociodemographic information about each patient, their International Classification of Diseases, Ninth Revision, Clinical Modification (ICD‐9‐CM) diagnosis and procedure codes, as well as hospital and physician information. This information is supplemented with a date‐stamped log of all items and services billed to the patient or insurer, including diagnostic tests, medications, and other treatments. Permission to conduct the study was obtained from the Institutional Review Board at Baystate Medical Center.
We included all patients age 18 years at moderate‐to‐high risk of VTE according to the ACCP recommendations,8 based on a principal diagnosis of pneumonia, septicemia or respiratory failure with pneumonia, heart failure, chronic obstructive pulmonary disease (COPD), stroke, and urinary tract infection. Diagnoses were assessed using ICD‐9‐CM codes. Patients who were prescribed warfarin or therapeutic doses of heparin on hospital day 1 or 2, and those who received >1 therapeutic dose of heparin but otherwise did not fulfill criteria for VTE, were excluded because we could not evaluate whether they experienced a VTE event during hospitalization. We also excluded patients whose length of stay was <3 days, because our definition of hospital‐acquired VTE required treatment begun on day 3 or later, and those with an indication for anticoagulation other than VTE (eg, prosthetic cardiac valve or atrial fibrillation), because we could not reliably distinguish treatment for VTE from treatment of the underlying condition.
Risk Factors
For each patient, we extracted age, gender, race/ethnicity, and insurance status, principal diagnosis, comorbidities, and specialty of the attending physician. Comorbidities were identified from ICD‐9‐CM secondary diagnosis codes and Diagnosis Related Groups using Healthcare Cost and Utilization Project Comorbidity Software, version 3.1, based on the work of Elixhauser et al.9 We also assessed risk factors which have been previously linked to VTE: paralysis, cancer (metastatic, solid tumor, and lymphoma), chemotherapy/radiation, prior VTE, use of estrogens and estrogen modulators, inflammatory bowel disease, nephrotic syndrome, myeloproliferative disorders, obesity, smoking, central venous catheter, inherited or acquired thrombophilia, steroid use, mechanical ventilation, urinary catheter, decubitus ulcer, HMGco‐A reductase inhibitors, restraints, diabetes, varicose veins, and length‐of‐stay 6 days. These additional comorbidities were defined based on the presence of specific ICD‐9 codes, while use of HMG‐co‐A reductase inhibitors were identified from medication charge files. We also noted whether patients received anticoagulants, the dosages and days of administration, as well as intermittent pneumatic compression devices.
Identification of VTE
Because the presence of a secondary diagnosis of VTE in medical patients is not a reliable way of differentiating hospital‐acquired VTE from those present at the time of admission,10 subjects were considered to have experienced a hospital‐acquired VTE only if they underwent a diagnostic test for VTE (lower extremity ultrasound, venography, CT angiogram, ventilation‐perfusion scan, or pulmonary angiogram) on hospital day 3 or later, received treatment for VTE for at least 50% of the remaining hospital stay, or until initiation of warfarin or appearance of a complication (eg, transfusion or treatment for heparin‐induced thrombocytopenia) and were given a secondary diagnosis of VTE (ICD‐9 diagnoses 453.4, 453.40, 453.41, 453.42, 453.8, 453.9, 415.1, 415.11, 415.19). We considered the following to be treatments for VTE: intravenous unfractionated heparin, >60 mg of enoxaparin, 7500 mg of dalteparin, or placement of an inferior vena cava filter. In addition, patients who were readmitted within 30 days of discharge with a primary diagnosis of VTE were also considered to have developed a VTE as a complication of their previous hospital stay.
Statistical Analysis
Univariate predictors of VTE were assessed using chi‐square tests. We developed a multivariable logistic regression model for VTE on an 80% randomly selected subset of the eligible admissions (the derivation cohort) using all measured risk factors for VTE and selected interaction terms. Generalized estimating equations (GEE) models with a logit link (SAS PROC GENMOD) were used to account for the clustering of patients within hospitals. Initial models were stratified on VTE prophylaxis. Factors significant at P < 0.05 were retained. Parameter estimates derived from the model were used to compute individual VTE risk in the remaining 20% of the admissions (the validation cohort). Discrimination in the validation model was assessed by the c‐statistic, as well as the expected/observed ratio. Both cohorts were categorized by decile of risk, based on the probability distribution in the derivation cohort, and observed VTE events compared to those predicted by the model. All analyses were performed using the Statistical Analysis System (version 9.1, SAS Institute, Inc., Cary, NC).
Role of the Funding Source
This study was supported by a Clinical Scientist Development Award from the Doris Duke Charitable Foundation. The funding source had no role in the study design, analysis, or interpretation of the data.
Results
Our sample contained 242,738 patients, 194,198 (80%) assigned to the derivation set and 48,540 (20%) to the validation set. Patient characteristics were similar in both sets (Supporting Information Appendix Table 1). Most patients were over age 65, 59% were female, and 64% were white (Table 1). The most common primary diagnoses were pneumonia (33%) and congestive heart failure (19%). The most common comorbidities were hypertension (50%), diabetes (31%), chronic pulmonary disease (30%), and anemia (20%). Most patients were cared for by internists (54%) or family practitioners (21%), and 30% received some form of anticoagulant VTE prophylaxis (Table 2). Of patients with an ICD‐9 code for VTE during hospitalization, just over half lacked either diagnostic testing, treatment, or both, leaving 612 (0.25%) patients who fulfilled our criteria for VTE; an additional 440 (0.18%) were readmitted for VTE, for an overall incidence of 0.43%. Patients with a length of stay 6 days had an incidence of 0.79% vs 0.19% for patients with shorter stays.
| Total | No VTE | VTE | |||||
|---|---|---|---|---|---|---|---|
| Variable | N | % | N | % | N | % | P‐Value |
| Total | 242,738 | 100 | 241,686 | 100.0 | 1,052 | 100.0 | |
| Demographics | |||||||
| Age | 0.20 | ||||||
| 18‐49 | 31,065 | 12.8 | 30,952 | 12.8 | 113 | 10.7 | |
| 50‐64 | 51,309 | 21.1 | 51,083 | 21.1 | 226 | 21.5 | |
| 65‐74 | 51,230 | 21.1 | 50,993 | 21.1 | 237 | 22.5 | |
| 75+ | 109,134 | 45.0 | 108,658 | 45.0 | 476 | 45.2 | |
| Female | 142,910 | 58.9 | 142,330 | 58.9 | 580 | 55.1 | 0.01 |
| Race/ethnicity | 0.49 | ||||||
| White | 155,866 | 64.2 | 155,189 | 64.2 | 677 | 64.4 | |
| Black | 41,556 | 17.1 | 41,374 | 17.1 | 182 | 17.3 | |
| Hispanic | 9,809 | 4.0 | 9,776 | 4.0 | 33 | 3.1 | |
| Other | 35,507 | 14.6 | 35,347 | 14.6 | 160 | 15.2 | |
| Marital status | 0.28 | ||||||
| Married/life partner | 88,035 | 36.3 | 87,627 | 36.3 | 408 | 38.8 | |
| Single | 39,254 | 16.2 | 39,103 | 16.2 | 151 | 14.4 | |
| Separated/divorced | 23,492 | 9.7 | 23,394 | 9.7 | 98 | 9.3 | |
| Widowed | 58,669 | 24.2 | 58,426 | 24.2 | 243 | 23.1 | |
| Other | 33,288 | 13.7 | 33,136 | 13.7 | 152 | 14.4 | |
| Admission characteristics | |||||||
| Primary diagnosis | <0.001 | ||||||
| Community‐acquired pneumonia | 81,171 | 33.4 | 80,792 | 33.4 | 379 | 36.0 | |
| Septicemia | 7,643 | 3.2 | 7,568 | 3.1 | 75 | 7.1 | |
| Chronic obstructive pulmonary disease | 35,116 | 14.5 | 35,027 | 14.5 | 89 | 8.5 | |
| Respiratory failure | 7,098 | 2.9 | 7,012 | 2.9 | 86 | 8.2 | |
| Congestive heart failure | 46,503 | 19.2 | 46,336 | 19.2 | 167 | 15.9 | |
| Cardiovascular disease | 33,044 | 13.6 | 32,931 | 13.6 | 113 | 10.7 | |
| Urinary tract infection | 32,163 | 13.3 | 32,020 | 13.2 | 143 | 13.6 | |
| Insurance payer | 0.93 | ||||||
| Medicare traditional | 157,609 | 64.9 | 156,927 | 64.9 | 682 | 64.8 | |
| Medicare managed care | 10,649 | 4.4 | 10,597 | 4.4 | 52 | 4.9 | |
| Medicaid | 17,796 | 7.3 | 17,720 | 7.3 | 76 | 7.2 | |
| Private | 44,858 | 18.5 | 44,665 | 18.5 | 193 | 18.3 | |
| Self‐pay/uninsured/other | 11,826 | 4.9 | 11,777 | 4.9 | 49 | 4.7 | |
| Admitted from skilled nursing facility | 3,003 | 1.2 | 2,980 | 1.2 | 23 | 2.2 | 0.005 |
| Risk factors | |||||||
| Any VTE prophylaxis | 72,558 | 29.9 | 72,164 | 29.9 | 394 | 37.5 | <0.001 |
| Length of stay 6 days | 99,463 | 41.0 | 98,680 | 40.8 | 783 | 74.4 | <0.001 |
| Paralysis | 16,764 | 6.9 | 16,689 | 6.9 | 75 | 7.1 | 0.77 |
| Metastatic cancer | 5,013 | 2.1 | 4,928 | 2.0 | 85 | 8.1 | <0.001 |
| Solid tumor without metastasis | 25,127 | 10.4 | 24,995 | 10.3 | 132 | 12.5 | 0.02 |
| Lymphoma | 3,026 | 1.2 | 2,995 | 1.2 | 31 | 2.9 | <0.001 |
| Cancer chemotherapy/radiation | 1,254 | 0.5 | 1,231 | 0.5 | 23 | 2.2 | <0.001 |
| Prior venous thromboembolism | 2,945 | 1.2 | 2,926 | 1.2 | 19 | 1.8 | 0.08 |
| Estrogens | 4,819 | 2.0 | 4,807 | 2.0 | 12 | 1.1 | 0.05 |
| Estrogen modulators | 2,102 | 0.9 | 2,091 | 0.9 | 11 | 1.0 | 0.53 |
| Inflammatory bowel disease | 814 | 0.3 | 803 | 0.3 | 11 | 1.0 | <0.001 |
| Nephrotic syndrome | 520 | 0.2 | 517 | 0.2 | 3 | 0.3 | 0.62 |
| Myeloproliferative disorder | 1,983 | 0.8 | 1,973 | 0.8 | 10 | 1.0 | 0.63 |
| Obesity | 16,938 | 7.0 | 16,856 | 7.0 | 82 | 7.8 | 0.30 |
| Smoking | 35,386 | 14.6 | 35,284 | 14.6 | 102 | 9.7 | <0.001 |
| Central venous catheter | 14,754 | 6.1 | 14,525 | 6.0 | 229 | 21.8 | <0.001 |
| Inherited or acquired thrombophilia | 114 | 0.1 | 108 | 0.0 | 6 | 0.6 | <0.001 |
| Steroids | 82,606 | 34.0 | 82,185 | 34.0 | 421 | 40.0 | <0.001 |
| Mechanical ventilation | 13,347 | 5.5 | 13,167 | 5.4 | 180 | 17.1 | <0.001 |
| Urinary catheter | 39,080 | 16.1 | 38,816 | 16.1 | 264 | 25.1 | <0.001 |
| Decubitus ulcer | 6,829 | 2.8 | 6,776 | 2.8 | 53 | 5.0 | <0.001 |
| Statins use | 57,282 | 23.6 | 57,068 | 23.6 | 214 | 20.3 | 0.01 |
| Use of restraints | 5,970 | 2.5 | 5,914 | 2.4 | 56 | 5.3 | <0.001 |
| Diabetes mellitus | 75,103 | 30.9 | 74,799 | 30.9 | 304 | 28.9 | 0.15 |
| Varicose veins | 166 | 0.1 | 165 | 0.1 | 1 | 0.1 | 0.74 |
| Comorbidities | |||||||
| Hypertension | 120,606 | 49.7 | 120,126 | 49.7 | 480 | 45.6 | 0.008 |
| Congestive heart failure | 18,900 | 7.8 | 18,793 | 7.8 | 107 | 10.2 | 0.004 |
| Peripheral vascular disease | 16,705 | 6.9 | 16,639 | 6.9 | 66 | 6.3 | 0.43 |
| Valvular disease | 13,683 | 5.6 | 13,628 | 5.6 | 55 | 5.2 | 0.56 |
| Pulmonary circulation disease | 5,530 | 2.3 | 5,492 | 2.3 | 38 | 3.6 | 0.004 |
| Chronic pulmonary disease | 72,028 | 29.7 | 71,698 | 29.7 | 330 | 31.4 | 0.23 |
| Respiratory failure second diagnosis | 13,027 | 5.4 | 12,893 | 5.3 | 134 | 12.7 | <0.001 |
| Rheumatoid arthritis/collagen vascular disease | 7,090 | 2.9 | 7,050 | 2.9 | 40 | 3.8 | 0.09 |
| Deficiency anemias | 49,605 | 20.4 | 49,352 | 20.4 | 253 | 24.0 | 0.004 |
| Weight loss | 8,810 | 3.6 | 8,714 | 3.6 | 96 | 9.1 | <0.001 |
| Peptic ulcer disease bleeding | 4,736 | 2.0 | 4,723 | 2.0 | 13 | 1.2 | 0.09 |
| Chronic blood loss anemia | 2,354 | 1.0 | 2,338 | 1.0 | 16 | 1.5 | 0.07 |
| Hypothyroidism | 28,773 | 11.9 | 28,668 | 11.9 | 105 | 10.0 | 0.06 |
| Renal failure | 19,768 | 8.1 | 19,669 | 8.1 | 99 | 9.4 | 0.13 |
| Liver disease | 4,682 | 1.9 | 4,657 | 1.9 | 25 | 2.4 | 0.29 |
| Other neurological disorders | 33,094 | 13.6 | 32,905 | 13.6 | 189 | 18.0 | <0.001 |
| Psychoses | 9,330 | 3.8 | 9,283 | 3.8 | 47 | 4.5 | 0.29 |
| Depression | 25,561 | 10.5 | 25,442 | 10.5 | 119 | 11.3 | 0.41 |
| Alcohol abuse | 7,756 | 3.2 | 7,727 | 3.2 | 29 | 2.8 | 0.42 |
| Drug abuse | 4,336 | 1.8 | 4,318 | 1.8 | 18 | 1.7 | 0.85 |
| Acquired immune deficiency syndrome | 1,048 | 0.4 | 1,045 | 0.4 | 3 | 0.3 | 0.47 |
| Total | Derivation | Validation | |||||
|---|---|---|---|---|---|---|---|
| Variable | N | % | N | % | N | % | P‐Value |
| |||||||
| Total | 242,738 | 100 | 194,198 | 100 | 48,540 | 100 | |
| VTE prophylaxis | 0.97 | ||||||
| No prophylaxis | 170,180 | 70.1 | 136,153 | 70.1 | 34,027 | 70.1 | |
| Any prophylaxis | 72,558 | 29.9 | 58,045 | 29.9 | 14,513 | 29.9 | |
| Outcomes | |||||||
| ICD‐9 code for VTE | 1,304 | 0.5 | 1,025 | 0.5 | 279 | 0.6 | 0.21 |
| ICD‐9 code + diagnostic test | 989 | 0.4 | 777 | 0.4 | 212 | 0.4 | 0.26 |
| ICD‐9 code + diagnostic test + treatment for VTE | 612 | 0.3 | 471 | 0.2 | 141 | 0.3 | 0.06 |
| Readmission for VTE within 30 days | 446 | 0.2 | 363 | 0.2 | 83 | 0.2 | 0.46 |
| Total hospital‐acquired VTE | 1,052 | 0.4 | 829 | 0.4 | 223 | 0.5 | 0.33 |
| In‐hospital mortality | 8,019 | 3.3 | 6,403 | 3.3 | 1,616 | 3.3 | 0.72 |
| Any readmission within 30 days | 28,664 | 11.8 | 22,885 | 11.8 | 5,779 | 11.9 | 0.46 |
Risk factors for VTE
A large number of patient and hospital factors were associated with the development of VTE (Table 1). Due to the large sample size, even weak associations appear highly statistically significant. Compared to patients without VTE, those with VTE were more likely to have received VTE prophylaxis (37% vs 30%, P < 0.001). However, models of patients receiving prophylaxis and of patients not receiving prophylaxis produced similar odds ratios for the various risk factors (Supporting Information Appendix Table 2); therefore, the final model includes both patients who did, and did not, receive VTE prophylaxis. In the multivariable model (Supporting Information Appendix Table 3), age, length of stay, gender, primary diagnosis, cancer, inflammatory bowel disease, obesity, central venous catheter, inherited thrombophilia, steroid use, mechanical ventilation, active chemotherapy, and urinary catheters were all associated with VTE (Table 3). The strongest risk factors were length of stay 6 days (OR 3.22, 95% CI 2.73, 3.79), central venous catheter (OR 1.87, 95% CI 1.52, 2.29), inflammatory bowel disease (OR 3.11, 95% CI 1.59, 6.08), and inherited thrombophilia (OR 4.00, 95% CI 0.98, 16.40). In addition, there were important interactions between age and cancer; cancer was a strong risk factor among younger patients, but is not as strong a risk factor among older patients (OR compared to young patients without cancer was 4.62 (95% CI 2.72, 7.87) for those age 1849 years, and 3.64 (95% CI 2.52, 5.25) for those aged 5064 years).
| Risk Factor | OR | 95% CI |
|---|---|---|
| ||
| Any prophylaxis | 0.98 | (0.84, 1.14) |
| Female | 0.85 | (0.74, 0.98) |
| Length of stay 6 days | 3.22 | (2.73, 3.79) |
| Age* | ||
| 18‐49 years | 1 | Referent |
| 50‐64 years | 1.15 | (0.86, 1.56) |
| >65 years | 1.51 | (1.17, 1.96) |
| Primary diagnosis | ||
| Pneumonia | 1 | Referent |
| Chronic obstructive pulmonary disease | 0.57 | (0.44, 0.75) |
| Stroke | 0.84 | (0.66, 1.08) |
| Congestive heart failure | 0.86 | (0.70, 1.06) |
| Urinary tract infection | 1.19 | (0.95, 1.50) |
| Respiratory failure | 1.15 | (0.85, 1.55) |
| Septicemia | 1.11 | (0.82, 1.50) |
| Comorbidities | ||
| Inflammatory bowel disease | 3.11 | (1.59, 6.08) |
| Obesity | 1.28 | (0.99, 1.66) |
| Inherited thrombophilia | 4.00 | (0.98, 16.40) |
| Cancer | ||
| 18‐49 years | 4.62 | (2.72, 7.87) |
| 50‐64 years | 3.64 | (2.52, 5.25) |
| >65 years | 2.17 | (1.61, 2.92) |
| Treatments | ||
| Central venous catheter | 1.87 | (1.52, 2.29) |
| Mechanical ventilation | 1.61 | (1.27, 2.05) |
| Urinary catheter | 1.17 | (0.99, 1.38) |
| Chemotherapy | 1.71 | (1.03, 2.83) |
| Steroids | 1.22 | (1.04, 1.43) |
In the derivation set, the multivariable model produced deciles of mean predicted risk from 0.11% to 1.45%, while mean observed risk over the same deciles ranged from 0.12% to 1.42% (Figure 1). Within the validation cohort, the observed rate of VTE was 0.46% (223 cases among 48,543 subjects). The expected rate according to the model was 0.43% (expected/observed ratio: 0.93 [95% CI 0.82, 1.06]). Model discrimination measured by the c‐statistic in the validation set was 0.75 (95% CI 0.71, 0.78). The model produced deciles of mean predicted risk from 0.11% to 1.46%, with mean observed risk over the same deciles from 0.17% to 1.81%. Risk gradient was relatively flat across the first 6 deciles, began to rise at the seventh decile, and rose sharply in the highest one. Using a risk threshold of 1%, the model had a sensitivity of 28% and a specificity of 93%. In the validation set, this translated into a positive predictive value of 2.2% and a negative predictive value of 99.7%. Assuming that VTE prophylaxis has an efficacy of 50%, the number‐needed‐to‐treat to prevent one VTE among high‐risk patients (predicted risk >1%) would be 91. In contrast, providing prophylaxis to the entire validation sample would result in a number‐needed‐to‐treat of 435. Using a lower treatment threshold of 0.4% produced a positive predictive value of 1% and a negative predictive value of 99.8%. At this threshold, the model would detect 73% of patients with VTE and the number‐needed‐to‐treat to prevent one VTE would be 200.
Discussion
In a representative sample of 243,000 hospitalized medical patients with at least one major risk factor for VTE, we found that symptomatic VTE was an uncommon event, occurring in approximately 1 in 231 patients. We identified a number of factors that were associated with an increased risk of VTE, but many previously cited risk factors did not show an association in multivariable models. In particular, patients with a primary diagnosis of COPD appeared not to share the same high risk of VTE as patients with the other diagnoses we examined, a finding reported by others.11 The risk model we developed accurately stratifies patients across a wide range of VTE probabilities, but even among those with the highest predicted rates, symptomatic VTE occurred in less than 2%.
VTE is often described as a frequent complication of hospitalization for medical illness and one of the most common potentially preventable causes of death. Indeed, rates of asymptomatic VTE have been demonstrated to be 3.7% to 26%.12 Although some of these might have fatal consequences, most are distal vein thromboses and their significance is unknown. In contrast, symptomatic events are uncommon, with previous estimates among general medical patients in observational studies in the range of 0.3%3 to 0.8%,12 similar to the rate observed in our study. Symptomatic event rates among control patients in landmark randomized trials have ranged from 0.86%13 to 2.3%,14 but these studies enrolled only very high‐risk patients with more extended hospitalizations, and may involve follow‐up periods of a month or more.
Because it is unlikely that our diagnostic algorithm was 100% sensitive, and because 30% of our patients received chemoprophylaxis, it is probable that we have underestimated the true rate of VTE in our sample. Among the patients who received prophylaxis, the observed rate of VTE was 0.54%. If we assume that prophylaxis is 50% effective, then had these patients not received prophylaxis, their rate of VTE would have been 1.08% (vs 0.39% among those patients who received no prophylaxis) and the overall rate of VTE for the sample would have been 0.60% (1.08 0.30 + 0.39 0.70). If we further assume that our algorithm was only 80% sensitive and 100% specific, the true underlying rate of symptomatic VTE could have been as high as 0.75%, still less than half that seen in randomized trials.
Prophylaxis with heparin has been shown to decrease the rate of both asymptomatic and symptomatic events, but because of the low prevalence, the number‐needed‐to‐treat to prevent one symptomatic pulmonary embolism has been estimated at 345, and prophylaxis has not been shown to affect all‐cause mortality.4, 15 At the same time, prophylaxis costs money, is uncomfortable, and carries a small risk of bleeding and heparin‐induced thrombocytopenia. Given the generally low incidence of symptomatic VTE, it therefore makes sense to reserve prophylaxis for patients at higher risk of thromboembolism.
To decide whether prophylaxis is appropriate for a given patient, it is necessary to quantify the patient's risk and then apply an appropriate threshold for treatment. The National Quality Forum (NQF) recommends,16 and JCAHO has adopted, that a clinician must evaluate each patient upon admission, and regularly thereafter, for the risk of developing DVT [deep vein thrombosis]/VTE. Until now, however, there has been no widely accepted, validated method to risk stratify medical patients. The ACCP recommendations cite just three studies of VTE risk factors in hospitalized medical patients.11, 17, 18 Together they examined 477 cases and 1197 controls, identifying congestive heart failure, pneumonia, cancer, and previous VTE as risk factors. Predictive models based on these factors17, 1921 have not been subjected to validation or have performed poorly.18 Acknowledging this lack of standardized risk assessment, JCAHO leaves the means of assessment to individual hospitals. A quality improvement guide published by the Agency for Healthcare Research and Quality goes one step further, stating that In a typical hospital, it is estimated that fewer than 5% of medical patients could be considered at low risk by most VTE risk stratification methods.22 The guide recommends near universal VTE prophylaxis.
In light of the JCAHO requirements, our model should be welcomed by hospitalists. Rather than assuming that all patients over 40 years of age are at high risk, our model will enable clinicians to risk stratify patients from a low of 0.1% to >1.4% (>10‐fold increase in risk). Moreover, the model was derived from more than 800 episodes of symptomatic VTE among almost 190,000 general medical patients and validated on almost 50,000 more. The observed patients were cared for in clinical practice at a nationally representative group of US hospitals, not in a highly selected clinical trial, increasing the generalizability of our findings. Finally, the model includes ten common risk factors that can easily be entered into decision support software or extracted automatically from the electronic medical record. Electronic reminder systems have already been shown to increase use of VTE prophylaxis, and prevent VTE, especially among cancer patients.23
A more challenging task is defining the appropriate risk threshold to initiate VTE prophylaxis. The Thromboembolic Risk Factors (THRIFT) Consensus Group classified patients according to risk of proximal DVT as low (<1%), moderate (1%‐10%), and high (>10%).21 They recommended heparin prophylaxis for all patients at moderate risk or higher. Although the patients included in our study all had a diagnosis that warranted prophylaxis according to the ACCP guidelines, using the THRIFT threshold for moderate‐to‐high risk, only 7% of our patients should have received prophylaxis. The recommendation not to offer heparin prophylaxis to patients with less than 1% chance of developing symptomatic VTE seems reasonable, given the large number‐needed‐to‐treat, but formal decision analyses should be conducted to better define this threshold. Many hospitalists, however, may feel uncomfortable using the 1% threshold, because our model failed to identify almost three out of four patients who ultimately experienced symptomatic VTE. At that threshold, it would seem that hospital‐acquired VTE is not a preventable complication in most medical patients, as others have pointed out.3, 24 Alternatively, if the threshold were lowered to 0.4%, our model could reduce the use of prophylaxis by 60%, while still identifying three‐fourths of all VTE cases. Further research is needed to know whether such a threshold is reasonable.
Our study has a number of important limitations. First, we relied on claims data, not chart review. We do not know for certain which patients experienced VTE, although our definition of VTE required diagnosis codes plus charges for both diagnosis and treatment. Moreover, our rates are similar to those observed in other trials where symptomatic events were confirmed. Second, about 30% of our patients received at least some VTE prophylaxis, and this may have prevented as many as half of the VTEs in that group. Without prophylaxis, rates might have been 20%30% higher. Similarly, we could not detect patients who were diagnosed after discharge but not admitted to hospital. While we believe this number to be small, it would again increase the rate slightly. Third, we could not assess certain clinical circumstances that are not associated with hospital charges or diagnosis codes, especially prolonged bed rest. Other risk factors, such as the urinary catheter, were probably surrogate markers for immobilization rather than true risk factors. Fourth, we included length of stay in our prediction model. We did this because most randomized trials of VTE prophylaxis included only patients with an expected length of stay 6 days. Physicians' estimates about probable length of stay may be less accurate than actual length of stay as a predictor of VTE. Moreover, the relationship may have been confounded if hospital‐acquired VTE led to longer lengths of stay. We think this unlikely since many of the events were discovered on readmission. Fifth, we studied only patients carrying high‐risk diagnoses, and therefore do not know the baseline risk for patients with less risky conditions, although it should be lower than what we observed. It seems probable that COPD, rather than being protective, as it appears in our model, actually represents the baseline risk for low‐risk diagnoses. It should be noted that we did include a number of other high‐risk diagnoses, such as cancer and inflammatory bowel disease, as secondary diagnoses. A larger, more inclusive study should be conducted to validate our model in other populations. Finally, we cannot know who died of undiagnosed VTE, either in the hospital or after discharge. Such an outcome would be important, but those events are likely to be rare, and VTE prophylaxis has not been shown to affect mortality.
VTE remains a daunting problem in hospitalized medical patients. Although VTE is responsible for a large number of hospital deaths each year, identifying patients at high risk for clinically important VTE is challenging, and may contribute to the persistently low rates of VTE prophylaxis seen in hospitals.25 Current efforts to treat nearly all patients are likely to lead to unnecessary cost, discomfort, and side effects. We present a simple logistic regression model that can easily identify patients at moderate‐to‐high risk (>1%) of developing symptomatic VTE. Future studies should focus on prospectively validating the model in a wider spectrum of medical illness, and better defining the appropriate risk cutoff for general prophylaxis.
Acknowledgements
The authors thank Aruna Priya, MS, for her help with some of the statistical analyses.
- ,,, et al.A comparison of enoxaparin with placebo for the prevention of venous thromboembolism in acutely ill medical patients. Prophylaxis in Medical Patients with Enoxaparin Study Group.N Engl J Med.1999;341(11):793–800.
- ,,, et al.Prevention of venous thromboembolism: American College of Chest Physicians Evidence‐Based Clinical Practice Guidelines (8th ed).Chest.2008;133(6 suppl):381S–453S.
- ,,.Thrombosis prophylaxis in hospitalised medical patients: does prophylaxis in all patients make sense?Neth J Med.2000;56(5):171–176.
- ,,,,.Pharmacological venous thromboembolism prophylaxis in hospitalized medical patients: a meta‐analysis of randomized controlled trials.Arch Intern Med.2007;167(14):1476–1486.
- The Joint Commission on the Accreditation of Healthcare Organizations. Venous thromboembolism (VTE) core measure set. Available at: http://www. jointcommission.org/PerformanceMeasurement/PerformanceMeasurement/VTE.htm. Accessed June 1,2009.
- ,,.Effective risk stratification of surgical and nonsurgical patients for venous thromboembolic disease.Semin Hematol.2001;38(2 suppl 5):12–19.
- ,,, et al.Assessment of venous thromboembolism risk and the benefits of thromboprophylaxis in medical patients.Thromb Haemost.2005;94(4):750–759.
- ,,, et al.Prevention of venous thromboembolism: the Seventh ACCP Conference on Antithrombotic and Thrombolytic Therapy.Chest.2004;126(3 suppl):338S–400S.
- ,,,.Comorbidity measures for use with administrative data.Med Care.1998;36(1):8–27.
- ,,,,,.Identification of in‐hospital complications from claims data. Is it valid?Med Care.2000;38(8):785–795.
- ,,, et al.Risk factors for venous thromboembolism in hospitalized patients with acute medical illness: analysis of the MEDENOX Study.Arch Intern Med.2004;164(9):963–968.
- ,,.The magnitude of an iatrogenic disorder: a systematic review of the incidence of venous thromboembolism for general medical inpatients.Thromb Haemost.2006;95(5):758–762.
- ,,,,,.Randomized, placebo‐controlled trial of dalteparin for the prevention of venous thromboembolism in acutely ill medical patients.Circulation.2004;110(7):874–879.
- .Randomised, controlled trial of low‐dose heparin for prevention of fatal pulmonary embolism in patients with infectious diseases. The Heparin Prophylaxis Study Group.Lancet.1996;347(9012):1357–1361.
- ,,,,.Meta‐analysis: anticoagulant prophylaxis to prevent symptomatic venous thromboembolism in hospitalized medical patients.Ann Intern Med.2007;146(4):278–288.
- National Quality Forum.National Voluntary Consensus Standards for Prevention and Care of Venous Thromboembolism: Policy, Preferred Practices, and Initial Performance Measures.Washington, DC;2006.
- ,,, et al.Risk factors for deep vein thrombosis in inpatients aged 65 and older: a case‐control multicenter study.J Am Geriatr Soc.2004;52(8):1299–1304.
- ,,.Risk factors for venous thrombosis in medical inpatients: validation of a thrombosis risk score.J Thromb Haemost.2004;2(12):2156–2161.
- ,,,,,.Venous thromboembolism prophylaxis and risk assessment in medical patients.Semin Thromb Hemost.1991;17(suppl 3):313–318.
- ,,, et al.A population‐based perspective of the hospital incidence and case‐fatality rates of deep vein thrombosis and pulmonary embolism. The Worcester DVT Study.Arch Intern Med.1991;151(5):933–938.
- Thromboembolic Risk Factors (THRIFT) Consensus Group.Risk of and prophylaxis for venous thromboembolism in hospital patients.BMJ.1992;305(6853):567–574.
- ,.Preventing Hospital‐Acquired Venous Thromboembolism: A Guide for Effective Quality Improvement. AHRQ Publication No. 08–0075.Rockville, MD:Agency for Healthcare Research and Quality;2008.
- ,,, et al.Electronic alerts to prevent venous thromboembolism among hospitalized patients.N Engl J Med.2005;352(10):969–977.
- ,,.Prophylaxis against venous thromboembolism.BMJ.1992;305(6862):1156.
- ,.Prevention of in‐hospital VTE: why can't we do better?Lancet.2008;371(9610):361–362.
Copyright © 2011 Society of Hospital Medicine
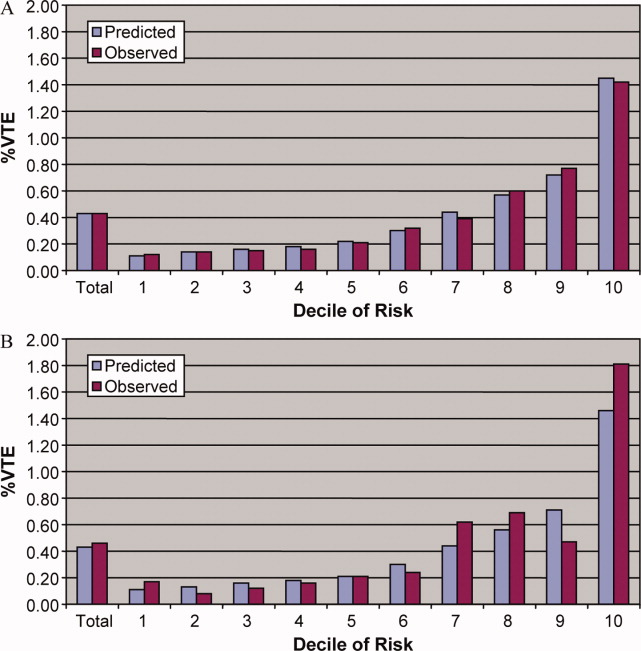
Macrolides and Quinolones for AECOPD
Acute exacerbations of chronic obstructive pulmonary disease (AECOPD) are responsible for more than 600,000 hospitalizations annually, resulting in direct costs of over $20 billion.1 Bacterial infections appear responsible for 50% of such exacerbations,25 and current COPD guidelines recommend treatment with antibiotics for patients with severe exacerbations or a change in sputum.1,69 These recommendations are based on a number of small randomized trials, most of which were conducted more than 20 years ago using narrow spectrum antibiotics that are no longer commonly used.10 Only 4 studies, totaling 321 subjects, included hospitalized patients, and most studies excluded patients who required steroids. Because no clinical trials have compared different antibiotic regimens for AECOPD, existing guidelines offer a range of treatment options, including amoxicillin‐clavulonate, macrolides, quinolones, cephalosporins, aminopenicillins, and tetracyclines.
Among hospitalized patients, macrolides and quinolones appear to be the most frequently prescribed antibiotics.11 Both are available in oral formulations, have excellent bioavailability, and are administered once daily. In addition to their antimicrobial activity, macrolides are believed to have antiinflammatory effects, which could be especially advantageous in AECOPD.1214 In trials of chronic bronchitis, however, fluoroquinolones have been shown to reduce the risk of recurrent exacerbation when compared to macrolides.15 The wide variation that has been observed in antibiotic selection for patients hospitalized for AECOPD suggests a high degree of uncertainty among clinicians about the benefits of different treatment options.11 Given the limited evidence from randomized trials, we sought to evaluate the comparative effectiveness of macrolides and quinolones among a large, representative sample of patients hospitalized with AECOPD.
Subjects and Methods
Setting and Subjects
We conducted a retrospective cohort study of all patients hospitalized between January 1 and December 31, 2001 for AECOPD at any 1 of 375 acute care facilities in the United States that participated in Premier's Perspective, a voluntary, fee‐supported database developed for measuring quality and healthcare utilization. Participating hospitals represent all geographical regions, and are primarily small‐sized to medium‐sized nonteaching hospitals located mostly in urban areas. In addition to the information contained in the standard hospital discharge file (Uniform Billing 92) such as patient age, International Classification of Disease, 9th Edition, Clinical Modification (ICD‐9‐CM) codes, the Perspective database includes a date‐stamped log of all billed items, including diagnostic tests, medications, and other treatments, as well as costs, for individual patients. The study was approved by the Institutional Review Board of Baystate Medical Center.
Patients were included if they had a primary diagnosis consistent with AECOPD (ICD‐9 codes 491.21 and 493.22) or a primary diagnosis of respiratory failure (ICD‐9 codes 518.81 and 518.84) paired with secondary diagnosis of AECOPD; they also had to receive at least 2 consecutive days of either a macrolide or a quinolone, started within 48 hours of hospitalization. Patients receiving both antibiotics were excluded, but patients who received additional antibiotics were included. To enhance the specificity of our diagnosis codes, we limited our study to patients age 40 years.16 Because mechanical ventilation initiated after hospital day 2 was an outcome measure, we excluded patients admitted directly to the intensive care unit. We also excluded: those with other bacterial infections, such as pneumonia or cellulitis, who might have another indication for antibiotics; those with a length of stay <2 days, because we could not ascertain whether they received a full course of antibiotics; patients with a secondary diagnosis of pulmonary embolism or pneumothorax; and those whose attending physicians were not internists, family practitioners, hospitalists, pulmonologists, or intensivists. For patients with more than 1 admission during the study period, we included only the first admission.
Data Elements
For each patient, we assessed age, gender, race, marital and insurance status, principal diagnosis, comorbidities, and specialty of the attending physician. Comorbidities were identified from ICD‐9 secondary diagnosis codes and Diagnosis Related Groups using Healthcare Cost and Utilization Project Comorbidity Software (version 3.1), based on the work of Elixhauser et al.17 In addition, to assess disease severity we recorded the presence of chronic pulmonary heart disease, the number of admissions for COPD during the 12 months prior to the index admission, and arterial blood gas testing.18,19 We also identified pharmacy or diagnostic charges for interventions that were recommended in current guidelines (beta‐adrenergic and anticholinergic bronchodilators, steroids, and noninvasive positive‐pressure ventilation); those that were not recommended or were of uncertain benefit (methylxanthine bronchodilators, spirometry/pulmonary function testing, mucolytic medications, chest physiotherapy, and sputum testing); and drugs that might be associated with severe exacerbations or end‐stage COPD (loop diuretics, morphine, and nutritional supplements).1,69 Hospitals were categorized by region (Northeast, South, Midwest, or West), bed size, setting (urban vs. rural), ownership, and teaching status.
Antibiotic Class and Outcome Variables
Our primary predictor variable was the antibiotic initiated during the first 2 hospital days and continued for at least 2 days, regardless of other antibiotics the patient may have received during the course of hospitalization. Because we anticipated low in‐hospital mortality, our primary outcome was a composite measure of treatment failure, defined as initiation of mechanical ventilation after hospital day 2, in‐hospital mortality, or readmission for COPD within 30 days of discharge.20 Secondary outcomes included hospital costs and length of stay, as well as allergic reactions identified by ICD‐9 code, and antibiotic‐associated diarrhea, defined as treatment with either metronidazole or oral vancomycin begun after hospital day 3.
Statistical Analysis
Summary statistics were computed using frequencies and percents for categorical variables; and means, medians, standard deviations, and interquartile ranges for continuous variables. Associations between antibiotic selection and patient and hospital characteristics were assessed using chi‐square tests for categorical variables and z‐tests for continuous variables.
We developed a series of multivariable models to evaluate the impact of initial antibiotic selection on the risk of treatment failure, length of stay, and total cost. In order to account for the effects of within‐hospital correlation, generalized estimating equation (GEE) models with a logit link were used to assess the effect of antibiotic selection on the risk of treatment failure, and identity link models were used for analyses of length of stay and cost. Unadjusted and covariate‐adjusted models for treatment failure were evaluated with and without adjustments for propensity score. A propensity score is the probability that a given patient would receive treatment with a macrolide, derived from a nonparsimonious model in which treatment with a macrolide was considered the outcome. The propensity model included all patient characteristics, other early treatments and tests, comorbidities, hospital and physician characteristics, and selected interaction terms.21 Length of stay and cost were trimmed at 3 standard deviations above the mean, and natural log‐transformed values were modeled due to extreme positive skew. In addition, we carried out matched analyses in which we compared the outcomes of patients who were treated with a macrolide to those with similar propensity scores (ie, with similar likelihood of receiving a macrolide) who received a quinolone.22
Finally, to reduce the threat of residual confounding by indication, which can occur if sicker patients are more likely to receive a particular antibiotic, we developed a grouped treatment model, in which all patients treated at the same hospital were assigned a probability of treatment with a macrolide equal to the overall treatment rate at that hospital.23 This is an adaptation of instrumental variable analysis, a well‐accepted technique in econometrics with growing use in health care.24,25 It attempts to assess whether patients treated at a hospital at which quinolones are used more frequently have better outcomes than patients treated at hospitals at which macrolides are used more frequently, while adjusting for other patient, physician, and hospital variables. It ignores the actual treatment the patient received, and instead substitutes the hospital's rate of macrolide use. By grouping treatment at the hospital level, this method greatly reduces the possibility of residual selection bias, unless hospitals that use a lot of macrolides have patients who differ in a consistent way from hospitals which use mostly quinolones.
All analyses were performed using SAS version 9.1 (SAS Institute, Inc., Cary, NC).
Results
Of 26,248 AECOPD patients treated with antibiotics, 19,608 patients met the inclusion criteria; of these, 6139 (31%) were treated initially with a macrolide; the median age was 70 years; 60% were female; and 78% were white. A total of 86% of patients had a primary diagnosis of obstructive chronic bronchitis with acute exacerbation, and 6% had respiratory failure. The most common comorbidities were hypertension, diabetes, and congestive heart failure. Twenty‐two percent had been admitted at least once in the preceding 12 months. Treatment failure occurred in 7.7% of patients, and 1.3% died in the hospital. Mean length of stay was 4.8 days. Hospital prescribing rates for macrolides varied from 0% to 100%, with a mean of 33% and an interquartile range of 14% to 46% (Supporting Appendix Figure 1).
Compared to patients receiving macrolides, those receiving quinolones were older, more likely to have respiratory failure, to be cared for by a pulmonologist, and to have an admission in the previous year (Table 1). They were also more likely to be treated with bronchodilators, methylxanthines, steroids, diuretics, and noninvasive positive pressure ventilation, and to have an arterial blood gas, but less likely to receive concomitant treatment with a cephalosporin (11% vs. 57%). With the exception of cephalosporin treatment, these differences were small, but due to the large sample were statistically significant. Comorbidities were similar in both groups. Patients in the quinolone group were also more likely to experience treatment failure (8.1% vs. 6.8%), death (1.5% vs. 1.0%), and antibiotic‐associated diarrhea (1.1% vs. 0.5%).
| Complete Cohort | Propensity‐matched Subsample | |||||
|---|---|---|---|---|---|---|
| Characteristic | Quinolone (n = 13469) | Macrolide (n = 6139) | P Value | Quinolone (n = 5610) | Macrolide (n = 5610) | P Value |
| ||||||
| Antibiotics received during hospitalization* [n (%)] | ||||||
| Macrolide | 264 (2) | 6139 (100) | 119 (2) | 5610 (100) | ||
| Quinolone | 13469 (100) | 459 (8) | 5610 (100) | 424 (8) | ||
| Cephalosporin | 1696 (13) | 3579 (59) | <0.001 | 726 (13) | 3305 (59) | <0.001 |
| Tetracycline | 231 (2) | 75 (2) | 0.01 | 101 (2) | 73 (2) | 0.06 |
| Other antibiotics | 397 (3) | 220 (4) | 0.02 | 166 (3) | 193 (3) | 0.03 |
| Age (years) (mean [SD]) | 69.1 (11.4) | 68.2 (11.8) | <0.001 | 68.6 (11.7) | 68.5 (11.7) | 0.58 |
| Male sex (n [%]) | 5447 (40) | 2440 (40) | 0.36 | 2207 (39) | 2196 (39) | 0.85 |
| Race/ethnic group (n [%]) | <0.001 | 0.44 | ||||
| White | 10454 (78) | 4758 (78) | 4359 (78) | 4368 (78) | ||
| Black | 1060 (8) | 540 (9) | 470 (8) | 455 (8) | ||
| Hispanic | 463 (3) | 144 (2) | 157 (3) | 134 (2) | ||
| Other | 1492 (11) | 697 (11) | 624 (11) | 653 (12) | ||
| Primary diagnosis (n [%]) | <0.001 | 0.78 | ||||
| Obstructive chronic bronchitis with acute exacerbation | 11650 (87) | 5298 (86) | 4884 (87) | 4860 (87) | ||
| Chronic obstructive asthma/asthma with COPD | 908 (7) | 569 (9) | 466 (8) | 486 (9) | ||
| Respiratory failure | 911 (7) | 272 (4) | 260 (5) | 264 (5) | ||
| Admissions in the prior year (n [%]) | <0.001 | 0.84 | ||||
| 0 | 9846 (73) | 4654 (76) | 4249 (76) | 4231 (75) | ||
| 1 | 1918 (14) | 816 (13) | 747 (13) | 750 (13) | ||
| 2+ | 1085 (8) | 445 (7) | 397 (7) | 420 (8) | ||
| Missing | 620 (5) | 224 (4) | 217 (4) | 209 (4) | ||
| Physician specialty (n [%]) | <0.001 | 0.84 | ||||
| Internal medicine/hospitalist | 7069 (53) | 3321 (54) | 3032 (54) | 3072 (55) | ||
| Family/general medicine | 3569 (27) | 2074 (34) | 1824 (33) | 1812 (32) | ||
| Pulmonologist | 2776 (21) | 727 (12) | 738 (13) | 711 (13) | ||
| Critical care/emntensivist | 55 (0) | 17 (0) | 16 (0) | 15 (0) | ||
| Tests on hospital day 1 or 2 (n [%]) | ||||||
| Arterial blood gas | 8084 (60) | 3377 (55) | <0.001 | 3195 (57) | 3129 (56) | 0.22 |
| Sputum test | 1741 (13) | 766 (13) | 0.39 | 20 (0) | 16 (0) | 0.62 |
| Medications/therapies on hospital day 1 or 2 (n [%]) | ||||||
| Short‐acting bronchodilators | 7555 (56) | 3242 (53) | <0.001 | 2969 (53) | 2820 (50) | 0.005 |
| Long‐acting beta‐2 agonists | 2068 (15) | 748 (12) | <0.001 | 704 (13) | 719 (13) | 0.69 |
| Methylxanthine bronchodilators | 3051 (23) | 1149 (19) | <0.001 | 1102 (20) | 1093 (20) | 0.85 |
| Steroids | 0.04 | 0.68 | ||||
| Intravenous | 11148 (83) | 4989 (81) | 4547 (81) | 4581 (82) | ||
| Oral | 772 (6) | 376 (6) | 334 (6) | 330 (6) | ||
| Severity indicators (n [%]) | ||||||
| Chronic pulmonary heart disease | 890 (7) | 401 (7) | 0.85 | 337 (6) | 368 (7) | 0.24 |
| Sleep apnea | 586 (4) | 234 (4) | 0.08 | 211 (4) | 218 (4) | 0.77 |
| Noninvasive positive pressure ventilation | 391 (3) | 128 (2) | <0.001 | 128 (2) | 114 (2) | 0.40 |
| Loop diuretics | 4838 (36) | 1971 (32) | <0.001 | 1884 (34) | 1862 (33) | 0.67 |
| Hospital characteristics (n [%]) | ||||||
| Staffed beds | <0.001 | 0.71 | ||||
| 6200 | 3483 (26) | 1688 (28) | 1610 (29) | 1586 (28) | ||
| 201300 | 3132 (23) | 1198 (20) | 1174 (21) | 1154 (21) | ||
| 301500 | 4265 (32) | 2047 (33) | 1809 (32) | 1867 (33) | ||
| 500+ | 2589 (19) | 1206 (20) | 1017 (18) | 1003 (18) | ||
| Hospital region (n [%]) | <0.001 | 0.65 | ||||
| South | 8562 (64) | 3270 (53) | 3212 (57) | 3160 (56) | ||
| Midwest | 2602 (19) | 1444 (24) | 1170 (21) | 1216 (22) | ||
| Northeast | 1163 (9) | 871 (14) | 687 (12) | 704 (13) | ||
| West | 1142 (9) | 554 (9) | 541 (10) | 530 (9) | ||
| Teaching hospital | <0.001 | 0.63 | ||||
| No | 12090 (90) | 5037 (82) | 4896 (87) | 4878 (87) | ||
| Yes | 1379 (10) | 1102 (18) | 714 (13) | 732 (13) | ||
| Comorbidities (n [%]) | ||||||
| Congestive heart failure | 2673 (20) | 1147 (19) | 0.06 | 1081 (19) | 1060 (19) | 0.63 |
| Metastatic cancer | 134 (1) | 27 (0) | <0.001 | 34 (1) | 38 (1) | 0.72 |
| Depression | 1419 (11) | 669 (11) | 0.45 | 598 (11) | 603 (11) | 0.90 |
| Deficiency anemias | 1155 (9) | 476 (8) | 0.05 | 426 (8) | 432 (8) | 0.86 |
| Solid tumor without metastasis | 1487 (11) | 586 (10) | 0.002 | 550 (10) | 552 (10) | 0.97 |
| Hypothyroidism | 1267 (9) | 527 (9) | 0.07 | 481 (9) | 482 (9) | 1.00 |
| Peripheral vascular disease | 821 (6) | 312 (5) | 0.005 | 287 (5) | 288 (5) | 1.00 |
| Paralysis | 165 (1) | 46 (1) | 0.003 | 49 (1) | 51 (1) | 0.92 |
| Obesity | 957 (7) | 435 (7) | 0.98 | 386 (7) | 398 (7) | 0.68 |
| Hypertension | 5793 (43) | 2688 (44) | 0.31 | 2474 (44) | 2468 (44) | 0.92 |
| Diabetes | 0.04 | 0.45 | ||||
| Without chronic complications | 2630 (20) | 1127 (18) | 1057 (19) | 1066 (19) | ||
| With chronic complications | 298 (2) | 116 (2) | 115 (2) | 97 (2) | ||
In the unadjusted analysis, compared to patients receiving quinolones, those treated with macrolides were less likely to experience treatment failure (OR, 0.83; 95% CI, 0.740.94) (Table 2). Adjusting for all patient, hospital, and physician covariates, including the propensity for treatment with macrolides, increased the OR to 0.89 and the results were no longer significant (95% CI, 0.781.01). Propensity matching successfully balanced all measured covariates except for the use of short‐acting bronchodilators and additional antibiotics (Table 1). In the propensity‐matched sample (Figure 1), quinolone‐treated patients were more likely to experience antibiotic‐associated diarrhea (1.2% vs. 0.6%; P = 0.0003) and late mechanical ventilation (1.3% vs. 0.8%; P = 0.02). There were no differences in adjusted cost or length of stay between the 2 groups. The results of the grouped treatment analysis, substituting the hospital's specific rate of macrolide use in place of the actual treatment that each patient received suggested that the 2 antibiotics were associated with similar rates of treatment failure. The OR for a 100% hospital rate of macrolide treatment vs. a 0% rate was 1.01 (95% CI, 0.751.35).

| Treatment Failure | Cost | LOS | ||||
|---|---|---|---|---|---|---|
| Models | OR | 95% CI | Ratio | 95% CI | Ratio | 95% CI |
| ||||||
| Unadjusted | 0.83 | 0.730.93 | 0.98 | 0.971.00 | 0.96 | 0.950.98 |
| Adjusted for propensity score only* | 0.89 | 0.791.01 | 1.00 | 0.981.01 | 0.98 | 0.971.00 |
| Adjusted for covariates | 0.87 | 0.770.99 | 1.00 | 0.991.02 | 0.99 | 0.971.00 |
| Adjusted for covariates and propensity score | 0.89 | 0.781.01 | 1.00 | 0.991.02 | 0.98 | 0.971.00 |
| Matched sample, unadjusted | 0.87 | 0.751.00 | 0.99 | 0.981.01 | 0.99 | 0.971.01 |
| Matched sample, adjusted for unbalanced variables | 0.87 | 0.751.01 | 1.00 | 0.981.02 | 0.99 | 0.971.01 |
| Grouped treatment model, unadjusted | 0.90 | 0.681.19 | 0.97 | 0.891.06 | 0.92 | 0.870.96 |
| Group treatment model, adjusted for covariates∥ | 1.01 | 0.751.35 | 0.96 | 0.881.05 | 0.96 | 0.911.00 |
Discussion
In this large observational study conducted at 375 hospitals, we took advantage of a natural experiment in which antibiotic prescribing patterns varied widely across hospitals to compare the effectiveness of 2 common antibiotic regimens for AECOPD. Treatment with macrolides and quinolones were associated with a similar risk of treatment failure, costs, and length of stay; however, patients treated with macrolides were less likely to experience late mechanical ventilation or treatment for antibiotic‐associated diarrhea.
Despite broad consensus in COPD guidelines that patients with severe acute exacerbations should receive antibiotics, there is little agreement about the preferred empiric agent. Controversy exists regarding antibiotics' comparative effectiveness, and even over which pathogens cause COPD exacerbations. Given the frequency of hospitalization for AECOPD, understanding the comparative effectiveness of treatments in this setting could have important implications for health outcomes and costs. Unfortunately, most antibiotic studies in AECOPD were conducted >20 years ago, using antibiotics that rarely appeared in our sample.26 Consequently, clinical practice guidelines offer conflicting recommendations. For example, the National Institute for Clinical Excellence recommends empirical treatment with an aminopenicillin, a macrolide, or a tetracycline,8 while the American Thoracic Society recommends amoxicillin‐clavulonate or a fluoroquinolone.9
As might be expected in light of so much uncertainty, we found wide variation in prescribing patterns across hospitals. Overall, approximately one‐third of patients received a macrolide and two‐thirds a quinolone. Both regimens provide adequate coverage of H. influenza, S. pneumoniae, and M. catarrhalis, and conform to at least 1 COPD guideline. Nevertheless, patients receiving macrolides often received a cephalosporin as well; this pattern of treatment suggests that antibiotic selection is likely to have been influenced more by guidelines for the treatment of community‐acquired pneumonia than COPD.
Previous studies comparing antibiotic effectiveness suffer from shortcomings that limit their application to patients hospitalized with AECOPD. First, they enrolled patients with chronic bronchitis, and included patients without obstructive lung disease, and most studies included patients as young as 18 years old. Second, many either did not include treatment with steroids or excluded patients receiving more than 10 mg of prednisone daily. Third, almost all enrolled only ambulatory patients.
While there are no studies comparing quinolones and macrolides in patients hospitalized for AECOPD, a meta‐analysis comparing quinolones, macrolides, and amoxicillin‐clavulonate identified 19 trials of ambulatory patients with chronic bronchitis. That study found that all 3 drugs had similar efficacy initially, but that quinolones resulted in the fewest relapses over a 26‐week period.27 Macrolides and quinolones had similar rates of adverse effects. In contrast, we did not find a difference in treatment failure, cost, or length of stay, but did find a higher rate of diarrhea associated with quinolones. Others have also documented an association between fluoroquinolones and C. difficile diarrhea.2830 This trend, first noted in 2001, is of particular concern because the fluoroquinolone‐resistant strains appear to be hypervirulent and have been associated with nosocomial epidemics.3134
Our study has several limitations. First, its observational design leaves open the possibility of selection bias. For this reason we analyzed our data in several ways, including using a grouped treatment approach, an adaptation of the instrumental variable technique, and accepted only those differences which were consistent across all models. Second, our study used claims data, and therefore we could not directly adjust for physiological measures of severity. However, the highly detailed nature of the data allowed us to adjust for numerous tests and treatments that reflected the clinician's assessment of the patient's severity, as well as the number of prior COPD admissions. Third, we cannot exclude the possibility that some patients may have had concurrent pneumonia without an ICD‐9 code. We think that the number would be small because reimbursement for pneumonia is generally higher than for COPD, so hospitals have an incentive to code pneumonia as the principal diagnosis when present. Finally, we compared initial antibiotics only. More than one‐quarter of our patients received an additional antibiotic before discharge. In particular, patients receiving macrolides were often prescribed a concomitant cephalosporin. We do not know to what extent these additional antibiotics may have affected the outcomes.
Despite the large number of patients hospitalized annually for AECOPD, there are no randomized trials comparing different antibiotics in this population. Studies comparing antibiotics in chronic bronchitis can offer little guidance, since they have primarily focused on proving equivalence between existing antibiotics and newer, more expensive formulations.35 Because many of the patients enrolled in such trials do not benefit from antibiotics at all, either because they do not have COPD or because their exacerbation is not caused by bacteria, it is relatively easy to prove equivalence. Given that AECOPD is one of the leading causes of hospitalization in the United States, large, randomized trials comparing the effectiveness of different antibiotics should be a high priority. In the meantime, macrolides (often given together with cephalosporins) and quinolones appear to be equally effective initial antibiotic choices; considering antibiotic‐associated diarrhea, macrolides appear to be the safer of the 2.
- ,,.Evidence base for management of acute exacerbations of chronic obstructive pulmonary disease.Ann Intern Med.2001;134:595–599.
- ,,, et al.Infectious etiologies in acute exacerbation of COPD.Diagn Microbiol Infect Dis.2001;40:95–102.
- ,.Bacterial infections in patients requiring admission for an acute exacerbation of COPD; a 1‐year prospective study.Respir Med.2003;97:770–777.
- ,,, et al.Microbiologic determinants of exacerbation in chronic obstructive pulmonary disease.Arch Intern Med.2005;165:891–897.
- ,.Infection in the pathogenesis and course of chronic obstructive pulmonary disease.N Engl J Med.2008;359:2355–2365.
- ,,, et al.Global strategy for the diagnosis, management, and prevention of chronic obstructive pulmonary disease: GOLD executive summary.Am J Respir Crit Care Med.2007;176:532–555.
- ,,, et al.Canadian Thoracic Society recommendations for management of chronic obstructive pulmonary disease—2008 update—highlights for primary care.Can Respir J.2008;15(suppl A):1A–8A.
- Chronic obstructive pulmonary disease.National clinical guideline on management of chronic obstructive pulmonary disease in adults in primary and secondary care.Thorax.2004;59(suppl 1):1–232.
- ,,, et al.Standards for the diagnosis and treatment of patients with COPD: a summary of the ATS/ERS position paper.Eur Respir J.2004;23:932–946.
- ,,,,.Antibiotics for exacerbations of chronic obstructive pulmonary disease.Cochrane Database Syst Rev.2006:CD004403.
- ,,,,,.Quality of care for patients hospitalized for acute exacerbations of chronic obstructive pulmonary disease.Ann Intern Med.2006;144:894–903.
- ,,, et al.Modulation of neutrophil and inflammation markers in chronic obstructive pulmonary disease by short‐term azithromycin treatment.Eur J Pharmacol.2005;517:132–143.
- ,,, et al.Azithromycin modulates neutrophil function and circulating inflammatory mediators in healthy human subjects.Eur J Pharmacol.2002;450:277–289.
- ,,,,,.The effect of clarithromycin on inflammatory markers in chronic obstructive pulmonary disease: preliminary data.Ann Pharmacother.2004;38:1400–1405.
- ,,,.A comparison of gemifloxacin and clarithromycin in acute exacerbations of chronic bronchitis and long‐term clinical outcomes.Clin Ther.2002;24:639–652.
- ,,,.In‐hospital mortality following acute exacerbations of chronic obstructive pulmonary disease.Arch Intern Med.2003;163:1180–1186.
- ,,,.Comorbidity measures for use with administrative data.Med Care.1998;36:8–27.
- ,,, et al.Outcomes following acute exacerbation of severe chronic obstructive lung disease. The SUPPORT investigators (Study to Understand Prognoses and Preferences for Outcomes and Risks of Treatments).Am J Respir Crit Care Med.1996;154:959–967.
- ,,.Mortality and mortality‐related factors after hospitalization for acute exacerbation of COPD.Chest.2003;124:459–467.
- ,,, et al.Effect of systemic glucocorticoids on exacerbations of chronic obstructive pulmonary disease.N Engl J Med.1999;340:1941–1947.
- .Propensity score methods for bias reduction in the comparison of a treatment to a non‐randomized control group.Stat Med.1998;17:2265–2281.
- .Reducing bias in a propensity score matched‐pair sample using greedy matching techniques. Proceedings of the Twenty‐Sixth Annual SAS Users Group International Conference. Cary, NC: SAS Institute;2001,214–216.
- ,,,.Modeling treatment effects on binary outcomes with grouped‐treatment variables and individual covariates.Am J Epidemiol.2002;156:753–760.
- ,,.Does more intensive treatment of acute myocardial infarction in the elderly reduce mortality? Analysis using instrumental variables. [see Comment].JAMA.1994;272:859–866.
- ,,,,,.Analysis of observational studies in the presence of treatment selection bias: effects of invasive cardiac management on AMI survival using propensity score and instrumental variable methods.JAMA.2007;297:278–285.
- ,,,.Antibiotics in chronic obstructive pulmonary disease exacerbations. A meta‐analysis.JAMA.1995;273:957–960.
- ,,,,.Macrolides, quinolones and amoxicillin/clavulanate for chronic bronchitis: a meta‐analysis.Eur Respir J.2007;29:1127–1137.
- ,,,,.Antimicrobial‐associated risk factors for Clostridium difficile infection.Clin Infect Dis.2008;46(suppl 1):S19–S31.
- ,,, et al.Short‐term and long‐term outcomes of moxifloxacin compared to standard antibiotic treatment in acute exacerbations of chronic bronchitis.Chest.2004;125:953–964.
- ,,,,.Oral gemifloxacin once daily for 5 days compared with sequential therapy with i.v. ceftriaxone/oral cefuroxime (maximum of 10 days) in the treatment of hospitalized patients with acute exacerbations of chronic bronchitis.Respir Med.2003;97:242–249.
- ,,, et al.A large outbreak of Clostridium difficile‐associated disease with an unexpected proportion of deaths and colectomies at a teaching hospital following increased fluoroquinolone use.Infect Control Hosp Epidemiol.2005;26:273–280.
- ,,, et al.An epidemic, toxin gene‐variant strain of Clostridium difficile.N Engl J Med.2005;353:2433–2441.
- ,,, et al.Outbreak of Clostridium difficile infection in a long‐term care facility: association with gatifloxacin use.Clin Infect Dis.2004;38:640–645.
- ,,, et al.A predominantly clonal multi‐institutional outbreak of Clostridium difficile‐associated diarrhea with high morbidity and mortality.N Engl J Med.2005;353:2442–2449.
- ,.No more equivalence trials for antibiotics in exacerbations of COPD, please.Chest.2004;125:811–813.
Acute exacerbations of chronic obstructive pulmonary disease (AECOPD) are responsible for more than 600,000 hospitalizations annually, resulting in direct costs of over $20 billion.1 Bacterial infections appear responsible for 50% of such exacerbations,25 and current COPD guidelines recommend treatment with antibiotics for patients with severe exacerbations or a change in sputum.1,69 These recommendations are based on a number of small randomized trials, most of which were conducted more than 20 years ago using narrow spectrum antibiotics that are no longer commonly used.10 Only 4 studies, totaling 321 subjects, included hospitalized patients, and most studies excluded patients who required steroids. Because no clinical trials have compared different antibiotic regimens for AECOPD, existing guidelines offer a range of treatment options, including amoxicillin‐clavulonate, macrolides, quinolones, cephalosporins, aminopenicillins, and tetracyclines.
Among hospitalized patients, macrolides and quinolones appear to be the most frequently prescribed antibiotics.11 Both are available in oral formulations, have excellent bioavailability, and are administered once daily. In addition to their antimicrobial activity, macrolides are believed to have antiinflammatory effects, which could be especially advantageous in AECOPD.1214 In trials of chronic bronchitis, however, fluoroquinolones have been shown to reduce the risk of recurrent exacerbation when compared to macrolides.15 The wide variation that has been observed in antibiotic selection for patients hospitalized for AECOPD suggests a high degree of uncertainty among clinicians about the benefits of different treatment options.11 Given the limited evidence from randomized trials, we sought to evaluate the comparative effectiveness of macrolides and quinolones among a large, representative sample of patients hospitalized with AECOPD.
Subjects and Methods
Setting and Subjects
We conducted a retrospective cohort study of all patients hospitalized between January 1 and December 31, 2001 for AECOPD at any 1 of 375 acute care facilities in the United States that participated in Premier's Perspective, a voluntary, fee‐supported database developed for measuring quality and healthcare utilization. Participating hospitals represent all geographical regions, and are primarily small‐sized to medium‐sized nonteaching hospitals located mostly in urban areas. In addition to the information contained in the standard hospital discharge file (Uniform Billing 92) such as patient age, International Classification of Disease, 9th Edition, Clinical Modification (ICD‐9‐CM) codes, the Perspective database includes a date‐stamped log of all billed items, including diagnostic tests, medications, and other treatments, as well as costs, for individual patients. The study was approved by the Institutional Review Board of Baystate Medical Center.
Patients were included if they had a primary diagnosis consistent with AECOPD (ICD‐9 codes 491.21 and 493.22) or a primary diagnosis of respiratory failure (ICD‐9 codes 518.81 and 518.84) paired with secondary diagnosis of AECOPD; they also had to receive at least 2 consecutive days of either a macrolide or a quinolone, started within 48 hours of hospitalization. Patients receiving both antibiotics were excluded, but patients who received additional antibiotics were included. To enhance the specificity of our diagnosis codes, we limited our study to patients age 40 years.16 Because mechanical ventilation initiated after hospital day 2 was an outcome measure, we excluded patients admitted directly to the intensive care unit. We also excluded: those with other bacterial infections, such as pneumonia or cellulitis, who might have another indication for antibiotics; those with a length of stay <2 days, because we could not ascertain whether they received a full course of antibiotics; patients with a secondary diagnosis of pulmonary embolism or pneumothorax; and those whose attending physicians were not internists, family practitioners, hospitalists, pulmonologists, or intensivists. For patients with more than 1 admission during the study period, we included only the first admission.
Data Elements
For each patient, we assessed age, gender, race, marital and insurance status, principal diagnosis, comorbidities, and specialty of the attending physician. Comorbidities were identified from ICD‐9 secondary diagnosis codes and Diagnosis Related Groups using Healthcare Cost and Utilization Project Comorbidity Software (version 3.1), based on the work of Elixhauser et al.17 In addition, to assess disease severity we recorded the presence of chronic pulmonary heart disease, the number of admissions for COPD during the 12 months prior to the index admission, and arterial blood gas testing.18,19 We also identified pharmacy or diagnostic charges for interventions that were recommended in current guidelines (beta‐adrenergic and anticholinergic bronchodilators, steroids, and noninvasive positive‐pressure ventilation); those that were not recommended or were of uncertain benefit (methylxanthine bronchodilators, spirometry/pulmonary function testing, mucolytic medications, chest physiotherapy, and sputum testing); and drugs that might be associated with severe exacerbations or end‐stage COPD (loop diuretics, morphine, and nutritional supplements).1,69 Hospitals were categorized by region (Northeast, South, Midwest, or West), bed size, setting (urban vs. rural), ownership, and teaching status.
Antibiotic Class and Outcome Variables
Our primary predictor variable was the antibiotic initiated during the first 2 hospital days and continued for at least 2 days, regardless of other antibiotics the patient may have received during the course of hospitalization. Because we anticipated low in‐hospital mortality, our primary outcome was a composite measure of treatment failure, defined as initiation of mechanical ventilation after hospital day 2, in‐hospital mortality, or readmission for COPD within 30 days of discharge.20 Secondary outcomes included hospital costs and length of stay, as well as allergic reactions identified by ICD‐9 code, and antibiotic‐associated diarrhea, defined as treatment with either metronidazole or oral vancomycin begun after hospital day 3.
Statistical Analysis
Summary statistics were computed using frequencies and percents for categorical variables; and means, medians, standard deviations, and interquartile ranges for continuous variables. Associations between antibiotic selection and patient and hospital characteristics were assessed using chi‐square tests for categorical variables and z‐tests for continuous variables.
We developed a series of multivariable models to evaluate the impact of initial antibiotic selection on the risk of treatment failure, length of stay, and total cost. In order to account for the effects of within‐hospital correlation, generalized estimating equation (GEE) models with a logit link were used to assess the effect of antibiotic selection on the risk of treatment failure, and identity link models were used for analyses of length of stay and cost. Unadjusted and covariate‐adjusted models for treatment failure were evaluated with and without adjustments for propensity score. A propensity score is the probability that a given patient would receive treatment with a macrolide, derived from a nonparsimonious model in which treatment with a macrolide was considered the outcome. The propensity model included all patient characteristics, other early treatments and tests, comorbidities, hospital and physician characteristics, and selected interaction terms.21 Length of stay and cost were trimmed at 3 standard deviations above the mean, and natural log‐transformed values were modeled due to extreme positive skew. In addition, we carried out matched analyses in which we compared the outcomes of patients who were treated with a macrolide to those with similar propensity scores (ie, with similar likelihood of receiving a macrolide) who received a quinolone.22
Finally, to reduce the threat of residual confounding by indication, which can occur if sicker patients are more likely to receive a particular antibiotic, we developed a grouped treatment model, in which all patients treated at the same hospital were assigned a probability of treatment with a macrolide equal to the overall treatment rate at that hospital.23 This is an adaptation of instrumental variable analysis, a well‐accepted technique in econometrics with growing use in health care.24,25 It attempts to assess whether patients treated at a hospital at which quinolones are used more frequently have better outcomes than patients treated at hospitals at which macrolides are used more frequently, while adjusting for other patient, physician, and hospital variables. It ignores the actual treatment the patient received, and instead substitutes the hospital's rate of macrolide use. By grouping treatment at the hospital level, this method greatly reduces the possibility of residual selection bias, unless hospitals that use a lot of macrolides have patients who differ in a consistent way from hospitals which use mostly quinolones.
All analyses were performed using SAS version 9.1 (SAS Institute, Inc., Cary, NC).
Results
Of 26,248 AECOPD patients treated with antibiotics, 19,608 patients met the inclusion criteria; of these, 6139 (31%) were treated initially with a macrolide; the median age was 70 years; 60% were female; and 78% were white. A total of 86% of patients had a primary diagnosis of obstructive chronic bronchitis with acute exacerbation, and 6% had respiratory failure. The most common comorbidities were hypertension, diabetes, and congestive heart failure. Twenty‐two percent had been admitted at least once in the preceding 12 months. Treatment failure occurred in 7.7% of patients, and 1.3% died in the hospital. Mean length of stay was 4.8 days. Hospital prescribing rates for macrolides varied from 0% to 100%, with a mean of 33% and an interquartile range of 14% to 46% (Supporting Appendix Figure 1).
Compared to patients receiving macrolides, those receiving quinolones were older, more likely to have respiratory failure, to be cared for by a pulmonologist, and to have an admission in the previous year (Table 1). They were also more likely to be treated with bronchodilators, methylxanthines, steroids, diuretics, and noninvasive positive pressure ventilation, and to have an arterial blood gas, but less likely to receive concomitant treatment with a cephalosporin (11% vs. 57%). With the exception of cephalosporin treatment, these differences were small, but due to the large sample were statistically significant. Comorbidities were similar in both groups. Patients in the quinolone group were also more likely to experience treatment failure (8.1% vs. 6.8%), death (1.5% vs. 1.0%), and antibiotic‐associated diarrhea (1.1% vs. 0.5%).
| Complete Cohort | Propensity‐matched Subsample | |||||
|---|---|---|---|---|---|---|
| Characteristic | Quinolone (n = 13469) | Macrolide (n = 6139) | P Value | Quinolone (n = 5610) | Macrolide (n = 5610) | P Value |
| ||||||
| Antibiotics received during hospitalization* [n (%)] | ||||||
| Macrolide | 264 (2) | 6139 (100) | 119 (2) | 5610 (100) | ||
| Quinolone | 13469 (100) | 459 (8) | 5610 (100) | 424 (8) | ||
| Cephalosporin | 1696 (13) | 3579 (59) | <0.001 | 726 (13) | 3305 (59) | <0.001 |
| Tetracycline | 231 (2) | 75 (2) | 0.01 | 101 (2) | 73 (2) | 0.06 |
| Other antibiotics | 397 (3) | 220 (4) | 0.02 | 166 (3) | 193 (3) | 0.03 |
| Age (years) (mean [SD]) | 69.1 (11.4) | 68.2 (11.8) | <0.001 | 68.6 (11.7) | 68.5 (11.7) | 0.58 |
| Male sex (n [%]) | 5447 (40) | 2440 (40) | 0.36 | 2207 (39) | 2196 (39) | 0.85 |
| Race/ethnic group (n [%]) | <0.001 | 0.44 | ||||
| White | 10454 (78) | 4758 (78) | 4359 (78) | 4368 (78) | ||
| Black | 1060 (8) | 540 (9) | 470 (8) | 455 (8) | ||
| Hispanic | 463 (3) | 144 (2) | 157 (3) | 134 (2) | ||
| Other | 1492 (11) | 697 (11) | 624 (11) | 653 (12) | ||
| Primary diagnosis (n [%]) | <0.001 | 0.78 | ||||
| Obstructive chronic bronchitis with acute exacerbation | 11650 (87) | 5298 (86) | 4884 (87) | 4860 (87) | ||
| Chronic obstructive asthma/asthma with COPD | 908 (7) | 569 (9) | 466 (8) | 486 (9) | ||
| Respiratory failure | 911 (7) | 272 (4) | 260 (5) | 264 (5) | ||
| Admissions in the prior year (n [%]) | <0.001 | 0.84 | ||||
| 0 | 9846 (73) | 4654 (76) | 4249 (76) | 4231 (75) | ||
| 1 | 1918 (14) | 816 (13) | 747 (13) | 750 (13) | ||
| 2+ | 1085 (8) | 445 (7) | 397 (7) | 420 (8) | ||
| Missing | 620 (5) | 224 (4) | 217 (4) | 209 (4) | ||
| Physician specialty (n [%]) | <0.001 | 0.84 | ||||
| Internal medicine/hospitalist | 7069 (53) | 3321 (54) | 3032 (54) | 3072 (55) | ||
| Family/general medicine | 3569 (27) | 2074 (34) | 1824 (33) | 1812 (32) | ||
| Pulmonologist | 2776 (21) | 727 (12) | 738 (13) | 711 (13) | ||
| Critical care/emntensivist | 55 (0) | 17 (0) | 16 (0) | 15 (0) | ||
| Tests on hospital day 1 or 2 (n [%]) | ||||||
| Arterial blood gas | 8084 (60) | 3377 (55) | <0.001 | 3195 (57) | 3129 (56) | 0.22 |
| Sputum test | 1741 (13) | 766 (13) | 0.39 | 20 (0) | 16 (0) | 0.62 |
| Medications/therapies on hospital day 1 or 2 (n [%]) | ||||||
| Short‐acting bronchodilators | 7555 (56) | 3242 (53) | <0.001 | 2969 (53) | 2820 (50) | 0.005 |
| Long‐acting beta‐2 agonists | 2068 (15) | 748 (12) | <0.001 | 704 (13) | 719 (13) | 0.69 |
| Methylxanthine bronchodilators | 3051 (23) | 1149 (19) | <0.001 | 1102 (20) | 1093 (20) | 0.85 |
| Steroids | 0.04 | 0.68 | ||||
| Intravenous | 11148 (83) | 4989 (81) | 4547 (81) | 4581 (82) | ||
| Oral | 772 (6) | 376 (6) | 334 (6) | 330 (6) | ||
| Severity indicators (n [%]) | ||||||
| Chronic pulmonary heart disease | 890 (7) | 401 (7) | 0.85 | 337 (6) | 368 (7) | 0.24 |
| Sleep apnea | 586 (4) | 234 (4) | 0.08 | 211 (4) | 218 (4) | 0.77 |
| Noninvasive positive pressure ventilation | 391 (3) | 128 (2) | <0.001 | 128 (2) | 114 (2) | 0.40 |
| Loop diuretics | 4838 (36) | 1971 (32) | <0.001 | 1884 (34) | 1862 (33) | 0.67 |
| Hospital characteristics (n [%]) | ||||||
| Staffed beds | <0.001 | 0.71 | ||||
| 6200 | 3483 (26) | 1688 (28) | 1610 (29) | 1586 (28) | ||
| 201300 | 3132 (23) | 1198 (20) | 1174 (21) | 1154 (21) | ||
| 301500 | 4265 (32) | 2047 (33) | 1809 (32) | 1867 (33) | ||
| 500+ | 2589 (19) | 1206 (20) | 1017 (18) | 1003 (18) | ||
| Hospital region (n [%]) | <0.001 | 0.65 | ||||
| South | 8562 (64) | 3270 (53) | 3212 (57) | 3160 (56) | ||
| Midwest | 2602 (19) | 1444 (24) | 1170 (21) | 1216 (22) | ||
| Northeast | 1163 (9) | 871 (14) | 687 (12) | 704 (13) | ||
| West | 1142 (9) | 554 (9) | 541 (10) | 530 (9) | ||
| Teaching hospital | <0.001 | 0.63 | ||||
| No | 12090 (90) | 5037 (82) | 4896 (87) | 4878 (87) | ||
| Yes | 1379 (10) | 1102 (18) | 714 (13) | 732 (13) | ||
| Comorbidities (n [%]) | ||||||
| Congestive heart failure | 2673 (20) | 1147 (19) | 0.06 | 1081 (19) | 1060 (19) | 0.63 |
| Metastatic cancer | 134 (1) | 27 (0) | <0.001 | 34 (1) | 38 (1) | 0.72 |
| Depression | 1419 (11) | 669 (11) | 0.45 | 598 (11) | 603 (11) | 0.90 |
| Deficiency anemias | 1155 (9) | 476 (8) | 0.05 | 426 (8) | 432 (8) | 0.86 |
| Solid tumor without metastasis | 1487 (11) | 586 (10) | 0.002 | 550 (10) | 552 (10) | 0.97 |
| Hypothyroidism | 1267 (9) | 527 (9) | 0.07 | 481 (9) | 482 (9) | 1.00 |
| Peripheral vascular disease | 821 (6) | 312 (5) | 0.005 | 287 (5) | 288 (5) | 1.00 |
| Paralysis | 165 (1) | 46 (1) | 0.003 | 49 (1) | 51 (1) | 0.92 |
| Obesity | 957 (7) | 435 (7) | 0.98 | 386 (7) | 398 (7) | 0.68 |
| Hypertension | 5793 (43) | 2688 (44) | 0.31 | 2474 (44) | 2468 (44) | 0.92 |
| Diabetes | 0.04 | 0.45 | ||||
| Without chronic complications | 2630 (20) | 1127 (18) | 1057 (19) | 1066 (19) | ||
| With chronic complications | 298 (2) | 116 (2) | 115 (2) | 97 (2) | ||
In the unadjusted analysis, compared to patients receiving quinolones, those treated with macrolides were less likely to experience treatment failure (OR, 0.83; 95% CI, 0.740.94) (Table 2). Adjusting for all patient, hospital, and physician covariates, including the propensity for treatment with macrolides, increased the OR to 0.89 and the results were no longer significant (95% CI, 0.781.01). Propensity matching successfully balanced all measured covariates except for the use of short‐acting bronchodilators and additional antibiotics (Table 1). In the propensity‐matched sample (Figure 1), quinolone‐treated patients were more likely to experience antibiotic‐associated diarrhea (1.2% vs. 0.6%; P = 0.0003) and late mechanical ventilation (1.3% vs. 0.8%; P = 0.02). There were no differences in adjusted cost or length of stay between the 2 groups. The results of the grouped treatment analysis, substituting the hospital's specific rate of macrolide use in place of the actual treatment that each patient received suggested that the 2 antibiotics were associated with similar rates of treatment failure. The OR for a 100% hospital rate of macrolide treatment vs. a 0% rate was 1.01 (95% CI, 0.751.35).
| Treatment Failure | Cost | LOS | ||||
|---|---|---|---|---|---|---|
| Models | OR | 95% CI | Ratio | 95% CI | Ratio | 95% CI |
| ||||||
| Unadjusted | 0.83 | 0.730.93 | 0.98 | 0.971.00 | 0.96 | 0.950.98 |
| Adjusted for propensity score only* | 0.89 | 0.791.01 | 1.00 | 0.981.01 | 0.98 | 0.971.00 |
| Adjusted for covariates | 0.87 | 0.770.99 | 1.00 | 0.991.02 | 0.99 | 0.971.00 |
| Adjusted for covariates and propensity score | 0.89 | 0.781.01 | 1.00 | 0.991.02 | 0.98 | 0.971.00 |
| Matched sample, unadjusted | 0.87 | 0.751.00 | 0.99 | 0.981.01 | 0.99 | 0.971.01 |
| Matched sample, adjusted for unbalanced variables | 0.87 | 0.751.01 | 1.00 | 0.981.02 | 0.99 | 0.971.01 |
| Grouped treatment model, unadjusted | 0.90 | 0.681.19 | 0.97 | 0.891.06 | 0.92 | 0.870.96 |
| Group treatment model, adjusted for covariates∥ | 1.01 | 0.751.35 | 0.96 | 0.881.05 | 0.96 | 0.911.00 |
Discussion
In this large observational study conducted at 375 hospitals, we took advantage of a natural experiment in which antibiotic prescribing patterns varied widely across hospitals to compare the effectiveness of 2 common antibiotic regimens for AECOPD. Treatment with macrolides and quinolones were associated with a similar risk of treatment failure, costs, and length of stay; however, patients treated with macrolides were less likely to experience late mechanical ventilation or treatment for antibiotic‐associated diarrhea.
Despite broad consensus in COPD guidelines that patients with severe acute exacerbations should receive antibiotics, there is little agreement about the preferred empiric agent. Controversy exists regarding antibiotics' comparative effectiveness, and even over which pathogens cause COPD exacerbations. Given the frequency of hospitalization for AECOPD, understanding the comparative effectiveness of treatments in this setting could have important implications for health outcomes and costs. Unfortunately, most antibiotic studies in AECOPD were conducted >20 years ago, using antibiotics that rarely appeared in our sample.26 Consequently, clinical practice guidelines offer conflicting recommendations. For example, the National Institute for Clinical Excellence recommends empirical treatment with an aminopenicillin, a macrolide, or a tetracycline,8 while the American Thoracic Society recommends amoxicillin‐clavulonate or a fluoroquinolone.9
As might be expected in light of so much uncertainty, we found wide variation in prescribing patterns across hospitals. Overall, approximately one‐third of patients received a macrolide and two‐thirds a quinolone. Both regimens provide adequate coverage of H. influenza, S. pneumoniae, and M. catarrhalis, and conform to at least 1 COPD guideline. Nevertheless, patients receiving macrolides often received a cephalosporin as well; this pattern of treatment suggests that antibiotic selection is likely to have been influenced more by guidelines for the treatment of community‐acquired pneumonia than COPD.
Previous studies comparing antibiotic effectiveness suffer from shortcomings that limit their application to patients hospitalized with AECOPD. First, they enrolled patients with chronic bronchitis, and included patients without obstructive lung disease, and most studies included patients as young as 18 years old. Second, many either did not include treatment with steroids or excluded patients receiving more than 10 mg of prednisone daily. Third, almost all enrolled only ambulatory patients.
While there are no studies comparing quinolones and macrolides in patients hospitalized for AECOPD, a meta‐analysis comparing quinolones, macrolides, and amoxicillin‐clavulonate identified 19 trials of ambulatory patients with chronic bronchitis. That study found that all 3 drugs had similar efficacy initially, but that quinolones resulted in the fewest relapses over a 26‐week period.27 Macrolides and quinolones had similar rates of adverse effects. In contrast, we did not find a difference in treatment failure, cost, or length of stay, but did find a higher rate of diarrhea associated with quinolones. Others have also documented an association between fluoroquinolones and C. difficile diarrhea.2830 This trend, first noted in 2001, is of particular concern because the fluoroquinolone‐resistant strains appear to be hypervirulent and have been associated with nosocomial epidemics.3134
Our study has several limitations. First, its observational design leaves open the possibility of selection bias. For this reason we analyzed our data in several ways, including using a grouped treatment approach, an adaptation of the instrumental variable technique, and accepted only those differences which were consistent across all models. Second, our study used claims data, and therefore we could not directly adjust for physiological measures of severity. However, the highly detailed nature of the data allowed us to adjust for numerous tests and treatments that reflected the clinician's assessment of the patient's severity, as well as the number of prior COPD admissions. Third, we cannot exclude the possibility that some patients may have had concurrent pneumonia without an ICD‐9 code. We think that the number would be small because reimbursement for pneumonia is generally higher than for COPD, so hospitals have an incentive to code pneumonia as the principal diagnosis when present. Finally, we compared initial antibiotics only. More than one‐quarter of our patients received an additional antibiotic before discharge. In particular, patients receiving macrolides were often prescribed a concomitant cephalosporin. We do not know to what extent these additional antibiotics may have affected the outcomes.
Despite the large number of patients hospitalized annually for AECOPD, there are no randomized trials comparing different antibiotics in this population. Studies comparing antibiotics in chronic bronchitis can offer little guidance, since they have primarily focused on proving equivalence between existing antibiotics and newer, more expensive formulations.35 Because many of the patients enrolled in such trials do not benefit from antibiotics at all, either because they do not have COPD or because their exacerbation is not caused by bacteria, it is relatively easy to prove equivalence. Given that AECOPD is one of the leading causes of hospitalization in the United States, large, randomized trials comparing the effectiveness of different antibiotics should be a high priority. In the meantime, macrolides (often given together with cephalosporins) and quinolones appear to be equally effective initial antibiotic choices; considering antibiotic‐associated diarrhea, macrolides appear to be the safer of the 2.
- ,,.Evidence base for management of acute exacerbations of chronic obstructive pulmonary disease.Ann Intern Med.2001;134:595–599.
- ,,, et al.Infectious etiologies in acute exacerbation of COPD.Diagn Microbiol Infect Dis.2001;40:95–102.
- ,.Bacterial infections in patients requiring admission for an acute exacerbation of COPD; a 1‐year prospective study.Respir Med.2003;97:770–777.
- ,,, et al.Microbiologic determinants of exacerbation in chronic obstructive pulmonary disease.Arch Intern Med.2005;165:891–897.
- ,.Infection in the pathogenesis and course of chronic obstructive pulmonary disease.N Engl J Med.2008;359:2355–2365.
- ,,, et al.Global strategy for the diagnosis, management, and prevention of chronic obstructive pulmonary disease: GOLD executive summary.Am J Respir Crit Care Med.2007;176:532–555.
- ,,, et al.Canadian Thoracic Society recommendations for management of chronic obstructive pulmonary disease—2008 update—highlights for primary care.Can Respir J.2008;15(suppl A):1A–8A.
- Chronic obstructive pulmonary disease.National clinical guideline on management of chronic obstructive pulmonary disease in adults in primary and secondary care.Thorax.2004;59(suppl 1):1–232.
- ,,, et al.Standards for the diagnosis and treatment of patients with COPD: a summary of the ATS/ERS position paper.Eur Respir J.2004;23:932–946.
- ,,,,.Antibiotics for exacerbations of chronic obstructive pulmonary disease.Cochrane Database Syst Rev.2006:CD004403.
- ,,,,,.Quality of care for patients hospitalized for acute exacerbations of chronic obstructive pulmonary disease.Ann Intern Med.2006;144:894–903.
- ,,, et al.Modulation of neutrophil and inflammation markers in chronic obstructive pulmonary disease by short‐term azithromycin treatment.Eur J Pharmacol.2005;517:132–143.
- ,,, et al.Azithromycin modulates neutrophil function and circulating inflammatory mediators in healthy human subjects.Eur J Pharmacol.2002;450:277–289.
- ,,,,,.The effect of clarithromycin on inflammatory markers in chronic obstructive pulmonary disease: preliminary data.Ann Pharmacother.2004;38:1400–1405.
- ,,,.A comparison of gemifloxacin and clarithromycin in acute exacerbations of chronic bronchitis and long‐term clinical outcomes.Clin Ther.2002;24:639–652.
- ,,,.In‐hospital mortality following acute exacerbations of chronic obstructive pulmonary disease.Arch Intern Med.2003;163:1180–1186.
- ,,,.Comorbidity measures for use with administrative data.Med Care.1998;36:8–27.
- ,,, et al.Outcomes following acute exacerbation of severe chronic obstructive lung disease. The SUPPORT investigators (Study to Understand Prognoses and Preferences for Outcomes and Risks of Treatments).Am J Respir Crit Care Med.1996;154:959–967.
- ,,.Mortality and mortality‐related factors after hospitalization for acute exacerbation of COPD.Chest.2003;124:459–467.
- ,,, et al.Effect of systemic glucocorticoids on exacerbations of chronic obstructive pulmonary disease.N Engl J Med.1999;340:1941–1947.
- .Propensity score methods for bias reduction in the comparison of a treatment to a non‐randomized control group.Stat Med.1998;17:2265–2281.
- .Reducing bias in a propensity score matched‐pair sample using greedy matching techniques. Proceedings of the Twenty‐Sixth Annual SAS Users Group International Conference. Cary, NC: SAS Institute;2001,214–216.
- ,,,.Modeling treatment effects on binary outcomes with grouped‐treatment variables and individual covariates.Am J Epidemiol.2002;156:753–760.
- ,,.Does more intensive treatment of acute myocardial infarction in the elderly reduce mortality? Analysis using instrumental variables. [see Comment].JAMA.1994;272:859–866.
- ,,,,,.Analysis of observational studies in the presence of treatment selection bias: effects of invasive cardiac management on AMI survival using propensity score and instrumental variable methods.JAMA.2007;297:278–285.
- ,,,.Antibiotics in chronic obstructive pulmonary disease exacerbations. A meta‐analysis.JAMA.1995;273:957–960.
- ,,,,.Macrolides, quinolones and amoxicillin/clavulanate for chronic bronchitis: a meta‐analysis.Eur Respir J.2007;29:1127–1137.
- ,,,,.Antimicrobial‐associated risk factors for Clostridium difficile infection.Clin Infect Dis.2008;46(suppl 1):S19–S31.
- ,,, et al.Short‐term and long‐term outcomes of moxifloxacin compared to standard antibiotic treatment in acute exacerbations of chronic bronchitis.Chest.2004;125:953–964.
- ,,,,.Oral gemifloxacin once daily for 5 days compared with sequential therapy with i.v. ceftriaxone/oral cefuroxime (maximum of 10 days) in the treatment of hospitalized patients with acute exacerbations of chronic bronchitis.Respir Med.2003;97:242–249.
- ,,, et al.A large outbreak of Clostridium difficile‐associated disease with an unexpected proportion of deaths and colectomies at a teaching hospital following increased fluoroquinolone use.Infect Control Hosp Epidemiol.2005;26:273–280.
- ,,, et al.An epidemic, toxin gene‐variant strain of Clostridium difficile.N Engl J Med.2005;353:2433–2441.
- ,,, et al.Outbreak of Clostridium difficile infection in a long‐term care facility: association with gatifloxacin use.Clin Infect Dis.2004;38:640–645.
- ,,, et al.A predominantly clonal multi‐institutional outbreak of Clostridium difficile‐associated diarrhea with high morbidity and mortality.N Engl J Med.2005;353:2442–2449.
- ,.No more equivalence trials for antibiotics in exacerbations of COPD, please.Chest.2004;125:811–813.
Copyright © 2010 Society of Hospital Medicine
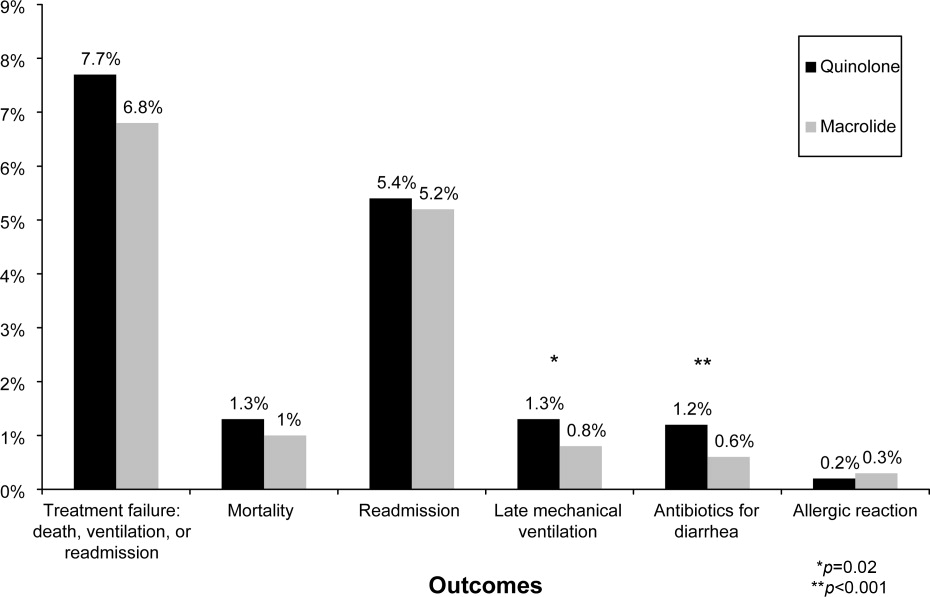
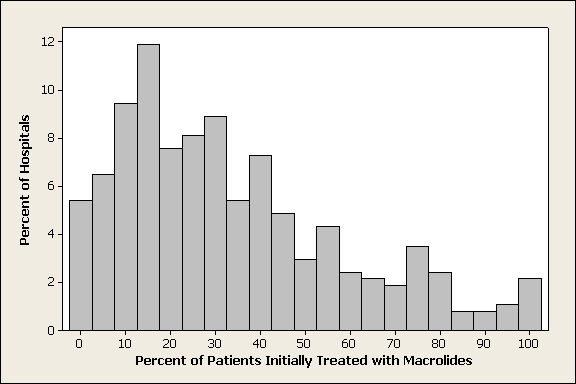
Inappropriate Hospital Prescribing
Medications can be considered inappropriate when their risk outweighs their benefit. The Beers list1 identifies medications that should be avoided in persons 65 years or older because they are ineffective or pose an unnecessarily high risk or because a safer alternative is available. Initially developed in 1991, the list has gained wide acceptance and has been updated twice.2, 3 In July 1999 it was adopted by the Centers for Medicare & Medicaid Services (CMS) for nursing home regulation, and in 2006 the National Committee on Quality Assurance adopted a modified version as a Health Plan Employer Data and Information Set (HEDIS) measure of quality of care for older Americans.4
A number of studies have demonstrated that inappropriate prescribing is common in the ambulatory setting,57 in nursing homes,8, 9 and in emergency departments10, 11 and that exposure to inappropriate medications is associated with increased risk of adverse drug reactions12 and hospitalization.13, 14 Initial studies of hospitalized patients1517 suggest that potentially inappropriate prescribing is also common among elderly inpatients and that reducing the misuse of psychotropic medications can prevent falls.18 We report on the incidence of and risk factors associated with potentially inappropriate prescribing in a large sample of hospitalized elders.
METHODS
Patients
We conducted a retrospective cohort study using data from 384 hospitals participating in Perspective (Premier, Inc., Charlotte, NC), a database developed for measuring quality and health care utilization. Participating hospitals represent all regions of the United States and are primarily small‐ to medium‐sized nonteaching hospitals most of which are in urban areas. Premier collects data elements from participating hospitals via a custom data extract from hospitals' decision support system. Hospitals aggregate the data elements into their decision support systems from multiple information technology systems including billing, medical records, pharmacy, and laboratory systems. In addition to the information contained in the standard hospital discharge file, Perspective includes a date‐stamped log of all billed items, including medications with dose and quantity, for individual patients.
We included patients at least 65 years old admitted between September 1, 2002, and June 30, 2005, with a principal diagnosis of acute myocardial infarction, chronic obstructive pulmonary disease, chest pain, community‐acquired pneumonia, congestive heart failure, ischemic stroke, or urinary tract infection. International Classification of Diseases, Ninth Revision (ICD‐9‐CM) codes were used to identify diagnoses. Patients cared for by an attending physician with a surgical specialty were excluded. The study protocol was approved by the institutional review board of Baystate Medical Center.
Data Elements
For each patient, Perspective contains fields for age, sex, race, marital status, insurance status, principal diagnosis, comorbidities, and specialty of the attending physician. Comorbidities were identified from ICD‐9‐CM secondary diagnosis codes and APR‐DRGs using Healthcare Cost and Utilization Project Comorbidity Software, version 3.1, based on the work of Elixhauser.19 Because almost all patients had Medicare coverage, plans were classified according to managed care status. Finally, for each patient we identified all medications administered, as well as discharge status, readmission rate, total costs, and length of stay. Hospitals were categorized by region (Northeast, South, Midwest, or West), bed size, setting (urban or rural), teaching status, and whether there were geriatricians.
Potentially Inappropriate Prescribing
Using the 2002 updated Beers criteria3 for potentially inappropriate medication (PIM) use in older adults, we identified the total number of PIMs administered to each patient during his or her hospital stay. We classified each PIM as either high or low severity based on the expert consensus expressed in the 1997 update of the Beers criteria.2 The list contains 48 PIMs and an additional 20 that should be avoided in patients with certain conditions. We did not include the second category of PIMs because we did not necessarily have sufficient patient information to make this determination. In addition, some of the standard PIMs, such as laxatives, although inappropriate for chronic outpatient use, could be appropriate in the hospital setting and were excluded from this analysis. Finally, several medications were considered inappropriate only above a given threshold (eg, lorazepam >3.0 mg/day) or for patients without a specific diagnosis (eg, digoxin >0.125 mg/day for patients without atrial fibrillation). We grouped PIMs that had similar side effects into 4 categories: sedatives, anticholinergics, causing orthostasis, or causing bleeding (Fig. 1).
Statistical Analysis
Summary statistics at the patient, physician, and hospital levels were constructed using frequencies and proportions for categorical data and means, standard deviations, medians, interquartile ranges, and box plots for continuous‐scale variables. Patients were identified as receiving a PIM if the drug was administered (above threshold dose where applicable) on at least 1 hospital day. We examined the association of each patient characteristic with use of any PIM, any high‐severity‐rated PIM, and each side effect category using chi‐square statistics. Kruskal‐Wallis analysis of variance was used to examine variation in hospital use rates by each hospital characteristic, and physician use rates for high‐severity PIMs by attending specialty. To examine whether it was feasible to avoid PIMs altogether, we compared individual hospitals as well as individual prescribers within their specialty, limiting the comparison to hospitals that contributed at least 100 patients and to physicians with at least 50 patients.
We developed a multivariable model for any high‐severity medication (HS‐PIM) use that included all patient, physician, and hospital characteristics except length of stay, mortality, cost, discharge status, and readmission rate. A generalized estimating equation model (SAS PROC GENMOD) with a logit link and a subcluster correlation structure was used to account for clustering at the hospital, physician, and diagnosis levels, adjusting for the clustering of primary diagnosis within physician level, nested within hospital level. Effects with P < .10 were retained in the model, and interaction effects were also evaluated for significance. Model fit was assessed using deviance and Pearson chi‐square statistics. All analyses were performed with SAS statistical software, version 9.1 (SAS Institute, Cary, NC).
RESULTS
We identified 519,853 patients at least 65 years old during the study period; 564 were excluded because of missing data for key variables or unclear principal diagnosis. An additional 25,318 were excluded because they were cared for by an attending with a surgical specialty. A total of 493,971 patients were included in the study (Table 1). Mean age was 78 years, and 24% of patients were 85 years or older. Forty‐three percent were male, 71% were white, and 39% were currently married. The most common principal diagnoses were community‐acquired pneumonia, congestive heart failure, and acute myocardial infarction. The most common comorbidities were hypertension, diabetes, and chronic pulmonary disease. Medicare was the primary payer for 91% of subjects, and 13% were in managed care plans. Most patients were cared for by internists (49%), family practitioners (18%), or cardiologists (17%). Only 1% of patients had a geriatrician as attending.
| Characteristic | n (%) |
|---|---|
| |
| Age group | |
| 6574 years | 168,527 (34%) |
| 7584 years | 206,407 (42%) |
| 85+ years | 119,037 (24%) |
| Sex | |
| Male | 212,358 (43%) |
| Female | 281,613 (57%) |
| Race | |
| White | 351,331 (71%) |
| Black | 52,429 (11%) |
| Hispanic | 18,057 (4%) |
| American Indian | 1876 (0%) |
| Asian/Pacific Islander | 5926 (1%) |
| Other | 64,352 (13%) |
| Marital status | |
| Married/partner | 194,496 (39%) |
| Widowed | 155,273 (31%) |
| Single/separated/divorced | 75,964 (15%) |
| Other | 68,238 (14%) |
| Primary diagnosis | |
| Pneumonia | 122,732 (25%) |
| Heart failure | 109,071 (22%) |
| Acute MI | 70,581 (14%) |
| Ischemic stroke | 57,204 (12%) |
| Chest pain | 50,404 (10%) |
| COPD | 44,582 (9%) |
| Urinary tract infection | 39,397 (8%) |
| Comorbidities | |
| Hypertension | 310,163 (63%) |
| Diabetes | 151,755 (31%) |
| Chronic pulmonary disease | 134,900 (27%) |
| Fluid and electrolyte disorders | 128,703 (26%) |
| Deficiency anemias | 92,668 (19%) |
| Congestive heart failure | 69,201 (14%) |
| Hypothyroidism | 68,711 (14%) |
| Peripheral vascular disease | 47,244 (10%) |
| Depression | 41,507 (8%) |
| Other neurological disorders | 40,200 (8%) |
| Renal failure | 38,134 (8%) |
| Obesity | 25,143 (5%) |
| Payer type | |
| Not Managed care | 431,583 (87%) |
| Managed care | 62,388 (13%) |
| Attending physician specialty | |
| Internal medicine (internist) | 241,982 (49%) |
| Family/general medicine | 90,827 (18%) |
| Cardiology | 83,317 (17%) |
| Pulmonology | 21,163 (4%) |
| Hospitalist | 14,924 (3%) |
| Nephrology | 8257 (2%) |
| Neurology | 5800 (1%) |
| Geriatrics | 3099 (1%) |
| Other* | 24,602 (5%) |
| Mortality | |
| Expired | 28,321 (6%) |
| Alive | 465,650 (94%) |
| Discharge status, n (% of survivors) | |
| Home | 323,629 (66%) |
| Nursing care | 119,468 (24%) |
| Transfer/short‐term hospital | 13,531 (3%) |
| Hospice | 9022 (2%) |
| 14‐Day readmission, n (% of survivors) | |
| Yes | 35,309 (8%) |
| No | 430,334 (92%) |
| Length of stay (days), median (IQR) | 4 (2, 7) |
| Total cost (dollars) | $5513 ($3366, $9902) |
Just under half of all patients (49%) received at least 1 PIM, and 6% received 3 or more (Table 2). Thirty‐eight percent received at least 1 drug with a high severity rating (HS‐PIM). The most common PIMs were promethazine, diphenhydramine, propoxyphene, clonidine, amiodarone, and lorazepam (>3 mg/day).
| Patients, n (%) | |
|---|---|
| Number of PIMs | |
| 0 | 254,200 (51%) |
| 1 | 146,028 (30%) |
| 2 | 61,445 (12%) |
| 3 | 22,128 (4%) |
| 4+ | 10,170 (2%) |
| Number of high‐severity‐rated PIMs | |
| 0 | 304,523 (62%) |
| 1 | 129,588 (26%) |
| 2 | 43,739 (9%) |
| 3 | 12,213 (2%) |
| 4+ | 3908 (1%) |
| Use of any PIM by side effect class | |
| Sedatives | 156,384 (32%) |
| Anticholinergic effects | 109,293 (22%) |
| Causing orthostasis | 43,805 (9%) |
| Causing bleeding | 14,744 (3%) |
| Most commonly prescribed | |
| Promethazine | 49,888 (10%) |
| Diphenhydramine | 45,458 (9%) |
| Propoxyphene | 41,786 (8%) |
| Clonidine | 34,765 (7%) |
| Amiodarone | 34,318 (7%) |
| Lorazepam (>3 mg/day) | 25,147 (5%) |
Patient, Physician, and Hospital Factors Associated with PIMs
Patient, physician, and hospital characteristics were all associated with use of PIMs (Table 3). In univariate analyses, older patients were less likely to receive any class of PIM, and this difference was accentuated for HS‐PIMs. Women, American Indians, married people, and those not in managed care plans were slightly more likely to receive PIMs, whereas patients admitted with acute myocardial infarction or congestive heart failure were even more likely to receive PIMs (P < .0001 for all comparisons).
| Patient characteristic | Any PIM n (row %) | Any high‐severity PIM n (row %) | Sedatives n (row %) | Anticholinergic effects n (row %) | Causing orthostasis n (row %) | Causing bleeding n (row %) |
|---|---|---|---|---|---|---|
| ||||||
| Overall | 239,771 (49%) | 189,448 (38%) | 156,384 (32%) | 109,293 (22%) | 43,805 (9%) | 14,744 (3%) |
| Age group | ||||||
| 6574 years | 89,168 (53%) | 72,573 (43%) | 61,399 (36%) | 44,792 (27%) | 15,799 (9%) | 6655 (4%) |
| 7584 years | 100,787 (49%) | 79,595 (39%) | 65,034 (32%) | 45,121 (22%) | 18,519 (9%) | 5727 (3%) |
| 85+ years | 49,816 (42%) | 37,280 (31%) | 29,951 (25%) | 19,380 (16%) | 9487 (8%) | 2362 (2%) |
| Sex | ||||||
| Male | 100,824 (47%) | 79,535 (37%) | 63,591 (30%) | 42,754 (20%) | 17,885 (8%) | 5771 (3%) |
| Female | 138,947 (49%) | 109,913 (39%) | 92,793 (33%) | 66,539 (24%) | 25,920 (9%) | 8973 (3%) |
| Race | ||||||
| White | 173,481 (49%) | 139,941 (40%) | 112,556 (32%) | 81,097 (23%) | 27,555 (8%) | 10,590 (3%) |
| Black | 26,793 (51%) | 18,655 (36%) | 18,720 (36%) | 11,263 (21%) | 8925 (17%) | 1536 (3%) |
| Hispanic | 8509 (47%) | 6370 (35%) | 5549 (31%) | 3505 (19%) | 2047 (11%) | 648 (4%) |
| American Indian | 1091 (58%) | 849 (45%) | 818 (44%) | 563 (30%) | 190 (10%) | 76 (4%) |
| Asian/Pacific Islander | 2386 (40%) | 1896 (32%) | 1420 (24%) | 1023 (17%) | 519 (9%) | 127 (2%) |
| Other | 27,511 (43%) | 21,737 (34%) | 17,321 (27%) | 11,842 (18%) | 4569 (7%) | 1767 (3%) |
| Marital status | ||||||
| Married/partner | 96,874 (50%) | 77,803 (40%) | 63,303 (33%) | 45,042 (23%) | 16,765 (9%) | 5969 (3%) |
| Widowed | 74,622 (48%) | 58,012 (37%) | 48,367 (31%) | 33,516 (22%) | 13,865 (9%) | 4354 (3%) |
| Single/separated/divorced | 36,583 (48%) | 28,799 (38%) | 24,251 (32%) | 16,115 (21%) | 7229 (10%) | 2399 (3%) |
| Other | 31,692 (46%) | 24,834 (36%) | 20,463 (30%) | 14,620 (21%) | 5946 (9%) | 2022 (3%) |
| Primary diagnosis | ||||||
| Pneumonia | 56,845 (46%) | 46,271 (38%) | 35,353 (29%) | 25,484 (21%) | 9184 (7%) | 4155 (3%) |
| Heart failure | 56,460 (52%) | 42,231 (39%) | 34,340 (31%) | 22,093 (20%) | 10,117 (9%) | 1945 (2%) |
| Acute MI | 43,046 (61%) | 37,849 (54%) | 32,560 (46%) | 25,568 (36%) | 4738 (7%) | 2549 (4%) |
| Ischemic stroke | 25,763 (45%) | 17,613 (31%) | 18,500 (32%) | 8742 (15%) | 9644 (17%) | 1384 (2%) |
| Chest pain | 20,655 (41%) | 16,363 (32%) | 13,536 (27%) | 10,520 (21%) | 3474 (7%) | 2027 (4%) |
| COPD | 18,876 (42%) | 14,626 (33%) | 12,087 (27%) | 8096 (18%) | 3209 (7%) | 1139 (3%) |
| Urinary tract infection | 18,126 (46%) | 14,495 (37%) | 10,008 (25%) | 8790 (22%) | 3439 (9%) | 1545 (4%) |
| Payer type | ||||||
| Nonmanaged care | 212,150 (49%) | 168,013 (39%) | 138,679 (32%) | 97,776 (23%) | 38,341 (9%) | 12,868 (3%) |
| Managed care | 27,621 (44%) | 21,435 (34%) | 17,705 (28%) | 11,517 (18%) | 5464 (9%) | 1876 (3%) |
| Attending physician specialty* | ||||||
| Internal medicine (internist%) | 112,664 (47%) | 86,907 (36%) | 71,382 (30%) | 48,746 (20%) | 23,221 (10%) | 7086 (3%) |
| Family/general medicine | 41,303 (45%) | 32,338 (36%) | 25,653 (28%) | 18,274 (20%) | 7660 (8%) | 2852 (3%) |
| Cardiology | 48,485 (58%) | 40,752 (49%) | 34,859 (42%) | 25,792 (31%) | 5455 (7%) | 2542 (3%) |
| Pulmonology | 10,231 (48%) | 8105 (38%) | 6746 (32%) | 4064 (19%) | 1739 (8%) | 574 (3%) |
| Hospitalist | 7003 (47%) | 5443 (36%) | 4447 (30%) | 3179 (21%) | 1471 (10%) | 463 (3%) |
| Nephrology | 4508 (55%) | 3388 (41%) | 3132 (38%) | 2054 (25%) | 1326 (16%) | 198 (2%) |
| Neurology | 2420 (42%) | 1789 (31%) | 1625 (28%) | 851 (15%) | 699 (12%) | 174 (3%) |
| Geriatrics | 1020 (33%) | 785 (25%) | 596 (19%) | 404 (13%) | 196 (6%) | 41 (1%) |
The HS‐PIM prescribing varied substantially by attending specialty (Fig. 2). Internists, family practitioners, and hospitalists all had similar median rates (33%), cardiologists had a higher median rate (48%), and geriatricians had a lower rate (24%). The most common PIM also differed by specialty: whereas promethazine was the most commonly prescribed drug across most specialties, nephrologists and neurologists used clonidine, pulmonologists used lorazepam, and cardiologists used diphenhydramine most often. Among the 8% of physicians who saw at least 50 patients, there was also great variation in each specialty (Fig. 2). Among internists and cardiologists who saw at least 50 patients, the high‐severity PIM usage rate ranged from 0% to more than 90%.
There was substantial variation in PIM usage among hospitals, most notably by region. The mean proportion of patients receiving PIMs ranged from 34% at hospitals in the Northeast to 55% at hospitals in the South (Table 4). Smaller hospitals and those in urban settings had slightly lower rates, as did those that had geriatricians on staff. The teaching status of the hospital had little effect. Variation at the individual hospital level was extreme (Fig. 3). Although half of all hospitals had rates between 43% and 58%, in 7 hospitals with more than 300 encounters each, PIMs were never prescribed for geriatric patients.
| Hospitals Total = 384 n (%) | Patients N = 49,3971 n (%) | Any PIM Mean = 48.2 Mean (SD) | Any high‐severity PIM Mean = 38.7 Mean (SD) | Sedatives Mean = 30.2 Mean (SD) | Anticholinergic effects Mean = 21.5 Mean (SD) | Causing orthostasis Mean = 8.5 Mean (SD) | Causing bleeding Mean = 3.1 Mean (SD) | |
|---|---|---|---|---|---|---|---|---|
| ||||||||
| Hospital region | *** | *** | *** | *** | *** | ** | ||
| Midwest | 76 (20%) | 95,791 (19%) | 38.8 (19.7) | 30.0 (16.4) | 24.3 (13.8) | 15.1 (9.9) | 6.9 (6.3) | 3.1 (2.3) |
| Northeast | 47 (12%) | 79,138 (16%) | 34.1 (12.6) | 26.2 (11.2) | 19.0 (9.2) | 13.5 (8.1) | 4.9 (2.3) | 2.1 (1.6) |
| South | 199 (52%) | 260,870 (53%) | 54.5 (10.1) | 42.7 (9.6) | 36.0 (10.8) | 26.4 (8.6) | 10.4 (4.6) | 3.6 (2.5) |
| West | 62 (16%) | 58,172 (12%) | 45.8 (8.1) | 37.4 (7.1) | 27.3 (7.7) | 19.5 (5.7) | 7.4 (4.8) | 2.7 (1.3) |
| Teaching status | ||||||||
| Nonteaching | 297 (77%) | 324,948 (66%) | 47.3 (14.6) | 36.9 (12.3) | 29.8 (12.0) | 21.3 (9.9) | 8.7 (5.4) | 3.3 (2.4) |
| Teaching | 87 (23%) | 169,023 (34%) | 48.2 (16.0) | 38.8 (14.2) | 31.6 (14.5) | 22.1 (10.2) | 7.8 (4.4) | 2.7 (1.5) |
| Staffed beds | * | ** | ||||||
| 22200 | 143 (37%) | 80,741 (16%) | 45.5 (16.9) | 35.2 (14.6) | 27.5 (14.0) | 20.1 (10.3) | 8.0 (6.2) | 3.5 (3.1) |
| 200400 | 137 (36%) | 177,286 (36%) | 47.7 (14.2) | 37.8 (12.0) | 30.5 (11.6) | 22.0 (10.0) | 8.4 (4.7) | 3.0 (1.6) |
| 400+ | 104 (27%) | 235944 (48%) | 50.1 (12.4) | 39.6 (10.6) | 33.5 (10.9) | 22.7 (9.3) | 9.3 (4.2) | 2.9 (1.4) |
| Population serviced | * | * | ** | |||||
| Rural | 119 (31%) | 102,799 (21%) | 48.4 (13.0) | 38.3 (10.6) | 29.2 (11.0) | 23.2 (9.3) | 7.5 (4.0) | 3.7 (3.0) |
| Urban | 265 (69%) | 391,172 (79%) | 47.1 (15.7) | 36.9 (13.7) | 30.6 (13.2) | 20.7 (10.2) | 9.0 (5.6) | 2.9 (1.8) |
| Geriatrician presence | ||||||||
| No | 340 (89%) | 409,281 (83%) | 47.7 (15.3) | 37.6 (13.0) | 30.3 (12.8) | 21.7 (10.0) | 8.4 (5.3) | 3.2 (2.3) |
| Yes | 44 (11%) | 84,690 (17%) | 45.8 (11.4) | 35.5 (10.6) | 29.4 (10.8) | 19.6 (9.4) | 9.3 (4.3) | 2.9 (1.6) |
Multivariable Model
In a multivariable logit model that included all patient, hospital, and physician characteristics and that accounted for clustering at the hospital, physician, and diagnosis levels, several characteristics were associated with HS‐PIM prescribing (Table 5). By far the most important predictor of use was hospital region. Compared with patients at hospitals in the Midwest, patients in the South (OR 1.63, 95% CI 1.591.67) and West (OR 1.43, 95% CI 1.381.47) were more likely and those in the Northeast were less likely (OR 0.85, 95% CI 0.830.88) to receive HS‐PIMs. Larger hospitals had higher HS‐PIM rates than smaller ones, but teaching status and rural or urban setting were not associated with HS‐PIM prescribing. The presence of geriatricians in a hospital was also associated with lower HS‐PIM prescribing for the entire hospital.
| Effect (reference) | Odds ratio | 95% Confidence limits | |
|---|---|---|---|
| Age | |||
| 6574 years | 1.00 | ||
| 7584 years | 0.83 | 0.82 | 0.84 |
| 85+ years | 0.59 | 0.58 | 0.61 |
| Sex | |||
| Female | 1.00 | ||
| Male | 0.85 | 0.83 | 0.86 |
| Race | |||
| White | 1.00 | ||
| Black | 0.78 | 0.76 | 0.80 |
| Hispanic | 0.84 | 0.81 | 0.87 |
| American Indian | 0.97 | 0.88 | 1.07 |
| Asian/Pacific Islander | 0.74 | 0.70 | 0.79 |
| Other | 0.94 | 0.92 | 0.97 |
| Marital Status | |||
| Married/partner | 1.00 | ||
| Single/separated/divorced | 0.96 | 0.94 | 0.98 |
| Widowed | 0.96 | 0.95 | 0.98 |
| Other | 0.93 | 0.90 | 0.95 |
| Primary diagnosis | |||
| Pneumonia | 1.00 | ||
| COPD | 0.83 | 0.81 | 0.85 |
| Heart failure | 1.14 | 1.12 | 1.16 |
| Ischemic stroke | 0.84 | 0.82 | 0.86 |
| Acute MI | 1.95 | 1.90 | 2.01 |
| Urinary tract infection | 1.06 | 1.03 | 1.09 |
| Chest pain | 0.87 | 0.84 | 0.89 |
| Comorbidities (yes or no) | |||
| Hypertension | 0.98 | 0.97 | 0.99 |
| Diabetes | 0.98 | 0.97 | 1.00 |
| Chronic lung disease | 1.11 | 1.10 | 1.13 |
| Fluid and electrolyte disorders | 1.26 | 1.24 | 1.27 |
| Anemia deficiencies | 1.17 | 1.15 | 1.18 |
| Congestive heart failure | 1.34 | 1.32 | 1.37 |
| Hypothyroidism | 1.13 | 1.11 | 1.15 |
| Peripheral vascular disease | 1.09 | 1.06 | 1.11 |
| Depression | 1.38 | 1.35 | 1.41 |
| Neurological disorders | 0.89 | 0.87 | 0.91 |
| Renal failure | 1.23 | 1.20 | 1.26 |
| Obesity | 1.11 | 1.08 | 1.14 |
| Payer type | |||
| Managed care | 1.00 | ||
| Not managed care | 1.04 | 1.02 | 1.06 |
| Attending physician specialty | |||
| Internal medicine | 1.00 | ||
| Cardiology | 1.32 | 1.28 | 1.36 |
| Family/general medicine | 0.99 | 0.97 | 1.01 |
| Geriatrics | 0.69 | 0.61 | 0.78 |
| Hospitalist | 0.90 | 0.84 | 0.96 |
| Nephrology | 1.02 | 0.96 | 1.08 |
| Neurology | 0.93 | 0.86 | 1.00 |
| Pulmonology | 1.10 | 1.05 | 1.15 |
| Setting | |||
| Rural | 1.00 | ||
| Urban | 1.02 | 1.00 | 1.05 |
| Teaching status | |||
| Nonteaching | 1.00 | ||
| Teaching | 1.01 | 0.98 | 1.03 |
| Number of beds | |||
| 22200 | 1.00 | ||
| 200400 | 1.08 | 1.05 | 1.11 |
| 400+ | 1.12 | 1.09 | 1.16 |
| Region | |||
| Midwest | 1.00 | ||
| Northeast | 0.85 | 0.83 | 0.88 |
| South | 1.63 | 1.59 | 1.67 |
| West | 1.43 | 1.38 | 1.47 |
| Geriatrician presence | |||
| No | 1.00 | ||
| Yes | 0.93 | 0.90 | 0.95 |
Physician specialty was also important. Adjusting for diagnosis attenuated some of this association, but compared with internists, cardiologists (OR 1.32, 95% CI 1.281.36) and pulmonologists (OR 1.10, 95% CI 1.051.15) were still more likely, hospitalists (OR 0.90, 95% CI 0.840.96) were less likely, and geriatricians (0.69, 95% CI 0.610.78) were least likely to prescribe any HS‐PIM.
Patient factors were also associated with HS‐PIM use. Compared with patients age 6574 years, patients older than 85 years were much less likely to receive an HS‐PIM (OR 0.59, CI 0.580.61), as to a lesser extent were nonwhites compared with whites and unmarried people compared with those who were married. Compared with patients with pneumonia, those with COPD, stroke, or chest pain were less likely and those with myocardial infarction and congestive heart failure were more likely to receive HS‐PIMs. Patients with a secondary diagnosis of depression were also at high risk (OR 1.38, CI 1.351.41).
DISCUSSION
Although Americans age 65 years and older make up less than 15% of the U.S. population, they consume about one third of all prescription drugs20 and account for one third of all hospital admissions.21 Using the Beers list, numerous studies have documented high rates of potentially inappropriate prescribing for community‐dwelling elderly and nursing home patients and, in some studies, an attendant risk of falling,2224 hip fracture,25, 26 hospitalization,13 or death.14 Applying these same criteria to a large sample of medical inpatients, we found that almost half received a potentially inappropriate drug, most of high severity. Moreover, the PIM prescribing rate varied substantially by region, hospital, and attending physician specialty. Although the use of PIMs was associated with patient age, comorbidities, and primary diagnosis, these patient factors explained only a small portion of the variation in prescribing practices across groups of physicians and hospitals.
Using consensus criteria, Beers originally found that 40% of the residents in 12 nursing homes received at least 1 PIM,8 and studies of community‐dwelling elderly demonstrated rates of 21% to 37%, with little change over time.6, 27, 28 Several small studies have examined inpatient prescribing.16, 17, 29, 30 The largest17 found that only 15% of elderly Italian inpatients received a PIM. Our finding, that 49% of inpatients had received at least 1 PIM, may partially reflect the high prevalence of use among elderly US patients in nursing homes and the community.
Regional variation has been demonstrated for ambulatory patients in the US6 and Europe.31 Zhan et al. found slightly higher rates of PIM use in the Midwest and the South (23%) than in the Northeast and the West (19%). Variation in Europe was greater, with 41% of patients in the Czech Republic versus 5.8% of patients in Denmark receiving at least 1 PIM. We found that region was the strongest predictor of in‐hospital HS‐PIM use, with patients in the South most likely and patients in the Northeast least likely to receive HS‐PIMs. This variation persisted even after adjusting for differences in other patient and hospital factors, suggesting that local custom played a large role in the decision to prescribe HS‐PIMs. Moreover, because outpatient rates are more uniform, these large differences seem limited to inpatient practice.
Patient factors have also been examined. Advanced age was associated with decreased PIM use in some studies17, 28, 31 but not in others.6, 27 We found increasing age to be strongly associated with decreased PIM use, suggesting that in the hospital, at least, doctors take care to avoid prescribing certain drugs to the frail elderly. Women appear to be consistently at higher risk than men,6, 27, 28, 31 and white patients are more at risk than those of other races.6 Our finding that certain diagnoses were associated with higher or lower rates has not been reported previously. The lower rates associated with stroke and COPD suggest that prescribers were aware that these patients were at increased risk of delirium and respiratory depression. The higher rates associated with myocardial infarction may have to do with the use of standardized order sets (eg, cath lab orders) that do not consider the age of the patient going for the procedure.
Admission to a geriatric service32 and intervention by a clinical pharmacist33 have been shown to decrease PIM prescribing at discharge. We noted that patients cared for by a geriatrician had the lowest rates of PIM prescribing during hospitalization as well and that hospitals with geriatricians had lower rates overall, possibly demonstrating that geriatricians had a ripple effect on their colleagues. Hospitalists also had lower rates than internists, supporting the notion that hospitalists provide higher‐quality inpatient care.
Our study had some important limitations. First, we only had access to inpatient administrative records. Thus, we could not identify which medications were continued from home and which were begun in the hospital, nor could we know the indications for which specific drugs were prescribed or who prescribed them. Based on published outpatient rates, however, we could assume that many of the drugs were started in the hospital and that others could have been discontinued but were not. Second, the Beers list was developed by the modified Delphi method; there was little empirical evidence of the danger of specific drugs, although some classes, such as benzodiazepines, opiates and digoxin, have been associated with inpatient falls.18, 3436 Furthermore, our administrative database did not allow us to balance the risks and benefits for particular patients; hence, the medications were only potentially inappropriate, and our study did not address the consequences of such prescribing. Although some of these drugs may be appropriate under certain circumstances, it is unlikely that these circumstances would vary by 60% across geographic regions or that internists would encounter these circumstances more often than do hospitalists. Thus, although we could not identify specific patients who received inappropriate medications, we did identify certain hospitals and even whole regions of the country in which the rate of inappropriate prescribing was high. Third, the Beers list, which was developed for outpatient use, may be less relevant in the inpatient setting. However, given that inpatients have more organ dysfunction and are at higher risk of delirium and falls, it may actually be more applicable to hospitalized patients. We similarly did not distinguish between single and multiple doses because the Beers list does not make such a distinction, and there is no empirical evidence that a single dose is safe. Indeed, patients are often at highest risk of falls immediately after initiation of therapy.3739 We did, however, exclude drugs such as laxatives, which may be appropriate for brief inpatient use but not for chronic use.
Our study also had a number of strengths. The large sample size, representing approximately 5% of annual inpatient admissions in the US over 2 years, offered an instructive look at the recent prescribing patterns of thousands of US physicians. We were able to identify many patient, physician, and hospital factors associated with PIM prescribing that have not previously been reported. Some of these factors, such as advanced age and comorbid diagnoses, suggest that physicians do tailor their treatment to individual patients. Nevertheless, patient factors accounted for only a small portion of the variation in prescribing. The largest variation, associated with regional, hospital, and physician factors, highlights the opportunity for improvement.
At the same time, our findings are encouraging for 2 reasons. First, most inappropriate prescribing involved only a handful of medications, so small changes in prescribing patterns could have a tremendous impact. Second, observing the practice of individual physicians and hospitals reveals what is possible. We found that in most specialties there were physicians who rarely or never used PIMs. We also found 7 hospitals, each with at least 300 cases, where no PIMs were ever prescribed.
Where should hospitals focus their efforts to prevent inappropriate prescribing? Our data highlight the complexity of the problem, which seems daunting. PIM prescribing is spread across all specialties, including geriatrics, and although cardiologists had the highest rate of prescribing, internists, who were more numerous, accounted for a much higher overall number of potentially inappropriate prescriptions. It would be instructive to study the 7 hospitals where PIMs were never prescribed or to interview those physicians who never prescribed PIMs, but the anonymous nature of our data would not allow for this. However, our data do suggest some directions. First, hospitals should become aware of their own rates of PIM use because measurement is the first step in quality improvement. Next, hospitals should focus efforts on reducing the use of the most common drugs. Eliminating just 3 drugs promethazine, diphenhydramine, and propoxyphenewould reduce the use of PIMs in 24% of elderly patients. Enlisting hospital pharmacists and electronic health records and reviewing standard order sets for elderly patients are potentially effective strategies. Finally, increasing the presence of geriatricians and hospitalists would be expected to have a modest impact.
In a representative sample of elderly inpatients, we found that almost half received a potentially inappropriate medication and that the rate of inappropriate prescribing varied widely among doctors and hospitals. Additional research is needed to distinguish which of the Beers drugs are most harmful and which patients are at highest risk. Research should also focus on understanding differences in prescribing patterns, perhaps by studying the outliers at both ends of the quality spectrum, and on techniques to minimize non‐patient‐centered variation.
- ,,,,,.Explicit criteria for determining inappropriate medication use in nursing home residents. UCLA Division of Geriatric Medicine.Arch Intern Med.1991;151:1825–1832.
- .Explicit criteria for determining potentially inappropriate medication use by the elderly. An update.Arch Intern Med.1997;157:1531–1536.
- ,,,,,.Updating the Beers criteria for potentially inappropriate medication use in older adults: results of a US consensus panel of experts.Arch Intern Med.2003;163:2716–2724.
- National Committee on Quality Assurance. Drugs to be Avoided in the Elderly. Available at: http://www.ncqa.org/Programs/HEDIS/2006/Volume2/NDC/DAE_06.xls. Accessed November 20,2006.
- ,,, et al.Inappropriate prescribing for elderly Americans in a large outpatient population.Arch Intern Med.2004;164:1621–1625.
- ,,, et al.Potentially inappropriate medication use in the community‐dwelling elderly: findings from the 1996 Medical Expenditure Panel Survey.JAMA.2001;286:2823–2829.
- ,.Prescribing potentially inappropriate psychotropic medications to the ambulatory elderly.Arch Intern Med.2000;160:2825–2831.
- ,,, et al.Inappropriate medication prescribing in skilled‐nursing facilities.Ann Intern Med.1992;117:684–689.
- ,,, et al.Adverse outcomes associated with inappropriate drug use in nursing homes.Ann Pharmacother.2005;39:405–411.
- ,,.Inappropriate medication administration to the acutely ill elderly: a nationwide emergency department study, 1992–2000.J Am Geriatr Soc.2004;52:1847–1855.
- ,,, et al.Appropriateness of medication selection for older persons in an urban academic emergency department.Acad Emerg Med.1999;6:1232–1242.
- ,,,,,.Use of the Beers criteria to predict adverse drug reactions among first‐visit elderly outpatients.Pharmacotherapy.2005;25:831–838.
- ,,.The association of inappropriate drug use with hospitalisation and mortality: a population‐based study of the very old.Drugs Aging.2005;22(1):69–82.
- ,,,,.Hospitalization and death associated with potentially inappropriate medication prescriptions among elderly nursing home residents.Arch Intern Med.2005;165(1):68–74.
- ,,.Potentially inappropriate prescribing for geriatric inpatients: an acute care of the elderly unit compared to a general medicine service.Consult Pharm.2003;18(1):37–42, 47–39.
- ,,, et al.Inappropriate medication use among frail elderly inpatients.Ann Pharmacother.2004;38(1):9–14.
- ,,,,,.Inappropriate medication use among hospitalized older adults in Italy: results from the Italian Group of Pharmacoepidemiology in the Elderly.Eur J Clin Pharmacol.2003;59(2):157–162.
- ,,,,,.Guided prescription of psychotropic medications for geriatric inpatients.Arch Intern Med.2005;165:802–807.
- ,,,.Comorbidity measures for use with administrative data.Med Care.1998;36(1):8–27.
- ,.Inadequate prescription‐drug coverage for Medicare enrollees—a call to action.N Engl J Med.1999;340:722–728.
- National and regional estimates on hospital use for all patients from the HCUP Nationwide Inpatient Sample (NIS). Agency for Healthcare Research and Quality (AHRQ). Available at: http://hcupnet.ahrq.gov/HCUPnet.jsp. Accessed October 12,2006.
- ,,,,,.Drugs and falls in community‐dwelling older people: a national veterans study.Clin Ther.2006;28:619–630.
- ,,,,,.Psychotropic medications and risk for falls among community‐dwelling frail older people: an observational study.J Gerontol A Biol Sci Med Sci.2005;60:622–626.
- ,,.Drugs and falls in older people: a systematic review and meta‐analysis: I. Psychotropic drugs.J Am Geriatr Soc.1999;47(1):30–39.
- ,,.Propoxyphene use and risk for hip fractures in older adults.Am J Geriatr Pharmacother.2006;4:219–226.
- ,,, et al.Central nervous system active medications and risk for fractures in older women.Arch Intern Med.2003;163:949–957.
- ,,, et al.Potentially inappropriate medication use by elderly persons in U.S. Health Maintenance Organizations, 2000–2001.J Am Geriatr Soc.2005;53:227–232.
- .Inappropriate medication prescribing for elderly ambulatory care patients.Arch Intern Med.2004;164:305–312.
- ,,.Adverse drug reactions in an elderly hospitalised population: inappropriate prescription is a leading cause.Drugs Aging.2005;22:767–777.
- ,,,,.Use of inappropriate medications and their prognostic significance among in‐hospital and nursing home patients with and without dementia in Finland.Drugs Aging.2006;23:333–343.
- ,,, et al.Potentially inappropriate medication use among elderly home care patients in Europe.JAMA.2005;293:1348–1358.
- ,,,,.Impact of hospitalisation in an acute medical geriatric unit on potentially inappropriate medication use.Drugs Aging.2006;23(1):49–59.
- ,.Pharmacists and their effectiveness in ensuring the appropriateness of the chronic medication regimens of geriatric inpatients.Consult Pharm.2004;19:432–436.
- ,,,,,.Benzodiazepines with different half‐life and falling in a hospitalized population: the GIFA study. Gruppo Italiano di Farmacovigilanza nell'Anziano.J Clin Epidemiol.2000;53:1222–1229.
- ,.Relationship between the administration of selected medications and falls in hospitalized elderly patients.Ann Pharmacother.1995;29:354–358.
- .The use of sedative/hypnotic medication and its correlation with falling down in the hospital.Sleep.1996;19:698–701.
- ,,, et al.Benzodiazepine use and hip fractures in the elderly: who is at greatest risk?Arch Intern Med.2004;164:1567–1572.
- ,,,,.Hazardous benzodiazepine regimens in the elderly: effects of half‐life, dosage, and duration on risk of hip fracture.Am J Psychiatry.2001;158:892–898.
- ,,,,.A 5‐year prospective assessment of the risk associated with individual benzodiazepines and doses in new elderly users.J Am Geriatr Soc.2005;53:233–241.
Medications can be considered inappropriate when their risk outweighs their benefit. The Beers list1 identifies medications that should be avoided in persons 65 years or older because they are ineffective or pose an unnecessarily high risk or because a safer alternative is available. Initially developed in 1991, the list has gained wide acceptance and has been updated twice.2, 3 In July 1999 it was adopted by the Centers for Medicare & Medicaid Services (CMS) for nursing home regulation, and in 2006 the National Committee on Quality Assurance adopted a modified version as a Health Plan Employer Data and Information Set (HEDIS) measure of quality of care for older Americans.4
A number of studies have demonstrated that inappropriate prescribing is common in the ambulatory setting,57 in nursing homes,8, 9 and in emergency departments10, 11 and that exposure to inappropriate medications is associated with increased risk of adverse drug reactions12 and hospitalization.13, 14 Initial studies of hospitalized patients1517 suggest that potentially inappropriate prescribing is also common among elderly inpatients and that reducing the misuse of psychotropic medications can prevent falls.18 We report on the incidence of and risk factors associated with potentially inappropriate prescribing in a large sample of hospitalized elders.
METHODS
Patients
We conducted a retrospective cohort study using data from 384 hospitals participating in Perspective (Premier, Inc., Charlotte, NC), a database developed for measuring quality and health care utilization. Participating hospitals represent all regions of the United States and are primarily small‐ to medium‐sized nonteaching hospitals most of which are in urban areas. Premier collects data elements from participating hospitals via a custom data extract from hospitals' decision support system. Hospitals aggregate the data elements into their decision support systems from multiple information technology systems including billing, medical records, pharmacy, and laboratory systems. In addition to the information contained in the standard hospital discharge file, Perspective includes a date‐stamped log of all billed items, including medications with dose and quantity, for individual patients.
We included patients at least 65 years old admitted between September 1, 2002, and June 30, 2005, with a principal diagnosis of acute myocardial infarction, chronic obstructive pulmonary disease, chest pain, community‐acquired pneumonia, congestive heart failure, ischemic stroke, or urinary tract infection. International Classification of Diseases, Ninth Revision (ICD‐9‐CM) codes were used to identify diagnoses. Patients cared for by an attending physician with a surgical specialty were excluded. The study protocol was approved by the institutional review board of Baystate Medical Center.
Data Elements
For each patient, Perspective contains fields for age, sex, race, marital status, insurance status, principal diagnosis, comorbidities, and specialty of the attending physician. Comorbidities were identified from ICD‐9‐CM secondary diagnosis codes and APR‐DRGs using Healthcare Cost and Utilization Project Comorbidity Software, version 3.1, based on the work of Elixhauser.19 Because almost all patients had Medicare coverage, plans were classified according to managed care status. Finally, for each patient we identified all medications administered, as well as discharge status, readmission rate, total costs, and length of stay. Hospitals were categorized by region (Northeast, South, Midwest, or West), bed size, setting (urban or rural), teaching status, and whether there were geriatricians.
Potentially Inappropriate Prescribing
Using the 2002 updated Beers criteria3 for potentially inappropriate medication (PIM) use in older adults, we identified the total number of PIMs administered to each patient during his or her hospital stay. We classified each PIM as either high or low severity based on the expert consensus expressed in the 1997 update of the Beers criteria.2 The list contains 48 PIMs and an additional 20 that should be avoided in patients with certain conditions. We did not include the second category of PIMs because we did not necessarily have sufficient patient information to make this determination. In addition, some of the standard PIMs, such as laxatives, although inappropriate for chronic outpatient use, could be appropriate in the hospital setting and were excluded from this analysis. Finally, several medications were considered inappropriate only above a given threshold (eg, lorazepam >3.0 mg/day) or for patients without a specific diagnosis (eg, digoxin >0.125 mg/day for patients without atrial fibrillation). We grouped PIMs that had similar side effects into 4 categories: sedatives, anticholinergics, causing orthostasis, or causing bleeding (Fig. 1).
Statistical Analysis
Summary statistics at the patient, physician, and hospital levels were constructed using frequencies and proportions for categorical data and means, standard deviations, medians, interquartile ranges, and box plots for continuous‐scale variables. Patients were identified as receiving a PIM if the drug was administered (above threshold dose where applicable) on at least 1 hospital day. We examined the association of each patient characteristic with use of any PIM, any high‐severity‐rated PIM, and each side effect category using chi‐square statistics. Kruskal‐Wallis analysis of variance was used to examine variation in hospital use rates by each hospital characteristic, and physician use rates for high‐severity PIMs by attending specialty. To examine whether it was feasible to avoid PIMs altogether, we compared individual hospitals as well as individual prescribers within their specialty, limiting the comparison to hospitals that contributed at least 100 patients and to physicians with at least 50 patients.
We developed a multivariable model for any high‐severity medication (HS‐PIM) use that included all patient, physician, and hospital characteristics except length of stay, mortality, cost, discharge status, and readmission rate. A generalized estimating equation model (SAS PROC GENMOD) with a logit link and a subcluster correlation structure was used to account for clustering at the hospital, physician, and diagnosis levels, adjusting for the clustering of primary diagnosis within physician level, nested within hospital level. Effects with P < .10 were retained in the model, and interaction effects were also evaluated for significance. Model fit was assessed using deviance and Pearson chi‐square statistics. All analyses were performed with SAS statistical software, version 9.1 (SAS Institute, Cary, NC).
RESULTS
We identified 519,853 patients at least 65 years old during the study period; 564 were excluded because of missing data for key variables or unclear principal diagnosis. An additional 25,318 were excluded because they were cared for by an attending with a surgical specialty. A total of 493,971 patients were included in the study (Table 1). Mean age was 78 years, and 24% of patients were 85 years or older. Forty‐three percent were male, 71% were white, and 39% were currently married. The most common principal diagnoses were community‐acquired pneumonia, congestive heart failure, and acute myocardial infarction. The most common comorbidities were hypertension, diabetes, and chronic pulmonary disease. Medicare was the primary payer for 91% of subjects, and 13% were in managed care plans. Most patients were cared for by internists (49%), family practitioners (18%), or cardiologists (17%). Only 1% of patients had a geriatrician as attending.
| Characteristic | n (%) |
|---|---|
| |
| Age group | |
| 6574 years | 168,527 (34%) |
| 7584 years | 206,407 (42%) |
| 85+ years | 119,037 (24%) |
| Sex | |
| Male | 212,358 (43%) |
| Female | 281,613 (57%) |
| Race | |
| White | 351,331 (71%) |
| Black | 52,429 (11%) |
| Hispanic | 18,057 (4%) |
| American Indian | 1876 (0%) |
| Asian/Pacific Islander | 5926 (1%) |
| Other | 64,352 (13%) |
| Marital status | |
| Married/partner | 194,496 (39%) |
| Widowed | 155,273 (31%) |
| Single/separated/divorced | 75,964 (15%) |
| Other | 68,238 (14%) |
| Primary diagnosis | |
| Pneumonia | 122,732 (25%) |
| Heart failure | 109,071 (22%) |
| Acute MI | 70,581 (14%) |
| Ischemic stroke | 57,204 (12%) |
| Chest pain | 50,404 (10%) |
| COPD | 44,582 (9%) |
| Urinary tract infection | 39,397 (8%) |
| Comorbidities | |
| Hypertension | 310,163 (63%) |
| Diabetes | 151,755 (31%) |
| Chronic pulmonary disease | 134,900 (27%) |
| Fluid and electrolyte disorders | 128,703 (26%) |
| Deficiency anemias | 92,668 (19%) |
| Congestive heart failure | 69,201 (14%) |
| Hypothyroidism | 68,711 (14%) |
| Peripheral vascular disease | 47,244 (10%) |
| Depression | 41,507 (8%) |
| Other neurological disorders | 40,200 (8%) |
| Renal failure | 38,134 (8%) |
| Obesity | 25,143 (5%) |
| Payer type | |
| Not Managed care | 431,583 (87%) |
| Managed care | 62,388 (13%) |
| Attending physician specialty | |
| Internal medicine (internist) | 241,982 (49%) |
| Family/general medicine | 90,827 (18%) |
| Cardiology | 83,317 (17%) |
| Pulmonology | 21,163 (4%) |
| Hospitalist | 14,924 (3%) |
| Nephrology | 8257 (2%) |
| Neurology | 5800 (1%) |
| Geriatrics | 3099 (1%) |
| Other* | 24,602 (5%) |
| Mortality | |
| Expired | 28,321 (6%) |
| Alive | 465,650 (94%) |
| Discharge status, n (% of survivors) | |
| Home | 323,629 (66%) |
| Nursing care | 119,468 (24%) |
| Transfer/short‐term hospital | 13,531 (3%) |
| Hospice | 9022 (2%) |
| 14‐Day readmission, n (% of survivors) | |
| Yes | 35,309 (8%) |
| No | 430,334 (92%) |
| Length of stay (days), median (IQR) | 4 (2, 7) |
| Total cost (dollars) | $5513 ($3366, $9902) |
Just under half of all patients (49%) received at least 1 PIM, and 6% received 3 or more (Table 2). Thirty‐eight percent received at least 1 drug with a high severity rating (HS‐PIM). The most common PIMs were promethazine, diphenhydramine, propoxyphene, clonidine, amiodarone, and lorazepam (>3 mg/day).
| Patients, n (%) | |
|---|---|
| Number of PIMs | |
| 0 | 254,200 (51%) |
| 1 | 146,028 (30%) |
| 2 | 61,445 (12%) |
| 3 | 22,128 (4%) |
| 4+ | 10,170 (2%) |
| Number of high‐severity‐rated PIMs | |
| 0 | 304,523 (62%) |
| 1 | 129,588 (26%) |
| 2 | 43,739 (9%) |
| 3 | 12,213 (2%) |
| 4+ | 3908 (1%) |
| Use of any PIM by side effect class | |
| Sedatives | 156,384 (32%) |
| Anticholinergic effects | 109,293 (22%) |
| Causing orthostasis | 43,805 (9%) |
| Causing bleeding | 14,744 (3%) |
| Most commonly prescribed | |
| Promethazine | 49,888 (10%) |
| Diphenhydramine | 45,458 (9%) |
| Propoxyphene | 41,786 (8%) |
| Clonidine | 34,765 (7%) |
| Amiodarone | 34,318 (7%) |
| Lorazepam (>3 mg/day) | 25,147 (5%) |
Patient, Physician, and Hospital Factors Associated with PIMs
Patient, physician, and hospital characteristics were all associated with use of PIMs (Table 3). In univariate analyses, older patients were less likely to receive any class of PIM, and this difference was accentuated for HS‐PIMs. Women, American Indians, married people, and those not in managed care plans were slightly more likely to receive PIMs, whereas patients admitted with acute myocardial infarction or congestive heart failure were even more likely to receive PIMs (P < .0001 for all comparisons).
| Patient characteristic | Any PIM n (row %) | Any high‐severity PIM n (row %) | Sedatives n (row %) | Anticholinergic effects n (row %) | Causing orthostasis n (row %) | Causing bleeding n (row %) |
|---|---|---|---|---|---|---|
| ||||||
| Overall | 239,771 (49%) | 189,448 (38%) | 156,384 (32%) | 109,293 (22%) | 43,805 (9%) | 14,744 (3%) |
| Age group | ||||||
| 6574 years | 89,168 (53%) | 72,573 (43%) | 61,399 (36%) | 44,792 (27%) | 15,799 (9%) | 6655 (4%) |
| 7584 years | 100,787 (49%) | 79,595 (39%) | 65,034 (32%) | 45,121 (22%) | 18,519 (9%) | 5727 (3%) |
| 85+ years | 49,816 (42%) | 37,280 (31%) | 29,951 (25%) | 19,380 (16%) | 9487 (8%) | 2362 (2%) |
| Sex | ||||||
| Male | 100,824 (47%) | 79,535 (37%) | 63,591 (30%) | 42,754 (20%) | 17,885 (8%) | 5771 (3%) |
| Female | 138,947 (49%) | 109,913 (39%) | 92,793 (33%) | 66,539 (24%) | 25,920 (9%) | 8973 (3%) |
| Race | ||||||
| White | 173,481 (49%) | 139,941 (40%) | 112,556 (32%) | 81,097 (23%) | 27,555 (8%) | 10,590 (3%) |
| Black | 26,793 (51%) | 18,655 (36%) | 18,720 (36%) | 11,263 (21%) | 8925 (17%) | 1536 (3%) |
| Hispanic | 8509 (47%) | 6370 (35%) | 5549 (31%) | 3505 (19%) | 2047 (11%) | 648 (4%) |
| American Indian | 1091 (58%) | 849 (45%) | 818 (44%) | 563 (30%) | 190 (10%) | 76 (4%) |
| Asian/Pacific Islander | 2386 (40%) | 1896 (32%) | 1420 (24%) | 1023 (17%) | 519 (9%) | 127 (2%) |
| Other | 27,511 (43%) | 21,737 (34%) | 17,321 (27%) | 11,842 (18%) | 4569 (7%) | 1767 (3%) |
| Marital status | ||||||
| Married/partner | 96,874 (50%) | 77,803 (40%) | 63,303 (33%) | 45,042 (23%) | 16,765 (9%) | 5969 (3%) |
| Widowed | 74,622 (48%) | 58,012 (37%) | 48,367 (31%) | 33,516 (22%) | 13,865 (9%) | 4354 (3%) |
| Single/separated/divorced | 36,583 (48%) | 28,799 (38%) | 24,251 (32%) | 16,115 (21%) | 7229 (10%) | 2399 (3%) |
| Other | 31,692 (46%) | 24,834 (36%) | 20,463 (30%) | 14,620 (21%) | 5946 (9%) | 2022 (3%) |
| Primary diagnosis | ||||||
| Pneumonia | 56,845 (46%) | 46,271 (38%) | 35,353 (29%) | 25,484 (21%) | 9184 (7%) | 4155 (3%) |
| Heart failure | 56,460 (52%) | 42,231 (39%) | 34,340 (31%) | 22,093 (20%) | 10,117 (9%) | 1945 (2%) |
| Acute MI | 43,046 (61%) | 37,849 (54%) | 32,560 (46%) | 25,568 (36%) | 4738 (7%) | 2549 (4%) |
| Ischemic stroke | 25,763 (45%) | 17,613 (31%) | 18,500 (32%) | 8742 (15%) | 9644 (17%) | 1384 (2%) |
| Chest pain | 20,655 (41%) | 16,363 (32%) | 13,536 (27%) | 10,520 (21%) | 3474 (7%) | 2027 (4%) |
| COPD | 18,876 (42%) | 14,626 (33%) | 12,087 (27%) | 8096 (18%) | 3209 (7%) | 1139 (3%) |
| Urinary tract infection | 18,126 (46%) | 14,495 (37%) | 10,008 (25%) | 8790 (22%) | 3439 (9%) | 1545 (4%) |
| Payer type | ||||||
| Nonmanaged care | 212,150 (49%) | 168,013 (39%) | 138,679 (32%) | 97,776 (23%) | 38,341 (9%) | 12,868 (3%) |
| Managed care | 27,621 (44%) | 21,435 (34%) | 17,705 (28%) | 11,517 (18%) | 5464 (9%) | 1876 (3%) |
| Attending physician specialty* | ||||||
| Internal medicine (internist%) | 112,664 (47%) | 86,907 (36%) | 71,382 (30%) | 48,746 (20%) | 23,221 (10%) | 7086 (3%) |
| Family/general medicine | 41,303 (45%) | 32,338 (36%) | 25,653 (28%) | 18,274 (20%) | 7660 (8%) | 2852 (3%) |
| Cardiology | 48,485 (58%) | 40,752 (49%) | 34,859 (42%) | 25,792 (31%) | 5455 (7%) | 2542 (3%) |
| Pulmonology | 10,231 (48%) | 8105 (38%) | 6746 (32%) | 4064 (19%) | 1739 (8%) | 574 (3%) |
| Hospitalist | 7003 (47%) | 5443 (36%) | 4447 (30%) | 3179 (21%) | 1471 (10%) | 463 (3%) |
| Nephrology | 4508 (55%) | 3388 (41%) | 3132 (38%) | 2054 (25%) | 1326 (16%) | 198 (2%) |
| Neurology | 2420 (42%) | 1789 (31%) | 1625 (28%) | 851 (15%) | 699 (12%) | 174 (3%) |
| Geriatrics | 1020 (33%) | 785 (25%) | 596 (19%) | 404 (13%) | 196 (6%) | 41 (1%) |
The HS‐PIM prescribing varied substantially by attending specialty (Fig. 2). Internists, family practitioners, and hospitalists all had similar median rates (33%), cardiologists had a higher median rate (48%), and geriatricians had a lower rate (24%). The most common PIM also differed by specialty: whereas promethazine was the most commonly prescribed drug across most specialties, nephrologists and neurologists used clonidine, pulmonologists used lorazepam, and cardiologists used diphenhydramine most often. Among the 8% of physicians who saw at least 50 patients, there was also great variation in each specialty (Fig. 2). Among internists and cardiologists who saw at least 50 patients, the high‐severity PIM usage rate ranged from 0% to more than 90%.
There was substantial variation in PIM usage among hospitals, most notably by region. The mean proportion of patients receiving PIMs ranged from 34% at hospitals in the Northeast to 55% at hospitals in the South (Table 4). Smaller hospitals and those in urban settings had slightly lower rates, as did those that had geriatricians on staff. The teaching status of the hospital had little effect. Variation at the individual hospital level was extreme (Fig. 3). Although half of all hospitals had rates between 43% and 58%, in 7 hospitals with more than 300 encounters each, PIMs were never prescribed for geriatric patients.
| Hospitals Total = 384 n (%) | Patients N = 49,3971 n (%) | Any PIM Mean = 48.2 Mean (SD) | Any high‐severity PIM Mean = 38.7 Mean (SD) | Sedatives Mean = 30.2 Mean (SD) | Anticholinergic effects Mean = 21.5 Mean (SD) | Causing orthostasis Mean = 8.5 Mean (SD) | Causing bleeding Mean = 3.1 Mean (SD) | |
|---|---|---|---|---|---|---|---|---|
| ||||||||
| Hospital region | *** | *** | *** | *** | *** | ** | ||
| Midwest | 76 (20%) | 95,791 (19%) | 38.8 (19.7) | 30.0 (16.4) | 24.3 (13.8) | 15.1 (9.9) | 6.9 (6.3) | 3.1 (2.3) |
| Northeast | 47 (12%) | 79,138 (16%) | 34.1 (12.6) | 26.2 (11.2) | 19.0 (9.2) | 13.5 (8.1) | 4.9 (2.3) | 2.1 (1.6) |
| South | 199 (52%) | 260,870 (53%) | 54.5 (10.1) | 42.7 (9.6) | 36.0 (10.8) | 26.4 (8.6) | 10.4 (4.6) | 3.6 (2.5) |
| West | 62 (16%) | 58,172 (12%) | 45.8 (8.1) | 37.4 (7.1) | 27.3 (7.7) | 19.5 (5.7) | 7.4 (4.8) | 2.7 (1.3) |
| Teaching status | ||||||||
| Nonteaching | 297 (77%) | 324,948 (66%) | 47.3 (14.6) | 36.9 (12.3) | 29.8 (12.0) | 21.3 (9.9) | 8.7 (5.4) | 3.3 (2.4) |
| Teaching | 87 (23%) | 169,023 (34%) | 48.2 (16.0) | 38.8 (14.2) | 31.6 (14.5) | 22.1 (10.2) | 7.8 (4.4) | 2.7 (1.5) |
| Staffed beds | * | ** | ||||||
| 22200 | 143 (37%) | 80,741 (16%) | 45.5 (16.9) | 35.2 (14.6) | 27.5 (14.0) | 20.1 (10.3) | 8.0 (6.2) | 3.5 (3.1) |
| 200400 | 137 (36%) | 177,286 (36%) | 47.7 (14.2) | 37.8 (12.0) | 30.5 (11.6) | 22.0 (10.0) | 8.4 (4.7) | 3.0 (1.6) |
| 400+ | 104 (27%) | 235944 (48%) | 50.1 (12.4) | 39.6 (10.6) | 33.5 (10.9) | 22.7 (9.3) | 9.3 (4.2) | 2.9 (1.4) |
| Population serviced | * | * | ** | |||||
| Rural | 119 (31%) | 102,799 (21%) | 48.4 (13.0) | 38.3 (10.6) | 29.2 (11.0) | 23.2 (9.3) | 7.5 (4.0) | 3.7 (3.0) |
| Urban | 265 (69%) | 391,172 (79%) | 47.1 (15.7) | 36.9 (13.7) | 30.6 (13.2) | 20.7 (10.2) | 9.0 (5.6) | 2.9 (1.8) |
| Geriatrician presence | ||||||||
| No | 340 (89%) | 409,281 (83%) | 47.7 (15.3) | 37.6 (13.0) | 30.3 (12.8) | 21.7 (10.0) | 8.4 (5.3) | 3.2 (2.3) |
| Yes | 44 (11%) | 84,690 (17%) | 45.8 (11.4) | 35.5 (10.6) | 29.4 (10.8) | 19.6 (9.4) | 9.3 (4.3) | 2.9 (1.6) |
Multivariable Model
In a multivariable logit model that included all patient, hospital, and physician characteristics and that accounted for clustering at the hospital, physician, and diagnosis levels, several characteristics were associated with HS‐PIM prescribing (Table 5). By far the most important predictor of use was hospital region. Compared with patients at hospitals in the Midwest, patients in the South (OR 1.63, 95% CI 1.591.67) and West (OR 1.43, 95% CI 1.381.47) were more likely and those in the Northeast were less likely (OR 0.85, 95% CI 0.830.88) to receive HS‐PIMs. Larger hospitals had higher HS‐PIM rates than smaller ones, but teaching status and rural or urban setting were not associated with HS‐PIM prescribing. The presence of geriatricians in a hospital was also associated with lower HS‐PIM prescribing for the entire hospital.
| Effect (reference) | Odds ratio | 95% Confidence limits | |
|---|---|---|---|
| Age | |||
| 6574 years | 1.00 | ||
| 7584 years | 0.83 | 0.82 | 0.84 |
| 85+ years | 0.59 | 0.58 | 0.61 |
| Sex | |||
| Female | 1.00 | ||
| Male | 0.85 | 0.83 | 0.86 |
| Race | |||
| White | 1.00 | ||
| Black | 0.78 | 0.76 | 0.80 |
| Hispanic | 0.84 | 0.81 | 0.87 |
| American Indian | 0.97 | 0.88 | 1.07 |
| Asian/Pacific Islander | 0.74 | 0.70 | 0.79 |
| Other | 0.94 | 0.92 | 0.97 |
| Marital Status | |||
| Married/partner | 1.00 | ||
| Single/separated/divorced | 0.96 | 0.94 | 0.98 |
| Widowed | 0.96 | 0.95 | 0.98 |
| Other | 0.93 | 0.90 | 0.95 |
| Primary diagnosis | |||
| Pneumonia | 1.00 | ||
| COPD | 0.83 | 0.81 | 0.85 |
| Heart failure | 1.14 | 1.12 | 1.16 |
| Ischemic stroke | 0.84 | 0.82 | 0.86 |
| Acute MI | 1.95 | 1.90 | 2.01 |
| Urinary tract infection | 1.06 | 1.03 | 1.09 |
| Chest pain | 0.87 | 0.84 | 0.89 |
| Comorbidities (yes or no) | |||
| Hypertension | 0.98 | 0.97 | 0.99 |
| Diabetes | 0.98 | 0.97 | 1.00 |
| Chronic lung disease | 1.11 | 1.10 | 1.13 |
| Fluid and electrolyte disorders | 1.26 | 1.24 | 1.27 |
| Anemia deficiencies | 1.17 | 1.15 | 1.18 |
| Congestive heart failure | 1.34 | 1.32 | 1.37 |
| Hypothyroidism | 1.13 | 1.11 | 1.15 |
| Peripheral vascular disease | 1.09 | 1.06 | 1.11 |
| Depression | 1.38 | 1.35 | 1.41 |
| Neurological disorders | 0.89 | 0.87 | 0.91 |
| Renal failure | 1.23 | 1.20 | 1.26 |
| Obesity | 1.11 | 1.08 | 1.14 |
| Payer type | |||
| Managed care | 1.00 | ||
| Not managed care | 1.04 | 1.02 | 1.06 |
| Attending physician specialty | |||
| Internal medicine | 1.00 | ||
| Cardiology | 1.32 | 1.28 | 1.36 |
| Family/general medicine | 0.99 | 0.97 | 1.01 |
| Geriatrics | 0.69 | 0.61 | 0.78 |
| Hospitalist | 0.90 | 0.84 | 0.96 |
| Nephrology | 1.02 | 0.96 | 1.08 |
| Neurology | 0.93 | 0.86 | 1.00 |
| Pulmonology | 1.10 | 1.05 | 1.15 |
| Setting | |||
| Rural | 1.00 | ||
| Urban | 1.02 | 1.00 | 1.05 |
| Teaching status | |||
| Nonteaching | 1.00 | ||
| Teaching | 1.01 | 0.98 | 1.03 |
| Number of beds | |||
| 22200 | 1.00 | ||
| 200400 | 1.08 | 1.05 | 1.11 |
| 400+ | 1.12 | 1.09 | 1.16 |
| Region | |||
| Midwest | 1.00 | ||
| Northeast | 0.85 | 0.83 | 0.88 |
| South | 1.63 | 1.59 | 1.67 |
| West | 1.43 | 1.38 | 1.47 |
| Geriatrician presence | |||
| No | 1.00 | ||
| Yes | 0.93 | 0.90 | 0.95 |
Physician specialty was also important. Adjusting for diagnosis attenuated some of this association, but compared with internists, cardiologists (OR 1.32, 95% CI 1.281.36) and pulmonologists (OR 1.10, 95% CI 1.051.15) were still more likely, hospitalists (OR 0.90, 95% CI 0.840.96) were less likely, and geriatricians (0.69, 95% CI 0.610.78) were least likely to prescribe any HS‐PIM.
Patient factors were also associated with HS‐PIM use. Compared with patients age 6574 years, patients older than 85 years were much less likely to receive an HS‐PIM (OR 0.59, CI 0.580.61), as to a lesser extent were nonwhites compared with whites and unmarried people compared with those who were married. Compared with patients with pneumonia, those with COPD, stroke, or chest pain were less likely and those with myocardial infarction and congestive heart failure were more likely to receive HS‐PIMs. Patients with a secondary diagnosis of depression were also at high risk (OR 1.38, CI 1.351.41).
DISCUSSION
Although Americans age 65 years and older make up less than 15% of the U.S. population, they consume about one third of all prescription drugs20 and account for one third of all hospital admissions.21 Using the Beers list, numerous studies have documented high rates of potentially inappropriate prescribing for community‐dwelling elderly and nursing home patients and, in some studies, an attendant risk of falling,2224 hip fracture,25, 26 hospitalization,13 or death.14 Applying these same criteria to a large sample of medical inpatients, we found that almost half received a potentially inappropriate drug, most of high severity. Moreover, the PIM prescribing rate varied substantially by region, hospital, and attending physician specialty. Although the use of PIMs was associated with patient age, comorbidities, and primary diagnosis, these patient factors explained only a small portion of the variation in prescribing practices across groups of physicians and hospitals.
Using consensus criteria, Beers originally found that 40% of the residents in 12 nursing homes received at least 1 PIM,8 and studies of community‐dwelling elderly demonstrated rates of 21% to 37%, with little change over time.6, 27, 28 Several small studies have examined inpatient prescribing.16, 17, 29, 30 The largest17 found that only 15% of elderly Italian inpatients received a PIM. Our finding, that 49% of inpatients had received at least 1 PIM, may partially reflect the high prevalence of use among elderly US patients in nursing homes and the community.
Regional variation has been demonstrated for ambulatory patients in the US6 and Europe.31 Zhan et al. found slightly higher rates of PIM use in the Midwest and the South (23%) than in the Northeast and the West (19%). Variation in Europe was greater, with 41% of patients in the Czech Republic versus 5.8% of patients in Denmark receiving at least 1 PIM. We found that region was the strongest predictor of in‐hospital HS‐PIM use, with patients in the South most likely and patients in the Northeast least likely to receive HS‐PIMs. This variation persisted even after adjusting for differences in other patient and hospital factors, suggesting that local custom played a large role in the decision to prescribe HS‐PIMs. Moreover, because outpatient rates are more uniform, these large differences seem limited to inpatient practice.
Patient factors have also been examined. Advanced age was associated with decreased PIM use in some studies17, 28, 31 but not in others.6, 27 We found increasing age to be strongly associated with decreased PIM use, suggesting that in the hospital, at least, doctors take care to avoid prescribing certain drugs to the frail elderly. Women appear to be consistently at higher risk than men,6, 27, 28, 31 and white patients are more at risk than those of other races.6 Our finding that certain diagnoses were associated with higher or lower rates has not been reported previously. The lower rates associated with stroke and COPD suggest that prescribers were aware that these patients were at increased risk of delirium and respiratory depression. The higher rates associated with myocardial infarction may have to do with the use of standardized order sets (eg, cath lab orders) that do not consider the age of the patient going for the procedure.
Admission to a geriatric service32 and intervention by a clinical pharmacist33 have been shown to decrease PIM prescribing at discharge. We noted that patients cared for by a geriatrician had the lowest rates of PIM prescribing during hospitalization as well and that hospitals with geriatricians had lower rates overall, possibly demonstrating that geriatricians had a ripple effect on their colleagues. Hospitalists also had lower rates than internists, supporting the notion that hospitalists provide higher‐quality inpatient care.
Our study had some important limitations. First, we only had access to inpatient administrative records. Thus, we could not identify which medications were continued from home and which were begun in the hospital, nor could we know the indications for which specific drugs were prescribed or who prescribed them. Based on published outpatient rates, however, we could assume that many of the drugs were started in the hospital and that others could have been discontinued but were not. Second, the Beers list was developed by the modified Delphi method; there was little empirical evidence of the danger of specific drugs, although some classes, such as benzodiazepines, opiates and digoxin, have been associated with inpatient falls.18, 3436 Furthermore, our administrative database did not allow us to balance the risks and benefits for particular patients; hence, the medications were only potentially inappropriate, and our study did not address the consequences of such prescribing. Although some of these drugs may be appropriate under certain circumstances, it is unlikely that these circumstances would vary by 60% across geographic regions or that internists would encounter these circumstances more often than do hospitalists. Thus, although we could not identify specific patients who received inappropriate medications, we did identify certain hospitals and even whole regions of the country in which the rate of inappropriate prescribing was high. Third, the Beers list, which was developed for outpatient use, may be less relevant in the inpatient setting. However, given that inpatients have more organ dysfunction and are at higher risk of delirium and falls, it may actually be more applicable to hospitalized patients. We similarly did not distinguish between single and multiple doses because the Beers list does not make such a distinction, and there is no empirical evidence that a single dose is safe. Indeed, patients are often at highest risk of falls immediately after initiation of therapy.3739 We did, however, exclude drugs such as laxatives, which may be appropriate for brief inpatient use but not for chronic use.
Our study also had a number of strengths. The large sample size, representing approximately 5% of annual inpatient admissions in the US over 2 years, offered an instructive look at the recent prescribing patterns of thousands of US physicians. We were able to identify many patient, physician, and hospital factors associated with PIM prescribing that have not previously been reported. Some of these factors, such as advanced age and comorbid diagnoses, suggest that physicians do tailor their treatment to individual patients. Nevertheless, patient factors accounted for only a small portion of the variation in prescribing. The largest variation, associated with regional, hospital, and physician factors, highlights the opportunity for improvement.
At the same time, our findings are encouraging for 2 reasons. First, most inappropriate prescribing involved only a handful of medications, so small changes in prescribing patterns could have a tremendous impact. Second, observing the practice of individual physicians and hospitals reveals what is possible. We found that in most specialties there were physicians who rarely or never used PIMs. We also found 7 hospitals, each with at least 300 cases, where no PIMs were ever prescribed.
Where should hospitals focus their efforts to prevent inappropriate prescribing? Our data highlight the complexity of the problem, which seems daunting. PIM prescribing is spread across all specialties, including geriatrics, and although cardiologists had the highest rate of prescribing, internists, who were more numerous, accounted for a much higher overall number of potentially inappropriate prescriptions. It would be instructive to study the 7 hospitals where PIMs were never prescribed or to interview those physicians who never prescribed PIMs, but the anonymous nature of our data would not allow for this. However, our data do suggest some directions. First, hospitals should become aware of their own rates of PIM use because measurement is the first step in quality improvement. Next, hospitals should focus efforts on reducing the use of the most common drugs. Eliminating just 3 drugs promethazine, diphenhydramine, and propoxyphenewould reduce the use of PIMs in 24% of elderly patients. Enlisting hospital pharmacists and electronic health records and reviewing standard order sets for elderly patients are potentially effective strategies. Finally, increasing the presence of geriatricians and hospitalists would be expected to have a modest impact.
In a representative sample of elderly inpatients, we found that almost half received a potentially inappropriate medication and that the rate of inappropriate prescribing varied widely among doctors and hospitals. Additional research is needed to distinguish which of the Beers drugs are most harmful and which patients are at highest risk. Research should also focus on understanding differences in prescribing patterns, perhaps by studying the outliers at both ends of the quality spectrum, and on techniques to minimize non‐patient‐centered variation.
- ,,,,,.Explicit criteria for determining inappropriate medication use in nursing home residents. UCLA Division of Geriatric Medicine.Arch Intern Med.1991;151:1825–1832.
- .Explicit criteria for determining potentially inappropriate medication use by the elderly. An update.Arch Intern Med.1997;157:1531–1536.
- ,,,,,.Updating the Beers criteria for potentially inappropriate medication use in older adults: results of a US consensus panel of experts.Arch Intern Med.2003;163:2716–2724.
- National Committee on Quality Assurance. Drugs to be Avoided in the Elderly. Available at: http://www.ncqa.org/Programs/HEDIS/2006/Volume2/NDC/DAE_06.xls. Accessed November 20,2006.
- ,,, et al.Inappropriate prescribing for elderly Americans in a large outpatient population.Arch Intern Med.2004;164:1621–1625.
- ,,, et al.Potentially inappropriate medication use in the community‐dwelling elderly: findings from the 1996 Medical Expenditure Panel Survey.JAMA.2001;286:2823–2829.
- ,.Prescribing potentially inappropriate psychotropic medications to the ambulatory elderly.Arch Intern Med.2000;160:2825–2831.
- ,,, et al.Inappropriate medication prescribing in skilled‐nursing facilities.Ann Intern Med.1992;117:684–689.
- ,,, et al.Adverse outcomes associated with inappropriate drug use in nursing homes.Ann Pharmacother.2005;39:405–411.
- ,,.Inappropriate medication administration to the acutely ill elderly: a nationwide emergency department study, 1992–2000.J Am Geriatr Soc.2004;52:1847–1855.
- ,,, et al.Appropriateness of medication selection for older persons in an urban academic emergency department.Acad Emerg Med.1999;6:1232–1242.
- ,,,,,.Use of the Beers criteria to predict adverse drug reactions among first‐visit elderly outpatients.Pharmacotherapy.2005;25:831–838.
- ,,.The association of inappropriate drug use with hospitalisation and mortality: a population‐based study of the very old.Drugs Aging.2005;22(1):69–82.
- ,,,,.Hospitalization and death associated with potentially inappropriate medication prescriptions among elderly nursing home residents.Arch Intern Med.2005;165(1):68–74.
- ,,.Potentially inappropriate prescribing for geriatric inpatients: an acute care of the elderly unit compared to a general medicine service.Consult Pharm.2003;18(1):37–42, 47–39.
- ,,, et al.Inappropriate medication use among frail elderly inpatients.Ann Pharmacother.2004;38(1):9–14.
- ,,,,,.Inappropriate medication use among hospitalized older adults in Italy: results from the Italian Group of Pharmacoepidemiology in the Elderly.Eur J Clin Pharmacol.2003;59(2):157–162.
- ,,,,,.Guided prescription of psychotropic medications for geriatric inpatients.Arch Intern Med.2005;165:802–807.
- ,,,.Comorbidity measures for use with administrative data.Med Care.1998;36(1):8–27.
- ,.Inadequate prescription‐drug coverage for Medicare enrollees—a call to action.N Engl J Med.1999;340:722–728.
- National and regional estimates on hospital use for all patients from the HCUP Nationwide Inpatient Sample (NIS). Agency for Healthcare Research and Quality (AHRQ). Available at: http://hcupnet.ahrq.gov/HCUPnet.jsp. Accessed October 12,2006.
- ,,,,,.Drugs and falls in community‐dwelling older people: a national veterans study.Clin Ther.2006;28:619–630.
- ,,,,,.Psychotropic medications and risk for falls among community‐dwelling frail older people: an observational study.J Gerontol A Biol Sci Med Sci.2005;60:622–626.
- ,,.Drugs and falls in older people: a systematic review and meta‐analysis: I. Psychotropic drugs.J Am Geriatr Soc.1999;47(1):30–39.
- ,,.Propoxyphene use and risk for hip fractures in older adults.Am J Geriatr Pharmacother.2006;4:219–226.
- ,,, et al.Central nervous system active medications and risk for fractures in older women.Arch Intern Med.2003;163:949–957.
- ,,, et al.Potentially inappropriate medication use by elderly persons in U.S. Health Maintenance Organizations, 2000–2001.J Am Geriatr Soc.2005;53:227–232.
- .Inappropriate medication prescribing for elderly ambulatory care patients.Arch Intern Med.2004;164:305–312.
- ,,.Adverse drug reactions in an elderly hospitalised population: inappropriate prescription is a leading cause.Drugs Aging.2005;22:767–777.
- ,,,,.Use of inappropriate medications and their prognostic significance among in‐hospital and nursing home patients with and without dementia in Finland.Drugs Aging.2006;23:333–343.
- ,,, et al.Potentially inappropriate medication use among elderly home care patients in Europe.JAMA.2005;293:1348–1358.
- ,,,,.Impact of hospitalisation in an acute medical geriatric unit on potentially inappropriate medication use.Drugs Aging.2006;23(1):49–59.
- ,.Pharmacists and their effectiveness in ensuring the appropriateness of the chronic medication regimens of geriatric inpatients.Consult Pharm.2004;19:432–436.
- ,,,,,.Benzodiazepines with different half‐life and falling in a hospitalized population: the GIFA study. Gruppo Italiano di Farmacovigilanza nell'Anziano.J Clin Epidemiol.2000;53:1222–1229.
- ,.Relationship between the administration of selected medications and falls in hospitalized elderly patients.Ann Pharmacother.1995;29:354–358.
- .The use of sedative/hypnotic medication and its correlation with falling down in the hospital.Sleep.1996;19:698–701.
- ,,, et al.Benzodiazepine use and hip fractures in the elderly: who is at greatest risk?Arch Intern Med.2004;164:1567–1572.
- ,,,,.Hazardous benzodiazepine regimens in the elderly: effects of half‐life, dosage, and duration on risk of hip fracture.Am J Psychiatry.2001;158:892–898.
- ,,,,.A 5‐year prospective assessment of the risk associated with individual benzodiazepines and doses in new elderly users.J Am Geriatr Soc.2005;53:233–241.
Copyright © 2008 Society of Hospital Medicine
