User login
Coronary artery calcium scoring: A valuable tool in primary care
In 1984, Jim Fixx, who wrote The Complete Book of Running,1 went out for his daily run and died of a massive heart attack. He was 48. Unbeknownst to him, he had 3-vessel coronary artery disease.
His case illustrates the difficulty of diagnosing coronary artery disease in patients who have no symptoms of it. For many, the initial presentation is myocardial infarction or death. Until recently, there was no reliable way to diagnose subclinical coronary artery disease other than angiography, and there is still no way to rule it out. As a result, physicians have concentrated less on diagnosing subclinical disease and more on assessing the risk of myocardial infarction.
ASSESSING RISK
The risk factors for coronary artery disease (age, male sex, smoking, hypertension, and cholesterol) have been well known for half a century. By combining risk factors with the appropriate weighting, it is possible to predict an individual’s risk of a myocardial infarction.
In 2013, the American College of Cardiology/American Heart Association (ACC/AHA) guidelines applied this risk-based approach to prescribing statins for primary prevention.2 Instead of focusing on low-density lipoprotein cholesterol concentration, which by itself is a poor predictor of myocardial infarction, they recommended using the Pooled Cohort Equation3 to determine the risk of a cardiovascular event within 10 years. For patients at high risk (> 7.5%), the benefits of a statin generally outweigh the harms. For those at low risk (< 5%), the opposite is true. For patients in between, there is room for shared decision-making.
Debate has focused on the predictive accuracy of the equation, the threshold for treatment, and the fact that almost all men over 60 qualify for treatment.4 These objections stem from the focus on risk rather than on diagnosis of the underlying disease.
Because one-third of “high-risk” patients never develop cardiovascular disease,5 the risk-based approach necessitates overtreatment. Those without disease cannot benefit from treatment but nonetheless suffer its side effects, cost, and inconvenience. Raising treatment thresholds (eg, treating only patients whose 10-year risk exceeds 10%) improves the ratio of patients with disease to those without but also misses diseased patients who have few risk factors. “Low risk” is not “no risk.”
TESTING FOR DISEASE IN THOSE AT INTERMEDIATE RISK
Diagnostic testing is preferred if such testing is safe and inexpensive.
In this issue of Cleveland Clinic Journal of Medicine, Parikh and colleagues6 review coronary artery calcium scoring, a diagnostic test for coronary artery disease. They conclude that calcium scoring is strongly predictive but should be reserved for patients at intermediate risk to help them decide about treatment. This is clearly the right approach, but the authors leave the term “intermediate” undefined, and their clinical examples offer little guidance as to where the borders lie.
The ACC/AHA guidelines specify a narrow intermediate range (5.0%–7.4%). For these patients, calcium scoring could reclassify most as being at high or low risk, helping to clarify whether statins are indicated.
However, only 12% of patients fall into this category.7 What about patients at higher risk? Could they be reclassified as being at low risk if their calcium score was 0?8 Conversely, could some low-risk patients discover that they are at high risk and perhaps take action?
The ACC/AHA guidelines recommend against calcium scoring in these circumstances. One concern was that calcium scoring had not been tested with the Pooled Cohort Equation. Another concern related to cost and radiation exposure, but as Parikh et al point out, the cost has now fallen to less than $100, and radiation exposure is similar to that with mammography.
SHOULD WE TEST PATIENTS AT HIGH OR LOW RISK?
Who, then, should we test? For patients at high or low risk according to the Pooled Cohort Equation, 2 questions determine whether calcium scoring is warranted: how much would an extremely high or low score (ie, 0 or > 400) change the risk of an event, and how likely is an extreme score?
The first question relates to the usefulness of the test, the second to its cost-effectiveness. If even an extreme score cannot move a patient’s risk into or out of the treatment range, then testing is unwarranted. At the same time, if few patients have an extreme score, then cost per test that changes practice will be high.
Because calcium scoring is a direct test for disease, it is extremely predictive. When added to risk-factor models, it substantially improves discrimination9 and exhibits excellent calibration.10 This is true whether the outcome is a major cardiovascular event or death from any cause.
But the calcium score is not strong enough to override all other risk factors. A patient with a predicted 10-year risk of 18% according to the Pooled Cohort Equation and a calcium score of 0 could be reclassified as being at low risk, but a patient with a 10-year predicted risk of 35% could not. The same is true for patients at low risk. A patient with a 4% risk and a calcium score higher than 400 would be reclassified as being at high risk, but not a patient with a 1% risk.
Extreme calcium scores are common, especially in patients at high risk. In the Multi-Ethnic Study of Atherosclerosis (MESA) cohort, 45% of patients with a 10-year predicted risk of 7.5% to 20% had a calcium score of 0, reclassifying them into the low-risk category.11 Even if the predicted risk was greater than 20%, 1 in 4 patients had a score of 0. In contrast, if the 10-year predicted risk was below 5%, one-fifth of patients had a calcium score greater than 0, but only 4% had a score greater than 100.
Nevertheless, patients in the low-risk category whose baseline risk is close to 5% may wish to undergo calcium scoring, because a positive test opens the door to a potentially lifesaving treatment. In general, the closer patients are to the treatment threshold, the more likely they are to be reclassified by calcium scoring.
The Society for Cardiovascular Computed Tomography currently recommends coronary artery calcium scoring for patients whose 10-year risk is between 5% and 20%.12 These numbers are easy to remember and a reasonable approximation of the number of patients likely to benefit from testing.
COMBINING CALCIUM SCORING WITH TRADITIONAL RISK FACTORS
Primary care physicians interested in more exact personalized medicine can use a risk calculator derived from the MESA cohort.13 Based on 10-year outcomes for 6,814 participants, Blaha et al8 derived and validated this risk-prediction tool incorporating all the elements of the Pooled Cohort Equation in addition to family history, race, and calcium score.
The tool offered good discrimination and calibration when validated against 2 external cohorts (the Heinz Nixdorf Recall Study and the Dallas Heart Study).10 The C statistics were 0.78 and 0.82, with 10-year risk predicted by the tool within half a percent of the observed event rate in each cohort.
The online calculator displays the 10-year risk based on risk factors alone or including a calcium score, allowing the clinician to gauge the value of testing. For example, a 70-year-old nonsmoking white man with a total cholesterol level of 240 mg/dL, high-density lipoprotein cholesterol 40 mg/dL, and systolic blood pressure 130 mm Hg on amlodipine has a 15.2% 10-year risk (well above the 7.5% threshold for statin therapy). However, if his calcium score is 0, his risk falls to 4.3% (well below the threshold). Sharing such information with patients could help them to decide whether to undergo coronary artery calcium scoring.
Ultimately, the decision to take a statin for primary prevention of coronary artery disease is a personal one. It involves weighing risks, benefits, and preferences. Physicians can facilitate the process by providing information and guidance. Patients are best served by having the most accurate information. In many cases, that information should include calcium scoring.
- Fixx JF. The Complete Book of Running. New York: Random House, 1977.
- Goff DC, Jr, Lloyd-Jones DM, Bennett G, et al. 2013 ACC/AHA guideline on the assessment of cardiovascular risk: a report of the American College of Cardiology/American Heart Association Task Force on Practice Guidelines. Circulation 2014; 129(25 suppl 2):S49–S73. doi:10.1161/01.cir.0000437741.48606.98
- American Heart Association, American College of Cardiology. 2013 Prevention guidelines tools. CV risk calculator. ASCVD risk calculator. https://professional.heart.org/professional/GuidelinesStatements/PreventionGuidelines/UCM_457698_ASCVD-Risk-Calculator.jsp. Accessed August 17, 2018.
- Pencina MJ, Navar-Boggan AM, D’Agostino RB, Sr, et al. Application of new cholesterol guidelines to a population-based sample. N Engl J Med 2014; 370(15):1422–1431. doi:10.1056/NEJMoa1315665
- Wilkins JT, Ning H, Berry J, Zhao L, Dyer AR, Lloyd-Jones DM. Lifetime risk and years lived free of total cardiovascular disease. JAMA 2012; 308(17):1795–1801. doi:10.1001/jama.2012.14312
- Parikh P, Shah N, Ahmed H, Schoenhagen P, Fares M. Coronary artery calcium scoring: its practicality and clinical utility in primary care. Cleve Clin J Med 2018; 85(9):707–716. doi:10.3949/ccjm.85a.17097
- Blaha MJ, Dardari ZA, Blumenthal RS, Martin SS, Nasir K, Al-Mallah MH. The new “intermediate risk” group: a comparative analysis of the new 2013 ACC/AHA risk assessment guidelines versus prior guidelines in men. Atherosclerosis 2014; 237(1):1–4. doi:10.1016/j.atherosclerosis.2014.08.024
- Blaha MJ, Cainzos-Achirica M, Greenland P, et al. Role of coronary artery calcium score of zero and other negative risk markers for cardiovascular disease: the Multi-Ethnic Study of Atherosclerosis (MESA). Circulation 2016; 133(9):849–858. doi:10.1161/CIRCULATIONAHA.115.018524
- Peters SAE, den Ruijter HM, Bots ML, Moons KGM. Improvements in risk stratification for the occurrence of cardiovascular disease by imaging subclinical atherosclerosis: a systematic review. Heart 2012; 98(3):177–184. doi:10.1136/heartjnl-2011-300747
- McClelland RL, Jorgensen NW, Budoff M, et al. Ten-year coronary heart disease risk prediction using coronary artery calcium and traditional risk factors: derivation in the Multi-Ethnic Study of Atherosclerosis with validation in the Heinz Nixdorf Recall Study and the Dallas Heart Study. J Am Coll Cardiol 2015; 66(15):1643–1653. doi:10.1016/j.jacc.2015.08.035
- Nasir K, Bittencourt MS, Blaha MJ, et al. Implications of coronary artery calcium testing among statin candidates according to American College of Cardiology/American Heart Association cholesterol management guidelines: MESA (Multi-Ethnic Study of Atherosclerosis). J Am Coll Cardiol 2015; 66(15):1657–1668. doi:10.1016/j.jacc.2015.07.066
- Hecht H, Blaha MJ, Berman DS, et al. Clinical indications for coronary artery calcium scoring in asymptomatic patients: expert consensus statement from the Society of Cardiovascular Computed Tomography. J Cardiovasc Comput Tomogr 2017; 11(2):157–168. doi:10.1016/j.jcct.2017.02.010
- MESA. The Multi-Ethnic Study of Atherosclerosis. MESA 10-year CHD risk with coronary artery calcification. www.mesa-nhlbi.org/MESACHDRisk/MesaRiskScore/RiskScore.aspx. Accessed August 17, 2018.
In 1984, Jim Fixx, who wrote The Complete Book of Running,1 went out for his daily run and died of a massive heart attack. He was 48. Unbeknownst to him, he had 3-vessel coronary artery disease.
His case illustrates the difficulty of diagnosing coronary artery disease in patients who have no symptoms of it. For many, the initial presentation is myocardial infarction or death. Until recently, there was no reliable way to diagnose subclinical coronary artery disease other than angiography, and there is still no way to rule it out. As a result, physicians have concentrated less on diagnosing subclinical disease and more on assessing the risk of myocardial infarction.
ASSESSING RISK
The risk factors for coronary artery disease (age, male sex, smoking, hypertension, and cholesterol) have been well known for half a century. By combining risk factors with the appropriate weighting, it is possible to predict an individual’s risk of a myocardial infarction.
In 2013, the American College of Cardiology/American Heart Association (ACC/AHA) guidelines applied this risk-based approach to prescribing statins for primary prevention.2 Instead of focusing on low-density lipoprotein cholesterol concentration, which by itself is a poor predictor of myocardial infarction, they recommended using the Pooled Cohort Equation3 to determine the risk of a cardiovascular event within 10 years. For patients at high risk (> 7.5%), the benefits of a statin generally outweigh the harms. For those at low risk (< 5%), the opposite is true. For patients in between, there is room for shared decision-making.
Debate has focused on the predictive accuracy of the equation, the threshold for treatment, and the fact that almost all men over 60 qualify for treatment.4 These objections stem from the focus on risk rather than on diagnosis of the underlying disease.
Because one-third of “high-risk” patients never develop cardiovascular disease,5 the risk-based approach necessitates overtreatment. Those without disease cannot benefit from treatment but nonetheless suffer its side effects, cost, and inconvenience. Raising treatment thresholds (eg, treating only patients whose 10-year risk exceeds 10%) improves the ratio of patients with disease to those without but also misses diseased patients who have few risk factors. “Low risk” is not “no risk.”
TESTING FOR DISEASE IN THOSE AT INTERMEDIATE RISK
Diagnostic testing is preferred if such testing is safe and inexpensive.
In this issue of Cleveland Clinic Journal of Medicine, Parikh and colleagues6 review coronary artery calcium scoring, a diagnostic test for coronary artery disease. They conclude that calcium scoring is strongly predictive but should be reserved for patients at intermediate risk to help them decide about treatment. This is clearly the right approach, but the authors leave the term “intermediate” undefined, and their clinical examples offer little guidance as to where the borders lie.
The ACC/AHA guidelines specify a narrow intermediate range (5.0%–7.4%). For these patients, calcium scoring could reclassify most as being at high or low risk, helping to clarify whether statins are indicated.
However, only 12% of patients fall into this category.7 What about patients at higher risk? Could they be reclassified as being at low risk if their calcium score was 0?8 Conversely, could some low-risk patients discover that they are at high risk and perhaps take action?
The ACC/AHA guidelines recommend against calcium scoring in these circumstances. One concern was that calcium scoring had not been tested with the Pooled Cohort Equation. Another concern related to cost and radiation exposure, but as Parikh et al point out, the cost has now fallen to less than $100, and radiation exposure is similar to that with mammography.
SHOULD WE TEST PATIENTS AT HIGH OR LOW RISK?
Who, then, should we test? For patients at high or low risk according to the Pooled Cohort Equation, 2 questions determine whether calcium scoring is warranted: how much would an extremely high or low score (ie, 0 or > 400) change the risk of an event, and how likely is an extreme score?
The first question relates to the usefulness of the test, the second to its cost-effectiveness. If even an extreme score cannot move a patient’s risk into or out of the treatment range, then testing is unwarranted. At the same time, if few patients have an extreme score, then cost per test that changes practice will be high.
Because calcium scoring is a direct test for disease, it is extremely predictive. When added to risk-factor models, it substantially improves discrimination9 and exhibits excellent calibration.10 This is true whether the outcome is a major cardiovascular event or death from any cause.
But the calcium score is not strong enough to override all other risk factors. A patient with a predicted 10-year risk of 18% according to the Pooled Cohort Equation and a calcium score of 0 could be reclassified as being at low risk, but a patient with a 10-year predicted risk of 35% could not. The same is true for patients at low risk. A patient with a 4% risk and a calcium score higher than 400 would be reclassified as being at high risk, but not a patient with a 1% risk.
Extreme calcium scores are common, especially in patients at high risk. In the Multi-Ethnic Study of Atherosclerosis (MESA) cohort, 45% of patients with a 10-year predicted risk of 7.5% to 20% had a calcium score of 0, reclassifying them into the low-risk category.11 Even if the predicted risk was greater than 20%, 1 in 4 patients had a score of 0. In contrast, if the 10-year predicted risk was below 5%, one-fifth of patients had a calcium score greater than 0, but only 4% had a score greater than 100.
Nevertheless, patients in the low-risk category whose baseline risk is close to 5% may wish to undergo calcium scoring, because a positive test opens the door to a potentially lifesaving treatment. In general, the closer patients are to the treatment threshold, the more likely they are to be reclassified by calcium scoring.
The Society for Cardiovascular Computed Tomography currently recommends coronary artery calcium scoring for patients whose 10-year risk is between 5% and 20%.12 These numbers are easy to remember and a reasonable approximation of the number of patients likely to benefit from testing.
COMBINING CALCIUM SCORING WITH TRADITIONAL RISK FACTORS
Primary care physicians interested in more exact personalized medicine can use a risk calculator derived from the MESA cohort.13 Based on 10-year outcomes for 6,814 participants, Blaha et al8 derived and validated this risk-prediction tool incorporating all the elements of the Pooled Cohort Equation in addition to family history, race, and calcium score.
The tool offered good discrimination and calibration when validated against 2 external cohorts (the Heinz Nixdorf Recall Study and the Dallas Heart Study).10 The C statistics were 0.78 and 0.82, with 10-year risk predicted by the tool within half a percent of the observed event rate in each cohort.
The online calculator displays the 10-year risk based on risk factors alone or including a calcium score, allowing the clinician to gauge the value of testing. For example, a 70-year-old nonsmoking white man with a total cholesterol level of 240 mg/dL, high-density lipoprotein cholesterol 40 mg/dL, and systolic blood pressure 130 mm Hg on amlodipine has a 15.2% 10-year risk (well above the 7.5% threshold for statin therapy). However, if his calcium score is 0, his risk falls to 4.3% (well below the threshold). Sharing such information with patients could help them to decide whether to undergo coronary artery calcium scoring.
Ultimately, the decision to take a statin for primary prevention of coronary artery disease is a personal one. It involves weighing risks, benefits, and preferences. Physicians can facilitate the process by providing information and guidance. Patients are best served by having the most accurate information. In many cases, that information should include calcium scoring.
- Fixx JF. The Complete Book of Running. New York: Random House, 1977.
- Goff DC, Jr, Lloyd-Jones DM, Bennett G, et al. 2013 ACC/AHA guideline on the assessment of cardiovascular risk: a report of the American College of Cardiology/American Heart Association Task Force on Practice Guidelines. Circulation 2014; 129(25 suppl 2):S49–S73. doi:10.1161/01.cir.0000437741.48606.98
- American Heart Association, American College of Cardiology. 2013 Prevention guidelines tools. CV risk calculator. ASCVD risk calculator. https://professional.heart.org/professional/GuidelinesStatements/PreventionGuidelines/UCM_457698_ASCVD-Risk-Calculator.jsp. Accessed August 17, 2018.
- Pencina MJ, Navar-Boggan AM, D’Agostino RB, Sr, et al. Application of new cholesterol guidelines to a population-based sample. N Engl J Med 2014; 370(15):1422–1431. doi:10.1056/NEJMoa1315665
- Wilkins JT, Ning H, Berry J, Zhao L, Dyer AR, Lloyd-Jones DM. Lifetime risk and years lived free of total cardiovascular disease. JAMA 2012; 308(17):1795–1801. doi:10.1001/jama.2012.14312
- Parikh P, Shah N, Ahmed H, Schoenhagen P, Fares M. Coronary artery calcium scoring: its practicality and clinical utility in primary care. Cleve Clin J Med 2018; 85(9):707–716. doi:10.3949/ccjm.85a.17097
- Blaha MJ, Dardari ZA, Blumenthal RS, Martin SS, Nasir K, Al-Mallah MH. The new “intermediate risk” group: a comparative analysis of the new 2013 ACC/AHA risk assessment guidelines versus prior guidelines in men. Atherosclerosis 2014; 237(1):1–4. doi:10.1016/j.atherosclerosis.2014.08.024
- Blaha MJ, Cainzos-Achirica M, Greenland P, et al. Role of coronary artery calcium score of zero and other negative risk markers for cardiovascular disease: the Multi-Ethnic Study of Atherosclerosis (MESA). Circulation 2016; 133(9):849–858. doi:10.1161/CIRCULATIONAHA.115.018524
- Peters SAE, den Ruijter HM, Bots ML, Moons KGM. Improvements in risk stratification for the occurrence of cardiovascular disease by imaging subclinical atherosclerosis: a systematic review. Heart 2012; 98(3):177–184. doi:10.1136/heartjnl-2011-300747
- McClelland RL, Jorgensen NW, Budoff M, et al. Ten-year coronary heart disease risk prediction using coronary artery calcium and traditional risk factors: derivation in the Multi-Ethnic Study of Atherosclerosis with validation in the Heinz Nixdorf Recall Study and the Dallas Heart Study. J Am Coll Cardiol 2015; 66(15):1643–1653. doi:10.1016/j.jacc.2015.08.035
- Nasir K, Bittencourt MS, Blaha MJ, et al. Implications of coronary artery calcium testing among statin candidates according to American College of Cardiology/American Heart Association cholesterol management guidelines: MESA (Multi-Ethnic Study of Atherosclerosis). J Am Coll Cardiol 2015; 66(15):1657–1668. doi:10.1016/j.jacc.2015.07.066
- Hecht H, Blaha MJ, Berman DS, et al. Clinical indications for coronary artery calcium scoring in asymptomatic patients: expert consensus statement from the Society of Cardiovascular Computed Tomography. J Cardiovasc Comput Tomogr 2017; 11(2):157–168. doi:10.1016/j.jcct.2017.02.010
- MESA. The Multi-Ethnic Study of Atherosclerosis. MESA 10-year CHD risk with coronary artery calcification. www.mesa-nhlbi.org/MESACHDRisk/MesaRiskScore/RiskScore.aspx. Accessed August 17, 2018.

PCI for stable angina: A missed opportunity for shared decision-making
Multiple randomized controlled trials have compared percutaneous coronary intervention (PCI) vs optimal medical therapy for patients with chronic stable angina. All have consistently shown that PCI does not reduce the risk of death or even myocardial infarction (MI) but that it may relieve angina temporarily. Nevertheless, PCI is still commonly performed for patients with stable coronary disease, often in the absence of angina, and patients mistakenly believe the procedure is life-saving. Cardiologists may not be aware of patients’ misperceptions, or worse, may encourage them. In either case, if patients do not understand the benefits of the procedure, they cannot give informed consent.
This article reviews the pathophysiology of coronary artery disease, evidence from clinical trials of the value of PCI for chronic stable angina, patient and physician perceptions of PCI, and ways to promote patient-centered, shared decision-making.
CLINICAL CASE: EXERTIONAL ANGINA
While climbing 4 flights of stairs, a 55-year-old man noticed tightness in his chest, which lasted for 5 minutes and resolved spontaneously. Several weeks later, when visiting his primary care physician, he mentioned the episode. He had had no symptoms in the interim, but the physician ordered an exercise stress test.
Six minutes into a standard Bruce protocol, the patient experienced the same chest tightness, accompanied by 1-mm ST-segment depressions in leads II, III, and aVF. He was then referred to a cardiologist, who recommended catheterization.
Catheterization demonstrated a 95% stenosis of the right coronary artery with nonsignificant stenoses of the left anterior descending and circumflex arteries. A drug-eluting stent was placed in the right coronary artery, with no residual stenosis.
Did this intervention likely prevent an MI and perhaps save the man’s life?
HOW MYOCARDIAL INFARCTION HAPPENS
Understanding the pathogenesis of MI is critical to having realistic expectations of the benefits of stent placement.
Doctors often describe coronary atherosclerosis as a plumbing problem, where deposits of cholesterol and fat build up in arterial walls, clogging the pipes and eventually causing a heart attack. This analogy, which has been around since the 1950s, is easy to for patients to grasp and has been popularized in the press and internalized by the public—as one patient with a 95% stenosis put it, “I was 95% dead.” In that model, angioplasty and stenting can resolve the blockage and “fix” the problem, much as a plumber can clear your pipes with a Roto-Rooter.
Despite the visual appeal of this model,1 it doesn’t accurately convey what we know about the pathophysiology of coronary artery disease. Instead of a gradual buildup of fatty deposits, low-density lipoprotein cholesterol particles infiltrate arterial walls and trigger an inflammatory reaction as they are engulfed by macrophages, leading to a cascade of cytokines and recruitment of more inflammatory cells.2 This immune response can eventually cause the rupture of the plaque’s fibrous cap, triggering thrombosis and infarction, often at a site of insignificant stenosis.
In this new model, coronary artery disease is primarily a problem of inflammation distributed throughout the vasculature, rather than a mechanical problem localized to the site of a significant stenosis.
Significant stenosis does not equal unstable plaque
Not all plaques are equally likely to rupture. Stable plaques tend to be long-standing and calcified, with a thick fibrous cap. A stable plaque causing a 95% stenosis may cause symptoms with exertion, but it is unlikely to cause infarction.3 Conversely, rupture-prone plaques may cause little stenosis, but a large and dangerous plaque may be lurking beneath the thin fibrous cap.
Relying on angiography can be misleading. Treating all significant stenoses improves blood flow, but does not reduce the risk of infarction, because infarction most often occurs in areas where the lumen is not obstructed. A plaque causing only 30% stenosis can suddenly rupture, causing thrombosis and complete occlusion.
The current model explains why PCI is no better than optimal medical therapy (ie, risk factor modification, antiplatelet therapy with aspirin, and a statin). Diet, exercise, smoking cessation, and statins target inflammatory processes and lower low-density lipoprotein cholesterol levels, while aspirin prevents platelet aggregation, among other likely actions.
The model also explains why coronary artery bypass grafting reduces the risk of MI and death in patients with left main or 3-vessel disease. A patient with generalized coronary artery disease has multiple lesions, many of which do not cause significant stenoses. PCI corrects only a single stenosis, whereas coronary artery bypass grafting circumvents all the vulnerable plaques in a vessel.
THE LANDMARK COURAGE TRIAL
Published in 2007, the Clinical Outcomes Utilizing Revascularization and Aggressive Drug Evaluation (COURAGE) trial4 randomized more than 2,000 patients to receive either optimal medical therapy plus PCI or optimal medical therapy alone. The primary outcome was a composite of death from any cause and nonfatal MI. Patients were followed for at least 3 years, and some for as long as 7 years.
There was an initial small upward spike in the primary outcome in the PCI arm due to periprocedural events. By 5 years, the outcomes of the 2 arms converged and then stayed the same for up to 15 years.5 The authors concluded that PCI conferred no benefit over optimal medical therapy in the risk of death or MI.
Some doctors dismiss the study because of its stringent entry criteria—of 35,539 patients assessed, only 3,071 met the eligibility criteria. However, the entry criteria were meant to identify patients most likely to benefit from PCI. Many patients who undergo PCI today would not have qualified for the study because they lack objective evidence of ischemia.6 To enroll, patients needed a proximal stenosis of at least 70% and objective evidence of ischemia or a coronary stenosis of more than 80% and classic angina. Exclusion criteria disqualified few patients: Canadian Cardiovascular Society class IV angina (ie, angina evoked from minimal activity or at rest); a markedly positive stress test (substantial ST-segment depression or hypotension during stage I of the Bruce protocol); refractory heart failure or cardiogenic shock; an ejection fraction of less than 30%; revascularization within the past 6 months; and coronary anatomy unsuitable for PCI.
OTHER TRIALS SUPPORT COURAGE FINDINGS
Although COURAGE was hailed as a landmark trial, it largely supported the results of previous studies. A meta-analysis of PCI vs optimal medical therapy published in 2005 found no significant differences in death, cardiac death, MI, or nonfatal MI.7 MI was actually slightly more common in the PCI group due to the increased risk of MI during the periprocedural period.
Nor has the evidence from COURAGE discouraged additional studies of the same topic. Despite consistent findings that fit with our understanding of coronary disease as inflammation, we continue to conduct studies aimed at addressing significant stenosis, as if that was the problem. Thus, there have been studies of angioplasty alone, followed by studies of bare-metal stents and then drug-eluting stents.
In 2009, Trikalinos et al published a review of 61 randomized controlled trials comprising more than 25,000 patients with stable coronary disease and comparing medical therapy and angioplasty in its various forms over the previous 20 years.8 In all direct and indirect comparisons of PCI and medical therapy, there were no improvements in rates of death or MI.
Even so, the studies continue. The most recent “improvement” was the addition of fractional flow reserve, which served as the inclusion criterion for the Fractional Flow Reserve versus Angiography for Multivessel Evaluation 2 (FAME 2) trial.9 In that study, patients with at least 1 stenosis with a fractional flow reserve less than 0.80 were randomized to PCI plus medical therapy or to medical therapy alone. The primary end point was a composite of death from any cause, MI, and urgent revascularization. Unfortunately, the study was stopped early when the primary end point was met due to a reduction in the need for urgent revascularization. There was no reduction in the rate of MI (hazard ratio 1.05, 95% confidence interval 0.51–2.19).
The reduction in urgent revascularization has also been shown consistently in past studies, but this is the weakest outcome measure because it does not equate to a reduction in the rate of MI. There is no demonstrable harm to putting off stent placement, even in functionally significant arteries, and most patients do not require a stent, even in the future.
In summary, the primary benefit of getting a stent now is a reduced likelihood of needing one later.
PCI MAY IMPROVE ANGINA FASTER
Another important finding of the COURAGE trial was that PCI improved symptoms more than optimal medical therapy.10 This is not surprising, because angina is often a direct result of a significant stenosis. What was unexpected was that even after PCI, most patients were not symptom-free. At 1 month, significantly more PCI patients were angina-free (42%) than were medical patients (33%). This translates into an absolute risk reduction of 9% or a number needed to treat of 11 to prevent 1 case of angina.
Patients in both groups improved over time, and after 3 years, the difference between the 2 groups was no longer significant: 59% in the PCI group vs 56% in the medical therapy group were angina-free.
A more recent study has raised the possibility that the improvement in angina with PCI is primarily a placebo effect. Researchers in the United Kingdom randomized patients with stable angina and at least a 70% stenosis of one vessel to either PCI or sham PCI, in which they threaded the catheter but did not deploy the stent.11 All patients received aggressive antianginal therapy before the procedure. At 6 weeks, there was improvement in angina in both groups, but no statistically significant difference between them in either exercise time or angina. Approximately half the patients in each group improved by at least 1 grade on the Canadian Cardiovascular Society angina classification, and more than 20% improved 2 grades.
This finding is not without precedent. Ligation of the internal mammary arteries, a popular treatment for angina in the 1950s, often provided dramatic relief of symptoms, until it was proven to be no better than a sham operation.12,13 More recently, a placebo-controlled trial of percutaneous laser myocardial revascularization also failed to show improvement over a sham treatment, despite promising results from a phase 1 trial.14 Together, these studies emphasize the subjective nature of angina as an outcome and call into question the routine use of PCI to relieve it.
PCI ENTAILS RISK
PCI entails a small but not inconsequential risk. During the procedure, 2% of patients develop bleeding or blood vessel damage, and another 1% die or have an MI or a stroke. In the first year after stent placement, 3% of patients have a bleeding event from the antiplatelet therapy needed for the stent, and an additional 2% develop a clot in the stent that leads to MI.15
INFORMED CONSENT IS CRITICAL
As demonstrated above, for patients with stable angina, the only evidence-based benefit of PCI over optimal medical therapy is that symptoms may respond faster. At the same time, there are costs and risks associated with the procedure. Because symptoms are subjective, patients should play a key role in deciding whether PCI is appropriate for them.
The American Medical Association states that a physician providing any treatment or procedure should disclose and discuss with patients the risks and benefits. Unfortunately, a substantial body of evidence demonstrates that this is not occurring in practice.
Patients and cardiologists have conflicting beliefs about PCI
Studies over the past 20 years demonstrate that patients with chronic stable angina consistently overestimate the benefits of PCI, with 71% to 88% believing that it will reduce their chance of death.16–19 Patients also understand that PCI can relieve their symptoms, though no study seems to have assessed the perceived magnitude of this benefit.
In contrast, when cardiologists were asked about the benefits their patients could expect from PCI, only 20% said that it would reduce mortality and 25% said it would prevent MI.18 These are still surprisingly high percentages, since the study was conducted after the COURAGE trial.
Nevertheless, these differences in perception show that cardiologists fail to successfully communicate the benefits of the procedure to their patients. Without complete information, patients cannot make informed decisions.
Cardiologists’ reasons for performing PCI
If PCI cannot improve hard outcomes like MI or death in stable coronary disease, why do cardiologists continue to perform it so frequently?
Soon after the COURAGE trial, Lin et al conducted focus groups with cardiologists to find out.20 Some said that they doubted the clinical trial evidence, given the reduction in the cardiac mortality rate over the past 30 years. Others remarked that their overriding goal is to stamp out ischemia, and that once a lesion is found by catheterization, one must proceed with PCI. This has been termed the “oculostenotic reflex,” ie, the interventionist sees coronary artery disease and immediately places a stent.
Atreya et al found objective evidence of this practice.21 In a 2016 study of 207 patients with obstructive lesions amenable to PCI, the only factors associated with medical management were those that increased the risk of the procedure: age, chronic kidney disease, distal location of the lesion, and type C lesions (the most difficult ones to treat by PCI). More important, evidence of ischemia, presence of angina, and being on optimal medical therapy or maximal antianginal therapy were not associated with PCI.
When surveyed, cardiologists offered reasons similar to those identified by Lin et al, including a positive stress test (70%) and significant myocardium at risk (50%).18 Optimal medical therapy failure was cited less often (40%). Over 30% identified relief of chest pain for patients who were not prescribed optimal medical therapy. Another 30% said that patient anxiety contributed to their decision, but patients who reported anxiety were not more likely to get PCI than those who did not.
True informed consent rarely occurs
Surveys of patients and recordings of doctor visits suggest that doctors often discuss the risks of the procedure but rarely accurately describe the benefits or mention alternative treatments, including optimal medical therapy.
Fowler et al22 surveyed 472 Medicare patients who had undergone PCI in the past year about their consent discussion, particularly regarding alternative options. Only 6% of patients recalled discussing medication as a serious option with their doctor.
In 2 published studies,23,24 we analyzed recorded conversations between doctors and patients in which angiography and PCI were discussed.
In a qualitative assessment of how cardiologists presented the rationale for PCI to patients,23 we observed that cardiologists gave an accurate presentation of the benefits in only 5% of cases. In 13% of the conversations the benefits were explicitly overstated (eg, “If you don’t do it [angiogram/PCI], what could happen? Well, you could…have a heart attack involving that area which can lead to a sudden death”). In another 35% of cases, physicians offered an implicit overstatement of the benefit by saying they could “fix” the problem (eg, “So that’s where we start thinking, Well maybe we better try to fix that [blockage]”), without specifically stating that fixing the problem would offer any benefit. Patients were left to fill in the blanks. Conversations frequently focused on the rationale for performing PCI (eg, ischemia on a stress test) and a description of the procedure, rather than on the risks and benefits.
In a quantitative study of the same data set, we assessed how often physicians addressed the 7 elements of informed decision-making as defined by Braddock et al.24
- Explaining the patient’s role in decision-making (ie, that the patient has a choice to make) was present in half of the conversations. Sometimes a doctor would simply say, “The next step is to perform catheterization.”
- Discussion of clinical issues (eg, having a blockage, stress test results) was performed in almost every case, demonstrating physicians’ comfort with that element.
- Discussing treatment alternatives occurred in only 1 in 4 conversations. This was more frequent than previously reported, and appeared most often when patients expressed hesitancy about proceeding to PCI.
- Discussing pros and cons of the alternatives was done in 42%.
- Uncertainty about the procedure (eg, that it might not relieve the angina) was expressed in only 10% of conversations.
- Assessment of patient understanding was done in 65% of cases. This included even minimal efforts (eg, “Do you have any questions?”). More advanced methods such as teach-back were never used.
- Exploration of patient preferences (eg, asking patients which treatment they prefer, or attempting to understand how angina affects a patient’s life) the final element, occurred in 73% of conversations.
Only 3% of the conversations contained all 7 elements. Even using a more relaxed definition of 3 critical elements (ie, discussing clinical issues, treatment alternatives, and pros and cons), only 13% of conversations included them all.
Discussion affects decisions
Informed decision-making is not only important because of its ethical implications. Offering patients more information was associated with their choosing not to have PCI. The probability of a patient undergoing PCI was negatively associated with 3 specific elements of informed decision-making. Patients were less likely to choose PCI if the patient’s role in decision-making was discussed (61% vs 86% chose PCI, P < .03); if alternatives were discussed (31% vs 89% chose PCI, P < .01); and if uncertainties were discussed (17% vs 80% chose PCI, P < .01).
There was also a linear relationship between the total number of elements discussed and the probability of choosing PCI: it ranged from 100% of patients choosing PCI when just 1 element was present to 3% of patients choosing PCI when all 7 elements were present. The relationship is not entirely causal, since doctors were more likely to talk about alternatives and risks if patients hesitated and raised questions. Cautious patients received more information.
From these observational studies, we know that physicians do not generally communicate the benefits of PCI, and patients make incorrect assumptions about the benefits they can expect. We know that those who receive more information are less likely to choose PCI, but what would happen if patients were randomly assigned to receive complete information?
An online survey
We conducted an online survey of more than 1,000 participants over age 50 who had never undergone PCI, asking them to imagine visiting a cardiologist after having a positive stress test for stable chest pain.25 Three intervention groups read different scenarios couched as information provided by their cardiologist:
- The “standard care” group received no specific information about the effects of PCI on the risk of myocardial infarction
- The “specific information” group was specifically told that PCI does not reduce the risk of myocardial infarction
- The “explanatory information” group was told how medications work and why PCI does not reduce the risk of myocardial infarction.
All 3 groups received information about the risks of PCI, its role in reducing angina, and the risks and benefits of optimal medical therapy.
After reading their scenario, all participants completed an identical questionnaire, which asked if they would opt for PCI, medical therapy, or both. Overall, 55% chose PCI, ranging from 70% in the standard care group to 46% in the group given explanatory information. Rates in the specific-information and explanatory-information groups were not statistically different from each other, but both were significantly different from that in the standard-care group. Interestingly, the more information patients were given about PCI, the more likely they were to choose optimal medical therapy.
After reading the scenario, participants were also asked if PCI would “prevent a heart attack.” Of those who received standard care, 71% endorsed that belief, which is remarkably similar to studies of real patients who have received standard care. In contrast, only 39% of those given specific information and 31% given explanatory information held that belief. Moreover, the belief that PCI prevented MI was the strongest predictor of choosing PCI (odds ratio 5.82, 95% confidence interval 4.13–8.26).25
Interestingly, 52% of the standard care group falsely remembered that the doctor had told them that PCI would prevent an MI, even though the doctor said nothing about it one way or the other. It appears that participants were projecting their own beliefs onto the encounter. This highlights the importance of providing full information to patients who are considering this procedure.
TOWARD SHARED DECISION-MAKING
Shared decision-making is a process in which physicians enter into a partnership with a patient, offer information, elicit the patient’s preferences, and then come to a decision in concert with the patient.
Although many decisions can and should involve elements of shared decision-making, the decision to proceed with PCI for stable angina is particularly well-suited to shared decision-making. This is because the benefit of PCI depends on the value a patient attaches to being free of angina sooner. Since there is no difference in the risk of MI or death, the patient must decide if the risks of the procedure and the inconvenience of taking dual antiplatelet therapy are worth the benefit of improving symptoms faster. Presumably, patients who have more severe symptoms or experienced side effects from antianginal therapy would be more likely to choose PCI.
Despite having substantial experience educating patients, most physicians are unfamiliar with the process of shared decision-making. In particular, the process of eliciting preferences is often overlooked.
To address this issue, researchers at the Mayo Clinic developed a decision aid that compares PCI plus optimal medical therapy vs optimal medical therapy alone in an easily understandable information card.15 On one side, the 2 options are clearly stated, with the magnitude of symptom improvement over time graphically illustrated and the statement, “NO DIFFERENCE in heart attack or death,” prominently displayed. The back of the card discusses the risks of each option in easily understood tables.
The decision aid was compared with standard care in a randomized trial involving patients who were referred for catheterization and possible PCI.26 The decision aid improved patients’ overall knowledge about PCI. In particular, 60% of those who used the decision aid knew that PCI did not prevent death or MI vs 40% of usual-care patients—results similar to those of the online experiment.
Interestingly, the decision about whether to undergo PCI did not differ significantly between the 2 groups, although there was a trend toward more patients in the decision-aid group choosing medical therapy alone (53%) vs the standard-care patients (39%).
To understand why the decision aid did not make more of a difference, the investigators performed qualitative interviews of the cardiologists in the study.27 One theme was the timing of the intervention. Patients using the decision aid had already been referred for catheterization, and some felt the process should have occurred earlier. Engaging in shared decision-making with a general cardiologist before referral could help to improve the quality of patient decisions.
Cardiologists also noted the difficulty in changing their work flow to incorporate the decision aid. Although some embraced the idea of shared decision-making, others were concerned that many patients could not participate, and there was confusion about the difference between an educational tool, which could be used by a patient alone, and a decision aid, which is meant to generate discussion between the doctor and patient. Some expressed interest in using the tool in the future.
These findings serve to emphasize that providing information alone is not enough. If the physician does not “buy in” to the idea of shared decision-making, it will not occur.
PRACTICE IMPLICATIONS
Based on the pathophysiology of coronary artery disease and the results of multiple randomized controlled trials, it is evident that PCI does not prevent heart attacks in patients with chronic stable angina. However, most patients who undergo PCI are unaware of this and therefore do not truly give informed consent. In the absence of explicit information to the contrary, most patients with stable angina assume that PCI prevents MI and thus are biased toward choosing PCI.
Even minimal amounts of explicit information can partially overcome that bias and influence decision-making. In particular, explaining why PCI does not prevent MI was the most effective means of overcoming the bias.
To this end, shared decision aids may help physicians to engage in shared decision-making. Shared decision-making is most likely to occur if physicians are trained in the concept of shared decision-making, are committed to practicing it, and can fit it into their work flow. Ideally, this would occur in the office of a general cardiologist before referral for PCI.
For those practicing in accountable-care organizations, Medicare has recently introduced the shared decision-making model for 6 preference-sensitive conditions, including stable ischemic heart disease. Participants in this program will have the opportunity to receive payments for shared decision-making services and to share in any savings that result from reduced use of resources. Use of these tools holds the promise for providing more patient-centered care at lower cost.
- Jones DS. Visions of a cure. Visualization, clinical trials, and controversies in cardiac therapeutics, 1968–1998. Isis 2000; 91:504–541.
- Hansson G. Inflammation, atherosclerosis, and coronary artery disease. N Engl J Med 2005; 352:1685–1695.
- Stone GW, Maehara A, Lansky AJ, et al. A prospective natural-history study of coronary atherosclerosis. N Engl J Med 2011; 364:226–235.
- Boden WE, O’Rourke RA, Teo KK, et al. Optimal medical therapy with or without PCI for stable coronary disease. N Engl J Med 2007; 356:1503–1516.
- Sedlis SP, Hartigan PM, Teo KK, et al. Effect of PCI on long-term survival in patients with stable ischemic heart disease. N Engl J Med 2015; 373:1937–1946.
- Lin GA, Dudley RA, Lucas FL, Malenka DJ, Vittinghoff E, Redberg RF. Frequency of stress testing to document ischemia prior to elective percutaneous coronary intervention. JAMA 2008; 300:1765–1773.
- Katritsis DG, Ioannidis JP. Percutaneous coronary intervention versus conservative therapy in nonacute coronary artery disease: a meta-analysis. Circulation 2005; 111:2906–2912.
- Trikalinos TA, Alsheikh-Ali AA, Tatsioni A, Nallamothu BK, Kent DM. Percutaneous coronary interventions for non-acute coronary artery disease: a quantitative 20-year synopsis and a network meta-analysis. Lancet 2009; 373:911–918.
- De Bruyne B, Pijls NHJ, Kalesan B, et al. Fractional flow reserve–guided PCI versus medical therapy in stable coronary disease. N Engl J Med 2012; 367:991–1001.
- Weintraub WS, Spertus JA, Kolm P, et al. Effect of PCI on quality of life in patients with stable coronary disease. N Engl J Med 2008; 359:677–687.
- Al-Lamee R, Thompson D, Dehbi H-M, et al, on behalf of the ORBITA Investigators. Percutaneous coronary intervention in stable angina (ORBITA): a double-blind, randomised controlled trial. Lancet. Published online November 2, 2017. http://dx.doi.org/10.1016/S0140-6736(17)32714-9. Accessed November 10, 2017.
- Cobb LA, Thomas GI, Dillard DH, et al. An evaluation of internal mammary-artery ligation by a double-blind technic. N Engl J Med 1959; 260:1115–1118.
- Dimond EG, Fittle F, Crockett JE. Comparison of internal mammary artery ligation and sham operation for angina pectoris. Am J Cardiol 1960; 5:483-486.
- Leon MB, Kornowski R, Downey WE, et al. A blinded, randomized placebo-controlled trial of percutaneous laser myocardial revascularization to improve angina symptoms in patients with severe coronary disease. J Am Coll Cardiol 2005; 46:1812–1819.
- Coylewright M, Shepel K, Leblanc A, et al. Shared decision making in patients with stable coronary artery disease: PCI choice. PLoS One 2012; 7:e49827.
- Holmboe ES, Fiellin DA, Cusanelli E, Remetz M, Krumholz HM. Perceptions of benefit and risk of patients undergoing first-time elective percutaneous coronary revascularization. J Gen Intern Med 2000; 15:632–637.
- Kee F, McDonald P, Gaffney B. Risks and benefits of coronary angioplasty: the patients perspective: a preliminary study. Qual Health Care 1997; 6:131–139.
- Rothberg MB, Sivalingam SK, Ashraf J, et al. Patients’ and cardiologists’ perceptions of the benefits of percutaneous coronary intervention for stable coronary disease. Ann Intern Med 2010; 153:307–313.
- Whittle J, Conigliaro J, Good CB, Kelley ME, Skanderson M. Understanding of the benefits of coronary revascularization procedures among patients who are offered such procedures. Am Heart J 2007; 154:662–668.
- Lin GA, Dudley RA, Redberg RF. Cardiologists’ use of percutaneous coronary interventions for stable coronary artery disease. Arch Intern Med 2007; 167:1604–1609.
- Atreya AR, Sivalingam SK, Arora S, et al. Predictors of medical management in patients undergoing elective cardiac catheterization for chronic ischemic heart disease. Clin Cardiol 2016; 39:207–214.
- Fowler FJ Jr, Gallagher PM, Bynum JP, Barry MJ, Lucas FL, Skinner JS. Decision-making process reported by Medicare patients who had coronary artery stenting or surgery for prostate cancer. J Gen Intern Med 2012; 27:911–916.
- Goff SL, Mazor KM, Ting HH, Kleppel R, Rothberg MB. How cardiologists present the benefits of percutaneous coronary interventions to patients with stable angina: a qualitative analysis. JAMA Intern Med 2014; 174:1614–1621.
- Braddock CH 3rd, Edwards KA, Hasenberg NM, Laidley TL, Levinson W. Informed decision making in outpatient practice: time to get back to basics. JAMA 1999; 282:2313–2320.
- Rothberg MB, Scherer L, Kashef MA, et al. The effect of information presentation on beliefs about the benefits of elective percutaneous coronary intervention. JAMA Intern Med 2014; 174:1623–1629.
- Coylewright M, Dick S, Zmolek B, et al. PCI choice decision aid for stable coronary artery disease: a randomized trial. Circ Cardiovasc Qual Outcomes 2016; 9:767–776.
- Coylewright M, O’Neill ES, Dick S, Grande SW. PCI choice: cardiovascular clinicians’ perceptions of shared decision making in stable coronary artery disease. Patient Educ Couns 2017; 100:1136–1143.
Multiple randomized controlled trials have compared percutaneous coronary intervention (PCI) vs optimal medical therapy for patients with chronic stable angina. All have consistently shown that PCI does not reduce the risk of death or even myocardial infarction (MI) but that it may relieve angina temporarily. Nevertheless, PCI is still commonly performed for patients with stable coronary disease, often in the absence of angina, and patients mistakenly believe the procedure is life-saving. Cardiologists may not be aware of patients’ misperceptions, or worse, may encourage them. In either case, if patients do not understand the benefits of the procedure, they cannot give informed consent.
This article reviews the pathophysiology of coronary artery disease, evidence from clinical trials of the value of PCI for chronic stable angina, patient and physician perceptions of PCI, and ways to promote patient-centered, shared decision-making.
CLINICAL CASE: EXERTIONAL ANGINA
While climbing 4 flights of stairs, a 55-year-old man noticed tightness in his chest, which lasted for 5 minutes and resolved spontaneously. Several weeks later, when visiting his primary care physician, he mentioned the episode. He had had no symptoms in the interim, but the physician ordered an exercise stress test.
Six minutes into a standard Bruce protocol, the patient experienced the same chest tightness, accompanied by 1-mm ST-segment depressions in leads II, III, and aVF. He was then referred to a cardiologist, who recommended catheterization.
Catheterization demonstrated a 95% stenosis of the right coronary artery with nonsignificant stenoses of the left anterior descending and circumflex arteries. A drug-eluting stent was placed in the right coronary artery, with no residual stenosis.
Did this intervention likely prevent an MI and perhaps save the man’s life?
HOW MYOCARDIAL INFARCTION HAPPENS
Understanding the pathogenesis of MI is critical to having realistic expectations of the benefits of stent placement.
Doctors often describe coronary atherosclerosis as a plumbing problem, where deposits of cholesterol and fat build up in arterial walls, clogging the pipes and eventually causing a heart attack. This analogy, which has been around since the 1950s, is easy to for patients to grasp and has been popularized in the press and internalized by the public—as one patient with a 95% stenosis put it, “I was 95% dead.” In that model, angioplasty and stenting can resolve the blockage and “fix” the problem, much as a plumber can clear your pipes with a Roto-Rooter.
Despite the visual appeal of this model,1 it doesn’t accurately convey what we know about the pathophysiology of coronary artery disease. Instead of a gradual buildup of fatty deposits, low-density lipoprotein cholesterol particles infiltrate arterial walls and trigger an inflammatory reaction as they are engulfed by macrophages, leading to a cascade of cytokines and recruitment of more inflammatory cells.2 This immune response can eventually cause the rupture of the plaque’s fibrous cap, triggering thrombosis and infarction, often at a site of insignificant stenosis.
In this new model, coronary artery disease is primarily a problem of inflammation distributed throughout the vasculature, rather than a mechanical problem localized to the site of a significant stenosis.
Significant stenosis does not equal unstable plaque
Not all plaques are equally likely to rupture. Stable plaques tend to be long-standing and calcified, with a thick fibrous cap. A stable plaque causing a 95% stenosis may cause symptoms with exertion, but it is unlikely to cause infarction.3 Conversely, rupture-prone plaques may cause little stenosis, but a large and dangerous plaque may be lurking beneath the thin fibrous cap.
Relying on angiography can be misleading. Treating all significant stenoses improves blood flow, but does not reduce the risk of infarction, because infarction most often occurs in areas where the lumen is not obstructed. A plaque causing only 30% stenosis can suddenly rupture, causing thrombosis and complete occlusion.
The current model explains why PCI is no better than optimal medical therapy (ie, risk factor modification, antiplatelet therapy with aspirin, and a statin). Diet, exercise, smoking cessation, and statins target inflammatory processes and lower low-density lipoprotein cholesterol levels, while aspirin prevents platelet aggregation, among other likely actions.
The model also explains why coronary artery bypass grafting reduces the risk of MI and death in patients with left main or 3-vessel disease. A patient with generalized coronary artery disease has multiple lesions, many of which do not cause significant stenoses. PCI corrects only a single stenosis, whereas coronary artery bypass grafting circumvents all the vulnerable plaques in a vessel.
THE LANDMARK COURAGE TRIAL
Published in 2007, the Clinical Outcomes Utilizing Revascularization and Aggressive Drug Evaluation (COURAGE) trial4 randomized more than 2,000 patients to receive either optimal medical therapy plus PCI or optimal medical therapy alone. The primary outcome was a composite of death from any cause and nonfatal MI. Patients were followed for at least 3 years, and some for as long as 7 years.
There was an initial small upward spike in the primary outcome in the PCI arm due to periprocedural events. By 5 years, the outcomes of the 2 arms converged and then stayed the same for up to 15 years.5 The authors concluded that PCI conferred no benefit over optimal medical therapy in the risk of death or MI.
Some doctors dismiss the study because of its stringent entry criteria—of 35,539 patients assessed, only 3,071 met the eligibility criteria. However, the entry criteria were meant to identify patients most likely to benefit from PCI. Many patients who undergo PCI today would not have qualified for the study because they lack objective evidence of ischemia.6 To enroll, patients needed a proximal stenosis of at least 70% and objective evidence of ischemia or a coronary stenosis of more than 80% and classic angina. Exclusion criteria disqualified few patients: Canadian Cardiovascular Society class IV angina (ie, angina evoked from minimal activity or at rest); a markedly positive stress test (substantial ST-segment depression or hypotension during stage I of the Bruce protocol); refractory heart failure or cardiogenic shock; an ejection fraction of less than 30%; revascularization within the past 6 months; and coronary anatomy unsuitable for PCI.
OTHER TRIALS SUPPORT COURAGE FINDINGS
Although COURAGE was hailed as a landmark trial, it largely supported the results of previous studies. A meta-analysis of PCI vs optimal medical therapy published in 2005 found no significant differences in death, cardiac death, MI, or nonfatal MI.7 MI was actually slightly more common in the PCI group due to the increased risk of MI during the periprocedural period.
Nor has the evidence from COURAGE discouraged additional studies of the same topic. Despite consistent findings that fit with our understanding of coronary disease as inflammation, we continue to conduct studies aimed at addressing significant stenosis, as if that was the problem. Thus, there have been studies of angioplasty alone, followed by studies of bare-metal stents and then drug-eluting stents.
In 2009, Trikalinos et al published a review of 61 randomized controlled trials comprising more than 25,000 patients with stable coronary disease and comparing medical therapy and angioplasty in its various forms over the previous 20 years.8 In all direct and indirect comparisons of PCI and medical therapy, there were no improvements in rates of death or MI.
Even so, the studies continue. The most recent “improvement” was the addition of fractional flow reserve, which served as the inclusion criterion for the Fractional Flow Reserve versus Angiography for Multivessel Evaluation 2 (FAME 2) trial.9 In that study, patients with at least 1 stenosis with a fractional flow reserve less than 0.80 were randomized to PCI plus medical therapy or to medical therapy alone. The primary end point was a composite of death from any cause, MI, and urgent revascularization. Unfortunately, the study was stopped early when the primary end point was met due to a reduction in the need for urgent revascularization. There was no reduction in the rate of MI (hazard ratio 1.05, 95% confidence interval 0.51–2.19).
The reduction in urgent revascularization has also been shown consistently in past studies, but this is the weakest outcome measure because it does not equate to a reduction in the rate of MI. There is no demonstrable harm to putting off stent placement, even in functionally significant arteries, and most patients do not require a stent, even in the future.
In summary, the primary benefit of getting a stent now is a reduced likelihood of needing one later.
PCI MAY IMPROVE ANGINA FASTER
Another important finding of the COURAGE trial was that PCI improved symptoms more than optimal medical therapy.10 This is not surprising, because angina is often a direct result of a significant stenosis. What was unexpected was that even after PCI, most patients were not symptom-free. At 1 month, significantly more PCI patients were angina-free (42%) than were medical patients (33%). This translates into an absolute risk reduction of 9% or a number needed to treat of 11 to prevent 1 case of angina.
Patients in both groups improved over time, and after 3 years, the difference between the 2 groups was no longer significant: 59% in the PCI group vs 56% in the medical therapy group were angina-free.
A more recent study has raised the possibility that the improvement in angina with PCI is primarily a placebo effect. Researchers in the United Kingdom randomized patients with stable angina and at least a 70% stenosis of one vessel to either PCI or sham PCI, in which they threaded the catheter but did not deploy the stent.11 All patients received aggressive antianginal therapy before the procedure. At 6 weeks, there was improvement in angina in both groups, but no statistically significant difference between them in either exercise time or angina. Approximately half the patients in each group improved by at least 1 grade on the Canadian Cardiovascular Society angina classification, and more than 20% improved 2 grades.
This finding is not without precedent. Ligation of the internal mammary arteries, a popular treatment for angina in the 1950s, often provided dramatic relief of symptoms, until it was proven to be no better than a sham operation.12,13 More recently, a placebo-controlled trial of percutaneous laser myocardial revascularization also failed to show improvement over a sham treatment, despite promising results from a phase 1 trial.14 Together, these studies emphasize the subjective nature of angina as an outcome and call into question the routine use of PCI to relieve it.
PCI ENTAILS RISK
PCI entails a small but not inconsequential risk. During the procedure, 2% of patients develop bleeding or blood vessel damage, and another 1% die or have an MI or a stroke. In the first year after stent placement, 3% of patients have a bleeding event from the antiplatelet therapy needed for the stent, and an additional 2% develop a clot in the stent that leads to MI.15
INFORMED CONSENT IS CRITICAL
As demonstrated above, for patients with stable angina, the only evidence-based benefit of PCI over optimal medical therapy is that symptoms may respond faster. At the same time, there are costs and risks associated with the procedure. Because symptoms are subjective, patients should play a key role in deciding whether PCI is appropriate for them.
The American Medical Association states that a physician providing any treatment or procedure should disclose and discuss with patients the risks and benefits. Unfortunately, a substantial body of evidence demonstrates that this is not occurring in practice.
Patients and cardiologists have conflicting beliefs about PCI
Studies over the past 20 years demonstrate that patients with chronic stable angina consistently overestimate the benefits of PCI, with 71% to 88% believing that it will reduce their chance of death.16–19 Patients also understand that PCI can relieve their symptoms, though no study seems to have assessed the perceived magnitude of this benefit.
In contrast, when cardiologists were asked about the benefits their patients could expect from PCI, only 20% said that it would reduce mortality and 25% said it would prevent MI.18 These are still surprisingly high percentages, since the study was conducted after the COURAGE trial.
Nevertheless, these differences in perception show that cardiologists fail to successfully communicate the benefits of the procedure to their patients. Without complete information, patients cannot make informed decisions.
Cardiologists’ reasons for performing PCI
If PCI cannot improve hard outcomes like MI or death in stable coronary disease, why do cardiologists continue to perform it so frequently?
Soon after the COURAGE trial, Lin et al conducted focus groups with cardiologists to find out.20 Some said that they doubted the clinical trial evidence, given the reduction in the cardiac mortality rate over the past 30 years. Others remarked that their overriding goal is to stamp out ischemia, and that once a lesion is found by catheterization, one must proceed with PCI. This has been termed the “oculostenotic reflex,” ie, the interventionist sees coronary artery disease and immediately places a stent.
Atreya et al found objective evidence of this practice.21 In a 2016 study of 207 patients with obstructive lesions amenable to PCI, the only factors associated with medical management were those that increased the risk of the procedure: age, chronic kidney disease, distal location of the lesion, and type C lesions (the most difficult ones to treat by PCI). More important, evidence of ischemia, presence of angina, and being on optimal medical therapy or maximal antianginal therapy were not associated with PCI.
When surveyed, cardiologists offered reasons similar to those identified by Lin et al, including a positive stress test (70%) and significant myocardium at risk (50%).18 Optimal medical therapy failure was cited less often (40%). Over 30% identified relief of chest pain for patients who were not prescribed optimal medical therapy. Another 30% said that patient anxiety contributed to their decision, but patients who reported anxiety were not more likely to get PCI than those who did not.
True informed consent rarely occurs
Surveys of patients and recordings of doctor visits suggest that doctors often discuss the risks of the procedure but rarely accurately describe the benefits or mention alternative treatments, including optimal medical therapy.
Fowler et al22 surveyed 472 Medicare patients who had undergone PCI in the past year about their consent discussion, particularly regarding alternative options. Only 6% of patients recalled discussing medication as a serious option with their doctor.
In 2 published studies,23,24 we analyzed recorded conversations between doctors and patients in which angiography and PCI were discussed.
In a qualitative assessment of how cardiologists presented the rationale for PCI to patients,23 we observed that cardiologists gave an accurate presentation of the benefits in only 5% of cases. In 13% of the conversations the benefits were explicitly overstated (eg, “If you don’t do it [angiogram/PCI], what could happen? Well, you could…have a heart attack involving that area which can lead to a sudden death”). In another 35% of cases, physicians offered an implicit overstatement of the benefit by saying they could “fix” the problem (eg, “So that’s where we start thinking, Well maybe we better try to fix that [blockage]”), without specifically stating that fixing the problem would offer any benefit. Patients were left to fill in the blanks. Conversations frequently focused on the rationale for performing PCI (eg, ischemia on a stress test) and a description of the procedure, rather than on the risks and benefits.
In a quantitative study of the same data set, we assessed how often physicians addressed the 7 elements of informed decision-making as defined by Braddock et al.24
- Explaining the patient’s role in decision-making (ie, that the patient has a choice to make) was present in half of the conversations. Sometimes a doctor would simply say, “The next step is to perform catheterization.”
- Discussion of clinical issues (eg, having a blockage, stress test results) was performed in almost every case, demonstrating physicians’ comfort with that element.
- Discussing treatment alternatives occurred in only 1 in 4 conversations. This was more frequent than previously reported, and appeared most often when patients expressed hesitancy about proceeding to PCI.
- Discussing pros and cons of the alternatives was done in 42%.
- Uncertainty about the procedure (eg, that it might not relieve the angina) was expressed in only 10% of conversations.
- Assessment of patient understanding was done in 65% of cases. This included even minimal efforts (eg, “Do you have any questions?”). More advanced methods such as teach-back were never used.
- Exploration of patient preferences (eg, asking patients which treatment they prefer, or attempting to understand how angina affects a patient’s life) the final element, occurred in 73% of conversations.
Only 3% of the conversations contained all 7 elements. Even using a more relaxed definition of 3 critical elements (ie, discussing clinical issues, treatment alternatives, and pros and cons), only 13% of conversations included them all.
Discussion affects decisions
Informed decision-making is not only important because of its ethical implications. Offering patients more information was associated with their choosing not to have PCI. The probability of a patient undergoing PCI was negatively associated with 3 specific elements of informed decision-making. Patients were less likely to choose PCI if the patient’s role in decision-making was discussed (61% vs 86% chose PCI, P < .03); if alternatives were discussed (31% vs 89% chose PCI, P < .01); and if uncertainties were discussed (17% vs 80% chose PCI, P < .01).
There was also a linear relationship between the total number of elements discussed and the probability of choosing PCI: it ranged from 100% of patients choosing PCI when just 1 element was present to 3% of patients choosing PCI when all 7 elements were present. The relationship is not entirely causal, since doctors were more likely to talk about alternatives and risks if patients hesitated and raised questions. Cautious patients received more information.
From these observational studies, we know that physicians do not generally communicate the benefits of PCI, and patients make incorrect assumptions about the benefits they can expect. We know that those who receive more information are less likely to choose PCI, but what would happen if patients were randomly assigned to receive complete information?
An online survey
We conducted an online survey of more than 1,000 participants over age 50 who had never undergone PCI, asking them to imagine visiting a cardiologist after having a positive stress test for stable chest pain.25 Three intervention groups read different scenarios couched as information provided by their cardiologist:
- The “standard care” group received no specific information about the effects of PCI on the risk of myocardial infarction
- The “specific information” group was specifically told that PCI does not reduce the risk of myocardial infarction
- The “explanatory information” group was told how medications work and why PCI does not reduce the risk of myocardial infarction.
All 3 groups received information about the risks of PCI, its role in reducing angina, and the risks and benefits of optimal medical therapy.
After reading their scenario, all participants completed an identical questionnaire, which asked if they would opt for PCI, medical therapy, or both. Overall, 55% chose PCI, ranging from 70% in the standard care group to 46% in the group given explanatory information. Rates in the specific-information and explanatory-information groups were not statistically different from each other, but both were significantly different from that in the standard-care group. Interestingly, the more information patients were given about PCI, the more likely they were to choose optimal medical therapy.
After reading the scenario, participants were also asked if PCI would “prevent a heart attack.” Of those who received standard care, 71% endorsed that belief, which is remarkably similar to studies of real patients who have received standard care. In contrast, only 39% of those given specific information and 31% given explanatory information held that belief. Moreover, the belief that PCI prevented MI was the strongest predictor of choosing PCI (odds ratio 5.82, 95% confidence interval 4.13–8.26).25
Interestingly, 52% of the standard care group falsely remembered that the doctor had told them that PCI would prevent an MI, even though the doctor said nothing about it one way or the other. It appears that participants were projecting their own beliefs onto the encounter. This highlights the importance of providing full information to patients who are considering this procedure.
TOWARD SHARED DECISION-MAKING
Shared decision-making is a process in which physicians enter into a partnership with a patient, offer information, elicit the patient’s preferences, and then come to a decision in concert with the patient.
Although many decisions can and should involve elements of shared decision-making, the decision to proceed with PCI for stable angina is particularly well-suited to shared decision-making. This is because the benefit of PCI depends on the value a patient attaches to being free of angina sooner. Since there is no difference in the risk of MI or death, the patient must decide if the risks of the procedure and the inconvenience of taking dual antiplatelet therapy are worth the benefit of improving symptoms faster. Presumably, patients who have more severe symptoms or experienced side effects from antianginal therapy would be more likely to choose PCI.
Despite having substantial experience educating patients, most physicians are unfamiliar with the process of shared decision-making. In particular, the process of eliciting preferences is often overlooked.
To address this issue, researchers at the Mayo Clinic developed a decision aid that compares PCI plus optimal medical therapy vs optimal medical therapy alone in an easily understandable information card.15 On one side, the 2 options are clearly stated, with the magnitude of symptom improvement over time graphically illustrated and the statement, “NO DIFFERENCE in heart attack or death,” prominently displayed. The back of the card discusses the risks of each option in easily understood tables.
The decision aid was compared with standard care in a randomized trial involving patients who were referred for catheterization and possible PCI.26 The decision aid improved patients’ overall knowledge about PCI. In particular, 60% of those who used the decision aid knew that PCI did not prevent death or MI vs 40% of usual-care patients—results similar to those of the online experiment.
Interestingly, the decision about whether to undergo PCI did not differ significantly between the 2 groups, although there was a trend toward more patients in the decision-aid group choosing medical therapy alone (53%) vs the standard-care patients (39%).
To understand why the decision aid did not make more of a difference, the investigators performed qualitative interviews of the cardiologists in the study.27 One theme was the timing of the intervention. Patients using the decision aid had already been referred for catheterization, and some felt the process should have occurred earlier. Engaging in shared decision-making with a general cardiologist before referral could help to improve the quality of patient decisions.
Cardiologists also noted the difficulty in changing their work flow to incorporate the decision aid. Although some embraced the idea of shared decision-making, others were concerned that many patients could not participate, and there was confusion about the difference between an educational tool, which could be used by a patient alone, and a decision aid, which is meant to generate discussion between the doctor and patient. Some expressed interest in using the tool in the future.
These findings serve to emphasize that providing information alone is not enough. If the physician does not “buy in” to the idea of shared decision-making, it will not occur.
PRACTICE IMPLICATIONS
Based on the pathophysiology of coronary artery disease and the results of multiple randomized controlled trials, it is evident that PCI does not prevent heart attacks in patients with chronic stable angina. However, most patients who undergo PCI are unaware of this and therefore do not truly give informed consent. In the absence of explicit information to the contrary, most patients with stable angina assume that PCI prevents MI and thus are biased toward choosing PCI.
Even minimal amounts of explicit information can partially overcome that bias and influence decision-making. In particular, explaining why PCI does not prevent MI was the most effective means of overcoming the bias.
To this end, shared decision aids may help physicians to engage in shared decision-making. Shared decision-making is most likely to occur if physicians are trained in the concept of shared decision-making, are committed to practicing it, and can fit it into their work flow. Ideally, this would occur in the office of a general cardiologist before referral for PCI.
For those practicing in accountable-care organizations, Medicare has recently introduced the shared decision-making model for 6 preference-sensitive conditions, including stable ischemic heart disease. Participants in this program will have the opportunity to receive payments for shared decision-making services and to share in any savings that result from reduced use of resources. Use of these tools holds the promise for providing more patient-centered care at lower cost.
- Jones DS. Visions of a cure. Visualization, clinical trials, and controversies in cardiac therapeutics, 1968–1998. Isis 2000; 91:504–541.
- Hansson G. Inflammation, atherosclerosis, and coronary artery disease. N Engl J Med 2005; 352:1685–1695.
- Stone GW, Maehara A, Lansky AJ, et al. A prospective natural-history study of coronary atherosclerosis. N Engl J Med 2011; 364:226–235.
- Boden WE, O’Rourke RA, Teo KK, et al. Optimal medical therapy with or without PCI for stable coronary disease. N Engl J Med 2007; 356:1503–1516.
- Sedlis SP, Hartigan PM, Teo KK, et al. Effect of PCI on long-term survival in patients with stable ischemic heart disease. N Engl J Med 2015; 373:1937–1946.
- Lin GA, Dudley RA, Lucas FL, Malenka DJ, Vittinghoff E, Redberg RF. Frequency of stress testing to document ischemia prior to elective percutaneous coronary intervention. JAMA 2008; 300:1765–1773.
- Katritsis DG, Ioannidis JP. Percutaneous coronary intervention versus conservative therapy in nonacute coronary artery disease: a meta-analysis. Circulation 2005; 111:2906–2912.
- Trikalinos TA, Alsheikh-Ali AA, Tatsioni A, Nallamothu BK, Kent DM. Percutaneous coronary interventions for non-acute coronary artery disease: a quantitative 20-year synopsis and a network meta-analysis. Lancet 2009; 373:911–918.
- De Bruyne B, Pijls NHJ, Kalesan B, et al. Fractional flow reserve–guided PCI versus medical therapy in stable coronary disease. N Engl J Med 2012; 367:991–1001.
- Weintraub WS, Spertus JA, Kolm P, et al. Effect of PCI on quality of life in patients with stable coronary disease. N Engl J Med 2008; 359:677–687.
- Al-Lamee R, Thompson D, Dehbi H-M, et al, on behalf of the ORBITA Investigators. Percutaneous coronary intervention in stable angina (ORBITA): a double-blind, randomised controlled trial. Lancet. Published online November 2, 2017. http://dx.doi.org/10.1016/S0140-6736(17)32714-9. Accessed November 10, 2017.
- Cobb LA, Thomas GI, Dillard DH, et al. An evaluation of internal mammary-artery ligation by a double-blind technic. N Engl J Med 1959; 260:1115–1118.
- Dimond EG, Fittle F, Crockett JE. Comparison of internal mammary artery ligation and sham operation for angina pectoris. Am J Cardiol 1960; 5:483-486.
- Leon MB, Kornowski R, Downey WE, et al. A blinded, randomized placebo-controlled trial of percutaneous laser myocardial revascularization to improve angina symptoms in patients with severe coronary disease. J Am Coll Cardiol 2005; 46:1812–1819.
- Coylewright M, Shepel K, Leblanc A, et al. Shared decision making in patients with stable coronary artery disease: PCI choice. PLoS One 2012; 7:e49827.
- Holmboe ES, Fiellin DA, Cusanelli E, Remetz M, Krumholz HM. Perceptions of benefit and risk of patients undergoing first-time elective percutaneous coronary revascularization. J Gen Intern Med 2000; 15:632–637.
- Kee F, McDonald P, Gaffney B. Risks and benefits of coronary angioplasty: the patients perspective: a preliminary study. Qual Health Care 1997; 6:131–139.
- Rothberg MB, Sivalingam SK, Ashraf J, et al. Patients’ and cardiologists’ perceptions of the benefits of percutaneous coronary intervention for stable coronary disease. Ann Intern Med 2010; 153:307–313.
- Whittle J, Conigliaro J, Good CB, Kelley ME, Skanderson M. Understanding of the benefits of coronary revascularization procedures among patients who are offered such procedures. Am Heart J 2007; 154:662–668.
- Lin GA, Dudley RA, Redberg RF. Cardiologists’ use of percutaneous coronary interventions for stable coronary artery disease. Arch Intern Med 2007; 167:1604–1609.
- Atreya AR, Sivalingam SK, Arora S, et al. Predictors of medical management in patients undergoing elective cardiac catheterization for chronic ischemic heart disease. Clin Cardiol 2016; 39:207–214.
- Fowler FJ Jr, Gallagher PM, Bynum JP, Barry MJ, Lucas FL, Skinner JS. Decision-making process reported by Medicare patients who had coronary artery stenting or surgery for prostate cancer. J Gen Intern Med 2012; 27:911–916.
- Goff SL, Mazor KM, Ting HH, Kleppel R, Rothberg MB. How cardiologists present the benefits of percutaneous coronary interventions to patients with stable angina: a qualitative analysis. JAMA Intern Med 2014; 174:1614–1621.
- Braddock CH 3rd, Edwards KA, Hasenberg NM, Laidley TL, Levinson W. Informed decision making in outpatient practice: time to get back to basics. JAMA 1999; 282:2313–2320.
- Rothberg MB, Scherer L, Kashef MA, et al. The effect of information presentation on beliefs about the benefits of elective percutaneous coronary intervention. JAMA Intern Med 2014; 174:1623–1629.
- Coylewright M, Dick S, Zmolek B, et al. PCI choice decision aid for stable coronary artery disease: a randomized trial. Circ Cardiovasc Qual Outcomes 2016; 9:767–776.
- Coylewright M, O’Neill ES, Dick S, Grande SW. PCI choice: cardiovascular clinicians’ perceptions of shared decision making in stable coronary artery disease. Patient Educ Couns 2017; 100:1136–1143.
KEY POINTS
- For patients with stable angina pectoris, PCI does not prevent myocardial infarction or death.
- Optimal medical therapy with aspirin and a statin can reduce the risk of myocardial infarction and should be recommended for all patients with stable angina, regardless of whether they undergo PCI.
- PCI improves symptoms of angina faster than medical therapy alone, but more than half of patients will be free of angina in about 2 years with either option.
- In the absence of information to the contrary, most patients and some doctors assume that PCI is life-saving and are biased towards choosing it. As a result, patients are rarely able to give true informed consent to undergo PCI.
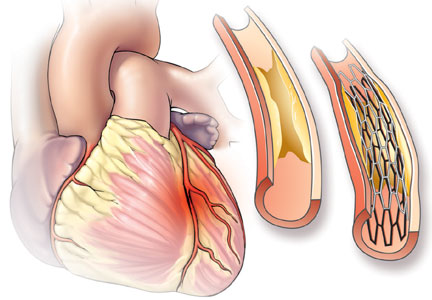
Treatment Trends and Outcomes in Healthcare-Associated Pneumonia
Bacterial pneumonia remains an important cause of morbidity and mortality in the United States, and is the 8th leading cause of death with 55,227 deaths among adults annually.1 In 2005, the American Thoracic Society (ATS) and the Infectious Diseases Society of America (IDSA) collaborated to update guidelines for hospital-acquired pneumonia (HAP), ventilator-associated pneumonia, and healthcare-associated pneumonia (HCAP).2 This broad document outlines an evidence-based approach to diagnostic testing and antibiotic management based on the epidemiology and risk factors for these conditions. The guideline specifies the following criteria for HCAP: hospitalization in the past 90 days, residence in a skilled nursing facility (SNF), home infusion therapy, hemodialysis, home wound care, family members with multidrug resistant organisms (MDRO), and immunosuppressive diseases or medications, with the presumption that these patients are more likely to be harboring MDRO and should thus be treated empirically with broad-spectrum antibiotic therapy. Prior studies have shown that patients with HCAP have a more severe illness, are more likely to have MDRO, are more likely to be inadequately treated, and are at a higher risk for mortality than patients with community-acquired pneumonia (CAP).3,4
These guidelines are controversial, especially in regard to the recommendations to empirically treat broadly with 2 antibiotics targeting Pseudomonas species, whether patients with HCAP merit broader spectrum coverage than patients with CAP, and whether the criteria for defining HCAP are adequate to predict which patients are harboring MDRO. It has subsequently been proposed that HCAP is more related to CAP than to HAP, and a recent update to the guideline removed recommendations for treatment of HCAP and will be placing HCAP into the guidelines for CAP instead.5 We sought to investigate the degree of uptake of the ATS and IDSA guideline recommendations by physicians over time, and whether this led to a change in outcomes among patients who met the criteria for HCAP.
METHODS
Setting and Patients
We identified patients discharged between July 1, 2007, and November 30, 2011, from 488 US hospitals that participated in the Premier database (Premier Inc., Charlotte, North Carolina), an inpatient database developed for measuring quality and healthcare utilization. The database is frequently used for healthcare research and has been described previously.6 Member hospitals are in all regions of the US and are generally reflective of US hospitals. This database contains multiple data elements, including sociodemographic information, International Classification of Diseases, 9th Revision-Clinical Modification (ICD-9-CM) diagnosis and procedure codes, hospital and physician information, source of admission, and discharge status. It also includes a date-stamped log of all billed items and services, including diagnostic tests, medications, and other treatments. Because the data do not contain identifiable information, the institutional review board at our medical center determined that this study did not constitute human subjects research.
We included all patients aged ≥18 years with a principal diagnosis of pneumonia or with a secondary diagnosis of pneumonia paired with a principal diagnosis of respiratory failure, acute respiratory distress syndrome, respiratory arrest, sepsis, or influenza. Patients were excluded if they were transferred to or from another acute care institution, had a length of stay of 1 day or less, had cystic fibrosis, did not have a chest radiograph, or did not receive antibiotics within 48 hours of admission.
For each patient, we extracted age, gender, principal diagnosis, comorbidities, and the specialty of the attending physician. Comorbidities were identified from ICD-9-CM secondary diagnosis codes and Diagnosis Related Groups by using Healthcare Cost and Utilization Project Comorbidity Software, version 3.1, based on the work of Elixhauser (Agency for Healthcare Research and Quality, Rockville, Maryland).7 In order to ensure that patients had HCAP, we required the presence of ≥1 HCAP criteria, including hospitalization in the past 90 days, hemodialysis, admission from an SNF, or immune suppression (which was derived from either a secondary diagnosis for neutropenia, hematological malignancy, organ transplant, acquired immunodeficiency virus, or receiving immunosuppressant drugs or corticosteroids [equivalent to ≥20 mg/day of prednisone]).
Definitions of Guideline-Concordant and Discordant Antibiotic Therapy
The ATS and IDSA guidelines recommended the following antibiotic combinations for HCAP: an antipseudomonal cephalosporin or carbapenem or a beta-lactam/lactamase inhibitor, plus an antipseudomonal quinolone or aminoglycoside, plus an antibiotic with activity versus methicillin resistant Staphylococcus aureus (MRSA), such as vancomycin or linezolid. Based on these guidelines, we defined the receipt of fully guideline-concordant antibiotics as 2 recommended antibiotics for Pseudomonas species plus 1 for MRSA administered by the second day of admission. Partially guideline-concordant antibiotics were defined as 1 recommended antibiotic for Pseudomonas species plus 1 for MRSA by the second day of hospitalization. Guideline-discordant antibiotics were defined as all other combinations.
Statistical Analysis
Descriptive statistics on patient characteristics are presented as frequency, proportions for categorical factors, and median with interquartile range (IQR) for continuous variables for the full cohort and by treatment group, defined as fully or partially guideline-concordant antibiotic therapy or discordant therapy. Hospital rates of fully guideline-concordant treatment are presented overall and by hospital characteristics. The association of hospital characteristics with rates of fully guideline-concordant therapy were assessed by using 1-way analysis of variance tests.
To assess trends across hospitals for the association between the use of guideline-concordant therapy and mortality, progression to respiratory failure as measured by the late initiation of invasive mechanical ventilation (day 3 or later), and the length of stay among survivors, we divided the 4.5-year study period into 9 intervals of 6 months each; 292 hospitals that submitted data for all 9 time points were examined in this analysis. Based on the distribution of length of stay in the first time period, we created an indicator variable for extended length of stay with length of stay at or above the 75th percentile, defined as extended. For each hospital at each 6-month interval, we then computed risk-standardized guideline-concordant treatment (RS-treatment) rates and risk-standardized in-hospital outcome rates similar to methods used by the Centers for Medicare and Medicaid Services for public reporting.8 For each hospital at each time interval, we estimated a predicted rate of guideline-concordant treatment as the sum of predicted probabilities of guideline-concordant treatment from patient factors and the random intercept for the hospital in which they were admitted. We then calculated the expected rate of guideline-concordant treatment as the sum of expected probabilities of treatment received from patient factors only. RS-treatment was then calculated as the ratio of predicted to expected rates multiplied by the overall unadjusted mean treatment rate from all patients.9 We repeated the same modeling strategy to calculate risk-standardized outcome (RS-outcome) rates for each hospital across all time points. All models were adjusted for patient demographics and comorbidities. Similar models using administrative data have moderate discrimination for mortality.10
We then fit mixed-effects linear models with random hospital intercept and slope across time for the RS-treatment and outcome rates, respectively. From these models, we estimated the mean slope for RS-treatment and for RS-outcome over time. In addition, we estimated a slope or trend over time for each hospital for treatment and for outcome and evaluated the correlation between the treatment and outcome trends.
All analyses were performed using the Statistical Analysis System version 9.4 (SAS Institute Inc., Cary, NC) and STATA release 13 (StataCorp, LLC, College Station, Texas).
RESULTS
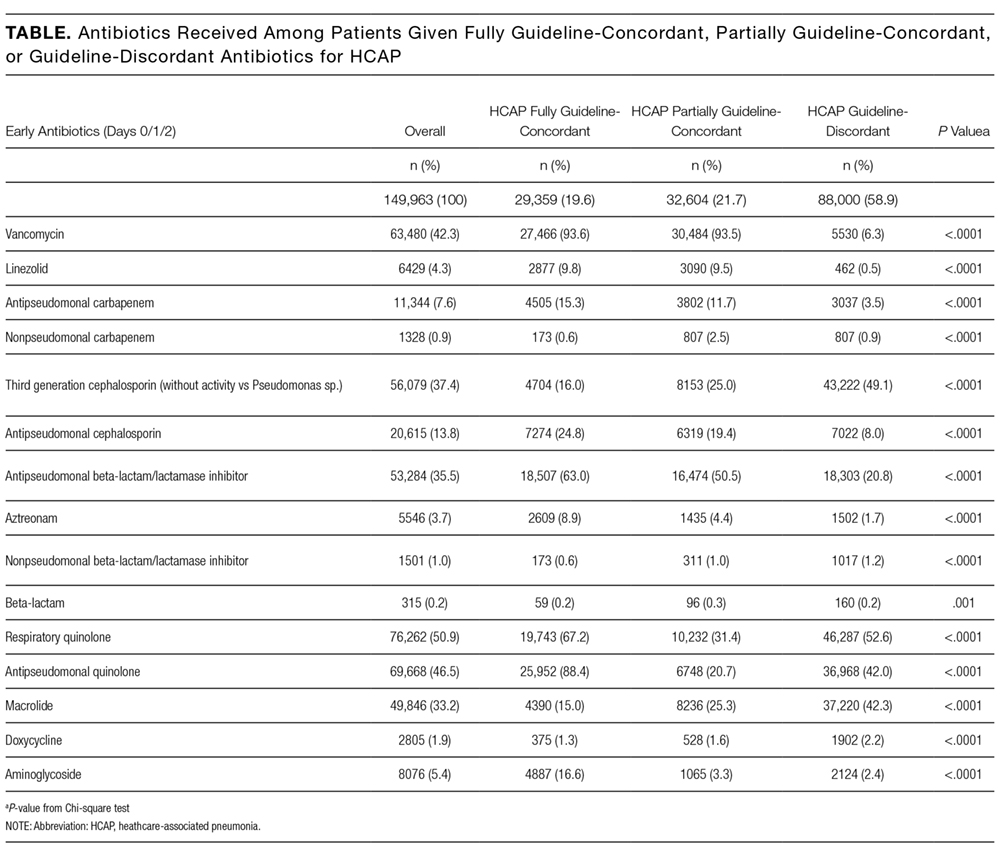

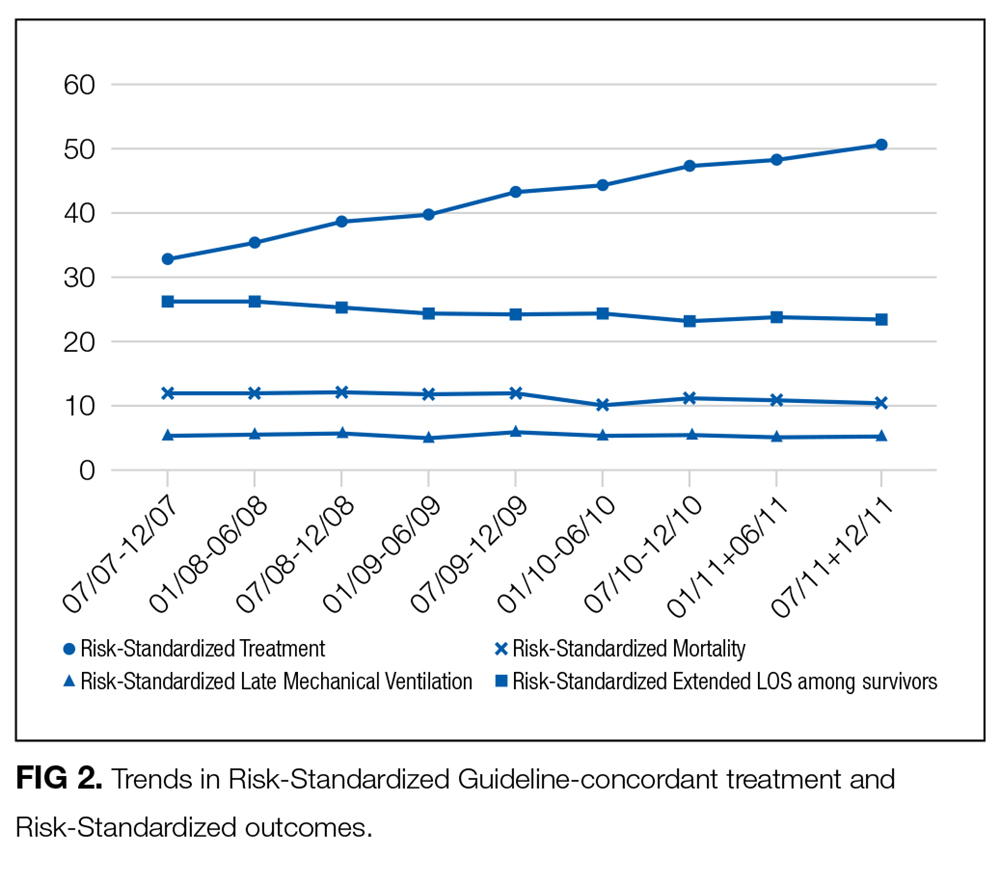
DISCUSSION
In this large, retrospective cohort study, we found that there was a substantial gap between the empiric antibiotics recommended by the ATS and IDSA guidelines and the empiric antibiotics that patients actually received. Over the study period, we saw an increased adherence to guidelines, in spite of growing evidence that HCAP risk factors do not adequately predict which patients are at risk for infection with an MDRO.11 We used this change in antibiotic prescribing behavior over time to determine if there was a clinical impact on patient outcomes and found that at the hospital level, there were no improvements in mortality, excess length of stay, or progression to respiratory failure despite a doubling in guideline-concordant antibiotic use.
At least 2 other large studies have assessed the association between guideline-concordant therapy and outcomes in HCAP.12,13 Both found that guideline-concordant therapy was associated with increased mortality, despite propensity matching. Both were conducted at the individual patient level by using administrative data, and results were likely affected by unmeasured clinical confounders, with sicker patients being more likely to receive guideline-concordant therapy. Our focus on the outcomes at the hospital level avoids this selection bias because the overall severity of illness of patients at any given hospital would not be expected to change over the study period, while physician uptake of antibiotic prescribing guidelines would be expected to increase over time. Determining the correlation between increases in guideline adherence and changes in patient outcome may offer a better assessment of the impact of guideline adherence. In this regard, our results are similar to those achieved by 1 quality improvement collaborative that was aimed at increasing guideline concordant therapy in ICUs. Despite an increase in guideline concordance from 33% to 47% of patients, they found no change in overall mortality.14
There were several limitations to our study. We did not have access to microbiologic data, so we were unable to determine which patients had MDRO infection or determine antibiotic-pathogen matching. However, the treating physicians in our study population presumably did not have access to this data at the time of treatment either because the time period we examined was within the first 48 hours of hospitalization, the interval during which cultures are incubating and the patients are being treated empirically. In addition, there may have been HCAP patients that we failed to identify, such as patients who were admitted in the past 90 days to a hospital that does not submit data to Premier. However, it is unlikely that prescribing for such patients should differ systematically from what we observed. While the database draws from 488 hospitals nationwide, it is possible that practices may be different at facilities that are not contained within the Premier database, such as Veterans Administration Hospitals. Similarly, we did not have readings for chest x-rays; hence, there could be some patients in the dataset who did not have pneumonia. However, we tried to overcome this by including only those patients with a principal diagnosis of pneumonia or sepsis with a secondary pneumonia diagnosis, a chest x-ray, and antibiotics administered within the first 48 hours of admission.
There are likely several reasons why so few HCAP patients in our study received guideline-concordant antibiotics. A lack of knowledge about the ATS and IDSA guidelines may have impacted the physicians in our study population. El-Solh et al.15 surveyed physicians about the ATS-IDSA guidelines 4 years after publication and found that only 45% were familiar with the document. We found that the rate of prescribing at least partially guideline-concordant antibiotics rose steadily over time, supporting the idea that the newness of the guidelines was 1 barrier. Additionally, prior studies have shown that many physicians may not agree with or choose to follow guidelines, with only 20% of physicians indicating that guidelines have a major impact on their clinical decision making,16 and the majority do not choose HCAP guideline-concordant antibiotics when tested.17 Alternatively, clinicians may not follow the guidelines because of a belief that the HCAP criteria do not adequately indicate patients who are at risk for MDRO. Previous studies have demonstrated the relative inability of HCAP risk factors to predict patients who harbor MDRO18 and suggest that better tools such as clinical scoring systems, which include not only the traditional HCAP risk factors but also prior exposure to antibiotics, prior culture data, and a cumulative assessment of both intrinsic and extrinsic factors, could more accurately predict MDRO and lead to a more judicious use of broad-spectrum antimicrobial agents.19-25 Indeed, these collective findings have led the authors of the recently updated guidelines to remove HCAP as a clinical entity from the hospital-acquired or ventilator-associated pneumonia guidelines and place them instead in the upcoming updated guidelines on the management of CAP.5 Of these 3 explanations, the lack of familiarity fits best with our observation that guideline-concordant therapy increased steadily over time with no evidence of reaching a plateau. Ironically, as consensus was building that HCAP is a poor marker for MDROs, routine empiric treatment with vancomycin and piperacillin-tazobactam (“vanco and zosyn”) have become routine in many hospitals. Additional studies are needed to know if this trend has stabilized or reversed.
CONCLUSIONS
In conclusion, clinicians in our large, nationally representative sample treated the majority of HCAP patients as though they had CAP. Although there was an increase in the administration of guideline-concordant therapy over time, this increase was not associated with improved outcomes. This study supports the growing consensus that HCAP criteria do not accurately predict which patients benefit from broad-spectrum antibiotics for pneumonia, and most patients fare well with antibiotics targeting common community-acquired organisms.
Disclosure
This work was supported by grant # R01HS018723 from the Agency for Healthcare Research and Quality. Dr. Lagu is also supported by the National Heart, Lung, and Blood Institute of the National Institutes of Health under award number K01HL114745. Dr. Lindenauer is supported by grant K24HL132008 from the National Heart, Lung, and Blood Institute. The funding agency had no role in the data acquisition, analysis, or manuscript preparation for this study. Drs. Haessler and Rothberg had full access to all the data in the study and take responsibility for the integrity of the data and the accuracy of the data analysis. Drs. Haessler, Lagu, Lindenauer, Skiest, Zilberberg, Higgins, and Rothberg conceived of the study and analyzed and interpreted the data. Dr. Lindenauer acquired the data. Dr. Pekow and Ms. Priya carried out the statistical analyses. Dr. Haessler drafted the manuscript. All authors critically reviewed the manuscript for accuracy and integrity. All authors certify no potential conflicts of interest. Preliminary results from this study were presented in oral and poster format at IDWeek in 2012 and 2013.
1. Kochanek KD, Murphy SL, Xu JQ, Tejada-Vera B. Deaths: Final data for 2014. National vital statistics reports; vol 65 no 4. Hyattsville, MD: National Center for Health Statistics. 2016. PubMed
2. American Thoracic Society, Infectious Diseases Society of America. Guidelines for the Management of Adults with Hospital-acquired, Ventilator-associated, and Healthcare-associated Pneumonia. Am J Respir Crit Care Med. 2005;171(4):388-416. PubMed
3. Zilberberg MD, Shorr A. Healthcare-associated pneumonia: the state of the evidence to date. Curr Opin Pulm Med. 2011;17(3):142-147. PubMed
4. Kollef MK, Shorr A, Tabak YP, Gupta V, Liu LZ, Johannes RS. Epidemiology and Outcomes of Health-care-associated pneumonia. Chest. 2005;128(6):3854-3862. PubMed
5. Kalil AC, Metersky ML, Klompas M, et al. Management of Adults With Hospital-acquired and Ventilator-associated Pneumonia: 2016 Clinical Practice Guidelines by the Infectious Diseases Society of America and the American Thoracic Society. Clin Infect Dis. 2016;63(5):575-582. PubMed
6. Lindenauer PK, Pekow PS, Lahti MC, Lee Y, Benjamin EM, Rothberg MB. Association of corticosteroid dose and route of administration with risk of treatment failure in acute exacerbation of chronic obstructive pulmonary disease. JAMA. 2010;303(23):2359-2367. PubMed
7. Elixhauser A, Steiner C, Harris DR, Coffey RM. Comorbidity measures for use with administrative data. Med Care. 1998;36(1):8-27. PubMed
8. Centers for Medicare & Medicaid Services. Frequently asked questions (FAQs): Implementation and maintenance of CMS mortality measures for AMI & HF. 2007. https://www.cms.gov/Medicare/Quality-Initiatives-Patient-Assessment-Instruments/HospitalQualityInits/downloads/HospitalMortalityAboutAMI_HF.pdf. Accessed November 1, 2016.
9. Normand SL, Shahian DM. Statistical and Clinical Aspects of Hospital Outcomes Profiling. Stat Sci. 2007;22(2):206-226.
10. Rothberg MB, Pekow PS, Priya A, et al. Using highly detailed administrative data to predict pneumonia mortality. PLoS One. 2014;9(1):e87382. PubMed
11. Jones BE, Jones MM, Huttner B, et al. Trends in antibiotic use and nosocomial pathogens in hospitalized veterans with pneumonia at 128 medical centers, 2006-2010. Clin Infect Dis. 2015;61(9):1403-1410. PubMed
12. Attridge RT, Frei CR, Restrepo MI, et al. Guideline-concordant therapy and outcomes in healthcare-associated pneumonia. Eur Respir J. 2011;38(4):878-887. PubMed
13. Rothberg MB, Zilberberg MD, Pekow PS, et al. Association of Guideline-based Antimicrobial Therapy and Outcomes in Healthcare-Associated Pneumonia. J Antimicrob Chemother. 2015;70(5):1573-1579. PubMed
14. Kett DH, Cano E, Quartin AA, et al. Improving Medicine through Pathway Assessment of Critical Therapy of Hospital-Acquired Pneumonia (IMPACT-HAP) Investigators. Implementation of guidelines for management of possible multidrug-resistant pneumonia in intensive care: an observational, multicentre cohort study. Lancet Infect Dis. 2011;11(3):181-189. PubMed
15. El-Solh AA, Alhajhusain A, Saliba RG, Drinka P. Physicians’ Attitudes Toward Guidelines for the Treatment of Hospitalized Nursing-Home -Acquired Pneumonia. J Am Med Dir Assoc. 2011;12(4):270-276. PubMed
16. Tunis S, Hayward R, Wilson M, et al. Internists’ Attitudes about Clinical Practice Guidelines. Ann Intern Med. 1994;120(11):956-963. PubMed
17. Seymann GB, Di Francesco L, Sharpe B, et al. The HCAP Gap: Differences between Self-Reported Practice Patterns and Published Guidelines for Health Care-Associated Pneumonia. Clin Infect Dis. 2009;49(12):1868-1874. PubMed
18. Chalmers JD, Rother C, Salih W, Ewig S. Healthcare associated pneumonia does not accurately identify potentially resistant pathogens: a systematic review and meta-analysis. Clin Infect Dis. 2014;58(3):330-339. PubMed
19. Shorr A, Zilberberg MD, Reichley R, et al. Validation of a Clinical Score for Assessing the Risk of Resistant Pathogens in Patients with Pneumonia Presenting to the Emergency Department. Clin Infect Dis. 2012;54(2):193-198. PubMed
20. Aliberti S, Pasquale MD, Zanaboni AM, et al. Stratifying Risk Factors for Multidrug-Resistant Pathogens in Hospitalized Patients Coming from the Community with Pneumonia. Clin Infect Dis. 2012;54(4):470-478. PubMed
21. Schreiber MP, Chan CM, Shorr AF. Resistant Pathogens in Nonnosocomial Pneumonia and Respiratory Failure: Is it Time to Refine the Definition of Health-care-Associated Pneumonia? Chest. 2010;137(6):1283-1288. PubMed
22. Madaras-Kelly KJ, Remington RE, Fan VS, Sloan KL. Predicting antibiotic resistance to community-acquired pneumonia antibiotics in culture-positive patients with healthcare-associated pneumonia. J Hosp Med. 2012;7(3):195-202. PubMed
23. Shindo Y, Ito R, Kobayashi D, et al. Risk factors for drug-resistant pathogens in community-acquired and healthcare-associated pneumonia. Am J Respir Crit Care Med. 2013;188(8):985-995. PubMed
24. Metersky ML, Frei CR, Mortensen EM. Predictors of Pseudomonas and methicillin-resistant Staphylococcus aureus in hospitalized patients with healthcare-associated pneumonia. Respirology. 2016;21(1):157-163. PubMed
25. Webb BJ, Dascomb K, Stenehjem E, Dean N. Predicting risk of drug-resistant organisms in pneumonia: moving beyond the HCAP model. Respir Med. 2015;109(1):1-10. PubMed
Bacterial pneumonia remains an important cause of morbidity and mortality in the United States, and is the 8th leading cause of death with 55,227 deaths among adults annually.1 In 2005, the American Thoracic Society (ATS) and the Infectious Diseases Society of America (IDSA) collaborated to update guidelines for hospital-acquired pneumonia (HAP), ventilator-associated pneumonia, and healthcare-associated pneumonia (HCAP).2 This broad document outlines an evidence-based approach to diagnostic testing and antibiotic management based on the epidemiology and risk factors for these conditions. The guideline specifies the following criteria for HCAP: hospitalization in the past 90 days, residence in a skilled nursing facility (SNF), home infusion therapy, hemodialysis, home wound care, family members with multidrug resistant organisms (MDRO), and immunosuppressive diseases or medications, with the presumption that these patients are more likely to be harboring MDRO and should thus be treated empirically with broad-spectrum antibiotic therapy. Prior studies have shown that patients with HCAP have a more severe illness, are more likely to have MDRO, are more likely to be inadequately treated, and are at a higher risk for mortality than patients with community-acquired pneumonia (CAP).3,4
These guidelines are controversial, especially in regard to the recommendations to empirically treat broadly with 2 antibiotics targeting Pseudomonas species, whether patients with HCAP merit broader spectrum coverage than patients with CAP, and whether the criteria for defining HCAP are adequate to predict which patients are harboring MDRO. It has subsequently been proposed that HCAP is more related to CAP than to HAP, and a recent update to the guideline removed recommendations for treatment of HCAP and will be placing HCAP into the guidelines for CAP instead.5 We sought to investigate the degree of uptake of the ATS and IDSA guideline recommendations by physicians over time, and whether this led to a change in outcomes among patients who met the criteria for HCAP.
METHODS
Setting and Patients
We identified patients discharged between July 1, 2007, and November 30, 2011, from 488 US hospitals that participated in the Premier database (Premier Inc., Charlotte, North Carolina), an inpatient database developed for measuring quality and healthcare utilization. The database is frequently used for healthcare research and has been described previously.6 Member hospitals are in all regions of the US and are generally reflective of US hospitals. This database contains multiple data elements, including sociodemographic information, International Classification of Diseases, 9th Revision-Clinical Modification (ICD-9-CM) diagnosis and procedure codes, hospital and physician information, source of admission, and discharge status. It also includes a date-stamped log of all billed items and services, including diagnostic tests, medications, and other treatments. Because the data do not contain identifiable information, the institutional review board at our medical center determined that this study did not constitute human subjects research.
We included all patients aged ≥18 years with a principal diagnosis of pneumonia or with a secondary diagnosis of pneumonia paired with a principal diagnosis of respiratory failure, acute respiratory distress syndrome, respiratory arrest, sepsis, or influenza. Patients were excluded if they were transferred to or from another acute care institution, had a length of stay of 1 day or less, had cystic fibrosis, did not have a chest radiograph, or did not receive antibiotics within 48 hours of admission.
For each patient, we extracted age, gender, principal diagnosis, comorbidities, and the specialty of the attending physician. Comorbidities were identified from ICD-9-CM secondary diagnosis codes and Diagnosis Related Groups by using Healthcare Cost and Utilization Project Comorbidity Software, version 3.1, based on the work of Elixhauser (Agency for Healthcare Research and Quality, Rockville, Maryland).7 In order to ensure that patients had HCAP, we required the presence of ≥1 HCAP criteria, including hospitalization in the past 90 days, hemodialysis, admission from an SNF, or immune suppression (which was derived from either a secondary diagnosis for neutropenia, hematological malignancy, organ transplant, acquired immunodeficiency virus, or receiving immunosuppressant drugs or corticosteroids [equivalent to ≥20 mg/day of prednisone]).
Definitions of Guideline-Concordant and Discordant Antibiotic Therapy
The ATS and IDSA guidelines recommended the following antibiotic combinations for HCAP: an antipseudomonal cephalosporin or carbapenem or a beta-lactam/lactamase inhibitor, plus an antipseudomonal quinolone or aminoglycoside, plus an antibiotic with activity versus methicillin resistant Staphylococcus aureus (MRSA), such as vancomycin or linezolid. Based on these guidelines, we defined the receipt of fully guideline-concordant antibiotics as 2 recommended antibiotics for Pseudomonas species plus 1 for MRSA administered by the second day of admission. Partially guideline-concordant antibiotics were defined as 1 recommended antibiotic for Pseudomonas species plus 1 for MRSA by the second day of hospitalization. Guideline-discordant antibiotics were defined as all other combinations.
Statistical Analysis
Descriptive statistics on patient characteristics are presented as frequency, proportions for categorical factors, and median with interquartile range (IQR) for continuous variables for the full cohort and by treatment group, defined as fully or partially guideline-concordant antibiotic therapy or discordant therapy. Hospital rates of fully guideline-concordant treatment are presented overall and by hospital characteristics. The association of hospital characteristics with rates of fully guideline-concordant therapy were assessed by using 1-way analysis of variance tests.
To assess trends across hospitals for the association between the use of guideline-concordant therapy and mortality, progression to respiratory failure as measured by the late initiation of invasive mechanical ventilation (day 3 or later), and the length of stay among survivors, we divided the 4.5-year study period into 9 intervals of 6 months each; 292 hospitals that submitted data for all 9 time points were examined in this analysis. Based on the distribution of length of stay in the first time period, we created an indicator variable for extended length of stay with length of stay at or above the 75th percentile, defined as extended. For each hospital at each 6-month interval, we then computed risk-standardized guideline-concordant treatment (RS-treatment) rates and risk-standardized in-hospital outcome rates similar to methods used by the Centers for Medicare and Medicaid Services for public reporting.8 For each hospital at each time interval, we estimated a predicted rate of guideline-concordant treatment as the sum of predicted probabilities of guideline-concordant treatment from patient factors and the random intercept for the hospital in which they were admitted. We then calculated the expected rate of guideline-concordant treatment as the sum of expected probabilities of treatment received from patient factors only. RS-treatment was then calculated as the ratio of predicted to expected rates multiplied by the overall unadjusted mean treatment rate from all patients.9 We repeated the same modeling strategy to calculate risk-standardized outcome (RS-outcome) rates for each hospital across all time points. All models were adjusted for patient demographics and comorbidities. Similar models using administrative data have moderate discrimination for mortality.10
We then fit mixed-effects linear models with random hospital intercept and slope across time for the RS-treatment and outcome rates, respectively. From these models, we estimated the mean slope for RS-treatment and for RS-outcome over time. In addition, we estimated a slope or trend over time for each hospital for treatment and for outcome and evaluated the correlation between the treatment and outcome trends.
All analyses were performed using the Statistical Analysis System version 9.4 (SAS Institute Inc., Cary, NC) and STATA release 13 (StataCorp, LLC, College Station, Texas).
RESULTS
DISCUSSION
In this large, retrospective cohort study, we found that there was a substantial gap between the empiric antibiotics recommended by the ATS and IDSA guidelines and the empiric antibiotics that patients actually received. Over the study period, we saw an increased adherence to guidelines, in spite of growing evidence that HCAP risk factors do not adequately predict which patients are at risk for infection with an MDRO.11 We used this change in antibiotic prescribing behavior over time to determine if there was a clinical impact on patient outcomes and found that at the hospital level, there were no improvements in mortality, excess length of stay, or progression to respiratory failure despite a doubling in guideline-concordant antibiotic use.
At least 2 other large studies have assessed the association between guideline-concordant therapy and outcomes in HCAP.12,13 Both found that guideline-concordant therapy was associated with increased mortality, despite propensity matching. Both were conducted at the individual patient level by using administrative data, and results were likely affected by unmeasured clinical confounders, with sicker patients being more likely to receive guideline-concordant therapy. Our focus on the outcomes at the hospital level avoids this selection bias because the overall severity of illness of patients at any given hospital would not be expected to change over the study period, while physician uptake of antibiotic prescribing guidelines would be expected to increase over time. Determining the correlation between increases in guideline adherence and changes in patient outcome may offer a better assessment of the impact of guideline adherence. In this regard, our results are similar to those achieved by 1 quality improvement collaborative that was aimed at increasing guideline concordant therapy in ICUs. Despite an increase in guideline concordance from 33% to 47% of patients, they found no change in overall mortality.14
There were several limitations to our study. We did not have access to microbiologic data, so we were unable to determine which patients had MDRO infection or determine antibiotic-pathogen matching. However, the treating physicians in our study population presumably did not have access to this data at the time of treatment either because the time period we examined was within the first 48 hours of hospitalization, the interval during which cultures are incubating and the patients are being treated empirically. In addition, there may have been HCAP patients that we failed to identify, such as patients who were admitted in the past 90 days to a hospital that does not submit data to Premier. However, it is unlikely that prescribing for such patients should differ systematically from what we observed. While the database draws from 488 hospitals nationwide, it is possible that practices may be different at facilities that are not contained within the Premier database, such as Veterans Administration Hospitals. Similarly, we did not have readings for chest x-rays; hence, there could be some patients in the dataset who did not have pneumonia. However, we tried to overcome this by including only those patients with a principal diagnosis of pneumonia or sepsis with a secondary pneumonia diagnosis, a chest x-ray, and antibiotics administered within the first 48 hours of admission.
There are likely several reasons why so few HCAP patients in our study received guideline-concordant antibiotics. A lack of knowledge about the ATS and IDSA guidelines may have impacted the physicians in our study population. El-Solh et al.15 surveyed physicians about the ATS-IDSA guidelines 4 years after publication and found that only 45% were familiar with the document. We found that the rate of prescribing at least partially guideline-concordant antibiotics rose steadily over time, supporting the idea that the newness of the guidelines was 1 barrier. Additionally, prior studies have shown that many physicians may not agree with or choose to follow guidelines, with only 20% of physicians indicating that guidelines have a major impact on their clinical decision making,16 and the majority do not choose HCAP guideline-concordant antibiotics when tested.17 Alternatively, clinicians may not follow the guidelines because of a belief that the HCAP criteria do not adequately indicate patients who are at risk for MDRO. Previous studies have demonstrated the relative inability of HCAP risk factors to predict patients who harbor MDRO18 and suggest that better tools such as clinical scoring systems, which include not only the traditional HCAP risk factors but also prior exposure to antibiotics, prior culture data, and a cumulative assessment of both intrinsic and extrinsic factors, could more accurately predict MDRO and lead to a more judicious use of broad-spectrum antimicrobial agents.19-25 Indeed, these collective findings have led the authors of the recently updated guidelines to remove HCAP as a clinical entity from the hospital-acquired or ventilator-associated pneumonia guidelines and place them instead in the upcoming updated guidelines on the management of CAP.5 Of these 3 explanations, the lack of familiarity fits best with our observation that guideline-concordant therapy increased steadily over time with no evidence of reaching a plateau. Ironically, as consensus was building that HCAP is a poor marker for MDROs, routine empiric treatment with vancomycin and piperacillin-tazobactam (“vanco and zosyn”) have become routine in many hospitals. Additional studies are needed to know if this trend has stabilized or reversed.
CONCLUSIONS
In conclusion, clinicians in our large, nationally representative sample treated the majority of HCAP patients as though they had CAP. Although there was an increase in the administration of guideline-concordant therapy over time, this increase was not associated with improved outcomes. This study supports the growing consensus that HCAP criteria do not accurately predict which patients benefit from broad-spectrum antibiotics for pneumonia, and most patients fare well with antibiotics targeting common community-acquired organisms.
Disclosure
This work was supported by grant # R01HS018723 from the Agency for Healthcare Research and Quality. Dr. Lagu is also supported by the National Heart, Lung, and Blood Institute of the National Institutes of Health under award number K01HL114745. Dr. Lindenauer is supported by grant K24HL132008 from the National Heart, Lung, and Blood Institute. The funding agency had no role in the data acquisition, analysis, or manuscript preparation for this study. Drs. Haessler and Rothberg had full access to all the data in the study and take responsibility for the integrity of the data and the accuracy of the data analysis. Drs. Haessler, Lagu, Lindenauer, Skiest, Zilberberg, Higgins, and Rothberg conceived of the study and analyzed and interpreted the data. Dr. Lindenauer acquired the data. Dr. Pekow and Ms. Priya carried out the statistical analyses. Dr. Haessler drafted the manuscript. All authors critically reviewed the manuscript for accuracy and integrity. All authors certify no potential conflicts of interest. Preliminary results from this study were presented in oral and poster format at IDWeek in 2012 and 2013.
1. Kochanek KD, Murphy SL, Xu JQ, Tejada-Vera B. Deaths: Final data for 2014. National vital statistics reports; vol 65 no 4. Hyattsville, MD: National Center for Health Statistics. 2016. PubMed
2. American Thoracic Society, Infectious Diseases Society of America. Guidelines for the Management of Adults with Hospital-acquired, Ventilator-associated, and Healthcare-associated Pneumonia. Am J Respir Crit Care Med. 2005;171(4):388-416. PubMed
3. Zilberberg MD, Shorr A. Healthcare-associated pneumonia: the state of the evidence to date. Curr Opin Pulm Med. 2011;17(3):142-147. PubMed
4. Kollef MK, Shorr A, Tabak YP, Gupta V, Liu LZ, Johannes RS. Epidemiology and Outcomes of Health-care-associated pneumonia. Chest. 2005;128(6):3854-3862. PubMed
5. Kalil AC, Metersky ML, Klompas M, et al. Management of Adults With Hospital-acquired and Ventilator-associated Pneumonia: 2016 Clinical Practice Guidelines by the Infectious Diseases Society of America and the American Thoracic Society. Clin Infect Dis. 2016;63(5):575-582. PubMed
6. Lindenauer PK, Pekow PS, Lahti MC, Lee Y, Benjamin EM, Rothberg MB. Association of corticosteroid dose and route of administration with risk of treatment failure in acute exacerbation of chronic obstructive pulmonary disease. JAMA. 2010;303(23):2359-2367. PubMed
7. Elixhauser A, Steiner C, Harris DR, Coffey RM. Comorbidity measures for use with administrative data. Med Care. 1998;36(1):8-27. PubMed
8. Centers for Medicare & Medicaid Services. Frequently asked questions (FAQs): Implementation and maintenance of CMS mortality measures for AMI & HF. 2007. https://www.cms.gov/Medicare/Quality-Initiatives-Patient-Assessment-Instruments/HospitalQualityInits/downloads/HospitalMortalityAboutAMI_HF.pdf. Accessed November 1, 2016.
9. Normand SL, Shahian DM. Statistical and Clinical Aspects of Hospital Outcomes Profiling. Stat Sci. 2007;22(2):206-226.
10. Rothberg MB, Pekow PS, Priya A, et al. Using highly detailed administrative data to predict pneumonia mortality. PLoS One. 2014;9(1):e87382. PubMed
11. Jones BE, Jones MM, Huttner B, et al. Trends in antibiotic use and nosocomial pathogens in hospitalized veterans with pneumonia at 128 medical centers, 2006-2010. Clin Infect Dis. 2015;61(9):1403-1410. PubMed
12. Attridge RT, Frei CR, Restrepo MI, et al. Guideline-concordant therapy and outcomes in healthcare-associated pneumonia. Eur Respir J. 2011;38(4):878-887. PubMed
13. Rothberg MB, Zilberberg MD, Pekow PS, et al. Association of Guideline-based Antimicrobial Therapy and Outcomes in Healthcare-Associated Pneumonia. J Antimicrob Chemother. 2015;70(5):1573-1579. PubMed
14. Kett DH, Cano E, Quartin AA, et al. Improving Medicine through Pathway Assessment of Critical Therapy of Hospital-Acquired Pneumonia (IMPACT-HAP) Investigators. Implementation of guidelines for management of possible multidrug-resistant pneumonia in intensive care: an observational, multicentre cohort study. Lancet Infect Dis. 2011;11(3):181-189. PubMed
15. El-Solh AA, Alhajhusain A, Saliba RG, Drinka P. Physicians’ Attitudes Toward Guidelines for the Treatment of Hospitalized Nursing-Home -Acquired Pneumonia. J Am Med Dir Assoc. 2011;12(4):270-276. PubMed
16. Tunis S, Hayward R, Wilson M, et al. Internists’ Attitudes about Clinical Practice Guidelines. Ann Intern Med. 1994;120(11):956-963. PubMed
17. Seymann GB, Di Francesco L, Sharpe B, et al. The HCAP Gap: Differences between Self-Reported Practice Patterns and Published Guidelines for Health Care-Associated Pneumonia. Clin Infect Dis. 2009;49(12):1868-1874. PubMed
18. Chalmers JD, Rother C, Salih W, Ewig S. Healthcare associated pneumonia does not accurately identify potentially resistant pathogens: a systematic review and meta-analysis. Clin Infect Dis. 2014;58(3):330-339. PubMed
19. Shorr A, Zilberberg MD, Reichley R, et al. Validation of a Clinical Score for Assessing the Risk of Resistant Pathogens in Patients with Pneumonia Presenting to the Emergency Department. Clin Infect Dis. 2012;54(2):193-198. PubMed
20. Aliberti S, Pasquale MD, Zanaboni AM, et al. Stratifying Risk Factors for Multidrug-Resistant Pathogens in Hospitalized Patients Coming from the Community with Pneumonia. Clin Infect Dis. 2012;54(4):470-478. PubMed
21. Schreiber MP, Chan CM, Shorr AF. Resistant Pathogens in Nonnosocomial Pneumonia and Respiratory Failure: Is it Time to Refine the Definition of Health-care-Associated Pneumonia? Chest. 2010;137(6):1283-1288. PubMed
22. Madaras-Kelly KJ, Remington RE, Fan VS, Sloan KL. Predicting antibiotic resistance to community-acquired pneumonia antibiotics in culture-positive patients with healthcare-associated pneumonia. J Hosp Med. 2012;7(3):195-202. PubMed
23. Shindo Y, Ito R, Kobayashi D, et al. Risk factors for drug-resistant pathogens in community-acquired and healthcare-associated pneumonia. Am J Respir Crit Care Med. 2013;188(8):985-995. PubMed
24. Metersky ML, Frei CR, Mortensen EM. Predictors of Pseudomonas and methicillin-resistant Staphylococcus aureus in hospitalized patients with healthcare-associated pneumonia. Respirology. 2016;21(1):157-163. PubMed
25. Webb BJ, Dascomb K, Stenehjem E, Dean N. Predicting risk of drug-resistant organisms in pneumonia: moving beyond the HCAP model. Respir Med. 2015;109(1):1-10. PubMed
© 2017 Society of Hospital Medicine
Reducing Readmissions or Length of Stay—Which Is More Important?
Whether robbing banks or reducing healthcare spending, it makes sense to go where the money is. In the case of healthcare, 32% of spending goes to inpatient care, so hospitals represent a logical target for cost-reduction efforts. Because most hospital costs are fixed, there are basically 2 approaches to reducing spending—shorten length of stay or keep patients out of the hospital altogether. The government has tried both, using the power of financial incentives to spur adoption.
Faced with soaring hospital costs in the 1980s, Medicare introduced its prospective payment system, offering hospitals a fixed payment for each specific Diagnosis-Related Group. Hospitals responded by discharging patients sooner, with a resultant rise in admissions to skilled nursing facilities (SNFs) and rapid growth of the home care industry. Length of stay fell dramatically, dropping 9% in 1984 alone.1 It continued to decline through the 1990s, falling by almost 20% between 1993 and 2000. In the following decade, despite the rise of hospital medicine, the rate of decrease slowed to 0.2% per year.2
Attention then turned to readmissions. In 2008, the Medicare Payment Advisory Committee proposed that hospitals with high risk-adjusted readmission rates receive lower payments, arguing that readmissions accounted for $15 billion in Medicare spending and that many were preventable. Thus the Hospital Readmissions Reduction Program was born, introducing readmission penalties in 2012.
Numerous interventions emerged from government and nongovernment parties to reduce readmissions. Many used intensive transitional care programs focusing on early follow-up or medication safety, and some even went as far as providing transitional housing.3 Shortly after passage of the Affordable Care Act, readmission rates fell rapidly. Within a few years, however, the rate of decline slowed dramatically and may have reached a plateau.4 Many have argued that only a small proportion of readmissions are preventable and that there are more direct ways to promote improved discharge planning without diverting resources from other areas.5 It seems that readmissions may not be feasibly reduced much further.
With the advent of accountable care organizations, health systems are now turning their focus to the small population of patients who consume a disproportionate share of healthcare dollars. Because the top 1% of patients—so-called super-utilizers—account for 21% of spending, efforts to reduce their utilization could produce outsized returns.6 Initial anecdotal reports described patients with complex physical, behavior, and social needs receiving fragmented care resulting in myriad expensive admissions. The response comprised teams of social workers and community health workers coupled with robust primary care, formulating individualized solutions. However, data supporting the effectiveness of this common-sense approach are lacking. In addition, our understanding of high-cost patients is evolving. For one thing, being a super-utilizer is often temporary, as just over one-quarter are still in that category a year later.7 Moreover, not all high-cost patients are frequently admitted.8
In this issue of The Journal of Hospital Medicine, Wick et al.9 provide additional insight into high utilizers of hospital services. The authors compare definitions of high utilizers based on cost, number of admissions, or cumulative length of stay over one year. Only 10 percent of high utilizers met all 3 definitions. The overlap between high utilizers by cost and length of stay was twice the overlap between high utilizers by number of admissions and either group. This finding is not surprising because hospitals have high fixed costs, so total cost tends to mirror length of stay.
The study was performed in Canada, and the overlap among these groups may be different in the US. The Canadian patients were hospitalized less frequently than their American counterparts, perhaps reflecting better access to primary care in the Canadian system. Regardless, Wick et al.9 add to the growing literature suggesting that the terms “high utilization” and “high cost” do not always describe the same population. This finding is important because strategies aimed at patients who are frequently admitted may not be effective for those who generate the highest costs. In trying to reduce overall costs, it may be time to revisit length of stay.
Given the long history of prospective payment in the US and the stagnation in length of stay over the past decade, it is reasonable to wonder whether further reductions are possible. In the study by Wick et al.,9 patients with longer lengths of stay were discharged to long-term care facilities. This observation is consistent with others’ reports. Studies of delays in care show that at least 10% of all hospital days can be attributed to delays in discharge, especially to SNFs. In the most recent study, 11% of hospital days were deemed unnecessary by hospitalists, with one-third of those delays due to lack of availability at an extended care facility.10 Six years earlier, Carey et al. found that 13.5% of inpatient days were unnecessary, with more than 60% of delays attributable to waiting for discharge to a SNF.11
How, then, might we curtail unnecessary waiting, and whose job is it to solve the problem? The prospective payment system should reward hospitals for eliminating waiting—particularly those hospitals operating at capacity, for which the opportunity costs of occupied beds are most acute. Hospitalists, per se, have no incentive to discharge patients who are waiting; these patients are easy to round on, rarely have emergencies, and generate daily bills. Even when hospitalists are employed by the hospital and incentives for both are aligned, hospitalists may still be powerless to discharge waiting patients, summon busy consultants, or create extra slots in the endoscopy suite.
The move to value at the system level may offer hope. As health systems become responsible for the total cost of care, their focus must shift from the individual areas where care is provided to the transitions of care between treatment areas. It is in these transitions that US healthcare has failed most spectacularly, and consequently, it is where the greatest opportunity lies.
To date, most discharge interventions have focused on communication, with a goal of improving patient safety and, to a lesser extent, preventing readmissions. Partnering with SNFs can reduce the rate of readmissions,12 but for the most part, the incentives for hospitals and post-acute care facilities remain misaligned. Because post-acute care facilities are paid per diem, they have little incentive to reduce patients’ stays or to admit new patients, who are more expensive to care for than existing ones. Physicians round on SNF patients infrequently and have no incentive to discharge patients, exacerbating the problem. Because post-acute care represents a growing proportion of costs for both medical and surgical patients, health systems will need to either have their own facilities or enter into contracts that align the incentives.
What can hospitalists do? As the predominant coordinators of hospitalized patients’ care both for medical and surgical teams, hospitalists meaningfully impact readmissions and lengths of stay through the care they provide.13 More important, as their roles in optimizing hospital throughput14 continue to expand, hospitalists are perhaps best positioned to observe a diverse range of inefficiencies and inadequacies in inpatient practice and translate those observations into new systems of care. Through thoughtful participation in hospital operations, administration, and health services research, hospitalists hold the key to improving the value of care we provide.
Disclosure
Nothing to report.
1. Davis C, Rhodes DJ. The impact of DRGs on the cost and quality of health care in the United States. Health Policy. 1988;9(2):117-131. PubMed
2. Healthcare Cost and Utilization Project (HCUP). Statistical Brief #180. Overview of Hospital Stays in the United States, 2012. Available at: https://www.hcup-us.ahrq.gov/reports/statbriefs/sb180-Hospitalizations-United-States-2012.pdf. Accessed July 17, 2017.
3. Kansagara D, Chiovaro JC, Kagen D, et al. So many options, where do we start? An overview of the care transitions literature. J Hosp Med. 2016;11(3):221-230. PubMed
4. Zuckerman RB, Sheingold SH, Orav EJ, Ruhter J, Epstein AM. Readmissions, observation, and the Hospital Readmissions Reduction Program. N Engl J Med. 2016;374(16):1543-1551. PubMed
5. Joynt KE, Jha AK. Thirty-day readmissions—truth and consequences. N Engl J Med. 2012;366(15):1366-1369. PubMed
6. Stanton MW, Rutherford MK. Research in Action: The high concentration of U.S. health care expenditures. Agency for Healthcare Research and Quality. Available at: https://meps.ahrq.gov/data_files/publications/ra19/ra19.pdf. Accessed July 17, 2017.
7. Johnson TL, Rinehart DJ, Durfee J, et al. For many patients who use large amounts of health care services, the need is intense yet temporary. Health Aff (Millwood). 2015;34(8):1312-1319. PubMed
8. Lee NS, Whitman N, Vakharia N, PhD GB, Rothberg MB. High-cost patients: hot-spotters don’t explain the half of it. J Gen Intern Med. 2017;32(1):28-34. PubMed
9. Wick JP, Hemmelgarn BR,Manns BJ, et al. Comparison of methods to define high use of inpatient services using population-based data. J Hosp Med. 2017;12(8):596-602. PubMed
10. Kim CS, Hart AL, Paretti RF, et al. Excess hospitalization days in an academic medical center: perceptions of hospitalists and discharge planners. Am J Manag Care. 2011;17(2):e34-42. PubMed
11. Carey MR, Sheth H, Braithwaite RS. A prospective study of reasons for prolonged hospitalizations on a general medicine teaching service. J Gen Intern Med. 2005;20(2):108-115. PubMed
12. Kim LD, Kou L, Hu B, Gorodeski EZ, Rothberg MB. Impact of a connected care model on 30-day readmission rates from skilled nursing facilities. J Hosp Med. 2017;12(4):238-244. PubMed
13. Southern WN, Berger MA, Bellin EY, Hailpern SM, Arnsten JH. Hospitalist care and length of stay in patients requiring complex discharge planning and close clinical monitoring. Arch Intern Med. 2007;167(17):1869-1874. PubMed
14. Chadaga SR, Maher MP, Maller N, et al. Evolving practice of hospital medicine and its impact on hospital throughput and efficiencies. J Hosp Med. 2012;7(8):649-654. PubMed
Whether robbing banks or reducing healthcare spending, it makes sense to go where the money is. In the case of healthcare, 32% of spending goes to inpatient care, so hospitals represent a logical target for cost-reduction efforts. Because most hospital costs are fixed, there are basically 2 approaches to reducing spending—shorten length of stay or keep patients out of the hospital altogether. The government has tried both, using the power of financial incentives to spur adoption.
Faced with soaring hospital costs in the 1980s, Medicare introduced its prospective payment system, offering hospitals a fixed payment for each specific Diagnosis-Related Group. Hospitals responded by discharging patients sooner, with a resultant rise in admissions to skilled nursing facilities (SNFs) and rapid growth of the home care industry. Length of stay fell dramatically, dropping 9% in 1984 alone.1 It continued to decline through the 1990s, falling by almost 20% between 1993 and 2000. In the following decade, despite the rise of hospital medicine, the rate of decrease slowed to 0.2% per year.2
Attention then turned to readmissions. In 2008, the Medicare Payment Advisory Committee proposed that hospitals with high risk-adjusted readmission rates receive lower payments, arguing that readmissions accounted for $15 billion in Medicare spending and that many were preventable. Thus the Hospital Readmissions Reduction Program was born, introducing readmission penalties in 2012.
Numerous interventions emerged from government and nongovernment parties to reduce readmissions. Many used intensive transitional care programs focusing on early follow-up or medication safety, and some even went as far as providing transitional housing.3 Shortly after passage of the Affordable Care Act, readmission rates fell rapidly. Within a few years, however, the rate of decline slowed dramatically and may have reached a plateau.4 Many have argued that only a small proportion of readmissions are preventable and that there are more direct ways to promote improved discharge planning without diverting resources from other areas.5 It seems that readmissions may not be feasibly reduced much further.
With the advent of accountable care organizations, health systems are now turning their focus to the small population of patients who consume a disproportionate share of healthcare dollars. Because the top 1% of patients—so-called super-utilizers—account for 21% of spending, efforts to reduce their utilization could produce outsized returns.6 Initial anecdotal reports described patients with complex physical, behavior, and social needs receiving fragmented care resulting in myriad expensive admissions. The response comprised teams of social workers and community health workers coupled with robust primary care, formulating individualized solutions. However, data supporting the effectiveness of this common-sense approach are lacking. In addition, our understanding of high-cost patients is evolving. For one thing, being a super-utilizer is often temporary, as just over one-quarter are still in that category a year later.7 Moreover, not all high-cost patients are frequently admitted.8
In this issue of The Journal of Hospital Medicine, Wick et al.9 provide additional insight into high utilizers of hospital services. The authors compare definitions of high utilizers based on cost, number of admissions, or cumulative length of stay over one year. Only 10 percent of high utilizers met all 3 definitions. The overlap between high utilizers by cost and length of stay was twice the overlap between high utilizers by number of admissions and either group. This finding is not surprising because hospitals have high fixed costs, so total cost tends to mirror length of stay.
The study was performed in Canada, and the overlap among these groups may be different in the US. The Canadian patients were hospitalized less frequently than their American counterparts, perhaps reflecting better access to primary care in the Canadian system. Regardless, Wick et al.9 add to the growing literature suggesting that the terms “high utilization” and “high cost” do not always describe the same population. This finding is important because strategies aimed at patients who are frequently admitted may not be effective for those who generate the highest costs. In trying to reduce overall costs, it may be time to revisit length of stay.
Given the long history of prospective payment in the US and the stagnation in length of stay over the past decade, it is reasonable to wonder whether further reductions are possible. In the study by Wick et al.,9 patients with longer lengths of stay were discharged to long-term care facilities. This observation is consistent with others’ reports. Studies of delays in care show that at least 10% of all hospital days can be attributed to delays in discharge, especially to SNFs. In the most recent study, 11% of hospital days were deemed unnecessary by hospitalists, with one-third of those delays due to lack of availability at an extended care facility.10 Six years earlier, Carey et al. found that 13.5% of inpatient days were unnecessary, with more than 60% of delays attributable to waiting for discharge to a SNF.11
How, then, might we curtail unnecessary waiting, and whose job is it to solve the problem? The prospective payment system should reward hospitals for eliminating waiting—particularly those hospitals operating at capacity, for which the opportunity costs of occupied beds are most acute. Hospitalists, per se, have no incentive to discharge patients who are waiting; these patients are easy to round on, rarely have emergencies, and generate daily bills. Even when hospitalists are employed by the hospital and incentives for both are aligned, hospitalists may still be powerless to discharge waiting patients, summon busy consultants, or create extra slots in the endoscopy suite.
The move to value at the system level may offer hope. As health systems become responsible for the total cost of care, their focus must shift from the individual areas where care is provided to the transitions of care between treatment areas. It is in these transitions that US healthcare has failed most spectacularly, and consequently, it is where the greatest opportunity lies.
To date, most discharge interventions have focused on communication, with a goal of improving patient safety and, to a lesser extent, preventing readmissions. Partnering with SNFs can reduce the rate of readmissions,12 but for the most part, the incentives for hospitals and post-acute care facilities remain misaligned. Because post-acute care facilities are paid per diem, they have little incentive to reduce patients’ stays or to admit new patients, who are more expensive to care for than existing ones. Physicians round on SNF patients infrequently and have no incentive to discharge patients, exacerbating the problem. Because post-acute care represents a growing proportion of costs for both medical and surgical patients, health systems will need to either have their own facilities or enter into contracts that align the incentives.
What can hospitalists do? As the predominant coordinators of hospitalized patients’ care both for medical and surgical teams, hospitalists meaningfully impact readmissions and lengths of stay through the care they provide.13 More important, as their roles in optimizing hospital throughput14 continue to expand, hospitalists are perhaps best positioned to observe a diverse range of inefficiencies and inadequacies in inpatient practice and translate those observations into new systems of care. Through thoughtful participation in hospital operations, administration, and health services research, hospitalists hold the key to improving the value of care we provide.
Disclosure
Nothing to report.
1. Davis C, Rhodes DJ. The impact of DRGs on the cost and quality of health care in the United States. Health Policy. 1988;9(2):117-131. PubMed
2. Healthcare Cost and Utilization Project (HCUP). Statistical Brief #180. Overview of Hospital Stays in the United States, 2012. Available at: https://www.hcup-us.ahrq.gov/reports/statbriefs/sb180-Hospitalizations-United-States-2012.pdf. Accessed July 17, 2017.
3. Kansagara D, Chiovaro JC, Kagen D, et al. So many options, where do we start? An overview of the care transitions literature. J Hosp Med. 2016;11(3):221-230. PubMed
4. Zuckerman RB, Sheingold SH, Orav EJ, Ruhter J, Epstein AM. Readmissions, observation, and the Hospital Readmissions Reduction Program. N Engl J Med. 2016;374(16):1543-1551. PubMed
5. Joynt KE, Jha AK. Thirty-day readmissions—truth and consequences. N Engl J Med. 2012;366(15):1366-1369. PubMed
6. Stanton MW, Rutherford MK. Research in Action: The high concentration of U.S. health care expenditures. Agency for Healthcare Research and Quality. Available at: https://meps.ahrq.gov/data_files/publications/ra19/ra19.pdf. Accessed July 17, 2017.
7. Johnson TL, Rinehart DJ, Durfee J, et al. For many patients who use large amounts of health care services, the need is intense yet temporary. Health Aff (Millwood). 2015;34(8):1312-1319. PubMed
8. Lee NS, Whitman N, Vakharia N, PhD GB, Rothberg MB. High-cost patients: hot-spotters don’t explain the half of it. J Gen Intern Med. 2017;32(1):28-34. PubMed
9. Wick JP, Hemmelgarn BR,Manns BJ, et al. Comparison of methods to define high use of inpatient services using population-based data. J Hosp Med. 2017;12(8):596-602. PubMed
10. Kim CS, Hart AL, Paretti RF, et al. Excess hospitalization days in an academic medical center: perceptions of hospitalists and discharge planners. Am J Manag Care. 2011;17(2):e34-42. PubMed
11. Carey MR, Sheth H, Braithwaite RS. A prospective study of reasons for prolonged hospitalizations on a general medicine teaching service. J Gen Intern Med. 2005;20(2):108-115. PubMed
12. Kim LD, Kou L, Hu B, Gorodeski EZ, Rothberg MB. Impact of a connected care model on 30-day readmission rates from skilled nursing facilities. J Hosp Med. 2017;12(4):238-244. PubMed
13. Southern WN, Berger MA, Bellin EY, Hailpern SM, Arnsten JH. Hospitalist care and length of stay in patients requiring complex discharge planning and close clinical monitoring. Arch Intern Med. 2007;167(17):1869-1874. PubMed
14. Chadaga SR, Maher MP, Maller N, et al. Evolving practice of hospital medicine and its impact on hospital throughput and efficiencies. J Hosp Med. 2012;7(8):649-654. PubMed
© 2017 Society of Hospital Medicine
Do HCAHPS doctor communication scores reflect the communication skills of the attending on record? A cautionary tale from a tertiary-care medical service
Communication is the foundation of medical care.1 Effective communication can improve health outcomes, safety, adherence, satisfaction, trust, and enable genuine informed consent and decision-making.2-9 Furthermore, high-quality communication increases provider engagement and workplace satisfaction, while reducing stress and malpractice risk.10-15
Direct measurement of communication in the healthcare setting can be challenging. The “Four Habits Model,” which is derived from a synthesis of empiric studies8,16-20 and theoretical models21-24 of communication, offers 1 framework for assessing healthcare communication. The conceptual model underlying the 4 habits has been validated in studies of physician and patient satisfaction.1,4,25-27 The 4 habits are: investing in the beginning, eliciting the patient’s perspective, demonstrating empathy, and investing in the end. Each habit is divided into several identifiable tasks or skill sets, which can be reliably measured using validated tools and checklists.28 One such instrument, the Four Habits Coding Scheme (4HCS), has been evaluated against other tools and demonstrated overall satisfactory inter-rater reliability and validity.29,30
The Hospital Consumer Assessment of Healthcare Providers and Systems (HCAHPS) survey, developed under the direction of the Centers for Medicare and Medicaid Services (CMS) and the Agency for Healthcare Research and Quality, is an established national standard for measuring patient perceptions of care. HCAHPS retrospectively measures global perceptions of communication, support and empathy from physicians and staff, processes of care, and the overall patient experience. HCAHPS scores were first collected nationally in 2006 and have been publicly reported since 2008.31 With the introduction of value-based purchasing in 2012, health system revenues are now tied to HCAHPS survey performance.32 As a result, hospitals are financially motivated to improve HCAHPS scores but lack evidence-based methods for doing so. Some healthcare organizations have invested in communication training programs based on the available literature and best practices.2,33-35 However, it is not known how, if at all, HCAHPS scores relate to physicians’ real-time observed communication skills.
To examine the relationship between physician communication, as reported by global HCAHPS scores, and the quality of physician communication skills in specific encounters, we observed hospitalist physicians during inpatient bedside rounds and measured their communication skills using the 4HCS.
METHODS
Study Design
The study utilized a cross sectional design; physicians who consented were observed on rounds during 3 separate encounters, and we compared hospitalists’ 4HCS scores to their HCAHPS scores to assess the correlation. The study was approved by the Institutional Review Board of the Cleveland Clinic.
Population
The study was conducted at the main campus of the Cleveland Clinic. All physicians specializing in hospital medicine who had received 10 or more completed HCAHPS survey responses while rounding on a medicine service in the past year were invited to participate in the study. Participation was voluntary; night hospitalists were excluded. A research nurse was trained in the Four Habits Model28 and in the use of the 4HCS coding scheme by the principal investigator. The nurse observed each physician and ascertained the presence of communication behaviors using the 4HCS tool. Physicians were observed between August 2013 and August 2014. Multiple observations per physician could occur on the same day, but only 1 observation per patient was used for analysis. Observations consisted of a physician’s first encounter with a hospitalized patient, with the patient’s consent. Observations were conducted during encounters with English-speaking and cognitively intact patients only. Resident physicians were permitted to stay and conduct rounds per their normal routine. Patient information was not collected as part of the study.
Measures
HCAHPS. For each physician, we extracted all HCAHPS scores that were collected from our hospital’s Press Ganey database. The HCAHPS survey contains 22 core questions divided into 7 themes or domains, 1 of which is doctor communication. The survey uses frequency-based questions with possible answers fixed on a 4-point scale (4=always, 3=usually, 2=sometimes, 1=never). Our primary outcome was the doctor communication domain, which comprises 3 questions: 1) During this hospital stay, how often did the doctors treat you with respect? 2) During this hospital stay, how often did the doctors listen to you? and 3) During this hospital stay, how often did the doctors explain things in a language you can understand? Because CMS counts only the percentage of responses that are graded “always,” so-called “top box” scoring, we used the same measure.
The HCAHPS scores are always attributed to the physician at the time of discharge even if he may not have been responsible for the care of the patient during the entire hospital course. To mitigate contamination from patients seen by multiple providers, we cross-matched length of stay (LOS) data with billing data to determine the proportion of days a patient was seen by a single provider during the entire length of stay. We stratified patients seen by the attending providers to less than 50%, 50% to less than 100%, and at 100% of the LOS. However, we were unable to identify which patients were seen by other consultants or by residents due to limitations in data gathering and the nature of the database.

The Four Habits. The Four Habits are: invest in the beginning, elicit the patient’s perspective, demonstrate empathy, and invest in the end (Figure 1). Specific behaviors for Habits 1 to 4 are outlined in the Appendix, but we will briefly describe the themes as follows. Habit 1, invest in the beginning, describes the ability of the physician to set a welcoming environment for the patient, establish rapport, and collaborate on an agenda for the visit. Habit 2, elicit the patient’s perspective, describes the ability of the physician to explore the patients’ worries, ideas, expectations, and the impact of the illness on their lifestyle. Habit 3, demonstrate empathy, describes the physician’s openness to the patient’s emotions as well as the ability to explore, validate; express curiosity, and openly accept these feelings. Habit 4, invest in the end, is a measure of the physician’s ability to counsel patients in a language built around their original concerns or worries, as well as the ability to check the patients’ understanding of the plan.2,29-30
4HCS. The 4HCS tool (Appendix) measures discreet behaviors and phrases based on each of the Four Habits (Figure 1). With a scoring range from a low of 4 to a high of 20, the rater at bedside assigns a range of points on a scale of 1 to 5 for each habit. It is an instrument based on a teaching model used widely throughout Kaiser Permanente to improve clinicians’ communication skills. The 4HCS was first tested for interrater reliability and validity against the Roter Interaction Analysis System using 100 videotaped primary care physician encounters.29 It was further evaluated in a randomized control trial. Videotapes from 497 hospital encounters involving 71 doctors from a variety of clinical specialties were rated by 4 trained raters using the coding scheme. The total score Pearson’s R and intraclass correlation coefficient (ICC) exceeded 0.70 for all pairs of raters, and the interrater reliability was satisfactory for the 4HCS as applied to heterogeneous material.30
STATISTICAL ANALYSIS
Physician characteristics were summarized with standard descriptive statistics. Pearson correlation coefficients were computed between HCAHPS and 4HCS scores. All analyses were performed with RStudio (Boston, MA). The Pearson correlation between the averaged HCAHPS and 4HCS scores was also computed. A correlation with a P value less than 0.05 was considered statistically significant. With 28 physicians, the study had a power of 88% to detect a moderate correlation (greater than 0.50) with a 2-sided alpha of 0.05. We also computed the correlations based on the subgroups of data with patients seen by providers for less than 50%, 50% to less than 100%, and 100% of LOS. All analyses were conducted in SAS 9.2 (SAS Institute Inc., Cary, NC).36
RESULTS
There were 31 physicians who met our inclusion criteria. Of 29 volunteers, 28 were observed during 3 separate inpatient encounters and made up the final sample. A total of 1003 HCAHPS survey responses were available for these physicians. Participants were predominantly female (60.7%), with an average age of 39 years. They were in practice for an average of 4 years (12 were in practice more than 5 years), and 9 were observed on a teaching rotation.

The means of the overall 4HCS scores per observation were 17.39 ± 2.33 for the first, 17.00 ± 2.37 for the second, and 17.43 ± 2.36 for third bedside observation. The mean 4HCS scores per observation, broken down by habit, appear in Table 1. The ICC among the repeated scores within the same physician was 0.81. The median number of HCAHPS survey returns was 32 (range = [8, 85], with mean = 35.8, interquartile range = [16, 54]). The median overall HCAHPS doctor communication score was 89.6 (range = 80.9-93.7). Participants scored the highest in the respect subdomain and the lowest in the explain subdomain. Median HCAHPS scores and ranges appear in Table 2.
Because there were no significant associations between 4HCS scores or HCAHPS scores and physician age, sex, years in practice, or teaching site, correlations were not adjusted. Figure 2A and 2B show the association between mean 4HCS scores and HCAHPS scores by physician. There was no significant correlation between overall 4HCS and HCAHPS doctor communication scores (Pearson correlation coefficient 0.098; 95% confidence interval [CI], -0.285, 0.455). The individual habits also were not correlated with overall HCAHPS scores or with their corresponding HCAHPS domain (Table 3).

For 325 patients, 1 hospitalist was present for the entire LOS. In sensitivity analysis limiting observations to these patients (Figure 2C, Figure 2D, Table 3), we found a moderate correlation between habit 3 and the HCAHPS respect score (Pearson correlation coefficient 0.515; 95% CI, 0.176, 0.745; P = 0.005), and a weaker correlation between habit 3 and the HCAHPS overall doctor communication score (0.442; 95% CI, 0.082, 0.7; P = 0.019). There were no other significant correlations between specific habits and HCAHPS scores.

DISCUSSION
In this observational study of hospitalist physicians at a large tertiary care center, we found that communication skills, as measured by the 4HCS, varied substantially among physicians but were highly correlated within patients of the same physician. However, there was virtually no correlation between the attending physician of record’s 4HCS scores and their HCAHPS communication scores. When we limited our analysis to patients who saw only 1 hospitalist throughout their stay, there were moderate correlations between demonstration of empathy and both the HCAHPS respect score and overall doctor communication score. There were no trends across the strata of hospitalist involvement. It is important to note that the addition of even 1 different hospitalist to the LOS removes any association. Habits 1 and 2 are close to significance in the 100% subgroup, with a weak correlation. Interestingly, Habit 4, which focuses on creating a plan with the patient, showed no correlation at all with patients reporting that doctors explained things in language they could understand.
Development and testing of the HCAHPS survey began in 2002, commissioned by CMS and the Agency for Healthcare Research and Quality for the purpose of measuring patient experience in the hospital. The HCAHPS survey was endorsed by the National Quality Forum in 2005, with final approval of the national implementation granted by the Office of Management and Budget later that year. The CMS began implementation of the HCAHPS survey in 2006, with the first required public reporting of all hospitals taking place in March 2008.37-41 Based on CMS’ value-based purchasing initiative, hospitals with low HCAHPS scores have faced substantial penalties since 2012. Under these circumstances, it is important that the HCAHPS measures what it purports to measure. Because HCAHPS was designed to compare hospitals, testing was limited to assessment of internal reliability, hospital-level reliability, and construct validity. External validation with known measures of physician communication was not performed.41 Our study appears to be the first to compare HCAHPS scores to directly observed measures of physician communication skills. The lack of association between the 2 should sound a cautionary note to hospitals who seek to tie individual compensation to HCAHPS scores to improve them. In particular, the survey asks for a rating for all the patient’s doctors, not just the primary hospitalist. We found that, for hospital stays with just 1 hospitalist, the HCAHPS score reflected observed expression of empathy, although the correlation was only moderate, and HCAHPS were not correlated with other communication skills. Of all communication skills, empathy may be most important. Almost the entire body of research on physician communication cites empathy as a central skill. Empathy improves patient outcomes1-9,13-14,16-18,42 such as adherence to treatment, loyalty, and perception of care; and provider outcomes10-12,15 such as reduced burnout and a decreased likelihood of malpractice litigation.
It is less clear why other communication skills did not correlate with HCAHPS, but several differences in the measures themselves and how they were obtained might be responsible. It is possible that HCAHPS measures something broader than physician communication. In addition, the 4HCS was developed and normed on outpatient encounters as is true for virtually all doctor-patient coding schemes.43 Little is known about inpatient communication best practices. The timing of HCAHPS may also degrade the relationship between observed and reported communication. The HCAHPS questionnaires, collected after discharge, are retrospective reconstructions that are subject to recall bias and recency effects.44,45 In contrast, our observations took place in real time and were specific to the face-to-face interactions that take place when physicians engage patients at the bedside. Third, the response rate for HCAHPS surveys is only 30%, leading to potential sample bias.46 Respondents represent discharged patients who are willing and able to answer surveys, and may not be representative of all hospitalized patients. Finally, as with all global questions, the meaning any individual patient assigns to terms like “respect” may vary.
Our study has several limitations. The HCAHPS and 4HCS scores were not obtained from the same sample of patients. It is possible that the patients who were observed were not representative of the patients who completed the HCAHPS surveys. In addition, the only type of encounter observed was the initial visit between the hospitalist and the patient, and did not include communication during follow-up visits or on the day of discharge. However, there was a strong ICC among the 4HCS scores, implying that the 4HCS measures an inherent physician skill, which should be consistent across patients and encounters. Coding bias of the habits by a single observer could not be excluded. High intra-class correlation could be due in part to observer preferences for particular communication styles. Our sample included only 28 physicians. Although our study was powered to rule out a moderate correlation between 4HCS scores and HCAHPS scores (Pearson correlation coefficient greater than 0.5), we cannot exclude weaker correlations. Most correlations that we observed were so small that they would not be clinically meaningful, even in a much larger sample.
CONCLUSIONS
Our findings that HCAHPS scores did not correlate with the communication skills of the attending of record have some important implications. In an environment of value-based purchasing, most hospital systems are interested in identifying modifiable provider behaviors that optimize efficiency and payment structures. This study shows that directly measured communication skills do not correlate with HCAHPS scores as generally reported, indicating that HCAHPS may be measuring a broader domain than only physician communication skills. Better attribution based on the proportion of care provided by an individual physician could make the scores more useful for individual comparisons, but most institutions do not report their data in this way. Given this limitation, hospitals should refrain from comparing and incentivizing individual physicians based on their HCAHPS scores, because this measure was not designed for this purpose and does not appear to reflect an individual’s skills. This is important in the current environment in which hospitals face substantial penalties for underperformance but lack specific tools to improve their scores. Furthermore, there is concern that this type of measurement creates perverse incentives that may adversely alter clinical practice with the aim of improving scores.46
Training clinicians in communication and teaming skills is one potential means of increasing overall scores.15 Improving doctor-patient and team relationships is also the right thing to do. It is increasingly being demanded by patients and has always been a deep source of satisfaction for physicians.15,47 Moreover, there is an increasingly robust literature that relates face-to-face communication to biomedical and psychosocial outcomes of care.48 Identifying individual physicians who need help with communication skills is a worthwhile goal. Unfortunately, the HCAHPS survey does not appear to be the appropriate tool for this purpose.
Disclosure
The Cleveland Clinic Foundation, Division of Clinical Research, Research Programs Committees provided funding support. No funding source had any role in the study design; in the collection, analysis, and interpretation of data; in the writing of the report; or in the decision to submit the article for publication. The authors have no conflicts of interest for this study.
1. Glass RM. The patient-physician relationship. JAMA focuses on the center of medicine. JAMA. 1996;275(2):147-148. PubMed
2. Stein T, Frankel RM, Krupat E. Enhancing clinician communication skills in a large healthcare organization: a longitudinal case study. Patient Educ Couns. 2005;58(1):4-12. PubMed
3. Stewart M, Brown JB, Donner A, et al. The impact of patient-centered care on outcomes. J Fam Pract. 2000;49(9):796-804. PubMed
4. Safran DG, Taira DA, Rogers WH, Kosinski M, Ware JE, Tarlov AR. Linking primary care performance to outcomes of care. J Fam Pract. 1998;47(3):213-220. PubMed
5. Like R, Zyzanski SJ. Patient satisfaction with the clinical encounter: social psychological determinants. Soc Sci Med. 1987;24(4):351-357. PubMed
6. Williams S, Weinman J, Dale J. Doctor-patient communication and patient satisfaction: a review. Fam Pract. 1998;15(5):480-492. PubMed
7. Ciechanowski P, Katon WJ. The interpersonal experience of health care through the eyes of patients with diabetes. Soc Sci Med. 2006;63(12):3067-3079. PubMed
8. Stewart MA. Effective physician-patient communication and health outcomes: a review. CMAJ. 1995;152(9):1423-1433. PubMed
9. Hojat M, Louis DZ, Markham FW, Wender R, Rabinowitz C, Gonnella JS. Physicians’ empathy and clinical outcomes for diabetic patients. Acad Med. 2011;86(3):359-364. PubMed
10. Levinson W, Roter DL, Mullooly JP, Dull VT, Frankel RM. Physician-patient communication. The relationship with malpractice claims among primary care physicians and surgeons. JAMA. 1997;277(7):553-559. PubMed
11. Ambady N, Laplante D, Nguyen T, Rosenthal R, Chaumeton N, Levinson W. Surgeons’ tone of voice: a clue to malpractice history. Surgery. 2002;132(1):5-9. PubMed
12. Weng HC, Hung CM, Liu YT, et al. Associations between emotional intelligence and doctor burnout, job satisfaction and patient satisfaction. Med Educ. 2011;45(8):835-842. PubMed
13. Mauksch LB, Dugdale DC, Dodson S, Epstein R. Relationship, communication, and efficiency in the medical encounter: creating a clinical model from a literature review. Arch Intern Med. 2008;168(13):1387-1395. PubMed
14. Suchman AL, Roter D, Green M, Lipkin M Jr. Physician satisfaction with primary care office visits. Collaborative Study Group of the American Academy on Physician and Patient. Med Care. 1993;31(12):1083-1092. PubMed
15. Boissy A, Windover AK, Bokar D, et al. Communication skills training for physicians improves patient satisfaction. J Gen Intern Med. 2016;31(7):755-761. PubMed
16. Brody DS, Miller SM, Lerman CE, Smith DG, Lazaro CG, Blum MJ. The relationship between patients’ satisfaction with their physicians and perceptions about interventions they desired and received. Med Care. 1989;27(11):1027-1035. PubMed
17. Wasserman RC, Inui TS, Barriatua RD, Carter WB, Lippincott P. Pediatric clinicians’ support for parents makes a difference: an outcome-based analysis of clinician-parent interaction. Pediatrics. 1984;74(6):1047-1053. PubMed
18. Greenfield S, Kaplan S, Ware JE Jr. Expanding patient involvement in care. Effects on patient outcomes. Ann Intern Med. 1985;102(4):520-528. PubMed
19. Inui TS, Carter WB. Problems and prospects for health services research on provider-patient communication. Med Care. 1985;23(5):521-538. PubMed
20. Beckman H, Frankel R, Kihm J, Kulesza G, Geheb M. Measurement and improvement of humanistic skills in first-year trainees. J Gen Intern Med. 1990;5(1):42-45. PubMed
21. Keller S, O’Malley AJ, Hays RD, et al. Methods used to streamline the CAHPS Hospital Survey. Health Serv Res. 2005;40(6 pt 2):2057-2077. PubMed
22. Engel GL. The clinical application of the biopsychosocial model. Am J Psychiatry. 1980;137(5):535-544. PubMed
23. Lazare A, Eisenthal S, Wasserman L. The customer approach to patienthood. Attending to patient requests in a walk-in clinic. Arch Gen Psychiatry. 1975;32(5):553-558. PubMed
24. Eisenthal S, Lazare A. Evaluation of the initial interview in a walk-in clinic. The clinician’s perspective on a “negotiated approach”. J Nerv Ment Dis. 1977;164(1):30-35. PubMed
25. Kravitz RL, Callahan EJ, Paterniti D, Antonius D, Dunham M, Lewis CE. Prevalence and sources of patients’ unmet expectations for care. Ann Intern Med. 1996;125(9):730-737. PubMed
26. Froehlich GW, Welch HG. Meeting walk-in patients’ expectations for testing. Effects on satisfaction. J Gen Intern Med. 1996;11(8):470-474. PubMed
27. DiMatteo MR, Taranta A, Friedman HS, Prince LM. Predicting patient satisfaction from physicians’ nonverbal communication skills. Med Care. 1980;18(4):376-387. PubMed
28. Frankel RM, Stein T. Getting the most out of the clinical encounter: the four habits model. J Med Pract Manage. 2001;16(4):184-191. PubMed
29. Krupat E, Frankel R, Stein T, Irish J. The Four Habits Coding Scheme: validation of an instrument to assess clinicians’ communication behavior. Patient Educ Couns. 2006;62(1):38-45. PubMed
30. Fossli Jensen B, Gulbrandsen P, Benth JS, Dahl FA, Krupat E, Finset A. Interrater reliability for the Four Habits Coding Scheme as part of a randomized controlled trial. Patient Educ Couns. 2010;80(3):405-409. PubMed
31. Giordano LA, Elliott MN, Goldstein E, Lehrman WG, Spencer PA. Development, implementation, and public reporting of the HCAHPS survey. Med Care Res Rev. 2010;67(1):27-37. PubMed
32. Anonymous. CMS continues to shift emphasis to quality of care. Hosp Case Manag. 2012;20(10):150-151. PubMed
33. The R.E.D.E. Model 2015. Cleveland Clinic Center for Excellence in Healthcare
Communication. http://healthcarecommunication.info/. Accessed April 3 2016.
34. Empathetics, Inc. A Boston-based empathy training firm raises $1.5 million in
Series A Financing 2015. Empathetics Inc. http://www.prnewswire.com/news-releases/
empathetics-inc----a-boston-based-empathy-training-firm-raises-15-million-
in-series-a-financing-300072696.html). Accessed April 3, 2016.
35. Intensive Communication Skills 2016. Institute for Healthcare Communication.
http://healthcarecomm.org/. Accessed April 3, 2016.
36. Hu B, Palta M, Shao J. Variability explained by covariates in linear mixed-effect
models for longitudinal data. Canadian Journal of Statistics. 2010;38:352-368.
37. O’Malley AJ, Zaslavsky AM, Elliott MN, Zaborski L, Cleary PD. Case-mix adjustment
of the CAHPS Hospital Survey. Health Serv Res. 2005;40(6 pt 2):2162-2181. PubMed
38. O’Malley AJ, Zaslavsky AM, Hays RD, Hepner KA, Keller S, Cleary PD. Exploratory
factor analyses of the CAHPS Hospital Pilot Survey responses across
and within medical, surgical, and obstetric services. Health Serv Res. 2005;40(6 pt
2):2078-2095. PubMed
39. Goldstein E, Farquhar M, Crofton C, Darby C, Garfinkel S. Measuring hospital
care from the patients’ perspective: an overview of the CAHPS Hospital Survey
development process. Health Serv Res. 2005;40(6 pt 2):1977-1995. PubMed
40. Darby C, Hays RD, Kletke P. Development and evaluation of the CAHPS hospital
survey. Health Serv Res. 2005;40(6 pt 2):1973-1976. PubMed
41. Keller VF, Carroll JG. A new model for physician-patient communication. Patient
Educ Couns. 1994;23(2):131-140. PubMed
42. Quirk M, Mazor K, Haley HL, et al. How patients perceive a doctor’s caring attitude.
Patient Educ Couns. 2008;72(3):359-366. PubMed
43. Frankel RM, Levinson W. Back to the future: Can conversation analysis be used
to judge physicians’ malpractice history? Commun Med. 2014;11(1):27-39. PubMed
44. Furnham A. Response bias, social desirability and dissimulation. Personality and
individual differences 1986;7(3):385-400.
45. Shteingart H, Neiman T, Loewenstein Y. The role of first impression in operant
learning. J Exp Psychol Gen. 2013;142(2):476-488. PubMed
46. Tefera L, Lehrman WG, Conway P. Measurement of the patient experience: clarifying
facts, myths, and approaches. JAMA. 2016;315(2):2167-2168. PubMed
47. Horowitz CR, Suchman AL, Branch WT Jr, Frankel RM. What do doctors find
meaningful about their work? Ann Intern Med. 2003;138(9):772-775. PubMed
48. Rao JK, Anderson LA, Inui TS, Frankel RM. Communication interventions make
a difference in conversations between physicians and patients: a systematic review
of the evidence. Med Care. 2007;45(4):340-349. PubMed
Communication is the foundation of medical care.1 Effective communication can improve health outcomes, safety, adherence, satisfaction, trust, and enable genuine informed consent and decision-making.2-9 Furthermore, high-quality communication increases provider engagement and workplace satisfaction, while reducing stress and malpractice risk.10-15
Direct measurement of communication in the healthcare setting can be challenging. The “Four Habits Model,” which is derived from a synthesis of empiric studies8,16-20 and theoretical models21-24 of communication, offers 1 framework for assessing healthcare communication. The conceptual model underlying the 4 habits has been validated in studies of physician and patient satisfaction.1,4,25-27 The 4 habits are: investing in the beginning, eliciting the patient’s perspective, demonstrating empathy, and investing in the end. Each habit is divided into several identifiable tasks or skill sets, which can be reliably measured using validated tools and checklists.28 One such instrument, the Four Habits Coding Scheme (4HCS), has been evaluated against other tools and demonstrated overall satisfactory inter-rater reliability and validity.29,30
The Hospital Consumer Assessment of Healthcare Providers and Systems (HCAHPS) survey, developed under the direction of the Centers for Medicare and Medicaid Services (CMS) and the Agency for Healthcare Research and Quality, is an established national standard for measuring patient perceptions of care. HCAHPS retrospectively measures global perceptions of communication, support and empathy from physicians and staff, processes of care, and the overall patient experience. HCAHPS scores were first collected nationally in 2006 and have been publicly reported since 2008.31 With the introduction of value-based purchasing in 2012, health system revenues are now tied to HCAHPS survey performance.32 As a result, hospitals are financially motivated to improve HCAHPS scores but lack evidence-based methods for doing so. Some healthcare organizations have invested in communication training programs based on the available literature and best practices.2,33-35 However, it is not known how, if at all, HCAHPS scores relate to physicians’ real-time observed communication skills.
To examine the relationship between physician communication, as reported by global HCAHPS scores, and the quality of physician communication skills in specific encounters, we observed hospitalist physicians during inpatient bedside rounds and measured their communication skills using the 4HCS.
METHODS
Study Design
The study utilized a cross sectional design; physicians who consented were observed on rounds during 3 separate encounters, and we compared hospitalists’ 4HCS scores to their HCAHPS scores to assess the correlation. The study was approved by the Institutional Review Board of the Cleveland Clinic.
Population
The study was conducted at the main campus of the Cleveland Clinic. All physicians specializing in hospital medicine who had received 10 or more completed HCAHPS survey responses while rounding on a medicine service in the past year were invited to participate in the study. Participation was voluntary; night hospitalists were excluded. A research nurse was trained in the Four Habits Model28 and in the use of the 4HCS coding scheme by the principal investigator. The nurse observed each physician and ascertained the presence of communication behaviors using the 4HCS tool. Physicians were observed between August 2013 and August 2014. Multiple observations per physician could occur on the same day, but only 1 observation per patient was used for analysis. Observations consisted of a physician’s first encounter with a hospitalized patient, with the patient’s consent. Observations were conducted during encounters with English-speaking and cognitively intact patients only. Resident physicians were permitted to stay and conduct rounds per their normal routine. Patient information was not collected as part of the study.
Measures
HCAHPS. For each physician, we extracted all HCAHPS scores that were collected from our hospital’s Press Ganey database. The HCAHPS survey contains 22 core questions divided into 7 themes or domains, 1 of which is doctor communication. The survey uses frequency-based questions with possible answers fixed on a 4-point scale (4=always, 3=usually, 2=sometimes, 1=never). Our primary outcome was the doctor communication domain, which comprises 3 questions: 1) During this hospital stay, how often did the doctors treat you with respect? 2) During this hospital stay, how often did the doctors listen to you? and 3) During this hospital stay, how often did the doctors explain things in a language you can understand? Because CMS counts only the percentage of responses that are graded “always,” so-called “top box” scoring, we used the same measure.
The HCAHPS scores are always attributed to the physician at the time of discharge even if he may not have been responsible for the care of the patient during the entire hospital course. To mitigate contamination from patients seen by multiple providers, we cross-matched length of stay (LOS) data with billing data to determine the proportion of days a patient was seen by a single provider during the entire length of stay. We stratified patients seen by the attending providers to less than 50%, 50% to less than 100%, and at 100% of the LOS. However, we were unable to identify which patients were seen by other consultants or by residents due to limitations in data gathering and the nature of the database.
The Four Habits. The Four Habits are: invest in the beginning, elicit the patient’s perspective, demonstrate empathy, and invest in the end (Figure 1). Specific behaviors for Habits 1 to 4 are outlined in the Appendix, but we will briefly describe the themes as follows. Habit 1, invest in the beginning, describes the ability of the physician to set a welcoming environment for the patient, establish rapport, and collaborate on an agenda for the visit. Habit 2, elicit the patient’s perspective, describes the ability of the physician to explore the patients’ worries, ideas, expectations, and the impact of the illness on their lifestyle. Habit 3, demonstrate empathy, describes the physician’s openness to the patient’s emotions as well as the ability to explore, validate; express curiosity, and openly accept these feelings. Habit 4, invest in the end, is a measure of the physician’s ability to counsel patients in a language built around their original concerns or worries, as well as the ability to check the patients’ understanding of the plan.2,29-30
4HCS. The 4HCS tool (Appendix) measures discreet behaviors and phrases based on each of the Four Habits (Figure 1). With a scoring range from a low of 4 to a high of 20, the rater at bedside assigns a range of points on a scale of 1 to 5 for each habit. It is an instrument based on a teaching model used widely throughout Kaiser Permanente to improve clinicians’ communication skills. The 4HCS was first tested for interrater reliability and validity against the Roter Interaction Analysis System using 100 videotaped primary care physician encounters.29 It was further evaluated in a randomized control trial. Videotapes from 497 hospital encounters involving 71 doctors from a variety of clinical specialties were rated by 4 trained raters using the coding scheme. The total score Pearson’s R and intraclass correlation coefficient (ICC) exceeded 0.70 for all pairs of raters, and the interrater reliability was satisfactory for the 4HCS as applied to heterogeneous material.30
STATISTICAL ANALYSIS
Physician characteristics were summarized with standard descriptive statistics. Pearson correlation coefficients were computed between HCAHPS and 4HCS scores. All analyses were performed with RStudio (Boston, MA). The Pearson correlation between the averaged HCAHPS and 4HCS scores was also computed. A correlation with a P value less than 0.05 was considered statistically significant. With 28 physicians, the study had a power of 88% to detect a moderate correlation (greater than 0.50) with a 2-sided alpha of 0.05. We also computed the correlations based on the subgroups of data with patients seen by providers for less than 50%, 50% to less than 100%, and 100% of LOS. All analyses were conducted in SAS 9.2 (SAS Institute Inc., Cary, NC).36
RESULTS
There were 31 physicians who met our inclusion criteria. Of 29 volunteers, 28 were observed during 3 separate inpatient encounters and made up the final sample. A total of 1003 HCAHPS survey responses were available for these physicians. Participants were predominantly female (60.7%), with an average age of 39 years. They were in practice for an average of 4 years (12 were in practice more than 5 years), and 9 were observed on a teaching rotation.
The means of the overall 4HCS scores per observation were 17.39 ± 2.33 for the first, 17.00 ± 2.37 for the second, and 17.43 ± 2.36 for third bedside observation. The mean 4HCS scores per observation, broken down by habit, appear in Table 1. The ICC among the repeated scores within the same physician was 0.81. The median number of HCAHPS survey returns was 32 (range = [8, 85], with mean = 35.8, interquartile range = [16, 54]). The median overall HCAHPS doctor communication score was 89.6 (range = 80.9-93.7). Participants scored the highest in the respect subdomain and the lowest in the explain subdomain. Median HCAHPS scores and ranges appear in Table 2.
Because there were no significant associations between 4HCS scores or HCAHPS scores and physician age, sex, years in practice, or teaching site, correlations were not adjusted. Figure 2A and 2B show the association between mean 4HCS scores and HCAHPS scores by physician. There was no significant correlation between overall 4HCS and HCAHPS doctor communication scores (Pearson correlation coefficient 0.098; 95% confidence interval [CI], -0.285, 0.455). The individual habits also were not correlated with overall HCAHPS scores or with their corresponding HCAHPS domain (Table 3).
For 325 patients, 1 hospitalist was present for the entire LOS. In sensitivity analysis limiting observations to these patients (Figure 2C, Figure 2D, Table 3), we found a moderate correlation between habit 3 and the HCAHPS respect score (Pearson correlation coefficient 0.515; 95% CI, 0.176, 0.745; P = 0.005), and a weaker correlation between habit 3 and the HCAHPS overall doctor communication score (0.442; 95% CI, 0.082, 0.7; P = 0.019). There were no other significant correlations between specific habits and HCAHPS scores.
DISCUSSION
In this observational study of hospitalist physicians at a large tertiary care center, we found that communication skills, as measured by the 4HCS, varied substantially among physicians but were highly correlated within patients of the same physician. However, there was virtually no correlation between the attending physician of record’s 4HCS scores and their HCAHPS communication scores. When we limited our analysis to patients who saw only 1 hospitalist throughout their stay, there were moderate correlations between demonstration of empathy and both the HCAHPS respect score and overall doctor communication score. There were no trends across the strata of hospitalist involvement. It is important to note that the addition of even 1 different hospitalist to the LOS removes any association. Habits 1 and 2 are close to significance in the 100% subgroup, with a weak correlation. Interestingly, Habit 4, which focuses on creating a plan with the patient, showed no correlation at all with patients reporting that doctors explained things in language they could understand.
Development and testing of the HCAHPS survey began in 2002, commissioned by CMS and the Agency for Healthcare Research and Quality for the purpose of measuring patient experience in the hospital. The HCAHPS survey was endorsed by the National Quality Forum in 2005, with final approval of the national implementation granted by the Office of Management and Budget later that year. The CMS began implementation of the HCAHPS survey in 2006, with the first required public reporting of all hospitals taking place in March 2008.37-41 Based on CMS’ value-based purchasing initiative, hospitals with low HCAHPS scores have faced substantial penalties since 2012. Under these circumstances, it is important that the HCAHPS measures what it purports to measure. Because HCAHPS was designed to compare hospitals, testing was limited to assessment of internal reliability, hospital-level reliability, and construct validity. External validation with known measures of physician communication was not performed.41 Our study appears to be the first to compare HCAHPS scores to directly observed measures of physician communication skills. The lack of association between the 2 should sound a cautionary note to hospitals who seek to tie individual compensation to HCAHPS scores to improve them. In particular, the survey asks for a rating for all the patient’s doctors, not just the primary hospitalist. We found that, for hospital stays with just 1 hospitalist, the HCAHPS score reflected observed expression of empathy, although the correlation was only moderate, and HCAHPS were not correlated with other communication skills. Of all communication skills, empathy may be most important. Almost the entire body of research on physician communication cites empathy as a central skill. Empathy improves patient outcomes1-9,13-14,16-18,42 such as adherence to treatment, loyalty, and perception of care; and provider outcomes10-12,15 such as reduced burnout and a decreased likelihood of malpractice litigation.
It is less clear why other communication skills did not correlate with HCAHPS, but several differences in the measures themselves and how they were obtained might be responsible. It is possible that HCAHPS measures something broader than physician communication. In addition, the 4HCS was developed and normed on outpatient encounters as is true for virtually all doctor-patient coding schemes.43 Little is known about inpatient communication best practices. The timing of HCAHPS may also degrade the relationship between observed and reported communication. The HCAHPS questionnaires, collected after discharge, are retrospective reconstructions that are subject to recall bias and recency effects.44,45 In contrast, our observations took place in real time and were specific to the face-to-face interactions that take place when physicians engage patients at the bedside. Third, the response rate for HCAHPS surveys is only 30%, leading to potential sample bias.46 Respondents represent discharged patients who are willing and able to answer surveys, and may not be representative of all hospitalized patients. Finally, as with all global questions, the meaning any individual patient assigns to terms like “respect” may vary.
Our study has several limitations. The HCAHPS and 4HCS scores were not obtained from the same sample of patients. It is possible that the patients who were observed were not representative of the patients who completed the HCAHPS surveys. In addition, the only type of encounter observed was the initial visit between the hospitalist and the patient, and did not include communication during follow-up visits or on the day of discharge. However, there was a strong ICC among the 4HCS scores, implying that the 4HCS measures an inherent physician skill, which should be consistent across patients and encounters. Coding bias of the habits by a single observer could not be excluded. High intra-class correlation could be due in part to observer preferences for particular communication styles. Our sample included only 28 physicians. Although our study was powered to rule out a moderate correlation between 4HCS scores and HCAHPS scores (Pearson correlation coefficient greater than 0.5), we cannot exclude weaker correlations. Most correlations that we observed were so small that they would not be clinically meaningful, even in a much larger sample.
CONCLUSIONS
Our findings that HCAHPS scores did not correlate with the communication skills of the attending of record have some important implications. In an environment of value-based purchasing, most hospital systems are interested in identifying modifiable provider behaviors that optimize efficiency and payment structures. This study shows that directly measured communication skills do not correlate with HCAHPS scores as generally reported, indicating that HCAHPS may be measuring a broader domain than only physician communication skills. Better attribution based on the proportion of care provided by an individual physician could make the scores more useful for individual comparisons, but most institutions do not report their data in this way. Given this limitation, hospitals should refrain from comparing and incentivizing individual physicians based on their HCAHPS scores, because this measure was not designed for this purpose and does not appear to reflect an individual’s skills. This is important in the current environment in which hospitals face substantial penalties for underperformance but lack specific tools to improve their scores. Furthermore, there is concern that this type of measurement creates perverse incentives that may adversely alter clinical practice with the aim of improving scores.46
Training clinicians in communication and teaming skills is one potential means of increasing overall scores.15 Improving doctor-patient and team relationships is also the right thing to do. It is increasingly being demanded by patients and has always been a deep source of satisfaction for physicians.15,47 Moreover, there is an increasingly robust literature that relates face-to-face communication to biomedical and psychosocial outcomes of care.48 Identifying individual physicians who need help with communication skills is a worthwhile goal. Unfortunately, the HCAHPS survey does not appear to be the appropriate tool for this purpose.
Disclosure
The Cleveland Clinic Foundation, Division of Clinical Research, Research Programs Committees provided funding support. No funding source had any role in the study design; in the collection, analysis, and interpretation of data; in the writing of the report; or in the decision to submit the article for publication. The authors have no conflicts of interest for this study.
1. Glass RM. The patient-physician relationship. JAMA focuses on the center of medicine. JAMA. 1996;275(2):147-148. PubMed
2. Stein T, Frankel RM, Krupat E. Enhancing clinician communication skills in a large healthcare organization: a longitudinal case study. Patient Educ Couns. 2005;58(1):4-12. PubMed
3. Stewart M, Brown JB, Donner A, et al. The impact of patient-centered care on outcomes. J Fam Pract. 2000;49(9):796-804. PubMed
4. Safran DG, Taira DA, Rogers WH, Kosinski M, Ware JE, Tarlov AR. Linking primary care performance to outcomes of care. J Fam Pract. 1998;47(3):213-220. PubMed
5. Like R, Zyzanski SJ. Patient satisfaction with the clinical encounter: social psychological determinants. Soc Sci Med. 1987;24(4):351-357. PubMed
6. Williams S, Weinman J, Dale J. Doctor-patient communication and patient satisfaction: a review. Fam Pract. 1998;15(5):480-492. PubMed
7. Ciechanowski P, Katon WJ. The interpersonal experience of health care through the eyes of patients with diabetes. Soc Sci Med. 2006;63(12):3067-3079. PubMed
8. Stewart MA. Effective physician-patient communication and health outcomes: a review. CMAJ. 1995;152(9):1423-1433. PubMed
9. Hojat M, Louis DZ, Markham FW, Wender R, Rabinowitz C, Gonnella JS. Physicians’ empathy and clinical outcomes for diabetic patients. Acad Med. 2011;86(3):359-364. PubMed
10. Levinson W, Roter DL, Mullooly JP, Dull VT, Frankel RM. Physician-patient communication. The relationship with malpractice claims among primary care physicians and surgeons. JAMA. 1997;277(7):553-559. PubMed
11. Ambady N, Laplante D, Nguyen T, Rosenthal R, Chaumeton N, Levinson W. Surgeons’ tone of voice: a clue to malpractice history. Surgery. 2002;132(1):5-9. PubMed
12. Weng HC, Hung CM, Liu YT, et al. Associations between emotional intelligence and doctor burnout, job satisfaction and patient satisfaction. Med Educ. 2011;45(8):835-842. PubMed
13. Mauksch LB, Dugdale DC, Dodson S, Epstein R. Relationship, communication, and efficiency in the medical encounter: creating a clinical model from a literature review. Arch Intern Med. 2008;168(13):1387-1395. PubMed
14. Suchman AL, Roter D, Green M, Lipkin M Jr. Physician satisfaction with primary care office visits. Collaborative Study Group of the American Academy on Physician and Patient. Med Care. 1993;31(12):1083-1092. PubMed
15. Boissy A, Windover AK, Bokar D, et al. Communication skills training for physicians improves patient satisfaction. J Gen Intern Med. 2016;31(7):755-761. PubMed
16. Brody DS, Miller SM, Lerman CE, Smith DG, Lazaro CG, Blum MJ. The relationship between patients’ satisfaction with their physicians and perceptions about interventions they desired and received. Med Care. 1989;27(11):1027-1035. PubMed
17. Wasserman RC, Inui TS, Barriatua RD, Carter WB, Lippincott P. Pediatric clinicians’ support for parents makes a difference: an outcome-based analysis of clinician-parent interaction. Pediatrics. 1984;74(6):1047-1053. PubMed
18. Greenfield S, Kaplan S, Ware JE Jr. Expanding patient involvement in care. Effects on patient outcomes. Ann Intern Med. 1985;102(4):520-528. PubMed
19. Inui TS, Carter WB. Problems and prospects for health services research on provider-patient communication. Med Care. 1985;23(5):521-538. PubMed
20. Beckman H, Frankel R, Kihm J, Kulesza G, Geheb M. Measurement and improvement of humanistic skills in first-year trainees. J Gen Intern Med. 1990;5(1):42-45. PubMed
21. Keller S, O’Malley AJ, Hays RD, et al. Methods used to streamline the CAHPS Hospital Survey. Health Serv Res. 2005;40(6 pt 2):2057-2077. PubMed
22. Engel GL. The clinical application of the biopsychosocial model. Am J Psychiatry. 1980;137(5):535-544. PubMed
23. Lazare A, Eisenthal S, Wasserman L. The customer approach to patienthood. Attending to patient requests in a walk-in clinic. Arch Gen Psychiatry. 1975;32(5):553-558. PubMed
24. Eisenthal S, Lazare A. Evaluation of the initial interview in a walk-in clinic. The clinician’s perspective on a “negotiated approach”. J Nerv Ment Dis. 1977;164(1):30-35. PubMed
25. Kravitz RL, Callahan EJ, Paterniti D, Antonius D, Dunham M, Lewis CE. Prevalence and sources of patients’ unmet expectations for care. Ann Intern Med. 1996;125(9):730-737. PubMed
26. Froehlich GW, Welch HG. Meeting walk-in patients’ expectations for testing. Effects on satisfaction. J Gen Intern Med. 1996;11(8):470-474. PubMed
27. DiMatteo MR, Taranta A, Friedman HS, Prince LM. Predicting patient satisfaction from physicians’ nonverbal communication skills. Med Care. 1980;18(4):376-387. PubMed
28. Frankel RM, Stein T. Getting the most out of the clinical encounter: the four habits model. J Med Pract Manage. 2001;16(4):184-191. PubMed
29. Krupat E, Frankel R, Stein T, Irish J. The Four Habits Coding Scheme: validation of an instrument to assess clinicians’ communication behavior. Patient Educ Couns. 2006;62(1):38-45. PubMed
30. Fossli Jensen B, Gulbrandsen P, Benth JS, Dahl FA, Krupat E, Finset A. Interrater reliability for the Four Habits Coding Scheme as part of a randomized controlled trial. Patient Educ Couns. 2010;80(3):405-409. PubMed
31. Giordano LA, Elliott MN, Goldstein E, Lehrman WG, Spencer PA. Development, implementation, and public reporting of the HCAHPS survey. Med Care Res Rev. 2010;67(1):27-37. PubMed
32. Anonymous. CMS continues to shift emphasis to quality of care. Hosp Case Manag. 2012;20(10):150-151. PubMed
33. The R.E.D.E. Model 2015. Cleveland Clinic Center for Excellence in Healthcare
Communication. http://healthcarecommunication.info/. Accessed April 3 2016.
34. Empathetics, Inc. A Boston-based empathy training firm raises $1.5 million in
Series A Financing 2015. Empathetics Inc. http://www.prnewswire.com/news-releases/
empathetics-inc----a-boston-based-empathy-training-firm-raises-15-million-
in-series-a-financing-300072696.html). Accessed April 3, 2016.
35. Intensive Communication Skills 2016. Institute for Healthcare Communication.
http://healthcarecomm.org/. Accessed April 3, 2016.
36. Hu B, Palta M, Shao J. Variability explained by covariates in linear mixed-effect
models for longitudinal data. Canadian Journal of Statistics. 2010;38:352-368.
37. O’Malley AJ, Zaslavsky AM, Elliott MN, Zaborski L, Cleary PD. Case-mix adjustment
of the CAHPS Hospital Survey. Health Serv Res. 2005;40(6 pt 2):2162-2181. PubMed
38. O’Malley AJ, Zaslavsky AM, Hays RD, Hepner KA, Keller S, Cleary PD. Exploratory
factor analyses of the CAHPS Hospital Pilot Survey responses across
and within medical, surgical, and obstetric services. Health Serv Res. 2005;40(6 pt
2):2078-2095. PubMed
39. Goldstein E, Farquhar M, Crofton C, Darby C, Garfinkel S. Measuring hospital
care from the patients’ perspective: an overview of the CAHPS Hospital Survey
development process. Health Serv Res. 2005;40(6 pt 2):1977-1995. PubMed
40. Darby C, Hays RD, Kletke P. Development and evaluation of the CAHPS hospital
survey. Health Serv Res. 2005;40(6 pt 2):1973-1976. PubMed
41. Keller VF, Carroll JG. A new model for physician-patient communication. Patient
Educ Couns. 1994;23(2):131-140. PubMed
42. Quirk M, Mazor K, Haley HL, et al. How patients perceive a doctor’s caring attitude.
Patient Educ Couns. 2008;72(3):359-366. PubMed
43. Frankel RM, Levinson W. Back to the future: Can conversation analysis be used
to judge physicians’ malpractice history? Commun Med. 2014;11(1):27-39. PubMed
44. Furnham A. Response bias, social desirability and dissimulation. Personality and
individual differences 1986;7(3):385-400.
45. Shteingart H, Neiman T, Loewenstein Y. The role of first impression in operant
learning. J Exp Psychol Gen. 2013;142(2):476-488. PubMed
46. Tefera L, Lehrman WG, Conway P. Measurement of the patient experience: clarifying
facts, myths, and approaches. JAMA. 2016;315(2):2167-2168. PubMed
47. Horowitz CR, Suchman AL, Branch WT Jr, Frankel RM. What do doctors find
meaningful about their work? Ann Intern Med. 2003;138(9):772-775. PubMed
48. Rao JK, Anderson LA, Inui TS, Frankel RM. Communication interventions make
a difference in conversations between physicians and patients: a systematic review
of the evidence. Med Care. 2007;45(4):340-349. PubMed
© 2017 Society of Hospital Medicine
Preventing herpes zoster through vaccination: New developments
Herpes zoster (HZ), or shingles, represents a reactivation of the varicella-zoster virus (VZV). Following primary infection, usually in childhood, the virus typically lies dormant in the dorsal root and sensory nerve ganglia for decades. The precise mechanism of reactivation is not well understood, but it is associated with a decline in cell-mediated immunity that occurs with advancing age, immune-compromising conditions such as HIV infection and cancer, or immunosuppressive therapies, including corticosteroids.1 HZ is usually a self-limited disease characterized by unilateral dermatomal rash and pain, but can cause disseminated infection in immunocompromised individuals.2
Treatment with antiviral medications within 72 hours of rash onset can reduce acute HZ symptoms.1 However, antiviral agents are only minimally effective in preventing postherpetic neuralgia, the most common complication of HZ.3 Therefore, efforts to reduce the burden of HZ morbidity have focused on prevention through vaccination.
Currently, the only shingles vaccine approved by the US Food and Drug Administration (FDA) is Zostavax (Merck), which contains the live-attenuated Oka strain of VZV at a concentration 14 times greater than that of the varicella vaccine (Varivax, Merck). The live-attenuated vaccine boosts VZV-specific cell-mediated immunity, preventing reactivation of the latent virus.
In this article, we describe the burden of disease and review recent developments in the literature on HZ vaccine, including duration of efficacy, uptake and barriers to vaccination, cost-effectiveness, and the outlook for future vaccines.
INCIDENCE INCREASES WITH AGE
The incidence of herpes zoster in the general population is between 3 and 5 per 1,000 person-years4 and increases with age, especially after age 60 when the incidence can approach 13 to 15 per 1,000 person-years.5,6 An estimated 1 million new cases occur each year in the United States, and about 6% of patients experience a second episode of HZ within 8 years.7,8 In immunocompromised patients, the incidence of HZ is 2 to 10 times higher than in the general population.9
The incidence of HZ has been increasing for reasons that are unclear. After varicella vaccine was introduced into the routine childhood immunization schedule in 1995, it was hypothesized that the resultant decrease in primary varicella infections would remove a natural source of immune boosting and cause an increase in HZ incidence for up to 20 years.10 However, recent studies demonstrate that the observed increase in HZ incidence actually predates the introduction of varicella vaccine,11–13 and the widespread use of varicella vaccine has not resulted in an increase in the incidence of HZ.14
Other potential explanations for the rise in reported incidence include increasing awareness among patients, who might previously not have sought care and among physicians, who may be more likely to make the diagnosis. Advertisement of new treatments for HZ, including gabapentin and capsaicin, probably began to increase awareness in the 1990s, as did promotion of the HZ vaccine after its licensure in 2006.
HZ can occur in people who have been vaccinated against varicella due to reactivation of the vaccine-strain virus, but the risk is lower than after infection with wild-type varicella.15 Given that the varicella vaccine has been routinely used in children for only 20 years, the long-term effect of varicella vaccination on the incidence of HZ in elderly people is unknown.
Serious complications
HZ can cause rare but serious complications including encephalitis, herpes ophthalmicus, herpes oticus, myelitis, and retinitis.1 These can lead to long-term disability including unilateral blindness and deafness.
The most common and debilitating complication is postherpetic neuralgia, a persistent pain lasting at least 3 months, with a mean duration of 3.3 years and sometimes as long as 10 years.16 Postherpetic neuralgia occurs in 8% to 32% of patients after acute HZ,4 and the incidence increases with age, being most common after age 70. The chronic pain of postherpetic neuralgia has a significant adverse impact on patients’ quality of life, including physical disability and emotional distress.17 Some pain is intense, and anecdotal reports of patients committing suicide were included in the Advisory Committee on Immunization Practices (ACIP) recommendations regarding herpes zoster vaccine.18
HZ and its complications also impose a substantial economic burden on society.19 In a population-based study, the mean direct medical costs of HZ ranged from $620 to $1,160 (2015 dollars) depending on age,20 and the mean costs of postherpetic neuralgia were 2 to 5 times higher than that.20–22 Immunocompromised patients had costs 2 to 3 times higher than those of immunocompetent adults.23 In addition, for employed patients, HZ resulted in an average loss of 32 hours of work due to absenteeism and 84 hours due to presenteeism (ie, working while sick and therefore suboptimally).24
Assuming there are 1 million cases of HZ each year, if 8% to 32% of patients go on to develop postherpetic neuralgia, that would translate into approximately $1 to $2 billion in direct medical costs. With 60% of adult patients working,25 at an average wage of $23.23 per hour,26 HZ illness could be responsible for another $1.6 billion in lost productivity.
EFFICACY AND SAFETY OF HZ VACCINE
In 2006, the FDA approved the live-attenuated Oka strain VZV vaccine for prevention of HZ and postherpetic neuralgia in adults age 60 and older based on findings from the Shingles Prevention Study (SPS).27
The Shingles Prevention Study
This multicenter randomized placebo-controlled trial27 enrolled 38,546 immunocompetent persons age 60 and older. Subjects in the intervention group received a single dose of live-attenuated vaccine, and all participants were followed for up to 4.9 years after vaccination.
 vaccines")
HZ occurred in 315 (1.636%) of the 19,254 participants in the vaccine group and in 642 (3.336%) of the 19,247 participants in the placebo group, an absolute risk reduction of 1.7%, number needed to treat 59, relative risk reduction 51%, P < .001. Similarly, postherpetic neuralgia occurred in 27 (0.140%) of the 19,254 vaccine recipients and in 80 (0.416%) of the placebo recipients (an absolute risk reduction of 0.276%, number needed to treat 362, relative risk reduction 66%, P < .001). The investigators calculated that vaccination reduced the overall burden of illness by 61% (Table 1).
The efficacy against HZ incidence decreased with age,28 but the efficacy against postherpetic neuralgia did not. In addition, vaccine recipients who developed HZ generally had less severe manifestations.
The safety of the vaccine was assessed for all participants in the SPS. In addition, one-sixth of SPS participants were enrolled in a safety substudy. These participants completed a detailed report card regarding all medically important events within the first 42 days. Forty-eight percent of the vaccine group and 17% of the placebo group (P < .05) experienced adverse events, primarily at the injection site. Less than 1% of all local reactions were severe.29 Serious adverse events were rare (< 2%), but occurred significantly more often in the vaccinated group.
Short-Term Persistence Substudy
Short-term efficacy of the live-attenuated vaccine (up to 7 years) was assessed in the Short-Term Persistence Substudy (STPS), which involved 14,270 of the initial participants and reported yearly and overall vaccine efficacy.30 After 5 years, the yearly efficacy against postherpetic neuralgia incidence declined to 32% and was no longer statistically significant. Efficacy against HZ incidence and burden of illness displayed the same pattern. After the end of the STPS, all subjects in the placebo group received vaccination.
Long-Term Persistence Substudy
Those in the intervention group were followed for an additional 4 years in the Long-Term Persistence Substudy (LTPS).31 Due to the lack of concurrent controls in the LTPS, the authors used regression models based on historical controls to estimate contemporary population incidence of HZ and postherpetic neuralgia for comparison.
Efficacy continued to decline over time, and by 10 years after vaccination there was no difference between vaccinated patients and historical controls in the rate of any end point (ie, efficacy declined to zero).
A trial of booster vaccination
Because many patients are vaccinated at age 60, waning immunity could leave them vulnerable to HZ and postherpetic neuralgia by age 70. A potential solution would be to give a booster dose after 10 years.
A recent phase 3 clinical trial of adults age 70 years and older found that a booster dose of live-attenuated vaccine was as safe and immunogenic as an initial dose.32 While antibody responses were similar in the boosted group and the newly vaccinated group, cell-mediated immunity was higher in the boosted group.
Because prevention of HZ is generally via cell-mediated immunity, the booster might be more effective than the initial vaccination, but clinical trials measuring actual cases prevented will be required to prove it. A booster dose is not currently recommended.
A trial of vaccination in adults 50 to 59
In 2011, the FDA extended its approval of HZ vaccine for use in adults ages 50 to 59.33
In a randomized, double-blind, placebo-controlled trial in this age group,33 the vaccine reduced HZ incidence by almost 70% (absolute risk reduction 0.614%, number needed to treat 156; Table 1), but the severity of HZ cases was not affected. There were too few cases of postherpetic neuralgia to assess the efficacy for this end point. The study followed patients for only 1.5 years after vaccination, so the duration of efficacy is unknown.
As in the older recipients, the vaccine was well tolerated; injection-site reactions and headache were the major adverse effects reported among vaccine recipients.33
INDICATIONS AND CONTRAINDICATIONS
Although HZ vaccine is licensed for use in adults age 50 and older, the ACIP recommends it only for immunocompetent adults age 60 and older. At this time, the ACIP does not recommend HZ vaccine in those younger than 60 because of the low risk of HZ in this age group.34
Any person age 60 or older should receive a single dose of the live-attenuated HZ vaccine subcutaneously, regardless of past history of HZ.
The vaccine is contraindicated in patients who have a history of allergic reaction to any vaccine component, immunosuppression or immunodeficiency conditions, and pregnancy. Specifically, people who will receive immunosuppressive therapies should have the vaccine at least 14 days before beginning treatment. Antiviral medications such as acyclovir, famciclovir, and valacyclovir should be discontinued at least 24 hours before vaccination and not resumed until 14 days later. Patients taking high-dose corticosteroids for more than 2 weeks should not be vaccinated until at least 1 month after therapy is completed.
In contrast, HZ vaccine is not contraindicated for leukemia patients who are in remission and who have not received chemotherapy or radiation for at least 3 months, or for patients receiving short-term, low-to-moderate dose, topical, intra-articular, bursal, or tendon injections of corticosteroids. Patients on low-dose methotrexate, azathioprine, or 6-mercaptopurine can also receive the vaccine.18
VACCINATION RATES ARE LOW

Although the vaccine has been recommended since 2008, uptake has been slow. Figure 1 shows the rate of HZ vaccination in adults age 60 and older surveyed in the National Health Interview Survey from 2007 to 2013.35 Eight years after the vaccine was licensed, only 28% of eligible patients had been vaccinated. Assuming the current rate of increase remains constant, it will take 7 more years to reach a 60% coverage rate—the same as for pneumococcal vaccine36—and 18 years to reach universal coverage.
Barriers to vaccination
Several barriers to HZ vaccination might account for the slow uptake.
For the first few years the vaccine was available, the requirement to store it frozen presented an obstacle for some physicians.37 Physicians may also have been discouraged by the cumbersome Medicare reimbursement process because while the administration fee is covered through Medicare Part B, the live-attenuated vaccine is reimbursed only through Medicare Part D, a benefit that varies by plans. Other barriers to physicians are supply shortages, high up-front costs, and uncertainties regarding the duration of vaccine protection, its safety, and side effects.38–40
Patient barriers include lack of physician recommendation, lack of familiarity with the vaccine, high out-of-pocket costs, the perception that they are at low risk for HZ, underestimation of the pain associated with HZ and postherpetic neuralgia, and fear of vaccine adverse effects.39,41,42
Interventions to increase vaccination rates
Certain interventions have been shown to increase vaccination adherence in general and HZ vaccination in particular. In randomized trials involving other vaccines, electronic medical record reminders supporting panel management or nurse-initiated protocols have been proven to increase vaccination rates, but these methods have not been tested for HZ vaccine specifically.43,44
In an observational study, Chaudhry et al found that the number of HZ vaccinations administered at the Mayo Clinic increased 43% in one practice and 54% in another after the implementation of an electronic alert.45 A randomized controlled trial showed that an informational package discussing HZ and the vaccine sent to patients via either their electronic personal health record or traditional mail increased HZ vaccination by almost 3 times.46
Pharmacists can also influence vaccination rates. States that provide full immunization privileges to pharmacists have vaccination rates significantly higher than states with restricted or no authorization.47
COST-EFFECTIVENESS CONSIDERATIONS
Unlike the Centers for Medicare and Medicaid Services, the ACIP does consider cost-effectiveness in their vaccine recommendations. Because of the morbidity associated with HZ and postherpetic neuralgia as well as the economic impact, vaccination is generally considered cost-effective for adults age 60 and older.48,49
Analyses have demonstrated that cost-effectiveness hinges on 4 factors: initial vaccine efficacy, the duration of efficacy, the age-specific incidence of HZ, and the cost of the vaccine.
For patients ages 50 to 59, the incidence of HZ is low, and because the duration of vaccine efficacy is short even though initial vaccine efficacy is high, vaccination in this age group offers poor value.50 At older ages, the incidence of HZ and postherpetic neuralgia rises, making vaccination more cost-effective. After age 60, the vaccine is cost-effective at all ages, although age 70 appears to offer the optimal trade-off between increasing incidence and declining vaccine efficacy.48,49
For patients who plan to be vaccinated only once, waiting until age 70 would appear to offer the best value.51 For those who are willing to receive a booster dose, the optimal age for vaccination is unknown, but will likely depend on the effectiveness, cost, and duration of the booster.
A NEW HZ VACCINE
In 2015, GlaxoSmithKline tested a new HZ vaccine containing a single VZV glycoprotein in an AS01B adjuvant system (HZ/su vaccine).52 In a phase 3 randomized trial involving 15,411 immunocompetent persons age 50 and older, a 2-dose schedule of HZ/su vaccine was 97% effective in preventing HZ (Table 1).53 Importantly, the vaccine was equally effective in older patients.
This vaccine also had a high rate of adverse reactions, with 17% of vaccine recipients vs 3% of placebo recipients reporting events that prevented normal everyday activities for at least 1 day. However, the rate of serious adverse reactions was the same in both groups (9%). The company announced that they intended to submit a regulatory application for HZ/su vaccine in the second half of 2016.54
Because of its high efficacy, HZ/su vaccine has the potential to change practice, but several issues must be resolved before it can supplant the current vaccine.
First, the AS01B adjuvant is not currently licensed in the United States, so it is unclear if the HZ/su vaccine can get FDA approval.52,55
Second, there are several questions about the efficacy of the vaccine, including long-term efficacy, efficacy in the elderly, and efficacy in the case of a patient receiving only 1 of the 2 required doses.
Third, the impact of HZ/su vaccine on complications such as postherpetic neuralgia has not been established. The clinical trial (NCT01165229) examining vaccine efficacy against postherpetic neuralgia incidence and other complications in adults age 70 and older has recently been completed and data should be available soon. Given the extremely high efficacy against HZ, it is likely that it will be close to 100% effective against this complication.
Fourth, there is uncertainty as to how the HZ/su vaccine should be used in patients who have already received the live-attenuated vaccine, if it is determined that a booster is necessary.
Finally, the vaccine is not yet priced. Given its superior effectiveness, particularly in older individuals, competitive pricing could dramatically affect the market. How Medicare or other insurers cover the new vaccine will likely influence its acceptance.
HZ VACCINATION OF IMMUNOCOMPROMISED PATIENTS
Immunocompromised patients are at highest risk for developing HZ. Unfortunately, there are currently no HZ vaccines approved for use in this population. The current live-attenuated vaccine has been demonstrated to be safe, well tolerated, and immunogenic in patients age 60 and older who are receiving chronic or maintenance low to moderate doses of corticosteroids.56
A clinical trial is being conducted to assess the immunogenicity, clinical effectiveness, and safety of the vaccine in rheumatoid arthritis patients receiving antitumor necrosis factor therapy (NCT01967316). Other trials are examining vaccine efficacy and safety in patients with solid organ tumors prior to chemotherapy (NCT02444936) and in patients who will be undergoing living donor kidney transplantation (NCT00940940). Researchers are also investigating the possibility of vaccinating allogeneic stem cell donors before donation in order to protect transplant recipients against HZ (NCT01573182).
ZVHT and HZ/su vaccination in immunocompromised patients
Heat-treated varicella-zoster vaccine (ZVHT) is a potential alternative for immunocompromised patients. A 4-dose regimen has been proven to reduce the risk of HZ in patients receiving autologous hematopoietic-cell transplants for non-Hodgkin or Hodgkin lymphoma.57
In another trial, the 4-dose ZVHT was safe and elicited significant VZV-specific T-cell response through 28 days in immunosuppressed patients with solid tumor malignancy, hematologic malignancy, human immunodeficiency virus infection with CD4 counts of 200 cells/mm3 or less, and autologous hematopoietic-cell transplants. The T-cell response was poor in allogeneic hematopoietic-cell transplant recipients, however.58
Because the HZ/su vaccine does not contain live virus, it seems particularly promising for immunocompromised patients. In phase 1 and 2 studies, a 3-dose regimen has been shown to be safe and immunogenic in hematopoietic-cell transplant recipients and HIV-infected adults with CD4 count higher than 200 cells/mm3.59,60 A phase 3 trial assessing the efficacy of HZ/su vaccine in autologous hematopoietic-cell transplant recipients is under way (NCT01610414). Changes in recommendations for HZ vaccine in these most vulnerable populations await the results of these studies.
- Dworkin RH, Johnson RW, Breuer J, et al. Recommendations for the management of herpes zoster. Clin Infect Dis 2007; 44(suppl 1):S1–S26.
- Johnson RW. Herpes zoster and postherpetic neuralgia. Expert Rev Vaccines 2010; 9(suppl):21–26.
- Chen N, Li Q, Yang J, Zhou M, Zhou D, He L. Antiviral treatment for preventing postherpetic neuralgia. Cochrane Database Syst Rev 2014; 2:CD006866.
- Kawai K, Gebremeskel BG, Acosta CJ. Systematic review of incidence and complications of herpes zoster: towards a global perspective. BMJ Open 2014; 4:e004833.
- Tseng HF, Smith N, Harpaz R, Bialek SR, Sy LS, Jacobsen SJ. Herpes zoster vaccine in older adults and the risk of subsequent herpes zoster disease. JAMA 2011; 305:160–166.
- Langan SM, Smeeth L, Margolis DJ, Thomas SL. Herpes zoster vaccine effectiveness against incident herpes zoster and post-herpetic neuralgia in an older US population: a cohort study. PLoS Med 2013; 10:e1001420.
- Yawn BP, Saddier P, Wollan PC, St. Sauver JL, Kurland MJ, Sy LS. A population-based study of the incidence and complication rates of herpes zoster before zoster vaccine introduction. Mayo Clin Proc 2007; 82:1341–1349.
- Yawn BP, Wollan PC, Kurland MJ, St. Sauver JL, Saddier P. Herpes zoster recurrences more frequent than previously reported. Mayo Clin Proc 2011; 86:88–93.
- Chen SY, Suaya JA, Li Q, et al. Incidence of herpes zoster in patients with altered immune function. Infection 2014; 42:325–334.
- Edmunds WJ, Brisson M. The effect of vaccination on the epidemiology of varicella zoster virus. J Infect 2002; 44:211–219.
- Hales CM, Harpaz R, Joesoef MR, Bialek SR. Examination of links between herpes zoster incidence and childhood varicella vaccination. Ann Intern Med 2013; 159:739–745.
- Leung J, Harpaz R, Molinari NA, Jumaan A, Zhou F. Herpes zoster incidence among insured persons in the United States, 1993-2006: evaluation of impact of varicella vaccination. Clin Infect Dis 2011; 52:332–340.
- Rimland D, Moanna A. Increasing incidence of herpes zoster among veterans. Clin Infect Dis 2010; 50:1000–1005.
- Jumaan AO, Yu O, Jackson LA, Bohlke K, Galil K, Seward JF. Incidence of herpes zoster, before and after varicella-vaccination-associated decreases in the incidence of varicella, 1992-2002. J Infect Dis 2005; 191:2002–2007.
- Plotkin SA, Starr SE, Connor K, Morton D. Zoster in normal children after varicella vaccine. J Infect Dis 1989; 159:1000–1001.
- Oster G, Harding G, Dukes E, Edelsberg J, Cleary PD. Pain, medication use, and health-related quality of life in older persons with postherpetic neuralgia: results from a population-based survey. J Pain 2005; 6:356–363.
- Johnson RW, Bouhassira D, Kassianos G, Leplege A, Schmader KE, Weinke T. The impact of herpes zoster and post-herpetic neuralgia on quality-of-life. BMC Med 2010; 8:37.
- Harpaz R, Ortega-Sanchez IR, Seward JF; Advisory Committee on Immunization Practices (ACIP) Centers for Disease Control and Prevention (CDC). Prevention of herpes zoster: recommendations of the Advisory Committee on Immunization Practices (ACIP). MMWR Recomm Rep 2008; 57:1–30.
- Panatto D, Bragazzi NL, Rizzitelli E, et al. Evaluation of the economic burden of herpes zoster (HZ) infection. Hum Vaccin Immunother 2015; 11:245–262.
- Yawn BP, Itzler RF, Wollan PC, Pellissier JM, Sy LS, Saddier P. Health care utilization and cost burden of herpes zoster in a community population. Mayo Clin Proc 2009; 84:787–794.
- Dworkin RH, White R, O’Connor AB, Hawkins K. Health care expenditure burden of persisting herpes zoster pain. Pain Med 2008; 9:348–353.
- White RR, Lenhart G, Singhal PK, et al. Incremental 1-year medical resource utilization and costs for patients with herpes zoster from a set of US health plans. Pharmacoeconomics 2009; 27:781–792.
- Insinga RP, Itzler RF, Pellissier JM. Acute/subacute herpes zoster: healthcare resource utilisation and costs in a group of US health plans. Pharmacoeconomics 2007; 25:155–169.
- Singhal PK, Makin C, Pellissier J, Sy L, White R, Saddier P. Work and productivity loss related to herpes zoster. J Med Econ 2011; 14:639–645.
- US Bureau of Labor Statistics. Labor force statistics from the current population survey. www.bls.gov/web/empsit/cpseea13.htm. Accessed April 6, 2017.
- US Bureau of Labor Statistic. Occupational employment statistics. www.bls.gov/oes/current/oes_nat.htm. Accessed April 6, 2017.
- Oxman MN, Levin MJ, Johnson GR, et al; Shingles Prevention Study Group. A vaccine to prevent herpes zoster and postherpetic neuralgia in older adults. N Engl J Med 2005; 352:2271–2284.
- Food and Drug Administration (FDA). FDA clinical briefing document for Merck & Co., Inc. Zoster vaccine live (Oka/Merck) Zostavax. www.fda.gov/ohrms/dockets/ac/05/briefing/5-4198b2_1.pdf. Accessed April 6, 2017.
- Simberkoff MS, Arbeit RD, Johnson GR, et al; Shingles Prevention Study Group. Safety of herpes zoster vaccine in the shingles prevention study: a randomized trial. Ann Intern Med 2010; 152:545–554.
- Schmader KE, Oxman MN, Levin MJ, et al; Shingles Prevention Study Group. Persistence of the efficacy of zoster vaccine in the shingles prevention study and the short-term persistence substudy. Clin Infect Dis 2012; 55:1320–1328.
- Morrison VA, Johnson GR, Schmader KE, et al; Shingles Prevention Study Group. Long-term persistence of zoster vaccine efficacy. Clin Infect Dis 2015; 60:900–909.
- Levin MJ, Schmader KE, Pang L, et al. Cellular and humoral responses to a second dose of herpes zoster vaccine administered 10 years after the first dose among older adults. J Infect Dis 2016; 213:14–22.
- Schmader KE, Levin MJ, Gnann JW Jr, et al. Efficacy, safety, and tolerability of herpes zoster vaccine in persons aged 50-59 years. Clin Infect Dis 2012; 54:922–928.
- Hales CM, Harpaz R, Ortega-Sanchez I, Bialek SR; Centers for Disease Control and Prevention (CDC). Update on recommendations for use of herpes zoster vaccine. MMWR Morb Mortal Wkly Rep 2014; 63:729–731.
- Centers for Disease Control and Prevention (CDC). Surveillance of vaccination coverage among adult populations—United States, 2014. MMWR Morb Mortal Wkly Rep 2016; 65(1):1–36. Accessed April 12, 2017.
- Williams WW, Lu PJ, O’Halloran A, et al; Centers for Disease Control and Prevention (CDC). Vaccination coverage among adults, excluding influenza vaccination—United States, 2013. MMWR Morb Mortal Wkly Rep 2015; 64:95–102.
- Oxman MN. Zoster vaccine: current status and future prospects. Clin Infect Dis 2010; 51:197–213.
- Hurley LP, Lindley MC, Harpaz R, et al. Barriers to the use of herpes zoster vaccine. Ann Intern Med 2010; 152:555–560.
- Lu PJ, Euler GL, Jumaan AO, Harpaz R. Herpes zoster vaccination among adults aged 60 years or older in the United States, 2007: uptake of the first new vaccine to target seniors. Vaccine 2009; 27:882–887.
- Hurley LP, Harpaz R, Daley MF, et al. National survey of primary care physicians regarding herpes zoster and the herpes zoster vaccine. J Infect Dis 2008; 197(suppl 2):S216–S223.
- Joon Lee T, Hayes S, Cummings DM, et al. Herpes zoster knowledge, prevalence, and vaccination rate by race. J Am Board Fam Med 2013; 26:45–51.
- Opstelten W, van Essen GA, Hak E. Determinants of non-compliance with herpes zoster vaccination in the community-dwelling elderly. Vaccine 2009; 27:192–196.
- Loo TS, Davis RB, Lipsitz LA, et al. Electronic medical record reminders and panel management to improve primary care of elderly patients. Arch Intern Med 2011; 171:1552–1558.
- Rhew DC, Glassman PA, Goetz MB. Improving pneumococcal vaccine rates. Nurse protocols versus clinical reminders. J Gen Intern Med 1999; 14:351–356.
- Chaudhry R, Schietel SM, North F, Dejesus R, Kesman RL, Stroebel RJ. Improving rates of herpes zoster vaccination with a clinical decision support system in a primary care practice. J Eval Clin Pract 2013; 19:263–266.
- Otsuka SH, Tayal NH, Porter K, Embi PJ, Beatty SJ. Improving herpes zoster vaccination rates through use of a clinical pharmacist and a personal health record. Am J Med 2013; 126:832.e1–832.e6.
- Taitel MS, Fensterheim LE, Cannon AE, Cohen ES. Improving pneumococcal and herpes zoster vaccination uptake: expanding pharmacist privileges. Am J Manag Care 2013; 19:e309–e313.
- Kawai K, Preaud E, Baron-Papillon F, Largeron N, Acosta CJ. Cost-effectiveness of vaccination against herpes zoster and postherpetic neuralgia: a critical review. Vaccine 2014; 32:1645–1653.
- Szucs TD, Pfeil AM. A systematic review of the cost effectiveness of herpes zoster vaccination. Pharmacoeconomics 2013; 31:125–136.
- Le P, Rothberg MB. Cost-effectiveness of herpes zoster vaccine for persons aged 50 years. Ann Intern Med 2015; 163:489–497.
- Le P, Rothberg MB. Determining the optimal age to vaccinate against herpes zoster: a cost-effectiveness analysis. Society for Medical Decision Making 37th Annual North American Meeting. St. Louis, MO; October 18-21, 2015.
- Cohen JI. Clinical practice: herpes zoster. N Engl J Med 2013; 369:255–263.
- Lal H, Cunningham AL, Godeaux O, et al; ZOE-50 Study Group. Efficacy of an adjuvanted herpes zoster subunit vaccine in older adults. N Engl J Med 2015; 372:2087–2096.
- GlaxoSmithKline plc. GSK’s candidate shingles vaccine demonstrates 90% efficacy against shingles in people 70 years of age and over. www.gsk.com/en-gb/media/press-releases/gsk-s-candidate-shingles-vaccine-demonstrates-90-efficacy-against-shingles-in-people-70-years-of-age-and-over/. Accessed April 6, 2017.
- Reed SG, Orr MT, Fox CB. Key roles of adjuvants in modern vaccines. Nat Med 2013; 19:1597–1608.
- Russell AF, Parrino J, Fisher CL Jr, et al. Safety, tolerability, and immunogenicity of zoster vaccine in subjects on chronic/maintenance corticosteroids. Vaccine 2015; 33:3129–3134.
- Hata A, Asanuma H, Rinki M, et al. Use of an inactivated varicella vaccine in recipients of hematopoietic-cell transplants. N Engl J Med 2002; 347:26–34.
- Mullane KM, Winston DJ, Wertheim MS, et al. Safety and immunogenicity of heat-treated zoster vaccine (ZVHT) in immunocompromised adults. J Infect Dis 2013; 208:1375–1385.
- Stadtmauer EA, Sullivan KM, Marty FM, et al. A phase 1/2 study of an adjuvanted varicella-zoster virus subunit vaccine in autologous hematopoietic cell transplant recipients. Blood 2014; 124:2921–2929.
- Berkowitz EM, Moyle G, Stellbrink HJ, et al. Safety and immunogenicity of an adjuvanted herpes zoster subunit candidate vaccine in HIV-infected adults: a phase 1/2a randomized, placebo-controlled study. J Infect Dis 2015; 211:1279–1287.
Herpes zoster (HZ), or shingles, represents a reactivation of the varicella-zoster virus (VZV). Following primary infection, usually in childhood, the virus typically lies dormant in the dorsal root and sensory nerve ganglia for decades. The precise mechanism of reactivation is not well understood, but it is associated with a decline in cell-mediated immunity that occurs with advancing age, immune-compromising conditions such as HIV infection and cancer, or immunosuppressive therapies, including corticosteroids.1 HZ is usually a self-limited disease characterized by unilateral dermatomal rash and pain, but can cause disseminated infection in immunocompromised individuals.2
Treatment with antiviral medications within 72 hours of rash onset can reduce acute HZ symptoms.1 However, antiviral agents are only minimally effective in preventing postherpetic neuralgia, the most common complication of HZ.3 Therefore, efforts to reduce the burden of HZ morbidity have focused on prevention through vaccination.
Currently, the only shingles vaccine approved by the US Food and Drug Administration (FDA) is Zostavax (Merck), which contains the live-attenuated Oka strain of VZV at a concentration 14 times greater than that of the varicella vaccine (Varivax, Merck). The live-attenuated vaccine boosts VZV-specific cell-mediated immunity, preventing reactivation of the latent virus.
In this article, we describe the burden of disease and review recent developments in the literature on HZ vaccine, including duration of efficacy, uptake and barriers to vaccination, cost-effectiveness, and the outlook for future vaccines.
INCIDENCE INCREASES WITH AGE
The incidence of herpes zoster in the general population is between 3 and 5 per 1,000 person-years4 and increases with age, especially after age 60 when the incidence can approach 13 to 15 per 1,000 person-years.5,6 An estimated 1 million new cases occur each year in the United States, and about 6% of patients experience a second episode of HZ within 8 years.7,8 In immunocompromised patients, the incidence of HZ is 2 to 10 times higher than in the general population.9
The incidence of HZ has been increasing for reasons that are unclear. After varicella vaccine was introduced into the routine childhood immunization schedule in 1995, it was hypothesized that the resultant decrease in primary varicella infections would remove a natural source of immune boosting and cause an increase in HZ incidence for up to 20 years.10 However, recent studies demonstrate that the observed increase in HZ incidence actually predates the introduction of varicella vaccine,11–13 and the widespread use of varicella vaccine has not resulted in an increase in the incidence of HZ.14
Other potential explanations for the rise in reported incidence include increasing awareness among patients, who might previously not have sought care and among physicians, who may be more likely to make the diagnosis. Advertisement of new treatments for HZ, including gabapentin and capsaicin, probably began to increase awareness in the 1990s, as did promotion of the HZ vaccine after its licensure in 2006.
HZ can occur in people who have been vaccinated against varicella due to reactivation of the vaccine-strain virus, but the risk is lower than after infection with wild-type varicella.15 Given that the varicella vaccine has been routinely used in children for only 20 years, the long-term effect of varicella vaccination on the incidence of HZ in elderly people is unknown.
Serious complications
HZ can cause rare but serious complications including encephalitis, herpes ophthalmicus, herpes oticus, myelitis, and retinitis.1 These can lead to long-term disability including unilateral blindness and deafness.
The most common and debilitating complication is postherpetic neuralgia, a persistent pain lasting at least 3 months, with a mean duration of 3.3 years and sometimes as long as 10 years.16 Postherpetic neuralgia occurs in 8% to 32% of patients after acute HZ,4 and the incidence increases with age, being most common after age 70. The chronic pain of postherpetic neuralgia has a significant adverse impact on patients’ quality of life, including physical disability and emotional distress.17 Some pain is intense, and anecdotal reports of patients committing suicide were included in the Advisory Committee on Immunization Practices (ACIP) recommendations regarding herpes zoster vaccine.18
HZ and its complications also impose a substantial economic burden on society.19 In a population-based study, the mean direct medical costs of HZ ranged from $620 to $1,160 (2015 dollars) depending on age,20 and the mean costs of postherpetic neuralgia were 2 to 5 times higher than that.20–22 Immunocompromised patients had costs 2 to 3 times higher than those of immunocompetent adults.23 In addition, for employed patients, HZ resulted in an average loss of 32 hours of work due to absenteeism and 84 hours due to presenteeism (ie, working while sick and therefore suboptimally).24
Assuming there are 1 million cases of HZ each year, if 8% to 32% of patients go on to develop postherpetic neuralgia, that would translate into approximately $1 to $2 billion in direct medical costs. With 60% of adult patients working,25 at an average wage of $23.23 per hour,26 HZ illness could be responsible for another $1.6 billion in lost productivity.
EFFICACY AND SAFETY OF HZ VACCINE
In 2006, the FDA approved the live-attenuated Oka strain VZV vaccine for prevention of HZ and postherpetic neuralgia in adults age 60 and older based on findings from the Shingles Prevention Study (SPS).27
The Shingles Prevention Study
This multicenter randomized placebo-controlled trial27 enrolled 38,546 immunocompetent persons age 60 and older. Subjects in the intervention group received a single dose of live-attenuated vaccine, and all participants were followed for up to 4.9 years after vaccination.
HZ occurred in 315 (1.636%) of the 19,254 participants in the vaccine group and in 642 (3.336%) of the 19,247 participants in the placebo group, an absolute risk reduction of 1.7%, number needed to treat 59, relative risk reduction 51%, P < .001. Similarly, postherpetic neuralgia occurred in 27 (0.140%) of the 19,254 vaccine recipients and in 80 (0.416%) of the placebo recipients (an absolute risk reduction of 0.276%, number needed to treat 362, relative risk reduction 66%, P < .001). The investigators calculated that vaccination reduced the overall burden of illness by 61% (Table 1).
The efficacy against HZ incidence decreased with age,28 but the efficacy against postherpetic neuralgia did not. In addition, vaccine recipients who developed HZ generally had less severe manifestations.
The safety of the vaccine was assessed for all participants in the SPS. In addition, one-sixth of SPS participants were enrolled in a safety substudy. These participants completed a detailed report card regarding all medically important events within the first 42 days. Forty-eight percent of the vaccine group and 17% of the placebo group (P < .05) experienced adverse events, primarily at the injection site. Less than 1% of all local reactions were severe.29 Serious adverse events were rare (< 2%), but occurred significantly more often in the vaccinated group.
Short-Term Persistence Substudy
Short-term efficacy of the live-attenuated vaccine (up to 7 years) was assessed in the Short-Term Persistence Substudy (STPS), which involved 14,270 of the initial participants and reported yearly and overall vaccine efficacy.30 After 5 years, the yearly efficacy against postherpetic neuralgia incidence declined to 32% and was no longer statistically significant. Efficacy against HZ incidence and burden of illness displayed the same pattern. After the end of the STPS, all subjects in the placebo group received vaccination.
Long-Term Persistence Substudy
Those in the intervention group were followed for an additional 4 years in the Long-Term Persistence Substudy (LTPS).31 Due to the lack of concurrent controls in the LTPS, the authors used regression models based on historical controls to estimate contemporary population incidence of HZ and postherpetic neuralgia for comparison.
Efficacy continued to decline over time, and by 10 years after vaccination there was no difference between vaccinated patients and historical controls in the rate of any end point (ie, efficacy declined to zero).
A trial of booster vaccination
Because many patients are vaccinated at age 60, waning immunity could leave them vulnerable to HZ and postherpetic neuralgia by age 70. A potential solution would be to give a booster dose after 10 years.
A recent phase 3 clinical trial of adults age 70 years and older found that a booster dose of live-attenuated vaccine was as safe and immunogenic as an initial dose.32 While antibody responses were similar in the boosted group and the newly vaccinated group, cell-mediated immunity was higher in the boosted group.
Because prevention of HZ is generally via cell-mediated immunity, the booster might be more effective than the initial vaccination, but clinical trials measuring actual cases prevented will be required to prove it. A booster dose is not currently recommended.
A trial of vaccination in adults 50 to 59
In 2011, the FDA extended its approval of HZ vaccine for use in adults ages 50 to 59.33
In a randomized, double-blind, placebo-controlled trial in this age group,33 the vaccine reduced HZ incidence by almost 70% (absolute risk reduction 0.614%, number needed to treat 156; Table 1), but the severity of HZ cases was not affected. There were too few cases of postherpetic neuralgia to assess the efficacy for this end point. The study followed patients for only 1.5 years after vaccination, so the duration of efficacy is unknown.
As in the older recipients, the vaccine was well tolerated; injection-site reactions and headache were the major adverse effects reported among vaccine recipients.33
INDICATIONS AND CONTRAINDICATIONS
Although HZ vaccine is licensed for use in adults age 50 and older, the ACIP recommends it only for immunocompetent adults age 60 and older. At this time, the ACIP does not recommend HZ vaccine in those younger than 60 because of the low risk of HZ in this age group.34
Any person age 60 or older should receive a single dose of the live-attenuated HZ vaccine subcutaneously, regardless of past history of HZ.
The vaccine is contraindicated in patients who have a history of allergic reaction to any vaccine component, immunosuppression or immunodeficiency conditions, and pregnancy. Specifically, people who will receive immunosuppressive therapies should have the vaccine at least 14 days before beginning treatment. Antiviral medications such as acyclovir, famciclovir, and valacyclovir should be discontinued at least 24 hours before vaccination and not resumed until 14 days later. Patients taking high-dose corticosteroids for more than 2 weeks should not be vaccinated until at least 1 month after therapy is completed.
In contrast, HZ vaccine is not contraindicated for leukemia patients who are in remission and who have not received chemotherapy or radiation for at least 3 months, or for patients receiving short-term, low-to-moderate dose, topical, intra-articular, bursal, or tendon injections of corticosteroids. Patients on low-dose methotrexate, azathioprine, or 6-mercaptopurine can also receive the vaccine.18
VACCINATION RATES ARE LOW
Although the vaccine has been recommended since 2008, uptake has been slow. Figure 1 shows the rate of HZ vaccination in adults age 60 and older surveyed in the National Health Interview Survey from 2007 to 2013.35 Eight years after the vaccine was licensed, only 28% of eligible patients had been vaccinated. Assuming the current rate of increase remains constant, it will take 7 more years to reach a 60% coverage rate—the same as for pneumococcal vaccine36—and 18 years to reach universal coverage.
Barriers to vaccination
Several barriers to HZ vaccination might account for the slow uptake.
For the first few years the vaccine was available, the requirement to store it frozen presented an obstacle for some physicians.37 Physicians may also have been discouraged by the cumbersome Medicare reimbursement process because while the administration fee is covered through Medicare Part B, the live-attenuated vaccine is reimbursed only through Medicare Part D, a benefit that varies by plans. Other barriers to physicians are supply shortages, high up-front costs, and uncertainties regarding the duration of vaccine protection, its safety, and side effects.38–40
Patient barriers include lack of physician recommendation, lack of familiarity with the vaccine, high out-of-pocket costs, the perception that they are at low risk for HZ, underestimation of the pain associated with HZ and postherpetic neuralgia, and fear of vaccine adverse effects.39,41,42
Interventions to increase vaccination rates
Certain interventions have been shown to increase vaccination adherence in general and HZ vaccination in particular. In randomized trials involving other vaccines, electronic medical record reminders supporting panel management or nurse-initiated protocols have been proven to increase vaccination rates, but these methods have not been tested for HZ vaccine specifically.43,44
In an observational study, Chaudhry et al found that the number of HZ vaccinations administered at the Mayo Clinic increased 43% in one practice and 54% in another after the implementation of an electronic alert.45 A randomized controlled trial showed that an informational package discussing HZ and the vaccine sent to patients via either their electronic personal health record or traditional mail increased HZ vaccination by almost 3 times.46
Pharmacists can also influence vaccination rates. States that provide full immunization privileges to pharmacists have vaccination rates significantly higher than states with restricted or no authorization.47
COST-EFFECTIVENESS CONSIDERATIONS
Unlike the Centers for Medicare and Medicaid Services, the ACIP does consider cost-effectiveness in their vaccine recommendations. Because of the morbidity associated with HZ and postherpetic neuralgia as well as the economic impact, vaccination is generally considered cost-effective for adults age 60 and older.48,49
Analyses have demonstrated that cost-effectiveness hinges on 4 factors: initial vaccine efficacy, the duration of efficacy, the age-specific incidence of HZ, and the cost of the vaccine.
For patients ages 50 to 59, the incidence of HZ is low, and because the duration of vaccine efficacy is short even though initial vaccine efficacy is high, vaccination in this age group offers poor value.50 At older ages, the incidence of HZ and postherpetic neuralgia rises, making vaccination more cost-effective. After age 60, the vaccine is cost-effective at all ages, although age 70 appears to offer the optimal trade-off between increasing incidence and declining vaccine efficacy.48,49
For patients who plan to be vaccinated only once, waiting until age 70 would appear to offer the best value.51 For those who are willing to receive a booster dose, the optimal age for vaccination is unknown, but will likely depend on the effectiveness, cost, and duration of the booster.
A NEW HZ VACCINE
In 2015, GlaxoSmithKline tested a new HZ vaccine containing a single VZV glycoprotein in an AS01B adjuvant system (HZ/su vaccine).52 In a phase 3 randomized trial involving 15,411 immunocompetent persons age 50 and older, a 2-dose schedule of HZ/su vaccine was 97% effective in preventing HZ (Table 1).53 Importantly, the vaccine was equally effective in older patients.
This vaccine also had a high rate of adverse reactions, with 17% of vaccine recipients vs 3% of placebo recipients reporting events that prevented normal everyday activities for at least 1 day. However, the rate of serious adverse reactions was the same in both groups (9%). The company announced that they intended to submit a regulatory application for HZ/su vaccine in the second half of 2016.54
Because of its high efficacy, HZ/su vaccine has the potential to change practice, but several issues must be resolved before it can supplant the current vaccine.
First, the AS01B adjuvant is not currently licensed in the United States, so it is unclear if the HZ/su vaccine can get FDA approval.52,55
Second, there are several questions about the efficacy of the vaccine, including long-term efficacy, efficacy in the elderly, and efficacy in the case of a patient receiving only 1 of the 2 required doses.
Third, the impact of HZ/su vaccine on complications such as postherpetic neuralgia has not been established. The clinical trial (NCT01165229) examining vaccine efficacy against postherpetic neuralgia incidence and other complications in adults age 70 and older has recently been completed and data should be available soon. Given the extremely high efficacy against HZ, it is likely that it will be close to 100% effective against this complication.
Fourth, there is uncertainty as to how the HZ/su vaccine should be used in patients who have already received the live-attenuated vaccine, if it is determined that a booster is necessary.
Finally, the vaccine is not yet priced. Given its superior effectiveness, particularly in older individuals, competitive pricing could dramatically affect the market. How Medicare or other insurers cover the new vaccine will likely influence its acceptance.
HZ VACCINATION OF IMMUNOCOMPROMISED PATIENTS
Immunocompromised patients are at highest risk for developing HZ. Unfortunately, there are currently no HZ vaccines approved for use in this population. The current live-attenuated vaccine has been demonstrated to be safe, well tolerated, and immunogenic in patients age 60 and older who are receiving chronic or maintenance low to moderate doses of corticosteroids.56
A clinical trial is being conducted to assess the immunogenicity, clinical effectiveness, and safety of the vaccine in rheumatoid arthritis patients receiving antitumor necrosis factor therapy (NCT01967316). Other trials are examining vaccine efficacy and safety in patients with solid organ tumors prior to chemotherapy (NCT02444936) and in patients who will be undergoing living donor kidney transplantation (NCT00940940). Researchers are also investigating the possibility of vaccinating allogeneic stem cell donors before donation in order to protect transplant recipients against HZ (NCT01573182).
ZVHT and HZ/su vaccination in immunocompromised patients
Heat-treated varicella-zoster vaccine (ZVHT) is a potential alternative for immunocompromised patients. A 4-dose regimen has been proven to reduce the risk of HZ in patients receiving autologous hematopoietic-cell transplants for non-Hodgkin or Hodgkin lymphoma.57
In another trial, the 4-dose ZVHT was safe and elicited significant VZV-specific T-cell response through 28 days in immunosuppressed patients with solid tumor malignancy, hematologic malignancy, human immunodeficiency virus infection with CD4 counts of 200 cells/mm3 or less, and autologous hematopoietic-cell transplants. The T-cell response was poor in allogeneic hematopoietic-cell transplant recipients, however.58
Because the HZ/su vaccine does not contain live virus, it seems particularly promising for immunocompromised patients. In phase 1 and 2 studies, a 3-dose regimen has been shown to be safe and immunogenic in hematopoietic-cell transplant recipients and HIV-infected adults with CD4 count higher than 200 cells/mm3.59,60 A phase 3 trial assessing the efficacy of HZ/su vaccine in autologous hematopoietic-cell transplant recipients is under way (NCT01610414). Changes in recommendations for HZ vaccine in these most vulnerable populations await the results of these studies.
- Dworkin RH, Johnson RW, Breuer J, et al. Recommendations for the management of herpes zoster. Clin Infect Dis 2007; 44(suppl 1):S1–S26.
- Johnson RW. Herpes zoster and postherpetic neuralgia. Expert Rev Vaccines 2010; 9(suppl):21–26.
- Chen N, Li Q, Yang J, Zhou M, Zhou D, He L. Antiviral treatment for preventing postherpetic neuralgia. Cochrane Database Syst Rev 2014; 2:CD006866.
- Kawai K, Gebremeskel BG, Acosta CJ. Systematic review of incidence and complications of herpes zoster: towards a global perspective. BMJ Open 2014; 4:e004833.
- Tseng HF, Smith N, Harpaz R, Bialek SR, Sy LS, Jacobsen SJ. Herpes zoster vaccine in older adults and the risk of subsequent herpes zoster disease. JAMA 2011; 305:160–166.
- Langan SM, Smeeth L, Margolis DJ, Thomas SL. Herpes zoster vaccine effectiveness against incident herpes zoster and post-herpetic neuralgia in an older US population: a cohort study. PLoS Med 2013; 10:e1001420.
- Yawn BP, Saddier P, Wollan PC, St. Sauver JL, Kurland MJ, Sy LS. A population-based study of the incidence and complication rates of herpes zoster before zoster vaccine introduction. Mayo Clin Proc 2007; 82:1341–1349.
- Yawn BP, Wollan PC, Kurland MJ, St. Sauver JL, Saddier P. Herpes zoster recurrences more frequent than previously reported. Mayo Clin Proc 2011; 86:88–93.
- Chen SY, Suaya JA, Li Q, et al. Incidence of herpes zoster in patients with altered immune function. Infection 2014; 42:325–334.
- Edmunds WJ, Brisson M. The effect of vaccination on the epidemiology of varicella zoster virus. J Infect 2002; 44:211–219.
- Hales CM, Harpaz R, Joesoef MR, Bialek SR. Examination of links between herpes zoster incidence and childhood varicella vaccination. Ann Intern Med 2013; 159:739–745.
- Leung J, Harpaz R, Molinari NA, Jumaan A, Zhou F. Herpes zoster incidence among insured persons in the United States, 1993-2006: evaluation of impact of varicella vaccination. Clin Infect Dis 2011; 52:332–340.
- Rimland D, Moanna A. Increasing incidence of herpes zoster among veterans. Clin Infect Dis 2010; 50:1000–1005.
- Jumaan AO, Yu O, Jackson LA, Bohlke K, Galil K, Seward JF. Incidence of herpes zoster, before and after varicella-vaccination-associated decreases in the incidence of varicella, 1992-2002. J Infect Dis 2005; 191:2002–2007.
- Plotkin SA, Starr SE, Connor K, Morton D. Zoster in normal children after varicella vaccine. J Infect Dis 1989; 159:1000–1001.
- Oster G, Harding G, Dukes E, Edelsberg J, Cleary PD. Pain, medication use, and health-related quality of life in older persons with postherpetic neuralgia: results from a population-based survey. J Pain 2005; 6:356–363.
- Johnson RW, Bouhassira D, Kassianos G, Leplege A, Schmader KE, Weinke T. The impact of herpes zoster and post-herpetic neuralgia on quality-of-life. BMC Med 2010; 8:37.
- Harpaz R, Ortega-Sanchez IR, Seward JF; Advisory Committee on Immunization Practices (ACIP) Centers for Disease Control and Prevention (CDC). Prevention of herpes zoster: recommendations of the Advisory Committee on Immunization Practices (ACIP). MMWR Recomm Rep 2008; 57:1–30.
- Panatto D, Bragazzi NL, Rizzitelli E, et al. Evaluation of the economic burden of herpes zoster (HZ) infection. Hum Vaccin Immunother 2015; 11:245–262.
- Yawn BP, Itzler RF, Wollan PC, Pellissier JM, Sy LS, Saddier P. Health care utilization and cost burden of herpes zoster in a community population. Mayo Clin Proc 2009; 84:787–794.
- Dworkin RH, White R, O’Connor AB, Hawkins K. Health care expenditure burden of persisting herpes zoster pain. Pain Med 2008; 9:348–353.
- White RR, Lenhart G, Singhal PK, et al. Incremental 1-year medical resource utilization and costs for patients with herpes zoster from a set of US health plans. Pharmacoeconomics 2009; 27:781–792.
- Insinga RP, Itzler RF, Pellissier JM. Acute/subacute herpes zoster: healthcare resource utilisation and costs in a group of US health plans. Pharmacoeconomics 2007; 25:155–169.
- Singhal PK, Makin C, Pellissier J, Sy L, White R, Saddier P. Work and productivity loss related to herpes zoster. J Med Econ 2011; 14:639–645.
- US Bureau of Labor Statistics. Labor force statistics from the current population survey. www.bls.gov/web/empsit/cpseea13.htm. Accessed April 6, 2017.
- US Bureau of Labor Statistic. Occupational employment statistics. www.bls.gov/oes/current/oes_nat.htm. Accessed April 6, 2017.
- Oxman MN, Levin MJ, Johnson GR, et al; Shingles Prevention Study Group. A vaccine to prevent herpes zoster and postherpetic neuralgia in older adults. N Engl J Med 2005; 352:2271–2284.
- Food and Drug Administration (FDA). FDA clinical briefing document for Merck & Co., Inc. Zoster vaccine live (Oka/Merck) Zostavax. www.fda.gov/ohrms/dockets/ac/05/briefing/5-4198b2_1.pdf. Accessed April 6, 2017.
- Simberkoff MS, Arbeit RD, Johnson GR, et al; Shingles Prevention Study Group. Safety of herpes zoster vaccine in the shingles prevention study: a randomized trial. Ann Intern Med 2010; 152:545–554.
- Schmader KE, Oxman MN, Levin MJ, et al; Shingles Prevention Study Group. Persistence of the efficacy of zoster vaccine in the shingles prevention study and the short-term persistence substudy. Clin Infect Dis 2012; 55:1320–1328.
- Morrison VA, Johnson GR, Schmader KE, et al; Shingles Prevention Study Group. Long-term persistence of zoster vaccine efficacy. Clin Infect Dis 2015; 60:900–909.
- Levin MJ, Schmader KE, Pang L, et al. Cellular and humoral responses to a second dose of herpes zoster vaccine administered 10 years after the first dose among older adults. J Infect Dis 2016; 213:14–22.
- Schmader KE, Levin MJ, Gnann JW Jr, et al. Efficacy, safety, and tolerability of herpes zoster vaccine in persons aged 50-59 years. Clin Infect Dis 2012; 54:922–928.
- Hales CM, Harpaz R, Ortega-Sanchez I, Bialek SR; Centers for Disease Control and Prevention (CDC). Update on recommendations for use of herpes zoster vaccine. MMWR Morb Mortal Wkly Rep 2014; 63:729–731.
- Centers for Disease Control and Prevention (CDC). Surveillance of vaccination coverage among adult populations—United States, 2014. MMWR Morb Mortal Wkly Rep 2016; 65(1):1–36. Accessed April 12, 2017.
- Williams WW, Lu PJ, O’Halloran A, et al; Centers for Disease Control and Prevention (CDC). Vaccination coverage among adults, excluding influenza vaccination—United States, 2013. MMWR Morb Mortal Wkly Rep 2015; 64:95–102.
- Oxman MN. Zoster vaccine: current status and future prospects. Clin Infect Dis 2010; 51:197–213.
- Hurley LP, Lindley MC, Harpaz R, et al. Barriers to the use of herpes zoster vaccine. Ann Intern Med 2010; 152:555–560.
- Lu PJ, Euler GL, Jumaan AO, Harpaz R. Herpes zoster vaccination among adults aged 60 years or older in the United States, 2007: uptake of the first new vaccine to target seniors. Vaccine 2009; 27:882–887.
- Hurley LP, Harpaz R, Daley MF, et al. National survey of primary care physicians regarding herpes zoster and the herpes zoster vaccine. J Infect Dis 2008; 197(suppl 2):S216–S223.
- Joon Lee T, Hayes S, Cummings DM, et al. Herpes zoster knowledge, prevalence, and vaccination rate by race. J Am Board Fam Med 2013; 26:45–51.
- Opstelten W, van Essen GA, Hak E. Determinants of non-compliance with herpes zoster vaccination in the community-dwelling elderly. Vaccine 2009; 27:192–196.
- Loo TS, Davis RB, Lipsitz LA, et al. Electronic medical record reminders and panel management to improve primary care of elderly patients. Arch Intern Med 2011; 171:1552–1558.
- Rhew DC, Glassman PA, Goetz MB. Improving pneumococcal vaccine rates. Nurse protocols versus clinical reminders. J Gen Intern Med 1999; 14:351–356.
- Chaudhry R, Schietel SM, North F, Dejesus R, Kesman RL, Stroebel RJ. Improving rates of herpes zoster vaccination with a clinical decision support system in a primary care practice. J Eval Clin Pract 2013; 19:263–266.
- Otsuka SH, Tayal NH, Porter K, Embi PJ, Beatty SJ. Improving herpes zoster vaccination rates through use of a clinical pharmacist and a personal health record. Am J Med 2013; 126:832.e1–832.e6.
- Taitel MS, Fensterheim LE, Cannon AE, Cohen ES. Improving pneumococcal and herpes zoster vaccination uptake: expanding pharmacist privileges. Am J Manag Care 2013; 19:e309–e313.
- Kawai K, Preaud E, Baron-Papillon F, Largeron N, Acosta CJ. Cost-effectiveness of vaccination against herpes zoster and postherpetic neuralgia: a critical review. Vaccine 2014; 32:1645–1653.
- Szucs TD, Pfeil AM. A systematic review of the cost effectiveness of herpes zoster vaccination. Pharmacoeconomics 2013; 31:125–136.
- Le P, Rothberg MB. Cost-effectiveness of herpes zoster vaccine for persons aged 50 years. Ann Intern Med 2015; 163:489–497.
- Le P, Rothberg MB. Determining the optimal age to vaccinate against herpes zoster: a cost-effectiveness analysis. Society for Medical Decision Making 37th Annual North American Meeting. St. Louis, MO; October 18-21, 2015.
- Cohen JI. Clinical practice: herpes zoster. N Engl J Med 2013; 369:255–263.
- Lal H, Cunningham AL, Godeaux O, et al; ZOE-50 Study Group. Efficacy of an adjuvanted herpes zoster subunit vaccine in older adults. N Engl J Med 2015; 372:2087–2096.
- GlaxoSmithKline plc. GSK’s candidate shingles vaccine demonstrates 90% efficacy against shingles in people 70 years of age and over. www.gsk.com/en-gb/media/press-releases/gsk-s-candidate-shingles-vaccine-demonstrates-90-efficacy-against-shingles-in-people-70-years-of-age-and-over/. Accessed April 6, 2017.
- Reed SG, Orr MT, Fox CB. Key roles of adjuvants in modern vaccines. Nat Med 2013; 19:1597–1608.
- Russell AF, Parrino J, Fisher CL Jr, et al. Safety, tolerability, and immunogenicity of zoster vaccine in subjects on chronic/maintenance corticosteroids. Vaccine 2015; 33:3129–3134.
- Hata A, Asanuma H, Rinki M, et al. Use of an inactivated varicella vaccine in recipients of hematopoietic-cell transplants. N Engl J Med 2002; 347:26–34.
- Mullane KM, Winston DJ, Wertheim MS, et al. Safety and immunogenicity of heat-treated zoster vaccine (ZVHT) in immunocompromised adults. J Infect Dis 2013; 208:1375–1385.
- Stadtmauer EA, Sullivan KM, Marty FM, et al. A phase 1/2 study of an adjuvanted varicella-zoster virus subunit vaccine in autologous hematopoietic cell transplant recipients. Blood 2014; 124:2921–2929.
- Berkowitz EM, Moyle G, Stellbrink HJ, et al. Safety and immunogenicity of an adjuvanted herpes zoster subunit candidate vaccine in HIV-infected adults: a phase 1/2a randomized, placebo-controlled study. J Infect Dis 2015; 211:1279–1287.
KEY POINTS
- HZ continues to be an important public health problem, with substantial morbidity and economic impact. Because of the lack of effective treatment, vaccination provides the best strategy for disease mitigation.
- Physicians can reduce the impact of HZ by educating patients about its complications and recommending immunization for all patients age 60 and older. Patients can protect themselves by seeking vaccination.
- Vaccine protection wanes completely after 10 years, and physicians should be prepared to offer a booster dose should the Advisory Committee on Immunization Practices issue such recommendations.
- Newer vaccines offer promise for greater efficacy, especially for the elderly. For immunocompromised patients, a safe and effective vaccine may be available in the near future.

Impact of a Connected Care model on 30-day readmission rates from skilled nursing facilities
Approximately 20% of hospitalized Medicare beneficiaries in the U.S. are discharged to skilled nursing facilities (SNFs) for post-acute care,1,2 and 23.5% of these patients are readmitted within 30 days.3 Because hospital readmissions are costly and associated with worse outcomes,4,5 30-day readmission rates are considered a quality indicator,6 and there are financial penalties for hospitals with higher than expected rates.7 As a result, hospitals invest substantial resources in programs to reduce readmissions.8-10 The SNFs represent an attractive target for readmission reduction efforts, since SNFs contribute a disproportionate share of readmissions.3,4 Because SNF patients are in a monitored environment with high medication adherence, risk factors for readmission likely differ between patients discharged to SNFs and those sent home. For example, 1 study showed that among heart failure patients with cognitive impairment, those discharged to SNFs had lower readmissions during the first 20 days, likely due to better medication adherence.11 Patients discharged to SNFs generally have more complex illnesses, lower functional status, and higher 1-year mortality than patients discharged to the community.12,13 Despite this, SNF patients might have infrequent contact with physicians. Federal regulations require only that patients discharged to SNFs need to be seen within 30 days and then at least once every 30 days thereafter.14 According to the 2014 Office of Inspector General report, one-third of Medicare beneficiaries in SNFs experience adverse events from substandard treatment, inadequate resident monitoring and failure or delay of necessary care, most of which are thought to be preventable.15
To address this issue, the Cleveland Clinic developed a program called “Connected Care SNF,” in which hospital-employed physicians and advanced practice professionals visit patients in selected SNFs 4 to 5 times per week, for the purpose of reducing preventable readmissions. The aim of this study was to assess whether the program reduced 30-day readmissions, and to identify which patients benefited most from the program.
METHODS
Setting and Intervention
The Cleveland Clinic main campus is a tertiary academic medical center with 1400 beds and approximately 50,000 admissions per year. In late 2012, the Cleveland Clinic implemented the Connected Care SNF program, wherein Cleveland Clinic physicians regularly visited patients who were discharged from the Cleveland Clinic main campus to 7 regional SNFs. Beginning in December 2012, these 7 high-volume referral SNFs that were not part of the Cleveland Clinic Health System (CCHS) agreed to participate in the program, which focused on reducing avoidable hospital readmissions and delivering quality care (Table 1). The Connected Care team, comprised of 2 geriatricians (1 of whom was also a palliative medicine specialist), 1 internist, 1 family physician, and 5 advanced practice professionals (nurse practitioners and physician assistants), provided medical services at the participating SNFs. These providers aimed to see patients 4 to 5 times per week, were available on site during working hours, and provided telephone coverage at nights and on weekends. All providers had access to hospital electronic medical records and could communicate with the discharging physician and with specialists familiar with the patient as needed. Prior to the admission, providers were informed about patient arrival and, at the time of admission to the SNF, providers reviewed medications and discussed goals of care with patients and their families. In the SNF, providers worked closely with staff members to deliver medications and timely treatment. They also met monthly with multidisciplinary teams for continuous quality improvement and to review outcomes. Patients at Connected Care SNFs who had their own physicians, including most long-stay and some short-stay residents, did not receive the Connected Care intervention. They constituted less than 10% of the patients discharged from Cleveland Clinic main campus.

Study Design and Population
We reviewed administrative and clinical data from a retrospective cohort of patients discharged to SNF from the Cleveland Clinic main campus from January 1, 2011 to December 31, 2014. We included all patients who were discharged to an SNF during the study period. Our main outcome measure was 30-day all-cause readmissions to any hospital in the Cleveland Clinic Health System (CCHS), including the main campus and 8 regional community hospitals. Study patients were followed until January 30, 2015 to capture 30-day readmissions. According to 2012 Medicare data, of CCHS patients who were readmitted within 30 days, 83% of pneumonia, 81% of major joint replacement, 72% of heart failure and 57% of acute myocardial infarction patients were readmitted to a CCHS facility. As the Cleveland Clinic main campus attracts cardiac patients from a 100+-mile radius, they may be more likely to seek care readmission near home and are not reflective of CCHS patients overall. Because we did not have access to readmissions data from non-CCHS hospitals, we excluded patients who were discharged to SNFs beyond a 25-mile radius from the main campus, where they may be more likely to utilize non-CCHS hospitals for acute hospitalization. We also excluded patients discharged to non-CCHS hospital-based SNFs, which may refer readmissions to their own hospital system. Because the Connected Care program began in December 2012, the years 2011-2012 served as the baseline period. The intervention was conducted at 7 SNFs. All other SNFs within the 25-mile radius were included as controls, except for 3 hospital-based SNFs that would be unlikely to admit patients to CCHS. We compared the change in all-cause 30-day readmission rates after implementation of Connected Care, using all patients discharged to SNFs within 25 miles to control for temporal changes in local readmission rates. Discharge to specific SNFs was determined solely by patient choice.
Data Collection
For each patient, we collected the following data that has been shown to be associated with readmissions:16-18 demographics (age, race, sex, ZIP code), lab values on discharge (hemoglobin and sodium); hemodialysis status; medicine or surgical service; elective surgery or nonelective surgery; details of the index admission index (diagnosis-related group [DRG], Medicare severity-diagnosis-related groups [MS-DRG] weight, primary diagnosis code; principal procedure code; admission date; discharge date, length of stay, and post-acute care provider); and common comorbidities, as listed in Table 2. We also calculated each patient’s HOSPITAL19,20 score. The HOSPITAL score was developed to predict risk of preventable 30-day readmissions,19 but it has also been validated to predict 30-day all-cause readmission rates for patients discharged to SNF.21 The model contains 7 elements (hemoglobin, oncology service, sodium, procedure, index type, admissions within the last year, length of stay) (supplemental Table).Patients with a high score (7 or higher) have a 41% chance of readmission, while those with a low score (4 or lower) have only a 15% chance. 21 We assessed all cause 30-day readmission status from CCHS administrative data. Observation patients and outpatient same-day surgeries were not considered to be admissions. For patients with multiple admissions, each admission was counted as a separate index hospitalization. Cleveland Clinic’s Institutional Review Board approved the study.

Statistical Analysis
For the 7 intervention SNFs, patient characteristics were summarized as means and standard deviations or frequencies and percentages for the periods of 2011-2012 and 2013-2014, respectively, and the 2 periods were compared using the Student t test or χ2 test as appropriate.
Mixed-effects logistic regression models were used to model 30-day readmission rates. Since the intervention was implemented in the last quarter of 2012, we examined the difference in readmission rates before and after that time point. The model included the following fixed effects: SNF type (intervention or usual care), time points (quarters of 2011-2014), whether the time is pre- or postintervention (binary), and the 3-way interaction between SNF type, pre- or postintervention and time points, and patient characteristics. The model also contained a Gaussian random effect at the SNF level to account for possible correlations among the outcomes of patients from the same SNF. For each quarter, the mean adjusted readmission rates of 2 types of SNFs were calculated from the fitted mixed models and plotted over time. Furthermore, we compared the mean readmission rates of the 2 groups in the pre- and postintervention periods. Subgroup analyses were performed for medical and surgical patients, and for patients in the low, intermediate and high HOSPITAL score groups.
All analyses were performed using RStudio (Boston, Massachusetts). Statistical significance was established with 2-sided P values less than 0.05.
RESULTS
We identified 119 SNFs within a 25-mile radius of the hospital. Of these, 6 did not receive any referrals. Three non-CCHS hospital-based SNFs were excluded, leaving a total of 110 SNFs in the study sample: 7 intervention SNFs and 103 usual-care SNFs. Between January 2011 and December 2014, there were 23,408 SNF discharges from Cleveland Clinic main campus, including 13,544 who were discharged to study SNFs (Supplemental Figure). Of these, 3334 were discharged to 7 intervention SNFs and 10,210 were discharged to usual care SNFs. Characteristics of patients in both periods appear in Table 2. At baseline, patients in the intervention and control SNFs varied in a number of ways. Patients at intervention SNFs were older (75.6 vs. 70.2 years; P < 0.001), more likely to be African American (45.5% vs. 35.9%; P < 0.001), female (61% vs. 55.4%; P < 0.001) and to be insured by Medicare (85.2% vs. 71.4%; P < 0.001). Both groups had similar proportions of patients with high, intermediate, and low readmission risk as measured by HOSPITAL score. Compared to the 2011-2012 pre-intervention period, during the 2013-2014 intervention period, there were more surgeries (34.3% vs. 41.9%; P < 0.001), more elective surgeries (21.8% vs. 25.5%; P = 0.01), fewer medical patients (65.7% vs. 58.1%; P < 0.001), and an increase in comorbidities, including myocardial infarction, peripheral vascular disease, and liver disease (Table 2).

Table 3 shows adjusted 30-day readmissions rates, before and during the intervention period at the intervention and usual care SNFs. Compared to the pre-intervention period, 30-day all-cause adjusted readmission rates declined in the intervention SNFs (28.1% to 21.7%, P < 0.001), while it increased slightly at control sites (27.1% to 28.5%, P < 0.001). The Figure shows the adjusted 30-day readmission rates by quarter throughout the study period.

Declines in 30-day readmission rates were greater for medical patients (31.0% to 24.6%, P < 0.001) than surgical patients (22.4% to 17.7%, P < 0.001). Patients with high HOSPITAL scores had the greatest decline, while those with low HOSPITAL scores had smaller declines.
DISCUSSION
In this retrospective study of 4 years of discharges to 110 SNFs, we report on the impact of a Connected Care program, in which a physician visited patients on admission to the SNF and 4 to 5 times per week during their stay. Introduction of the program was followed by a 6.8% absolute reduction in all-cause 30-day readmission rates compared to usual care. The absolute reductions ranged from 4.6% for patients at low risk for readmission to 9.1% for patients at high risk, and medical patients benefited more than surgical patients.
Most studies of interventions to reduce hospital readmissions have focused on patients discharged to the community setting.7-9 Interventions have centered on discharge planning, medication reconciliation, and close follow-up to assess for medication adherence and early signs of deterioration. Because patients in SNFs have their medications administered by staff and are under frequent surveillance, such interventions are unlikely to be helpful in this population. We found no studies that focus on short-stay or skilled patients discharged to SNF. Two studies have demonstrated that interventions can reduce hospitalization from nursing homes.22,23 Neither study included readmissions. The Evercare model consisted of nurse practitioners providing active primary care services within the nursing home, as well as offering incentive payments to nursing homes for not hospitalizing patients.22 During a 2-year period, long term residents who enrolled in Evercare had an almost 50% reduction in incident hospitalizations compared to those who did not.22 INTERACT II was a quality improvement intervention that provided tools, education, and strategies to help identify and manage acute conditions proactively.23 In 25 nursing homes employing INTERACT II, there was a 17% reduction in self-reported hospital admissions during the 6-month project, with higher rates of reduction among nursing homes rated as more engaged in the process.23 Although nursing homes may serve some short-stay or skilled patients, they generally serve long-term populations, and studies have shown that short-stay patients are at higher risk for 30-day readmissions.24
There are a number of reasons that short-term SNF patients are at higher risk for readmission. Although prior to admission, they were considered hospital level of care and received a physician visit daily, on transfer to the SNF, relatively little medical care is available. Current federal regulations regarding physician services at a SNF require the resident to be seen by a physician at least once every 30 days for the first 90 days after admission, and at least once every 60 days thereafter.25
The Connected Care program physicians provided a smooth transition of care from hospital to SNF as well as frequent reassessment. Physicians were alerted prior to hospital discharge and performed an initial comprehensive visit generally on the day of admission to the SNF and always within 48 hours. The initial evaluation is important because miscommunication during the handoff from hospital to SNF may result in incorrect medication regimens or inaccurate assessments. By performing prompt medication reconciliation and periodic reassessments of a patient’s medical condition, the Connected Care providers recreate some of the essential elements of successful outpatient readmissions prevention programs.
They also worked together with each SNF’s interdisciplinary team to deliver quality care. There were monthly meetings at each participating Connected Care SNF. Physicians reviewed monthly 30-day readmissions and performed root-cause analysis. When they discovered challenges to timely medication and treatment delivery during daily rounds, they provided in-services to SNF nurses.
In addition, Connected Care providers discussed goals of care—something that is often overlooked on admission to a SNF. This is particularly important because patients with chronic illnesses who are discharged to SNF often have poor prognoses. For example, Medicare patients with heart failure who are discharged to SNFs have 1-year mortality in excess of 50%.13 By implementing a plan of care consistent with patient and family goals, inappropriate readmissions for terminal patients may be avoided.
Reducing readmissions is important for hospitals because under the Hospital Readmissions Reduction Program, hospitals now face substantial penalties for higher than expected readmissions rates. Hospitals involved in bundled payments or other total cost-of-care arrangements have additional incentive to avoid readmissions. Beginning in 2019, SNFs will also receive incentive payments based on their 30-day all-cause hospital readmissions as part of the Skilled Nursing Facility Value-Based Purchasing program.25 The Connected Care model offers 1 means of achieving this goal through partnership between hospitals and SNFs.
Our study has several limitations. First, our study was observational in nature, so the observed reduction in readmissions could have been due to temporal trends unrelated to the intervention. However, no significant reduction was noted during the same time period in other area SNFs. There was also little change in the characteristics of patients admitted to the intervention SNFs. Importantly, the HOSPITAL score, which can predict 30-day readmission rates,20 did not change throughout the study period. Second, the results reflect patients discharged from a single hospital and may not be generalizable to other geographic areas. However, because the program included 7 SNFs, we believe it could be reproduced in other settings. Third, our readmissions measure included only those patients who returned to a CCHS facility. Although we may have missed some readmissions to other hospital systems, such leakage is uncommon—more than 80% of CCHS patients are readmitted to CCHS facilities—and would be unlikely to differ across the short duration of the study. Finally, at the intervention SNFs, most long-stay and some short-stay residents did not receive the Connected Care intervention because they were cared for by their own physicians who did not participate in Connected Care. Had these patients’ readmissions been excluded from our results, the intervention might appear even more effective.
CONCLUSION
A Connected Care intervention reduced 30-day readmission rates among patients discharged to SNFs from a tertiary academic center. While all subgroups had substantial reductions in readmissions following the implementation of the intervention, patients who are at the highest risk of readmission benefited the most. Further study is necessary to know whether Connected Care can be reproduced in other health care systems and whether it reduces overall costs.
Acknowledgments
The authors would like to thank Michael Felver, MD, and teams for their clinical care of patients; Michael Felver, MD, William Zafirau, MD, Dan Blechschmid, MHA, and Kathy Brezine, and Seth Vilensky, MBA, for their administrative support; and Brad Souder, MPT, for assistance with data collection.
Disclosure
Nothing to report.
1. Medicare Payment Advisory Commission. Report to the Congress: Medicare Payment Policy. Chapter 8. Skilled Nursing Facility Services. March 2013. http://www.medpac.gov/docs/default-source/reports/mar13_entirereport.pdf?sfvrsn=0. Accessed March 1, 2017.
2. Kim DG, Messinger-Rapport BJ. Clarion call for a dedicated clinical and research approach to post-acute care. J Am Med Dir Assoc. 2014;15(8):607. e1-e3. PubMed
3. Mor V, Intrator O, Feng Z, Grabowski D. The revolving door of rehospitalization from skilled nursing facilities. Health Aff. 2010;29(1):57-64. PubMed
4. Jencks SF, Williams MV, Coleman EA. Rehospitalizations among patients in the Medicare fee-for-service program. N Engl J Med. 2009;360(14):1418-1428. PubMed
5. Creditor MC. Hazards of hospitalization of the elderly. Ann Intern Med 1993;118(3):219-223. PubMed
6. Van Walraven C, Bennett C, Jennings A, Austin PC, Forester AJ. Proportion of hospital readmissions deemed avoidable: a systematic review. CMAJ. 2011;183(7):E391-E402. PubMed
7. Brenson RA, Paulus RA, Kalman NS. Medicare’s readmissions-reduction program – a positive alternative. N Engl J Med 2012;366(15):1364-1366. PubMed
8. Jack BW, Chetty VK, Anthony D, et al. A reengineered hospital discharge program to decrease rehospitalization: a randomized trial. Ann Intern Med. 2009;150(3):178-187. PubMed
9. Naylor MD, Brooten D, Campbell R, et al. Comprehensive discharge planning and home follow-up of hospitalized elders: a randomized clinical trial. JAMA. 1999;281(7):613-620. PubMed
10. Coleman EA, Parry C, Chalmers S, Min SJ. The care transition intervention: results of a randomized controlled trial. Arch Intern Med. 2006;166(17):1822-1828. PubMed
11. Patel A, Parikh R, Howell EH, Hsich E, Landers SH, Gorodeski EZ. Mini-cog performance: novel marker of post discharge risk among patients hospitalized for heart failure. Circ Heart Fail. 2015;8(1):8-16. PubMed
12. Walter LC, Brand RJ, Counsell SR, et al. Development and validation of a prognostic index for 1-year mortality in older adults after hospitalization. JAMA. 2001;285(23):2987-2994. PubMed
13. Allen LA, Hernandez AF, Peterson ED, et al. Discharge to a skilled nursing facility and subsequent clinical outcomes among older patients hospitalized for heart failure. Circ Heart Fail. 2011;4(3):293-300. PubMed
14. 42 CFR 483.40 – Physician services. US government Publishing Office. https://www.gpo.gov/fdsys/granule/CFR-2011-title42-vol5/CFR-2011-title42-vol5-sec483-40. Published October 1, 2011. Accessed August 31, 2016.
15. Office of Inspector General. Adverse Events in Skilled Nursing Facilities: National Incidence among Medicare Beneficiaries. OEI-06-11-00370. February 2014. http://oig.hhs.gov/oei/reports/oei-06-11-00370.pdf. Accessed March 22, 2016.
16. Hasan O, Meltzer DO, Shaykevich SA, et al. Hospital readmission in general medicine patients: a prediction model. J Gen Intern Med. 2010;25(3):211-219. PubMed
17. Boult C, Dowd B, McCaffrey D, Boult L, Hernandez R, Krulewitch H. Screening elders for risk of hospital admission. J Am Geriatr Soc. 1993;41(8):811-817. PubMed
18. Silverstein MD, Qin H, Mercer SQ, Fong J, Haydar Z. Risk factors for 30-day hospital readmission in patients ≥65 years of age. Proc (Bayl Univ Med Cent). 2008;21(4):363-372. PubMed
19. Donzé J, Aujesky D, Williams D, Schnipper JL. Potentially avoidable 30-day hospital readmissions in medical patients: derivation and validation of a prediction model. JAMA Intern Med. 2013;173(8):632-638. PubMed
20. Donzé JD, Williams MV, Robinson EJ, et al. International validity of the HOSPITAL score to predict 30-day potentially avoidable hospital readmissions. JAMA Intern Med. 2016;176(4):496-502. PubMed
21. Kim LD, Kou L, Messinger-Rapport BJ, Rothberg MB. Validation of the HOSPITAL score for 30-day all-cause readmissions of patients discharged to skilled nursing facilities. J Am Med Dir Assoc. 2016;17(9):e15-e18. PubMed
22. Kane RL, Keckhafer G, Flood S, Bershardsky B, Siadaty MS. The effect of Evercare on hospital use. J Am Geriatr Soc. 2003;51(10):1427-1434. PubMed
23. Ouslander JG, Lamb G, Tappen R, et al. Interventions to reduce hospitalizations from nursing homes: Evaluation of the INTERACT II collaboration quality improvement project. J Am Geriatr Soc. 2011;59(4):745-753. PubMed
24. Cost drivers for dually eligible beneficiaries: Potentially avoidable hospitalizations from nursing facility, skilled nursing facility, and home and community based service waiver programs. http://www.cms.gov/Research-Statistics-Data-and-Systems/Statistics-Trends-and-Reports/Reports/downloads/costdriverstask2.pdf. Accessed August 31, 2016.
25. H.R. 4302 (113th), Section 215, Protecting Access to Medicare Act of 2014 (PAMA). April 2, 2014. https://www.govtrack.us/congress/bills/113/hr4302/text. Accessed August 31, 2016.
Approximately 20% of hospitalized Medicare beneficiaries in the U.S. are discharged to skilled nursing facilities (SNFs) for post-acute care,1,2 and 23.5% of these patients are readmitted within 30 days.3 Because hospital readmissions are costly and associated with worse outcomes,4,5 30-day readmission rates are considered a quality indicator,6 and there are financial penalties for hospitals with higher than expected rates.7 As a result, hospitals invest substantial resources in programs to reduce readmissions.8-10 The SNFs represent an attractive target for readmission reduction efforts, since SNFs contribute a disproportionate share of readmissions.3,4 Because SNF patients are in a monitored environment with high medication adherence, risk factors for readmission likely differ between patients discharged to SNFs and those sent home. For example, 1 study showed that among heart failure patients with cognitive impairment, those discharged to SNFs had lower readmissions during the first 20 days, likely due to better medication adherence.11 Patients discharged to SNFs generally have more complex illnesses, lower functional status, and higher 1-year mortality than patients discharged to the community.12,13 Despite this, SNF patients might have infrequent contact with physicians. Federal regulations require only that patients discharged to SNFs need to be seen within 30 days and then at least once every 30 days thereafter.14 According to the 2014 Office of Inspector General report, one-third of Medicare beneficiaries in SNFs experience adverse events from substandard treatment, inadequate resident monitoring and failure or delay of necessary care, most of which are thought to be preventable.15
To address this issue, the Cleveland Clinic developed a program called “Connected Care SNF,” in which hospital-employed physicians and advanced practice professionals visit patients in selected SNFs 4 to 5 times per week, for the purpose of reducing preventable readmissions. The aim of this study was to assess whether the program reduced 30-day readmissions, and to identify which patients benefited most from the program.
METHODS
Setting and Intervention
The Cleveland Clinic main campus is a tertiary academic medical center with 1400 beds and approximately 50,000 admissions per year. In late 2012, the Cleveland Clinic implemented the Connected Care SNF program, wherein Cleveland Clinic physicians regularly visited patients who were discharged from the Cleveland Clinic main campus to 7 regional SNFs. Beginning in December 2012, these 7 high-volume referral SNFs that were not part of the Cleveland Clinic Health System (CCHS) agreed to participate in the program, which focused on reducing avoidable hospital readmissions and delivering quality care (Table 1). The Connected Care team, comprised of 2 geriatricians (1 of whom was also a palliative medicine specialist), 1 internist, 1 family physician, and 5 advanced practice professionals (nurse practitioners and physician assistants), provided medical services at the participating SNFs. These providers aimed to see patients 4 to 5 times per week, were available on site during working hours, and provided telephone coverage at nights and on weekends. All providers had access to hospital electronic medical records and could communicate with the discharging physician and with specialists familiar with the patient as needed. Prior to the admission, providers were informed about patient arrival and, at the time of admission to the SNF, providers reviewed medications and discussed goals of care with patients and their families. In the SNF, providers worked closely with staff members to deliver medications and timely treatment. They also met monthly with multidisciplinary teams for continuous quality improvement and to review outcomes. Patients at Connected Care SNFs who had their own physicians, including most long-stay and some short-stay residents, did not receive the Connected Care intervention. They constituted less than 10% of the patients discharged from Cleveland Clinic main campus.
Study Design and Population
We reviewed administrative and clinical data from a retrospective cohort of patients discharged to SNF from the Cleveland Clinic main campus from January 1, 2011 to December 31, 2014. We included all patients who were discharged to an SNF during the study period. Our main outcome measure was 30-day all-cause readmissions to any hospital in the Cleveland Clinic Health System (CCHS), including the main campus and 8 regional community hospitals. Study patients were followed until January 30, 2015 to capture 30-day readmissions. According to 2012 Medicare data, of CCHS patients who were readmitted within 30 days, 83% of pneumonia, 81% of major joint replacement, 72% of heart failure and 57% of acute myocardial infarction patients were readmitted to a CCHS facility. As the Cleveland Clinic main campus attracts cardiac patients from a 100+-mile radius, they may be more likely to seek care readmission near home and are not reflective of CCHS patients overall. Because we did not have access to readmissions data from non-CCHS hospitals, we excluded patients who were discharged to SNFs beyond a 25-mile radius from the main campus, where they may be more likely to utilize non-CCHS hospitals for acute hospitalization. We also excluded patients discharged to non-CCHS hospital-based SNFs, which may refer readmissions to their own hospital system. Because the Connected Care program began in December 2012, the years 2011-2012 served as the baseline period. The intervention was conducted at 7 SNFs. All other SNFs within the 25-mile radius were included as controls, except for 3 hospital-based SNFs that would be unlikely to admit patients to CCHS. We compared the change in all-cause 30-day readmission rates after implementation of Connected Care, using all patients discharged to SNFs within 25 miles to control for temporal changes in local readmission rates. Discharge to specific SNFs was determined solely by patient choice.
Data Collection
For each patient, we collected the following data that has been shown to be associated with readmissions:16-18 demographics (age, race, sex, ZIP code), lab values on discharge (hemoglobin and sodium); hemodialysis status; medicine or surgical service; elective surgery or nonelective surgery; details of the index admission index (diagnosis-related group [DRG], Medicare severity-diagnosis-related groups [MS-DRG] weight, primary diagnosis code; principal procedure code; admission date; discharge date, length of stay, and post-acute care provider); and common comorbidities, as listed in Table 2. We also calculated each patient’s HOSPITAL19,20 score. The HOSPITAL score was developed to predict risk of preventable 30-day readmissions,19 but it has also been validated to predict 30-day all-cause readmission rates for patients discharged to SNF.21 The model contains 7 elements (hemoglobin, oncology service, sodium, procedure, index type, admissions within the last year, length of stay) (supplemental Table).Patients with a high score (7 or higher) have a 41% chance of readmission, while those with a low score (4 or lower) have only a 15% chance. 21 We assessed all cause 30-day readmission status from CCHS administrative data. Observation patients and outpatient same-day surgeries were not considered to be admissions. For patients with multiple admissions, each admission was counted as a separate index hospitalization. Cleveland Clinic’s Institutional Review Board approved the study.
Statistical Analysis
For the 7 intervention SNFs, patient characteristics were summarized as means and standard deviations or frequencies and percentages for the periods of 2011-2012 and 2013-2014, respectively, and the 2 periods were compared using the Student t test or χ2 test as appropriate.
Mixed-effects logistic regression models were used to model 30-day readmission rates. Since the intervention was implemented in the last quarter of 2012, we examined the difference in readmission rates before and after that time point. The model included the following fixed effects: SNF type (intervention or usual care), time points (quarters of 2011-2014), whether the time is pre- or postintervention (binary), and the 3-way interaction between SNF type, pre- or postintervention and time points, and patient characteristics. The model also contained a Gaussian random effect at the SNF level to account for possible correlations among the outcomes of patients from the same SNF. For each quarter, the mean adjusted readmission rates of 2 types of SNFs were calculated from the fitted mixed models and plotted over time. Furthermore, we compared the mean readmission rates of the 2 groups in the pre- and postintervention periods. Subgroup analyses were performed for medical and surgical patients, and for patients in the low, intermediate and high HOSPITAL score groups.
All analyses were performed using RStudio (Boston, Massachusetts). Statistical significance was established with 2-sided P values less than 0.05.
RESULTS
We identified 119 SNFs within a 25-mile radius of the hospital. Of these, 6 did not receive any referrals. Three non-CCHS hospital-based SNFs were excluded, leaving a total of 110 SNFs in the study sample: 7 intervention SNFs and 103 usual-care SNFs. Between January 2011 and December 2014, there were 23,408 SNF discharges from Cleveland Clinic main campus, including 13,544 who were discharged to study SNFs (Supplemental Figure). Of these, 3334 were discharged to 7 intervention SNFs and 10,210 were discharged to usual care SNFs. Characteristics of patients in both periods appear in Table 2. At baseline, patients in the intervention and control SNFs varied in a number of ways. Patients at intervention SNFs were older (75.6 vs. 70.2 years; P < 0.001), more likely to be African American (45.5% vs. 35.9%; P < 0.001), female (61% vs. 55.4%; P < 0.001) and to be insured by Medicare (85.2% vs. 71.4%; P < 0.001). Both groups had similar proportions of patients with high, intermediate, and low readmission risk as measured by HOSPITAL score. Compared to the 2011-2012 pre-intervention period, during the 2013-2014 intervention period, there were more surgeries (34.3% vs. 41.9%; P < 0.001), more elective surgeries (21.8% vs. 25.5%; P = 0.01), fewer medical patients (65.7% vs. 58.1%; P < 0.001), and an increase in comorbidities, including myocardial infarction, peripheral vascular disease, and liver disease (Table 2).
Table 3 shows adjusted 30-day readmissions rates, before and during the intervention period at the intervention and usual care SNFs. Compared to the pre-intervention period, 30-day all-cause adjusted readmission rates declined in the intervention SNFs (28.1% to 21.7%, P < 0.001), while it increased slightly at control sites (27.1% to 28.5%, P < 0.001). The Figure shows the adjusted 30-day readmission rates by quarter throughout the study period.
Declines in 30-day readmission rates were greater for medical patients (31.0% to 24.6%, P < 0.001) than surgical patients (22.4% to 17.7%, P < 0.001). Patients with high HOSPITAL scores had the greatest decline, while those with low HOSPITAL scores had smaller declines.
DISCUSSION
In this retrospective study of 4 years of discharges to 110 SNFs, we report on the impact of a Connected Care program, in which a physician visited patients on admission to the SNF and 4 to 5 times per week during their stay. Introduction of the program was followed by a 6.8% absolute reduction in all-cause 30-day readmission rates compared to usual care. The absolute reductions ranged from 4.6% for patients at low risk for readmission to 9.1% for patients at high risk, and medical patients benefited more than surgical patients.
Most studies of interventions to reduce hospital readmissions have focused on patients discharged to the community setting.7-9 Interventions have centered on discharge planning, medication reconciliation, and close follow-up to assess for medication adherence and early signs of deterioration. Because patients in SNFs have their medications administered by staff and are under frequent surveillance, such interventions are unlikely to be helpful in this population. We found no studies that focus on short-stay or skilled patients discharged to SNF. Two studies have demonstrated that interventions can reduce hospitalization from nursing homes.22,23 Neither study included readmissions. The Evercare model consisted of nurse practitioners providing active primary care services within the nursing home, as well as offering incentive payments to nursing homes for not hospitalizing patients.22 During a 2-year period, long term residents who enrolled in Evercare had an almost 50% reduction in incident hospitalizations compared to those who did not.22 INTERACT II was a quality improvement intervention that provided tools, education, and strategies to help identify and manage acute conditions proactively.23 In 25 nursing homes employing INTERACT II, there was a 17% reduction in self-reported hospital admissions during the 6-month project, with higher rates of reduction among nursing homes rated as more engaged in the process.23 Although nursing homes may serve some short-stay or skilled patients, they generally serve long-term populations, and studies have shown that short-stay patients are at higher risk for 30-day readmissions.24
There are a number of reasons that short-term SNF patients are at higher risk for readmission. Although prior to admission, they were considered hospital level of care and received a physician visit daily, on transfer to the SNF, relatively little medical care is available. Current federal regulations regarding physician services at a SNF require the resident to be seen by a physician at least once every 30 days for the first 90 days after admission, and at least once every 60 days thereafter.25
The Connected Care program physicians provided a smooth transition of care from hospital to SNF as well as frequent reassessment. Physicians were alerted prior to hospital discharge and performed an initial comprehensive visit generally on the day of admission to the SNF and always within 48 hours. The initial evaluation is important because miscommunication during the handoff from hospital to SNF may result in incorrect medication regimens or inaccurate assessments. By performing prompt medication reconciliation and periodic reassessments of a patient’s medical condition, the Connected Care providers recreate some of the essential elements of successful outpatient readmissions prevention programs.
They also worked together with each SNF’s interdisciplinary team to deliver quality care. There were monthly meetings at each participating Connected Care SNF. Physicians reviewed monthly 30-day readmissions and performed root-cause analysis. When they discovered challenges to timely medication and treatment delivery during daily rounds, they provided in-services to SNF nurses.
In addition, Connected Care providers discussed goals of care—something that is often overlooked on admission to a SNF. This is particularly important because patients with chronic illnesses who are discharged to SNF often have poor prognoses. For example, Medicare patients with heart failure who are discharged to SNFs have 1-year mortality in excess of 50%.13 By implementing a plan of care consistent with patient and family goals, inappropriate readmissions for terminal patients may be avoided.
Reducing readmissions is important for hospitals because under the Hospital Readmissions Reduction Program, hospitals now face substantial penalties for higher than expected readmissions rates. Hospitals involved in bundled payments or other total cost-of-care arrangements have additional incentive to avoid readmissions. Beginning in 2019, SNFs will also receive incentive payments based on their 30-day all-cause hospital readmissions as part of the Skilled Nursing Facility Value-Based Purchasing program.25 The Connected Care model offers 1 means of achieving this goal through partnership between hospitals and SNFs.
Our study has several limitations. First, our study was observational in nature, so the observed reduction in readmissions could have been due to temporal trends unrelated to the intervention. However, no significant reduction was noted during the same time period in other area SNFs. There was also little change in the characteristics of patients admitted to the intervention SNFs. Importantly, the HOSPITAL score, which can predict 30-day readmission rates,20 did not change throughout the study period. Second, the results reflect patients discharged from a single hospital and may not be generalizable to other geographic areas. However, because the program included 7 SNFs, we believe it could be reproduced in other settings. Third, our readmissions measure included only those patients who returned to a CCHS facility. Although we may have missed some readmissions to other hospital systems, such leakage is uncommon—more than 80% of CCHS patients are readmitted to CCHS facilities—and would be unlikely to differ across the short duration of the study. Finally, at the intervention SNFs, most long-stay and some short-stay residents did not receive the Connected Care intervention because they were cared for by their own physicians who did not participate in Connected Care. Had these patients’ readmissions been excluded from our results, the intervention might appear even more effective.
CONCLUSION
A Connected Care intervention reduced 30-day readmission rates among patients discharged to SNFs from a tertiary academic center. While all subgroups had substantial reductions in readmissions following the implementation of the intervention, patients who are at the highest risk of readmission benefited the most. Further study is necessary to know whether Connected Care can be reproduced in other health care systems and whether it reduces overall costs.
Acknowledgments
The authors would like to thank Michael Felver, MD, and teams for their clinical care of patients; Michael Felver, MD, William Zafirau, MD, Dan Blechschmid, MHA, and Kathy Brezine, and Seth Vilensky, MBA, for their administrative support; and Brad Souder, MPT, for assistance with data collection.
Disclosure
Nothing to report.
1. Medicare Payment Advisory Commission. Report to the Congress: Medicare Payment Policy. Chapter 8. Skilled Nursing Facility Services. March 2013. http://www.medpac.gov/docs/default-source/reports/mar13_entirereport.pdf?sfvrsn=0. Accessed March 1, 2017.
2. Kim DG, Messinger-Rapport BJ. Clarion call for a dedicated clinical and research approach to post-acute care. J Am Med Dir Assoc. 2014;15(8):607. e1-e3. PubMed
3. Mor V, Intrator O, Feng Z, Grabowski D. The revolving door of rehospitalization from skilled nursing facilities. Health Aff. 2010;29(1):57-64. PubMed
4. Jencks SF, Williams MV, Coleman EA. Rehospitalizations among patients in the Medicare fee-for-service program. N Engl J Med. 2009;360(14):1418-1428. PubMed
5. Creditor MC. Hazards of hospitalization of the elderly. Ann Intern Med 1993;118(3):219-223. PubMed
6. Van Walraven C, Bennett C, Jennings A, Austin PC, Forester AJ. Proportion of hospital readmissions deemed avoidable: a systematic review. CMAJ. 2011;183(7):E391-E402. PubMed
7. Brenson RA, Paulus RA, Kalman NS. Medicare’s readmissions-reduction program – a positive alternative. N Engl J Med 2012;366(15):1364-1366. PubMed
8. Jack BW, Chetty VK, Anthony D, et al. A reengineered hospital discharge program to decrease rehospitalization: a randomized trial. Ann Intern Med. 2009;150(3):178-187. PubMed
9. Naylor MD, Brooten D, Campbell R, et al. Comprehensive discharge planning and home follow-up of hospitalized elders: a randomized clinical trial. JAMA. 1999;281(7):613-620. PubMed
10. Coleman EA, Parry C, Chalmers S, Min SJ. The care transition intervention: results of a randomized controlled trial. Arch Intern Med. 2006;166(17):1822-1828. PubMed
11. Patel A, Parikh R, Howell EH, Hsich E, Landers SH, Gorodeski EZ. Mini-cog performance: novel marker of post discharge risk among patients hospitalized for heart failure. Circ Heart Fail. 2015;8(1):8-16. PubMed
12. Walter LC, Brand RJ, Counsell SR, et al. Development and validation of a prognostic index for 1-year mortality in older adults after hospitalization. JAMA. 2001;285(23):2987-2994. PubMed
13. Allen LA, Hernandez AF, Peterson ED, et al. Discharge to a skilled nursing facility and subsequent clinical outcomes among older patients hospitalized for heart failure. Circ Heart Fail. 2011;4(3):293-300. PubMed
14. 42 CFR 483.40 – Physician services. US government Publishing Office. https://www.gpo.gov/fdsys/granule/CFR-2011-title42-vol5/CFR-2011-title42-vol5-sec483-40. Published October 1, 2011. Accessed August 31, 2016.
15. Office of Inspector General. Adverse Events in Skilled Nursing Facilities: National Incidence among Medicare Beneficiaries. OEI-06-11-00370. February 2014. http://oig.hhs.gov/oei/reports/oei-06-11-00370.pdf. Accessed March 22, 2016.
16. Hasan O, Meltzer DO, Shaykevich SA, et al. Hospital readmission in general medicine patients: a prediction model. J Gen Intern Med. 2010;25(3):211-219. PubMed
17. Boult C, Dowd B, McCaffrey D, Boult L, Hernandez R, Krulewitch H. Screening elders for risk of hospital admission. J Am Geriatr Soc. 1993;41(8):811-817. PubMed
18. Silverstein MD, Qin H, Mercer SQ, Fong J, Haydar Z. Risk factors for 30-day hospital readmission in patients ≥65 years of age. Proc (Bayl Univ Med Cent). 2008;21(4):363-372. PubMed
19. Donzé J, Aujesky D, Williams D, Schnipper JL. Potentially avoidable 30-day hospital readmissions in medical patients: derivation and validation of a prediction model. JAMA Intern Med. 2013;173(8):632-638. PubMed
20. Donzé JD, Williams MV, Robinson EJ, et al. International validity of the HOSPITAL score to predict 30-day potentially avoidable hospital readmissions. JAMA Intern Med. 2016;176(4):496-502. PubMed
21. Kim LD, Kou L, Messinger-Rapport BJ, Rothberg MB. Validation of the HOSPITAL score for 30-day all-cause readmissions of patients discharged to skilled nursing facilities. J Am Med Dir Assoc. 2016;17(9):e15-e18. PubMed
22. Kane RL, Keckhafer G, Flood S, Bershardsky B, Siadaty MS. The effect of Evercare on hospital use. J Am Geriatr Soc. 2003;51(10):1427-1434. PubMed
23. Ouslander JG, Lamb G, Tappen R, et al. Interventions to reduce hospitalizations from nursing homes: Evaluation of the INTERACT II collaboration quality improvement project. J Am Geriatr Soc. 2011;59(4):745-753. PubMed
24. Cost drivers for dually eligible beneficiaries: Potentially avoidable hospitalizations from nursing facility, skilled nursing facility, and home and community based service waiver programs. http://www.cms.gov/Research-Statistics-Data-and-Systems/Statistics-Trends-and-Reports/Reports/downloads/costdriverstask2.pdf. Accessed August 31, 2016.
25. H.R. 4302 (113th), Section 215, Protecting Access to Medicare Act of 2014 (PAMA). April 2, 2014. https://www.govtrack.us/congress/bills/113/hr4302/text. Accessed August 31, 2016.
© 2017 Society of Hospital Medicine
Hospital Antipsychotic Use
Antipsychotic medications are frequently used off label for management of behavioral symptoms associated with delirium and/or dementia. Despite regulations designed to curb inappropriate prescribing of these medications in nursing homes, substantial levels of use and variation in use have been observed in this setting.[1] Although antipsychotic medications are also frequently used in the hospital, the scope and variation in use have not been adequately investigated. Given the lack of oversight for medication prescribing in the hospital setting and the frequency of delirium, occurring in 15% to 26% of hospitalized older adults,[2, 3, 4] off‐label use of antipsychotic medications and variation in use could be substantial.
Because variation in practice is known to increase in the setting of controversy or lack of clarity regarding appropriate management,[5] large degrees of variation can draw attention to priority areas for clinical effectiveness studies, and the need for guidelines, clinical decision support, or regulatory oversight. In the absence of clear guidelines for the use of antipsychotic medication in nonpsychiatric hospitalized patients, we hypothesized that significant variation in use would persist after controlling for patient characteristics. Using a large, nationally representative cohort of admissions to 300 hospitals from July 2009 to June 2010, we sought to investigate prescribing patterns and hospital variation in use of antipsychotic medications in nonpsychiatric admissions to US hospitals.
METHODS
Setting and Data Collection
We conducted a retrospective cohort study using data from 300 US, nonfederal, acute care facilities contributing to the database maintained by Premier (Premier Healthcare Solutions, Inc., Charlotte, NC). This nationally representative database, created to measure healthcare utilization and quality of care, is drawn from voluntarily participating hospitals and contains data on approximately 1 in every 4 discharges nationwide.[6] Participating hospitals are similar in geographic distribution and urban/rural status to hospitals nationwide, although large, nonteaching hospitals are slightly over‐represented. The study was approved by the institutional review board at Beth Israel Deaconess Medical Center.
Inclusion and Exclusion Criteria
We studied a cohort of all adult (18 years) nonpsychiatric admissions to participating hospitals from July 1, 2009 through June 30, 2010. We excluded patients admitted to a psychiatry service or with any discharge diagnosis of a psychotic disorder (defined by the Elixhauser comorbidity Psychoses: 295.00‐298.9, 299.10‐299.11), because we were interested in use of antipsychotics for conditions other than primary psychiatric disorders. We also excluded patients with a charge for labor and delivery owing to the nonrepresentativeness of this patient population for the general hospitalized patient. We excluded admissions with unknown gender, and admissions with a length of stay greater than 365 days, as these admissions are not representative of the typical admission to an acute care hospital. We also excluded hospitals contributing less than 100 admissions owing to lack of precision in corresponding hospital prescribing rates.
Antipsychotic Medication Utilization
In‐hospital antipsychotic use was ascertained from pharmacy charges, reflecting each medication dispensed during the hospitalization. We categorized antipsychotic medications as typical (haloperidol, loxapine, thioridazine, molindone, thiothixine, pimozide, fluphenazine, trifluoperazine, chlorpromazine, and perphenazine) and atypical (aripiprazole, asenapine, clozapine, iloperidone, lurasidone, olanzapine, paliperidone, quetiapine, risperidone, and ziprasidone) based on classification by the Food and Drug Administration.[7, 8] We excluded prochlorperazine (Compazine) from our typical antipsychotic definition, as this medication is almost exclusively used as an antiemetic.
In the absence of guidelines for use of antipsychotic agents in hospitalized patients, we used the Centers for Medicare and Medicaid Services (CMS) guidelines for long‐term care facilities to define measures of potentially excessive dosing in the hospital setting.[9] These guidelines define the daily dosage levels of antipsychotics above which the medical necessity of the higher dose should be explained in the medical record. We defined any daily dosage above these specified levels as a potentially excessive daily dose.
Characteristics Associated With Use
We investigated the association between antipsychotic use and patient and hospital characteristics, selected based on clinical grounds. Patient characteristics included: (1) demographic variables such as age (<65, 6574, 75+ years), gender, self‐reported race, marital status, and primary insurance; (2) admission characteristic variables, including admitting department (surgical vs nonsurgical, defined by a surgical attending of record and presence of operating room charges), whether the patient spent any time in the intensive care unit (ICU), and whether they received mechanical ventilation; and (3) potential indications for use, including delirium (included delirium superimposed upon dementia), dementia (without delirium), and insomnia (see Supporting Information, Appendix, in the online version of this article for International Classification of Diseases, Ninth Revision, Clinical Modification [ICD‐9‐CM] codes). Hospital characteristics included number of beds, urban versus rural status, teaching status, and US Census region.
Statistical Analysis
We report the proportion of admissions with in‐hospital use of any antipsychotic, and the number of days of exposure, overall and stratified by typical and atypical.
We determined potentially excessive dosing by taking the sum of the doses for a specific antipsychotic charged on a given day and comparing it to the CMS guidelines for long‐term care settings described above. We report the percentage of exposed admissions with at least 1 day of potentially excessive dosing.
All multivariable models below were operationalized as generalized estimating equations with a Poisson error term, log link, robust variance estimator,[10] and an exchangeable correlation structure to account for repeated admissions of the same patient.
We investigated patient and hospital characteristics associated with use of any antipsychotic medication using a multivariable model that simultaneously included all patient and hospital characteristics in Table 1 as independent variables.
| % of Cohort | Any Exposure, % | Typical Exposure, % | Atypical Exposure, % | |
|---|---|---|---|---|
| ||||
| Patient characteristics | ||||
| Age group, y | ||||
| <65 | 52.1 | 4.6 | 2.0 | 3.1 |
| 6574 | 18.5 | 5.2 | 2.7 | 3.1 |
| 75+ | 29.4 | 8.8 | 4.6 | 5.4 |
| Gender | ||||
| Male | 43.8 | 6.6 | 3.6 | 3.8 |
| Female | 56.2 | 5.5 | 2.3 | 3.8 |
| Race | ||||
| White | 64.6 | 6.1 | 2.9 | 4.0 |
| Black | 13.5 | 5.5 | 2.8 | 3.3 |
| Hispanic | 5.0 | 4.9 | 2.2 | 3.2 |
| Other | 19.9 | 6.1 | 3.1 | 3.7 |
| Marital Status | ||||
| Married | 42.5 | 4.6 | 2.4 | 2.7 |
| Single | 46.7 | 7.2 | 3.2 | 4.7 |
| Unknown/other | 10.8 | 6.4 | 3.1 | 4.1 |
| Primary insurance | ||||
| Private (commercial) | 28.8 | 3.0 | 1.5 | 1.8 |
| Medicaid | 10.3 | 6.4 | 2.4 | 4.6 |
| Medicare managed | 10.6 | 7.1 | 4.1 | 4.0 |
| Medicare traditional | 40.9 | 8.0 | 3.7 | 5.3 |
| Self‐pay or other | 9.4 | 4.3 | 2.5 | 2.2 |
| Admitting department | ||||
| Surgical | 60.6 | 5.8 | 3.1 | 3.4 |
| Nonsurgical | 39.4 | 6.2 | 2.4 | 4.4 |
| Any ICU stay | 16.6 | 10.4 | 7.2 | 4.9 |
| Mechanical ventilation | 4.7 | 17.4 | 12.9 | 7.9 |
| Diagnoses | ||||
| Delirium | 3.2 | 28.6 | 19.4 | 15.7 |
| Dementia | 3.1 | 27.4 | 12.0 | 20.2 |
| Insomnia | 1.3 | 10.2 | 3.9 | 7.5 |
| Discharge disposition | ||||
| Home | 77.9 | 3.8 | 1.6 | 2.5 |
| SNF/Rehab | 15.5 | 13.7 | 6.8 | 9.0 |
| Hospice | 1.7 | 16.0 | 10.3 | 8.1 |
| Other | 4.9 | 11.6 | 7.6 | 5.7 |
| Hospital characteristics, % | ||||
| No. of beds | ||||
| 200 | 14.1 | 6.1 | 2.8 | 3.8 |
| 201300 | 18.6 | 6.1 | 2.9 | 3.9 |
| 301500 | 37.7 | 5.9 | 2.9 | 3.7 |
| 500+ | 29.7 | 5.9 | 2.8 | 3.8 |
| Population served | ||||
| Urban | 89.4 | 6.0 | 2.9 | 3.8 |
| Rural | 10.6 | 5.8 | 2.4 | 3.9 |
| Teaching status | ||||
| Teaching | 39.2 | 5.8 | 2.9 | 3.7 |
| Nonteaching | 60.8 | 6.0 | 2.8 | 3.9 |
| US Census region | ||||
| West | 16.9 | 5.9 | 3.2 | 3.5 |
| Northeast | 20.1 | 6.1 | 2.9 | 3.9 |
| Midwest | 21.9 | 5.7 | 2.5 | 3.8 |
| South | 41.0 | 6.1 | 2.9 | 3.9 |
To determine hospital variation in antipsychotic use, we first determined the proportion of admissions at each hospital with at least 1 charge for antipsychotic medication. We then divided hospitals into quintiles based on their facility‐level antipsychotic prescribing rates and assigned all admissions to their corresponding hospital quintile. We then used a multivariable model to measure the adjusted association between prescribing quintile and patient‐level receipt of antipsychotic medication, controlling for all patient characteristics listed in Table 1 (except discharge disposition), and comorbidities using the Healthcare Cost and Utilization Project Comorbidity Software version 3.7 (Agency for Healthcare Research and Quality, Rockville, MD).[11] We used the lowest prescribing quintile as the reference group. We also report in the Supporting Information, Appendix, in the online version of this article, the distribution of prescribing rates for the hospitals in our cohort before and after adjustment for patient characteristics. For both approaches, we conducted stratified analyses in admissions with delirium and dementia.
All analyses were carried out using SAS software (SAS Institute Inc., Cary, NC).
RESULTS
Admission Characteristics
There were 3,190,934 admissions aged 18 years and over to 300 hospitals from July 1, 2009 to June 30, 2010. After excluding admissions with unknown gender (n = 17), length of stay greater than 365 days (n = 25), charges for labor and delivery (n = 323,111) or a psychiatric attending of record or psychiatric comorbidity (n = 172,669), and admissions to hospitals with fewer than 100 admissions (n = 31), our cohort included 2,695,081 admissions. The median age was 63 years (25th, 75th percentile 48, 77 years), and 1,514,986 (56%) were women. Table 1 shows the overall admission characteristics of the cohort and the percent exposed to antipsychotics among each patient and hospital characteristic.
Antipsychotic Use
There were 160,773 (6%) admissions with antipsychotic exposure. Among exposed admissions, 102,148 (64%) received atypical and 76,979 (48%) received typical antipsychotics, with 18,354 (11%) exposed to both. The median (25th, 75th percentile) length of stay among exposed was 5 days (3, 9 days), and the median (25th, 75th percentile) number of days of exposure was 3 (1, 5 days) overall, 3 days (2, 6 days) for atypical and 2 days (1, 3 days) for typical exposure.
Among admissions aged 65 to 74 years, 25,855 (5%) were exposed. Among admissions aged 75 years or older, 69,792 (9%) were exposed. Among admissions with delirium, exposure occurred in 24,787 (29%), with 13,640 (55%) receiving atypical, 16,828 (68%) receiving typical, and 5681 (23%) exposed to both. Among admissions with dementia, exposure occurred in 23,179 (27%), with 17,068 (74%) receiving atypical, 10,108 (44%) receiving typical, and 3997 (17%) exposed to both.
Use of Specific Drugs and Potentially Excessive Dosing
Table 2 demonstrates the most commonly used antipsychotic medications and the rates of potentially excessive dosing. Quetiapine and olanzapine were the most commonly used atypical antipsychotics, and haloperidol represented the majority of typical antipsychotic use. Among admissions with antipsychotic exposure, 47% received at least 1 potentially excessive daily dose, 18% of those with atypical exposure and 79% of those with typical exposure. Among admissions aged 65 years and up (n = 1,291,375), the prevalence of potentially excessive dosing was almost identical; 46% received at least 1 daily dose in excess of the recommended daily dose, 11% of those with atypical exposure and 79% of those with typical exposure.
| Agent |
Overall Prevalence,N = 2,695,081 |
% of Exposed With Potentially Excessive Dosing* | ||
|---|---|---|---|---|
| Within 100% of Recommended DD* | 101% to 150% of Recommended DD* | >150% of Recommended DD* | ||
| ||||
| Any antipsychotic | 6.0 | 52.9 | 20.2 | 26.9 |
| Atypical | 3.8 | 82.0 | 5.4 | 12.6 |
| Quetiapine (200) | 1.8 | 81.7 | 5.7 | 12.6 |
| Olanzapine (10) | 0.6 | 73.7 | 7.3 | 19.0 |
| Risperidone (2) | 0.9 | 79.2 | 6.8 | 14.0 |
| Other | 0.7 | 98.3 | 0.1 | 1.6 |
| Typical | 2.9 | 21.1 | 37.0 | 41.9 |
| Haloperidol (4) | 2.5 | 13.2 | 41.3 | 45.5 |
| Chlorpromazine (75) | 0.3 | 76.0 | 9.8 | 14.2 |
| Other | 0.4 | 89.1 | 2.9 | 8.0 |
Characteristics Associated With Antipsychotic Use
Among the patient and hospital characteristics included in our analysis, the 5 characteristics most strongly associated with antipsychotic exposure after adjustment were (Table 3): delirium (relative risk [RR]: 2.93, 95% confidence interval [CI]: 2.88‐2.98); dementia (RR: 2.78, 95% CI: 2.72‐2.83); insurance status, with higher risk among patients with traditional Medicare (RR: 2.09, 95% CI: 2.04‐2.13), Medicare managed (RR: 1.98, 95% CI: 1.93‐2.03), Medicaid (RR: 1.84, 95% CI: 1.80‐1.88), and self‐pay/other (RR: 1.26, 95% CI: 1.23‐1.29) compared to private (commercial) insurance; use of mechanical ventilation (RR: 1.84, 95% CI: 1.81‐1.87); and any ICU stay (RR: 1.53, 95% CI: 1.51‐1.55).
| Unadjusted RR of Receiving Any Antipsychotic [95% CI] | Adjusted RR of Receiving Any Antipsychotic [95% CI]* | |
|---|---|---|
| ||
| Age group, y, % | ||
| <65 | Reference | Reference |
| 6574 | 1.12 [1.10,1.14] | 0.74 [0.72, 0.75] |
| 75+ | 1.90 [1.88,1.92] | 1.03 [1.01, 1.05] |
| Gender | ||
| Female | Reference | Reference |
| Male | 1.19 [1.18,1.20] | 1.27 [1.26, 1.28] |
| Race | ||
| White | Reference | Reference |
| Black | 0.91 [0.90,0.92] | 0.85 [0.83, 0.86] |
| Hispanic | 0.80 [0.78,0.82] | 0.79 [0.76, 0.81] |
| Other | 0.99 [0.98,1.00] | 0.96 [0.95, 0.98] |
| Marital status | ||
| Married | Reference | Reference |
| Single | 1.57 [1.55,1.59] | 1.43 [1.42, 1.45] |
| Unknown/other | 1.41 [1.39,1.43] | 1.27 [1.24, 1.29] |
| Primary insurance | ||
| Private (commercial) | Reference | Reference |
| Medicaid | 2.13 [2.09,2.17] | 1.84 [1.80, 1.88] |
| Medicare managed | 2.35 [2.31,2.39] | 1.98 [1.93, 2.03] |
| Medicare traditional | 2.65 [2.61,2.69] | 2.09 [2.04, 2.13] |
| Self‐pay or other | 1.41 [1.38,1.44] | 1.26 [1.23, 1.29] |
| Admitting department | ||
| Surgical | Reference | Reference |
| Nonsurgical | 1.06 [1.05,1.07] | 1.05 [1.03, 1.06] |
| Any ICU stay | 2.05 [2.03,2.07] | 1.53 [1.51, 1.55] |
| Mechanical ventilation | 3.22 [3.18,3.26] | 1.84 [1.81, 1.87] |
| Diagnoses | ||
| Delirium | 5.48 [5.42, 5.45] | 2.93 [2.88, 2.98] |
| Dementia | 5.21 [5.15,5.27] | 2.78 [2.72, 2.83] |
| Insomnia | 1.72 [1.67,1.78] | 1.51 [1.45, 1.57] |
| No. of beds | ||
| 200 | Reference | Reference |
| 201300 | 1.01 [0.99,1.03] | 0.96 [0.94, 0.98] |
| 301500 | 0.98 [0.97,1.00] | 0.93 [0.91, 0.95] |
| 500+ | 0.97 [0.96,0.98] | 0.91 [0.90, 0.93] |
| Population served | ||
| Urban | Reference | Reference |
| Rural | 0.96 [0.95,0.98] | 0.91 [0.89, 0.93] |
| Teaching status | ||
| Teaching | Reference | Reference |
| Nonteaching | 1.03 [1.02,1.04] | 0.98 [0.97, 1.00] |
| US Census region | ||
| West | Reference | Reference |
| Northeast | 1.03 [1.01,1.05] | 1.04 [1.02, 1.06] |
| Midwest | 0.95 [0.94,0.97] | 0.93 [0.91, 0.94] |
| South | 1.02 [1.01,1.03] | 1.07 [1.05, 1.09] |
Hospital Variation in Antipsychotic Use
Figure 1 demonstrates the antipsychotic prescribing rate at each hospital in our cohort, and the corresponding quintiles. Patients admitted to hospitals in the highest prescribing quintile were more than twice as likely to be exposed to antipsychotics compared to patients admitted to hospitals in the lowest prescribing quintile, even after adjustment for patient characteristics and comorbidities (Table 4). This relationship was similar across subgroups of admissions with delirium and dementia (see Supporting Information, Appendix, in the online version of this article for the distribution of hospital antipsychotic prescribing rates before and after adjustment for patient characteristics).
| Admissions, No. (% of Total) | Unadjusted RR of Exposure [95% CI] | Adjusted RR of exposure [95% CI]* | |
|---|---|---|---|
| |||
| Overall | |||
| Q1 | 431,017 (16%) | Reference | Reference |
| Q2 | 630,486 (23%) | 1.67 [1.63, 1.71] | 1.59 [1.55, 1.62] |
| Q3 | 548,337 (20%) | 1.93 [1.88, 1.97] | 1.84 [1.80, 1.88] |
| Q4 | 639,027 (24%) | 2.16 [2.12, 2.21] | 2.07 [2.03, 2.12] |
| Q5 | 446,214 (17%) | 2.83 [2.77, 2.89] | 2.56 [2.50, 2.61] |
| Delirium | |||
| Q1 | 12,878 (15%) | Reference | Reference |
| Q2 | 20,588 (24%) | 1.58 [1.51, 1.65] | 1.58 [1.51, 1.65] |
| Q3 | 17,402 (20%) | 1.71 [1.64, 1.80] | 1.73 [1.65, 1.82] |
| Q4 | 20,943 (24%) | 2.01 [1.92, 2.10] | 1.99 [1.91, 2.08] |
| Q5 | 14,883 (17%) | 2.15 [2.05, 2.25] | 2.16 [2.07, 2.26] |
| Dementia | |||
| Q1 | 28,290 (15%) | Reference | Reference |
| Q2 | 42,018 (22%) | 1.43 [1.36, 1.50] | 1.40 [1.34, 1.47] |
| Q3 | 38,593 (21%) | 1.61 [1.53, 1.69] | 1.59 [1.51, 1.66] |
| Q4 | 44,638 (24%) | 1.69 [1.62, 1.77] | 1.69 [1.61, 1.77] |
| Q5 | 34,442 (18%) | 1.92 [1.83, 2.01] | 1.90 [1.81, 1.99] |
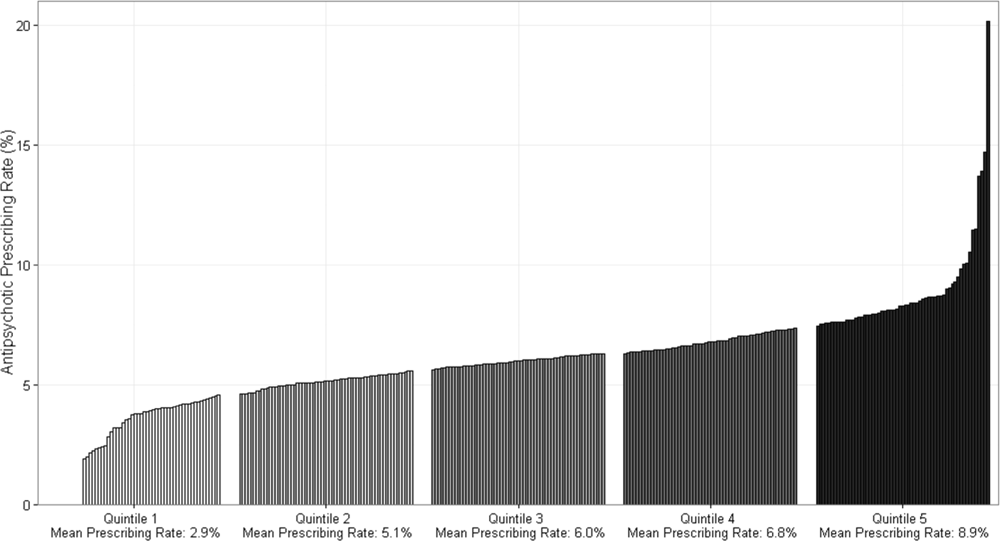
DISCUSSION
In this cohort of nonpsychiatric admissions to 300 US hospitals, antipsychotic medications were used in 6% of admissions, with atypical antipsychotics representing the majority of use. Potentially excessive daily doses based on CMS recommendations for long‐term care facilities occurred in almost half of admissions with any antipsychotic exposure, and in 87% of admissions with haloperidol exposure specifically. We found variation in hospital use of antipsychotics that was not fully accounted for by measured patient characteristics, and which persisted among subgroups of admissions with delirium and/or dementia. Although unmeasured patient characteristics or different billing practices between hospitals are potential explanations, our findings also raise the possibility of different hospital antipsychotic prescribing cultures. These findings provide new information regarding the scope of prescribing in US hospitals, and draw attention to the need for additional studies to better define what constitutes appropriate use of antipsychotics in the hospital setting.
A recent single‐center study at a large academic medical center found an overall antipsychotic exposure rate of 9% of nonpsychiatric admissions.[12] Our finding that 6% of admissions in this multicenter cohort were exposed to antipsychotics is slightly lower, but similar to the previous estimate. Assuming 37 million discharges from US hospitals each year,[13] our study suggests that more than 2 million hospitalized patients receive antipsychotics annually. With around 1.4 million residents in nursing homes on any given day,[14] and an exposure rate of 25% to 30% in that setting,[15, 16, 17] our study suggests that the number of patients exposed in the hospital setting is greater than the number exposed in the nursing home setting, the site of care for which prescribing regulations have been focused thus far.
Because our dataset does not contain preadmission medications, we were unable to specifically investigate new initiation. In the prior single‐center study, approximately 55% of overall use in the hospital setting was new initiation,[12] which would suggest that antipsychotics are newly initiated in around 1 million admissions each year in the hospital. Although we are unable to determine reason for use in our analysis, delirium was a strong predictor of antipsychotic use in our multivariable model, and prior studies have demonstrated delirium to be the most common reason for antipsychotic initiation in hospitalized patients,[12, 18] an indication for which efficacy/effectiveness data are lacking. A recent systematic review of antipsychotics for the treatment of delirium in older adults concluded that because of severe methodological limitations, the small number of existing studies on this topic do not support the use of antipsychotics in the treatment of delirium in older hospitalized adults.[19] Our results further highlight the need for randomized placebo‐controlled trials of antipsychotics in treatment of delirium.
We found variation in antipsychotic use between hospitals that was not fully explained by patient characteristics. Insufficient data to inform clinical decisions surrounding management of agitated delirium/dementia and lack of clear criteria by which to judge appropriateness of antipsychotic use may contribute to this variation. Some variation may relate to resource allocation at different hospitals, and the feasibility of implementing nonpharmacologic management options across settings. Our results collectively highlight the need for studies evaluating the efficacy/effectiveness of antipsychotics in the treatment of delirium and drivers of physician decision‐making in this realm, as well as the need for greater hospital investment in nonpharmacologic delirium‐prevention programs, which have been shown to be effective in prevention of delirium in hospitalized patients.[20]
We observed high levels of potentially excessive daily dosing using cutoffs applied in the long‐term care setting. The majority of the potentially excessive doses were in the setting of typical antipsychotic use, and haloperidol specifically, where doses exceeded 4 mg on at least 1 day in 87% of exposed admissions. Of note, the threshold for haloperidol dosage above which justification is required was decreased from 4 to 2 mg per day in the 2015 update to the CMS guidelines.[21] For the present analysis, we used the guidelines that were contemporaneous to our cohort; we are unable to determine current rates of potentially inappropriate dosages in the present analysis, but given the high prevalence in 2009 to 2010, and the lowering of the dosage threshold since then, it is unlikely that any decrease in use would be enough to substantially reduce the estimate. Whether these high dosages are actually inappropriate in the hospital setting is not established, and we were not able to review medical records to determine whether justification for use of such doses was documented.[22, 23] It is possible that hospitalized patients with altered pharmacodynamics and greater severity of illness could require larger doses of these medications; however, this is an area in need of further investigation, and current critical care guidelines note the lack of sufficient data upon which to justify use of haloperidol in the prevention or treatment of delirium in ICU patients.[24, 25]
The dosages in use are concerning given that the risk of extrapyramidal side effects increases with increasing dose, and prior studies have demonstrated an association between increased dose of antipsychotics and increased risk of other adverse events, including hip fracture and sudden cardiac death.[22, 23] Further, despite these known risks, studies have demonstrated failure to follow recommendations to mitigate risk,[26] such as electrocardiogram monitoring in individuals receiving intravenous haloperidol.[27] Our results suggest that physicians are similarly not following recommendations to use lower doses of haloperidol when treating older patients, given the almost identical incidence of potentially excessive dosing among admissions of patients aged 65 years and older in our cohort.[25] Clinical decision support prompts have been effective at increasing appropriate use of antipsychotic medications in several single‐center analyses,[28, 29, 30] and widespread implementation of such support with a focus on haloperidol dosing should be considered on the basis of our results.
The patient characteristics associated with antipsychotic use in this large, nationally representative analysis are consistent with those identified in prior single‐center analyses.[12, 18] Both prior analyses identified delirium as the most common reason for antipsychotic use, and dementia, intensive care unit stay, and mechanical ventilation were also previously identified as strong predictors of use that we believe hold face validity for the practicing hospitalist. On the other hand, some of the factors associated with antipsychotic use in our model cannot be readily explained, such as insurance status and race, and may be serving as proxies for other variables not included in our analysis. That nonwhite patients are less likely than white patients to receive antipsychotic medications in the hospital has been previously demonstrated,[12] and further investigation to understand this disparity is warranted.
Our study has several additional limitations. First, because our study is observational, the possibility of residual confounding exists, and we cannot rule out that there are other patient factors driving the hospital variation in antipsychotic use that we observed. Second, because guidelines do not exist for antipsychotic dosing in hospitalized patients, we could only comment on potentially excessive dosing, extrapolating from guidelines in the long‐term care setting. Whether such doses are actually excessive in hospitalized patients is not defined. Third, although Premier performs quality checks on charge and ICD‐9‐CM coding data submitted by participating hospitals, the validity of administrative data is uncertain. For example, the use of administrative data to identify delirium diagnoses is likely to have resulted in underestimation of delirium incidence among our different exposure groups. Delirium is likely to be coded more often in the setting of more severe or hyperactive cases, when antipsychotics are more likely to be utilized. This could result in an overestimation of the association between delirium and antipsychotic use. Additionally, differences in coding practices between hospitals for any of the variables in our models could explain some of the variation in antipsychotic prescribing that we observed. Finally, because we were unable to differentiate between new initiation and continuation of a preadmission antipsychotic, some of the variation that we observed is likely to reflect differences in outpatient antipsychotic prescribing practices.
In conclusion, in this large cohort of nonpsychiatric admissions to 300 US hospitals, we found that antipsychotic medication exposure was common, often at high daily doses. Delirium and dementia were the strongest predictors of use among the patient and hospital characteristics examined. The variation in antipsychotic prescribing that we observed was not fully accounted for by measured patient characteristics, and raises the possibility of differing hospital prescribing cultures. Our results draw attention to the need for additional research to better define what constitutes appropriate use of these potentially harmful medications in the hospital setting.
Disclosures: Dr. Herzig had full access to all of the data in the study and takes responsibility for the integrity of the data and the accuracy of the data analysis. Study concept and design: Drs. Herzig, Rothberg, Gurwitz, and Marcantonio. Acquisition of data: Dr. Herzig. Analysis of data: Mr. Guess. Interpretation of data: Drs. Herzig, Rothberg, Gurwitz, Marcantonio, and Mr. Guess. Drafting of the manuscript: Dr. Herzig. Critical revision of the manuscript for important intellectual content: Drs. Rothberg, Gurwitz, Marcantonio, and Mr. Guess. Dr. Herzig was funded by grant number K23AG042459 from the National Institute on Aging. Dr. Marcantonio was funded by grant number K24AG035075 from the National Institute on Aging. The funding organizations had no involvement in any aspect of the study, including design and conduct of the study; collection, management, analysis, and interpretation of the data; and preparation, review, or approval of the manuscript. The authors report no conflicts of interest.
- , , , et al. Variation in nursing home antipsychotic prescribing rates. Arch Intern Med. 2007;167(7):676–683.
- , . Precipitating factors for delirium in hospitalized elderly persons. Predictive model and interrelationship with baseline vulnerability. JAMA. 1996;275(11):852–857.
- , , , , . A predictive model for delirium in hospitalized elderly medical patients based on admission characteristics. Ann Intern Med. 1993;119(6):474–481.
- , , , , , . Delirium in hospitalized older persons: outcomes and predictors. J Am Geriatr Soc. 1994;42(8):809–815.
- , , , . Small‐area variations in the use of common surgical procedures: an international comparison of New England, England, and Norway. N Engl J Med. 1982;307(21):1310–1314.
- Premier Research Services. Available at: https://www.premierinc.com/transforming‐healthcare/healthcare‐performance‐improvement/premier‐research‐services. Accessed March 15, 2016.
- U.S. Food and Drug Administration. Atypical antipsychotic drugs information. Available at: http://www.fda.gov/drugs/drugsafety/postmarketdrugsafetyinformationforpatientsandproviders/ucm094303.htm. Accessed November 1, 2015.
- U.S. Food and Drug Administration. Information on conventional antipsychotics. Available at: http://www.fda.gov/drugs/drugsafety/postmarketdrugsafetyinformationforpatientsandproviders/ucm107211. htm. Accessed November 1, 2015.
- Centers for Medicare and Medicaid Services. State Operations Manual. Appendix PP: guidance to surveyors for long‐term care facilities. Available at: https://www.cms.gov/Medicare/Provider‐Enrollment‐and‐Certification/GuidanceforLawsAndRegulations/Downloads/som107 ap_pp_guidelines_ltcf.pdf. Revised October 14, 2005. Accessed March 15, 2016.
- . A modified Poisson regression approach to prospective studies with binary data. Am J Epidemiol. 2004;159(7):702–706.
- Healthcare Cost and Utilization Project. Comorbidity software, version 3.7. Agency for Healthcare Research and Quality, Rockville, MD. Available at: http://www.hcup‐us.ahrq.gov/toolssoftware/comorbidity/comorbidity.jsp. Accessed March 15, 2016.
- , , , et al. Antipsychotic use in hospitalized adults: rates, indications, and predictors. J Am Geriatr Soc. 2016;64(2):299–305.
- , . Overview of hospital stays in the United States, 2012. HCUP Statistical Brief #180. Agency for Healthcare Research and Quality, Rockville, MD. Available at: http://www.hcup‐us.ahrq.gov/reports/statbriefs/sb180‐Hospitalizations‐United‐States‐2012.pdf. Published October 2014. Accessed June 29, 2015.
- , , , . Long‐term care services in the United States: 2013 overview. Vital Health Stat 3. 2013;(37):1–107. Available at: http://www.cdc.gov/nchs/data/nsltcp/long_term_care_services_2013.pdf. Accessed March 16, 2016.
- , , , et al. The quality of antipsychotic drug prescribing in nursing homes. Arch Intern Med. 2005;165(11):1280–1285.
- , , , , , . Unexplained variation across US nursing homes in antipsychotic prescribing rates. Arch Intern Med. 2010;170(1):89–95.
- , , , , . Broadened use of atypical antipsychotics: safety, effectiveness, and policy challenges. Health Aff (Millwood). 2009;28(5):w770–w781.
- , , , , , . From hospital to community: use of antipsychotics in hospitalized elders. J Hosp Med. 2014;9(12):802–804.
- , , . Antipsychotics in the treatment of delirium in older hospitalized adults: a systematic review. J Am Geriatr Soc. 2011;59(suppl 2):S269–S276.
- , , , et al. Effectiveness of multicomponent nonpharmacological delirium interventions: a meta‐analysis. JAMA Intern Med. 2015;175(4):512–520.
- Centers for Medicare and Medicaid Services. State operations manual, appendix PP: guidance to surveyors for long‐term care facilities. Available at: https://www.cms.gov/Regulations‐and‐Guidance/Guidance/Manuals/downloads/som107ap_pp_guidelines_ltcf.pdf. Revised October 9, 2015. Accessed February 22, 2016.
- , , , , . Psychotropic drug use and the risk of hip fracture. N Engl J Med. 1987;316(7):363–369.
- , , , , . Atypical antipsychotic drugs and the risk of sudden cardiac death. N Engl J Med. 2009;360(3):225–235.
- , , , et al. Clinical practice guidelines for the management of pain, agitation, and delirium in adult patients in the intensive care unit. Crit Care Med. 2013;41(1):263–306.
- , , , , . Haloperidol overdosing in the treatment of agitated hospitalized older people with delirium: a retrospective chart review from a community teaching hospital. Drugs Aging. 2013;30(8):639–644.
- , , , . Unsafe use of intravenous haloperidol: evaluation of recommendation‐concordant care in hospitalized elderly adults. J Am Geriatr Soc. 2013;61(1):160–161.
- U.S. Food and Drug Administration. HALDOL brand of haloperidol injection. Available at: http://www.accessdata.fda.gov/drugsatfda_docs/label/2008/015923s082,018701s057lbl.pdf. Accessed February 23, 2016.
- , , , . Preventing potentially inappropriate medication use in hospitalized older patients with a computerized provider order entry warning system. Arch Intern Med. 2010;170(15):1331–1336.
- , , , et al. A standardized, bundled approach to providing geriatric‐focused acute care. J Am Geriatr Soc. 2014;62(5):936–942.
- , , , . Don't fuel the fire: decreasing intravenous haloperidol use in high risk patients via a customized electronic alert. J Am Med Inform Assoc. 2014;21(6):1109–1112.
Antipsychotic medications are frequently used off label for management of behavioral symptoms associated with delirium and/or dementia. Despite regulations designed to curb inappropriate prescribing of these medications in nursing homes, substantial levels of use and variation in use have been observed in this setting.[1] Although antipsychotic medications are also frequently used in the hospital, the scope and variation in use have not been adequately investigated. Given the lack of oversight for medication prescribing in the hospital setting and the frequency of delirium, occurring in 15% to 26% of hospitalized older adults,[2, 3, 4] off‐label use of antipsychotic medications and variation in use could be substantial.
Because variation in practice is known to increase in the setting of controversy or lack of clarity regarding appropriate management,[5] large degrees of variation can draw attention to priority areas for clinical effectiveness studies, and the need for guidelines, clinical decision support, or regulatory oversight. In the absence of clear guidelines for the use of antipsychotic medication in nonpsychiatric hospitalized patients, we hypothesized that significant variation in use would persist after controlling for patient characteristics. Using a large, nationally representative cohort of admissions to 300 hospitals from July 2009 to June 2010, we sought to investigate prescribing patterns and hospital variation in use of antipsychotic medications in nonpsychiatric admissions to US hospitals.
METHODS
Setting and Data Collection
We conducted a retrospective cohort study using data from 300 US, nonfederal, acute care facilities contributing to the database maintained by Premier (Premier Healthcare Solutions, Inc., Charlotte, NC). This nationally representative database, created to measure healthcare utilization and quality of care, is drawn from voluntarily participating hospitals and contains data on approximately 1 in every 4 discharges nationwide.[6] Participating hospitals are similar in geographic distribution and urban/rural status to hospitals nationwide, although large, nonteaching hospitals are slightly over‐represented. The study was approved by the institutional review board at Beth Israel Deaconess Medical Center.
Inclusion and Exclusion Criteria
We studied a cohort of all adult (18 years) nonpsychiatric admissions to participating hospitals from July 1, 2009 through June 30, 2010. We excluded patients admitted to a psychiatry service or with any discharge diagnosis of a psychotic disorder (defined by the Elixhauser comorbidity Psychoses: 295.00‐298.9, 299.10‐299.11), because we were interested in use of antipsychotics for conditions other than primary psychiatric disorders. We also excluded patients with a charge for labor and delivery owing to the nonrepresentativeness of this patient population for the general hospitalized patient. We excluded admissions with unknown gender, and admissions with a length of stay greater than 365 days, as these admissions are not representative of the typical admission to an acute care hospital. We also excluded hospitals contributing less than 100 admissions owing to lack of precision in corresponding hospital prescribing rates.
Antipsychotic Medication Utilization
In‐hospital antipsychotic use was ascertained from pharmacy charges, reflecting each medication dispensed during the hospitalization. We categorized antipsychotic medications as typical (haloperidol, loxapine, thioridazine, molindone, thiothixine, pimozide, fluphenazine, trifluoperazine, chlorpromazine, and perphenazine) and atypical (aripiprazole, asenapine, clozapine, iloperidone, lurasidone, olanzapine, paliperidone, quetiapine, risperidone, and ziprasidone) based on classification by the Food and Drug Administration.[7, 8] We excluded prochlorperazine (Compazine) from our typical antipsychotic definition, as this medication is almost exclusively used as an antiemetic.
In the absence of guidelines for use of antipsychotic agents in hospitalized patients, we used the Centers for Medicare and Medicaid Services (CMS) guidelines for long‐term care facilities to define measures of potentially excessive dosing in the hospital setting.[9] These guidelines define the daily dosage levels of antipsychotics above which the medical necessity of the higher dose should be explained in the medical record. We defined any daily dosage above these specified levels as a potentially excessive daily dose.
Characteristics Associated With Use
We investigated the association between antipsychotic use and patient and hospital characteristics, selected based on clinical grounds. Patient characteristics included: (1) demographic variables such as age (<65, 6574, 75+ years), gender, self‐reported race, marital status, and primary insurance; (2) admission characteristic variables, including admitting department (surgical vs nonsurgical, defined by a surgical attending of record and presence of operating room charges), whether the patient spent any time in the intensive care unit (ICU), and whether they received mechanical ventilation; and (3) potential indications for use, including delirium (included delirium superimposed upon dementia), dementia (without delirium), and insomnia (see Supporting Information, Appendix, in the online version of this article for International Classification of Diseases, Ninth Revision, Clinical Modification [ICD‐9‐CM] codes). Hospital characteristics included number of beds, urban versus rural status, teaching status, and US Census region.
Statistical Analysis
We report the proportion of admissions with in‐hospital use of any antipsychotic, and the number of days of exposure, overall and stratified by typical and atypical.
We determined potentially excessive dosing by taking the sum of the doses for a specific antipsychotic charged on a given day and comparing it to the CMS guidelines for long‐term care settings described above. We report the percentage of exposed admissions with at least 1 day of potentially excessive dosing.
All multivariable models below were operationalized as generalized estimating equations with a Poisson error term, log link, robust variance estimator,[10] and an exchangeable correlation structure to account for repeated admissions of the same patient.
We investigated patient and hospital characteristics associated with use of any antipsychotic medication using a multivariable model that simultaneously included all patient and hospital characteristics in Table 1 as independent variables.
| % of Cohort | Any Exposure, % | Typical Exposure, % | Atypical Exposure, % | |
|---|---|---|---|---|
| ||||
| Patient characteristics | ||||
| Age group, y | ||||
| <65 | 52.1 | 4.6 | 2.0 | 3.1 |
| 6574 | 18.5 | 5.2 | 2.7 | 3.1 |
| 75+ | 29.4 | 8.8 | 4.6 | 5.4 |
| Gender | ||||
| Male | 43.8 | 6.6 | 3.6 | 3.8 |
| Female | 56.2 | 5.5 | 2.3 | 3.8 |
| Race | ||||
| White | 64.6 | 6.1 | 2.9 | 4.0 |
| Black | 13.5 | 5.5 | 2.8 | 3.3 |
| Hispanic | 5.0 | 4.9 | 2.2 | 3.2 |
| Other | 19.9 | 6.1 | 3.1 | 3.7 |
| Marital Status | ||||
| Married | 42.5 | 4.6 | 2.4 | 2.7 |
| Single | 46.7 | 7.2 | 3.2 | 4.7 |
| Unknown/other | 10.8 | 6.4 | 3.1 | 4.1 |
| Primary insurance | ||||
| Private (commercial) | 28.8 | 3.0 | 1.5 | 1.8 |
| Medicaid | 10.3 | 6.4 | 2.4 | 4.6 |
| Medicare managed | 10.6 | 7.1 | 4.1 | 4.0 |
| Medicare traditional | 40.9 | 8.0 | 3.7 | 5.3 |
| Self‐pay or other | 9.4 | 4.3 | 2.5 | 2.2 |
| Admitting department | ||||
| Surgical | 60.6 | 5.8 | 3.1 | 3.4 |
| Nonsurgical | 39.4 | 6.2 | 2.4 | 4.4 |
| Any ICU stay | 16.6 | 10.4 | 7.2 | 4.9 |
| Mechanical ventilation | 4.7 | 17.4 | 12.9 | 7.9 |
| Diagnoses | ||||
| Delirium | 3.2 | 28.6 | 19.4 | 15.7 |
| Dementia | 3.1 | 27.4 | 12.0 | 20.2 |
| Insomnia | 1.3 | 10.2 | 3.9 | 7.5 |
| Discharge disposition | ||||
| Home | 77.9 | 3.8 | 1.6 | 2.5 |
| SNF/Rehab | 15.5 | 13.7 | 6.8 | 9.0 |
| Hospice | 1.7 | 16.0 | 10.3 | 8.1 |
| Other | 4.9 | 11.6 | 7.6 | 5.7 |
| Hospital characteristics, % | ||||
| No. of beds | ||||
| 200 | 14.1 | 6.1 | 2.8 | 3.8 |
| 201300 | 18.6 | 6.1 | 2.9 | 3.9 |
| 301500 | 37.7 | 5.9 | 2.9 | 3.7 |
| 500+ | 29.7 | 5.9 | 2.8 | 3.8 |
| Population served | ||||
| Urban | 89.4 | 6.0 | 2.9 | 3.8 |
| Rural | 10.6 | 5.8 | 2.4 | 3.9 |
| Teaching status | ||||
| Teaching | 39.2 | 5.8 | 2.9 | 3.7 |
| Nonteaching | 60.8 | 6.0 | 2.8 | 3.9 |
| US Census region | ||||
| West | 16.9 | 5.9 | 3.2 | 3.5 |
| Northeast | 20.1 | 6.1 | 2.9 | 3.9 |
| Midwest | 21.9 | 5.7 | 2.5 | 3.8 |
| South | 41.0 | 6.1 | 2.9 | 3.9 |
To determine hospital variation in antipsychotic use, we first determined the proportion of admissions at each hospital with at least 1 charge for antipsychotic medication. We then divided hospitals into quintiles based on their facility‐level antipsychotic prescribing rates and assigned all admissions to their corresponding hospital quintile. We then used a multivariable model to measure the adjusted association between prescribing quintile and patient‐level receipt of antipsychotic medication, controlling for all patient characteristics listed in Table 1 (except discharge disposition), and comorbidities using the Healthcare Cost and Utilization Project Comorbidity Software version 3.7 (Agency for Healthcare Research and Quality, Rockville, MD).[11] We used the lowest prescribing quintile as the reference group. We also report in the Supporting Information, Appendix, in the online version of this article, the distribution of prescribing rates for the hospitals in our cohort before and after adjustment for patient characteristics. For both approaches, we conducted stratified analyses in admissions with delirium and dementia.
All analyses were carried out using SAS software (SAS Institute Inc., Cary, NC).
RESULTS
Admission Characteristics
There were 3,190,934 admissions aged 18 years and over to 300 hospitals from July 1, 2009 to June 30, 2010. After excluding admissions with unknown gender (n = 17), length of stay greater than 365 days (n = 25), charges for labor and delivery (n = 323,111) or a psychiatric attending of record or psychiatric comorbidity (n = 172,669), and admissions to hospitals with fewer than 100 admissions (n = 31), our cohort included 2,695,081 admissions. The median age was 63 years (25th, 75th percentile 48, 77 years), and 1,514,986 (56%) were women. Table 1 shows the overall admission characteristics of the cohort and the percent exposed to antipsychotics among each patient and hospital characteristic.
Antipsychotic Use
There were 160,773 (6%) admissions with antipsychotic exposure. Among exposed admissions, 102,148 (64%) received atypical and 76,979 (48%) received typical antipsychotics, with 18,354 (11%) exposed to both. The median (25th, 75th percentile) length of stay among exposed was 5 days (3, 9 days), and the median (25th, 75th percentile) number of days of exposure was 3 (1, 5 days) overall, 3 days (2, 6 days) for atypical and 2 days (1, 3 days) for typical exposure.
Among admissions aged 65 to 74 years, 25,855 (5%) were exposed. Among admissions aged 75 years or older, 69,792 (9%) were exposed. Among admissions with delirium, exposure occurred in 24,787 (29%), with 13,640 (55%) receiving atypical, 16,828 (68%) receiving typical, and 5681 (23%) exposed to both. Among admissions with dementia, exposure occurred in 23,179 (27%), with 17,068 (74%) receiving atypical, 10,108 (44%) receiving typical, and 3997 (17%) exposed to both.
Use of Specific Drugs and Potentially Excessive Dosing
Table 2 demonstrates the most commonly used antipsychotic medications and the rates of potentially excessive dosing. Quetiapine and olanzapine were the most commonly used atypical antipsychotics, and haloperidol represented the majority of typical antipsychotic use. Among admissions with antipsychotic exposure, 47% received at least 1 potentially excessive daily dose, 18% of those with atypical exposure and 79% of those with typical exposure. Among admissions aged 65 years and up (n = 1,291,375), the prevalence of potentially excessive dosing was almost identical; 46% received at least 1 daily dose in excess of the recommended daily dose, 11% of those with atypical exposure and 79% of those with typical exposure.
| Agent |
Overall Prevalence,N = 2,695,081 |
% of Exposed With Potentially Excessive Dosing* | ||
|---|---|---|---|---|
| Within 100% of Recommended DD* | 101% to 150% of Recommended DD* | >150% of Recommended DD* | ||
| ||||
| Any antipsychotic | 6.0 | 52.9 | 20.2 | 26.9 |
| Atypical | 3.8 | 82.0 | 5.4 | 12.6 |
| Quetiapine (200) | 1.8 | 81.7 | 5.7 | 12.6 |
| Olanzapine (10) | 0.6 | 73.7 | 7.3 | 19.0 |
| Risperidone (2) | 0.9 | 79.2 | 6.8 | 14.0 |
| Other | 0.7 | 98.3 | 0.1 | 1.6 |
| Typical | 2.9 | 21.1 | 37.0 | 41.9 |
| Haloperidol (4) | 2.5 | 13.2 | 41.3 | 45.5 |
| Chlorpromazine (75) | 0.3 | 76.0 | 9.8 | 14.2 |
| Other | 0.4 | 89.1 | 2.9 | 8.0 |
Characteristics Associated With Antipsychotic Use
Among the patient and hospital characteristics included in our analysis, the 5 characteristics most strongly associated with antipsychotic exposure after adjustment were (Table 3): delirium (relative risk [RR]: 2.93, 95% confidence interval [CI]: 2.88‐2.98); dementia (RR: 2.78, 95% CI: 2.72‐2.83); insurance status, with higher risk among patients with traditional Medicare (RR: 2.09, 95% CI: 2.04‐2.13), Medicare managed (RR: 1.98, 95% CI: 1.93‐2.03), Medicaid (RR: 1.84, 95% CI: 1.80‐1.88), and self‐pay/other (RR: 1.26, 95% CI: 1.23‐1.29) compared to private (commercial) insurance; use of mechanical ventilation (RR: 1.84, 95% CI: 1.81‐1.87); and any ICU stay (RR: 1.53, 95% CI: 1.51‐1.55).
| Unadjusted RR of Receiving Any Antipsychotic [95% CI] | Adjusted RR of Receiving Any Antipsychotic [95% CI]* | |
|---|---|---|
| ||
| Age group, y, % | ||
| <65 | Reference | Reference |
| 6574 | 1.12 [1.10,1.14] | 0.74 [0.72, 0.75] |
| 75+ | 1.90 [1.88,1.92] | 1.03 [1.01, 1.05] |
| Gender | ||
| Female | Reference | Reference |
| Male | 1.19 [1.18,1.20] | 1.27 [1.26, 1.28] |
| Race | ||
| White | Reference | Reference |
| Black | 0.91 [0.90,0.92] | 0.85 [0.83, 0.86] |
| Hispanic | 0.80 [0.78,0.82] | 0.79 [0.76, 0.81] |
| Other | 0.99 [0.98,1.00] | 0.96 [0.95, 0.98] |
| Marital status | ||
| Married | Reference | Reference |
| Single | 1.57 [1.55,1.59] | 1.43 [1.42, 1.45] |
| Unknown/other | 1.41 [1.39,1.43] | 1.27 [1.24, 1.29] |
| Primary insurance | ||
| Private (commercial) | Reference | Reference |
| Medicaid | 2.13 [2.09,2.17] | 1.84 [1.80, 1.88] |
| Medicare managed | 2.35 [2.31,2.39] | 1.98 [1.93, 2.03] |
| Medicare traditional | 2.65 [2.61,2.69] | 2.09 [2.04, 2.13] |
| Self‐pay or other | 1.41 [1.38,1.44] | 1.26 [1.23, 1.29] |
| Admitting department | ||
| Surgical | Reference | Reference |
| Nonsurgical | 1.06 [1.05,1.07] | 1.05 [1.03, 1.06] |
| Any ICU stay | 2.05 [2.03,2.07] | 1.53 [1.51, 1.55] |
| Mechanical ventilation | 3.22 [3.18,3.26] | 1.84 [1.81, 1.87] |
| Diagnoses | ||
| Delirium | 5.48 [5.42, 5.45] | 2.93 [2.88, 2.98] |
| Dementia | 5.21 [5.15,5.27] | 2.78 [2.72, 2.83] |
| Insomnia | 1.72 [1.67,1.78] | 1.51 [1.45, 1.57] |
| No. of beds | ||
| 200 | Reference | Reference |
| 201300 | 1.01 [0.99,1.03] | 0.96 [0.94, 0.98] |
| 301500 | 0.98 [0.97,1.00] | 0.93 [0.91, 0.95] |
| 500+ | 0.97 [0.96,0.98] | 0.91 [0.90, 0.93] |
| Population served | ||
| Urban | Reference | Reference |
| Rural | 0.96 [0.95,0.98] | 0.91 [0.89, 0.93] |
| Teaching status | ||
| Teaching | Reference | Reference |
| Nonteaching | 1.03 [1.02,1.04] | 0.98 [0.97, 1.00] |
| US Census region | ||
| West | Reference | Reference |
| Northeast | 1.03 [1.01,1.05] | 1.04 [1.02, 1.06] |
| Midwest | 0.95 [0.94,0.97] | 0.93 [0.91, 0.94] |
| South | 1.02 [1.01,1.03] | 1.07 [1.05, 1.09] |
Hospital Variation in Antipsychotic Use
Figure 1 demonstrates the antipsychotic prescribing rate at each hospital in our cohort, and the corresponding quintiles. Patients admitted to hospitals in the highest prescribing quintile were more than twice as likely to be exposed to antipsychotics compared to patients admitted to hospitals in the lowest prescribing quintile, even after adjustment for patient characteristics and comorbidities (Table 4). This relationship was similar across subgroups of admissions with delirium and dementia (see Supporting Information, Appendix, in the online version of this article for the distribution of hospital antipsychotic prescribing rates before and after adjustment for patient characteristics).
| Admissions, No. (% of Total) | Unadjusted RR of Exposure [95% CI] | Adjusted RR of exposure [95% CI]* | |
|---|---|---|---|
| |||
| Overall | |||
| Q1 | 431,017 (16%) | Reference | Reference |
| Q2 | 630,486 (23%) | 1.67 [1.63, 1.71] | 1.59 [1.55, 1.62] |
| Q3 | 548,337 (20%) | 1.93 [1.88, 1.97] | 1.84 [1.80, 1.88] |
| Q4 | 639,027 (24%) | 2.16 [2.12, 2.21] | 2.07 [2.03, 2.12] |
| Q5 | 446,214 (17%) | 2.83 [2.77, 2.89] | 2.56 [2.50, 2.61] |
| Delirium | |||
| Q1 | 12,878 (15%) | Reference | Reference |
| Q2 | 20,588 (24%) | 1.58 [1.51, 1.65] | 1.58 [1.51, 1.65] |
| Q3 | 17,402 (20%) | 1.71 [1.64, 1.80] | 1.73 [1.65, 1.82] |
| Q4 | 20,943 (24%) | 2.01 [1.92, 2.10] | 1.99 [1.91, 2.08] |
| Q5 | 14,883 (17%) | 2.15 [2.05, 2.25] | 2.16 [2.07, 2.26] |
| Dementia | |||
| Q1 | 28,290 (15%) | Reference | Reference |
| Q2 | 42,018 (22%) | 1.43 [1.36, 1.50] | 1.40 [1.34, 1.47] |
| Q3 | 38,593 (21%) | 1.61 [1.53, 1.69] | 1.59 [1.51, 1.66] |
| Q4 | 44,638 (24%) | 1.69 [1.62, 1.77] | 1.69 [1.61, 1.77] |
| Q5 | 34,442 (18%) | 1.92 [1.83, 2.01] | 1.90 [1.81, 1.99] |
DISCUSSION
In this cohort of nonpsychiatric admissions to 300 US hospitals, antipsychotic medications were used in 6% of admissions, with atypical antipsychotics representing the majority of use. Potentially excessive daily doses based on CMS recommendations for long‐term care facilities occurred in almost half of admissions with any antipsychotic exposure, and in 87% of admissions with haloperidol exposure specifically. We found variation in hospital use of antipsychotics that was not fully accounted for by measured patient characteristics, and which persisted among subgroups of admissions with delirium and/or dementia. Although unmeasured patient characteristics or different billing practices between hospitals are potential explanations, our findings also raise the possibility of different hospital antipsychotic prescribing cultures. These findings provide new information regarding the scope of prescribing in US hospitals, and draw attention to the need for additional studies to better define what constitutes appropriate use of antipsychotics in the hospital setting.
A recent single‐center study at a large academic medical center found an overall antipsychotic exposure rate of 9% of nonpsychiatric admissions.[12] Our finding that 6% of admissions in this multicenter cohort were exposed to antipsychotics is slightly lower, but similar to the previous estimate. Assuming 37 million discharges from US hospitals each year,[13] our study suggests that more than 2 million hospitalized patients receive antipsychotics annually. With around 1.4 million residents in nursing homes on any given day,[14] and an exposure rate of 25% to 30% in that setting,[15, 16, 17] our study suggests that the number of patients exposed in the hospital setting is greater than the number exposed in the nursing home setting, the site of care for which prescribing regulations have been focused thus far.
Because our dataset does not contain preadmission medications, we were unable to specifically investigate new initiation. In the prior single‐center study, approximately 55% of overall use in the hospital setting was new initiation,[12] which would suggest that antipsychotics are newly initiated in around 1 million admissions each year in the hospital. Although we are unable to determine reason for use in our analysis, delirium was a strong predictor of antipsychotic use in our multivariable model, and prior studies have demonstrated delirium to be the most common reason for antipsychotic initiation in hospitalized patients,[12, 18] an indication for which efficacy/effectiveness data are lacking. A recent systematic review of antipsychotics for the treatment of delirium in older adults concluded that because of severe methodological limitations, the small number of existing studies on this topic do not support the use of antipsychotics in the treatment of delirium in older hospitalized adults.[19] Our results further highlight the need for randomized placebo‐controlled trials of antipsychotics in treatment of delirium.
We found variation in antipsychotic use between hospitals that was not fully explained by patient characteristics. Insufficient data to inform clinical decisions surrounding management of agitated delirium/dementia and lack of clear criteria by which to judge appropriateness of antipsychotic use may contribute to this variation. Some variation may relate to resource allocation at different hospitals, and the feasibility of implementing nonpharmacologic management options across settings. Our results collectively highlight the need for studies evaluating the efficacy/effectiveness of antipsychotics in the treatment of delirium and drivers of physician decision‐making in this realm, as well as the need for greater hospital investment in nonpharmacologic delirium‐prevention programs, which have been shown to be effective in prevention of delirium in hospitalized patients.[20]
We observed high levels of potentially excessive daily dosing using cutoffs applied in the long‐term care setting. The majority of the potentially excessive doses were in the setting of typical antipsychotic use, and haloperidol specifically, where doses exceeded 4 mg on at least 1 day in 87% of exposed admissions. Of note, the threshold for haloperidol dosage above which justification is required was decreased from 4 to 2 mg per day in the 2015 update to the CMS guidelines.[21] For the present analysis, we used the guidelines that were contemporaneous to our cohort; we are unable to determine current rates of potentially inappropriate dosages in the present analysis, but given the high prevalence in 2009 to 2010, and the lowering of the dosage threshold since then, it is unlikely that any decrease in use would be enough to substantially reduce the estimate. Whether these high dosages are actually inappropriate in the hospital setting is not established, and we were not able to review medical records to determine whether justification for use of such doses was documented.[22, 23] It is possible that hospitalized patients with altered pharmacodynamics and greater severity of illness could require larger doses of these medications; however, this is an area in need of further investigation, and current critical care guidelines note the lack of sufficient data upon which to justify use of haloperidol in the prevention or treatment of delirium in ICU patients.[24, 25]
The dosages in use are concerning given that the risk of extrapyramidal side effects increases with increasing dose, and prior studies have demonstrated an association between increased dose of antipsychotics and increased risk of other adverse events, including hip fracture and sudden cardiac death.[22, 23] Further, despite these known risks, studies have demonstrated failure to follow recommendations to mitigate risk,[26] such as electrocardiogram monitoring in individuals receiving intravenous haloperidol.[27] Our results suggest that physicians are similarly not following recommendations to use lower doses of haloperidol when treating older patients, given the almost identical incidence of potentially excessive dosing among admissions of patients aged 65 years and older in our cohort.[25] Clinical decision support prompts have been effective at increasing appropriate use of antipsychotic medications in several single‐center analyses,[28, 29, 30] and widespread implementation of such support with a focus on haloperidol dosing should be considered on the basis of our results.
The patient characteristics associated with antipsychotic use in this large, nationally representative analysis are consistent with those identified in prior single‐center analyses.[12, 18] Both prior analyses identified delirium as the most common reason for antipsychotic use, and dementia, intensive care unit stay, and mechanical ventilation were also previously identified as strong predictors of use that we believe hold face validity for the practicing hospitalist. On the other hand, some of the factors associated with antipsychotic use in our model cannot be readily explained, such as insurance status and race, and may be serving as proxies for other variables not included in our analysis. That nonwhite patients are less likely than white patients to receive antipsychotic medications in the hospital has been previously demonstrated,[12] and further investigation to understand this disparity is warranted.
Our study has several additional limitations. First, because our study is observational, the possibility of residual confounding exists, and we cannot rule out that there are other patient factors driving the hospital variation in antipsychotic use that we observed. Second, because guidelines do not exist for antipsychotic dosing in hospitalized patients, we could only comment on potentially excessive dosing, extrapolating from guidelines in the long‐term care setting. Whether such doses are actually excessive in hospitalized patients is not defined. Third, although Premier performs quality checks on charge and ICD‐9‐CM coding data submitted by participating hospitals, the validity of administrative data is uncertain. For example, the use of administrative data to identify delirium diagnoses is likely to have resulted in underestimation of delirium incidence among our different exposure groups. Delirium is likely to be coded more often in the setting of more severe or hyperactive cases, when antipsychotics are more likely to be utilized. This could result in an overestimation of the association between delirium and antipsychotic use. Additionally, differences in coding practices between hospitals for any of the variables in our models could explain some of the variation in antipsychotic prescribing that we observed. Finally, because we were unable to differentiate between new initiation and continuation of a preadmission antipsychotic, some of the variation that we observed is likely to reflect differences in outpatient antipsychotic prescribing practices.
In conclusion, in this large cohort of nonpsychiatric admissions to 300 US hospitals, we found that antipsychotic medication exposure was common, often at high daily doses. Delirium and dementia were the strongest predictors of use among the patient and hospital characteristics examined. The variation in antipsychotic prescribing that we observed was not fully accounted for by measured patient characteristics, and raises the possibility of differing hospital prescribing cultures. Our results draw attention to the need for additional research to better define what constitutes appropriate use of these potentially harmful medications in the hospital setting.
Disclosures: Dr. Herzig had full access to all of the data in the study and takes responsibility for the integrity of the data and the accuracy of the data analysis. Study concept and design: Drs. Herzig, Rothberg, Gurwitz, and Marcantonio. Acquisition of data: Dr. Herzig. Analysis of data: Mr. Guess. Interpretation of data: Drs. Herzig, Rothberg, Gurwitz, Marcantonio, and Mr. Guess. Drafting of the manuscript: Dr. Herzig. Critical revision of the manuscript for important intellectual content: Drs. Rothberg, Gurwitz, Marcantonio, and Mr. Guess. Dr. Herzig was funded by grant number K23AG042459 from the National Institute on Aging. Dr. Marcantonio was funded by grant number K24AG035075 from the National Institute on Aging. The funding organizations had no involvement in any aspect of the study, including design and conduct of the study; collection, management, analysis, and interpretation of the data; and preparation, review, or approval of the manuscript. The authors report no conflicts of interest.
- , , , et al. Variation in nursing home antipsychotic prescribing rates. Arch Intern Med. 2007;167(7):676–683.
- , . Precipitating factors for delirium in hospitalized elderly persons. Predictive model and interrelationship with baseline vulnerability. JAMA. 1996;275(11):852–857.
- , , , , . A predictive model for delirium in hospitalized elderly medical patients based on admission characteristics. Ann Intern Med. 1993;119(6):474–481.
- , , , , , . Delirium in hospitalized older persons: outcomes and predictors. J Am Geriatr Soc. 1994;42(8):809–815.
- , , , . Small‐area variations in the use of common surgical procedures: an international comparison of New England, England, and Norway. N Engl J Med. 1982;307(21):1310–1314.
- Premier Research Services. Available at: https://www.premierinc.com/transforming‐healthcare/healthcare‐performance‐improvement/premier‐research‐services. Accessed March 15, 2016.
- U.S. Food and Drug Administration. Atypical antipsychotic drugs information. Available at: http://www.fda.gov/drugs/drugsafety/postmarketdrugsafetyinformationforpatientsandproviders/ucm094303.htm. Accessed November 1, 2015.
- U.S. Food and Drug Administration. Information on conventional antipsychotics. Available at: http://www.fda.gov/drugs/drugsafety/postmarketdrugsafetyinformationforpatientsandproviders/ucm107211. htm. Accessed November 1, 2015.
- Centers for Medicare and Medicaid Services. State Operations Manual. Appendix PP: guidance to surveyors for long‐term care facilities. Available at: https://www.cms.gov/Medicare/Provider‐Enrollment‐and‐Certification/GuidanceforLawsAndRegulations/Downloads/som107 ap_pp_guidelines_ltcf.pdf. Revised October 14, 2005. Accessed March 15, 2016.
- . A modified Poisson regression approach to prospective studies with binary data. Am J Epidemiol. 2004;159(7):702–706.
- Healthcare Cost and Utilization Project. Comorbidity software, version 3.7. Agency for Healthcare Research and Quality, Rockville, MD. Available at: http://www.hcup‐us.ahrq.gov/toolssoftware/comorbidity/comorbidity.jsp. Accessed March 15, 2016.
- , , , et al. Antipsychotic use in hospitalized adults: rates, indications, and predictors. J Am Geriatr Soc. 2016;64(2):299–305.
- , . Overview of hospital stays in the United States, 2012. HCUP Statistical Brief #180. Agency for Healthcare Research and Quality, Rockville, MD. Available at: http://www.hcup‐us.ahrq.gov/reports/statbriefs/sb180‐Hospitalizations‐United‐States‐2012.pdf. Published October 2014. Accessed June 29, 2015.
- , , , . Long‐term care services in the United States: 2013 overview. Vital Health Stat 3. 2013;(37):1–107. Available at: http://www.cdc.gov/nchs/data/nsltcp/long_term_care_services_2013.pdf. Accessed March 16, 2016.
- , , , et al. The quality of antipsychotic drug prescribing in nursing homes. Arch Intern Med. 2005;165(11):1280–1285.
- , , , , , . Unexplained variation across US nursing homes in antipsychotic prescribing rates. Arch Intern Med. 2010;170(1):89–95.
- , , , , . Broadened use of atypical antipsychotics: safety, effectiveness, and policy challenges. Health Aff (Millwood). 2009;28(5):w770–w781.
- , , , , , . From hospital to community: use of antipsychotics in hospitalized elders. J Hosp Med. 2014;9(12):802–804.
- , , . Antipsychotics in the treatment of delirium in older hospitalized adults: a systematic review. J Am Geriatr Soc. 2011;59(suppl 2):S269–S276.
- , , , et al. Effectiveness of multicomponent nonpharmacological delirium interventions: a meta‐analysis. JAMA Intern Med. 2015;175(4):512–520.
- Centers for Medicare and Medicaid Services. State operations manual, appendix PP: guidance to surveyors for long‐term care facilities. Available at: https://www.cms.gov/Regulations‐and‐Guidance/Guidance/Manuals/downloads/som107ap_pp_guidelines_ltcf.pdf. Revised October 9, 2015. Accessed February 22, 2016.
- , , , , . Psychotropic drug use and the risk of hip fracture. N Engl J Med. 1987;316(7):363–369.
- , , , , . Atypical antipsychotic drugs and the risk of sudden cardiac death. N Engl J Med. 2009;360(3):225–235.
- , , , et al. Clinical practice guidelines for the management of pain, agitation, and delirium in adult patients in the intensive care unit. Crit Care Med. 2013;41(1):263–306.
- , , , , . Haloperidol overdosing in the treatment of agitated hospitalized older people with delirium: a retrospective chart review from a community teaching hospital. Drugs Aging. 2013;30(8):639–644.
- , , , . Unsafe use of intravenous haloperidol: evaluation of recommendation‐concordant care in hospitalized elderly adults. J Am Geriatr Soc. 2013;61(1):160–161.
- U.S. Food and Drug Administration. HALDOL brand of haloperidol injection. Available at: http://www.accessdata.fda.gov/drugsatfda_docs/label/2008/015923s082,018701s057lbl.pdf. Accessed February 23, 2016.
- , , , . Preventing potentially inappropriate medication use in hospitalized older patients with a computerized provider order entry warning system. Arch Intern Med. 2010;170(15):1331–1336.
- , , , et al. A standardized, bundled approach to providing geriatric‐focused acute care. J Am Geriatr Soc. 2014;62(5):936–942.
- , , , . Don't fuel the fire: decreasing intravenous haloperidol use in high risk patients via a customized electronic alert. J Am Med Inform Assoc. 2014;21(6):1109–1112.

Why do clinicians continue to order ‘routine preoperative tests’ despite the evidence?
Guidelines and practice advisories issued by several medical societies, including the American Society of Anesthesiologists,1 American Heart Association (AHA) and American College of Cardiology (ACC),2 and Society of General Internal Medicine,3 advise against routine preoperative testing for patients undergoing low-risk surgical procedures. Such testing often includes routine blood chemistry, complete blood cell counts, measures of the clotting system, and cardiac stress testing.
In this issue of the Cleveland Clinic Journal of Medicine, Dr. Nathan Houchens reviews the evidence against these measures.4
Despite a substantial body of evidence going back more than 2 decades that includes prospective randomized controlled trials,5–10 physicians continue to order unnecessary, ineffective, and costly tests in the perioperative period.11 The process of abandoning current medical practice—a phenomenon known as medical reversal12—often takes years,13 because it is more difficult to convince physicians to discontinue a current behavior than to implement a new one.14 The study of what makes physicians accept new therapies and abandon old ones began more than half a century ago.15
More recently, Cabana et al16 created a framework to understand why physicians do not follow clinical practice guidelines. Among the reasons are lack of familiarity or agreement with the contents of the guideline, lack of outcome expectancy, inertia of previous practice, and external barriers to implementation.
The rapid proliferation of guidelines in the past 20 years has led to numerous conflicting recommendations, many of which are based primarily on expert opinion.17 Guidelines based solely on randomized trials have also come under fire.18,19
In the case of preoperative testing, the recommendations are generally evidence-based and consistent. Why then do physicians appear to disregard the evidence? We propose several reasons why they might do so.
SOME PHYSICIANS ARE UNFAMILIAR WITH THE EVIDENCE
The complexity of the evidence summarized in guidelines has increased exponentially in the last decade, but physician time to assess the evidence has not increased. For example, the number of references in the executive summary of the ACC/AHA perioperative guidelines increased from 96 in 2002 to 252 in 2014. Most of the recommendations are backed by substantial amounts of high-quality evidence. For example, there are 17 prospective and 13 retrospective studies demonstrating that routine testing with the prothrombin time and the partial thromboplastin time is not helpful in asymptomatic patients.20
Although compliance with medical evidence varies among specialties,21 most physicians do not have time to keep up with the ever-increasing amount of information. Specifically in the area of cardiac risk assessment, there has been a rapid proliferation of tests that can be used to assess cardiac risk.22–28 In a Harris Interactive survey from 2008, physicians reported not applying medical evidence routinely. One-third believed they would do it more if they had the time.29 Without information technology support to provide medical information at the point of care,30 especially in small practices, using evidence may not be practical. Simply making the information available online and not promoting it actively does not improve utilization.31
As a consequence, physicians continue to order unnecessary tests, even though they may not feel confident interpreting the results.32
PHYSICIANS MAY NOT BELIEVE THE EVIDENCE
A lack of transparency in evidence-based guidelines and, sometimes, a lack of flexibility and relevance to clinical practice are important barriers to physicians’ acceptance of and adherence to evidence-based clinical practice guidelines.30
Even experts who write guidelines may not be swayed by the evidence. For example, a randomized prospective trial of almost 6,000 patients reported that coronary artery revascularization before elective major vascular surgery does not affect long-term mortality rates.33 Based on this study, the 2014 ACC/AHA guidelines2 advised against revascularization before noncardiac surgery exclusively to reduce perioperative cardiac events. Yet the same guidelines do recommend assessing for myocardial ischemia in patients with elevated risk and poor or unknown functional capacity, using a pharmacologic stress test. Based on the extent of the stress test abnormalities, coronary angiography and revascularization are then suggested for patients willing to undergo coronary artery bypass grafting (CABG) or percutaneous coronary intervention.2
The 2014 European Society of Cardiology and European Society of Anaesthesiology guidelines directly recommend revascularization before high-risk surgery, depending on the extent of a stress-induced perfusion defect.34 This recommendation relies on data from the Coronary Artery Surgery Study registry, which included almost 25,000 patients who underwent coronary angiography from 1975 through 1979. At a mean follow-up of 4.1 years, 1,961 patients underwent high-risk surgery. In this observational cohort, patients who underwent CABG had a lower risk of death and myocardial infarction after surgery.35 The reliance of medical societies34 on data that are more than 30 years old—when operative mortality rates and the treatment of coronary artery disease have changed substantially in the interim and despite the fact that this study did not test whether preoperative revascularization can reduce postoperative mortality—reflects a certain resistance to accept the results of the more recent and relevant randomized trial.33
Other physicians may also prefer to rely on selective data or to simply defer to guidelines that support their beliefs. Some physicians find that evidence-based guidelines are impractical and rigid and reduce their autonomy.36 For many physicians, trials that use surrogate end points and short-term outcomes are not sufficiently compelling to make them abandon current practice.37 Finally, when members of the guideline committees have financial associations with the pharmaceutical industry, or when corporations interested in the outcomes provide financial support for a trial’s development, the likelihood of a recommendation being trusted and used by physicians is drastically reduced.38
PRACTICING DEFENSIVELY
Even if physicians are familiar with the evidence and believe it, they may choose not to act on it. One reason is fear of litigation.
In court, attorneys can use guidelines as well as articles from medical journals as both exculpatory and inculpatory evidence. But they more frequently rely on the standard of care, or what most physicians would do under similar circumstances. If a patient has a bad outcome, such as a perioperative myocardial infarction or life-threatening bleeding, the defendant may assert that testing was unwarranted because guidelines do not recommend it or because the probability of such an outcome was low. However, because the outcome occurred, the jury may not believe that the probability was low enough not to consider, especially if expert witnesses testify that the standard of care would be to order the test.
In areas of controversy, physicians generally believe that erring on the side of more testing is more defensible in court.39 Indeed, following established practice traditions, learned during residency,11,40 may absolve physicians in negligence claims if the way medical care was delivered is supported by recognized and respected physicians.41
As a consequence, physicians prefer to practice the same way their peers do rather than follow the evidence. Unfortunately, the more procedures physicians perform for low-risk patients, the more likely these tests will become accepted as the legal standard of care.42 In this vicious circle, the new standard of care can increase the risk of litigation for others.43 Although unnecessary testing that leads to harmful invasive tests or procedures can also result in malpractice litigation, physicians may not consider this possibility.
FINANCIAL INCENTIVES
The threat of malpractice litigation provides a negative financial incentive to keep performing unnecessary tests, but there are a number of positive incentives as well.
First, physicians often feel compelled to order tests when they believe that physicians referring the patients want the tests done, or when they fear that not completing the tests could delay or cancel the scheduled surgery.40 Refusing to order the test could result in a loss of future referrals. In contrast, ordering tests allows them to meet expectations, preserve trust, and appear more valuable to referring physicians and their patients.
Insurance companies are complicit in these practices. Paying for unnecessary tests can create direct financial incentives for physicians or institutions that own on-site laboratories or diagnostic imaging equipment. Evidence shows that under those circumstances physicians do order more tests. Self-referral and referral to facilities where physicians have a financial interest is associated with increased healthcare costs.44 In addition to direct revenues for the tests performed, physicians may also bill for test interpretation, follow-up visits, and additional procedures generated from test results.
This may be one explanation why the ordering of cardiac tests (stress testing, echocardiography, vascular ultrasonography) by US physicians varies widely from state to state.45
RECOMMENDATIONS TO REDUCE INAPPROPRIATE TESTING
To counter these influences, we propose a multifaceted intervention that includes the following:
- Establish preoperative clinics staffed by experts. Despite the large volume of potentially relevant evidence, the number of articles directly supporting or refuting preoperative laboratory testing is small enough that physicians who routinely engage in preoperative assessment should easily master the evidence.
- Identify local leaders who can convince colleagues of the evidence. Distribute evidence summaries or guidelines with references to major articles that support each recommendation.
- Work with clinical practice committees to establish new standards of care within the hospital. Establish hospital care paths to dictate and support local standards of care. Measure individual physician performance and offer feedback with the goal of reducing utilization.
- National societies should recommend that insurance companies remove inappropriate financial incentives. If companies deny payment for inappropriate testing, physicians will stop ordering it. Even requirements for preauthorization of tests should reduce utilization. The Choosing Wisely campaign (www.choosingwisely.org) would be a good place to start.
- Committee on Standards and Practice Parameters, Apfelbaum JL, Connis RT, Nickinovich DG, et al. Practice advisory for preanesthesia evaluation. An updated report by the American Society of Anesthesiologists Task Force on Preanesthesia Evaluation. Anesthesiology 2012; 116:522–538.
- Fleisher LA, Fleischmann KE, Auerbach AD, et al; American College of Cardiology and American Heart Association. 2014 ACC/AHA guideline on perioperative cardiovascular evaluation and management of patients undergoing noncardiac surgery: a report of the American College of Cardiology/American Heart Association Task Force on practice guidelines. J Am Coll Cardiol 2014; 64:e77–e137.
- Society of General Internal Medicine. Don’t perform routine pre-operative testing before low-risk surgical procedures. Choosing Wisely. An initiative of the ABIM Foundation. September 12, 2013. www.choosingwisely.org/clinician-lists/society-general-internal-medicine-routine-preoperative-testing-before-low-risk-surgery/. Accessed August 31, 2015.
- Houchens N. Should healthy patients undergoing low-risk, elective, noncardiac surgery undergo routine preoperative laboratory testing? Cleve Clin J Med 2015; 82:664–666.
- Rohrer MJ, Michelotti MC, Nahrwold DL. A prospective evaluation of the efficacy of preoperative coagulation testing. Ann Surg 1988; 208:554–557.
- Eagle KA, Coley CM, Newell JB, et al. Combining clinical and thallium data optimizes preoperative assessment of cardiac risk before major vascular surgery. Ann Intern Med 1989; 110:859–866.
- Mangano DT, London MJ, Tubau JF, et al. Dipyridamole thallium-201 scintigraphy as a preoperative screening test. A reexamination of its predictive potential. Study of Perioperative Ischemia Research Group. Circulation 1991; 84:493–502.
- Stratmann HG, Younis LT, Wittry MD, Amato M, Mark AL, Miller DD. Dipyridamole technetium 99m sestamibi myocardial tomography for preoperative cardiac risk stratification before major or minor nonvascular surgery. Am Heart J 1996; 132:536–541.
- Schein OD, Katz J, Bass EB, et al. The value of routine preoperative medical testing before cataract surgery. Study of Medical Testing for Cataract Surgery. N Engl J Med 2000; 342:168–175.
- Hashimoto J, Nakahara T, Bai J, Kitamura N, Kasamatsu T, Kubo A. Preoperative risk stratification with myocardial perfusion imaging in intermediate and low-risk non-cardiac surgery. Circ J 2007; 71:1395–1400.
- Smetana GW. The conundrum of unnecessary preoperative testing. JAMA Intern Med 2015; 175:1359–1361.
- Prasad V, Cifu A. Medical reversal: why we must raise the bar before adopting new technologies. Yale J Biol Med 2011; 84:471–478.
- Tatsioni A, Bonitsis NG, Ioannidis JP. Persistence of contradicted claims in the literature. JAMA 2007; 298:2517–2526.
- Moscucci M. Medical reversal, clinical trials, and the “late” open artery hypothesis in acute myocardial infarction. Arch Intern Med 2011; 171:1643–1644.
- Coleman J, Menzel H, Katz E. Social processes in physicians’ adoption of a new drug. J Chronic Dis 1959; 9:1–19.
- Cabana MD, Rand CS, Powe NR, et al. Why don’t physicians follow clinical practice guidelines? A framework for improvement. JAMA 1999; 282:1458–1465.
- Tricoci P, Allen JM, Kramer JM, Califf RM, Smith SC Jr. Scientific evidence underlying the ACC/AHA clinical practice guidelines. JAMA 2009; 301:831–841.
- Moher D, Hopewell S, Schulz KF, et al; CONSORT. CONSORT 2010 explanation and elaboration: updated guidelines for reporting parallel group randomised trials. Int J Surg 2012; 10:28–55.
- Gattinoni L, Giomarelli P. Acquiring knowledge in intensive care: merits and pitfalls of randomized controlled trials. Intensive Care Med 2015; 41:1460–1464.
- Levy JH, Szlam F, Wolberg AS, Winkler A. Clinical use of the activated partial thromboplastin time and prothrombin time for screening: a review of the literature and current guidelines for testing. Clin Lab Med 2014; 34:453–477.
- Dale W, Hemmerich J, Moliski E, Schwarze ML, Tung A. Effect of specialty and recent experience on perioperative decision-making for abdominal aortic aneurysm repair. J Am Geriatr Soc 2012; 60:1889–1894.
- Underwood SR, Anagnostopoulos C, Cerqueira M, et al; British Cardiac Society, British Nuclear Cardiology Society, British Nuclear Medicine Society, Royal College of Physicians of London, Royal College of Physicians of London. Myocardial perfusion scintigraphy: the evidence. Eur J Nucl Med Mol Imaging 2004; 31:261–291.
- Das MK, Pellikka PA, Mahoney DW, et al. Assessment of cardiac risk before nonvascular surgery: dobutamine stress echocardiography in 530 patients. J Am Coll Cardiol 2000; 35:1647–1653.
- Meijboom WB, Mollet NR, Van Mieghem CA, et al. Pre-operative computed tomography coronary angiography to detect significant coronary artery disease in patients referred for cardiac valve surgery. J Am Coll Cardiol 2006; 48:1658–1665.
- Russo V, Gostoli V, Lovato L, et al. Clinical value of multidetector CT coronary angiography as a preoperative screening test before non-coronary cardiac surgery. Heart 2007; 93:1591–1598.
- Schuetz GM, Zacharopoulou NM, Schlattmann P, Dewey M. Meta-analysis: noninvasive coronary angiography using computed tomography versus magnetic resonance imaging. Ann Intern Med 2010; 152:167–177.
- Bluemke DA, Achenbach S, Budoff M, et al. Noninvasive coronary artery imaging: magnetic resonance angiography and multidetector computed tomography angiography: a scientific statement from the American Heart Association Committee on Cardiovascular Imaging and Intervention of the Council on Cardiovascular Radiology and Intervention, and the Councils on Clinical Cardiology and Cardiovascular Disease in the Young. Circulation 2008; 118:586–606.
- Nagel E, Lehmkuhl HB, Bocksch W, et al. Noninvasive diagnosis of ischemia-induced wall motion abnormalities with the use of high-dose dobutamine stress MRI: comparison with dobutamine stress echocardiography. Circulation 1999; 99:763–770.
- Taylor H. Physicians’ use of clinical guidelines—and how to increase it. Healthcare News 2008; 8:32–55. www.harrisinteractive.com/vault/HI_HealthCareNews2008Vol8_Iss04.pdf. Accessed August 31, 2015.
- Kenefick H, Lee J, Fleishman V. Improving physician adherence to clinical practice guidelines. Barriers and stragies for change. New England Healthcare Institute, February 2008. www.nehi.net/writable/publication_files/file/cpg_report_final.pdf. Accessed August 31, 2015.
- Williams J, Cheung WY, Price DE, et al. Clinical guidelines online: do they improve compliance? Postgrad Med J 2004; 80:415–419.
- Wians F. Clinical laboratory tests: which, why, and what do the results mean? Lab Medicine 2009; 40:105–113.
- McFalls EO, Ward HB, Moritz TE, et al. Coronary-artery revascularization before elective major vascular surgery. N Engl J Med 2004; 351:2795–2804.
- Kristensen SD, Knuuti J, Saraste A, et al; Authors/Task Force Members. 2014 ESC/ESA guidelines on non-cardiac surgery: cardiovascular assessment and management: The Joint Task Force on non-cardiac surgery: cardiovascular assessment and management of the European Society of Cardiology (ESC) and the European Society of Anaesthesiology (ESA). Eur Heart J 2014; 35:2383–2431.
- Eagle KA, Rihal CS, Mickel MC, Holmes DR, Foster ED, Gersh BJ. Cardiac risk of noncardiac surgery: influence of coronary disease and type of surgery in 3368 operations. CASS Investigators and University of Michigan Heart Care Program. Coronary Artery Surgery Study. Circulation 1997; 96:1882–1887.
- Farquhar CM, Kofa EW, Slutsky JR. Clinicians’ attitudes to clinical practice guidelines: a systematic review. Med J Aust 2002; 177:502–506.
- Prasad V, Cifu A, Ioannidis JP. Reversals of established medical practices: evidence to abandon ship. JAMA 2012; 307:37–38.
- Steinbrook R. Guidance for guidelines. N Engl J Med 2007; 356:331–333.
- Sirovich BE, Woloshin S, Schwartz LM. Too little? Too much? Primary care physicians’ views on US health care: a brief report. Arch Intern Med 2011; 171:1582–1585.
- Brown SR, Brown J. Why do physicians order unnecessary preoperative tests? A qualitative study. Fam Med 2011; 43:338–343.
- LeCraw LL. Use of clinical practice guidelines in medical malpractice litigation. J Oncol Pract 2007; 3:254.
- Studdert DM, Mello MM, Sage WM, et al. Defensive medicine among high-risk specialist physicians in a volatile malpractice environment. JAMA 2005; 293:2609–2617.
- Budetti PP. Tort reform and the patient safety movement: seeking common ground. JAMA 2005; 293:2660–2662.
- Bishop TF, Federman AD, Ross JS. Laboratory test ordering at physician offices with and without on-site laboratories. J Gen Intern Med 2010; 25:1057–1063.
- Rosenthal E. Medical costs rise as retirees winter in Florida. The New York Times, Jan 31, 2015. http://nyti.ms/1vmjfa5. Accessed August 31, 2015.
Guidelines and practice advisories issued by several medical societies, including the American Society of Anesthesiologists,1 American Heart Association (AHA) and American College of Cardiology (ACC),2 and Society of General Internal Medicine,3 advise against routine preoperative testing for patients undergoing low-risk surgical procedures. Such testing often includes routine blood chemistry, complete blood cell counts, measures of the clotting system, and cardiac stress testing.
In this issue of the Cleveland Clinic Journal of Medicine, Dr. Nathan Houchens reviews the evidence against these measures.4
Despite a substantial body of evidence going back more than 2 decades that includes prospective randomized controlled trials,5–10 physicians continue to order unnecessary, ineffective, and costly tests in the perioperative period.11 The process of abandoning current medical practice—a phenomenon known as medical reversal12—often takes years,13 because it is more difficult to convince physicians to discontinue a current behavior than to implement a new one.14 The study of what makes physicians accept new therapies and abandon old ones began more than half a century ago.15
More recently, Cabana et al16 created a framework to understand why physicians do not follow clinical practice guidelines. Among the reasons are lack of familiarity or agreement with the contents of the guideline, lack of outcome expectancy, inertia of previous practice, and external barriers to implementation.
The rapid proliferation of guidelines in the past 20 years has led to numerous conflicting recommendations, many of which are based primarily on expert opinion.17 Guidelines based solely on randomized trials have also come under fire.18,19
In the case of preoperative testing, the recommendations are generally evidence-based and consistent. Why then do physicians appear to disregard the evidence? We propose several reasons why they might do so.
SOME PHYSICIANS ARE UNFAMILIAR WITH THE EVIDENCE
The complexity of the evidence summarized in guidelines has increased exponentially in the last decade, but physician time to assess the evidence has not increased. For example, the number of references in the executive summary of the ACC/AHA perioperative guidelines increased from 96 in 2002 to 252 in 2014. Most of the recommendations are backed by substantial amounts of high-quality evidence. For example, there are 17 prospective and 13 retrospective studies demonstrating that routine testing with the prothrombin time and the partial thromboplastin time is not helpful in asymptomatic patients.20
Although compliance with medical evidence varies among specialties,21 most physicians do not have time to keep up with the ever-increasing amount of information. Specifically in the area of cardiac risk assessment, there has been a rapid proliferation of tests that can be used to assess cardiac risk.22–28 In a Harris Interactive survey from 2008, physicians reported not applying medical evidence routinely. One-third believed they would do it more if they had the time.29 Without information technology support to provide medical information at the point of care,30 especially in small practices, using evidence may not be practical. Simply making the information available online and not promoting it actively does not improve utilization.31
As a consequence, physicians continue to order unnecessary tests, even though they may not feel confident interpreting the results.32
PHYSICIANS MAY NOT BELIEVE THE EVIDENCE
A lack of transparency in evidence-based guidelines and, sometimes, a lack of flexibility and relevance to clinical practice are important barriers to physicians’ acceptance of and adherence to evidence-based clinical practice guidelines.30
Even experts who write guidelines may not be swayed by the evidence. For example, a randomized prospective trial of almost 6,000 patients reported that coronary artery revascularization before elective major vascular surgery does not affect long-term mortality rates.33 Based on this study, the 2014 ACC/AHA guidelines2 advised against revascularization before noncardiac surgery exclusively to reduce perioperative cardiac events. Yet the same guidelines do recommend assessing for myocardial ischemia in patients with elevated risk and poor or unknown functional capacity, using a pharmacologic stress test. Based on the extent of the stress test abnormalities, coronary angiography and revascularization are then suggested for patients willing to undergo coronary artery bypass grafting (CABG) or percutaneous coronary intervention.2
The 2014 European Society of Cardiology and European Society of Anaesthesiology guidelines directly recommend revascularization before high-risk surgery, depending on the extent of a stress-induced perfusion defect.34 This recommendation relies on data from the Coronary Artery Surgery Study registry, which included almost 25,000 patients who underwent coronary angiography from 1975 through 1979. At a mean follow-up of 4.1 years, 1,961 patients underwent high-risk surgery. In this observational cohort, patients who underwent CABG had a lower risk of death and myocardial infarction after surgery.35 The reliance of medical societies34 on data that are more than 30 years old—when operative mortality rates and the treatment of coronary artery disease have changed substantially in the interim and despite the fact that this study did not test whether preoperative revascularization can reduce postoperative mortality—reflects a certain resistance to accept the results of the more recent and relevant randomized trial.33
Other physicians may also prefer to rely on selective data or to simply defer to guidelines that support their beliefs. Some physicians find that evidence-based guidelines are impractical and rigid and reduce their autonomy.36 For many physicians, trials that use surrogate end points and short-term outcomes are not sufficiently compelling to make them abandon current practice.37 Finally, when members of the guideline committees have financial associations with the pharmaceutical industry, or when corporations interested in the outcomes provide financial support for a trial’s development, the likelihood of a recommendation being trusted and used by physicians is drastically reduced.38
PRACTICING DEFENSIVELY
Even if physicians are familiar with the evidence and believe it, they may choose not to act on it. One reason is fear of litigation.
In court, attorneys can use guidelines as well as articles from medical journals as both exculpatory and inculpatory evidence. But they more frequently rely on the standard of care, or what most physicians would do under similar circumstances. If a patient has a bad outcome, such as a perioperative myocardial infarction or life-threatening bleeding, the defendant may assert that testing was unwarranted because guidelines do not recommend it or because the probability of such an outcome was low. However, because the outcome occurred, the jury may not believe that the probability was low enough not to consider, especially if expert witnesses testify that the standard of care would be to order the test.
In areas of controversy, physicians generally believe that erring on the side of more testing is more defensible in court.39 Indeed, following established practice traditions, learned during residency,11,40 may absolve physicians in negligence claims if the way medical care was delivered is supported by recognized and respected physicians.41
As a consequence, physicians prefer to practice the same way their peers do rather than follow the evidence. Unfortunately, the more procedures physicians perform for low-risk patients, the more likely these tests will become accepted as the legal standard of care.42 In this vicious circle, the new standard of care can increase the risk of litigation for others.43 Although unnecessary testing that leads to harmful invasive tests or procedures can also result in malpractice litigation, physicians may not consider this possibility.
FINANCIAL INCENTIVES
The threat of malpractice litigation provides a negative financial incentive to keep performing unnecessary tests, but there are a number of positive incentives as well.
First, physicians often feel compelled to order tests when they believe that physicians referring the patients want the tests done, or when they fear that not completing the tests could delay or cancel the scheduled surgery.40 Refusing to order the test could result in a loss of future referrals. In contrast, ordering tests allows them to meet expectations, preserve trust, and appear more valuable to referring physicians and their patients.
Insurance companies are complicit in these practices. Paying for unnecessary tests can create direct financial incentives for physicians or institutions that own on-site laboratories or diagnostic imaging equipment. Evidence shows that under those circumstances physicians do order more tests. Self-referral and referral to facilities where physicians have a financial interest is associated with increased healthcare costs.44 In addition to direct revenues for the tests performed, physicians may also bill for test interpretation, follow-up visits, and additional procedures generated from test results.
This may be one explanation why the ordering of cardiac tests (stress testing, echocardiography, vascular ultrasonography) by US physicians varies widely from state to state.45
RECOMMENDATIONS TO REDUCE INAPPROPRIATE TESTING
To counter these influences, we propose a multifaceted intervention that includes the following:
- Establish preoperative clinics staffed by experts. Despite the large volume of potentially relevant evidence, the number of articles directly supporting or refuting preoperative laboratory testing is small enough that physicians who routinely engage in preoperative assessment should easily master the evidence.
- Identify local leaders who can convince colleagues of the evidence. Distribute evidence summaries or guidelines with references to major articles that support each recommendation.
- Work with clinical practice committees to establish new standards of care within the hospital. Establish hospital care paths to dictate and support local standards of care. Measure individual physician performance and offer feedback with the goal of reducing utilization.
- National societies should recommend that insurance companies remove inappropriate financial incentives. If companies deny payment for inappropriate testing, physicians will stop ordering it. Even requirements for preauthorization of tests should reduce utilization. The Choosing Wisely campaign (www.choosingwisely.org) would be a good place to start.
- Committee on Standards and Practice Parameters, Apfelbaum JL, Connis RT, Nickinovich DG, et al. Practice advisory for preanesthesia evaluation. An updated report by the American Society of Anesthesiologists Task Force on Preanesthesia Evaluation. Anesthesiology 2012; 116:522–538.
- Fleisher LA, Fleischmann KE, Auerbach AD, et al; American College of Cardiology and American Heart Association. 2014 ACC/AHA guideline on perioperative cardiovascular evaluation and management of patients undergoing noncardiac surgery: a report of the American College of Cardiology/American Heart Association Task Force on practice guidelines. J Am Coll Cardiol 2014; 64:e77–e137.
- Society of General Internal Medicine. Don’t perform routine pre-operative testing before low-risk surgical procedures. Choosing Wisely. An initiative of the ABIM Foundation. September 12, 2013. www.choosingwisely.org/clinician-lists/society-general-internal-medicine-routine-preoperative-testing-before-low-risk-surgery/. Accessed August 31, 2015.
- Houchens N. Should healthy patients undergoing low-risk, elective, noncardiac surgery undergo routine preoperative laboratory testing? Cleve Clin J Med 2015; 82:664–666.
- Rohrer MJ, Michelotti MC, Nahrwold DL. A prospective evaluation of the efficacy of preoperative coagulation testing. Ann Surg 1988; 208:554–557.
- Eagle KA, Coley CM, Newell JB, et al. Combining clinical and thallium data optimizes preoperative assessment of cardiac risk before major vascular surgery. Ann Intern Med 1989; 110:859–866.
- Mangano DT, London MJ, Tubau JF, et al. Dipyridamole thallium-201 scintigraphy as a preoperative screening test. A reexamination of its predictive potential. Study of Perioperative Ischemia Research Group. Circulation 1991; 84:493–502.
- Stratmann HG, Younis LT, Wittry MD, Amato M, Mark AL, Miller DD. Dipyridamole technetium 99m sestamibi myocardial tomography for preoperative cardiac risk stratification before major or minor nonvascular surgery. Am Heart J 1996; 132:536–541.
- Schein OD, Katz J, Bass EB, et al. The value of routine preoperative medical testing before cataract surgery. Study of Medical Testing for Cataract Surgery. N Engl J Med 2000; 342:168–175.
- Hashimoto J, Nakahara T, Bai J, Kitamura N, Kasamatsu T, Kubo A. Preoperative risk stratification with myocardial perfusion imaging in intermediate and low-risk non-cardiac surgery. Circ J 2007; 71:1395–1400.
- Smetana GW. The conundrum of unnecessary preoperative testing. JAMA Intern Med 2015; 175:1359–1361.
- Prasad V, Cifu A. Medical reversal: why we must raise the bar before adopting new technologies. Yale J Biol Med 2011; 84:471–478.
- Tatsioni A, Bonitsis NG, Ioannidis JP. Persistence of contradicted claims in the literature. JAMA 2007; 298:2517–2526.
- Moscucci M. Medical reversal, clinical trials, and the “late” open artery hypothesis in acute myocardial infarction. Arch Intern Med 2011; 171:1643–1644.
- Coleman J, Menzel H, Katz E. Social processes in physicians’ adoption of a new drug. J Chronic Dis 1959; 9:1–19.
- Cabana MD, Rand CS, Powe NR, et al. Why don’t physicians follow clinical practice guidelines? A framework for improvement. JAMA 1999; 282:1458–1465.
- Tricoci P, Allen JM, Kramer JM, Califf RM, Smith SC Jr. Scientific evidence underlying the ACC/AHA clinical practice guidelines. JAMA 2009; 301:831–841.
- Moher D, Hopewell S, Schulz KF, et al; CONSORT. CONSORT 2010 explanation and elaboration: updated guidelines for reporting parallel group randomised trials. Int J Surg 2012; 10:28–55.
- Gattinoni L, Giomarelli P. Acquiring knowledge in intensive care: merits and pitfalls of randomized controlled trials. Intensive Care Med 2015; 41:1460–1464.
- Levy JH, Szlam F, Wolberg AS, Winkler A. Clinical use of the activated partial thromboplastin time and prothrombin time for screening: a review of the literature and current guidelines for testing. Clin Lab Med 2014; 34:453–477.
- Dale W, Hemmerich J, Moliski E, Schwarze ML, Tung A. Effect of specialty and recent experience on perioperative decision-making for abdominal aortic aneurysm repair. J Am Geriatr Soc 2012; 60:1889–1894.
- Underwood SR, Anagnostopoulos C, Cerqueira M, et al; British Cardiac Society, British Nuclear Cardiology Society, British Nuclear Medicine Society, Royal College of Physicians of London, Royal College of Physicians of London. Myocardial perfusion scintigraphy: the evidence. Eur J Nucl Med Mol Imaging 2004; 31:261–291.
- Das MK, Pellikka PA, Mahoney DW, et al. Assessment of cardiac risk before nonvascular surgery: dobutamine stress echocardiography in 530 patients. J Am Coll Cardiol 2000; 35:1647–1653.
- Meijboom WB, Mollet NR, Van Mieghem CA, et al. Pre-operative computed tomography coronary angiography to detect significant coronary artery disease in patients referred for cardiac valve surgery. J Am Coll Cardiol 2006; 48:1658–1665.
- Russo V, Gostoli V, Lovato L, et al. Clinical value of multidetector CT coronary angiography as a preoperative screening test before non-coronary cardiac surgery. Heart 2007; 93:1591–1598.
- Schuetz GM, Zacharopoulou NM, Schlattmann P, Dewey M. Meta-analysis: noninvasive coronary angiography using computed tomography versus magnetic resonance imaging. Ann Intern Med 2010; 152:167–177.
- Bluemke DA, Achenbach S, Budoff M, et al. Noninvasive coronary artery imaging: magnetic resonance angiography and multidetector computed tomography angiography: a scientific statement from the American Heart Association Committee on Cardiovascular Imaging and Intervention of the Council on Cardiovascular Radiology and Intervention, and the Councils on Clinical Cardiology and Cardiovascular Disease in the Young. Circulation 2008; 118:586–606.
- Nagel E, Lehmkuhl HB, Bocksch W, et al. Noninvasive diagnosis of ischemia-induced wall motion abnormalities with the use of high-dose dobutamine stress MRI: comparison with dobutamine stress echocardiography. Circulation 1999; 99:763–770.
- Taylor H. Physicians’ use of clinical guidelines—and how to increase it. Healthcare News 2008; 8:32–55. www.harrisinteractive.com/vault/HI_HealthCareNews2008Vol8_Iss04.pdf. Accessed August 31, 2015.
- Kenefick H, Lee J, Fleishman V. Improving physician adherence to clinical practice guidelines. Barriers and stragies for change. New England Healthcare Institute, February 2008. www.nehi.net/writable/publication_files/file/cpg_report_final.pdf. Accessed August 31, 2015.
- Williams J, Cheung WY, Price DE, et al. Clinical guidelines online: do they improve compliance? Postgrad Med J 2004; 80:415–419.
- Wians F. Clinical laboratory tests: which, why, and what do the results mean? Lab Medicine 2009; 40:105–113.
- McFalls EO, Ward HB, Moritz TE, et al. Coronary-artery revascularization before elective major vascular surgery. N Engl J Med 2004; 351:2795–2804.
- Kristensen SD, Knuuti J, Saraste A, et al; Authors/Task Force Members. 2014 ESC/ESA guidelines on non-cardiac surgery: cardiovascular assessment and management: The Joint Task Force on non-cardiac surgery: cardiovascular assessment and management of the European Society of Cardiology (ESC) and the European Society of Anaesthesiology (ESA). Eur Heart J 2014; 35:2383–2431.
- Eagle KA, Rihal CS, Mickel MC, Holmes DR, Foster ED, Gersh BJ. Cardiac risk of noncardiac surgery: influence of coronary disease and type of surgery in 3368 operations. CASS Investigators and University of Michigan Heart Care Program. Coronary Artery Surgery Study. Circulation 1997; 96:1882–1887.
- Farquhar CM, Kofa EW, Slutsky JR. Clinicians’ attitudes to clinical practice guidelines: a systematic review. Med J Aust 2002; 177:502–506.
- Prasad V, Cifu A, Ioannidis JP. Reversals of established medical practices: evidence to abandon ship. JAMA 2012; 307:37–38.
- Steinbrook R. Guidance for guidelines. N Engl J Med 2007; 356:331–333.
- Sirovich BE, Woloshin S, Schwartz LM. Too little? Too much? Primary care physicians’ views on US health care: a brief report. Arch Intern Med 2011; 171:1582–1585.
- Brown SR, Brown J. Why do physicians order unnecessary preoperative tests? A qualitative study. Fam Med 2011; 43:338–343.
- LeCraw LL. Use of clinical practice guidelines in medical malpractice litigation. J Oncol Pract 2007; 3:254.
- Studdert DM, Mello MM, Sage WM, et al. Defensive medicine among high-risk specialist physicians in a volatile malpractice environment. JAMA 2005; 293:2609–2617.
- Budetti PP. Tort reform and the patient safety movement: seeking common ground. JAMA 2005; 293:2660–2662.
- Bishop TF, Federman AD, Ross JS. Laboratory test ordering at physician offices with and without on-site laboratories. J Gen Intern Med 2010; 25:1057–1063.
- Rosenthal E. Medical costs rise as retirees winter in Florida. The New York Times, Jan 31, 2015. http://nyti.ms/1vmjfa5. Accessed August 31, 2015.

Impact of HOCDI on Sepsis Patients
There are approximately 3 million cases of Clostridium difficile infection (CDI) per year in the United States.[1, 2, 3, 4] Of these, 10% result in a hospitalization or occur as a consequence of the exposures and treatments associated with hospitalization.[1, 2, 3, 4] Some patients with CDI experience mild diarrhea that is responsive to therapy, but other patients experience severe, life‐threatening disease that is refractory to treatment, leading to pseudomembranous colitis, toxic megacolon, and sepsis with a 60‐day mortality rate that exceeds 12%.[5, 6, 7, 8, 9, 10, 11, 12, 13, 14]
Hospital‐onset CDI (HOCDI), defined as C difficile‐associated diarrhea and related symptoms with onset more than 48 hours after admission to a healthcare facility,[15] represents a unique marriage of CDI risk factors.[5] A vulnerable patient is introduced into an environment that contains both exposure to C difficile (through other patients or healthcare workers) and treatment with antibacterial agents that may diminish normal flora. Consequently, CDI is common among hospitalized patients.[16, 17, 18] A particularly important group for understanding the burden of disease is patients who initially present to the hospital with sepsis and subsequently develop HOCDI. Sepsis patients are often critically ill and are universally treated with antibiotics.
Determining the incremental cost and mortality risk attributable to HOCDI is methodologically challenging. Because HOCDI is associated with presenting severity, the sickest patients are also the most likely to contract the disease. HOCDI is also associated with time of exposure or length of stay (LOS). Because LOS is a risk factor, comparing LOS between those with and without HOCDI will overestimate the impact if the time to diagnosis is not taken into account.[16, 17, 19, 20] We aimed to examine the impact of HOCDI in hospitalized patients with sepsis using a large, multihospital database with statistical methods that took presenting severity and time to diagnosis into account.
METHODS
Data Source and Subjects
Permission to conduct this study was obtained from the institutional review board at Baystate Medical Center. We used the Premier Healthcare Informatics database, a voluntary, fee‐supported database created to measure quality and healthcare utilization, which has been used extensively in health services research.[21, 22, 23] In addition to the elements found in hospital claims derived from the uniform billing 04 form, Premier data include an itemized, date‐stamped log of all items and services charged to the patient or their insurer, including medications, laboratory tests, and diagnostic and therapeutic services. Approximately 75% of hospitals that submit data also provide information on actual hospital costs, taken from internal cost accounting systems. The rest provide cost estimates based on Medicare cost‐to‐charge ratios. Participating hospitals are similar to the composition of acute care hospitals nationwide, although they are more commonly small‐ to midsized nonteaching facilities and are more likely to be located in the southern United States.
We included medical (nonsurgical) adult patients with sepsis who were admitted to a participating hospital between July 1, 2004 and December 31, 2010. Because we sought to focus on the care of patients who present to the hospital with sepsis, we defined sepsis as the presence of a diagnosis of sepsis plus evidence of both blood cultures and antibiotic treatment within the first 2 days of hospitalization; we used the first 2 days of hospitalization rather than just the first day because, in administrative datasets, the duration of the first hospital day includes partial days that can vary in length. We excluded patients who died or were discharged prior to day 3, because HOCDI is defined as onset after 48 hours in a healthcare facility.[15] We also excluded surviving patients who received less than 3 consecutive days of antibiotics, and patients who were transferred from or to another acute‐care facility; the latter exclusion criterion was used because we could not accurately determine the onset or subsequent course of their illness.
Identification of Patients at Risk for and Diagnosed With HOCDI
Among eligible patients with sepsis, we aimed to identify a cohort at risk for developing CDI during the hospital stay. We excluded patients: (1) with a diagnosis indicating that diarrhea was present on admission, (2) with a diagnosis of CDI that was indicated to be present on admission, (3) who were tested for CDI on the first or second hospital day, and (4) who received an antibiotic that could be consistent with treatment for CDI (oral or intravenous [IV] metronidazole or oral vancomycin) on hospital days 1 or 2.
Next, we aimed to identify sepsis patients at risk for HOCDI who developed HOCDI during their hospital stay. Among eligible patients described above, we considered a patient to have HOCDI if they had an International Classification of Diseases, Ninth Revision, Clinical Modification diagnosis of CDI (primary or secondary but not present on admission), plus evidence of testing for CDI after hospital day 2, and treatment with oral vancomycin or oral or IV metronidazole that was started after hospital day 2 and within 2 days of the C difficile test, and evidence of treatment for CDI for at least 3 days unless the patient was discharged or died.
Patient Information
We recorded patient age, gender, marital status, insurance status, race, and ethnicity. Using software provided by the Healthcare Costs and Utilization Project of the Agency for Healthcare Research and Quality, we categorized information on 30 comorbid conditions. We also created a single numerical comorbidity score based on a previously published and validated combined comorbidity score that predicts 1‐year mortality.[24] Based on a previously described algorithm,[25] we used diagnosis codes to assess the source (lung, abdomen, urinary tract, blood, other) and type of sepsis (Gram positive, Gram negative, mixed, anaerobic, fungal). Because patients can have more than 1 potential source of sepsis (eg, pneumonia and urinary tract infection) and more than 1 organism causing infection (eg, urine with Gram negative rods and blood culture with Gram positive cocci), these categories are not mutually exclusive (see Supporting Table 1 in the online version of this article). We used billing codes to identify the use of therapies, monitoring devices, and pharmacologic treatments to characterize both initial severity of illness and severity at the time of CDI diagnosis. These therapies are included in a validated sepsis mortality prediction model (designed for administrative datasets) with similar discrimination and calibration to clinical intensive care unit (ICU) risk‐adjustment models such as the mortality probability model, version III.[26, 27]
Outcomes
Our primary outcome of interest was in‐hospital mortality. Secondary outcomes included LOS and costs for survivors only and for all patients.
Statistical Methods
We calculated patient‐level summary statistics for all patients using frequencies for binary variables and medians and interquartile percentiles for continuous variables. P values <0.05 were considered statistically significant.
To account for presenting severity and time to diagnosis, we used methods that have been described elsewhere.[12, 13, 18, 20, 28] First, we identified patients who were eligible to develop HOCDI. Second, for all eligible patients, we identified a date of disease onset (index date). For patients who met criteria for HOCDI, this was the date on which the patient was tested for CDI. For eligible patients without disease, this was a date randomly assigned to any time during the hospital stay.[29] Next, we developed a nonparsimonious propensity score model that included all patient characteristics (demographics, comorbidities, sepsis source, and severity of illness on presentation and on the index date; all variables listed in Table 1 were included in the propensity model). Some of the variables for this model (eg, mechanical ventilation and vasopressors) were derived from a validated severity model.[26] We adjusted for correlation within hospital when creating the propensity score using Huber‐White robust standard error estimators clustered at the hospital level.[30] We then created matched pairs with the same LOS prior to the index date and similar propensity for developing CDI. We first matched on index date, and then, within each index‐datematched subset, matched patients with and without HOCDI by their propensity score using a 5‐to‐1 greedy match algorithm.[31] We used the differences in LOS between the cases and controls after the index date to calculate the additional attributable LOS estimates; we also separately estimated the impact on cost and LOS in a group limited to those who survived after discharge because of concerns that death could shorten LOS and reduce costs.
| Before Matching | After Matching | |||||
|---|---|---|---|---|---|---|
| HOCDI, n=2,368, % | No CDI, n=216,547, % | P | HOCDI, n=2,368, % | No CDI, n=2,368, % | P | |
| ||||||
| Age, y | 70.9 (15.1) | 68.6 (16.8) | <0.01 | 70.9 (15.1) | 69.8 (15.9) | 0.02 |
| Male | 46.8 | 46.0 | 0.44 | 46.8 | 47.2 | 0.79 |
| Race | ||||||
| White | 61.0 | 63.3 | 61.0 | 58.1 | ||
| Black | 15.6 | 14.5 | <0.01 | 15.6 | 17.0 | 0.11 |
| Hispanic | 3.2 | 5.4 | 3.2 | 4.1 | ||
| Other race | 20.2 | 16.8 | 20.2 | 20.9 | ||
| Marital status | ||||||
| Married | 31.6 | 36.3 | <0.01 | 31.6 | 32.6 | 0.74 |
| Single/divorced | 52.8 | 51.1 | 52.8 | 52.0 | ||
| Other/unknown | 15.7 | 12.6 | 15.7 | 14.5 | ||
| Insurance status | ||||||
| Medicare traditional | 63.2 | 59.5 | 63.2 | 60.3 | ||
| Medicare managed | 10.6 | 10.1 | 10.6 | 10.9 | ||
| Medicaid traditional | 7.6 | 6.9 | 7.6 | 8.2 | ||
| Medicaid managed | 1.8 | 2.0 | <0.01 | 1.8 | 1.8 | 0.50 |
| Managed care | 10.8 | 12.3 | 10.8 | 12.0 | ||
| Commercial | 2.0 | 3.5 | 2.0 | 2.2 | ||
| Self‐pay/other/unknown | 4.0 | 5.7 | 4.0 | 4.7 | ||
| Infection source | ||||||
| Respiratory | 46.5 | 37.0 | <0.01 | 46.5 | 49.6 | 0.03 |
| Skin/bone | 10.1 | 8.6 | 0.01 | 10.1 | 11.2 | 0.21 |
| Urinary | 52.2 | 51.3 | 0.38 | 52.2 | 50.3 | 0.18 |
| Blood | 11.1 | 15.1 | <0.01 | 11.1 | 11.5 | 0.65 |
| Infecting organism | ||||||
| Gram negative | 35.0 | 36.6 | <0.01 | 35.0 | 33.1 | 0.18 |
| Anaerobe | 1.4 | 0.7 | <0.01 | 1.4 | 1.1 | 0.24 |
| Fungal | 17.5 | 7.5 | <0.01 | 17.5 | 18.3 | 0.44 |
| Most common comorbid conditions | ||||||
| Congestive heart failure | 35.1 | 24.6 | <0.01 | 35.1 | 37.5 | 0.06 |
| Chronic lung disease | 31.6 | 27.6 | <0.01 | 31.6 | 32.1 | 0.71 |
| Hypertension | 31.5 | 37.7 | <0.01 | 31.5 | 29.7 | 0.16 |
| Renal Failure | 29.7 | 23.8 | <0.01 | 29.7 | 31.2 | 0.28 |
| Weight Loss | 27.7 | 13.3 | <0.01 | 27.7 | 29.4 | 0.17 |
| Treatments by day 2 | ||||||
| ICU admission | 40.0 | 29.5 | <0.01 | 40.0 | 40.7 | 0.64 |
| Use of bicarbonate | 12.2 | 7.1 | <0.01 | 12.2 | 13.6 | 0.15 |
| Fresh frozen plasma | 1.4 | 1.0 | 0.03 | 1.4 | 1.1 | 0.36 |
| Inotropes | 1.4 | 0.9 | 0.01 | 1.4 | 2.2 | 0.04 |
| Hydrocortisone | 6.7 | 4.7 | <0.01 | 6.7 | 7.4 | 0.33 |
| Thiamine | 4.2 | 3.3 | 0.01 | 4.2 | 4.1 | 0.83 |
| Psychotropics (eg, haldol for delirium) | 10.0 | 9.2 | 0.21 | 10.0 | 10.8 | 0.36 |
| Restraints (eg, for delirium) | 2.0 | 1.5 | 0.05 | 2.0 | 2.5 | 0.29 |
| Angiotensin‐converting enzyme inhibitors | 12.1 | 13.2 | 0.12 | 12.1 | 10.9 | 0.20 |
| Statins | 18.8 | 21.1 | 0.01 | 18.8 | 16.9 | 0.09 |
| Drotrecogin alfa | 0.6 | 0.3 | 0.00 | 0.6 | 0.6 | 0.85 |
| Foley catheter | 19.2 | 19.8 | 0.50 | 19.2 | 22.0 | 0.02 |
| Diuretics | 28.5 | 25.4 | 0.01 | 28.5 | 29.6 | 0.42 |
| Red blood cells | 15.5 | 10.6 | <0.01 | 15.5 | 15.8 | 0.81 |
| Calcium channel blockers | 19.3 | 16.8 | 0.01 | 19.3 | 19.1 | 0.82 |
| ‐Blockers | 32.7 | 29.6 | 0.01 | 32.7 | 30.6 | 0.12 |
| Proton pump inhibitors | 59.6 | 53.1 | <0.01 | 59.6 | 61.0 | 0.31 |
Analysis Across Clinical Subgroups
In a secondary analysis, we examined heterogeneity in the association between HOCDI and outcomes within subsets of patients defined by age, combined comorbidity score, and admission to the ICU by day 2. We created separate propensity scores using the same covariates in the primary analysis, but limited matches to within these subsets. For each group, we examined how the covariates in the HOCDI and control groups differed after matching with inference tests that took the paired nature of the data into account. All analyses were carried out using Stata/SE 11.1 (StataCorp, College Station, TX).
RESULTS
We identified 486,943 adult sepsis admissions to a Premier hospital between July 1, 2004 and December 31, 2010. After applying all exclusion criteria, we had a final sample of 218,915 admissions with sepsis (from 400 hospitals) at risk for HOCDI (Figure 1). Of these, 2368 (1.08%) met criteria for diagnosis of CDI after hospital day 2 and were matched to controls using index date and propensity score.
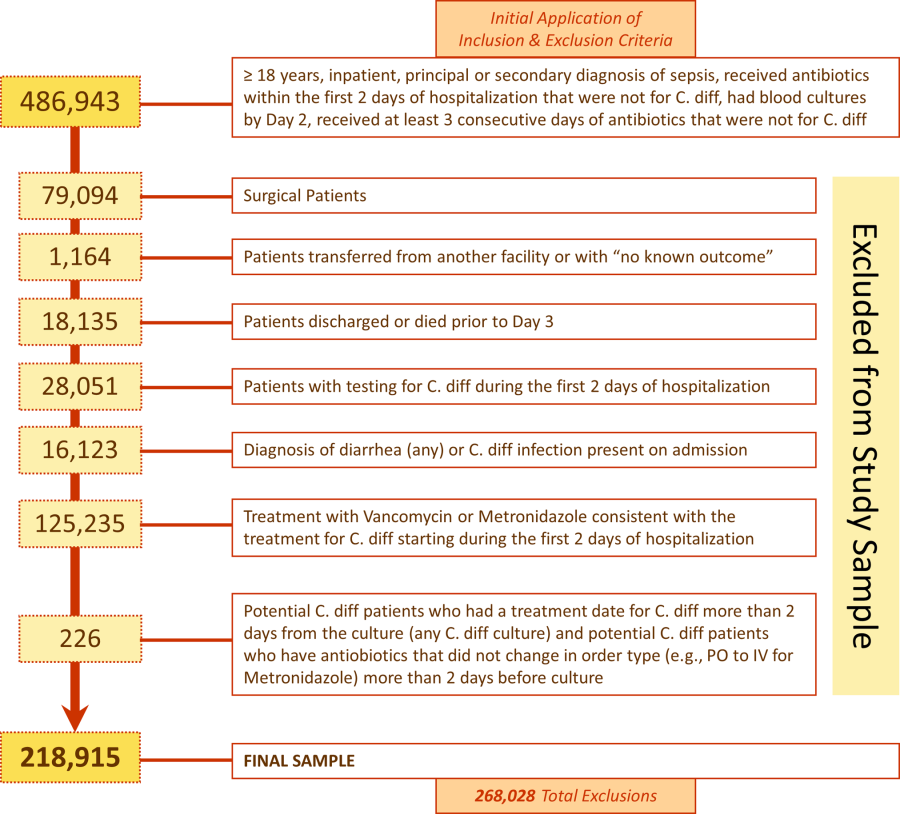
Patient and Hospital Factors
After matching, the median age was 71 years in cases and 70 years in controls (Table 1). Less than half (46%) of the population was male. Most cases (61%) and controls (58%) were white. Heart failure, hypertension, chronic lung disease, renal failure, and weight loss were the most common comorbid conditions. Our propensity model, which had a C statistic of 0.75, identified patients whose risk varied from a mean of 0.1% in the first decile to a mean of 3.8% in the tenth decile. Before matching, 40% of cases and 29% of controls were treated in the ICU by hospital day 2; after matching, 40% of both cases and controls were treated in the ICU by hospital day 2.
Distribution by LOS, Index Day, and Risk for Mortality
The unadjusted and unmatched LOS was longer for cases than controls (19 days vs 8 days, Table 2) (see Supporting Figure 1 in the online version of this article). Approximately 90% of the patients had an index day of 14 or less (Figure 2). Among patients both with and without CDI, the unadjusted mortality risk increased as the index day (and thus the total LOS) increased.
| Outcome | HOCDI | No HOCDI | Difference (95% CI) | P |
|---|---|---|---|---|
| ||||
| Length of stay, d | ||||
| Raw results | 19.2 | 8.3 | 8.4 (8.48.5) | <0.01 |
| Raw results for survivors only | 18.6 | 8.0 | 10.6 (10.311.0) | <0.01 |
| Matched results | 19.2 | 14.2 | 5.1(4.45.7) | <0.01 |
| Matched results for survivors only | 18.6 | 13.6 | 5.1 (4.45.8) | <0.01 |
| Mortality, % | ||||
| Raw results | 24.0 | 10.1 | 13.9 (12.615.1), RR=2.4 (2.22.5) | <0.01 |
| Matched results | 24.0 | 15.4 | 8.6 (6.410.9), RR=1.6 (1.41.8) | <0.01 |
| Costs, US$ | ||||
| Raw results median costs [interquartile range] | $26,187 [$15,117$46,273] | $9,988 [$6,296$17,351] | $16,190 ($15,826$16,555) | <0.01 |
| Raw results for survivors only [interquartile range] | $24,038 [$14,169$41,654] | $9,429 [$6,070$15,875] | $14,620 ($14,246$14,996) | <0.01 |
| Matched results [interquartile range] | $26,187 [$15,117$46,273] | $19,160 [$12,392$33,777] | $5,308 ($4,521$6,108) | |
| Matched results for survivors only [interquartile range] | $24,038 [$14,169$41,654] | $17,811 [$11,614$29,298] | $4,916 ($4,088$5,768) | <0.01 |
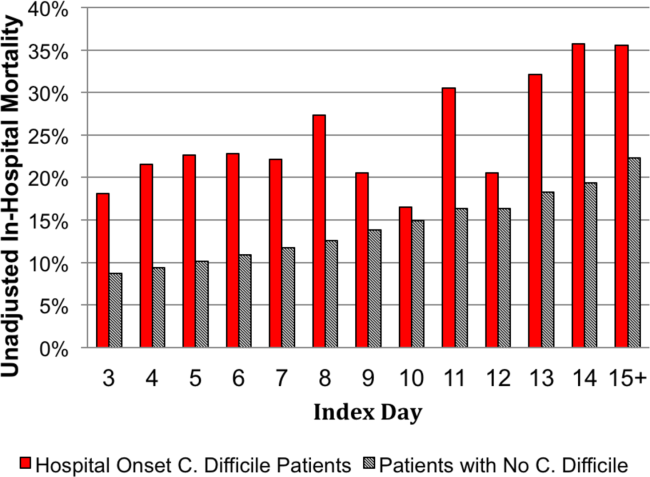
Adjusted Results
Compared to patients without disease, HOCDI patients had an increased unadjusted mortality (24% vs 10%, P<0.001). This translates into a relative risk of 2.4 (95% confidence interval [CI]: 2.2, 2.5). In the matched cohort, the difference in the mortality rates was attenuated, but still significantly higher in the HOCDI patients (24% versus 15%, P<0.001, an absolute difference of 9%; 95% CI: 6.410.8). The adjusted relative risk of mortality for HOCDI was 1.6 (95% CI: 1.41.8; Table 2). After matching, patients with CDI had a LOS of 19.2 days versus 14.2 days in matched controls (difference of 5.1 days; 95% CI: 4.45.7; P<0.001). When the LOS analysis was limited to survivors only, this difference of 5 days remained (P<0.001). In an analysis limited to survivors only, the difference in median costs between cases and controls was $4916 (95% CI: $4088$5768; P<0.001). In a secondary analysis examining heterogeneity between HOCDI and outcomes across clinical subgroups, the absolute difference in mortality and costs between cases and controls varied across demographics, comorbidity, and ICU admission, but the relative risks were similar (Figure 3) (see Supporting Figure 3 in the online version of this article).
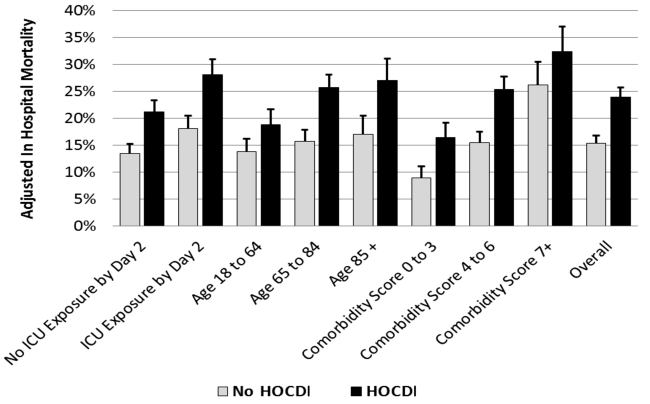
DISCUSSION
In this large cohort of patients with sepsis, we found that approximately 1 in 100 patients with sepsis developed HOCDI. Even after matching with controls based on the date of symptom onset and propensity score, patients who developed HOCDI were more than 1.6 times more likely to die in the hospital. HOCDI also added 5 days to the average hospitalization for patients with sepsis and increased median costs by approximately $5000. These findings suggest that a hospital that prevents 1 case of HOCDI per month in sepsis patients could avoid 1 death and 60 inpatient days annually, achieving an approximate yearly savings of $60,000.
Until now, the incremental cost and mortality attributable to HOCDI in sepsis patients have been poorly understood. Attributing outcomes can be methodologically challenging because patients who are at greatest risk for poor outcomes are the most likely to contract the disease and are at risk for longer periods of time. Therefore, it is necessary to take into account differences in severity of illness and time at risk between diseased and nondiseased populations and to ensure that outcomes attributed to the disease occur after disease onset.[28, 32] The majority of prior studies examining the impact of CDI on hospitalized patients have been limited by a lack of adequate matching to controls, small sample size, or failure to take into account time to infection.[16, 17, 19, 20]
A few studies have taken into account severity, time to infection, or both in estimating the impact of HOCDI. Using a time‐dependent Cox model that accounted for time to infection, Micek et al. found no difference in mortality but a longer LOS in mechanically ventilated patients (not limited to sepsis) with CDI.[33] However, their study was conducted at only 3 centers, did not take into account severity at the time of diagnosis, and did not clearly distinguish between community‐onset CDI and HOCDI. Oake et al. and Forster et al. examined the impact of CDI on patients hospitalized in a 2‐hospital health system in Canada.[12, 13] Using the baseline mortality estimate in a Cox multivariate proportional hazards regression model that accounted for the time‐varying nature of CDI, they found that HOCDI increased absolute risk of death by approximately 10%. Also, notably similar to our study were their findings that HOCDI occurred in approximately 1 in 100 patients and that the attributable median increase in LOS due to hospital‐onset CDI was 6 days. Although methodologically rigorous, these 2 small studies did not assess the impact of CDI on costs of care, were not focused on sepsis patients or even patients who received antibiotics, and also did not clearly distinguish between community‐onset CDI and HOCDI.
Our study therefore has important strengths. It is the first to examine the impact of HOCDI, including costs, on the outcomes of patients hospitalized with sepsis. The fact that we took into account both time to diagnosis and severity at the time of diagnosis (by using an index date for both cases and controls and determining severity on that date) prevented us from overestimating the impact of HOCDI on outcomes. The large differences in outcomes we observed in unadjusted and unmatched data were tempered after multivariate adjustment (eg, difference in LOS from 10.6 days to 5.1 additional days, costs from $14,620 to $4916 additional costs after adjustment). Our patient sample was derived from a large, multihospital database that contains actual hospital costs as derived from internal accounting systems. The fact that our study used data from hundreds of hospitals means that our estimates of cost, LOS, and mortality may be more generalizable than the work of Micek et al., Oake et al., and Forster et al.
This work also has important implications. First, hospital administrators, clinicians, and researchers can use our results to evaluate the cost‐effectiveness of HOCDI prevention measures (eg, hand hygiene programs, antibiotic stewardship). By quantifying the cost per case in sepsis patients, we allow administrators and researchers to compare the incremental costs of HOCDI prevention programs to the dollars and lives saved due to prevention efforts. Second, we found that our propensity model identified patients whose risk varied greatly. This suggests that an opportunity exists to identify subgroups of patients that are at highest risk. Identifying high‐risk subgroups will allow for targeted risk reduction interventions and the opportunity to reduce transmission (eg, by placing high‐risk patients in a private room). Finally, we have reaffirmed that time to diagnosis and presenting severity need to be rigorously addressed prior to making estimates of the impact of CDI burden and other hospital‐acquired conditions and injuries.
There are limitations to this study as well. We did not have access to microbiological data. However, we required a diagnosis code of CDI, evidence of testing, and treatment after the date of testing to confirm a diagnosis. We also adopted detailed exclusion criteria to ensure that CDI that was not present on admission and that controls did not have CDI. These stringent inclusion and exclusion criteria strengthened the internal validity of our estimates of disease impact. We used administrative claims data, which limited our ability to adjust for severity. However, the detailed nature of the database allowed us to use treatments, such as vasopressors and antibiotics, to identify cases; treatments were also used as a validated indicator of severity,[26] which may have helped to reduce some of this potential bias. Although our propensity model included many predictors of CDI, such as use of proton pump inhibitors and factors associated with mortality, not every confounder was completely balanced after propensity matching, although the statistical differences may have been related to our large sample size and therefore might not be clinically significant. We also may have failed to include all possible predictors of CDI in the propensity model.
In a large, diverse cohort of hospitalized patients with sepsis, we found that HOCDI lengthened hospital stay by approximately 5 days, increased risk of in‐hospital mortality by 9%, and increased hospital cost by approximately $5000 per patient. These findings highlight the importance of identifying effective prevention measures and of determining the patient populations at greatest risk for HOCDI.
Disclosures: The study was conducted with funding from the Division of Critical Care and the Center for Quality of Care Research at Baystate Medical Center. Dr. Lagu is supported by the National Heart, Lung, and Blood Institute of the National Institutes of Health under award number K01HL114745. Dr. Stefan is supported by the National Heart, Lung, and Blood Institute of the National Institutes of Health under award number K01HL114631. Drs. Lagu and Lindenauer had full access to all of the data in the study; they take responsibility for the integrity of the data and the accuracy of the data analysis. Drs. Lagu, Lindenauer, Steingrub, Higgins, Stefan, Haessler, and Rothberg conceived of the study. Dr. Lindenauer acquired the data. Drs. Lagu, Lindenauer, Rothberg, Steingrub, Nathanson, Stefan, Haessler, Higgins, and Mr. Hannon analyzed and interpreted the data. Dr. Lagu drafted the manuscript. Drs. Lagu, Lindenauer, Rothberg, Steingrub, Nathanson, Stefan, Haessler, Higgins, and Mr. Hannon critically reviewed the manuscript for important intellectual content. Dr. Nathanson carried out the statistical analyses. Dr. Nathanson, through his company OptiStatim LLC, was paid by the investigators with funding from the Department of Medicine at Baystate Medical Center to assist in conducting the statistical analyses in this study. The authors report no further conflicts of interest.
- , , , . Increasing prevalence and severity of Clostridium difficile colitis in hospitalized patients in the United States. Arch Surg. 2007;142(7):624–631; discussion 631.
- , , , et al. The changing epidemiology of Clostridium difficile infections. Clin Microbiol Rev. 2010;23(3):529–549.
- , . Clostridium Difficile‐Associated Disease in U.S. Hospitals, 1993–2005. HCUP Statistical Brief #50. April 2008. Agency for Healthcare Research and Quality, Rockville, MD. Available at: http://www.hcup‐us.ahrq.gov/reports/statbriefs/sb50.pdf. Accessed April 4, 2014.
- , , , . National point prevalence of Clostridium difficile in US health care facility inpatients, 2008. Am J Infect Control. 2009;37(4):263–270.
- . A 76‐year‐old man with recurrent Clostridium difficile‐associated diarrhea: review of C. difficile infection. JAMA. 2009;301(9):954–962.
- , , , , , . Recurrent Clostridium difficile disease: epidemiology and clinical characteristics. Infect Control Hosp Epidemiol. 1999;20(1):43–50.
- , , , , , . Recurrent Clostridium difficile diarrhea: characteristics of and risk factors for patients enrolled in a prospective, randomized, double‐blinded trial. Clin Infect Dis. 1997;24(3):324–333.
- . Narrative review: the new epidemic of Clostridium difficile‐associated enteric disease. Ann Intern Med. 2006;145(10):758–764.
- , , , et al. Impact of emergency colectomy on survival of patients with fulminant Clostridium difficile colitis during an epidemic caused by a hypervirulent strain. Ann Surg. 2007;245(2):267–272.
- , , , . Hospital‐acquired Clostridium difficile‐associated disease in the intensive care unit setting: epidemiology, clinical course and outcome. BMC Infect Dis. 2007;7:42.
- , , , , , . Factors associated with prolonged symptoms and severe disease due to Clostridium difficile. Age Ageing. 1999;28(2):107–113.
- , , , , , . The effect of hospital‐acquired Clostridium difficile infection on in‐hospital mortality. Arch Intern Med. 2010;170(20):1804–1810.
- , , , , , . The effect of hospital‐acquired infection with Clostridium difficile on length of stay in hospital. CMAJ. 2012;184(1):37–42.
- , . Clostridium difficile—more difficult than ever. N Engl J Med. 2008;359(18):1932–1940.
- , , , et al. Clinical practice guidelines for Clostridium difficile infection in adults: 2010 update by the society for healthcare epidemiology of America (SHEA) and the infectious diseases society of America (IDSA). Infect Control Hosp Epidemiol. 2010;31(5):431–455.
- , , , . Health care costs and mortality associated with nosocomial diarrhea due to Clostridium difficile. Clin Infect Dis. 2002;34(3):346–353.
- , , , , . Short‐ and long‐term attributable costs of Clostridium difficile‐associated disease in nonsurgical inpatients. Clin Infect Dis. 2008;46(4):497–504.
- , , , , . Estimation of extra hospital stay attributable to nosocomial infections: heterogeneity and timing of events. J Clin Epidemiol. 2000;53(4):409–417.
- , , , et al. Attributable outcomes of endemic Clostridium difficile‐associated disease in nonsurgical patients. Emerging Infect Dis. 2008;14(7):1031–1038.
- , . Excess length of stay, charges, and mortality attributable to medical injuries during hospitalization. JAMA. 2003;290(14):1868–1874.
- , , , , , . Association of corticosteroid dose and route of administration with risk of treatment failure in acute exacerbation of chronic obstructive pulmonary disease. JAMA. 2010;303(23):2359–2367.
- , , , , , . The relationship between hospital spending and mortality in patients with sepsis. Arch Intern Med. 2011;171(4):292–299.
- , , , , , . Comparative effectiveness of macrolides and quinolones for patients hospitalized with acute exacerbations of chronic obstructive pulmonary disease (AECOPD). J Hosp Med. 2010;5(5):261–267.
- , , , , . A combined comorbidity score predicted mortality in elderly patients better than existing scores. J Clin Epidemiol. 2011;64(7):749–759.
- , , , , , . Epidemiology of severe sepsis in the United States: analysis of incidence, outcome, and associated costs of care. Crit Care Med. 2001;29(7):1303–1310.
- , , , et al. Development and validation of a model that uses enhanced administrative data to predict mortality in patients with sepsis. Crit Care Med. 2011;39(11):2425–2430.
- , , , , . Incorporating initial treatments improves performance of a mortality prediction model for patients with sepsis. Pharmacoepidemiol Drug Saf. 2012;21(suppl 2):44–52.
- , , , . Nosocomial infection, length of stay, and time‐dependent bias. Infect Control Hosp Epidemiol. 2009;30(3):273–276.
- , , , , , . Length of stay and hospital costs among high‐risk patients with hospital‐origin Clostridium difficile‐associated diarrhea. J Med Econ. 2013;16(3):440–448.
- Rogers. Regression standard errors in clustered samples. Stata Technical Bulletin. 1993;13(13):19–23.
- . Reducing bias in a propensity score matched‐pair sample using greedy matching techniques. In: Proceedings of the 26th Annual SAS Users Group International Conference; April 22–25, 2001; Long Beach, CA. Paper 214‐26. Available at: http://www2.sas.com/proceedings/sugi26/p214‐26.pdf. Accessed April 4, 2014.
- , . Prolongation of length of stay and Clostridium difficile infection: a review of the methods used to examine length of stay due to healthcare associated infections. Antimicrob Resist Infect Control. 2012;1(1):14.
- , , , et al. Clostridium difficile Infection: a multicenter study of epidemiology and outcomes in mechanically ventilated patients. Crit Care Med. 2013;41(8):1968–1975.
There are approximately 3 million cases of Clostridium difficile infection (CDI) per year in the United States.[1, 2, 3, 4] Of these, 10% result in a hospitalization or occur as a consequence of the exposures and treatments associated with hospitalization.[1, 2, 3, 4] Some patients with CDI experience mild diarrhea that is responsive to therapy, but other patients experience severe, life‐threatening disease that is refractory to treatment, leading to pseudomembranous colitis, toxic megacolon, and sepsis with a 60‐day mortality rate that exceeds 12%.[5, 6, 7, 8, 9, 10, 11, 12, 13, 14]
Hospital‐onset CDI (HOCDI), defined as C difficile‐associated diarrhea and related symptoms with onset more than 48 hours after admission to a healthcare facility,[15] represents a unique marriage of CDI risk factors.[5] A vulnerable patient is introduced into an environment that contains both exposure to C difficile (through other patients or healthcare workers) and treatment with antibacterial agents that may diminish normal flora. Consequently, CDI is common among hospitalized patients.[16, 17, 18] A particularly important group for understanding the burden of disease is patients who initially present to the hospital with sepsis and subsequently develop HOCDI. Sepsis patients are often critically ill and are universally treated with antibiotics.
Determining the incremental cost and mortality risk attributable to HOCDI is methodologically challenging. Because HOCDI is associated with presenting severity, the sickest patients are also the most likely to contract the disease. HOCDI is also associated with time of exposure or length of stay (LOS). Because LOS is a risk factor, comparing LOS between those with and without HOCDI will overestimate the impact if the time to diagnosis is not taken into account.[16, 17, 19, 20] We aimed to examine the impact of HOCDI in hospitalized patients with sepsis using a large, multihospital database with statistical methods that took presenting severity and time to diagnosis into account.
METHODS
Data Source and Subjects
Permission to conduct this study was obtained from the institutional review board at Baystate Medical Center. We used the Premier Healthcare Informatics database, a voluntary, fee‐supported database created to measure quality and healthcare utilization, which has been used extensively in health services research.[21, 22, 23] In addition to the elements found in hospital claims derived from the uniform billing 04 form, Premier data include an itemized, date‐stamped log of all items and services charged to the patient or their insurer, including medications, laboratory tests, and diagnostic and therapeutic services. Approximately 75% of hospitals that submit data also provide information on actual hospital costs, taken from internal cost accounting systems. The rest provide cost estimates based on Medicare cost‐to‐charge ratios. Participating hospitals are similar to the composition of acute care hospitals nationwide, although they are more commonly small‐ to midsized nonteaching facilities and are more likely to be located in the southern United States.
We included medical (nonsurgical) adult patients with sepsis who were admitted to a participating hospital between July 1, 2004 and December 31, 2010. Because we sought to focus on the care of patients who present to the hospital with sepsis, we defined sepsis as the presence of a diagnosis of sepsis plus evidence of both blood cultures and antibiotic treatment within the first 2 days of hospitalization; we used the first 2 days of hospitalization rather than just the first day because, in administrative datasets, the duration of the first hospital day includes partial days that can vary in length. We excluded patients who died or were discharged prior to day 3, because HOCDI is defined as onset after 48 hours in a healthcare facility.[15] We also excluded surviving patients who received less than 3 consecutive days of antibiotics, and patients who were transferred from or to another acute‐care facility; the latter exclusion criterion was used because we could not accurately determine the onset or subsequent course of their illness.
Identification of Patients at Risk for and Diagnosed With HOCDI
Among eligible patients with sepsis, we aimed to identify a cohort at risk for developing CDI during the hospital stay. We excluded patients: (1) with a diagnosis indicating that diarrhea was present on admission, (2) with a diagnosis of CDI that was indicated to be present on admission, (3) who were tested for CDI on the first or second hospital day, and (4) who received an antibiotic that could be consistent with treatment for CDI (oral or intravenous [IV] metronidazole or oral vancomycin) on hospital days 1 or 2.
Next, we aimed to identify sepsis patients at risk for HOCDI who developed HOCDI during their hospital stay. Among eligible patients described above, we considered a patient to have HOCDI if they had an International Classification of Diseases, Ninth Revision, Clinical Modification diagnosis of CDI (primary or secondary but not present on admission), plus evidence of testing for CDI after hospital day 2, and treatment with oral vancomycin or oral or IV metronidazole that was started after hospital day 2 and within 2 days of the C difficile test, and evidence of treatment for CDI for at least 3 days unless the patient was discharged or died.
Patient Information
We recorded patient age, gender, marital status, insurance status, race, and ethnicity. Using software provided by the Healthcare Costs and Utilization Project of the Agency for Healthcare Research and Quality, we categorized information on 30 comorbid conditions. We also created a single numerical comorbidity score based on a previously published and validated combined comorbidity score that predicts 1‐year mortality.[24] Based on a previously described algorithm,[25] we used diagnosis codes to assess the source (lung, abdomen, urinary tract, blood, other) and type of sepsis (Gram positive, Gram negative, mixed, anaerobic, fungal). Because patients can have more than 1 potential source of sepsis (eg, pneumonia and urinary tract infection) and more than 1 organism causing infection (eg, urine with Gram negative rods and blood culture with Gram positive cocci), these categories are not mutually exclusive (see Supporting Table 1 in the online version of this article). We used billing codes to identify the use of therapies, monitoring devices, and pharmacologic treatments to characterize both initial severity of illness and severity at the time of CDI diagnosis. These therapies are included in a validated sepsis mortality prediction model (designed for administrative datasets) with similar discrimination and calibration to clinical intensive care unit (ICU) risk‐adjustment models such as the mortality probability model, version III.[26, 27]
Outcomes
Our primary outcome of interest was in‐hospital mortality. Secondary outcomes included LOS and costs for survivors only and for all patients.
Statistical Methods
We calculated patient‐level summary statistics for all patients using frequencies for binary variables and medians and interquartile percentiles for continuous variables. P values <0.05 were considered statistically significant.
To account for presenting severity and time to diagnosis, we used methods that have been described elsewhere.[12, 13, 18, 20, 28] First, we identified patients who were eligible to develop HOCDI. Second, for all eligible patients, we identified a date of disease onset (index date). For patients who met criteria for HOCDI, this was the date on which the patient was tested for CDI. For eligible patients without disease, this was a date randomly assigned to any time during the hospital stay.[29] Next, we developed a nonparsimonious propensity score model that included all patient characteristics (demographics, comorbidities, sepsis source, and severity of illness on presentation and on the index date; all variables listed in Table 1 were included in the propensity model). Some of the variables for this model (eg, mechanical ventilation and vasopressors) were derived from a validated severity model.[26] We adjusted for correlation within hospital when creating the propensity score using Huber‐White robust standard error estimators clustered at the hospital level.[30] We then created matched pairs with the same LOS prior to the index date and similar propensity for developing CDI. We first matched on index date, and then, within each index‐datematched subset, matched patients with and without HOCDI by their propensity score using a 5‐to‐1 greedy match algorithm.[31] We used the differences in LOS between the cases and controls after the index date to calculate the additional attributable LOS estimates; we also separately estimated the impact on cost and LOS in a group limited to those who survived after discharge because of concerns that death could shorten LOS and reduce costs.
| Before Matching | After Matching | |||||
|---|---|---|---|---|---|---|
| HOCDI, n=2,368, % | No CDI, n=216,547, % | P | HOCDI, n=2,368, % | No CDI, n=2,368, % | P | |
| ||||||
| Age, y | 70.9 (15.1) | 68.6 (16.8) | <0.01 | 70.9 (15.1) | 69.8 (15.9) | 0.02 |
| Male | 46.8 | 46.0 | 0.44 | 46.8 | 47.2 | 0.79 |
| Race | ||||||
| White | 61.0 | 63.3 | 61.0 | 58.1 | ||
| Black | 15.6 | 14.5 | <0.01 | 15.6 | 17.0 | 0.11 |
| Hispanic | 3.2 | 5.4 | 3.2 | 4.1 | ||
| Other race | 20.2 | 16.8 | 20.2 | 20.9 | ||
| Marital status | ||||||
| Married | 31.6 | 36.3 | <0.01 | 31.6 | 32.6 | 0.74 |
| Single/divorced | 52.8 | 51.1 | 52.8 | 52.0 | ||
| Other/unknown | 15.7 | 12.6 | 15.7 | 14.5 | ||
| Insurance status | ||||||
| Medicare traditional | 63.2 | 59.5 | 63.2 | 60.3 | ||
| Medicare managed | 10.6 | 10.1 | 10.6 | 10.9 | ||
| Medicaid traditional | 7.6 | 6.9 | 7.6 | 8.2 | ||
| Medicaid managed | 1.8 | 2.0 | <0.01 | 1.8 | 1.8 | 0.50 |
| Managed care | 10.8 | 12.3 | 10.8 | 12.0 | ||
| Commercial | 2.0 | 3.5 | 2.0 | 2.2 | ||
| Self‐pay/other/unknown | 4.0 | 5.7 | 4.0 | 4.7 | ||
| Infection source | ||||||
| Respiratory | 46.5 | 37.0 | <0.01 | 46.5 | 49.6 | 0.03 |
| Skin/bone | 10.1 | 8.6 | 0.01 | 10.1 | 11.2 | 0.21 |
| Urinary | 52.2 | 51.3 | 0.38 | 52.2 | 50.3 | 0.18 |
| Blood | 11.1 | 15.1 | <0.01 | 11.1 | 11.5 | 0.65 |
| Infecting organism | ||||||
| Gram negative | 35.0 | 36.6 | <0.01 | 35.0 | 33.1 | 0.18 |
| Anaerobe | 1.4 | 0.7 | <0.01 | 1.4 | 1.1 | 0.24 |
| Fungal | 17.5 | 7.5 | <0.01 | 17.5 | 18.3 | 0.44 |
| Most common comorbid conditions | ||||||
| Congestive heart failure | 35.1 | 24.6 | <0.01 | 35.1 | 37.5 | 0.06 |
| Chronic lung disease | 31.6 | 27.6 | <0.01 | 31.6 | 32.1 | 0.71 |
| Hypertension | 31.5 | 37.7 | <0.01 | 31.5 | 29.7 | 0.16 |
| Renal Failure | 29.7 | 23.8 | <0.01 | 29.7 | 31.2 | 0.28 |
| Weight Loss | 27.7 | 13.3 | <0.01 | 27.7 | 29.4 | 0.17 |
| Treatments by day 2 | ||||||
| ICU admission | 40.0 | 29.5 | <0.01 | 40.0 | 40.7 | 0.64 |
| Use of bicarbonate | 12.2 | 7.1 | <0.01 | 12.2 | 13.6 | 0.15 |
| Fresh frozen plasma | 1.4 | 1.0 | 0.03 | 1.4 | 1.1 | 0.36 |
| Inotropes | 1.4 | 0.9 | 0.01 | 1.4 | 2.2 | 0.04 |
| Hydrocortisone | 6.7 | 4.7 | <0.01 | 6.7 | 7.4 | 0.33 |
| Thiamine | 4.2 | 3.3 | 0.01 | 4.2 | 4.1 | 0.83 |
| Psychotropics (eg, haldol for delirium) | 10.0 | 9.2 | 0.21 | 10.0 | 10.8 | 0.36 |
| Restraints (eg, for delirium) | 2.0 | 1.5 | 0.05 | 2.0 | 2.5 | 0.29 |
| Angiotensin‐converting enzyme inhibitors | 12.1 | 13.2 | 0.12 | 12.1 | 10.9 | 0.20 |
| Statins | 18.8 | 21.1 | 0.01 | 18.8 | 16.9 | 0.09 |
| Drotrecogin alfa | 0.6 | 0.3 | 0.00 | 0.6 | 0.6 | 0.85 |
| Foley catheter | 19.2 | 19.8 | 0.50 | 19.2 | 22.0 | 0.02 |
| Diuretics | 28.5 | 25.4 | 0.01 | 28.5 | 29.6 | 0.42 |
| Red blood cells | 15.5 | 10.6 | <0.01 | 15.5 | 15.8 | 0.81 |
| Calcium channel blockers | 19.3 | 16.8 | 0.01 | 19.3 | 19.1 | 0.82 |
| ‐Blockers | 32.7 | 29.6 | 0.01 | 32.7 | 30.6 | 0.12 |
| Proton pump inhibitors | 59.6 | 53.1 | <0.01 | 59.6 | 61.0 | 0.31 |
Analysis Across Clinical Subgroups
In a secondary analysis, we examined heterogeneity in the association between HOCDI and outcomes within subsets of patients defined by age, combined comorbidity score, and admission to the ICU by day 2. We created separate propensity scores using the same covariates in the primary analysis, but limited matches to within these subsets. For each group, we examined how the covariates in the HOCDI and control groups differed after matching with inference tests that took the paired nature of the data into account. All analyses were carried out using Stata/SE 11.1 (StataCorp, College Station, TX).
RESULTS
We identified 486,943 adult sepsis admissions to a Premier hospital between July 1, 2004 and December 31, 2010. After applying all exclusion criteria, we had a final sample of 218,915 admissions with sepsis (from 400 hospitals) at risk for HOCDI (Figure 1). Of these, 2368 (1.08%) met criteria for diagnosis of CDI after hospital day 2 and were matched to controls using index date and propensity score.
Patient and Hospital Factors
After matching, the median age was 71 years in cases and 70 years in controls (Table 1). Less than half (46%) of the population was male. Most cases (61%) and controls (58%) were white. Heart failure, hypertension, chronic lung disease, renal failure, and weight loss were the most common comorbid conditions. Our propensity model, which had a C statistic of 0.75, identified patients whose risk varied from a mean of 0.1% in the first decile to a mean of 3.8% in the tenth decile. Before matching, 40% of cases and 29% of controls were treated in the ICU by hospital day 2; after matching, 40% of both cases and controls were treated in the ICU by hospital day 2.
Distribution by LOS, Index Day, and Risk for Mortality
The unadjusted and unmatched LOS was longer for cases than controls (19 days vs 8 days, Table 2) (see Supporting Figure 1 in the online version of this article). Approximately 90% of the patients had an index day of 14 or less (Figure 2). Among patients both with and without CDI, the unadjusted mortality risk increased as the index day (and thus the total LOS) increased.
| Outcome | HOCDI | No HOCDI | Difference (95% CI) | P |
|---|---|---|---|---|
| ||||
| Length of stay, d | ||||
| Raw results | 19.2 | 8.3 | 8.4 (8.48.5) | <0.01 |
| Raw results for survivors only | 18.6 | 8.0 | 10.6 (10.311.0) | <0.01 |
| Matched results | 19.2 | 14.2 | 5.1(4.45.7) | <0.01 |
| Matched results for survivors only | 18.6 | 13.6 | 5.1 (4.45.8) | <0.01 |
| Mortality, % | ||||
| Raw results | 24.0 | 10.1 | 13.9 (12.615.1), RR=2.4 (2.22.5) | <0.01 |
| Matched results | 24.0 | 15.4 | 8.6 (6.410.9), RR=1.6 (1.41.8) | <0.01 |
| Costs, US$ | ||||
| Raw results median costs [interquartile range] | $26,187 [$15,117$46,273] | $9,988 [$6,296$17,351] | $16,190 ($15,826$16,555) | <0.01 |
| Raw results for survivors only [interquartile range] | $24,038 [$14,169$41,654] | $9,429 [$6,070$15,875] | $14,620 ($14,246$14,996) | <0.01 |
| Matched results [interquartile range] | $26,187 [$15,117$46,273] | $19,160 [$12,392$33,777] | $5,308 ($4,521$6,108) | |
| Matched results for survivors only [interquartile range] | $24,038 [$14,169$41,654] | $17,811 [$11,614$29,298] | $4,916 ($4,088$5,768) | <0.01 |
Adjusted Results
Compared to patients without disease, HOCDI patients had an increased unadjusted mortality (24% vs 10%, P<0.001). This translates into a relative risk of 2.4 (95% confidence interval [CI]: 2.2, 2.5). In the matched cohort, the difference in the mortality rates was attenuated, but still significantly higher in the HOCDI patients (24% versus 15%, P<0.001, an absolute difference of 9%; 95% CI: 6.410.8). The adjusted relative risk of mortality for HOCDI was 1.6 (95% CI: 1.41.8; Table 2). After matching, patients with CDI had a LOS of 19.2 days versus 14.2 days in matched controls (difference of 5.1 days; 95% CI: 4.45.7; P<0.001). When the LOS analysis was limited to survivors only, this difference of 5 days remained (P<0.001). In an analysis limited to survivors only, the difference in median costs between cases and controls was $4916 (95% CI: $4088$5768; P<0.001). In a secondary analysis examining heterogeneity between HOCDI and outcomes across clinical subgroups, the absolute difference in mortality and costs between cases and controls varied across demographics, comorbidity, and ICU admission, but the relative risks were similar (Figure 3) (see Supporting Figure 3 in the online version of this article).
DISCUSSION
In this large cohort of patients with sepsis, we found that approximately 1 in 100 patients with sepsis developed HOCDI. Even after matching with controls based on the date of symptom onset and propensity score, patients who developed HOCDI were more than 1.6 times more likely to die in the hospital. HOCDI also added 5 days to the average hospitalization for patients with sepsis and increased median costs by approximately $5000. These findings suggest that a hospital that prevents 1 case of HOCDI per month in sepsis patients could avoid 1 death and 60 inpatient days annually, achieving an approximate yearly savings of $60,000.
Until now, the incremental cost and mortality attributable to HOCDI in sepsis patients have been poorly understood. Attributing outcomes can be methodologically challenging because patients who are at greatest risk for poor outcomes are the most likely to contract the disease and are at risk for longer periods of time. Therefore, it is necessary to take into account differences in severity of illness and time at risk between diseased and nondiseased populations and to ensure that outcomes attributed to the disease occur after disease onset.[28, 32] The majority of prior studies examining the impact of CDI on hospitalized patients have been limited by a lack of adequate matching to controls, small sample size, or failure to take into account time to infection.[16, 17, 19, 20]
A few studies have taken into account severity, time to infection, or both in estimating the impact of HOCDI. Using a time‐dependent Cox model that accounted for time to infection, Micek et al. found no difference in mortality but a longer LOS in mechanically ventilated patients (not limited to sepsis) with CDI.[33] However, their study was conducted at only 3 centers, did not take into account severity at the time of diagnosis, and did not clearly distinguish between community‐onset CDI and HOCDI. Oake et al. and Forster et al. examined the impact of CDI on patients hospitalized in a 2‐hospital health system in Canada.[12, 13] Using the baseline mortality estimate in a Cox multivariate proportional hazards regression model that accounted for the time‐varying nature of CDI, they found that HOCDI increased absolute risk of death by approximately 10%. Also, notably similar to our study were their findings that HOCDI occurred in approximately 1 in 100 patients and that the attributable median increase in LOS due to hospital‐onset CDI was 6 days. Although methodologically rigorous, these 2 small studies did not assess the impact of CDI on costs of care, were not focused on sepsis patients or even patients who received antibiotics, and also did not clearly distinguish between community‐onset CDI and HOCDI.
Our study therefore has important strengths. It is the first to examine the impact of HOCDI, including costs, on the outcomes of patients hospitalized with sepsis. The fact that we took into account both time to diagnosis and severity at the time of diagnosis (by using an index date for both cases and controls and determining severity on that date) prevented us from overestimating the impact of HOCDI on outcomes. The large differences in outcomes we observed in unadjusted and unmatched data were tempered after multivariate adjustment (eg, difference in LOS from 10.6 days to 5.1 additional days, costs from $14,620 to $4916 additional costs after adjustment). Our patient sample was derived from a large, multihospital database that contains actual hospital costs as derived from internal accounting systems. The fact that our study used data from hundreds of hospitals means that our estimates of cost, LOS, and mortality may be more generalizable than the work of Micek et al., Oake et al., and Forster et al.
This work also has important implications. First, hospital administrators, clinicians, and researchers can use our results to evaluate the cost‐effectiveness of HOCDI prevention measures (eg, hand hygiene programs, antibiotic stewardship). By quantifying the cost per case in sepsis patients, we allow administrators and researchers to compare the incremental costs of HOCDI prevention programs to the dollars and lives saved due to prevention efforts. Second, we found that our propensity model identified patients whose risk varied greatly. This suggests that an opportunity exists to identify subgroups of patients that are at highest risk. Identifying high‐risk subgroups will allow for targeted risk reduction interventions and the opportunity to reduce transmission (eg, by placing high‐risk patients in a private room). Finally, we have reaffirmed that time to diagnosis and presenting severity need to be rigorously addressed prior to making estimates of the impact of CDI burden and other hospital‐acquired conditions and injuries.
There are limitations to this study as well. We did not have access to microbiological data. However, we required a diagnosis code of CDI, evidence of testing, and treatment after the date of testing to confirm a diagnosis. We also adopted detailed exclusion criteria to ensure that CDI that was not present on admission and that controls did not have CDI. These stringent inclusion and exclusion criteria strengthened the internal validity of our estimates of disease impact. We used administrative claims data, which limited our ability to adjust for severity. However, the detailed nature of the database allowed us to use treatments, such as vasopressors and antibiotics, to identify cases; treatments were also used as a validated indicator of severity,[26] which may have helped to reduce some of this potential bias. Although our propensity model included many predictors of CDI, such as use of proton pump inhibitors and factors associated with mortality, not every confounder was completely balanced after propensity matching, although the statistical differences may have been related to our large sample size and therefore might not be clinically significant. We also may have failed to include all possible predictors of CDI in the propensity model.
In a large, diverse cohort of hospitalized patients with sepsis, we found that HOCDI lengthened hospital stay by approximately 5 days, increased risk of in‐hospital mortality by 9%, and increased hospital cost by approximately $5000 per patient. These findings highlight the importance of identifying effective prevention measures and of determining the patient populations at greatest risk for HOCDI.
Disclosures: The study was conducted with funding from the Division of Critical Care and the Center for Quality of Care Research at Baystate Medical Center. Dr. Lagu is supported by the National Heart, Lung, and Blood Institute of the National Institutes of Health under award number K01HL114745. Dr. Stefan is supported by the National Heart, Lung, and Blood Institute of the National Institutes of Health under award number K01HL114631. Drs. Lagu and Lindenauer had full access to all of the data in the study; they take responsibility for the integrity of the data and the accuracy of the data analysis. Drs. Lagu, Lindenauer, Steingrub, Higgins, Stefan, Haessler, and Rothberg conceived of the study. Dr. Lindenauer acquired the data. Drs. Lagu, Lindenauer, Rothberg, Steingrub, Nathanson, Stefan, Haessler, Higgins, and Mr. Hannon analyzed and interpreted the data. Dr. Lagu drafted the manuscript. Drs. Lagu, Lindenauer, Rothberg, Steingrub, Nathanson, Stefan, Haessler, Higgins, and Mr. Hannon critically reviewed the manuscript for important intellectual content. Dr. Nathanson carried out the statistical analyses. Dr. Nathanson, through his company OptiStatim LLC, was paid by the investigators with funding from the Department of Medicine at Baystate Medical Center to assist in conducting the statistical analyses in this study. The authors report no further conflicts of interest.
- , , , . Increasing prevalence and severity of Clostridium difficile colitis in hospitalized patients in the United States. Arch Surg. 2007;142(7):624–631; discussion 631.
- , , , et al. The changing epidemiology of Clostridium difficile infections. Clin Microbiol Rev. 2010;23(3):529–549.
- , . Clostridium Difficile‐Associated Disease in U.S. Hospitals, 1993–2005. HCUP Statistical Brief #50. April 2008. Agency for Healthcare Research and Quality, Rockville, MD. Available at: http://www.hcup‐us.ahrq.gov/reports/statbriefs/sb50.pdf. Accessed April 4, 2014.
- , , , . National point prevalence of Clostridium difficile in US health care facility inpatients, 2008. Am J Infect Control. 2009;37(4):263–270.
- . A 76‐year‐old man with recurrent Clostridium difficile‐associated diarrhea: review of C. difficile infection. JAMA. 2009;301(9):954–962.
- , , , , , . Recurrent Clostridium difficile disease: epidemiology and clinical characteristics. Infect Control Hosp Epidemiol. 1999;20(1):43–50.
- , , , , , . Recurrent Clostridium difficile diarrhea: characteristics of and risk factors for patients enrolled in a prospective, randomized, double‐blinded trial. Clin Infect Dis. 1997;24(3):324–333.
- . Narrative review: the new epidemic of Clostridium difficile‐associated enteric disease. Ann Intern Med. 2006;145(10):758–764.
- , , , et al. Impact of emergency colectomy on survival of patients with fulminant Clostridium difficile colitis during an epidemic caused by a hypervirulent strain. Ann Surg. 2007;245(2):267–272.
- , , , . Hospital‐acquired Clostridium difficile‐associated disease in the intensive care unit setting: epidemiology, clinical course and outcome. BMC Infect Dis. 2007;7:42.
- , , , , , . Factors associated with prolonged symptoms and severe disease due to Clostridium difficile. Age Ageing. 1999;28(2):107–113.
- , , , , , . The effect of hospital‐acquired Clostridium difficile infection on in‐hospital mortality. Arch Intern Med. 2010;170(20):1804–1810.
- , , , , , . The effect of hospital‐acquired infection with Clostridium difficile on length of stay in hospital. CMAJ. 2012;184(1):37–42.
- , . Clostridium difficile—more difficult than ever. N Engl J Med. 2008;359(18):1932–1940.
- , , , et al. Clinical practice guidelines for Clostridium difficile infection in adults: 2010 update by the society for healthcare epidemiology of America (SHEA) and the infectious diseases society of America (IDSA). Infect Control Hosp Epidemiol. 2010;31(5):431–455.
- , , , . Health care costs and mortality associated with nosocomial diarrhea due to Clostridium difficile. Clin Infect Dis. 2002;34(3):346–353.
- , , , , . Short‐ and long‐term attributable costs of Clostridium difficile‐associated disease in nonsurgical inpatients. Clin Infect Dis. 2008;46(4):497–504.
- , , , , . Estimation of extra hospital stay attributable to nosocomial infections: heterogeneity and timing of events. J Clin Epidemiol. 2000;53(4):409–417.
- , , , et al. Attributable outcomes of endemic Clostridium difficile‐associated disease in nonsurgical patients. Emerging Infect Dis. 2008;14(7):1031–1038.
- , . Excess length of stay, charges, and mortality attributable to medical injuries during hospitalization. JAMA. 2003;290(14):1868–1874.
- , , , , , . Association of corticosteroid dose and route of administration with risk of treatment failure in acute exacerbation of chronic obstructive pulmonary disease. JAMA. 2010;303(23):2359–2367.
- , , , , , . The relationship between hospital spending and mortality in patients with sepsis. Arch Intern Med. 2011;171(4):292–299.
- , , , , , . Comparative effectiveness of macrolides and quinolones for patients hospitalized with acute exacerbations of chronic obstructive pulmonary disease (AECOPD). J Hosp Med. 2010;5(5):261–267.
- , , , , . A combined comorbidity score predicted mortality in elderly patients better than existing scores. J Clin Epidemiol. 2011;64(7):749–759.
- , , , , , . Epidemiology of severe sepsis in the United States: analysis of incidence, outcome, and associated costs of care. Crit Care Med. 2001;29(7):1303–1310.
- , , , et al. Development and validation of a model that uses enhanced administrative data to predict mortality in patients with sepsis. Crit Care Med. 2011;39(11):2425–2430.
- , , , , . Incorporating initial treatments improves performance of a mortality prediction model for patients with sepsis. Pharmacoepidemiol Drug Saf. 2012;21(suppl 2):44–52.
- , , , . Nosocomial infection, length of stay, and time‐dependent bias. Infect Control Hosp Epidemiol. 2009;30(3):273–276.
- , , , , , . Length of stay and hospital costs among high‐risk patients with hospital‐origin Clostridium difficile‐associated diarrhea. J Med Econ. 2013;16(3):440–448.
- Rogers. Regression standard errors in clustered samples. Stata Technical Bulletin. 1993;13(13):19–23.
- . Reducing bias in a propensity score matched‐pair sample using greedy matching techniques. In: Proceedings of the 26th Annual SAS Users Group International Conference; April 22–25, 2001; Long Beach, CA. Paper 214‐26. Available at: http://www2.sas.com/proceedings/sugi26/p214‐26.pdf. Accessed April 4, 2014.
- , . Prolongation of length of stay and Clostridium difficile infection: a review of the methods used to examine length of stay due to healthcare associated infections. Antimicrob Resist Infect Control. 2012;1(1):14.
- , , , et al. Clostridium difficile Infection: a multicenter study of epidemiology and outcomes in mechanically ventilated patients. Crit Care Med. 2013;41(8):1968–1975.
© 2014 Society of Hospital Medicine
