User login
Quality of care of hospitalized infective endocarditis patients: Report from a tertiary medical center
Infective endocarditis (IE) affected an estimated 46,800 Americans in 2011, and its incidence is increasing due to greater numbers of invasive procedures and prevalence of IE risk factors.1-3 Despite recent advances in the treatment of IE, morbidity and mortality remain high: in-hospital mortality in IE patients is 15% to 20%, and the 1-year mortality rate is approximately 40%.2,4,5
Poor IE outcomes may be the result of difficulty in diagnosing IE and identifying its optimal treatments. The American Heart Association (AHA), the American College of Cardiology (ACC), and the European Society of Cardiology (ESC) have published guidelines to address these challenges. Recent guidelines recommend a multidisciplinary approach that includes cardiology, cardiac surgery, and infectious disease (ID) specialty involvement in decision-making.5,6
In the absence of published quality measures for IE management, guidelines can be used to evaluate the quality of care of IE. Studies have showed poor concordance with guideline recommendations but did not examine agreement with more recently published guidelines.7,8 Furthermore, few studies have examined the management, outcomes, and quality of care received by IE patients. Therefore, we aimed to describe a modern cohort of patients with IE admitted to a tertiary medical center over a 4-year period. In particular, we aimed to assess quality of care received by this cohort, as measured by concordance with AHA and ACC guidelines to identify gaps in care and spur quality improvement (QI) efforts.
METHODS
Design and Study Population
We conducted a retrospective cohort study of adult IE patients admitted to Baystate Medical Center (BMC), a 716-bed tertiary academic center that covers a population of 800,000 people throughout western New England. We used the International Classification of Diseases (ICD)–Ninth Revision, to identify IE patients discharged with a principal or secondary diagnosis of IE between 2007 and 2011 (codes 421.0, 421.1, 421.9, 424.9, 424.90, and 424.91). Three co-authors confirmed the diagnosis by conducting a review of the electronic health records.
We included only patients who met modified Duke criteria for definite or possible IE.5 Definite IE defines patients with pathological criteria (microorganisms demonstrated by culture or histologic examination or a histologic examination showing active endocarditis); or patients with 2 major criteria (positive blood culture and evidence of endocardial involvement by echocardiogram), 1 major criterion and 3 minor criteria (minor criteria: predisposing heart conditions or intravenous drug (IVD) use, fever, vascular phenomena, immunologic phenomena, and microbiologic evidence that do not meet the major criteria) or 5 minor criteria. Possible IE defines patients with 1 major and 1 minor criterion or 3 minor criteria.5
Data Collection
We used billing and clinical databases to collect demographics, comorbidities, antibiotic treatment, 6-month readmission and 1-year mortality. Comorbid conditions were classified into Elixhauser comorbidities using software provided by the Healthcare Costs and Utilization Project of the Agency for Healthcare Research and Quality.9,10
We obtained all other data through electronic health record abstraction. These included microbiology, type of endocarditis (native valve endocarditis [NVE] or prosthetic valve endocarditis [PVE]), echocardiographic location of the vegetation, and complications involving the valve (eg, valve perforation, ruptured chorda, perivalvular abscess, or valvular insufficiency).
Using 2006 AHA/ACC guidelines,11 we identified quality metrics, including the presence of at least 2 sets of blood cultures prior to start of antibiotics and use of transthoracic echocardiogram (TTE) and transesophageal echocardiogram (TEE). Guidelines recommend using TTE as first-line to detect valvular vegetations and assess IE complications. TEE is recommended if TTE is nondiagnostic and also as first-line to diagnose PVE. We assessed the rate of consultation with ID, cardiology, and cardiac surgery specialties. While these consultations were not explicitly emphasized in the 2006 AHA/ACC guidelines, there is a class I recommendation in 2014 AHA/ACC guidelines5 to manage IE patients with consultation of all these specialties.
We reported the number of patients with intracardiac leads (pacemaker or defibrillator) who had documentation of intracardiac lead removal. Complete removal of intracardiac leads is indicated in IE patients with infection of leads or device (class I) and suggested for IE caused by Staphylococcus aureus or fungi (even without evidence of device or lead infection), and for patients undergoing valve surgery (class IIa).5 We entered abstracted data elements into a RedCap database, hosted by Tufts Clinical and Translational Science Institute.12
Outcomes
Outcomes included embolic events, strokes, need for cardiac surgery, LOS, inhospital mortality, 6-month readmission, and 1-year mortality. We identified embolic events using documentation of clinical or imaging evidence of an embolic event to the cerebral, coronary, peripheral arterial, renal, splenic, or pulmonary vasculature. We used record extraction to identify incidence of valve surgery. Nearly all patients who require surgery at BMC have it done onsite. We compared outcomes among patients who received less than 3 vs. 3 consultations provided by ID, cardiology, and cardiac surgery specialties. We also compared outcomes among patients who received 0, 1, 2, or 3 consultations to look for a trend.
Statistical Analysis
We divided the cohort into patients with NVE and PVE because there are differences in pathophysiology, treatment, and outcomes of these groups. We calculated descriptive statistics, including means/standard deviation (SD) and n (%). We conducted univariable analyses using Fisher exact (categorical), unpaired t tests (Gaussian), or Kruskal-Wallis equality-of-populations rank test (non-Gaussian). Common language effect sizes were also calculated to quantify group differences without respect to sample size.13,14 Analyses were performed using Stata 14.1. (StataCorp LLC, College Station, Texas). The BMC Institutional Review Board approved the protocol.
RESULTS
We identified a total of 317 hospitalizations at BMC meeting criteria for IE. Of these, 147 hospitalizations were readmissions or did not meet the clinical criteria of definite or possible IE. Thus, we included a total of 170 patients in the final analysis. Definite IE was present in 135 (79.4%) and possible IE in 35 (20.6%) patients.
Patient Characteristics
Of 170 patients, 127 (74.7%) had NVE and 43 (25.3%) had PVE. Mean ± SD age was 60.0 ± 17.9 years, 66.5% (n = 113) of patients were male, and 79.4% (n = 135) were white (Table 1). Hypertension and chronic kidney disease were the most common comorbidities. The median Gagne score15 was 4, corresponding to a 1-year mortality risk of 15%. Predisposing factors for IE included previous history of IE (n = 14 or 8.2%), IVD use (n = 23 or 13.5%), and presence of long-term venous catheters (n = 19 or 11.2%). Intracardiac leads were present in 17.1% (n = 29) of patients. Bicuspid aortic valve was reported in 6.5% (n = 11) of patients with NVE. Patients with PVE were older (+11.5 years, 95% confidence interval [CI] 5.5, 17.5) and more likely to have intracardiac leads (44.2% vs. 7.9%; P < 0.001; Table 1).
Microbiology and Antibiotics
Staphylococcus aureus was isolated in 40.0% of patients (methicillin-sensitive: 21.2%, n = 36; methicillin-resistant: 18.8%, n = 32) and vancomycin (88.2%, n = 150) was the most common initial antibiotic used. Nearly half (44.7%, n = 76) of patients received gentamicin as part of their initial antibiotic regimen. Appendix 1 provides information on final blood culture results, prosthetic versus native valve IE, and antimicrobial agents that each patient received. PVE patients were more likely to receive gentamicin as their initial antibiotic regimen than NVE (58.1% vs. 40.2%; P = 0.051; Table 1).
Echocardiography and Affected Valves
As per study inclusion criteria, all patients received echocardiography (either TTE, TEE, or both). Overall, the most common infected valve was mitral (41.3%), n = 59), followed by aortic valve (28.7%), n = 41). Patients in whom the location of infected valve could not be determined (15.9%, n = 27) had echocardiographic features of intracardiac device infection or intracardiac mass (Table 1).
Quality of Care
Nearly all (n = 165, 97.1%) of patients had at least 2 sets of blood cultures drawn, most on the first day of admission (71.2%). The vast majority of patients (n = 152, 89.4%) also received their first dose of antibiotics on the day of admission. Ten (5.9%) patients did not receive any consults, and 160 (94.1%) received at least 1 consultation. An ID consultation was obtained for most (147, 86.5%) patients; cardiac surgery consultation was obtained for about half of patients (92, 54.1%), and cardiology consultation was also obtained for nearly half of patients (80, 47.1%). One-third (53, 31.2%) did not receive a cardiology or cardiac surgery consult, two-thirds (117, 68.8%) received either a cardiology or a cardiac surgery consult, and one-third (55, 32.4%) received both.
Of the 29 patients who had an intracardiac lead, 6 patients had documentation of the device removal during the index hospitalization (5 or 50.0% of patients with NVE and 1 or 5.3% of patients with PVE; P = 0.02; Table 2).

Outcomes
Evidence of any embolic events was seen in 27.7% (n = 47) of patients, including stroke in 17.1% (n = 29). Median LOS for all patients was 13.5 days, and 6-month readmission among patients who survived their index admission was 51.0% (n = 74/145; 95% CI, 45.9%-62.7%). Inhospital mortality was 14.7% (n = 25; 95% CI: 10.1%-20.9%) and 12-month mortality was 22.4% (n = 38; 95% CI, 16.7%-29.3%). Inhospital mortality was more frequent among patients with PVE than NVE (20.9% vs. 12.6%; P = 0.21), although this difference was not statistically significant. Complications were more common in NVE than PVE (any embolic event: 32.3% vs. 14.0%, P = 0.03; stroke, 20.5% vs. 7.0%, P = 0.06; Table 3).

Although there was a trend toward reduction in 6-month readmission and 12-month mortality with incremental increase in the number of specialties consulted (ID, cardiology and cardiac surgery), the difference was not statistically significant (Figure). In addition, comparing outcomes of embolic events, stroke, 6-month readmission, and 12-month mortality between those who received 3 consults (28.8%, n = 49) to those with fewer than 3 (71.2%, n = 121) did not show statistically significant differences.

Of 92 patients who received a cardiac surgery consult, 73 had NVE and 19 had PVE. Of these, 47 underwent valve surgery, 39 (of 73) with NVE (53.42%) and 8 (of 19) with PVE (42.1%). Most of the NVE patients (73.2%) had more than 1 indication for surgery. The most common indications for surgery among NVE patients were significant valvular dysfunction resulting in heart failure (65.9%), followed by mobile vegetation (56.1%) and recurrent embolic events (26.8%). The most common indication for surgery in PVE was persistent bacteremia or recurrent embolic events (75.0%).
DISCUSSION
In this study, we described the management, quality of care, and outcomes of IE patients in a tertiary medical center. We found that the majority of hospitalized patients with IE were older white men with comorbidities and IE risk factors. The complication rate was high (27.7% with embolic events) and the inhospital mortality rate was in the lower range reported by prior studies [14.7% vs. 15%-20%].5 Nearly one-third of patients (n = 47, 27.7%) received valve surgery. Quality of care received was generally good, with most patients receiving early blood cultures, echocardiograms, early antibiotics, and timely ID consultation. We identified important gaps in care, including a failure to consult cardiac surgery in nearly half of patients and failure to consult cardiology in more than half of patients.
Our findings support work suggesting that IE is no longer primarily a chronic or subacute disease of younger patients with IVD use, positive human immunodeficiency virus status, or bicuspid aortic valves.1,4,16,17 The International Collaboration on Endocarditis-Prospective Cohort Study,4 a multinational prospective cohort study (2000-2005) of 2781 adults with IE, reported a higher prevalence of patients with diabetes or on hemodialysis, IVD users, and patients with long-term venous catheter and intracardiac leads than we found. Yet both studies suggest that the demographics of IE are changing. This may partially explain why IE mortality has not improved in recent years:2,3 patients with older age and higher comorbidity burden may not be considered good surgical candidates.
This study is among the first to contribute information on concordance with IE guidelines in a cohort of U.S. patients. Our findings suggest that most patients received timely blood culture, same-day administration of empiric antibiotics, and ID consultation, which is similar to European studies.7,18 Guideline concordance could be improved in some areas. Overall documentation of the management plan regarding the intracardiac leads could be improved. Only 6 of 29 patients with intracardiac leads had documentation of their removal during the index hospitalization.
The 2014 AHA/ACC guidelines5 and the ESC guidelines6 emphasized the importance of multidisciplinary management of IE. As part of the Heart Valve Team at BMC, cardiologists provide expertise in diagnosis, imaging and clinical management of IE, and cardiac surgeons provide consultation on whether to pursue surgery and optimal timing of surgery. Early discussion with surgical team is considered mandatory in all complicated cases of IE.6,18 Infectious disease consultation has been shown to improve the rate of IE diagnosis, reduce the 6-month relapse rate,19 and improve outcomes in patients with S aureus bacteremia.20 In our study 86.5% of patients had documentation of an ID consultation; cardiac surgery consultation was obtained in 54.1% and cardiology consultation in 47.1% of patients.
We observed a trend towards lower rates of 6-month readmission and 12-month mortality among patients who received all 3 consults (Figure 1), despite the fact that rates of embolic events and stroke were higher in patients with 3 consults compared to those with fewer than 3. Obviously, the lack of confounder adjustment and lack of power limits our ability to make inferences about this association, but it generates hypotheses for future work. Because subjects in our study were cared for prior to 2014, multidisciplinary management of IE with involvement of cardiology, cardiac surgery, and ID physicians was observed in only one-third of patients. However, 117 (68.8%) patients received either cardiology or cardiac surgery consults. It is possible that some physicians considered involving both cardiology and cardiac surgery consultants as unnecessary and, therefore, did not consult both specialties. We will focus future QI efforts in our institution on educating physicians about the benefits of multidisciplinary care and the importance of fully implementing the 2014 AHA/ACC guidelines.
Our findings around quality of care should be placed in the context of 2 studies by González de Molina et al8 and Delahaye et al7 These studies described considerable discordance between guideline recommendations and real-world IE care. However, these studies were performed more than a decade ago and were conducted before current recommendations to consult cardiology and cardiac surgery were published.
In the 2014 AHA/ACC guidelines, surgery prior to completion of antibiotics is indicated in patients with valve dysfunction resulting in heart failure; left-sided IE caused by highly resistant organisms (including fungus or S aureus); IE complicated by heart block, aortic abscess, or penetrating lesions; and presence of persistent infection (bacteremia or fever lasting longer than 5 to 7 days) after onset of appropriate antimicrobial therapy. In addition, there is a Class IIa indication of early surgery in patients with recurrent emboli and persistent vegetation despite appropriate antibiotic therapy and a Class IIb indication of early surgery in patients with NVE with mobile vegetation greater than 10 mm in length. Surgery is recommended for patients with PVE and relapsing infection.
It is recommended that IE patients be cared for in centers with immediate access to cardiac surgery because the urgent need for surgical intervention can arise rapidly.5 We found that nearly one-third of included patients underwent surgery. Although we did not collect data on indications for surgery in patients who did not receive surgery, we observed that 50% had a surgery consult, suggesting the presence of 1 or more surgical indications. Of these, half underwent valve surgery. Most of the NVE patients who underwent surgery had more than 1 indication for surgery. Our surgical rate is similar to a study from Italy3 and overall in the lower range of reported surgical rate (25%-50%) from other studies.21 The low rate of surgery at our center may be related to the fact that the use of surgery for IE has been hotly debated in the literature,21 and may also be due to the low rate of cardiac surgery consultation.
Our study has several limitations. We identified eligible patients using a discharge ICD-9 coding of IE and then confirmed the presence of Duke criteria using record review. Using discharge diagnosis codes for endocarditis has been validated, and our additional manual chart review to confirm Duke criteria likely improved the specificity significantly. However, by excluding patients who did not have documented evidence of Duke criteria, we may have missed some cases, lowering sensitivity. The performance on selected quality metrics may also have been affected by our inclusion criteria. Because we included only patients who met Duke criteria, we tended to include patients who had received blood cultures and echocardiograms, which are part of the criteria. Thus, we cannot comment on use of diagnostic testing or specialty consultation in patients with suspected IE. This was a single-center study and may not represent patients or current practices seen in other institutions. We did not collect data on some of the predisposing factors to NVE (for example, baseline rheumatic heart disease or preexisting valvular heart disease) because it is estimated that less than 5% of IE in the U.S. is superimposed on rheumatic heart disease.4 We likely underestimated 12-month mortality rate because we did not cross-reference our findings again the National Death Index; however, this should not affect the comparison of this outcome between groups.
CONCLUSION
Our study confirms reports that IE epidemiology has changed significantly in recent years. It also suggests that concordance with guideline recommendations is good for some aspects of care (eg, echocardiogram, blood cultures), but can be improved in other areas, particularly in use of specialty consultation during the hospitalization. Future QI efforts should emphasize the role of the heart valve team or endocarditis team that consists of an internist, ID physician, cardiologist, cardiac surgeon, and nursing. Finally, efforts should be made to develop strategies for community hospitals that do not have access to all of these specialists (eg, early transfer, telehealth).
Disclosure
Nothing to report.
1. Pant S, Patel NJ, Deshmukh A, Golwala H, Patel N, Badheka A, et al. Trends in infective endocarditis incidence, microbiology, and valve replacement in the United States from 2000 to 2011. J Am Coll Cardiol. 2015;65(19):2070-2076. PubMed
2. Bor DH, Woolhandler S, Nardin R, Brusch J, Himmelstein DU. Infective endocarditis in the U.S., 1998-2009: a nationwide study. PloS One. 2013;8(3):e60033. PubMed
3. Fedeli U, Schievano E, Buonfrate D, Pellizzer G, Spolaore P. Increasing incidence and mortality of infective endocarditis: a population-based study through a record-linkage system. BMC Infect Dis. 2011;11:48. PubMed
4. Murdoch DR, Corey GR, Hoen B, Miró JM, Fowler VG, Bayer AS, et al. Clinical presentation, etiology, and outcome of infective endocarditis in the 21st century: the International Collaboration on Endocarditis-Prospective Cohort Study. Arch Intern Med. 2009;169(5):463-473. PubMed
5. Nishimura RA, Otto CM, Bonow RO, Carabello BA, Erwin JP, Guyton RA, et al. 2014 AHA/ACC guideline for the management of patients with valvular heart disease: executive summary: a report of the American College of Cardiology/American Heart Association Task Force on Practice Guidelines. J Am Coll Cardiol. 2014;63(22):2438-2488. PubMed
6. Habib G, Lancellotti P, Antunes MJ, Bongiorni MG, Casalta J-P, Del Zotti F, et al. 2015 ESC Guidelines for the management of infective endocarditis: The Task Force for the Management of Infective Endocarditis of the European Society of Cardiology (ESC). Endorsed by: European Association for Cardio-Thoracic Surgery (EACTS), the European Association of Nuclear Medicine (EANM). Eur Heart J. 2015;36(44):3075-3128. PubMed
7. Delahaye F, Rial MO, de Gevigney G, Ecochard R, Delaye J. A critical appraisal of the quality of the management of infective endocarditis. J Am Coll Cardiol. 1999;33(3):788-793. PubMed
8. González De Molina M, Fernández-Guerrero JC, Azpitarte J. [Infectious endocarditis: degree of discordance between clinical guidelines recommendations and clinical practice]. Rev Esp Cardiol. 2002;55(8):793-800. PubMed
9. Elixhauser A, Steiner C, Harris DR, Coffey RM. Comorbidity measures for use with administrative data. Med Care. 1998;36(1):8-27. PubMed
10. Quan H, Parsons GA, Ghali WA. Validity of information on comorbidity derived rom ICD-9-CCM administrative data. Med Care. 2002;40(8):675-685. PubMed
11. American College of Cardiology/American Heart Association Task Force on Practice Guidelines, Society of Cardiovascular Anesthesiologists, Society for Cardiovascular Angiography and Interventions, Society of Thoracic Surgeons, Bonow RO, Carabello BA, Kanu C, deLeon AC Jr, Faxon DP, Freed MD, et al. ACC/AHA 2006 guidelines for the management of patients with valvular heart disease: a report of the American College of Cardiology/American Heart Association Task Force on Practice Guidelines (writing committee to revise the 1998 Guidelines for the Management of Patients With Valvular Heart Disease): developed in collaboration with the Society of Cardiovascular Anesthesiologists: endorsed by the Society for Cardiovascular Angiography and Interventions and the Society of Thoracic Surgeons. Circulation. 2006;114(5):e84-e231.
12. REDCap [Internet]. [cited 2016 May 14]. Available from: https://collaborate.tuftsctsi.org/redcap/.
13. McGraw KO, Wong SP. A common language effect-size statistic. Psychol Bull. 1992;111:361-365.
14. Cohen J. The statistical power of abnormal-social psychological research: a review. J Abnorm Soc Psychol. 1962;65:145-153. PubMed
15. Gagne JJ, Glynn RJ, Avorn J, Levin R, Schneeweiss S. A combined comorbidity score predicted mortality in elderly patients better than existing scores. J Clin Epidemiol. 2011;64(7):749-759. PubMed
16. Baddour LM, Wilson WR, Bayer AS, Fowler VG Jr, Tleyjeh IM, Rybak MJ, et al. Infective endocarditis in adults: Diagnosis, antimicrobial therapy, and management of complications: A scientific statement for healthcare professionals from the American Heart Association. Circulation. 2015;132(15):1435-1486. PubMed
17. Cecchi E, Chirillo F, Castiglione A, Faggiano P, Cecconi M, Moreo A, et al. Clinical epidemiology in Italian Registry of Infective Endocarditis (RIEI): Focus on age, intravascular devices and enterococci. Int J Cardiol. 2015;190:151-156. PubMed
18. Tornos P, Iung B, Permanyer-Miralda G, Baron G, Delahaye F, Gohlke-Bärwolf Ch, et al. Infective endocarditis in Europe: lessons from the Euro heart survey. Heart. 2005;91(5):571-575. PubMed
19. Yamamoto S, Hosokawa N, Sogi M, Inakaku M, Imoto K, Ohji G, et al. Impact of infectious diseases service consultation on diagnosis of infective endocarditis. Scand J Infect Dis. 2012;44(4):270-275. PubMed
20. Rieg S, Küpper MF. Infectious diseases consultations can make the difference: a brief review and a plea for more infectious diseases specialists in Germany. Infection. 2016;(2):159-166. PubMed
21. Prendergast BD, Tornos P. Surgery for infective endocarditis: who and when? Circulation. 2010;121(9):11411152. PubMed
Infective endocarditis (IE) affected an estimated 46,800 Americans in 2011, and its incidence is increasing due to greater numbers of invasive procedures and prevalence of IE risk factors.1-3 Despite recent advances in the treatment of IE, morbidity and mortality remain high: in-hospital mortality in IE patients is 15% to 20%, and the 1-year mortality rate is approximately 40%.2,4,5
Poor IE outcomes may be the result of difficulty in diagnosing IE and identifying its optimal treatments. The American Heart Association (AHA), the American College of Cardiology (ACC), and the European Society of Cardiology (ESC) have published guidelines to address these challenges. Recent guidelines recommend a multidisciplinary approach that includes cardiology, cardiac surgery, and infectious disease (ID) specialty involvement in decision-making.5,6
In the absence of published quality measures for IE management, guidelines can be used to evaluate the quality of care of IE. Studies have showed poor concordance with guideline recommendations but did not examine agreement with more recently published guidelines.7,8 Furthermore, few studies have examined the management, outcomes, and quality of care received by IE patients. Therefore, we aimed to describe a modern cohort of patients with IE admitted to a tertiary medical center over a 4-year period. In particular, we aimed to assess quality of care received by this cohort, as measured by concordance with AHA and ACC guidelines to identify gaps in care and spur quality improvement (QI) efforts.
METHODS
Design and Study Population
We conducted a retrospective cohort study of adult IE patients admitted to Baystate Medical Center (BMC), a 716-bed tertiary academic center that covers a population of 800,000 people throughout western New England. We used the International Classification of Diseases (ICD)–Ninth Revision, to identify IE patients discharged with a principal or secondary diagnosis of IE between 2007 and 2011 (codes 421.0, 421.1, 421.9, 424.9, 424.90, and 424.91). Three co-authors confirmed the diagnosis by conducting a review of the electronic health records.
We included only patients who met modified Duke criteria for definite or possible IE.5 Definite IE defines patients with pathological criteria (microorganisms demonstrated by culture or histologic examination or a histologic examination showing active endocarditis); or patients with 2 major criteria (positive blood culture and evidence of endocardial involvement by echocardiogram), 1 major criterion and 3 minor criteria (minor criteria: predisposing heart conditions or intravenous drug (IVD) use, fever, vascular phenomena, immunologic phenomena, and microbiologic evidence that do not meet the major criteria) or 5 minor criteria. Possible IE defines patients with 1 major and 1 minor criterion or 3 minor criteria.5
Data Collection
We used billing and clinical databases to collect demographics, comorbidities, antibiotic treatment, 6-month readmission and 1-year mortality. Comorbid conditions were classified into Elixhauser comorbidities using software provided by the Healthcare Costs and Utilization Project of the Agency for Healthcare Research and Quality.9,10
We obtained all other data through electronic health record abstraction. These included microbiology, type of endocarditis (native valve endocarditis [NVE] or prosthetic valve endocarditis [PVE]), echocardiographic location of the vegetation, and complications involving the valve (eg, valve perforation, ruptured chorda, perivalvular abscess, or valvular insufficiency).
Using 2006 AHA/ACC guidelines,11 we identified quality metrics, including the presence of at least 2 sets of blood cultures prior to start of antibiotics and use of transthoracic echocardiogram (TTE) and transesophageal echocardiogram (TEE). Guidelines recommend using TTE as first-line to detect valvular vegetations and assess IE complications. TEE is recommended if TTE is nondiagnostic and also as first-line to diagnose PVE. We assessed the rate of consultation with ID, cardiology, and cardiac surgery specialties. While these consultations were not explicitly emphasized in the 2006 AHA/ACC guidelines, there is a class I recommendation in 2014 AHA/ACC guidelines5 to manage IE patients with consultation of all these specialties.
We reported the number of patients with intracardiac leads (pacemaker or defibrillator) who had documentation of intracardiac lead removal. Complete removal of intracardiac leads is indicated in IE patients with infection of leads or device (class I) and suggested for IE caused by Staphylococcus aureus or fungi (even without evidence of device or lead infection), and for patients undergoing valve surgery (class IIa).5 We entered abstracted data elements into a RedCap database, hosted by Tufts Clinical and Translational Science Institute.12
Outcomes
Outcomes included embolic events, strokes, need for cardiac surgery, LOS, inhospital mortality, 6-month readmission, and 1-year mortality. We identified embolic events using documentation of clinical or imaging evidence of an embolic event to the cerebral, coronary, peripheral arterial, renal, splenic, or pulmonary vasculature. We used record extraction to identify incidence of valve surgery. Nearly all patients who require surgery at BMC have it done onsite. We compared outcomes among patients who received less than 3 vs. 3 consultations provided by ID, cardiology, and cardiac surgery specialties. We also compared outcomes among patients who received 0, 1, 2, or 3 consultations to look for a trend.
Statistical Analysis
We divided the cohort into patients with NVE and PVE because there are differences in pathophysiology, treatment, and outcomes of these groups. We calculated descriptive statistics, including means/standard deviation (SD) and n (%). We conducted univariable analyses using Fisher exact (categorical), unpaired t tests (Gaussian), or Kruskal-Wallis equality-of-populations rank test (non-Gaussian). Common language effect sizes were also calculated to quantify group differences without respect to sample size.13,14 Analyses were performed using Stata 14.1. (StataCorp LLC, College Station, Texas). The BMC Institutional Review Board approved the protocol.
RESULTS
We identified a total of 317 hospitalizations at BMC meeting criteria for IE. Of these, 147 hospitalizations were readmissions or did not meet the clinical criteria of definite or possible IE. Thus, we included a total of 170 patients in the final analysis. Definite IE was present in 135 (79.4%) and possible IE in 35 (20.6%) patients.
Patient Characteristics
Of 170 patients, 127 (74.7%) had NVE and 43 (25.3%) had PVE. Mean ± SD age was 60.0 ± 17.9 years, 66.5% (n = 113) of patients were male, and 79.4% (n = 135) were white (Table 1). Hypertension and chronic kidney disease were the most common comorbidities. The median Gagne score15 was 4, corresponding to a 1-year mortality risk of 15%. Predisposing factors for IE included previous history of IE (n = 14 or 8.2%), IVD use (n = 23 or 13.5%), and presence of long-term venous catheters (n = 19 or 11.2%). Intracardiac leads were present in 17.1% (n = 29) of patients. Bicuspid aortic valve was reported in 6.5% (n = 11) of patients with NVE. Patients with PVE were older (+11.5 years, 95% confidence interval [CI] 5.5, 17.5) and more likely to have intracardiac leads (44.2% vs. 7.9%; P < 0.001; Table 1).
Microbiology and Antibiotics
Staphylococcus aureus was isolated in 40.0% of patients (methicillin-sensitive: 21.2%, n = 36; methicillin-resistant: 18.8%, n = 32) and vancomycin (88.2%, n = 150) was the most common initial antibiotic used. Nearly half (44.7%, n = 76) of patients received gentamicin as part of their initial antibiotic regimen. Appendix 1 provides information on final blood culture results, prosthetic versus native valve IE, and antimicrobial agents that each patient received. PVE patients were more likely to receive gentamicin as their initial antibiotic regimen than NVE (58.1% vs. 40.2%; P = 0.051; Table 1).
Echocardiography and Affected Valves
As per study inclusion criteria, all patients received echocardiography (either TTE, TEE, or both). Overall, the most common infected valve was mitral (41.3%), n = 59), followed by aortic valve (28.7%), n = 41). Patients in whom the location of infected valve could not be determined (15.9%, n = 27) had echocardiographic features of intracardiac device infection or intracardiac mass (Table 1).
Quality of Care
Nearly all (n = 165, 97.1%) of patients had at least 2 sets of blood cultures drawn, most on the first day of admission (71.2%). The vast majority of patients (n = 152, 89.4%) also received their first dose of antibiotics on the day of admission. Ten (5.9%) patients did not receive any consults, and 160 (94.1%) received at least 1 consultation. An ID consultation was obtained for most (147, 86.5%) patients; cardiac surgery consultation was obtained for about half of patients (92, 54.1%), and cardiology consultation was also obtained for nearly half of patients (80, 47.1%). One-third (53, 31.2%) did not receive a cardiology or cardiac surgery consult, two-thirds (117, 68.8%) received either a cardiology or a cardiac surgery consult, and one-third (55, 32.4%) received both.
Of the 29 patients who had an intracardiac lead, 6 patients had documentation of the device removal during the index hospitalization (5 or 50.0% of patients with NVE and 1 or 5.3% of patients with PVE; P = 0.02; Table 2).
Outcomes
Evidence of any embolic events was seen in 27.7% (n = 47) of patients, including stroke in 17.1% (n = 29). Median LOS for all patients was 13.5 days, and 6-month readmission among patients who survived their index admission was 51.0% (n = 74/145; 95% CI, 45.9%-62.7%). Inhospital mortality was 14.7% (n = 25; 95% CI: 10.1%-20.9%) and 12-month mortality was 22.4% (n = 38; 95% CI, 16.7%-29.3%). Inhospital mortality was more frequent among patients with PVE than NVE (20.9% vs. 12.6%; P = 0.21), although this difference was not statistically significant. Complications were more common in NVE than PVE (any embolic event: 32.3% vs. 14.0%, P = 0.03; stroke, 20.5% vs. 7.0%, P = 0.06; Table 3).
Although there was a trend toward reduction in 6-month readmission and 12-month mortality with incremental increase in the number of specialties consulted (ID, cardiology and cardiac surgery), the difference was not statistically significant (Figure). In addition, comparing outcomes of embolic events, stroke, 6-month readmission, and 12-month mortality between those who received 3 consults (28.8%, n = 49) to those with fewer than 3 (71.2%, n = 121) did not show statistically significant differences.
Of 92 patients who received a cardiac surgery consult, 73 had NVE and 19 had PVE. Of these, 47 underwent valve surgery, 39 (of 73) with NVE (53.42%) and 8 (of 19) with PVE (42.1%). Most of the NVE patients (73.2%) had more than 1 indication for surgery. The most common indications for surgery among NVE patients were significant valvular dysfunction resulting in heart failure (65.9%), followed by mobile vegetation (56.1%) and recurrent embolic events (26.8%). The most common indication for surgery in PVE was persistent bacteremia or recurrent embolic events (75.0%).
DISCUSSION
In this study, we described the management, quality of care, and outcomes of IE patients in a tertiary medical center. We found that the majority of hospitalized patients with IE were older white men with comorbidities and IE risk factors. The complication rate was high (27.7% with embolic events) and the inhospital mortality rate was in the lower range reported by prior studies [14.7% vs. 15%-20%].5 Nearly one-third of patients (n = 47, 27.7%) received valve surgery. Quality of care received was generally good, with most patients receiving early blood cultures, echocardiograms, early antibiotics, and timely ID consultation. We identified important gaps in care, including a failure to consult cardiac surgery in nearly half of patients and failure to consult cardiology in more than half of patients.
Our findings support work suggesting that IE is no longer primarily a chronic or subacute disease of younger patients with IVD use, positive human immunodeficiency virus status, or bicuspid aortic valves.1,4,16,17 The International Collaboration on Endocarditis-Prospective Cohort Study,4 a multinational prospective cohort study (2000-2005) of 2781 adults with IE, reported a higher prevalence of patients with diabetes or on hemodialysis, IVD users, and patients with long-term venous catheter and intracardiac leads than we found. Yet both studies suggest that the demographics of IE are changing. This may partially explain why IE mortality has not improved in recent years:2,3 patients with older age and higher comorbidity burden may not be considered good surgical candidates.
This study is among the first to contribute information on concordance with IE guidelines in a cohort of U.S. patients. Our findings suggest that most patients received timely blood culture, same-day administration of empiric antibiotics, and ID consultation, which is similar to European studies.7,18 Guideline concordance could be improved in some areas. Overall documentation of the management plan regarding the intracardiac leads could be improved. Only 6 of 29 patients with intracardiac leads had documentation of their removal during the index hospitalization.
The 2014 AHA/ACC guidelines5 and the ESC guidelines6 emphasized the importance of multidisciplinary management of IE. As part of the Heart Valve Team at BMC, cardiologists provide expertise in diagnosis, imaging and clinical management of IE, and cardiac surgeons provide consultation on whether to pursue surgery and optimal timing of surgery. Early discussion with surgical team is considered mandatory in all complicated cases of IE.6,18 Infectious disease consultation has been shown to improve the rate of IE diagnosis, reduce the 6-month relapse rate,19 and improve outcomes in patients with S aureus bacteremia.20 In our study 86.5% of patients had documentation of an ID consultation; cardiac surgery consultation was obtained in 54.1% and cardiology consultation in 47.1% of patients.
We observed a trend towards lower rates of 6-month readmission and 12-month mortality among patients who received all 3 consults (Figure 1), despite the fact that rates of embolic events and stroke were higher in patients with 3 consults compared to those with fewer than 3. Obviously, the lack of confounder adjustment and lack of power limits our ability to make inferences about this association, but it generates hypotheses for future work. Because subjects in our study were cared for prior to 2014, multidisciplinary management of IE with involvement of cardiology, cardiac surgery, and ID physicians was observed in only one-third of patients. However, 117 (68.8%) patients received either cardiology or cardiac surgery consults. It is possible that some physicians considered involving both cardiology and cardiac surgery consultants as unnecessary and, therefore, did not consult both specialties. We will focus future QI efforts in our institution on educating physicians about the benefits of multidisciplinary care and the importance of fully implementing the 2014 AHA/ACC guidelines.
Our findings around quality of care should be placed in the context of 2 studies by González de Molina et al8 and Delahaye et al7 These studies described considerable discordance between guideline recommendations and real-world IE care. However, these studies were performed more than a decade ago and were conducted before current recommendations to consult cardiology and cardiac surgery were published.
In the 2014 AHA/ACC guidelines, surgery prior to completion of antibiotics is indicated in patients with valve dysfunction resulting in heart failure; left-sided IE caused by highly resistant organisms (including fungus or S aureus); IE complicated by heart block, aortic abscess, or penetrating lesions; and presence of persistent infection (bacteremia or fever lasting longer than 5 to 7 days) after onset of appropriate antimicrobial therapy. In addition, there is a Class IIa indication of early surgery in patients with recurrent emboli and persistent vegetation despite appropriate antibiotic therapy and a Class IIb indication of early surgery in patients with NVE with mobile vegetation greater than 10 mm in length. Surgery is recommended for patients with PVE and relapsing infection.
It is recommended that IE patients be cared for in centers with immediate access to cardiac surgery because the urgent need for surgical intervention can arise rapidly.5 We found that nearly one-third of included patients underwent surgery. Although we did not collect data on indications for surgery in patients who did not receive surgery, we observed that 50% had a surgery consult, suggesting the presence of 1 or more surgical indications. Of these, half underwent valve surgery. Most of the NVE patients who underwent surgery had more than 1 indication for surgery. Our surgical rate is similar to a study from Italy3 and overall in the lower range of reported surgical rate (25%-50%) from other studies.21 The low rate of surgery at our center may be related to the fact that the use of surgery for IE has been hotly debated in the literature,21 and may also be due to the low rate of cardiac surgery consultation.
Our study has several limitations. We identified eligible patients using a discharge ICD-9 coding of IE and then confirmed the presence of Duke criteria using record review. Using discharge diagnosis codes for endocarditis has been validated, and our additional manual chart review to confirm Duke criteria likely improved the specificity significantly. However, by excluding patients who did not have documented evidence of Duke criteria, we may have missed some cases, lowering sensitivity. The performance on selected quality metrics may also have been affected by our inclusion criteria. Because we included only patients who met Duke criteria, we tended to include patients who had received blood cultures and echocardiograms, which are part of the criteria. Thus, we cannot comment on use of diagnostic testing or specialty consultation in patients with suspected IE. This was a single-center study and may not represent patients or current practices seen in other institutions. We did not collect data on some of the predisposing factors to NVE (for example, baseline rheumatic heart disease or preexisting valvular heart disease) because it is estimated that less than 5% of IE in the U.S. is superimposed on rheumatic heart disease.4 We likely underestimated 12-month mortality rate because we did not cross-reference our findings again the National Death Index; however, this should not affect the comparison of this outcome between groups.
CONCLUSION
Our study confirms reports that IE epidemiology has changed significantly in recent years. It also suggests that concordance with guideline recommendations is good for some aspects of care (eg, echocardiogram, blood cultures), but can be improved in other areas, particularly in use of specialty consultation during the hospitalization. Future QI efforts should emphasize the role of the heart valve team or endocarditis team that consists of an internist, ID physician, cardiologist, cardiac surgeon, and nursing. Finally, efforts should be made to develop strategies for community hospitals that do not have access to all of these specialists (eg, early transfer, telehealth).
Disclosure
Nothing to report.
1. Pant S, Patel NJ, Deshmukh A, Golwala H, Patel N, Badheka A, et al. Trends in infective endocarditis incidence, microbiology, and valve replacement in the United States from 2000 to 2011. J Am Coll Cardiol. 2015;65(19):2070-2076. PubMed
2. Bor DH, Woolhandler S, Nardin R, Brusch J, Himmelstein DU. Infective endocarditis in the U.S., 1998-2009: a nationwide study. PloS One. 2013;8(3):e60033. PubMed
3. Fedeli U, Schievano E, Buonfrate D, Pellizzer G, Spolaore P. Increasing incidence and mortality of infective endocarditis: a population-based study through a record-linkage system. BMC Infect Dis. 2011;11:48. PubMed
4. Murdoch DR, Corey GR, Hoen B, Miró JM, Fowler VG, Bayer AS, et al. Clinical presentation, etiology, and outcome of infective endocarditis in the 21st century: the International Collaboration on Endocarditis-Prospective Cohort Study. Arch Intern Med. 2009;169(5):463-473. PubMed
5. Nishimura RA, Otto CM, Bonow RO, Carabello BA, Erwin JP, Guyton RA, et al. 2014 AHA/ACC guideline for the management of patients with valvular heart disease: executive summary: a report of the American College of Cardiology/American Heart Association Task Force on Practice Guidelines. J Am Coll Cardiol. 2014;63(22):2438-2488. PubMed
6. Habib G, Lancellotti P, Antunes MJ, Bongiorni MG, Casalta J-P, Del Zotti F, et al. 2015 ESC Guidelines for the management of infective endocarditis: The Task Force for the Management of Infective Endocarditis of the European Society of Cardiology (ESC). Endorsed by: European Association for Cardio-Thoracic Surgery (EACTS), the European Association of Nuclear Medicine (EANM). Eur Heart J. 2015;36(44):3075-3128. PubMed
7. Delahaye F, Rial MO, de Gevigney G, Ecochard R, Delaye J. A critical appraisal of the quality of the management of infective endocarditis. J Am Coll Cardiol. 1999;33(3):788-793. PubMed
8. González De Molina M, Fernández-Guerrero JC, Azpitarte J. [Infectious endocarditis: degree of discordance between clinical guidelines recommendations and clinical practice]. Rev Esp Cardiol. 2002;55(8):793-800. PubMed
9. Elixhauser A, Steiner C, Harris DR, Coffey RM. Comorbidity measures for use with administrative data. Med Care. 1998;36(1):8-27. PubMed
10. Quan H, Parsons GA, Ghali WA. Validity of information on comorbidity derived rom ICD-9-CCM administrative data. Med Care. 2002;40(8):675-685. PubMed
11. American College of Cardiology/American Heart Association Task Force on Practice Guidelines, Society of Cardiovascular Anesthesiologists, Society for Cardiovascular Angiography and Interventions, Society of Thoracic Surgeons, Bonow RO, Carabello BA, Kanu C, deLeon AC Jr, Faxon DP, Freed MD, et al. ACC/AHA 2006 guidelines for the management of patients with valvular heart disease: a report of the American College of Cardiology/American Heart Association Task Force on Practice Guidelines (writing committee to revise the 1998 Guidelines for the Management of Patients With Valvular Heart Disease): developed in collaboration with the Society of Cardiovascular Anesthesiologists: endorsed by the Society for Cardiovascular Angiography and Interventions and the Society of Thoracic Surgeons. Circulation. 2006;114(5):e84-e231.
12. REDCap [Internet]. [cited 2016 May 14]. Available from: https://collaborate.tuftsctsi.org/redcap/.
13. McGraw KO, Wong SP. A common language effect-size statistic. Psychol Bull. 1992;111:361-365.
14. Cohen J. The statistical power of abnormal-social psychological research: a review. J Abnorm Soc Psychol. 1962;65:145-153. PubMed
15. Gagne JJ, Glynn RJ, Avorn J, Levin R, Schneeweiss S. A combined comorbidity score predicted mortality in elderly patients better than existing scores. J Clin Epidemiol. 2011;64(7):749-759. PubMed
16. Baddour LM, Wilson WR, Bayer AS, Fowler VG Jr, Tleyjeh IM, Rybak MJ, et al. Infective endocarditis in adults: Diagnosis, antimicrobial therapy, and management of complications: A scientific statement for healthcare professionals from the American Heart Association. Circulation. 2015;132(15):1435-1486. PubMed
17. Cecchi E, Chirillo F, Castiglione A, Faggiano P, Cecconi M, Moreo A, et al. Clinical epidemiology in Italian Registry of Infective Endocarditis (RIEI): Focus on age, intravascular devices and enterococci. Int J Cardiol. 2015;190:151-156. PubMed
18. Tornos P, Iung B, Permanyer-Miralda G, Baron G, Delahaye F, Gohlke-Bärwolf Ch, et al. Infective endocarditis in Europe: lessons from the Euro heart survey. Heart. 2005;91(5):571-575. PubMed
19. Yamamoto S, Hosokawa N, Sogi M, Inakaku M, Imoto K, Ohji G, et al. Impact of infectious diseases service consultation on diagnosis of infective endocarditis. Scand J Infect Dis. 2012;44(4):270-275. PubMed
20. Rieg S, Küpper MF. Infectious diseases consultations can make the difference: a brief review and a plea for more infectious diseases specialists in Germany. Infection. 2016;(2):159-166. PubMed
21. Prendergast BD, Tornos P. Surgery for infective endocarditis: who and when? Circulation. 2010;121(9):11411152. PubMed
© 2017 Society of Hospital Medicine
Impact of MC Intervention on QIs
Decompensated cirrhosis (DC) is defined as cirrhosis with at least 1 of the following complications: ascites, hepatocellular carcinoma, bleeding from portal hypertension, or hepatic encephalopathy. Patients with DC have a median survival estimated at 2 years compared to the 12‐year median survival of compensated cirrhotics.[1] In an era where quality of hospital care is being measured, and where progress is being made in the management of several conditions including congestive heart failure and nosocomial infections, little attention has been paid to DC. The burden of chronic liver failure is clear in the United States, where DC leads to more than 150,000 annual admissions to the hospital and accounts for 40,000 deaths annually.[2]
This burden of disease spurred quality improvement efforts in 2010, when a team of experts identified a set of literature‐based parameters or quality indicators (QI) for patients with cirrhosis.[3] We have demonstrated that adherence to these indicators fell far short of desired targets.[4] A year before their publication, an overall compliance of <50% with these metrics was measured at a single medical center.
We sought to improve the quality of care for patients with DC through implementation of mandatory consultation (MC) with a gastroenterologist for all patients admitted with DC. We assessed whether MC was associated with better care and improved outcomes (hospitalization length of stay [LOS], 30‐day readmission, and inpatient mortality) when compared to usual care (UC).[4]
MATERIALS AND METHODS
Design, Setting, and Patients
We conducted a cohort study comparing adherence to QI and outcomes of patients admitted with DC after the institution of an MC to a historical cohort of patients managed with UC (ie, before MC, adherence to QI for this group has been reported elsewhere).[4] Both cohorts included all patients aged >18 years with DC admitted to Baystate Medical Center, a tertiary care medical center in western Massachusetts. The UC cohort was collected between January 1, 2009 and December 31, 2009, and the MC cohort was assembled between June 1, 2011 and June 30, 2012.
As previously reported,[4] patients were considered for inclusion in the historical cohort if their International Classification of DiseasesNinth Revision discharge code pertained to chronic liver disease (see Supporting Information, Appendix 1, in the online version of this article). This list was broad by design to identify all patients with decompensated cirrhosis. A gastroenterologist (R.G.) then manually extracted charts from electronic medical records (EMRs) using a set of predefined clinical criteria, the same in both cohorts, to identify the patients with DC: cirrhosis with concomitant ascites, hepatic encephalopathy, or gastrointestinal (GI) bleeding secondary to portal hypertension. Other types of decompensated states, such as hepatocellular carcinoma, were not included as their management was not detailed in the QI.[3]
We included patients with suspected or established cirrhosis who had ascites confirmed radiographically or by exam, noting shifting dullness or fluid wave. However, patients were excluded if they lacked sufficient peritoneal fluid for bedside or image‐guided paracentesis. Cirrhotic patients were defined as having hepatic encephalopathy if the patient had altered mental status not secondary to seizures, cerebrovascular accident, or alcohol withdrawal. Finally, gastrointestinal bleeding in cirrhotic patients was defined as any upper or lower bleeding prompting hospital admission, or identified in the medical record as clinically significant by the attending physician.
The same QIs were measured in both cohorts. From the QI set,[3] we selected the 16 QIs that would apply to the management of inpatients (see Supporting Information, Appendix 2, in the online version of this article). Indicators developed for outpatient settings were not included. A quality score was calculated for each admission, defined as the proportion of QIs met divided by the number of QIs for which the patient was eligible. For example, a patient with hepatic encephalopathy but without GI bleeding or ascites would have a score calculated as the number of QIs met for hepatic encephalopathy and documentation of transplant evaluation divided by 3 (2 QIs for hepatic encephalopathy and 1 QI for transplant evaluation). If the patient met both QIs for hepatic encephalopathy, but the consultant failed to address liver transplant eligibility, the score would be 2/3=0.666.
After the institution of the MC, all inpatients with DC were identified within 24 hours of admission by a gastroenterologist (R.G., D.D.), who manually reviewed on a daily basis all admissions from EMRs. An author (R.G.) would then contact the admitting team (hospitalist or resident) to make sure that a gastroenterology consult was called and would then obtain the QI by manual extraction from the EMRs.
Of the 16 gastroenterologists who work at the hospital, 12 of them belong to several private practice groups, whereas 4 are employed by the hospital. As part of the intervention, all gastroenterologists were made aware of the intervention 1 month before the starting date, were provided with a checklist of the QIs of interest, and were encouraged to work with the hospitalist attendings to achieve compliance with the QIs. We reminded the gastroenterologists of the ongoing study during routine division meetings and regularly sought feedback from the hospitalists
The MC consisted of a systematic consultation by a gastroenterologist: any identified patient with DC would generate a mandatory GI consultation and would be assigned to a specialist depending on the roster coverage for that day. A close monitoring of the process allowed us to confirm that all patients admitted with DC were seen by a gastroenterologist. Patients were followed until their discharge, death, or readmission to our institution during the study period.
Outcomes
The primary outcome was defined as the rate of adherence to the QIs and overall QI score expressed as a proportion as noted above. Secondary outcomes included in‐hospital mortality, LOS, and 30‐day readmission rate. These parameters were abstracted from the medical record.
Covariates
The hospital EMR (Cerner Corporation, North Kansas City, MO) was used to extract patient demographic parameters such as gender, race, language, and age at time of admission. Other admission‐level details were extracted from the EMR including Model for End‐Stage Liver Disease (MELD) scores, documented comorbidities (including substance abuse, psychiatric diagnosis, diabetes mellitus, renal failure, congestive heart failure, coronary artery disease, and cancer), underlying etiology for cirrhosis, and reason for admission.
The study was approved by Baystate Medical Center's institutional review board.
Statistical Analysis
Summary statistics for outcomes and covariates were calculated as means/standard deviations (SDs), medians/emnterquartile range, and proportions. Univariable statistics (unpaired t tests, 1‐way analysis of variance, Fisher exact test, Spearman correlation) were used to identify possible demographic (eg, age, race) and clinical (eg, admission complaint) predictors of quality score and with 30‐day outcomes. For each admission, a composite quality score, also known as an opportunity model score,[5, 6] was calculated as a fraction (ie, the number of QIs met divided by the total number of possible QIs indicated by the patient's presentation). This fraction was then multiplied by 100 so as to express the QI score as a percent. Possible scores, therefore, ranged from 0 to 100%.
Calculation of the 30‐day incidence proportion of readmission after the first admission was restricted to patients whose readmission occurred in this hospital, and occurring up to 30‐days before study closure (June 1, 2012). In‐hospital death was examined as a function of QI score during that admission. To derive an unbiased, risk‐adjusted estimate of the association between quality score and outcomes, multiple linear regression (opportunity model score [OMS], LOS) or multiple Poisson regression models (30‐day readmission, in‐hospital death) were built. These included a dummy variable for the study period, as well as any potential confounder that was associated at P0.10, with both study period and the outcome in univariable analyses. Robust standard errors were specified to account for multiple admissions within patients. Marginal means or proportions were then estimated with 95% confidence intervals derived using the delta method. All analyses were performed using Stata 12.1 for Windows (StataCorp, College Station, TX).
RESULTS
A total of 303 patients were observed in 695 hospitalizations;149 patients in 379 admissions were observed in the UC cohort, and 154 patients in 316 admissions were observed in the MC cohort. Baseline demographics of all study admissions appear in Table 1. Patients seen in the MC cohort were younger, more likely to speak English, and less likely to be male or have comorbid diabetes mellitus. Most admissions (n=217, 57.2%; 95% confidence interval: 52.3%‐62.3%) were not evaluated by a gastroenterologist in the UC cohort but all were in the MC cohort.
| UC, N=379, N (%) or Mean/SD | MC, N=316, N (%) or Mean/SD | P Value* | |
|---|---|---|---|
| |||
| Age, y | 55.3/12.1 | 53.3/13.6 | 0.05 |
| English speaking | 261 (68.9%) | 261 (82.6%) | <0.001 |
| Male | 251 (66.2%) | 163 (53.5%) | 0.001 |
| Race | <0.001 | ||
| White | 301 (79.4%) | 262 (82.9%) | |
| Black | 31 (8.2%) | 40 (12.7%) | |
| Asian | 16 (4.2%) | 0 (0.0%) | |
| Other | 31 (8.2%) | 14 (4.4%) | |
| Comorbidities | |||
| Substance | 75 (19.8%) | 58 (18.4%) | 0.70 |
| abuse | |||
| Psychiatric | 123 (32.5%) | 103 (32.9%) | 0.94 |
| Diabetes mellitus | 175 (45.4%) | 115 (36.5%) | 0.02 |
| Renal failure | 74 (19.3%) | 55 (17.4%) | 0.50 |
| CHF | 38 (10.0%) | 24 (7.6%) | 0.35 |
| CAD | 26 (6.9%) | 17 (5.4%) | 0.43 |
| Cancer | 48 (12.7%) | 40 (12.7%) | 1.00 |
| Admission MELD | 15.6/6.9 | 17.0/7.0 | 0.006 |
| Serum creatinine | 1.43/1.94 | 1.42/1.30 | 0.91 |
| Reason for admission | |||
| Hepatology/GI | 318 (83.9%) | 257 (81.3%) | 0.42 |
| Renal failure | 85 (22.4%) | 90 (28.5%) | 0.08 |
| Encephalopathy | 151 (39.3%) | 113 (34.9%) | 0.24 |
| GI bleed | 78 (20.5%) | 57 (18.0%) | 1.00 |
| Abdominal pain | 116 (30.7%) | 114 (36.2%) | 0.15 |
| Ascites | 246 (64.9%) | 185 (58.5%) | 0.10 |
Admission Characteristics
The baseline clinical measures of all study admissions appear in Table 1. The UC and MC cohorts had similar characteristics, with the majority of patients with DC admitted for a gastrointestinal/hepatology‐related reason specifically for the management of ascites and hepatic encephalopathy. The patients in the MC cohort had a statistically higher MELD score on admission, which was not clinically relevant.
Quality Measures
Adherence to individual quality indices is shown in Table 2.
| Condition (Denominator) | Quality Indicator (Numerator) | UC (n=379), Met/Indicated | MC (n=316), Met/Indicated | P Value | |
|---|---|---|---|---|---|
| |||||
| Admissions with ascites | |||||
| 1 | Admissions to the hospital because of ascites or encephalopathy. | Diagnostic paracentesis during admission. | 77/193, 39.9%, (32.9%, 46.9%) | 111/135, 82.2% (75.7%, 88.8%) | <0.001 |
| 2 | No fibrinolysis or disseminated intravascular coagulation before paracentesis INR <2.5, >100,000 platelets. | No fresh frozen plasma or platelet replacement given. | 36/37, 97.3% (91.8%, 103.0%) | 41/42, 97.6% (92.8%, 102.4%) | 1.00 |
| 3 | All admissions with diagnostic paracentesis (not limited to admissions for ascites or hepatic encephalopathy). | Cell count differential, total protein, albumin, and culture/sensitivity all performed. | 31/49, 63.3% (49.3%‐77.3%) | 46/72 63.9% (52.7%, 75.0%) | 1.00 |
| 4 | Admissions with known portal hypertension‐related ascites receiving a paracentesis. | Ascitic fluid cell count and differential performed. | 15/104, 14.4% (7.6%‐ 21.3%) | 47/62, 75.8% (63.2%, 88.4%) | <0.001 |
| 5 | Serum sodium 110 mEq/L. | Fluid restriction and discontinuation of diuretics. | NA | NA | NA |
| 6 | Polymorphonuclear count of 250/mm3 in ascites. | Empiric antibiotics, 6 hours of results. | 10/13, 76.9% (50.4%‐ 103.4%) | 16/20, 80.0% (60.8%, 99.2%) | 1.00 |
| 7 | Ascitic fluid, total protein 1.1 gm/dL, serum bilirubin 2.5 mg/dL. | Prophylactic antibiotics. | 4/12, 33.3% (2.0%‐ 64.6%) | 18/30, 60.0%, (41.4%, 78.6%) | 0.18 |
| 8 | Normal renal function. | Salt restriction and diuretics (spironolactone and loop diuretics). | 57/186, 30.6%, (24.0%‐ 37.3%) | 81/122, 66.4%, (57.9%, 74.9%) | <0.001 |
| Total ascites subscore, mean/SD | 30%/36% | 67%/34% | <0.001 | ||
| GI bleeding | |||||
| 9 | Admissions with GI bleeding: variceal and nonvariceal, hematemesis and melena. | Upper endoscopy 24 hours of presentation. | 60/78, 76.9% (67.4%, 86.4%) | 52/57, 91.2% (83.7%, 98.8%) | 0.04 |
| 10 | Esophageal varices (active, stigmata of recent bleeding, or no other causes to explain bleeding). | Endoscopic variceal ligation/sublerotherapy. | 40/46, 87.0% (76.8%‐97.1%) | 30/32, 93.8% (84.9%, 100.0%) | 0.46 |
| 11 | Admissions with established/suspected upper GI bleeding. | Antibiotics within 24 hours of admission. | 27/69, 39.1% (27.3%‐ 50.9%) | 26/58, 44.8% (31.6%, 58.0%) | 0.59 |
| 12 | Admissions with established/suspected variceal bleeding. | Somatostatin/octreotide given within 12 hours of presentation. | 53/69, 76.8%, (66.6%‐ 87.0%) | 49/58, 84.5% (73.8%, 95.2%) | 0.37 |
| 13 | Recurrent bleeding within 72 hours of initial endoscopic hemostasis. | Repeat endoscopy or transjugular intrahepatic portosystemic shunt. | 5/5 100% | 2/3, 66.7% (76.8%, 210.0%) | 0.38 |
| Total GI subscore, mean/SD | 61%/38% | 74%/28% | 0.04 | ||
| Liver transplantation | |||||
| 14 | Admissions with MELD 15 or MELD 15 and decompensated status (ie, all admissions in our study). | Documented evaluation for liver transplantation. | 112/379, 29.6% (24.9%‐ 34.2%) | 231/316, 73.6% (68.7%, 78.5%) | <0.001 |
| Hepatic encephalopathy | |||||
| 15 | Admissions with hepatic encephalopathy. | Search for reversible factors documented. | 81/151, 53.6% (45.6%‐ 61.7 %) | 97/113, 85.8% (79.4%, 92.3%) | <0.001 |
| 16 | Admissions with hepatic encephalopathy. | Oral disaccharides/ rifaximin. | 144/151, 95.3% (91.9 %‐ 98.7 %) | 107/113, 94.7% (90.7%. 98.69%) | 1.00 |
| Total encephalopathy subscore, mean/SD | 75%/28% | 90%/24% | <0.001 | ||
Ascites
The management of ascites yielded 3 main differences between the 2 cohorts. Following the implementation of the MC, 82.2 % (111/135) of ascites‐related admissions led to a diagnostic paracentesis as compared to 39.9% (77/193) in the UC group (P<0.001).
In the MC cohort, 75.8% (47/62) of admissions with known portal hypertensionrelated ascites who received a paracentesis had an ascites cell count checked. In contrast, only 14.4% (15/104) in the UC group receiving paracentesis had a fluid cell count (P<0.001). The management of ascites in patients with normal renal function was optimal, with sodium restriction and diuretics combination in 66.4% (81/122) of the MC cohort, whereas this parameter in the UC cohort was only 30.6% (57/186) (P<0.001). There were no significant differences between the groups for the other QIs.
Variceal Bleeding
The MC group had a higher frequency of endoscopy within 24 hours of admissions than the UC group (91.2% [52/57] vs 76.9% [60/78], respectively; P<0.04). The rest had endoscopy later in the admission. Among admissions with bleeding from varices, banding was done 93.8% of the time for patients in the MC group (30/32), which was not statistically different than 87.0% (40/46) for patients seen in the UC group. In the remaining admissions, endoscopy only revealed nonbleeding large esophageal varices, and the endoscopist opted not to proceed with therapy. There were no statistically significant differences in the rest of the management.
Hepatic Encephalopathy
For hepatic encephalopathy, an empirical treatment was given to 95.3 % (144/151) patients in the UC group and 94.7% (107/113) of the patients in the MC group. We found better documentation of a search for underlying etiologies leading to hepatic encephalopathy in the MC cohort 85.8% (97/113) versus the UC cohort, which was only 53.6% (81/151) (P<0.001).
Evaluation for Liver Transplantation
Better documentation of evaluation for liver transplantation was seen in the MC group 73.6% (231/316) in comparison to the UC group 29.4% (111/379) (P<0.001).
Opportunity Score and Clinical Outcomes
As detailed above, care provided during the MC achieved a higher compliance with the QI shown with the QI score or OMS (Table 3). These improvements were not associated with statistically significant differences in in‐hospital death, LOS, or 30‐day readmission. To explore this further we also examined the direct association between the OMS and outcomes in the MC group by dividing patients into 2 groups: patients whose OMS was 80% and those whose OMS was <80% (see Supporting Information, Appendix 4, in the online version of this article). Although there were trends toward decreased in‐hospital death (6.4% vs 8.6%, P=0.26), increased 30‐day readmission (33.8% vs 23.0%, P=0.27), and decreased LOS (6.2 days vs 6.6 days, P=0.77), none of these differences achieved statistical significance.
| Unadjusted | Adjusted* | |||||
|---|---|---|---|---|---|---|
| UC | MC | Difference | UC | MC | Difference | |
| ||||||
| Opportunity model score | 0.46 | 0.77 | +0.31 (0.24, 0.39) | 0.46 | 0.77 | +0.30(0.23, 0.37) |
| In‐hospital death | 7.1% | 8.5% | +1.4 (0.3, +5.6) | 7.5% | 7.9% | +0.4% (4.0%, +4.5%) |
| Readmission within 30 days | 39.6% | 32.6% | 7.0% (16.4%, +2.5%) | 40.0% | 31.8% | 8.2%(18.0%, +1.5%) |
| Length of stay | 6.1d | 6.2d | +0.1d (1.0 d, +1.2 d) | 6.1d | 6.2d | +0.1d (1.0 d, +1.2d) |
Mandatory Consultation Subgroups: Employed Versus Private Physicians
The type of employment of the gastroenterologist on consultation (employed by the hospital vs private practice) affected the management of the patients admitted with DC (see Supporting Information, Appendix 3, in the online version of this article). Patients seen by a hospital‐employed gastroenterologist were more likely to have a better documentation in regard to evaluation for liver transplantation and better management of ascites. Except for the prescription of antibiotics in patients presenting with GI bleeding, which were more often given by the employed physician (63% vs 23%, P=0.004), the management of hepatic encephalopathy and GI bleeding was similar between employed and private‐practice physicians.
DISCUSSION
In this evaluation of an MC intervention for patients with DC cared for at a large tertiary academic medical center, we found that the implementation of a routine consultation by a gastroenterologist led to greater adherence to recommended care processes when compared to UC. Overall, the management of ascites and the documentation of evaluation for liver transplantation were statistically superior in the intervention (MC) group. UC and MC were similar with respect to treatment of variceal bleeding and hepatic encephalopathy. Although we did not demonstrate changes in mortality, readmission, or LOS as a result of the MC intervention, our study was underpowered to detect clinically meaningful effects.
The gaps in care of patients with cirrhosis were reported before and after the publication of the formal QIs.[7, 8, 9, 10] These gaps remain relevant in the face of an increasing prevalence of DC along with a recent publication suggesting an underestimation of the burden of liver disease in the United States.[11] Ours is the first study to evaluate the impact on inpatients with DC of a liver service with a systematic, mandatory, specialist consultation. A previous study[12] had shown that a GI consultation would improve the care of patients with DC, but excluded patients with variceal bleeding, did not specifically measure the compliance with QIs, and more important, the GI consult was not mandatory.
Our study has several limitations that must be considered while weighing its findings. The patients were not randomly assigned but followed a pre‐established distribution depending on the call schedule. Some of the improvement we noted might be the result of secular trends; however, this remains unlikely given the lack of national initiatives or pay for performance programs. In the UC cohort, patients who were nonEnglish‐speaking were associated with a lower QI score, which could account for part of the improvement seen in the MC group that has a more prominent English‐speaking cohort. Readmissions could have occurred at other hospitals, and patients were not monitored in an outpatient setting. We did not observe a change in the secondary outcomes (30‐day readmission, LOS, in‐hospital death); however, our study was underpowered for that purpose. Given the complexity of the billing process we did not collect the costs of the MC, which is another limitation of our work. Future studies are needed to determine the cost‐effectiveness of the intervention.
This study shows that a dedicated team of physicians focused on compliance with QIs can achieve a rapid improvement, over a year, in providing higher‐quality care. This may be relevant at other institutions. The strength of our study is that our large tertiary academic medical center serves a large catchment area, with a mix of patients from both rural and urban communities. It is located in Massachusetts, where most of the population has had access to healthcare since 2006. Therefore, although this is a single‐center study, we expect our findings to be more generalizable and less subject to selection bias than other single‐center studies.
Importantly, the compliance with QIs was often far from being perfect in the MC group and was different across type of employment of providers, reflecting the challenges in changing practice among physicians.[13] In fact the QI scores of the private practice group did not change, and mirror the compliance observed at our institution in the previous study, before the implementation of the MC.[4] The difference in performance according to the type of employment of providers stems from 2 factors. First, a better documentation of the need of formal evaluation for liver transplantation by the employed gastroenterologists resulted in better compliance with this QI. Second, and more important, among the employed physicians, there was a readiness to assist the hospitalist with diagnostic/therapeutic paracentesis without relying on, for example, an interventional radiologist. This is reflected by the higher score in the management of ascites. Although our study was not designed to answer this directly, employed physicians may have been more engaged in the project and showed a greater willingness to change practice. In the future, linking reimbursement to quality of care will lead to improved accountability of consultants.
In this study we show that a direct involvement of a gastroenterologist improves the care of inpatients as measured by QIs. We theorize that a better coordination of the transition to outpatient care involving the specialist should lead to better outcomes, specifically a reduction in the 22% observed readmission rate within 30 days of patients with DC.[14, 15] As we move forward, a broader definition of outcomes should be addressed, taking into account patient‐related outcomes and preferences.[16] Future studies should define the relationship between the gastroenterologist and the hospitalist service, the role of physician assistants and nurse practitioners in implementing and monitoring compliance with QIs, and define how physicians and patients can be made accountable in the transition to the outpatient setting.
Disclosures
R.G.: Conception, data collection and interpretation, manuscript. J.F.: Data management, data analysis, manuscript. P.V.: Conception, data analysis, manuscript. P.L.: Conception, data interpretation, manuscript. T.L.: Dr. Lagu is supported by the National Heart, Lung, and Blood Institute of the National Institutes of Health under award number K01HL114745. Conception, data interpretation, manuscript. D.D.: Conception, data collection and interpretation, manuscript. A.B.: Data collection. J.S.: Data collection. Source of funding: internal. The authors report no conflicts of interest.
- , , . Natural history and prognostic indicators of survival in cirrhosis: a systematic review of 118 studies. J Hepatol. 2006;44:217–231.
- , , , . Efficacy of a chronic disease management model for patients with chronic liver failure. Clin Gastroenterol Hepatol. 2013;11:850–858.
- , , , et al. An Explicit Quality Indicator Set for Measurement of Quality of Care in Patients with Cirrhosis. Clin Gastroenterol Hepatol. 2010;8:709–717.
- , , , , , Desilets D. Measurement of the quality of care of patients admitted with decompensated cirrhosis. Liver Int. 2014:34:204–210.
- , . All‐or‐none measurement raises the bar on performance. JAMA. 2006;295:1168–1170.
- Joint Commission on Accreditation of Healthcare Organizations. Quality report user guide. Available at: http://www.jointcommission.org. Accessed May 30, 2011.
- , , , et al. Management of patients with cirrhosis in Southern California: results of a practitioner survey. J Clin Gastroenterol. 2006;40:156–161.
- , , , et al. Spanish Collaborative Study Group on Therapeutic Management In Liver Disease. Multicenter hospital study on prescribing patterns for prophylaxis and treatment of complications of cirrhosis. Eur J Clin Pharmacol. 2002;58:435–440.
- , , , et al. The quality of care provided to patients with cirrhosis and ascites in the Department of Veterans Affairs. Gastroenterology. 2012 143(1):70–77.
- , , , et al. Improved patient survival after acute variceal bleeding: a multicenter, cohort study. Am J Gastroenterol. 2003;98:653–659.
- , , , , . Underestimation of liver‐related mortality in the United States. Gastroenterology. 2013;145:375–382.
- , , , et al. Impact of gastroenterology consultation on the outcomes of patients admitted to the hospital with decompensated cirrhosis. Hepatology. 2001;34:1089–1095.
- , , , et al. Why don't physicians follow clinical practice guidelines? A framework for improvement. JAMA. 1999;282:1458–1465.
- , , , et al. Incidence and predictors of 30‐day readmission among patients hospitalized with advanced liver disease. Clin Gastroenterol Hepatol. 2011;9:254–259.
- , , , et al. Hospital Readmissions among patients with decompensated cirrhosis. Am J Gastroenterol. 2012;107:247–252.
- . Patient‐reported outcomes of cirrhosis. Clin Gastroenterol Hepatol. 2013;11:1043–1045.
Decompensated cirrhosis (DC) is defined as cirrhosis with at least 1 of the following complications: ascites, hepatocellular carcinoma, bleeding from portal hypertension, or hepatic encephalopathy. Patients with DC have a median survival estimated at 2 years compared to the 12‐year median survival of compensated cirrhotics.[1] In an era where quality of hospital care is being measured, and where progress is being made in the management of several conditions including congestive heart failure and nosocomial infections, little attention has been paid to DC. The burden of chronic liver failure is clear in the United States, where DC leads to more than 150,000 annual admissions to the hospital and accounts for 40,000 deaths annually.[2]
This burden of disease spurred quality improvement efforts in 2010, when a team of experts identified a set of literature‐based parameters or quality indicators (QI) for patients with cirrhosis.[3] We have demonstrated that adherence to these indicators fell far short of desired targets.[4] A year before their publication, an overall compliance of <50% with these metrics was measured at a single medical center.
We sought to improve the quality of care for patients with DC through implementation of mandatory consultation (MC) with a gastroenterologist for all patients admitted with DC. We assessed whether MC was associated with better care and improved outcomes (hospitalization length of stay [LOS], 30‐day readmission, and inpatient mortality) when compared to usual care (UC).[4]
MATERIALS AND METHODS
Design, Setting, and Patients
We conducted a cohort study comparing adherence to QI and outcomes of patients admitted with DC after the institution of an MC to a historical cohort of patients managed with UC (ie, before MC, adherence to QI for this group has been reported elsewhere).[4] Both cohorts included all patients aged >18 years with DC admitted to Baystate Medical Center, a tertiary care medical center in western Massachusetts. The UC cohort was collected between January 1, 2009 and December 31, 2009, and the MC cohort was assembled between June 1, 2011 and June 30, 2012.
As previously reported,[4] patients were considered for inclusion in the historical cohort if their International Classification of DiseasesNinth Revision discharge code pertained to chronic liver disease (see Supporting Information, Appendix 1, in the online version of this article). This list was broad by design to identify all patients with decompensated cirrhosis. A gastroenterologist (R.G.) then manually extracted charts from electronic medical records (EMRs) using a set of predefined clinical criteria, the same in both cohorts, to identify the patients with DC: cirrhosis with concomitant ascites, hepatic encephalopathy, or gastrointestinal (GI) bleeding secondary to portal hypertension. Other types of decompensated states, such as hepatocellular carcinoma, were not included as their management was not detailed in the QI.[3]
We included patients with suspected or established cirrhosis who had ascites confirmed radiographically or by exam, noting shifting dullness or fluid wave. However, patients were excluded if they lacked sufficient peritoneal fluid for bedside or image‐guided paracentesis. Cirrhotic patients were defined as having hepatic encephalopathy if the patient had altered mental status not secondary to seizures, cerebrovascular accident, or alcohol withdrawal. Finally, gastrointestinal bleeding in cirrhotic patients was defined as any upper or lower bleeding prompting hospital admission, or identified in the medical record as clinically significant by the attending physician.
The same QIs were measured in both cohorts. From the QI set,[3] we selected the 16 QIs that would apply to the management of inpatients (see Supporting Information, Appendix 2, in the online version of this article). Indicators developed for outpatient settings were not included. A quality score was calculated for each admission, defined as the proportion of QIs met divided by the number of QIs for which the patient was eligible. For example, a patient with hepatic encephalopathy but without GI bleeding or ascites would have a score calculated as the number of QIs met for hepatic encephalopathy and documentation of transplant evaluation divided by 3 (2 QIs for hepatic encephalopathy and 1 QI for transplant evaluation). If the patient met both QIs for hepatic encephalopathy, but the consultant failed to address liver transplant eligibility, the score would be 2/3=0.666.
After the institution of the MC, all inpatients with DC were identified within 24 hours of admission by a gastroenterologist (R.G., D.D.), who manually reviewed on a daily basis all admissions from EMRs. An author (R.G.) would then contact the admitting team (hospitalist or resident) to make sure that a gastroenterology consult was called and would then obtain the QI by manual extraction from the EMRs.
Of the 16 gastroenterologists who work at the hospital, 12 of them belong to several private practice groups, whereas 4 are employed by the hospital. As part of the intervention, all gastroenterologists were made aware of the intervention 1 month before the starting date, were provided with a checklist of the QIs of interest, and were encouraged to work with the hospitalist attendings to achieve compliance with the QIs. We reminded the gastroenterologists of the ongoing study during routine division meetings and regularly sought feedback from the hospitalists
The MC consisted of a systematic consultation by a gastroenterologist: any identified patient with DC would generate a mandatory GI consultation and would be assigned to a specialist depending on the roster coverage for that day. A close monitoring of the process allowed us to confirm that all patients admitted with DC were seen by a gastroenterologist. Patients were followed until their discharge, death, or readmission to our institution during the study period.
Outcomes
The primary outcome was defined as the rate of adherence to the QIs and overall QI score expressed as a proportion as noted above. Secondary outcomes included in‐hospital mortality, LOS, and 30‐day readmission rate. These parameters were abstracted from the medical record.
Covariates
The hospital EMR (Cerner Corporation, North Kansas City, MO) was used to extract patient demographic parameters such as gender, race, language, and age at time of admission. Other admission‐level details were extracted from the EMR including Model for End‐Stage Liver Disease (MELD) scores, documented comorbidities (including substance abuse, psychiatric diagnosis, diabetes mellitus, renal failure, congestive heart failure, coronary artery disease, and cancer), underlying etiology for cirrhosis, and reason for admission.
The study was approved by Baystate Medical Center's institutional review board.
Statistical Analysis
Summary statistics for outcomes and covariates were calculated as means/standard deviations (SDs), medians/emnterquartile range, and proportions. Univariable statistics (unpaired t tests, 1‐way analysis of variance, Fisher exact test, Spearman correlation) were used to identify possible demographic (eg, age, race) and clinical (eg, admission complaint) predictors of quality score and with 30‐day outcomes. For each admission, a composite quality score, also known as an opportunity model score,[5, 6] was calculated as a fraction (ie, the number of QIs met divided by the total number of possible QIs indicated by the patient's presentation). This fraction was then multiplied by 100 so as to express the QI score as a percent. Possible scores, therefore, ranged from 0 to 100%.
Calculation of the 30‐day incidence proportion of readmission after the first admission was restricted to patients whose readmission occurred in this hospital, and occurring up to 30‐days before study closure (June 1, 2012). In‐hospital death was examined as a function of QI score during that admission. To derive an unbiased, risk‐adjusted estimate of the association between quality score and outcomes, multiple linear regression (opportunity model score [OMS], LOS) or multiple Poisson regression models (30‐day readmission, in‐hospital death) were built. These included a dummy variable for the study period, as well as any potential confounder that was associated at P0.10, with both study period and the outcome in univariable analyses. Robust standard errors were specified to account for multiple admissions within patients. Marginal means or proportions were then estimated with 95% confidence intervals derived using the delta method. All analyses were performed using Stata 12.1 for Windows (StataCorp, College Station, TX).
RESULTS
A total of 303 patients were observed in 695 hospitalizations;149 patients in 379 admissions were observed in the UC cohort, and 154 patients in 316 admissions were observed in the MC cohort. Baseline demographics of all study admissions appear in Table 1. Patients seen in the MC cohort were younger, more likely to speak English, and less likely to be male or have comorbid diabetes mellitus. Most admissions (n=217, 57.2%; 95% confidence interval: 52.3%‐62.3%) were not evaluated by a gastroenterologist in the UC cohort but all were in the MC cohort.
| UC, N=379, N (%) or Mean/SD | MC, N=316, N (%) or Mean/SD | P Value* | |
|---|---|---|---|
| |||
| Age, y | 55.3/12.1 | 53.3/13.6 | 0.05 |
| English speaking | 261 (68.9%) | 261 (82.6%) | <0.001 |
| Male | 251 (66.2%) | 163 (53.5%) | 0.001 |
| Race | <0.001 | ||
| White | 301 (79.4%) | 262 (82.9%) | |
| Black | 31 (8.2%) | 40 (12.7%) | |
| Asian | 16 (4.2%) | 0 (0.0%) | |
| Other | 31 (8.2%) | 14 (4.4%) | |
| Comorbidities | |||
| Substance | 75 (19.8%) | 58 (18.4%) | 0.70 |
| abuse | |||
| Psychiatric | 123 (32.5%) | 103 (32.9%) | 0.94 |
| Diabetes mellitus | 175 (45.4%) | 115 (36.5%) | 0.02 |
| Renal failure | 74 (19.3%) | 55 (17.4%) | 0.50 |
| CHF | 38 (10.0%) | 24 (7.6%) | 0.35 |
| CAD | 26 (6.9%) | 17 (5.4%) | 0.43 |
| Cancer | 48 (12.7%) | 40 (12.7%) | 1.00 |
| Admission MELD | 15.6/6.9 | 17.0/7.0 | 0.006 |
| Serum creatinine | 1.43/1.94 | 1.42/1.30 | 0.91 |
| Reason for admission | |||
| Hepatology/GI | 318 (83.9%) | 257 (81.3%) | 0.42 |
| Renal failure | 85 (22.4%) | 90 (28.5%) | 0.08 |
| Encephalopathy | 151 (39.3%) | 113 (34.9%) | 0.24 |
| GI bleed | 78 (20.5%) | 57 (18.0%) | 1.00 |
| Abdominal pain | 116 (30.7%) | 114 (36.2%) | 0.15 |
| Ascites | 246 (64.9%) | 185 (58.5%) | 0.10 |
Admission Characteristics
The baseline clinical measures of all study admissions appear in Table 1. The UC and MC cohorts had similar characteristics, with the majority of patients with DC admitted for a gastrointestinal/hepatology‐related reason specifically for the management of ascites and hepatic encephalopathy. The patients in the MC cohort had a statistically higher MELD score on admission, which was not clinically relevant.
Quality Measures
Adherence to individual quality indices is shown in Table 2.
| Condition (Denominator) | Quality Indicator (Numerator) | UC (n=379), Met/Indicated | MC (n=316), Met/Indicated | P Value | |
|---|---|---|---|---|---|
| |||||
| Admissions with ascites | |||||
| 1 | Admissions to the hospital because of ascites or encephalopathy. | Diagnostic paracentesis during admission. | 77/193, 39.9%, (32.9%, 46.9%) | 111/135, 82.2% (75.7%, 88.8%) | <0.001 |
| 2 | No fibrinolysis or disseminated intravascular coagulation before paracentesis INR <2.5, >100,000 platelets. | No fresh frozen plasma or platelet replacement given. | 36/37, 97.3% (91.8%, 103.0%) | 41/42, 97.6% (92.8%, 102.4%) | 1.00 |
| 3 | All admissions with diagnostic paracentesis (not limited to admissions for ascites or hepatic encephalopathy). | Cell count differential, total protein, albumin, and culture/sensitivity all performed. | 31/49, 63.3% (49.3%‐77.3%) | 46/72 63.9% (52.7%, 75.0%) | 1.00 |
| 4 | Admissions with known portal hypertension‐related ascites receiving a paracentesis. | Ascitic fluid cell count and differential performed. | 15/104, 14.4% (7.6%‐ 21.3%) | 47/62, 75.8% (63.2%, 88.4%) | <0.001 |
| 5 | Serum sodium 110 mEq/L. | Fluid restriction and discontinuation of diuretics. | NA | NA | NA |
| 6 | Polymorphonuclear count of 250/mm3 in ascites. | Empiric antibiotics, 6 hours of results. | 10/13, 76.9% (50.4%‐ 103.4%) | 16/20, 80.0% (60.8%, 99.2%) | 1.00 |
| 7 | Ascitic fluid, total protein 1.1 gm/dL, serum bilirubin 2.5 mg/dL. | Prophylactic antibiotics. | 4/12, 33.3% (2.0%‐ 64.6%) | 18/30, 60.0%, (41.4%, 78.6%) | 0.18 |
| 8 | Normal renal function. | Salt restriction and diuretics (spironolactone and loop diuretics). | 57/186, 30.6%, (24.0%‐ 37.3%) | 81/122, 66.4%, (57.9%, 74.9%) | <0.001 |
| Total ascites subscore, mean/SD | 30%/36% | 67%/34% | <0.001 | ||
| GI bleeding | |||||
| 9 | Admissions with GI bleeding: variceal and nonvariceal, hematemesis and melena. | Upper endoscopy 24 hours of presentation. | 60/78, 76.9% (67.4%, 86.4%) | 52/57, 91.2% (83.7%, 98.8%) | 0.04 |
| 10 | Esophageal varices (active, stigmata of recent bleeding, or no other causes to explain bleeding). | Endoscopic variceal ligation/sublerotherapy. | 40/46, 87.0% (76.8%‐97.1%) | 30/32, 93.8% (84.9%, 100.0%) | 0.46 |
| 11 | Admissions with established/suspected upper GI bleeding. | Antibiotics within 24 hours of admission. | 27/69, 39.1% (27.3%‐ 50.9%) | 26/58, 44.8% (31.6%, 58.0%) | 0.59 |
| 12 | Admissions with established/suspected variceal bleeding. | Somatostatin/octreotide given within 12 hours of presentation. | 53/69, 76.8%, (66.6%‐ 87.0%) | 49/58, 84.5% (73.8%, 95.2%) | 0.37 |
| 13 | Recurrent bleeding within 72 hours of initial endoscopic hemostasis. | Repeat endoscopy or transjugular intrahepatic portosystemic shunt. | 5/5 100% | 2/3, 66.7% (76.8%, 210.0%) | 0.38 |
| Total GI subscore, mean/SD | 61%/38% | 74%/28% | 0.04 | ||
| Liver transplantation | |||||
| 14 | Admissions with MELD 15 or MELD 15 and decompensated status (ie, all admissions in our study). | Documented evaluation for liver transplantation. | 112/379, 29.6% (24.9%‐ 34.2%) | 231/316, 73.6% (68.7%, 78.5%) | <0.001 |
| Hepatic encephalopathy | |||||
| 15 | Admissions with hepatic encephalopathy. | Search for reversible factors documented. | 81/151, 53.6% (45.6%‐ 61.7 %) | 97/113, 85.8% (79.4%, 92.3%) | <0.001 |
| 16 | Admissions with hepatic encephalopathy. | Oral disaccharides/ rifaximin. | 144/151, 95.3% (91.9 %‐ 98.7 %) | 107/113, 94.7% (90.7%. 98.69%) | 1.00 |
| Total encephalopathy subscore, mean/SD | 75%/28% | 90%/24% | <0.001 | ||
Ascites
The management of ascites yielded 3 main differences between the 2 cohorts. Following the implementation of the MC, 82.2 % (111/135) of ascites‐related admissions led to a diagnostic paracentesis as compared to 39.9% (77/193) in the UC group (P<0.001).
In the MC cohort, 75.8% (47/62) of admissions with known portal hypertensionrelated ascites who received a paracentesis had an ascites cell count checked. In contrast, only 14.4% (15/104) in the UC group receiving paracentesis had a fluid cell count (P<0.001). The management of ascites in patients with normal renal function was optimal, with sodium restriction and diuretics combination in 66.4% (81/122) of the MC cohort, whereas this parameter in the UC cohort was only 30.6% (57/186) (P<0.001). There were no significant differences between the groups for the other QIs.
Variceal Bleeding
The MC group had a higher frequency of endoscopy within 24 hours of admissions than the UC group (91.2% [52/57] vs 76.9% [60/78], respectively; P<0.04). The rest had endoscopy later in the admission. Among admissions with bleeding from varices, banding was done 93.8% of the time for patients in the MC group (30/32), which was not statistically different than 87.0% (40/46) for patients seen in the UC group. In the remaining admissions, endoscopy only revealed nonbleeding large esophageal varices, and the endoscopist opted not to proceed with therapy. There were no statistically significant differences in the rest of the management.
Hepatic Encephalopathy
For hepatic encephalopathy, an empirical treatment was given to 95.3 % (144/151) patients in the UC group and 94.7% (107/113) of the patients in the MC group. We found better documentation of a search for underlying etiologies leading to hepatic encephalopathy in the MC cohort 85.8% (97/113) versus the UC cohort, which was only 53.6% (81/151) (P<0.001).
Evaluation for Liver Transplantation
Better documentation of evaluation for liver transplantation was seen in the MC group 73.6% (231/316) in comparison to the UC group 29.4% (111/379) (P<0.001).
Opportunity Score and Clinical Outcomes
As detailed above, care provided during the MC achieved a higher compliance with the QI shown with the QI score or OMS (Table 3). These improvements were not associated with statistically significant differences in in‐hospital death, LOS, or 30‐day readmission. To explore this further we also examined the direct association between the OMS and outcomes in the MC group by dividing patients into 2 groups: patients whose OMS was 80% and those whose OMS was <80% (see Supporting Information, Appendix 4, in the online version of this article). Although there were trends toward decreased in‐hospital death (6.4% vs 8.6%, P=0.26), increased 30‐day readmission (33.8% vs 23.0%, P=0.27), and decreased LOS (6.2 days vs 6.6 days, P=0.77), none of these differences achieved statistical significance.
| Unadjusted | Adjusted* | |||||
|---|---|---|---|---|---|---|
| UC | MC | Difference | UC | MC | Difference | |
| ||||||
| Opportunity model score | 0.46 | 0.77 | +0.31 (0.24, 0.39) | 0.46 | 0.77 | +0.30(0.23, 0.37) |
| In‐hospital death | 7.1% | 8.5% | +1.4 (0.3, +5.6) | 7.5% | 7.9% | +0.4% (4.0%, +4.5%) |
| Readmission within 30 days | 39.6% | 32.6% | 7.0% (16.4%, +2.5%) | 40.0% | 31.8% | 8.2%(18.0%, +1.5%) |
| Length of stay | 6.1d | 6.2d | +0.1d (1.0 d, +1.2 d) | 6.1d | 6.2d | +0.1d (1.0 d, +1.2d) |
Mandatory Consultation Subgroups: Employed Versus Private Physicians
The type of employment of the gastroenterologist on consultation (employed by the hospital vs private practice) affected the management of the patients admitted with DC (see Supporting Information, Appendix 3, in the online version of this article). Patients seen by a hospital‐employed gastroenterologist were more likely to have a better documentation in regard to evaluation for liver transplantation and better management of ascites. Except for the prescription of antibiotics in patients presenting with GI bleeding, which were more often given by the employed physician (63% vs 23%, P=0.004), the management of hepatic encephalopathy and GI bleeding was similar between employed and private‐practice physicians.
DISCUSSION
In this evaluation of an MC intervention for patients with DC cared for at a large tertiary academic medical center, we found that the implementation of a routine consultation by a gastroenterologist led to greater adherence to recommended care processes when compared to UC. Overall, the management of ascites and the documentation of evaluation for liver transplantation were statistically superior in the intervention (MC) group. UC and MC were similar with respect to treatment of variceal bleeding and hepatic encephalopathy. Although we did not demonstrate changes in mortality, readmission, or LOS as a result of the MC intervention, our study was underpowered to detect clinically meaningful effects.
The gaps in care of patients with cirrhosis were reported before and after the publication of the formal QIs.[7, 8, 9, 10] These gaps remain relevant in the face of an increasing prevalence of DC along with a recent publication suggesting an underestimation of the burden of liver disease in the United States.[11] Ours is the first study to evaluate the impact on inpatients with DC of a liver service with a systematic, mandatory, specialist consultation. A previous study[12] had shown that a GI consultation would improve the care of patients with DC, but excluded patients with variceal bleeding, did not specifically measure the compliance with QIs, and more important, the GI consult was not mandatory.
Our study has several limitations that must be considered while weighing its findings. The patients were not randomly assigned but followed a pre‐established distribution depending on the call schedule. Some of the improvement we noted might be the result of secular trends; however, this remains unlikely given the lack of national initiatives or pay for performance programs. In the UC cohort, patients who were nonEnglish‐speaking were associated with a lower QI score, which could account for part of the improvement seen in the MC group that has a more prominent English‐speaking cohort. Readmissions could have occurred at other hospitals, and patients were not monitored in an outpatient setting. We did not observe a change in the secondary outcomes (30‐day readmission, LOS, in‐hospital death); however, our study was underpowered for that purpose. Given the complexity of the billing process we did not collect the costs of the MC, which is another limitation of our work. Future studies are needed to determine the cost‐effectiveness of the intervention.
This study shows that a dedicated team of physicians focused on compliance with QIs can achieve a rapid improvement, over a year, in providing higher‐quality care. This may be relevant at other institutions. The strength of our study is that our large tertiary academic medical center serves a large catchment area, with a mix of patients from both rural and urban communities. It is located in Massachusetts, where most of the population has had access to healthcare since 2006. Therefore, although this is a single‐center study, we expect our findings to be more generalizable and less subject to selection bias than other single‐center studies.
Importantly, the compliance with QIs was often far from being perfect in the MC group and was different across type of employment of providers, reflecting the challenges in changing practice among physicians.[13] In fact the QI scores of the private practice group did not change, and mirror the compliance observed at our institution in the previous study, before the implementation of the MC.[4] The difference in performance according to the type of employment of providers stems from 2 factors. First, a better documentation of the need of formal evaluation for liver transplantation by the employed gastroenterologists resulted in better compliance with this QI. Second, and more important, among the employed physicians, there was a readiness to assist the hospitalist with diagnostic/therapeutic paracentesis without relying on, for example, an interventional radiologist. This is reflected by the higher score in the management of ascites. Although our study was not designed to answer this directly, employed physicians may have been more engaged in the project and showed a greater willingness to change practice. In the future, linking reimbursement to quality of care will lead to improved accountability of consultants.
In this study we show that a direct involvement of a gastroenterologist improves the care of inpatients as measured by QIs. We theorize that a better coordination of the transition to outpatient care involving the specialist should lead to better outcomes, specifically a reduction in the 22% observed readmission rate within 30 days of patients with DC.[14, 15] As we move forward, a broader definition of outcomes should be addressed, taking into account patient‐related outcomes and preferences.[16] Future studies should define the relationship between the gastroenterologist and the hospitalist service, the role of physician assistants and nurse practitioners in implementing and monitoring compliance with QIs, and define how physicians and patients can be made accountable in the transition to the outpatient setting.
Disclosures
R.G.: Conception, data collection and interpretation, manuscript. J.F.: Data management, data analysis, manuscript. P.V.: Conception, data analysis, manuscript. P.L.: Conception, data interpretation, manuscript. T.L.: Dr. Lagu is supported by the National Heart, Lung, and Blood Institute of the National Institutes of Health under award number K01HL114745. Conception, data interpretation, manuscript. D.D.: Conception, data collection and interpretation, manuscript. A.B.: Data collection. J.S.: Data collection. Source of funding: internal. The authors report no conflicts of interest.
- , , . Natural history and prognostic indicators of survival in cirrhosis: a systematic review of 118 studies. J Hepatol. 2006;44:217–231.
- , , , . Efficacy of a chronic disease management model for patients with chronic liver failure. Clin Gastroenterol Hepatol. 2013;11:850–858.
- , , , et al. An Explicit Quality Indicator Set for Measurement of Quality of Care in Patients with Cirrhosis. Clin Gastroenterol Hepatol. 2010;8:709–717.
- , , , , , Desilets D. Measurement of the quality of care of patients admitted with decompensated cirrhosis. Liver Int. 2014:34:204–210.
- , . All‐or‐none measurement raises the bar on performance. JAMA. 2006;295:1168–1170.
- Joint Commission on Accreditation of Healthcare Organizations. Quality report user guide. Available at: http://www.jointcommission.org. Accessed May 30, 2011.
- , , , et al. Management of patients with cirrhosis in Southern California: results of a practitioner survey. J Clin Gastroenterol. 2006;40:156–161.
- , , , et al. Spanish Collaborative Study Group on Therapeutic Management In Liver Disease. Multicenter hospital study on prescribing patterns for prophylaxis and treatment of complications of cirrhosis. Eur J Clin Pharmacol. 2002;58:435–440.
- , , , et al. The quality of care provided to patients with cirrhosis and ascites in the Department of Veterans Affairs. Gastroenterology. 2012 143(1):70–77.
- , , , et al. Improved patient survival after acute variceal bleeding: a multicenter, cohort study. Am J Gastroenterol. 2003;98:653–659.
- , , , , . Underestimation of liver‐related mortality in the United States. Gastroenterology. 2013;145:375–382.
- , , , et al. Impact of gastroenterology consultation on the outcomes of patients admitted to the hospital with decompensated cirrhosis. Hepatology. 2001;34:1089–1095.
- , , , et al. Why don't physicians follow clinical practice guidelines? A framework for improvement. JAMA. 1999;282:1458–1465.
- , , , et al. Incidence and predictors of 30‐day readmission among patients hospitalized with advanced liver disease. Clin Gastroenterol Hepatol. 2011;9:254–259.
- , , , et al. Hospital Readmissions among patients with decompensated cirrhosis. Am J Gastroenterol. 2012;107:247–252.
- . Patient‐reported outcomes of cirrhosis. Clin Gastroenterol Hepatol. 2013;11:1043–1045.
© 2014 Society of Hospital Medicine
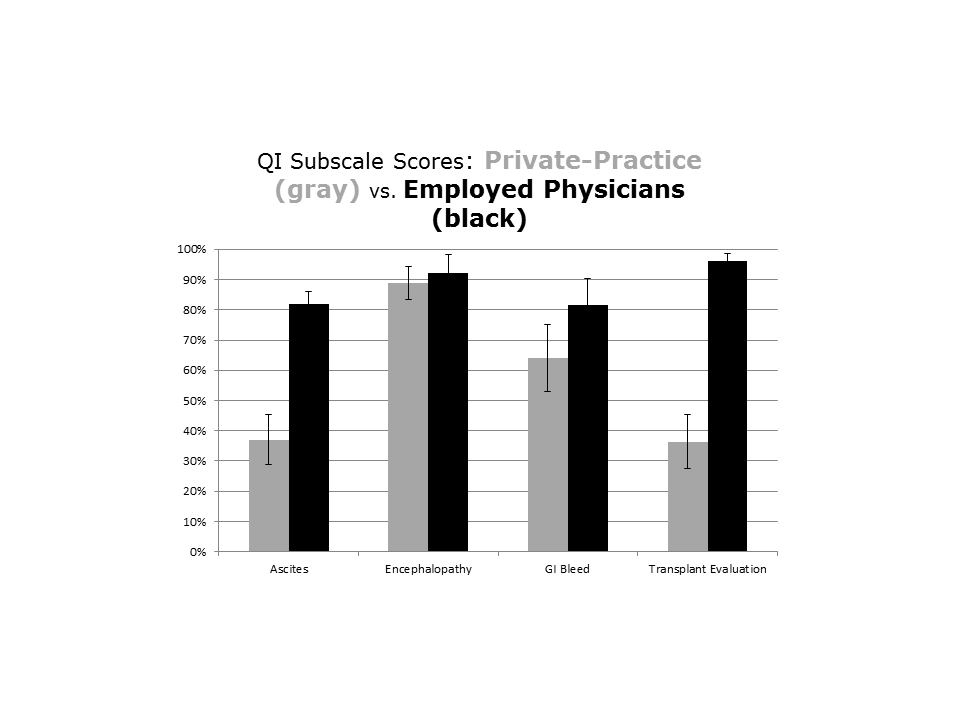
Paracentesis in Cirrhosis Patients/
Ascites is the most common complication of cirrhosis leading to hospital admission.[1] Approximately 12% of hospitalized patients who present with decompensated cirrhosis and ascites have spontaneous bacterial peritonitis (SBP); half of these patients do not present with abdominal pain, fever, nausea, or vomiting.[2] Guidelines published by the American Association for the Study of Liver Diseases (AASLD) recommend paracentesis for all hospitalized patients with cirrhosis and ascites and also recommend long‐term antibiotic prophylaxis for survivors of an SBP episode.[3] Despite evidence that in‐hospital mortality is reduced in those patients who receive paracentesis in a timely manner,[4, 5] only 40% to 60% of eligible patients receive paracentesis.[4, 6, 7] We aimed to describe clinical predictors of paracentesis and use of antibiotics following an episode of SBP in patients with decompensated cirrhosis and ascites.
METHODS
We conducted a retrospective cohort study of adults admitted to a single tertiary care center between January 1, 2009 and December 31, 2009.7 We included patients with an International Classification of Diseases, Ninth Revision discharge code consistent with decompensated cirrhosis who met clinical criteria for decompensated cirrhosis (see
RESULTS
We identified 193 admissions for 103 patients with decompensated cirrhosis and ascites (Table 1). Of these, 41% (80/193) received diagnostic paracentesis. Mean/standard deviation for age was 53.6/12.4 years; 71% of patients were male and 63% were English speaking. Common comorbidities included diabetes mellitus (33%), psychiatric diagnosis (29%), substance abuse (18%), and renal failure (17%). Excluding SBP, 31% of patients had another documented infection. Gastroenterology was consulted in 50% of the admissions. Fever was present in 27% of patients, elevated white blood cell (WBC) count (ie, WBC >11 k/mm3) was present in 27% of patients, International Normalized Ratio (INR) was elevated (>1.1) in 92% of patients, and 16% of patients had a platelet count of <50,000/mm3. Patients who received paracentesis were less likely to have a fever on presentation (19% vs 32%, P=0.06), low (ie, <50,000/mm3) platelet count (11% vs 19%, P=0.14), or concurrent gastrointestinal (GI) bleed (6% vs 16%, P=0.05). In a multiple logistic regression model including characteristics associated at P0.2 with paracentesis, fever, low platelet count, and concurrent GI bleeding were associated with decreased odds of receiving paracentesis (Appendix 1).
| Overall, N=193, Mean/SD or N (%)* | Paracentesis (), n=113, Mean/SD or N (%) | Paracentesis (+), n=80, Mean/SD or N (%) | Odds Ratio (95% CI) | |
|---|---|---|---|---|
| ||||
| Age, y | 53.6/12.4 | 54.1/13.4 | 53.2/11.7 | 1.00 (0.981.03) |
| Sex (male) | 137 (71.0%) | 78 (69.0%) | 59 (73.8%) | 1.26 (0.672.39) |
| English speaking | 122 (63.2%) | 69 (61.1%) | 53 (66.3%) | 1.25 (0.692.28) |
| Etiology | ||||
| Alcohol | 120 (62.2%) | 74 (65.5%) | 46 (57.5%) | 0.71 (0.401.29) |
| Hepatitis C | 94 (48.7%) | 57 (50.4%) | 37 (46.3%) | 0.85 (0.481.50) |
| Hepatitis B | 16 (8.3%) | 7 (6.2%) | 9 (11.3%) | 1.92 (0.685.39) |
| NASH | 8 (4.2%) | 4 (3.5%) | 4 (5.0%) | 1.43 (0.355.91) |
| Cryptogenic | 11 (5.7%) | 6 (5.3%) | 5 (6.3%) | 1.19 (0.354.04) |
| Comorbidities | ||||
| Substance abuse | 34 (17.6%) | 22 (19.5%) | 12 (15.0%) | 0.73 (0.341.58) |
| Psychiatric diagnosis | 55 (28.5%) | 38 (33.6%) | 17 (21.3%) | 0.53 (0.271.03) |
| Diabetes mellitus | 63 (32.6%) | 37 (32.7%) | 26 (32.5%) | 0.99 (0.541.82) |
| Renal failure | 33 (17.1%) | 20 (17.7%) | 13 (16.3%) | 0.90 (0.421.94) |
| GI bleed | 23 (11.9%) | 18 (15.9%) | 5 (6.3%) | 0.35 (0.120.99) |
| Admission MELD | 17.3/7.3 | 17.5/7.3 | 17.0/7.3 | 0.99 (0.951.03) |
| Creatinine, median/IQR | 0.9/0.7 | 0.9/0.7 | 0.9/0.8 | 1.02 (0.821.27) |
| Gastroenterology consult | 97 (50.3%) | 46 (40.7%) | 51 (63.8%) | 2.56 (1.424.63) |
| Infection, UTI, pneumonia, other | 60 (31.1%) | 38 (33.6%) | 22 (27.5%) | 0.75 (0.401.40) |
| Temperature 100.4F | 49 (26.8%) | 34 (32.4%) | 15 (19.2%) | 0.50 (0.251.00) |
| WBC >11 k/mm3 | 50 (27.3%) | 28 (26.7%) | 22 (28.2%) | 1.08 (0.562.08) |
| WBC <4 k/mm3 | 43 (23.5%) | 23 (21.9%) | 20 (25.6%) | 1.23 (0.622.44) |
| INR >1.1 | 149 (92.0%) | 83 (93.3%) | 66 (90.4%) | 0.68 (0.222.13) |
| Highest temperature, F | 98.9/1.1 | 99.1/1.3 | 98.8/0.8 | 0.82 (0.621.09) |
| Highest HR | 98.2/20.4 | 97.4/22.4 | 99.2/17.4 | 1.00 (0.991.02) |
| Highest RR | 24.5/13.7 | 25.2/16.8 | 23.5/7.8 | 0.99 (0.961.02) |
| Lowest SBP | 101.0/20.0 | 99.4/20.3 | 102.2/19.7 | 0.99 (0.981.01) |
| Lowest MAP | 73.0/12.2 | 73.2/13.3 | 72.7/10.6 | 1.00 (0.971.02) |
| Lowest O2Sat | 92.6/13.6 | 91.0/17.7 | 94.9/2.8 | 1.04 (0.991.10) |
| Highest PT | 15.8/3.8 | 15.9/3.7 | 15.7/3.9 | 0.98 (0.901.08) |
| Platelets 50 k/mm3 | 30 (15.9%) | 21 (19.3%) | 9 (11.3%) | 0.53 (0.231.23) |
Of the patients who received paracentesis (n=80), 14% were diagnosed with SBP. Of these, 55% received prophylaxis on discharge. Among the patients who did not receive paracentesis (n=113), 38 (34%) received antibiotics for another documented infection (eg, pneumonia), and 25 patients (22%) received antibiotics with no other documented infection or evidence of variceal bleeding. Of these 25 patients who were presumed to be empirically treated for SBP (Figure 1), only 20% were prescribed prophylactic antibiotics on discharge.

CONCLUSION
We found that many patients with decompensated cirrhosis and ascites did not receive paracentesis when hospitalized, which is similar to previously published data.[4, 6, 7] Clinical evidence of infection, such as fever or elevated WBC count, did not increase the odds of receiving paracentesis. Many patients treated for SBP were not discharged on prophylaxis.
This study is limited by its small single‐center design. We could only use data from 1 year (2009), because study data collection was part of a quality‐improvement project that took place for that year only. We did not adjust for the number of red blood cells in the ascitic fluid samples. We were also unable to determine the timing of gastroenterology consultation (whether it was done prior to paracentesis), admission venue (floor vs intensive care), or patient history of SBP.
Despite these limitations, there are important implications. First, the decision to perform paracentesis was not associated with symptoms of infection, although some clinical factors (eg, low platelets or GI bleeding) were associated with reduced odds of receiving paracentesis. Second, a majority of patients treated for SBP did not receive prophylactic antibiotics at discharge. These findings suggest a clear opportunity to increase awareness and acceptance of AASLD guidelines among hospital medicine practitioners. Quality‐improvement efforts should focus on the education of providers, and future research should identify barriers to paracentesis at both the practitioner and system levels (eg, availability of interventional radiology). Checklists or decision support within electronic order entry systems may also help reduce the low rates of paracentesis seen in our and prior studies.[4, 6, 7]
Disclosures: Dr. Lagu is supported by the National Heart, Lung, and Blood Institute of the National Institutes of Health under award number K01HL114745. Drs. Lagu, Ghaoui, and Brooling had full access to all of the data in the study. They take responsibility for the integrity of the data and the accuracy of the data analysis. Drs. Lagu, Ghaoui, and Brooling conceived of the study. Dr. Ghaoui acquired the data. Ms. Friderici carried out the statistical analyses. Drs. Lagu, Ghaoui, Brooling, Lindenauer, and Ms. Friderici analyzed and interpreted the data, drafted the manuscript, and critically reviewed the manuscript for important intellectual content. The authors report no conflicts of interest.
- , , , , ; Spanish Collaborative Study Group On Therapeutic Management In Liver Disease. Multicenter hospital study on prescribing patterns for prophylaxis and treatment of complications of cirrhosis. Eur J Clin Pharmacol. 2002;58(6):435–440.
- , , , et al. Bacterial infection in patients with advanced cirrhosis: a multicentre prospective study. Dig Liver Dis. 2001;33(1):41–48.
- , AASLD. Introduction to the revised American Association for the Study of Liver Diseases Practice Guideline management of adult patients with ascites due to cirrhosis 2012. Hepatology. 2013;57(4):1651–1653.
- , , , . Paracentesis is associated with reduced mortality in patients hospitalized with cirrhosis and ascites. Clin Gastroenterol Hepatol. 2014;12(3):496–503.e1.
- , , , et al. Delayed paracentesis is associated with increased in‐hospital mortality in patients with spontaneous bacterial peritonitis. Am J Gastroenterol. 2014;109(9):1436–1442.
- , , , et al. The quality of care provided to patients with cirrhosis and ascites in the Department of Veterans Affairs. Gastroenterology. 2012;143(1):70–77.
- , , , , , . Measurement of the quality of care of patients admitted with decompensated cirrhosis. Liver Int. 2014;34(2):204–210.
Ascites is the most common complication of cirrhosis leading to hospital admission.[1] Approximately 12% of hospitalized patients who present with decompensated cirrhosis and ascites have spontaneous bacterial peritonitis (SBP); half of these patients do not present with abdominal pain, fever, nausea, or vomiting.[2] Guidelines published by the American Association for the Study of Liver Diseases (AASLD) recommend paracentesis for all hospitalized patients with cirrhosis and ascites and also recommend long‐term antibiotic prophylaxis for survivors of an SBP episode.[3] Despite evidence that in‐hospital mortality is reduced in those patients who receive paracentesis in a timely manner,[4, 5] only 40% to 60% of eligible patients receive paracentesis.[4, 6, 7] We aimed to describe clinical predictors of paracentesis and use of antibiotics following an episode of SBP in patients with decompensated cirrhosis and ascites.
METHODS
We conducted a retrospective cohort study of adults admitted to a single tertiary care center between January 1, 2009 and December 31, 2009.7 We included patients with an International Classification of Diseases, Ninth Revision discharge code consistent with decompensated cirrhosis who met clinical criteria for decompensated cirrhosis (see
RESULTS
We identified 193 admissions for 103 patients with decompensated cirrhosis and ascites (Table 1). Of these, 41% (80/193) received diagnostic paracentesis. Mean/standard deviation for age was 53.6/12.4 years; 71% of patients were male and 63% were English speaking. Common comorbidities included diabetes mellitus (33%), psychiatric diagnosis (29%), substance abuse (18%), and renal failure (17%). Excluding SBP, 31% of patients had another documented infection. Gastroenterology was consulted in 50% of the admissions. Fever was present in 27% of patients, elevated white blood cell (WBC) count (ie, WBC >11 k/mm3) was present in 27% of patients, International Normalized Ratio (INR) was elevated (>1.1) in 92% of patients, and 16% of patients had a platelet count of <50,000/mm3. Patients who received paracentesis were less likely to have a fever on presentation (19% vs 32%, P=0.06), low (ie, <50,000/mm3) platelet count (11% vs 19%, P=0.14), or concurrent gastrointestinal (GI) bleed (6% vs 16%, P=0.05). In a multiple logistic regression model including characteristics associated at P0.2 with paracentesis, fever, low platelet count, and concurrent GI bleeding were associated with decreased odds of receiving paracentesis (Appendix 1).
| Overall, N=193, Mean/SD or N (%)* | Paracentesis (), n=113, Mean/SD or N (%) | Paracentesis (+), n=80, Mean/SD or N (%) | Odds Ratio (95% CI) | |
|---|---|---|---|---|
| ||||
| Age, y | 53.6/12.4 | 54.1/13.4 | 53.2/11.7 | 1.00 (0.981.03) |
| Sex (male) | 137 (71.0%) | 78 (69.0%) | 59 (73.8%) | 1.26 (0.672.39) |
| English speaking | 122 (63.2%) | 69 (61.1%) | 53 (66.3%) | 1.25 (0.692.28) |
| Etiology | ||||
| Alcohol | 120 (62.2%) | 74 (65.5%) | 46 (57.5%) | 0.71 (0.401.29) |
| Hepatitis C | 94 (48.7%) | 57 (50.4%) | 37 (46.3%) | 0.85 (0.481.50) |
| Hepatitis B | 16 (8.3%) | 7 (6.2%) | 9 (11.3%) | 1.92 (0.685.39) |
| NASH | 8 (4.2%) | 4 (3.5%) | 4 (5.0%) | 1.43 (0.355.91) |
| Cryptogenic | 11 (5.7%) | 6 (5.3%) | 5 (6.3%) | 1.19 (0.354.04) |
| Comorbidities | ||||
| Substance abuse | 34 (17.6%) | 22 (19.5%) | 12 (15.0%) | 0.73 (0.341.58) |
| Psychiatric diagnosis | 55 (28.5%) | 38 (33.6%) | 17 (21.3%) | 0.53 (0.271.03) |
| Diabetes mellitus | 63 (32.6%) | 37 (32.7%) | 26 (32.5%) | 0.99 (0.541.82) |
| Renal failure | 33 (17.1%) | 20 (17.7%) | 13 (16.3%) | 0.90 (0.421.94) |
| GI bleed | 23 (11.9%) | 18 (15.9%) | 5 (6.3%) | 0.35 (0.120.99) |
| Admission MELD | 17.3/7.3 | 17.5/7.3 | 17.0/7.3 | 0.99 (0.951.03) |
| Creatinine, median/IQR | 0.9/0.7 | 0.9/0.7 | 0.9/0.8 | 1.02 (0.821.27) |
| Gastroenterology consult | 97 (50.3%) | 46 (40.7%) | 51 (63.8%) | 2.56 (1.424.63) |
| Infection, UTI, pneumonia, other | 60 (31.1%) | 38 (33.6%) | 22 (27.5%) | 0.75 (0.401.40) |
| Temperature 100.4F | 49 (26.8%) | 34 (32.4%) | 15 (19.2%) | 0.50 (0.251.00) |
| WBC >11 k/mm3 | 50 (27.3%) | 28 (26.7%) | 22 (28.2%) | 1.08 (0.562.08) |
| WBC <4 k/mm3 | 43 (23.5%) | 23 (21.9%) | 20 (25.6%) | 1.23 (0.622.44) |
| INR >1.1 | 149 (92.0%) | 83 (93.3%) | 66 (90.4%) | 0.68 (0.222.13) |
| Highest temperature, F | 98.9/1.1 | 99.1/1.3 | 98.8/0.8 | 0.82 (0.621.09) |
| Highest HR | 98.2/20.4 | 97.4/22.4 | 99.2/17.4 | 1.00 (0.991.02) |
| Highest RR | 24.5/13.7 | 25.2/16.8 | 23.5/7.8 | 0.99 (0.961.02) |
| Lowest SBP | 101.0/20.0 | 99.4/20.3 | 102.2/19.7 | 0.99 (0.981.01) |
| Lowest MAP | 73.0/12.2 | 73.2/13.3 | 72.7/10.6 | 1.00 (0.971.02) |
| Lowest O2Sat | 92.6/13.6 | 91.0/17.7 | 94.9/2.8 | 1.04 (0.991.10) |
| Highest PT | 15.8/3.8 | 15.9/3.7 | 15.7/3.9 | 0.98 (0.901.08) |
| Platelets 50 k/mm3 | 30 (15.9%) | 21 (19.3%) | 9 (11.3%) | 0.53 (0.231.23) |
Of the patients who received paracentesis (n=80), 14% were diagnosed with SBP. Of these, 55% received prophylaxis on discharge. Among the patients who did not receive paracentesis (n=113), 38 (34%) received antibiotics for another documented infection (eg, pneumonia), and 25 patients (22%) received antibiotics with no other documented infection or evidence of variceal bleeding. Of these 25 patients who were presumed to be empirically treated for SBP (Figure 1), only 20% were prescribed prophylactic antibiotics on discharge.
CONCLUSION
We found that many patients with decompensated cirrhosis and ascites did not receive paracentesis when hospitalized, which is similar to previously published data.[4, 6, 7] Clinical evidence of infection, such as fever or elevated WBC count, did not increase the odds of receiving paracentesis. Many patients treated for SBP were not discharged on prophylaxis.
This study is limited by its small single‐center design. We could only use data from 1 year (2009), because study data collection was part of a quality‐improvement project that took place for that year only. We did not adjust for the number of red blood cells in the ascitic fluid samples. We were also unable to determine the timing of gastroenterology consultation (whether it was done prior to paracentesis), admission venue (floor vs intensive care), or patient history of SBP.
Despite these limitations, there are important implications. First, the decision to perform paracentesis was not associated with symptoms of infection, although some clinical factors (eg, low platelets or GI bleeding) were associated with reduced odds of receiving paracentesis. Second, a majority of patients treated for SBP did not receive prophylactic antibiotics at discharge. These findings suggest a clear opportunity to increase awareness and acceptance of AASLD guidelines among hospital medicine practitioners. Quality‐improvement efforts should focus on the education of providers, and future research should identify barriers to paracentesis at both the practitioner and system levels (eg, availability of interventional radiology). Checklists or decision support within electronic order entry systems may also help reduce the low rates of paracentesis seen in our and prior studies.[4, 6, 7]
Disclosures: Dr. Lagu is supported by the National Heart, Lung, and Blood Institute of the National Institutes of Health under award number K01HL114745. Drs. Lagu, Ghaoui, and Brooling had full access to all of the data in the study. They take responsibility for the integrity of the data and the accuracy of the data analysis. Drs. Lagu, Ghaoui, and Brooling conceived of the study. Dr. Ghaoui acquired the data. Ms. Friderici carried out the statistical analyses. Drs. Lagu, Ghaoui, Brooling, Lindenauer, and Ms. Friderici analyzed and interpreted the data, drafted the manuscript, and critically reviewed the manuscript for important intellectual content. The authors report no conflicts of interest.
- , , , , ; Spanish Collaborative Study Group On Therapeutic Management In Liver Disease. Multicenter hospital study on prescribing patterns for prophylaxis and treatment of complications of cirrhosis. Eur J Clin Pharmacol. 2002;58(6):435–440.
- , , , et al. Bacterial infection in patients with advanced cirrhosis: a multicentre prospective study. Dig Liver Dis. 2001;33(1):41–48.
- , AASLD. Introduction to the revised American Association for the Study of Liver Diseases Practice Guideline management of adult patients with ascites due to cirrhosis 2012. Hepatology. 2013;57(4):1651–1653.
- , , , . Paracentesis is associated with reduced mortality in patients hospitalized with cirrhosis and ascites. Clin Gastroenterol Hepatol. 2014;12(3):496–503.e1.
- , , , et al. Delayed paracentesis is associated with increased in‐hospital mortality in patients with spontaneous bacterial peritonitis. Am J Gastroenterol. 2014;109(9):1436–1442.
- , , , et al. The quality of care provided to patients with cirrhosis and ascites in the Department of Veterans Affairs. Gastroenterology. 2012;143(1):70–77.
- , , , , , . Measurement of the quality of care of patients admitted with decompensated cirrhosis. Liver Int. 2014;34(2):204–210.
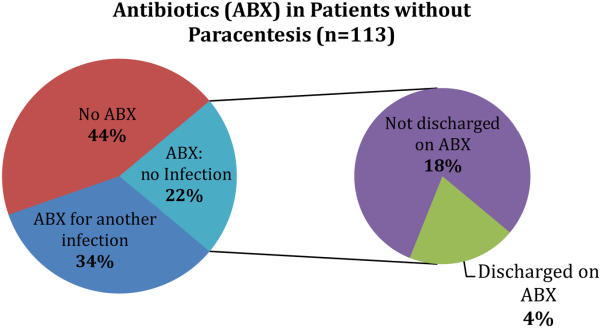
Implementing an RRT
In‐hospital cardiopulmonary arrests are often preceded by signs of clinical instability, such as changes in vital signs or mental status.1 Nearly 85% of patients who suffer from cardiopulmonary arrests have documented observations of deterioration in the 8 hours before arrest.2 A Medical Emergency Team (MET), sometimes known as Rapid Response Team (RRT), can rapidly assess and manage unstable patients, with the goal that early intervention will prevent adverse outcomes. In 2004, the Institute for Healthcare Improvement (IHI), as part of its 100,000 Lives Campaign, called for hospitals to implement rapid response systems as 1 of 6 strategies to reduce deaths in hospital.3 Since this recommendation, hundreds of hospitals in the United States have invested substantial financial and personnel resources to implement some form of a rapid response system, which is comprised of a varying array of healthcare providers who bring critical care expertise to the patient's bedside.4, 5
Despite the intuitive appeal of the approach, and early observational data which suggested that METs could reduce both codes and unexpected in‐hospital mortality,2, 6 the largest randomized controlled trial found that METs failed to reduce unplanned intensive care unit (ICU) admissions, cardiac arrests, or unexpected deaths.7 More recently, in a prospective observational cohort study at 1 US hospital, Chan et al. found that a nurse‐led RRT did not impact hospital‐wide code rates or mortality.4
The study of rapid response systems is further complicated by a lack of standard definition, and the many types of hospitals in which they may be implemented. In 2006, a consensus conference suggested that MET be used to refer to teams led by physicians (usually intensivists), and RRT be used for teams led by nurses.8 Many studies have been conducted at non‐US institutions, and follow‐up periods have generally been 1 year or less. We report on almost 4 years of experience with a hospitalist‐led MET implemented in a major US academic medical center, and examine the subsequent changes in code calls, cardiac arrests, deaths following cardiopulmonary resuscitation, and overall hospital mortality. Because the MET did not operate in the critical care units, and because cardiac arrest may occur without prior signs of deterioration, we hypothesized that implementation of the MET would correspond to a small drop in total code calls, no change in codes called inside of critical care units, no change in cardiac arrest outside of critical care, and a marked drop in other medical crises (mostly respiratory distress) outside critical care. We also hypothesized that there would be no change in the rate of fatal codes, because most deaths occur in patients who were found to be pulseless on arrival of the code team.
METHODS
Setting
Beginning in March 2006, Baystate Medical Center implemented an MET in accordance with the recommendations of the IHI. Baystate is a 670‐bed tertiary care referral center in Springfield, Massachusetts, and a major teaching hospital for Tufts University. Throughout the study period, the hospital had full‐time intensivists and >90% of medical patients were cared for by hospitalists with 24‐hour coverage. As a result, a medical patient's attending physician or corresponding coverage was usually on site. In order to promote acceptance of the team as well as to maximize continuity of care, we constructed our MET to include a critical care nurse, a respiratory therapist, intravenous therapist, and the patient's physician (either attending or resident). Baystate staff members carry alpha‐numeric pagers, so attendings could be alerted to the fact that the MET had been activated by means of a text page. In the event that the patient's physician could not respond, an ICU physician served as a backup team member. The MET was implemented initially in March of 2006 on 2 medical floors, and over a period of 3 months was gradually expanded to cover the entire hospital. For surgical patients, the MET was led by the attending surgeon or appropriate resident. Educational efforts, including meetings, e‐mails, and posters, targeted nurses in particular, but anyone could summon the MET by calling the activation number posted on all ward telephones. Nurses were encouraged to activate the system for any of the following: heart rate (<40 and >130 beats per minute), systolic blood pressure (<90 mmHg), respiratory rate (<8 or >24 per minute), oxygen saturation (<90% despite supplemental oxygen), altered mental status, or simply concern that something is wrong. The MET implementation oversight committee met biweekly and made adjustments to the team composition and protocols using rapid Plan Do Study Act (PDSA) cycles. A full description of the implementation process has been published elsewhere.9
In addition to the MET, Baystate has a separate code team which can be activated for cardiovascular arrests via a call to a designated phone extension, which activates a page to the code team members and an overhead announcement. Code team members include the ICU medical resident and intern, a critical care nurse, an anesthesiologist, a respiratory therapist, a staff nurse, and the house supervisor. In response to the overhead announcement, doctors, nurses and students in the vicinity often respond as well. Prior to implementation of the MET, a code blue was the only level of immediate response available.
Data and Outcomes
The nurse attending a code blue or code completes a report form which becomes part of the permanent medical record. A copy of the report is reviewed by the Division of Healthcare Quality and housed in the Critical Care administrative offices. For this study, we reviewed all code reports from January 2004 through December 2009. For each report, we extracted the following information: the date, location (inside or outside of a critical care unit), whether the patient had a pulse on arrival of the team, and whether the patient survived to discharge. All activations of the code system were included, regardless of the patient's code status (ie, even if the code was called in error) or the reason for the code call. Patients were then aggregated to calculate the rate of codes called per calendar quarter, as well as the rates of codes called in and out of critical care and the rates of two subsets of code calls, namely cardiac arrests and other medical crises (eg, respiratory arrest or seizures).
MET members were also required to collect data on the reason for the MET call, as well as the response time, time of day and unit, duration of the call, whether the physician was present, whether the patient was transferred to critical care, and whether the patient survived to discharge. In addition, we surveyed the nursing staff directly after the call, asking the following questions: 1) Did the team arrive promptly? 2) Were the critical care nurse and respiratory therapist efficient and respectful? 3) Did you feel the patient's needs were addressed appropriately? 4) Did you feel supported by the MET? and 5) Would you call the MET again?
Statistical Analysis
Quarterly event rates per 1000 admissions were calculated for each outcome. Event rates were compared using piecewise Poisson regression10 with robust standard errors.11 We excluded the 2 quarterly periods (2006 Q1 and Q2) during which the MET was implemented. A piecewise Poisson regression model was chosen to facilitate estimation of: 1) change in code calls from immediately before implementation to immediately after; and 2) temporal trends in code calls before and after implementation. Each model was built with 1 pre‐implementation intercept (December 2005), and 1 post‐implementation intercept (July 2006), as well as 2 slopes, with time coded negatively before the intervention (ie, 2, 1, 0), and positively after (ie, 0, 1, 2). Linear contrasts tested for differences in each parameter. A significant difference in intercepts suggests a post‐intervention decrease in code call rates; a significant, negative post‐intervention slope suggests continuing decline in code call rates. Statistical inferences were aided with visual plots of predicted incidence rates for each quarter in the observation period, with 95% confidence intervals (CI) for each quarterly rate estimated by the delta method.12 Alpha was specified at 0.05 and all significance tests were 2‐sided. Analyses were conducted in Stata 11.1 for Windows ( 2010, StataCorp LP, College Station, TX).
RESULTS
Implementation of the MET
The MET was introduced in the first and second quarters of 2006, with 2717 calls logged through the end of 2009 (out of 154,382 admissions). The rate of MET calls increased during the first 6 months of implementation from 5.95 per 1000 admissions in the first quarter of the intervention, to 15.8 calls per 1000 admissions in the second quarter. Call rates peaked in the first half of 2009, at 20.9 calls per 1000 admissions, leveling off to 17.9 calls per 1000 admissions in the last half of 2009 (Figure 1). Of calls with time recorded, 40% occurred on the day shift, 35% on the evening shift, and 25% on the night shift. The most common reason to call the MET was respiratory distress (33%), followed by cardiovascular instability (25%), and neurological abnormality (20%). In 15% of cases, concern about a patient's condition prompted the nurse to call. Calls came primarily from medical floors (75%) and surgical units (20%). The median response time was 4 minutes (interquartile range [IQR], 2.8 to 5.2 minutes) with no meaningful trend during the study period. The median call duration was 50 minutes (IQR, 38 to 72 minutes). Again, there was no trend over time. The most common interventions were arterial blood gas, fluid resuscitation, and electrocardiogram (see Supporting Web Appendix Table 1 in the online version of this article). A physician was present at 52% of the calls in the first year, which rose to 93% of calls in the final year. Approximately 25% of calls resulted in the patient being transferred to a critical care unit. Staff evaluations were overwhelmingly positive. Nurses rated the teams on the following points: whether the critical care nurse and respiratory therapist were efficient and respectful (mean rating 98%, SD 5.6%); promptness (98%, SD 5.6%); whether the patient's needs were addressed appropriately (mean 98%, SD 4.2%); whether the nurse felt supported by the MET (99.5%, SD 1.7%); and whether they would call the MET again (99.7%, SD 1.4%).

Effect of MET on Code Calls and Mortality
Between January 2004 and December of 2009, the hospital case mix index remained constant, and there were a total of 1202 codes called. The majority (62%) took place outside of critical care units. Linear contrasts of pre‐piecewise and post‐piecewise intercepts revealed that overall code calls declined significantly between pre‐implementation and post‐implementation of the MET from 7.30 (95% CI 5.81, 9.16) codes called per 1000 admissions to 4.21 (95% CI 3.42, 5.18) calls per 1000 admissions (Figure 1; also see Supporting Web Appendix Table 2 in the online version of this article). Outside of critical care, code calls declined from 4.70 (95% CI 3.92, 5.63) before the MET was implemented to 3.11 (95% CI 2.44, 3.97) afterwards (Figure 2); this was due primarily to a decrease in medical crises, which averaged 3.29 events per 1000 admissions (95% CI 2.70, 4.02) before implementation and decreased to 1.72 (95% CI 1.28, 2.31) afterwards, whereas cardiac arrests did not change significantly (Figure 3). Following implementation, code calls within critical care also declined significantly, from 2.59 events per 1000 admissions (95% CI 1.82, 3.69) before to 1.24 events per 1000 admissions (95% CI 0.94, 1.63) afterwards. The change in codes called within critical care was smaller, however, and included reductions in both cardiac arrests ( 0.84 events, P = 0.01) and medical crises ( 0.55, P = 0.08). There was no significant change in the rate of fatal codes per 1000 admissions ( +0.06, P = 0.65) (Figure 4). Overall hospital mortality remained steady at 22.0 deaths per 1000 admissions throughout the study period.
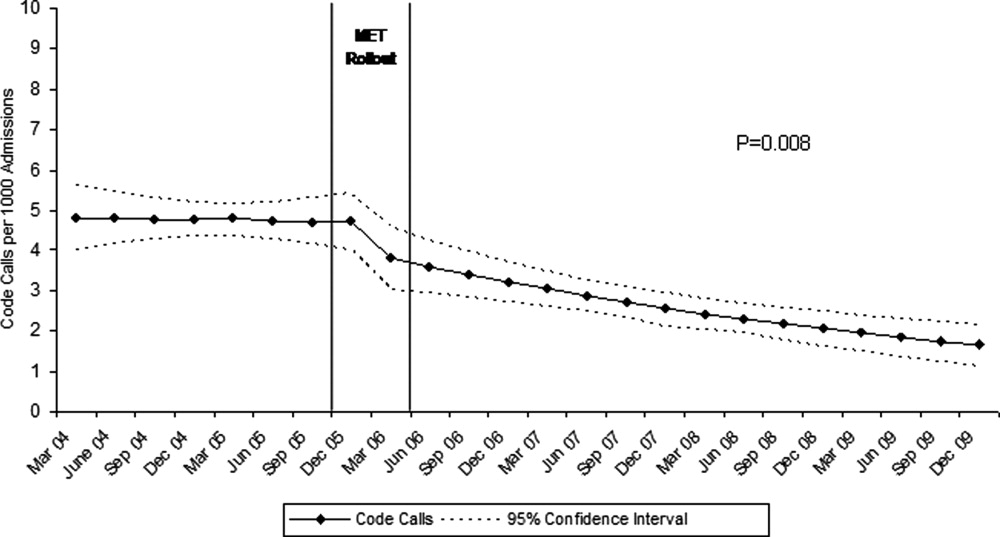
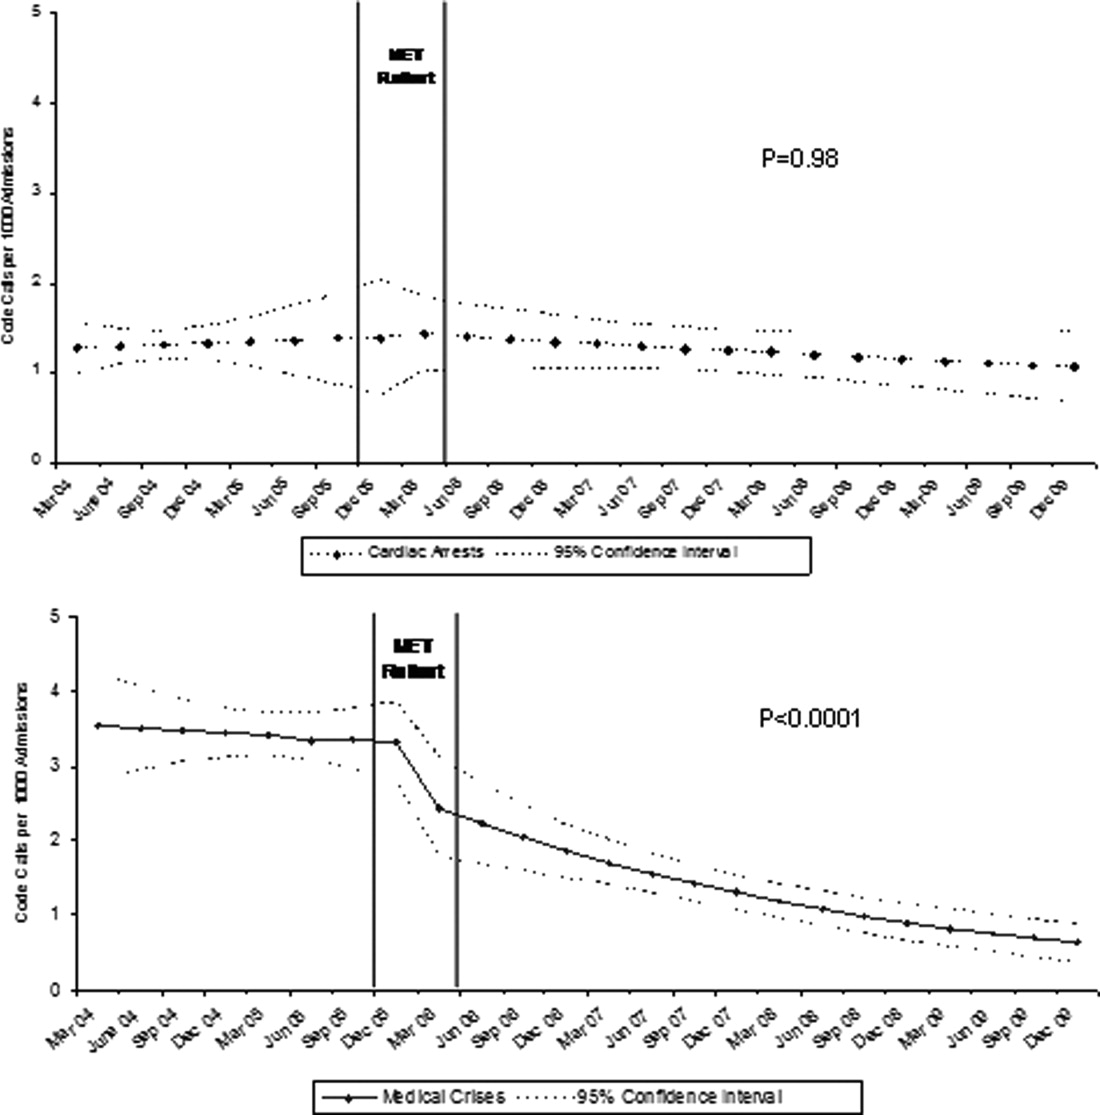
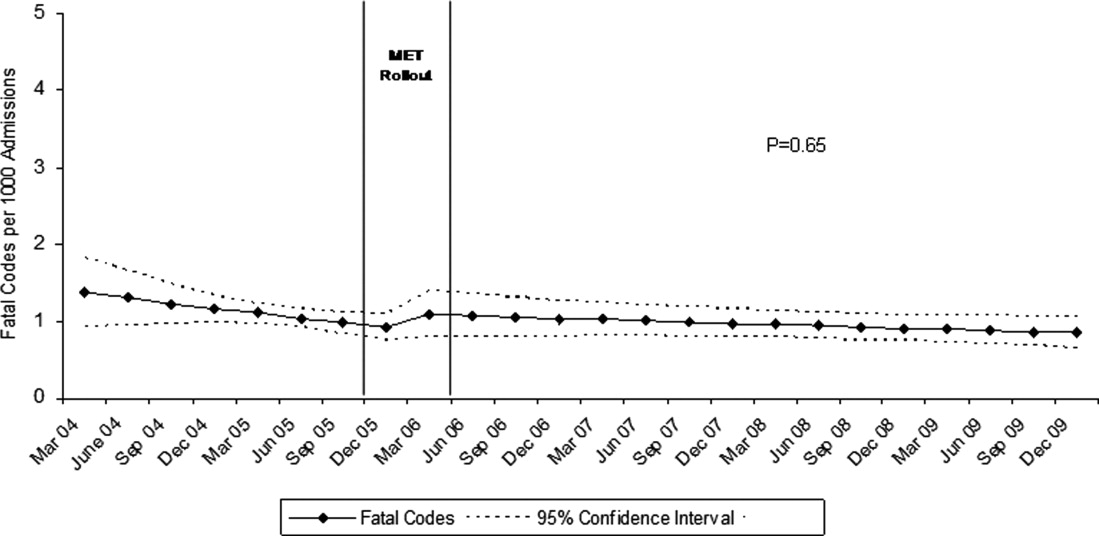
DISCUSSION
In this report, we detail the implementation of a novel hospitalist‐led medical emergency team at a large academic medical center over a period of 4 years. The team, which consisted of the patient's physician, a critical care nurse, a respiratory therapist, and an intravenous therapist, achieved full implementation within 6 months, was well received by the nursing staff, and was associated with a 42% decrease in code calls hospital‐wide. Most of the overall reduction was due to a reduction in codes called for medical crises outside of critical care, accompanied by a lesser reduction in codes called for cardiac arrests and medical crises within critical care units. There was no significant effect on the rate of cardiac arrest outside critical care. More importantly, there was no change in the rate of fatal codes or overall hospital mortality.
The idea of early intervention to prevent deterioration among hospitalized patients appeals to the concept that an ounce of prevention is worth a pound of cure. Like many other preventive interventions, rapid response systems have not always delivered on this promise. Since several early reports from Australia2 suggested that medical emergency teams could reduce not only cardiopulmonary arrests, but overall hospital mortality, there has been a rapid proliferation in their implementation, spurred on by the IHI's 100,000 Lives Campaign, which incorporated rapid response systems as one of 6 hospital‐wide interventions aimed at reducing harm and mortality.13 Subsequent randomized trials have both reproduced and refuted the early observational results. A ward‐randomized trial within 1 British hospital found a 50% reduction in hospital mortality for wards assigned to have an RRT,14 while a cluster randomized trial conducted at 23 Australian hospitals found no difference in rates of cardiac arrest or mortality between hospitals implementing METs and those continuing with usual care.7 Interestingly, in the Australian trial, the rates of cardiac arrest and mortality declined for both groups compared to historical controls, an important limitation to observational trials. Reports from single‐institution observational trials are also divided between those that found a reduction in mortality following implementation and those that did not. A recent meta‐analysis reported that there was too much heterogeneity among these trials to reach a conclusion about the benefits of rapid response systems.15
Our study adds to this literature in several ways. First, our MET design, which included the patient's physician (as opposed to an intensive care physician), was different from those previously studied. Including the patient's physician increases the team's knowledge of the patient and disease, and may improve physician acceptance of METs. In addition, our study provides 4 full years of follow‐up. Second, our rate of MET activation (18 calls/1000 admissions) was 2 to 3 times higher than that seen in most other studies,16 thus, the lack of mortality benefit was not likely the result of underuse. Third, our hospital employs a large number of hospitalists whose continuous presence might be expected to attenuate the benefits of an MET. Indeed, our initial rate of codes (7.5/1000 admissions) was similar to the post‐intervention rate in other studies.4 Nevertheless, the decrease in the overall rate of code calls following implementation of our MET was similar to that observed by others.17 Finally, our stratification of code calls inside critical care (where the MET was not deployed) and outside critical care, as well as the division of codes into cardiac arrest (where intervention is often unsuccessful) and other medical crises (primarily respiratory distress), gives further insight into how METs might work. As expected, we found that outside critical care only, codes called for medical crises declined, implying that the main effect of the MET was to provide early interventions for patients who were not likely to die anyway (eg, respiratory care for patients with respiratory distress or intravenous fluids for hypotensive patients). Instead of intervening to prevent death, MET may avoid emergent intubation by providing respiratory therapy and/or urgent intubation. In addition, it represents a less‐intense option for responding to nonlife‐threatening emergencies, such as seizures or syncope. As codes were no longer called for these types of crises, the rate of code calls necessarily fell. The reason that code calls declined inside critical care is less clear. It could be that patients transferred to critical care by the MET were less likely to code than those transferred before implementation, or the decline might be due to other factors that were not evaluated. Regardless, it is clear that the MET did not simply relocate codes to critical care units.
Our study has a number of limitations. First, it is an observational study and cannot account for other confounders relating to temporal trends in the hospital. However, our long time window allowed us to examine trends over several years. For 2 years prior to implementation of the MET, there was no decline at all in the rate of code calls, followed by an immediate and sustained drop after implementation. Other interventions, including ventilator‐associated pneumonia bundles, sepsis bundles, and advanced cardiac life support simulation training were also implemented at different times during the study period. However, the stark demarcation in code call rates coinciding with MET implementation makes it less likely that these other interventions were responsible for the observed decline. Second, our study was limited to a single institution and a single type of MET. Our findings may not apply to other types of institutions with different staffing arrangements or a different hospital culture, nor would they necessarily apply to different types of MET. Third, our nurse surveys were not collected anonymously, and this may have affected the nurses' responses. Finally, we did not collect physiological parameters on our patients, so we cannot state with certainty what the MET intervention accomplished.
Since initial studies suggested that METs could reduce hospital mortality rates, the Joint Commission has effectively mandated implementation of rapid response systems in all hospitals. Newer evidence, however, has been less convincing of mortality or other benefit. Our study adds to the literature in that we also did not find a mortality benefit. However, there were 2 clear benefits that we did identify. Our MET did appear to substantially reduce total numbers of code calls, particularly codes called for medical crises. Also, our nurses had a very positive response to the MET, which empowered them to get help for a patient when the patient's physician was unavailable or did not take their concerns seriously. Clearly, additional study is needed to better understand the effects of METs on mortality, codes, and other indicators of patient outcomes. However, in the current regulatory environment, such studies will be difficult to perform. Instead, additional studies can clarify which models deliver best outcomes and optimal use of our limited resources.
- ,,,,,.Recognising clinical instability in hospital patients before cardiac arrest or unplanned admission to intensive care. A pilot study in a tertiary‐care hospital.Med J Aust.1999;171:22–25.
- ,,, et al.Rates of in‐hospital arrests, deaths and intensive care admissions: the effect of a medical emergency team.Med J Aust.2000;173:236–240.
- ,,,.The 100,000 Lives Campaign: setting a goal and a deadline for improving health care quality.JAMA.2006;295:324–327.
- ,,,,,.Hospital‐wide code rates and mortality before and after implementation of a rapid response team.JAMA.2008;300:2506–2513.
- ,,,,.Rapid response teams: do they make a difference?Dimens Crit Care Nurs.2007;26:253–262.
- ,,,,,.Effects of a medical emergency team on reduction of incidence of and mortality from unexpected cardiac arrests in hospital: preliminary study.BMJ.2002;324:387–390.
- ,,, et al.Introduction of the medical emergency team (MET) system: a cluster‐randomised controlled trial.Lancet.2005;365:2091–2097.
- ,,, et al.Findings of the first consensus conference on medical emergency teams.Crit Care Med.2006;34:2463–2478.
- ,.Implementation of a rapid response team: a success story.Crit Care Nurse.2009;29:66–76.
- .Practical Biostatistical Methods.Belmont, CA:Wadsworth Publishing;1995.
- ,,,.Regression Methods in Biostatistics: Linear, Logistic, Survival, and Repeated Measures Models.New York:Springer Science + Business Media;2005.
- .A note on the delta method.Am Stat.1992;46:27–29.
- ,.The 100,000 Lives Campaign: crystallizing standards of care for hospitals.Health Aff.2005;24:1560–1570.
- ,,, et al.Introducing critical care outreach: a ward‐randomised trial of phased introduction in a general hospital.Intensive Care Med.2004;30:1398–404.
- ,,,,,.Rapid response systems: a systematic review.Crit Care Med.2007;35:1238–1243.
- ,,,,.Effects of rapid response systems on clinical outcomes: systematic review and meta‐analysis.J Hosp Med.2007;2:422–432.
- ,,,,.Rapid response teams: a systematic review and meta‐analysis.Arch Intern Med.2010;170:18–26.
In‐hospital cardiopulmonary arrests are often preceded by signs of clinical instability, such as changes in vital signs or mental status.1 Nearly 85% of patients who suffer from cardiopulmonary arrests have documented observations of deterioration in the 8 hours before arrest.2 A Medical Emergency Team (MET), sometimes known as Rapid Response Team (RRT), can rapidly assess and manage unstable patients, with the goal that early intervention will prevent adverse outcomes. In 2004, the Institute for Healthcare Improvement (IHI), as part of its 100,000 Lives Campaign, called for hospitals to implement rapid response systems as 1 of 6 strategies to reduce deaths in hospital.3 Since this recommendation, hundreds of hospitals in the United States have invested substantial financial and personnel resources to implement some form of a rapid response system, which is comprised of a varying array of healthcare providers who bring critical care expertise to the patient's bedside.4, 5
Despite the intuitive appeal of the approach, and early observational data which suggested that METs could reduce both codes and unexpected in‐hospital mortality,2, 6 the largest randomized controlled trial found that METs failed to reduce unplanned intensive care unit (ICU) admissions, cardiac arrests, or unexpected deaths.7 More recently, in a prospective observational cohort study at 1 US hospital, Chan et al. found that a nurse‐led RRT did not impact hospital‐wide code rates or mortality.4
The study of rapid response systems is further complicated by a lack of standard definition, and the many types of hospitals in which they may be implemented. In 2006, a consensus conference suggested that MET be used to refer to teams led by physicians (usually intensivists), and RRT be used for teams led by nurses.8 Many studies have been conducted at non‐US institutions, and follow‐up periods have generally been 1 year or less. We report on almost 4 years of experience with a hospitalist‐led MET implemented in a major US academic medical center, and examine the subsequent changes in code calls, cardiac arrests, deaths following cardiopulmonary resuscitation, and overall hospital mortality. Because the MET did not operate in the critical care units, and because cardiac arrest may occur without prior signs of deterioration, we hypothesized that implementation of the MET would correspond to a small drop in total code calls, no change in codes called inside of critical care units, no change in cardiac arrest outside of critical care, and a marked drop in other medical crises (mostly respiratory distress) outside critical care. We also hypothesized that there would be no change in the rate of fatal codes, because most deaths occur in patients who were found to be pulseless on arrival of the code team.
METHODS
Setting
Beginning in March 2006, Baystate Medical Center implemented an MET in accordance with the recommendations of the IHI. Baystate is a 670‐bed tertiary care referral center in Springfield, Massachusetts, and a major teaching hospital for Tufts University. Throughout the study period, the hospital had full‐time intensivists and >90% of medical patients were cared for by hospitalists with 24‐hour coverage. As a result, a medical patient's attending physician or corresponding coverage was usually on site. In order to promote acceptance of the team as well as to maximize continuity of care, we constructed our MET to include a critical care nurse, a respiratory therapist, intravenous therapist, and the patient's physician (either attending or resident). Baystate staff members carry alpha‐numeric pagers, so attendings could be alerted to the fact that the MET had been activated by means of a text page. In the event that the patient's physician could not respond, an ICU physician served as a backup team member. The MET was implemented initially in March of 2006 on 2 medical floors, and over a period of 3 months was gradually expanded to cover the entire hospital. For surgical patients, the MET was led by the attending surgeon or appropriate resident. Educational efforts, including meetings, e‐mails, and posters, targeted nurses in particular, but anyone could summon the MET by calling the activation number posted on all ward telephones. Nurses were encouraged to activate the system for any of the following: heart rate (<40 and >130 beats per minute), systolic blood pressure (<90 mmHg), respiratory rate (<8 or >24 per minute), oxygen saturation (<90% despite supplemental oxygen), altered mental status, or simply concern that something is wrong. The MET implementation oversight committee met biweekly and made adjustments to the team composition and protocols using rapid Plan Do Study Act (PDSA) cycles. A full description of the implementation process has been published elsewhere.9
In addition to the MET, Baystate has a separate code team which can be activated for cardiovascular arrests via a call to a designated phone extension, which activates a page to the code team members and an overhead announcement. Code team members include the ICU medical resident and intern, a critical care nurse, an anesthesiologist, a respiratory therapist, a staff nurse, and the house supervisor. In response to the overhead announcement, doctors, nurses and students in the vicinity often respond as well. Prior to implementation of the MET, a code blue was the only level of immediate response available.
Data and Outcomes
The nurse attending a code blue or code completes a report form which becomes part of the permanent medical record. A copy of the report is reviewed by the Division of Healthcare Quality and housed in the Critical Care administrative offices. For this study, we reviewed all code reports from January 2004 through December 2009. For each report, we extracted the following information: the date, location (inside or outside of a critical care unit), whether the patient had a pulse on arrival of the team, and whether the patient survived to discharge. All activations of the code system were included, regardless of the patient's code status (ie, even if the code was called in error) or the reason for the code call. Patients were then aggregated to calculate the rate of codes called per calendar quarter, as well as the rates of codes called in and out of critical care and the rates of two subsets of code calls, namely cardiac arrests and other medical crises (eg, respiratory arrest or seizures).
MET members were also required to collect data on the reason for the MET call, as well as the response time, time of day and unit, duration of the call, whether the physician was present, whether the patient was transferred to critical care, and whether the patient survived to discharge. In addition, we surveyed the nursing staff directly after the call, asking the following questions: 1) Did the team arrive promptly? 2) Were the critical care nurse and respiratory therapist efficient and respectful? 3) Did you feel the patient's needs were addressed appropriately? 4) Did you feel supported by the MET? and 5) Would you call the MET again?
Statistical Analysis
Quarterly event rates per 1000 admissions were calculated for each outcome. Event rates were compared using piecewise Poisson regression10 with robust standard errors.11 We excluded the 2 quarterly periods (2006 Q1 and Q2) during which the MET was implemented. A piecewise Poisson regression model was chosen to facilitate estimation of: 1) change in code calls from immediately before implementation to immediately after; and 2) temporal trends in code calls before and after implementation. Each model was built with 1 pre‐implementation intercept (December 2005), and 1 post‐implementation intercept (July 2006), as well as 2 slopes, with time coded negatively before the intervention (ie, 2, 1, 0), and positively after (ie, 0, 1, 2). Linear contrasts tested for differences in each parameter. A significant difference in intercepts suggests a post‐intervention decrease in code call rates; a significant, negative post‐intervention slope suggests continuing decline in code call rates. Statistical inferences were aided with visual plots of predicted incidence rates for each quarter in the observation period, with 95% confidence intervals (CI) for each quarterly rate estimated by the delta method.12 Alpha was specified at 0.05 and all significance tests were 2‐sided. Analyses were conducted in Stata 11.1 for Windows ( 2010, StataCorp LP, College Station, TX).
RESULTS
Implementation of the MET
The MET was introduced in the first and second quarters of 2006, with 2717 calls logged through the end of 2009 (out of 154,382 admissions). The rate of MET calls increased during the first 6 months of implementation from 5.95 per 1000 admissions in the first quarter of the intervention, to 15.8 calls per 1000 admissions in the second quarter. Call rates peaked in the first half of 2009, at 20.9 calls per 1000 admissions, leveling off to 17.9 calls per 1000 admissions in the last half of 2009 (Figure 1). Of calls with time recorded, 40% occurred on the day shift, 35% on the evening shift, and 25% on the night shift. The most common reason to call the MET was respiratory distress (33%), followed by cardiovascular instability (25%), and neurological abnormality (20%). In 15% of cases, concern about a patient's condition prompted the nurse to call. Calls came primarily from medical floors (75%) and surgical units (20%). The median response time was 4 minutes (interquartile range [IQR], 2.8 to 5.2 minutes) with no meaningful trend during the study period. The median call duration was 50 minutes (IQR, 38 to 72 minutes). Again, there was no trend over time. The most common interventions were arterial blood gas, fluid resuscitation, and electrocardiogram (see Supporting Web Appendix Table 1 in the online version of this article). A physician was present at 52% of the calls in the first year, which rose to 93% of calls in the final year. Approximately 25% of calls resulted in the patient being transferred to a critical care unit. Staff evaluations were overwhelmingly positive. Nurses rated the teams on the following points: whether the critical care nurse and respiratory therapist were efficient and respectful (mean rating 98%, SD 5.6%); promptness (98%, SD 5.6%); whether the patient's needs were addressed appropriately (mean 98%, SD 4.2%); whether the nurse felt supported by the MET (99.5%, SD 1.7%); and whether they would call the MET again (99.7%, SD 1.4%).
Effect of MET on Code Calls and Mortality
Between January 2004 and December of 2009, the hospital case mix index remained constant, and there were a total of 1202 codes called. The majority (62%) took place outside of critical care units. Linear contrasts of pre‐piecewise and post‐piecewise intercepts revealed that overall code calls declined significantly between pre‐implementation and post‐implementation of the MET from 7.30 (95% CI 5.81, 9.16) codes called per 1000 admissions to 4.21 (95% CI 3.42, 5.18) calls per 1000 admissions (Figure 1; also see Supporting Web Appendix Table 2 in the online version of this article). Outside of critical care, code calls declined from 4.70 (95% CI 3.92, 5.63) before the MET was implemented to 3.11 (95% CI 2.44, 3.97) afterwards (Figure 2); this was due primarily to a decrease in medical crises, which averaged 3.29 events per 1000 admissions (95% CI 2.70, 4.02) before implementation and decreased to 1.72 (95% CI 1.28, 2.31) afterwards, whereas cardiac arrests did not change significantly (Figure 3). Following implementation, code calls within critical care also declined significantly, from 2.59 events per 1000 admissions (95% CI 1.82, 3.69) before to 1.24 events per 1000 admissions (95% CI 0.94, 1.63) afterwards. The change in codes called within critical care was smaller, however, and included reductions in both cardiac arrests ( 0.84 events, P = 0.01) and medical crises ( 0.55, P = 0.08). There was no significant change in the rate of fatal codes per 1000 admissions ( +0.06, P = 0.65) (Figure 4). Overall hospital mortality remained steady at 22.0 deaths per 1000 admissions throughout the study period.
DISCUSSION
In this report, we detail the implementation of a novel hospitalist‐led medical emergency team at a large academic medical center over a period of 4 years. The team, which consisted of the patient's physician, a critical care nurse, a respiratory therapist, and an intravenous therapist, achieved full implementation within 6 months, was well received by the nursing staff, and was associated with a 42% decrease in code calls hospital‐wide. Most of the overall reduction was due to a reduction in codes called for medical crises outside of critical care, accompanied by a lesser reduction in codes called for cardiac arrests and medical crises within critical care units. There was no significant effect on the rate of cardiac arrest outside critical care. More importantly, there was no change in the rate of fatal codes or overall hospital mortality.
The idea of early intervention to prevent deterioration among hospitalized patients appeals to the concept that an ounce of prevention is worth a pound of cure. Like many other preventive interventions, rapid response systems have not always delivered on this promise. Since several early reports from Australia2 suggested that medical emergency teams could reduce not only cardiopulmonary arrests, but overall hospital mortality, there has been a rapid proliferation in their implementation, spurred on by the IHI's 100,000 Lives Campaign, which incorporated rapid response systems as one of 6 hospital‐wide interventions aimed at reducing harm and mortality.13 Subsequent randomized trials have both reproduced and refuted the early observational results. A ward‐randomized trial within 1 British hospital found a 50% reduction in hospital mortality for wards assigned to have an RRT,14 while a cluster randomized trial conducted at 23 Australian hospitals found no difference in rates of cardiac arrest or mortality between hospitals implementing METs and those continuing with usual care.7 Interestingly, in the Australian trial, the rates of cardiac arrest and mortality declined for both groups compared to historical controls, an important limitation to observational trials. Reports from single‐institution observational trials are also divided between those that found a reduction in mortality following implementation and those that did not. A recent meta‐analysis reported that there was too much heterogeneity among these trials to reach a conclusion about the benefits of rapid response systems.15
Our study adds to this literature in several ways. First, our MET design, which included the patient's physician (as opposed to an intensive care physician), was different from those previously studied. Including the patient's physician increases the team's knowledge of the patient and disease, and may improve physician acceptance of METs. In addition, our study provides 4 full years of follow‐up. Second, our rate of MET activation (18 calls/1000 admissions) was 2 to 3 times higher than that seen in most other studies,16 thus, the lack of mortality benefit was not likely the result of underuse. Third, our hospital employs a large number of hospitalists whose continuous presence might be expected to attenuate the benefits of an MET. Indeed, our initial rate of codes (7.5/1000 admissions) was similar to the post‐intervention rate in other studies.4 Nevertheless, the decrease in the overall rate of code calls following implementation of our MET was similar to that observed by others.17 Finally, our stratification of code calls inside critical care (where the MET was not deployed) and outside critical care, as well as the division of codes into cardiac arrest (where intervention is often unsuccessful) and other medical crises (primarily respiratory distress), gives further insight into how METs might work. As expected, we found that outside critical care only, codes called for medical crises declined, implying that the main effect of the MET was to provide early interventions for patients who were not likely to die anyway (eg, respiratory care for patients with respiratory distress or intravenous fluids for hypotensive patients). Instead of intervening to prevent death, MET may avoid emergent intubation by providing respiratory therapy and/or urgent intubation. In addition, it represents a less‐intense option for responding to nonlife‐threatening emergencies, such as seizures or syncope. As codes were no longer called for these types of crises, the rate of code calls necessarily fell. The reason that code calls declined inside critical care is less clear. It could be that patients transferred to critical care by the MET were less likely to code than those transferred before implementation, or the decline might be due to other factors that were not evaluated. Regardless, it is clear that the MET did not simply relocate codes to critical care units.
Our study has a number of limitations. First, it is an observational study and cannot account for other confounders relating to temporal trends in the hospital. However, our long time window allowed us to examine trends over several years. For 2 years prior to implementation of the MET, there was no decline at all in the rate of code calls, followed by an immediate and sustained drop after implementation. Other interventions, including ventilator‐associated pneumonia bundles, sepsis bundles, and advanced cardiac life support simulation training were also implemented at different times during the study period. However, the stark demarcation in code call rates coinciding with MET implementation makes it less likely that these other interventions were responsible for the observed decline. Second, our study was limited to a single institution and a single type of MET. Our findings may not apply to other types of institutions with different staffing arrangements or a different hospital culture, nor would they necessarily apply to different types of MET. Third, our nurse surveys were not collected anonymously, and this may have affected the nurses' responses. Finally, we did not collect physiological parameters on our patients, so we cannot state with certainty what the MET intervention accomplished.
Since initial studies suggested that METs could reduce hospital mortality rates, the Joint Commission has effectively mandated implementation of rapid response systems in all hospitals. Newer evidence, however, has been less convincing of mortality or other benefit. Our study adds to the literature in that we also did not find a mortality benefit. However, there were 2 clear benefits that we did identify. Our MET did appear to substantially reduce total numbers of code calls, particularly codes called for medical crises. Also, our nurses had a very positive response to the MET, which empowered them to get help for a patient when the patient's physician was unavailable or did not take their concerns seriously. Clearly, additional study is needed to better understand the effects of METs on mortality, codes, and other indicators of patient outcomes. However, in the current regulatory environment, such studies will be difficult to perform. Instead, additional studies can clarify which models deliver best outcomes and optimal use of our limited resources.
- ,,,,,.Recognising clinical instability in hospital patients before cardiac arrest or unplanned admission to intensive care. A pilot study in a tertiary‐care hospital.Med J Aust.1999;171:22–25.
- ,,, et al.Rates of in‐hospital arrests, deaths and intensive care admissions: the effect of a medical emergency team.Med J Aust.2000;173:236–240.
- ,,,.The 100,000 Lives Campaign: setting a goal and a deadline for improving health care quality.JAMA.2006;295:324–327.
- ,,,,,.Hospital‐wide code rates and mortality before and after implementation of a rapid response team.JAMA.2008;300:2506–2513.
- ,,,,.Rapid response teams: do they make a difference?Dimens Crit Care Nurs.2007;26:253–262.
- ,,,,,.Effects of a medical emergency team on reduction of incidence of and mortality from unexpected cardiac arrests in hospital: preliminary study.BMJ.2002;324:387–390.
- ,,, et al.Introduction of the medical emergency team (MET) system: a cluster‐randomised controlled trial.Lancet.2005;365:2091–2097.
- ,,, et al.Findings of the first consensus conference on medical emergency teams.Crit Care Med.2006;34:2463–2478.
- ,.Implementation of a rapid response team: a success story.Crit Care Nurse.2009;29:66–76.
- .Practical Biostatistical Methods.Belmont, CA:Wadsworth Publishing;1995.
- ,,,.Regression Methods in Biostatistics: Linear, Logistic, Survival, and Repeated Measures Models.New York:Springer Science + Business Media;2005.
- .A note on the delta method.Am Stat.1992;46:27–29.
- ,.The 100,000 Lives Campaign: crystallizing standards of care for hospitals.Health Aff.2005;24:1560–1570.
- ,,, et al.Introducing critical care outreach: a ward‐randomised trial of phased introduction in a general hospital.Intensive Care Med.2004;30:1398–404.
- ,,,,,.Rapid response systems: a systematic review.Crit Care Med.2007;35:1238–1243.
- ,,,,.Effects of rapid response systems on clinical outcomes: systematic review and meta‐analysis.J Hosp Med.2007;2:422–432.
- ,,,,.Rapid response teams: a systematic review and meta‐analysis.Arch Intern Med.2010;170:18–26.
Copyright © 2011 Society of Hospital Medicine