User login
Dearth of Hospitalist Investigators in Academic Medicine: A Call to Action
In their report celebrating the increase in the number of hospitalists from a few hundred in the 1990s to more than 50,000 in 2016, Drs Robert Wachter and Lee Goldman also noted the stunted growth of productive hospital medicine research programs, which presents a challenge to academic credibility in hospital medicine.1 Given the substantial increase in the number of hospitalists over the past two decades, we surveyed adult academic hospital medicine groups to quantify the number of hospitalist clinician investigators and identify gaps in resources for researchers. The number of clinician investigators supported at academic medical centers (AMCs) remains disturbingly low despite the rapid growth of our specialty. Some programs also reported a lack of access to fundamental research services. We report selected results from our survey and provide recommendations to support and facilitate the development of clinician investigators in hospital medicine.
DEARTH OF CLINICIAN INVESTIGATORS IN HOSPITAL MEDICINE
We performed a survey of hospital medicine programs at AMCs in the United States through the Hospital Medicine Reengineering Network (HOMERuN), a hospital medicine research collaborative that facilitates and conducts multisite research studies.2 The purpose of this survey was to obtain a profile of adult academic hospital medicine groups. Surveys were distributed via email to directors and/or senior leaders of each hospital medicine group between January and August 2019. In the survey, a clinician investigator was defined as “faculty whose primary nonclinical focus is scientific papers and grant writing.”
We received responses from 43 of the 86 invitees (50%), each of whom represented a unique hospital medicine group; 41 of the representatives responded to the questions concerning available research services. Collectively, these 43 programs represented 2,503 hospitalists. There were 79 clinician investigators reported among all surveyed hospital medicine groups (3.1% of all hospitalists). The median number of clinician investigators per hospital medicine group was 0 (range 0-12) (Appendix Figure 1), and 22 of 43 (51.2%) hospital medicine groups reported having no clinician investigators. Two of the hospital medicine groups, however, reported having 12 clinician investigators at their respective institutions, comprising nearly one third of the total number of clinician investigators reported in the survey.
Many of the programs reported lack of access to resources such as research assistants (56.1%) and dedicated research fellowships (53.7%) (Appendix Figure 2). A number of groups reported a need for more support for various junior faculty development activities, including research mentoring (53.5%), networking with other researchers (60.5%), and access to clinical data from multiple sites (62.8%).
One of the limitations of this survey was the manner in which the participating hospital medicine groups were chosen. Selection was based on groups affiliated with HOMERuN; among those chosen were highly visible US AMCs, including 70% of the top 20 AMCs based on National Institutes of Health (NIH) funding.3 Therefore, our results likely overestimate the research presence of hospital medicine across all AMCs in the United States.
LACK OF GROWTH OVER TIME: CONTEXTUALIZATION AND IMPLICATIONS
Despite the substantial growth of hospital medicine over the past 2 decades, there has been no proportional increase in the number of hospitalist clinician investigators, with earlier surveys also demonstrating low numbers.4,5 Along with the survey by Chopra and colleagues published in 2019,6 our survey provides an additional contemporary appraisal of research activities for adult academic hospital medicine groups. In the survey by Chopra et al, only 54% (15 of 28) of responding programs reported having any faculty with research as their major activity (ie, >50% effort), and 3% of total faculty reported having funding for >50% effort toward research.6 Our study expands upon these findings by providing more detailed data on the number of clinician investigators per hospital medicine group. Results of our survey showed a concentration of hospitalists within a small number of programs, which may have contributed to the observed lack of growth. We also expand on prior work by identifying a lack of resources and services to support hospitalist researchers.
The findings of our survey have important implications for the field of hospital medicine. Without a critical mass of hospitalist clinician investigators, the quality of research that addresses important questions in our field will suffer. It will also limit academic credibility of the field, as well as individual academic achievement; previous studies have consistently demonstrated that few hospitalists at AMCs achieve the rank of associate or full professor.5-9
POTENTIAL EXPLANATIONS FOR LACK OF RESEARCH GROWTH
The results of our study additionally offer possible explanations for the dearth of clinician investigators in hospital medicine. The limited access to research resources and fellowship training identified in our survey are critical domains that must be addressed in order to develop successful academic hospital medicine programs.4,6,8,10
Regarding dedicated hospital medicine research fellowships, there are only a handful across the country. The small number of existing research fellowships only have one or two fellows per year, and these positions often go unfilled because of a lack of applicants and lower salaries compared to full-time clinical positions.11 The lack of applicants for adult hospital medicine fellowship positions is also integrally linked to board certification requirements. Unlike pediatric hospital medicine where additional fellowship training is required to become board-certified, no such fellowship is required in adult hospital medicine. In pediatrics, this requirement has led to a rapid increase in the number of fellowships with scholarly work requirements (more than 60 fellowships, plus additional programs in development) and greater standardization among training experiences.12,13
The lack of fellowship applicants may also stem from the fact that many trainees are not aware of a potential career as a hospitalist clinician investigator due to limited exposure to this career at most AMCs. Our results revealed that nearly half of sites in our survey had zero clinician investigators, depriving trainees at these programs of role models and thus perpetuating a negative feedback loop. Lastly, although unfilled fellowship positions may indicate that demand is a larger problem than supply, it is also true that fellowship programs generate their own demand through recruitment efforts and the gradual establishment of a positive reputation.
Another potential explanation could relate to the development of hospital medicine in response to rising clinical demands at hospitals: compared with other medical specialties, AMCs may regard hospitalists as being clinicians first and academicians second.1,7,10 Also, hospitalists may be perceived as being beholden to hospitals and less engaged with their surrounding communities than other general medicine fields. With a small footprint in health equity research, academic hospital medicine may be less of a draw to generalists interested in pursuing this area of research. Further, there are very few underrepresented in medicine (URiM) hospital medicine research faculty.5
Another challenge to the career development of hospitalist researchers is the lack of available funding for the type of research typically conducted by hospitalists (eg, rigorous quality improvement implementation and evaluation, optimizing best evidence-based care delivery models, evaluation of patient safety in the hospital setting). As hospitalists tend to be system-level thinkers, this lack of funding may steer potential researchers away from externally funded research careers and into hospital operations and quality improvement positions. Also, unlike other medical specialties, there is no dedicated NIH funding source for hospital medicine research (eg, cardiology and the National Heart, Lung, and Blood Institute), placing hospitalists at a disadvantage in seeking funding compared to subspecialists.
STRATEGIES TO ENHANCE RESEARCH PRESENCE
We recommend several approaches—ones that should be pursued simultaneously—to increase the number of clinician investigators in hospital medicine. First, hospital medicine groups and their respective divisions, departments, and hospitals should allocate funding to support research resources; this includes investing in research assistants, data analysts, statisticians, and administrative support. Through the funding of such research infrastructure programs, AMCs could incentivize hospitalists to research best approaches to improve the value of healthcare delivery, ultimately leading to cost savings.
With 60% of respondents identifying the need for improved access to data across multiple sites, our survey also emphasizes the requirement for further collaboration among hospital medicine groups. Such collaboration could lead to high-powered observational studies and the evaluation of interventions across multiple sites, thus improving the generalizability of study findings.
The Society of Hospital Medicine (SHM) and its research committee can continue to expand the research footprint of hospital medicine. To date, the committee has achieved this by highlighting hospitalist research activity at the SHM Annual Conference Scientific Abstract and Poster Competition and developing a visiting professorship exchange program. In addition to these efforts, SHM could foster collaboration and networking between institutions, as well as take advantage of the current political push for expanded Medicare access by lobbying for robust funding for the Agency for Healthcare Research and Quality, which could provide more opportunities for hospitalists to study the effects of healthcare policy reform on the delivery of inpatient care.
Another strategy to increase the number of hospitalist clinician investigators is to expand hospital medicine research fellowships and recruit trainees for these programs. Fellowships could be internally funded wherein a fellow’s clinical productivity is used to offset the costs associated with obtaining advanced degrees. As an incentive to encourage applicants to temporarily forego a full-time clinical salary during fellowship, hospital medicine groups could offer expanded moonlighting opportunities and contribute to repayment of medical school loans. Hospital medicine groups should also advocate for NIH-funded T32 or K12 training grants for hospital medicine. (There are, however, challenges with this approach because the number of T32 spots per NIH institute is usually fixed). The success of academic emergency medicine offers a precedent for such efforts: After the development of a K12 research training program in emergency medicine, the number of NIH-sponsored principal investigators in this specialty increased by 40% in 6 years.14 Additionally, now that fellowships are required for the pediatric hospital medicine clinician investigators, it would be revealing to track the growth of this workforce.12,13
Structured and formalized mentorship is an essential part of the development of clinician investigators in hospital medicine.4,7,8,10 One successful strategy for mentorship has been the partnering of hospital medicine groups with faculty of general internal medicine and other subspecialty divisions with robust research programs.7,8,15 In addition to developing sustainable mentorship programs, hospital medicine researchers must increase their visibility to trainees. Therefore, it is essential that the majority of academic hospital medicine groups not only hire clinician investigators but also invest in their development, rather than rely on the few programs that have several such faculty members. With this strategy, we could dramatically increase the number of hospitalist clinician investigators from a diverse background of training institutions.
SHM could also play a greater role in organizing events for networking and mentoring for trainees and medical students interested in pursuing a career in hospital medicine research. It is also critically important that hospital medicine groups actively recruit, retain, and develop URiM hospital medicine research faculty in order to attract talented researchers and actively participate in the necessary effort to mitigate the inequities prevalent throughout our healthcare system.
CONCLUSION
Despite the growth of hospital medicine over the past decade, there remains a dearth of hospitalist clinician investigators at major AMCs in the United States. This may be due in part to lack of research resources and mentorship within hospital medicine groups. We believe that investment in these resources, expanded funding opportunities, mentorship development, research fellowship programs, and greater exposure of trainees to hospitalist researchers are solutions that should be strongly considered to develop hospitalist clinician investigators.
Acknowledgments
The authors thank HOMERuN executive committee members, including Grant Fletcher, MD, James Harrison, PhD, BSC, MPH, Peter K. Lindenauer, MD, Melissa Mattison, MD, David Meltzer, MD, PhD, Joshua Metlay, MD, PhD, Jennifer Myers, MD, Sumant Ranji, MD, Gregory Ruhnke, MD, MPH, Edmondo Robinson, MD, MBA, and Neil Sehgal, MPH PhD, for their assistance in developing the survey. They also thank Tiffany Lee, MA, for her project management assistance for HOMERuN.
1. Wachter RM, Goldman L. Zero to 50,000 – The 20th anniversary of the hospitalist. N Engl J Med. 2016;375(11):1009-1011. https://doi.org/10.1056/NEJMp1607958
2. Auerbach AD, Patel MS, Metlay JP, et al. The Hospital Medicine Reengineering Network (HOMERuN): a learning organization focused on improving hospital care. Acad Med. 2014;89(3):415-420. https://doi.org/10.1097/acm.0000000000000139
3. Roskoski R Jr, Parslow TG. Ranking Tables of NIH funding to US medical schools in 2019. Blue Ridge Institute for Medical Research. Published 2020. Updated July 14, 2020. Accessed July 30, 2020. http://www.brimr.org/NIH_Awards/2019/NIH_Awards_2019.htm
4. Reid MB, Misky GJ, Harrison RA, Sharpe B, Auerbach A, Glasheen JJ. Mentorship, productivity, and promotion among academic hospitalists. J Gen Intern Med. 2012;27(1):23-27. https://doi.org/10.1007/s11606-011-1892-5
5. Miller CS, Fogerty RL, Gann J, Bruti CP, Klein R; The Society of General Internal Medicine Membership Committee. The growth of hospitalists and the future of the society of general internal medicine: results from the 2014 membership survey. J Gen Intern Med. 2017;32(11):1179-1185. https://doi.org/10.1007/s11606-017-4126-7
6. Chopra V, Burden M, Jones CD, et al; Society of Hospital Medicine Research Committee. State of research in adult hospital medicine: results of a national survey. J Hosp Med. 2019;14(4):207-211. https://doi.org/10.12788/jhm.3136
7. Seymann GB, Southern W, Burger A, et al. Features of successful academic hospitalist programs: insights from the SCHOLAR (SuCcessful HOspitaLists in academics and research) project. J Hosp Med. 2016;11(10):708-713. https://doi.org/10.1002/jhm.2603
8. Harrison R, Hunter AJ, Sharpe B, Auerbach AD. Survey of US academic hospitalist leaders about mentorship and academic activities in hospitalist groups. J Hosp Med. 2011;6(1):5-9. https://doi.org/10.1002/jhm.836
9. Dang Do AN, Munchhof AM, Terry C, Emmett T, Kara A. Research and publication trends in hospital medicine. J Hosp Med. 2014;9(3):148-154. https://doi.org/10.1002/jhm.2148
10. Sehgal NL, Sharpe BA, Auerbach AA, Wachter RM. Investing in the future: building an academic hospitalist faculty development program. J Hosp Med. 2011;6(3):161-166. https://doi.org/10.1002/jhm.845
11. Ranji SR, Rosenman DJ, Amin AN, Kripalani S. Hospital medicine fellowships: works in progress. Am J Med. 2006;119(1):72.e1-72.e7. https://doi.org/10.1016/j.amjmed.2005.07.061
12. Shah NH, Rhim HJ, Maniscalco J, Wilson K, Rassbach C. The current state of pediatric hospital medicine fellowships: a survey of program directors. J Hosp Med. 2016;11(5):324-328. https://doi.org/10.1002/jhm.2571
13. Jerardi KE, Fisher E, Rassbach C, et al; Council of Pediatric Hospital Medicine Fellowship Directors. Development of a curricular framework for pediatric hospital medicine fellowships. Pediatrics. 2017;140(1):e20170698. https://doi.org/10.1542/peds.2017-0698
14. Lewis RJ, Neumar RW. Research in emergency medicine: building the investigator pipeline. Ann Emerg Med. 2018;72(6):691-695. https://doi.org/10.1016/j.annemergmed.2018.10.019
15. Flanders SA, Kaufman SR, Nallamothu BK, Saint S. The University of Michigan Specialist-Hospitalist Allied Research Program: jumpstarting hospital medicine research. J Hosp Med. 2008;3(4):308-313. https://doi.org/10.1002/jhm.342
In their report celebrating the increase in the number of hospitalists from a few hundred in the 1990s to more than 50,000 in 2016, Drs Robert Wachter and Lee Goldman also noted the stunted growth of productive hospital medicine research programs, which presents a challenge to academic credibility in hospital medicine.1 Given the substantial increase in the number of hospitalists over the past two decades, we surveyed adult academic hospital medicine groups to quantify the number of hospitalist clinician investigators and identify gaps in resources for researchers. The number of clinician investigators supported at academic medical centers (AMCs) remains disturbingly low despite the rapid growth of our specialty. Some programs also reported a lack of access to fundamental research services. We report selected results from our survey and provide recommendations to support and facilitate the development of clinician investigators in hospital medicine.
DEARTH OF CLINICIAN INVESTIGATORS IN HOSPITAL MEDICINE
We performed a survey of hospital medicine programs at AMCs in the United States through the Hospital Medicine Reengineering Network (HOMERuN), a hospital medicine research collaborative that facilitates and conducts multisite research studies.2 The purpose of this survey was to obtain a profile of adult academic hospital medicine groups. Surveys were distributed via email to directors and/or senior leaders of each hospital medicine group between January and August 2019. In the survey, a clinician investigator was defined as “faculty whose primary nonclinical focus is scientific papers and grant writing.”
We received responses from 43 of the 86 invitees (50%), each of whom represented a unique hospital medicine group; 41 of the representatives responded to the questions concerning available research services. Collectively, these 43 programs represented 2,503 hospitalists. There were 79 clinician investigators reported among all surveyed hospital medicine groups (3.1% of all hospitalists). The median number of clinician investigators per hospital medicine group was 0 (range 0-12) (Appendix Figure 1), and 22 of 43 (51.2%) hospital medicine groups reported having no clinician investigators. Two of the hospital medicine groups, however, reported having 12 clinician investigators at their respective institutions, comprising nearly one third of the total number of clinician investigators reported in the survey.
Many of the programs reported lack of access to resources such as research assistants (56.1%) and dedicated research fellowships (53.7%) (Appendix Figure 2). A number of groups reported a need for more support for various junior faculty development activities, including research mentoring (53.5%), networking with other researchers (60.5%), and access to clinical data from multiple sites (62.8%).
One of the limitations of this survey was the manner in which the participating hospital medicine groups were chosen. Selection was based on groups affiliated with HOMERuN; among those chosen were highly visible US AMCs, including 70% of the top 20 AMCs based on National Institutes of Health (NIH) funding.3 Therefore, our results likely overestimate the research presence of hospital medicine across all AMCs in the United States.
LACK OF GROWTH OVER TIME: CONTEXTUALIZATION AND IMPLICATIONS
Despite the substantial growth of hospital medicine over the past 2 decades, there has been no proportional increase in the number of hospitalist clinician investigators, with earlier surveys also demonstrating low numbers.4,5 Along with the survey by Chopra and colleagues published in 2019,6 our survey provides an additional contemporary appraisal of research activities for adult academic hospital medicine groups. In the survey by Chopra et al, only 54% (15 of 28) of responding programs reported having any faculty with research as their major activity (ie, >50% effort), and 3% of total faculty reported having funding for >50% effort toward research.6 Our study expands upon these findings by providing more detailed data on the number of clinician investigators per hospital medicine group. Results of our survey showed a concentration of hospitalists within a small number of programs, which may have contributed to the observed lack of growth. We also expand on prior work by identifying a lack of resources and services to support hospitalist researchers.
The findings of our survey have important implications for the field of hospital medicine. Without a critical mass of hospitalist clinician investigators, the quality of research that addresses important questions in our field will suffer. It will also limit academic credibility of the field, as well as individual academic achievement; previous studies have consistently demonstrated that few hospitalists at AMCs achieve the rank of associate or full professor.5-9
POTENTIAL EXPLANATIONS FOR LACK OF RESEARCH GROWTH
The results of our study additionally offer possible explanations for the dearth of clinician investigators in hospital medicine. The limited access to research resources and fellowship training identified in our survey are critical domains that must be addressed in order to develop successful academic hospital medicine programs.4,6,8,10
Regarding dedicated hospital medicine research fellowships, there are only a handful across the country. The small number of existing research fellowships only have one or two fellows per year, and these positions often go unfilled because of a lack of applicants and lower salaries compared to full-time clinical positions.11 The lack of applicants for adult hospital medicine fellowship positions is also integrally linked to board certification requirements. Unlike pediatric hospital medicine where additional fellowship training is required to become board-certified, no such fellowship is required in adult hospital medicine. In pediatrics, this requirement has led to a rapid increase in the number of fellowships with scholarly work requirements (more than 60 fellowships, plus additional programs in development) and greater standardization among training experiences.12,13
The lack of fellowship applicants may also stem from the fact that many trainees are not aware of a potential career as a hospitalist clinician investigator due to limited exposure to this career at most AMCs. Our results revealed that nearly half of sites in our survey had zero clinician investigators, depriving trainees at these programs of role models and thus perpetuating a negative feedback loop. Lastly, although unfilled fellowship positions may indicate that demand is a larger problem than supply, it is also true that fellowship programs generate their own demand through recruitment efforts and the gradual establishment of a positive reputation.
Another potential explanation could relate to the development of hospital medicine in response to rising clinical demands at hospitals: compared with other medical specialties, AMCs may regard hospitalists as being clinicians first and academicians second.1,7,10 Also, hospitalists may be perceived as being beholden to hospitals and less engaged with their surrounding communities than other general medicine fields. With a small footprint in health equity research, academic hospital medicine may be less of a draw to generalists interested in pursuing this area of research. Further, there are very few underrepresented in medicine (URiM) hospital medicine research faculty.5
Another challenge to the career development of hospitalist researchers is the lack of available funding for the type of research typically conducted by hospitalists (eg, rigorous quality improvement implementation and evaluation, optimizing best evidence-based care delivery models, evaluation of patient safety in the hospital setting). As hospitalists tend to be system-level thinkers, this lack of funding may steer potential researchers away from externally funded research careers and into hospital operations and quality improvement positions. Also, unlike other medical specialties, there is no dedicated NIH funding source for hospital medicine research (eg, cardiology and the National Heart, Lung, and Blood Institute), placing hospitalists at a disadvantage in seeking funding compared to subspecialists.
STRATEGIES TO ENHANCE RESEARCH PRESENCE
We recommend several approaches—ones that should be pursued simultaneously—to increase the number of clinician investigators in hospital medicine. First, hospital medicine groups and their respective divisions, departments, and hospitals should allocate funding to support research resources; this includes investing in research assistants, data analysts, statisticians, and administrative support. Through the funding of such research infrastructure programs, AMCs could incentivize hospitalists to research best approaches to improve the value of healthcare delivery, ultimately leading to cost savings.
With 60% of respondents identifying the need for improved access to data across multiple sites, our survey also emphasizes the requirement for further collaboration among hospital medicine groups. Such collaboration could lead to high-powered observational studies and the evaluation of interventions across multiple sites, thus improving the generalizability of study findings.
The Society of Hospital Medicine (SHM) and its research committee can continue to expand the research footprint of hospital medicine. To date, the committee has achieved this by highlighting hospitalist research activity at the SHM Annual Conference Scientific Abstract and Poster Competition and developing a visiting professorship exchange program. In addition to these efforts, SHM could foster collaboration and networking between institutions, as well as take advantage of the current political push for expanded Medicare access by lobbying for robust funding for the Agency for Healthcare Research and Quality, which could provide more opportunities for hospitalists to study the effects of healthcare policy reform on the delivery of inpatient care.
Another strategy to increase the number of hospitalist clinician investigators is to expand hospital medicine research fellowships and recruit trainees for these programs. Fellowships could be internally funded wherein a fellow’s clinical productivity is used to offset the costs associated with obtaining advanced degrees. As an incentive to encourage applicants to temporarily forego a full-time clinical salary during fellowship, hospital medicine groups could offer expanded moonlighting opportunities and contribute to repayment of medical school loans. Hospital medicine groups should also advocate for NIH-funded T32 or K12 training grants for hospital medicine. (There are, however, challenges with this approach because the number of T32 spots per NIH institute is usually fixed). The success of academic emergency medicine offers a precedent for such efforts: After the development of a K12 research training program in emergency medicine, the number of NIH-sponsored principal investigators in this specialty increased by 40% in 6 years.14 Additionally, now that fellowships are required for the pediatric hospital medicine clinician investigators, it would be revealing to track the growth of this workforce.12,13
Structured and formalized mentorship is an essential part of the development of clinician investigators in hospital medicine.4,7,8,10 One successful strategy for mentorship has been the partnering of hospital medicine groups with faculty of general internal medicine and other subspecialty divisions with robust research programs.7,8,15 In addition to developing sustainable mentorship programs, hospital medicine researchers must increase their visibility to trainees. Therefore, it is essential that the majority of academic hospital medicine groups not only hire clinician investigators but also invest in their development, rather than rely on the few programs that have several such faculty members. With this strategy, we could dramatically increase the number of hospitalist clinician investigators from a diverse background of training institutions.
SHM could also play a greater role in organizing events for networking and mentoring for trainees and medical students interested in pursuing a career in hospital medicine research. It is also critically important that hospital medicine groups actively recruit, retain, and develop URiM hospital medicine research faculty in order to attract talented researchers and actively participate in the necessary effort to mitigate the inequities prevalent throughout our healthcare system.
CONCLUSION
Despite the growth of hospital medicine over the past decade, there remains a dearth of hospitalist clinician investigators at major AMCs in the United States. This may be due in part to lack of research resources and mentorship within hospital medicine groups. We believe that investment in these resources, expanded funding opportunities, mentorship development, research fellowship programs, and greater exposure of trainees to hospitalist researchers are solutions that should be strongly considered to develop hospitalist clinician investigators.
Acknowledgments
The authors thank HOMERuN executive committee members, including Grant Fletcher, MD, James Harrison, PhD, BSC, MPH, Peter K. Lindenauer, MD, Melissa Mattison, MD, David Meltzer, MD, PhD, Joshua Metlay, MD, PhD, Jennifer Myers, MD, Sumant Ranji, MD, Gregory Ruhnke, MD, MPH, Edmondo Robinson, MD, MBA, and Neil Sehgal, MPH PhD, for their assistance in developing the survey. They also thank Tiffany Lee, MA, for her project management assistance for HOMERuN.
1. Wachter RM, Goldman L. Zero to 50,000 – The 20th anniversary of the hospitalist. N Engl J Med. 2016;375(11):1009-1011. https://doi.org/10.1056/NEJMp1607958
2. Auerbach AD, Patel MS, Metlay JP, et al. The Hospital Medicine Reengineering Network (HOMERuN): a learning organization focused on improving hospital care. Acad Med. 2014;89(3):415-420. https://doi.org/10.1097/acm.0000000000000139
3. Roskoski R Jr, Parslow TG. Ranking Tables of NIH funding to US medical schools in 2019. Blue Ridge Institute for Medical Research. Published 2020. Updated July 14, 2020. Accessed July 30, 2020. http://www.brimr.org/NIH_Awards/2019/NIH_Awards_2019.htm
4. Reid MB, Misky GJ, Harrison RA, Sharpe B, Auerbach A, Glasheen JJ. Mentorship, productivity, and promotion among academic hospitalists. J Gen Intern Med. 2012;27(1):23-27. https://doi.org/10.1007/s11606-011-1892-5
5. Miller CS, Fogerty RL, Gann J, Bruti CP, Klein R; The Society of General Internal Medicine Membership Committee. The growth of hospitalists and the future of the society of general internal medicine: results from the 2014 membership survey. J Gen Intern Med. 2017;32(11):1179-1185. https://doi.org/10.1007/s11606-017-4126-7
6. Chopra V, Burden M, Jones CD, et al; Society of Hospital Medicine Research Committee. State of research in adult hospital medicine: results of a national survey. J Hosp Med. 2019;14(4):207-211. https://doi.org/10.12788/jhm.3136
7. Seymann GB, Southern W, Burger A, et al. Features of successful academic hospitalist programs: insights from the SCHOLAR (SuCcessful HOspitaLists in academics and research) project. J Hosp Med. 2016;11(10):708-713. https://doi.org/10.1002/jhm.2603
8. Harrison R, Hunter AJ, Sharpe B, Auerbach AD. Survey of US academic hospitalist leaders about mentorship and academic activities in hospitalist groups. J Hosp Med. 2011;6(1):5-9. https://doi.org/10.1002/jhm.836
9. Dang Do AN, Munchhof AM, Terry C, Emmett T, Kara A. Research and publication trends in hospital medicine. J Hosp Med. 2014;9(3):148-154. https://doi.org/10.1002/jhm.2148
10. Sehgal NL, Sharpe BA, Auerbach AA, Wachter RM. Investing in the future: building an academic hospitalist faculty development program. J Hosp Med. 2011;6(3):161-166. https://doi.org/10.1002/jhm.845
11. Ranji SR, Rosenman DJ, Amin AN, Kripalani S. Hospital medicine fellowships: works in progress. Am J Med. 2006;119(1):72.e1-72.e7. https://doi.org/10.1016/j.amjmed.2005.07.061
12. Shah NH, Rhim HJ, Maniscalco J, Wilson K, Rassbach C. The current state of pediatric hospital medicine fellowships: a survey of program directors. J Hosp Med. 2016;11(5):324-328. https://doi.org/10.1002/jhm.2571
13. Jerardi KE, Fisher E, Rassbach C, et al; Council of Pediatric Hospital Medicine Fellowship Directors. Development of a curricular framework for pediatric hospital medicine fellowships. Pediatrics. 2017;140(1):e20170698. https://doi.org/10.1542/peds.2017-0698
14. Lewis RJ, Neumar RW. Research in emergency medicine: building the investigator pipeline. Ann Emerg Med. 2018;72(6):691-695. https://doi.org/10.1016/j.annemergmed.2018.10.019
15. Flanders SA, Kaufman SR, Nallamothu BK, Saint S. The University of Michigan Specialist-Hospitalist Allied Research Program: jumpstarting hospital medicine research. J Hosp Med. 2008;3(4):308-313. https://doi.org/10.1002/jhm.342
© 2021 Society of Hospital Medicine
Leadership & Professional Development: Make a Friend Before You Need One
“Takers believe in a zero-sum world, and they end up creating one where bosses, colleagues and clients don’t trust them. Givers build deeper and broader relationships—people are rooting for them instead of gunning for them.”
—Adam Grant
To succeed in a hospital, leaders need a generous supply of social and political capital. House officers learn this very quickly, especially when they are relying on other members of the healthcare team to obtain tests and studies for their patients and calling for specialty consultations. To be successful and efficient, building relationships and trust is key. Such capital, unfortunately, takes time to develop. Therefore, healthcare leaders and clinicians at all levels of training need to make an everyday investment of goodwill and friendliness with those they encounter. The dividends may be slow in coming, but they are substantial and sustained. Friends give you the benefit of the doubt—and help you when you are most in need.
Having friends (or friendly colleagues) at work is beneficial both professionally and personally. The benefits of social interactions have been studied for years and even more so in recent times with the dramatic increase in the use of handheld devices. Eye contact between casual acquaintances passing each other in the hallway is replaced with eyes focused downward on smartphones. The result? We are becoming more socially isolated. Our personal solution? When we see professional colleagues (or patients and families in the hallways of our hospital), we nod in acknowledgement with appropriate eye contact and say “Good morning” or “Hello” even if we don’t know them—even if their eyes are focused on their devices as they walk past you in the hallway. You get a gold star if you remember the names of the professional colleagues you see frequently in the hallways or around the hospital.
This isn’t soft science; it’s backed by hard data. When we conduct site visits of different hospitals around the country to help them improve their care quality and performance, we informally divide hospitals into two groups: The “How ya doin’?” hospitals vs the “Rec-Ignore” hospitals (in which employees recognize a colleague in the hallway but choose to not acknowledge them). Most prefer to work at a “How ya doin’?” hospital. Being friendly has been linked to increased team spirit and morale, knowledge sharing, trust, prevention of burnout, and sense of a positive working environment. It also makes you feel better about yourself—and makes other people feel similarly as well.
We’ll share an example from a search for a new department chair. The dean went on reverse site visits to meet the two finalists in their home institutions and asked them for tours of their hospitals. Candidate A walked around and it seemed like everyone knew her. She smiled and said hello to the people she came in contact with during the tour. Not so for candidate B—just the opposite. Guess which candidate the dean hired?
Put away your phone, interact with your colleagues, and learn to make small talk, and not just with your supervisors or peers. Chitchat is an important “social lubricant,” fostering a sense of community and teamwork. It helps bring down the divides that come from organizational hierarchies. It helps endear you to your staff.
Developing a reputation as a nice person who is quick with a smile and even quicker with a “How ya doin’?” pays off in the end. This reputation also makes it easier to give bad news, something that all leaders must do at some point. So make a friend before you need one—it usually will pay dividends.
Patient Preferences for Physician Attire: A Multicenter Study in Japan
The patient-physician relationship is critical for ensuring the delivery of high-quality healthcare. Successful patient-physician relationships arise from shared trust, knowledge, mutual respect, and effective verbal and nonverbal communication. The ways in which patients experience healthcare and their satisfaction with physicians affect a myriad of important health outcomes, such as adherence to treatment and outcomes for conditions such as hypertension and diabetes mellitus.1-5 One method for potentially enhancing patient satisfaction is through understanding how patients wish their physicians to dress6-8 and tailoring attire to match these expectations. In addition to our systematic review,9 a recent large-scale, multicenter study in the United States revealed that most patients perceive physician attire as important, but that preferences for specific types of attire are contextual.9,10 For example, elderly patients preferred physicians in formal attire and white coat, while scrubs with white coat or scrubs alone were preferred for emergency department (ED) physicians and surgeons, respectively. Moreover, regional variation regarding attire preference was also observed in the US, with preferences for more formal attire in the South and less formal in the Midwest.
Geographic variation, regarding patient preferences for physician dress, is perhaps even more relevant internationally. In particular, Japan is considered to have a highly contextualized culture that relies on nonverbal and implicit communication. However, medical professionals have no specific dress code and, thus, don many different kinds of attire. In part, this may be because it is not clear whether or how physician attire impacts patient satisfaction and perceived healthcare quality in Japan.11-13 Although previous studies in Japan have suggested that physician attire has a considerable influence on patient satisfaction, these studies either involved a single department in one hospital or a small number of respondents.14-17 Therefore, we performed a multicenter, cross-sectional study to understand patients’ preferences for physician attire in different clinical settings and in different geographic regions in Japan.
METHODS
Study Population
We conducted a cross-sectional, questionnaire-based study from 2015 to 2017, in four geographically diverse hospitals in Japan. Two of these hospitals, Tokyo Joto Hospital and Juntendo University Hospital, are located in eastern Japan whereas the others, Kurashiki Central Hospital and Akashi Medical Center, are in western Japan.
Questionnaires were printed and randomly distributed by research staff to outpatients in waiting rooms and inpatients in medical wards who were 20 years of age or older. We placed no restriction on ward site or time of questionnaire distribution. Research staff, including physicians, nurses, and medical clerks, were instructed to avoid guiding or influencing participants’ responses. Informed consent was obtained by the staff; only those who provided informed consent participated in the study. Respondents could request assistance with form completion from persons accompanying them if they had difficulties, such as physical, visual, or hearing impairments. All responses were collected anonymously. The study was approved by the ethics committees of all four hospitals.
Questionnaire
We used a modified version of the survey instrument from a prior study.10 The first section of the survey showed photographs of either a male or female physician with 7 unique forms of attire, including casual, casual with white coat, scrubs, scrubs with white coat, formal, formal with white coat, and business suit (Figure 1). Given the Japanese context of this study, the language was translated to Japanese and photographs of physicians of Japanese descent were used. Photographs were taken with attention paid to achieving constant facial expressions on the physicians as well as in other visual cues (eg, lighting, background, pose). The physician’s gender and attire in the first photograph seen by each respondent were randomized to prevent bias in ordering, priming, and anchoring; all other sections of the survey were identical.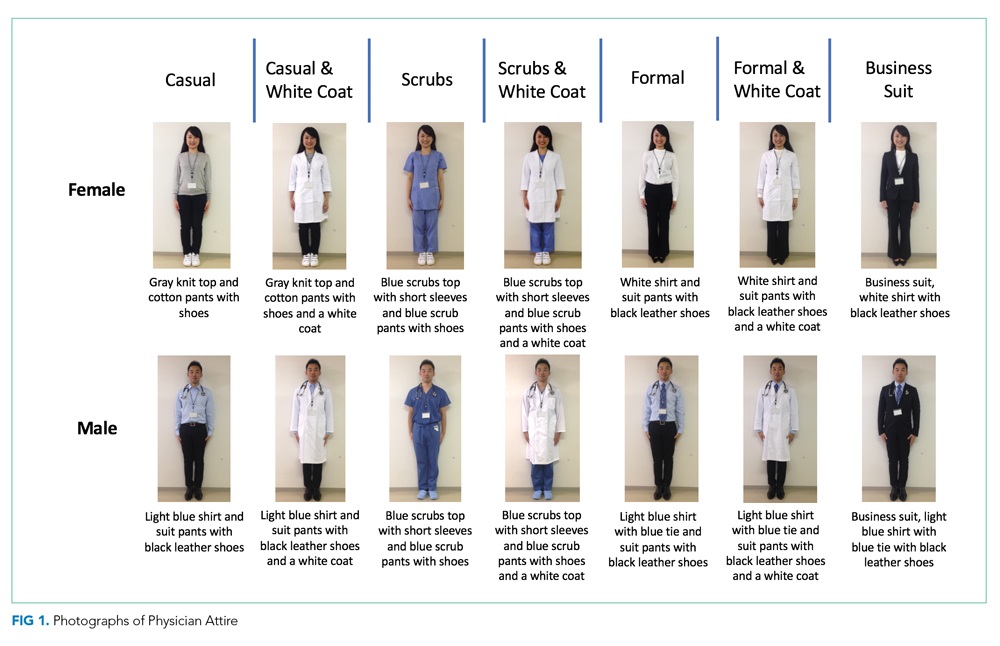
Respondents were first asked to rate the standalone, randomized physician photograph using a 1-10 scale across five domains (ie, how knowledgeable, trustworthy, caring, and approachable the physician appeared and how comfortable the physician’s appearance made the respondent feel), with a score of 10 representing the highest rating. Respondents were subsequently given 7 photographs of the same physician wearing various forms of attire. Questions were asked regarding preference of attire in varied clinical settings (ie, primary care, ED, hospital, surgery, overall preference). To identify the influence of and respondent preferences for physician dress and white coats, a Likert scale ranging from 1 (strongly disagree) to 5 (strongly agree) was employed. The scale was trichotomized into “disagree” (1, 2), “neither agree nor disagree” (3), and “agree” (4, 5) for analysis. Demographic data, including age, gender, education level, nationality (Japanese or non-Japanese), and number of physicians seen in the past year were collected.
Outcomes and Sample Size Calculation
The primary outcome of attire preference was calculated as the mean composite score of the five individual rating domains (ie, knowledgeable, trustworthy, caring, approachable, and comfortable), with the highest score representing the most preferred form of attire. We also assessed variation in preferences for physician attire by respondent characteristics, such as age and gender.
Sample size estimation was based on previous survey methodology.10 The Likert scale range for identifying influence of and respondent preferences for physician dress and white coats was 1-5 (“strongly disagree” to “strongly agree”). The scale range for measuring preferences for the randomized attire photograph was 1-10. An assumption of normality was made regarding responses on the 1-10 scale. An estimated standard deviation of 2.2 was assumed, based on prior findings.10 Based on these assumptions and the inclusion of at least 816 respondents (assuming a two-sided alpha error of 0.05), we expected to have 90% capacity to detect differences for effect sizes of 0.50 on the 1-10 scale.
Statistical Analyses
Paper-based survey data were entered independently and in duplicate by the study team. Respondents were not required to answer all questions; therefore, the denominator for each question varied. Data were reported as mean and standard deviation (SD) or percentages, where appropriate. Differences in the mean composite rating scores were assessed using one-way ANOVA with the Tukey method for pairwise comparisons. Differences in proportions for categorical data were compared using the Z-test. Chi-squared tests were used for bivariate comparisons between respondent age, gender, and level of education and corresponding respondent preferences. All analyses were performed using Stata 14 MP/SE (Stata Corp., College Station, Texas, USA).
RESULTS
Characteristics of Participants
Between December 1, 2015 and October 30, 2017, a total of 2,020 surveys were completed by patients across four academic hospitals in Japan. Of those, 1,960 patients (97.0%) completed the survey in its entirety. Approximately half of the respondents were 65 years of age or older (49%), of female gender (52%), and reported receiving care in the outpatient setting (53%). Regarding use of healthcare, 91% had seen more than one physician in the year preceding the time of survey completion (Table 1).
Ratings of Physician Attire
Compared with all forms of attire depicted in the survey’s first standalone photograph, respondents rated “casual attire with white coat” the highest (Figure 2). The mean composite score for “casual attire with white coat” was 7.1 (standard deviation [SD] = 1.8), and this attire was set as the referent group. Cronbach’s alpha, for the five items included in the composite score, was 0.95. However, “formal attire with white coat” was rated almost as highly as “casual attire with white coat” with an overall mean composite score of 7.0 (SD = 1.6).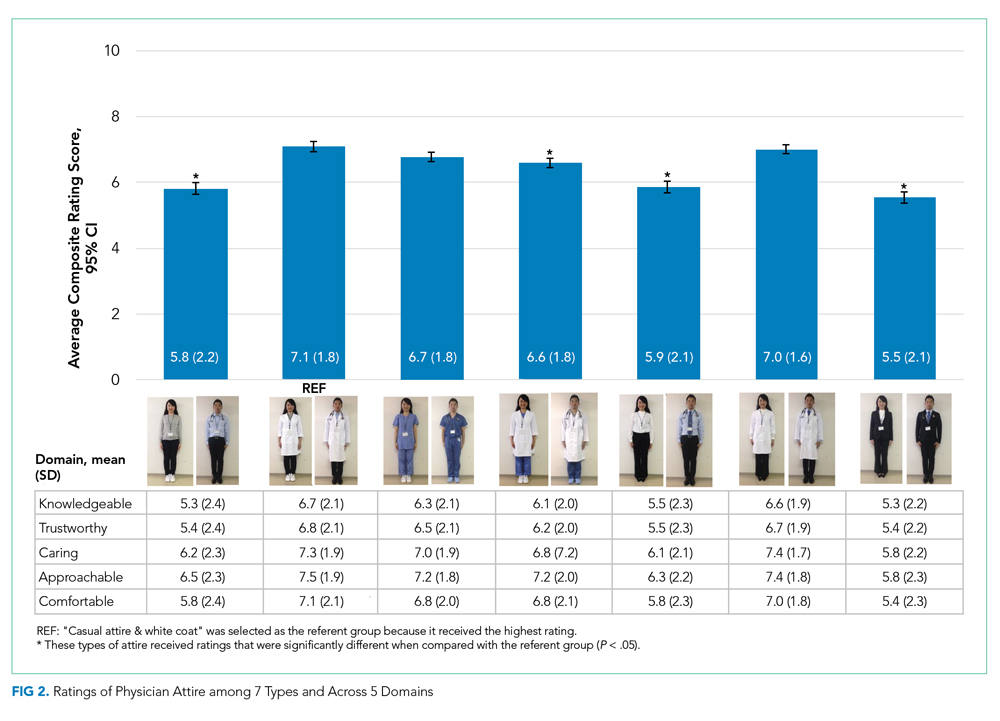
Variation in Preference for Physician Attire by Clinical Setting
Preferences for physician attire varied by clinical care setting. Most respondents preferred “casual attire with white coat” or “formal attire with white coat” in both primary care and hospital settings, with a slight preference for “casual attire with white coat.” In contrast, respondents preferred “scrubs without white coat” in the ED and surgical settings. When asked about their overall preference, respondents reported they felt their physician should wear “formal attire with white coat” (35%) or “casual attire with white coat” (30%; Table 2). When comparing the group of photographs of physicians with white coats to the group without white coats (Figure 1), respondents preferred physicians wearing white coats overall and specifically when providing care in primary care and hospital settings. However, they preferred physicians without white coats when providing care in the ED (P < .001). With respect to surgeons, there was no statistically significant difference between preference for white coats and no white coats. These results were similar for photographs of both male and female physicians.
When asked whether physician dress was important to them and if physician attire influenced their satisfaction with the care received, 61% of participants agreed that physician dress was important, and 47% agreed that physician attire influenced satisfaction (Appendix Table 1). With respect to appropriateness of physicians dressing casually over the weekend in clinical settings, 52% responded that casual wear was inappropriate, while 31% had a neutral opinion.
Participants were asked whether physicians should wear a white coat in different clinical settings. Nearly two-thirds indicated a preference for white coats in the office and hospital (65% and 64%, respectively). Responses regarding whether emergency physicians should wear white coats were nearly equally divided (Agree, 37%; Disagree, 32%; Neither Agree nor Disagree, 31%). However, “scrubs without white coat” was most preferred (56%) when patients were given photographs of various attire and asked, “Which physician would you prefer to see when visiting the ER?” Responses to the question “Physicians should always wear a white coat when seeing patients in any setting” varied equally (Agree, 32%; Disagree, 34%; Neither Agree nor Disagree, 34%).
Variation in Preference for Physician Attire by Respondent Demographics
When comparing respondents by age, those 65 years or older preferred “formal attire with white coat” more so than respondents younger than 65 years (Appendix Table 2). This finding was identified in both primary care (36% vs 31%, P < .001) and hospital settings (37% vs 30%, P < .001). Additionally, physician attire had a greater impact on older respondents’ satisfaction and experience (Appendix Table 3). For example, 67% of respondents 65 years and older agreed that physician attire was important, and 54% agreed that attire influenced satisfaction. Conversely, for respondents younger than 65 years, the proportion agreeing with these statements was lower (56% and 41%, both P < .001). When comparing older and younger respondents, those 65 years and older more often preferred physicians wearing white coats in any setting (39% vs 26%, P < .001) and specifically in their office (68% vs 61%, P = .002), the ED (40% vs 34%, P < .001), and the hospital (69% vs 60%, P < .001).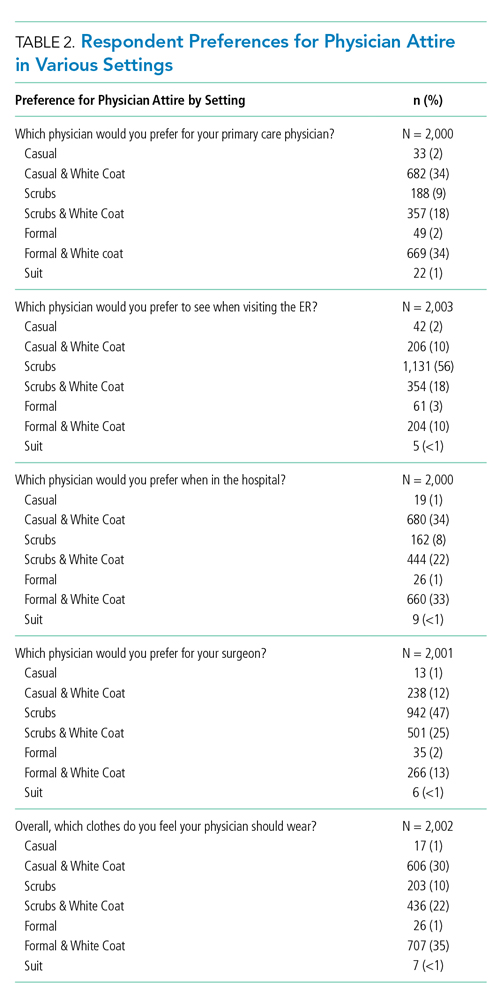
When comparing male and female respondents, male respondents more often stated that physician dress was important to them (men, 64%; women, 58%; P = .002). When comparing responses to the question “Overall, which clothes do you feel a doctor should wear?”, between the eastern and western Japanese hospitals, preferences for physician attire varied.
Variation in Expectations Between Male and Female Physicians
When comparing the ratings of male and female physicians, female physicians were rated higher in how caring (P = .005) and approachable (P < .001) they appeared. However, there were no significant differences in the ratings of the three remaining domains (ie, knowledgeable, trustworthy, and comfortable) or the composite score.
DISCUSSION
Since we employed the same methodology as previous studies conducted in the US10 and Switzerland,18 a notable strength of our approach is that comparisons among these countries can be drawn. For example, physician attire appears to hold greater importance in Japan than in the US and Switzerland. Among Japanese participants, 61% agreed that physician dress is important (US, 53%; Switzerland, 36%), and 47% agreed that physician dress influenced how satisfied they were with their care (US, 36%; Switzerland, 23%).10 This result supports the notion that nonverbal and implicit communications (such as physician dress) may carry more importance among Japanese people.11-13
Regarding preference ratings for type of dress among respondents in Japan, “casual attire with white coat” received the highest mean composite score rating, with “formal attire with white coat” rated second overall. In contrast, US respondents rated “formal attire with white coat” highest and “scrubs with white coat” second.10 Our result runs counter to our expectation in that we expected Japanese respondents to prefer formal attire, since Japan is one of the most formal cultures in the world. One potential explanation for this difference is that the casual style chosen for this study was close to the smart casual style (slightly casual). Most hospitals and clinics in Japan do not allow physicians to wear jeans or polo shirts, which were chosen as the casual attire in the previous US study.
When examining various care settings and physician types, both Japanese and US respondents were more likely to prefer physicians wearing a white coat in the office or hospital.10 However, Japanese participants preferred both “casual attire with white coat” and “formal attire with white coat” equally in primary care or hospital settings. A smaller proportion of US respondents preferred “casual attire with white coat” in primary care (11%) and hospital settings (9%), but more preferred “formal attire with white coat” for primary care (44%) and hospital physicians (39%). In the ED setting, 32% of participants in Japan and 18% in the US disagreed with the idea that physicians should wear a white coat. Among Japanese participants, “scrubs without white coat” was rated highest for emergency physicians (56%) and surgeons (47%), while US preferences were 40% and 42%, respectively.10 One potential explanation is that scrubs-based attire became popular among Japanese ED and surgical contexts as a result of cultural influence and spread from western countries.19, 20
With respect to perceptions regarding physician attire on weekends, 52% of participants considered it inappropriate for a physician to dress casually over the weekend, compared with only 30% in Switzerland and 21% in the US.11,12 Given Japan’s level of formality and the fact that most Japanese physicians continue to work over the weekend,21-23 Japanese patients tend to expect their physicians to dress in more formal attire during these times.
Previous studies in Japan have demonstrated that older patients gave low ratings to scrubs and high ratings to white coat with any attire,15,17 and this was also the case in our study. Perhaps elderly patients reflect conservative values in their preferences of physician dress. Their perceptions may be less influenced by scenes portraying physicians in popular media when compared with the perceptions of younger patients. Though a 2015 systematic review and studies in other countries revealed white coats were preferred regardless of exact dress,9,24-26 they also showed variation in preferences for physician attire. For example, patients in Saudi Arabia preferred white coat and traditional ethnic dress,25 whereas mothers of pediatric patients in Saudi Arabia preferred scrubs for their pediatricians.27 Therefore, it is recommended for internationally mobile physicians to choose their dress depending on a variety of factors including country, context, and patient age group.
Our study has limitations. First, because some physicians presented the surveys to the patients, participants may have responded differently. Second, participants may have identified photographs of the male physician model as their personal healthcare provider (one author, K.K.). To avoid this possible bias, we randomly distributed 14 different versions of physician photographs in the questionnaire. Third, although physician photographs were strictly controlled, the “formal attire and white coat” and “casual attire and white coat” photographs appeared similar, especially given that the white coats were buttoned. Also, the female physician depicted in the photographs did not have the scrub shirt tucked in, while the male physician did. These nuances may have affected participant ratings between groups. Fourth,
In conclusion, patient preferences for physician attire were examined using a multicenter survey with a large sample size and robust survey methodology, thus overcoming weaknesses of previous studies into Japanese attire. Japanese patients perceive that physician attire is important and influences satisfaction with their care, more so than patients in other countries, like the US and Switzerland. Geography, settings of care, and patient age play a role in preferences. As a result, hospitals and health systems may use these findings to inform dress code policy based on patient population and context, recognizing that the appearance of their providers affects the patient-physician relationship. Future research should focus on better understanding the various cultural and societal customs that lead to patient expectations of physician attire.
Acknowledgments
The authors thank Drs. Fumi Takemoto, Masayuki Ueno, Kazuya Sakai, Saori Kinami, and Toshio Naito for their assistance with data collection at their respective sites. Additionally, the authors thank Dr. Yoko Kanamitsu for serving as a model for photographs.
1. Manary MP, Boulding W, Staelin R, Glickman SW. The patient experience and health outcomes. N Engl J Med. 2013;368(3):201-203. https://doi.org/ 10.1056/NEJMp1211775.
2. Boulding W, Glickman SW, Manary MP, Schulman KA, Staelin R. Relationship between patient satisfaction with inpatient care and hospital readmission within 30 days. Am J Manag Care. 2011;17(1):41-48.
3. Barbosa CD, Balp MM, Kulich K, Germain N, Rofail D. A literature review to explore the link between treatment satisfaction and adherence, compliance, and persistence. Patient Prefer Adherence. 2012;6:39-48. https://doi.org/10.2147/PPA.S24752.
4. Jha AK, Orav EJ, Zheng J, Epstein AM. Patients’ perception of hospital care in the United States. N Engl J Med. 2008;359(18):1921-31. https://doi.org/10.1056/NEJMsa080411.
5. O’Malley AS, Forrest CB, Mandelblatt J. Adherence of low-income women to cancer screening recommendations. J Gen Intern Med. 2002;17(2):144-54. https://doi.org/10.1046/j.1525-1497.2002.10431.x.
6. Chung H, Lee H, Chang DS, Kim HS, Park HJ, Chae Y. Doctor’s attire influences perceived empathy in the patient-doctor relationship. Patient Educ Couns. 2012;89(3):387-391. https://doi.org/10.1016/j.pec.2012.02.017.
7. Bianchi MT. Desiderata or dogma: what the evidence reveals about physician attire. J Gen Intern Med. 2008;23(5):641-643. https://doi.org/10.1007/s11606-008-0546-8.
8. Brandt LJ. On the value of an old dress code in the new millennium. Arch Intern Med. 2003;163(11):1277-1281. https://doi.org/10.1001/archinte.163.11.1277.
9. Petrilli CM, Mack M, Petrilli JJ, Hickner A, Saint S, Chopra V. Understanding the role of physician attire on patient perceptions: a systematic review of the literature--targeting attire to improve likelihood of rapport (TAILOR) investigators. BMJ Open. 2015;5(1):e006578. https://doi.org/10.1136/bmjopen-2014-006578.
10. Petrilli CM, Saint S, Jennings JJ, et al. Understanding patient preference for physician attire: a cross-sectional observational study of 10 academic medical centres in the USA. BMJ Open. 2018;8(5):e021239. https://doi.org/10.1136/bmjopen-2017-021239.
11. Rowbury R. The need for more proactive communications. Low trust and changing values mean Japan can no longer fall back on its homogeneity. The Japan Times. 2017, Oct 15;Sect. Opinion. https://www.japantimes.co.jp/opinion/2017/10/15/commentary/japan-commentary/need-proactive-communications/#.Xej7lC3MzUI. Accessed December 5, 2019.
12. Shoji Nishimura ANaST. Communication Style and Cultural Features in High/Low Context Communication Cultures: A Case Study of Finland, Japan and India. Nov 22nd, 2009.
13. Smith RMRSW. The influence of high/low-context culture and power distance on choice of communication media: Students’ media choice to communicate with Professors in Japan and America. Int J Intercultural Relations. 2007;31(4):479-501.
14. Yamada Y, Takahashi O, Ohde S, Deshpande GA, Fukui T. Patients’ preferences for doctors’ attire in Japan. Intern Med. 2010;49(15):1521-1526. https://doi.org/10.2169/internalmedicine.49.3572.
15. Ikusaka M, Kamegai M, Sunaga T, et al. Patients’ attitude toward consultations by a physician without a white coat in Japan. Intern Med. 1999;38(7):533-536. https://doi.org/10.2169/internalmedicine.38.533.
16. Lefor AK, Ohnuma T, Nunomiya S, Yokota S, Makino J, Sanui M. Physician attire in the intensive care unit in Japan influences visitors’ perception of care. J Crit Care. 2018;43:288-293.
17. Kurihara H, Maeno T. Importance of physicians’ attire: factors influencing the impression it makes on patients, a cross-sectional study. Asia Pac Fam Med. 2014;13(1):2. https://doi.org/10.1186/1447-056X-13-2.
18. Zollinger M, Houchens N, Chopra V, et al. Understanding patient preference for physician attire in ambulatory clinics: a cross-sectional observational study. BMJ Open. 2019;9(5):e026009. https://doi.org/10.1136/bmjopen-2018-026009.
19. Chung JE. Medical Dramas and Viewer Perception of Health: Testing Cultivation Effects. Hum Commun Res. 2014;40(3):333-349.
20. Michael Pfau LJM, Kirsten Garrow. The influence of television viewing on public perceptions of physicians. J Broadcast Electron Media. 1995;39(4):441-458.
21. Suzuki S. Exhausting physicians employed in hospitals in Japan assessed by a health questionnaire [in Japanese]. Sangyo Eiseigaku Zasshi. 2017;59(4):107-118. https://doi.org/10.1539/sangyoeisei.
22. Ogawa R, Seo E, Maeno T, Ito M, Sanuki M. The relationship between long working hours and depression among first-year residents in Japan. BMC Med Educ. 2018;18(1):50. https://doi.org/10.1186/s12909-018-1171-9.
23. Saijo Y, Chiba S, Yoshioka E, et al. Effects of work burden, job strain and support on depressive symptoms and burnout among Japanese physicians. Int J Occup Med Environ Health. 2014;27(6):980-992. https://doi.org/10.2478/s13382-014-0324-2.
24. Tiang KW, Razack AH, Ng KL. The ‘auxiliary’ white coat effect in hospitals: perceptions of patients and doctors. Singapore Med J. 2017;58(10):574-575. https://doi.org/10.11622/smedj.2017023.
25. Al Amry KM, Al Farrah M, Ur Rahman S, Abdulmajeed I. Patient perceptions and preferences of physicians’ attire in Saudi primary healthcare setting. J Community Hosp Intern Med Perspect. 2018;8(6):326-330. https://doi.org/10.1080/20009666.2018.1551026.
26. Healy WL. Letter to the editor: editor’s spotlight/take 5: physicians’ attire influences patients’ perceptions in the urban outpatient orthopaedic surgery setting. Clin Orthop Relat Res. 2016;474(11):2545-2546. https://doi.org/10.1007/s11999-016-5049-z.
27. Aldrees T, Alsuhaibani R, Alqaryan S, et al. Physicians’ attire. Parents preferences in a tertiary hospital. Saudi Med J. 2017;38(4):435-439. https://doi.org/10.15537/smj.2017.4.15853.
The patient-physician relationship is critical for ensuring the delivery of high-quality healthcare. Successful patient-physician relationships arise from shared trust, knowledge, mutual respect, and effective verbal and nonverbal communication. The ways in which patients experience healthcare and their satisfaction with physicians affect a myriad of important health outcomes, such as adherence to treatment and outcomes for conditions such as hypertension and diabetes mellitus.1-5 One method for potentially enhancing patient satisfaction is through understanding how patients wish their physicians to dress6-8 and tailoring attire to match these expectations. In addition to our systematic review,9 a recent large-scale, multicenter study in the United States revealed that most patients perceive physician attire as important, but that preferences for specific types of attire are contextual.9,10 For example, elderly patients preferred physicians in formal attire and white coat, while scrubs with white coat or scrubs alone were preferred for emergency department (ED) physicians and surgeons, respectively. Moreover, regional variation regarding attire preference was also observed in the US, with preferences for more formal attire in the South and less formal in the Midwest.
Geographic variation, regarding patient preferences for physician dress, is perhaps even more relevant internationally. In particular, Japan is considered to have a highly contextualized culture that relies on nonverbal and implicit communication. However, medical professionals have no specific dress code and, thus, don many different kinds of attire. In part, this may be because it is not clear whether or how physician attire impacts patient satisfaction and perceived healthcare quality in Japan.11-13 Although previous studies in Japan have suggested that physician attire has a considerable influence on patient satisfaction, these studies either involved a single department in one hospital or a small number of respondents.14-17 Therefore, we performed a multicenter, cross-sectional study to understand patients’ preferences for physician attire in different clinical settings and in different geographic regions in Japan.
METHODS
Study Population
We conducted a cross-sectional, questionnaire-based study from 2015 to 2017, in four geographically diverse hospitals in Japan. Two of these hospitals, Tokyo Joto Hospital and Juntendo University Hospital, are located in eastern Japan whereas the others, Kurashiki Central Hospital and Akashi Medical Center, are in western Japan.
Questionnaires were printed and randomly distributed by research staff to outpatients in waiting rooms and inpatients in medical wards who were 20 years of age or older. We placed no restriction on ward site or time of questionnaire distribution. Research staff, including physicians, nurses, and medical clerks, were instructed to avoid guiding or influencing participants’ responses. Informed consent was obtained by the staff; only those who provided informed consent participated in the study. Respondents could request assistance with form completion from persons accompanying them if they had difficulties, such as physical, visual, or hearing impairments. All responses were collected anonymously. The study was approved by the ethics committees of all four hospitals.
Questionnaire
We used a modified version of the survey instrument from a prior study.10 The first section of the survey showed photographs of either a male or female physician with 7 unique forms of attire, including casual, casual with white coat, scrubs, scrubs with white coat, formal, formal with white coat, and business suit (Figure 1). Given the Japanese context of this study, the language was translated to Japanese and photographs of physicians of Japanese descent were used. Photographs were taken with attention paid to achieving constant facial expressions on the physicians as well as in other visual cues (eg, lighting, background, pose). The physician’s gender and attire in the first photograph seen by each respondent were randomized to prevent bias in ordering, priming, and anchoring; all other sections of the survey were identical.
Respondents were first asked to rate the standalone, randomized physician photograph using a 1-10 scale across five domains (ie, how knowledgeable, trustworthy, caring, and approachable the physician appeared and how comfortable the physician’s appearance made the respondent feel), with a score of 10 representing the highest rating. Respondents were subsequently given 7 photographs of the same physician wearing various forms of attire. Questions were asked regarding preference of attire in varied clinical settings (ie, primary care, ED, hospital, surgery, overall preference). To identify the influence of and respondent preferences for physician dress and white coats, a Likert scale ranging from 1 (strongly disagree) to 5 (strongly agree) was employed. The scale was trichotomized into “disagree” (1, 2), “neither agree nor disagree” (3), and “agree” (4, 5) for analysis. Demographic data, including age, gender, education level, nationality (Japanese or non-Japanese), and number of physicians seen in the past year were collected.
Outcomes and Sample Size Calculation
The primary outcome of attire preference was calculated as the mean composite score of the five individual rating domains (ie, knowledgeable, trustworthy, caring, approachable, and comfortable), with the highest score representing the most preferred form of attire. We also assessed variation in preferences for physician attire by respondent characteristics, such as age and gender.
Sample size estimation was based on previous survey methodology.10 The Likert scale range for identifying influence of and respondent preferences for physician dress and white coats was 1-5 (“strongly disagree” to “strongly agree”). The scale range for measuring preferences for the randomized attire photograph was 1-10. An assumption of normality was made regarding responses on the 1-10 scale. An estimated standard deviation of 2.2 was assumed, based on prior findings.10 Based on these assumptions and the inclusion of at least 816 respondents (assuming a two-sided alpha error of 0.05), we expected to have 90% capacity to detect differences for effect sizes of 0.50 on the 1-10 scale.
Statistical Analyses
Paper-based survey data were entered independently and in duplicate by the study team. Respondents were not required to answer all questions; therefore, the denominator for each question varied. Data were reported as mean and standard deviation (SD) or percentages, where appropriate. Differences in the mean composite rating scores were assessed using one-way ANOVA with the Tukey method for pairwise comparisons. Differences in proportions for categorical data were compared using the Z-test. Chi-squared tests were used for bivariate comparisons between respondent age, gender, and level of education and corresponding respondent preferences. All analyses were performed using Stata 14 MP/SE (Stata Corp., College Station, Texas, USA).
RESULTS
Characteristics of Participants
Between December 1, 2015 and October 30, 2017, a total of 2,020 surveys were completed by patients across four academic hospitals in Japan. Of those, 1,960 patients (97.0%) completed the survey in its entirety. Approximately half of the respondents were 65 years of age or older (49%), of female gender (52%), and reported receiving care in the outpatient setting (53%). Regarding use of healthcare, 91% had seen more than one physician in the year preceding the time of survey completion (Table 1).
Ratings of Physician Attire
Compared with all forms of attire depicted in the survey’s first standalone photograph, respondents rated “casual attire with white coat” the highest (Figure 2). The mean composite score for “casual attire with white coat” was 7.1 (standard deviation [SD] = 1.8), and this attire was set as the referent group. Cronbach’s alpha, for the five items included in the composite score, was 0.95. However, “formal attire with white coat” was rated almost as highly as “casual attire with white coat” with an overall mean composite score of 7.0 (SD = 1.6).
Variation in Preference for Physician Attire by Clinical Setting
Preferences for physician attire varied by clinical care setting. Most respondents preferred “casual attire with white coat” or “formal attire with white coat” in both primary care and hospital settings, with a slight preference for “casual attire with white coat.” In contrast, respondents preferred “scrubs without white coat” in the ED and surgical settings. When asked about their overall preference, respondents reported they felt their physician should wear “formal attire with white coat” (35%) or “casual attire with white coat” (30%; Table 2). When comparing the group of photographs of physicians with white coats to the group without white coats (Figure 1), respondents preferred physicians wearing white coats overall and specifically when providing care in primary care and hospital settings. However, they preferred physicians without white coats when providing care in the ED (P < .001). With respect to surgeons, there was no statistically significant difference between preference for white coats and no white coats. These results were similar for photographs of both male and female physicians.
When asked whether physician dress was important to them and if physician attire influenced their satisfaction with the care received, 61% of participants agreed that physician dress was important, and 47% agreed that physician attire influenced satisfaction (Appendix Table 1). With respect to appropriateness of physicians dressing casually over the weekend in clinical settings, 52% responded that casual wear was inappropriate, while 31% had a neutral opinion.
Participants were asked whether physicians should wear a white coat in different clinical settings. Nearly two-thirds indicated a preference for white coats in the office and hospital (65% and 64%, respectively). Responses regarding whether emergency physicians should wear white coats were nearly equally divided (Agree, 37%; Disagree, 32%; Neither Agree nor Disagree, 31%). However, “scrubs without white coat” was most preferred (56%) when patients were given photographs of various attire and asked, “Which physician would you prefer to see when visiting the ER?” Responses to the question “Physicians should always wear a white coat when seeing patients in any setting” varied equally (Agree, 32%; Disagree, 34%; Neither Agree nor Disagree, 34%).
Variation in Preference for Physician Attire by Respondent Demographics
When comparing respondents by age, those 65 years or older preferred “formal attire with white coat” more so than respondents younger than 65 years (Appendix Table 2). This finding was identified in both primary care (36% vs 31%, P < .001) and hospital settings (37% vs 30%, P < .001). Additionally, physician attire had a greater impact on older respondents’ satisfaction and experience (Appendix Table 3). For example, 67% of respondents 65 years and older agreed that physician attire was important, and 54% agreed that attire influenced satisfaction. Conversely, for respondents younger than 65 years, the proportion agreeing with these statements was lower (56% and 41%, both P < .001). When comparing older and younger respondents, those 65 years and older more often preferred physicians wearing white coats in any setting (39% vs 26%, P < .001) and specifically in their office (68% vs 61%, P = .002), the ED (40% vs 34%, P < .001), and the hospital (69% vs 60%, P < .001).
When comparing male and female respondents, male respondents more often stated that physician dress was important to them (men, 64%; women, 58%; P = .002). When comparing responses to the question “Overall, which clothes do you feel a doctor should wear?”, between the eastern and western Japanese hospitals, preferences for physician attire varied.
Variation in Expectations Between Male and Female Physicians
When comparing the ratings of male and female physicians, female physicians were rated higher in how caring (P = .005) and approachable (P < .001) they appeared. However, there were no significant differences in the ratings of the three remaining domains (ie, knowledgeable, trustworthy, and comfortable) or the composite score.
DISCUSSION
Since we employed the same methodology as previous studies conducted in the US10 and Switzerland,18 a notable strength of our approach is that comparisons among these countries can be drawn. For example, physician attire appears to hold greater importance in Japan than in the US and Switzerland. Among Japanese participants, 61% agreed that physician dress is important (US, 53%; Switzerland, 36%), and 47% agreed that physician dress influenced how satisfied they were with their care (US, 36%; Switzerland, 23%).10 This result supports the notion that nonverbal and implicit communications (such as physician dress) may carry more importance among Japanese people.11-13
Regarding preference ratings for type of dress among respondents in Japan, “casual attire with white coat” received the highest mean composite score rating, with “formal attire with white coat” rated second overall. In contrast, US respondents rated “formal attire with white coat” highest and “scrubs with white coat” second.10 Our result runs counter to our expectation in that we expected Japanese respondents to prefer formal attire, since Japan is one of the most formal cultures in the world. One potential explanation for this difference is that the casual style chosen for this study was close to the smart casual style (slightly casual). Most hospitals and clinics in Japan do not allow physicians to wear jeans or polo shirts, which were chosen as the casual attire in the previous US study.
When examining various care settings and physician types, both Japanese and US respondents were more likely to prefer physicians wearing a white coat in the office or hospital.10 However, Japanese participants preferred both “casual attire with white coat” and “formal attire with white coat” equally in primary care or hospital settings. A smaller proportion of US respondents preferred “casual attire with white coat” in primary care (11%) and hospital settings (9%), but more preferred “formal attire with white coat” for primary care (44%) and hospital physicians (39%). In the ED setting, 32% of participants in Japan and 18% in the US disagreed with the idea that physicians should wear a white coat. Among Japanese participants, “scrubs without white coat” was rated highest for emergency physicians (56%) and surgeons (47%), while US preferences were 40% and 42%, respectively.10 One potential explanation is that scrubs-based attire became popular among Japanese ED and surgical contexts as a result of cultural influence and spread from western countries.19, 20
With respect to perceptions regarding physician attire on weekends, 52% of participants considered it inappropriate for a physician to dress casually over the weekend, compared with only 30% in Switzerland and 21% in the US.11,12 Given Japan’s level of formality and the fact that most Japanese physicians continue to work over the weekend,21-23 Japanese patients tend to expect their physicians to dress in more formal attire during these times.
Previous studies in Japan have demonstrated that older patients gave low ratings to scrubs and high ratings to white coat with any attire,15,17 and this was also the case in our study. Perhaps elderly patients reflect conservative values in their preferences of physician dress. Their perceptions may be less influenced by scenes portraying physicians in popular media when compared with the perceptions of younger patients. Though a 2015 systematic review and studies in other countries revealed white coats were preferred regardless of exact dress,9,24-26 they also showed variation in preferences for physician attire. For example, patients in Saudi Arabia preferred white coat and traditional ethnic dress,25 whereas mothers of pediatric patients in Saudi Arabia preferred scrubs for their pediatricians.27 Therefore, it is recommended for internationally mobile physicians to choose their dress depending on a variety of factors including country, context, and patient age group.
Our study has limitations. First, because some physicians presented the surveys to the patients, participants may have responded differently. Second, participants may have identified photographs of the male physician model as their personal healthcare provider (one author, K.K.). To avoid this possible bias, we randomly distributed 14 different versions of physician photographs in the questionnaire. Third, although physician photographs were strictly controlled, the “formal attire and white coat” and “casual attire and white coat” photographs appeared similar, especially given that the white coats were buttoned. Also, the female physician depicted in the photographs did not have the scrub shirt tucked in, while the male physician did. These nuances may have affected participant ratings between groups. Fourth,
In conclusion, patient preferences for physician attire were examined using a multicenter survey with a large sample size and robust survey methodology, thus overcoming weaknesses of previous studies into Japanese attire. Japanese patients perceive that physician attire is important and influences satisfaction with their care, more so than patients in other countries, like the US and Switzerland. Geography, settings of care, and patient age play a role in preferences. As a result, hospitals and health systems may use these findings to inform dress code policy based on patient population and context, recognizing that the appearance of their providers affects the patient-physician relationship. Future research should focus on better understanding the various cultural and societal customs that lead to patient expectations of physician attire.
Acknowledgments
The authors thank Drs. Fumi Takemoto, Masayuki Ueno, Kazuya Sakai, Saori Kinami, and Toshio Naito for their assistance with data collection at their respective sites. Additionally, the authors thank Dr. Yoko Kanamitsu for serving as a model for photographs.
1. Manary MP, Boulding W, Staelin R, Glickman SW. The patient experience and health outcomes. N Engl J Med. 2013;368(3):201-203. https://doi.org/ 10.1056/NEJMp1211775.
2. Boulding W, Glickman SW, Manary MP, Schulman KA, Staelin R. Relationship between patient satisfaction with inpatient care and hospital readmission within 30 days. Am J Manag Care. 2011;17(1):41-48.
3. Barbosa CD, Balp MM, Kulich K, Germain N, Rofail D. A literature review to explore the link between treatment satisfaction and adherence, compliance, and persistence. Patient Prefer Adherence. 2012;6:39-48. https://doi.org/10.2147/PPA.S24752.
4. Jha AK, Orav EJ, Zheng J, Epstein AM. Patients’ perception of hospital care in the United States. N Engl J Med. 2008;359(18):1921-31. https://doi.org/10.1056/NEJMsa080411.
5. O’Malley AS, Forrest CB, Mandelblatt J. Adherence of low-income women to cancer screening recommendations. J Gen Intern Med. 2002;17(2):144-54. https://doi.org/10.1046/j.1525-1497.2002.10431.x.
6. Chung H, Lee H, Chang DS, Kim HS, Park HJ, Chae Y. Doctor’s attire influences perceived empathy in the patient-doctor relationship. Patient Educ Couns. 2012;89(3):387-391. https://doi.org/10.1016/j.pec.2012.02.017.
7. Bianchi MT. Desiderata or dogma: what the evidence reveals about physician attire. J Gen Intern Med. 2008;23(5):641-643. https://doi.org/10.1007/s11606-008-0546-8.
8. Brandt LJ. On the value of an old dress code in the new millennium. Arch Intern Med. 2003;163(11):1277-1281. https://doi.org/10.1001/archinte.163.11.1277.
9. Petrilli CM, Mack M, Petrilli JJ, Hickner A, Saint S, Chopra V. Understanding the role of physician attire on patient perceptions: a systematic review of the literature--targeting attire to improve likelihood of rapport (TAILOR) investigators. BMJ Open. 2015;5(1):e006578. https://doi.org/10.1136/bmjopen-2014-006578.
10. Petrilli CM, Saint S, Jennings JJ, et al. Understanding patient preference for physician attire: a cross-sectional observational study of 10 academic medical centres in the USA. BMJ Open. 2018;8(5):e021239. https://doi.org/10.1136/bmjopen-2017-021239.
11. Rowbury R. The need for more proactive communications. Low trust and changing values mean Japan can no longer fall back on its homogeneity. The Japan Times. 2017, Oct 15;Sect. Opinion. https://www.japantimes.co.jp/opinion/2017/10/15/commentary/japan-commentary/need-proactive-communications/#.Xej7lC3MzUI. Accessed December 5, 2019.
12. Shoji Nishimura ANaST. Communication Style and Cultural Features in High/Low Context Communication Cultures: A Case Study of Finland, Japan and India. Nov 22nd, 2009.
13. Smith RMRSW. The influence of high/low-context culture and power distance on choice of communication media: Students’ media choice to communicate with Professors in Japan and America. Int J Intercultural Relations. 2007;31(4):479-501.
14. Yamada Y, Takahashi O, Ohde S, Deshpande GA, Fukui T. Patients’ preferences for doctors’ attire in Japan. Intern Med. 2010;49(15):1521-1526. https://doi.org/10.2169/internalmedicine.49.3572.
15. Ikusaka M, Kamegai M, Sunaga T, et al. Patients’ attitude toward consultations by a physician without a white coat in Japan. Intern Med. 1999;38(7):533-536. https://doi.org/10.2169/internalmedicine.38.533.
16. Lefor AK, Ohnuma T, Nunomiya S, Yokota S, Makino J, Sanui M. Physician attire in the intensive care unit in Japan influences visitors’ perception of care. J Crit Care. 2018;43:288-293.
17. Kurihara H, Maeno T. Importance of physicians’ attire: factors influencing the impression it makes on patients, a cross-sectional study. Asia Pac Fam Med. 2014;13(1):2. https://doi.org/10.1186/1447-056X-13-2.
18. Zollinger M, Houchens N, Chopra V, et al. Understanding patient preference for physician attire in ambulatory clinics: a cross-sectional observational study. BMJ Open. 2019;9(5):e026009. https://doi.org/10.1136/bmjopen-2018-026009.
19. Chung JE. Medical Dramas and Viewer Perception of Health: Testing Cultivation Effects. Hum Commun Res. 2014;40(3):333-349.
20. Michael Pfau LJM, Kirsten Garrow. The influence of television viewing on public perceptions of physicians. J Broadcast Electron Media. 1995;39(4):441-458.
21. Suzuki S. Exhausting physicians employed in hospitals in Japan assessed by a health questionnaire [in Japanese]. Sangyo Eiseigaku Zasshi. 2017;59(4):107-118. https://doi.org/10.1539/sangyoeisei.
22. Ogawa R, Seo E, Maeno T, Ito M, Sanuki M. The relationship between long working hours and depression among first-year residents in Japan. BMC Med Educ. 2018;18(1):50. https://doi.org/10.1186/s12909-018-1171-9.
23. Saijo Y, Chiba S, Yoshioka E, et al. Effects of work burden, job strain and support on depressive symptoms and burnout among Japanese physicians. Int J Occup Med Environ Health. 2014;27(6):980-992. https://doi.org/10.2478/s13382-014-0324-2.
24. Tiang KW, Razack AH, Ng KL. The ‘auxiliary’ white coat effect in hospitals: perceptions of patients and doctors. Singapore Med J. 2017;58(10):574-575. https://doi.org/10.11622/smedj.2017023.
25. Al Amry KM, Al Farrah M, Ur Rahman S, Abdulmajeed I. Patient perceptions and preferences of physicians’ attire in Saudi primary healthcare setting. J Community Hosp Intern Med Perspect. 2018;8(6):326-330. https://doi.org/10.1080/20009666.2018.1551026.
26. Healy WL. Letter to the editor: editor’s spotlight/take 5: physicians’ attire influences patients’ perceptions in the urban outpatient orthopaedic surgery setting. Clin Orthop Relat Res. 2016;474(11):2545-2546. https://doi.org/10.1007/s11999-016-5049-z.
27. Aldrees T, Alsuhaibani R, Alqaryan S, et al. Physicians’ attire. Parents preferences in a tertiary hospital. Saudi Med J. 2017;38(4):435-439. https://doi.org/10.15537/smj.2017.4.15853.
© 2020 Society of Hospital Medicine
Long Peripheral Catheters: A Retrospective Review of Major Complications
Introduced in the 1950s, midline catheters have become a popular option for intravenous (IV) access.1,2 Ranging from 8 to 25 cm in length, they are inserted in the veins of the upper arm. Unlike peripherally inserted central catheters (PICCs), the tip of midline catheters terminates proximal to the axillary vein; thus, midlines are peripheral, not central venous access devices.1-3 One popular variation of a midline catheter, though nebulously defined, is the long peripheral catheter (LPC), a device ranging from 6 to 15 cm in length.4,5
Concerns regarding inappropriate use and complications such as thrombosis and central line-associated bloodstream infection (CLABSI) have spurred growth in the use of LPCs.6 However, data regarding complication rates with these devices are limited. Whether LPCs are a safe and viable option for IV access is unclear. We conducted a retrospective study to examine indications, patterns of use, and complications following LPC insertion in hospitalized patients.
METHODS
Device Selection
Our institution is a 470-bed tertiary care, safety-net hospital in Chicago, Illinois. Our vascular access team (VAT) performs a patient assessment and selects IV devices based upon published standards for device appropriateness. 7 We retrospectively collated electronic requests for LPC insertion on adult inpatients between October 2015 and June 2017. Cases where (1) duplicate orders, (2) patient refusal, (3) peripheral intravenous catheter of any length, or (4) PICCs were placed were excluded from this analysis.
VAT and Device Characteristics
We used Bard PowerGlide® (Bard Access Systems, Inc., Salt Lake City, Utah), an 18-gauge, 8-10 cm long, power-injectable, polyurethane LPC. Bundled kits (ie, device, gown, dressing, etc.) were utilized, and VAT providers underwent two weeks of training prior to the study period. All LPCs were inserted in the upper extremities under sterile technique using ultrasound guidance (accelerated Seldinger technique). Placement confirmation was verified by aspiration, flush, and ultrasound visualization of the catheter tip within the vein. An antimicrobial dressing was applied to the catheter insertion site, and daily saline flushes and weekly dressing changes by bedside nurses were used for device maintenance. LPC placement was available on all nonholiday weekdays from 8
Data Selection
For each LPC recipient, demographic and comorbidity data were collected to calculate the Charlson Comorbidity Index (Table 1). Every LPC recipient’s history of deep vein thrombosis (DVT) and catheter-related infection (CRI) was recorded. Procedural information (eg, inserter, vein, and number of attempts) was obtained from insertion notes. All data were extracted from the electronic medical record via chart review. Two reviewers verified outcomes to ensure concordance with stated definitions (ie, DVT, CRI). Device parameters, including dwell time, indication, and time to complication(s) were also collected.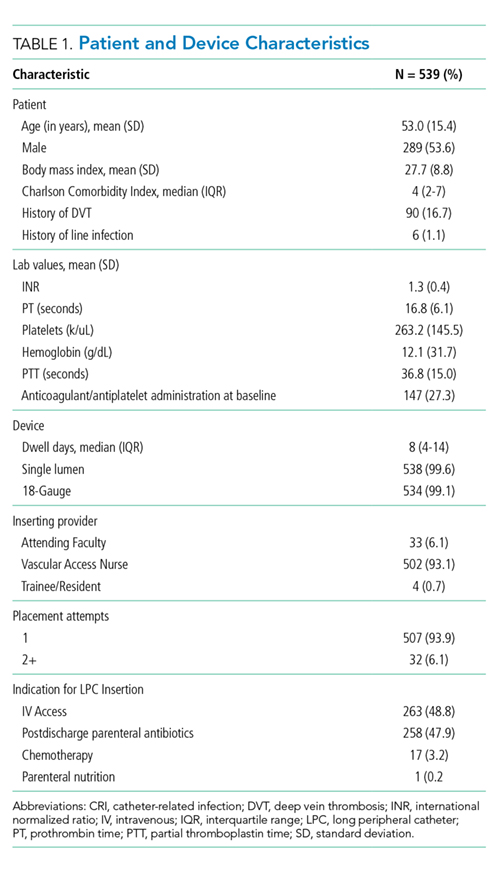
Primary Outcomes
The primary outcome was the incidence of DVT and CRI (Table 2). DVT was defined as radiographically confirmed (eg, ultrasound, computed tomography) thrombosis in the presence of patient signs or symptoms. CRI was defined in accordance with Timsit et al.8 as follows: catheter-related clinical sepsis without bloodstream infection defined as (1) combination of fever (body temperature >38.5°C) or hypothermia (body temperature <36.5°C), (2) catheter-tip culture yielding ≥103 CFUs/mL, (3) pus at the insertion site or resolution of clinical sepsis after catheter removal, and (4) absence of any other infectious focus or catheter-related bloodstream infection (CRBSI). CRBSI was defined as a combination of (1) one or more positive peripheral blood cultures sampled immediately before or within 48 hours after catheter removal, (2) a quantitative catheter-tip culture testing positive for the same microorganisms (same species and susceptibility pattern) or a differential time to positivity of blood cultures ≥2 hours, and (3) no other infectious focus explaining the positive blood culture result.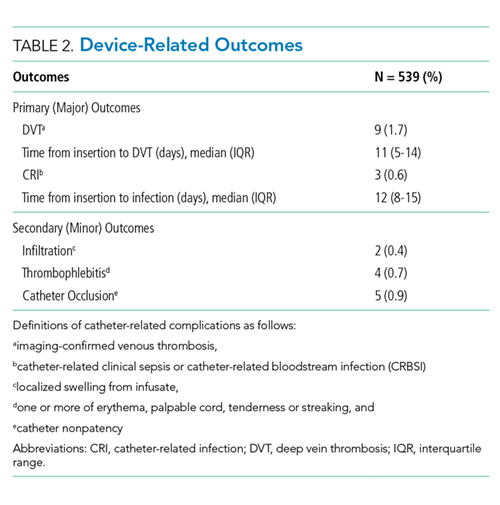
Secondary Outcomes
Secondary outcomes, defined as minor complications, included infiltration, thrombophlebitis, and catheter occlusion. Infiltration was defined as localized swelling due to infusate or site leakage. Thrombophlebitis was defined as one or more of the following: localized erythema, palpable cord, tenderness, or streaking. Occlusion was defined as nonpatency of the catheter due to the inability to flush or aspirate. Definitions for secondary outcomes are consistent with those used in prior studies.9
Statistical Analysis
Patient and LPC characteristics were analyzed using descriptive statistics. Results were reported as percentages, means, medians (interquartile range [IQR]), and rates per 1,000 catheter days. All analyses were conducted in Stata v.15 (StataCorp, College Station, Texas).
RESULTS
Within the 20-month study period, a total of 539 LPCs representing 5,543 catheter days were available for analysis. The mean patient age was 53 years. A total of 90 patients (16.7%) had a history of DVT, while 6 (1.1%) had a history of CRI. We calculated a median Charlson index of 4 (interquartile range [IQR], 2-7), suggesting an estimated one-year postdischarge survival of 53% (Table 1).
The majority of LPCs (99.6% [537/539]) were single lumen catheters. No patient had more than one concurrent LPC. The cannulation success rate on the first attempt was 93.9% (507/539). The brachial or basilic veins were primarily targeted (98.7%, [532/539]). Difficult intravenous access represented 48.8% (263/539) of indications, and postdischarge parenteral antibiotics constituted 47.9% (258/539). The median catheter dwell time was eight days (IQR, 4-14 days).
Nine DVTs (1.7% [9/539]) occurred in patients with LPCs. The incidence of DVT was higher in patients with a history of DVT (5.7%, 5/90). The median time from insertion to DVT was 11 (IQR, 5-14) days. DVTs were managed with LPC removal and systemic anticoagulation in accordance with catheter-related DVT guidelines. The rate of CRI was 0.6% (3/539), or 0.54 per 1,000 catheter days. Two CRIs had positive blood cultures, while one had negative cultures. Infections occurred after a median of 12 (IQR, 8-15) days of catheter dwell. Each was treated with LPC removal and IV antibiotics, with two patients receiving two weeks and one receiving six weeks of antibiotic therapy (Table 2).
With respect to secondary outcomes, the incidence of infiltration was 0.4% (2/539), thrombophlebitis 0.7% (4/539), and catheter occlusion 0.9% (5/539). The time to event was 8.5, 3.75, and 5.4 days, respectively. Collectively, 2.0% of devices experienced a minor complication.
DISCUSSION
In our single-center study, LPCs were primarily inserted for difficult venous access or parenteral antibiotics. Despite a clinically complex population with a high number of comorbidities, rates of major and minor complications associated with LPCs were low. These data suggest that LPCs are a safe alternative to PICCs and other central access devices for short-term use.
Our incidence of CRI of 0.6% (0.54 per 1,000 catheter days) is similar to or lower than other studies.2,10,11 An incidence of 0%-1.5% was observed in two recent publications about midline catheters, with rates across individual studies and hospital sites varying widely.12,13 A systematic review of intravascular devices reported CRI rates of 0.4% (0.2 per 1,000 catheter days) for midlines and 0.1% (0.5 per 1,000 catheter days for peripheral IVs), in contrast to PICCs at 3.1% (1.1 per 1,000 catheter days).14 However, catheters of varying lengths and diameters were used in studies within the review, potentially leading to heterogeneous outcomes. In accordance with existing data, CRI incidence in our study increased with catheter dwell time.10
The 1.7% rate of DVT observed in our study is on the lower end of existing data (1.4%-5.9%).12-15 Compared with PICCs (2%-15%), the incidence of venous thrombosis appears to be lower with midlines/LPCs—justifying their use as an alternative device for IV access.7,9,12,14 There was an overall low rate of minor complications, similar to recently published results.10 As rates were greater in patients with a history of DVT (5.7%), caution is warranted when using these devices in this population.
Our experience with LPCs suggests financial and patient benefits. The cost of LPCs is lower than central access devices.4 As rates of CRI were low, costs related to CLABSIs from PICC use may be reduced by appropriate LPC use. LPCs may allow the ability to draw blood routinely, which could improve the patient experience—albeit with its own risks. Current recommendations support the use of PICCs or LPCs, somewhat interchangeably, for patients with appropriate indications needing IV therapy for more than five to six days.2,7 However, LPCs now account for 57% of vascular access procedures in our center and have led to a decrease in reliance on PICCs and attendant complications.
Our study has several limitations. First, LPCs and midlines are often used interchangeably in the literature.4,5 Therefore, reported complication rates may not reflect those of LPCs alone and may limit comparisons. Second, ours was a single-center study with experts assessing device appropriateness and performing ultrasound-guided insertions; our findings may not be generalizable to dissimilar settings. Third, we did not track LPC complications such as nonpatency and leakage. As prior studies reported high rates of complications such as these events, caution is advised when interpreting our findings.15 Finally, we retrospectively extracted data from our medical records; limitations in documentation may influence our findings.
CONCLUSION
In patients requiring short-term IV therapy, these data suggest LPCs have low complication rates and may be safely used as an alternative option for venous access.
Acknowledgments
The authors thank Drs. Laura Hernandez, Andres Mendez Hernandez, and Victor Prado for their assistance in data collection. The authors also thank Mr. Onofre Donceras and Dr. Sharon Welbel from the John H. Stroger, Jr. Hospital of Cook County Department of Infection Control & Epidemiology for their assistance in reviewing local line infection data.
Drs. Patel and Chopra developed the study design. Drs. Patel, Araujo, Parra Rodriguez, Ramirez Sanchez, and Chopra contributed to manuscript writing. Ms. Snyder provided statistical analysis. All authors have seen and approved the final manuscript for submission.
Disclosures
The authors have nothing to disclose.
1. Anderson NR. Midline catheters: the middle ground of intravenous therapy administration. J Infus Nurs. 2004;27(5):313-321.
2. Adams DZ, Little A, Vinsant C, et al. The midline catheter: a clinical review. J Emerg Med. 2016;51(3):252-258. https://doi.org/10.1016/j.jemermed.2016.05.029.
3. Scoppettuolo G, Pittiruti M, Pitoni S, et al. Ultrasound-guided “short” midline catheters for difficult venous access in the emergency department: a retrospective analysis. Int J Emerg Med. 2016;9(1):3. https://doi.org/10.1186/s12245-016-0100-0.
4. Qin KR, Nataraja RM, Pacilli M. Long peripheral catheters: is it time to address the confusion? J Vasc Access. 2018;20(5). https://doi.org/10.1177/1129729818819730.
5. Pittiruti M, Scoppettuolo G. The GAVeCeLT Manual of PICC and Midlines. Milano: EDRA; 2016.
6. Dawson RB, Moureau NL. Midline catheters: an essential tool in CLABSI reduction. Infection Control Today. https://www.infectioncontroltoday.com/clabsi/midline-catheters-essential-tool-clabsi-reduction. Accessed February 19, 2018
7. Chopra V, Flanders SA, Saint S, et al. The Michigan Appropriateness Guide for Intravenous Catheters (MAGIC): results from a multispecialty panel using the RAND/UCLA appropriateness method. Ann Intern Med. 2015;163(6):S1-S40. https://doi.org/10.7326/M15-0744.
8. Timsit JF, Schwebel C, Bouadma L, et al. Chlorhexidine-impregnated sponges and less frequent dressing changes for prevention of catheter-related infections in critically ill adults: a randomized controlled trial. JAMA. 2009;301(12):1231-1241. https://doi.org/10.1001/jama.2009.376.
9. Bahl A, Karabon P, Chu D. Comparison of venous thrombosis complications in midlines versus peripherally inserted central catheters: are midlines the safer option? Clin Appl Thromb Hemost. 2019;25. https://doi.org/10.1177/1076029619839150.
10. Goetz AM, Miller J, Wagener MM, et al. Complications related to intravenous midline catheter usage. A 2-year study. J Intraven Nurs. 1998;21(2):76-80.
11. Xu T, Kingsley L, DiNucci S, et al. Safety and utilization of peripherally inserted central catheters versus midline catheters at a large academic medical center. Am J Infect Control. 2016;44(12):1458-1461. https://doi.org/10.1016/j.ajic.2016.09.010.
12. Chopra V, Kaatz S, Swaminathan L, et al. Variation in use and outcomes related to midline catheters: results from a multicentre pilot study. BMJ Qual Saf. 2019;28(9):714-720. https://doi.org/10.1136/bmjqs-2018-008554.
13. Badger J. Long peripheral catheters for deep arm vein venous access: A systematic review of complications. Heart Lung. 2019;48(3):222-225. https://doi.org/10.1016/j.hrtlng.2019.01.002.
14. Maki DG, Kluger DM, Crnich CJ. The risk of bloodstream infection in adults with different intravascular devices: a systematic review of 200 published prospective studies. Mayo Clin Proc. 2006;81(9):1159-1171. https://doi.org/10.4065/81.9.1159.
15. Zerla PA, Caravella G, De Luca G, et al. Open- vs closed-tip valved peripherally inserted central catheters and midlines: Findings from a vascular access database. J Assoc Vasc Access. 2015;20(3):169-176. https://doi.org/10.1016/j.java.2015.06.001.
Introduced in the 1950s, midline catheters have become a popular option for intravenous (IV) access.1,2 Ranging from 8 to 25 cm in length, they are inserted in the veins of the upper arm. Unlike peripherally inserted central catheters (PICCs), the tip of midline catheters terminates proximal to the axillary vein; thus, midlines are peripheral, not central venous access devices.1-3 One popular variation of a midline catheter, though nebulously defined, is the long peripheral catheter (LPC), a device ranging from 6 to 15 cm in length.4,5
Concerns regarding inappropriate use and complications such as thrombosis and central line-associated bloodstream infection (CLABSI) have spurred growth in the use of LPCs.6 However, data regarding complication rates with these devices are limited. Whether LPCs are a safe and viable option for IV access is unclear. We conducted a retrospective study to examine indications, patterns of use, and complications following LPC insertion in hospitalized patients.
METHODS
Device Selection
Our institution is a 470-bed tertiary care, safety-net hospital in Chicago, Illinois. Our vascular access team (VAT) performs a patient assessment and selects IV devices based upon published standards for device appropriateness. 7 We retrospectively collated electronic requests for LPC insertion on adult inpatients between October 2015 and June 2017. Cases where (1) duplicate orders, (2) patient refusal, (3) peripheral intravenous catheter of any length, or (4) PICCs were placed were excluded from this analysis.
VAT and Device Characteristics
We used Bard PowerGlide® (Bard Access Systems, Inc., Salt Lake City, Utah), an 18-gauge, 8-10 cm long, power-injectable, polyurethane LPC. Bundled kits (ie, device, gown, dressing, etc.) were utilized, and VAT providers underwent two weeks of training prior to the study period. All LPCs were inserted in the upper extremities under sterile technique using ultrasound guidance (accelerated Seldinger technique). Placement confirmation was verified by aspiration, flush, and ultrasound visualization of the catheter tip within the vein. An antimicrobial dressing was applied to the catheter insertion site, and daily saline flushes and weekly dressing changes by bedside nurses were used for device maintenance. LPC placement was available on all nonholiday weekdays from 8
Data Selection
For each LPC recipient, demographic and comorbidity data were collected to calculate the Charlson Comorbidity Index (Table 1). Every LPC recipient’s history of deep vein thrombosis (DVT) and catheter-related infection (CRI) was recorded. Procedural information (eg, inserter, vein, and number of attempts) was obtained from insertion notes. All data were extracted from the electronic medical record via chart review. Two reviewers verified outcomes to ensure concordance with stated definitions (ie, DVT, CRI). Device parameters, including dwell time, indication, and time to complication(s) were also collected.
Primary Outcomes
The primary outcome was the incidence of DVT and CRI (Table 2). DVT was defined as radiographically confirmed (eg, ultrasound, computed tomography) thrombosis in the presence of patient signs or symptoms. CRI was defined in accordance with Timsit et al.8 as follows: catheter-related clinical sepsis without bloodstream infection defined as (1) combination of fever (body temperature >38.5°C) or hypothermia (body temperature <36.5°C), (2) catheter-tip culture yielding ≥103 CFUs/mL, (3) pus at the insertion site or resolution of clinical sepsis after catheter removal, and (4) absence of any other infectious focus or catheter-related bloodstream infection (CRBSI). CRBSI was defined as a combination of (1) one or more positive peripheral blood cultures sampled immediately before or within 48 hours after catheter removal, (2) a quantitative catheter-tip culture testing positive for the same microorganisms (same species and susceptibility pattern) or a differential time to positivity of blood cultures ≥2 hours, and (3) no other infectious focus explaining the positive blood culture result.
Secondary Outcomes
Secondary outcomes, defined as minor complications, included infiltration, thrombophlebitis, and catheter occlusion. Infiltration was defined as localized swelling due to infusate or site leakage. Thrombophlebitis was defined as one or more of the following: localized erythema, palpable cord, tenderness, or streaking. Occlusion was defined as nonpatency of the catheter due to the inability to flush or aspirate. Definitions for secondary outcomes are consistent with those used in prior studies.9
Statistical Analysis
Patient and LPC characteristics were analyzed using descriptive statistics. Results were reported as percentages, means, medians (interquartile range [IQR]), and rates per 1,000 catheter days. All analyses were conducted in Stata v.15 (StataCorp, College Station, Texas).
RESULTS
Within the 20-month study period, a total of 539 LPCs representing 5,543 catheter days were available for analysis. The mean patient age was 53 years. A total of 90 patients (16.7%) had a history of DVT, while 6 (1.1%) had a history of CRI. We calculated a median Charlson index of 4 (interquartile range [IQR], 2-7), suggesting an estimated one-year postdischarge survival of 53% (Table 1).
The majority of LPCs (99.6% [537/539]) were single lumen catheters. No patient had more than one concurrent LPC. The cannulation success rate on the first attempt was 93.9% (507/539). The brachial or basilic veins were primarily targeted (98.7%, [532/539]). Difficult intravenous access represented 48.8% (263/539) of indications, and postdischarge parenteral antibiotics constituted 47.9% (258/539). The median catheter dwell time was eight days (IQR, 4-14 days).
Nine DVTs (1.7% [9/539]) occurred in patients with LPCs. The incidence of DVT was higher in patients with a history of DVT (5.7%, 5/90). The median time from insertion to DVT was 11 (IQR, 5-14) days. DVTs were managed with LPC removal and systemic anticoagulation in accordance with catheter-related DVT guidelines. The rate of CRI was 0.6% (3/539), or 0.54 per 1,000 catheter days. Two CRIs had positive blood cultures, while one had negative cultures. Infections occurred after a median of 12 (IQR, 8-15) days of catheter dwell. Each was treated with LPC removal and IV antibiotics, with two patients receiving two weeks and one receiving six weeks of antibiotic therapy (Table 2).
With respect to secondary outcomes, the incidence of infiltration was 0.4% (2/539), thrombophlebitis 0.7% (4/539), and catheter occlusion 0.9% (5/539). The time to event was 8.5, 3.75, and 5.4 days, respectively. Collectively, 2.0% of devices experienced a minor complication.
DISCUSSION
In our single-center study, LPCs were primarily inserted for difficult venous access or parenteral antibiotics. Despite a clinically complex population with a high number of comorbidities, rates of major and minor complications associated with LPCs were low. These data suggest that LPCs are a safe alternative to PICCs and other central access devices for short-term use.
Our incidence of CRI of 0.6% (0.54 per 1,000 catheter days) is similar to or lower than other studies.2,10,11 An incidence of 0%-1.5% was observed in two recent publications about midline catheters, with rates across individual studies and hospital sites varying widely.12,13 A systematic review of intravascular devices reported CRI rates of 0.4% (0.2 per 1,000 catheter days) for midlines and 0.1% (0.5 per 1,000 catheter days for peripheral IVs), in contrast to PICCs at 3.1% (1.1 per 1,000 catheter days).14 However, catheters of varying lengths and diameters were used in studies within the review, potentially leading to heterogeneous outcomes. In accordance with existing data, CRI incidence in our study increased with catheter dwell time.10
The 1.7% rate of DVT observed in our study is on the lower end of existing data (1.4%-5.9%).12-15 Compared with PICCs (2%-15%), the incidence of venous thrombosis appears to be lower with midlines/LPCs—justifying their use as an alternative device for IV access.7,9,12,14 There was an overall low rate of minor complications, similar to recently published results.10 As rates were greater in patients with a history of DVT (5.7%), caution is warranted when using these devices in this population.
Our experience with LPCs suggests financial and patient benefits. The cost of LPCs is lower than central access devices.4 As rates of CRI were low, costs related to CLABSIs from PICC use may be reduced by appropriate LPC use. LPCs may allow the ability to draw blood routinely, which could improve the patient experience—albeit with its own risks. Current recommendations support the use of PICCs or LPCs, somewhat interchangeably, for patients with appropriate indications needing IV therapy for more than five to six days.2,7 However, LPCs now account for 57% of vascular access procedures in our center and have led to a decrease in reliance on PICCs and attendant complications.
Our study has several limitations. First, LPCs and midlines are often used interchangeably in the literature.4,5 Therefore, reported complication rates may not reflect those of LPCs alone and may limit comparisons. Second, ours was a single-center study with experts assessing device appropriateness and performing ultrasound-guided insertions; our findings may not be generalizable to dissimilar settings. Third, we did not track LPC complications such as nonpatency and leakage. As prior studies reported high rates of complications such as these events, caution is advised when interpreting our findings.15 Finally, we retrospectively extracted data from our medical records; limitations in documentation may influence our findings.
CONCLUSION
In patients requiring short-term IV therapy, these data suggest LPCs have low complication rates and may be safely used as an alternative option for venous access.
Acknowledgments
The authors thank Drs. Laura Hernandez, Andres Mendez Hernandez, and Victor Prado for their assistance in data collection. The authors also thank Mr. Onofre Donceras and Dr. Sharon Welbel from the John H. Stroger, Jr. Hospital of Cook County Department of Infection Control & Epidemiology for their assistance in reviewing local line infection data.
Drs. Patel and Chopra developed the study design. Drs. Patel, Araujo, Parra Rodriguez, Ramirez Sanchez, and Chopra contributed to manuscript writing. Ms. Snyder provided statistical analysis. All authors have seen and approved the final manuscript for submission.
Disclosures
The authors have nothing to disclose.
1. Anderson NR. Midline catheters: the middle ground of intravenous therapy administration. J Infus Nurs. 2004;27(5):313-321.
2. Adams DZ, Little A, Vinsant C, et al. The midline catheter: a clinical review. J Emerg Med. 2016;51(3):252-258. https://doi.org/10.1016/j.jemermed.2016.05.029.
3. Scoppettuolo G, Pittiruti M, Pitoni S, et al. Ultrasound-guided “short” midline catheters for difficult venous access in the emergency department: a retrospective analysis. Int J Emerg Med. 2016;9(1):3. https://doi.org/10.1186/s12245-016-0100-0.
4. Qin KR, Nataraja RM, Pacilli M. Long peripheral catheters: is it time to address the confusion? J Vasc Access. 2018;20(5). https://doi.org/10.1177/1129729818819730.
5. Pittiruti M, Scoppettuolo G. The GAVeCeLT Manual of PICC and Midlines. Milano: EDRA; 2016.
6. Dawson RB, Moureau NL. Midline catheters: an essential tool in CLABSI reduction. Infection Control Today. https://www.infectioncontroltoday.com/clabsi/midline-catheters-essential-tool-clabsi-reduction. Accessed February 19, 2018
7. Chopra V, Flanders SA, Saint S, et al. The Michigan Appropriateness Guide for Intravenous Catheters (MAGIC): results from a multispecialty panel using the RAND/UCLA appropriateness method. Ann Intern Med. 2015;163(6):S1-S40. https://doi.org/10.7326/M15-0744.
8. Timsit JF, Schwebel C, Bouadma L, et al. Chlorhexidine-impregnated sponges and less frequent dressing changes for prevention of catheter-related infections in critically ill adults: a randomized controlled trial. JAMA. 2009;301(12):1231-1241. https://doi.org/10.1001/jama.2009.376.
9. Bahl A, Karabon P, Chu D. Comparison of venous thrombosis complications in midlines versus peripherally inserted central catheters: are midlines the safer option? Clin Appl Thromb Hemost. 2019;25. https://doi.org/10.1177/1076029619839150.
10. Goetz AM, Miller J, Wagener MM, et al. Complications related to intravenous midline catheter usage. A 2-year study. J Intraven Nurs. 1998;21(2):76-80.
11. Xu T, Kingsley L, DiNucci S, et al. Safety and utilization of peripherally inserted central catheters versus midline catheters at a large academic medical center. Am J Infect Control. 2016;44(12):1458-1461. https://doi.org/10.1016/j.ajic.2016.09.010.
12. Chopra V, Kaatz S, Swaminathan L, et al. Variation in use and outcomes related to midline catheters: results from a multicentre pilot study. BMJ Qual Saf. 2019;28(9):714-720. https://doi.org/10.1136/bmjqs-2018-008554.
13. Badger J. Long peripheral catheters for deep arm vein venous access: A systematic review of complications. Heart Lung. 2019;48(3):222-225. https://doi.org/10.1016/j.hrtlng.2019.01.002.
14. Maki DG, Kluger DM, Crnich CJ. The risk of bloodstream infection in adults with different intravascular devices: a systematic review of 200 published prospective studies. Mayo Clin Proc. 2006;81(9):1159-1171. https://doi.org/10.4065/81.9.1159.
15. Zerla PA, Caravella G, De Luca G, et al. Open- vs closed-tip valved peripherally inserted central catheters and midlines: Findings from a vascular access database. J Assoc Vasc Access. 2015;20(3):169-176. https://doi.org/10.1016/j.java.2015.06.001.
© 2019 Society of Hospital Medicine
State of Research in Adult Hospital Medicine: Results of a National Survey
Almost all specialties in internal medicine have a sound scientific research base through which clinical practice is informed.1 For the field of Hospital Medicine (HM), this evidence has largely comprised research generated from fields outside of the specialty. The need to develop, invest, and grow investigators in hospital-based medicine remains unmet as HM and its footprint in hospital systems continue to grow.2,3
Despite this fact, little is known about the current state of research in HM. A 2014 survey of the members of the Society of Hospital Medicine (SHM) found that research output across the field of HM, as measured on the basis of peer-reviewed publications, was growing.4 Since then, however, the numbers of individuals engaged in research activities, their background and training, publication output, or funding sources have not been quantified. Similarly, little is known about which institutions support the development of junior investigators (ie, HM research fellowships), how these programs are funded, and whether or not matriculants enter the field as investigators. These gaps must be measured, evaluated, and ideally addressed through strategic policy and funding initiatives to advance the state of science within HM.
Members of the SHM Research Committee developed, designed, and deployed a survey to improve the understanding of the state of research in HM. In this study, we aimed to establish the baseline of research in HM to enable the measurement of progress through periodic waves of data collection. Specifically, we sought to quantify and describe the characteristics of existing research programs, the sources and types of funding, the number and background of faculty, and the availability of resources for training researchers in HM.
METHODS
Study Setting and Participants
Given that no defined list, database, or external resource that identifies research programs and contacts in HM exists, we began by creating a strategy to identify and sample adult
Survey Development
A workgroup within the SHM Research Committee was tasked to create a survey that would achieve four distinct goals: (1) identify institutions currently engaging in hospital-based research; (2) define the characteristics, including sources of research funding, training opportunities, criteria for promotion, and grant support, of research programs within institutions; (3) understand the prevalence of research fellowship programs, including size, training curricula, and funding sources; and (4) evaluate the productivity and funding sources of HM investigators at each site.
Survey questions that target each of these domains were drafted by the workgroup. Questions were pretested with colleagues outside the workgroup focused on this project (ie, from the main research committee). The instrument was refined and edited to improve the readability and clarity of questions on the basis of the feedback obtained through the iterative process. The revised instrument was then programmed into an online survey administration tool (SurveyMonkey®) to facilitate electronic dissemination. Finally, the members of the workgroup tested the online survey to ensure functionality. No identifiable information was collected from respondents, and no monetary incentive was offered for the completion of the survey. An invitation to participate in the survey was sent via e-mail to each of the program contacts identified.
Statistical Analysis
Descriptive statistics, including proportions, means, and percentages, were used to tabulate results. All analyses were conducted using Stata 13 MP/SE (StataCorp, College Station, Texas).
Ethical and Regulatory Considerations
The study was reviewed and deemed exempt from regulation by the University of Michigan Institutional Review Board (HUM000138628).
RESULTS
General Characteristics of Research Programs and Faculty
Out of 100 program contacts, 28 (representing 1,586 faculty members) responded and were included in the survey (program response rate = 28%). When comparing programs that did respond with those that did not, a greater proportion of programs in university settings were noted among respondents (79% vs 21%). Respondents represented programs from all regions of the United States, with most representing university-based (79%), university-affiliated (14%) or Veterans Health Administration (VHA; 11%) programs. Most respondents were in leadership roles, including division chiefs (32%), research directors/leads (21%), section chiefs (18%), and related titles, such as program director. Respondents indicated that the total number of faculty members in their programs (including nonclinicians and advance practice providers) varied from eight to 152 (mean [SD] = 57 [36]) members, with physicians representing the majority of faculty members (Table 1).
Among the 1,586 faculty members within the 28 programs, respondents identified 192 faculty members (12%) as currently receiving extra- or intramural support for research activities. Of these faculty, over half (58%) received <25% of effort from intra or extramural sources, and 28 (15%) and 52 (27%) faculty members received 25%-50% or >50% of support for their effort, respectively. The number of investigators who received funding across programs ranged from 0 to 28 faculty members. Compared with the 192 funded investigators, respondents indicated that a larger number of faculty in their programs (n = 656 or 41%) were involved in local quality improvement (QI) efforts. Of the 656 faculty members involved in QI efforts, 241 individuals (37%) were internally funded and received protected time/effort for their work.
Key Attributes of Research Programs
In the evaluation of the amount of total grant funding, respondents from 17 programs indicated that they received $500,000 in annual extra and intramural funding, and those from three programs stated that they received $500,000 to $999,999 in funding. Five respondents indicated that their programs currently received $1 million to $5 million in grant funding, and three reported >$5 million in research support. The sources of research funding included several divisions within the National Institute of Health (NIH, 12 programs), Agency for Healthcare Research and Quality (AHRQ, four programs), foundations (four programs), and internal grants (six programs). Additionally, six programs indicated “other” sources of funding that included the VHA, Patient-Centered Outcomes Research Institute (PCORI), Centers for Medicare and Medicaid Services, Centers for Disease Control (CDC), and industry sources.
A range of grants, including career development awards (11 programs); small grants, such as R21 and R03s (eight programs); R-level grants, including VA merit awards (five programs); program series grants, such as P and U grants (five programs), and foundation grants (eight programs), were reported as types of awards. Respondents from 16 programs indicated that they provided internal pilot grants. Amounts for such grants ranged from <$50,000 (14 programs) to $50,000-$100,000 (two programs).
Research Fellowship Programs/Training Programs
Only five of the 28 surveyed programs indicated that they currently had a research training or fellowship program for developing hospitalist investigators. The age of these programs varied from <1 year to 10 years. Three of the five programs stated that they had two fellows per year, and two stated they had spots for one trainee annually. All respondents indicated that fellows received training on study design, research methods, quantitative (eg, large database and secondary analyses) and qualitative data analysis. In addition, two programs included training in systematic review and meta-analyses, and three included focused courses on healthcare policy. Four of the five programs included training in QI tools, such as LEAN and Six Sigma. Funding for four of the five fellowship programs came from internal sources (eg, department and CTSA). However, two programs added they received some support from extramural funding and philanthropy. Following training, respondents from programs indicated that the majority of their graduates (60%) went on to hybrid research/QI roles (50/50 research/clinical effort), whereas 40% obtained dedicated research investigator (80/20) positions (Table 2).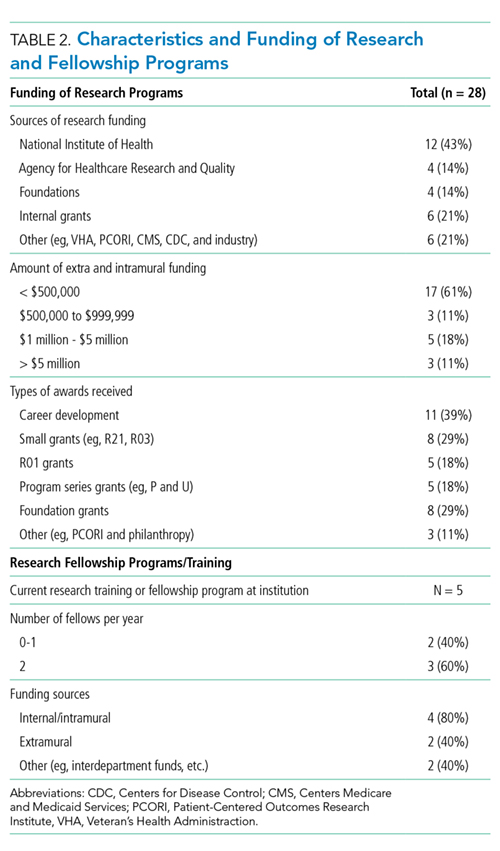
The 23 institutions without research training programs cited that the most important barrier for establishing such programs was lack of funding (12 programs) and the lack of a pipeline of hospitalists seeking such training (six programs). However, 15 programs indicated that opportunities for hospitalists to gain research training in the form of courses were available internally (eg, courses in the department or medical school) or externally (eg, School of Public Health). Seven programs indicated that they were planning to start a HM research fellowship within the next five years.
Research Faculty
Among the 28 respondents, 15 stated that they have faculty members who conduct research as their main professional activity (ie, >50% effort). The number of faculty members in each program in such roles varied from one to 10. Respondents indicated that faculty members in this category were most often midcareer assistant or associate professors with few full professors. All programs indicated that scholarship in the form of peer-reviewed publications was required for the promotion of faculty. Faculty members who performed research as their main activity had all received formal fellowship training and consequently had dual degrees (MD with MPH or MD, with MSc being the two most common combinations). With respect to clinical activities, most respondents indicated that research faculty spent 10% to 49% of their effort on clinical work. However, five respondents indicated that research faculty had <10% effort on clinical duties (Table 3).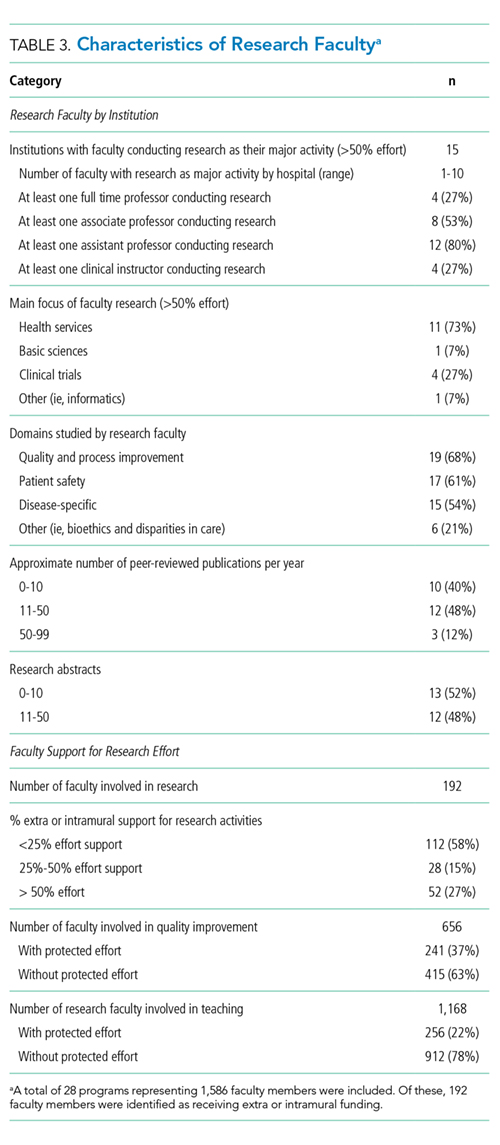
Eleven respondents (39%) identified the main focus of faculty as health service research, where four (14%) identified their main focus as clinical trials. Regardless of funding status, all respondents stated that their faculty were interested in studying quality and process improvement efforts (eg, transitions or readmissions, n = 19), patient safety initiatives (eg, hospital-acquired complications, n = 17), and disease-specific areas (eg, thrombosis, n = 15).
In terms of research output, 12 respondents stated that their research/QI faculty collectively published 11-50 peer-reviewed papers during the academic year, and 10 programs indicated that their faculty published 0-10 papers per year. Only three programs reported that their faculty collectively published 50-99 peer-reviewed papers per year. With respect to abstract presentations at national conferences, 13 programs indicated that they presented 0-10 abstracts, and 12 indicated that they presented 11-50.
DISCUSSION
In this first survey quantifying research activities in HM, respondents from 28 programs shared important insights into research activities at their institutions. Although our sample size was small, substantial variation in the size, composition, and structure of research programs in HM among respondents was observed. For example, few respondents indicated the availability of training programs for research in HM at their institutions. Similarly, among faculty who focused mainly on research, variation in funding streams and effort protection was observed. A preponderance of midcareer faculty with a range of funding sources, including NIH, AHRQ, VHA, CMS, and CDC was reported. Collectively, these data not only provide a unique glimpse into the state of research in HM but also help establish a baseline of the status of the field at large.
Some findings of our study are intuitive given our sampling strategy and the types of programs that responded. For example, the fact that most respondents for research programs represented university-based or affiliated institutions is expected given the tripartite academic mission. However, even within our sample of highly motivated programs, some findings are surprising and merit further exploration. For example, the observation that some respondents identified HM investigators within their program with <25% in intra- or extramural funding was unexpected. On the other extreme, we were surprised to find that three programs reported >$5 million in research funding. Understanding whether specific factors, such as the availability of experienced mentors within and outside departments or assistance from support staff (eg, statisticians and project managers), are associated with success and funding within these programs are important questions to answer. By focusing on these issues, we will be well poised as a field to understand what works, what does not work, and why.
Likewise, the finding that few programs within our sample offer formal training in the form of fellowships to research investigators represents an improvement opportunity. A pipeline for growing investigators is critical for the specialty that is HM. Notably, this call is not new; rather, previous investigators have highlighted the importance of developing academically oriented hospitalists for the future of the field.5 The implementation of faculty scholarship development programs has improved the scholarly output, mentoring activities, and succession planning of academics within HM.6,7 Conversely, lack of adequate mentorship and support for academic activities remains a challenge and as a factor associated with the failure to produce academic work.8 Without a cadre of investigators asking critical questions related to care delivery, the legitimacy of our field may be threatened.
While extrapolating to the field is difficult given the small number of our respondents, highlighting the progress that has been made is important. For example, while misalignment between funding and clinical and research mission persists, our survey found that several programs have been successful in securing extramural funding for their investigators. Additionally, internal funding for QI work appears to be increasing, with hospitalists receiving dedicated effort for much of this work. Innovation in how best to support and develop these types of efforts have also emerged. For example, the University of Michigan Specialist Hospitalist Allied Research Program offers dedicated effort and funding for hospitalists tackling projects germane to HM (eg, ordering of blood cultures for febrile inpatients) that overlap with subspecialists (eg, infectious diseases).9 Thus, hospitalists are linked with other specialties in the development of research agendas and academic products. Similarly, the launch of the HOMERUN network, a coalition of investigators who bridge health systems to study problems central to HM, has helped usher in a new era of research opportunities in the specialty.10 Fundamentally, the culture of HM has begun to place an emphasis on academic and scholarly productivity in addition to clinical prowess.11-13 Increased support and funding for training programs geared toward innovation and research in HM is needed to continue this mission. The Society for General Internal Medicine, American College of Physicians, and SHM have important roles to play as the largest professional organizations for generalists in this respect. Support for research, QI, and investigators in HM remains an urgent and largely unmet need.
Our study has limitations. First, our response rate was low at 28% but is consistent with the response rates of other surveys of physician groups.14 Caution in making inferences to the field at large is necessary given the potential for selection and nonresponse bias. However, we expect that respondents are likely biased toward programs actively conducting research and engaged in QI, thus better reflecting the state of these activities in HM. Second, given that we did not ask for any identifying information, we have no way of establishing the accuracy of the data provided by respondents. However, we have no reason to believe that responses would be altered in a systematic fashion. Future studies that link our findings to publicly available data (eg, databases of active grants and funding) might be useful. Third, while our survey instrument was created and internally validated by hospitalist researchers, its lack of external validation could limit findings. Finally, our results vary on the basis of how respondents answered questions related to effort and time allocation given that these measures differ across programs.
In summary, the findings from this study highlight substantial variations in the number, training, and funding of research faculty across HM programs. Understanding the factors behind the success of some programs and the failures of others appears important in informing and growing the research in the field. Future studies that aim to expand survey participation, raise the awareness of the state of research in HM, and identify barriers and facilitators to academic success in HM are needed.
Disclosures
Dr. Chopra discloses grant funding from the Agency for Healthcare Research and Quality (AHRQ), VA Health Services and Research Department, and Centers for Disease Control. Dr. Jones discloses grant funding from AHRQ. All other authors disclose no conflicts of interest.
1. International Working Party to Promote and Revitalise Academic Medicine. Academic medicine: the evidence base. BMJ. 2004;329(7469):789-792. PubMed
2. Flanders SA, Saint S, McMahon LF, Howell JD. Where should hospitalists sit within the academic medical center? J Gen Intern Med. 2008;23(8):1269-1272. PubMed
3. Flanders SA, Centor B, Weber V, McGinn T, Desalvo K, Auerbach A. Challenges and opportunities in academic hospital medicine: report from the academic hospital medicine summit. J Gen Intern Med. 2009;24(5):636-641. PubMed
4. Dang Do AN, Munchhof AM, Terry C, Emmett T, Kara A. Research and publication trends in hospital medicine. J Hosp Med. 2014;9(3):148-154. PubMed
5. Harrison R, Hunter AJ, Sharpe B, Auerbach AD. Survey of US academic hospitalist leaders about mentorship and academic activities in hospitalist groups. J Hosp Med. 2011;6(1):5-9. PubMed
6. Sehgal NL, Sharpe BA, Auerbach AA, Wachter RM. Investing in the future: building an academic hospitalist faculty development program. J Hosp Med. 2011;6(3):161-166. PubMed
7. Nagarur A, O’Neill RM, Lawton D, Greenwald JL. Supporting faculty development in hospital medicine: design and implementation of a personalized structured mentoring program. J Hosp Med. 2018;13(2):96-99. PubMed
8. Reid MB, Misky GJ, Harrison RA, Sharpe B, Auerbach A, Glasheen JJ. Mentorship, productivity, and promotion among academic hospitalists. J Gen Intern Med. 2012;27(1):23-27. PubMed
9. Flanders SA, Kaufman SR, Nallamothu BK, Saint S. The University of Michigan Specialist-Hospitalist Allied Research Program: jumpstarting hospital medicine research. J Hosp Med. 2008;3(4):308-313. PubMed
10. Auerbach AD, Patel MS, Metlay JP, et al. The Hospital Medicine Reengineering Network (HOMERuN): a learning organization focused on improving hospital care. Acad Med. 2014;89(3):415-420. PubMed
11. Souba WW. Academic medicine’s core values: what do they mean? J Surg Res. 2003;115(2):171-173. PubMed
12. Bonsall J, Chopra V. Building an academic pipeline: a combined society of hospital medicine committee initiative. J Hosp Med. 2016;11(10):735-736. PubMed
13. Sweigart JR, Tad YD, Kneeland P, Williams MV, Glasheen JJ. Hospital medicine resident training tracks: developing the hospital medicine pipeline. J Hosp Med. 2017;12(3):173-176. PubMed
14. Cunningham CT, Quan H, Hemmelgarn B, et al. Exploring physician specialist response rates to web-based surveys. BMC Med Res Methodol. 2015;15(1):32. PubMed
Almost all specialties in internal medicine have a sound scientific research base through which clinical practice is informed.1 For the field of Hospital Medicine (HM), this evidence has largely comprised research generated from fields outside of the specialty. The need to develop, invest, and grow investigators in hospital-based medicine remains unmet as HM and its footprint in hospital systems continue to grow.2,3
Despite this fact, little is known about the current state of research in HM. A 2014 survey of the members of the Society of Hospital Medicine (SHM) found that research output across the field of HM, as measured on the basis of peer-reviewed publications, was growing.4 Since then, however, the numbers of individuals engaged in research activities, their background and training, publication output, or funding sources have not been quantified. Similarly, little is known about which institutions support the development of junior investigators (ie, HM research fellowships), how these programs are funded, and whether or not matriculants enter the field as investigators. These gaps must be measured, evaluated, and ideally addressed through strategic policy and funding initiatives to advance the state of science within HM.
Members of the SHM Research Committee developed, designed, and deployed a survey to improve the understanding of the state of research in HM. In this study, we aimed to establish the baseline of research in HM to enable the measurement of progress through periodic waves of data collection. Specifically, we sought to quantify and describe the characteristics of existing research programs, the sources and types of funding, the number and background of faculty, and the availability of resources for training researchers in HM.
METHODS
Study Setting and Participants
Given that no defined list, database, or external resource that identifies research programs and contacts in HM exists, we began by creating a strategy to identify and sample adult
Survey Development
A workgroup within the SHM Research Committee was tasked to create a survey that would achieve four distinct goals: (1) identify institutions currently engaging in hospital-based research; (2) define the characteristics, including sources of research funding, training opportunities, criteria for promotion, and grant support, of research programs within institutions; (3) understand the prevalence of research fellowship programs, including size, training curricula, and funding sources; and (4) evaluate the productivity and funding sources of HM investigators at each site.
Survey questions that target each of these domains were drafted by the workgroup. Questions were pretested with colleagues outside the workgroup focused on this project (ie, from the main research committee). The instrument was refined and edited to improve the readability and clarity of questions on the basis of the feedback obtained through the iterative process. The revised instrument was then programmed into an online survey administration tool (SurveyMonkey®) to facilitate electronic dissemination. Finally, the members of the workgroup tested the online survey to ensure functionality. No identifiable information was collected from respondents, and no monetary incentive was offered for the completion of the survey. An invitation to participate in the survey was sent via e-mail to each of the program contacts identified.
Statistical Analysis
Descriptive statistics, including proportions, means, and percentages, were used to tabulate results. All analyses were conducted using Stata 13 MP/SE (StataCorp, College Station, Texas).
Ethical and Regulatory Considerations
The study was reviewed and deemed exempt from regulation by the University of Michigan Institutional Review Board (HUM000138628).
RESULTS
General Characteristics of Research Programs and Faculty
Out of 100 program contacts, 28 (representing 1,586 faculty members) responded and were included in the survey (program response rate = 28%). When comparing programs that did respond with those that did not, a greater proportion of programs in university settings were noted among respondents (79% vs 21%). Respondents represented programs from all regions of the United States, with most representing university-based (79%), university-affiliated (14%) or Veterans Health Administration (VHA; 11%) programs. Most respondents were in leadership roles, including division chiefs (32%), research directors/leads (21%), section chiefs (18%), and related titles, such as program director. Respondents indicated that the total number of faculty members in their programs (including nonclinicians and advance practice providers) varied from eight to 152 (mean [SD] = 57 [36]) members, with physicians representing the majority of faculty members (Table 1).
Among the 1,586 faculty members within the 28 programs, respondents identified 192 faculty members (12%) as currently receiving extra- or intramural support for research activities. Of these faculty, over half (58%) received <25% of effort from intra or extramural sources, and 28 (15%) and 52 (27%) faculty members received 25%-50% or >50% of support for their effort, respectively. The number of investigators who received funding across programs ranged from 0 to 28 faculty members. Compared with the 192 funded investigators, respondents indicated that a larger number of faculty in their programs (n = 656 or 41%) were involved in local quality improvement (QI) efforts. Of the 656 faculty members involved in QI efforts, 241 individuals (37%) were internally funded and received protected time/effort for their work.
Key Attributes of Research Programs
In the evaluation of the amount of total grant funding, respondents from 17 programs indicated that they received $500,000 in annual extra and intramural funding, and those from three programs stated that they received $500,000 to $999,999 in funding. Five respondents indicated that their programs currently received $1 million to $5 million in grant funding, and three reported >$5 million in research support. The sources of research funding included several divisions within the National Institute of Health (NIH, 12 programs), Agency for Healthcare Research and Quality (AHRQ, four programs), foundations (four programs), and internal grants (six programs). Additionally, six programs indicated “other” sources of funding that included the VHA, Patient-Centered Outcomes Research Institute (PCORI), Centers for Medicare and Medicaid Services, Centers for Disease Control (CDC), and industry sources.
A range of grants, including career development awards (11 programs); small grants, such as R21 and R03s (eight programs); R-level grants, including VA merit awards (five programs); program series grants, such as P and U grants (five programs), and foundation grants (eight programs), were reported as types of awards. Respondents from 16 programs indicated that they provided internal pilot grants. Amounts for such grants ranged from <$50,000 (14 programs) to $50,000-$100,000 (two programs).
Research Fellowship Programs/Training Programs
Only five of the 28 surveyed programs indicated that they currently had a research training or fellowship program for developing hospitalist investigators. The age of these programs varied from <1 year to 10 years. Three of the five programs stated that they had two fellows per year, and two stated they had spots for one trainee annually. All respondents indicated that fellows received training on study design, research methods, quantitative (eg, large database and secondary analyses) and qualitative data analysis. In addition, two programs included training in systematic review and meta-analyses, and three included focused courses on healthcare policy. Four of the five programs included training in QI tools, such as LEAN and Six Sigma. Funding for four of the five fellowship programs came from internal sources (eg, department and CTSA). However, two programs added they received some support from extramural funding and philanthropy. Following training, respondents from programs indicated that the majority of their graduates (60%) went on to hybrid research/QI roles (50/50 research/clinical effort), whereas 40% obtained dedicated research investigator (80/20) positions (Table 2).
The 23 institutions without research training programs cited that the most important barrier for establishing such programs was lack of funding (12 programs) and the lack of a pipeline of hospitalists seeking such training (six programs). However, 15 programs indicated that opportunities for hospitalists to gain research training in the form of courses were available internally (eg, courses in the department or medical school) or externally (eg, School of Public Health). Seven programs indicated that they were planning to start a HM research fellowship within the next five years.
Research Faculty
Among the 28 respondents, 15 stated that they have faculty members who conduct research as their main professional activity (ie, >50% effort). The number of faculty members in each program in such roles varied from one to 10. Respondents indicated that faculty members in this category were most often midcareer assistant or associate professors with few full professors. All programs indicated that scholarship in the form of peer-reviewed publications was required for the promotion of faculty. Faculty members who performed research as their main activity had all received formal fellowship training and consequently had dual degrees (MD with MPH or MD, with MSc being the two most common combinations). With respect to clinical activities, most respondents indicated that research faculty spent 10% to 49% of their effort on clinical work. However, five respondents indicated that research faculty had <10% effort on clinical duties (Table 3).
Eleven respondents (39%) identified the main focus of faculty as health service research, where four (14%) identified their main focus as clinical trials. Regardless of funding status, all respondents stated that their faculty were interested in studying quality and process improvement efforts (eg, transitions or readmissions, n = 19), patient safety initiatives (eg, hospital-acquired complications, n = 17), and disease-specific areas (eg, thrombosis, n = 15).
In terms of research output, 12 respondents stated that their research/QI faculty collectively published 11-50 peer-reviewed papers during the academic year, and 10 programs indicated that their faculty published 0-10 papers per year. Only three programs reported that their faculty collectively published 50-99 peer-reviewed papers per year. With respect to abstract presentations at national conferences, 13 programs indicated that they presented 0-10 abstracts, and 12 indicated that they presented 11-50.
DISCUSSION
In this first survey quantifying research activities in HM, respondents from 28 programs shared important insights into research activities at their institutions. Although our sample size was small, substantial variation in the size, composition, and structure of research programs in HM among respondents was observed. For example, few respondents indicated the availability of training programs for research in HM at their institutions. Similarly, among faculty who focused mainly on research, variation in funding streams and effort protection was observed. A preponderance of midcareer faculty with a range of funding sources, including NIH, AHRQ, VHA, CMS, and CDC was reported. Collectively, these data not only provide a unique glimpse into the state of research in HM but also help establish a baseline of the status of the field at large.
Some findings of our study are intuitive given our sampling strategy and the types of programs that responded. For example, the fact that most respondents for research programs represented university-based or affiliated institutions is expected given the tripartite academic mission. However, even within our sample of highly motivated programs, some findings are surprising and merit further exploration. For example, the observation that some respondents identified HM investigators within their program with <25% in intra- or extramural funding was unexpected. On the other extreme, we were surprised to find that three programs reported >$5 million in research funding. Understanding whether specific factors, such as the availability of experienced mentors within and outside departments or assistance from support staff (eg, statisticians and project managers), are associated with success and funding within these programs are important questions to answer. By focusing on these issues, we will be well poised as a field to understand what works, what does not work, and why.
Likewise, the finding that few programs within our sample offer formal training in the form of fellowships to research investigators represents an improvement opportunity. A pipeline for growing investigators is critical for the specialty that is HM. Notably, this call is not new; rather, previous investigators have highlighted the importance of developing academically oriented hospitalists for the future of the field.5 The implementation of faculty scholarship development programs has improved the scholarly output, mentoring activities, and succession planning of academics within HM.6,7 Conversely, lack of adequate mentorship and support for academic activities remains a challenge and as a factor associated with the failure to produce academic work.8 Without a cadre of investigators asking critical questions related to care delivery, the legitimacy of our field may be threatened.
While extrapolating to the field is difficult given the small number of our respondents, highlighting the progress that has been made is important. For example, while misalignment between funding and clinical and research mission persists, our survey found that several programs have been successful in securing extramural funding for their investigators. Additionally, internal funding for QI work appears to be increasing, with hospitalists receiving dedicated effort for much of this work. Innovation in how best to support and develop these types of efforts have also emerged. For example, the University of Michigan Specialist Hospitalist Allied Research Program offers dedicated effort and funding for hospitalists tackling projects germane to HM (eg, ordering of blood cultures for febrile inpatients) that overlap with subspecialists (eg, infectious diseases).9 Thus, hospitalists are linked with other specialties in the development of research agendas and academic products. Similarly, the launch of the HOMERUN network, a coalition of investigators who bridge health systems to study problems central to HM, has helped usher in a new era of research opportunities in the specialty.10 Fundamentally, the culture of HM has begun to place an emphasis on academic and scholarly productivity in addition to clinical prowess.11-13 Increased support and funding for training programs geared toward innovation and research in HM is needed to continue this mission. The Society for General Internal Medicine, American College of Physicians, and SHM have important roles to play as the largest professional organizations for generalists in this respect. Support for research, QI, and investigators in HM remains an urgent and largely unmet need.
Our study has limitations. First, our response rate was low at 28% but is consistent with the response rates of other surveys of physician groups.14 Caution in making inferences to the field at large is necessary given the potential for selection and nonresponse bias. However, we expect that respondents are likely biased toward programs actively conducting research and engaged in QI, thus better reflecting the state of these activities in HM. Second, given that we did not ask for any identifying information, we have no way of establishing the accuracy of the data provided by respondents. However, we have no reason to believe that responses would be altered in a systematic fashion. Future studies that link our findings to publicly available data (eg, databases of active grants and funding) might be useful. Third, while our survey instrument was created and internally validated by hospitalist researchers, its lack of external validation could limit findings. Finally, our results vary on the basis of how respondents answered questions related to effort and time allocation given that these measures differ across programs.
In summary, the findings from this study highlight substantial variations in the number, training, and funding of research faculty across HM programs. Understanding the factors behind the success of some programs and the failures of others appears important in informing and growing the research in the field. Future studies that aim to expand survey participation, raise the awareness of the state of research in HM, and identify barriers and facilitators to academic success in HM are needed.
Disclosures
Dr. Chopra discloses grant funding from the Agency for Healthcare Research and Quality (AHRQ), VA Health Services and Research Department, and Centers for Disease Control. Dr. Jones discloses grant funding from AHRQ. All other authors disclose no conflicts of interest.
1. International Working Party to Promote and Revitalise Academic Medicine. Academic medicine: the evidence base. BMJ. 2004;329(7469):789-792. PubMed
2. Flanders SA, Saint S, McMahon LF, Howell JD. Where should hospitalists sit within the academic medical center? J Gen Intern Med. 2008;23(8):1269-1272. PubMed
3. Flanders SA, Centor B, Weber V, McGinn T, Desalvo K, Auerbach A. Challenges and opportunities in academic hospital medicine: report from the academic hospital medicine summit. J Gen Intern Med. 2009;24(5):636-641. PubMed
4. Dang Do AN, Munchhof AM, Terry C, Emmett T, Kara A. Research and publication trends in hospital medicine. J Hosp Med. 2014;9(3):148-154. PubMed
5. Harrison R, Hunter AJ, Sharpe B, Auerbach AD. Survey of US academic hospitalist leaders about mentorship and academic activities in hospitalist groups. J Hosp Med. 2011;6(1):5-9. PubMed
6. Sehgal NL, Sharpe BA, Auerbach AA, Wachter RM. Investing in the future: building an academic hospitalist faculty development program. J Hosp Med. 2011;6(3):161-166. PubMed
7. Nagarur A, O’Neill RM, Lawton D, Greenwald JL. Supporting faculty development in hospital medicine: design and implementation of a personalized structured mentoring program. J Hosp Med. 2018;13(2):96-99. PubMed
8. Reid MB, Misky GJ, Harrison RA, Sharpe B, Auerbach A, Glasheen JJ. Mentorship, productivity, and promotion among academic hospitalists. J Gen Intern Med. 2012;27(1):23-27. PubMed
9. Flanders SA, Kaufman SR, Nallamothu BK, Saint S. The University of Michigan Specialist-Hospitalist Allied Research Program: jumpstarting hospital medicine research. J Hosp Med. 2008;3(4):308-313. PubMed
10. Auerbach AD, Patel MS, Metlay JP, et al. The Hospital Medicine Reengineering Network (HOMERuN): a learning organization focused on improving hospital care. Acad Med. 2014;89(3):415-420. PubMed
11. Souba WW. Academic medicine’s core values: what do they mean? J Surg Res. 2003;115(2):171-173. PubMed
12. Bonsall J, Chopra V. Building an academic pipeline: a combined society of hospital medicine committee initiative. J Hosp Med. 2016;11(10):735-736. PubMed
13. Sweigart JR, Tad YD, Kneeland P, Williams MV, Glasheen JJ. Hospital medicine resident training tracks: developing the hospital medicine pipeline. J Hosp Med. 2017;12(3):173-176. PubMed
14. Cunningham CT, Quan H, Hemmelgarn B, et al. Exploring physician specialist response rates to web-based surveys. BMC Med Res Methodol. 2015;15(1):32. PubMed
© 2019 Society of Hospital Medicine
Hire Hard, Manage Easy
The socio-adaptive (or “nontechnical”) aspects of healthcare including leadership, followership, mentorship, culture, teamwork, and communication are not formally taught in medical training. Yet, they are critical to our daily lives as Hospitalists. The LPD series features brief “pearls of wisdom” that highlight these important lessons.
“If you can hire people whose passion intersects with the job, they won’t require any supervision at all. They will manage themselves better than anyone could ever manage them. Their fire comes from within, not from without.”
—Stephen Covey
When you initiate a quality or performance improvement project, you want to find someone who can help you do the necessary work and find that someone quickly. But be warned: leaders must learn to go slow when hiring for their team. Do not settle on whoever has available time or interest—they may have time to give or be eager for a reason.
We see this unfold in several ways. For example, individuals are sometimes “offered” up for a role: “This person has experience reviewing charts and abstracting data—and they have some time available. Would you like to hire them?” Similarly, eager students or faculty may be willing to jump on a project with you—“I am looking to join a project,” or “Yes, I can help with that,” are all too often heard in this context. Both scenarios share in common one truth: easy availability and willingness to help make it tempting to say, “Sure.”
While some of these individuals might be ideal, many are not. When hiring, you have to think hard about the role and an individual’s skill set that makes them well suited for it. Based on experience, we can tell you that once you go “soft” by selecting a suboptimal candidate, you are in trouble for at least three reasons. First, hiring the right people is the key to achieving success for your initiative. And success in your project reflects directly on you. People will make inferences about you based on the people you surround yourself with: if they are terrific, the assumption—right or wrong—is that you are as well. Second, we tend to compensate for underperforming employees, often at great cost to ourselves or others. When data collection for a project does not go well, we have found ourselves behind the screen filling in various portions of a data collection form. For example, a colleague once told us, “I hired this person to help, but they ended up needing so much assistance that it was often easier for me and others to do the work. The environment quickly became toxic.”
Third, it is often difficult to remove an underperforming employee or have them change positions. Health organizations (especially universities or other public institutions) can be rigid that way. An infection prevention leader told us of waiting a whole year to fill a crucial vacancy before she found the right person. It was ultimately the right decision, she said, adding, “My life is so much better.”
How can you be sure you have found the right person? Regardless of whether you are hiring for a permanent or temporary position, staff or faculty member, we recommend the following:
- Ensure recruits meet with several people. The more eyes on a candidate, the better. Often, someone will catch something you may not—and having many people involved helps get the team invested in the success of your hire.
- Standardize and solicit feedback. For example, we use a standardized template to garner feedback on administrative recruits, project managers, and faculty. This way, we all are evaluating potential colleagues through the same structured approach.
- Ensure skills match the role. For example, an ethnographic study would benefit from someone skilled in qualitative methods. Similarly, a project manager experienced in clinical trials would be best suited for patient recruitment and managing investigators at several sites. Identifying what is clearly needed in the role is a key step in hiring.
Management guru Jim Collins writes: “The moment you feel the need to tightly manage someone, you’ve made a hiring mistake. The best people don’t need to be managed. Guided, taught, led—yes. But not tightly managed.”1 True in management, and true in the world of healthcare. Hire Hard. In the long run, you will be able to manage easy.
Disclosures
Drs. Chopra and Saint are co-authors of the upcoming book, “Thirty Rules for Healthcare Leaders,” from which this article is adapted. Both authors have no other relevant conflicts of interest.
1. Collins J. Recruitment and Selection. In: Garner E, ed. The Art of Managing People. 550 quotes on how to get the best out of others. Eric Garner & Ventus Publishing ApS. 2012;39. https://bookboon.com/en/the-art-of-managing-people-ebook. Accessed January 7, 2019.
The socio-adaptive (or “nontechnical”) aspects of healthcare including leadership, followership, mentorship, culture, teamwork, and communication are not formally taught in medical training. Yet, they are critical to our daily lives as Hospitalists. The LPD series features brief “pearls of wisdom” that highlight these important lessons.
“If you can hire people whose passion intersects with the job, they won’t require any supervision at all. They will manage themselves better than anyone could ever manage them. Their fire comes from within, not from without.”
—Stephen Covey
When you initiate a quality or performance improvement project, you want to find someone who can help you do the necessary work and find that someone quickly. But be warned: leaders must learn to go slow when hiring for their team. Do not settle on whoever has available time or interest—they may have time to give or be eager for a reason.
We see this unfold in several ways. For example, individuals are sometimes “offered” up for a role: “This person has experience reviewing charts and abstracting data—and they have some time available. Would you like to hire them?” Similarly, eager students or faculty may be willing to jump on a project with you—“I am looking to join a project,” or “Yes, I can help with that,” are all too often heard in this context. Both scenarios share in common one truth: easy availability and willingness to help make it tempting to say, “Sure.”
While some of these individuals might be ideal, many are not. When hiring, you have to think hard about the role and an individual’s skill set that makes them well suited for it. Based on experience, we can tell you that once you go “soft” by selecting a suboptimal candidate, you are in trouble for at least three reasons. First, hiring the right people is the key to achieving success for your initiative. And success in your project reflects directly on you. People will make inferences about you based on the people you surround yourself with: if they are terrific, the assumption—right or wrong—is that you are as well. Second, we tend to compensate for underperforming employees, often at great cost to ourselves or others. When data collection for a project does not go well, we have found ourselves behind the screen filling in various portions of a data collection form. For example, a colleague once told us, “I hired this person to help, but they ended up needing so much assistance that it was often easier for me and others to do the work. The environment quickly became toxic.”
Third, it is often difficult to remove an underperforming employee or have them change positions. Health organizations (especially universities or other public institutions) can be rigid that way. An infection prevention leader told us of waiting a whole year to fill a crucial vacancy before she found the right person. It was ultimately the right decision, she said, adding, “My life is so much better.”
How can you be sure you have found the right person? Regardless of whether you are hiring for a permanent or temporary position, staff or faculty member, we recommend the following:
- Ensure recruits meet with several people. The more eyes on a candidate, the better. Often, someone will catch something you may not—and having many people involved helps get the team invested in the success of your hire.
- Standardize and solicit feedback. For example, we use a standardized template to garner feedback on administrative recruits, project managers, and faculty. This way, we all are evaluating potential colleagues through the same structured approach.
- Ensure skills match the role. For example, an ethnographic study would benefit from someone skilled in qualitative methods. Similarly, a project manager experienced in clinical trials would be best suited for patient recruitment and managing investigators at several sites. Identifying what is clearly needed in the role is a key step in hiring.
Management guru Jim Collins writes: “The moment you feel the need to tightly manage someone, you’ve made a hiring mistake. The best people don’t need to be managed. Guided, taught, led—yes. But not tightly managed.”1 True in management, and true in the world of healthcare. Hire Hard. In the long run, you will be able to manage easy.
Disclosures
Drs. Chopra and Saint are co-authors of the upcoming book, “Thirty Rules for Healthcare Leaders,” from which this article is adapted. Both authors have no other relevant conflicts of interest.
1. Collins J. Recruitment and Selection. In: Garner E, ed. The Art of Managing People. 550 quotes on how to get the best out of others. Eric Garner & Ventus Publishing ApS. 2012;39. https://bookboon.com/en/the-art-of-managing-people-ebook. Accessed January 7, 2019.
1. Collins J. Recruitment and Selection. In: Garner E, ed. The Art of Managing People. 550 quotes on how to get the best out of others. Eric Garner & Ventus Publishing ApS. 2012;39. https://bookboon.com/en/the-art-of-managing-people-ebook. Accessed January 7, 2019.
© 2019 Society of Hospital Medicine
Less Lumens-Less Risk: A Pilot Intervention to Increase the Use of Single-Lumen Peripherally Inserted Central Catheters
Vascular access is a cornerstone of safe and effective medical care. The use of peripherally inserted central catheters (PICCs) to meet vascular access needs has recently increased.1,2 PICCs offer several advantages over other central venous catheters. These advantages include increased reliability over intermediate to long-term use and reductions in complication rates during insertion.3,4
Multiple studies have suggested a strong association between the number of PICC lumens and risk of complications, such as central-line associated bloodstream infection (CLABSI), venous thrombosis, and catheter occlusion.5-8,9,10-12 These complications may lead to device failure, interrupt therapy, prolonged length of stay, and increased healthcare costs.13-15 Thus, available guidelines recommend using PICCs with the least clinically necessary number of lumens.1,16 Quality improvement strategies that have targeted decreasing the number of PICC lumens have reduced complications and healthcare costs.17-19 However, variability exists in the selection of the number of PICC lumens, and many providers request multilumen devices “just in case” additional lumens are needed.20,21 Such variation in device selection may stem from the paucity of information that defines the appropriate indications for the use of single- versus multi-lumen PICCs.
Therefore, to ensure appropriateness of PICC use, we designed an intervention to improve selection of the number of PICC lumens.
METHODS
We conducted this pre–post quasi-experimental study in accordance with SQUIRE guidelines.22 Details regarding clinical parameters associated with the decision to place a PICC, patient characteristics, comorbidities, complications, and laboratory values were collected from the medical records of patients. All PICCs were placed by the Vascular Access Service Team (VAST) during the study period.
Intervention
The intervention consisted of three components: first, all hospitalists, pharmacists, and VAST nurses received education in the form of a CME lecture that emphasized use of the Michigan Appropriateness Guide for Intravenous Catheters (MAGIC).1 These criteria define when use of a PICC is appropriate and emphasize how best to select the most appropriate device characteristics such as lumens and catheter gauge. Next, a multidisciplinary task force that consisted of hospitalists, VAST nurses, and pharmacists developed a list of indications specifying when use of a multilumen PICC was appropriate.1 Third, the order for a PICC in our electronic medical record (EMR) system was modified to set single-lumen PICCs as default. If a multilumen PICC was requested, text-based justification from the ordering clinician was required.
As an additional safeguard, a VAST nurse reviewed the number of lumens and clinical scenario for each PICC order prior to insertion. If the number of lumens ordered was considered inappropriate on the basis of the developed list of MAGIC recommendations, the case was referred to a pharmacist for additional review. The pharmacist then reviewed active and anticipated medications, explored options for adjusting the medication delivery plan, and discussed these options with the ordering clinician to determine the most appropriate number of lumens.
Measures and Definitions
In accordance with the criteria set by the Centers for Disease Control National Healthcare Safety Network,23 CLABSI was defined as a confirmed positive blood culture with a PICC in place for 48 hours or longer without another identified infection source or a positive PICC tip culture in the setting of clinically suspected infection. Venous thrombosis was defined as symptomatic upper extremity deep vein thromboembolism or pulmonary embolism that was radiographically confirmed after the placement of a PICC or within one week of device removal. Catheter occlusion was captured when documented or when tPA was administered for problems related to the PICC. The appropriateness of the number of PICC lumens was independently adjudicated by an attending physician and clinical pharmacist by comparing the indications of the device placed against predefined appropriateness criteria.
Outcomes
The primary outcome of interest was the change in the proportion of single-lumen PICCs placed. Secondary outcomes included (1) the placement of PICCs with an appropriate number of lumens, (2) the occurrence of PICC-related complications (CLABSI, venous thrombosis, and catheter occlusion), and (3) the need for a second procedure to place a multilumen device or additional vascular access.
Statistical Analysis
Descriptive statistics were used to tabulate and summarize patient and PICC characteristics. Differences between pre- and postintervention populations were assessed using χ2, Fishers exact, t-, and Wilcoxon rank sum tests. Differences in complications were assessed using the two-sample tests of proportions. Results were reported as medians (IQR) and percentages with corresponding 95% confidence intervals. All statistical tests were two-sided, with P < .05 considered statistically significant. Analyses were conducted with Stata v.14 (stataCorp, College Station, Texas).
Ethical and Regulatory Oversight
This study was approved by the Institutional Review Board at the University of Michigan (IRB#HUM00118168).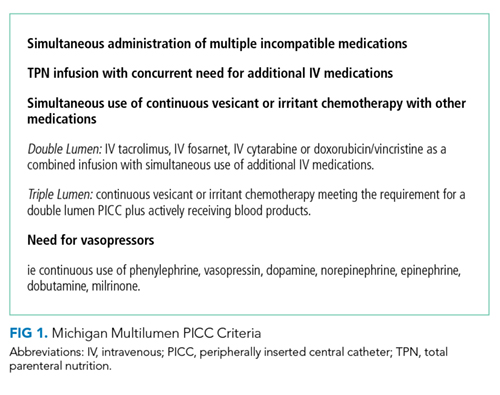
RESULTS
Of the 133 PICCs placed preintervention, 64.7% (n = 86) were single lumen, 33.1% (n = 44) were double lumen, and 2.3% (n = 3) were triple lumen. Compared with the preintervention period, the use of single-lumen PICCs significantly increased following the intervention (64.7% to 93.6%; P < .001; Figure 1). As well, the proportion of PICCs with an inappropriate number of lumens decreased from 25.6% to 2.2% (P < .001; Table 1).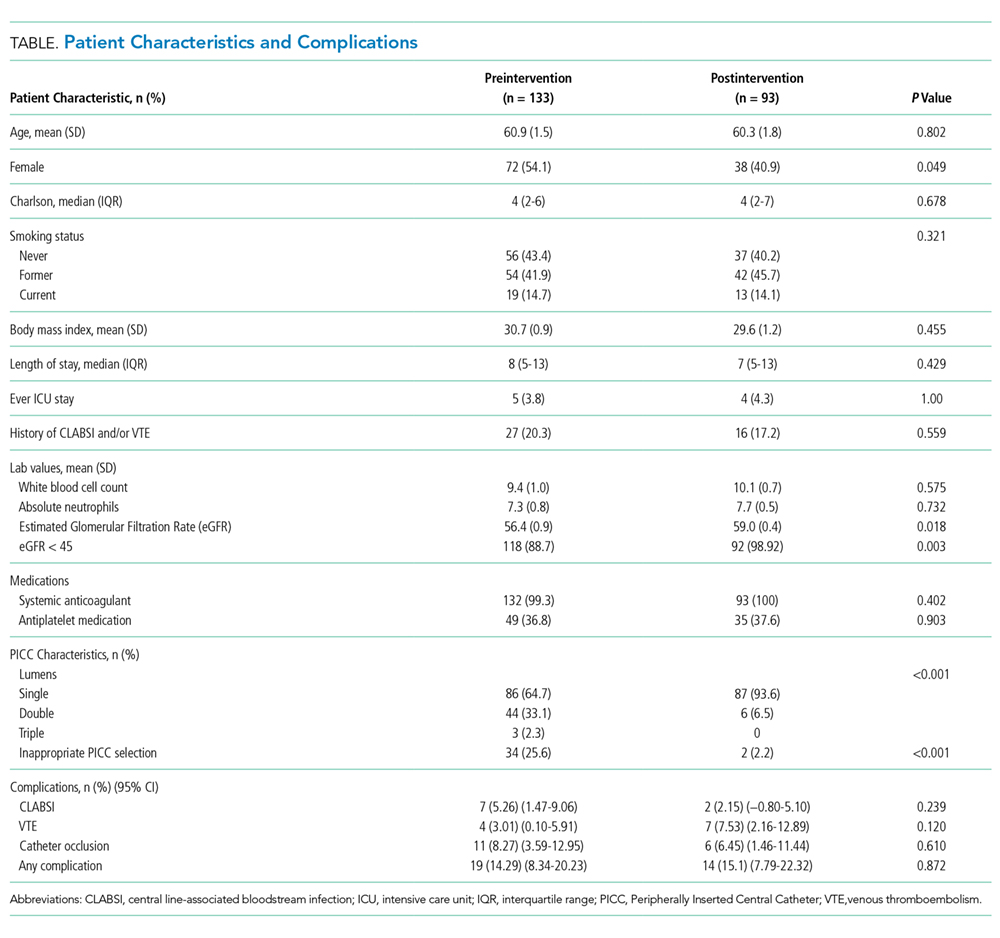
Preintervention, 14.3% (95% CI = 8.34-20.23) of the patients with PICCs experienced at least one complication (n = 19). Following the intervention, 15.1% (95% CI = 7.79-22.32) of the 93 patients with PICCs experienced at least one complication (absolute difference = 0.8%, P = .872). With respect to individual complications, CLABSI decreased from 5.3% (n = 7; 95% CI = 1.47-9.06) to 2.2% (n = 2; 95% CI = −0.80-5.10) (P = .239). Similarly, the incidence of catheter occlusion decreased from 8.3% (n = 11; 95% CI = 3.59-12.95) to 6.5% (n = 6; 95% CI = 1.46-11.44; P = .610; Table). Notably, only 12.1% (n = 21) of patients with a single-lumen PICC experienced any complication, whereas 20.0% (n = 10) of patients with a double lumen, and 66.7% (n = 2) with a triple lumen experienced a PICC-associated complication (P = .022). Patients with triple lumens had a significantly higher incidence of catheter occlusion compared with patients that received double- and single-lumen PICCs (66.7% vs. 12.0% and 5.2%, respectively; P = .003).
No patient who received a single-lumen device required a second procedure for the placement of a device with additional lumens. Similarly, no documentation suggesting an insufficient number of PICC lumens or the need for additional vascular access (eg, placement of additional PICCs) was found in medical records of patients postintervention. Pharmacists supporting the interventions and VAST team members reported no disagreements when discussing number of lumens or appropriateness of catheter choice.
DISCUSSION
In this single center, pre–post quasi-experimental study, a multimodal intervention based on the MAGIC criteria significantly reduced the use of multilumen PICCs. Additionally, a trend toward reductions in complications, including CLABSI and catheter occlusion, was also observed. Notably, these changes in ordering practices did not lead to requests for additional devices or replacement with a multilumen PICC when a single-lumen device was inserted. Collectively, our findings suggest that the use of single-lumen devices in a large direct care service can be feasibly and safely increased through this approach. Larger scale studies that implement MAGIC to inform placement of multilumen PICCs and reduce PICC-related complications now appear necessary.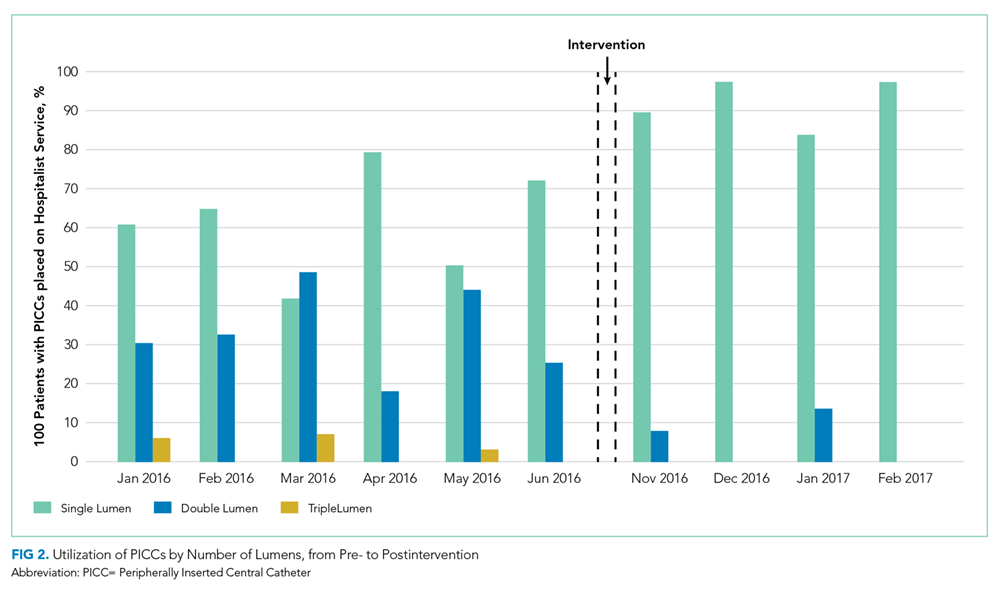
The presence of a PICC, even for short periods, significantly increases the risk of CLABSI and is one of the strongest predictors of venous thrombosis risk in the hospital setting.19,24,25 Although some factors that lead to this increased risk are patient-related and not modifiable (eg, malignancy or intensive care unit status), increased risk linked to the gauge of PICCs and the number of PICC lumens can be modified by improving device selection.9,18,26 Deliberate use of PICCs with the least numbers of clinically necessary lumens decreases risk of CLABSI, venous thrombosis and overall cost.17,19,26 Additionally, greater rates of occlusion with each additional PICC lumen may result in the interruption of intravenous therapy, the administration of costly medications (eg, tissue plasminogen activator) to salvage the PICC, and premature removal of devices should the occlusion prove irreversible.8
We observed a trend toward decreased PICC complications following implementation of our criteria, especially for the outcomes of CLABSI and catheter occlusion. Given the pilot nature of this study, we were underpowered to detect a statistically significant change in PICC adverse events. However, we did observe a statistically significant increase in the rate of single-lumen PICC use following our intervention. Notably, this increase occurred in the setting of high rates of single-lumen PICC use at baseline (64%). Therefore, an important takeaway from our findings is that room for improving PICC appropriateness exists even among high performers. This finding In turn, high baseline use of single-lumen PICCs may also explain why a robust reduction in PICC complications was not observed in our study, given that other studies showing reduction in the rates of complications began with considerably low rates of single-lumen device use.19 Outcomes may improve, however, if we expand and sustain these changes or expand to larger settings. For example, (based on assumptions from a previously published simulation study and our average hospital medicine daily census of 98 patients) the increased use of single-over multilumen PICCs is expected to decrease CLABSI events and venous thrombosis episodes by 2.4-fold in our hospital medicine service with an associated cost savings of $74,300 each year.17 Additionally, we would also expect the increase in the proportion of single-lumen PICCs to reduce rates of catheter occlusion. This reduction, in turn, would lessen interruptions in intravenous therapy, the need for medications to treat occlusion, and the need for device replacement all leading to reduced costs.27 Overall, then, our intervention (informed by appropriateness criteria) provides substantial benefits to hospital savings and patient safety.
After our intervention, 98% of all PICCs placed were found to comply with appropriate criteria for multilumen PICC use. We unexpectedly found that the most important factor driving our findings was not oversight or order modification by the pharmacy team or VAST nurses, but rather better decisions made by physicians at the outset. Specifically, we did not find a single instance wherein the original PICC order was changed to a device with a different number of lumens after review from the VAST team. We attribute this finding to receptiveness of physicians to change ordering practices following education and the redesign of the default EMR PICC order, both of which provided a scientific rationale for multilumen PICC use. Clarifying the risk and criteria of the use of multilumen devices along with providing an EMR ordering process that supports best practice helped hospitalists “do the right thing”. Additionally, setting single-lumen devices as the preselected EMR order and requiring text-based justification for placement of a multilumen PICC helped provide a nudge to physicians, much as it has done with antibiotic choices.28
Our study has limitations. First, we were only able to identify complications that were captured by our EMR. Given that over 70% of the patients in our study were discharged with a PICC in place, we do not know whether complications may have developed outside the hospital. Second, our intervention was resource intensive and required partnership with pharmacy, VAST, and hospitalists. Thus, the generalizability of our intervention to other institutions without similar support is unclear. Third, despite an increase in the use of single-lumen PICCs and a decrease in multilumen devices, we did not observe a significant reduction in all types of complications. While our high rate of single-lumen PICC use may account for these findings, larger scale studies are needed to better study the impact of MAGIC and appropriateness criteria on PICC complications. Finally, given our approach, we cannot identify the most effective modality within our bundled intervention. Stepped wedge or single-component studies are needed to further address this question.
In conclusion, we piloted a multimodal intervention to promote the use of single-lumen PICCs while lowering the use of multilumen devices. By using MAGIC to create appropriate indications, the use of multilumen PICCs declined and complications trended downwards. Larger, multicenter studies to validate our findings and examine the sustainability of this intervention would be welcomed.
Disclosures
The authors have nothing to disclose.
1. Chopra V, Flanders SA, Saint S, et al. The Michigan Appropriateness Guide for Intravenous Catheters (MAGIC): Results from a multispecialty panel using the RAND/UCLA appropriateness method. Ann Intern Med. 2015;163(6 Suppl):S1-S40. doi: 10.7326/M15-0744. PubMed
2. Taylor RW, Palagiri AV. Central venous catheterization. Crit Care Med. 2007;35(5):1390-1396. doi: 10.1097/01.CCM.0000260241.80346.1B. PubMed
3. Pikwer A, Akeson J, Lindgren S. Complications associated with peripheral or central routes for central venous cannulation. Anaesthesia. 2012;67(1):65-71. doi: 10.1111/j.1365-2044.2011.06911.x. PubMed
4. Johansson E, Hammarskjold F, Lundberg D, Arnlind MH. Advantages and disadvantages of peripherally inserted central venous catheters (PICC) compared to other central venous lines: a systematic review of the literature. Acta Onco. 2013;52(5):886-892. doi: 10.3109/0284186X.2013.773072. PubMed
5. Pan L, Zhao Q, Yang X. Risk factors for venous thrombosis associated with peripherally inserted central venous catheters. Int J Clin Exp Med. 2014;7(12):5814-5819. PubMed
6. Herc E, Patel P, Washer LL, Conlon A, Flanders SA, Chopra V. A model to predict central-line-associated bloodstream infection among patients with peripherally inserted central catheters: The MPC score. Infect Cont Hosp Ep. 2017;38(10):1155-1166. doi: 10.1017/ice.2017.167. PubMed
7. Maki DG, Kluger DM, Crnich CJ. The risk of bloodstream infection in adults with different intravascular devices: a systematic review of 200 published prospective studies. Mayo Clin Proc. 2006;81(9):1159–1171. doi: 10.4065/81.9.1159. PubMed
8. Smith SN, Moureau N, Vaughn VM, et al. Patterns and predictors of peripherally inserted central catheter occlusion: The 3P-O study. J Vasc Interv Radiol. 2017;28(5):749-756.e742. doi: 10.1016/j.jvir.2017.02.005. PubMed
9. Chopra V, Anand S, Hickner A, et al. Risk of venous thromboembolism associated with peripherally inserted central catheters: a systematic review and meta-analysis. Lancet. 2013;382(9889):311-325. doi: 10.1016/S0140-6736(13)60592-9. PubMed
10. Chopra V, Ratz D, Kuhn L, Lopus T, Lee A, Krein S. Peripherally inserted central catheter-related deep vein thrombosis: contemporary patterns and predictors. J Thromb Haemost. 2014;12(6):847-854. doi: 10.1111/jth.12549. PubMed
11. Carter JH, Langley JM, Kuhle S, Kirkland S. Risk factors for central venous catheter-associated bloodstream infection in pediatric patients: A cohort study. Infect Control Hosp Epidemiol. 2016;37(8):939-945. doi: 10.1017/ice.2016.83. PubMed
12. Chopra V, Ratz D, Kuhn L, Lopus T, Chenoweth C, Krein S. PICC-associated bloodstream infections: prevalence, patterns, and predictors. Am J Med. 2014;127(4):319-328. doi: 10.1016/j.amjmed.2014.01.001. PubMed
13. O’Grady NP, Alexander M, Burns LA, et al. Guidelines for the prevention of intravascular catheter-related infections. Clin Infect Dis. 2011;52(9):e162-e193. doi: 10.1093/cid/cir257. PubMed
14. Parkinson R, Gandhi M, Harper J, Archibald C. Establishing an ultrasound guided peripherally inserted central catheter (PICC) insertion service. Clin Radiol. 1998;53(1):33-36. doi: 10.1016/S0009-9260(98)80031-7. PubMed
15. Shannon RP, Patel B, Cummins D, Shannon AH, Ganguli G, Lu Y. Economics of central line--associated bloodstream infections. Am J Med Qual. 2006;21(6 Suppl):7s–16s. doi: 10.1177/1062860606294631. PubMed
16. Mermis JD, Strom JC, Greenwood JP, et al. Quality improvement initiative to reduce deep vein thrombosis associated with peripherally inserted central catheters in adults with cystic fibrosis. Ann Am Thorac Soc. 2014;11(9):1404-1410. doi: 10.1513/AnnalsATS.201404-175OC. PubMed
17. Ratz D, Hofer T, Flanders SA, Saint S, Chopra V. Limiting the number of lumens in peripherally inserted central catheters to improve outcomes and reduce cost: A simulation study. Infect Control Hosp Epidemiol. 2016;37(7):811-817. doi: 10.1017/ice.2016.55. PubMed
18. Chopra V, Anand S, Krein SL, Chenoweth C, Saint S. Bloodstream infection, venous thrombosis, and peripherally inserted central catheters: reappraising the evidence. Am J Med. 2012;125(8):733-741. doi: 10.1016/j.amjmed.2012.04.010. PubMed
19. O’Brien J, Paquet F, Lindsay R, Valenti D. Insertion of PICCs with minimum number of lumens reduces complications and costs. J Am Coll Radiol. 2013;10(11):864-868. doi: 10.1016/j.jacr.2013.06.003. PubMed
20. Tiwari MM, Hermsen ED, Charlton ME, Anderson JR, Rupp ME. Inappropriate intravascular device use: a prospective study. J Hosp Infect. 2011;78(2):128-132. doi: 10.1016/j.jhin.2011.03.004. PubMed
21. Chopra V, Kuhn L, Flanders SA, Saint S, Krein SL. Hospitalist experiences, practice, opinions, and knowledge regarding peripherally inserted central catheters: results of a national survey. J Hosp Med. 2013;8(11):635-638. doi: 10.1002/jhm.2095. PubMed
22. Goodman D, Ogrinc G, Davies L, et al. Explanation and elaboration of the SQUIRE (Standards for Quality Improvement Reporting Excellence) Guidelines, V.2.0: examples of SQUIRE elements in the healthcare improvement literature. BMJ Qual Saf. 2016;25(12):e7. doi: 10.1136/bmjqs-2015-004480. PubMed
23. CDC Bloodstream Infection/Device Associated Infection Module. https://wwwcdcgov/nhsn/pdfs/pscmanual/4psc_clabscurrentpdf 2017. Accessed April 11, 2017.
24. Woller SC, Stevens SM, Jones JP, et al. Derivation and validation of a simple model to identify venous thromboembolism risk in medical patients. Am J Med. 2011;124(10):947-954.e2. doi: 10.1016/j.amjmed.2011.06.004. PubMed
25. Paje D, Conlon A, Kaatz S, et al. Patterns and predictors of short-term peripherally inserted central catheter use: A multicenter prospective cohort study. J Hosp Med. 2018;13(2):76-82. doi: 10.12788/jhm.2847. PubMed
26. Evans RS, Sharp JH, Linford LH, et al. Reduction of peripherally inserted central catheter-associated DVT. Chest. 2013;143(3):627-633. doi: 10.1378/chest.12-0923. PubMed
27. Smith S, Moureau N, Vaughn VM, et al. Patterns and predictors of peripherally inserted central catheter occlusion: The 3P-O study. J Vasc Interv Radiol. 2017;28(5):749-756.e2. doi: 10.1016/j.jvir.2017.02.005. PubMed
28. Vaughn VM, Linder JA. Thoughtless design of the electronic health record drives overuse, but purposeful design can nudge improved patient care. BMJ Qual Saf. 2018;27(8):583-586. doi: 10.1136/bmjqs-2017-007578. PubMed
Vascular access is a cornerstone of safe and effective medical care. The use of peripherally inserted central catheters (PICCs) to meet vascular access needs has recently increased.1,2 PICCs offer several advantages over other central venous catheters. These advantages include increased reliability over intermediate to long-term use and reductions in complication rates during insertion.3,4
Multiple studies have suggested a strong association between the number of PICC lumens and risk of complications, such as central-line associated bloodstream infection (CLABSI), venous thrombosis, and catheter occlusion.5-8,9,10-12 These complications may lead to device failure, interrupt therapy, prolonged length of stay, and increased healthcare costs.13-15 Thus, available guidelines recommend using PICCs with the least clinically necessary number of lumens.1,16 Quality improvement strategies that have targeted decreasing the number of PICC lumens have reduced complications and healthcare costs.17-19 However, variability exists in the selection of the number of PICC lumens, and many providers request multilumen devices “just in case” additional lumens are needed.20,21 Such variation in device selection may stem from the paucity of information that defines the appropriate indications for the use of single- versus multi-lumen PICCs.
Therefore, to ensure appropriateness of PICC use, we designed an intervention to improve selection of the number of PICC lumens.
METHODS
We conducted this pre–post quasi-experimental study in accordance with SQUIRE guidelines.22 Details regarding clinical parameters associated with the decision to place a PICC, patient characteristics, comorbidities, complications, and laboratory values were collected from the medical records of patients. All PICCs were placed by the Vascular Access Service Team (VAST) during the study period.
Intervention
The intervention consisted of three components: first, all hospitalists, pharmacists, and VAST nurses received education in the form of a CME lecture that emphasized use of the Michigan Appropriateness Guide for Intravenous Catheters (MAGIC).1 These criteria define when use of a PICC is appropriate and emphasize how best to select the most appropriate device characteristics such as lumens and catheter gauge. Next, a multidisciplinary task force that consisted of hospitalists, VAST nurses, and pharmacists developed a list of indications specifying when use of a multilumen PICC was appropriate.1 Third, the order for a PICC in our electronic medical record (EMR) system was modified to set single-lumen PICCs as default. If a multilumen PICC was requested, text-based justification from the ordering clinician was required.
As an additional safeguard, a VAST nurse reviewed the number of lumens and clinical scenario for each PICC order prior to insertion. If the number of lumens ordered was considered inappropriate on the basis of the developed list of MAGIC recommendations, the case was referred to a pharmacist for additional review. The pharmacist then reviewed active and anticipated medications, explored options for adjusting the medication delivery plan, and discussed these options with the ordering clinician to determine the most appropriate number of lumens.
Measures and Definitions
In accordance with the criteria set by the Centers for Disease Control National Healthcare Safety Network,23 CLABSI was defined as a confirmed positive blood culture with a PICC in place for 48 hours or longer without another identified infection source or a positive PICC tip culture in the setting of clinically suspected infection. Venous thrombosis was defined as symptomatic upper extremity deep vein thromboembolism or pulmonary embolism that was radiographically confirmed after the placement of a PICC or within one week of device removal. Catheter occlusion was captured when documented or when tPA was administered for problems related to the PICC. The appropriateness of the number of PICC lumens was independently adjudicated by an attending physician and clinical pharmacist by comparing the indications of the device placed against predefined appropriateness criteria.
Outcomes
The primary outcome of interest was the change in the proportion of single-lumen PICCs placed. Secondary outcomes included (1) the placement of PICCs with an appropriate number of lumens, (2) the occurrence of PICC-related complications (CLABSI, venous thrombosis, and catheter occlusion), and (3) the need for a second procedure to place a multilumen device or additional vascular access.
Statistical Analysis
Descriptive statistics were used to tabulate and summarize patient and PICC characteristics. Differences between pre- and postintervention populations were assessed using χ2, Fishers exact, t-, and Wilcoxon rank sum tests. Differences in complications were assessed using the two-sample tests of proportions. Results were reported as medians (IQR) and percentages with corresponding 95% confidence intervals. All statistical tests were two-sided, with P < .05 considered statistically significant. Analyses were conducted with Stata v.14 (stataCorp, College Station, Texas).
Ethical and Regulatory Oversight
This study was approved by the Institutional Review Board at the University of Michigan (IRB#HUM00118168).
RESULTS
Of the 133 PICCs placed preintervention, 64.7% (n = 86) were single lumen, 33.1% (n = 44) were double lumen, and 2.3% (n = 3) were triple lumen. Compared with the preintervention period, the use of single-lumen PICCs significantly increased following the intervention (64.7% to 93.6%; P < .001; Figure 1). As well, the proportion of PICCs with an inappropriate number of lumens decreased from 25.6% to 2.2% (P < .001; Table 1).
Preintervention, 14.3% (95% CI = 8.34-20.23) of the patients with PICCs experienced at least one complication (n = 19). Following the intervention, 15.1% (95% CI = 7.79-22.32) of the 93 patients with PICCs experienced at least one complication (absolute difference = 0.8%, P = .872). With respect to individual complications, CLABSI decreased from 5.3% (n = 7; 95% CI = 1.47-9.06) to 2.2% (n = 2; 95% CI = −0.80-5.10) (P = .239). Similarly, the incidence of catheter occlusion decreased from 8.3% (n = 11; 95% CI = 3.59-12.95) to 6.5% (n = 6; 95% CI = 1.46-11.44; P = .610; Table). Notably, only 12.1% (n = 21) of patients with a single-lumen PICC experienced any complication, whereas 20.0% (n = 10) of patients with a double lumen, and 66.7% (n = 2) with a triple lumen experienced a PICC-associated complication (P = .022). Patients with triple lumens had a significantly higher incidence of catheter occlusion compared with patients that received double- and single-lumen PICCs (66.7% vs. 12.0% and 5.2%, respectively; P = .003).
No patient who received a single-lumen device required a second procedure for the placement of a device with additional lumens. Similarly, no documentation suggesting an insufficient number of PICC lumens or the need for additional vascular access (eg, placement of additional PICCs) was found in medical records of patients postintervention. Pharmacists supporting the interventions and VAST team members reported no disagreements when discussing number of lumens or appropriateness of catheter choice.
DISCUSSION
In this single center, pre–post quasi-experimental study, a multimodal intervention based on the MAGIC criteria significantly reduced the use of multilumen PICCs. Additionally, a trend toward reductions in complications, including CLABSI and catheter occlusion, was also observed. Notably, these changes in ordering practices did not lead to requests for additional devices or replacement with a multilumen PICC when a single-lumen device was inserted. Collectively, our findings suggest that the use of single-lumen devices in a large direct care service can be feasibly and safely increased through this approach. Larger scale studies that implement MAGIC to inform placement of multilumen PICCs and reduce PICC-related complications now appear necessary.
The presence of a PICC, even for short periods, significantly increases the risk of CLABSI and is one of the strongest predictors of venous thrombosis risk in the hospital setting.19,24,25 Although some factors that lead to this increased risk are patient-related and not modifiable (eg, malignancy or intensive care unit status), increased risk linked to the gauge of PICCs and the number of PICC lumens can be modified by improving device selection.9,18,26 Deliberate use of PICCs with the least numbers of clinically necessary lumens decreases risk of CLABSI, venous thrombosis and overall cost.17,19,26 Additionally, greater rates of occlusion with each additional PICC lumen may result in the interruption of intravenous therapy, the administration of costly medications (eg, tissue plasminogen activator) to salvage the PICC, and premature removal of devices should the occlusion prove irreversible.8
We observed a trend toward decreased PICC complications following implementation of our criteria, especially for the outcomes of CLABSI and catheter occlusion. Given the pilot nature of this study, we were underpowered to detect a statistically significant change in PICC adverse events. However, we did observe a statistically significant increase in the rate of single-lumen PICC use following our intervention. Notably, this increase occurred in the setting of high rates of single-lumen PICC use at baseline (64%). Therefore, an important takeaway from our findings is that room for improving PICC appropriateness exists even among high performers. This finding In turn, high baseline use of single-lumen PICCs may also explain why a robust reduction in PICC complications was not observed in our study, given that other studies showing reduction in the rates of complications began with considerably low rates of single-lumen device use.19 Outcomes may improve, however, if we expand and sustain these changes or expand to larger settings. For example, (based on assumptions from a previously published simulation study and our average hospital medicine daily census of 98 patients) the increased use of single-over multilumen PICCs is expected to decrease CLABSI events and venous thrombosis episodes by 2.4-fold in our hospital medicine service with an associated cost savings of $74,300 each year.17 Additionally, we would also expect the increase in the proportion of single-lumen PICCs to reduce rates of catheter occlusion. This reduction, in turn, would lessen interruptions in intravenous therapy, the need for medications to treat occlusion, and the need for device replacement all leading to reduced costs.27 Overall, then, our intervention (informed by appropriateness criteria) provides substantial benefits to hospital savings and patient safety.
After our intervention, 98% of all PICCs placed were found to comply with appropriate criteria for multilumen PICC use. We unexpectedly found that the most important factor driving our findings was not oversight or order modification by the pharmacy team or VAST nurses, but rather better decisions made by physicians at the outset. Specifically, we did not find a single instance wherein the original PICC order was changed to a device with a different number of lumens after review from the VAST team. We attribute this finding to receptiveness of physicians to change ordering practices following education and the redesign of the default EMR PICC order, both of which provided a scientific rationale for multilumen PICC use. Clarifying the risk and criteria of the use of multilumen devices along with providing an EMR ordering process that supports best practice helped hospitalists “do the right thing”. Additionally, setting single-lumen devices as the preselected EMR order and requiring text-based justification for placement of a multilumen PICC helped provide a nudge to physicians, much as it has done with antibiotic choices.28
Our study has limitations. First, we were only able to identify complications that were captured by our EMR. Given that over 70% of the patients in our study were discharged with a PICC in place, we do not know whether complications may have developed outside the hospital. Second, our intervention was resource intensive and required partnership with pharmacy, VAST, and hospitalists. Thus, the generalizability of our intervention to other institutions without similar support is unclear. Third, despite an increase in the use of single-lumen PICCs and a decrease in multilumen devices, we did not observe a significant reduction in all types of complications. While our high rate of single-lumen PICC use may account for these findings, larger scale studies are needed to better study the impact of MAGIC and appropriateness criteria on PICC complications. Finally, given our approach, we cannot identify the most effective modality within our bundled intervention. Stepped wedge or single-component studies are needed to further address this question.
In conclusion, we piloted a multimodal intervention to promote the use of single-lumen PICCs while lowering the use of multilumen devices. By using MAGIC to create appropriate indications, the use of multilumen PICCs declined and complications trended downwards. Larger, multicenter studies to validate our findings and examine the sustainability of this intervention would be welcomed.
Disclosures
The authors have nothing to disclose.
1. Chopra V, Flanders SA, Saint S, et al. The Michigan Appropriateness Guide for Intravenous Catheters (MAGIC): Results from a multispecialty panel using the RAND/UCLA appropriateness method. Ann Intern Med. 2015;163(6 Suppl):S1-S40. doi: 10.7326/M15-0744. PubMed
2. Taylor RW, Palagiri AV. Central venous catheterization. Crit Care Med. 2007;35(5):1390-1396. doi: 10.1097/01.CCM.0000260241.80346.1B. PubMed
3. Pikwer A, Akeson J, Lindgren S. Complications associated with peripheral or central routes for central venous cannulation. Anaesthesia. 2012;67(1):65-71. doi: 10.1111/j.1365-2044.2011.06911.x. PubMed
4. Johansson E, Hammarskjold F, Lundberg D, Arnlind MH. Advantages and disadvantages of peripherally inserted central venous catheters (PICC) compared to other central venous lines: a systematic review of the literature. Acta Onco. 2013;52(5):886-892. doi: 10.3109/0284186X.2013.773072. PubMed
5. Pan L, Zhao Q, Yang X. Risk factors for venous thrombosis associated with peripherally inserted central venous catheters. Int J Clin Exp Med. 2014;7(12):5814-5819. PubMed
6. Herc E, Patel P, Washer LL, Conlon A, Flanders SA, Chopra V. A model to predict central-line-associated bloodstream infection among patients with peripherally inserted central catheters: The MPC score. Infect Cont Hosp Ep. 2017;38(10):1155-1166. doi: 10.1017/ice.2017.167. PubMed
7. Maki DG, Kluger DM, Crnich CJ. The risk of bloodstream infection in adults with different intravascular devices: a systematic review of 200 published prospective studies. Mayo Clin Proc. 2006;81(9):1159–1171. doi: 10.4065/81.9.1159. PubMed
8. Smith SN, Moureau N, Vaughn VM, et al. Patterns and predictors of peripherally inserted central catheter occlusion: The 3P-O study. J Vasc Interv Radiol. 2017;28(5):749-756.e742. doi: 10.1016/j.jvir.2017.02.005. PubMed
9. Chopra V, Anand S, Hickner A, et al. Risk of venous thromboembolism associated with peripherally inserted central catheters: a systematic review and meta-analysis. Lancet. 2013;382(9889):311-325. doi: 10.1016/S0140-6736(13)60592-9. PubMed
10. Chopra V, Ratz D, Kuhn L, Lopus T, Lee A, Krein S. Peripherally inserted central catheter-related deep vein thrombosis: contemporary patterns and predictors. J Thromb Haemost. 2014;12(6):847-854. doi: 10.1111/jth.12549. PubMed
11. Carter JH, Langley JM, Kuhle S, Kirkland S. Risk factors for central venous catheter-associated bloodstream infection in pediatric patients: A cohort study. Infect Control Hosp Epidemiol. 2016;37(8):939-945. doi: 10.1017/ice.2016.83. PubMed
12. Chopra V, Ratz D, Kuhn L, Lopus T, Chenoweth C, Krein S. PICC-associated bloodstream infections: prevalence, patterns, and predictors. Am J Med. 2014;127(4):319-328. doi: 10.1016/j.amjmed.2014.01.001. PubMed
13. O’Grady NP, Alexander M, Burns LA, et al. Guidelines for the prevention of intravascular catheter-related infections. Clin Infect Dis. 2011;52(9):e162-e193. doi: 10.1093/cid/cir257. PubMed
14. Parkinson R, Gandhi M, Harper J, Archibald C. Establishing an ultrasound guided peripherally inserted central catheter (PICC) insertion service. Clin Radiol. 1998;53(1):33-36. doi: 10.1016/S0009-9260(98)80031-7. PubMed
15. Shannon RP, Patel B, Cummins D, Shannon AH, Ganguli G, Lu Y. Economics of central line--associated bloodstream infections. Am J Med Qual. 2006;21(6 Suppl):7s–16s. doi: 10.1177/1062860606294631. PubMed
16. Mermis JD, Strom JC, Greenwood JP, et al. Quality improvement initiative to reduce deep vein thrombosis associated with peripherally inserted central catheters in adults with cystic fibrosis. Ann Am Thorac Soc. 2014;11(9):1404-1410. doi: 10.1513/AnnalsATS.201404-175OC. PubMed
17. Ratz D, Hofer T, Flanders SA, Saint S, Chopra V. Limiting the number of lumens in peripherally inserted central catheters to improve outcomes and reduce cost: A simulation study. Infect Control Hosp Epidemiol. 2016;37(7):811-817. doi: 10.1017/ice.2016.55. PubMed
18. Chopra V, Anand S, Krein SL, Chenoweth C, Saint S. Bloodstream infection, venous thrombosis, and peripherally inserted central catheters: reappraising the evidence. Am J Med. 2012;125(8):733-741. doi: 10.1016/j.amjmed.2012.04.010. PubMed
19. O’Brien J, Paquet F, Lindsay R, Valenti D. Insertion of PICCs with minimum number of lumens reduces complications and costs. J Am Coll Radiol. 2013;10(11):864-868. doi: 10.1016/j.jacr.2013.06.003. PubMed
20. Tiwari MM, Hermsen ED, Charlton ME, Anderson JR, Rupp ME. Inappropriate intravascular device use: a prospective study. J Hosp Infect. 2011;78(2):128-132. doi: 10.1016/j.jhin.2011.03.004. PubMed
21. Chopra V, Kuhn L, Flanders SA, Saint S, Krein SL. Hospitalist experiences, practice, opinions, and knowledge regarding peripherally inserted central catheters: results of a national survey. J Hosp Med. 2013;8(11):635-638. doi: 10.1002/jhm.2095. PubMed
22. Goodman D, Ogrinc G, Davies L, et al. Explanation and elaboration of the SQUIRE (Standards for Quality Improvement Reporting Excellence) Guidelines, V.2.0: examples of SQUIRE elements in the healthcare improvement literature. BMJ Qual Saf. 2016;25(12):e7. doi: 10.1136/bmjqs-2015-004480. PubMed
23. CDC Bloodstream Infection/Device Associated Infection Module. https://wwwcdcgov/nhsn/pdfs/pscmanual/4psc_clabscurrentpdf 2017. Accessed April 11, 2017.
24. Woller SC, Stevens SM, Jones JP, et al. Derivation and validation of a simple model to identify venous thromboembolism risk in medical patients. Am J Med. 2011;124(10):947-954.e2. doi: 10.1016/j.amjmed.2011.06.004. PubMed
25. Paje D, Conlon A, Kaatz S, et al. Patterns and predictors of short-term peripherally inserted central catheter use: A multicenter prospective cohort study. J Hosp Med. 2018;13(2):76-82. doi: 10.12788/jhm.2847. PubMed
26. Evans RS, Sharp JH, Linford LH, et al. Reduction of peripherally inserted central catheter-associated DVT. Chest. 2013;143(3):627-633. doi: 10.1378/chest.12-0923. PubMed
27. Smith S, Moureau N, Vaughn VM, et al. Patterns and predictors of peripherally inserted central catheter occlusion: The 3P-O study. J Vasc Interv Radiol. 2017;28(5):749-756.e2. doi: 10.1016/j.jvir.2017.02.005. PubMed
28. Vaughn VM, Linder JA. Thoughtless design of the electronic health record drives overuse, but purposeful design can nudge improved patient care. BMJ Qual Saf. 2018;27(8):583-586. doi: 10.1136/bmjqs-2017-007578. PubMed
© 2019 Society of Hospital Medicine
A Model to Improve Hospital-Based Palliative Care: The Palliative Care Redistribution Integrated System Model (PRISM)
Palliative care is an essential component of inpatient medicine. At its core, it is an interdisciplinary philosophy of care aiming to achieve the best quality of life for patients and families in the physical, psychosocial, and spiritual domains. With the aging population and growing complexity of hospitalized patients, inpatient palliative care needs are only projected to rise. However, a mismatch exists between the number of palliative care–trained physicians and the demand for such physicians. Currently, only 6,600 US physicians are board certified in palliative care – just 37% of the projected need.1 These workforce shortages have serious implications. In fact, it is estimated that nearly 40% of all hospitalized patients who need palliative care go without it.2
Existing efforts to improve access to palliative care have largely focused on bolstering the palliative care workforce. One tactic particularly relevant to hospitalists centers on frontline physicians providing “primary” palliative care: basic symptom management, patient-centered communication, and goals of care assessment, regardless of the disease state.3 Such physicians constitute the base of today’s palliative care workforce model – a three-tiered pyramid built on clinician availability and skills. In this model, the second tier (“secondary” palliative care) includes physicians supported by a palliative care consultant or referral. The third level (“tertiary” palliative care) encompasses care provided directly by specialized palliative care teams, usually within academic medical centers (Figure).4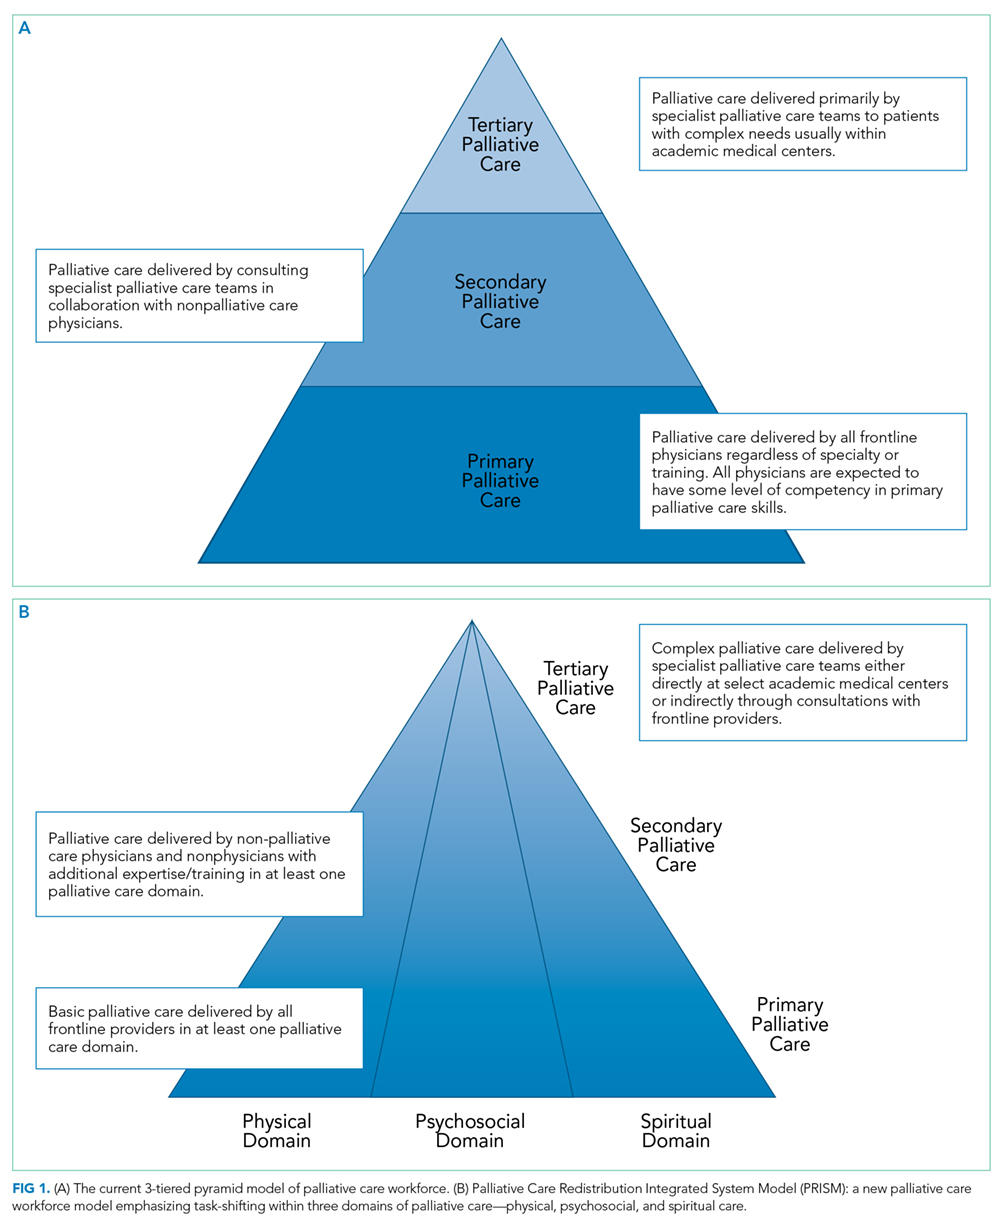
The practice of primary palliative care is central to the practice of hospital medicine.5,6 After all, hospitalists generate nearly half of all inpatient palliative care consultations7 and routinely interface with social workers, pharmacists, nurses, chaplains, and other consultants in their daily activities. Consequently, they are also well versed in serious illness communication and prognostication.8 In many ways, they are ideal purveyors of palliative care in the hospital.
Why then does the challenge to meet the demands of patients with palliative care needs persist? The truth may lie in at least three central shortcomings within the tiered palliative care workforce model. First, physicians comprising the base (where hospitalists typically fall) possess variable skills and knowledge in caring for seriously ill patients. While training opportunities exist for interested individuals,7 education alone can rarely achieve a systematic change. Second, some physicians may have the requisite skills but lack
The Palliative Care Redistribution Integrated Service Model (PRISM)
To better address the current palliative care access problem, we propose a new model: “The Palliative care Redistribution Integrated Service Model (PRISM; Figure 1).” Using the industrial engineering principle of “task shifting,” this approach leverages disciplinary diversity and shifts specific activities from more specialized to less specialized members.9 In this way, PRISM integrates hospital-based interdisciplinary teams across all tiers of palliative care delivery.
PRISM sheds a tier-based approach in favor of flexible, skill-based verticals that span all physician and nonphysician providers. By dividing the original pyramid into three domains – physical, psychosocial, and spiritual – providers with various spheres of expertise may serve patients on multiple tiers. For example, a bedside nurse may perform basic psychosocial assessment consistent with his or her training, while physicians may focus on code status or prescribe antiemetics or low-dose opiate monotherapy – skills they have refined during medical school. Analogously, secondary palliative care may be delivered by any provider with more advanced skills in communication or symptom management. In this way, we expand the pool of clinicians available to provide palliative care to include nurses, hospitalists, oncologists, intensivists, social workers, and chaplains and also recognize the diversity of skill sets within and between disciplines. Thus, a hospitalist may clarify the goals of care but may ask a social worker trained in psychosocial assessment for assistance with difficult family dynamics or a chaplain for spiritual needs. Interdisciplinary teamwork and cross-disciplinary communication – hallmarks of palliative care – are encouraged and valued. Furthermore, if providers feel uncomfortable providing a certain type of care, they can ask for assistance from more experienced providers within their discipline or outside of it. In rare cases, the most complex patients may be referred to specialist palliative care teams.
Inherent within PRISM is a recognition that all providers must have a basic palliative care skillset obtained through educational initiatives.7 Yet focusing solely on training the workforce as a strategy has and will continue to miss the mark. Rather, structural changes to the means of providing care are also needed. Within hospitals, these changes often rely heavily on hospitalists due to their central position in care delivery. In this way, hospitalists are well primed to be the agents of change in this model.
The Role of Technology
Since many hospitalized patients have unrecognized and underserved palliative care needs, a formal approach to assessment is needed. Lin et al. proposed criteria for a “sentinel hospitalization,” marking a major illness or transition in high-risk patients necessitating palliative interventions.10 Similar screening criteria have been validated among hospitalized oncology patients11 and in critical care.12 While checklists have been shown to help identify hospitalized patients with palliative care needs,13 their implementation has been slow, presumably because they are burdensome for busy providers to complete.
Technological automation may be a solution to the checklist conundrum. For example, if palliative care screening criteria could be automatically extracted from electronic health records, scoring systems could trigger hospitalists to consider the goals of care discussions or engage an interdisciplinary care team to fulfill a variety of needs. Frameworks for such scoring systems already exist and are familiar to most hospitalists. For example, admission order sets routinely calculate the Padua or Caprini score to facilitate decision-making for prophylaxis of deep vein thrombosis. An admission order set that screens and prompts decision-making around palliative care needs is thus feasible. One example is a hard stop for entering code status in the admission order set; in turn, this hard stop could also trigger providers to complete a “check-box” palliative care screening checklist. Automatic extraction of certain data from the record – such as age, prior code status, recent hospitalizations, or mobility scores – could auto-populate to facilitate decision-making. In turn, measuring the influence of such tools on access to palliative care, workflow, and capacity will be important, as most tools may not have quality or value intended.14
Streamlining Workflow
It is common for hospitalists to oversee care for 15-20 patients at a time. Thus, they may not have the time to meaningfully engage patients to assess palliative care needs. Creating designated hospitalist palliative care teams with enhanced interdisciplinary support for patients identified using sentinel hospitalization or checklist-based tools may help to solve this dilemma. These teams may also employ lower “caps,” freeing up time for critical discussions and planning around end of life. At the University of Michigan, we are planning just such an approach, a strategy which has the additional benefit of bypassing the binary “care versus no care” dilemma faced by patients choosing palliation. Rather, patients may continue to receive treatments congruent with the goals of care in such teams.
Making Palliative Care a Standard of Care
A call for health systems to develop and implement palliative care quality metrics has emerged. Given their role in quality improvement and health system reform, hospitalists are well positioned to shepherd this imperative. Creating incentives to screen inpatients for palliative care needs and develop new homes in which to care for these patients are but a few ways to help set the tone. Additionally, developing and sharing quality metrics and benchmarks currently captured in repositories such as the Palliative Care Quality Network, Global Palliative Care Quality Alliance, and Center to Advance Palliative Care can help to assess and continually improve care delivery. Creating and sharing dashboards from these metrics with all providers, regardless of discipline or training, will ensure accountability to deliver quality palliative care.
CONCLUSION
Many hospitalized patients do not receive appropriate attention to their palliative care needs. A new interdisciplinary workforce model that task shifts to physician and nonphysician providers and pairs system-level innovations and quality may solve this problem. Input and endorsement from a wide variety of disciplines (particularly our nonphysician colleagues) are needed to make PRISM operational. The proof of concept will lie in testing feasibility among key stakeholders and rigorously studying the proposed interventions. Through innovation in technology, workflow, and quality improvement, hospitalists are well poised to lead this change. After all, our patients deserve nothing less.
Disclosures
The authors have nothing to disclose.Funding: Dr. Abedini’s work is supported by the University of Michigan National Clinician Scholars Program at the Institute for Healthcare Policy and Innovation, as well as the Un
1. Lupu D. American Academy of Hospice and Palliative Medicine Task Force. Estimate of current hospice and palliative medicine physician workforce shortage. J Pain Symptom Manage. 2010;40(6):899-911. doi: 10.1016/j.jpainsymman.2010.07.004. PubMed
2. Chuang E, Hope AA, Allyn K, Szalkiewicz E, Gary B, Gong MN. Gaps in provision of primary and specialty palliative care in the acute care setting by race and ethnicity. J Pain Symptom Manage. 2017;54(5):645-653. doi: 10.1016/j.jpainsymman.2017.05.001 PubMed
3. Quill TE, Abernethy AP. Generalist plus specialist palliative care--creating a more sustainable model. N Engl J Med. 2013;368(13):1173-1175. doi: 10.1056/NEJMp1215620 PubMed
4. von Gunten CF. Secondary and tertiary palliative care in US hospitals. JAMA. 2002;287(7):875-881. doi: 10.1001/jama.287.7.875 PubMed
5. Pantilat SZ. Hope to reality: the future of hospitalists and palliative care. J Hosp Med. 2015;10(10):701-702. doi: 10.1002/jhm.2401 PubMed
6. Meier DE. Palliative care in hospitals. J Hosp Med. 2006;1(1):21-28. doi: 10.1016/j.cger.2004.07.006 PubMed
7. Fail RE, Meier DE. Improving quality of care for seriously ill patients: Opportunities for hospitalists. J Hosp Med. 2018;13(3):194-197. doi: 10.12788/jhm.2896. [Epub ahead of print] PubMed
8. Rosenberg LB, Greenwald J, Caponi B, et al. Confidence with and barriers to serious illness communication: A national survey of hospitalists. J Palliat Med. 2017;20(9):1013-1019. doi: 10.1089/jpm.2016.0515 PubMed
9. Carayon P, Gurses AP. Nursing workload and patient safety–a human factors engineering perspective. In: Hughes RG, ed.Patient Safety and Quality: An Evidence-Based Handbook for Nurses. Rockville, MD: Agency for Healthcare Research and Quality (US); 2008. PubMed
10. Lin RJ, Adelman RD, Diamond RR, Evans AT. The sentinel hospitalization and the role of palliative care. J Hosp Med. 2014;9(5):320-323. doi: 10.1002/jhm.2160 PubMed
11. Glare PA, Chow K. Validation of a simple screening tool for identifying unmet palliative care needs in patients with cancer. J Oncol Pract. 2015;11(1):e81-e86. doi: 10.1200/JOP.2014.001487. PubMed
12. Zalenski RJ, Jones SS, Courage C, et al. Impact of a palliative care screening and consultation in the ICU: A multihospital quality improvement project. J Pain Symptom Manage. 2017;53(1):5-12.e3. doi: 10.1016/j.jpainsymman.2016.08.003. PubMed
13. Weissman DE, Meier DE. Identifying patients in need of palliative care assessment in the hospital setting: a consensus report from the Center to Advance Palliative Care. J Palliat Med. 2011;14(1):17-23. doi: PubMed
14. MacLean CH, Kerr EA, Qaseem A. Time out-charting a path for improving performance measurement. N Engl J Med. 2018. Epub ahead of print. doi: 10.1056/NEJMp1802595 PubMed
Palliative care is an essential component of inpatient medicine. At its core, it is an interdisciplinary philosophy of care aiming to achieve the best quality of life for patients and families in the physical, psychosocial, and spiritual domains. With the aging population and growing complexity of hospitalized patients, inpatient palliative care needs are only projected to rise. However, a mismatch exists between the number of palliative care–trained physicians and the demand for such physicians. Currently, only 6,600 US physicians are board certified in palliative care – just 37% of the projected need.1 These workforce shortages have serious implications. In fact, it is estimated that nearly 40% of all hospitalized patients who need palliative care go without it.2
Existing efforts to improve access to palliative care have largely focused on bolstering the palliative care workforce. One tactic particularly relevant to hospitalists centers on frontline physicians providing “primary” palliative care: basic symptom management, patient-centered communication, and goals of care assessment, regardless of the disease state.3 Such physicians constitute the base of today’s palliative care workforce model – a three-tiered pyramid built on clinician availability and skills. In this model, the second tier (“secondary” palliative care) includes physicians supported by a palliative care consultant or referral. The third level (“tertiary” palliative care) encompasses care provided directly by specialized palliative care teams, usually within academic medical centers (Figure).4
The practice of primary palliative care is central to the practice of hospital medicine.5,6 After all, hospitalists generate nearly half of all inpatient palliative care consultations7 and routinely interface with social workers, pharmacists, nurses, chaplains, and other consultants in their daily activities. Consequently, they are also well versed in serious illness communication and prognostication.8 In many ways, they are ideal purveyors of palliative care in the hospital.
Why then does the challenge to meet the demands of patients with palliative care needs persist? The truth may lie in at least three central shortcomings within the tiered palliative care workforce model. First, physicians comprising the base (where hospitalists typically fall) possess variable skills and knowledge in caring for seriously ill patients. While training opportunities exist for interested individuals,7 education alone can rarely achieve a systematic change. Second, some physicians may have the requisite skills but lack
The Palliative Care Redistribution Integrated Service Model (PRISM)
To better address the current palliative care access problem, we propose a new model: “The Palliative care Redistribution Integrated Service Model (PRISM; Figure 1).” Using the industrial engineering principle of “task shifting,” this approach leverages disciplinary diversity and shifts specific activities from more specialized to less specialized members.9 In this way, PRISM integrates hospital-based interdisciplinary teams across all tiers of palliative care delivery.
PRISM sheds a tier-based approach in favor of flexible, skill-based verticals that span all physician and nonphysician providers. By dividing the original pyramid into three domains – physical, psychosocial, and spiritual – providers with various spheres of expertise may serve patients on multiple tiers. For example, a bedside nurse may perform basic psychosocial assessment consistent with his or her training, while physicians may focus on code status or prescribe antiemetics or low-dose opiate monotherapy – skills they have refined during medical school. Analogously, secondary palliative care may be delivered by any provider with more advanced skills in communication or symptom management. In this way, we expand the pool of clinicians available to provide palliative care to include nurses, hospitalists, oncologists, intensivists, social workers, and chaplains and also recognize the diversity of skill sets within and between disciplines. Thus, a hospitalist may clarify the goals of care but may ask a social worker trained in psychosocial assessment for assistance with difficult family dynamics or a chaplain for spiritual needs. Interdisciplinary teamwork and cross-disciplinary communication – hallmarks of palliative care – are encouraged and valued. Furthermore, if providers feel uncomfortable providing a certain type of care, they can ask for assistance from more experienced providers within their discipline or outside of it. In rare cases, the most complex patients may be referred to specialist palliative care teams.
Inherent within PRISM is a recognition that all providers must have a basic palliative care skillset obtained through educational initiatives.7 Yet focusing solely on training the workforce as a strategy has and will continue to miss the mark. Rather, structural changes to the means of providing care are also needed. Within hospitals, these changes often rely heavily on hospitalists due to their central position in care delivery. In this way, hospitalists are well primed to be the agents of change in this model.
The Role of Technology
Since many hospitalized patients have unrecognized and underserved palliative care needs, a formal approach to assessment is needed. Lin et al. proposed criteria for a “sentinel hospitalization,” marking a major illness or transition in high-risk patients necessitating palliative interventions.10 Similar screening criteria have been validated among hospitalized oncology patients11 and in critical care.12 While checklists have been shown to help identify hospitalized patients with palliative care needs,13 their implementation has been slow, presumably because they are burdensome for busy providers to complete.
Technological automation may be a solution to the checklist conundrum. For example, if palliative care screening criteria could be automatically extracted from electronic health records, scoring systems could trigger hospitalists to consider the goals of care discussions or engage an interdisciplinary care team to fulfill a variety of needs. Frameworks for such scoring systems already exist and are familiar to most hospitalists. For example, admission order sets routinely calculate the Padua or Caprini score to facilitate decision-making for prophylaxis of deep vein thrombosis. An admission order set that screens and prompts decision-making around palliative care needs is thus feasible. One example is a hard stop for entering code status in the admission order set; in turn, this hard stop could also trigger providers to complete a “check-box” palliative care screening checklist. Automatic extraction of certain data from the record – such as age, prior code status, recent hospitalizations, or mobility scores – could auto-populate to facilitate decision-making. In turn, measuring the influence of such tools on access to palliative care, workflow, and capacity will be important, as most tools may not have quality or value intended.14
Streamlining Workflow
It is common for hospitalists to oversee care for 15-20 patients at a time. Thus, they may not have the time to meaningfully engage patients to assess palliative care needs. Creating designated hospitalist palliative care teams with enhanced interdisciplinary support for patients identified using sentinel hospitalization or checklist-based tools may help to solve this dilemma. These teams may also employ lower “caps,” freeing up time for critical discussions and planning around end of life. At the University of Michigan, we are planning just such an approach, a strategy which has the additional benefit of bypassing the binary “care versus no care” dilemma faced by patients choosing palliation. Rather, patients may continue to receive treatments congruent with the goals of care in such teams.
Making Palliative Care a Standard of Care
A call for health systems to develop and implement palliative care quality metrics has emerged. Given their role in quality improvement and health system reform, hospitalists are well positioned to shepherd this imperative. Creating incentives to screen inpatients for palliative care needs and develop new homes in which to care for these patients are but a few ways to help set the tone. Additionally, developing and sharing quality metrics and benchmarks currently captured in repositories such as the Palliative Care Quality Network, Global Palliative Care Quality Alliance, and Center to Advance Palliative Care can help to assess and continually improve care delivery. Creating and sharing dashboards from these metrics with all providers, regardless of discipline or training, will ensure accountability to deliver quality palliative care.
CONCLUSION
Many hospitalized patients do not receive appropriate attention to their palliative care needs. A new interdisciplinary workforce model that task shifts to physician and nonphysician providers and pairs system-level innovations and quality may solve this problem. Input and endorsement from a wide variety of disciplines (particularly our nonphysician colleagues) are needed to make PRISM operational. The proof of concept will lie in testing feasibility among key stakeholders and rigorously studying the proposed interventions. Through innovation in technology, workflow, and quality improvement, hospitalists are well poised to lead this change. After all, our patients deserve nothing less.
Disclosures
The authors have nothing to disclose.Funding: Dr. Abedini’s work is supported by the University of Michigan National Clinician Scholars Program at the Institute for Healthcare Policy and Innovation, as well as the Un
1. Lupu D. American Academy of Hospice and Palliative Medicine Task Force. Estimate of current hospice and palliative medicine physician workforce shortage. J Pain Symptom Manage. 2010;40(6):899-911. doi: 10.1016/j.jpainsymman.2010.07.004. PubMed
2. Chuang E, Hope AA, Allyn K, Szalkiewicz E, Gary B, Gong MN. Gaps in provision of primary and specialty palliative care in the acute care setting by race and ethnicity. J Pain Symptom Manage. 2017;54(5):645-653. doi: 10.1016/j.jpainsymman.2017.05.001 PubMed
3. Quill TE, Abernethy AP. Generalist plus specialist palliative care--creating a more sustainable model. N Engl J Med. 2013;368(13):1173-1175. doi: 10.1056/NEJMp1215620 PubMed
4. von Gunten CF. Secondary and tertiary palliative care in US hospitals. JAMA. 2002;287(7):875-881. doi: 10.1001/jama.287.7.875 PubMed
5. Pantilat SZ. Hope to reality: the future of hospitalists and palliative care. J Hosp Med. 2015;10(10):701-702. doi: 10.1002/jhm.2401 PubMed
6. Meier DE. Palliative care in hospitals. J Hosp Med. 2006;1(1):21-28. doi: 10.1016/j.cger.2004.07.006 PubMed
7. Fail RE, Meier DE. Improving quality of care for seriously ill patients: Opportunities for hospitalists. J Hosp Med. 2018;13(3):194-197. doi: 10.12788/jhm.2896. [Epub ahead of print] PubMed
8. Rosenberg LB, Greenwald J, Caponi B, et al. Confidence with and barriers to serious illness communication: A national survey of hospitalists. J Palliat Med. 2017;20(9):1013-1019. doi: 10.1089/jpm.2016.0515 PubMed
9. Carayon P, Gurses AP. Nursing workload and patient safety–a human factors engineering perspective. In: Hughes RG, ed.Patient Safety and Quality: An Evidence-Based Handbook for Nurses. Rockville, MD: Agency for Healthcare Research and Quality (US); 2008. PubMed
10. Lin RJ, Adelman RD, Diamond RR, Evans AT. The sentinel hospitalization and the role of palliative care. J Hosp Med. 2014;9(5):320-323. doi: 10.1002/jhm.2160 PubMed
11. Glare PA, Chow K. Validation of a simple screening tool for identifying unmet palliative care needs in patients with cancer. J Oncol Pract. 2015;11(1):e81-e86. doi: 10.1200/JOP.2014.001487. PubMed
12. Zalenski RJ, Jones SS, Courage C, et al. Impact of a palliative care screening and consultation in the ICU: A multihospital quality improvement project. J Pain Symptom Manage. 2017;53(1):5-12.e3. doi: 10.1016/j.jpainsymman.2016.08.003. PubMed
13. Weissman DE, Meier DE. Identifying patients in need of palliative care assessment in the hospital setting: a consensus report from the Center to Advance Palliative Care. J Palliat Med. 2011;14(1):17-23. doi: PubMed
14. MacLean CH, Kerr EA, Qaseem A. Time out-charting a path for improving performance measurement. N Engl J Med. 2018. Epub ahead of print. doi: 10.1056/NEJMp1802595 PubMed
© 2018 Society of Hospital Medicine
Focused Ethnography of Diagnosis in Academic Medical Centers
Diagnostic error—defined as a failure to establish an accurate and timely explanation of the patient’s health problem—is an important source of patient harm.1 Data suggest that all patients will experience at least 1 diagnostic error in their lifetime.2-4 Not surprisingly, diagnostic errors are among the leading categories of paid malpractice claims in the United States.5
Despite diagnostic errors being morbid and sometimes deadly in the hospital,6,7 little is known about how residents and learners approach diagnostic decision making. Errors in diagnosis are believed to stem from cognitive or system failures,8 with errors in cognition believed to occur due to rapid, reflexive thinking operating in the absence of a more analytical, deliberate process. System-based problems (eg, lack of expert availability, technology barriers, and access to data) have also been cited as contributors.9 However, whether and how these apply to trainees is not known.
Therefore, we conducted a focused ethnography of inpatient medicine teams (ie, attendings, residents, interns, and medical students) in 2 affiliated teaching hospitals, aiming to (a) observe the process of diagnosis by trainees and (b) identify methods to improve the diagnostic process and prevent errors.
METHODS
We designed a multimethod, focused ethnographic study to examine diagnostic decision making in hospital settings.10,11 In contrast to anthropologic ethnographies that study entire fields using open-ended questions, our study was designed to examine the process of diagnosis from the perspective of clinicians engaged in this activity.11 This approach allowed us to capture diagnostic decisions and cognitive and system-based factors in a manner currently lacking in the literature.12
Setting and Participants
Between January 2016 and May 2016, we observed the members of four inpatient internal medicine teaching teams at 2 affiliated teaching hospitals. We purposefully selected teaching teams for observation because they are the primary model of care in academic settings and we have expertise in carrying out similar studies.13,14 Teaching teams typically consisted of a medical attending (senior-level physician), 1 senior resident (a second- or third-year postgraduate trainee), two interns (a trainee in their first postgraduate year), and two to four medical students. Teams were selected at random using existing schedules and followed Monday to Friday so as to permit observation of work on call and noncall days. Owing to manpower limitations, weekend and night shifts were not observed. However, overnight events were captured during morning rounds.
Most of the teams began rounds at 8:30 AM. Typically, rounds lasted for 90–120 min and concluded with a recap (ie, “running the list”) with a review of explicit plans for patients after they had been evaluated by the attending. This discussion often occurred in the team rooms, with the attending leading the discussion with the trainees.
Data Collection
A multidisciplinary team, including clinicians (eg, physicians, nurses), nonclinicians (eg, qualitative researchers, social scientists), and healthcare engineers, conducted the observations. We observed preround activities of interns and residents before arrival of the attending (7:00 AM - 8:30 AM), followed by morning rounds with the entire team, and afternoon work that included senior residents, interns, and students.
To capture multiple aspects of the diagnostic process, we collected data using field notes modeled on components of the National Academy of Science model for diagnosis (Appendix).1,15 This model encompasses phases of the diagnostic process (eg, data gathering, integration, formulation of a working diagnosis, treatment delivery, and outcomes) and the work system (team members, organization, technology and tools, physical environment, tasks).
Focus Groups and Interviews
At the end of weekly observations, we conducted focus groups with the residents and one-on- one interviews with the attendings. Focus groups with the residents were conducted to encourage a group discussion about the diagnostic process. Separate interviews with the attendings were performed to ensure that power differentials did not influence discussions. During focus groups, we specifically asked about challenges and possible solutions to improve diagnosis. Experienced qualitative methodologists (J.F., M.H., M.Q.) used semistructured interview guides for discussions (Appendix).
Data Analysis
After aggregating and reading the data, three reviewers (V.C., S.K., S.S.) began inductive analysis by handwriting notes and initial reflective thoughts to create preliminary codes. Multiple team members then reread the original field notes and the focus group/interview data to refine the preliminary codes and develop additional codes. Next, relationships between codes were identified and used to develop key themes. Triangulation of data collected from observations and interview/focus group sessions was carried out to compare data that we surmised with data that were verbalized by the team. The developed themes were discussed as a group to ensure consistency of major findings.
Ethical and Regulatory Oversight
This study was reviewed and approved by the Institutional Review Boards at the University of Michigan Health System (HUM-00106657) and the VA Ann Arbor Healthcare System (1-2016-010040).
RESULTS
Four teaching teams (4 attendings, 4 senior residents, 9 interns, and 14 medical students) were observed over 33 distinct shifts and 168 hours. Observations included morning rounds (96 h), postround call days (52 h), and postround non-call days (20 h). Morning rounds lasted an average of 127 min (range: 48-232 min) and included an average of 9 patients (range: 4-16 patients).
Themes Regarding the Diagnostic Process
We identified the following 4 primary themes related to the diagnostic process in teaching hospitals: (1) diagnosis is a social phenomenon; (2) data necessary to make diagnoses are fragmented; (3) distractions undermine the diagnostic process; and (4) time pressures interfere with diagnostic decision making (Appendix Table 1).
(1) Diagnosis is a Social Phenomenon.
Team members viewed the process of diagnosis as a social exchange of facts, findings, and strategies within a defined structure. The opportunity to discuss impressions with others was valued as a means to share, test, and process assumptions.
“Rounds are the most important part of the process. That is where we make most decisions in a collective, collaborative way with the attending present. We bounce ideas off each other.” (Intern)
Typical of social processes, variations based on time of day and schedule were observed. For instance, during call days, learners gathered data and formed working diagnosis and treatment plans with minimal attending interaction. This separation of roles and responsibilities introduced a hierarchy within diagnosis as follows:
“The interns would not call me first; they would talk to the senior resident and then if the senior thought he should chat with me, then they would call. But for the most part, they gather information and come up with the plan.” (Attending).
The work system was suited to facilitate social interactions. For instance, designated rooms (with team members informally assigned to a computer) provided physical proximity of the resident to interns and medical students. In this space, numerous informal discussions between team members (eg, “What do you think about this test?” “I’m not sure what to do about this finding.” “Should I call a [consult] on this patient?”) were observed. Although proximity to each other was viewed as beneficial, dangers to the social nature of diagnosis in the form of anchoring (ie, a cognitive bias where emphasis is placed on the first piece of data)16 were also mentioned. Similarly, the paradox associated with social proof (ie, the pressure to assume conformity within a group) was also observed as disagreement between team members and attendings rarely occurred during observations.
“I mean, they’re the attending, right? It’s hard to argue with them when they want a test or something done. When I do push back, it’s rare that others will support me–so it’s usually me and the attending.” (Resident)
“I would push back if I think it’s really bad for the patient or could cause harm–but the truth is, it doesn’t happen much.” (Intern)
(2) Data Necessary to Make Diagnoses are Fragmented
Team members universally cited fragmentation in data delivery, retrieval, and processing as a barrier to diagnosis. Team members indicated that test results might not be looked at or acted upon in a timely manner, and participants pointed to the electronic medical record as a source of this challenge.
“Before I knew about [the app for Epic], I would literally sit on the computer to get all the information we would need on rounds. Its key to making decisions. We often say we will do something, only to find the test result doesn’t support it–and then we’re back to square 1.” (Intern)
Information used by teams came from myriad sources (eg, patients, family members, electronic records) and from various settings (eg, emergency department, patient rooms, discussions with consultants). Additionally, test results often appeared without warning. Thus, availability of information was poorly aligned with clinical duties.
“They (the lab) will call us when a blood culture is positive or something is off. That is very helpful but it often comes later in the day, when we’re done with rounds.” (Resident)
The work system was highlighted as a key contributor to data fragmentation. Peculiarities of our electronic medical record (EMR) and how data were collected, stored, or presented were described as “frustrating,” and “unsafe,” by team members. Correspondingly, we frequently observed interns asking for assistance for tasks such as ordering tests or finding information despite being “trained” to use the EMR.
“People have to learn how to filter, how to recognize the most important points and link data streams together in terms of causality. But we assume they know where to find that information. It’s actually a very hard thing to do, for both the house staff and me.” (Attending)
(3) Distractions Undermine the Diagnostic Process
Distractions often created cognitive difficulties. For example, ambient noise and interruptions from neighbors working on other teams were cited as barriers to diagnosis. In addition, we observed several team members using headphones to drown out ambient noise while working on the computer.
“I know I shouldn’t do it (wear headphones), but I have no other way of turning down the noise so I can concentrate.” (Intern)
Similarly, the unpredictable nature and the volume of pages often interrupted thinking about diagnosis.
“Sometimes the pager just goes off all the time and (after making sure its not an urgent issue), I will just ignore it for a bit, especially if I am in the middle of something. It would be great if I could finish my thought process knowing I would not be interrupted.” (Resident)
To mitigate this problem, 1 attending described how he would proactively seek out nurses caring for his patients to “head off” questions (eg, “I will renew the restraints and medications this morning,” and “Is there anything you need in terms of orders for this patient that I can take care of now?”) that might lead to pages. Another resident described his approach as follows:
“I make it a point to tell the nurses where I will be hanging out and where they can find me if they have any questions. I tell them to come talk to me rather than page me since that will be less distracting.” (Resident).
Most of the interns described documentation work such as writing admission and progress notes in negative terms (“an academic exercise,” “part of the billing activity”). However, in the context of interruptions, some described this as helpful.
“The most valuable part of the thinking process was writing the assessment and plan because that’s actually my schema for all problems. It literally is the only time where I can sit and collect my thoughts to formulate a diagnosis and plan.” (Intern)
(4) Time Pressures Interfere With Diagnostic Decision Making
All team members spoke about the challenge of finding time for diagnosis during the workday. Often, they had to skip learning sessions for this purpose.
“They tell us we should go to morning report or noon conference but when I’m running around trying to get things done. I hate having to choose between my education and doing what’s best for the patient–but that’s often what it comes down to.” (Intern)
When specifically asked whether setting aside dedicated time to specifically review and formulate diagnoses would be valuable, respondents were uniformly enthusiastic. Team members described attentional conflicts as being the worst when “cross covering” other teams on call days, as their patient load effectively doubled during this time. Of note, cross-covering occurred when teams were also on call—and thus took them away from important diagnostic activities such as data gathering or synthesis for patients they were admitting.
“If you were to ever design a system where errors were likely–this is how you would design it: take a team with little supervision, double their patient load, keep them busy with new challenging cases and then ask questions about patients they know little about.” (Resident)
DISCUSSION
Although diagnostic errors have been called “the next frontier for patient safety,”17 little is known about the process, barriers, and facilitators to diagnosis in teaching hospitals. In this focused ethnography conducted at 2 academic medical centers, we identified multiple cognitive and system-level challenges and potential strategies to improve diagnosis from trainees engaged in this activity. Key themes identified by those we observed included the social nature of diagnosis, fragmented information delivery, constant distractions and interruptions, and time pressures. In turn, these insights allow us to generate strategies that can be applied to improve the diagnostic process in teaching hospitals.
Our study underscores the importance of social interactions in diagnosis. In contrast, most of the interventions to prevent diagnostic errors target individual providers through practices such as metacognition and “thinking about thinking.”18-20 These interventions are based on Daniel Kahnemann’s work on dual thought process. Type 1 thought processes are fast, subconscious, reflexive, largely intuitive, and more vulnerable to error. In contrast, Type 2 processes are slower, deliberate, analytic, and less prone to error.21 Although an individual’s Type 2 thought capacity is limited, a major goal of cognitive interventions is to encourage Type 2 over Type 1 thinking, an approach termed “de-biasing.”22-24 Unfortunately, cognitive interventions testing such approaches have suffered mixed results–perhaps because of lack of focus on collective wisdom or group thinking, which may be key to diagnosis from our findings.9,25 In this sense, morning rounds were a social gathering used to strategize and develop care plans, but with limited time to think about diagnosis.26 Introduction of defined periods for individuals to engage in diagnostic activities such as de-biasing (ie, asking “what else could this be)27 before or after rounds may provide an opportunity for reflection and improving diagnosis. In addition, embedding tools such as diagnosis expanders and checklists within these defined time slots28,29 may prove to be useful in reflecting on diagnosis and preventing diagnostic errors.
An unexpected yet important finding from this study were the challenges posed by distractions and the physical environment. Potentially maladaptive workarounds to these interruptions included use of headphones; more productive strategies included updating nurses with plans to avert pages and creating a list of activities to ensure that key tasks were not forgotten.30,31 Applying lessons from aviation, a focused effort to limit distractions during key portions of the day, might be worth considering for diagnostic safety.32 Similarly, improving the environment in which diagnosis occurs—including creating spaces that are quiet, orderly, and optimized for thinking—may be valuable.33Our study has limitations. First, our findings are limited to direct observations; we are thus unable to comment on how unobserved aspects of care (eg, cognitive processes) might have influenced our findings. Our observations of clinical care might also have introduced a Hawthorne effect. However, because we were closely integrated with teams and conducted focus groups to corroborate our assessments, we believe that this was not the case. Second, we did not identify diagnostic errors or link processes we observed to errors. Third, our approach is limited to 2 teaching centers, thereby limiting the generalizability of findings. Relatedly, we were only able to conduct observations during weekdays; differences in weekend and night resources might affect our insights.
The cognitive and system-based barriers faced by clinicians in teaching hospitals suggest that new methods to improve diagnosis are needed. Future interventions such as defined “time-outs” for diagnosis, strategies focused on limiting distractions, and methods to improve communication between team members are novel and have parallels in other industries. As challenges to quantify diagnostic errors abound,34 improving cognitive- and system-based factors via reflection through communication, concentration, and organization is necessary to improve medical decision making in academic medical centers.
Disclosures
None declared for all coauthors.
Funding
This project was supported by grant number P30HS024385 from the Agency for Healthcare Research and Quality. The funding source played no role in study design, data acquisition, analysis or decision to report these data. Dr. Chopra is supported by a career development award from the Agency of Healthcare Research and Quality (1-K08-HS022835-01). Dr. Krein is supported by a VA Health Services Research and Development Research Career Scientist Award (RCS 11-222). Dr. Singh is partially supported by Houston VA HSR&D Center for Innovations in Quality, Effectiveness and Safety (CIN 13-413). The content is solely the responsibility of the authors and does not necessarily represent the official views of the Agency for Healthcare Research and Quality or the Department of Veterans Affairs.
1. National Academies of Sciences, Engineering, and Medicine. 2015. Improving Diagnosis in Health Care. Washington, DC: The National Academies Press. http://www.nap.edu/21794. Accessed November 1; 2016:2015. https://doi.org/10.17226/21794.
2. Schiff GD, Hasan O, Kim S, et al. Diagnostic error in medicine: analysis of 583 physician-reported errors. Arch Intern Med. 2009;169(20):1881-1887. http://dx.doi.org/10.1001/archinternmed.2009.333. PubMed
3. Sonderegger-Iseli K, Burger S, Muntwyler J, Salomon F. Diagnostic errors in three medical eras: A necropsy study. Lancet. 2000;355(9220):2027-2031. http://dx.doi.org/10.1016/S0140-6736(00)02349-7. PubMed
4. Winters B, Custer J, Galvagno SM Jr, et al. Diagnostic errors in the intensive care unit: a systematic review of autopsy studies. BMJ Qual Saf. 2012;21(11):894-902. http://dx.doi.org/10.1136/bmjqs-2012-000803. PubMed
5. Saber Tehrani AS, Lee H, Mathews SC, et al. 25-Year summary of US malpractice claims for diagnostic errors 1986-2010: an analysis from the National Practitioner Data Bank. BMJ Qual Saf. 2013;22(8):672-680. http://dx.doi.org/10.1136/bmjqs-2012-001550. PubMed
6. Graber M, Gordon R, Franklin N. Reducing diagnostic errors in medicine: what’s the goal? Acad Med. 2002;77(10):981-992. http://dx.doi.org/10.1097/00001888-200210000-00009. PubMed
7. Gupta A, Snyder A, Kachalia A, Flanders S, Saint S, Chopra V. Malpractice claims related to diagnostic errors in the hospital. BMJ Qual Saf. 2018;27(1):53-60. 10.1136/bmjqs-2017-006774. PubMed
8. van Noord I, Eikens MP, Hamersma AM, de Bruijne MC. Application of root cause analysis on malpractice claim files related to diagnostic failures. Qual Saf Health Care. 2010;19(6):e21. http://dx.doi.org/10.1136/qshc.2008.029801. PubMed
9. Croskerry P, Petrie DA, Reilly JB, Tait G. Deciding about fast and slow decisions. Acad Med. 2014;89(2):197-200. 10.1097/ACM.0000000000000121. PubMed
10. Higginbottom GM, Pillay JJ, Boadu NY. Guidance on performing focused ethnographies with an emphasis on healthcare research. Qual Rep. 2013;18(9):1-6. https://doi.org/10.7939/R35M6287P.
11. Savage J. Participative observation: standing in the shoes of others? Qual Health Res. 2000;10(3):324-339. http://dx.doi.org/10.1177/104973200129118471. PubMed
12. Patton MQ. Qualitative Research and Evaluation Methods. 3rd ed. Thousand Oaks, CA: SAGE Publications; 2002.
13. Harrod M, Weston LE, Robinson C, Tremblay A, Greenstone CL, Forman J. “It goes beyond good camaraderie”: A qualitative study of the process of becoming an interprofessional healthcare “teamlet.” J Interprof Care. 2016;30(3):295-300. http://dx.doi.org/10.3109/13561820.2015.1130028. PubMed
14. Houchens N, Harrod M, Moody S, Fowler KE, Saint S. Techniques and behaviors associated with exemplary inpatient general medicine teaching: an exploratory qualitative study. J Hosp Med. 2017;12(7):503-509. http://dx.doi.org/10.12788/jhm.2763. PubMed
15. Mulhall A. In the field: notes on observation in qualitative research. J Adv Nurs. 2003;41(3):306-313. http://dx.doi.org/10.1046/j.1365-2648.2003.02514.x. PubMed
16. Zwaan L, Monteiro S, Sherbino J, Ilgen J, Howey B, Norman G. Is bias in the eye of the beholder? A vignette study to assess recognition of cognitive biases in clinical case workups. BMJ Qual Saf. 2017;26(2):104-110. http://dx.doi.org/10.1136/bmjqs-2015-005014. PubMed
17. Singh H, Graber ML. Improving diagnosis in health care--the next imperative for patient safety. N Engl J Med. 2015;373(26):2493-2495. http://dx.doi.org/10.1056/NEJMp1512241. PubMed
18. Croskerry P. From mindless to mindful practice--cognitive bias and clinical decision making. N Engl J Med. 2013;368(26):2445-2448. http://dx.doi.org/10.1056/NEJMp1303712. PubMed
19. van den Berge K, Mamede S. Cognitive diagnostic error in internal medicine. Eur J Intern Med. 2013;24(6):525-529. http://dx.doi.org/10.1016/j.ejim.2013.03.006. PubMed
20. Norman G, Sherbino J, Dore K, et al. The etiology of diagnostic errors: A controlled trial of system 1 versus system 2 reasoning. Acad Med. 2014;89(2):277-284. 10.1097/ACM.0000000000000105 PubMed
21. Dhaliwal G. Premature closure? Not so fast. BMJ Qual Saf. 2017;26(2):87-89. http://dx.doi.org/10.1136/bmjqs-2016-005267. PubMed
22. Croskerry P, Singhal G, Mamede S. Cognitive debiasing 1: Origins of bias and theory of debiasing. BMJ Qual Saf. 2013;22(suppl 2):ii58-iiii64. http://dx.doi.org/10.1136/bmjqs-2012-001712. PubMed
23. Croskerry P, Singhal G, Mamede S. Cognitive debiasing 2: Impediments to and strategies for change. BMJ Qual Saf. 2013;22(suppl 2):ii65-iiii72. http://dx.doi.org/10.1136/bmjqs-2012-001713. PubMed
24. Reilly JB, Ogdie AR, Von Feldt JM, Myers JS. Teaching about how doctors think: a longitudinal curriculum in cognitive bias and diagnostic error for residents. BMJ Qual Saf. 2013;22(12):1044-1050. http://dx.doi.org/10.1136/bmjqs-2013-001987. PubMed
25. Schmidt HG, Mamede S, van den Berge K, van Gog T, van Saase JL, Rikers RM. Exposure to media information about a disease can cause doctors to misdiagnose similar-looking clinical cases. Acad Med. 2014;89(2):285-291. http://dx.doi.org/10.1097/ACM.0000000000000107. PubMed
26. Hess BJ, Lipner RS, Thompson V, Holmboe ES, Graber ML. Blink or think: can further reflection improve initial diagnostic impressions? Acad Med. 2015;90(1):112-118. http://dx.doi.org/10.1097/ACM.0000000000000550. PubMed
27. Lambe KA, O’Reilly G, Kelly BD, Curristan S. Dual-process cognitive interventions to enhance diagnostic reasoning: A systematic review. BMJ Qual Saf. 2016;25(10):808-820. http://dx.doi.org/10.1136/bmjqs-2015-004417. PubMed
28. Graber ML, Kissam S, Payne VL, et al. Cognitive interventions to reduce diagnostic error: a narrative review. BMJ Qual Saf. 2012;21(7):535-557. http://dx.doi.org/10.1136/bmjqs-2011-000149. PubMed
29. McDonald KM, Matesic B, Contopoulos-Ioannidis DG, et al. Patient safety strategies targeted at diagnostic errors: a systematic review. Ann Intern Med. 2013;158(5 Pt 2):381-389. http://dx.doi.org/10.7326/0003-4819-158-5-201303051-00004. PubMed
30. Wray CM, Chaudhry S, Pincavage A, et al. Resident shift handoff strategies in US internal medicine residency programs. JAMA. 2016;316(21):2273-2275. http://dx.doi.org/10.1001/jama.2016.17786. PubMed
31. Choo KJ, Arora VM, Barach P, Johnson JK, Farnan JM. How do supervising physicians decide to entrust residents with unsupervised tasks? A qualitative analysis. J Hosp Med. 2014;9(3):169-175. http://dx.doi.org/10.1002/jhm.2150. PubMed
32. Carayon P, Wood KE. Patient safety - the role of human factors and systems engineering. Stud Health Technol Inform. 2010;153:23-46.
.http://dx.doi.org/10.1001/jama.2015.13453 PubMed
34. McGlynn EA, McDonald KM, Cassel CK. Measurement is essential for improving diagnosis and reducing diagnostic error: A report from the Institute of Medicine. JAMA. 2015;314(23):2501-2502.
.http://dx.doi.org/10.1136/bmjqs-2013-001812 PubMed
33. Carayon P, Xie A, Kianfar S. Human factors and ergonomics as a patient safety practice. BMJ Qual Saf. 2014;23(3):196-205. PubMed
Diagnostic error—defined as a failure to establish an accurate and timely explanation of the patient’s health problem—is an important source of patient harm.1 Data suggest that all patients will experience at least 1 diagnostic error in their lifetime.2-4 Not surprisingly, diagnostic errors are among the leading categories of paid malpractice claims in the United States.5
Despite diagnostic errors being morbid and sometimes deadly in the hospital,6,7 little is known about how residents and learners approach diagnostic decision making. Errors in diagnosis are believed to stem from cognitive or system failures,8 with errors in cognition believed to occur due to rapid, reflexive thinking operating in the absence of a more analytical, deliberate process. System-based problems (eg, lack of expert availability, technology barriers, and access to data) have also been cited as contributors.9 However, whether and how these apply to trainees is not known.
Therefore, we conducted a focused ethnography of inpatient medicine teams (ie, attendings, residents, interns, and medical students) in 2 affiliated teaching hospitals, aiming to (a) observe the process of diagnosis by trainees and (b) identify methods to improve the diagnostic process and prevent errors.
METHODS
We designed a multimethod, focused ethnographic study to examine diagnostic decision making in hospital settings.10,11 In contrast to anthropologic ethnographies that study entire fields using open-ended questions, our study was designed to examine the process of diagnosis from the perspective of clinicians engaged in this activity.11 This approach allowed us to capture diagnostic decisions and cognitive and system-based factors in a manner currently lacking in the literature.12
Setting and Participants
Between January 2016 and May 2016, we observed the members of four inpatient internal medicine teaching teams at 2 affiliated teaching hospitals. We purposefully selected teaching teams for observation because they are the primary model of care in academic settings and we have expertise in carrying out similar studies.13,14 Teaching teams typically consisted of a medical attending (senior-level physician), 1 senior resident (a second- or third-year postgraduate trainee), two interns (a trainee in their first postgraduate year), and two to four medical students. Teams were selected at random using existing schedules and followed Monday to Friday so as to permit observation of work on call and noncall days. Owing to manpower limitations, weekend and night shifts were not observed. However, overnight events were captured during morning rounds.
Most of the teams began rounds at 8:30 AM. Typically, rounds lasted for 90–120 min and concluded with a recap (ie, “running the list”) with a review of explicit plans for patients after they had been evaluated by the attending. This discussion often occurred in the team rooms, with the attending leading the discussion with the trainees.
Data Collection
A multidisciplinary team, including clinicians (eg, physicians, nurses), nonclinicians (eg, qualitative researchers, social scientists), and healthcare engineers, conducted the observations. We observed preround activities of interns and residents before arrival of the attending (7:00 AM - 8:30 AM), followed by morning rounds with the entire team, and afternoon work that included senior residents, interns, and students.
To capture multiple aspects of the diagnostic process, we collected data using field notes modeled on components of the National Academy of Science model for diagnosis (Appendix).1,15 This model encompasses phases of the diagnostic process (eg, data gathering, integration, formulation of a working diagnosis, treatment delivery, and outcomes) and the work system (team members, organization, technology and tools, physical environment, tasks).
Focus Groups and Interviews
At the end of weekly observations, we conducted focus groups with the residents and one-on- one interviews with the attendings. Focus groups with the residents were conducted to encourage a group discussion about the diagnostic process. Separate interviews with the attendings were performed to ensure that power differentials did not influence discussions. During focus groups, we specifically asked about challenges and possible solutions to improve diagnosis. Experienced qualitative methodologists (J.F., M.H., M.Q.) used semistructured interview guides for discussions (Appendix).
Data Analysis
After aggregating and reading the data, three reviewers (V.C., S.K., S.S.) began inductive analysis by handwriting notes and initial reflective thoughts to create preliminary codes. Multiple team members then reread the original field notes and the focus group/interview data to refine the preliminary codes and develop additional codes. Next, relationships between codes were identified and used to develop key themes. Triangulation of data collected from observations and interview/focus group sessions was carried out to compare data that we surmised with data that were verbalized by the team. The developed themes were discussed as a group to ensure consistency of major findings.
Ethical and Regulatory Oversight
This study was reviewed and approved by the Institutional Review Boards at the University of Michigan Health System (HUM-00106657) and the VA Ann Arbor Healthcare System (1-2016-010040).
RESULTS
Four teaching teams (4 attendings, 4 senior residents, 9 interns, and 14 medical students) were observed over 33 distinct shifts and 168 hours. Observations included morning rounds (96 h), postround call days (52 h), and postround non-call days (20 h). Morning rounds lasted an average of 127 min (range: 48-232 min) and included an average of 9 patients (range: 4-16 patients).
Themes Regarding the Diagnostic Process
We identified the following 4 primary themes related to the diagnostic process in teaching hospitals: (1) diagnosis is a social phenomenon; (2) data necessary to make diagnoses are fragmented; (3) distractions undermine the diagnostic process; and (4) time pressures interfere with diagnostic decision making (Appendix Table 1).
(1) Diagnosis is a Social Phenomenon.
Team members viewed the process of diagnosis as a social exchange of facts, findings, and strategies within a defined structure. The opportunity to discuss impressions with others was valued as a means to share, test, and process assumptions.
“Rounds are the most important part of the process. That is where we make most decisions in a collective, collaborative way with the attending present. We bounce ideas off each other.” (Intern)
Typical of social processes, variations based on time of day and schedule were observed. For instance, during call days, learners gathered data and formed working diagnosis and treatment plans with minimal attending interaction. This separation of roles and responsibilities introduced a hierarchy within diagnosis as follows:
“The interns would not call me first; they would talk to the senior resident and then if the senior thought he should chat with me, then they would call. But for the most part, they gather information and come up with the plan.” (Attending).
The work system was suited to facilitate social interactions. For instance, designated rooms (with team members informally assigned to a computer) provided physical proximity of the resident to interns and medical students. In this space, numerous informal discussions between team members (eg, “What do you think about this test?” “I’m not sure what to do about this finding.” “Should I call a [consult] on this patient?”) were observed. Although proximity to each other was viewed as beneficial, dangers to the social nature of diagnosis in the form of anchoring (ie, a cognitive bias where emphasis is placed on the first piece of data)16 were also mentioned. Similarly, the paradox associated with social proof (ie, the pressure to assume conformity within a group) was also observed as disagreement between team members and attendings rarely occurred during observations.
“I mean, they’re the attending, right? It’s hard to argue with them when they want a test or something done. When I do push back, it’s rare that others will support me–so it’s usually me and the attending.” (Resident)
“I would push back if I think it’s really bad for the patient or could cause harm–but the truth is, it doesn’t happen much.” (Intern)
(2) Data Necessary to Make Diagnoses are Fragmented
Team members universally cited fragmentation in data delivery, retrieval, and processing as a barrier to diagnosis. Team members indicated that test results might not be looked at or acted upon in a timely manner, and participants pointed to the electronic medical record as a source of this challenge.
“Before I knew about [the app for Epic], I would literally sit on the computer to get all the information we would need on rounds. Its key to making decisions. We often say we will do something, only to find the test result doesn’t support it–and then we’re back to square 1.” (Intern)
Information used by teams came from myriad sources (eg, patients, family members, electronic records) and from various settings (eg, emergency department, patient rooms, discussions with consultants). Additionally, test results often appeared without warning. Thus, availability of information was poorly aligned with clinical duties.
“They (the lab) will call us when a blood culture is positive or something is off. That is very helpful but it often comes later in the day, when we’re done with rounds.” (Resident)
The work system was highlighted as a key contributor to data fragmentation. Peculiarities of our electronic medical record (EMR) and how data were collected, stored, or presented were described as “frustrating,” and “unsafe,” by team members. Correspondingly, we frequently observed interns asking for assistance for tasks such as ordering tests or finding information despite being “trained” to use the EMR.
“People have to learn how to filter, how to recognize the most important points and link data streams together in terms of causality. But we assume they know where to find that information. It’s actually a very hard thing to do, for both the house staff and me.” (Attending)
(3) Distractions Undermine the Diagnostic Process
Distractions often created cognitive difficulties. For example, ambient noise and interruptions from neighbors working on other teams were cited as barriers to diagnosis. In addition, we observed several team members using headphones to drown out ambient noise while working on the computer.
“I know I shouldn’t do it (wear headphones), but I have no other way of turning down the noise so I can concentrate.” (Intern)
Similarly, the unpredictable nature and the volume of pages often interrupted thinking about diagnosis.
“Sometimes the pager just goes off all the time and (after making sure its not an urgent issue), I will just ignore it for a bit, especially if I am in the middle of something. It would be great if I could finish my thought process knowing I would not be interrupted.” (Resident)
To mitigate this problem, 1 attending described how he would proactively seek out nurses caring for his patients to “head off” questions (eg, “I will renew the restraints and medications this morning,” and “Is there anything you need in terms of orders for this patient that I can take care of now?”) that might lead to pages. Another resident described his approach as follows:
“I make it a point to tell the nurses where I will be hanging out and where they can find me if they have any questions. I tell them to come talk to me rather than page me since that will be less distracting.” (Resident).
Most of the interns described documentation work such as writing admission and progress notes in negative terms (“an academic exercise,” “part of the billing activity”). However, in the context of interruptions, some described this as helpful.
“The most valuable part of the thinking process was writing the assessment and plan because that’s actually my schema for all problems. It literally is the only time where I can sit and collect my thoughts to formulate a diagnosis and plan.” (Intern)
(4) Time Pressures Interfere With Diagnostic Decision Making
All team members spoke about the challenge of finding time for diagnosis during the workday. Often, they had to skip learning sessions for this purpose.
“They tell us we should go to morning report or noon conference but when I’m running around trying to get things done. I hate having to choose between my education and doing what’s best for the patient–but that’s often what it comes down to.” (Intern)
When specifically asked whether setting aside dedicated time to specifically review and formulate diagnoses would be valuable, respondents were uniformly enthusiastic. Team members described attentional conflicts as being the worst when “cross covering” other teams on call days, as their patient load effectively doubled during this time. Of note, cross-covering occurred when teams were also on call—and thus took them away from important diagnostic activities such as data gathering or synthesis for patients they were admitting.
“If you were to ever design a system where errors were likely–this is how you would design it: take a team with little supervision, double their patient load, keep them busy with new challenging cases and then ask questions about patients they know little about.” (Resident)
DISCUSSION
Although diagnostic errors have been called “the next frontier for patient safety,”17 little is known about the process, barriers, and facilitators to diagnosis in teaching hospitals. In this focused ethnography conducted at 2 academic medical centers, we identified multiple cognitive and system-level challenges and potential strategies to improve diagnosis from trainees engaged in this activity. Key themes identified by those we observed included the social nature of diagnosis, fragmented information delivery, constant distractions and interruptions, and time pressures. In turn, these insights allow us to generate strategies that can be applied to improve the diagnostic process in teaching hospitals.
Our study underscores the importance of social interactions in diagnosis. In contrast, most of the interventions to prevent diagnostic errors target individual providers through practices such as metacognition and “thinking about thinking.”18-20 These interventions are based on Daniel Kahnemann’s work on dual thought process. Type 1 thought processes are fast, subconscious, reflexive, largely intuitive, and more vulnerable to error. In contrast, Type 2 processes are slower, deliberate, analytic, and less prone to error.21 Although an individual’s Type 2 thought capacity is limited, a major goal of cognitive interventions is to encourage Type 2 over Type 1 thinking, an approach termed “de-biasing.”22-24 Unfortunately, cognitive interventions testing such approaches have suffered mixed results–perhaps because of lack of focus on collective wisdom or group thinking, which may be key to diagnosis from our findings.9,25 In this sense, morning rounds were a social gathering used to strategize and develop care plans, but with limited time to think about diagnosis.26 Introduction of defined periods for individuals to engage in diagnostic activities such as de-biasing (ie, asking “what else could this be)27 before or after rounds may provide an opportunity for reflection and improving diagnosis. In addition, embedding tools such as diagnosis expanders and checklists within these defined time slots28,29 may prove to be useful in reflecting on diagnosis and preventing diagnostic errors.
An unexpected yet important finding from this study were the challenges posed by distractions and the physical environment. Potentially maladaptive workarounds to these interruptions included use of headphones; more productive strategies included updating nurses with plans to avert pages and creating a list of activities to ensure that key tasks were not forgotten.30,31 Applying lessons from aviation, a focused effort to limit distractions during key portions of the day, might be worth considering for diagnostic safety.32 Similarly, improving the environment in which diagnosis occurs—including creating spaces that are quiet, orderly, and optimized for thinking—may be valuable.33Our study has limitations. First, our findings are limited to direct observations; we are thus unable to comment on how unobserved aspects of care (eg, cognitive processes) might have influenced our findings. Our observations of clinical care might also have introduced a Hawthorne effect. However, because we were closely integrated with teams and conducted focus groups to corroborate our assessments, we believe that this was not the case. Second, we did not identify diagnostic errors or link processes we observed to errors. Third, our approach is limited to 2 teaching centers, thereby limiting the generalizability of findings. Relatedly, we were only able to conduct observations during weekdays; differences in weekend and night resources might affect our insights.
The cognitive and system-based barriers faced by clinicians in teaching hospitals suggest that new methods to improve diagnosis are needed. Future interventions such as defined “time-outs” for diagnosis, strategies focused on limiting distractions, and methods to improve communication between team members are novel and have parallels in other industries. As challenges to quantify diagnostic errors abound,34 improving cognitive- and system-based factors via reflection through communication, concentration, and organization is necessary to improve medical decision making in academic medical centers.
Disclosures
None declared for all coauthors.
Funding
This project was supported by grant number P30HS024385 from the Agency for Healthcare Research and Quality. The funding source played no role in study design, data acquisition, analysis or decision to report these data. Dr. Chopra is supported by a career development award from the Agency of Healthcare Research and Quality (1-K08-HS022835-01). Dr. Krein is supported by a VA Health Services Research and Development Research Career Scientist Award (RCS 11-222). Dr. Singh is partially supported by Houston VA HSR&D Center for Innovations in Quality, Effectiveness and Safety (CIN 13-413). The content is solely the responsibility of the authors and does not necessarily represent the official views of the Agency for Healthcare Research and Quality or the Department of Veterans Affairs.
1. National Academies of Sciences, Engineering, and Medicine. 2015. Improving Diagnosis in Health Care. Washington, DC: The National Academies Press. http://www.nap.edu/21794. Accessed November 1; 2016:2015. https://doi.org/10.17226/21794.
2. Schiff GD, Hasan O, Kim S, et al. Diagnostic error in medicine: analysis of 583 physician-reported errors. Arch Intern Med. 2009;169(20):1881-1887. http://dx.doi.org/10.1001/archinternmed.2009.333. PubMed
3. Sonderegger-Iseli K, Burger S, Muntwyler J, Salomon F. Diagnostic errors in three medical eras: A necropsy study. Lancet. 2000;355(9220):2027-2031. http://dx.doi.org/10.1016/S0140-6736(00)02349-7. PubMed
4. Winters B, Custer J, Galvagno SM Jr, et al. Diagnostic errors in the intensive care unit: a systematic review of autopsy studies. BMJ Qual Saf. 2012;21(11):894-902. http://dx.doi.org/10.1136/bmjqs-2012-000803. PubMed
5. Saber Tehrani AS, Lee H, Mathews SC, et al. 25-Year summary of US malpractice claims for diagnostic errors 1986-2010: an analysis from the National Practitioner Data Bank. BMJ Qual Saf. 2013;22(8):672-680. http://dx.doi.org/10.1136/bmjqs-2012-001550. PubMed
6. Graber M, Gordon R, Franklin N. Reducing diagnostic errors in medicine: what’s the goal? Acad Med. 2002;77(10):981-992. http://dx.doi.org/10.1097/00001888-200210000-00009. PubMed
7. Gupta A, Snyder A, Kachalia A, Flanders S, Saint S, Chopra V. Malpractice claims related to diagnostic errors in the hospital. BMJ Qual Saf. 2018;27(1):53-60. 10.1136/bmjqs-2017-006774. PubMed
8. van Noord I, Eikens MP, Hamersma AM, de Bruijne MC. Application of root cause analysis on malpractice claim files related to diagnostic failures. Qual Saf Health Care. 2010;19(6):e21. http://dx.doi.org/10.1136/qshc.2008.029801. PubMed
9. Croskerry P, Petrie DA, Reilly JB, Tait G. Deciding about fast and slow decisions. Acad Med. 2014;89(2):197-200. 10.1097/ACM.0000000000000121. PubMed
10. Higginbottom GM, Pillay JJ, Boadu NY. Guidance on performing focused ethnographies with an emphasis on healthcare research. Qual Rep. 2013;18(9):1-6. https://doi.org/10.7939/R35M6287P.
11. Savage J. Participative observation: standing in the shoes of others? Qual Health Res. 2000;10(3):324-339. http://dx.doi.org/10.1177/104973200129118471. PubMed
12. Patton MQ. Qualitative Research and Evaluation Methods. 3rd ed. Thousand Oaks, CA: SAGE Publications; 2002.
13. Harrod M, Weston LE, Robinson C, Tremblay A, Greenstone CL, Forman J. “It goes beyond good camaraderie”: A qualitative study of the process of becoming an interprofessional healthcare “teamlet.” J Interprof Care. 2016;30(3):295-300. http://dx.doi.org/10.3109/13561820.2015.1130028. PubMed
14. Houchens N, Harrod M, Moody S, Fowler KE, Saint S. Techniques and behaviors associated with exemplary inpatient general medicine teaching: an exploratory qualitative study. J Hosp Med. 2017;12(7):503-509. http://dx.doi.org/10.12788/jhm.2763. PubMed
15. Mulhall A. In the field: notes on observation in qualitative research. J Adv Nurs. 2003;41(3):306-313. http://dx.doi.org/10.1046/j.1365-2648.2003.02514.x. PubMed
16. Zwaan L, Monteiro S, Sherbino J, Ilgen J, Howey B, Norman G. Is bias in the eye of the beholder? A vignette study to assess recognition of cognitive biases in clinical case workups. BMJ Qual Saf. 2017;26(2):104-110. http://dx.doi.org/10.1136/bmjqs-2015-005014. PubMed
17. Singh H, Graber ML. Improving diagnosis in health care--the next imperative for patient safety. N Engl J Med. 2015;373(26):2493-2495. http://dx.doi.org/10.1056/NEJMp1512241. PubMed
18. Croskerry P. From mindless to mindful practice--cognitive bias and clinical decision making. N Engl J Med. 2013;368(26):2445-2448. http://dx.doi.org/10.1056/NEJMp1303712. PubMed
19. van den Berge K, Mamede S. Cognitive diagnostic error in internal medicine. Eur J Intern Med. 2013;24(6):525-529. http://dx.doi.org/10.1016/j.ejim.2013.03.006. PubMed
20. Norman G, Sherbino J, Dore K, et al. The etiology of diagnostic errors: A controlled trial of system 1 versus system 2 reasoning. Acad Med. 2014;89(2):277-284. 10.1097/ACM.0000000000000105 PubMed
21. Dhaliwal G. Premature closure? Not so fast. BMJ Qual Saf. 2017;26(2):87-89. http://dx.doi.org/10.1136/bmjqs-2016-005267. PubMed
22. Croskerry P, Singhal G, Mamede S. Cognitive debiasing 1: Origins of bias and theory of debiasing. BMJ Qual Saf. 2013;22(suppl 2):ii58-iiii64. http://dx.doi.org/10.1136/bmjqs-2012-001712. PubMed
23. Croskerry P, Singhal G, Mamede S. Cognitive debiasing 2: Impediments to and strategies for change. BMJ Qual Saf. 2013;22(suppl 2):ii65-iiii72. http://dx.doi.org/10.1136/bmjqs-2012-001713. PubMed
24. Reilly JB, Ogdie AR, Von Feldt JM, Myers JS. Teaching about how doctors think: a longitudinal curriculum in cognitive bias and diagnostic error for residents. BMJ Qual Saf. 2013;22(12):1044-1050. http://dx.doi.org/10.1136/bmjqs-2013-001987. PubMed
25. Schmidt HG, Mamede S, van den Berge K, van Gog T, van Saase JL, Rikers RM. Exposure to media information about a disease can cause doctors to misdiagnose similar-looking clinical cases. Acad Med. 2014;89(2):285-291. http://dx.doi.org/10.1097/ACM.0000000000000107. PubMed
26. Hess BJ, Lipner RS, Thompson V, Holmboe ES, Graber ML. Blink or think: can further reflection improve initial diagnostic impressions? Acad Med. 2015;90(1):112-118. http://dx.doi.org/10.1097/ACM.0000000000000550. PubMed
27. Lambe KA, O’Reilly G, Kelly BD, Curristan S. Dual-process cognitive interventions to enhance diagnostic reasoning: A systematic review. BMJ Qual Saf. 2016;25(10):808-820. http://dx.doi.org/10.1136/bmjqs-2015-004417. PubMed
28. Graber ML, Kissam S, Payne VL, et al. Cognitive interventions to reduce diagnostic error: a narrative review. BMJ Qual Saf. 2012;21(7):535-557. http://dx.doi.org/10.1136/bmjqs-2011-000149. PubMed
29. McDonald KM, Matesic B, Contopoulos-Ioannidis DG, et al. Patient safety strategies targeted at diagnostic errors: a systematic review. Ann Intern Med. 2013;158(5 Pt 2):381-389. http://dx.doi.org/10.7326/0003-4819-158-5-201303051-00004. PubMed
30. Wray CM, Chaudhry S, Pincavage A, et al. Resident shift handoff strategies in US internal medicine residency programs. JAMA. 2016;316(21):2273-2275. http://dx.doi.org/10.1001/jama.2016.17786. PubMed
31. Choo KJ, Arora VM, Barach P, Johnson JK, Farnan JM. How do supervising physicians decide to entrust residents with unsupervised tasks? A qualitative analysis. J Hosp Med. 2014;9(3):169-175. http://dx.doi.org/10.1002/jhm.2150. PubMed
32. Carayon P, Wood KE. Patient safety - the role of human factors and systems engineering. Stud Health Technol Inform. 2010;153:23-46.
.http://dx.doi.org/10.1001/jama.2015.13453 PubMed
34. McGlynn EA, McDonald KM, Cassel CK. Measurement is essential for improving diagnosis and reducing diagnostic error: A report from the Institute of Medicine. JAMA. 2015;314(23):2501-2502.
.http://dx.doi.org/10.1136/bmjqs-2013-001812 PubMed
33. Carayon P, Xie A, Kianfar S. Human factors and ergonomics as a patient safety practice. BMJ Qual Saf. 2014;23(3):196-205. PubMed
© 2018 Society of Hospital Medicine
The Harm We Do: The Environmental Impact of Medicine
Healthcare is a “dirty” business with widespread effects on the environment. In the US, healthcare is estimated to generate 9.8% of our greenhouse gases and 9% of our particulate matter emissions.1 Hazardous wastes must be incinerated, emitting carbon dioxide, nitrogen oxides, and volatile substances into the atmosphere.2 Similarly, hospitals are responsible for 7% of commercial water use in the US.3 Conventional water treatment systems are not designed to remove heavy metals, pharmaceuticals, and disinfectants in hospital wastewaters; these compounds have been detected in rivers and streams throughout the US.4,5 Furthermore, pharmaceutical compounds such as antibiotics, anti-epileptics, and narcotics have even been isolated in our drinking water.5
As hospitalists, we are the directors of inpatient care, yet we only witness brief moments in the lives of our patients and the products we use for their care. For example, we are unaware of particulate matter emissions needed to power an extra imaging study or the contribution of unused materials to a growing landfill. However, pollution, including that from our clinical practice, is detrimental to human health in many ways. Exposure to particulate matter and toxic wastes has been linked to increased rates of reproductive and developmental disorders, cancer, and respiratory disease. 6 Particles <2.5 µm in diameter can diffuse through alveoli into the bloodstream, contributing to heart disease, stroke, and lung disease.7 Climate change has been linked to a wide range of adverse cardiovascular, respiratory, infectious, and mental health outcomes.8,9 These examples of the health impacts of pollution are illustrative but not exhaustive.
The environmental impact of US healthcare accounts for an estimated 470,000 disability-adjusted life years lost; this figure is on par with the burden of preventable medical errors.1 Clearly, change is necessary at all levels in the healthcare system to address our impact on human health. Fortunately, healthcare systems and hospital administrators have begun to address this issue. This perspective describes sustainability efforts in hospitals and healthcare systems and seeks to motivate hospitalists to build upon these efforts.
EFFORTS BY HOSPITALS AND HEALTHCARE SYSTEMS
With the ability to affect change from the top down, health systems are playing an important role in healthcare’s environmental sustainability. Ambitiously, Kaiser Permanente outlined eight environmental stewardship goals, which include becoming net carbon positive and recycling, reusing, or composting 100% of their non-hazardous waste by 2025.10 The Cleveland Clinic has pledged to become carbon neutral within the next 10 years.11 Other healthcare systems may follow suite. Many “green” interventions aimed at reducing waste and pollution also protect population health and reduce hospital operating costs.
From 2011 to 2015, a group of Boston Hospitals decreased energy use by 9.4% compared with a historical growth of 1.5% per year and saved over 15 million dollars.12 Similarly, Virginia Mason reduced landfill waste by reprocessing single-use medical devices, thereby decreasing purchasing costs by $3 million.13 As part of a regional campaign to protect the St. Croix River, Hudson Hospital and Clinic in Wisconsin saved over $20,000 with new recycling and waste reduction programs.13 Notably, these programs not only benefit hospitals but also patients and payers by reducing costs of care.
ROLE OF THE HOSPITALIST
These examples illustrate that a greener healthcare industry is achievable. Despite the potential benefits, sustainability efforts in US hospitals are the exception, not the rule, and the diffusion of such innovations must be encouraged from within.
In addition to the moral case for environmentally sustainable healthcare,14,15 such efforts can also improve our quality of care. The conversation around healthcare waste has focused on costs. Yet, examining our waste from a new perspective may reveal new ways to increase the value of patient care while protecting population health. Our communities and families are not immune to the health impacts of pollution, including that generated by our industry. However, predicted effects of climate change including altered patterns of vector-borne disease and frequent hurricanes and forest fires are upon us, affecting our communities, hospitals, and health delivery enterprise today. These challenges represent educational, academic, and economic opportunities that hospitalists should embrace.
RECOMMENDATIONS FOR ACTION
Education and Awareness
The first step to engagement is to promote awareness of the effects of healthcare waste. Physicians remain one of the most trusted sources of information about the health impacts of climate change.16 By educating ourselves, we can spread accurate knowledge to our patients and communities. Furthermore, we have the ability to advocate for our hospitals to follow institutions such as Kaiser Permanente and the Cleveland Clinic.
Given that hospitalists play a key role in educating students and residents, they are ideal vehicles for such dissemination. Education should begin in medical and nursing schools, where curricula detailing the importance and impact of healthcare pollution may be introduced. As hospitalists, we should champion such efforts.
Measurement and Amelioration
Second, resource use, waste production, and areas for improvement must be systematically quantified. At a national level, the Sustainable Development Unit of the National Health System (NHS) measures and reports water use, waste production, and energy consumption of the UK’s healthcare sector. Consequently, the NHS has surpassed their 2015 goal of reducing their carbon footprint by 10%.17 By establishing a baseline understanding of our carbon emissions, waste production, and water consumption, areas where physicians and hospitals can target improvement can similarly be identified.
Hospitalists appreciate the practical tradeoffs between clinical work and change efforts; thus, they are critical in establishing pragmatic policies. Physicians, often in collaboration with environmental engineers, have used evidence-based methods such as life-cycle analysis (LCA) to evaluate the environmental impacts of the pharmaceuticals and procedures that they use.18-20 An LCA is a cost-benefit analysis that examines multiple parameters of a product, namely, emissions, water use, costs, and waste production, from production to disposal. For example, an LCA of disposable custom packs for hysterectomies, vaginal deliveries, and laryngeal masks found costs savings and environmental benefits from choosing reusable over single-use items and removing unnecessary materials such as extra towels in this setting. 18-20 By considering the full life cycle of a procedure, LCAs reveal important information about the value and safety of care. LCAs, along with other sustainable design strategies, are tools that can provide hospitalists with new insights for quality improvement.
Public Reporting
Numerous physicians are known for educating their communities about the impacts of pollution on health. Recently, a pediatrician brought the presence of lead in Flint’s water supply to the public’s attention, instigating government action and policy change.21 A group called Utah Physicians for a Healthy Environment publishes online summaries of peer-reviewed information on air pollution and health. The Huma Lung Foundation led by a pulmonologist in Chennai, India, is working with a local radio station to report daily air quality measurements along with health advisories for the city.
We must now extend this paradigm to encompass transparency about healthcare’s practices and their impact on health. Indeed, the public is comfortable with this idea: a survey of 1011 respondents in the UK found that 92% indicated that the healthcare system should be environmentally sustainable.22 One idea may be a public-facing scorecard for hospitals, akin to publicly reported quality metrics. We can look to the example of the SDU and corporations such as Apple, which publicly report their carbon emissions, waste production, water use, and other metrics of their environmental impact. By galvanizing efforts to quantify and report our impact, hospitalists have the opportunity to be a role model for the industry and increase trust within their communities.
Individual Actions
What can a hospitalist do today? First, simple measures, like turning off idle electronics, recycling appropriately, or avoiding the use of unnecessary supplies or tests, are behavioral steps in the right direction. Second, just as education, goal setting, and feedback have met success in improving hand hygiene,23 we must begin the hard work of developing programs to monitor our environmental impact. Individual hospitalist carbon scores may help intensify efforts and spur improvement. Finally, we should learn and celebrate each other’s success. Renewed focus on this topic with increased reporting of interventions and outcomes is needed.
CONCLUSIONS
As hospitalists, we must look within ourselves to protect our planet and advocate for solutions that assure a sustainable future. By recognizing that a healthy environment is crucial to human health, we can set an example for other industries and create a safer world for our patients. Eliminating the harm we do is the first step in this process.
Disclosures
The authors have nothing to disclose.
Funding
Dr. Chopra is supported by a Career Development Award from the Agency for Healthcare Quality and Research (1-K08-HS-022835-01).
1. Eckelman MJ, Sherman J. Environmental impacts of the U.S. health care system and effects on public health. Ahmad S, ed. PLoS One. 2016;11(6):e0157014. doi:10.1371/journal.pone.0157014. PubMed
2. Windfeld ES, Brooks MS-L. Medical waste management–A review. J Environ Manage. 2015;163:98-108. doi:10.1016/j.jenvman.2015.08.013. PubMed
3. Environmental Protection Agency. Saving Water in Hospitals. Available at: https://www.epa.gov/sites/production/files/2017-01/documents/ws-commercial-factsheet-hospitals.pdf. Accessed December 9, 2017.
4. Kolpin DW, Furlong ET, Meyer MT, et al. Pharmaceuticals, hormones, and other organic wastewater contaminants in U.S. streams, 1999−2000: A national reconnaissance. Environ Sci & Technol 2002;36(6):1202-1211. PubMed
5. Deo, RP, Halden, RU. Pharmaceuticals in the built and natural water environment of the United States. Water. 2013;5(3):1346-1365. doi:10.3390/w5031346.
6. Lim SS, Vos T, Flaxman AD, Danaei G, et al. A comparative risk assessment of burden of disease and injury attributable to 67 risk factors and risk factor clusters in 21 regions, 1990–2010: a systematic analysis for the Global Burden of Disease Study 2010. Lancet 2013; 380: 2224-60. PubMed
7. Brook RD, Rajagopalan S, Pope CA, et al. Particulate matter air pollution and cardiovascular disease: An update to the scientific statement from the American heart association. Circulation. 2010;121(21):2331-2378. doi:10.1161/CIR.0b013e3181dbece1. PubMed
8. Watts N, Adger WN, Ayeb-Karlsson S, et al. The Lancet countdown: tracking progress on health and climate change. Lancet. 2017;389(10074):1151-1164. doi:10.1016/S0140-6736(16)32124-9. PubMed
9. Whitmee S, Haines A, Beyrer C, et al. Safeguarding human health in the Anthropocene epoch: report of The Rockefeller Foundation–Lancet Commission on planetary health. Lancet. 2015;386(10007):1973–2028. PubMed
10. Kaiser Permanente. Environmental Stewardship. Available at: https://share.kaiserpermanente.org/article/environmental-stewardship-overview/. Accessed December 2, 2017.
11. Health Facilities Management Magazine. Cleveland Clinic makes carbon-neutrality its newest sustainability goal. Available at: https://www.hfmmagazine.com/articles/3210-cleveland-clinic-makes-carbon-neutrality-its-newest-sustainability-goal?lipi=urn%3Ali%3Apage%3Ad_flagship3_feed%3BHXuZOUrpQUu0OQ3RcUQqEg%3D%3D. Accessed December 2, 2017.
12. Healthcare without Harm. Metropolitan Boston Health Care Energy & Greenhouse Gas Profile: 2011 through 2015, and 2020 Projection. Available at: https://noharm-uscanada.org/sites/default/files/documents-files/4723/Report-Boston%20Health%20Care%20Energy%20Profile-May%202017.pdf Accessed December 9, 2017.
13. Practice Greenhealth. Advancing sustainability in healthcare: a collection of special case studies. Available at: https://practicegreenhealth.org/sites/default/files/upload-files/hhi.case_.studies.pdf. Accessed July 22, 2017.
14. Macpherson C, Hill J. Are physicians obliged to lead environmental sustainability efforts in health care organizations? AMA J Ethics. 2017;19(12):1164-1173. doi:10.1001/journalofethics.2017.19.12.ecas2-1712. PubMed
15. American Nurses Association. ANA’s principles of environmental health for nursing practice with implementation strategies. Available at: http://www.nursingworld.org/MainMenuCategories/WorkplaceSafety/Healthy-Nurse/ANAsPrinciplesofEnvironmentalHealthforNursingPractice.pd. Accessed December 9, 2017.
16. Maibach EW, Kreslake JM, Roser-Renouf C, et al. Do Americans understand that global warming is harmful to human health? Evidence from a national survey. Ann Glob Health. 2015;81(3):396-409. doi:10.1016/j.aogh.2015.08.010. PubMed
17. Healthcare without Harm. Reducing Healthcare’s Climate Footprint: opportunities for European Hospitals & Health Systems. Available at: https://noharm-europe.org/sites/default/files/documents-files/4746/HCWHEurope_Climate_Report_Dec2016.pdf. Accessed May 22, 2017.
18. Campion, N, Thiel, CL, Woods, et al. Sustainable healthcare and environmental life-cycle impacts of disposable supplies: a focus on disposable custom packs. J Clean Prod. 2015;94:46-55. doi:10.1016/j.jclepro.2015.01.076.
19. Eckelman M, Mosher M, Gonzalez A, et al. Comparative life cycle assessment of disposable and reusable laryngeal mask airways: Anesth Analg. 2012;114(5):1067-1072. doi:10.1213/ANE.0b013e31824f6959. PubMed
20. Thiel CL, Eckelman M, Guido R, et al. Environmental impacts of surgical procedures: life cycle assessment of hysterectomy in the United States. Environ Sci & Technol. 2015;49(3):1779-1786. doi:10.1021/es504719g. PubMed
21. Hanna-Attisha M, LaChance J, Sadler RC, et al. Elevated blood lead levels in children associated with the Flint drinking water crisis: a spatial analysis of risk and public health response. Am J Public Health. 2016;106(2):283-290. PubMed
22. Sustainable Development Unit. Sustainability and the NHS, Public Health and Social Care system–Ipsos Mori survey. Available at: https://www.sduhealth.org.uk/policy-strategy/reporting/ipsos-mori.aspx. Accessed December 9, 2017.
23. Luangasanatip N, Hongsuwan M, Limmathurotsakul D, et al. Comparative efficacy of interventions to promote hand hygiene in hospital: systematic review and network meta-analysis. BMJ. 2015;351:h3728. doi:10.1136/bmj.h3728. PubMed
Healthcare is a “dirty” business with widespread effects on the environment. In the US, healthcare is estimated to generate 9.8% of our greenhouse gases and 9% of our particulate matter emissions.1 Hazardous wastes must be incinerated, emitting carbon dioxide, nitrogen oxides, and volatile substances into the atmosphere.2 Similarly, hospitals are responsible for 7% of commercial water use in the US.3 Conventional water treatment systems are not designed to remove heavy metals, pharmaceuticals, and disinfectants in hospital wastewaters; these compounds have been detected in rivers and streams throughout the US.4,5 Furthermore, pharmaceutical compounds such as antibiotics, anti-epileptics, and narcotics have even been isolated in our drinking water.5
As hospitalists, we are the directors of inpatient care, yet we only witness brief moments in the lives of our patients and the products we use for their care. For example, we are unaware of particulate matter emissions needed to power an extra imaging study or the contribution of unused materials to a growing landfill. However, pollution, including that from our clinical practice, is detrimental to human health in many ways. Exposure to particulate matter and toxic wastes has been linked to increased rates of reproductive and developmental disorders, cancer, and respiratory disease. 6 Particles <2.5 µm in diameter can diffuse through alveoli into the bloodstream, contributing to heart disease, stroke, and lung disease.7 Climate change has been linked to a wide range of adverse cardiovascular, respiratory, infectious, and mental health outcomes.8,9 These examples of the health impacts of pollution are illustrative but not exhaustive.
The environmental impact of US healthcare accounts for an estimated 470,000 disability-adjusted life years lost; this figure is on par with the burden of preventable medical errors.1 Clearly, change is necessary at all levels in the healthcare system to address our impact on human health. Fortunately, healthcare systems and hospital administrators have begun to address this issue. This perspective describes sustainability efforts in hospitals and healthcare systems and seeks to motivate hospitalists to build upon these efforts.
EFFORTS BY HOSPITALS AND HEALTHCARE SYSTEMS
With the ability to affect change from the top down, health systems are playing an important role in healthcare’s environmental sustainability. Ambitiously, Kaiser Permanente outlined eight environmental stewardship goals, which include becoming net carbon positive and recycling, reusing, or composting 100% of their non-hazardous waste by 2025.10 The Cleveland Clinic has pledged to become carbon neutral within the next 10 years.11 Other healthcare systems may follow suite. Many “green” interventions aimed at reducing waste and pollution also protect population health and reduce hospital operating costs.
From 2011 to 2015, a group of Boston Hospitals decreased energy use by 9.4% compared with a historical growth of 1.5% per year and saved over 15 million dollars.12 Similarly, Virginia Mason reduced landfill waste by reprocessing single-use medical devices, thereby decreasing purchasing costs by $3 million.13 As part of a regional campaign to protect the St. Croix River, Hudson Hospital and Clinic in Wisconsin saved over $20,000 with new recycling and waste reduction programs.13 Notably, these programs not only benefit hospitals but also patients and payers by reducing costs of care.
ROLE OF THE HOSPITALIST
These examples illustrate that a greener healthcare industry is achievable. Despite the potential benefits, sustainability efforts in US hospitals are the exception, not the rule, and the diffusion of such innovations must be encouraged from within.
In addition to the moral case for environmentally sustainable healthcare,14,15 such efforts can also improve our quality of care. The conversation around healthcare waste has focused on costs. Yet, examining our waste from a new perspective may reveal new ways to increase the value of patient care while protecting population health. Our communities and families are not immune to the health impacts of pollution, including that generated by our industry. However, predicted effects of climate change including altered patterns of vector-borne disease and frequent hurricanes and forest fires are upon us, affecting our communities, hospitals, and health delivery enterprise today. These challenges represent educational, academic, and economic opportunities that hospitalists should embrace.
RECOMMENDATIONS FOR ACTION
Education and Awareness
The first step to engagement is to promote awareness of the effects of healthcare waste. Physicians remain one of the most trusted sources of information about the health impacts of climate change.16 By educating ourselves, we can spread accurate knowledge to our patients and communities. Furthermore, we have the ability to advocate for our hospitals to follow institutions such as Kaiser Permanente and the Cleveland Clinic.
Given that hospitalists play a key role in educating students and residents, they are ideal vehicles for such dissemination. Education should begin in medical and nursing schools, where curricula detailing the importance and impact of healthcare pollution may be introduced. As hospitalists, we should champion such efforts.
Measurement and Amelioration
Second, resource use, waste production, and areas for improvement must be systematically quantified. At a national level, the Sustainable Development Unit of the National Health System (NHS) measures and reports water use, waste production, and energy consumption of the UK’s healthcare sector. Consequently, the NHS has surpassed their 2015 goal of reducing their carbon footprint by 10%.17 By establishing a baseline understanding of our carbon emissions, waste production, and water consumption, areas where physicians and hospitals can target improvement can similarly be identified.
Hospitalists appreciate the practical tradeoffs between clinical work and change efforts; thus, they are critical in establishing pragmatic policies. Physicians, often in collaboration with environmental engineers, have used evidence-based methods such as life-cycle analysis (LCA) to evaluate the environmental impacts of the pharmaceuticals and procedures that they use.18-20 An LCA is a cost-benefit analysis that examines multiple parameters of a product, namely, emissions, water use, costs, and waste production, from production to disposal. For example, an LCA of disposable custom packs for hysterectomies, vaginal deliveries, and laryngeal masks found costs savings and environmental benefits from choosing reusable over single-use items and removing unnecessary materials such as extra towels in this setting. 18-20 By considering the full life cycle of a procedure, LCAs reveal important information about the value and safety of care. LCAs, along with other sustainable design strategies, are tools that can provide hospitalists with new insights for quality improvement.
Public Reporting
Numerous physicians are known for educating their communities about the impacts of pollution on health. Recently, a pediatrician brought the presence of lead in Flint’s water supply to the public’s attention, instigating government action and policy change.21 A group called Utah Physicians for a Healthy Environment publishes online summaries of peer-reviewed information on air pollution and health. The Huma Lung Foundation led by a pulmonologist in Chennai, India, is working with a local radio station to report daily air quality measurements along with health advisories for the city.
We must now extend this paradigm to encompass transparency about healthcare’s practices and their impact on health. Indeed, the public is comfortable with this idea: a survey of 1011 respondents in the UK found that 92% indicated that the healthcare system should be environmentally sustainable.22 One idea may be a public-facing scorecard for hospitals, akin to publicly reported quality metrics. We can look to the example of the SDU and corporations such as Apple, which publicly report their carbon emissions, waste production, water use, and other metrics of their environmental impact. By galvanizing efforts to quantify and report our impact, hospitalists have the opportunity to be a role model for the industry and increase trust within their communities.
Individual Actions
What can a hospitalist do today? First, simple measures, like turning off idle electronics, recycling appropriately, or avoiding the use of unnecessary supplies or tests, are behavioral steps in the right direction. Second, just as education, goal setting, and feedback have met success in improving hand hygiene,23 we must begin the hard work of developing programs to monitor our environmental impact. Individual hospitalist carbon scores may help intensify efforts and spur improvement. Finally, we should learn and celebrate each other’s success. Renewed focus on this topic with increased reporting of interventions and outcomes is needed.
CONCLUSIONS
As hospitalists, we must look within ourselves to protect our planet and advocate for solutions that assure a sustainable future. By recognizing that a healthy environment is crucial to human health, we can set an example for other industries and create a safer world for our patients. Eliminating the harm we do is the first step in this process.
Disclosures
The authors have nothing to disclose.
Funding
Dr. Chopra is supported by a Career Development Award from the Agency for Healthcare Quality and Research (1-K08-HS-022835-01).
1. Eckelman MJ, Sherman J. Environmental impacts of the U.S. health care system and effects on public health. Ahmad S, ed. PLoS One. 2016;11(6):e0157014. doi:10.1371/journal.pone.0157014. PubMed
2. Windfeld ES, Brooks MS-L. Medical waste management–A review. J Environ Manage. 2015;163:98-108. doi:10.1016/j.jenvman.2015.08.013. PubMed
3. Environmental Protection Agency. Saving Water in Hospitals. Available at: https://www.epa.gov/sites/production/files/2017-01/documents/ws-commercial-factsheet-hospitals.pdf. Accessed December 9, 2017.
4. Kolpin DW, Furlong ET, Meyer MT, et al. Pharmaceuticals, hormones, and other organic wastewater contaminants in U.S. streams, 1999−2000: A national reconnaissance. Environ Sci & Technol 2002;36(6):1202-1211. PubMed
5. Deo, RP, Halden, RU. Pharmaceuticals in the built and natural water environment of the United States. Water. 2013;5(3):1346-1365. doi:10.3390/w5031346.
6. Lim SS, Vos T, Flaxman AD, Danaei G, et al. A comparative risk assessment of burden of disease and injury attributable to 67 risk factors and risk factor clusters in 21 regions, 1990–2010: a systematic analysis for the Global Burden of Disease Study 2010. Lancet 2013; 380: 2224-60. PubMed
7. Brook RD, Rajagopalan S, Pope CA, et al. Particulate matter air pollution and cardiovascular disease: An update to the scientific statement from the American heart association. Circulation. 2010;121(21):2331-2378. doi:10.1161/CIR.0b013e3181dbece1. PubMed
8. Watts N, Adger WN, Ayeb-Karlsson S, et al. The Lancet countdown: tracking progress on health and climate change. Lancet. 2017;389(10074):1151-1164. doi:10.1016/S0140-6736(16)32124-9. PubMed
9. Whitmee S, Haines A, Beyrer C, et al. Safeguarding human health in the Anthropocene epoch: report of The Rockefeller Foundation–Lancet Commission on planetary health. Lancet. 2015;386(10007):1973–2028. PubMed
10. Kaiser Permanente. Environmental Stewardship. Available at: https://share.kaiserpermanente.org/article/environmental-stewardship-overview/. Accessed December 2, 2017.
11. Health Facilities Management Magazine. Cleveland Clinic makes carbon-neutrality its newest sustainability goal. Available at: https://www.hfmmagazine.com/articles/3210-cleveland-clinic-makes-carbon-neutrality-its-newest-sustainability-goal?lipi=urn%3Ali%3Apage%3Ad_flagship3_feed%3BHXuZOUrpQUu0OQ3RcUQqEg%3D%3D. Accessed December 2, 2017.
12. Healthcare without Harm. Metropolitan Boston Health Care Energy & Greenhouse Gas Profile: 2011 through 2015, and 2020 Projection. Available at: https://noharm-uscanada.org/sites/default/files/documents-files/4723/Report-Boston%20Health%20Care%20Energy%20Profile-May%202017.pdf Accessed December 9, 2017.
13. Practice Greenhealth. Advancing sustainability in healthcare: a collection of special case studies. Available at: https://practicegreenhealth.org/sites/default/files/upload-files/hhi.case_.studies.pdf. Accessed July 22, 2017.
14. Macpherson C, Hill J. Are physicians obliged to lead environmental sustainability efforts in health care organizations? AMA J Ethics. 2017;19(12):1164-1173. doi:10.1001/journalofethics.2017.19.12.ecas2-1712. PubMed
15. American Nurses Association. ANA’s principles of environmental health for nursing practice with implementation strategies. Available at: http://www.nursingworld.org/MainMenuCategories/WorkplaceSafety/Healthy-Nurse/ANAsPrinciplesofEnvironmentalHealthforNursingPractice.pd. Accessed December 9, 2017.
16. Maibach EW, Kreslake JM, Roser-Renouf C, et al. Do Americans understand that global warming is harmful to human health? Evidence from a national survey. Ann Glob Health. 2015;81(3):396-409. doi:10.1016/j.aogh.2015.08.010. PubMed
17. Healthcare without Harm. Reducing Healthcare’s Climate Footprint: opportunities for European Hospitals & Health Systems. Available at: https://noharm-europe.org/sites/default/files/documents-files/4746/HCWHEurope_Climate_Report_Dec2016.pdf. Accessed May 22, 2017.
18. Campion, N, Thiel, CL, Woods, et al. Sustainable healthcare and environmental life-cycle impacts of disposable supplies: a focus on disposable custom packs. J Clean Prod. 2015;94:46-55. doi:10.1016/j.jclepro.2015.01.076.
19. Eckelman M, Mosher M, Gonzalez A, et al. Comparative life cycle assessment of disposable and reusable laryngeal mask airways: Anesth Analg. 2012;114(5):1067-1072. doi:10.1213/ANE.0b013e31824f6959. PubMed
20. Thiel CL, Eckelman M, Guido R, et al. Environmental impacts of surgical procedures: life cycle assessment of hysterectomy in the United States. Environ Sci & Technol. 2015;49(3):1779-1786. doi:10.1021/es504719g. PubMed
21. Hanna-Attisha M, LaChance J, Sadler RC, et al. Elevated blood lead levels in children associated with the Flint drinking water crisis: a spatial analysis of risk and public health response. Am J Public Health. 2016;106(2):283-290. PubMed
22. Sustainable Development Unit. Sustainability and the NHS, Public Health and Social Care system–Ipsos Mori survey. Available at: https://www.sduhealth.org.uk/policy-strategy/reporting/ipsos-mori.aspx. Accessed December 9, 2017.
23. Luangasanatip N, Hongsuwan M, Limmathurotsakul D, et al. Comparative efficacy of interventions to promote hand hygiene in hospital: systematic review and network meta-analysis. BMJ. 2015;351:h3728. doi:10.1136/bmj.h3728. PubMed
© 2018 Society of Hospital Medicine