User login
Pneumonia is the most common cause of unplanned hospitalization in the United States.[1] Despite its clinical toll, the management of this disease has evolved markedly. Expanding vaccination programs, efforts to improve timeliness of antibiotic therapy, and improved processes of care are but a few developments that have improved outcomes for patients afflicted with this illness.[2, 3]
Use of peripherally inserted central catheters (PICCs) is an example of a modern development in the management of patients with pneumonia.[4, 5, 6, 7] PICCs provide many of the benefits associated with central venous catheters (CVCs) including reliable venous access for delivery of antibiotics, phlebotomy, and invasive hemodynamic monitoring. However, as they are placed in veins of the upper extremity, PICCs bypass insertion risks (eg, injury to the carotid vessels or pneumothorax) associated with placement of traditional CVCs.[8] Because they offer durable venous access, PICCs also facilitate care transitions while continuing intravenous antimicrobial therapy in patients with pneumonia.
However, accumulating evidence also suggests that PICCs are associated with important complications, including central lineassociated bloodstream infectionand venous thromboembolism.[9, 10] Furthermore, knowledge gaps in clinicians regarding indications for appropriate use and management of complications associated with PICCs have been recognized.[10, 11] These elements are problematic because reports of unjustified and inappropriate PICC use are growing in the literature.[12, 13] Such concerns have prompted a number of policy calls to improve PICC use, including Choosing Wisely recommendations by various professional societies.[14, 15]
As little is known about the prevalence or patterns of PICC use in adults hospitalized with pneumonia, we conducted a retrospective cohort study using data from a large network of US hospitals.
METHODS
Setting and Participants
We included patients from hospitals that participated in Premier's inpatient dataset, a large, fee‐supported, multipayer administrative database that has been used extensively in health services research to measure quality of care and comparative effectiveness of interventions.[16] Participating hospitals represent all regions of the United States and include teaching and nonteaching facilities in rural and urban locations. In addition to variables found in the uniform billing form, the Premier inpatient database also includes a date‐stamped list of charges for procedures conducted during hospitalization such as PICC placement. As PICC‐specific data are not available in most nationally representative datasets, Premier offers unique insights into utilization, timing, and factors associated with use of PICCs in hospitalized settings.
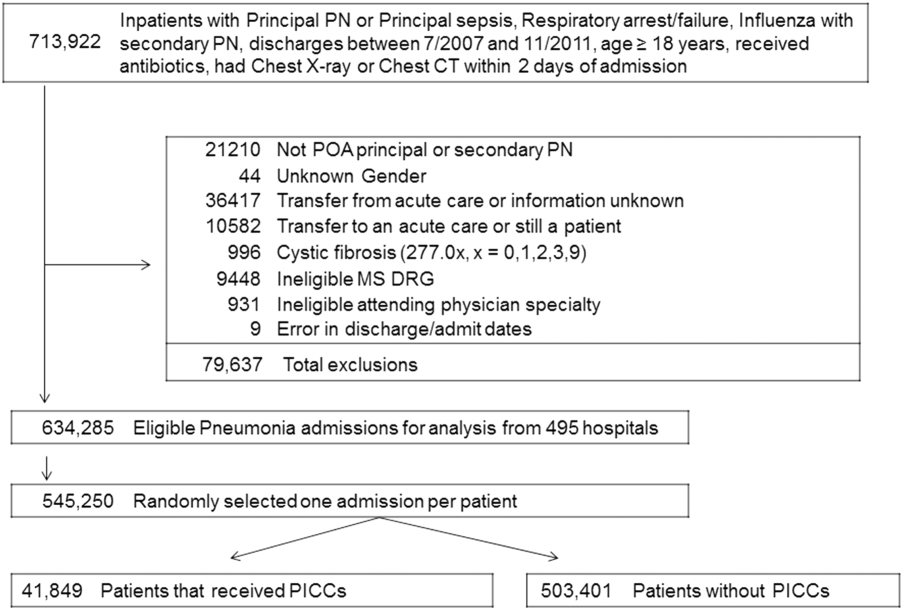
We included adult patients aged 18 years who were (1) admitted with a principal diagnosis of pneumonia present on admission, or secondary diagnosis of pneumonia if paired with a principal diagnosis of sepsis, respiratory failure, or influenza; (2) received at least 1 day of antibiotics between July 1, 2007 and November 30, 2011, and (3) underwent chest x‐ray or computed tomography (CT) at the time of admission. International Classification of Disease, 9th Revision, Clinical Modification (ICD‐9‐CM) codes were used for patient selection. Patients who were not admitted (eg, observation cases), had cystic fibrosis, or marked as pneumonia not present on admission were excluded. For patients who had more than 1 hospitalization during the study period, a single admission was randomly selected for inclusion.
Patient, Physician, and Hospital Data
For all patients, age, gender, marital status, insurance, race, and ethnicity were captured. Using software provided by the Healthcare Costs and Utilization Project, we categorized information on 29 comorbid conditions and computed a combined comorbidity score as described by Gagne et al.[17] Patients were considered to have healthcare‐associated pneumonia (HCAP) if they were: (1) admitted from a skilled nursing or a long‐term care facility, (2) hospitalized in the previous 90 days, (3) on dialysis, or (4) receiving immunosuppressing medications (eg, chemotherapy or steroids equivalent to at least 20 mg of prednisone per day) at the time of admission. Information on specialty of the admitting physician and hospital characteristics (eg, size, location, teaching status) were sourced through Premier data.
Receipt of PICCs and Related Therapies
Among eligible adult patients hospitalized with pneumonia, we identified patients who received a PICC at any time during hospitalization via PICC‐specific billing codes. Non‐PICC devices (eg, midlines, Hickman catheters) were not included. For all insertions, we assessed day of PICC placement relative to admission date. Data on type of PICC (eg, power‐injection capable, antibiotic coating) or PICC characteristics (size, number of lumens) were not available. We used billing codes to assess use of invasive or noninvasive ventilation, vasopressors, and administration of pneumonia‐specific antibiotics (eg, ‐lactams, macrolides, fluoroquinolones). Early exposure was defined when a billing code appeared within 2 days of hospital admission.
Outcomes of Interest
The primary outcome of interest was receipt of a PICC. Additionally, we assessed factors associated with PICC placement and variation in risk‐standardized rates of PICC use between hospitals.
Statistical Analyses
Patient and hospital characteristics were summarized using frequencies for categorical variables and medians with interquartile ranges for continuous variables. We examined association of individual patient and hospital characteristics with use of PICCs using generalized estimating equations models with a logit link for categorical variables and identity link for continuous variables, accounting for patient clustering within hospitals.
| Characteristic | Total, No. (%) | No PICC, No. (%) | PICC, No. (%) | P Value* |
|---|---|---|---|---|
| ||||
| 545,250 (100) | 503,401 (92.3) | 41,849 (7.7) | ||
| Demographics | ||||
| Age, median (Q1Q3), y | 71 (5782) | 72 (5782) | 69 (5780) | <0.001 |
| Gender | <0.001 | |||
| Male | 256,448 (47.0) | 237,232 (47.1) | 19,216 (45.9) | |
| Female | 288,802 (53.0) | 266,169 (52.9) | 22,633 (54.1) | |
| Race/ethnicity | <0.001 | |||
| White | 377,255 (69.2) | 346,689 (68.9) | 30,566 (73.0) | |
| Black | 63,345 (11.6) | 58,407 (11.6) | 4,938 (11.8) | |
| Hispanic | 22,855 (4.2) | 21,716 (4.3) | 1,139 (2.7) | |
| Other | 81,795 (15.0) | 76,589 (15.2) | 5,206 (12.4) | |
| Admitting specialty | <0.001 | |||
| Internal medicine | 236,859 (43.4) | 218,689 (43.4) | 18,170 (43.4) | |
| Hospital medicine | 116,499 (21.4) | 107,671 (21.4) | 8,828 (21.1) | |
| Family practice | 80,388 (14.7) | 75,482 (15.0) | 4,906 (11.7) | |
| Critical care and pulmonary | 35,670 (6.5) | 30,529 (6.1) | 41,849 (12.3) | |
| Geriatrics | 4,812 (0.9) | 4,098 (0.8) | 714 (1.7) | |
| Other | 71,022 (13.0) | 66,932 (13.3) | 4,090 (9.8) | |
| Insurance | <0.001 | |||
| Medicare | 370,303 (67.9) | 341,379 (67.8) | 28,924 (69.1) | |
| Medicaid | 45,505 (8.3) | 41,100 (8.2) | 4,405 (10.5) | |
| Managed care | 69,984 (12.8) | 65,280 (13.0) | 4,704 (11.2) | |
| Commercialindemnity | 20,672 (3.8) | 19,251 (3.8) | 1,421 (3.4) | |
| Other | 38,786 (7.1) | 36,391 (7.2) | 2,395 (5.7) | |
| Comorbidities | ||||
| Gagne combined comorbidity score, median (Q1Q3) | 2 (15) | 2 (14) | 4 (26) | <0.001 |
| Hypertension | 332,347 (60.9) | 306,964 (61.0) | 25,383 (60.7) | 0.13 |
| Chronic pulmonary disease | 255,403 (46.8) | 234,619 (46.6) | 20,784 (49.7) | <0.001 |
| Diabetes | 171,247 (31.4) | 155,540 (30.9) | 15,707 (37.5) | <0.001 |
| Congestive heart failure | 146,492 (26.9) | 131,041 (26.0) | 15,451 (36.9) | <0.001 |
| Atrial fibrillation | 108,405 (19.9) | 97,124 (19.3) | 11,281 (27.0) | <0.001 |
| Renal failure | 104,404 (19.1) | 94,277 (18.7) | 10,127 (24.2) | <0.001 |
| Nicotine replacement therapy/tobacco use | 89,938 (16.5) | 83,247 (16.5) | 6,691 (16.0) | <0.001 |
| Obesity | 60,242 (11.0) | 53,268 (10.6) | 6,974 (16.7) | <0.001 |
| Coagulopathy | 41,717 (7.6) | 35,371 (7.0) | 6,346 (15.2) | <0.001 |
| Prior stroke (1 year) | 26,787 (4.9) | 24,046 (4.78) | 2,741 (6.55) | <0.001 |
| Metastatic cancer | 21,868 (4.0) | 20,244 (4.0) | 1,624 (3.9) | 0.16 |
| Solid tumor w/out metastasis | 21,083 (3.9) | 19,380 (3.8) | 1,703 (4.1) | 0.12 |
| Prior VTE (1 year) | 19,090 (3.5) | 16,906 (3.4) | 2,184 (5.2) | <0.001 |
| Chronic liver disease | 16,273 (3.0) | 14,207 (2.8) | 2,066 (4.9) | <0.001 |
| Prior bacteremia (1 year) | 4,106 (0.7) | 3,584 (0.7) | 522 (1.2) | <0.001 |
| Nephrotic syndrome | 671 (0.1) | 607 (0.1) | 64 (0.2) | 0.03 |
| Morbidity markers | ||||
| Type of pneumonia | <0.001 | |||
| CAP | 376,370 (69.1) | 352,900 (70.1) | 23,830 (56.9) | |
| HCAP | 168,520 (30.9) | 150,501 (29.9) | 18,019 (43.1) | |
| Sepsis present on admission | 114,578 (21.0) | 96,467 (19.2) | 18,111 (43.3) | <0.001 |
| Non‐invasive ventilation | 47,913(8.8) | 40,599 (8.1) | 7,314 (17.5) | <0.001 |
| Invasive mechanical ventilation | 56,179 (10.3) | 44,228 (8.8) | 11,951 (28.6) | <0.001 |
| ICU status | 97,703 (17.9) | 80,380 (16.0) | 17,323 (41.4) | <0.001 |
| Vasopressor use | 48,353 (8.9) | 38,030 (7.6) | 10,323 (24.7) | <0.001 |
| Antibiotic/medication use | ||||
| Anti‐MRSA agent (vancomycin) | 146,068 (26.8) | 123,327 (24.5) | 22,741 (54.3) | <0.001 |
| Third‐generation cephalosporin | 250,782 (46.0) | 235,556 (46.8) | 15,226 (36.4) | <0.001 |
| Anti‐Pseudomonal cephalosporin | 41,798 (7.7) | 36,982 (7.3) | 4,816 (11.5) | <0.001 |
| Anti‐Pseudomonal ‐lactam | 122,215 (22.4) | 105,741 (21.0) | 16,474 (39.4) | <0.001 |
| Fluroquinolone | 288,051 (52.8) | 267,131 (53.1) | 20,920 (50.0) | <0.001 |
| Macrolide | 223,737 (41.0) | 210,954 (41.9) | 12,783 (30.5) | <0.001 |
| Aminoglycoside | 15,415 (2.8) | 12,661 (2.5) | 2,754 (6.6) | <0.001 |
| Oral steroids | 44,486 (8.2) | 41,586 (8.3) | 2,900 (6.9) | <0.001 |
| Intravenous steroids | 146,308 (26.8) | 133,920 (26.6) | 12,388 (29.6) | <0.001 |
| VTE prophylaxis with LMWH | 190,735 (35.0) | 174,612 (34.7) | 16,123 (38.5) | 0.01 |
| Discharge disposition | ||||
| Home | 282,146 (51.7) | 272,604(54.1) | 9,542 (22.8) | <0.001 |
| Home with home health | 71,977 (13.2) | 65,289 (13.0) | 6,688 (16.0) | <0.001 |
| Skilled nursing facility | 111,541 (20.5) | 97,113 (19.3) | 14,428 (34.5) | <0.001 |
| Hospice | 20,428 (3.7) | 17,902 (3.6) | 2,526 (6.0) | <0.001 |
| Expired | 47,733 (8.7) | 40,768 (8.1) | 6,965 (16.6) | <0.001 |
| Other | 11,425 (2.1) | 9,725 (1.9) | 1,700 (4.1) | <0.001 |
We then developed a multivariable hierarchical generalized linear model (HGLM) for PICC placement with a random effect for hospital. In this model, we included patient demographics, comorbidities, sepsis on admission, type of pneumonia (eg, HCAP vs community‐associated pneumonia [CAP]), admitting physician specialty, and indicators for early receipt of specific treatments such as guideline‐recommended antibiotics, vasopressors, ventilation (invasive or noninvasive), and pneumatic compression devices for prophylaxis of deep vein thrombosis.
To understand and estimate between‐hospital variation in PICC use, we calculated risk‐standardized rates of PICC use (RSPICC) across hospitals using HGLM methods. These methods are also employed by the Centers for Medicare and Medicaid Services to calculate risk‐standardized measures for public reporting.[18] Because hospital rates of PICC use were highly skewed (21.2% [n = 105] of hospitals had no patients with PICCs), we restricted this model to the 343 hospitals that had at least 5 patients with a PICC to obtain stable estimates. For each hospital, we estimated a predicted rate of PICC use (pPICC) as the sum of predicted probabilities of PICC receipt from patient factors and the random intercept for hospital in which they were admitted. We then calculated an expected rate of PICC use (ePICC) per hospital as the sum of expected probabilities of PICC receipt from patient factors only. RSPICC for each hospital was then computed as the product of the overall unadjusted mean PICC rate (PICC) from all patients and the ratio of the predicted to expected PICC rate (uPICC*[pPICC/ePICC]).[19] Kruskal‐Wallis tests were used to evaluate the association between hospital characteristics with RSPICC rates. To evaluate the impact of the hospital in variation in PICC use, we assessed the change in likelihood ratio of a hierarchical model with hospital random effects compared to a logistic regression model with patient factors only. In addition, we estimated the intraclass correlation (ICC) to assess the proportion of variation in PICC use associated with the hospital, and the median odds ratio (MOR) from the hierarchical model. The MOR is the median of a set of odds ratios comparing 2 patients with the same set of characteristics treated at 2 randomly selected hospitals.[20, 21, 22] All analyses were performed using the Statistical Analysis System version 9.3 (SAS Institute, Inc., Cary, NC) and Stata 13 (StataCorp Inc., College Station, TX).
Ethical and Regulatory Oversight
Permission to conduct this study was obtained from the institutional review board at Baystate Medical Center, Springfield, Massachusetts. The study did not qualify as human subjects research and made use of fully deidentified data.
RESULTS
Between July 2007 and November 2011, 634,285 admissions representing 545,250 unique patients from 495 hospitals met eligibility criteria and were included in the study (Figure 1). Included patients had a median age of 71 years (interquartile range [IQR]: 5782), and 53.0% were female. Most patients were Caucasian (69.2%), unmarried (51.6%), and insured by Medicare (67.9%). Patients were admitted to the hospital by internal medicine providers (43.4%), hospitalists (21.4%), and family practice providers (14.7%); notably, critical care and pulmonary medicine providers admitted 6.5% of patients. The median Gagne comorbidity score was 2 (IQR: 15). Hypertension, chronic obstructive pulmonary disease, diabetes, and congestive heart failure were among the most common comorbidities observed (Table 1).

Among eligible patients, 41,849 (7.7%) received a PICC during hospitalization. Approximately a quarter of all patients who received PICCs did so by hospital day 2; 90% underwent insertion by hospital day 11 (mean = 5.4 days, median = 4 days). Patients who received PICCs were younger (median IQR: 69 years, 5780 years) but otherwise demographically similar to those that did not receive PICCs (median IQR: 72 years, 5782 years). Compared to other specialties, patients admitted by critical care/pulmonary providers were twice as likely to receive PICCs (12.3% vs 6.1%, P < .001). Patients who received PICCs had higher comorbidity scores than those who did not (median Gagne comorbidity score 4 vs 2, P < 0.001) and were more likely to be diagnosed with HCAP (43.1% vs 29.9%, P < 0.001) than CAP (56.9% vs 70.1%, P < 0.001).
PICC recipients were also more likely to receive intensive care unit (ICU) level of care (41.4% vs 16%, P < 0.001) and both noninvasive (17.5% vs 8.1%, P < 0.001) and invasive ventilation (28.6% vs 8.8%, P < 0.001) upon admission. Vasopressor use was also significantly more frequent in patients who received PICCs (24.7% vs 7.6%, P < 0.001) compared to those who did not receive these devices. Patients with PICCs were more often discharged to skilled nursing facilities (34.5% vs 19.3%) than those without PICCs.
Characteristics Associated With PICC Use Following Multivariable Modeling
Using HGLM with a random hospital effect, multiple patient characteristics were associated with PICC use (Table 2). Patients 65 years of age were less likely to receive a PICC compared to younger patients (odds ratio [OR]: 0.81, 95% confidence interval [CI]: 0.79‐0.84). Weight loss (OR: 2.03, 95% CI: 1.97‐2.10), sepsis on admission (OR: 1.80, 95% CI: 1.75‐1.85), and ICU status on hospital day 1 or 2 (OR: 1.70, 95% CI: 1.64‐1.75) represented 3 factors most strongly associated with PICC use.
| Patient Characteristic | Odds Ratio | 95% Confidence Intervals |
|---|---|---|
| ||
| Age group (>66 vs 65 years) | 0.82 | 0.790.84 |
| Race/ethnicity | ||
| Other | 1.02 | 0.971.06 |
| Black | 0.99 | 0.951.03 |
| Hispanic | 0.82 | 0.760.88 |
| White | Referent | |
| Marital status | ||
| Other/missing | 1.07 | 1.011.14 |
| Single | 1.02 | 1.001.05 |
| Married | Referent | |
| Insurance payor | ||
| Other | 0.85 | 0.800.89 |
| Medicaid | 1.13 | 1.081.18 |
| Managed care | 0.95 | 0.910.99 |
| Commercialindemnity | 0.93 | 0.871.00 |
| Medicare | Referent | |
| Admitting physician specialty | ||
| Pulmonary/critical care medicine | 1.18 | 1.131.24 |
| Family practice | 1.01 | 0.971.05 |
| Geriatric medicine (FP and IM) | 1.85 | 1.662.05 |
| Hospitalist | 0.94 | 0.910.98 |
| Other specialties | 1.02 | 0.971.06 |
| Internal medicine | Referent | |
| Comorbidities | ||
| Congestive heart failure | 1.27 | 1.241.31 |
| Valvular disease | 1.11 | 1.071.15 |
| Pulmonary circulation disorders | 1.37 | 1.321.42 |
| Peripheral vascular disease | 1.09 | 1.051.13 |
| Hypertension | 0.94 | 0.920.97 |
| Paralysis | 1.59 | 1.511.67 |
| Other neurological disorders | 1.20 | 1.161.23 |
| Chronic lung disease | 1.10 | 1.071.12 |
| Diabetes | 1.13 | 1.101.16 |
| Hypothyroidism | 1.03 | 1.001.06 |
| Liver disease | 1.16 | 1.101.23 |
| Ulcer | 1.86 | 1.153.02 |
| Lymphoma | 0.88 | 0.810.96 |
| Metastatic cancer | 0.75 | 0.710.80 |
| Solid tumor without metastasis | 0.93 | 0.880.98 |
| Arthritis | 1.22 | 1.161.28 |
| Obesity | 1.47 | 1.421.52 |
| Weight loss | 2.03 | 1.972.10 |
| Blood loss | 1.69 | 1.551.85 |
| Deficiency anemias | 1.40 | 1.371.44 |
| Alcohol abuse | 1.19 | 1.131.26 |
| Drug abuse | 1.31 | 1.231.39 |
| Psychoses | 1.16 | 1.111.21 |
| Depression | 1.10 | 1.061.13 |
| Renal failure | 0.96 | 0.930.98 |
| Type of pneumonia | ||
| HCAP | 1.03 | 1.011.06 |
| CAP | Referent | |
| Sepsis (POA) | 1.80 | 1.751.85 |
| Antibiotic exposure | ||
| Anti‐MRSA agent | 1.72 | 1.671.76 |
| Anti‐Pseudomonal carbapenem | 1.37 | 1.311.44 |
| Non‐Pseudomonal carbapenem | 1.48 | 1.331.66 |
| Third‐generation cephalosporin | 1.04 | 1.011.07 |
| Anti‐Pseudomonal cephalosporin | 1.25 | 1.201.30 |
| Anti‐Pseudomonal ‐lactam | 1.27 | 1.231.31 |
| Aztreonam | 1.31 | 1.231.40 |
| Non‐Pseudomonal ‐lactam | 1.36 | 1.231.50 |
| ‐lactam | 1.55 | 1.261.90 |
| Respiratory quinolone | 0.90 | 0.870.92 |
| Macrolide | 0.85 | 0.820.88 |
| Doxycycline | 0.94 | 0.871.01 |
| Aminoglycoside | 1.21 | 1.141.27 |
| Vasopressors | 1.06 | 1.031.10 |
| Noninvasive ventilation | 1.29 | 1.251.34 |
| Invasive ventilation | 1.66 | 1.611.72 |
| Intensive care unit on admission | 1.70 | 1.641.75 |
| Atrial fibrillation | 1.26 | 1.221.29 |
| Upper extremity chronic DVT | 1.61 | 1.132.28 |
| Nicotine replacement therapy/tobacco abuse | 0.91 | 0.880.94 |
| Aspirin | 0.94 | 0.920.97 |
| Warfarin | 0.90 | 0.860.94 |
| LMWH, prophylactic dose | 1.10 | 1.081.13 |
| LMWH, treatment dose | 1.22 | 1.161.29 |
| Intravenous steroids | 1.05 | 1.021.08 |
| Bacteremia (prior year) | 1.14 | 1.021.27 |
| VTE (prior year) | 1.11 | 1.061.18 |
| Pneumatic compression device | 1.25 | 1.081.45 |
| Invasive ventilation (prior year) | 1.17 | 1.111.24 |
| Irritable bowel disease | 1.19 | 1.051.36 |
Therapy with potent parenteral antimicrobials including antimethicillin‐resistant Staphylococcus aureus agents (OR: 1.72, 95% CI: 1.67‐1.76), antipseudomonal ‐lactamases (OR: 1.27, 95% CI: 1.23‐1.31), and carbapenems (OR: 1.37, 95% CI: 1.31‐1.44) were significantly associated with PICC use. Conversely, use of macrolides (OR: 0.85, 95% CI: 0.82‐0.88) or respiratory fluoroquinolones (OR: 0.90, 95% CI: 0.87‐0.92) were associated with lower likelihood of PICC use. After adjusting for antimicrobial therapy, HCAP was only slightly more likely to result in PICC use than CAP (OR: 1.03, 95% CI: 1.01‐1.06). Compared to internal medicine providers, admission by geriatricians and critical care/pulmonary specialists was associated with greater likelihood of PICC use (OR: 1.85, 95% CI: 1.66‐2.05 and OR: 1.18, 95% CI: =1.13‐1.24, respectively). Admission by hospitalists was associated with a modestly lower likelihood of PICC placement (OR: 0.94, 95% CI: 0.91‐0.98).
Hospital Level Variation in PICC Use
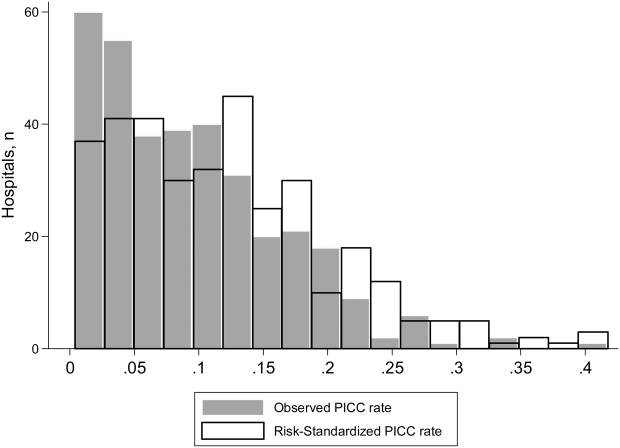
To ensure stable estimates of hospital PICC use, we excluded 152 facilities (31%): 10% had no patients with PICCs and 21% had <5 patients who received a PICC. Therefore, RSPICC was estimated for 343 of 495 facilities (69%) (Figure 2). In these facilities, RSPICC varied from 0.3% to 41.7%. Hospital RSPICC was significantly associated with hospital location (median 11.9% vs 7.8% for urban vs rural hospitals respectively, P = 0.05). RSPICCs were also greater among hospitals in Southern (11.3%), Western (12.7%), and Midwest (12.0%) regions of the nation compared to those in the Northeast (8.4%) (P = 0.02) (Table 3).
| Hospital Characteristic (No.) | Median (IQR), % | P Value |
|---|---|---|
| ||
| Bed size | 0.12 | |
| 200 beds (106) | 9.1 (4.816.3) | |
| 201 beds (237) | 11.6 (5.817.6) | |
| Rural/urban | 0.05 | |
| Urban (275) | 11.9 (5.517.4) | |
| Rural (68) | 7.8 (5.014.0) | |
| Region | 0.02 | |
| Northeast (50) | 8.4 (3.913.0) | |
| Midwest (69) | 12.0 (5.817.4) | |
| West (57) | 12.7 (7.617.0) | |
| South (167) | 11.3 (4.817.8) | |
| Teaching status | 0.77 | |
| Nonteaching (246) | 10.9 (5.017.4) | |
| Teaching (97) | 12.0 (5.816.9) | |
A likelihood ratio test comparing the hierarchical model to a logistic model with patient factors only was highly significant (P < 0.001), indicating that the hospital where the patient was treated had a major impact on receipt of PICC after accounting for patient factors. The MOR was 2.71, which is a larger effect than we found for any of the individual patient characteristics. The proportion of variance explained by hospitals was 25% (95% CI: 22%‐28%), as measured by the ICC.
DISCUSSION
In this study of 545,250 adults hospitalized with pneumonia, we found that approximately 8% of patients received a PICC. Patients who received PICCs had more comorbidities, were more frequently diagnosed with HCAP, and were more often admitted to the ICU, where they experienced greater rates of mechanical ventilation, noninvasive ventilation, and vasopressor use compared to those who did not receive a PICC. Additionally, risk‐adjusted rates of PICC use varied as much as 10‐fold across institutions. In fact, almost 70% of the total variation in rates of PICC use remained unexplained by hospital or patient characteristics. Although use of PICCs is often clinically nuanced in ways that are difficult to capture in large datasets (eg, difficult venous access or inability to tolerate oral medications), the substantial variation of PICC use observed suggests that physician and institutional practice styles are the major determinants of PICC placement during a hospitalization for pneumonia. Because PICCs are associated with serious complications, and evidence regarding discretionary use is accumulating, a research agenda examining reasons for such use and related outcomes appears necessary.
The placement of PICCs has grown substantially in hospitalized patients all over the world.[23, 24] Although originally developed for total parenteral nutrition in surgical patients,[25] contemporary reports of PICC use in critical illness,[26] diseases such as cystic fibrosis,[27] and even pregnancy[28] are now common. Although PICCs are clinically invaluable in many of these conditions, growing use of these devices has led to the realization that benefits may be offset by complications.[9, 10, 29, 30] Additionally, recent data suggest that not all PICCs may be used for appropriate reasons. For instance, in a decade‐long study at a tertiary care center, changes in patterns of PICC use including shortened dwell times, multiple insertions in a single patient, and unclear indications for use were reported.[11] In another study at an academic medical center, a substantial proportion of PICCs were found to be idle or unjustified.[12] It comes as little surprise, then, that a recent multicenter study found that 1 out of every 5 clinicians did not even know that their patient had a PICC.[29] Although calls to improve PICC use in the hospital setting have emerged, strategies to do so are limited by data that emanate from single‐center reports or retrospective designs. No other studies reporting use of PICCs across US hospitals for any clinical condition currently exist.[31]
We found that patients with weight loss, those with greater combined comorbidity scores, and those who were critically ill or diagnosed with sepsis were more likely to receive PICCs than others. These observations suggest that PICC use may reflect underlying severity of illness, as advanced care such as ventilator support was often associated with PICC use. Additionally, discharge to a skilled nursing facility was frequently associated with PICC placement, a finding consistent with a recent study evaluating the use of PICCs in these settings.[32] However, a substantial proportion of PICC use remained unexplained by available patient or hospital factors. Although our study was not specifically designed to examine this question, a possible reason may relate to unmeasured institutional factors that influence the propensity to use a PICC, recently termed as PICC culture.[33] For example, it is plausible that hospitals with nursing‐led PICC teams or interventional radiology (such as teaching hospitals) are more likely to use PICCs than those without such operators. This hypothesis may explain why urban, larger, and teaching hospitals exhibited higher rates of PICC use. Conversely, providers may have an affinity toward PICC use that is predicated not just by operator availability, but also local hospital norms. Understanding why some facilities use PICCs at higher rates than others and implications of such variation with respect to patient safety, cost, and outcomes is important. Study designs that use mixed‐methods approaches or seek to qualitatively understand reasons behind PICC use are likely to be valuable in this enquiry.
Our study has limitations. First, we used an administrative dataset and ICD‐9‐CM codes rather than clinical data from medical records to identify cases of pneumonia or comorbidities. Our estimates of PICC use across hospitals thus may not fully account for differences in severity of illness, and it is possible that patients needed a PICC for reasons that we could not observe. However, the substantial variation observed in rates of PICC use across hospitals is unlikely to be explained by differences in patient severity of illness, documentation, or coding practices. Second, as PICC removal codes were not available, we are unable to comment on how often hospitalized pneumonia patients were discharged with PICCs or received antimicrobial therapy beyond their inpatient stay. Third, although we observed that a number of patient and hospital factors were associated with PICC receipt, our study was not designed to determine the reasons underlying these patterns.
These limitations aside, our study has important strengths. To our knowledge, this is the first study to report utilization and outcomes associated with PICC use among those hospitalized with pneumonia across the United States. The inclusion of a large number of patients receiving care in diverse facilities lends a high degree of external validity to our findings. Second, we used advanced modeling to identify factors associated with PICC use in hospitalized patients with pneumonia, producing innovative and novel findings. Third, our study is the first to show the existence of substantial variation in rates of PICC use across US hospitals within the single disease state of pneumonia. Understanding the drivers of this variability is important as it may inform future studies, policies, and practices to improve PICC use in hospitalized patients.
In conclusion, we found that PICC use in patients hospitalized with pneumonia is common and highly variable. Future studies examining the contextual factors behind PICC use and their association with outcomes are needed to facilitate efforts to standardize PICC use across hospitals.
Disclosures
Dr. Chopra is supported by a career development award (1‐K08‐HS022835‐01) from the Agency of Healthcare Research and Quality. The authors report no conflicts of interest.
- , . Reasons for being admitted to the hospital through the emergency department, 2003. Healthcare Cost and Utilization Project Statistical Brief 2. Rockville, MD: Agency for Healthcare Research and Quality. Available at: www.hcup‐us.ahrq.gov/reports/statbriefs/sb2.pdf. Published February 2006. Accessed June 27, 2014.
- , , , et al. National patterns of risk‐standardized mortality and readmission after hospitalization for acute myocardial infarction, heart failure, and pneumonia: update on publicly reported outcomes measures based on the 2013 release. J Gen Intern Med. 2014;29(10):1333–1340.
- , , , et al. Quality of care for elderly patients hospitalized for pneumonia in the United States, 2006 to 2010. JAMA Intern Med. 2014;174(11):1806–1814.
- , . PICC lines: the latest home care challenge. RN. 1990;53(1):44–51.
- , , , . Peripherally inserted central catheters in an acute‐care hospital. Arch Intern Med. 1994;154(16):1833–1837.
- , . The peripherally inserted central catheter: a retrospective look at three years of insertions. J Intraven Nurs. 1993;16(2):92–103.
- , , , . Peripherally inserted central catheters in general medicine. Mayo Clin Proc. 1997;72(3):225–233.
- , , . Two‐year trends of peripherally inserted central catheter‐line complications at a tertiary‐care hospital: role of nursing expertise. Infect Control Hosp Epidemiol. 2001;22(6):377–379.
- , , , , , . PICC‐associated bloodstream infections: prevalence, patterns, and predictors. Am J Med. 2014;127(4):319–328.
- , , , , . The risk of bloodstream infection associated with peripherally inserted central catheters compared with central venous catheters in adults: a systematic review and meta‐analysis. Infect Control Hosp Epidemiol. 2013;34(9):908–918.
- , , , , , . Peripherally inserted central catheters: use at a tertiary care pediatric center. J Vasc Interv Radiol. 2013;24(9):1323–1331.
- , , , et al. Temporary central venous catheter utilization patterns in a large tertiary care center: tracking the “idle central venous catheter”. Infect Control Hosp Epidemiol. 2012;33(1):50–57.
- , , , , . Inappropriate intravascular device use: a prospective study. Journal Hosp Infect. 2011;78(2):128–132.
- , , , et al. Enhancing patient‐centered care: SGIM and choosing wisely. J Gen Intern Med. 2014;29(3):432–433.
- , , , et al. Critical and honest conversations: the evidence behind the “Choosing Wisely” campaign recommendations by the American Society of Nephrology. Clin J Am Soc Nephrol. 2012;7(10):1664–1672.
- , , , et al. Using highly detailed administrative data to predict pneumonia mortality. PLoS One. 2014;9(1):e87382.
- , , , , . A combined comorbidity score predicted mortality in elderly patients better than existing scores. J Clin Epidemiol. 2011;64(7):749–759.
- , , , , . Hospitals with the highest intensive care utilization provide lower quality pneumonia care to the elderly. Crit Care Med. 2015;43(6):1178–1186.
- , . Statistical and clinical aspects of hospital outcomes profiling. Stat Sci. 2007;22(2):206–226.
- , . Appropriate assessment of neighborhood effects on individual health: integrating random and fixed effects in multilevel logistic regression. Am J Epidemiol. 2005;161(1):81–88.
- , , , . Interpreting parameters in the logistic regression model with random effects. Biometrics. 2000;56(3):909–914.
- , , , . Hospital‐level associations with 30‐day patient mortality after cardiac surgery: a tutorial on the application and interpretation of marginal and multilevel logistic regression. BMC Med Res Methodol. 2012;12:28.
- , , , . Experiences of the first PICC team in the Czech Republic. Br J Nurs. 2015;24(suppl 2):S4–S10.
- , , , et al. Greece reports prototype intervention with first peripherally inserted central catheter: case report and literature review. J Vasc Nurs. 2012;30(3):88–93.
- Total intravenous nutrition with peripherally inserted silicone elastomer central venous catheters. Arch Surg. 1975;110(5):644–646.
- , . Focus on peripherally inserted central catheters in critically ill patients. World J Crit Care Med. 2014;3(4):80–94.
- , , , et al. Quality improvement initiative to reduce deep vein thrombosis associated with peripherally inserted central catheters in adults with cystic fibrosis. Ann Am Thorac Soc. 2014;11(9):1404–1410.
- , , , . Peripherally Inserted central catheter (PICC) complications during pregnancy. JPEN J Parenter Enteral Nutr. 2013;38(5):595–601.
- , , , et al. Do clinicians know which of their patients have central venous catheters?: a multicenter observational study. Ann Intern Med. 2014;161(8):562–567.
- , , , et al. Risk of venous thromboembolism associated with peripherally inserted central catheters: a systematic review and meta‐analysis. Lancet. 2013;382(9889):311–325.
- , , . The problem with peripherally inserted central catheters. JAMA. 2012;308(15):1527–1528.
- , , , et al. Peripherally inserted central catheter use in skilled nursing facilities: a pilot study. J Am Geriatr Soc. 2015;63(9):1894–1899.
- , , , , . Inpatient venous access practices: PICC culture and the kidney patient. J Vasc Access. 2015;16(3):206–210.
Pneumonia is the most common cause of unplanned hospitalization in the United States.[1] Despite its clinical toll, the management of this disease has evolved markedly. Expanding vaccination programs, efforts to improve timeliness of antibiotic therapy, and improved processes of care are but a few developments that have improved outcomes for patients afflicted with this illness.[2, 3]
Use of peripherally inserted central catheters (PICCs) is an example of a modern development in the management of patients with pneumonia.[4, 5, 6, 7] PICCs provide many of the benefits associated with central venous catheters (CVCs) including reliable venous access for delivery of antibiotics, phlebotomy, and invasive hemodynamic monitoring. However, as they are placed in veins of the upper extremity, PICCs bypass insertion risks (eg, injury to the carotid vessels or pneumothorax) associated with placement of traditional CVCs.[8] Because they offer durable venous access, PICCs also facilitate care transitions while continuing intravenous antimicrobial therapy in patients with pneumonia.
However, accumulating evidence also suggests that PICCs are associated with important complications, including central lineassociated bloodstream infectionand venous thromboembolism.[9, 10] Furthermore, knowledge gaps in clinicians regarding indications for appropriate use and management of complications associated with PICCs have been recognized.[10, 11] These elements are problematic because reports of unjustified and inappropriate PICC use are growing in the literature.[12, 13] Such concerns have prompted a number of policy calls to improve PICC use, including Choosing Wisely recommendations by various professional societies.[14, 15]
As little is known about the prevalence or patterns of PICC use in adults hospitalized with pneumonia, we conducted a retrospective cohort study using data from a large network of US hospitals.
METHODS
Setting and Participants
We included patients from hospitals that participated in Premier's inpatient dataset, a large, fee‐supported, multipayer administrative database that has been used extensively in health services research to measure quality of care and comparative effectiveness of interventions.[16] Participating hospitals represent all regions of the United States and include teaching and nonteaching facilities in rural and urban locations. In addition to variables found in the uniform billing form, the Premier inpatient database also includes a date‐stamped list of charges for procedures conducted during hospitalization such as PICC placement. As PICC‐specific data are not available in most nationally representative datasets, Premier offers unique insights into utilization, timing, and factors associated with use of PICCs in hospitalized settings.
We included adult patients aged 18 years who were (1) admitted with a principal diagnosis of pneumonia present on admission, or secondary diagnosis of pneumonia if paired with a principal diagnosis of sepsis, respiratory failure, or influenza; (2) received at least 1 day of antibiotics between July 1, 2007 and November 30, 2011, and (3) underwent chest x‐ray or computed tomography (CT) at the time of admission. International Classification of Disease, 9th Revision, Clinical Modification (ICD‐9‐CM) codes were used for patient selection. Patients who were not admitted (eg, observation cases), had cystic fibrosis, or marked as pneumonia not present on admission were excluded. For patients who had more than 1 hospitalization during the study period, a single admission was randomly selected for inclusion.
Patient, Physician, and Hospital Data
For all patients, age, gender, marital status, insurance, race, and ethnicity were captured. Using software provided by the Healthcare Costs and Utilization Project, we categorized information on 29 comorbid conditions and computed a combined comorbidity score as described by Gagne et al.[17] Patients were considered to have healthcare‐associated pneumonia (HCAP) if they were: (1) admitted from a skilled nursing or a long‐term care facility, (2) hospitalized in the previous 90 days, (3) on dialysis, or (4) receiving immunosuppressing medications (eg, chemotherapy or steroids equivalent to at least 20 mg of prednisone per day) at the time of admission. Information on specialty of the admitting physician and hospital characteristics (eg, size, location, teaching status) were sourced through Premier data.
Receipt of PICCs and Related Therapies
Among eligible adult patients hospitalized with pneumonia, we identified patients who received a PICC at any time during hospitalization via PICC‐specific billing codes. Non‐PICC devices (eg, midlines, Hickman catheters) were not included. For all insertions, we assessed day of PICC placement relative to admission date. Data on type of PICC (eg, power‐injection capable, antibiotic coating) or PICC characteristics (size, number of lumens) were not available. We used billing codes to assess use of invasive or noninvasive ventilation, vasopressors, and administration of pneumonia‐specific antibiotics (eg, ‐lactams, macrolides, fluoroquinolones). Early exposure was defined when a billing code appeared within 2 days of hospital admission.
Outcomes of Interest
The primary outcome of interest was receipt of a PICC. Additionally, we assessed factors associated with PICC placement and variation in risk‐standardized rates of PICC use between hospitals.
Statistical Analyses
Patient and hospital characteristics were summarized using frequencies for categorical variables and medians with interquartile ranges for continuous variables. We examined association of individual patient and hospital characteristics with use of PICCs using generalized estimating equations models with a logit link for categorical variables and identity link for continuous variables, accounting for patient clustering within hospitals.
| Characteristic | Total, No. (%) | No PICC, No. (%) | PICC, No. (%) | P Value* |
|---|---|---|---|---|
| ||||
| 545,250 (100) | 503,401 (92.3) | 41,849 (7.7) | ||
| Demographics | ||||
| Age, median (Q1Q3), y | 71 (5782) | 72 (5782) | 69 (5780) | <0.001 |
| Gender | <0.001 | |||
| Male | 256,448 (47.0) | 237,232 (47.1) | 19,216 (45.9) | |
| Female | 288,802 (53.0) | 266,169 (52.9) | 22,633 (54.1) | |
| Race/ethnicity | <0.001 | |||
| White | 377,255 (69.2) | 346,689 (68.9) | 30,566 (73.0) | |
| Black | 63,345 (11.6) | 58,407 (11.6) | 4,938 (11.8) | |
| Hispanic | 22,855 (4.2) | 21,716 (4.3) | 1,139 (2.7) | |
| Other | 81,795 (15.0) | 76,589 (15.2) | 5,206 (12.4) | |
| Admitting specialty | <0.001 | |||
| Internal medicine | 236,859 (43.4) | 218,689 (43.4) | 18,170 (43.4) | |
| Hospital medicine | 116,499 (21.4) | 107,671 (21.4) | 8,828 (21.1) | |
| Family practice | 80,388 (14.7) | 75,482 (15.0) | 4,906 (11.7) | |
| Critical care and pulmonary | 35,670 (6.5) | 30,529 (6.1) | 41,849 (12.3) | |
| Geriatrics | 4,812 (0.9) | 4,098 (0.8) | 714 (1.7) | |
| Other | 71,022 (13.0) | 66,932 (13.3) | 4,090 (9.8) | |
| Insurance | <0.001 | |||
| Medicare | 370,303 (67.9) | 341,379 (67.8) | 28,924 (69.1) | |
| Medicaid | 45,505 (8.3) | 41,100 (8.2) | 4,405 (10.5) | |
| Managed care | 69,984 (12.8) | 65,280 (13.0) | 4,704 (11.2) | |
| Commercialindemnity | 20,672 (3.8) | 19,251 (3.8) | 1,421 (3.4) | |
| Other | 38,786 (7.1) | 36,391 (7.2) | 2,395 (5.7) | |
| Comorbidities | ||||
| Gagne combined comorbidity score, median (Q1Q3) | 2 (15) | 2 (14) | 4 (26) | <0.001 |
| Hypertension | 332,347 (60.9) | 306,964 (61.0) | 25,383 (60.7) | 0.13 |
| Chronic pulmonary disease | 255,403 (46.8) | 234,619 (46.6) | 20,784 (49.7) | <0.001 |
| Diabetes | 171,247 (31.4) | 155,540 (30.9) | 15,707 (37.5) | <0.001 |
| Congestive heart failure | 146,492 (26.9) | 131,041 (26.0) | 15,451 (36.9) | <0.001 |
| Atrial fibrillation | 108,405 (19.9) | 97,124 (19.3) | 11,281 (27.0) | <0.001 |
| Renal failure | 104,404 (19.1) | 94,277 (18.7) | 10,127 (24.2) | <0.001 |
| Nicotine replacement therapy/tobacco use | 89,938 (16.5) | 83,247 (16.5) | 6,691 (16.0) | <0.001 |
| Obesity | 60,242 (11.0) | 53,268 (10.6) | 6,974 (16.7) | <0.001 |
| Coagulopathy | 41,717 (7.6) | 35,371 (7.0) | 6,346 (15.2) | <0.001 |
| Prior stroke (1 year) | 26,787 (4.9) | 24,046 (4.78) | 2,741 (6.55) | <0.001 |
| Metastatic cancer | 21,868 (4.0) | 20,244 (4.0) | 1,624 (3.9) | 0.16 |
| Solid tumor w/out metastasis | 21,083 (3.9) | 19,380 (3.8) | 1,703 (4.1) | 0.12 |
| Prior VTE (1 year) | 19,090 (3.5) | 16,906 (3.4) | 2,184 (5.2) | <0.001 |
| Chronic liver disease | 16,273 (3.0) | 14,207 (2.8) | 2,066 (4.9) | <0.001 |
| Prior bacteremia (1 year) | 4,106 (0.7) | 3,584 (0.7) | 522 (1.2) | <0.001 |
| Nephrotic syndrome | 671 (0.1) | 607 (0.1) | 64 (0.2) | 0.03 |
| Morbidity markers | ||||
| Type of pneumonia | <0.001 | |||
| CAP | 376,370 (69.1) | 352,900 (70.1) | 23,830 (56.9) | |
| HCAP | 168,520 (30.9) | 150,501 (29.9) | 18,019 (43.1) | |
| Sepsis present on admission | 114,578 (21.0) | 96,467 (19.2) | 18,111 (43.3) | <0.001 |
| Non‐invasive ventilation | 47,913(8.8) | 40,599 (8.1) | 7,314 (17.5) | <0.001 |
| Invasive mechanical ventilation | 56,179 (10.3) | 44,228 (8.8) | 11,951 (28.6) | <0.001 |
| ICU status | 97,703 (17.9) | 80,380 (16.0) | 17,323 (41.4) | <0.001 |
| Vasopressor use | 48,353 (8.9) | 38,030 (7.6) | 10,323 (24.7) | <0.001 |
| Antibiotic/medication use | ||||
| Anti‐MRSA agent (vancomycin) | 146,068 (26.8) | 123,327 (24.5) | 22,741 (54.3) | <0.001 |
| Third‐generation cephalosporin | 250,782 (46.0) | 235,556 (46.8) | 15,226 (36.4) | <0.001 |
| Anti‐Pseudomonal cephalosporin | 41,798 (7.7) | 36,982 (7.3) | 4,816 (11.5) | <0.001 |
| Anti‐Pseudomonal ‐lactam | 122,215 (22.4) | 105,741 (21.0) | 16,474 (39.4) | <0.001 |
| Fluroquinolone | 288,051 (52.8) | 267,131 (53.1) | 20,920 (50.0) | <0.001 |
| Macrolide | 223,737 (41.0) | 210,954 (41.9) | 12,783 (30.5) | <0.001 |
| Aminoglycoside | 15,415 (2.8) | 12,661 (2.5) | 2,754 (6.6) | <0.001 |
| Oral steroids | 44,486 (8.2) | 41,586 (8.3) | 2,900 (6.9) | <0.001 |
| Intravenous steroids | 146,308 (26.8) | 133,920 (26.6) | 12,388 (29.6) | <0.001 |
| VTE prophylaxis with LMWH | 190,735 (35.0) | 174,612 (34.7) | 16,123 (38.5) | 0.01 |
| Discharge disposition | ||||
| Home | 282,146 (51.7) | 272,604(54.1) | 9,542 (22.8) | <0.001 |
| Home with home health | 71,977 (13.2) | 65,289 (13.0) | 6,688 (16.0) | <0.001 |
| Skilled nursing facility | 111,541 (20.5) | 97,113 (19.3) | 14,428 (34.5) | <0.001 |
| Hospice | 20,428 (3.7) | 17,902 (3.6) | 2,526 (6.0) | <0.001 |
| Expired | 47,733 (8.7) | 40,768 (8.1) | 6,965 (16.6) | <0.001 |
| Other | 11,425 (2.1) | 9,725 (1.9) | 1,700 (4.1) | <0.001 |
We then developed a multivariable hierarchical generalized linear model (HGLM) for PICC placement with a random effect for hospital. In this model, we included patient demographics, comorbidities, sepsis on admission, type of pneumonia (eg, HCAP vs community‐associated pneumonia [CAP]), admitting physician specialty, and indicators for early receipt of specific treatments such as guideline‐recommended antibiotics, vasopressors, ventilation (invasive or noninvasive), and pneumatic compression devices for prophylaxis of deep vein thrombosis.
To understand and estimate between‐hospital variation in PICC use, we calculated risk‐standardized rates of PICC use (RSPICC) across hospitals using HGLM methods. These methods are also employed by the Centers for Medicare and Medicaid Services to calculate risk‐standardized measures for public reporting.[18] Because hospital rates of PICC use were highly skewed (21.2% [n = 105] of hospitals had no patients with PICCs), we restricted this model to the 343 hospitals that had at least 5 patients with a PICC to obtain stable estimates. For each hospital, we estimated a predicted rate of PICC use (pPICC) as the sum of predicted probabilities of PICC receipt from patient factors and the random intercept for hospital in which they were admitted. We then calculated an expected rate of PICC use (ePICC) per hospital as the sum of expected probabilities of PICC receipt from patient factors only. RSPICC for each hospital was then computed as the product of the overall unadjusted mean PICC rate (PICC) from all patients and the ratio of the predicted to expected PICC rate (uPICC*[pPICC/ePICC]).[19] Kruskal‐Wallis tests were used to evaluate the association between hospital characteristics with RSPICC rates. To evaluate the impact of the hospital in variation in PICC use, we assessed the change in likelihood ratio of a hierarchical model with hospital random effects compared to a logistic regression model with patient factors only. In addition, we estimated the intraclass correlation (ICC) to assess the proportion of variation in PICC use associated with the hospital, and the median odds ratio (MOR) from the hierarchical model. The MOR is the median of a set of odds ratios comparing 2 patients with the same set of characteristics treated at 2 randomly selected hospitals.[20, 21, 22] All analyses were performed using the Statistical Analysis System version 9.3 (SAS Institute, Inc., Cary, NC) and Stata 13 (StataCorp Inc., College Station, TX).
Ethical and Regulatory Oversight
Permission to conduct this study was obtained from the institutional review board at Baystate Medical Center, Springfield, Massachusetts. The study did not qualify as human subjects research and made use of fully deidentified data.
RESULTS
Between July 2007 and November 2011, 634,285 admissions representing 545,250 unique patients from 495 hospitals met eligibility criteria and were included in the study (Figure 1). Included patients had a median age of 71 years (interquartile range [IQR]: 5782), and 53.0% were female. Most patients were Caucasian (69.2%), unmarried (51.6%), and insured by Medicare (67.9%). Patients were admitted to the hospital by internal medicine providers (43.4%), hospitalists (21.4%), and family practice providers (14.7%); notably, critical care and pulmonary medicine providers admitted 6.5% of patients. The median Gagne comorbidity score was 2 (IQR: 15). Hypertension, chronic obstructive pulmonary disease, diabetes, and congestive heart failure were among the most common comorbidities observed (Table 1).
Among eligible patients, 41,849 (7.7%) received a PICC during hospitalization. Approximately a quarter of all patients who received PICCs did so by hospital day 2; 90% underwent insertion by hospital day 11 (mean = 5.4 days, median = 4 days). Patients who received PICCs were younger (median IQR: 69 years, 5780 years) but otherwise demographically similar to those that did not receive PICCs (median IQR: 72 years, 5782 years). Compared to other specialties, patients admitted by critical care/pulmonary providers were twice as likely to receive PICCs (12.3% vs 6.1%, P < .001). Patients who received PICCs had higher comorbidity scores than those who did not (median Gagne comorbidity score 4 vs 2, P < 0.001) and were more likely to be diagnosed with HCAP (43.1% vs 29.9%, P < 0.001) than CAP (56.9% vs 70.1%, P < 0.001).
PICC recipients were also more likely to receive intensive care unit (ICU) level of care (41.4% vs 16%, P < 0.001) and both noninvasive (17.5% vs 8.1%, P < 0.001) and invasive ventilation (28.6% vs 8.8%, P < 0.001) upon admission. Vasopressor use was also significantly more frequent in patients who received PICCs (24.7% vs 7.6%, P < 0.001) compared to those who did not receive these devices. Patients with PICCs were more often discharged to skilled nursing facilities (34.5% vs 19.3%) than those without PICCs.
Characteristics Associated With PICC Use Following Multivariable Modeling
Using HGLM with a random hospital effect, multiple patient characteristics were associated with PICC use (Table 2). Patients 65 years of age were less likely to receive a PICC compared to younger patients (odds ratio [OR]: 0.81, 95% confidence interval [CI]: 0.79‐0.84). Weight loss (OR: 2.03, 95% CI: 1.97‐2.10), sepsis on admission (OR: 1.80, 95% CI: 1.75‐1.85), and ICU status on hospital day 1 or 2 (OR: 1.70, 95% CI: 1.64‐1.75) represented 3 factors most strongly associated with PICC use.
| Patient Characteristic | Odds Ratio | 95% Confidence Intervals |
|---|---|---|
| ||
| Age group (>66 vs 65 years) | 0.82 | 0.790.84 |
| Race/ethnicity | ||
| Other | 1.02 | 0.971.06 |
| Black | 0.99 | 0.951.03 |
| Hispanic | 0.82 | 0.760.88 |
| White | Referent | |
| Marital status | ||
| Other/missing | 1.07 | 1.011.14 |
| Single | 1.02 | 1.001.05 |
| Married | Referent | |
| Insurance payor | ||
| Other | 0.85 | 0.800.89 |
| Medicaid | 1.13 | 1.081.18 |
| Managed care | 0.95 | 0.910.99 |
| Commercialindemnity | 0.93 | 0.871.00 |
| Medicare | Referent | |
| Admitting physician specialty | ||
| Pulmonary/critical care medicine | 1.18 | 1.131.24 |
| Family practice | 1.01 | 0.971.05 |
| Geriatric medicine (FP and IM) | 1.85 | 1.662.05 |
| Hospitalist | 0.94 | 0.910.98 |
| Other specialties | 1.02 | 0.971.06 |
| Internal medicine | Referent | |
| Comorbidities | ||
| Congestive heart failure | 1.27 | 1.241.31 |
| Valvular disease | 1.11 | 1.071.15 |
| Pulmonary circulation disorders | 1.37 | 1.321.42 |
| Peripheral vascular disease | 1.09 | 1.051.13 |
| Hypertension | 0.94 | 0.920.97 |
| Paralysis | 1.59 | 1.511.67 |
| Other neurological disorders | 1.20 | 1.161.23 |
| Chronic lung disease | 1.10 | 1.071.12 |
| Diabetes | 1.13 | 1.101.16 |
| Hypothyroidism | 1.03 | 1.001.06 |
| Liver disease | 1.16 | 1.101.23 |
| Ulcer | 1.86 | 1.153.02 |
| Lymphoma | 0.88 | 0.810.96 |
| Metastatic cancer | 0.75 | 0.710.80 |
| Solid tumor without metastasis | 0.93 | 0.880.98 |
| Arthritis | 1.22 | 1.161.28 |
| Obesity | 1.47 | 1.421.52 |
| Weight loss | 2.03 | 1.972.10 |
| Blood loss | 1.69 | 1.551.85 |
| Deficiency anemias | 1.40 | 1.371.44 |
| Alcohol abuse | 1.19 | 1.131.26 |
| Drug abuse | 1.31 | 1.231.39 |
| Psychoses | 1.16 | 1.111.21 |
| Depression | 1.10 | 1.061.13 |
| Renal failure | 0.96 | 0.930.98 |
| Type of pneumonia | ||
| HCAP | 1.03 | 1.011.06 |
| CAP | Referent | |
| Sepsis (POA) | 1.80 | 1.751.85 |
| Antibiotic exposure | ||
| Anti‐MRSA agent | 1.72 | 1.671.76 |
| Anti‐Pseudomonal carbapenem | 1.37 | 1.311.44 |
| Non‐Pseudomonal carbapenem | 1.48 | 1.331.66 |
| Third‐generation cephalosporin | 1.04 | 1.011.07 |
| Anti‐Pseudomonal cephalosporin | 1.25 | 1.201.30 |
| Anti‐Pseudomonal ‐lactam | 1.27 | 1.231.31 |
| Aztreonam | 1.31 | 1.231.40 |
| Non‐Pseudomonal ‐lactam | 1.36 | 1.231.50 |
| ‐lactam | 1.55 | 1.261.90 |
| Respiratory quinolone | 0.90 | 0.870.92 |
| Macrolide | 0.85 | 0.820.88 |
| Doxycycline | 0.94 | 0.871.01 |
| Aminoglycoside | 1.21 | 1.141.27 |
| Vasopressors | 1.06 | 1.031.10 |
| Noninvasive ventilation | 1.29 | 1.251.34 |
| Invasive ventilation | 1.66 | 1.611.72 |
| Intensive care unit on admission | 1.70 | 1.641.75 |
| Atrial fibrillation | 1.26 | 1.221.29 |
| Upper extremity chronic DVT | 1.61 | 1.132.28 |
| Nicotine replacement therapy/tobacco abuse | 0.91 | 0.880.94 |
| Aspirin | 0.94 | 0.920.97 |
| Warfarin | 0.90 | 0.860.94 |
| LMWH, prophylactic dose | 1.10 | 1.081.13 |
| LMWH, treatment dose | 1.22 | 1.161.29 |
| Intravenous steroids | 1.05 | 1.021.08 |
| Bacteremia (prior year) | 1.14 | 1.021.27 |
| VTE (prior year) | 1.11 | 1.061.18 |
| Pneumatic compression device | 1.25 | 1.081.45 |
| Invasive ventilation (prior year) | 1.17 | 1.111.24 |
| Irritable bowel disease | 1.19 | 1.051.36 |
Therapy with potent parenteral antimicrobials including antimethicillin‐resistant Staphylococcus aureus agents (OR: 1.72, 95% CI: 1.67‐1.76), antipseudomonal ‐lactamases (OR: 1.27, 95% CI: 1.23‐1.31), and carbapenems (OR: 1.37, 95% CI: 1.31‐1.44) were significantly associated with PICC use. Conversely, use of macrolides (OR: 0.85, 95% CI: 0.82‐0.88) or respiratory fluoroquinolones (OR: 0.90, 95% CI: 0.87‐0.92) were associated with lower likelihood of PICC use. After adjusting for antimicrobial therapy, HCAP was only slightly more likely to result in PICC use than CAP (OR: 1.03, 95% CI: 1.01‐1.06). Compared to internal medicine providers, admission by geriatricians and critical care/pulmonary specialists was associated with greater likelihood of PICC use (OR: 1.85, 95% CI: 1.66‐2.05 and OR: 1.18, 95% CI: =1.13‐1.24, respectively). Admission by hospitalists was associated with a modestly lower likelihood of PICC placement (OR: 0.94, 95% CI: 0.91‐0.98).
Hospital Level Variation in PICC Use
To ensure stable estimates of hospital PICC use, we excluded 152 facilities (31%): 10% had no patients with PICCs and 21% had <5 patients who received a PICC. Therefore, RSPICC was estimated for 343 of 495 facilities (69%) (Figure 2). In these facilities, RSPICC varied from 0.3% to 41.7%. Hospital RSPICC was significantly associated with hospital location (median 11.9% vs 7.8% for urban vs rural hospitals respectively, P = 0.05). RSPICCs were also greater among hospitals in Southern (11.3%), Western (12.7%), and Midwest (12.0%) regions of the nation compared to those in the Northeast (8.4%) (P = 0.02) (Table 3).
| Hospital Characteristic (No.) | Median (IQR), % | P Value |
|---|---|---|
| ||
| Bed size | 0.12 | |
| 200 beds (106) | 9.1 (4.816.3) | |
| 201 beds (237) | 11.6 (5.817.6) | |
| Rural/urban | 0.05 | |
| Urban (275) | 11.9 (5.517.4) | |
| Rural (68) | 7.8 (5.014.0) | |
| Region | 0.02 | |
| Northeast (50) | 8.4 (3.913.0) | |
| Midwest (69) | 12.0 (5.817.4) | |
| West (57) | 12.7 (7.617.0) | |
| South (167) | 11.3 (4.817.8) | |
| Teaching status | 0.77 | |
| Nonteaching (246) | 10.9 (5.017.4) | |
| Teaching (97) | 12.0 (5.816.9) | |
A likelihood ratio test comparing the hierarchical model to a logistic model with patient factors only was highly significant (P < 0.001), indicating that the hospital where the patient was treated had a major impact on receipt of PICC after accounting for patient factors. The MOR was 2.71, which is a larger effect than we found for any of the individual patient characteristics. The proportion of variance explained by hospitals was 25% (95% CI: 22%‐28%), as measured by the ICC.
DISCUSSION
In this study of 545,250 adults hospitalized with pneumonia, we found that approximately 8% of patients received a PICC. Patients who received PICCs had more comorbidities, were more frequently diagnosed with HCAP, and were more often admitted to the ICU, where they experienced greater rates of mechanical ventilation, noninvasive ventilation, and vasopressor use compared to those who did not receive a PICC. Additionally, risk‐adjusted rates of PICC use varied as much as 10‐fold across institutions. In fact, almost 70% of the total variation in rates of PICC use remained unexplained by hospital or patient characteristics. Although use of PICCs is often clinically nuanced in ways that are difficult to capture in large datasets (eg, difficult venous access or inability to tolerate oral medications), the substantial variation of PICC use observed suggests that physician and institutional practice styles are the major determinants of PICC placement during a hospitalization for pneumonia. Because PICCs are associated with serious complications, and evidence regarding discretionary use is accumulating, a research agenda examining reasons for such use and related outcomes appears necessary.
The placement of PICCs has grown substantially in hospitalized patients all over the world.[23, 24] Although originally developed for total parenteral nutrition in surgical patients,[25] contemporary reports of PICC use in critical illness,[26] diseases such as cystic fibrosis,[27] and even pregnancy[28] are now common. Although PICCs are clinically invaluable in many of these conditions, growing use of these devices has led to the realization that benefits may be offset by complications.[9, 10, 29, 30] Additionally, recent data suggest that not all PICCs may be used for appropriate reasons. For instance, in a decade‐long study at a tertiary care center, changes in patterns of PICC use including shortened dwell times, multiple insertions in a single patient, and unclear indications for use were reported.[11] In another study at an academic medical center, a substantial proportion of PICCs were found to be idle or unjustified.[12] It comes as little surprise, then, that a recent multicenter study found that 1 out of every 5 clinicians did not even know that their patient had a PICC.[29] Although calls to improve PICC use in the hospital setting have emerged, strategies to do so are limited by data that emanate from single‐center reports or retrospective designs. No other studies reporting use of PICCs across US hospitals for any clinical condition currently exist.[31]
We found that patients with weight loss, those with greater combined comorbidity scores, and those who were critically ill or diagnosed with sepsis were more likely to receive PICCs than others. These observations suggest that PICC use may reflect underlying severity of illness, as advanced care such as ventilator support was often associated with PICC use. Additionally, discharge to a skilled nursing facility was frequently associated with PICC placement, a finding consistent with a recent study evaluating the use of PICCs in these settings.[32] However, a substantial proportion of PICC use remained unexplained by available patient or hospital factors. Although our study was not specifically designed to examine this question, a possible reason may relate to unmeasured institutional factors that influence the propensity to use a PICC, recently termed as PICC culture.[33] For example, it is plausible that hospitals with nursing‐led PICC teams or interventional radiology (such as teaching hospitals) are more likely to use PICCs than those without such operators. This hypothesis may explain why urban, larger, and teaching hospitals exhibited higher rates of PICC use. Conversely, providers may have an affinity toward PICC use that is predicated not just by operator availability, but also local hospital norms. Understanding why some facilities use PICCs at higher rates than others and implications of such variation with respect to patient safety, cost, and outcomes is important. Study designs that use mixed‐methods approaches or seek to qualitatively understand reasons behind PICC use are likely to be valuable in this enquiry.
Our study has limitations. First, we used an administrative dataset and ICD‐9‐CM codes rather than clinical data from medical records to identify cases of pneumonia or comorbidities. Our estimates of PICC use across hospitals thus may not fully account for differences in severity of illness, and it is possible that patients needed a PICC for reasons that we could not observe. However, the substantial variation observed in rates of PICC use across hospitals is unlikely to be explained by differences in patient severity of illness, documentation, or coding practices. Second, as PICC removal codes were not available, we are unable to comment on how often hospitalized pneumonia patients were discharged with PICCs or received antimicrobial therapy beyond their inpatient stay. Third, although we observed that a number of patient and hospital factors were associated with PICC receipt, our study was not designed to determine the reasons underlying these patterns.
These limitations aside, our study has important strengths. To our knowledge, this is the first study to report utilization and outcomes associated with PICC use among those hospitalized with pneumonia across the United States. The inclusion of a large number of patients receiving care in diverse facilities lends a high degree of external validity to our findings. Second, we used advanced modeling to identify factors associated with PICC use in hospitalized patients with pneumonia, producing innovative and novel findings. Third, our study is the first to show the existence of substantial variation in rates of PICC use across US hospitals within the single disease state of pneumonia. Understanding the drivers of this variability is important as it may inform future studies, policies, and practices to improve PICC use in hospitalized patients.
In conclusion, we found that PICC use in patients hospitalized with pneumonia is common and highly variable. Future studies examining the contextual factors behind PICC use and their association with outcomes are needed to facilitate efforts to standardize PICC use across hospitals.
Disclosures
Dr. Chopra is supported by a career development award (1‐K08‐HS022835‐01) from the Agency of Healthcare Research and Quality. The authors report no conflicts of interest.
- , . Reasons for being admitted to the hospital through the emergency department, 2003. Healthcare Cost and Utilization Project Statistical Brief 2. Rockville, MD: Agency for Healthcare Research and Quality. Available at: www.hcup‐us.ahrq.gov/reports/statbriefs/sb2.pdf. Published February 2006. Accessed June 27, 2014.
- , , , et al. National patterns of risk‐standardized mortality and readmission after hospitalization for acute myocardial infarction, heart failure, and pneumonia: update on publicly reported outcomes measures based on the 2013 release. J Gen Intern Med. 2014;29(10):1333–1340.
- , , , et al. Quality of care for elderly patients hospitalized for pneumonia in the United States, 2006 to 2010. JAMA Intern Med. 2014;174(11):1806–1814.
- , . PICC lines: the latest home care challenge. RN. 1990;53(1):44–51.
- , , , . Peripherally inserted central catheters in an acute‐care hospital. Arch Intern Med. 1994;154(16):1833–1837.
- , . The peripherally inserted central catheter: a retrospective look at three years of insertions. J Intraven Nurs. 1993;16(2):92–103.
- , , , . Peripherally inserted central catheters in general medicine. Mayo Clin Proc. 1997;72(3):225–233.
- , , . Two‐year trends of peripherally inserted central catheter‐line complications at a tertiary‐care hospital: role of nursing expertise. Infect Control Hosp Epidemiol. 2001;22(6):377–379.
- , , , , , . PICC‐associated bloodstream infections: prevalence, patterns, and predictors. Am J Med. 2014;127(4):319–328.
- , , , , . The risk of bloodstream infection associated with peripherally inserted central catheters compared with central venous catheters in adults: a systematic review and meta‐analysis. Infect Control Hosp Epidemiol. 2013;34(9):908–918.
- , , , , , . Peripherally inserted central catheters: use at a tertiary care pediatric center. J Vasc Interv Radiol. 2013;24(9):1323–1331.
- , , , et al. Temporary central venous catheter utilization patterns in a large tertiary care center: tracking the “idle central venous catheter”. Infect Control Hosp Epidemiol. 2012;33(1):50–57.
- , , , , . Inappropriate intravascular device use: a prospective study. Journal Hosp Infect. 2011;78(2):128–132.
- , , , et al. Enhancing patient‐centered care: SGIM and choosing wisely. J Gen Intern Med. 2014;29(3):432–433.
- , , , et al. Critical and honest conversations: the evidence behind the “Choosing Wisely” campaign recommendations by the American Society of Nephrology. Clin J Am Soc Nephrol. 2012;7(10):1664–1672.
- , , , et al. Using highly detailed administrative data to predict pneumonia mortality. PLoS One. 2014;9(1):e87382.
- , , , , . A combined comorbidity score predicted mortality in elderly patients better than existing scores. J Clin Epidemiol. 2011;64(7):749–759.
- , , , , . Hospitals with the highest intensive care utilization provide lower quality pneumonia care to the elderly. Crit Care Med. 2015;43(6):1178–1186.
- , . Statistical and clinical aspects of hospital outcomes profiling. Stat Sci. 2007;22(2):206–226.
- , . Appropriate assessment of neighborhood effects on individual health: integrating random and fixed effects in multilevel logistic regression. Am J Epidemiol. 2005;161(1):81–88.
- , , , . Interpreting parameters in the logistic regression model with random effects. Biometrics. 2000;56(3):909–914.
- , , , . Hospital‐level associations with 30‐day patient mortality after cardiac surgery: a tutorial on the application and interpretation of marginal and multilevel logistic regression. BMC Med Res Methodol. 2012;12:28.
- , , , . Experiences of the first PICC team in the Czech Republic. Br J Nurs. 2015;24(suppl 2):S4–S10.
- , , , et al. Greece reports prototype intervention with first peripherally inserted central catheter: case report and literature review. J Vasc Nurs. 2012;30(3):88–93.
- Total intravenous nutrition with peripherally inserted silicone elastomer central venous catheters. Arch Surg. 1975;110(5):644–646.
- , . Focus on peripherally inserted central catheters in critically ill patients. World J Crit Care Med. 2014;3(4):80–94.
- , , , et al. Quality improvement initiative to reduce deep vein thrombosis associated with peripherally inserted central catheters in adults with cystic fibrosis. Ann Am Thorac Soc. 2014;11(9):1404–1410.
- , , , . Peripherally Inserted central catheter (PICC) complications during pregnancy. JPEN J Parenter Enteral Nutr. 2013;38(5):595–601.
- , , , et al. Do clinicians know which of their patients have central venous catheters?: a multicenter observational study. Ann Intern Med. 2014;161(8):562–567.
- , , , et al. Risk of venous thromboembolism associated with peripherally inserted central catheters: a systematic review and meta‐analysis. Lancet. 2013;382(9889):311–325.
- , , . The problem with peripherally inserted central catheters. JAMA. 2012;308(15):1527–1528.
- , , , et al. Peripherally inserted central catheter use in skilled nursing facilities: a pilot study. J Am Geriatr Soc. 2015;63(9):1894–1899.
- , , , , . Inpatient venous access practices: PICC culture and the kidney patient. J Vasc Access. 2015;16(3):206–210.