User login
Improvement in the quality of hospital care in the United States is a national priority, both to advance patient safety and because our expenditures exceed any other nation's, but our health outcomes lag behind.[1, 2] Healthcare spending for children is growing at a faster rate than any other age group, with hospital care accounting for more than 40% of pediatric healthcare expenditures.[3] Inpatient healthcare comprises a greater proportion of healthcare costs for children than for adults, yet we have limited knowledge about where this care is provided.[4]
There is substantial variability in the settings in which children are hospitalized. Children may be hospitalized in freestanding children's hospitals, where all services are designed for children and which operate independently of adult‐focused institutions. They may also be hospitalized in general hospitals where care may be provided in a general inpatient bed, on a dedicated pediatric ward, or in a children's hospital nested within a hospital, which may have specialized nursing and physician care but often shares other resources such as laboratory and radiology with the primarily adult‐focused institution. Medical students and residents may be trained in all of these settings. We know little about how these hospital types differ with respect to patient populations, disease volumes, and resource utilization, and this knowledge is important to inform clinical programs, implementation research, and quality improvement (QI) priorities. To this end, we aimed to describe the volume and characteristics of pediatric hospitalizations at acute care general hospitals and freestanding children's hospitals in the United States.
METHODS
Study Design and Eligibility
The data source for this analysis was the Healthcare Cost and Utilization Project's (HCUP) 2012 Kids' Inpatient Database (KID). We conducted a cross‐sectional study of hospitalizations in children and adolescents less than 18 years of age, excluding in‐hospital births and hospitalizations for pregnancy and delivery (identified using All Patient Refined‐Diagnostic Related Groups [APR‐DRGs]).[5] Neonatal hospitalizations not representing in‐hospital births but resulting from transfers or new admissions were retained. Because the dataset does not contain identifiable information, the institutional review board at Baystate Medical Center determined that our study did not constitute human subjects research.
The KID is released every 3 years and is the only publicly available, nationally representative database developed to study pediatric hospitalizations, including an 80% sample of noninborn pediatric discharges from all community, nonrehabilitation hospitals from 44 participating states.[6] Short‐term rehabilitation hospitals, long‐term nonacute care hospitals, psychiatric hospitals, and alcoholism/chemical dependency treatment facilities are excluded. The KID contains information on all patients, regardless of payer, and provides discharge weights to calculate national estimates.[6] It contains both hospital‐level and patient‐level variables, including demographic characteristics, charges, and other clinical and resource use data available from discharge abstracts. Beginning in 2012, freestanding children's hospitals (FCHs) are assigned to a separate stratum in the KID, with data from the Children's Hospital Association used by HCUP to verify the American Hospital Association's (AHA) list of FCHs.[6] Hospitals that are not FCHs were categorized as general hospitals (GHs). We were interested in examining patterns of care at acute care hospitals and not specialty hospitals; unlike previous years, the KID 2012 does not include a specialty hospital identifier.[6] Therefore, as a proxy for specialty hospital status, we excluded hospitals that had 2% hospitalizations for 12 common medical conditions (pneumonia, asthma, bronchiolitis, cellulitis, dehydration, urinary tract infection, neonatal hyperbilirubinemia, fever, upper respiratory infection, infectious gastroenteritis, unspecified viral infection, and croup). These medical conditions were the 12 most common reasons for medical hospitalizations identified using Keren's pediatric diagnosis code grouper,[7] excluding chronic diseases, and represented 26.2% of all pediatric hospitalizations. This 2% threshold was developed empirically, based on visual analysis of the distribution of cases across hospitals and was limited to hospitals with total pediatric volumes >25/year, allowing for stable case‐mix estimates.
Descriptor Variables
Hospital level characteristics included US Census region; teaching status classified in the KID based on results of the AHA Annual Survey; urban/rural location; hospital ownership, classified as public, private nonprofit and private investor‐owned; and total volume of pediatric hospitalizations, in deciles.[6] At the patient level, we examined age, gender, race/ethnicity, expected primary payer, and median household income (in quartiles) for patient's zip code. Medical complexity was categorized as (1) nonchronic disease, (2) complex chronic disease, or (3) noncomplex chronic disease, using the previously validated Pediatric Medical Complexity Algorithm (PMCA) based on International Classification of Diseases, 9th Revision, Clinical Modification (ICD‐9‐CM) codes.[8] Disease severity was classified based on APR‐DRG severity of illness coding, which classifies illnesses severity as minor, moderate, major, or extreme.[9]
We examined the following characteristics of the hospitalizations: (1) length of hospital stay (LOS) measured in calendar days; (2) high‐turnover hospitalization defined as LOS less than 2 days[10, 11, 12]; (3) long LOS, defined as greater than 4 days, equivalent to LOS greater than the 75th percentile; (4) neonatal versus non‐neonatal hospitalization, identified using APR‐DRGs; (5) admission type categorized as elective and nonelective; (6) admission source, categorized as transfer from another acute care hospital, admission from the emergency department, or direct admission; (7) discharge status, categorized as routine discharge, transfer to another hospital or healthcare facility, and discharge against medical advice; and (8) total hospital costs, calculated by applying the cost‐to‐charge ratios available in the KID to total hospital charges.
Reasons for hospitalization were categorized using the pediatric diagnosis code grouper by Keren, which uses ICD‐9‐CM codes to group common and costly principal diagnoses into distinct conditions (eg, pneumonia, idiopathic scoliosis), excluding children who have ICD‐9‐CM principal procedure codes unlikely related to their principal diagnosis (for example, appendectomy for a child with a principal diagnosis of pneumonia).[7] This pediatric grouper classifies diagnoses as medical, surgical, or medical‐surgical based on whether <20% (medical), >80% (surgical) or between 20% and 80% (medical‐surgical) of encounters for the condition had an ICD‐9‐CM principal procedure code for a surgery related to that condition. We further characterized medical hospitalizations as either medical or mental health hospitalizations.
Statistical Analysis
We categorized each discharge record as a hospitalization at a GH or an FCH. We then calculated patient‐level summary statistics, applying weights to calculate national estimates with an associated standard deviation (SD). We assessed differences in characteristics of hospitalizations at GHs and FCHs using Rao‐Scott 2 tests for categorical variables and Wald F tests for continuous variables.[6] We identified the most common reasons for hospitalization, including those responsible for at least 2% of all medical or surgical hospitalizations and at least 0.5% of medical hospitalizations for mental health diagnoses, given the lower prevalence of these conditions and our desire to include mental health diagnoses in our analysis. For these common conditions, we calculated the proportion of condition‐specific hospitalizations and aggregate hospital costs at GHs and FCHs. We also determined the number of hospitalizations at each hospital and calculated the median and interquartile range for the number of hospitalizations for each of these conditions according to hospital type, assessing for differences using Kruskal‐Wallis tests. Finally, we identified the most common and costly conditions at GHs and FCHs by ranking frequency and aggregate costs for each condition according to hospital type, limited to the 20 most costly and/or prevalent pediatric diagnoses. Because we used a novel method to identify specialty hospitals in this dataset, we repeated these analyses using all hospitals classified as a GH and FCH as a sensitivity analysis.
RESULTS
Overall, 3866 hospitals were categorized as a GH, whereas 70 hospitals were categorized as FCHs. Following exclusion of specialty hospitals, 3758 GHs and 50 FCHs were retained in this study. The geographic distribution of hospitals was similar, but although GHs included those in both urban and rural regions, all FCHs were located in urban regions (Table 1).
| General Hospitals, n = 3,758 | Children's Hospitals, n = 50 | ||||
|---|---|---|---|---|---|
| Hospital characteristics | n | % | n | % | P Value |
| |||||
| Geographic region | |||||
| Northeast | 458 | 12.2 | 4 | 8.0 | 0.50 |
| Midwest | 1,209 | 32.2 | 15 | 30.0 | |
| South | 1,335 | 35.6 | 17 | 34.0 | |
| West | 753 | 20.1 | 14 | 28.0 | |
| Location and teaching status | |||||
| Rural | 1,524 | 40.6 | 0 | 0 | <0.0001 |
| Urban nonteaching | 1,506 | 40.1 | 7 | 14.0 | |
| Urban teaching | 725 | 19.3 | 43 | 86.0 | |
| Hospital ownership | |||||
| Government, nonfederal | 741 | 19.7 | 0 | 0 | <0.0001 |
| Private, nonprofit | 2,364 | 63.0 | 48 | 96.0 | |
| Private, investor‐owned | 650 | 17.3 | 2 | 4.0 | |
| Volume of pediatric hospitalizations (deciles) | |||||
| <185 hospitalizations/year (<8th decile) | 2,664 | 71.0 | 0 | 0 | <0.0001 |
| 186375 hospitalizations/year (8th decile) | 378 | 10.1 | 2 | 4.0 | |
| 376996 hospitalizations/year (9th decile) | 380 | 10.1 | 1 | 2.0 | |
| >986 hospitalizations/year (10th decile) | 333 | 8.9 | 47 | 94.0 | |
| Volume of pediatric hospitalizations, median [IQR] | 56 | [14240] | 12,001 | [5,83815,448] | <0.0001 |
A total of 1,407,822 (SD 50,456) hospitalizations occurred at GHs, representing 71.7% of pediatric hospitalizations, whereas 554,458 (SD 45,046) hospitalizations occurred at FCHs. Hospitalizations at GHs accounted for 63.6% of days in hospital and 50.0% of pediatric inpatient healthcare costs. Eighty percent of the GHs had total pediatric patient volumes of less than 375 hospitalizations yearly; 11.1% of pediatric hospitalizations occurred at these lower‐volume centers. At FCHs, the median volume of pediatric hospitalizations was 12,001 (interquartile range [IQR]: 583815,448). A total of 36 GHs had pediatric hospitalization volumes in this IQR.
The median age for pediatric patients was slightly higher at GHs, whereas gender, race/ethnicity, primary payer, and median household income for zip code did not differ significantly between hospital types (Table 2). Medical complexity differed between hospital types: children with complex chronic diseases represented 20.2% of hospitalizations at GHs and 35.6% of hospitalizations at FCHs. Severity of illness differed between hospital types, with fewer hospitalizations categorized at the highest level of severity at GHs than FCHs. There were no significant differences between hospital types with respect to the proportion of hospitalizations categorized as neonatal hospitalizations or as elective hospitalizations. The median LOS was shorter at GHs than FCHs. Approximately 1 in 5 children hospitalized at GHs had LOS greater than 4 days, whereas almost 30% of children hospitalized at FCHs had LOS of this duration.
| Patient Characteristics |
General Hospitals,1,407,822 (50,456), 71.7% |
Children's Hospitals,554,458 (45,046), 28.3% |
P Value | ||||
|---|---|---|---|---|---|---|---|
| n | (SD Weighted Frequency) | (%) | n | (SD Weighted Frequency) | % | ||
| |||||||
| Age, y, median [IQR] | 3.6 [011.7] | 3.4 [010.8] | 0.001 | ||||
| Gender (% female) | 644,250 | (23,089) | 45.8 | 254,505 | (20,688) | 45.9 | 0.50 |
| Race* | |||||||
| White | 668,876 | (27,741) | 47.5 | 233,930 | (26,349) | 42.2 | 0.05 |
| Black | 231,586 | (12,890) | 16.5 | 80,568 | (11,739) | 14.5 | |
| Hispanic | 279,021 | (16,843) | 19.8 | 12,1425 | (21,183) | 21.9 | |
| Other | 133,062 | (8,572) | 9.5 | 41,190 | (6,394) | 7.4 | |
| Insurance status | |||||||
| Public | 740,033 | (28,675) | 52.6 | 284,795 | (25,324) | 51.4 | 0.90 |
| Private | 563,562 | (21,930) | 40.0 | 224,042 | (21,613) | 40.4 | |
| Uninsured | 37,265 | (1,445) | 2.7 | 16,355 | (3,804) | 3.0 | |
| No charge/other/unknown | 66,962 | (5,807) | 4.8 | 29,266 | (6,789) | 5.3 | |
| Median household income for zip code, quartiles | |||||||
| <$38,999 | 457,139 | (19,725) | 33.3 | 164,831 | (17,016) | 30.1 | 0.07 |
| $39,000$47,999 | 347,229 | (14,104) | 25.3 | 125,105 | (10,712) | 22.9 | |
| $48,000$62,999 | 304,795 | (13,427) | 22.2 | 134,915 | (13,999) | 24.7 | |
| >$63,000 | 263,171 | (15,418) | 19.2 | 122,164 | (16,279) | 22.3 | |
| Medical complexity | |||||||
| Nonchronic disease | 717,009 | (21,807) | 50.9 | 211,089 | (17,023) | 38.1 | <0.001 |
| Noncomplex chronic disease | 406,070 | (14,951) | 28.8 | 146,077 | (12,442) | 26.4 | |
| Complex chronic disease | 284,742 | (17,111) | 20.2 | 197,292 | (18,236) | 35.6 | |
| APR‐DRG severity of illness | |||||||
| 1 (lowest severity) | 730,134 | (23,162) | 51.9 | 217,202 | (18,433) | 39.2 | <0.001 |
| 2 | 486,748 | (18,395) | 34.6 | 202,931 | (16,864) | 36.6 | |
| 3 | 146,921 | (8,432) | 10.4 | 100,566 | (9,041) | 18.1 | |
| 4 (highest severity) | 41,749 | (3,002) | 3.0 | 33,340 | (3,199) | 6.0 | |
| Hospitalization characteristics | |||||||
| Neonatal hospitalization | 98,512 | (3,336) | 7.0 | 39,584 | (4,274) | 7.1 | 0.84 |
| Admission type | |||||||
| Elective | 255,774 | (12,285) | 18.3 | 109,854 | (13,061) | 19.8 | 0.05 |
| Length of stay, d, (median [IQR]) | 1.8 (0.01) [0.8‐3.6] | 2.2 (0.06) [1.1‐4.7] | <0.001 | ||||
| High turnover hospitalizations | 416,790 | (14,995) | 29.6 | 130,441 | (12,405) | 23.5 | <0.001 |
| Length of stay >4 days | 298,315 | (14,421) | 21.2 | 161,804 | (14,354) | 29.2 | <0.001 |
| Admission source | |||||||
| Transfer from another acute care hospital | 154,058 | (10,067) | 10.9 | 82,118 | (8,952) | 14.8 | 0.05 |
| Direct admission | 550,123 | (21,954) | 39.1 | 211,117 | (20,203) | 38.1 | |
| Admission from ED | 703,641 | (26,155) | 50.0 | 261,223 | (28,708) | 47.1 | |
| Discharge status | |||||||
| Routine | 1,296,638 | (46,012) | 92.1 | 519,785 | (42,613) | 93.8 | <0.01 |
| Transfer to another hospital or healthcare facility | 56,115 | (1,922) | 4.0 | 13,035 | (1,437) | 2.4 | |
| Discharge against medical advice | 2,792 | (181) | 0.2 | 382 | (70) | 0.1 | |
| Other | 52,276 | (4,223) | 3.7 | 21,256 | (4,501) | 3.8 | |
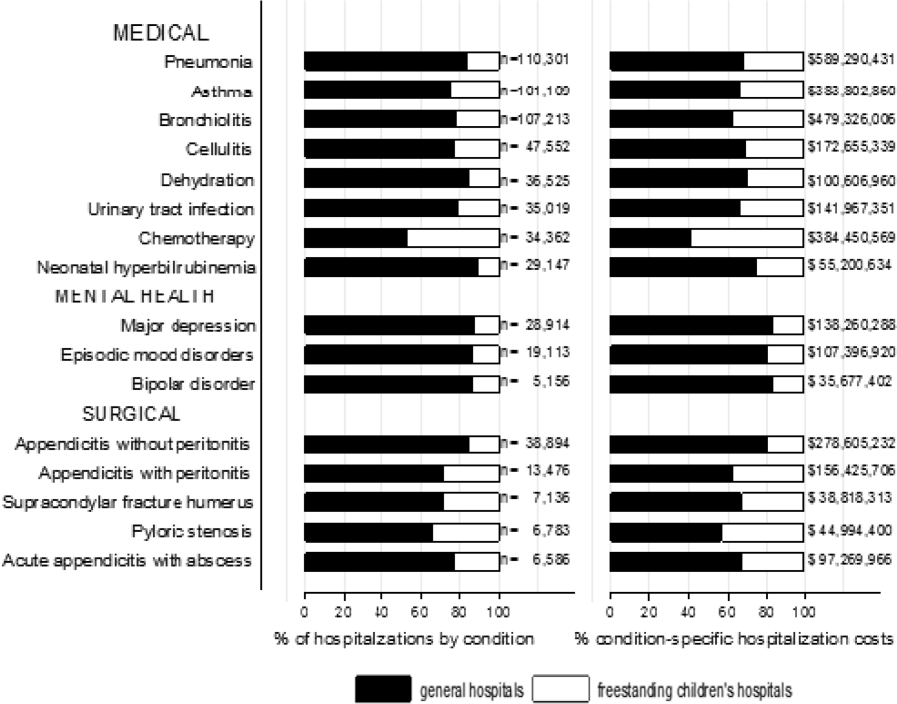
The most common pediatric medical, mental health, and surgical conditions are shown in Figure 1, together representing 32% of pediatric hospitalizations during the study period. For these medical conditions, 77.9% of hospitalizations occurred at GHs, ranging from 52.6% of chemotherapy hospitalizations to 89.0% of hospitalizations for neonatal hyperbilirubinemia. Sixty‐two percent of total hospital costs for these conditions were incurred at GHs. For the common mental health hospitalizations, 86% of hospitalizations occurred at GHs. The majority of hospitalizations and aggregate hospital costs for common surgical conditions also occurred at GHs.

Whereas pneumonia, asthma, and bronchiolitis were the most common reasons for hospitalization at both GHs and FCHs, the most costly conditions differed (see Supporting Table 1 in the online version of this article). At GHs, these respiratory diseases were responsible for the highest condition‐specific total hospital costs. At FCHs, the highest aggregate costs were due to respiratory distress syndrome and chemotherapy. Congenital heart diseases, including hypoplastic left heart syndrome, transposition of the great vessels, tetralogy of Fallot, endocardial cushion defects, coarctation of the aorta and ventricular septal defects accounted for 6 of the 20 most costly conditions at FCHs.
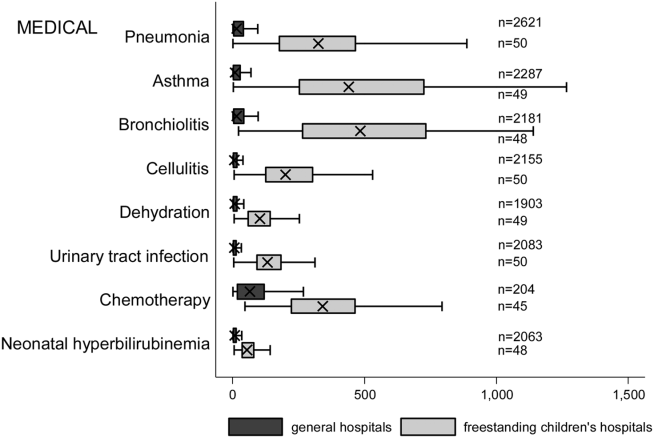
Figure 2 illustrates the volume of hospitalizations, per hospital, at GHs and FCHs for the most common medical hospitalizations. The median number of hospitalizations, per hospital, was consistently significantly lower at GHs than at FCHs (all P values <0.001). Similar results for surgical and mental health hospitalizations are shown as Supporting Figures 1 and 2 in the online version of this article. In our sensitivity analyses that included all hospitals classified as GH and FCH, all results were essentially unchanged.
Recognizing the wide range of pediatric volumes at GHs (Table 1) and our inability to differentiate children's hospitals nested within GHs from GHs with pediatric beds, we examined differences in patient and hospitalization characteristics at GHs with volumes 5838 hospitalizations (the 25th percentile for FCH volume) and GHs with pediatric volumes <5838/year (see Supporting Table 2 in the online version of this article). We also compared patient and hospitalization characteristics at FCHs and the higher‐volume GHs. A total of 36 GHs had pediatric volumes 5838, with hospitalizations at these sites together accounting for 15.4% of all pediatric hospitalizations. Characteristics of patients hospitalized at these higher‐volume GHs were similar to patients hospitalized at FCHs, but they had significantly lower disease severity, fewer neonatal hospitalizations, shorter LOS, and more high‐turnover hospitalizations than patients hospitalized at FCHs. We also observed several differences between children hospitalized at higher‐ and lower‐volume GHs (see Supporting Table 2 in the online version of this article). Children hospitalized at the lower‐volume GHs were more likely to have public health insurance and less likely to have complex chronic diseases, although overall, 39.0% of all hospitalizations for children with complex chronic diseases occurred at these lower‐volume GHs. Compared to children hospitalized at higher‐volume GHs, children hospitalized at the lower‐volume hospitals had significantly lower disease severity, shorter LOS, more direct admissions, and a greater proportion of routine discharges.
DISCUSSION
Of the 2 million pediatric hospitalizations in the United States in 2012, more than 70% occurred at GHs. We observed considerable heterogeneity in pediatric volumes across GHs, with 11% of pediatric hospitalizations occurring at hospitals with pediatric volumes of <375 hospitalizations annually, whereas 15% of pediatric hospitalizations occurred at GHs with volumes similar to those observed at FCHs. The remaining pediatric hospitalizations at GHs occurred at centers with intermediate volumes. The most common reasons for hospitalization were similar at GHs and FCHs, but the most costly conditions differed substantially. These findings have important implications for pediatric clinical care programs, research, and QI efforts.
Our finding that more than 70% of pediatric hospitalizations occurred at GHs speaks to the importance of quality measurement at these hospitals, whereas low per‐hospital pediatric volumes at the majority of GHs makes such measurement particularly challenging. Several previous studies have illustrated that volumes of pediatric hospitalizations are too small to detect meaningful differences in quality between hospitals using established condition‐specific metrics.[13, 14, 15] Our finding that more than 10% of pediatric hospitalizations occurred at GHs with pediatric volumes <375 year supports previous research suggesting that cross‐cutting, all‐condition quality metrics, composite measures, and/or multihospital reporting networks may be needed to enable quality measurement at these sites. In addition, the heterogeneity in patient volumes and characteristics across GHs raise questions about the applicability of quality metrics developed and validated at FCHs to the many GH settings. Field‐testing quality measures to ensure their validity at diverse GHs, particularly those with patient volumes and infrastructure different from FCHs, will be important to meaningful pediatric quality measurement.
Our results illustrating differences in the most common and costly conditions at GHs and FCHs have further implications for prioritization and implementation of research and QI efforts. Implementation research and QI efforts focused on cardiac and neurosurgical procedures, as well as neonatal intensive care, may have considerable impact on cost and quality at FCHs. At GHs, research and QI efforts focused on common conditions are needed to increase our knowledge of contextually relevant barriers to and facilitators of high‐quality pediatric care. This, however, can be made more difficult by small sample sizes, limited resources, and infrastructure, and competing priorities in adult‐focused GH settings.[16, 17, 18] Multihospital learning collaboratives and partnerships between FCHs and GHs can begin to address these challenges, but their success is contingent upon national advocacy and funding to support pediatric research and quality measures at GHs.
One of the most notable differences in the characteristics of pediatric hospitalizations at GHs and FCHs was the proportion of hospitalizations attributable to children with medical complexity (CMC); more than one‐third of hospitalizations at FCHs were for CMC compared to 1 in 5 at GHs. These findings align with the results of several previous studies describing the substantial resource utilization attributed to CMC, and with growing research, innovation, and quality metrics focused on improving both inpatient and outpatient care for these vulnerable children.[19, 20, 21, 22] Structured complex care programs, developed to improve care coordination and healthcare quality for CMC, are common at FCHs, and have been associated with decreased resource utilization and improved outcomes.[23, 24, 25] Notably, however, more than half of all hospitalizations for CMC, exceeding 250,000 annually, occurred at GHs, and almost 40% of hospitalizations for CMC occurred at the lower‐volume GHs. These findings speak to the importance of translating effective and innovative programs of care for CMC to GHs as resources allow, accompanied by robust evaluations of their effectiveness. Lower patient volume at most GHs, however, may be a barrier to dedicated CMC programs. As a result, decentralized community‐based programs of care for CMC, linking primary care programs with regional and tertiary care hospitals, warrant further consideration.[26, 27, 28]
This analysis should be interpreted in light of several limitations. First, we were unable to distinguish between GHs with scant pediatric‐specific resources from those with a large volume of dedicated pediatric resources, such as children's hospitals nested within GHs. We did identify 36 GHs with pediatric volumes similar to those observed at FCHs (see Supporting Table 2 in the online version of this article); patient and hospitalization characteristics at these higher‐volume GHs were similar in many ways to children hospitalized at FCHs. Several of these higher‐volume GHs may have considerable resources dedicated to the care of children, including subspecialty care, and may represent children's hospitals nested within GHs. Because nested children's hospitals are included in the GH categorization, our results may have underestimated the proportion of children cared for at children's hospitals. Further work is needed to identify the health systems challenges and opportunities that may be unique to these institutions. Second, because the 2012 KID does not include a specialty hospital indicator, we developed a proxy method for identifying these hospitals, which may have resulted in some misclassification. We are reassured that the results of our analyses did not change substantively when we included all hospitals. Similarly, although we are reassured that the number of hospitals classified in our analysis as acute care FCHs aligns, approximately, with the number of hospitals classified as such by the Children's Hospital Association, we were unable to assess the validity of this variable within the KID. Third, the KID does not link records at the patient level, so we are unable to report the number of unique children included in this analysis. In addition, the KID includes only inpatient stays with exclusion of observation status stays; potential differences between GH and FCH in the use of observation status could have biased our findings. Fifth, we used the PMCA to identify CMC; although this algorithm has been shown to have excellent sensitivity in identifying children with chronic diseases, using up to 3 years of Medicaid claims data, the sensitivity using the KID, where only 1 inpatient stay is available for assessment, is unknown.[8, 29] Similarly, use of Keren's pediatric diagnosis grouper to classify reasons for hospitalization may have resulted in misclassification, though there are few other nonproprietary pediatric‐specific diagnostic groupers available.
In 2012, more than 70% of pediatric hospitalizations occurred at GHs in the United States. The considerably higher pediatric volumes at FCHs makes these institutions well suited for research, innovation, and the development and application of disease‐specific QI initiatives. Recognizing that the majority of pediatric hospitalizations occurred at GHs, there is a clear need for implementation research, program development, and quality metrics that align with the characteristics of hospitalizations at these centers. National support for research and quality improvement that reflects the diverse hospital settings where children receive their hospital care is critical to further our nation's goal of improving hospital quality for children.
Disclosures
Dr. Leyenaar was supported by grant number K08HS024133 from the Agency for Healthcare Research and Quality. The content is solely the responsibility of the authors and does not necessarily represent the official views of the Agency for Healthcare Research and Quality. The authors have no conflicts of interest relevant to this article to disclose.
- , , , . Mirror, Mirror on the wall: how the performance of the US health care system compares internationally. The Commonwealth Fund. Available at: http://www.commonwealthfund.org/publications/fund‐reports/2014/jun/mirror‐mirror. Published June 16, 2014. Accessed August 26, 2015.
- , , , , , . Higher cost, but poorer outcomes: the US health disadvantage and implications for pediatrics. Pediatrics. 2015;135(6):961–964.
- , , , , . US health spending trends by age and gender: selected years 2002–10. Health Aff (Millwood). 2014;33(5):815–822.
- , , . Costs for hospital stays in the United States, 2012. Healthcare Cost and Utilization Project 181. Available at: http://www.hcup‐us.ahrq.gov/reports/statbriefs/sb181‐Hospital‐Costs‐United‐States‐2012.pdf. Published October 2014. Accessed September 2015.
- , , , et al. All Patient Refined Diagnosis Related Groups: Methodology Overview. 3M Health Information Systems. Available at: https://www.hcup‐us.ahrq.gov/db/nation/nis/APR‐DRGsV20MethodologyOverviewandBibliography.pdf. Accessed February 8, 2016.
- Agency for Healthcare Research and Quality. Healthcare Cost and Utilization Project. Introduction to the HCUP Kids' Inpatient Database (KID) 2012. Available at: https://www.hcup‐us.ahrq.gov/db/nation/kid/kid_2012_introduction.jsp. Published Issued July 2014. Accessed February 8, 2016.
- . Prioritization of comparative effectiveness research topics in hospital pediatrics. Arch Pediatr Adolesc Med. 2012;166(12):1155.
- , , , et al. Pediatric medical complexity algorithm: a new method to stratify children by medical complexity. Pediatrics. 2014;133(6):e1647–e1654.
- , , , et al. 3M APR DRG Classification System. 3M Health Information Systems. Available at: http://www.hcup‐us.ahrq.gov/db/nation/nis/v261_aprdrg_meth_ovrview.pdf. Accessed August 7, 2015.
- , , , , , . Trends in high‐turnover stays among children hospitalized in the United States, 1993–2003. Pediatrics. 2009;123(3):996–1002.
- , , , . High turnover stays for pediatric asthma in the United States. Med Care. 2010;48(9):827–833.
- , , , , . Variation and outcomes associated with direct admission among children with pneumonia in the United States. JAMA Pediatr. 2014;168(9):829–836.
- , , , et al. Recognizing differences in hospital quality performance for pediatric inpatient care. Pediatrics. 2015;136(2):251–262.
- , , . Small numbers limit the use of the inpatient pediatric quality indicators for hospital comparison. Acad Pediatr. 2010;10(4):266–273.
- , , , et al. Statistical uncertainty of mortality rates and rankings for children's hospitals. Pediatrics. 2011;128(4):e966–e972.
- , , , , . Determinants of career satisfaction among pediatric hospitalists: a qualitative exploration. Acad Pediatr. 2014;14(4):361–368.
- , , , et al. Quality improvement research in pediatric hospital medicine and the role of the Pediatric Research in Inpatient Settings (PRIS) network. Acad Pediatr. 2013;13(6 suppl):S54–S60.
- . Roles for children's hospitals in pediatric collaborative improvement networks. Pediatrics. 2013;131(suppl 4):S215–S218.
- , , , et al. Children with medical complexity: an emerging population for clinical and research initiatives. Pediatrics. 2011;127(3):529–538.
- , , , et al. Children with complex chronic conditions in inpatient hospital settings in the United States. Pediatrics. 2010;126(4):647–655.
- , , , , , . Patterns and costs of health care use of children with medical complexity. Pediatrics. 2012;130(6):e1463–e1470.
- , , , , , . Hospital utilization and characteristics of patients experiencing recurrent readmissions within children's hospitals. JAMA. 2011;305(7):682–690.
- , , , et al. Characteristics of hospitalizations for patients who use a structured clinical care program for children with medical complexity. J Pediatr. 2011;159(2):284–290.
- , , , . Hospital‐based comprehensive care programs for children with special health care needs: a systematic review. Arch Pediatr Adolesc Med. 2011;165(6):554–561.
- , , , , , . A tertiary care–primary care partnership model for medically complex and fragile children and youth with special health care needs. Arch Pediatr Adolesc Med. 2007;161(10):937–944.
- , , , et al. Integrated complex care coordination for children with medical complexity: a mixed‐methods evaluation of tertiary care‐community collaboration. BMC Health Serv Res. 2012;12:366.
- , , , . Medical transport of children with complex chronic conditions. Emerg Med Int. 2012;2012:837020.
- , , . Comanagement of medically complex children by subspecialists, generalists, and care coordinators. Pediatrics. 2014;134(2):203–205.
- , , , , . Ways to identify children with medical complexity and the importance of why. J Pediatr. 2015;167(2):229–237.
Improvement in the quality of hospital care in the United States is a national priority, both to advance patient safety and because our expenditures exceed any other nation's, but our health outcomes lag behind.[1, 2] Healthcare spending for children is growing at a faster rate than any other age group, with hospital care accounting for more than 40% of pediatric healthcare expenditures.[3] Inpatient healthcare comprises a greater proportion of healthcare costs for children than for adults, yet we have limited knowledge about where this care is provided.[4]
There is substantial variability in the settings in which children are hospitalized. Children may be hospitalized in freestanding children's hospitals, where all services are designed for children and which operate independently of adult‐focused institutions. They may also be hospitalized in general hospitals where care may be provided in a general inpatient bed, on a dedicated pediatric ward, or in a children's hospital nested within a hospital, which may have specialized nursing and physician care but often shares other resources such as laboratory and radiology with the primarily adult‐focused institution. Medical students and residents may be trained in all of these settings. We know little about how these hospital types differ with respect to patient populations, disease volumes, and resource utilization, and this knowledge is important to inform clinical programs, implementation research, and quality improvement (QI) priorities. To this end, we aimed to describe the volume and characteristics of pediatric hospitalizations at acute care general hospitals and freestanding children's hospitals in the United States.
METHODS
Study Design and Eligibility
The data source for this analysis was the Healthcare Cost and Utilization Project's (HCUP) 2012 Kids' Inpatient Database (KID). We conducted a cross‐sectional study of hospitalizations in children and adolescents less than 18 years of age, excluding in‐hospital births and hospitalizations for pregnancy and delivery (identified using All Patient Refined‐Diagnostic Related Groups [APR‐DRGs]).[5] Neonatal hospitalizations not representing in‐hospital births but resulting from transfers or new admissions were retained. Because the dataset does not contain identifiable information, the institutional review board at Baystate Medical Center determined that our study did not constitute human subjects research.
The KID is released every 3 years and is the only publicly available, nationally representative database developed to study pediatric hospitalizations, including an 80% sample of noninborn pediatric discharges from all community, nonrehabilitation hospitals from 44 participating states.[6] Short‐term rehabilitation hospitals, long‐term nonacute care hospitals, psychiatric hospitals, and alcoholism/chemical dependency treatment facilities are excluded. The KID contains information on all patients, regardless of payer, and provides discharge weights to calculate national estimates.[6] It contains both hospital‐level and patient‐level variables, including demographic characteristics, charges, and other clinical and resource use data available from discharge abstracts. Beginning in 2012, freestanding children's hospitals (FCHs) are assigned to a separate stratum in the KID, with data from the Children's Hospital Association used by HCUP to verify the American Hospital Association's (AHA) list of FCHs.[6] Hospitals that are not FCHs were categorized as general hospitals (GHs). We were interested in examining patterns of care at acute care hospitals and not specialty hospitals; unlike previous years, the KID 2012 does not include a specialty hospital identifier.[6] Therefore, as a proxy for specialty hospital status, we excluded hospitals that had 2% hospitalizations for 12 common medical conditions (pneumonia, asthma, bronchiolitis, cellulitis, dehydration, urinary tract infection, neonatal hyperbilirubinemia, fever, upper respiratory infection, infectious gastroenteritis, unspecified viral infection, and croup). These medical conditions were the 12 most common reasons for medical hospitalizations identified using Keren's pediatric diagnosis code grouper,[7] excluding chronic diseases, and represented 26.2% of all pediatric hospitalizations. This 2% threshold was developed empirically, based on visual analysis of the distribution of cases across hospitals and was limited to hospitals with total pediatric volumes >25/year, allowing for stable case‐mix estimates.
Descriptor Variables
Hospital level characteristics included US Census region; teaching status classified in the KID based on results of the AHA Annual Survey; urban/rural location; hospital ownership, classified as public, private nonprofit and private investor‐owned; and total volume of pediatric hospitalizations, in deciles.[6] At the patient level, we examined age, gender, race/ethnicity, expected primary payer, and median household income (in quartiles) for patient's zip code. Medical complexity was categorized as (1) nonchronic disease, (2) complex chronic disease, or (3) noncomplex chronic disease, using the previously validated Pediatric Medical Complexity Algorithm (PMCA) based on International Classification of Diseases, 9th Revision, Clinical Modification (ICD‐9‐CM) codes.[8] Disease severity was classified based on APR‐DRG severity of illness coding, which classifies illnesses severity as minor, moderate, major, or extreme.[9]
We examined the following characteristics of the hospitalizations: (1) length of hospital stay (LOS) measured in calendar days; (2) high‐turnover hospitalization defined as LOS less than 2 days[10, 11, 12]; (3) long LOS, defined as greater than 4 days, equivalent to LOS greater than the 75th percentile; (4) neonatal versus non‐neonatal hospitalization, identified using APR‐DRGs; (5) admission type categorized as elective and nonelective; (6) admission source, categorized as transfer from another acute care hospital, admission from the emergency department, or direct admission; (7) discharge status, categorized as routine discharge, transfer to another hospital or healthcare facility, and discharge against medical advice; and (8) total hospital costs, calculated by applying the cost‐to‐charge ratios available in the KID to total hospital charges.
Reasons for hospitalization were categorized using the pediatric diagnosis code grouper by Keren, which uses ICD‐9‐CM codes to group common and costly principal diagnoses into distinct conditions (eg, pneumonia, idiopathic scoliosis), excluding children who have ICD‐9‐CM principal procedure codes unlikely related to their principal diagnosis (for example, appendectomy for a child with a principal diagnosis of pneumonia).[7] This pediatric grouper classifies diagnoses as medical, surgical, or medical‐surgical based on whether <20% (medical), >80% (surgical) or between 20% and 80% (medical‐surgical) of encounters for the condition had an ICD‐9‐CM principal procedure code for a surgery related to that condition. We further characterized medical hospitalizations as either medical or mental health hospitalizations.
Statistical Analysis
We categorized each discharge record as a hospitalization at a GH or an FCH. We then calculated patient‐level summary statistics, applying weights to calculate national estimates with an associated standard deviation (SD). We assessed differences in characteristics of hospitalizations at GHs and FCHs using Rao‐Scott 2 tests for categorical variables and Wald F tests for continuous variables.[6] We identified the most common reasons for hospitalization, including those responsible for at least 2% of all medical or surgical hospitalizations and at least 0.5% of medical hospitalizations for mental health diagnoses, given the lower prevalence of these conditions and our desire to include mental health diagnoses in our analysis. For these common conditions, we calculated the proportion of condition‐specific hospitalizations and aggregate hospital costs at GHs and FCHs. We also determined the number of hospitalizations at each hospital and calculated the median and interquartile range for the number of hospitalizations for each of these conditions according to hospital type, assessing for differences using Kruskal‐Wallis tests. Finally, we identified the most common and costly conditions at GHs and FCHs by ranking frequency and aggregate costs for each condition according to hospital type, limited to the 20 most costly and/or prevalent pediatric diagnoses. Because we used a novel method to identify specialty hospitals in this dataset, we repeated these analyses using all hospitals classified as a GH and FCH as a sensitivity analysis.
RESULTS
Overall, 3866 hospitals were categorized as a GH, whereas 70 hospitals were categorized as FCHs. Following exclusion of specialty hospitals, 3758 GHs and 50 FCHs were retained in this study. The geographic distribution of hospitals was similar, but although GHs included those in both urban and rural regions, all FCHs were located in urban regions (Table 1).
| General Hospitals, n = 3,758 | Children's Hospitals, n = 50 | ||||
|---|---|---|---|---|---|
| Hospital characteristics | n | % | n | % | P Value |
| |||||
| Geographic region | |||||
| Northeast | 458 | 12.2 | 4 | 8.0 | 0.50 |
| Midwest | 1,209 | 32.2 | 15 | 30.0 | |
| South | 1,335 | 35.6 | 17 | 34.0 | |
| West | 753 | 20.1 | 14 | 28.0 | |
| Location and teaching status | |||||
| Rural | 1,524 | 40.6 | 0 | 0 | <0.0001 |
| Urban nonteaching | 1,506 | 40.1 | 7 | 14.0 | |
| Urban teaching | 725 | 19.3 | 43 | 86.0 | |
| Hospital ownership | |||||
| Government, nonfederal | 741 | 19.7 | 0 | 0 | <0.0001 |
| Private, nonprofit | 2,364 | 63.0 | 48 | 96.0 | |
| Private, investor‐owned | 650 | 17.3 | 2 | 4.0 | |
| Volume of pediatric hospitalizations (deciles) | |||||
| <185 hospitalizations/year (<8th decile) | 2,664 | 71.0 | 0 | 0 | <0.0001 |
| 186375 hospitalizations/year (8th decile) | 378 | 10.1 | 2 | 4.0 | |
| 376996 hospitalizations/year (9th decile) | 380 | 10.1 | 1 | 2.0 | |
| >986 hospitalizations/year (10th decile) | 333 | 8.9 | 47 | 94.0 | |
| Volume of pediatric hospitalizations, median [IQR] | 56 | [14240] | 12,001 | [5,83815,448] | <0.0001 |
A total of 1,407,822 (SD 50,456) hospitalizations occurred at GHs, representing 71.7% of pediatric hospitalizations, whereas 554,458 (SD 45,046) hospitalizations occurred at FCHs. Hospitalizations at GHs accounted for 63.6% of days in hospital and 50.0% of pediatric inpatient healthcare costs. Eighty percent of the GHs had total pediatric patient volumes of less than 375 hospitalizations yearly; 11.1% of pediatric hospitalizations occurred at these lower‐volume centers. At FCHs, the median volume of pediatric hospitalizations was 12,001 (interquartile range [IQR]: 583815,448). A total of 36 GHs had pediatric hospitalization volumes in this IQR.
The median age for pediatric patients was slightly higher at GHs, whereas gender, race/ethnicity, primary payer, and median household income for zip code did not differ significantly between hospital types (Table 2). Medical complexity differed between hospital types: children with complex chronic diseases represented 20.2% of hospitalizations at GHs and 35.6% of hospitalizations at FCHs. Severity of illness differed between hospital types, with fewer hospitalizations categorized at the highest level of severity at GHs than FCHs. There were no significant differences between hospital types with respect to the proportion of hospitalizations categorized as neonatal hospitalizations or as elective hospitalizations. The median LOS was shorter at GHs than FCHs. Approximately 1 in 5 children hospitalized at GHs had LOS greater than 4 days, whereas almost 30% of children hospitalized at FCHs had LOS of this duration.
| Patient Characteristics |
General Hospitals,1,407,822 (50,456), 71.7% |
Children's Hospitals,554,458 (45,046), 28.3% |
P Value | ||||
|---|---|---|---|---|---|---|---|
| n | (SD Weighted Frequency) | (%) | n | (SD Weighted Frequency) | % | ||
| |||||||
| Age, y, median [IQR] | 3.6 [011.7] | 3.4 [010.8] | 0.001 | ||||
| Gender (% female) | 644,250 | (23,089) | 45.8 | 254,505 | (20,688) | 45.9 | 0.50 |
| Race* | |||||||
| White | 668,876 | (27,741) | 47.5 | 233,930 | (26,349) | 42.2 | 0.05 |
| Black | 231,586 | (12,890) | 16.5 | 80,568 | (11,739) | 14.5 | |
| Hispanic | 279,021 | (16,843) | 19.8 | 12,1425 | (21,183) | 21.9 | |
| Other | 133,062 | (8,572) | 9.5 | 41,190 | (6,394) | 7.4 | |
| Insurance status | |||||||
| Public | 740,033 | (28,675) | 52.6 | 284,795 | (25,324) | 51.4 | 0.90 |
| Private | 563,562 | (21,930) | 40.0 | 224,042 | (21,613) | 40.4 | |
| Uninsured | 37,265 | (1,445) | 2.7 | 16,355 | (3,804) | 3.0 | |
| No charge/other/unknown | 66,962 | (5,807) | 4.8 | 29,266 | (6,789) | 5.3 | |
| Median household income for zip code, quartiles | |||||||
| <$38,999 | 457,139 | (19,725) | 33.3 | 164,831 | (17,016) | 30.1 | 0.07 |
| $39,000$47,999 | 347,229 | (14,104) | 25.3 | 125,105 | (10,712) | 22.9 | |
| $48,000$62,999 | 304,795 | (13,427) | 22.2 | 134,915 | (13,999) | 24.7 | |
| >$63,000 | 263,171 | (15,418) | 19.2 | 122,164 | (16,279) | 22.3 | |
| Medical complexity | |||||||
| Nonchronic disease | 717,009 | (21,807) | 50.9 | 211,089 | (17,023) | 38.1 | <0.001 |
| Noncomplex chronic disease | 406,070 | (14,951) | 28.8 | 146,077 | (12,442) | 26.4 | |
| Complex chronic disease | 284,742 | (17,111) | 20.2 | 197,292 | (18,236) | 35.6 | |
| APR‐DRG severity of illness | |||||||
| 1 (lowest severity) | 730,134 | (23,162) | 51.9 | 217,202 | (18,433) | 39.2 | <0.001 |
| 2 | 486,748 | (18,395) | 34.6 | 202,931 | (16,864) | 36.6 | |
| 3 | 146,921 | (8,432) | 10.4 | 100,566 | (9,041) | 18.1 | |
| 4 (highest severity) | 41,749 | (3,002) | 3.0 | 33,340 | (3,199) | 6.0 | |
| Hospitalization characteristics | |||||||
| Neonatal hospitalization | 98,512 | (3,336) | 7.0 | 39,584 | (4,274) | 7.1 | 0.84 |
| Admission type | |||||||
| Elective | 255,774 | (12,285) | 18.3 | 109,854 | (13,061) | 19.8 | 0.05 |
| Length of stay, d, (median [IQR]) | 1.8 (0.01) [0.8‐3.6] | 2.2 (0.06) [1.1‐4.7] | <0.001 | ||||
| High turnover hospitalizations | 416,790 | (14,995) | 29.6 | 130,441 | (12,405) | 23.5 | <0.001 |
| Length of stay >4 days | 298,315 | (14,421) | 21.2 | 161,804 | (14,354) | 29.2 | <0.001 |
| Admission source | |||||||
| Transfer from another acute care hospital | 154,058 | (10,067) | 10.9 | 82,118 | (8,952) | 14.8 | 0.05 |
| Direct admission | 550,123 | (21,954) | 39.1 | 211,117 | (20,203) | 38.1 | |
| Admission from ED | 703,641 | (26,155) | 50.0 | 261,223 | (28,708) | 47.1 | |
| Discharge status | |||||||
| Routine | 1,296,638 | (46,012) | 92.1 | 519,785 | (42,613) | 93.8 | <0.01 |
| Transfer to another hospital or healthcare facility | 56,115 | (1,922) | 4.0 | 13,035 | (1,437) | 2.4 | |
| Discharge against medical advice | 2,792 | (181) | 0.2 | 382 | (70) | 0.1 | |
| Other | 52,276 | (4,223) | 3.7 | 21,256 | (4,501) | 3.8 | |
The most common pediatric medical, mental health, and surgical conditions are shown in Figure 1, together representing 32% of pediatric hospitalizations during the study period. For these medical conditions, 77.9% of hospitalizations occurred at GHs, ranging from 52.6% of chemotherapy hospitalizations to 89.0% of hospitalizations for neonatal hyperbilirubinemia. Sixty‐two percent of total hospital costs for these conditions were incurred at GHs. For the common mental health hospitalizations, 86% of hospitalizations occurred at GHs. The majority of hospitalizations and aggregate hospital costs for common surgical conditions also occurred at GHs.
Whereas pneumonia, asthma, and bronchiolitis were the most common reasons for hospitalization at both GHs and FCHs, the most costly conditions differed (see Supporting Table 1 in the online version of this article). At GHs, these respiratory diseases were responsible for the highest condition‐specific total hospital costs. At FCHs, the highest aggregate costs were due to respiratory distress syndrome and chemotherapy. Congenital heart diseases, including hypoplastic left heart syndrome, transposition of the great vessels, tetralogy of Fallot, endocardial cushion defects, coarctation of the aorta and ventricular septal defects accounted for 6 of the 20 most costly conditions at FCHs.
Figure 2 illustrates the volume of hospitalizations, per hospital, at GHs and FCHs for the most common medical hospitalizations. The median number of hospitalizations, per hospital, was consistently significantly lower at GHs than at FCHs (all P values <0.001). Similar results for surgical and mental health hospitalizations are shown as Supporting Figures 1 and 2 in the online version of this article. In our sensitivity analyses that included all hospitals classified as GH and FCH, all results were essentially unchanged.
Recognizing the wide range of pediatric volumes at GHs (Table 1) and our inability to differentiate children's hospitals nested within GHs from GHs with pediatric beds, we examined differences in patient and hospitalization characteristics at GHs with volumes 5838 hospitalizations (the 25th percentile for FCH volume) and GHs with pediatric volumes <5838/year (see Supporting Table 2 in the online version of this article). We also compared patient and hospitalization characteristics at FCHs and the higher‐volume GHs. A total of 36 GHs had pediatric volumes 5838, with hospitalizations at these sites together accounting for 15.4% of all pediatric hospitalizations. Characteristics of patients hospitalized at these higher‐volume GHs were similar to patients hospitalized at FCHs, but they had significantly lower disease severity, fewer neonatal hospitalizations, shorter LOS, and more high‐turnover hospitalizations than patients hospitalized at FCHs. We also observed several differences between children hospitalized at higher‐ and lower‐volume GHs (see Supporting Table 2 in the online version of this article). Children hospitalized at the lower‐volume GHs were more likely to have public health insurance and less likely to have complex chronic diseases, although overall, 39.0% of all hospitalizations for children with complex chronic diseases occurred at these lower‐volume GHs. Compared to children hospitalized at higher‐volume GHs, children hospitalized at the lower‐volume hospitals had significantly lower disease severity, shorter LOS, more direct admissions, and a greater proportion of routine discharges.
DISCUSSION
Of the 2 million pediatric hospitalizations in the United States in 2012, more than 70% occurred at GHs. We observed considerable heterogeneity in pediatric volumes across GHs, with 11% of pediatric hospitalizations occurring at hospitals with pediatric volumes of <375 hospitalizations annually, whereas 15% of pediatric hospitalizations occurred at GHs with volumes similar to those observed at FCHs. The remaining pediatric hospitalizations at GHs occurred at centers with intermediate volumes. The most common reasons for hospitalization were similar at GHs and FCHs, but the most costly conditions differed substantially. These findings have important implications for pediatric clinical care programs, research, and QI efforts.
Our finding that more than 70% of pediatric hospitalizations occurred at GHs speaks to the importance of quality measurement at these hospitals, whereas low per‐hospital pediatric volumes at the majority of GHs makes such measurement particularly challenging. Several previous studies have illustrated that volumes of pediatric hospitalizations are too small to detect meaningful differences in quality between hospitals using established condition‐specific metrics.[13, 14, 15] Our finding that more than 10% of pediatric hospitalizations occurred at GHs with pediatric volumes <375 year supports previous research suggesting that cross‐cutting, all‐condition quality metrics, composite measures, and/or multihospital reporting networks may be needed to enable quality measurement at these sites. In addition, the heterogeneity in patient volumes and characteristics across GHs raise questions about the applicability of quality metrics developed and validated at FCHs to the many GH settings. Field‐testing quality measures to ensure their validity at diverse GHs, particularly those with patient volumes and infrastructure different from FCHs, will be important to meaningful pediatric quality measurement.
Our results illustrating differences in the most common and costly conditions at GHs and FCHs have further implications for prioritization and implementation of research and QI efforts. Implementation research and QI efforts focused on cardiac and neurosurgical procedures, as well as neonatal intensive care, may have considerable impact on cost and quality at FCHs. At GHs, research and QI efforts focused on common conditions are needed to increase our knowledge of contextually relevant barriers to and facilitators of high‐quality pediatric care. This, however, can be made more difficult by small sample sizes, limited resources, and infrastructure, and competing priorities in adult‐focused GH settings.[16, 17, 18] Multihospital learning collaboratives and partnerships between FCHs and GHs can begin to address these challenges, but their success is contingent upon national advocacy and funding to support pediatric research and quality measures at GHs.
One of the most notable differences in the characteristics of pediatric hospitalizations at GHs and FCHs was the proportion of hospitalizations attributable to children with medical complexity (CMC); more than one‐third of hospitalizations at FCHs were for CMC compared to 1 in 5 at GHs. These findings align with the results of several previous studies describing the substantial resource utilization attributed to CMC, and with growing research, innovation, and quality metrics focused on improving both inpatient and outpatient care for these vulnerable children.[19, 20, 21, 22] Structured complex care programs, developed to improve care coordination and healthcare quality for CMC, are common at FCHs, and have been associated with decreased resource utilization and improved outcomes.[23, 24, 25] Notably, however, more than half of all hospitalizations for CMC, exceeding 250,000 annually, occurred at GHs, and almost 40% of hospitalizations for CMC occurred at the lower‐volume GHs. These findings speak to the importance of translating effective and innovative programs of care for CMC to GHs as resources allow, accompanied by robust evaluations of their effectiveness. Lower patient volume at most GHs, however, may be a barrier to dedicated CMC programs. As a result, decentralized community‐based programs of care for CMC, linking primary care programs with regional and tertiary care hospitals, warrant further consideration.[26, 27, 28]
This analysis should be interpreted in light of several limitations. First, we were unable to distinguish between GHs with scant pediatric‐specific resources from those with a large volume of dedicated pediatric resources, such as children's hospitals nested within GHs. We did identify 36 GHs with pediatric volumes similar to those observed at FCHs (see Supporting Table 2 in the online version of this article); patient and hospitalization characteristics at these higher‐volume GHs were similar in many ways to children hospitalized at FCHs. Several of these higher‐volume GHs may have considerable resources dedicated to the care of children, including subspecialty care, and may represent children's hospitals nested within GHs. Because nested children's hospitals are included in the GH categorization, our results may have underestimated the proportion of children cared for at children's hospitals. Further work is needed to identify the health systems challenges and opportunities that may be unique to these institutions. Second, because the 2012 KID does not include a specialty hospital indicator, we developed a proxy method for identifying these hospitals, which may have resulted in some misclassification. We are reassured that the results of our analyses did not change substantively when we included all hospitals. Similarly, although we are reassured that the number of hospitals classified in our analysis as acute care FCHs aligns, approximately, with the number of hospitals classified as such by the Children's Hospital Association, we were unable to assess the validity of this variable within the KID. Third, the KID does not link records at the patient level, so we are unable to report the number of unique children included in this analysis. In addition, the KID includes only inpatient stays with exclusion of observation status stays; potential differences between GH and FCH in the use of observation status could have biased our findings. Fifth, we used the PMCA to identify CMC; although this algorithm has been shown to have excellent sensitivity in identifying children with chronic diseases, using up to 3 years of Medicaid claims data, the sensitivity using the KID, where only 1 inpatient stay is available for assessment, is unknown.[8, 29] Similarly, use of Keren's pediatric diagnosis grouper to classify reasons for hospitalization may have resulted in misclassification, though there are few other nonproprietary pediatric‐specific diagnostic groupers available.
In 2012, more than 70% of pediatric hospitalizations occurred at GHs in the United States. The considerably higher pediatric volumes at FCHs makes these institutions well suited for research, innovation, and the development and application of disease‐specific QI initiatives. Recognizing that the majority of pediatric hospitalizations occurred at GHs, there is a clear need for implementation research, program development, and quality metrics that align with the characteristics of hospitalizations at these centers. National support for research and quality improvement that reflects the diverse hospital settings where children receive their hospital care is critical to further our nation's goal of improving hospital quality for children.
Disclosures
Dr. Leyenaar was supported by grant number K08HS024133 from the Agency for Healthcare Research and Quality. The content is solely the responsibility of the authors and does not necessarily represent the official views of the Agency for Healthcare Research and Quality. The authors have no conflicts of interest relevant to this article to disclose.
- , , , . Mirror, Mirror on the wall: how the performance of the US health care system compares internationally. The Commonwealth Fund. Available at: http://www.commonwealthfund.org/publications/fund‐reports/2014/jun/mirror‐mirror. Published June 16, 2014. Accessed August 26, 2015.
- , , , , , . Higher cost, but poorer outcomes: the US health disadvantage and implications for pediatrics. Pediatrics. 2015;135(6):961–964.
- , , , , . US health spending trends by age and gender: selected years 2002–10. Health Aff (Millwood). 2014;33(5):815–822.
- , , . Costs for hospital stays in the United States, 2012. Healthcare Cost and Utilization Project 181. Available at: http://www.hcup‐us.ahrq.gov/reports/statbriefs/sb181‐Hospital‐Costs‐United‐States‐2012.pdf. Published October 2014. Accessed September 2015.
- , , , et al. All Patient Refined Diagnosis Related Groups: Methodology Overview. 3M Health Information Systems. Available at: https://www.hcup‐us.ahrq.gov/db/nation/nis/APR‐DRGsV20MethodologyOverviewandBibliography.pdf. Accessed February 8, 2016.
- Agency for Healthcare Research and Quality. Healthcare Cost and Utilization Project. Introduction to the HCUP Kids' Inpatient Database (KID) 2012. Available at: https://www.hcup‐us.ahrq.gov/db/nation/kid/kid_2012_introduction.jsp. Published Issued July 2014. Accessed February 8, 2016.
- . Prioritization of comparative effectiveness research topics in hospital pediatrics. Arch Pediatr Adolesc Med. 2012;166(12):1155.
- , , , et al. Pediatric medical complexity algorithm: a new method to stratify children by medical complexity. Pediatrics. 2014;133(6):e1647–e1654.
- , , , et al. 3M APR DRG Classification System. 3M Health Information Systems. Available at: http://www.hcup‐us.ahrq.gov/db/nation/nis/v261_aprdrg_meth_ovrview.pdf. Accessed August 7, 2015.
- , , , , , . Trends in high‐turnover stays among children hospitalized in the United States, 1993–2003. Pediatrics. 2009;123(3):996–1002.
- , , , . High turnover stays for pediatric asthma in the United States. Med Care. 2010;48(9):827–833.
- , , , , . Variation and outcomes associated with direct admission among children with pneumonia in the United States. JAMA Pediatr. 2014;168(9):829–836.
- , , , et al. Recognizing differences in hospital quality performance for pediatric inpatient care. Pediatrics. 2015;136(2):251–262.
- , , . Small numbers limit the use of the inpatient pediatric quality indicators for hospital comparison. Acad Pediatr. 2010;10(4):266–273.
- , , , et al. Statistical uncertainty of mortality rates and rankings for children's hospitals. Pediatrics. 2011;128(4):e966–e972.
- , , , , . Determinants of career satisfaction among pediatric hospitalists: a qualitative exploration. Acad Pediatr. 2014;14(4):361–368.
- , , , et al. Quality improvement research in pediatric hospital medicine and the role of the Pediatric Research in Inpatient Settings (PRIS) network. Acad Pediatr. 2013;13(6 suppl):S54–S60.
- . Roles for children's hospitals in pediatric collaborative improvement networks. Pediatrics. 2013;131(suppl 4):S215–S218.
- , , , et al. Children with medical complexity: an emerging population for clinical and research initiatives. Pediatrics. 2011;127(3):529–538.
- , , , et al. Children with complex chronic conditions in inpatient hospital settings in the United States. Pediatrics. 2010;126(4):647–655.
- , , , , , . Patterns and costs of health care use of children with medical complexity. Pediatrics. 2012;130(6):e1463–e1470.
- , , , , , . Hospital utilization and characteristics of patients experiencing recurrent readmissions within children's hospitals. JAMA. 2011;305(7):682–690.
- , , , et al. Characteristics of hospitalizations for patients who use a structured clinical care program for children with medical complexity. J Pediatr. 2011;159(2):284–290.
- , , , . Hospital‐based comprehensive care programs for children with special health care needs: a systematic review. Arch Pediatr Adolesc Med. 2011;165(6):554–561.
- , , , , , . A tertiary care–primary care partnership model for medically complex and fragile children and youth with special health care needs. Arch Pediatr Adolesc Med. 2007;161(10):937–944.
- , , , et al. Integrated complex care coordination for children with medical complexity: a mixed‐methods evaluation of tertiary care‐community collaboration. BMC Health Serv Res. 2012;12:366.
- , , , . Medical transport of children with complex chronic conditions. Emerg Med Int. 2012;2012:837020.
- , , . Comanagement of medically complex children by subspecialists, generalists, and care coordinators. Pediatrics. 2014;134(2):203–205.
- , , , , . Ways to identify children with medical complexity and the importance of why. J Pediatr. 2015;167(2):229–237.