User login
Hospital-level factors associated with pediatric emergency department return visits
Return visit (RV) rate is a quality measure commonly used in the emergency department (ED) setting. This metric may represent suboptimal care at the index ED visit.1-5 Although patient- and visit-level factors affecting ED RVs have been evaluated,1,3,4,6-9 hospital-level factors and factors of a hospital’s patient population that may play roles in ED RV rates have not been examined. Identifying the factors associated with increased RVs may allow resources to be designated to areas that improve emergent care for children.10
Hospital readmission rates are a closely followed quality measure and are linked to reimbursement by the federal government, but a recent study found the influence a hospital can have on this marker may be mitigated by the impact of the social determinates of health (SDHs) of the hospital’s patient population.11 That study and others have prompted an ongoing debate about adjusting quality measures for SDHs.12,13 A clearer understanding of these interactions may permit us to focus on factors that can truly lead to improvement in care instead of penalizing practitioners or hospitals that provide care to those most in need.
Prior work has identified several SDHs associated with higher ED RV rates in patient- or visit-level analyses.3,11,14 We conducted a study of hospital-level characteristics and characteristics of a hospital’s patient population to identify potentially mutable factors associated with increased ED RV rates that, once recognized, may allow for improvement in this quality measure.
PATIENTS AND METHODS
This study was not considered human subjects research in accordance with Common Rule 45 CFR§46.104(f) and was evaluated by the Ann and Robert H. Lurie Children’s Hospital and Northwestern University Feinberg School of Medicine Institutional Review Boards and deemed exempt from review.
Study Population and Protocol
Our study had 2 data sources (to be described in detail): the Pediatric Health Information System (PHIS) and a survey of ED medical directors of the hospitals represented within PHIS. Hospitals were eligible for inclusion in the study if their data (1) met PHIS quality control standards for ED patient visits as determined by internal data assurance processes incorporated in PHIS,3,14,15 (2) included data only from an identifiable single main ED, and (3) completed the ED medical director’s survey.
PHIS Database
PHIS, an administrative database managed by Truven Health Analytics, includes data from ED, ambulatory surgery, observation, and inpatient encounters across Children’s Hospital Association member children’s hospitals in North America. Data are subjected to validity checks before being included in the database.16 PHIS assigns unique patient identifiers to track individual patient visits within participating institutions over time.
Hospitals were described by percentages of ED patients in several groups: age (<1, 1-4, 5-9, 10-14, and 15-18 years)17; sex; race/ethnicity; insurance type (commercial, government, other); ED International Classification of Diseases, Ninth Edition (ICD-9) diagnosis code–based severity classification system score (1-2, low severity; 3-5, high severity)18; complex
ED Medical Director Survey
A web-based survey was constructed in an iterative process based on literature review and expert opinion to assess hospital-level factors that may impact ED RV rates.3,7,24-26 The survey was piloted at 3 institutions to refine its structure and content.
The survey included 15 close-ended or multiple-choice questions on ED environment and operations and 2 open-ended questions, “What is the largest barrier to reducing the number of return visits within 72 hours of discharge from a previous ED visit?” and “In your opinion, what is the best way of reducing the number of the return visits within 72 hours of previous ED visit ?” (questionnaire in Supplemental material). Hospital characteristics from the survey included total clinical time allotment, or full-time equivalent (FTE), among all physicians, pediatric emergency medicine (PEM) fellowship-trained physicians, and all other (non-PEM) physicians. The data were standardized across sites by calculating FTE-per-10,000-visits values for each hospital; median duration of ED visit for admitted and discharged patients; median time from arrival to ED physician evaluation; rate of leaving without being seen; discharge educational material authorship and age specificity; follow-up visit scheduling procedure; and percentage of ED patients for whom English was a second language.
Responses to the 2 open-ended questions were independently categorized by Drs. Pittsenbarger and Alpern. Responses could be placed in more than 1 category if multiple answers to the question were included in the response. Categorizations were compared for consistency, and any inconsistencies were resolved by the consensus of the study investigators.
Outcome Measures From PHIS Database
All ED visits within a 12-month period (July 1, 2013–June 30, 2014) by patients younger than 18 years at time of index ED visit were eligible for inclusion in the study. An index visit was defined as any ED visit without another ED visit within the preceding 72 hours. The 72-hour time frame was used because it is the most widely studied time frame for ED RVs.5 Index ED visits that led to admission, observation status, death, or transfer were excluded.
The 2 primary outcomes of interest were (1) RVs within 72 hours of index ED visit discharge and (2) RVs within 72 hours that resulted in hospital admission or observation status at the next ED visit (RVA).7,9,27-30 For patients with multiple ED revisits within 72 hours, only the first was assessed. There was a 72-hour minimum between index visits for the same patient.
Statistical Analyses
To determine hospital groups based on RV and RVA rates, we adjusted RV and RVA rates using generalized linear mixed-effects models, controlling for clustering and allowing for correlated data (within hospitals), nonconstant variability (across hospitals), and non-normally distributed data, as we did in a study of patient-level factors associated with ED RV and RVA.3 For each calculated rate (RV, RVA), the hospitals were then classified into 3 groups based on whether the hospital’s adjusted RV and RVA rates were outside 2 SDs from the mean, below the 5th or above the 95th percentile, or within that range. These groups were labeled lowest outliers, highest outliers, and average-performing hospitals.
After the groups of hospitals were determined, we returned to using unadjusted data to statistically analyze them. We summarized continuous variables using minimum and maximum values, medians, and interquartile ranges (IQRs). We present categorical variables using counts and percentages. To identify hospital characteristics with the most potential to gain from improvement, we also analyzed associations using 2 collapsed groups: hospitals with RV (or RVA) rates included in the average-performing and lowest outlier groups and hospitals within the highest outlier group. Hospital characteristics and hospital’s patient population characteristics from the surveys are summarized based on RV and RVA rate groups. Differences in distributions among continuous variables were assessed by Kruskal-Wallis 1-way analysis of variance. Chi-square tests were used to evaluate differences in proportions among categorical variables. All statistical analyses were performed with SAS Version 9.4 (SAS Institute); 2-sided P < 0.05 was considered statistically significant.
RESULTS
Return Visit Rates and Hospital ED Site Population Characteristics
Twenty-four of 35 (68%) eligible hospitals that met PHIS quality control standards for ED patient visits responded to the ED medical director survey. The included hospitals that both met quality control standards and completed the survey had a total of 1,456,377 patient visits during the study period. Individual sites had annual volumes ranging from 26,627 to 96,637 ED encounters. The mean RV rate across the institutions was 3.7% (range, 3.0%-4.8%), and the mean RVA rate across the hospitals was 0.7% (range, 0.5%-1.1%) (Figure).

There were 5 hospitals with RV rates less than 2 SDs of the mean rate, placing them in the lowest outlier group for RV; 13 hospitals with RV rates within 2 SDs of the mean RV rate, placing them in the average-performing group; and 6 hospitals with RV rates above 2 SDs of the mean, placing them in the highest outlier group. Table 1 lists the hospital ED site population characteristics among the 3 RV rate groups. Hospitals in the highest outlier group served populations with higher proportions of patients with insurance from a government payer, lower proportions of patients covered by a commercial insurance plan, and higher proportion of patients with lower median household incomes.

In the RVA analysis, there were 6 hospitals with RVA rates less than 2 SDs of the mean RVA rate (lowest outliers); 14 hospitals with RVA rates within 2 SDs of the mean RVA rate (average performers); and 4 hospitals with RVA rates above 2 SDs of the mean RVA rate (highest outliers). When using these groups based on RVA rate, there were no statistically significant differences in hospital ED site population characteristics (Supplemental Table 1).
RV Rates and Hospital-Level Factors Survey Characteristics
Table 2 lists the ED medical director survey hospital-level data among the 3 RV rate groups. There were fewer FTEs by PEM fellowship-trained physicians per 10,000 patient visits at sites with higher RV rates (Table 2). Hospital-level characteristics assessed by the survey were not associated with RVA rates (Supplemental Table 2).
 and Return Visit Rates")
Evaluating characteristics of hospitals with the most potential to gain from improvement, hospitals with the highest RV rates (highest outlier group), compared with hospitals in the lowest outlier and average-performing groups collapsed together, persisted in having fewer PEM fellowship-trained physician FTEs per patient visit (Table 3). A similar collapsed analysis of RVA rates demonstrated that hospitals in the highest outlier group had longer-wait-to-physician time (81 minutes; IQR, 51-105 minutes) compared with hospitals in the other 2 groups (30 minutes; IQR, 19-42.5 minutes) (Table 3).
In response to the first qualitative question on the ED medial director survey, “In your opinion, what is the largest barrier to reducing the number of return visits within 72 hours of discharge from a previous ED visit?”, 15 directors (62.5%) reported limited access to primary care, 4 (16.6%) reported inadequate discharge instructions and/or education provided, and 3 (12.5%) reported lack of access to specialist care. To the second question, “In your opinion, what is the best way of reducing the number of the return visits within 72 hours of previous ED visit for the same condition?”, they responded that RVs could be reduced by innovations in scheduling primary care or specialty follow-up visits (19, 79%), improving discharge education and instructions (6, 25%), and identifying more case management or care coordination (4, 16.6%).
DISCUSSION
Other studies have identified patient- and visit-level characteristics associated with higher ED RV and RVA rates.3,8,9,31 However, as our goal was to identify possible modifiable institutional features, our study examined factors at hospital and population-served levels (instead of patient or visit level) that may impact ED RV and RVA rates. Interestingly, our sample of tertiary-care pediatric center EDs provided evidence of variability in RV and RVA rates. We identified factors associated with RV rates related to the SDHs of the populations served by the ED, which suggests these factors are not modifiable at an institution level. In addition, we found that the increased availability of PEM providers per patient visit correlated with fewer ED RVs.
Hospitals serving ED populations with more government-insured and fewer commercially insured patients had higher rates of return to the ED. Similarly, hospitals with larger proportions of patients from areas with lower median household incomes had higher RV rates. These factors may indicate that patients with limited resources may have more frequent ED RVs,3,6,32,33 and hospitals that serve them have higher ED RV rates. Our findings complement those of a recent study by Sills et al.,11 who evaluated hospital readmissions and proposed risk adjustment for performance reimbursement. This study found that hospital population-level race, ethnicity, insurance status, and household income were predictors of hospital readmission after discharge.
Of note, our data did not identify similar site-level attributes related to the population served that correlated with RVA rates. We postulate that the need for admission on RV may indicate an inherent clinical urgency or medical need associated with the return to the ED, whereas RV without admission may be related more to patient- or population-level sociodemographic factors than to quality of care and clinical course, which influence ED utilization.1,3,30 EDs treating higher proportions of patients of minority race or ethnicity, those with fewer financial resources, and those in more need of government health insurance are at higher risk for ED revisits.
We observed that increased PEM fellowship-trained physician staffing was associated with decreased RV rates. The availability of specialty-trained physicians in PEM may allow a larger proportion of patients treated by physicians with honed clinical skills for the patient population. Data from a single pediatric center showed PEM fellowship-trained physicians had admission rates lower than those of their counterparts without subspecialty fellowship training.34 The lower RV rate for this group in our study is especially interesting in light of previously reported lower admission rates at index visit in PEM trained physicians. With lower index admission rates, it may have been assumed that visits associated with PEM trained physician care would have an increased (rather than decreased) chance of RV. In addition, we noted the increased RVA rates were associated with longer waits to see a physician. These measures may indicate the effect of institutional access to robust resources (the ability to hire and support more specialty-trained physicians). These novel findings warrant further evaluation, particularly as our sample included only pediatric centers.
Our survey data demonstrated the impact that access to care has on ED RV rates. The ED medical directors indicated that limited access to outpatient appointments with PCPs and specialists was an important factor increasing ED RVs and a potential avenue for interventions. As the 2 open-ended questions addressed barriers and potential solutions, it is interesting that the respondents cited access to care and discharge instructions as the largest barriers and identified innovations in access to care and discharge education as important potential remedies.
This study demonstrated that, at the hospital level, ED RV quality measures are influenced by complex and varied SDHs that primarily reflect the characteristics of the patient populations served. Prior work has similarly highlighted the importance of gaining a rigorous understanding of other quality measures before widespread use, reporting, and dissemination of results.11,35-38 With this in mind, as quality measures are developed and implemented, care should be taken to ensure they accurately and appropriately reflect the quality of care provided to the patient and are not more representative of other factors not directly within institutional control. These findings call into question the usefulness of ED RVs as a quality measure for comparing institutions.
Study Limitations
This study had several limitations. The PHIS dataset tracks only patients within each institution and does not include RVs to other EDs, which may account for a proportion of RVs.39 Our survey response rate was 68% among medical directors, excluding 11 hospitals from analysis, which decreased the study’s power to detect differences that may be present between groups. In addition, the generalizability of our findings may be limited to tertiary-care children’s hospitals, as the PHIS dataset included only these types of healthcare facilities. We also included data only from the sites’ main EDs, and therefore cannot know if our results are applicable to satellite EDs. ED staffing of PEM physicians was analyzed using FTEs. However, number of clinical hours in 1 FTE may vary among sites, leading to imprecision in this hospital characteristic.
CONCLUSION
Hospitals with the highest RV rates served populations with a larger proportion of patients with government insurance and lower household income, and these hospitals had fewer PEM trained physicians. Variation in RV rates among hospitals may be indicative of the SDHs of their unique patient populations. ED revisit rates should be used cautiously in determining the quality of care of hospitals providing care to differing populations.
Disclosure
Nothing to report.
1. Goldman RD, Kapoor A, Mehta S. Children admitted to the hospital after returning to the emergency department within 72 hours. Pediatr Emerg Care. 2011;27(9):808-811. PubMed
2. Cho CS, Shapiro DJ, Cabana MD, Maselli JH, Hersh AL. A national depiction of children with return visits to the emergency department within 72 hours, 2001–2007. Pediatr Emerg Care. 2012;28(7):606-610. PubMed
3. Akenroye AT, Thurm CW, Neuman MI, et al. Prevalence and predictors of return visits to pediatric emergency departments. J Hosp Med. 2014;9(12):779-787. PubMed
4. Gallagher RA, Porter S, Monuteaux MC, Stack AM. Unscheduled return visits to the emergency department: the impact of language. Pediatr Emerg Care. 2013;29(5):579-583. PubMed
5. Sørup CM, Jacobsen P, Forberg JL. Evaluation of emergency department performance—a systematic review on recommended performance and quality-in-care measures. Scand J Trauma Resusc Emerg Med. 2013;21:62. PubMed
6. Gabayan GZ, Asch SM, Hsia RY, et al. Factors associated with short-term bounce-back admissions after emergency department discharge. Ann Emerg Med. 2013;62(2):136-144.e1. PubMed
7. Ali AB, Place R, Howell J, Malubay SM. Early pediatric emergency department return visits: a prospective patient-centric assessment. Clin Pediatr (Phila). 2012;51(7):651-658. PubMed
8. Alessandrini EA, Lavelle JM, Grenfell SM, Jacobstein CR, Shaw KN. Return visits to a pediatric emergency department. Pediatr Emerg Care. 2004;20(3):166-171. PubMed
9. Goldman RD, Ong M, Macpherson A. Unscheduled return visits to the pediatric emergency department—one-year experience. Pediatr Emerg Care. 2006;22(8):545-549. PubMed
10. Berry JG, Toomey SL, Zaslavsky AM, et al. Pediatric readmission prevalence and variability across hospitals. JAMA. 2013;309(4):372-380. PubMed
11. Sills MR, Hall M, Colvin JD, et al. Association of social determinants with children’s hospitals’ preventable readmissions performance. JAMA Pediatr. 2016;170(4):350-358. PubMed
12. Fiscella K, Burstin HR, Nerenz DR. Quality measures and sociodemographic risk factors: to adjust or not to adjust. JAMA. 2014;312(24):2615-2616. PubMed
13. Lipstein SH, Dunagan WC. The risks of not adjusting performance measures for sociodemographic factors. Ann Intern Med. 2014;161(8):594-596. PubMed
14. Berry JG, Hall DE, Kuo DZ, et al. Hospital utilization and characteristics of patients experiencing recurrent readmissions within children’s hospitals. JAMA. 2011;305(7):682-690. PubMed
15. Bourgeois FT, Monuteaux MC, Stack AM, Neuman MI. Variation in emergency department admission rates in US children’s hospitals. Pediatrics. 2014;134(3):539-545. PubMed
16. Fletcher DM. Achieving data quality. How data from a pediatric health information system earns the trust of its users. J AHIMA. 2004;75(10):22-26. PubMed
17. US Census Bureau. US Census current estimates data. 2014. https://www.census.gov/programs-surveys/popest/data/data-sets.2014.html. Accessed June 2015.
18. Alessandrini EA, Alpern ER, Chamberlain JM, Shea JA, Gorelick MH. A new diagnosis grouping system for child emergency department visits. Acad Emerg Med. 2010;17(2):204-213. PubMed
19. Feudtner C, Levin JE, Srivastava R, et al. How well can hospital readmission be predicted in a cohort of hospitalized children? A retrospective, multicenter study. Pediatrics. 2009;123(1):286-293. PubMed
20. Feinstein JA, Feudtner C, Kempe A. Adverse drug event–related emergency department visits associated with complex chronic conditions. Pediatrics. 2014;133(6):e1575-e1585. PubMed
21. Simon TD, Berry J, Feudtner C, et al. Children with complex chronic conditions in inpatient hospital settings in the United States. Pediatrics. 2010;126(4):647-655. PubMed
22. Dartmouth Medical School, Center for Evaluative Clinical Sciences. The Dartmouth Atlas of Health Care. Chicago, IL: American Hospital Publishing; 2015.
23. Kansagara D, Englander H, Salanitro A, et al. Risk prediction models for hospital readmission: a systematic review. JAMA. 2011;306(15):1688-1698. PubMed
24. Lawrence LM, Jenkins CA, Zhou C, Givens TG. The effect of diagnosis-specific computerized discharge instructions on 72-hour return visits to the pediatric emergency department. Pediatr Emerg Care. 2009;25(11):733-738. PubMed
25. National Quality Forum. National Quality Forum issue brief: strengthening pediatric quality measurement and reporting. J Healthc Qual. 2008;30(3):51-55. PubMed
26. Rising KL, Victor TW, Hollander JE, Carr BG. Patient returns to the emergency department: the time-to-return curve. Acad Emerg Med. 2014;21(8):864-871. PubMed
27. Cho CS, Shapiro DJ, Cabana MD, Maselli JH, Hersh AL. A national depiction of children with return visits to the emergency department within 72 hours, 2001–2007. Pediatr Emerg Care. 2012;28(7):606-610. PubMed
28. Adekoya N. Patients seen in emergency departments who had a prior visit within the previous 72 h—National Hospital Ambulatory Medical Care Survey, 2002. Public Health. 2005;119(10):914-918. PubMed
29. Mittal MK, Zorc JJ, Garcia-Espana JF, Shaw KN. An assessment of clinical performance measures for pediatric emergency physicians. Am J Med Qual. 2013;28(1):33-39. PubMed
30. Depiero AD, Ochsenschlager DW, Chamberlain JM. Analysis of pediatric hospitalizations after emergency department release as a quality improvement tool. Ann Emerg Med. 2002;39(2):159-163. PubMed
31. Sung SF, Liu KE, Chen SC, Lo CL, Lin KC, Hu YH. Predicting factors and risk stratification for return visits to the emergency department within 72 hours in pediatric patients. Pediatr Emerg Care. 2015;31(12):819-824. PubMed
32. Jacobstein CR, Alessandrini EA, Lavelle JM, Shaw KN. Unscheduled revisits to a pediatric emergency department: risk factors for children with fever or infection-related complaints. Pediatr Emerg Care. 2005;21(12):816-821. PubMed
33. Barnett ML, Hsu J, McWilliams J. Patient characteristics and differences in hospital readmission rates. JAMA Intern Med. 2015;175(11):1803-1812. PubMed
34. Gaucher N, Bailey B, Gravel J. Impact of physicians’ characteristics on the admission risk among children visiting a pediatric emergency department. Pediatr Emerg Care. 2012;28(2):120-124. PubMed
35. McHugh M, Neimeyer J, Powell E, Khare RK, Adams JG. An early look at performance on the emergency care measures included in Medicare’s hospital inpatient Value-Based Purchasing Program. Ann Emerg Med. 2013;61(6):616-623.e2. PubMed
36. Axon RN, Williams MV. Hospital readmission as an accountability measure. JAMA. 2011;305(5):504-505. PubMed
37. Adams JG. Ensuring the quality of quality metrics for emergency care. JAMA. 2016;315(7):659-660. PubMed
38. Payne NR, Flood A. Preventing pediatric readmissions: which ones and how? J Pediatr. 2015;166(3):519-520. PubMed
39. Khan A, Nakamura MM, Zaslavsky AM, et al. Same-hospital readmission rates as a measure of pediatric quality of care. JAMA Pediatr. 2015;169(10):905-912. PubMed
Return visit (RV) rate is a quality measure commonly used in the emergency department (ED) setting. This metric may represent suboptimal care at the index ED visit.1-5 Although patient- and visit-level factors affecting ED RVs have been evaluated,1,3,4,6-9 hospital-level factors and factors of a hospital’s patient population that may play roles in ED RV rates have not been examined. Identifying the factors associated with increased RVs may allow resources to be designated to areas that improve emergent care for children.10
Hospital readmission rates are a closely followed quality measure and are linked to reimbursement by the federal government, but a recent study found the influence a hospital can have on this marker may be mitigated by the impact of the social determinates of health (SDHs) of the hospital’s patient population.11 That study and others have prompted an ongoing debate about adjusting quality measures for SDHs.12,13 A clearer understanding of these interactions may permit us to focus on factors that can truly lead to improvement in care instead of penalizing practitioners or hospitals that provide care to those most in need.
Prior work has identified several SDHs associated with higher ED RV rates in patient- or visit-level analyses.3,11,14 We conducted a study of hospital-level characteristics and characteristics of a hospital’s patient population to identify potentially mutable factors associated with increased ED RV rates that, once recognized, may allow for improvement in this quality measure.
PATIENTS AND METHODS
This study was not considered human subjects research in accordance with Common Rule 45 CFR§46.104(f) and was evaluated by the Ann and Robert H. Lurie Children’s Hospital and Northwestern University Feinberg School of Medicine Institutional Review Boards and deemed exempt from review.
Study Population and Protocol
Our study had 2 data sources (to be described in detail): the Pediatric Health Information System (PHIS) and a survey of ED medical directors of the hospitals represented within PHIS. Hospitals were eligible for inclusion in the study if their data (1) met PHIS quality control standards for ED patient visits as determined by internal data assurance processes incorporated in PHIS,3,14,15 (2) included data only from an identifiable single main ED, and (3) completed the ED medical director’s survey.
PHIS Database
PHIS, an administrative database managed by Truven Health Analytics, includes data from ED, ambulatory surgery, observation, and inpatient encounters across Children’s Hospital Association member children’s hospitals in North America. Data are subjected to validity checks before being included in the database.16 PHIS assigns unique patient identifiers to track individual patient visits within participating institutions over time.
Hospitals were described by percentages of ED patients in several groups: age (<1, 1-4, 5-9, 10-14, and 15-18 years)17; sex; race/ethnicity; insurance type (commercial, government, other); ED International Classification of Diseases, Ninth Edition (ICD-9) diagnosis code–based severity classification system score (1-2, low severity; 3-5, high severity)18; complex
ED Medical Director Survey
A web-based survey was constructed in an iterative process based on literature review and expert opinion to assess hospital-level factors that may impact ED RV rates.3,7,24-26 The survey was piloted at 3 institutions to refine its structure and content.
The survey included 15 close-ended or multiple-choice questions on ED environment and operations and 2 open-ended questions, “What is the largest barrier to reducing the number of return visits within 72 hours of discharge from a previous ED visit?” and “In your opinion, what is the best way of reducing the number of the return visits within 72 hours of previous ED visit ?” (questionnaire in Supplemental material). Hospital characteristics from the survey included total clinical time allotment, or full-time equivalent (FTE), among all physicians, pediatric emergency medicine (PEM) fellowship-trained physicians, and all other (non-PEM) physicians. The data were standardized across sites by calculating FTE-per-10,000-visits values for each hospital; median duration of ED visit for admitted and discharged patients; median time from arrival to ED physician evaluation; rate of leaving without being seen; discharge educational material authorship and age specificity; follow-up visit scheduling procedure; and percentage of ED patients for whom English was a second language.
Responses to the 2 open-ended questions were independently categorized by Drs. Pittsenbarger and Alpern. Responses could be placed in more than 1 category if multiple answers to the question were included in the response. Categorizations were compared for consistency, and any inconsistencies were resolved by the consensus of the study investigators.
Outcome Measures From PHIS Database
All ED visits within a 12-month period (July 1, 2013–June 30, 2014) by patients younger than 18 years at time of index ED visit were eligible for inclusion in the study. An index visit was defined as any ED visit without another ED visit within the preceding 72 hours. The 72-hour time frame was used because it is the most widely studied time frame for ED RVs.5 Index ED visits that led to admission, observation status, death, or transfer were excluded.
The 2 primary outcomes of interest were (1) RVs within 72 hours of index ED visit discharge and (2) RVs within 72 hours that resulted in hospital admission or observation status at the next ED visit (RVA).7,9,27-30 For patients with multiple ED revisits within 72 hours, only the first was assessed. There was a 72-hour minimum between index visits for the same patient.
Statistical Analyses
To determine hospital groups based on RV and RVA rates, we adjusted RV and RVA rates using generalized linear mixed-effects models, controlling for clustering and allowing for correlated data (within hospitals), nonconstant variability (across hospitals), and non-normally distributed data, as we did in a study of patient-level factors associated with ED RV and RVA.3 For each calculated rate (RV, RVA), the hospitals were then classified into 3 groups based on whether the hospital’s adjusted RV and RVA rates were outside 2 SDs from the mean, below the 5th or above the 95th percentile, or within that range. These groups were labeled lowest outliers, highest outliers, and average-performing hospitals.
After the groups of hospitals were determined, we returned to using unadjusted data to statistically analyze them. We summarized continuous variables using minimum and maximum values, medians, and interquartile ranges (IQRs). We present categorical variables using counts and percentages. To identify hospital characteristics with the most potential to gain from improvement, we also analyzed associations using 2 collapsed groups: hospitals with RV (or RVA) rates included in the average-performing and lowest outlier groups and hospitals within the highest outlier group. Hospital characteristics and hospital’s patient population characteristics from the surveys are summarized based on RV and RVA rate groups. Differences in distributions among continuous variables were assessed by Kruskal-Wallis 1-way analysis of variance. Chi-square tests were used to evaluate differences in proportions among categorical variables. All statistical analyses were performed with SAS Version 9.4 (SAS Institute); 2-sided P < 0.05 was considered statistically significant.
RESULTS
Return Visit Rates and Hospital ED Site Population Characteristics
Twenty-four of 35 (68%) eligible hospitals that met PHIS quality control standards for ED patient visits responded to the ED medical director survey. The included hospitals that both met quality control standards and completed the survey had a total of 1,456,377 patient visits during the study period. Individual sites had annual volumes ranging from 26,627 to 96,637 ED encounters. The mean RV rate across the institutions was 3.7% (range, 3.0%-4.8%), and the mean RVA rate across the hospitals was 0.7% (range, 0.5%-1.1%) (Figure).
There were 5 hospitals with RV rates less than 2 SDs of the mean rate, placing them in the lowest outlier group for RV; 13 hospitals with RV rates within 2 SDs of the mean RV rate, placing them in the average-performing group; and 6 hospitals with RV rates above 2 SDs of the mean, placing them in the highest outlier group. Table 1 lists the hospital ED site population characteristics among the 3 RV rate groups. Hospitals in the highest outlier group served populations with higher proportions of patients with insurance from a government payer, lower proportions of patients covered by a commercial insurance plan, and higher proportion of patients with lower median household incomes.
In the RVA analysis, there were 6 hospitals with RVA rates less than 2 SDs of the mean RVA rate (lowest outliers); 14 hospitals with RVA rates within 2 SDs of the mean RVA rate (average performers); and 4 hospitals with RVA rates above 2 SDs of the mean RVA rate (highest outliers). When using these groups based on RVA rate, there were no statistically significant differences in hospital ED site population characteristics (Supplemental Table 1).
RV Rates and Hospital-Level Factors Survey Characteristics
Table 2 lists the ED medical director survey hospital-level data among the 3 RV rate groups. There were fewer FTEs by PEM fellowship-trained physicians per 10,000 patient visits at sites with higher RV rates (Table 2). Hospital-level characteristics assessed by the survey were not associated with RVA rates (Supplemental Table 2).
Evaluating characteristics of hospitals with the most potential to gain from improvement, hospitals with the highest RV rates (highest outlier group), compared with hospitals in the lowest outlier and average-performing groups collapsed together, persisted in having fewer PEM fellowship-trained physician FTEs per patient visit (Table 3). A similar collapsed analysis of RVA rates demonstrated that hospitals in the highest outlier group had longer-wait-to-physician time (81 minutes; IQR, 51-105 minutes) compared with hospitals in the other 2 groups (30 minutes; IQR, 19-42.5 minutes) (Table 3).
In response to the first qualitative question on the ED medial director survey, “In your opinion, what is the largest barrier to reducing the number of return visits within 72 hours of discharge from a previous ED visit?”, 15 directors (62.5%) reported limited access to primary care, 4 (16.6%) reported inadequate discharge instructions and/or education provided, and 3 (12.5%) reported lack of access to specialist care. To the second question, “In your opinion, what is the best way of reducing the number of the return visits within 72 hours of previous ED visit for the same condition?”, they responded that RVs could be reduced by innovations in scheduling primary care or specialty follow-up visits (19, 79%), improving discharge education and instructions (6, 25%), and identifying more case management or care coordination (4, 16.6%).
DISCUSSION
Other studies have identified patient- and visit-level characteristics associated with higher ED RV and RVA rates.3,8,9,31 However, as our goal was to identify possible modifiable institutional features, our study examined factors at hospital and population-served levels (instead of patient or visit level) that may impact ED RV and RVA rates. Interestingly, our sample of tertiary-care pediatric center EDs provided evidence of variability in RV and RVA rates. We identified factors associated with RV rates related to the SDHs of the populations served by the ED, which suggests these factors are not modifiable at an institution level. In addition, we found that the increased availability of PEM providers per patient visit correlated with fewer ED RVs.
Hospitals serving ED populations with more government-insured and fewer commercially insured patients had higher rates of return to the ED. Similarly, hospitals with larger proportions of patients from areas with lower median household incomes had higher RV rates. These factors may indicate that patients with limited resources may have more frequent ED RVs,3,6,32,33 and hospitals that serve them have higher ED RV rates. Our findings complement those of a recent study by Sills et al.,11 who evaluated hospital readmissions and proposed risk adjustment for performance reimbursement. This study found that hospital population-level race, ethnicity, insurance status, and household income were predictors of hospital readmission after discharge.
Of note, our data did not identify similar site-level attributes related to the population served that correlated with RVA rates. We postulate that the need for admission on RV may indicate an inherent clinical urgency or medical need associated with the return to the ED, whereas RV without admission may be related more to patient- or population-level sociodemographic factors than to quality of care and clinical course, which influence ED utilization.1,3,30 EDs treating higher proportions of patients of minority race or ethnicity, those with fewer financial resources, and those in more need of government health insurance are at higher risk for ED revisits.
We observed that increased PEM fellowship-trained physician staffing was associated with decreased RV rates. The availability of specialty-trained physicians in PEM may allow a larger proportion of patients treated by physicians with honed clinical skills for the patient population. Data from a single pediatric center showed PEM fellowship-trained physicians had admission rates lower than those of their counterparts without subspecialty fellowship training.34 The lower RV rate for this group in our study is especially interesting in light of previously reported lower admission rates at index visit in PEM trained physicians. With lower index admission rates, it may have been assumed that visits associated with PEM trained physician care would have an increased (rather than decreased) chance of RV. In addition, we noted the increased RVA rates were associated with longer waits to see a physician. These measures may indicate the effect of institutional access to robust resources (the ability to hire and support more specialty-trained physicians). These novel findings warrant further evaluation, particularly as our sample included only pediatric centers.
Our survey data demonstrated the impact that access to care has on ED RV rates. The ED medical directors indicated that limited access to outpatient appointments with PCPs and specialists was an important factor increasing ED RVs and a potential avenue for interventions. As the 2 open-ended questions addressed barriers and potential solutions, it is interesting that the respondents cited access to care and discharge instructions as the largest barriers and identified innovations in access to care and discharge education as important potential remedies.
This study demonstrated that, at the hospital level, ED RV quality measures are influenced by complex and varied SDHs that primarily reflect the characteristics of the patient populations served. Prior work has similarly highlighted the importance of gaining a rigorous understanding of other quality measures before widespread use, reporting, and dissemination of results.11,35-38 With this in mind, as quality measures are developed and implemented, care should be taken to ensure they accurately and appropriately reflect the quality of care provided to the patient and are not more representative of other factors not directly within institutional control. These findings call into question the usefulness of ED RVs as a quality measure for comparing institutions.
Study Limitations
This study had several limitations. The PHIS dataset tracks only patients within each institution and does not include RVs to other EDs, which may account for a proportion of RVs.39 Our survey response rate was 68% among medical directors, excluding 11 hospitals from analysis, which decreased the study’s power to detect differences that may be present between groups. In addition, the generalizability of our findings may be limited to tertiary-care children’s hospitals, as the PHIS dataset included only these types of healthcare facilities. We also included data only from the sites’ main EDs, and therefore cannot know if our results are applicable to satellite EDs. ED staffing of PEM physicians was analyzed using FTEs. However, number of clinical hours in 1 FTE may vary among sites, leading to imprecision in this hospital characteristic.
CONCLUSION
Hospitals with the highest RV rates served populations with a larger proportion of patients with government insurance and lower household income, and these hospitals had fewer PEM trained physicians. Variation in RV rates among hospitals may be indicative of the SDHs of their unique patient populations. ED revisit rates should be used cautiously in determining the quality of care of hospitals providing care to differing populations.
Disclosure
Nothing to report.
1. Goldman RD, Kapoor A, Mehta S. Children admitted to the hospital after returning to the emergency department within 72 hours. Pediatr Emerg Care. 2011;27(9):808-811. PubMed
2. Cho CS, Shapiro DJ, Cabana MD, Maselli JH, Hersh AL. A national depiction of children with return visits to the emergency department within 72 hours, 2001–2007. Pediatr Emerg Care. 2012;28(7):606-610. PubMed
3. Akenroye AT, Thurm CW, Neuman MI, et al. Prevalence and predictors of return visits to pediatric emergency departments. J Hosp Med. 2014;9(12):779-787. PubMed
4. Gallagher RA, Porter S, Monuteaux MC, Stack AM. Unscheduled return visits to the emergency department: the impact of language. Pediatr Emerg Care. 2013;29(5):579-583. PubMed
5. Sørup CM, Jacobsen P, Forberg JL. Evaluation of emergency department performance—a systematic review on recommended performance and quality-in-care measures. Scand J Trauma Resusc Emerg Med. 2013;21:62. PubMed
6. Gabayan GZ, Asch SM, Hsia RY, et al. Factors associated with short-term bounce-back admissions after emergency department discharge. Ann Emerg Med. 2013;62(2):136-144.e1. PubMed
7. Ali AB, Place R, Howell J, Malubay SM. Early pediatric emergency department return visits: a prospective patient-centric assessment. Clin Pediatr (Phila). 2012;51(7):651-658. PubMed
8. Alessandrini EA, Lavelle JM, Grenfell SM, Jacobstein CR, Shaw KN. Return visits to a pediatric emergency department. Pediatr Emerg Care. 2004;20(3):166-171. PubMed
9. Goldman RD, Ong M, Macpherson A. Unscheduled return visits to the pediatric emergency department—one-year experience. Pediatr Emerg Care. 2006;22(8):545-549. PubMed
10. Berry JG, Toomey SL, Zaslavsky AM, et al. Pediatric readmission prevalence and variability across hospitals. JAMA. 2013;309(4):372-380. PubMed
11. Sills MR, Hall M, Colvin JD, et al. Association of social determinants with children’s hospitals’ preventable readmissions performance. JAMA Pediatr. 2016;170(4):350-358. PubMed
12. Fiscella K, Burstin HR, Nerenz DR. Quality measures and sociodemographic risk factors: to adjust or not to adjust. JAMA. 2014;312(24):2615-2616. PubMed
13. Lipstein SH, Dunagan WC. The risks of not adjusting performance measures for sociodemographic factors. Ann Intern Med. 2014;161(8):594-596. PubMed
14. Berry JG, Hall DE, Kuo DZ, et al. Hospital utilization and characteristics of patients experiencing recurrent readmissions within children’s hospitals. JAMA. 2011;305(7):682-690. PubMed
15. Bourgeois FT, Monuteaux MC, Stack AM, Neuman MI. Variation in emergency department admission rates in US children’s hospitals. Pediatrics. 2014;134(3):539-545. PubMed
16. Fletcher DM. Achieving data quality. How data from a pediatric health information system earns the trust of its users. J AHIMA. 2004;75(10):22-26. PubMed
17. US Census Bureau. US Census current estimates data. 2014. https://www.census.gov/programs-surveys/popest/data/data-sets.2014.html. Accessed June 2015.
18. Alessandrini EA, Alpern ER, Chamberlain JM, Shea JA, Gorelick MH. A new diagnosis grouping system for child emergency department visits. Acad Emerg Med. 2010;17(2):204-213. PubMed
19. Feudtner C, Levin JE, Srivastava R, et al. How well can hospital readmission be predicted in a cohort of hospitalized children? A retrospective, multicenter study. Pediatrics. 2009;123(1):286-293. PubMed
20. Feinstein JA, Feudtner C, Kempe A. Adverse drug event–related emergency department visits associated with complex chronic conditions. Pediatrics. 2014;133(6):e1575-e1585. PubMed
21. Simon TD, Berry J, Feudtner C, et al. Children with complex chronic conditions in inpatient hospital settings in the United States. Pediatrics. 2010;126(4):647-655. PubMed
22. Dartmouth Medical School, Center for Evaluative Clinical Sciences. The Dartmouth Atlas of Health Care. Chicago, IL: American Hospital Publishing; 2015.
23. Kansagara D, Englander H, Salanitro A, et al. Risk prediction models for hospital readmission: a systematic review. JAMA. 2011;306(15):1688-1698. PubMed
24. Lawrence LM, Jenkins CA, Zhou C, Givens TG. The effect of diagnosis-specific computerized discharge instructions on 72-hour return visits to the pediatric emergency department. Pediatr Emerg Care. 2009;25(11):733-738. PubMed
25. National Quality Forum. National Quality Forum issue brief: strengthening pediatric quality measurement and reporting. J Healthc Qual. 2008;30(3):51-55. PubMed
26. Rising KL, Victor TW, Hollander JE, Carr BG. Patient returns to the emergency department: the time-to-return curve. Acad Emerg Med. 2014;21(8):864-871. PubMed
27. Cho CS, Shapiro DJ, Cabana MD, Maselli JH, Hersh AL. A national depiction of children with return visits to the emergency department within 72 hours, 2001–2007. Pediatr Emerg Care. 2012;28(7):606-610. PubMed
28. Adekoya N. Patients seen in emergency departments who had a prior visit within the previous 72 h—National Hospital Ambulatory Medical Care Survey, 2002. Public Health. 2005;119(10):914-918. PubMed
29. Mittal MK, Zorc JJ, Garcia-Espana JF, Shaw KN. An assessment of clinical performance measures for pediatric emergency physicians. Am J Med Qual. 2013;28(1):33-39. PubMed
30. Depiero AD, Ochsenschlager DW, Chamberlain JM. Analysis of pediatric hospitalizations after emergency department release as a quality improvement tool. Ann Emerg Med. 2002;39(2):159-163. PubMed
31. Sung SF, Liu KE, Chen SC, Lo CL, Lin KC, Hu YH. Predicting factors and risk stratification for return visits to the emergency department within 72 hours in pediatric patients. Pediatr Emerg Care. 2015;31(12):819-824. PubMed
32. Jacobstein CR, Alessandrini EA, Lavelle JM, Shaw KN. Unscheduled revisits to a pediatric emergency department: risk factors for children with fever or infection-related complaints. Pediatr Emerg Care. 2005;21(12):816-821. PubMed
33. Barnett ML, Hsu J, McWilliams J. Patient characteristics and differences in hospital readmission rates. JAMA Intern Med. 2015;175(11):1803-1812. PubMed
34. Gaucher N, Bailey B, Gravel J. Impact of physicians’ characteristics on the admission risk among children visiting a pediatric emergency department. Pediatr Emerg Care. 2012;28(2):120-124. PubMed
35. McHugh M, Neimeyer J, Powell E, Khare RK, Adams JG. An early look at performance on the emergency care measures included in Medicare’s hospital inpatient Value-Based Purchasing Program. Ann Emerg Med. 2013;61(6):616-623.e2. PubMed
36. Axon RN, Williams MV. Hospital readmission as an accountability measure. JAMA. 2011;305(5):504-505. PubMed
37. Adams JG. Ensuring the quality of quality metrics for emergency care. JAMA. 2016;315(7):659-660. PubMed
38. Payne NR, Flood A. Preventing pediatric readmissions: which ones and how? J Pediatr. 2015;166(3):519-520. PubMed
39. Khan A, Nakamura MM, Zaslavsky AM, et al. Same-hospital readmission rates as a measure of pediatric quality of care. JAMA Pediatr. 2015;169(10):905-912. PubMed
© 2017 Society of Hospital Medicine
Febrile Infant Diagnosis Code Accuracy
Fever is one of the most common reasons for emergency department (ED) evaluation of infants under 90 days of age.[1] Up to 10% to 20% of febrile young infants will have a serious bacterial infection (SBI),[2, 3, 4] but infants with SBI are difficult to distinguish from those without SBI based upon symptoms and physical examination findings alone.[5] Previously developed clinical prediction algorithms can help to identify febrile infants at low risk for SBI, but differ in age range as well as recommendations for testing and empiric treatment.[6, 7, 8] Consequently, there is widespread variation in management of febrile young infants at US children's hospitals,[9, 10, 11] and defining optimal management strategies remains an important issue in pediatric healthcare.[12] Administrative datasets are convenient and inexpensive, and can be used to evaluate practice variation, trends, and outcomes of a large, diverse group of patients within and across institutions.[9, 10] Accurately identifying febrile infants evaluated for suspected SBI in administrative databases would facilitate comparative effectiveness research, quality improvement initiatives, and institutional benchmarking.
Prior studies have validated the accuracy of administrative billing codes for identification of other common childhood illnesses, including urinary tract infection (UTI)[13] and pneumonia.[14] The accuracy of International Classification of Diseases, Ninth Revision (ICD‐9) diagnosis codes in identifying febrile young infants evaluated for SBI is not known. Reliance on administrative ICD‐9 diagnosis codes for patient identification can lead to misclassification of patients due to variable database quality, the validity of the diagnosis codes being utilized, and hospital coding practices.[15] Additionally, fever is a symptom and not a specific diagnosis. If a particular bacterial or viral diagnosis is established (eg, enterovirus meningitis), a discharge diagnosis of fever may not be attributed to the patient encounter. Thus, evaluating the performance characteristics and capture of clinical outcomes of different combinations of ICD‐9 diagnosis codes for identifying febrile infants is necessary for both the conduct and interpretation of studies that utilize administrative databases. The primary objective of this investigation was to identify the most accurate ICD‐9 coding strategies for the identification of febrile infants aged <90 days using administrative data. We also sought to evaluate capture of clinically important outcomes across identification strategies.
METHODS
Study Design and Setting
For this multicenter retrospective study, we used the Pediatric Health Information System (PHIS) database to identify infants <90 days of age[16] who presented between July 1, 2012 and June 30, 2013 to 1 of 8 EDs. We assessed performance characteristics of ICD‐9 diagnosis code case‐identification algorithms by comparing ICD‐9 code combinations to a fever reference standard determined by medical record review. The institutional review board at each participating site approved the study protocol.
Data Source
Data were obtained from 2 sources: the PHIS database and medical record review. We used the PHIS database to identify eligible patients by ICD‐9 diagnosis codes; patient encounters were randomly selected using a random number generator. The PHIS database contains demographic, diagnosis, and billing data from 44 hospitals affiliated with the Children's Hospital Association (Overland Park, Kansas) and represents 85% of freestanding children's hospitals in the United States.[17] Data are deidentified; encrypted unique patient identifiers permit tracking of patients across visits within a site.[18] The Children's Hospital Association and participating hospitals jointly assure the quality and integrity of the data.[19]
For each patient encounter identified in the PHIS database, detailed medical record review was performed by trained investigators at each of the 8 study sites (see Supporting Information, Appendix, in the online version of this article). A standardized data collection instrument was pilot tested by all investigators prior to use. Data were collected and managed using the Research Electronic Data Capture (REDCap) tool hosted at Boston Children's Hospital.[20]
Exclusions
Using PHIS data, prior to medical record review we excluded infants with a complex chronic condition as defined previously[21] and those transferred from another institution, as these infants may warrant a nonstandard evaluation and/or may have incomplete data.
ICD‐9 Diagnosis Code Groups
In the PHIS database, all patients discharged from the hospital (including hospitalized patients as well as patients discharged from the ED) receive 1 or more ICD‐9 discharge diagnosis codes. These diagnosis codes are ascribed after discharge from the hospital, or for ED patients, after ED discharge. Additionally, patients may receive an admission diagnosis, which reflects the diagnosis ascribed at the time of ED discharge or transfer to the inpatient unit.
We reviewed medical records of infants selected from the following ICD‐9 diagnosis code groups (Figure 1): (1) discharge diagnosis code of fever (780.6 [fever and other physiologic disturbances of temperature regulation], 778.4 [other disturbances of temperature regulation of newborn], 780.60 [fever, unspecified], or 780.61 [fever presenting with conditions classified elsewhere])[9, 10] regardless of the presence of admission diagnosis of fever or diagnosis of serious infection, (2) admission diagnosis code of fever without associated discharge diagnosis code of fever,[10] (3) discharge diagnosis code of serious infection determined a priori (see Supporting Information, Appendix, in the online version of this article) without discharge or admission diagnosis code of fever, and (4) infants without any diagnosis code of fever or serious infection.

Medical records reviewed in each of the 4 ICD‐9 diagnosis code groups were randomly selected from the overall set of ED encounters in the population of infants <90 days of age evaluated during the study period. Twenty‐five percent population sampling was used for 3 of the ICD‐9 diagnosis code groups, whereas 5% sampling was used for the no fever/no serious infection code group. The number of medical records reviewed in each ICD‐9 diagnosis code group was proportional to the distribution of ICD‐9 codes across the entire population of infants <90 days of age. These records were distributed equally across sites (228 records per site), except for 1 site that does not assign admission diagnoses (201 records).
Investigators were blinded to ICD‐9 diagnosis code groups during medical record review. Infants with multiple visits during the study period were eligible to be included more than once if the visits occurred more than 3 days apart. For infants with more than 1 ED visit on a particular calendar day, investigators were instructed to review the initial visit.
For each encounter, we also abstracted demographic characteristics (gender, race/ethnicity), insurance status, hospital region (using US Census categories[22]), and season from the PHIS database.
Reference Standard
The presence of fever was determined by medical record review. We defined fever as any documented temperature 100.4F (38.0C) at home or in the ED.[16]
ICD‐9 Code Case‐Identification Algorithms
Using the aforementioned ICD‐9 diagnosis code groups individually and in combination, the following 4 case‐identification algorithms, determined from prior study or group consensus, were compared to the reference standard: (1) ICD‐9 discharge diagnosis code of fever,[9] (2) ICD‐9 admission or discharge diagnosis code of fever,[10, 11] (3) ICD‐9 discharge diagnosis code of fever or serious infection, and (4) ICD‐9 discharge or admission diagnosis code of fever or serious infection. Algorithms were compared overall, separately for discharged and hospitalized infants, and across 3 distinct age groups (28 days, 2956 days, and 5789 days).
Patient‐Level Outcomes
To compare differences in outcomes by case‐identification algorithm, from the PHIS database we abstracted hospitalization rates, rates of UTI/pyelonephritis,[13] bacteremia/sepsis, and bacterial meningitis.[19] Severe outcomes were defined as intensive care unit admission, mechanical ventilation, central line placement, receipt of extracorporeal membrane oxygenation, or death. We assessed hospital length of stay for admitted infants and 3‐day revisits,[23, 24] and revisits resulting in hospitalization for infants discharged from the ED at the index visit. Patients billed for observation care were classified as being hospitalized.[25, 26]
Data Analysis
Accuracy of the 4 case‐identification algorithms (compared with the reference standard) was calculated using sensitivity, specificity, negative predictive value (NPV), and positive predictive value (PPV), along with 95% confidence interval (CI). Prior to analysis, a 5‐fold weighting factor was applied to the no fever/no serious infection group to account for the differential sampling used for this group (5% vs 25% for the other 3 ICD‐9 diagnosis code groups). This weighting was done to approximate the true prevalence of each ICD‐9 code group within the larger population, so that an accurate rate of false negatives (infants with fever who had neither a diagnosis of fever nor serious infection) could be calculated.
We described continuous variables using median and interquartile range or range values and categorical variables using frequencies with 95% CIs. We compared categorical variables using a 2 test. We determined statistical significance as a 2‐tailed P value <0.05. Statistical analyses were performed using SAS version 9.3 (SAS Institute, Cary, NC).
RESULTS
Study Patients
During the 1‐year study period, 23,753 ED encounters for infants <90 days of age were identified in the PHIS database at the 8 participating sites. Of these infant encounters, 2166 (9.2%) were excluded (1658 infants who had a complex chronic condition and 508 transferred into the ED), leaving 21,587 infants available for selection. After applying our sampling strategy, we identified 1797 encounters for medical record review. Seven encounters from 3 hospitals with missing medical records were excluded, resulting in a final cohort of 1790 encounters (Figure 1). Among included infants, 552 (30.8%) were 28 days, 743 (41.5%) were 29 to 56 days, and 495 (27.8%) were 57 to 89 days of age; 737 (41.2%) infants were hospitalized. Patients differed in age, race, payer, and season across ICD‐9 diagnosis code groups (see Supporting Information, Table 1, in the online version of this article).
| ICD‐9 Diagnosis Code Algorithm | Overall | |||
|---|---|---|---|---|
| Sensitivity, % (95% CI) | Specificity, % (95% CI) | Negative Predictive Value, % (95% CI) | Positive Predictive Value, % (95% CI) | |
| ||||
| Discharge diagnosis of fever | 53.2 (50.056.4) | 98.2 (97.898.6) | 90.8 (90.091.6) | 86.1 (83.388.9) |
| Hospitalized | 47.3 (43.151.5) | 97.7 (96.998.5) | 80.6 (78.682.6) | 90.2 (86.893.6) |
| Discharged from ED | 61.4 (56.666.2) | 98.4 (98.098.8) | 95.4 (94.796.1) | 82.1 (77.786.5) |
| Discharge or admission diagnosis of Fever | 71.1 (68.274.0) | 97.7 (97.398.1) | 94.1 (93.494.8) | 86.9 (84.589.3) |
| Hospitalized | 72.5 (68.876.2) | 97.1 (96.298.0) | 88.8 (87.190.5) | 91.7 (89.194.3) |
| Discharged from ED | 69.2 (64.773.7) | 98.0 (97.598.5) | 96.3 (95.796.9) | 80.8 (76.685.0) |
| Discharge diagnosis of fever or serious infection | 63.7 (60.666.8) | 96.5 (96.097.0) | 92.6 (91.893.4) | 79.6 (76.782.5) |
| Hospitalized | 63.9 (59.967.9) | 92.5 (91.094.0) | 85.1 (83.287.0) | 79.1 (75.382.9) |
| Discharged from ED | 63.4 (58.768.1) | 98.1 (97.698.6) | 95.6 (94.996.3) | 80.2 (75.884.6) |
| Discharge or admission diagnosis of fever or serious infection | 76.6 (73.979.3) | 96.2 (95.696.8) | 95.1 (94.595.7) | 81.0 (78.483.6) |
| Hospitalized | 80.8 (77.584.1) | 92.1 (90.693.6) | 91.5 (89.993.1) | 82.1 (78.985.3) |
| Discharged from ED | 71.0 (66.575.5) | 97.7 (97.298.2) | 96.5 (95.997.1) | 79.4 (75.283.6) |
Among the 1790 patient encounters reviewed, a total of 766 infants (42.8%) met the reference standard definition for fever in the cohort. An additional 47 infants had abnormal temperature reported (documentation of tactile fever, history of fever without a specific temperature described, or hypothermia) but were classified as having no fever by the reference standard.
ICD‐9 Code Case‐Identification Algorithm Performance
Compared with the reference standard, the 4 case‐identification algorithms demonstrated specificity of 96.2% to 98.2% but lower sensitivity overall (Figure 2). Discharge diagnosis of fever alone demonstrated the lowest sensitivity. The algorithm of discharge or admission diagnosis of fever resulted in increased sensitivity and the highest PPV of all 4 algorithms (86.9%, 95% CI: 84.5‐89.3). Addition of serious infection codes to this algorithm resulted in a marginal increase in sensitivity and a similar decrease in PPV (Table 1). When limited to hospitalized infants, specificity was highest for the case‐identification algorithm of discharge diagnosis of fever and similarly high for discharge or admission diagnosis of fever; sensitivity was highest for the algorithm of discharge or admission diagnosis of fever or diagnosis of serious infection. For infants discharged from the ED, algorithm specificity was 97.7% to 98.4%, with lower sensitivity for all 4 algorithms (Table 1). Inclusion of the 47 infants with abnormal temperature as fever did not materially change algorithm performance (data not shown).
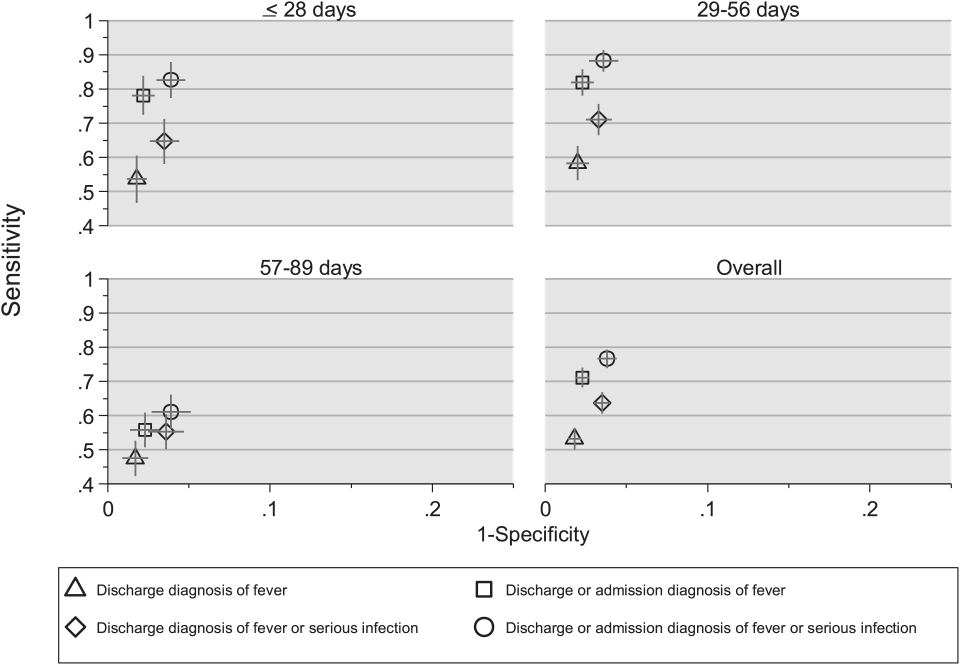
Across all 3 age groups (28 days, 2956 days, and 5789 days), the 4 case‐identification algorithms demonstrated specificity >96%, whereas algorithm sensitivity was highest in the 29‐ to 56‐days‐old age group and lowest among infants 57 to 89 days old across all 4 algorithms (Figure 2). Similar to the overall cohort, an algorithm of discharge or admission diagnosis of fever demonstrated specificity of nearly 98% in all age groups; addition of serious infection codes to this algorithm increased sensitivity, highest in the 29‐ to 56‐days‐old age group (Figure 2; see also Supporting Information, Table 2, in the online version of this article).
| ICD‐9 Diagnosis Code Algorithm | Sensitivity, Median % (Range) | Specificity, Median % (Range) | Negative Predictive Value, Median % (Range) | Positive Predictive Value, Median % (Range) |
|---|---|---|---|---|
| ||||
| Discharge diagnosis of fever | 56.2 (34.681.0) | 98.3 (96.499.1) | 92.1 (83.297.4) | 87.7 (74.093.2) |
| Discharge or Admission diagnosis of Fever | 76.7 (51.385.0) | 97.8 (96.298.7) | 95.6 (86.997.4) | 87.4 (80.092.9) |
| Discharge diagnosis of fever or serious infection | 68.3 (44.287.3) | 96.5 (95.498.0) | 93.6 (85.298.2) | 78.3 (74.289.0) |
| Discharge or admission diagnosis of fever or serious infection | 83.1 (58.390.7) | 95.8 (95.498.0) | 96.5 (88.598.2) | 79.1 (77.490.4) |
Across the 8 study sites, median specificity was 95.8% to 98.3% for the 4 algorithms, with little interhospital variability; however, algorithm sensitivity varied widely by site. Median PPV was highest for discharge diagnosis of fever alone at 87.7% but ranged from 74.0% to 93.2% across sites. Median PPV for an algorithm of discharge or admission diagnosis of fever was similar (87.4%) but with less variation by site (range 80.0%92.9%) (Table 2).
Outcomes by ICD‐9 Diagnosis Code Group and Case‐Identification Algorithm
When compared with discharge diagnosis of fever, adding admission diagnosis of fever captured a higher proportion of hospitalized infants with SBIs (UTI/pyelonephritis, bacteremia/sepsis, or bacterial meningitis). However, median hospital length of stay, severe outcomes, and 3‐day revisits and revisits with hospitalization did not materially differ when including infants with admission diagnosis of fever in addition to discharge diagnosis of fever. Addition of infants with a diagnosis code for serious infection substantially increased the number of infants with SBIs and severe outcomes but did not capture additional 3‐day revisits (Table 3). There were no additional cases of SBI in the no fever/no serious illness diagnosis code group.
| ICD‐9 Diagnosis Code Algorithm | Outcome | 3‐Day Revisit, % (95% CI) | 3‐Day Revisit With Hospitalization, % (95% CI) | |||
|---|---|---|---|---|---|---|
| Hospitalized, % (95% CI) | UTI/Pyelonephritis, Bacteremia/Sepsis, or Bacterial Meningitis, % (95% CI) | Severe Outcome, % (95% CI)* | Length of Stay in Days, Median (IQR) | |||
| ||||||
| Discharge diagnosis of fever | 44.3 (40.348.4) | 3.3 (1.84.7) | 1.4 (0.42.3) | 3 (23) | 11.7 (8.215.2) | 5.9 (3.38.4) |
| Discharge or admission diagnosis of fever | 52.4 (48.955.9) | 6.1 (4.47.8) | 1.9 (1.02.9) | 3 (23) | 10.9 (7.714.1) | 5.4 (3.17.8) |
| Discharge diagnosis of fever or serious infection | 54.0 (50.457.5) | 15.3 (12.717.8) | 3.8 (2.55.2) | 3 (24) | 11.0 (7.714.2) | 5.5 (3.17.9) |
| Discharge or admission diagnosis of fever or serious infection | 56.5 (53.259.7) | 12.9 (10.715.1) | 3.6 (2.44.8) | 3 (24) | 10.3 (7.313.3) | 5.2 (3.07.4) |
Among infants who met the reference standard for fever but did not have a discharge or admission diagnosis of fever (false negatives), 11.8% had a diagnosis of SBI. Overall, 43.2% of febrile infants (and 84.4% of hospitalized infants) with SBI did not have an ICD‐9 discharge or admission diagnosis of fever. Addition of ICD‐9 diagnosis codes of serious infection to the algorithm of discharge or admission diagnosis of fever captured all additional SBIs, and no false negativeinfants missed with this algorithm had an SBI.
DISCUSSION
We described the performance of 4 ICD‐9 diagnosis code case‐identification algorithms for the identification of febrile young infants <90 days of age at US children's hospitals. Although the specificity was high across algorithms and institutions, the sensitivity was relatively low, particularly for discharge diagnosis of fever, and varied by institution. Given the high specificity, ICD‐9 diagnosis code case‐identification algorithms for fever reliably identify febrile infants using administrative data with low rates of inclusion of infants without fever. However, underidentification of patients, particularly those more prone to SBIs and severe outcomes depending on the algorithm utilized, can impact interpretation of comparative effectiveness studies or the quality of care delivered by an institution.
ICD‐9 discharge diagnosis codes are frequently used to identify pediatric patients across a variety of administrative databases, diseases, and symptoms.[19, 27, 28, 29, 30, 31] Although discharge diagnosis of fever is highly specific, sensitivity is substantially lower than other case‐identification algorithms we studied, particularly for hospitalized infants. This may be due to a fever code sometimes being omitted in favor of a more specific diagnosis (eg, bacteremia) prior to hospital discharge. Therefore, case identification relying only on ICD‐9 discharge diagnosis codes for fever may under‐report clinically important SBI or severe outcomes as demonstrated in our study. This is in contrast to ICD‐9 diagnosis code identification strategies for childhood UTI and pneumonia, which largely have higher sensitivity but lower specificity than fever codes.[13, 14]
Admission diagnosis of fever is important for febrile infants as they may not have an explicit diagnosis at the time of disposition from the ED. Addition of admission diagnosis of fever to an algorithm relying on discharge diagnosis code alone increased sensitivity without a demonstrable reduction in specificity and PPV, likely due to capture of infants with a fever diagnosis at presentation before a specific infection was identified. Although using an algorithm of discharge or admission diagnosis of fever captured a higher percentage of hospitalized febrile infants with SBIs, sensitivity was only 71% overall with this algorithm, and 43% of febrile infants with SBI would still have been missed. Importantly, though, addition of various ICD‐9 codes for serious infection to this algorithm resulted in capture of all febrile infants with SBI and should be used as a sensitivity analysis.
The test characteristics of diagnosis codes were highest in the 29‐ to 56‐days‐old age group. Given the differing low‐risk criteria[6, 7, 8] and lack of best practice guidelines[16] in this age group, the use of administrative data may allow for the comparison of testing and treatment strategies across a large cohort of febrile infants aged 29 to 56 days. However, individual hospital coding practices may affect algorithm performance, in particular sensitivity, which varied substantially by hospital. This variation in algorithm sensitivity may impact comparisons of outcomes across institutions. Therefore, when conducting studies of febrile infants using administrative data, sensitivity analyses or use of chart review should be considered to augment the use of ICD‐9 code‐based identification strategies, particularly for comparative benchmarking and outcomes studies. These additional analyses are particularly important for studies of febrile infants >56 days of age, in whom the sensitivity of diagnosis codes is particularly low. We speculate that the lower sensitivity in older febrile infants may relate to a lack of consensus on the clinical significance of fever in this age group and the varying management strategies employed.[10]
Strengths of this study include the assessment of ICD‐9 code algorithms across multiple institutions for identification of fever in young infants, and the patterns of our findings remained robust when comparing median performance characteristics of the algorithms across hospitals to our overall findings. We were also able to accurately estimate PPV and NPV using a case‐identification strategy weighted to the actual population sizes. Although sensitivity and specificity are the primary measures of test performance, predictive values are highly informative for investigators using administrative data. Additionally, our findings may inform public health efforts including disease surveillance, assessment of seasonal variation, and identification and monitoring of healthcare‐associated infections among febrile infants.
Our study has limitations. We did not review all identified records, which raises the possibility that our evaluated cohort may not be representative of the entire febrile infant population. We attempted to mitigate this possibility by using a random sampling strategy for our population selection that was weighted to the actual population sizes. Second, we identified serious infections using ICD‐9 diagnosis codes determined by group consensus, which may not capture all serious infection codes that identify febrile infants whose fever code was omitted. Third, 47 infants had abnormal temperature that did not meet our reference standard criteria for fever and were included in the no fever group. Although there may be disagreement regarding what constitutes a fever, we used a widely accepted reference standard to define fever.[16] Further, inclusion of these 47 infants as fever did not materially change algorithm performance. Last, our study was conducted at 8 large tertiary‐care children's hospitals, and our results may not be generalizable to other children's hospitals and community‐based hospitals.
CONCLUSIONS
Studies of febrile young infants that rely on ICD‐9 discharge diagnosis code of fever for case ascertainment have high specificity but low sensitivity for the identification of febrile infants, particularly among hospitalized patients. A case‐identification strategy that includes discharge or admission diagnosis of fever demonstrated higher sensitivity, and should be considered for studies of febrile infants using administrative data. However, additional strategies such as incorporation of ICD‐9 codes for serious infection should be used when comparing outcomes across institutions.
Acknowledgements
The Febrile Young Infant Research Collaborative includes the following additional collaborators who are acknowledged for their work on this study: Erica DiLeo, MA, Department of Medical Education and Research, Danbury Hospital, Danbury, Connecticut; Janet Flores, BS, Division of Emergency Medicine, Ann and Robert H. Lurie Children's Hospital of Chicago, Chicago, Illinois.
Disclosures: This project funded in part by The Gerber Foundation Novice Researcher Award, (Ref No. 1827‐3835). Dr. Fran Balamuth received career development support from the National Institutes of Health (NHLBI K12‐HL109009). Funders were not involved in the design or conduct of the study; collection, management, analysis, or interpretation of the data; or preparation, review, or approval of the manuscript. The authors have no conflicts of interest relevant to this article to disclose.
- . The prevalence of serious bacterial infections by age in febrile infants during the first 3 months of life. Pediatr Ann. 1993;22:462–466.
- , , . Performance of low‐risk criteria in the evaluation of young infants with fever: review of the literature. Pediatrics. 2010;125:228–233.
- , , , , , . A week‐by‐week analysis of the low‐risk criteria for serious bacterial infection in febrile neonates. Arch Dis Child. 2009;94:287–292.
- , , , et al. Is 15 days an appropriate cut‐off age for considering serious bacterial infection in the management of febrile infants? Pediatr Infect Dis J. 2012;31:455–458.
- , , . Failure of infant observation scales in detecting serious illness in febrile, 4‐ to 8‐week‐old infants. Pediatrics. 1990;85:1040–1043.
- , , . Outpatient management without antibiotics of fever in selected infants. N Engl J Med. 1993;329:1437–1441.
- , , . Identifying febrile infants at risk for a serious bacterial infection. J Pediatr. 1993;123:489–490.
- , , , et al. Febrile infants at low risk for serious bacterial infection—an appraisal of the Rochester criteria and implications for management. Febrile Infant Collaborative Study Group. Pediatrics. 1994;94:390–396.
- , , , et al. Management of febrile neonates in US pediatric emergency departments. Pediatrics. 2014;133:187–195.
- , , , et al. Variation in care of the febrile young infant <90 days in US pediatric emergency departments. Pediatrics. 2014;134:667–677.
- , , , et al. Association of clinical practice guidelines with emergency department management of febrile infants ≤56 days of age. J Hosp Med. 2015;10:358–365.
- , , , et al. Diagnosis and management of febrile infants (0‐3 months). Evid Rep Technol Assess (Full Rep). 2012;(205):1–297.
- , , , et al. Accuracy of administrative billing codes to detect urinary tract infection hospitalizations. Pediatrics. 2011;128:323–330.
- , , , et al. Identifying pediatric community‐acquired pneumonia hospitalizations: accuracy of administrative billing codes. JAMA Pediatr. 2013;167:851–858.
- , , , , , . Development and use of reporting guidelines for assessing the quality of validation studies of health administrative data. J Clin Epidemiol. 2011;64:821–829.
- American College of Emergency Physicians Clinical Policies Committee; American College of Emergency Physicians Clinical Policies Subcommittee on Pediatric Fever. Clinical policy for children younger than three years presenting to the emergency department with fever. Ann Emerg Med. 2003;42:530–545.
- , , , , , . Variation in occult injury screening for children with suspected abuse in selected US children's hospitals. Pediatrics. 2012;130:853–860.
- . Achieving data quality. How data from a pediatric health information system earns the trust of its users. J AHIMA. 2004;75:22–26.
- , , , . Corticosteroids and mortality in children with bacterial meningitis. JAMA. 2008;299:2048–2055.
- , , , , , . Research electronic data capture (REDCap)—a metadata‐driven methodology and workflow process for providing translational research informatics support. J Biomed Inform. 2009;42:377–381.
- , , , , , . Deaths attributed to pediatric complex chronic conditions: national trends and implications for supportive care services. Pediatrics. 2001;107:E99.
- US Census Bureau. Geographic terms and concepts—census divisions and census regions. Available at: https://www.census.gov/geo/reference/gtc/gtc_census_divreg.html. Accessed October 20, 2014.
- , , , . Initial emergency department diagnosis and return visits: risk versus perception. Ann Emerg Med. 1998;32:569–573.
- , , , , . A national depiction of children with return visits to the emergency department within 72 hours, 2001–2007. Pediatr Emerg Care. 2012;28:606–610.
- , , , et al. Pediatric observation status: are we overlooking a growing population in children's hospitals? J Hosp Med. 2012;7:530–536.
- , , , et al. Differences in designations of observation care in US freestanding children's hospitals: are they virtual or real? J Hosp Med. 2012;7:287–293.
- , , , , . Trends in the management of viral meningitis at United States children's hospitals. Pediatrics. 2013;131:670–676.
- , , , et al. Impact of increasing ondansetron use on clinical outcomes in children with gastroenteritis. JAMA Pediatr. 2014;168:321–329.
- , , , , . Race, otitis media, and antibiotic selection. Pediatrics. 2014;134:1059–1066.
- , , , et al. Establishing benchmarks for the hospitalized care of children with asthma, bronchiolitis, and pneumonia. Pediatrics. 2014;134:555–562.
- , , , , . Diagnostic testing and treatment of pediatric headache in the emergency department. J Pediatr. 2013;163:1634–1637.
Fever is one of the most common reasons for emergency department (ED) evaluation of infants under 90 days of age.[1] Up to 10% to 20% of febrile young infants will have a serious bacterial infection (SBI),[2, 3, 4] but infants with SBI are difficult to distinguish from those without SBI based upon symptoms and physical examination findings alone.[5] Previously developed clinical prediction algorithms can help to identify febrile infants at low risk for SBI, but differ in age range as well as recommendations for testing and empiric treatment.[6, 7, 8] Consequently, there is widespread variation in management of febrile young infants at US children's hospitals,[9, 10, 11] and defining optimal management strategies remains an important issue in pediatric healthcare.[12] Administrative datasets are convenient and inexpensive, and can be used to evaluate practice variation, trends, and outcomes of a large, diverse group of patients within and across institutions.[9, 10] Accurately identifying febrile infants evaluated for suspected SBI in administrative databases would facilitate comparative effectiveness research, quality improvement initiatives, and institutional benchmarking.
Prior studies have validated the accuracy of administrative billing codes for identification of other common childhood illnesses, including urinary tract infection (UTI)[13] and pneumonia.[14] The accuracy of International Classification of Diseases, Ninth Revision (ICD‐9) diagnosis codes in identifying febrile young infants evaluated for SBI is not known. Reliance on administrative ICD‐9 diagnosis codes for patient identification can lead to misclassification of patients due to variable database quality, the validity of the diagnosis codes being utilized, and hospital coding practices.[15] Additionally, fever is a symptom and not a specific diagnosis. If a particular bacterial or viral diagnosis is established (eg, enterovirus meningitis), a discharge diagnosis of fever may not be attributed to the patient encounter. Thus, evaluating the performance characteristics and capture of clinical outcomes of different combinations of ICD‐9 diagnosis codes for identifying febrile infants is necessary for both the conduct and interpretation of studies that utilize administrative databases. The primary objective of this investigation was to identify the most accurate ICD‐9 coding strategies for the identification of febrile infants aged <90 days using administrative data. We also sought to evaluate capture of clinically important outcomes across identification strategies.
METHODS
Study Design and Setting
For this multicenter retrospective study, we used the Pediatric Health Information System (PHIS) database to identify infants <90 days of age[16] who presented between July 1, 2012 and June 30, 2013 to 1 of 8 EDs. We assessed performance characteristics of ICD‐9 diagnosis code case‐identification algorithms by comparing ICD‐9 code combinations to a fever reference standard determined by medical record review. The institutional review board at each participating site approved the study protocol.
Data Source
Data were obtained from 2 sources: the PHIS database and medical record review. We used the PHIS database to identify eligible patients by ICD‐9 diagnosis codes; patient encounters were randomly selected using a random number generator. The PHIS database contains demographic, diagnosis, and billing data from 44 hospitals affiliated with the Children's Hospital Association (Overland Park, Kansas) and represents 85% of freestanding children's hospitals in the United States.[17] Data are deidentified; encrypted unique patient identifiers permit tracking of patients across visits within a site.[18] The Children's Hospital Association and participating hospitals jointly assure the quality and integrity of the data.[19]
For each patient encounter identified in the PHIS database, detailed medical record review was performed by trained investigators at each of the 8 study sites (see Supporting Information, Appendix, in the online version of this article). A standardized data collection instrument was pilot tested by all investigators prior to use. Data were collected and managed using the Research Electronic Data Capture (REDCap) tool hosted at Boston Children's Hospital.[20]
Exclusions
Using PHIS data, prior to medical record review we excluded infants with a complex chronic condition as defined previously[21] and those transferred from another institution, as these infants may warrant a nonstandard evaluation and/or may have incomplete data.
ICD‐9 Diagnosis Code Groups
In the PHIS database, all patients discharged from the hospital (including hospitalized patients as well as patients discharged from the ED) receive 1 or more ICD‐9 discharge diagnosis codes. These diagnosis codes are ascribed after discharge from the hospital, or for ED patients, after ED discharge. Additionally, patients may receive an admission diagnosis, which reflects the diagnosis ascribed at the time of ED discharge or transfer to the inpatient unit.
We reviewed medical records of infants selected from the following ICD‐9 diagnosis code groups (Figure 1): (1) discharge diagnosis code of fever (780.6 [fever and other physiologic disturbances of temperature regulation], 778.4 [other disturbances of temperature regulation of newborn], 780.60 [fever, unspecified], or 780.61 [fever presenting with conditions classified elsewhere])[9, 10] regardless of the presence of admission diagnosis of fever or diagnosis of serious infection, (2) admission diagnosis code of fever without associated discharge diagnosis code of fever,[10] (3) discharge diagnosis code of serious infection determined a priori (see Supporting Information, Appendix, in the online version of this article) without discharge or admission diagnosis code of fever, and (4) infants without any diagnosis code of fever or serious infection.
Medical records reviewed in each of the 4 ICD‐9 diagnosis code groups were randomly selected from the overall set of ED encounters in the population of infants <90 days of age evaluated during the study period. Twenty‐five percent population sampling was used for 3 of the ICD‐9 diagnosis code groups, whereas 5% sampling was used for the no fever/no serious infection code group. The number of medical records reviewed in each ICD‐9 diagnosis code group was proportional to the distribution of ICD‐9 codes across the entire population of infants <90 days of age. These records were distributed equally across sites (228 records per site), except for 1 site that does not assign admission diagnoses (201 records).
Investigators were blinded to ICD‐9 diagnosis code groups during medical record review. Infants with multiple visits during the study period were eligible to be included more than once if the visits occurred more than 3 days apart. For infants with more than 1 ED visit on a particular calendar day, investigators were instructed to review the initial visit.
For each encounter, we also abstracted demographic characteristics (gender, race/ethnicity), insurance status, hospital region (using US Census categories[22]), and season from the PHIS database.
Reference Standard
The presence of fever was determined by medical record review. We defined fever as any documented temperature 100.4F (38.0C) at home or in the ED.[16]
ICD‐9 Code Case‐Identification Algorithms
Using the aforementioned ICD‐9 diagnosis code groups individually and in combination, the following 4 case‐identification algorithms, determined from prior study or group consensus, were compared to the reference standard: (1) ICD‐9 discharge diagnosis code of fever,[9] (2) ICD‐9 admission or discharge diagnosis code of fever,[10, 11] (3) ICD‐9 discharge diagnosis code of fever or serious infection, and (4) ICD‐9 discharge or admission diagnosis code of fever or serious infection. Algorithms were compared overall, separately for discharged and hospitalized infants, and across 3 distinct age groups (28 days, 2956 days, and 5789 days).
Patient‐Level Outcomes
To compare differences in outcomes by case‐identification algorithm, from the PHIS database we abstracted hospitalization rates, rates of UTI/pyelonephritis,[13] bacteremia/sepsis, and bacterial meningitis.[19] Severe outcomes were defined as intensive care unit admission, mechanical ventilation, central line placement, receipt of extracorporeal membrane oxygenation, or death. We assessed hospital length of stay for admitted infants and 3‐day revisits,[23, 24] and revisits resulting in hospitalization for infants discharged from the ED at the index visit. Patients billed for observation care were classified as being hospitalized.[25, 26]
Data Analysis
Accuracy of the 4 case‐identification algorithms (compared with the reference standard) was calculated using sensitivity, specificity, negative predictive value (NPV), and positive predictive value (PPV), along with 95% confidence interval (CI). Prior to analysis, a 5‐fold weighting factor was applied to the no fever/no serious infection group to account for the differential sampling used for this group (5% vs 25% for the other 3 ICD‐9 diagnosis code groups). This weighting was done to approximate the true prevalence of each ICD‐9 code group within the larger population, so that an accurate rate of false negatives (infants with fever who had neither a diagnosis of fever nor serious infection) could be calculated.
We described continuous variables using median and interquartile range or range values and categorical variables using frequencies with 95% CIs. We compared categorical variables using a 2 test. We determined statistical significance as a 2‐tailed P value <0.05. Statistical analyses were performed using SAS version 9.3 (SAS Institute, Cary, NC).
RESULTS
Study Patients
During the 1‐year study period, 23,753 ED encounters for infants <90 days of age were identified in the PHIS database at the 8 participating sites. Of these infant encounters, 2166 (9.2%) were excluded (1658 infants who had a complex chronic condition and 508 transferred into the ED), leaving 21,587 infants available for selection. After applying our sampling strategy, we identified 1797 encounters for medical record review. Seven encounters from 3 hospitals with missing medical records were excluded, resulting in a final cohort of 1790 encounters (Figure 1). Among included infants, 552 (30.8%) were 28 days, 743 (41.5%) were 29 to 56 days, and 495 (27.8%) were 57 to 89 days of age; 737 (41.2%) infants were hospitalized. Patients differed in age, race, payer, and season across ICD‐9 diagnosis code groups (see Supporting Information, Table 1, in the online version of this article).
| ICD‐9 Diagnosis Code Algorithm | Overall | |||
|---|---|---|---|---|
| Sensitivity, % (95% CI) | Specificity, % (95% CI) | Negative Predictive Value, % (95% CI) | Positive Predictive Value, % (95% CI) | |
| ||||
| Discharge diagnosis of fever | 53.2 (50.056.4) | 98.2 (97.898.6) | 90.8 (90.091.6) | 86.1 (83.388.9) |
| Hospitalized | 47.3 (43.151.5) | 97.7 (96.998.5) | 80.6 (78.682.6) | 90.2 (86.893.6) |
| Discharged from ED | 61.4 (56.666.2) | 98.4 (98.098.8) | 95.4 (94.796.1) | 82.1 (77.786.5) |
| Discharge or admission diagnosis of Fever | 71.1 (68.274.0) | 97.7 (97.398.1) | 94.1 (93.494.8) | 86.9 (84.589.3) |
| Hospitalized | 72.5 (68.876.2) | 97.1 (96.298.0) | 88.8 (87.190.5) | 91.7 (89.194.3) |
| Discharged from ED | 69.2 (64.773.7) | 98.0 (97.598.5) | 96.3 (95.796.9) | 80.8 (76.685.0) |
| Discharge diagnosis of fever or serious infection | 63.7 (60.666.8) | 96.5 (96.097.0) | 92.6 (91.893.4) | 79.6 (76.782.5) |
| Hospitalized | 63.9 (59.967.9) | 92.5 (91.094.0) | 85.1 (83.287.0) | 79.1 (75.382.9) |
| Discharged from ED | 63.4 (58.768.1) | 98.1 (97.698.6) | 95.6 (94.996.3) | 80.2 (75.884.6) |
| Discharge or admission diagnosis of fever or serious infection | 76.6 (73.979.3) | 96.2 (95.696.8) | 95.1 (94.595.7) | 81.0 (78.483.6) |
| Hospitalized | 80.8 (77.584.1) | 92.1 (90.693.6) | 91.5 (89.993.1) | 82.1 (78.985.3) |
| Discharged from ED | 71.0 (66.575.5) | 97.7 (97.298.2) | 96.5 (95.997.1) | 79.4 (75.283.6) |
Among the 1790 patient encounters reviewed, a total of 766 infants (42.8%) met the reference standard definition for fever in the cohort. An additional 47 infants had abnormal temperature reported (documentation of tactile fever, history of fever without a specific temperature described, or hypothermia) but were classified as having no fever by the reference standard.
ICD‐9 Code Case‐Identification Algorithm Performance
Compared with the reference standard, the 4 case‐identification algorithms demonstrated specificity of 96.2% to 98.2% but lower sensitivity overall (Figure 2). Discharge diagnosis of fever alone demonstrated the lowest sensitivity. The algorithm of discharge or admission diagnosis of fever resulted in increased sensitivity and the highest PPV of all 4 algorithms (86.9%, 95% CI: 84.5‐89.3). Addition of serious infection codes to this algorithm resulted in a marginal increase in sensitivity and a similar decrease in PPV (Table 1). When limited to hospitalized infants, specificity was highest for the case‐identification algorithm of discharge diagnosis of fever and similarly high for discharge or admission diagnosis of fever; sensitivity was highest for the algorithm of discharge or admission diagnosis of fever or diagnosis of serious infection. For infants discharged from the ED, algorithm specificity was 97.7% to 98.4%, with lower sensitivity for all 4 algorithms (Table 1). Inclusion of the 47 infants with abnormal temperature as fever did not materially change algorithm performance (data not shown).
Across all 3 age groups (28 days, 2956 days, and 5789 days), the 4 case‐identification algorithms demonstrated specificity >96%, whereas algorithm sensitivity was highest in the 29‐ to 56‐days‐old age group and lowest among infants 57 to 89 days old across all 4 algorithms (Figure 2). Similar to the overall cohort, an algorithm of discharge or admission diagnosis of fever demonstrated specificity of nearly 98% in all age groups; addition of serious infection codes to this algorithm increased sensitivity, highest in the 29‐ to 56‐days‐old age group (Figure 2; see also Supporting Information, Table 2, in the online version of this article).
| ICD‐9 Diagnosis Code Algorithm | Sensitivity, Median % (Range) | Specificity, Median % (Range) | Negative Predictive Value, Median % (Range) | Positive Predictive Value, Median % (Range) |
|---|---|---|---|---|
| ||||
| Discharge diagnosis of fever | 56.2 (34.681.0) | 98.3 (96.499.1) | 92.1 (83.297.4) | 87.7 (74.093.2) |
| Discharge or Admission diagnosis of Fever | 76.7 (51.385.0) | 97.8 (96.298.7) | 95.6 (86.997.4) | 87.4 (80.092.9) |
| Discharge diagnosis of fever or serious infection | 68.3 (44.287.3) | 96.5 (95.498.0) | 93.6 (85.298.2) | 78.3 (74.289.0) |
| Discharge or admission diagnosis of fever or serious infection | 83.1 (58.390.7) | 95.8 (95.498.0) | 96.5 (88.598.2) | 79.1 (77.490.4) |
Across the 8 study sites, median specificity was 95.8% to 98.3% for the 4 algorithms, with little interhospital variability; however, algorithm sensitivity varied widely by site. Median PPV was highest for discharge diagnosis of fever alone at 87.7% but ranged from 74.0% to 93.2% across sites. Median PPV for an algorithm of discharge or admission diagnosis of fever was similar (87.4%) but with less variation by site (range 80.0%92.9%) (Table 2).
Outcomes by ICD‐9 Diagnosis Code Group and Case‐Identification Algorithm
When compared with discharge diagnosis of fever, adding admission diagnosis of fever captured a higher proportion of hospitalized infants with SBIs (UTI/pyelonephritis, bacteremia/sepsis, or bacterial meningitis). However, median hospital length of stay, severe outcomes, and 3‐day revisits and revisits with hospitalization did not materially differ when including infants with admission diagnosis of fever in addition to discharge diagnosis of fever. Addition of infants with a diagnosis code for serious infection substantially increased the number of infants with SBIs and severe outcomes but did not capture additional 3‐day revisits (Table 3). There were no additional cases of SBI in the no fever/no serious illness diagnosis code group.
| ICD‐9 Diagnosis Code Algorithm | Outcome | 3‐Day Revisit, % (95% CI) | 3‐Day Revisit With Hospitalization, % (95% CI) | |||
|---|---|---|---|---|---|---|
| Hospitalized, % (95% CI) | UTI/Pyelonephritis, Bacteremia/Sepsis, or Bacterial Meningitis, % (95% CI) | Severe Outcome, % (95% CI)* | Length of Stay in Days, Median (IQR) | |||
| ||||||
| Discharge diagnosis of fever | 44.3 (40.348.4) | 3.3 (1.84.7) | 1.4 (0.42.3) | 3 (23) | 11.7 (8.215.2) | 5.9 (3.38.4) |
| Discharge or admission diagnosis of fever | 52.4 (48.955.9) | 6.1 (4.47.8) | 1.9 (1.02.9) | 3 (23) | 10.9 (7.714.1) | 5.4 (3.17.8) |
| Discharge diagnosis of fever or serious infection | 54.0 (50.457.5) | 15.3 (12.717.8) | 3.8 (2.55.2) | 3 (24) | 11.0 (7.714.2) | 5.5 (3.17.9) |
| Discharge or admission diagnosis of fever or serious infection | 56.5 (53.259.7) | 12.9 (10.715.1) | 3.6 (2.44.8) | 3 (24) | 10.3 (7.313.3) | 5.2 (3.07.4) |
Among infants who met the reference standard for fever but did not have a discharge or admission diagnosis of fever (false negatives), 11.8% had a diagnosis of SBI. Overall, 43.2% of febrile infants (and 84.4% of hospitalized infants) with SBI did not have an ICD‐9 discharge or admission diagnosis of fever. Addition of ICD‐9 diagnosis codes of serious infection to the algorithm of discharge or admission diagnosis of fever captured all additional SBIs, and no false negativeinfants missed with this algorithm had an SBI.
DISCUSSION
We described the performance of 4 ICD‐9 diagnosis code case‐identification algorithms for the identification of febrile young infants <90 days of age at US children's hospitals. Although the specificity was high across algorithms and institutions, the sensitivity was relatively low, particularly for discharge diagnosis of fever, and varied by institution. Given the high specificity, ICD‐9 diagnosis code case‐identification algorithms for fever reliably identify febrile infants using administrative data with low rates of inclusion of infants without fever. However, underidentification of patients, particularly those more prone to SBIs and severe outcomes depending on the algorithm utilized, can impact interpretation of comparative effectiveness studies or the quality of care delivered by an institution.
ICD‐9 discharge diagnosis codes are frequently used to identify pediatric patients across a variety of administrative databases, diseases, and symptoms.[19, 27, 28, 29, 30, 31] Although discharge diagnosis of fever is highly specific, sensitivity is substantially lower than other case‐identification algorithms we studied, particularly for hospitalized infants. This may be due to a fever code sometimes being omitted in favor of a more specific diagnosis (eg, bacteremia) prior to hospital discharge. Therefore, case identification relying only on ICD‐9 discharge diagnosis codes for fever may under‐report clinically important SBI or severe outcomes as demonstrated in our study. This is in contrast to ICD‐9 diagnosis code identification strategies for childhood UTI and pneumonia, which largely have higher sensitivity but lower specificity than fever codes.[13, 14]
Admission diagnosis of fever is important for febrile infants as they may not have an explicit diagnosis at the time of disposition from the ED. Addition of admission diagnosis of fever to an algorithm relying on discharge diagnosis code alone increased sensitivity without a demonstrable reduction in specificity and PPV, likely due to capture of infants with a fever diagnosis at presentation before a specific infection was identified. Although using an algorithm of discharge or admission diagnosis of fever captured a higher percentage of hospitalized febrile infants with SBIs, sensitivity was only 71% overall with this algorithm, and 43% of febrile infants with SBI would still have been missed. Importantly, though, addition of various ICD‐9 codes for serious infection to this algorithm resulted in capture of all febrile infants with SBI and should be used as a sensitivity analysis.
The test characteristics of diagnosis codes were highest in the 29‐ to 56‐days‐old age group. Given the differing low‐risk criteria[6, 7, 8] and lack of best practice guidelines[16] in this age group, the use of administrative data may allow for the comparison of testing and treatment strategies across a large cohort of febrile infants aged 29 to 56 days. However, individual hospital coding practices may affect algorithm performance, in particular sensitivity, which varied substantially by hospital. This variation in algorithm sensitivity may impact comparisons of outcomes across institutions. Therefore, when conducting studies of febrile infants using administrative data, sensitivity analyses or use of chart review should be considered to augment the use of ICD‐9 code‐based identification strategies, particularly for comparative benchmarking and outcomes studies. These additional analyses are particularly important for studies of febrile infants >56 days of age, in whom the sensitivity of diagnosis codes is particularly low. We speculate that the lower sensitivity in older febrile infants may relate to a lack of consensus on the clinical significance of fever in this age group and the varying management strategies employed.[10]
Strengths of this study include the assessment of ICD‐9 code algorithms across multiple institutions for identification of fever in young infants, and the patterns of our findings remained robust when comparing median performance characteristics of the algorithms across hospitals to our overall findings. We were also able to accurately estimate PPV and NPV using a case‐identification strategy weighted to the actual population sizes. Although sensitivity and specificity are the primary measures of test performance, predictive values are highly informative for investigators using administrative data. Additionally, our findings may inform public health efforts including disease surveillance, assessment of seasonal variation, and identification and monitoring of healthcare‐associated infections among febrile infants.
Our study has limitations. We did not review all identified records, which raises the possibility that our evaluated cohort may not be representative of the entire febrile infant population. We attempted to mitigate this possibility by using a random sampling strategy for our population selection that was weighted to the actual population sizes. Second, we identified serious infections using ICD‐9 diagnosis codes determined by group consensus, which may not capture all serious infection codes that identify febrile infants whose fever code was omitted. Third, 47 infants had abnormal temperature that did not meet our reference standard criteria for fever and were included in the no fever group. Although there may be disagreement regarding what constitutes a fever, we used a widely accepted reference standard to define fever.[16] Further, inclusion of these 47 infants as fever did not materially change algorithm performance. Last, our study was conducted at 8 large tertiary‐care children's hospitals, and our results may not be generalizable to other children's hospitals and community‐based hospitals.
CONCLUSIONS
Studies of febrile young infants that rely on ICD‐9 discharge diagnosis code of fever for case ascertainment have high specificity but low sensitivity for the identification of febrile infants, particularly among hospitalized patients. A case‐identification strategy that includes discharge or admission diagnosis of fever demonstrated higher sensitivity, and should be considered for studies of febrile infants using administrative data. However, additional strategies such as incorporation of ICD‐9 codes for serious infection should be used when comparing outcomes across institutions.
Acknowledgements
The Febrile Young Infant Research Collaborative includes the following additional collaborators who are acknowledged for their work on this study: Erica DiLeo, MA, Department of Medical Education and Research, Danbury Hospital, Danbury, Connecticut; Janet Flores, BS, Division of Emergency Medicine, Ann and Robert H. Lurie Children's Hospital of Chicago, Chicago, Illinois.
Disclosures: This project funded in part by The Gerber Foundation Novice Researcher Award, (Ref No. 1827‐3835). Dr. Fran Balamuth received career development support from the National Institutes of Health (NHLBI K12‐HL109009). Funders were not involved in the design or conduct of the study; collection, management, analysis, or interpretation of the data; or preparation, review, or approval of the manuscript. The authors have no conflicts of interest relevant to this article to disclose.
- . The prevalence of serious bacterial infections by age in febrile infants during the first 3 months of life. Pediatr Ann. 1993;22:462–466.
- , , . Performance of low‐risk criteria in the evaluation of young infants with fever: review of the literature. Pediatrics. 2010;125:228–233.
- , , , , , . A week‐by‐week analysis of the low‐risk criteria for serious bacterial infection in febrile neonates. Arch Dis Child. 2009;94:287–292.
- , , , et al. Is 15 days an appropriate cut‐off age for considering serious bacterial infection in the management of febrile infants? Pediatr Infect Dis J. 2012;31:455–458.
- , , . Failure of infant observation scales in detecting serious illness in febrile, 4‐ to 8‐week‐old infants. Pediatrics. 1990;85:1040–1043.
- , , . Outpatient management without antibiotics of fever in selected infants. N Engl J Med. 1993;329:1437–1441.
- , , . Identifying febrile infants at risk for a serious bacterial infection. J Pediatr. 1993;123:489–490.
- , , , et al. Febrile infants at low risk for serious bacterial infection—an appraisal of the Rochester criteria and implications for management. Febrile Infant Collaborative Study Group. Pediatrics. 1994;94:390–396.
- , , , et al. Management of febrile neonates in US pediatric emergency departments. Pediatrics. 2014;133:187–195.
- , , , et al. Variation in care of the febrile young infant <90 days in US pediatric emergency departments. Pediatrics. 2014;134:667–677.
- , , , et al. Association of clinical practice guidelines with emergency department management of febrile infants ≤56 days of age. J Hosp Med. 2015;10:358–365.
- , , , et al. Diagnosis and management of febrile infants (0‐3 months). Evid Rep Technol Assess (Full Rep). 2012;(205):1–297.
- , , , et al. Accuracy of administrative billing codes to detect urinary tract infection hospitalizations. Pediatrics. 2011;128:323–330.
- , , , et al. Identifying pediatric community‐acquired pneumonia hospitalizations: accuracy of administrative billing codes. JAMA Pediatr. 2013;167:851–858.
- , , , , , . Development and use of reporting guidelines for assessing the quality of validation studies of health administrative data. J Clin Epidemiol. 2011;64:821–829.
- American College of Emergency Physicians Clinical Policies Committee; American College of Emergency Physicians Clinical Policies Subcommittee on Pediatric Fever. Clinical policy for children younger than three years presenting to the emergency department with fever. Ann Emerg Med. 2003;42:530–545.
- , , , , , . Variation in occult injury screening for children with suspected abuse in selected US children's hospitals. Pediatrics. 2012;130:853–860.
- . Achieving data quality. How data from a pediatric health information system earns the trust of its users. J AHIMA. 2004;75:22–26.
- , , , . Corticosteroids and mortality in children with bacterial meningitis. JAMA. 2008;299:2048–2055.
- , , , , , . Research electronic data capture (REDCap)—a metadata‐driven methodology and workflow process for providing translational research informatics support. J Biomed Inform. 2009;42:377–381.
- , , , , , . Deaths attributed to pediatric complex chronic conditions: national trends and implications for supportive care services. Pediatrics. 2001;107:E99.
- US Census Bureau. Geographic terms and concepts—census divisions and census regions. Available at: https://www.census.gov/geo/reference/gtc/gtc_census_divreg.html. Accessed October 20, 2014.
- , , , . Initial emergency department diagnosis and return visits: risk versus perception. Ann Emerg Med. 1998;32:569–573.
- , , , , . A national depiction of children with return visits to the emergency department within 72 hours, 2001–2007. Pediatr Emerg Care. 2012;28:606–610.
- , , , et al. Pediatric observation status: are we overlooking a growing population in children's hospitals? J Hosp Med. 2012;7:530–536.
- , , , et al. Differences in designations of observation care in US freestanding children's hospitals: are they virtual or real? J Hosp Med. 2012;7:287–293.
- , , , , . Trends in the management of viral meningitis at United States children's hospitals. Pediatrics. 2013;131:670–676.
- , , , et al. Impact of increasing ondansetron use on clinical outcomes in children with gastroenteritis. JAMA Pediatr. 2014;168:321–329.
- , , , , . Race, otitis media, and antibiotic selection. Pediatrics. 2014;134:1059–1066.
- , , , et al. Establishing benchmarks for the hospitalized care of children with asthma, bronchiolitis, and pneumonia. Pediatrics. 2014;134:555–562.
- , , , , . Diagnostic testing and treatment of pediatric headache in the emergency department. J Pediatr. 2013;163:1634–1637.
© 2015 Society of Hospital Medicine
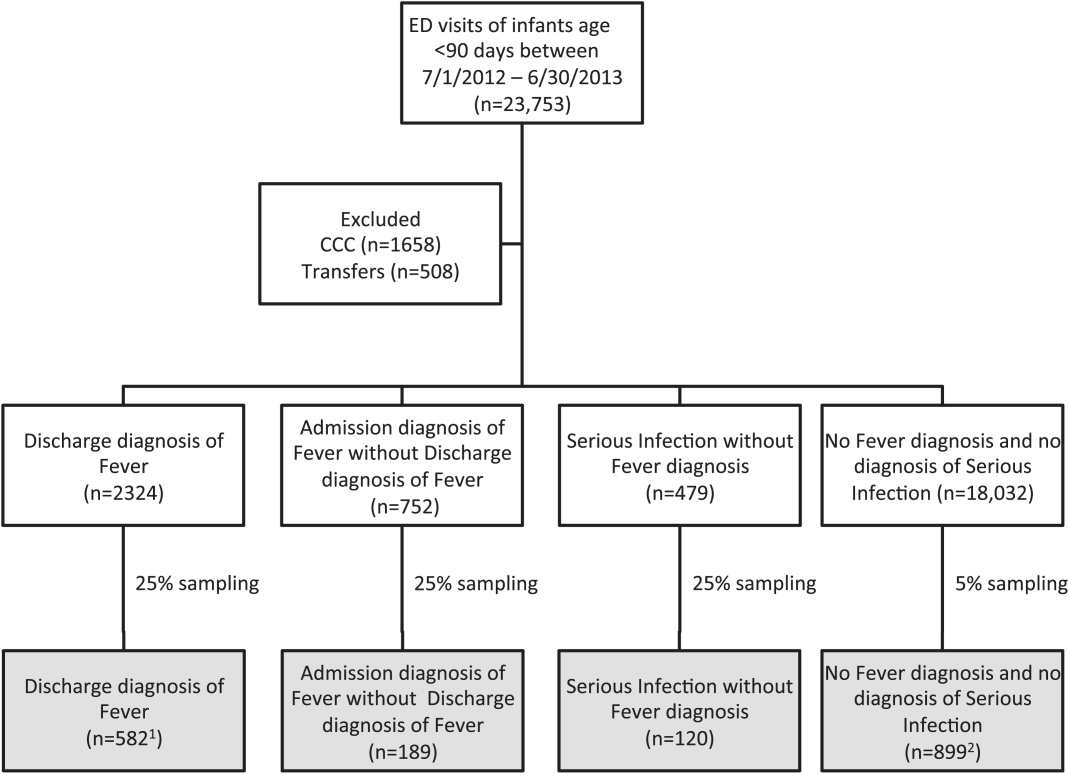
OUs and Patient Outcomes
Many pediatric hospitalizations are of short duration, and more than half of short‐stay hospitalizations are designated as observation status.[1, 2] Observation status is an administrative label assigned to patients who do not meet hospital or payer criteria for inpatient‐status care. Short‐stay observation‐status patients do not fit in traditional models of emergency department (ED) or inpatient care. EDs often focus on discharging or admitting patients within a matter of hours, whereas inpatient units tend to measure length of stay (LOS) in terms of days[3] and may not have systems in place to facilitate rapid discharge of short‐stay patients.[4] Observation units (OUs) have been established in some hospitals to address the unique care needs of short‐stay patients.[5, 6, 7]
Single‐site reports from children's hospitals with successful OUs have demonstrated shorter LOS and lower costs compared with inpatient settings.[6, 8, 9, 10, 11, 12, 13, 14] No prior study has examined hospital‐level effects of an OU on observation‐status patient outcomes. The Pediatric Health Information System (PHIS) database provides a unique opportunity to explore this question, because unlike other national hospital administrative databases,[15, 16] the PHIS dataset contains information about children under observation status. In addition, we know which PHIS hospitals had a dedicated OU in 2011.7
We hypothesized that overall observation‐status stays in hospitals with a dedicated OU would be of shorter duration with earlier discharges at lower cost than observation‐status stays in hospitals without a dedicated OU. We compared hospitals with and without a dedicated OU on secondary outcomes including rates of conversion to inpatient status and return care for any reason.
METHODS
We conducted a cross‐sectional analysis of hospital administrative data using the 2011 PHIS databasea national administrative database that contains resource utilization data from 43 participating hospitals located in 26 states plus the District of Columbia. These hospitals account for approximately 20% of pediatric hospitalizations in the United States.
For each hospital encounter, PHIS includes patient demographics, up to 41 International Classification of Diseases, Ninth Revision, Clinical Modification (ICD‐9‐CM) diagnoses, up to 41 ICD‐9‐CM procedures, and hospital charges for services. Data are deidentified prior to inclusion, but unique identifiers allow for determination of return visits and readmissions following an index visit for an individual patient. Data quality and reliability are assured jointly by the Children's Hospital Association (formerly Child Health Corporation of America, Overland Park, KS), participating hospitals, and Truven Health Analytics (New York, NY). This study, using administrative data, was not considered human subjects research by the policies of the Cincinnati Children's Hospital Medical Center Institutional Review Board.
Hospital Selection and Hospital Characteristics
The study sample was drawn from the 31 hospitals that reported observation‐status patient data to PHIS in 2011. Analyses were conducted in 2013, at which time 2011 was the most recent year of data. We categorized 14 hospitals as having a dedicated OU during 2011 based on information collected in 2013.7 To summarize briefly, we interviewed by telephone representatives of hospitals responding to an email query as to the presence of a geographically distinct OU for the care of unscheduled patients from the ED. Three of the 14 representatives reported their hospital had 2 OUs, 1 of which was a separate surgical OU. Ten OUs cared for both ED patients and patients with scheduled procedures; 8 units received patients from non‐ED sources. Hospitalists provided staffing in more than half of the OUs.
We attempted to identify administrative data that would signal care delivered in a dedicated OU using hospital charge codes reported to PHIS, but learned this was not possible due to between‐hospital variation in the specificity of the charge codes. Therefore, we were unable to determine if patient care was delivered in a dedicated OU or another setting, such as a general inpatient unit or the ED. Other hospital characteristics available from the PHIS dataset included the number of inpatient beds, ED visits, inpatient admissions, observation‐status stays, and payer mix. We calculated the percentage of ED visits resulting in admission by dividing the number of ED visits with associated inpatient or observation status by the total number of ED visits and the percentage of admissions under observation status by dividing the number of observation‐status stays by the total number of admissions under observation or inpatient status.
Visit Selection and Patient Characteristics
All observation‐status stays regardless of the point of entry into the hospital were eligible for this study. We excluded stays that were birth‐related, included intensive care, or resulted in transfer or death. Patient demographic characteristics used to describe the cohort included age, gender, race/ethnicity, and primary payer. Stays that began in the ED were identified by an emergency room charge within PHIS. Eligible stays were categorized using All Patient Refined Diagnosis Related Groups (APR‐DRGs) version 24 using the ICD‐9‐CM code‐based proprietary 3M software (3M Health Information Systems, St. Paul, MN). We determined the 15 top‐ranking APR‐DRGs among observation‐status stays in hospitals with a dedicated OU and hospitals without. Procedural stays were identified based on procedural APR‐DRGs (eg, tonsil and adenoid procedures) or the presence of an ICD‐9‐CM procedure code (eg, 331 spinal tap).
Measured Outcomes
Outcomes of observation‐status stays were determined within 4 categories: (1) LOS, (2) standardized costs, (3) conversion to inpatient status, and (4) return visits and readmissions. LOS was calculated in terms of nights spent in hospital for all stays by subtracting the discharge date from the admission date and in terms of hours for stays in the 28 hospitals that report admission and discharge hour to the PHIS database. Discharge timing was examined in 4, 6‐hour blocks starting at midnight. Standardized costs were derived from a charge master index that was created by taking the median costs from all PHIS hospitals for each charged service.[17] Standardized costs represent the estimated cost of providing any particular clinical activity but are not the cost to patients, nor do they represent the actual cost to any given hospital. This approach allows for cost comparisons across hospitals, without biases arising from using charges or from deriving costs using hospitals' ratios of costs to charges.[18] Conversion from observation to inpatient status was calculated by dividing the number of inpatient‐status stays with observation codes by the number of observation‐statusonly stays plus the number of inpatient‐status stays with observation codes. All‐cause 3‐day ED return visits and 30‐day readmissions to the same hospital were assessed using patient‐specific identifiers that allowed for tracking of ED return visits and readmissions following the index observation stay.
Data Analysis
Descriptive statistics were calculated for hospital and patient characteristics using medians and interquartile ranges (IQRs) for continuous factors and frequencies with percentages for categorical factors. Comparisons of these factors between hospitals with dedicated OUs and without were made using [2] and Wilcoxon rank sum tests as appropriate. Multivariable regression was performed using generalized linear mixed models treating hospital as a random effect and used patient age, the case‐mix index based on the APR‐DRG severity of illness, ED visit, and procedures associated with the index observation‐status stay. For continuous outcomes, we performed a log transformation on the outcome, confirmed the normality assumption, and back transformed the results. Sensitivity analyses were conducted to compare LOS, standardized costs, and conversation rates by hospital type for 10 of the 15 top‐ranking APR‐DRGs commonly cared for by pediatric hospitalists and to compare hospitals that reported the presence of an OU that was consistently open (24 hours per day, 7 days per week) and operating during the entire 2011 calendar year, and those without. Based on information gathered from the telephone interviews, hospitals with partially open OUs were similar to hospitals with continuously open OUs, such that they were included in our main analyses. All statistical analyses were performed using SAS version 9.3 (SAS Institute, Cary, NC). P values <0.05 were considered statistically significant.
RESULTS
Hospital Characteristics
Dedicated OUs were present in 14 of the 31 hospitals that reported observation‐status patient data to PHIS (Figure 1). Three of these hospitals had OUs that were open for 5 months or less in 2011; 1 unit opened, 1 unit closed, and 1 hospital operated a seasonal unit. The remaining 17 hospitals reported no OU that admitted unscheduled patients from the ED during 2011. Hospitals with a dedicated OU had more inpatient beds and higher median number of inpatient admissions than those without (Table 1). Hospitals were statistically similar in terms of total volume of ED visits, percentage of ED visits resulting in admission, total number of observation‐status stays, percentage of admissions under observation status, and payer mix.

| Overall, Median (IQR) | Hospitals With a Dedicated Observation Unit, Median (IQR) | Hospitals Without a Dedicated Observation Unit, Median (IQR) | P Value | |
|---|---|---|---|---|
| ||||
| No. of hospitals | 31 | 14 | 17 | |
| Total no. of inpatient beds | 273 (213311) | 304 (269425) | 246 (175293) | 0.006 |
| Total no. ED visits | 62971 (47,50497,723) | 87,892 (55,102117,119) | 53,151 (4750470,882) | 0.21 |
| ED visits resulting in admission, % | 13.1 (9.715.0) | 13.8 (10.5, 19.1) | 12.5 (9.714.5) | 0.31 |
| Total no. of inpatient admissions | 11,537 (9,26814,568) | 13,206 (11,32517,869) | 10,207 (8,64013,363) | 0.04 |
| Admissions under observation status, % | 25.7 (19.733.8) | 25.5 (21.431.4) | 26.0 (16.935.1) | 0.98 |
| Total no. of observation stays | 3,820 (27935672) | 4,850 (3,309 6,196) | 3,141 (2,3654,616) | 0.07 |
| Government payer, % | 60.2 (53.371.2) | 62.1 (54.9, 65.9) | 59.2 (53.373.7) | 0.89 |
Observation‐Status Patients by Hospital Type
In 2011, there were a total of 136,239 observation‐status stays69,983 (51.4%) within the 14 hospitals with a dedicated OU and 66,256 (48.6%) within the 17 hospitals without. Patient care originated in the ED for 57.8% observation‐status stays in hospitals with an OU compared with 53.0% of observation‐status stays in hospitals without (P<0.001). Compared with hospitals with a dedicated OU, those without a dedicated OU had higher percentages of observation‐status patients older than 12 years and non‐Hispanic and a higher percentage of observation‐status patients with private payer type (Table 2). The 15 top‐ranking APR‐DRGs accounted for roughly half of all observation‐status stays and were relatively consistent between hospitals with and without a dedicated OU (Table 3). Procedural care was frequently associated with observation‐status stays.
| Overall, No. (%) | Hospitals With a Dedicated Observation Unit, No. (%)* | Hospitals Without a Dedicated Observation Unit, No. (%) | P Value | |
|---|---|---|---|---|
| ||||
| Age | ||||
| <1 year | 23,845 (17.5) | 12,101 (17.3) | 11,744 (17.7) | <0.001 |
| 15 years | 53,405 (38.5) | 28,052 (40.1) | 24,353 (36.8) | |
| 612 years | 33,674 (24.7) | 17,215 (24.6) | 16,459 (24.8) | |
| 1318 years | 23,607 (17.3) | 11,472 (16.4) | 12,135 (18.3) | |
| >18 years | 2,708 (2) | 1,143 (1.6) | 1,565 (2.4) | |
| Gender | ||||
| Male | 76,142 (55.9) | 39,178 (56) | 36,964 (55.8) | 0.43 |
| Female | 60,025 (44.1) | 30,756 (44) | 29,269 (44.2) | |
| Race/ethnicity | ||||
| Non‐Hispanic white | 72,183 (53.0) | 30,653 (43.8) | 41,530 (62.7) | <0.001 |
| Non‐Hispanic black | 30,995 (22.8) | 16,314 (23.3) | 14,681 (22.2) | |
| Hispanic | 21,255 (15.6) | 16,583 (23.7) | 4,672 (7.1) | |
| Asian | 2,075 (1.5) | 1,313 (1.9) | 762 (1.2) | |
| Non‐Hispanic other | 9,731 (7.1) | 5,120 (7.3) | 4,611 (7.0) | |
| Payer | ||||
| Government | 68,725 (50.4) | 36,967 (52.8) | 31,758 (47.9) | <0.001 |
| Private | 48,416 (35.5) | 21,112 (30.2) | 27,304 (41.2) | |
| Other | 19,098 (14.0) | 11,904 (17) | 7,194 (10.9) | |
| Observation‐Status Patients in Hospitals With a Dedicated Observation Unit* | Observation‐Status Patients in Hospitals Without a Dedicated Observation Unit | ||||||||
|---|---|---|---|---|---|---|---|---|---|
| Rank | APR‐DRG | No. | % of All Observation Status Stays | % Began in ED | Rank | APR‐DRG | No. | % of All Observation Status Stays | % Began in ED |
| |||||||||
| 1 | Tonsil and adenoid procedures | 4,621 | 6.6 | 1.3 | 1 | Tonsil and adenoid procedures | 3,806 | 5.7 | 1.6 |
| 2 | Asthma | 4,246 | 6.1 | 85.3 | 2 | Asthma | 3,756 | 5.7 | 79.0 |
| 3 | Seizure | 3,516 | 5.0 | 52.0 | 3 | Seizure | 2,846 | 4.3 | 54.9 |
| 4 | Nonbacterial gastroenteritis | 3,286 | 4.7 | 85.8 | 4 | Upper respiratory infections | 2,733 | 4.1 | 69.6 |
| 5 | Bronchiolitis, RSV pneumonia | 3,093 | 4.4 | 78.5 | 5 | Nonbacterial gastroenteritis | 2,682 | 4.0 | 74.5 |
| 6 | Upper respiratory infections | 2,923 | 4.2 | 80.0 | 6 | Other digestive system diagnoses | 2,545 | 3.8 | 66.3 |
| 7 | Other digestive system diagnoses | 2,064 | 2.9 | 74.0 | 7 | Bronchiolitis, RSV pneumonia | 2,544 | 3.8 | 69.2 |
| 8 | Respiratory signs, symptoms, diagnoses | 2,052 | 2.9 | 81.6 | 8 | Shoulder and arm procedures | 1,862 | 2.8 | 72.6 |
| 9 | Other ENT/cranial/facial diagnoses | 1,684 | 2.4 | 43.6 | 9 | Appendectomy | 1,785 | 2.7 | 79.2 |
| 10 | Shoulder and arm procedures | 1,624 | 2.3 | 79.1 | 10 | Other ENT/cranial/facial diagnoses | 1,624 | 2.5 | 29.9 |
| 11 | Abdominal pain | 1,612 | 2.3 | 86.2 | 11 | Abdominal pain | 1,461 | 2.2 | 82.3 |
| 12 | Fever | 1,494 | 2.1 | 85.1 | 12 | Other factors influencing health status | 1,461 | 2.2 | 66.3 |
| 13 | Appendectomy | 1,465 | 2.1 | 66.4 | 13 | Cellulitis/other bacterial skin infections | 1,383 | 2.1 | 84.2 |
| 14 | Cellulitis/other bacterial skin infections | 1,393 | 2.0 | 86.4 | 14 | Respiratory signs, symptoms, diagnoses | 1,308 | 2.0 | 39.1 |
| 15 | Pneumonia NEC | 1,356 | 1.9 | 79.1 | 15 | Pneumonia NEC | 1,245 | 1.9 | 73.1 |
| Total | 36,429 | 52.0 | 57.8 | Total | 33,041 | 49.87 | 53.0 | ||
Outcomes of Observation‐Status Stays
A greater percentage of observation‐status stays in hospitals with a dedicated OU experienced a same‐day discharge (Table 4). In addition, a higher percentage of discharges occurred between midnight and 11 am in hospitals with a dedicated OU. However, overall risk‐adjusted LOS in hours (12.8 vs 12.2 hours, P=0.90) and risk‐adjusted total standardized costs ($2551 vs $2433, P=0.75) were similar between hospital types. These findings were consistent within the 1 APR‐DRGs commonly cared for by pediatric hospitalists (see Supporting Information, Appendix 1, in the online version of this article). Overall, conversion from observation to inpatient status was significantly higher in hospitals with a dedicated OU compared with hospitals without; however, this pattern was not consistent across the 10 APR‐DRGs commonly cared for by pediatric hospitalists (see Supporting Information, Appendix 1, in the online version of this article). Adjusted odds of 3‐day ED return visits and 30‐day readmissions were comparable between hospital groups.
| Observation‐Status Patients in Hospitals With a Dedicated Observation Unit | Observation‐Status Patients in Hospitals Without a Dedicated Observation Unit | P Value | |
|---|---|---|---|
| |||
| No. of hospitals | 14 | 17 | |
| Length of stay, h, median (IQR) | 12.8 (6.923.7) | 12.2 (721.3) | 0.90 |
| 0 midnights, no. (%) | 16,678 (23.8) | 14,648 (22.1) | <.001 |
| 1 midnight, no. (%) | 46,144 (65.9) | 44,559 (67.3) | |
| 2 midnights or more, no. (%) | 7,161 (10.2) | 7,049 (10.6) | |
| Discharge timing, no. (%) | |||
| Midnight5 am | 1,223 (1.9) | 408 (0.7) | <0.001 |
| 6 am11 am | 18,916 (29.3) | 15,914 (27.1) | |
| Noon5 pm | 32,699 (50.7) | 31,619 (53.9) | |
| 6 pm11 pm | 11,718 (18.2) | 10,718 (18.3) | |
| Total standardized costs, $, median (IQR) | 2,551.3 (2,053.93,169.1) | 2,433.4 (1,998.42,963) | 0.75 |
| Conversion to inpatient status | 11.06% | 9.63% | <0.01 |
| Return care, AOR (95% CI) | |||
| 3‐day ED return visit | 0.93 (0.77‐1.12) | Referent | 0.46 |
| 30‐day readmission | 0.88 (0.67‐1.15) | Referent | 0.36 |
We found similar results in sensitivity analyses comparing observation‐status stays in hospitals with a continuously open OU (open 24 hours per day, 7 days per week, for all of 2011 [n=10 hospitals]) to those without(see Supporting Information, Appendix 2, in the online version of this article). However, there were, on average, more observation‐status stays in hospitals with a continuously open OU (median 5605, IQR 42077089) than hospitals without (median 3309, IQR 26784616) (P=0.04). In contrast to our main results, conversion to inpatient status was lower in hospitals with a continuously open OU compared with hospitals without (8.52% vs 11.57%, P<0.01).
DISCUSSION
Counter to our hypothesis, we did not find hospital‐level differences in length of stay or costs for observation‐status patients cared for in hospitals with and without a dedicated OU, though hospitals with dedicated OUs did have more same‐day discharges and more morning discharges. The lack of observed differences in LOS and costs may reflect the fact that many children under observation status are treated throughout the hospital, even in facilities with a dedicated OU. Access to a dedicated OU is limited by factors including small numbers of OU beds and specific low acuity/low complexity OU admission criteria.[7] The inclusion of all children admitted under observation status in our analyses may have diluted any effect of dedicated OUs at the hospital level, but was necessary due to the inability to identify location of care for children admitted under observation status. Location of care is an important variable that should be incorporated into administrative databases to allow for comparative effectiveness research designs. Until such data are available, chart review at individual hospitals would be necessary to determine which patients received care in an OU.
We did find that discharges for observation‐status patients occurred earlier in the day in hospitals with a dedicated OU when compared with observation‐status patients in hospitals without a dedicated OU. In addition, the percentage of same‐day discharges was higher among observation‐status patients treated in hospitals with a dedicated OU. These differences may stem from policies and procedures that encourage rapid discharge in dedicated OUs, and those practices may affect other care areas. For example, OUs may enforce policies requiring family presence at the bedside or utilize staffing models where doctors and nurses are in frequent communication, both of which would facilitate discharge as soon as a patient no longer required hospital‐based care.[7] A retrospective chart review study design could be used to identify discharge processes and other key characteristics of highly performing OUs.
We found conflicting results in our main and sensitivity analyses related to conversion to inpatient status. Lower percentages of observation‐status patients converting to inpatient status indicates greater success in the delivery of observation care based on established performance metrics.[19] Lower rates of conversion to inpatient status may be the result of stricter admission criteria for some diagnosis and in hospitals with a continuously open dedicate OU, more refined processes for utilization review that allow for patients to be placed into the correct status (observation vs inpatient) at the time of admission, or efforts to educate providers about the designation of observation status.[7] It is also possible that fewer observation‐status patients convert to inpatient status in hospitals with a continuously open dedicated OU because such a change would require movement of the patient to an inpatient bed.
These analyses were more comprehensive than our prior studies[2, 20] in that we included both patients who were treated first in the ED and those who were not. In addition to the APR‐DRGs representative of conditions that have been successfully treated in ED‐based pediatric OUs (eg, asthma, seizures, gastroenteritis, cellulitis),[8, 9, 21, 22] we found observation‐status was commonly associated with procedural care. This population of patients may be relevant to hospitalists who staff OUs that provide both unscheduled and postprocedural care. The colocation of medical and postprocedural patients has been described by others[8, 23] and was reported to occur in over half of the OUs included in this study.[7] The extent to which postprocedure observation care is provided in general OUs staffed by hospitalists represents another opportunity for further study.
Hospitals face many considerations when determining if and how they will provide observation services to patients expected to experience short stays.[7] Some hospitals may be unable to justify an OU for all or part of the year based on the volume of admissions or the costs to staff an OU.[24, 25] Other hospitals may open an OU to promote patient flow and reduce ED crowding.[26] Hospitals may also be influenced by reimbursement policies related to observation‐status stays. Although we did not observe differences in overall payer mix, we did find higher percentages of observation‐status patients in hospitals with dedicated OUs to have public insurance. Although hospital contracts with payers around observation status patients are complex and beyond the scope of this analysis, it is possible that hospitals have established OUs because of increasingly stringent rules or criteria to meet inpatient status or experiences with high volumes of observation‐status patients covered by a particular payer. Nevertheless, the brief nature of many pediatric hospitalizations and the scarcity of pediatric OU beds must be considered in policy changes that result from national discussions about the appropriateness of inpatient stays shorter than 2 nights in duration.[27]
Limitations
The primary limitation to our analyses is the lack of ability to identify patients who were treated in a dedicated OU because few hospitals provided data to PHIS that allowed for the identification of the unit or location of care. Second, it is possible that some hospitals were misclassified as not having a dedicated OU based on our survey, which initially inquired about OUs that provided care to patients first treated in the ED. Therefore, OUs that exclusively care for postoperative patients or patients with scheduled treatments may be present in hospitals that we have labeled as not having a dedicated OU. This potential misclassification would bias our results toward finding no differences. Third, in any study of administrative data there is potential that diagnosis codes are incomplete or inaccurately capture the underlying reason for the episode of care. Fourth, the experiences of the free‐standing children's hospitals that contribute data to PHIS may not be generalizable to other hospitals that provide observation care to children. Finally, return care may be underestimated, as children could receive treatment at another hospital following discharge from a PHIS hospital. Care outside of PHIS hospitals would not be captured, but we do not expect this to differ for hospitals with and without dedicated OUs. It is possible that health information exchanges will permit more comprehensive analyses of care across different hospitals in the future.
CONCLUSION
Observation status patients are similar in hospitals with and without dedicated observation units that admit children from the ED. The presence of a dedicated OU appears to have an influence on same‐day and morning discharges across all observation‐status stays without impacting other hospital‐level outcomes. Inclusion of location of care (eg, geographically distinct dedicated OU vs general inpatient unit vs ED) in hospital administrative datasets would allow for meaningful comparisons of different models of care for short‐stay observation‐status patients.
Acknowledgements
The authors thank John P. Harding, MBA, FACHE, Children's Hospital of the King's Daughters, Norfolk, Virginia for his input on the study design.
Disclosures: Dr. Hall had full access to the data and takes responsibility for the integrity of the data and the accuracy of the data analysis. Internal funds from the Children's Hospital Association supported the conduct of this work. The authors have no financial relationships or conflicts of interest to disclose.
Many pediatric hospitalizations are of short duration, and more than half of short‐stay hospitalizations are designated as observation status.[1, 2] Observation status is an administrative label assigned to patients who do not meet hospital or payer criteria for inpatient‐status care. Short‐stay observation‐status patients do not fit in traditional models of emergency department (ED) or inpatient care. EDs often focus on discharging or admitting patients within a matter of hours, whereas inpatient units tend to measure length of stay (LOS) in terms of days[3] and may not have systems in place to facilitate rapid discharge of short‐stay patients.[4] Observation units (OUs) have been established in some hospitals to address the unique care needs of short‐stay patients.[5, 6, 7]
Single‐site reports from children's hospitals with successful OUs have demonstrated shorter LOS and lower costs compared with inpatient settings.[6, 8, 9, 10, 11, 12, 13, 14] No prior study has examined hospital‐level effects of an OU on observation‐status patient outcomes. The Pediatric Health Information System (PHIS) database provides a unique opportunity to explore this question, because unlike other national hospital administrative databases,[15, 16] the PHIS dataset contains information about children under observation status. In addition, we know which PHIS hospitals had a dedicated OU in 2011.7
We hypothesized that overall observation‐status stays in hospitals with a dedicated OU would be of shorter duration with earlier discharges at lower cost than observation‐status stays in hospitals without a dedicated OU. We compared hospitals with and without a dedicated OU on secondary outcomes including rates of conversion to inpatient status and return care for any reason.
METHODS
We conducted a cross‐sectional analysis of hospital administrative data using the 2011 PHIS databasea national administrative database that contains resource utilization data from 43 participating hospitals located in 26 states plus the District of Columbia. These hospitals account for approximately 20% of pediatric hospitalizations in the United States.
For each hospital encounter, PHIS includes patient demographics, up to 41 International Classification of Diseases, Ninth Revision, Clinical Modification (ICD‐9‐CM) diagnoses, up to 41 ICD‐9‐CM procedures, and hospital charges for services. Data are deidentified prior to inclusion, but unique identifiers allow for determination of return visits and readmissions following an index visit for an individual patient. Data quality and reliability are assured jointly by the Children's Hospital Association (formerly Child Health Corporation of America, Overland Park, KS), participating hospitals, and Truven Health Analytics (New York, NY). This study, using administrative data, was not considered human subjects research by the policies of the Cincinnati Children's Hospital Medical Center Institutional Review Board.
Hospital Selection and Hospital Characteristics
The study sample was drawn from the 31 hospitals that reported observation‐status patient data to PHIS in 2011. Analyses were conducted in 2013, at which time 2011 was the most recent year of data. We categorized 14 hospitals as having a dedicated OU during 2011 based on information collected in 2013.7 To summarize briefly, we interviewed by telephone representatives of hospitals responding to an email query as to the presence of a geographically distinct OU for the care of unscheduled patients from the ED. Three of the 14 representatives reported their hospital had 2 OUs, 1 of which was a separate surgical OU. Ten OUs cared for both ED patients and patients with scheduled procedures; 8 units received patients from non‐ED sources. Hospitalists provided staffing in more than half of the OUs.
We attempted to identify administrative data that would signal care delivered in a dedicated OU using hospital charge codes reported to PHIS, but learned this was not possible due to between‐hospital variation in the specificity of the charge codes. Therefore, we were unable to determine if patient care was delivered in a dedicated OU or another setting, such as a general inpatient unit or the ED. Other hospital characteristics available from the PHIS dataset included the number of inpatient beds, ED visits, inpatient admissions, observation‐status stays, and payer mix. We calculated the percentage of ED visits resulting in admission by dividing the number of ED visits with associated inpatient or observation status by the total number of ED visits and the percentage of admissions under observation status by dividing the number of observation‐status stays by the total number of admissions under observation or inpatient status.
Visit Selection and Patient Characteristics
All observation‐status stays regardless of the point of entry into the hospital were eligible for this study. We excluded stays that were birth‐related, included intensive care, or resulted in transfer or death. Patient demographic characteristics used to describe the cohort included age, gender, race/ethnicity, and primary payer. Stays that began in the ED were identified by an emergency room charge within PHIS. Eligible stays were categorized using All Patient Refined Diagnosis Related Groups (APR‐DRGs) version 24 using the ICD‐9‐CM code‐based proprietary 3M software (3M Health Information Systems, St. Paul, MN). We determined the 15 top‐ranking APR‐DRGs among observation‐status stays in hospitals with a dedicated OU and hospitals without. Procedural stays were identified based on procedural APR‐DRGs (eg, tonsil and adenoid procedures) or the presence of an ICD‐9‐CM procedure code (eg, 331 spinal tap).
Measured Outcomes
Outcomes of observation‐status stays were determined within 4 categories: (1) LOS, (2) standardized costs, (3) conversion to inpatient status, and (4) return visits and readmissions. LOS was calculated in terms of nights spent in hospital for all stays by subtracting the discharge date from the admission date and in terms of hours for stays in the 28 hospitals that report admission and discharge hour to the PHIS database. Discharge timing was examined in 4, 6‐hour blocks starting at midnight. Standardized costs were derived from a charge master index that was created by taking the median costs from all PHIS hospitals for each charged service.[17] Standardized costs represent the estimated cost of providing any particular clinical activity but are not the cost to patients, nor do they represent the actual cost to any given hospital. This approach allows for cost comparisons across hospitals, without biases arising from using charges or from deriving costs using hospitals' ratios of costs to charges.[18] Conversion from observation to inpatient status was calculated by dividing the number of inpatient‐status stays with observation codes by the number of observation‐statusonly stays plus the number of inpatient‐status stays with observation codes. All‐cause 3‐day ED return visits and 30‐day readmissions to the same hospital were assessed using patient‐specific identifiers that allowed for tracking of ED return visits and readmissions following the index observation stay.
Data Analysis
Descriptive statistics were calculated for hospital and patient characteristics using medians and interquartile ranges (IQRs) for continuous factors and frequencies with percentages for categorical factors. Comparisons of these factors between hospitals with dedicated OUs and without were made using [2] and Wilcoxon rank sum tests as appropriate. Multivariable regression was performed using generalized linear mixed models treating hospital as a random effect and used patient age, the case‐mix index based on the APR‐DRG severity of illness, ED visit, and procedures associated with the index observation‐status stay. For continuous outcomes, we performed a log transformation on the outcome, confirmed the normality assumption, and back transformed the results. Sensitivity analyses were conducted to compare LOS, standardized costs, and conversation rates by hospital type for 10 of the 15 top‐ranking APR‐DRGs commonly cared for by pediatric hospitalists and to compare hospitals that reported the presence of an OU that was consistently open (24 hours per day, 7 days per week) and operating during the entire 2011 calendar year, and those without. Based on information gathered from the telephone interviews, hospitals with partially open OUs were similar to hospitals with continuously open OUs, such that they were included in our main analyses. All statistical analyses were performed using SAS version 9.3 (SAS Institute, Cary, NC). P values <0.05 were considered statistically significant.
RESULTS
Hospital Characteristics
Dedicated OUs were present in 14 of the 31 hospitals that reported observation‐status patient data to PHIS (Figure 1). Three of these hospitals had OUs that were open for 5 months or less in 2011; 1 unit opened, 1 unit closed, and 1 hospital operated a seasonal unit. The remaining 17 hospitals reported no OU that admitted unscheduled patients from the ED during 2011. Hospitals with a dedicated OU had more inpatient beds and higher median number of inpatient admissions than those without (Table 1). Hospitals were statistically similar in terms of total volume of ED visits, percentage of ED visits resulting in admission, total number of observation‐status stays, percentage of admissions under observation status, and payer mix.
| Overall, Median (IQR) | Hospitals With a Dedicated Observation Unit, Median (IQR) | Hospitals Without a Dedicated Observation Unit, Median (IQR) | P Value | |
|---|---|---|---|---|
| ||||
| No. of hospitals | 31 | 14 | 17 | |
| Total no. of inpatient beds | 273 (213311) | 304 (269425) | 246 (175293) | 0.006 |
| Total no. ED visits | 62971 (47,50497,723) | 87,892 (55,102117,119) | 53,151 (4750470,882) | 0.21 |
| ED visits resulting in admission, % | 13.1 (9.715.0) | 13.8 (10.5, 19.1) | 12.5 (9.714.5) | 0.31 |
| Total no. of inpatient admissions | 11,537 (9,26814,568) | 13,206 (11,32517,869) | 10,207 (8,64013,363) | 0.04 |
| Admissions under observation status, % | 25.7 (19.733.8) | 25.5 (21.431.4) | 26.0 (16.935.1) | 0.98 |
| Total no. of observation stays | 3,820 (27935672) | 4,850 (3,309 6,196) | 3,141 (2,3654,616) | 0.07 |
| Government payer, % | 60.2 (53.371.2) | 62.1 (54.9, 65.9) | 59.2 (53.373.7) | 0.89 |
Observation‐Status Patients by Hospital Type
In 2011, there were a total of 136,239 observation‐status stays69,983 (51.4%) within the 14 hospitals with a dedicated OU and 66,256 (48.6%) within the 17 hospitals without. Patient care originated in the ED for 57.8% observation‐status stays in hospitals with an OU compared with 53.0% of observation‐status stays in hospitals without (P<0.001). Compared with hospitals with a dedicated OU, those without a dedicated OU had higher percentages of observation‐status patients older than 12 years and non‐Hispanic and a higher percentage of observation‐status patients with private payer type (Table 2). The 15 top‐ranking APR‐DRGs accounted for roughly half of all observation‐status stays and were relatively consistent between hospitals with and without a dedicated OU (Table 3). Procedural care was frequently associated with observation‐status stays.
| Overall, No. (%) | Hospitals With a Dedicated Observation Unit, No. (%)* | Hospitals Without a Dedicated Observation Unit, No. (%) | P Value | |
|---|---|---|---|---|
| ||||
| Age | ||||
| <1 year | 23,845 (17.5) | 12,101 (17.3) | 11,744 (17.7) | <0.001 |
| 15 years | 53,405 (38.5) | 28,052 (40.1) | 24,353 (36.8) | |
| 612 years | 33,674 (24.7) | 17,215 (24.6) | 16,459 (24.8) | |
| 1318 years | 23,607 (17.3) | 11,472 (16.4) | 12,135 (18.3) | |
| >18 years | 2,708 (2) | 1,143 (1.6) | 1,565 (2.4) | |
| Gender | ||||
| Male | 76,142 (55.9) | 39,178 (56) | 36,964 (55.8) | 0.43 |
| Female | 60,025 (44.1) | 30,756 (44) | 29,269 (44.2) | |
| Race/ethnicity | ||||
| Non‐Hispanic white | 72,183 (53.0) | 30,653 (43.8) | 41,530 (62.7) | <0.001 |
| Non‐Hispanic black | 30,995 (22.8) | 16,314 (23.3) | 14,681 (22.2) | |
| Hispanic | 21,255 (15.6) | 16,583 (23.7) | 4,672 (7.1) | |
| Asian | 2,075 (1.5) | 1,313 (1.9) | 762 (1.2) | |
| Non‐Hispanic other | 9,731 (7.1) | 5,120 (7.3) | 4,611 (7.0) | |
| Payer | ||||
| Government | 68,725 (50.4) | 36,967 (52.8) | 31,758 (47.9) | <0.001 |
| Private | 48,416 (35.5) | 21,112 (30.2) | 27,304 (41.2) | |
| Other | 19,098 (14.0) | 11,904 (17) | 7,194 (10.9) | |
| Observation‐Status Patients in Hospitals With a Dedicated Observation Unit* | Observation‐Status Patients in Hospitals Without a Dedicated Observation Unit | ||||||||
|---|---|---|---|---|---|---|---|---|---|
| Rank | APR‐DRG | No. | % of All Observation Status Stays | % Began in ED | Rank | APR‐DRG | No. | % of All Observation Status Stays | % Began in ED |
| |||||||||
| 1 | Tonsil and adenoid procedures | 4,621 | 6.6 | 1.3 | 1 | Tonsil and adenoid procedures | 3,806 | 5.7 | 1.6 |
| 2 | Asthma | 4,246 | 6.1 | 85.3 | 2 | Asthma | 3,756 | 5.7 | 79.0 |
| 3 | Seizure | 3,516 | 5.0 | 52.0 | 3 | Seizure | 2,846 | 4.3 | 54.9 |
| 4 | Nonbacterial gastroenteritis | 3,286 | 4.7 | 85.8 | 4 | Upper respiratory infections | 2,733 | 4.1 | 69.6 |
| 5 | Bronchiolitis, RSV pneumonia | 3,093 | 4.4 | 78.5 | 5 | Nonbacterial gastroenteritis | 2,682 | 4.0 | 74.5 |
| 6 | Upper respiratory infections | 2,923 | 4.2 | 80.0 | 6 | Other digestive system diagnoses | 2,545 | 3.8 | 66.3 |
| 7 | Other digestive system diagnoses | 2,064 | 2.9 | 74.0 | 7 | Bronchiolitis, RSV pneumonia | 2,544 | 3.8 | 69.2 |
| 8 | Respiratory signs, symptoms, diagnoses | 2,052 | 2.9 | 81.6 | 8 | Shoulder and arm procedures | 1,862 | 2.8 | 72.6 |
| 9 | Other ENT/cranial/facial diagnoses | 1,684 | 2.4 | 43.6 | 9 | Appendectomy | 1,785 | 2.7 | 79.2 |
| 10 | Shoulder and arm procedures | 1,624 | 2.3 | 79.1 | 10 | Other ENT/cranial/facial diagnoses | 1,624 | 2.5 | 29.9 |
| 11 | Abdominal pain | 1,612 | 2.3 | 86.2 | 11 | Abdominal pain | 1,461 | 2.2 | 82.3 |
| 12 | Fever | 1,494 | 2.1 | 85.1 | 12 | Other factors influencing health status | 1,461 | 2.2 | 66.3 |
| 13 | Appendectomy | 1,465 | 2.1 | 66.4 | 13 | Cellulitis/other bacterial skin infections | 1,383 | 2.1 | 84.2 |
| 14 | Cellulitis/other bacterial skin infections | 1,393 | 2.0 | 86.4 | 14 | Respiratory signs, symptoms, diagnoses | 1,308 | 2.0 | 39.1 |
| 15 | Pneumonia NEC | 1,356 | 1.9 | 79.1 | 15 | Pneumonia NEC | 1,245 | 1.9 | 73.1 |
| Total | 36,429 | 52.0 | 57.8 | Total | 33,041 | 49.87 | 53.0 | ||
Outcomes of Observation‐Status Stays
A greater percentage of observation‐status stays in hospitals with a dedicated OU experienced a same‐day discharge (Table 4). In addition, a higher percentage of discharges occurred between midnight and 11 am in hospitals with a dedicated OU. However, overall risk‐adjusted LOS in hours (12.8 vs 12.2 hours, P=0.90) and risk‐adjusted total standardized costs ($2551 vs $2433, P=0.75) were similar between hospital types. These findings were consistent within the 1 APR‐DRGs commonly cared for by pediatric hospitalists (see Supporting Information, Appendix 1, in the online version of this article). Overall, conversion from observation to inpatient status was significantly higher in hospitals with a dedicated OU compared with hospitals without; however, this pattern was not consistent across the 10 APR‐DRGs commonly cared for by pediatric hospitalists (see Supporting Information, Appendix 1, in the online version of this article). Adjusted odds of 3‐day ED return visits and 30‐day readmissions were comparable between hospital groups.
| Observation‐Status Patients in Hospitals With a Dedicated Observation Unit | Observation‐Status Patients in Hospitals Without a Dedicated Observation Unit | P Value | |
|---|---|---|---|
| |||
| No. of hospitals | 14 | 17 | |
| Length of stay, h, median (IQR) | 12.8 (6.923.7) | 12.2 (721.3) | 0.90 |
| 0 midnights, no. (%) | 16,678 (23.8) | 14,648 (22.1) | <.001 |
| 1 midnight, no. (%) | 46,144 (65.9) | 44,559 (67.3) | |
| 2 midnights or more, no. (%) | 7,161 (10.2) | 7,049 (10.6) | |
| Discharge timing, no. (%) | |||
| Midnight5 am | 1,223 (1.9) | 408 (0.7) | <0.001 |
| 6 am11 am | 18,916 (29.3) | 15,914 (27.1) | |
| Noon5 pm | 32,699 (50.7) | 31,619 (53.9) | |
| 6 pm11 pm | 11,718 (18.2) | 10,718 (18.3) | |
| Total standardized costs, $, median (IQR) | 2,551.3 (2,053.93,169.1) | 2,433.4 (1,998.42,963) | 0.75 |
| Conversion to inpatient status | 11.06% | 9.63% | <0.01 |
| Return care, AOR (95% CI) | |||
| 3‐day ED return visit | 0.93 (0.77‐1.12) | Referent | 0.46 |
| 30‐day readmission | 0.88 (0.67‐1.15) | Referent | 0.36 |
We found similar results in sensitivity analyses comparing observation‐status stays in hospitals with a continuously open OU (open 24 hours per day, 7 days per week, for all of 2011 [n=10 hospitals]) to those without(see Supporting Information, Appendix 2, in the online version of this article). However, there were, on average, more observation‐status stays in hospitals with a continuously open OU (median 5605, IQR 42077089) than hospitals without (median 3309, IQR 26784616) (P=0.04). In contrast to our main results, conversion to inpatient status was lower in hospitals with a continuously open OU compared with hospitals without (8.52% vs 11.57%, P<0.01).
DISCUSSION
Counter to our hypothesis, we did not find hospital‐level differences in length of stay or costs for observation‐status patients cared for in hospitals with and without a dedicated OU, though hospitals with dedicated OUs did have more same‐day discharges and more morning discharges. The lack of observed differences in LOS and costs may reflect the fact that many children under observation status are treated throughout the hospital, even in facilities with a dedicated OU. Access to a dedicated OU is limited by factors including small numbers of OU beds and specific low acuity/low complexity OU admission criteria.[7] The inclusion of all children admitted under observation status in our analyses may have diluted any effect of dedicated OUs at the hospital level, but was necessary due to the inability to identify location of care for children admitted under observation status. Location of care is an important variable that should be incorporated into administrative databases to allow for comparative effectiveness research designs. Until such data are available, chart review at individual hospitals would be necessary to determine which patients received care in an OU.
We did find that discharges for observation‐status patients occurred earlier in the day in hospitals with a dedicated OU when compared with observation‐status patients in hospitals without a dedicated OU. In addition, the percentage of same‐day discharges was higher among observation‐status patients treated in hospitals with a dedicated OU. These differences may stem from policies and procedures that encourage rapid discharge in dedicated OUs, and those practices may affect other care areas. For example, OUs may enforce policies requiring family presence at the bedside or utilize staffing models where doctors and nurses are in frequent communication, both of which would facilitate discharge as soon as a patient no longer required hospital‐based care.[7] A retrospective chart review study design could be used to identify discharge processes and other key characteristics of highly performing OUs.
We found conflicting results in our main and sensitivity analyses related to conversion to inpatient status. Lower percentages of observation‐status patients converting to inpatient status indicates greater success in the delivery of observation care based on established performance metrics.[19] Lower rates of conversion to inpatient status may be the result of stricter admission criteria for some diagnosis and in hospitals with a continuously open dedicate OU, more refined processes for utilization review that allow for patients to be placed into the correct status (observation vs inpatient) at the time of admission, or efforts to educate providers about the designation of observation status.[7] It is also possible that fewer observation‐status patients convert to inpatient status in hospitals with a continuously open dedicated OU because such a change would require movement of the patient to an inpatient bed.
These analyses were more comprehensive than our prior studies[2, 20] in that we included both patients who were treated first in the ED and those who were not. In addition to the APR‐DRGs representative of conditions that have been successfully treated in ED‐based pediatric OUs (eg, asthma, seizures, gastroenteritis, cellulitis),[8, 9, 21, 22] we found observation‐status was commonly associated with procedural care. This population of patients may be relevant to hospitalists who staff OUs that provide both unscheduled and postprocedural care. The colocation of medical and postprocedural patients has been described by others[8, 23] and was reported to occur in over half of the OUs included in this study.[7] The extent to which postprocedure observation care is provided in general OUs staffed by hospitalists represents another opportunity for further study.
Hospitals face many considerations when determining if and how they will provide observation services to patients expected to experience short stays.[7] Some hospitals may be unable to justify an OU for all or part of the year based on the volume of admissions or the costs to staff an OU.[24, 25] Other hospitals may open an OU to promote patient flow and reduce ED crowding.[26] Hospitals may also be influenced by reimbursement policies related to observation‐status stays. Although we did not observe differences in overall payer mix, we did find higher percentages of observation‐status patients in hospitals with dedicated OUs to have public insurance. Although hospital contracts with payers around observation status patients are complex and beyond the scope of this analysis, it is possible that hospitals have established OUs because of increasingly stringent rules or criteria to meet inpatient status or experiences with high volumes of observation‐status patients covered by a particular payer. Nevertheless, the brief nature of many pediatric hospitalizations and the scarcity of pediatric OU beds must be considered in policy changes that result from national discussions about the appropriateness of inpatient stays shorter than 2 nights in duration.[27]
Limitations
The primary limitation to our analyses is the lack of ability to identify patients who were treated in a dedicated OU because few hospitals provided data to PHIS that allowed for the identification of the unit or location of care. Second, it is possible that some hospitals were misclassified as not having a dedicated OU based on our survey, which initially inquired about OUs that provided care to patients first treated in the ED. Therefore, OUs that exclusively care for postoperative patients or patients with scheduled treatments may be present in hospitals that we have labeled as not having a dedicated OU. This potential misclassification would bias our results toward finding no differences. Third, in any study of administrative data there is potential that diagnosis codes are incomplete or inaccurately capture the underlying reason for the episode of care. Fourth, the experiences of the free‐standing children's hospitals that contribute data to PHIS may not be generalizable to other hospitals that provide observation care to children. Finally, return care may be underestimated, as children could receive treatment at another hospital following discharge from a PHIS hospital. Care outside of PHIS hospitals would not be captured, but we do not expect this to differ for hospitals with and without dedicated OUs. It is possible that health information exchanges will permit more comprehensive analyses of care across different hospitals in the future.
CONCLUSION
Observation status patients are similar in hospitals with and without dedicated observation units that admit children from the ED. The presence of a dedicated OU appears to have an influence on same‐day and morning discharges across all observation‐status stays without impacting other hospital‐level outcomes. Inclusion of location of care (eg, geographically distinct dedicated OU vs general inpatient unit vs ED) in hospital administrative datasets would allow for meaningful comparisons of different models of care for short‐stay observation‐status patients.
Acknowledgements
The authors thank John P. Harding, MBA, FACHE, Children's Hospital of the King's Daughters, Norfolk, Virginia for his input on the study design.
Disclosures: Dr. Hall had full access to the data and takes responsibility for the integrity of the data and the accuracy of the data analysis. Internal funds from the Children's Hospital Association supported the conduct of this work. The authors have no financial relationships or conflicts of interest to disclose.
© 2015 Society of Hospital Medicine
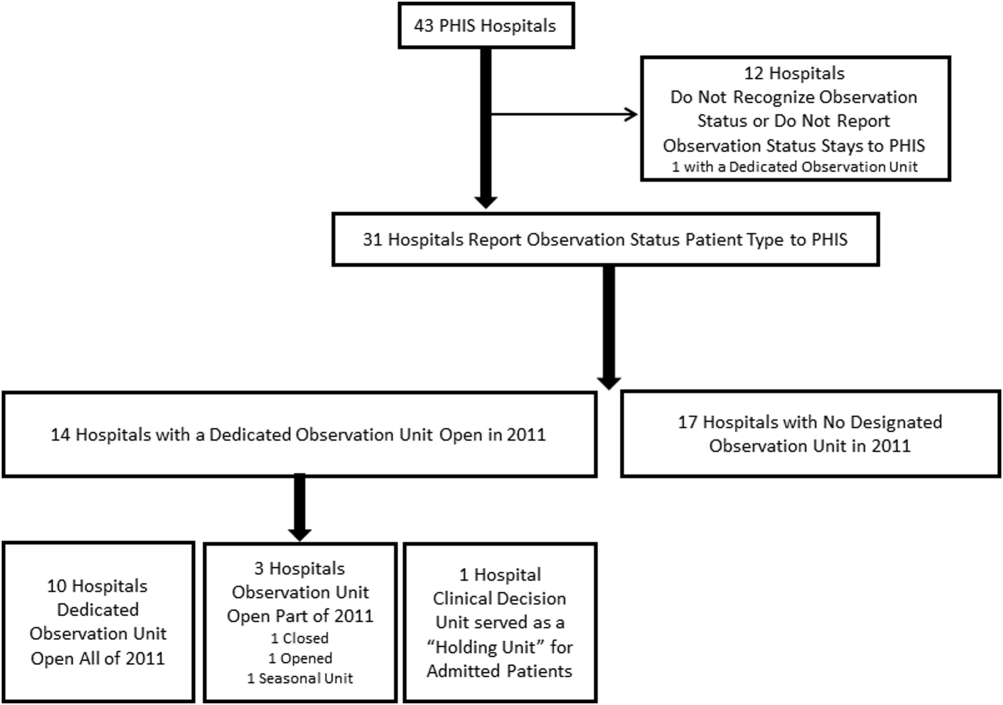
Febrile Infant CPGs
Febrile young infants are at high risk for serious bacterial infection (SBI) with reported rates of 8.5% to 12%, even higher in neonates 28 days of age.[1, 2, 3] As a result, febrile infants often undergo extensive diagnostic evaluation consisting of a combination of urine, blood, and cerebrospinal fluid (CSF) testing.[4, 5, 6] Several clinical prediction algorithms use this diagnostic testing to identify febrile infants at low risk for SBI, but they differ with respect to age range, recommended testing, antibiotic administration, and threshold for hospitalization.[4, 5, 6] Additionally, the optimal management strategy for this population has not been defined.[7] Consequently, laboratory testing, antibiotic use, and hospitalization for febrile young infants vary widely among hospitals.[8, 9, 10]
Clinical practice guidelines (CPGs) are designed to implement evidence‐based care and reduce practice variability, with the goal of improving quality of care and optimizing costs.[11] Implementation of a CPG for management of febrile young infants in the Intermountain Healthcare System was associated with greater adherence to evidence‐based care and lower costs.[12] However, when strong evidence is lacking, different interpretations of febrile infant risk classification incorporated into local CPGs may be a major driver of the across‐hospital practice variation observed in prior studies.[8, 9] Understanding sources of variability as well as determining the association of CPGs with clinicians' practice patterns can help identify quality improvement opportunities, either through national benchmarking or local efforts.
Our primary objectives were to compare (1) recommendations of pediatric emergency departmentbased institutional CPGs for febrile young infants and (2) rates of urine, blood, CSF testing, hospitalization, and ceftriaxone use at emergency department (ED) discharge based upon CPG presence and the specific CPG recommendations. Our secondary objectives were to describe the association of CPGs with healthcare costs and return visits for SBI.
METHODS
Study Design
We used the Pediatric Health Information System (PHIS) to identify febrile infants 56 days of age who presented to the ED between January 1, 2013 and December 31, 2013. We also surveyed ED providers at participating PHIS hospitals. Informed consent was obtained from survey respondents. The institutional review board at Boston Children's Hospital approved the study protocol.
Clinical Practice Guideline Survey
We sent an electronic survey to medical directors or division directors at 37 pediatric EDs to determine whether their ED utilized a CPG for the management of the febrile young infant in 2013. If no response was received after the second attempt, we queried ED fellowship directors or other ED attending physicians at nonresponding hospitals. Survey items included the presence of a febrile young infant CPG, and if present, the year of implementation, ages targeted, and CPG content. As applicable, respondents were asked to share their CPG and/or provide the specific CPG recommendations.
We collected and managed survey data using the Research Electronic Data Capture (REDCap) electronic data capture tools hosted at Boston Children's Hospital. REDCap is a secure, Web‐based application designed to support data capture for research studies.[13]
Data Source
The PHIS database contains administrative data from 44 US children's hospitals. These hospitals, affiliated with the Children's Hospital Association, represent 85% of freestanding US children's hospitals.[14] Encrypted patient identifiers permit tracking of patients across encounters.[15] Data quality and integrity are assured jointly by the Children's Hospital Association and participating hospitals.[16] For this study, 7 hospitals were excluded due to incomplete ED data or known data‐quality issues.[17]
Patients
We identified study infants using the following International Classification of Diseases, 9th Revision (ICD‐9) admission or discharge diagnosis codes for fever as defined previously[8, 9]: 780.6, 778.4, 780.60, or 780.61. We excluded infants with a complex chronic condition[18] and those transferred from another institution, as these infants may warrant a nonstandard evaluation and/or may have incomplete data. For infants with >1 ED visit for fever during the study period, repeat visits within 3 days of an index visit were considered a revisit for the same episode of illness; visits >3 days following an index visit were considered as a new index visit.
Study Definitions
From the PHIS database, we abstracted demographic characteristics (gender, race/ethnicity), insurance status, and region where the hospital was located (using US Census categories[19]). Billing codes were used to assess whether urine, blood, and CSF testing (as defined previously[9]) were performed during the ED evaluation. To account for ED visits that spanned the midnight hour, for hospitalized patients we considered any testing or treatment occurring on the initial or second hospital day to be performed in the ED; billing code data in PHIS are based upon calendar day and do not distinguish testing performed in the ED versus inpatient setting.[8, 9] Patients billed for observation care were classified as being hospitalized.[20, 21]
We identified the presence of an SBI using ICD‐9 diagnosis codes for the following infections as described previously[9]: urinary tract infection or pyelonephritis,[22] bacteremia or sepsis, bacterial meningitis,[16] pneumonia,[23] or bacterial enteritis. To assess return visits for SBI that required inpatient management, we defined an ED revisit for an SBI as a return visit within 3 days of ED discharge[24, 25] that resulted in hospitalization with an associated ICD‐9 discharge diagnosis code for an SBI.
Hospitals charges in PHIS database were adjusted for hospital location by using the Centers for Medicare and Medicaid Services price/wage index. Costs were estimated by applying hospital‐level cost‐to‐charge ratios to charge data.[26]
Measured Exposures
The primary exposure was the presence of an ED‐based CPG for management of the febrile young infant aged 28 days and 29 to 56 days; 56 days was used as the upper age limit as all of the CPGs included infants up to this age or beyond. Six institutions utilized CPGs with different thresholds to define the age categories (eg, dichotomized at 27 or 30 days); these CPGs were classified into the aforementioned age groups to permit comparisons across standardized age groups. We classified institutions based on the presence of a CPG. To assess differences in the application of low‐risk criteria, the CPGs were further classified a priori based upon specific recommendations around laboratory testing and hospitalization, as well as ceftriaxone use for infants aged 29 to 56 days discharged from the ED. CPGs were categorized based upon whether testing, hospitalization, and ceftriaxone use were: (1) recommended for all patients, (2) recommended only if patients were classified as high risk (absence of low‐risk criteria), (3) recommended against, or (4) recommended to consider at clinician discretion.
Outcome Measures
Measured outcomes were performance of urine, blood, CSF testing, and hospitalization rate, as well as rate of ceftriaxone use for discharged infants aged 29 to 56 days, 3‐day revisits for SBI, and costs per visit, which included hospitalization costs for admitted patients.
Data Analysis
We described continuous variables using median and interquartile range or range values and categorical variables using frequencies. We compared medians using Wilcoxon rank sum and categorical variables using a [2] test. We compared rates of testing, hospitalization, ceftriaxone use, and 3‐day revisits for SBI based on the presence of a CPG, and when present, the specific CPG recommendations. Costs per visit were compared between institutions with and without CPGs and assessed separately for admitted and discharged patients. To adjust for potential confounders and clustering of patients within hospitals, we used generalized estimating equations with logistic regression to generate adjusted odd ratios (aORs) and 95% confidence intervals (CIs). Models were adjusted for geographic region, payer, race, and gender. Statistical analyses were performed by using SAS version 9.3 (SAS Institute, Cary, NC). We determined statistical significance as a 2‐tailed P value <0.05.
Febrile infants with bronchiolitis or a history of prematurity may be managed differently from full‐term febrile young infants without bronchiolitis.[6, 27] Therefore, we performed a subgroup analysis after exclusion of infants with an ICD‐9 discharge diagnosis code for bronchiolitis (466.11 and 466.19)[28] or prematurity (765).
Because our study included ED encounters in 2013, we repeated our analyses after exclusion of hospitals with CPGs implemented during the 2013 calendar year.
RESULTS
CPG by Institution
Thirty‐three (89.2%) of the 37 EDs surveyed completed the questionnaire. Overall, 21 (63.6%) of the 33 EDs had a CPG; 15 (45.5%) had a CPG for all infants 56 days of age, 5 (15.2%) had a CPG for infants 28 days only, and 1 (3.0%) had a CPG for infants 29 to 56 days but not 28 days of age (Figure 1). Seventeen EDs had an established CPG prior to 2013, and 4 hospitals implemented a CPG during the 2013 calendar year, 2 with CPGs for neonates 28 days and 2 with CPGs for both 28 days and 29 to 56 days of age. Hospitals with CPGs were more likely to be located in the Northeast and West regions of the United States and provide care to a higher proportion of non‐Hispanic white patients, as well as those with commercial insurance (Table 1).
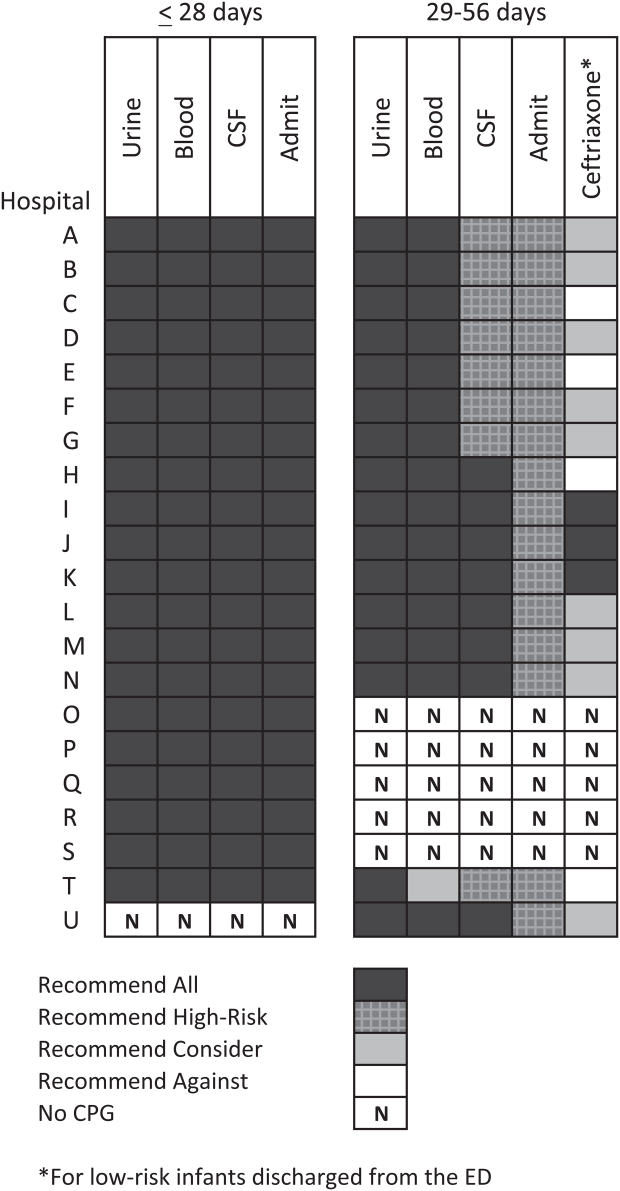
| Characteristic | 28 Days | 2956 Days | ||||
|---|---|---|---|---|---|---|
| No CPG, n=996, N (%) | CPG, n=2,149, N (%) | P Value | No CPG, n=2,460, N (%) | CPG, n=3,772, N (%) | P Value | |
| ||||||
| Race | ||||||
| Non‐Hispanic white | 325 (32.6) | 996 (46.3) | 867 (35.2) | 1,728 (45.8) | ||
| Non‐Hispanic black | 248 (24.9) | 381 (17.7) | 593 (24.1) | 670 (17.8) | ||
| Hispanic | 243 (24.4) | 531 (24.7) | 655 (26.6) | 986 (26.1) | ||
| Asian | 28 (2.8) | 78 (3.6) | 40 (1.6) | 122 (3.2) | ||
| Other Race | 152 (15.3) | 163 (7.6) | <0.001 | 305 (12.4) | 266 (7.1) | <0.001 |
| Gender | ||||||
| Female | 435 (43.7) | 926 (43.1) | 0.76 | 1,067 (43.4) | 1,714 (45.4) | 0.22 |
| Payer | ||||||
| Commercial | 243 (24.4) | 738 (34.3) | 554 (22.5) | 1,202 (31.9) | ||
| Government | 664 (66.7) | 1,269 (59.1) | 1,798 (73.1) | 2,342 (62.1) | ||
| Other payer | 89 (8.9) | 142 (6.6) | <0.001 | 108 (4.4) | 228 (6.0) | <0.001 |
| Region | ||||||
| Northeast | 39 (3.9) | 245 (11.4) | 77 (3.1) | 572 (15.2) | ||
| South | 648 (65.1) | 915 (42.6) | 1,662 (67.6) | 1,462 (38.8) | ||
| Midwest | 271 (27.2) | 462 (21.5) | 506 (20.6) | 851 (22.6) | ||
| West | 38 (3.8) | 527 (24.5) | <0.001 | 215 (8.7) | 887 (23.5) | <0.001 |
| Serious bacterial infection | ||||||
| Overall* | 131 (13.2) | 242 (11.3) | 0.14 | 191 (7.8) | 237 (6.3) | 0.03 |
| UTI/pyelonephritis | 73 (7.3) | 153 (7.1) | 103 (4.2) | 154 (4.1) | ||
| Bacteremia/sepsis | 56 (5.6) | 91 (4.2) | 78 (3.2) | 61 (1.6) | ||
| Bacterial meningitis | 15 (1.5) | 15 (0.7) | 4 (0.2) | 14 (0.4) | ||
| Age, d, median (IQR) | 18 (11, 24) | 18 (11, 23) | 0.67 | 46 (37, 53) | 45 (37, 53) | 0.11 |
All 20 CPGs for the febrile young infant 28 days of age recommended urine, blood, CSF testing, and hospitalization for all infants (Figure 1). Of the 16 hospitals with CPGs for febrile infants aged 29 to 56 days, all recommended urine and blood testing for all patients, except for 1 CPG, which recommended consideration of blood testing but not to obtain routinely. Hospitals varied in recommendations for CSF testing among infants aged 29 to 56 days: 8 (50%) recommended CSF testing in all patients and 8 (50%) recommended CSF testing only if the patient was high risk per defined criteria (based on history, physical examination, urine, and blood testing). In all 16 CPGs, hospitalization was recommended only for high‐risk infants. For low‐risk infants aged 2956 days being discharged from the ED, 3 hospitals recommended ceftriaxone for all, 9 recommended consideration of ceftriaxone, and 4 recommended against antibiotics (Figure 1).
Study Patients
During the study period, there were 10,415 infants 56 days old with a diagnosis of fever at the 33 participating hospitals. After exclusion of 635 (6.1%) infants with a complex chronic condition and 445 (4.3%) transferred from another institution (including 42 with a complex chronic condition), 9377 infants remained in our study cohort. Approximately one‐third of the cohort was 28 days of age and two‐thirds aged 29 to 56 days. The overall SBI rate was 8.5% but varied by age (11.9% in infants 28 days and 6.9% in infants 29 to 56 days of age) (Table 1).
CPGs and Use of Diagnostic Testing, Hospitalization Rates, Ceftriaxone Use, and Revisits for SBI
For infants 28 days of age, the presence of a CPG was not associated with urine, blood, CSF testing, or hospitalization after multivariable adjustment (Table 2). Among infants aged 29 to 56 days, urine testing did not differ based on the presence of a CPG, whereas blood testing was performed less often at the 1 hospital whose CPG recommended to consider, but not routinely obtain, testing (aOR: 0.4, 95% CI: 0.3‐0.7, P=0.001). Compared to hospitals without a CPG, CSF testing was performed less often at hospitals with CPG recommendations to only obtain CSF if high risk (aOR: 0.5, 95% CI: 0.3‐0.8, P=0.002). However, the odds of hospitalization did not differ at institutions with and without a febrile infant CPG (aOR: 0.7, 95% CI: 0.5‐1.1, P=0.10). For infants aged 29 to 56 days discharged from the ED, ceftriaxone was administered more often at hospitals with CPGs that recommended ceftriaxone for all discharged patients (aOR: 4.6, 95% CI: 2.39.3, P<0.001) and less often at hospitals whose CPGs recommended against antibiotics (aOR: 0.3, 95% CI: 0.1‐0.9, P=0.03) (Table 3). Our findings were similar in the subgroup of infants without bronchiolitis or prematurity (see Supporting Tables 1 and 2 in the online version of this article). After exclusion of hospitals with a CPG implemented during the 2013 calendar year (4 hospitals excluded in the 28 days age group and 2 hospitals excluded in the 29 to 56 days age group), infants aged 29 to 56 days cared for at a hospital with a CPG experienced a lower odds of hospitalization (aOR: 0.7, 95% CI: 0.4‐0.98, P=0.04). Otherwise, our findings in both age groups did not materially differ from the main analyses.
| Testing/Hospitalization | No. of Hospitals | No. of Patients | % Received* | aOR (95% CI) | P Value |
|---|---|---|---|---|---|
| |||||
| Laboratory testing | |||||
| Urine testing | |||||
| No CPG | 13 | 996 | 75.6 | Ref | |
| CPG: recommend for all | 20 | 2,149 | 80.7 | 1.2 (0.9‐1.7) | 0.22 |
| Blood testing | |||||
| No CPG | 13 | 996 | 76.9 | Ref | |
| CPG: recommend for all | 20 | 2,149 | 81.8 | 1.2 (0.9‐1.7) | 0.25 |
| CSF testing‖ | |||||
| No CPG | 13 | 996 | 71.0 | Ref | |
| CPG: recommend for all | 20 | 2,149 | 77.5 | 1.3 (1.01.7) | 0.08 |
| Disposition | |||||
| Hospitalization | |||||
| No CPG | 13 | 996 | 75.4 | Ref | |
| CPG: recommend for all | 20 | 2,149 | 81.6 | 1.2 (0.9‐1.8) | 0.26 |
| Testing/Hospitalization | No. of Hospitals | No. of Patients | % Received* | aOR (95% CI) | P Value |
|---|---|---|---|---|---|
| |||||
| Laboratory resting | |||||
| Urine testing | |||||
| No CPG | 17 | 2,460 | 81.1 | Ref | |
| CPG: recommend for all | 16 | 3,772 | 82.1 | 0.9 (0.7‐1.4) | 0.76 |
| Blood testing | |||||
| No CPG | 17 | 2,460 | 79.4 | Ref | |
| CPG: recommend for all | 15 | 3,628 | 82.6 | 1.1 (0.7‐1.6) | 0.70 |
| CPG: recommend consider | 1 | 144 | 62.5 | 0.4 (0.3‐0.7) | 0.001 |
| CSF testing‖ | |||||
| No CPG | 17 | 2,460 | 46.3 | Ref | |
| CPG: recommend for all | 8 | 1,517 | 70.3 | 1.3 (0.9‐1.9) | 0.11 |
| CPG: recommend if high‐risk | 8 | 2,255 | 39.9 | 0.5 (0.3‐0.8) | 0.002 |
| Disposition | |||||
| Hospitalization | |||||
| No CPG | 17 | 2,460 | 47.0 | Ref | |
| CPG: recommend if high‐risk | 16 | 3,772 | 42.0 | 0.7 (0.5‐1.1) | 0.10 |
| Ceftriaxone if discharged | |||||
| No CPG | 17 | 1,304 | 11.7 | Ref | |
| CPG: recommend against | 4 | 313 | 10.9 | 0.3 (0.1‐0.9) | 0.03 |
| CPG: recommend consider | 9 | 1,567 | 14.4 | 1.5 (0.9‐2.4) | 0.09 |
| CPG: recommend for all | 3 | 306 | 64.1 | 4.6 (2.39.3) | < 0.001 |
Three‐day revisits for SBI were similarly low at hospitals with and without CPGs among infants 28 days (1.5% vs 0.8%, P=0.44) and 29 to 56 days of age (1.4% vs 1.1%, P=0.44) and did not differ after exclusion of hospitals with a CPG implemented in 2013.
CPGs and Costs
Among infants 28 days of age, costs per visit did not differ for admitted and discharged patients based on CPG presence. The presence of an ED febrile infant CPG was associated with higher costs for both admitted and discharged infants 29 to 56 days of age (Table 4). The cost analysis did not significantly differ after exclusion of hospitals with CPGs implemented in 2013.
| 28 Days, Cost, Median (IQR) | 29 to 56 Days, Cost, Median (IQR) | |||||
|---|---|---|---|---|---|---|
| No CPG | CPG | P Value | No CPG | CPG | P Value | |
| ||||||
| Admitted | $4,979 ($3,408$6,607) [n=751] | $4,715 ($3,472$6,526) [n=1,753] | 0.79 | $3,756 ($2,725$5,041) [n=1,156] | $3,923 ($3,077$5,243) [n=1,586] | <0.001 |
| Discharged | $298 ($166$510) [n=245] | $231 ($160$464) [n=396] | 0.10 | $681($398$982) [n=1,304)] | $764 ($412$1,100) [n=2,186] | <0.001 |
DISCUSSION
We described the content and association of CPGs with management of the febrile infant 56 days of age across a large sample of children's hospitals. Nearly two‐thirds of included pediatric EDs have a CPG for the management of young febrile infants. Management of febrile infants 28 days was uniform, with a majority hospitalized after urine, blood, and CSF testing regardless of the presence of a CPG. In contrast, CPGs for infants 29 to 56 days of age varied in their recommendations for CSF testing as well as ceftriaxone use for infants discharged from the ED. Consequently, we observed considerable hospital variability in CSF testing and ceftriaxone use for discharged infants, which correlates with variation in the presence and content of CPGs. Institutional CPGs may be a source of the across‐hospital variation in care of febrile young infants observed in prior study.[9]
Febrile infants 28 days of age are at particularly high risk for SBI, with a prevalence of nearly 20% or higher.[2, 3, 29] The high prevalence of SBI, combined with the inherent difficulty in distinguishing neonates with and without SBI,[2, 30] has resulted in uniform CPG recommendations to perform the full‐sepsis workup in this young age group. Similar to prior studies,[8, 9] we observed that most febrile infants 28 days undergo the full sepsis evaluation, including CSF testing, and are hospitalized regardless of the presence of a CPG.
However, given the conflicting recommendations for febrile infants 29 to 56 days of age,[4, 5, 6] the optimal management strategy is less certain.[7] The Rochester, Philadelphia, and Boston criteria, 3 published models to identify infants at low risk for SBI, primarily differ in their recommendations for CSF testing and ceftriaxone use in this age group.[4, 5, 6] Half of the CPGs recommended CSF testing for all febrile infants, and half recommended CSF testing only if the infant was high risk. Institutional guidelines that recommended selective CSF testing for febrile infants aged 29 to 56 days were associated with lower rates of CSF testing. Furthermore, ceftriaxone use varied based on CPG recommendations for low‐risk infants discharged from the ED. Therefore, the influence of febrile infant CPGs mainly relates to the limiting of CSF testing and targeted ceftriaxone use in low‐risk infants. As the rate of return visits for SBI is low across hospitals, future study should assess outcomes at hospitals with CPGs recommending selective CSF testing. Of note, infants 29 to 56 days of age were less likely to be hospitalized when cared for at a hospital with an established CPG prior to 2013 without increase in 3‐day revisits for SBI. This finding may indicate that longer duration of CPG implementation is associated with lower rates of hospitalization for low‐risk infants; this finding merits further study.
The presence of a CPG was not associated with lower costs for febrile infants in either age group. Although individual healthcare systems have achieved lower costs with CPG implementation,[12] the mere presence of a CPG is not associated with lower costs when assessed across institutions. Higher costs for admitted and discharged infants 29 to 56 days of age in the presence of a CPG likely reflects the higher rate of CSF testing at hospitals whose CPGs recommend testing for all febrile infants, as well as inpatient management strategies for hospitalized infants not captured in our study. Future investigation should include an assessment of the cost‐effectiveness of the various testing and treatment strategies employed for the febrile young infant.
Our study has several limitations. First, the validity of ICD‐9 diagnosis codes for identifying young infants with fever is not well established, and thus our study is subject to misclassification bias. To minimize missed patients, we included infants with either an ICD‐9 admission or discharge diagnosis of fever; however, utilization of diagnosis codes for patient identification may have resulted in undercapture of infants with a measured temperature of 38.0C. It is also possible that some patients who did not undergo testing were misclassified as having a fever or had temperatures below standard thresholds to prompt diagnostic testing. This is a potential reason that testing was not performed in 100% of infants, even at hospitals with CPGs that recommended testing for all patients. Additionally, some febrile infants diagnosed with SBI may not have an associated ICD‐9 diagnosis code for fever. Although the overall SBI rate observed in our study was similar to prior studies,[4, 31] the rate in neonates 28 days of age was lower than reported in recent investigations,[2, 3] which may indicate inclusion of a higher proportion of low‐risk febrile infants. With the exception of bronchiolitis, we also did not assess diagnostic testing in the presence of other identified sources of infection such as herpes simplex virus.
Second, we were unable to assess the presence or absence of a CPG at the 4 excluded EDs that did not respond to the survey or the institutions excluded for data‐quality issues. However, included and excluded hospitals did not differ in region or annual ED volume (data not shown).
Third, although we classified hospitals based upon the presence and content of CPGs, we were unable to fully evaluate adherence to the CPG at each site.
Last, though PHIS hospitals represent 85% of freestanding children's hospitals, many febrile infants are hospitalized at non‐PHIS institutions; our results may not be generalizable to care provided at nonchildren's hospitals.
CONCLUSIONS
Management of febrile neonates 28 days of age does not vary based on CPG presence. However, CPGs for the febrile infant aged 29 to 56 days vary in recommendations for CSF testing as well as ceftriaxone use for low‐risk patients, which significantly contributes to practice variation and healthcare costs across institutions.
Acknowledgements
The Febrile Young Infant Research Collaborative includes the following additional investigators who are acknowledged for their work on this study: Kao‐Ping Chua, MD, Harvard PhD Program in Health Policy, Harvard University, Cambridge, Massachusetts, and Division of Emergency Medicine, Department of Pediatrics, Boston Children's Hospital, Boston, Massachusetts; Elana A. Feldman, BA, University of Washington School of Medicine, Seattle, Washington; and Katie L. Hayes, BS, Division of Emergency Medicine, Department of Pediatrics, The Children's Hospital of Philadelphia, Philadelphia, Pennsylvania.
Disclosures
This project was funded in part by The Gerber Foundation Novice Researcher Award (Ref #18273835). Dr. Fran Balamuth received career development support from the National Institutes of Health (NHLBI K12‐HL109009). Funders were not involved in design or conduct of the study; collection, management, analysis, or interpretation of the data; preparation, review, or approval of the manuscript. The authors have no financial relationships relevant to this article to disclose. No payment was received for the production of this article. The authors have no conflicts of interest relevant to this article to disclose.
- , , . Performance of low‐risk criteria in the evaluation of young infants with fever: review of the literature. Pediatrics. 2010;125:228–233.
- , , , , , . A week‐by‐week analysis of the low‐risk criteria for serious bacterial infection in febrile neonates. Arch Dis Child. 2009;94:287–292.
- , , , et al. Is 15 days an appropriate cut‐off age for considering serious bacterial infection in the management of febrile infants? Pediatr Infect Dis J. 2012;31:455–458.
- , , . Outpatient management without antibiotics of fever in selected infants. N Engl J Med. 1993;329:1437–1441.
- , , . Identifying febrile infants at risk for a serious bacterial infection. J Pediatr. 1993;123:489–490.
- , , , et al. Febrile infants at low risk for serious bacterial infection—an appraisal of the Rochester criteria and implications for management. Febrile Infant Collaborative Study Group. Pediatrics. 1994;94:390–396.
- American College of Emergency Physicians Clinical Policies Committee; American College of Emergency Physicians Clinical Policies Subcommittee on Pediatric Fever. Clinical policy for children younger than three years presenting to the emergency department with fever. Ann Emerg Med. 2003;42:530–545.
- , , , et al. Management of febrile neonates in US pediatric emergency departments. Pediatrics. 2014;133:187–195.
- , , , et al. Variation in care of the febrile young infant <90 days in US pediatric emergency departments. Pediatrics. 2014;134:667–677.
- , , , , . Fever survey highlights significant variations in how infants aged ≤60 days are evaluated and underline the need for guidelines. Acta Paediatr. 2014;103:379–385.
- . Evidence‐based guidelines and critical pathways for quality improvement. Pediatrics. 1999;103:225–232.
- , , , et al. Costs and infant outcomes after implementation of a care process model for febrile infants. Pediatrics. 2012;130:e16–e24.
- , , , , , . Research electronic data capture (REDCap)—a metadata‐driven methodology and workflow process for providing translational research informatics support. J Biomed Inform. 2009;42:377–381.
- , , , , , . Variation in occult injury screening for children with suspected abuse in selected US children's hospitals. Pediatrics. 2012;130:853–860.
- . Achieving data quality. How data from a pediatric health information system earns the trust of its users. J AHIMA. 2004;75:22–26.
- , , , . Corticosteroids and mortality in children with bacterial meningitis. JAMA. 2008;299:2048–2055.
- , , , et al. Variation in resource utilization across a national sample of pediatric emergency departments. J Pediatr. 2013;163:230–236.
- , , , , , . Deaths attributed to pediatric complex chronic conditions: national trends and implications for supportive care services. Pediatrics. 2001;107:E99.
- US Census Bureau. Geographic terms and concepts—census divisions and census regions. Available at: https://www.census.gov/geo/reference/gtc/gtc_census_divreg.html. Accessed September 10, 2014.
- , , , et al. Pediatric observation status: are we overlooking a growing population in children's hospitals? J Hosp Med. 2012;7:530–536.
- , , , et al. Differences in designations of observation care in US freestanding children's hospitals: are they virtual or real? J Hosp Med. 2012;7:287–293.
- , , , et al. Accuracy of administrative billing codes to detect urinary tract infection hospitalizations. Pediatrics. 2011;128:323–330.
- , , , et al. Identifying pediatric community‐acquired pneumonia hospitalizations: accuracy of administrative billing codes. JAMA Pediatr. 2013;167:851–858.
- , , , . Initial emergency department diagnosis and return visits: risk versus perception. Ann Emerg Med. 1998;32:569–573.
- , , , , . A national depiction of children with return visits to the emergency department within 72 hours, 2001–2007. Pediatr Emerg Care. 2012;28:606–610.
- Healthcare Cost and Utilization Project. Cost‐to‐charge ratio files. Available at: http://www.hcup‐us.ahrq.gov/db/state/costtocharge.jsp. Accessed September 11, 2014.
- , , , et al. Risk of serious bacterial infection in young febrile infants with respiratory syncytial virus infections. Pediatrics. 2004;113:1728–1734.
- , , , et al. Establishing benchmarks for the hospitalized care of children with asthma, bronchiolitis, and pneumonia. Pediatrics. 2014;134:555–562.
- , , , , , . Well appearing young infants with fever without known source in the emergency department: are lumbar punctures always necessary? Eur J Emerg Med. 2010;17:167–169.
- , . Unpredictability of serious bacterial illness in febrile infants from birth to 1 month of age. Arch Pediatr Adolesc Med. 1999;153:508–511.
- , , , et al. Management and outcomes of care of fever in early infancy. JAMA. 2004;291:1203–1212.
Febrile young infants are at high risk for serious bacterial infection (SBI) with reported rates of 8.5% to 12%, even higher in neonates 28 days of age.[1, 2, 3] As a result, febrile infants often undergo extensive diagnostic evaluation consisting of a combination of urine, blood, and cerebrospinal fluid (CSF) testing.[4, 5, 6] Several clinical prediction algorithms use this diagnostic testing to identify febrile infants at low risk for SBI, but they differ with respect to age range, recommended testing, antibiotic administration, and threshold for hospitalization.[4, 5, 6] Additionally, the optimal management strategy for this population has not been defined.[7] Consequently, laboratory testing, antibiotic use, and hospitalization for febrile young infants vary widely among hospitals.[8, 9, 10]
Clinical practice guidelines (CPGs) are designed to implement evidence‐based care and reduce practice variability, with the goal of improving quality of care and optimizing costs.[11] Implementation of a CPG for management of febrile young infants in the Intermountain Healthcare System was associated with greater adherence to evidence‐based care and lower costs.[12] However, when strong evidence is lacking, different interpretations of febrile infant risk classification incorporated into local CPGs may be a major driver of the across‐hospital practice variation observed in prior studies.[8, 9] Understanding sources of variability as well as determining the association of CPGs with clinicians' practice patterns can help identify quality improvement opportunities, either through national benchmarking or local efforts.
Our primary objectives were to compare (1) recommendations of pediatric emergency departmentbased institutional CPGs for febrile young infants and (2) rates of urine, blood, CSF testing, hospitalization, and ceftriaxone use at emergency department (ED) discharge based upon CPG presence and the specific CPG recommendations. Our secondary objectives were to describe the association of CPGs with healthcare costs and return visits for SBI.
METHODS
Study Design
We used the Pediatric Health Information System (PHIS) to identify febrile infants 56 days of age who presented to the ED between January 1, 2013 and December 31, 2013. We also surveyed ED providers at participating PHIS hospitals. Informed consent was obtained from survey respondents. The institutional review board at Boston Children's Hospital approved the study protocol.
Clinical Practice Guideline Survey
We sent an electronic survey to medical directors or division directors at 37 pediatric EDs to determine whether their ED utilized a CPG for the management of the febrile young infant in 2013. If no response was received after the second attempt, we queried ED fellowship directors or other ED attending physicians at nonresponding hospitals. Survey items included the presence of a febrile young infant CPG, and if present, the year of implementation, ages targeted, and CPG content. As applicable, respondents were asked to share their CPG and/or provide the specific CPG recommendations.
We collected and managed survey data using the Research Electronic Data Capture (REDCap) electronic data capture tools hosted at Boston Children's Hospital. REDCap is a secure, Web‐based application designed to support data capture for research studies.[13]
Data Source
The PHIS database contains administrative data from 44 US children's hospitals. These hospitals, affiliated with the Children's Hospital Association, represent 85% of freestanding US children's hospitals.[14] Encrypted patient identifiers permit tracking of patients across encounters.[15] Data quality and integrity are assured jointly by the Children's Hospital Association and participating hospitals.[16] For this study, 7 hospitals were excluded due to incomplete ED data or known data‐quality issues.[17]
Patients
We identified study infants using the following International Classification of Diseases, 9th Revision (ICD‐9) admission or discharge diagnosis codes for fever as defined previously[8, 9]: 780.6, 778.4, 780.60, or 780.61. We excluded infants with a complex chronic condition[18] and those transferred from another institution, as these infants may warrant a nonstandard evaluation and/or may have incomplete data. For infants with >1 ED visit for fever during the study period, repeat visits within 3 days of an index visit were considered a revisit for the same episode of illness; visits >3 days following an index visit were considered as a new index visit.
Study Definitions
From the PHIS database, we abstracted demographic characteristics (gender, race/ethnicity), insurance status, and region where the hospital was located (using US Census categories[19]). Billing codes were used to assess whether urine, blood, and CSF testing (as defined previously[9]) were performed during the ED evaluation. To account for ED visits that spanned the midnight hour, for hospitalized patients we considered any testing or treatment occurring on the initial or second hospital day to be performed in the ED; billing code data in PHIS are based upon calendar day and do not distinguish testing performed in the ED versus inpatient setting.[8, 9] Patients billed for observation care were classified as being hospitalized.[20, 21]
We identified the presence of an SBI using ICD‐9 diagnosis codes for the following infections as described previously[9]: urinary tract infection or pyelonephritis,[22] bacteremia or sepsis, bacterial meningitis,[16] pneumonia,[23] or bacterial enteritis. To assess return visits for SBI that required inpatient management, we defined an ED revisit for an SBI as a return visit within 3 days of ED discharge[24, 25] that resulted in hospitalization with an associated ICD‐9 discharge diagnosis code for an SBI.
Hospitals charges in PHIS database were adjusted for hospital location by using the Centers for Medicare and Medicaid Services price/wage index. Costs were estimated by applying hospital‐level cost‐to‐charge ratios to charge data.[26]
Measured Exposures
The primary exposure was the presence of an ED‐based CPG for management of the febrile young infant aged 28 days and 29 to 56 days; 56 days was used as the upper age limit as all of the CPGs included infants up to this age or beyond. Six institutions utilized CPGs with different thresholds to define the age categories (eg, dichotomized at 27 or 30 days); these CPGs were classified into the aforementioned age groups to permit comparisons across standardized age groups. We classified institutions based on the presence of a CPG. To assess differences in the application of low‐risk criteria, the CPGs were further classified a priori based upon specific recommendations around laboratory testing and hospitalization, as well as ceftriaxone use for infants aged 29 to 56 days discharged from the ED. CPGs were categorized based upon whether testing, hospitalization, and ceftriaxone use were: (1) recommended for all patients, (2) recommended only if patients were classified as high risk (absence of low‐risk criteria), (3) recommended against, or (4) recommended to consider at clinician discretion.
Outcome Measures
Measured outcomes were performance of urine, blood, CSF testing, and hospitalization rate, as well as rate of ceftriaxone use for discharged infants aged 29 to 56 days, 3‐day revisits for SBI, and costs per visit, which included hospitalization costs for admitted patients.
Data Analysis
We described continuous variables using median and interquartile range or range values and categorical variables using frequencies. We compared medians using Wilcoxon rank sum and categorical variables using a [2] test. We compared rates of testing, hospitalization, ceftriaxone use, and 3‐day revisits for SBI based on the presence of a CPG, and when present, the specific CPG recommendations. Costs per visit were compared between institutions with and without CPGs and assessed separately for admitted and discharged patients. To adjust for potential confounders and clustering of patients within hospitals, we used generalized estimating equations with logistic regression to generate adjusted odd ratios (aORs) and 95% confidence intervals (CIs). Models were adjusted for geographic region, payer, race, and gender. Statistical analyses were performed by using SAS version 9.3 (SAS Institute, Cary, NC). We determined statistical significance as a 2‐tailed P value <0.05.
Febrile infants with bronchiolitis or a history of prematurity may be managed differently from full‐term febrile young infants without bronchiolitis.[6, 27] Therefore, we performed a subgroup analysis after exclusion of infants with an ICD‐9 discharge diagnosis code for bronchiolitis (466.11 and 466.19)[28] or prematurity (765).
Because our study included ED encounters in 2013, we repeated our analyses after exclusion of hospitals with CPGs implemented during the 2013 calendar year.
RESULTS
CPG by Institution
Thirty‐three (89.2%) of the 37 EDs surveyed completed the questionnaire. Overall, 21 (63.6%) of the 33 EDs had a CPG; 15 (45.5%) had a CPG for all infants 56 days of age, 5 (15.2%) had a CPG for infants 28 days only, and 1 (3.0%) had a CPG for infants 29 to 56 days but not 28 days of age (Figure 1). Seventeen EDs had an established CPG prior to 2013, and 4 hospitals implemented a CPG during the 2013 calendar year, 2 with CPGs for neonates 28 days and 2 with CPGs for both 28 days and 29 to 56 days of age. Hospitals with CPGs were more likely to be located in the Northeast and West regions of the United States and provide care to a higher proportion of non‐Hispanic white patients, as well as those with commercial insurance (Table 1).
| Characteristic | 28 Days | 2956 Days | ||||
|---|---|---|---|---|---|---|
| No CPG, n=996, N (%) | CPG, n=2,149, N (%) | P Value | No CPG, n=2,460, N (%) | CPG, n=3,772, N (%) | P Value | |
| ||||||
| Race | ||||||
| Non‐Hispanic white | 325 (32.6) | 996 (46.3) | 867 (35.2) | 1,728 (45.8) | ||
| Non‐Hispanic black | 248 (24.9) | 381 (17.7) | 593 (24.1) | 670 (17.8) | ||
| Hispanic | 243 (24.4) | 531 (24.7) | 655 (26.6) | 986 (26.1) | ||
| Asian | 28 (2.8) | 78 (3.6) | 40 (1.6) | 122 (3.2) | ||
| Other Race | 152 (15.3) | 163 (7.6) | <0.001 | 305 (12.4) | 266 (7.1) | <0.001 |
| Gender | ||||||
| Female | 435 (43.7) | 926 (43.1) | 0.76 | 1,067 (43.4) | 1,714 (45.4) | 0.22 |
| Payer | ||||||
| Commercial | 243 (24.4) | 738 (34.3) | 554 (22.5) | 1,202 (31.9) | ||
| Government | 664 (66.7) | 1,269 (59.1) | 1,798 (73.1) | 2,342 (62.1) | ||
| Other payer | 89 (8.9) | 142 (6.6) | <0.001 | 108 (4.4) | 228 (6.0) | <0.001 |
| Region | ||||||
| Northeast | 39 (3.9) | 245 (11.4) | 77 (3.1) | 572 (15.2) | ||
| South | 648 (65.1) | 915 (42.6) | 1,662 (67.6) | 1,462 (38.8) | ||
| Midwest | 271 (27.2) | 462 (21.5) | 506 (20.6) | 851 (22.6) | ||
| West | 38 (3.8) | 527 (24.5) | <0.001 | 215 (8.7) | 887 (23.5) | <0.001 |
| Serious bacterial infection | ||||||
| Overall* | 131 (13.2) | 242 (11.3) | 0.14 | 191 (7.8) | 237 (6.3) | 0.03 |
| UTI/pyelonephritis | 73 (7.3) | 153 (7.1) | 103 (4.2) | 154 (4.1) | ||
| Bacteremia/sepsis | 56 (5.6) | 91 (4.2) | 78 (3.2) | 61 (1.6) | ||
| Bacterial meningitis | 15 (1.5) | 15 (0.7) | 4 (0.2) | 14 (0.4) | ||
| Age, d, median (IQR) | 18 (11, 24) | 18 (11, 23) | 0.67 | 46 (37, 53) | 45 (37, 53) | 0.11 |
All 20 CPGs for the febrile young infant 28 days of age recommended urine, blood, CSF testing, and hospitalization for all infants (Figure 1). Of the 16 hospitals with CPGs for febrile infants aged 29 to 56 days, all recommended urine and blood testing for all patients, except for 1 CPG, which recommended consideration of blood testing but not to obtain routinely. Hospitals varied in recommendations for CSF testing among infants aged 29 to 56 days: 8 (50%) recommended CSF testing in all patients and 8 (50%) recommended CSF testing only if the patient was high risk per defined criteria (based on history, physical examination, urine, and blood testing). In all 16 CPGs, hospitalization was recommended only for high‐risk infants. For low‐risk infants aged 2956 days being discharged from the ED, 3 hospitals recommended ceftriaxone for all, 9 recommended consideration of ceftriaxone, and 4 recommended against antibiotics (Figure 1).
Study Patients
During the study period, there were 10,415 infants 56 days old with a diagnosis of fever at the 33 participating hospitals. After exclusion of 635 (6.1%) infants with a complex chronic condition and 445 (4.3%) transferred from another institution (including 42 with a complex chronic condition), 9377 infants remained in our study cohort. Approximately one‐third of the cohort was 28 days of age and two‐thirds aged 29 to 56 days. The overall SBI rate was 8.5% but varied by age (11.9% in infants 28 days and 6.9% in infants 29 to 56 days of age) (Table 1).
CPGs and Use of Diagnostic Testing, Hospitalization Rates, Ceftriaxone Use, and Revisits for SBI
For infants 28 days of age, the presence of a CPG was not associated with urine, blood, CSF testing, or hospitalization after multivariable adjustment (Table 2). Among infants aged 29 to 56 days, urine testing did not differ based on the presence of a CPG, whereas blood testing was performed less often at the 1 hospital whose CPG recommended to consider, but not routinely obtain, testing (aOR: 0.4, 95% CI: 0.3‐0.7, P=0.001). Compared to hospitals without a CPG, CSF testing was performed less often at hospitals with CPG recommendations to only obtain CSF if high risk (aOR: 0.5, 95% CI: 0.3‐0.8, P=0.002). However, the odds of hospitalization did not differ at institutions with and without a febrile infant CPG (aOR: 0.7, 95% CI: 0.5‐1.1, P=0.10). For infants aged 29 to 56 days discharged from the ED, ceftriaxone was administered more often at hospitals with CPGs that recommended ceftriaxone for all discharged patients (aOR: 4.6, 95% CI: 2.39.3, P<0.001) and less often at hospitals whose CPGs recommended against antibiotics (aOR: 0.3, 95% CI: 0.1‐0.9, P=0.03) (Table 3). Our findings were similar in the subgroup of infants without bronchiolitis or prematurity (see Supporting Tables 1 and 2 in the online version of this article). After exclusion of hospitals with a CPG implemented during the 2013 calendar year (4 hospitals excluded in the 28 days age group and 2 hospitals excluded in the 29 to 56 days age group), infants aged 29 to 56 days cared for at a hospital with a CPG experienced a lower odds of hospitalization (aOR: 0.7, 95% CI: 0.4‐0.98, P=0.04). Otherwise, our findings in both age groups did not materially differ from the main analyses.
| Testing/Hospitalization | No. of Hospitals | No. of Patients | % Received* | aOR (95% CI) | P Value |
|---|---|---|---|---|---|
| |||||
| Laboratory testing | |||||
| Urine testing | |||||
| No CPG | 13 | 996 | 75.6 | Ref | |
| CPG: recommend for all | 20 | 2,149 | 80.7 | 1.2 (0.9‐1.7) | 0.22 |
| Blood testing | |||||
| No CPG | 13 | 996 | 76.9 | Ref | |
| CPG: recommend for all | 20 | 2,149 | 81.8 | 1.2 (0.9‐1.7) | 0.25 |
| CSF testing‖ | |||||
| No CPG | 13 | 996 | 71.0 | Ref | |
| CPG: recommend for all | 20 | 2,149 | 77.5 | 1.3 (1.01.7) | 0.08 |
| Disposition | |||||
| Hospitalization | |||||
| No CPG | 13 | 996 | 75.4 | Ref | |
| CPG: recommend for all | 20 | 2,149 | 81.6 | 1.2 (0.9‐1.8) | 0.26 |
| Testing/Hospitalization | No. of Hospitals | No. of Patients | % Received* | aOR (95% CI) | P Value |
|---|---|---|---|---|---|
| |||||
| Laboratory resting | |||||
| Urine testing | |||||
| No CPG | 17 | 2,460 | 81.1 | Ref | |
| CPG: recommend for all | 16 | 3,772 | 82.1 | 0.9 (0.7‐1.4) | 0.76 |
| Blood testing | |||||
| No CPG | 17 | 2,460 | 79.4 | Ref | |
| CPG: recommend for all | 15 | 3,628 | 82.6 | 1.1 (0.7‐1.6) | 0.70 |
| CPG: recommend consider | 1 | 144 | 62.5 | 0.4 (0.3‐0.7) | 0.001 |
| CSF testing‖ | |||||
| No CPG | 17 | 2,460 | 46.3 | Ref | |
| CPG: recommend for all | 8 | 1,517 | 70.3 | 1.3 (0.9‐1.9) | 0.11 |
| CPG: recommend if high‐risk | 8 | 2,255 | 39.9 | 0.5 (0.3‐0.8) | 0.002 |
| Disposition | |||||
| Hospitalization | |||||
| No CPG | 17 | 2,460 | 47.0 | Ref | |
| CPG: recommend if high‐risk | 16 | 3,772 | 42.0 | 0.7 (0.5‐1.1) | 0.10 |
| Ceftriaxone if discharged | |||||
| No CPG | 17 | 1,304 | 11.7 | Ref | |
| CPG: recommend against | 4 | 313 | 10.9 | 0.3 (0.1‐0.9) | 0.03 |
| CPG: recommend consider | 9 | 1,567 | 14.4 | 1.5 (0.9‐2.4) | 0.09 |
| CPG: recommend for all | 3 | 306 | 64.1 | 4.6 (2.39.3) | < 0.001 |
Three‐day revisits for SBI were similarly low at hospitals with and without CPGs among infants 28 days (1.5% vs 0.8%, P=0.44) and 29 to 56 days of age (1.4% vs 1.1%, P=0.44) and did not differ after exclusion of hospitals with a CPG implemented in 2013.
CPGs and Costs
Among infants 28 days of age, costs per visit did not differ for admitted and discharged patients based on CPG presence. The presence of an ED febrile infant CPG was associated with higher costs for both admitted and discharged infants 29 to 56 days of age (Table 4). The cost analysis did not significantly differ after exclusion of hospitals with CPGs implemented in 2013.
| 28 Days, Cost, Median (IQR) | 29 to 56 Days, Cost, Median (IQR) | |||||
|---|---|---|---|---|---|---|
| No CPG | CPG | P Value | No CPG | CPG | P Value | |
| ||||||
| Admitted | $4,979 ($3,408$6,607) [n=751] | $4,715 ($3,472$6,526) [n=1,753] | 0.79 | $3,756 ($2,725$5,041) [n=1,156] | $3,923 ($3,077$5,243) [n=1,586] | <0.001 |
| Discharged | $298 ($166$510) [n=245] | $231 ($160$464) [n=396] | 0.10 | $681($398$982) [n=1,304)] | $764 ($412$1,100) [n=2,186] | <0.001 |
DISCUSSION
We described the content and association of CPGs with management of the febrile infant 56 days of age across a large sample of children's hospitals. Nearly two‐thirds of included pediatric EDs have a CPG for the management of young febrile infants. Management of febrile infants 28 days was uniform, with a majority hospitalized after urine, blood, and CSF testing regardless of the presence of a CPG. In contrast, CPGs for infants 29 to 56 days of age varied in their recommendations for CSF testing as well as ceftriaxone use for infants discharged from the ED. Consequently, we observed considerable hospital variability in CSF testing and ceftriaxone use for discharged infants, which correlates with variation in the presence and content of CPGs. Institutional CPGs may be a source of the across‐hospital variation in care of febrile young infants observed in prior study.[9]
Febrile infants 28 days of age are at particularly high risk for SBI, with a prevalence of nearly 20% or higher.[2, 3, 29] The high prevalence of SBI, combined with the inherent difficulty in distinguishing neonates with and without SBI,[2, 30] has resulted in uniform CPG recommendations to perform the full‐sepsis workup in this young age group. Similar to prior studies,[8, 9] we observed that most febrile infants 28 days undergo the full sepsis evaluation, including CSF testing, and are hospitalized regardless of the presence of a CPG.
However, given the conflicting recommendations for febrile infants 29 to 56 days of age,[4, 5, 6] the optimal management strategy is less certain.[7] The Rochester, Philadelphia, and Boston criteria, 3 published models to identify infants at low risk for SBI, primarily differ in their recommendations for CSF testing and ceftriaxone use in this age group.[4, 5, 6] Half of the CPGs recommended CSF testing for all febrile infants, and half recommended CSF testing only if the infant was high risk. Institutional guidelines that recommended selective CSF testing for febrile infants aged 29 to 56 days were associated with lower rates of CSF testing. Furthermore, ceftriaxone use varied based on CPG recommendations for low‐risk infants discharged from the ED. Therefore, the influence of febrile infant CPGs mainly relates to the limiting of CSF testing and targeted ceftriaxone use in low‐risk infants. As the rate of return visits for SBI is low across hospitals, future study should assess outcomes at hospitals with CPGs recommending selective CSF testing. Of note, infants 29 to 56 days of age were less likely to be hospitalized when cared for at a hospital with an established CPG prior to 2013 without increase in 3‐day revisits for SBI. This finding may indicate that longer duration of CPG implementation is associated with lower rates of hospitalization for low‐risk infants; this finding merits further study.
The presence of a CPG was not associated with lower costs for febrile infants in either age group. Although individual healthcare systems have achieved lower costs with CPG implementation,[12] the mere presence of a CPG is not associated with lower costs when assessed across institutions. Higher costs for admitted and discharged infants 29 to 56 days of age in the presence of a CPG likely reflects the higher rate of CSF testing at hospitals whose CPGs recommend testing for all febrile infants, as well as inpatient management strategies for hospitalized infants not captured in our study. Future investigation should include an assessment of the cost‐effectiveness of the various testing and treatment strategies employed for the febrile young infant.
Our study has several limitations. First, the validity of ICD‐9 diagnosis codes for identifying young infants with fever is not well established, and thus our study is subject to misclassification bias. To minimize missed patients, we included infants with either an ICD‐9 admission or discharge diagnosis of fever; however, utilization of diagnosis codes for patient identification may have resulted in undercapture of infants with a measured temperature of 38.0C. It is also possible that some patients who did not undergo testing were misclassified as having a fever or had temperatures below standard thresholds to prompt diagnostic testing. This is a potential reason that testing was not performed in 100% of infants, even at hospitals with CPGs that recommended testing for all patients. Additionally, some febrile infants diagnosed with SBI may not have an associated ICD‐9 diagnosis code for fever. Although the overall SBI rate observed in our study was similar to prior studies,[4, 31] the rate in neonates 28 days of age was lower than reported in recent investigations,[2, 3] which may indicate inclusion of a higher proportion of low‐risk febrile infants. With the exception of bronchiolitis, we also did not assess diagnostic testing in the presence of other identified sources of infection such as herpes simplex virus.
Second, we were unable to assess the presence or absence of a CPG at the 4 excluded EDs that did not respond to the survey or the institutions excluded for data‐quality issues. However, included and excluded hospitals did not differ in region or annual ED volume (data not shown).
Third, although we classified hospitals based upon the presence and content of CPGs, we were unable to fully evaluate adherence to the CPG at each site.
Last, though PHIS hospitals represent 85% of freestanding children's hospitals, many febrile infants are hospitalized at non‐PHIS institutions; our results may not be generalizable to care provided at nonchildren's hospitals.
CONCLUSIONS
Management of febrile neonates 28 days of age does not vary based on CPG presence. However, CPGs for the febrile infant aged 29 to 56 days vary in recommendations for CSF testing as well as ceftriaxone use for low‐risk patients, which significantly contributes to practice variation and healthcare costs across institutions.
Acknowledgements
The Febrile Young Infant Research Collaborative includes the following additional investigators who are acknowledged for their work on this study: Kao‐Ping Chua, MD, Harvard PhD Program in Health Policy, Harvard University, Cambridge, Massachusetts, and Division of Emergency Medicine, Department of Pediatrics, Boston Children's Hospital, Boston, Massachusetts; Elana A. Feldman, BA, University of Washington School of Medicine, Seattle, Washington; and Katie L. Hayes, BS, Division of Emergency Medicine, Department of Pediatrics, The Children's Hospital of Philadelphia, Philadelphia, Pennsylvania.
Disclosures
This project was funded in part by The Gerber Foundation Novice Researcher Award (Ref #18273835). Dr. Fran Balamuth received career development support from the National Institutes of Health (NHLBI K12‐HL109009). Funders were not involved in design or conduct of the study; collection, management, analysis, or interpretation of the data; preparation, review, or approval of the manuscript. The authors have no financial relationships relevant to this article to disclose. No payment was received for the production of this article. The authors have no conflicts of interest relevant to this article to disclose.
- , , . Performance of low‐risk criteria in the evaluation of young infants with fever: review of the literature. Pediatrics. 2010;125:228–233.
- , , , , , . A week‐by‐week analysis of the low‐risk criteria for serious bacterial infection in febrile neonates. Arch Dis Child. 2009;94:287–292.
- , , , et al. Is 15 days an appropriate cut‐off age for considering serious bacterial infection in the management of febrile infants? Pediatr Infect Dis J. 2012;31:455–458.
- , , . Outpatient management without antibiotics of fever in selected infants. N Engl J Med. 1993;329:1437–1441.
- , , . Identifying febrile infants at risk for a serious bacterial infection. J Pediatr. 1993;123:489–490.
- , , , et al. Febrile infants at low risk for serious bacterial infection—an appraisal of the Rochester criteria and implications for management. Febrile Infant Collaborative Study Group. Pediatrics. 1994;94:390–396.
- American College of Emergency Physicians Clinical Policies Committee; American College of Emergency Physicians Clinical Policies Subcommittee on Pediatric Fever. Clinical policy for children younger than three years presenting to the emergency department with fever. Ann Emerg Med. 2003;42:530–545.
- , , , et al. Management of febrile neonates in US pediatric emergency departments. Pediatrics. 2014;133:187–195.
- , , , et al. Variation in care of the febrile young infant <90 days in US pediatric emergency departments. Pediatrics. 2014;134:667–677.
- , , , , . Fever survey highlights significant variations in how infants aged ≤60 days are evaluated and underline the need for guidelines. Acta Paediatr. 2014;103:379–385.
- . Evidence‐based guidelines and critical pathways for quality improvement. Pediatrics. 1999;103:225–232.
- , , , et al. Costs and infant outcomes after implementation of a care process model for febrile infants. Pediatrics. 2012;130:e16–e24.
- , , , , , . Research electronic data capture (REDCap)—a metadata‐driven methodology and workflow process for providing translational research informatics support. J Biomed Inform. 2009;42:377–381.
- , , , , , . Variation in occult injury screening for children with suspected abuse in selected US children's hospitals. Pediatrics. 2012;130:853–860.
- . Achieving data quality. How data from a pediatric health information system earns the trust of its users. J AHIMA. 2004;75:22–26.
- , , , . Corticosteroids and mortality in children with bacterial meningitis. JAMA. 2008;299:2048–2055.
- , , , et al. Variation in resource utilization across a national sample of pediatric emergency departments. J Pediatr. 2013;163:230–236.
- , , , , , . Deaths attributed to pediatric complex chronic conditions: national trends and implications for supportive care services. Pediatrics. 2001;107:E99.
- US Census Bureau. Geographic terms and concepts—census divisions and census regions. Available at: https://www.census.gov/geo/reference/gtc/gtc_census_divreg.html. Accessed September 10, 2014.
- , , , et al. Pediatric observation status: are we overlooking a growing population in children's hospitals? J Hosp Med. 2012;7:530–536.
- , , , et al. Differences in designations of observation care in US freestanding children's hospitals: are they virtual or real? J Hosp Med. 2012;7:287–293.
- , , , et al. Accuracy of administrative billing codes to detect urinary tract infection hospitalizations. Pediatrics. 2011;128:323–330.
- , , , et al. Identifying pediatric community‐acquired pneumonia hospitalizations: accuracy of administrative billing codes. JAMA Pediatr. 2013;167:851–858.
- , , , . Initial emergency department diagnosis and return visits: risk versus perception. Ann Emerg Med. 1998;32:569–573.
- , , , , . A national depiction of children with return visits to the emergency department within 72 hours, 2001–2007. Pediatr Emerg Care. 2012;28:606–610.
- Healthcare Cost and Utilization Project. Cost‐to‐charge ratio files. Available at: http://www.hcup‐us.ahrq.gov/db/state/costtocharge.jsp. Accessed September 11, 2014.
- , , , et al. Risk of serious bacterial infection in young febrile infants with respiratory syncytial virus infections. Pediatrics. 2004;113:1728–1734.
- , , , et al. Establishing benchmarks for the hospitalized care of children with asthma, bronchiolitis, and pneumonia. Pediatrics. 2014;134:555–562.
- , , , , , . Well appearing young infants with fever without known source in the emergency department: are lumbar punctures always necessary? Eur J Emerg Med. 2010;17:167–169.
- , . Unpredictability of serious bacterial illness in febrile infants from birth to 1 month of age. Arch Pediatr Adolesc Med. 1999;153:508–511.
- , , , et al. Management and outcomes of care of fever in early infancy. JAMA. 2004;291:1203–1212.
© 2015 Society of Hospital Medicine

Return Visits to Pediatric EDs
Returns to the hospital following recent encounters, such as an admission to the inpatient unit or evaluation in an emergency department (ED), may reflect the natural progression of a disease, the quality of care received during the initial admission or visit, or the quality of the underlying healthcare system.[1, 2, 3, 4, 5, 6, 7, 8, 9, 10] Although national attention has focused on hospital readmissions,[3, 4, 5, 6, 7, 11, 12] ED revisits are a source of concern to emergency physicians.[8, 9] Some ED revisits are medically necessary, but revisits that may be managed in the primary care setting contribute to ED crowding, can be stressful to patients and providers, and increase healthcare costs.[10, 11, 12] Approximately 27 million annual ED visits are made by children, accounting for over one‐quarter of all ED visits in the United States, with a reported ED revisit rate of 2.5% to 5.2%.[2, 13, 14, 15, 16, 17, 18, 19, 20] Improved understanding of the patient‐level or visit‐level factors associated with ED revisits may provide an opportunity to enhance disposition decision making at the index visit and optimize site of and communication around follow‐up care.
Previous studies on ED revisits have largely been conducted in single centers and have used variable visit intervals ranging between 48 hours and 30 days.[2, 13, 16, 18, 21, 22, 23, 24, 25] Two national studies used the National Hospital Ambulatory Medical Care Survey, which includes data from both general and pediatric EDs.[13, 14] Factors identified to be associated with increased odds of returning were: young age, higher acuity, chronic conditions, and public insurance. One national study identified some diagnoses associated with higher likelihood of returning,[13] whereas the other focused primarily on infectious diseaserelated diagnoses.[14]
The purpose of this study was to describe the prevalence of return visits specifically to pediatric EDs and to investigate patient‐level, visit‐level, and healthcare systemrelated factors that may be associated with return visits and hospitalization at return.
METHODS
Study Design and Data Source
This retrospective cohort study used data from the Pediatric Health Information System (PHIS), an administrative database with data from 44 tertiary care pediatric hospitals in 27 US states and the District of Columbia. This database contains patient demographics, diagnoses, and procedures as well as medications, diagnostic imaging, laboratory, and supply charges for each patient. Data are deidentified prior to inclusion; encrypted medical record numbers allow for the identification of individual patients across all ED visits and hospitalizations to the same hospital. The Children's Hospital Association (Overland Park, KS) and participating hospitals jointly assure the quality and integrity of the data. This study was approved by the institutional review board at Boston Children's Hospital with a waiver for informed consent granted.
Study Population and Protocol
To standardize comparisons across the hospitals, we included data from 23 of the 44 hospitals in PHIS; 7 were excluded for not including ED‐specific data. For institutions that collect information from multiple hospitals within their healthcare system, we included only records from the main campus or children's hospital when possible, leading to the exclusion of 9 hospitals where the data were not able to be segregated. As an additional level of data validation, we compared the hospital‐level ED volume and admission rates as reported in the PHIS to those reported to a separate database (the Pediatric Analysis and Comparison Tool). We further excluded 5 hospitals whose volume differed by >10% between these 2 data sources.
Patients <18 years of age who were discharged from these EDs following their index visit in 2012 formed the eligible cohort.
Key Outcome Measures
The primary outcomes were return visits within 72 hours of discharge from the ED, and return visits resulting in hospitalization, including observation status. We defined an ED revisit as a return within 72 hours of ED discharge regardless of whether the patient was subsequently discharged from the ED on the return visit or hospitalized. We assessed revisits within 72 hours of an index ED discharge, because return visits within this time frame are likely to be related to the index visit.[2, 13, 16, 21, 22, 24, 25, 26]
Factors Associated With ED Revisits
A priori, we chose to adjust for the following patient‐level factors: age (<30 days, 30 days<1 year, 14 years, 511 years, 1217 years), gender, and socioeconomic status (SES) measured as the zip codebased median household income, obtained from the 2010 US Census, with respect to the federal poverty level (FPL) (<1.5 FPL, 1.52 FPL, 23 FPL, and >3 FPL).[27] We also adjusted for insurance type (commercial, government, or other), proximity of patient's home zip code to hospital (modeled as the natural log of the geographical distance to patient's home address from the hospital), ED diagnosis‐based severity classification system score (1=low severity, 5=high severity),[28] presence of a complex chronic condition at the index or prior visits using a validated classification scheme,[15, 29, 30, 31] and primary care physician (PCP) density per 100,000 in the patient's residential area (modeled as quartiles: very low, <57.2; low, 57.267.9; medium, 68.078.7; high, >78.8). PCP density, defined by the Dartmouth Atlas of Health Care,[32, 33, 34] is the number of primary care physicians per 100,000 residents (PCP count) in federal health service areas (HSA). Patients were assigned to a corresponding HSA based on their home zip code.
Visit‐level factors included arrival time of index visit (8:01 am 4:00 pm, 4:01 pm12:00 am, 12:01 am8 am representing day, evening, and overnight arrival, respectively), day of the week, season, length of stay (LOS) in the ED during the index visit, and ED crowding (calculated as the average daily LOS/yearly average LOS for the individual ED).[35] We categorized the ED primary diagnosis for each visit using the major diagnosis groupings of a previously described pediatric ED‐specific classification scheme.[36] Using International Classification of Diseases, Ninth Revision (ICD‐9) codes, we identified the conditions with the highest ED revisit rates.
Statistical Analyses
Categorical variables describing the study cohort were summarized using frequencies and percentages. Continuous variables were summarized using mean, median, and interquartile range values, where appropriate. We used 2 different hierarchical logistic regression models to assess revisit rates by patient‐ and visit‐level characteristics. The initial model included all patients discharged from the ED following the index visit and assessed for the outcome of a revisit within 72 hours. The second model considered only patients who returned within 72 hours of an index visit and assessed for hospitalization on that return visit. We used generalized linear mixed effects models, with hospital as a random effect to account for the presence of correlated data (within hospitals), nonconstant variability (across hospitals), and binary responses. Adjusted odds ratios with 95% confidence intervals were used as summary measures of the effect of the individual adjusters. Adjusters were missing in fewer than 5% of patients across participating hospitals. Statistical analyses were performed using SAS version 9.3 (SAS Institute Inc., Cary, NC); 2‐sided P values <0.004 were considered statistically significant to account for multiple comparisons (Bonferroni‐adjusted level of significance=0.0038).
RESULTS
Patients
A total of 1,610,201 patients <18 years of age evaluated across the 23 PHIS EDs in 2012 were included in the study. Twenty‐one of the 23 EDs have academic affiliations; 10 are located in the South, 6 in the Midwest, 5 in the West, and 2 in the Northeast region of the United States. The annual ED volume for these EDs ranged from 25,090 to 136,160 (median, 65,075; interquartile range, 45,28085,206). Of the total patients, 1,415,721 (87.9%) were discharged following the index visit and comprised our study cohort. Of these patients, 47,294 (revisit rate: 3.3%) had an ED revisit within 72 hours. There were 4015 patients (0.3%) who returned more than once within 72 hours, and the largest proportion of these returned with infection‐related conditions. Of those returning, 37,999 (80.3%) were discharged again, whereas 9295 (19.7%) were admitted to the hospital (Figure 1). The demographic and clinical characteristics of study participants are displayed in Table 1.
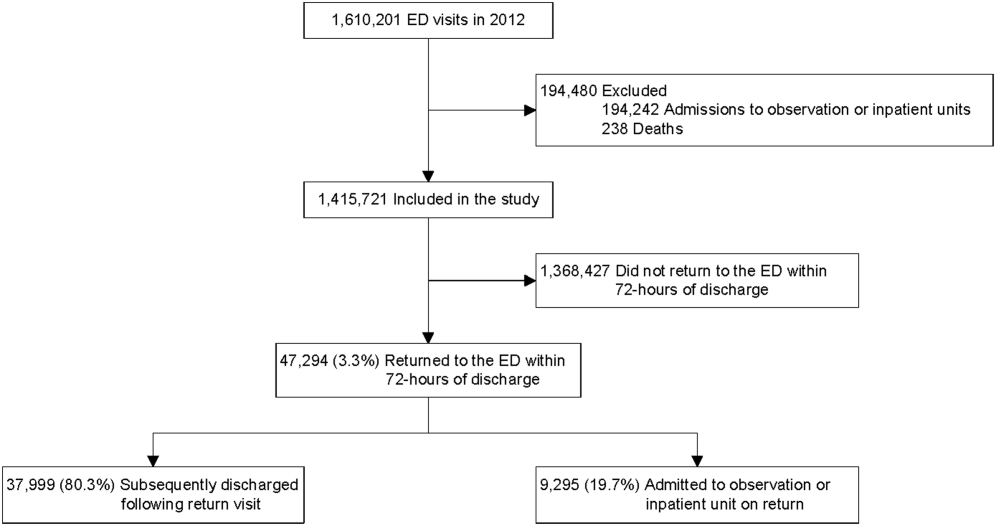
| Index Visit, n=1,415,721, n (%) | Return Visits Within 72 Hours of Discharge, n=47,294, 3.3% | ||
|---|---|---|---|
| Return to Discharge, n (%) | Return to Admission, n (%) | ||
| |||
| Gender, female | 659,417 (46.6) | 17,665 (46.5) | 4,304 (46.3) |
| Payor | |||
| Commercial | 379,403 (26.8) | 8,388 (22.1) | 3,214 (34.6) |
| Government | 925,147 (65.4) | 26,880 (70.7) | 5,786 (62.3) |
| Other | 111,171 (7.9) | 2,731 (7.2) | 295 (3.2) |
| Age | |||
| <30 days | 19,217 (1.4) | 488 (1.3) | 253 (2.7) |
| 30 days to <1 year | 216,967 (15.3) | 8,280 (21.8) | 2,372 (25.5) |
| 1 year to 4 years | 547,083 (38.6) | 15,542 (40.9) | 3,187 (34.3) |
| 5 years to 11 years | 409,463 (28.9) | 8,906 (23.4) | 1,964 (21.1) |
| 12 years to 17 years | 222,991 (15.8) | 4,783 (12.6) | 1,519 (16.3) |
| Socioeconomic statusa | |||
| <1.5 times FPL | 493,770 (34.9) | 13,851 (36.5) | 2,879 (31.0) |
| 1.5 to 2 times FPL | 455,490 (32.2) | 12,364 (32.5) | 2,904 (31.2) |
| 2 to 3 times FPL | 367,557 (26.0) | 9,560 (25.2) | 2,714 (29.2) |
| >3 times FPL | 98,904 (7.0) | 2,224 (5.9) | 798 (8.6) |
| Primary care physician density per 100,000 patients | |||
| Very low | 351,798 (24.9) | 8,727 (23.0) | 2,628 (28.3) |
| Low | 357,099 (25.2) | 9,810 (25.8) | 2,067 (22.2) |
| Medium | 347,995 (24.6) | 10,186 (26.8) | 2,035 (21.9) |
| High | 358,829 (25.4) | 9,276 (24.4) | 2,565 (27.6) |
| CCC present, yes | 125,774 (8.9) | 4,446 (11.7) | 2,825 (30.4) |
| Severity score | |||
| Low severity (0,1,2) | 721,061 (50.9) | 17,310 (45.6) | 2,955 (31.8) |
| High severity (3,4,5) | 694,660 (49.1) | 20,689 (54.5) | 6,340 (68.2) |
| Time of arrival | |||
| Day | 533,328 (37.7) | 13,449 (35.4) | 3,396 (36.5) |
| Evening | 684,873 (48.4) | 18,417 (48.5) | 4,378 (47.1) |
| Overnight | 197,520 (14.0) | 6,133 (16.1) | 1,521 (16.4) |
| Season | |||
| Winter | 384,957 (27.2) | 10,603 (27.9) | 2,844 (30.6) |
| Spring | 367,434 (26.0) | 9,923 (26.1) | 2,311 (24.9) |
| Summer | 303,872 (21.5) | 8,308 (21.9) | 1,875 (20.2) |
| Fall | 359,458 (25.4) | 9,165 (24.1) | 2,265 (24.4) |
| Weekday/weekend | |||
| Monday | 217,774 (15.4) | 5,646 (14.9) | 1,394 (15) |
| Tuesday | 198,220 (14.0) | 5,054 (13.3) | 1,316 (14.2) |
| Wednesday | 194,295 (13.7) | 4,985 (13.1) | 1,333 (14.3) |
| Thursday | 191,950 (13.6) | 5,123 (13.5) | 1,234 (13.3) |
| Friday | 190,022 (13.4) | 5,449 (14.3) | 1,228 (13.2) |
| Saturday | 202,247 (14.3) | 5,766 (15.2) | 1,364 (14.7) |
| Sunday | 221,213 (15.6) | 5,976 (15.7) | 1,426 (15.3) |
| Distance from hospital in miles, median (IQR) | 8.3 (4.614.9) | 9.2 (4.917.4) | 8.3 (4.614.9) |
| ED crowding score at index visit, median (IQR) | 1.0 (0.91.1) | 1.0 (0.91.1) | 1.0 (0.91.1) |
| ED LOS in hours at index visit, median (IQR) | 2.0 (1.03.0) | 3.0 (2.05.0) | 2.0 (1.03.0) |
ED Revisit Rates and Revisits Resulting in Admission
In multivariate analyses, compared to patients who did not return to the ED, patients who returned within 72 hours of discharge had higher odds of revisit if they had the following characteristics: a chronic condition, were <1 year old, a higher severity score, and public insurance. Visit‐level factors associated with higher odds of revisits included arrival for the index visit during the evening or overnight shift or on a Friday or Saturday, index visit during times of lower ED crowding, and living closer to the hospital. On return, patients were more likely to be hospitalized if they had a higher severity score, a chronic condition, private insurance, or were <30 days old. Visit‐level factors associated with higher odds of hospitalization at revisit included an index visit during the evening and overnight shift and living further from the hospital. Although the median SES and PCP density of a patient's area of residence were not associated with greater likelihood of returning, when they returned, patients residing in an area with a lower SES and higher PCP densities (>78.8 PCPs/100,000) had lower odds of being admitted to the hospital. Patients whose index visit was on a Sunday also had lower odds of being hospitalized upon return (Table 2).
| Characteristic | Adjusted OR of 72‐Hour Revisit (95% CI), n=1,380,723 | P Value | Adjusted OR of 72‐Hour Revisit Admissions (95% CI), n=46,364 | P Value |
|---|---|---|---|---|
| ||||
| Gender | ||||
| Male | 0.99 (0.971.01) | 0.2809 | 1.02 (0.971.07) | 0.5179 |
| Female | Reference | Reference | ||
| Payor | ||||
| Government | 1.14 (1.111.17) | <0.0001 | 0.68 (0.640.72) | <0.0001 |
| Other | 0.97 (0.921.01) | 0.1148 | 0.33 (0.280.39) | <0.0001 |
| Private | Reference | Reference | ||
| Age group | ||||
| 30 days to <1 year | 1.32 (1.221.42) | <0.0001 | 0.58 (0.490.69) | <0.0001 |
| 1 year to 5 years | 0.89 (0.830.96) | 0.003 | 0.41 (0.340.48) | <0.0001 |
| 5 years to 11 years | 0.69 (0.640.74) | <0.0001 | 0.40 (0.330.48) | <0.0001 |
| 12 years to 17 years | 0.72 (0.660.77) | <0.0001 | 0.50 (0.420.60) | <0.0001 |
| <30 days | Reference | Reference | ||
| Socioeconomic statusa | ||||
| % <1.5 times FPL | 0.96 (0.921.01) | 0.0992 | 0.82 (0.740.92) | 0.0005 |
| % 1.5 to 2 times FPL | 0.98 (0.941.02) | 0.2992 | 0.83 (0.750.92) | 0.0005 |
| % 2 to 3 times FPL | 1.02 (0.981.07) | 0.292 | 0.88 (0.790.97) | 0.01 |
| % >3 times FPL | Reference | Reference | ||
| Severity score | ||||
| High severity, 4, 5, 6 | 1.43 (1.401.45) | <0.0001 | 3.42 (3.233.62) | <0.0001 |
| Low severity, 1, 2, 3 | Reference | Reference | ||
| Presence of any CCC | ||||
| Yes | 1.90 (1.861.96) | <0.0001 | 2.92 (2.753.10) | <0.0001 |
| No | Reference | Reference | ||
| Time of arrival | ||||
| Evening | 1.05 (1.031.08) | <0.0001 | 1.37 (1.291.44) | <0.0001 |
| Overnight | 1.19 (1.151.22) | <0.0001 | 1.84 (1.711.97) | <0.0001 |
| Day | Reference | Reference | ||
| Season | ||||
| Winter | 1.09 (1.061.11) | <0.0001 | 1.06 (0.991.14) | 0.0722 |
| Spring | 1.07 (1.041.10) | <0.0001 | 0.98 (0.911.046) | 0.4763 |
| Summer | 1.05 (1.021.08) | 0.0011 | 0.93 (0.871.01) | 0.0729 |
| Fall | Reference | Reference | ||
| Weekday/weekend | ||||
| Thursday | 1.02 (0.9821.055) | 0.3297 | 0.983 (0.8971.078) | 0.7185 |
| Friday | 1.08 (1.041.11) | <0.0001 | 1.03 (0.941.13) | 0.5832 |
| Saturday | 1.08 (1.041.12) | <0.0001 | 0.89 (0.810.97) | 0.0112 |
| Sunday | 1.02 (0.991.06) | 0.2054 | 0.81 (0.740.89) | <0.0001 |
| Monday | 1.00 (0.961.03) | 0.8928 | 0.98 (0.901.07) | 0.6647 |
| Tuesday | 0.99 (0.951.03) | 0.5342 | 0.93 (0.851.02) | 0.1417 |
| Wednesday | Reference | Reference | ||
| PCP ratio per 100,000 patients | ||||
| 57.267.9 | 1.00 (0.961.04) | 0.8844 | 0.93 (0.841.03) | 0.1669 |
| 68.078.7 | 1.00 (0.951.04) | 0.8156 | 0.86 (0.770.96) | 0.0066 |
| >78.8 | 1.00 (0.951.04) | 0.6883 | 0.82 (0.730.92) | 0.001 |
| <57.2 | Reference | Reference | ||
| ED crowding score at index visitb | ||||
| 2 | 0.92 (0.900.95) | <0.0001 | 0.96 (0.881.05) | 0.3435 |
| 1 | Reference | Reference | ||
| Distance from hospitalc | ||||
| 3.168, 23.6 miles | 0.95 (0.940.96) | <0.0001 | 1.16 (1.121.19) | <0.0001 |
| 2.168, 8.7 miles | Reference | Reference | ||
| ED LOS at index visitb | ||||
| 3.7 hours | 1.003 (1.0011.005) | 0.0052 | NA | |
| 2.7 hours | Reference | |||
Diagnoses Associated With Return Visits
Patients with index visit diagnoses of sickle cell disease and leukemia had the highest proportion of return visits (10.7% and 7.3%, respectively). Other conditions with high revisit rates included infectious diseases such as cellulitis, bronchiolitis, and gastroenteritis. Patients with other chronic diseases such as diabetes and with devices, such as gastrostomy tubes, also had high rates of return visits. At return, the rate of hospitalization for these conditions ranged from a 1‐in‐6 chance of hospitalization for the diagnoses of a fever to a 1‐in‐2 chance of hospitalization for patients with sickle cell anemia (Table 3).
| Major Diagnostic Subgroup | No. of Index ED Visit Dischargesa | 72‐Hour Revisit, % (95% CI) | Admitted on Return, % (95% CI) |
|---|---|---|---|
| |||
| Sickle cell anemia | 2,531 | 10.7 (9.511.9) | 49.6 (43.755.6) |
| Neoplastic diseases, cancer | 536 | 7.3 (5.19.5) | 36 (2151) |
| Infectious gastrointestinal diseases | 802 | 7.2 (5.49.0) | 21 (1031) |
| Devices and complications of the circulatory systemb | 1,033 | 6.9 (5.38.4) | 45 (3457) |
| Other hematologic diseasesb | 1,538 | 6.1 (4.97.3) | 33 (2443) |
| Fever | 80,626 | 5.9 (5.76.0) | 16.3 (15.217.3) |
| Dehydration | 7,362 | 5.4 (5.25.5) | 34.6 (30.139) |
| Infectious respiratory diseases | 72,652 | 5.4 (5.25.5) | 28.6 (27.230) |
| Seizures | 17,637 | 5.3 (4.95.6) | 33.3 (30.336.4) |
| Other devices and complicationsb | 1,896 | 5.3 (4.36.3) | 39.0 (29.448.6) |
| Infectious skin, dermatologic and soft tissue diseases | 40,272 | 4.7 (4.55) | 20.0 (18.221.8) |
| Devices and complications of the gastrointestinal systemb | 4,692 | 4.6 (4.05.2) | 24.7 (18.930.4) |
| Vomiting | 44,730 | 4.4 (4.24.6) | 23.7 (21.825.6) |
| Infectious urinary tract diseases | 17,020 | 4.4 (4.14.7) | 25.9 (22.729) |
| Headache | 19,016 | 4.3 (4.14.6) | 28.2 (25.131.3) |
| Diabetes mellitus | 1,531 | 4.5 (3.35.3) | 29 (1840) |
| Abdominal pain | 39,594 | 4.2 (44.4) | 24.8 (22.726.8) |
| Other infectious diseasesb | 647 | 4.2 (2.65.7) | 33 (1651) |
| Gastroenteritis | 55,613 | 4.0 (3.84.1) | 20.6 (18.922.3) |
DISCUSSION
In this nationally representative sample of free‐standing children's hospitals, 3.3% of patients discharged from the ED returned to the same ED within 72 hours. This rate is similar to rates previously published in studies of general EDs.[11, 15] Of the returning children, over 80% were discharged again, and 19.7% were hospitalized, which is two‐thirds more than the admission rate at index visit (12%). In accordance with previous studies,[14, 16, 25] we found higher disease severity, presence of a chronic condition, and younger age were strongly associated with both the odds of patients returning to the ED and of being hospitalized at return. Patients who were hospitalized lived further away from the hospital and were of a higher SES. In this study, we show that visit‐level and access‐related factors are also associated with increased risk of return, although to a lesser degree. Patients seen on a weekend (Friday or Saturday) were found to have higher odds of returning, whereas those seen initially on a Sunday had lower odds of hospitalization at return. In this study, we also found that patients seen on the evening or night shifts at the index presentation had a significant association with return visits and hospitalization at return. Additionally, we found that although PCP density was not associated with the odds of returning to the ED, patients from areas with a higher PCP density were less likely to be admitted at return. In addition, by evaluating the diagnoses of patients who returned, we found that many infectious conditions commonly seen in the ED also had high return rates.
As previously shown,[23] we found that patients with complex and chronic diseases were at risk for ED revisits, especially patients with sickle cell anemia and cancer (mainly acute leukemia). In addition, patients with a chronic condition were 3 times more likely to be hospitalized when they returned. These findings may indicate an opportunity for improved discharge planning and coordination of care with subspecialty care providers for particularly at‐risk populations, or stronger consideration of admission at the index visit. However, admission for these patients at revisit may be unavoidable.
Excluding patients with chronic and complex conditions, the majority of conditions with high revisit rates were acute infectious conditions. One national study showed that >70% of ED revisits by patients with infectious conditions had planned ED follow‐up.[13] Although this study was unable to assess the reasons for return or admission at return, children with infectious diseases often worsen over time (eg, those with bronchiolitis). The relatively low admission rates at return for these conditions, despite evidence that providers may have a lower threshold for admission when a patient returns to the ED shortly after discharge,[24] may reflect the potential for improving follow‐up at the PCP office. However, although some revisits may be prevented,[37, 38] we recognize that an ED visit could be appropriate and necessary for some of these children, especially those without primary care.
Access to primary care and insurance status influence ED utilization.[14, 39, 40, 41] A fragmented healthcare system with poor access to primary care is strongly associated with utilization of the ED for nonurgent care. A high ED revisit rate might be indicative of poor coordination between ED and outpatient services.[9, 39, 42, 43, 44, 45, 46] Our study's finding of increased risk of return visit if the index visit occurred on a Friday or Saturday, and a decreased likelihood of subsequent admission when a patient returns on a Sunday, may suggest limited or perceived limited access to the PCP over a weekend. Although insured patients tend to use the ED less often for nonemergent cases, even when patients have PCPs, they might still choose to return to the ED out of convenience.[47, 48] This may be reflected in our finding that, when adjusted for insurance status and PCP density, patients who lived closer to the hospital were more likely to return, but less likely to be admitted, thereby suggesting proximity as a factor in the decision to return. It is also possible that patients residing further away returned to another institution. Although PCP density did not seem to be associated with revisits, patients who lived in areas with higher PCP density were less likely to be admitted when they returned. In this study, there was a stepwise gradient in the effect of PCP density on the odds of being hospitalized on return with those patients in areas with fewer PCPs being admitted at higher rates on return. Guttmann et al.,[40] in a recent study conducted in Canada where there is universal health insurance, showed that children residing in areas with higher PCP densities had higher rates of PCP visits but lower rates of ED visits compared to children residing in areas with lower PCP densities. It is possible that emergency physicians have more confidence that patients will have dedicated follow‐up when a PCP can be identified. These findings suggest that the development of PCP networks with expanded access, such as alignment of office hours with parent need and patient/parent education about PCP availability, may reduce ED revisits. Alternatively, creation of centralized hospital‐based urgent care centers for evening, night, and weekend visits may benefit both the patient and the PCP and avoid ED revisits and associated costs.
Targeting and eliminating disparities in care might also play a role in reducing ED revisits. Prior studies have shown that publicly insured individuals, in particular, frequently use the ED as their usual source of care and are more likely to return to the ED within 72 hours of an initial visit.[23, 39, 44, 49, 50] Likewise, we found that patients with public insurance were more likely to return but less likely to be admitted on revisit. After controlling for disease severity and other demographic variables, patients with public insurance and of lower socioeconomic status still had lower odds of being hospitalized following a revisit. This might also signify an increase of avoidable hospitalizations among patients of higher SES or with private insurance. Further investigation is needed to explore the reasons for these differences and to identify effective interventions to eliminate disparities.
Our findings have implications for emergency care, ambulatory care, and the larger healthcare system. First, ED revisits are costly and contribute to already overburdened EDs.[10, 11] The average ED visit incurs charges that are 2 to 5 times more than an outpatient office visit.[49, 50] Careful coordination of ambulatory and ED services could not only ensure optimal care for patients, but could save the US healthcare system billions of dollars in potentially avoidable healthcare expenditures.[49, 50] Second, prior studies have demonstrated a consistent relationship between poor access to primary care and increased use of the ED for nonurgent conditions.[42] Publicly insured patients have been shown to have disproportionately increased difficulty acquiring and accessing primary care.[41, 42, 47, 51] Furthermore, conditions with high ED revisit rates are similar to conditions reported by Berry et al.4 as having the highest hospital readmission rates such as cancer, sickle cell anemia, seizure, pneumonia, asthma, and gastroenteritis. This might suggest a close relationship between 72‐hour ED revisits and 30‐day hospital readmissions. In light of the recent expansion of health insurance coverage to an additional 30 million individuals, the need for better coordination of services throughout the entire continuum of care, including primary care, ED, and inpatient services, has never been more important.[52] Future improvements could explore condition‐specific revisit or readmission rates to identify the most effective interventions to reduce the possibly preventable returns.
This study has several limitations. First, as an administrative database, PHIS has limited clinical data, and reasons for return visits could not be assessed. Variations between hospitals in diagnostic coding might also lead to misclassification bias. Second, we were unable to assess return visits to a different ED. Thus, we may have underestimated revisit frequency. However, because children are generally more likely to seek repeat care in the same hospital,[3] we believe our estimate of return visit rate approximates the actual return visit rate; our findings are also similar to previously reported rates. Third, for the PCP density factor, we were unable to account for types of insurance each physician accepted and influence on return rates. Fourth, return visits in our sample could have been for conditions unrelated to the diagnosis at index visit, though the short timeframe considered for revisits makes this less likely. In addition, the crowding index does not include the proportion of occupied beds at the precise moment of the index visit. Finally, this cohort includes only children seen in the EDs of pediatric hospitals, and our findings may not be generalizable to all EDs who provide care for ill and injured children.
We have shown that, in addition to previously identified patient level factors, there are visit‐level and access‐related factors associated with pediatric ED return visits. Eighty percent are discharged again, and almost one‐fifth of returning patients are admitted to the hospital. Admitted patients tend to be younger, sicker, chronically ill, and live farther from the hospital. By being aware of patients' comorbidities, PCP access, as well as certain diagnoses associated with high rates of return, physicians may better target interventions to optimize care. This may include having a lower threshold for hospitalization at the initial visit for children at high risk of return, and communication with the PCP at the time of discharge to ensure close follow‐up. Our study helps to provide benchmarks around ED revisit rates, and may serve as a starting point to better understand variation in care. Future efforts should aim to find creative solutions at individual institutions, with the goal of disseminating and replicating successes more broadly. For example, investigators in Boston have shown that the use of a comprehensive home‐based asthma management program has been successful in decreasing emergency department visits and hospitalization rates.[53] It is possible that this approach could be spread to other institutions to decrease revisits for patients with asthma. As a next step, the authors have undertaken an investigation to identify hospital‐level characteristics that may be associated with rates of return visits.
Acknowledgements
The authors thank the following members of the PHIS ED Return Visits Research Group for their contributions to the data analysis plan and interpretation of results of this study: Rustin Morse, MD, Children's Medical Center of Dallas; Catherine Perron, MD, Boston Children's Hospital; John Cheng, MD, Children's Healthcare of Atlanta; Shabnam Jain, MD, MPH, Children's Healthcare of Atlanta; and Amanda Montalbano, MD, MPH, Children's Mercy Hospitals and Clinics. These contributors did not receive compensation for their help with this work.
Disclosures
A.T.A. and A.M.S. conceived the study and developed the initial study design. All authors were involved in the development of the final study design and data analysis plan. C.W.T. collected and analyzed the data. A.T.A. and C.W.T. had full access to all of the data and take responsibility for the integrity of the data and the accuracy of the data analysis. All authors were involved in the interpretation of the data. A.T.A. drafted the article, and all authors made critical revisions to the initial draft and subsequent versions. A.T.A. and A.M.S. take full responsibility for the article as a whole. The authors report no conflicts of interest.
- Joint policy statement—guidelines for care of children in the emergency department. Pediatrics. 2009;124:1233–1243.
- , , , , . Return visits to a pediatric emergency department. Pediatr Emerg Care. 2004;20:166–171.
- , . Hospital readmission as an accountability measure. JAMA. 2011;305:504–505.
- , , , et al. Hospital utilization and characteristics of patients experiencing recurrent readmissions within children's hospitals. JAMA. 2011;305:682–690.
- , , , et al. Pediatric readmission prevalence and variability across hospitals. JAMA. 2013;309:372–380.
- . Farewell, and don't come back. Health reform gives hospitals a big incentive to send patients home for good. US News World Rep. 2010;147:20, 22–23.
- . CMS' stealth health reform. Plan to reduce readmissions and boost the continuum of care. Hosp Health Netw. 2008;82:24.
- , . Return visits to the emergency department. J Emerg Med. 1987;5:359–362.
- , , , . Emergency department visits after hospital discharge: a missing part of the equation. Ann Emerg Med. 2013;62:145–150.
- , , , , . Quality indicators for high acuity pediatric conditions. Pediatrics. 2013;132:752–762.
- , . Revisiting hospital readmissions. JAMA. 2013;309:398–400.
- , , . Thirty‐day readmissions: the clock is ticking. JAMA. 2013;309:345–346.
- . Patients seen in emergency departments who had a prior visit within the previous 72 h‐National Hospital Ambulatory Medical Care Survey, 2002. Public Health. 2005;119:914–918.
- , , , , . A national depiction of children with return visits to the emergency department within 72 hours, 2001–2007. Pediatr Emerg Care. 2012;28:606–610.
- , , , et al. How well can hospital readmission be predicted in a cohort of hospitalized children? A retrospective, multicenter study. Pediatrics. 2009;123:286–293.
- , , . Unscheduled return visits to the pediatric emergency department‐one‐year experience. Pediatr Emerg Care. 2006;22:545–549.
- , . Return visits to the emergency department among febrile children 3 to 36 months of age. Pediatr Emerg Care. 2011;27:1126–1129.
- , , , . Pediatric emergency department recidivism: demographic characteristics and diagnostic predictors. J Emerg Nurs. 2006;32:131–138.
- Healthcare Cost and Utilization Project. Pediatric emergency department visits in community hospitals from selected states, 2005. Statistical brief #52. Available at: http://www.ncbi.nlm.nih.gov/books/NBK56039. Accessed October 3, 2013.
- , , , , , . Factors influencing infant visits to emergency departments. Pediatrics. 2000;106:1031–1039.
- , , , . Early pediatric emergency department return visits: a prospective patient‐centric assessment. Clin Pediatr (Phila). 2012;51:651–658.
- , , , , . Unscheduled return visits with and without admission post emergency department discharge. J Emerg Med. 2012;43:1110–1118.
- , , , . Unscheduled revisits to a pediatric emergency department: risk factors for children with fever or infection‐related complaints. Pediatr Emerg Care. 2005;21:816–821.
- , , , , . Unscheduled return visits to the emergency department: consequences for triage. Acad Emerg Med. 2013;20:33–39.
- , , , et al. Repeat pediatric visits to a general emergency department. Ann Emerg Med. 1996;28:467–473.
- , , , , . Emergency department revisits. Ann Emerg Med. 1989;18:964–968.
- US Department of Health 19:70–78.
- , , . Pediatric deaths attributable to complex chronic conditions: a population‐based study of Washington State, 1980–1997. Pediatrics. 2000;106:205–209.
- , , , , , . Deaths attributed to pediatric complex chronic conditions: national trends and implications for supportive care services. Pediatrics. 2001;107:E99.
- , , . Where do children with complex chronic conditions die? Patterns in Washington State, 1980–1998. Pediatrics. 2002;109:656–660.
- Dartmouth Atlas of Health Care. Hospital and physician capacity, 2006. Available at: http://www.dartmouthatlas.org/data/topic/topic.aspx?cat=24. Accessed October 7, 2013.
- Dartmouth Atlas of Health Care. Research methods. What is an HSA/HRR? Available at: http://www.dartmouthatlas.org/tools/faq/researchmethods.aspx. Accessed October 7, 2013,.
- Dartmouth Atlas of Health Care. Appendix on the geography of health care in the United States. Available at: http://www.dartmouthatlas.org/downloads/methods/geogappdx.pdf. Accessed October 7, 2013.
- , , . Emergency department crowding: prioritising quantified crowding measures using a Delphi study. Emerg Med J. 2012;29:868–871.
- , , , , . A new diagnosis grouping system for child emergency department visits. Acad Emerg Med. 2010;17:204–213.
- , , , et al. Effectiveness of emergency department asthma management strategies on return visits in children: a population‐based study. Pediatrics. 2007;120:e1402–e1410.
- , , , . Emergency department patients with diabetes have better glycemic control when they have identifiable primary care providers. Acad Emerg Med. 2012;19:650–655.
- , , , , , Newman L. Impact of socioeconomic status on hospital use in New York City. Health Aff (Millwood). 1993;12:162–173.
- , , , , . Primary care physician supply and children's health care use, access, and outcomes: findings from Canada. Pediatrics. 2010;125:1119–1126.
- , , , et al. Insurance status and access to urgent ambulatory care follow‐up appointments. JAMA. 2005;294:1248–1254.
- , . Emergency departments, Medicaid costs, and access to primary care—understanding the link. N Engl J Med. 2012;366:2141–2143.
- Committee on the Future of Emergency Care in the United States Health System. Emergency Care for Children: Growing Pains. Washington, DC: The National Academies Press; 2007.
- Committee on the Future of Emergency Care in the United States Health System. Hospital‐Based Emergency Care: At the Breaking Point. Washington, DC: The National Academies Press; 2007.
- , . Geographic variation in access to care—the relationship with quality. N Engl J Med. 2012;367:3–6.
- , , , , . Trends and characteristics of US emergency department visits, 1997–2007. JAMA. 2010;304:664–670.
- , , , , . Ambulatory visits to hospital emergency departments. Patterns and reasons for use. 24 Hours in the ED Study Group. JAMA. 1996;276:460–465.
- , , , , . Emergency department workload increase: dependence on primary care? J Emerg Med. 2010;38:279–285.
- Network for Excellence in Health Innovation. Leading healthcare research organizations to examine emergency department overuse. New England Research Institute, 2008. Available at: http://www.nehi.net/news/310‐leading‐health‐care‐research‐organizations‐to‐examine‐emergency‐department‐overuse/view. Accessed October 4, 2013.
- Robert Wood Johnson Foundation. Quality field notes: reducing inappropriate emergency department use. Available at: http://www.rwjf.org/en/research‐publications/find‐rwjf‐research/2013/09/quality‐field‐notes–reducing‐inappropriate‐emergency‐department.html.
- Access of Medicaid recipients to outpatient care. N Engl J Med. 1994;330:1426–1430.
- Medicaid policy statement. Pediatrics. 2013;131:e1697–e1706.
- , , , et al. Community asthma initiative: evaluation of a quality improvement program for comprehensive asthma care. Pediatrics. 2012;129:465–472.
Returns to the hospital following recent encounters, such as an admission to the inpatient unit or evaluation in an emergency department (ED), may reflect the natural progression of a disease, the quality of care received during the initial admission or visit, or the quality of the underlying healthcare system.[1, 2, 3, 4, 5, 6, 7, 8, 9, 10] Although national attention has focused on hospital readmissions,[3, 4, 5, 6, 7, 11, 12] ED revisits are a source of concern to emergency physicians.[8, 9] Some ED revisits are medically necessary, but revisits that may be managed in the primary care setting contribute to ED crowding, can be stressful to patients and providers, and increase healthcare costs.[10, 11, 12] Approximately 27 million annual ED visits are made by children, accounting for over one‐quarter of all ED visits in the United States, with a reported ED revisit rate of 2.5% to 5.2%.[2, 13, 14, 15, 16, 17, 18, 19, 20] Improved understanding of the patient‐level or visit‐level factors associated with ED revisits may provide an opportunity to enhance disposition decision making at the index visit and optimize site of and communication around follow‐up care.
Previous studies on ED revisits have largely been conducted in single centers and have used variable visit intervals ranging between 48 hours and 30 days.[2, 13, 16, 18, 21, 22, 23, 24, 25] Two national studies used the National Hospital Ambulatory Medical Care Survey, which includes data from both general and pediatric EDs.[13, 14] Factors identified to be associated with increased odds of returning were: young age, higher acuity, chronic conditions, and public insurance. One national study identified some diagnoses associated with higher likelihood of returning,[13] whereas the other focused primarily on infectious diseaserelated diagnoses.[14]
The purpose of this study was to describe the prevalence of return visits specifically to pediatric EDs and to investigate patient‐level, visit‐level, and healthcare systemrelated factors that may be associated with return visits and hospitalization at return.
METHODS
Study Design and Data Source
This retrospective cohort study used data from the Pediatric Health Information System (PHIS), an administrative database with data from 44 tertiary care pediatric hospitals in 27 US states and the District of Columbia. This database contains patient demographics, diagnoses, and procedures as well as medications, diagnostic imaging, laboratory, and supply charges for each patient. Data are deidentified prior to inclusion; encrypted medical record numbers allow for the identification of individual patients across all ED visits and hospitalizations to the same hospital. The Children's Hospital Association (Overland Park, KS) and participating hospitals jointly assure the quality and integrity of the data. This study was approved by the institutional review board at Boston Children's Hospital with a waiver for informed consent granted.
Study Population and Protocol
To standardize comparisons across the hospitals, we included data from 23 of the 44 hospitals in PHIS; 7 were excluded for not including ED‐specific data. For institutions that collect information from multiple hospitals within their healthcare system, we included only records from the main campus or children's hospital when possible, leading to the exclusion of 9 hospitals where the data were not able to be segregated. As an additional level of data validation, we compared the hospital‐level ED volume and admission rates as reported in the PHIS to those reported to a separate database (the Pediatric Analysis and Comparison Tool). We further excluded 5 hospitals whose volume differed by >10% between these 2 data sources.
Patients <18 years of age who were discharged from these EDs following their index visit in 2012 formed the eligible cohort.
Key Outcome Measures
The primary outcomes were return visits within 72 hours of discharge from the ED, and return visits resulting in hospitalization, including observation status. We defined an ED revisit as a return within 72 hours of ED discharge regardless of whether the patient was subsequently discharged from the ED on the return visit or hospitalized. We assessed revisits within 72 hours of an index ED discharge, because return visits within this time frame are likely to be related to the index visit.[2, 13, 16, 21, 22, 24, 25, 26]
Factors Associated With ED Revisits
A priori, we chose to adjust for the following patient‐level factors: age (<30 days, 30 days<1 year, 14 years, 511 years, 1217 years), gender, and socioeconomic status (SES) measured as the zip codebased median household income, obtained from the 2010 US Census, with respect to the federal poverty level (FPL) (<1.5 FPL, 1.52 FPL, 23 FPL, and >3 FPL).[27] We also adjusted for insurance type (commercial, government, or other), proximity of patient's home zip code to hospital (modeled as the natural log of the geographical distance to patient's home address from the hospital), ED diagnosis‐based severity classification system score (1=low severity, 5=high severity),[28] presence of a complex chronic condition at the index or prior visits using a validated classification scheme,[15, 29, 30, 31] and primary care physician (PCP) density per 100,000 in the patient's residential area (modeled as quartiles: very low, <57.2; low, 57.267.9; medium, 68.078.7; high, >78.8). PCP density, defined by the Dartmouth Atlas of Health Care,[32, 33, 34] is the number of primary care physicians per 100,000 residents (PCP count) in federal health service areas (HSA). Patients were assigned to a corresponding HSA based on their home zip code.
Visit‐level factors included arrival time of index visit (8:01 am 4:00 pm, 4:01 pm12:00 am, 12:01 am8 am representing day, evening, and overnight arrival, respectively), day of the week, season, length of stay (LOS) in the ED during the index visit, and ED crowding (calculated as the average daily LOS/yearly average LOS for the individual ED).[35] We categorized the ED primary diagnosis for each visit using the major diagnosis groupings of a previously described pediatric ED‐specific classification scheme.[36] Using International Classification of Diseases, Ninth Revision (ICD‐9) codes, we identified the conditions with the highest ED revisit rates.
Statistical Analyses
Categorical variables describing the study cohort were summarized using frequencies and percentages. Continuous variables were summarized using mean, median, and interquartile range values, where appropriate. We used 2 different hierarchical logistic regression models to assess revisit rates by patient‐ and visit‐level characteristics. The initial model included all patients discharged from the ED following the index visit and assessed for the outcome of a revisit within 72 hours. The second model considered only patients who returned within 72 hours of an index visit and assessed for hospitalization on that return visit. We used generalized linear mixed effects models, with hospital as a random effect to account for the presence of correlated data (within hospitals), nonconstant variability (across hospitals), and binary responses. Adjusted odds ratios with 95% confidence intervals were used as summary measures of the effect of the individual adjusters. Adjusters were missing in fewer than 5% of patients across participating hospitals. Statistical analyses were performed using SAS version 9.3 (SAS Institute Inc., Cary, NC); 2‐sided P values <0.004 were considered statistically significant to account for multiple comparisons (Bonferroni‐adjusted level of significance=0.0038).
RESULTS
Patients
A total of 1,610,201 patients <18 years of age evaluated across the 23 PHIS EDs in 2012 were included in the study. Twenty‐one of the 23 EDs have academic affiliations; 10 are located in the South, 6 in the Midwest, 5 in the West, and 2 in the Northeast region of the United States. The annual ED volume for these EDs ranged from 25,090 to 136,160 (median, 65,075; interquartile range, 45,28085,206). Of the total patients, 1,415,721 (87.9%) were discharged following the index visit and comprised our study cohort. Of these patients, 47,294 (revisit rate: 3.3%) had an ED revisit within 72 hours. There were 4015 patients (0.3%) who returned more than once within 72 hours, and the largest proportion of these returned with infection‐related conditions. Of those returning, 37,999 (80.3%) were discharged again, whereas 9295 (19.7%) were admitted to the hospital (Figure 1). The demographic and clinical characteristics of study participants are displayed in Table 1.
| Index Visit, n=1,415,721, n (%) | Return Visits Within 72 Hours of Discharge, n=47,294, 3.3% | ||
|---|---|---|---|
| Return to Discharge, n (%) | Return to Admission, n (%) | ||
| |||
| Gender, female | 659,417 (46.6) | 17,665 (46.5) | 4,304 (46.3) |
| Payor | |||
| Commercial | 379,403 (26.8) | 8,388 (22.1) | 3,214 (34.6) |
| Government | 925,147 (65.4) | 26,880 (70.7) | 5,786 (62.3) |
| Other | 111,171 (7.9) | 2,731 (7.2) | 295 (3.2) |
| Age | |||
| <30 days | 19,217 (1.4) | 488 (1.3) | 253 (2.7) |
| 30 days to <1 year | 216,967 (15.3) | 8,280 (21.8) | 2,372 (25.5) |
| 1 year to 4 years | 547,083 (38.6) | 15,542 (40.9) | 3,187 (34.3) |
| 5 years to 11 years | 409,463 (28.9) | 8,906 (23.4) | 1,964 (21.1) |
| 12 years to 17 years | 222,991 (15.8) | 4,783 (12.6) | 1,519 (16.3) |
| Socioeconomic statusa | |||
| <1.5 times FPL | 493,770 (34.9) | 13,851 (36.5) | 2,879 (31.0) |
| 1.5 to 2 times FPL | 455,490 (32.2) | 12,364 (32.5) | 2,904 (31.2) |
| 2 to 3 times FPL | 367,557 (26.0) | 9,560 (25.2) | 2,714 (29.2) |
| >3 times FPL | 98,904 (7.0) | 2,224 (5.9) | 798 (8.6) |
| Primary care physician density per 100,000 patients | |||
| Very low | 351,798 (24.9) | 8,727 (23.0) | 2,628 (28.3) |
| Low | 357,099 (25.2) | 9,810 (25.8) | 2,067 (22.2) |
| Medium | 347,995 (24.6) | 10,186 (26.8) | 2,035 (21.9) |
| High | 358,829 (25.4) | 9,276 (24.4) | 2,565 (27.6) |
| CCC present, yes | 125,774 (8.9) | 4,446 (11.7) | 2,825 (30.4) |
| Severity score | |||
| Low severity (0,1,2) | 721,061 (50.9) | 17,310 (45.6) | 2,955 (31.8) |
| High severity (3,4,5) | 694,660 (49.1) | 20,689 (54.5) | 6,340 (68.2) |
| Time of arrival | |||
| Day | 533,328 (37.7) | 13,449 (35.4) | 3,396 (36.5) |
| Evening | 684,873 (48.4) | 18,417 (48.5) | 4,378 (47.1) |
| Overnight | 197,520 (14.0) | 6,133 (16.1) | 1,521 (16.4) |
| Season | |||
| Winter | 384,957 (27.2) | 10,603 (27.9) | 2,844 (30.6) |
| Spring | 367,434 (26.0) | 9,923 (26.1) | 2,311 (24.9) |
| Summer | 303,872 (21.5) | 8,308 (21.9) | 1,875 (20.2) |
| Fall | 359,458 (25.4) | 9,165 (24.1) | 2,265 (24.4) |
| Weekday/weekend | |||
| Monday | 217,774 (15.4) | 5,646 (14.9) | 1,394 (15) |
| Tuesday | 198,220 (14.0) | 5,054 (13.3) | 1,316 (14.2) |
| Wednesday | 194,295 (13.7) | 4,985 (13.1) | 1,333 (14.3) |
| Thursday | 191,950 (13.6) | 5,123 (13.5) | 1,234 (13.3) |
| Friday | 190,022 (13.4) | 5,449 (14.3) | 1,228 (13.2) |
| Saturday | 202,247 (14.3) | 5,766 (15.2) | 1,364 (14.7) |
| Sunday | 221,213 (15.6) | 5,976 (15.7) | 1,426 (15.3) |
| Distance from hospital in miles, median (IQR) | 8.3 (4.614.9) | 9.2 (4.917.4) | 8.3 (4.614.9) |
| ED crowding score at index visit, median (IQR) | 1.0 (0.91.1) | 1.0 (0.91.1) | 1.0 (0.91.1) |
| ED LOS in hours at index visit, median (IQR) | 2.0 (1.03.0) | 3.0 (2.05.0) | 2.0 (1.03.0) |
ED Revisit Rates and Revisits Resulting in Admission
In multivariate analyses, compared to patients who did not return to the ED, patients who returned within 72 hours of discharge had higher odds of revisit if they had the following characteristics: a chronic condition, were <1 year old, a higher severity score, and public insurance. Visit‐level factors associated with higher odds of revisits included arrival for the index visit during the evening or overnight shift or on a Friday or Saturday, index visit during times of lower ED crowding, and living closer to the hospital. On return, patients were more likely to be hospitalized if they had a higher severity score, a chronic condition, private insurance, or were <30 days old. Visit‐level factors associated with higher odds of hospitalization at revisit included an index visit during the evening and overnight shift and living further from the hospital. Although the median SES and PCP density of a patient's area of residence were not associated with greater likelihood of returning, when they returned, patients residing in an area with a lower SES and higher PCP densities (>78.8 PCPs/100,000) had lower odds of being admitted to the hospital. Patients whose index visit was on a Sunday also had lower odds of being hospitalized upon return (Table 2).
| Characteristic | Adjusted OR of 72‐Hour Revisit (95% CI), n=1,380,723 | P Value | Adjusted OR of 72‐Hour Revisit Admissions (95% CI), n=46,364 | P Value |
|---|---|---|---|---|
| ||||
| Gender | ||||
| Male | 0.99 (0.971.01) | 0.2809 | 1.02 (0.971.07) | 0.5179 |
| Female | Reference | Reference | ||
| Payor | ||||
| Government | 1.14 (1.111.17) | <0.0001 | 0.68 (0.640.72) | <0.0001 |
| Other | 0.97 (0.921.01) | 0.1148 | 0.33 (0.280.39) | <0.0001 |
| Private | Reference | Reference | ||
| Age group | ||||
| 30 days to <1 year | 1.32 (1.221.42) | <0.0001 | 0.58 (0.490.69) | <0.0001 |
| 1 year to 5 years | 0.89 (0.830.96) | 0.003 | 0.41 (0.340.48) | <0.0001 |
| 5 years to 11 years | 0.69 (0.640.74) | <0.0001 | 0.40 (0.330.48) | <0.0001 |
| 12 years to 17 years | 0.72 (0.660.77) | <0.0001 | 0.50 (0.420.60) | <0.0001 |
| <30 days | Reference | Reference | ||
| Socioeconomic statusa | ||||
| % <1.5 times FPL | 0.96 (0.921.01) | 0.0992 | 0.82 (0.740.92) | 0.0005 |
| % 1.5 to 2 times FPL | 0.98 (0.941.02) | 0.2992 | 0.83 (0.750.92) | 0.0005 |
| % 2 to 3 times FPL | 1.02 (0.981.07) | 0.292 | 0.88 (0.790.97) | 0.01 |
| % >3 times FPL | Reference | Reference | ||
| Severity score | ||||
| High severity, 4, 5, 6 | 1.43 (1.401.45) | <0.0001 | 3.42 (3.233.62) | <0.0001 |
| Low severity, 1, 2, 3 | Reference | Reference | ||
| Presence of any CCC | ||||
| Yes | 1.90 (1.861.96) | <0.0001 | 2.92 (2.753.10) | <0.0001 |
| No | Reference | Reference | ||
| Time of arrival | ||||
| Evening | 1.05 (1.031.08) | <0.0001 | 1.37 (1.291.44) | <0.0001 |
| Overnight | 1.19 (1.151.22) | <0.0001 | 1.84 (1.711.97) | <0.0001 |
| Day | Reference | Reference | ||
| Season | ||||
| Winter | 1.09 (1.061.11) | <0.0001 | 1.06 (0.991.14) | 0.0722 |
| Spring | 1.07 (1.041.10) | <0.0001 | 0.98 (0.911.046) | 0.4763 |
| Summer | 1.05 (1.021.08) | 0.0011 | 0.93 (0.871.01) | 0.0729 |
| Fall | Reference | Reference | ||
| Weekday/weekend | ||||
| Thursday | 1.02 (0.9821.055) | 0.3297 | 0.983 (0.8971.078) | 0.7185 |
| Friday | 1.08 (1.041.11) | <0.0001 | 1.03 (0.941.13) | 0.5832 |
| Saturday | 1.08 (1.041.12) | <0.0001 | 0.89 (0.810.97) | 0.0112 |
| Sunday | 1.02 (0.991.06) | 0.2054 | 0.81 (0.740.89) | <0.0001 |
| Monday | 1.00 (0.961.03) | 0.8928 | 0.98 (0.901.07) | 0.6647 |
| Tuesday | 0.99 (0.951.03) | 0.5342 | 0.93 (0.851.02) | 0.1417 |
| Wednesday | Reference | Reference | ||
| PCP ratio per 100,000 patients | ||||
| 57.267.9 | 1.00 (0.961.04) | 0.8844 | 0.93 (0.841.03) | 0.1669 |
| 68.078.7 | 1.00 (0.951.04) | 0.8156 | 0.86 (0.770.96) | 0.0066 |
| >78.8 | 1.00 (0.951.04) | 0.6883 | 0.82 (0.730.92) | 0.001 |
| <57.2 | Reference | Reference | ||
| ED crowding score at index visitb | ||||
| 2 | 0.92 (0.900.95) | <0.0001 | 0.96 (0.881.05) | 0.3435 |
| 1 | Reference | Reference | ||
| Distance from hospitalc | ||||
| 3.168, 23.6 miles | 0.95 (0.940.96) | <0.0001 | 1.16 (1.121.19) | <0.0001 |
| 2.168, 8.7 miles | Reference | Reference | ||
| ED LOS at index visitb | ||||
| 3.7 hours | 1.003 (1.0011.005) | 0.0052 | NA | |
| 2.7 hours | Reference | |||
Diagnoses Associated With Return Visits
Patients with index visit diagnoses of sickle cell disease and leukemia had the highest proportion of return visits (10.7% and 7.3%, respectively). Other conditions with high revisit rates included infectious diseases such as cellulitis, bronchiolitis, and gastroenteritis. Patients with other chronic diseases such as diabetes and with devices, such as gastrostomy tubes, also had high rates of return visits. At return, the rate of hospitalization for these conditions ranged from a 1‐in‐6 chance of hospitalization for the diagnoses of a fever to a 1‐in‐2 chance of hospitalization for patients with sickle cell anemia (Table 3).
| Major Diagnostic Subgroup | No. of Index ED Visit Dischargesa | 72‐Hour Revisit, % (95% CI) | Admitted on Return, % (95% CI) |
|---|---|---|---|
| |||
| Sickle cell anemia | 2,531 | 10.7 (9.511.9) | 49.6 (43.755.6) |
| Neoplastic diseases, cancer | 536 | 7.3 (5.19.5) | 36 (2151) |
| Infectious gastrointestinal diseases | 802 | 7.2 (5.49.0) | 21 (1031) |
| Devices and complications of the circulatory systemb | 1,033 | 6.9 (5.38.4) | 45 (3457) |
| Other hematologic diseasesb | 1,538 | 6.1 (4.97.3) | 33 (2443) |
| Fever | 80,626 | 5.9 (5.76.0) | 16.3 (15.217.3) |
| Dehydration | 7,362 | 5.4 (5.25.5) | 34.6 (30.139) |
| Infectious respiratory diseases | 72,652 | 5.4 (5.25.5) | 28.6 (27.230) |
| Seizures | 17,637 | 5.3 (4.95.6) | 33.3 (30.336.4) |
| Other devices and complicationsb | 1,896 | 5.3 (4.36.3) | 39.0 (29.448.6) |
| Infectious skin, dermatologic and soft tissue diseases | 40,272 | 4.7 (4.55) | 20.0 (18.221.8) |
| Devices and complications of the gastrointestinal systemb | 4,692 | 4.6 (4.05.2) | 24.7 (18.930.4) |
| Vomiting | 44,730 | 4.4 (4.24.6) | 23.7 (21.825.6) |
| Infectious urinary tract diseases | 17,020 | 4.4 (4.14.7) | 25.9 (22.729) |
| Headache | 19,016 | 4.3 (4.14.6) | 28.2 (25.131.3) |
| Diabetes mellitus | 1,531 | 4.5 (3.35.3) | 29 (1840) |
| Abdominal pain | 39,594 | 4.2 (44.4) | 24.8 (22.726.8) |
| Other infectious diseasesb | 647 | 4.2 (2.65.7) | 33 (1651) |
| Gastroenteritis | 55,613 | 4.0 (3.84.1) | 20.6 (18.922.3) |
DISCUSSION
In this nationally representative sample of free‐standing children's hospitals, 3.3% of patients discharged from the ED returned to the same ED within 72 hours. This rate is similar to rates previously published in studies of general EDs.[11, 15] Of the returning children, over 80% were discharged again, and 19.7% were hospitalized, which is two‐thirds more than the admission rate at index visit (12%). In accordance with previous studies,[14, 16, 25] we found higher disease severity, presence of a chronic condition, and younger age were strongly associated with both the odds of patients returning to the ED and of being hospitalized at return. Patients who were hospitalized lived further away from the hospital and were of a higher SES. In this study, we show that visit‐level and access‐related factors are also associated with increased risk of return, although to a lesser degree. Patients seen on a weekend (Friday or Saturday) were found to have higher odds of returning, whereas those seen initially on a Sunday had lower odds of hospitalization at return. In this study, we also found that patients seen on the evening or night shifts at the index presentation had a significant association with return visits and hospitalization at return. Additionally, we found that although PCP density was not associated with the odds of returning to the ED, patients from areas with a higher PCP density were less likely to be admitted at return. In addition, by evaluating the diagnoses of patients who returned, we found that many infectious conditions commonly seen in the ED also had high return rates.
As previously shown,[23] we found that patients with complex and chronic diseases were at risk for ED revisits, especially patients with sickle cell anemia and cancer (mainly acute leukemia). In addition, patients with a chronic condition were 3 times more likely to be hospitalized when they returned. These findings may indicate an opportunity for improved discharge planning and coordination of care with subspecialty care providers for particularly at‐risk populations, or stronger consideration of admission at the index visit. However, admission for these patients at revisit may be unavoidable.
Excluding patients with chronic and complex conditions, the majority of conditions with high revisit rates were acute infectious conditions. One national study showed that >70% of ED revisits by patients with infectious conditions had planned ED follow‐up.[13] Although this study was unable to assess the reasons for return or admission at return, children with infectious diseases often worsen over time (eg, those with bronchiolitis). The relatively low admission rates at return for these conditions, despite evidence that providers may have a lower threshold for admission when a patient returns to the ED shortly after discharge,[24] may reflect the potential for improving follow‐up at the PCP office. However, although some revisits may be prevented,[37, 38] we recognize that an ED visit could be appropriate and necessary for some of these children, especially those without primary care.
Access to primary care and insurance status influence ED utilization.[14, 39, 40, 41] A fragmented healthcare system with poor access to primary care is strongly associated with utilization of the ED for nonurgent care. A high ED revisit rate might be indicative of poor coordination between ED and outpatient services.[9, 39, 42, 43, 44, 45, 46] Our study's finding of increased risk of return visit if the index visit occurred on a Friday or Saturday, and a decreased likelihood of subsequent admission when a patient returns on a Sunday, may suggest limited or perceived limited access to the PCP over a weekend. Although insured patients tend to use the ED less often for nonemergent cases, even when patients have PCPs, they might still choose to return to the ED out of convenience.[47, 48] This may be reflected in our finding that, when adjusted for insurance status and PCP density, patients who lived closer to the hospital were more likely to return, but less likely to be admitted, thereby suggesting proximity as a factor in the decision to return. It is also possible that patients residing further away returned to another institution. Although PCP density did not seem to be associated with revisits, patients who lived in areas with higher PCP density were less likely to be admitted when they returned. In this study, there was a stepwise gradient in the effect of PCP density on the odds of being hospitalized on return with those patients in areas with fewer PCPs being admitted at higher rates on return. Guttmann et al.,[40] in a recent study conducted in Canada where there is universal health insurance, showed that children residing in areas with higher PCP densities had higher rates of PCP visits but lower rates of ED visits compared to children residing in areas with lower PCP densities. It is possible that emergency physicians have more confidence that patients will have dedicated follow‐up when a PCP can be identified. These findings suggest that the development of PCP networks with expanded access, such as alignment of office hours with parent need and patient/parent education about PCP availability, may reduce ED revisits. Alternatively, creation of centralized hospital‐based urgent care centers for evening, night, and weekend visits may benefit both the patient and the PCP and avoid ED revisits and associated costs.
Targeting and eliminating disparities in care might also play a role in reducing ED revisits. Prior studies have shown that publicly insured individuals, in particular, frequently use the ED as their usual source of care and are more likely to return to the ED within 72 hours of an initial visit.[23, 39, 44, 49, 50] Likewise, we found that patients with public insurance were more likely to return but less likely to be admitted on revisit. After controlling for disease severity and other demographic variables, patients with public insurance and of lower socioeconomic status still had lower odds of being hospitalized following a revisit. This might also signify an increase of avoidable hospitalizations among patients of higher SES or with private insurance. Further investigation is needed to explore the reasons for these differences and to identify effective interventions to eliminate disparities.
Our findings have implications for emergency care, ambulatory care, and the larger healthcare system. First, ED revisits are costly and contribute to already overburdened EDs.[10, 11] The average ED visit incurs charges that are 2 to 5 times more than an outpatient office visit.[49, 50] Careful coordination of ambulatory and ED services could not only ensure optimal care for patients, but could save the US healthcare system billions of dollars in potentially avoidable healthcare expenditures.[49, 50] Second, prior studies have demonstrated a consistent relationship between poor access to primary care and increased use of the ED for nonurgent conditions.[42] Publicly insured patients have been shown to have disproportionately increased difficulty acquiring and accessing primary care.[41, 42, 47, 51] Furthermore, conditions with high ED revisit rates are similar to conditions reported by Berry et al.4 as having the highest hospital readmission rates such as cancer, sickle cell anemia, seizure, pneumonia, asthma, and gastroenteritis. This might suggest a close relationship between 72‐hour ED revisits and 30‐day hospital readmissions. In light of the recent expansion of health insurance coverage to an additional 30 million individuals, the need for better coordination of services throughout the entire continuum of care, including primary care, ED, and inpatient services, has never been more important.[52] Future improvements could explore condition‐specific revisit or readmission rates to identify the most effective interventions to reduce the possibly preventable returns.
This study has several limitations. First, as an administrative database, PHIS has limited clinical data, and reasons for return visits could not be assessed. Variations between hospitals in diagnostic coding might also lead to misclassification bias. Second, we were unable to assess return visits to a different ED. Thus, we may have underestimated revisit frequency. However, because children are generally more likely to seek repeat care in the same hospital,[3] we believe our estimate of return visit rate approximates the actual return visit rate; our findings are also similar to previously reported rates. Third, for the PCP density factor, we were unable to account for types of insurance each physician accepted and influence on return rates. Fourth, return visits in our sample could have been for conditions unrelated to the diagnosis at index visit, though the short timeframe considered for revisits makes this less likely. In addition, the crowding index does not include the proportion of occupied beds at the precise moment of the index visit. Finally, this cohort includes only children seen in the EDs of pediatric hospitals, and our findings may not be generalizable to all EDs who provide care for ill and injured children.
We have shown that, in addition to previously identified patient level factors, there are visit‐level and access‐related factors associated with pediatric ED return visits. Eighty percent are discharged again, and almost one‐fifth of returning patients are admitted to the hospital. Admitted patients tend to be younger, sicker, chronically ill, and live farther from the hospital. By being aware of patients' comorbidities, PCP access, as well as certain diagnoses associated with high rates of return, physicians may better target interventions to optimize care. This may include having a lower threshold for hospitalization at the initial visit for children at high risk of return, and communication with the PCP at the time of discharge to ensure close follow‐up. Our study helps to provide benchmarks around ED revisit rates, and may serve as a starting point to better understand variation in care. Future efforts should aim to find creative solutions at individual institutions, with the goal of disseminating and replicating successes more broadly. For example, investigators in Boston have shown that the use of a comprehensive home‐based asthma management program has been successful in decreasing emergency department visits and hospitalization rates.[53] It is possible that this approach could be spread to other institutions to decrease revisits for patients with asthma. As a next step, the authors have undertaken an investigation to identify hospital‐level characteristics that may be associated with rates of return visits.
Acknowledgements
The authors thank the following members of the PHIS ED Return Visits Research Group for their contributions to the data analysis plan and interpretation of results of this study: Rustin Morse, MD, Children's Medical Center of Dallas; Catherine Perron, MD, Boston Children's Hospital; John Cheng, MD, Children's Healthcare of Atlanta; Shabnam Jain, MD, MPH, Children's Healthcare of Atlanta; and Amanda Montalbano, MD, MPH, Children's Mercy Hospitals and Clinics. These contributors did not receive compensation for their help with this work.
Disclosures
A.T.A. and A.M.S. conceived the study and developed the initial study design. All authors were involved in the development of the final study design and data analysis plan. C.W.T. collected and analyzed the data. A.T.A. and C.W.T. had full access to all of the data and take responsibility for the integrity of the data and the accuracy of the data analysis. All authors were involved in the interpretation of the data. A.T.A. drafted the article, and all authors made critical revisions to the initial draft and subsequent versions. A.T.A. and A.M.S. take full responsibility for the article as a whole. The authors report no conflicts of interest.
- Joint policy statement—guidelines for care of children in the emergency department. Pediatrics. 2009;124:1233–1243.
- , , , , . Return visits to a pediatric emergency department. Pediatr Emerg Care. 2004;20:166–171.
- , . Hospital readmission as an accountability measure. JAMA. 2011;305:504–505.
- , , , et al. Hospital utilization and characteristics of patients experiencing recurrent readmissions within children's hospitals. JAMA. 2011;305:682–690.
- , , , et al. Pediatric readmission prevalence and variability across hospitals. JAMA. 2013;309:372–380.
- . Farewell, and don't come back. Health reform gives hospitals a big incentive to send patients home for good. US News World Rep. 2010;147:20, 22–23.
- . CMS' stealth health reform. Plan to reduce readmissions and boost the continuum of care. Hosp Health Netw. 2008;82:24.
- , . Return visits to the emergency department. J Emerg Med. 1987;5:359–362.
- , , , . Emergency department visits after hospital discharge: a missing part of the equation. Ann Emerg Med. 2013;62:145–150.
- , , , , . Quality indicators for high acuity pediatric conditions. Pediatrics. 2013;132:752–762.
- , . Revisiting hospital readmissions. JAMA. 2013;309:398–400.
- , , . Thirty‐day readmissions: the clock is ticking. JAMA. 2013;309:345–346.
- . Patients seen in emergency departments who had a prior visit within the previous 72 h‐National Hospital Ambulatory Medical Care Survey, 2002. Public Health. 2005;119:914–918.
- , , , , . A national depiction of children with return visits to the emergency department within 72 hours, 2001–2007. Pediatr Emerg Care. 2012;28:606–610.
- , , , et al. How well can hospital readmission be predicted in a cohort of hospitalized children? A retrospective, multicenter study. Pediatrics. 2009;123:286–293.
- , , . Unscheduled return visits to the pediatric emergency department‐one‐year experience. Pediatr Emerg Care. 2006;22:545–549.
- , . Return visits to the emergency department among febrile children 3 to 36 months of age. Pediatr Emerg Care. 2011;27:1126–1129.
- , , , . Pediatric emergency department recidivism: demographic characteristics and diagnostic predictors. J Emerg Nurs. 2006;32:131–138.
- Healthcare Cost and Utilization Project. Pediatric emergency department visits in community hospitals from selected states, 2005. Statistical brief #52. Available at: http://www.ncbi.nlm.nih.gov/books/NBK56039. Accessed October 3, 2013.
- , , , , , . Factors influencing infant visits to emergency departments. Pediatrics. 2000;106:1031–1039.
- , , , . Early pediatric emergency department return visits: a prospective patient‐centric assessment. Clin Pediatr (Phila). 2012;51:651–658.
- , , , , . Unscheduled return visits with and without admission post emergency department discharge. J Emerg Med. 2012;43:1110–1118.
- , , , . Unscheduled revisits to a pediatric emergency department: risk factors for children with fever or infection‐related complaints. Pediatr Emerg Care. 2005;21:816–821.
- , , , , . Unscheduled return visits to the emergency department: consequences for triage. Acad Emerg Med. 2013;20:33–39.
- , , , et al. Repeat pediatric visits to a general emergency department. Ann Emerg Med. 1996;28:467–473.
- , , , , . Emergency department revisits. Ann Emerg Med. 1989;18:964–968.
- US Department of Health 19:70–78.
- , , . Pediatric deaths attributable to complex chronic conditions: a population‐based study of Washington State, 1980–1997. Pediatrics. 2000;106:205–209.
- , , , , , . Deaths attributed to pediatric complex chronic conditions: national trends and implications for supportive care services. Pediatrics. 2001;107:E99.
- , , . Where do children with complex chronic conditions die? Patterns in Washington State, 1980–1998. Pediatrics. 2002;109:656–660.
- Dartmouth Atlas of Health Care. Hospital and physician capacity, 2006. Available at: http://www.dartmouthatlas.org/data/topic/topic.aspx?cat=24. Accessed October 7, 2013.
- Dartmouth Atlas of Health Care. Research methods. What is an HSA/HRR? Available at: http://www.dartmouthatlas.org/tools/faq/researchmethods.aspx. Accessed October 7, 2013,.
- Dartmouth Atlas of Health Care. Appendix on the geography of health care in the United States. Available at: http://www.dartmouthatlas.org/downloads/methods/geogappdx.pdf. Accessed October 7, 2013.
- , , . Emergency department crowding: prioritising quantified crowding measures using a Delphi study. Emerg Med J. 2012;29:868–871.
- , , , , . A new diagnosis grouping system for child emergency department visits. Acad Emerg Med. 2010;17:204–213.
- , , , et al. Effectiveness of emergency department asthma management strategies on return visits in children: a population‐based study. Pediatrics. 2007;120:e1402–e1410.
- , , , . Emergency department patients with diabetes have better glycemic control when they have identifiable primary care providers. Acad Emerg Med. 2012;19:650–655.
- , , , , , Newman L. Impact of socioeconomic status on hospital use in New York City. Health Aff (Millwood). 1993;12:162–173.
- , , , , . Primary care physician supply and children's health care use, access, and outcomes: findings from Canada. Pediatrics. 2010;125:1119–1126.
- , , , et al. Insurance status and access to urgent ambulatory care follow‐up appointments. JAMA. 2005;294:1248–1254.
- , . Emergency departments, Medicaid costs, and access to primary care—understanding the link. N Engl J Med. 2012;366:2141–2143.
- Committee on the Future of Emergency Care in the United States Health System. Emergency Care for Children: Growing Pains. Washington, DC: The National Academies Press; 2007.
- Committee on the Future of Emergency Care in the United States Health System. Hospital‐Based Emergency Care: At the Breaking Point. Washington, DC: The National Academies Press; 2007.
- , . Geographic variation in access to care—the relationship with quality. N Engl J Med. 2012;367:3–6.
- , , , , . Trends and characteristics of US emergency department visits, 1997–2007. JAMA. 2010;304:664–670.
- , , , , . Ambulatory visits to hospital emergency departments. Patterns and reasons for use. 24 Hours in the ED Study Group. JAMA. 1996;276:460–465.
- , , , , . Emergency department workload increase: dependence on primary care? J Emerg Med. 2010;38:279–285.
- Network for Excellence in Health Innovation. Leading healthcare research organizations to examine emergency department overuse. New England Research Institute, 2008. Available at: http://www.nehi.net/news/310‐leading‐health‐care‐research‐organizations‐to‐examine‐emergency‐department‐overuse/view. Accessed October 4, 2013.
- Robert Wood Johnson Foundation. Quality field notes: reducing inappropriate emergency department use. Available at: http://www.rwjf.org/en/research‐publications/find‐rwjf‐research/2013/09/quality‐field‐notes–reducing‐inappropriate‐emergency‐department.html.
- Access of Medicaid recipients to outpatient care. N Engl J Med. 1994;330:1426–1430.
- Medicaid policy statement. Pediatrics. 2013;131:e1697–e1706.
- , , , et al. Community asthma initiative: evaluation of a quality improvement program for comprehensive asthma care. Pediatrics. 2012;129:465–472.
© 2014 Society of Hospital Medicine

Pediatric Observation Status Stays
In recent decades, hospital lengths of stay have decreased and there has been a shift toward outpatient management for many pediatric conditions. In 2003, one‐third of all children admitted to US hospitals experienced 1‐day inpatient stays, an increase from 19% in 1993.1 Some hospitals have developed dedicated observation units for the care of children, with select diagnoses, who are expected to respond to less than 24 hours of treatment.26 Expansion of observation services has been suggested as an approach to lessen emergency department (ED) crowding7 and alleviate high‐capacity conditions within hospital inpatient units.8
In contrast to care delivered in a dedicated observation unit, observation status is an administrative label applied to patients who do not meet inpatient criteria as defined by third parties such as InterQual. While the decision to admit a patient is ultimately at the discretion of the ordering physician, many hospitals use predetermined criteria to assign observation status to patients admitted to observation and inpatient units.9 Treatment provided under observation status is designated by hospitals and payers as outpatient care, even when delivered in an inpatient bed.10 As outpatient‐designated care, observation cases do not enter publicly available administrative datasets of hospital discharges that have traditionally been used to understand hospital resource utilization, including the National Hospital Discharge Survey and the Kid's Inpatient Database.11, 12
We hypothesize that there has been an increase in observation status care delivered to children in recent years, and that the majority of children under observation were discharged home without converting to inpatient status. To determine trends in pediatric observation status care, we conducted the first longitudinal, multicenter evaluation of observation status code utilization following ED treatment in a sample of US freestanding children's hospitals. In addition, we focused on the most recent year of data among top ranking diagnoses to assess the current state of observation status stay outcomes (including conversion to inpatient status and return visits).
METHODS
Data Source
Data for this multicenter retrospective cohort study were obtained from the Pediatric Health Information System (PHIS). Freestanding children's hospital's participating in PHIS account for approximately 20% of all US tertiary care children's hospitals. The PHIS hospitals provide resource utilization data including patient demographics, International Classification of Diseases, Ninth Revision (ICD‐9) diagnosis and procedure codes, and charges applied to each stay, including room and nursing charges. Data were de‐identified prior to inclusion in the database, however encrypted identification numbers allowed for tracking individual patients across admissions. Data quality and reliability were assured through a joint effort between the Child Health Corporation of America (CHCA; Shawnee Mission, KS) and participating hospitals as described previously.13, 14 In accordance with the Common Rule (45 CFR 46.102(f)) and the policies of The Children's Hospital of Philadelphia Institutional Review Board, this research, using a de‐identified dataset, was considered exempt from review.
Hospital Selection
Each year from 2004 to 2009, there were 18 hospitals participating in PHIS that reported data from both inpatient discharges and outpatient visits (including observation status discharges). To assess data quality for observation status stays, we evaluated observation status discharges for the presence of associated observation billing codes applied to charge records reported to PHIS including: 1) observation per hour, 2) ED observation time, or 3) other codes mentioning observation in the hospital charge master description document. The 16 hospitals with observation charges assigned to at least 90% of observation status discharges in each study year were selected for analysis.
Visit Identification
Within the 16 study hospitals, we identified all visits between January 1, 2004 and December 31, 2009 with ED facility charges. From these ED visits, we included any stays designated by the hospital as observation or inpatient status, excluding transfers and ED discharges.
Variable Definitions
Hospitals submitting records to PHIS assigned a single patient type to the episode of care. The Observation patient type was assigned to patients discharged from observation status. Although the duration of observation is often less than 24 hours, hospitals may allow a patient to remain under observation for longer durations.15, 16 Duration of stay is not defined precisely enough within PHIS to determine hours of inpatient care. Therefore, length of stay (LOS) was not used to determine observation status stays.
The Inpatient patient type was assigned to patients who were discharged from inpatient status, including those patients admitted to inpatient care from the ED and also those who converted to inpatient status from observation. Patients who converted from observation status to inpatient status during the episode of care could be identified through the presence of observation charge codes as described above.
Given the potential for differences in the application of observation status, we also identified 1‐Day Stays where discharge occurred on the day of, or the day following, an inpatient status admission. These 1‐Day Stays represent hospitalizations that may, by their duration, be suitable for care in an observation unit. We considered discharges in the Observation and 1‐Day Stay categories to be Short‐Stays.
DATA ANALYSIS
For each of the 6 years of study, we calculated the following proportions to determine trends over time: 1) the number of Observation Status admissions from the ED as a proportion of the total number of ED visits resulting in Observation or Inpatient admission, and 2) the number of 1‐Day Stays admitted from the ED as a proportion of the total number of ED visits resulting in Observation or Inpatient admissions. Trends were analyzed using linear regression. Trends were also calculated for the total volume of admissions from the ED and the case‐mix index (CMI). CMI was assessed to evaluate for changes in the severity of illness for children admitted from the ED over the study period. Each hospital's CMI was calculated as an average of their Observation and Inpatient Status discharges' charge weights during the study period. Charge weights were calculated at the All Patient Refined Diagnosis Related Groups (APR‐DRG)/severity of illness level (3M Health Information Systems, St Paul, MN) and were normalized national average charges derived by Thomson‐Reuters from their Pediatric Projected National Database. Weights were then assigned to each discharge based on the discharge's APR‐DRG and severity level assignment.
To assess the current outcomes for observation, we analyzed stays with associated observation billing codes from the most recent year of available data (2009). Stays with Observation patient type were considered to have been discharged from observation, while those with an Inpatient Status patient type were considered to have converted to an inpatient admission during the observation period.
Using the 2009 data, we calculated descriptive statistics for patient characteristics (eg, age, gender, payer) comparing Observation Stays, 1‐Day Stays, and longer‐duration Inpatient admissions using chi‐square statistics. Age was categorized using the American Academy of Pediatrics groupings: <30 days, 30 days1 year, 12 years, 34 years, 512 years, 1317 years, >18 years. Designated payer was categorized into government, private, and other, including self‐pay and uninsured groups.
We used the Severity Classification Systems (SCS) developed for pediatric emergency care to estimate severity of illness for the visit.17 In this 5‐level system, each ICD‐9 diagnosis code is associated with a score related to the intensity of ED resources needed to care for a child with that diagnosis. In our analyses, each case was assigned the maximal SCS category based on the highest severity ICD‐9 code associated with the stay. Within the SCS, a score of 1 indicates minor illness (eg, diaper dermatitis) and 5 indicates major illness (eg, septic shock). The proportions of visits within categorical SCS scores were compared for Observation Stays, 1‐Day Stays, and longer‐duration Inpatient admissions using chi‐square statistics.
We determined the top 10 ranking diagnoses for which children were admitted from the ED in 2009 using the Diagnosis Grouping System (DGS).18 The DGS was designed specifically to categorize pediatric ED visits into clinically meaningful groups. The ICD‐9 code for the principal discharge diagnosis was used to assign records to 1 of the 77 DGS subgroups. Within each of the top ranking DGS subgroups, we determined the proportion of Observation Stays, 1‐Day Stays, and longer‐duration Inpatient admissions.
To provide clinically relevant outcomes of Observation Stays for common conditions, we selected stays with observation charges from within the top 10 ranking observation stay DGS subgroups in 2009. Outcomes for observation included: 1) immediate outcome of the observation stay (ie, discharge or conversion to inpatient status), 2) return visits to the ED in the 3 days following observation, and 3) readmissions to the hospital in the 3 and 30 days following observation. Bivariate comparisons of return visits and readmissions for Observation versus 1‐Day Stays within DGS subgroups were analyzed using chi‐square tests. Multivariate analyses of return visits and readmissions were conducted using Generalized Estimating Equations adjusting for severity of illness by SCS score and clustering by hospital. To account for local practice patterns, we also adjusted for a grouped treatment variable that included the site level proportion of children admitted to Observation Status, 1‐Day‐Stays, and longer Inpatient admissions. All statistical analyses were performed using SAS (version 9.2, SAS Institute, Inc, Cary, NC); P values <0.05 were considered statistically significant.
RESULTS
Trends in Short‐Stays
An increase in proportion of Observation Stays was mirrored by a decrease in proportion of 1‐Day Stays over the study period (Figure 1). In 2009, there were 1.4 times more Observation Stays than 1‐Day Stays (25,653 vs 18,425) compared with 14,242 and 20,747, respectively, in 2004. This shift toward more Observation Stays occurred as hospitals faced a 16% increase in the total number of admissions from the ED (91,318 to 108,217) and change in CMI from 1.48 to 1.51. Over the study period, roughly 40% of all admissions from the ED were Short‐Stays (Observation and 1‐Day Stays). Median LOS for Observation Status stays was 1 day (interquartile range [IQR]: 11).

Patient Characteristics in 2009
Table 1 presents comparisons between Observation, 1‐Day Stays, and longer‐duration Inpatient admissions. Of potential clinical significance, children under Observation Status were slightly younger (median, 4.0 years; IQR: 1.310.0) when compared with children admitted for 1‐Day Stays (median, 5.0 years; IQR: 1.411.4; P < 0.001) and longer‐duration Inpatient stays (median, 4.7 years; IQR: 0.912.2; P < 0.001). Nearly two‐thirds of Observation Status stays had SCS scores of 3 or lower compared with less than half of 1‐Day Stays and longer‐duration Inpatient admissions.
| Short‐Stays | LOS >1 Day | |||||
|---|---|---|---|---|---|---|
| Observation | 1‐Day Stay | Longer Admission | ||||
| N = 25,653* (24%) | N = 18,425* (17%) | P Value Comparing Observation to 1‐Day Stay | N = 64,139* (59%) | P Value Comparing Short‐Stays to LOS >1 Day | ||
| ||||||
| Sex | Male | 14,586 (57) | 10,474 (57) | P = 0.663 | 34,696 (54) | P < 0.001 |
| Female | 11,000 (43) | 7,940 (43) | 29,403 (46) | |||
| Payer | Government | 13,247 (58) | 8,944 (55) | P < 0.001 | 35,475 (61) | P < 0.001 |
| Private | 7,123 (31) | 5,105 (32) | 16,507 (28) | |||
| Other | 2,443 (11) | 2,087 (13) | 6,157 (11) | |||
| Age | <30 days | 793 (3) | 687 (4) | P < 0.001 | 3,932 (6) | P < 0.001 |
| 30 days1 yr | 4,499 (17) | 2,930 (16) | 13,139 (21) | |||
| 12 yr | 5,793 (23) | 3,566 (19) | 10,229 (16) | |||
| 34 yr | 3,040 (12) | 2,056 (11) | 5,551 (9) | |||
| 512 yr | 7,427 (29) | 5,570 (30) | 17,057 (27) | |||
| 1317 yr | 3,560 (14) | 3,136 (17) | 11,860 (18) | |||
| >17 yr | 541 (2) | 480 (3) | 2,371 (4) | |||
| Race | White | 17,249 (70) | 12,123 (70) | P < 0.001 | 40,779 (67) | P <0.001 |
| Black | 6,298 (25) | 4,216 (25) | 16,855 (28) | |||
| Asian | 277 (1) | 295 (2) | 995 (2) | |||
| Other | 885 (4) | 589 (3) | 2,011 (3) | |||
| SCS | 1 Minor illness | 64 (<1) | 37 (<1) | P < 0.001 | 84 (<1) | P < 0.001 |
| 2 | 1,190 (5) | 658 (4) | 1,461 (2) | |||
| 3 | 14,553 (57) | 7,617 (42) | 20,760 (33) | |||
| 4 | 8,994 (36) | 9,317 (51) | 35,632 (56) | |||
| 5 Major illness | 490 (2) | 579 (3) | 5,689 (9) | |||
In 2009, the top 10 DGS subgroups accounted for half of all admissions from the ED. The majority of admissions for extremity fractures, head trauma, dehydration, and asthma were Short‐Stays, as were roughly 50% of admissions for seizures, appendicitis, and gastroenteritis (Table 2). Respiratory infections and asthma were the top 1 and 2 ranking DGS subgroups for Observation Stays, 1‐Day Stays, and longer‐duration Inpatient admissions. While rank order differed, 9 of the 10 top ranking Observation Stay DGS subgroups were also top ranking DGS subgroups for 1‐Day Stays. Gastroenteritis ranked 10th among Observation Stays and 11th among 1‐Day Stays. Diabetes mellitus ranked 26th among Observation Stays compared with 8th among 1‐Day Stays.
| Short‐Stays | LOS >1 Day | ||
|---|---|---|---|
| % Observation | % 1‐Day Stay | % Longer Admission | |
| |||
| All admissions from the ED | 23.7 | 17.0 | 59.3 |
| n = 108,217 | |||
| Respiratory infections | 22.3 | 15.3 | 62.4 |
| n = 14,455 (13%) | |||
| Asthma | 32.0 | 23.8 | 44.2 |
| n = 8,853 (8%) | |||
| Other GI diseases | 24.1 | 16.2 | 59.7 |
| n = 6,519 (6%) | |||
| Appendicitis | 21.0 | 29.5 | 49.5 |
| n = 4,480 (4%) | |||
| Skin infections | 20.7 | 14.3 | 65.0 |
| n = 4,743 (4%) | |||
| Seizures | 29.5 | 22 | 48.5 |
| n = 4,088 (4%) | |||
| Extremity fractures | 49.4 | 20.5 | 30.1 |
| n = 3,681 (3%) | |||
| Dehydration | 37.8 | 19.0 | 43.2 |
| n = 2,773 (3%) | |||
| Gastroenteritis | 30.3 | 18.7 | 50.9 |
| n = 2,603 (2%) | |||
| Head trauma | 44.1 | 43.9 | 32.0 |
| n = 2,153 (2%) | |||
Average maximum SCS scores were clinically comparable for Observation and 1‐Day Stays and generally lower than for longer‐duration Inpatient admissions within the top 10 most common DGS subgroups. Average maximum SCS scores were statistically lower for Observation Stays compared with 1‐Day Stays for respiratory infections (3.2 vs 3.4), asthma (3.4 vs 3.6), diabetes (3.5 vs 3.8), gastroenteritis (3.0 vs 3.1), other gastrointestinal diseases (3.2 vs 3.4), head trauma (3.3 vs 3.5), and extremity fractures (3.2 vs 3.4) (P < 0.01). There were no differences in SCS scores for skin infections (SCS = 3.0) and appendicitis (SCS = 4.0) when comparing Observation and 1‐Day Stays.
Outcomes for Observation Stays in 2009
Within 6 of the top 10 DGS subgroups for Observation Stays, >75% of patients were discharged home from Observation Status (Table 3). Mean LOS for stays that converted from Observation to Inpatient Status ranged from 2.85 days for extremity fractures to 4.66 days for appendicitis.
| Return to ED in 3 Days n = 421 (1.6%) | Hospital Readmissions in 3 Days n = 247 (1.0%) | Hospital Readmissions in 30 Days n = 819 (3.2%) | ||
|---|---|---|---|---|
| DGS subgroup | % Discharged From Observation | Adjusted* Odds Ratio (95% CI) | Adjusted* Odds Ratio (95% CI) | Adjusted* Odds Ratio (95% CI) |
| ||||
| Respiratory infections | 72 | 1.1 (0.71.8) | 0.8 (0.51.3) | 0.9 (0.71.3) |
| Asthma | 80 | 1.3 (0.63.0) | 1.0 (0.61.8) | 0.5 (0.31.0) |
| Other GI diseases | 74 | 0.8 (0.51.3) | 2.2 (1.33.8) | 1.0 (0.71.5) |
| Appendicitis | 82 | NE | NE | NE |
| Skin infections | 68 | 1.8 (0.84.4) | 1.4 (0.45.3) | 0.9 (0.61.6) |
| Seizures | 79 | 0.8 (0.41.6) | 0.8 (0.31.8) | 0.7 (0.51.0) |
| Extremity fractures | 92 | 0.9 (0.42.1) | 0.2 (01.3) | 1.2 (0.53.2) |
| Dehydration | 81 | 0.9 (0.61.4) | 0.8 (0.31.9) | 0.7 (0.41.1) |
| Gastroenteritis | 74 | 0.9 (0.42.0) | 0.6 (0.41.2) | 0.6 (0.41) |
| Head trauma | 92 | 0.6 (0.21.7) | 0.3 (02.1) | 1.0 (0.42.8) |
Among children with Observation Stays for 1 of the top 10 DGS subgroups, adjusted return ED visit rates were <3% and readmission rates were <1.6% within 3 days following the index stay. Thirty‐day readmission rates were highest following observation for other GI illnesses and seizures. In unadjusted analysis, Observation Stays for asthma, respiratory infections, and skin infections were associated with greater proportions of return ED visits when compared with 1‐Day Stays. Differences were no longer statistically significant after adjusting for SCS score, clustering by hospital, and the grouped treatment variable. Adjusted odds of readmission were significantly higher at 3 days following observation for other GI illnesses and lower at 30 days following observation for seizures when compared with 1‐Day Stays (Table 3).
DISCUSSION
In this first, multicenter longitudinal study of pediatric observation following an ED visit, we found that Observation Status code utilization has increased steadily over the past 6 years and, in 2007, the proportion of children admitted to observation status surpassed the proportion of children experiencing a 1‐day inpatient admission. Taken together, Short‐Stays made up more than 40% of the hospital‐based care delivered to children admitted from an ED. Stable trends in CMI over time suggest that observation status may be replacing inpatient status designated care for pediatric Short‐Stays in these hospitals. Our findings suggest the lines between outpatient observation and short‐stay inpatient care are becoming increasingly blurred. These trends have occurred in the setting of changing policies for hospital reimbursement, requirements for patients to meet criteria to qualify for inpatient admissions, and efforts to avoid stays deemed unnecessary or inappropriate by their brief duration.19 Therefore there is a growing need to understand the impact of children under observation on the structure, delivery, and financing of acute hospital care for children.
Our results also have implications for pediatric health services research that relies on hospital administrative databases that do not contain observation stays. Currently, observation stays are systematically excluded from many inpatient administrative datasets.11, 12 Analyses of datasets that do not account for observation stays likely result in underestimation of hospitalization rates and hospital resource utilization for children. This may be particularly important for high‐volume conditions, such as asthma and acute infections, for which children commonly require brief periods of hospital‐based care beyond an ED encounter. Data from pediatric observation status admissions should be consistently included in hospital administrative datasets to allow for more comprehensive analyses of hospital resource utilization among children.
Prior research has shown that the diagnoses commonly treated in pediatric observation units overlap with the diagnoses for which children experience 1‐Day Stays.1, 20 We found a similar pattern of conditions for which children were under Observation Status and 1‐Day Stays with comparable severity of illness between the groups in terms of SCS scores. Our findings imply a need to determine how and why hospitals differentiate Observation Status from 1‐Day‐Stay groups in order to improve the assignment of observation status. Assuming continued pressures from payers to provide more care in outpatient or observation settings, there is potential for expansion of dedicated observation services for children in the US. Without designated observation units or processes to group patients with lower severity conditions, there may be limited opportunities to realize more efficient hospital care simply through the application of the label of observation status.
For more than 30 years, observation services have been provided to children who require a period of monitoring to determine their response to therapy and the need for acute inpatient admission from the ED.21While we were not able to determine the location of care for observation status patients in this study, we know that few children's hospitals have dedicated observation units and, even when an observation unit is present, not all observation status patients are cared for in dedicated observation units.9 This, in essence, means that most children under observation status are cared for in virtual observation by inpatient teams using inpatient beds. If observation patients are treated in inpatient beds and consume the same resources as inpatients, then cost‐savings based on reimbursement contracts with payers may not reflect an actual reduction in services. Pediatric institutions will need to closely monitor the financial implications of observation status given the historical differences in payment for observation and inpatient care.
With more than 70% of children being discharged home following observation, our results are comparable to the published literature2, 5, 6, 22, 23 and guidelines for observation unit operations.24 Similar to prior studies,4, 15, 2530 our results also indicate that return visits and readmissions following observation are uncommon events. Our findings can serve as initial benchmarks for condition‐specific outcomes for pediatric observation care. Studies are needed both to identify the clinical characteristics predictive of successful discharge home from observation and to explore the hospital‐to‐hospital variability in outcomes for observation. Such studies are necessary to identify the most successful healthcare delivery models for pediatric observation stays.
LIMITATIONS
The primary limitation to our results is that data from a subset of freestanding children's hospitals may not reflect observation stays at other children's hospitals or the community hospitals that care for children across the US. Only 18 of 42 current PHIS member hospitals have provided both outpatient visit and inpatient stay data for each year of the study period and were considered eligible. In an effort to ensure the quality of observation stay data, we included the 16 hospitals that assigned observation charges to at least 90% of their observation status stays in the PHIS database. The exclusion of the 2 hospitals where <90% of observation status patients were assigned observation charges likely resulted in an underestimation of the utilization of observation status.
Second, there is potential for misclassification of patient type given institutional variations in the assignment of patient status. The PHIS database does not contain information about the factors that were considered in the assignment of observation status. At the time of admission from the ED, observation or inpatient status is assigned. While this decision is clearly reserved for the admitting physician, the process is not standardized across hospitals.9 Some institutions have Utilization Managers on site to help guide decision‐making, while others allow the assignment to be made by physicians without specific guidance. As a result, some patients may be assigned to observation status at admission and reassigned to inpatient status following Utilization Review, which may bias our results toward overestimation of the number of observation stays that converted to inpatient status.
The third limitation to our results relates to return visits. An accurate assessment of return visits is subject to the patient returning to the same hospital. If children do not return to the same hospital, our results would underestimate return visits and readmissions. In addition, we did not assess the reason for return visit as there was no way to verify if the return visit was truly related to the index visit without detailed chart review. Assuming children return to the same hospital for different reasons, our results would overestimate return visits associated with observation stays. We suspect that many 3‐day return visits result from the progression of acute illness or failure to respond to initial treatment, and 30‐day readmissions reflect recurrent hospital care needs related to chronic illnesses.
Lastly, severity classification is difficult when analyzing administrative datasets without physiologic patient data, and the SCS may not provide enough detail to reveal clinically important differences between patient groups.
CONCLUSIONS
Short‐stay hospitalizations following ED visits are common among children, and the majority of pediatric short‐stays are under observation status. Analyses of inpatient administrative databases that exclude observation stays likely result in an underestimation of hospital resource utilization for children. Efforts are needed to ensure that patients under observation status are accounted for in hospital administrative datasets used for pediatric health services research, and healthcare resource allocation, as it relates to hospital‐based care. While the clinical outcomes for observation patients appear favorable in terms of conversion to inpatient admissions and return visits, the financial implications of observation status care within children's hospitals are currently unknown.
- ,,,,,.Trends in high‐turnover stays among children hospitalized in the United States, 1993–2003.Pediatrics.2009;123(3):996–1002.
- ,,,,.Utilization and unexpected hospitalization rates of a pediatric emergency department 23‐hour observation unit.Pediatr Emerg Care.2008;24(9):589–594.
- ,,.When the patient requires observation not hospitalization.J Nurs Admin.1988;18(10):20–23.
- ,,,.Pediatric observation status beds on an inpatient unit: an integrated care model.Pediatr Emerg Care.2004;20(1):17–21.
- ,,.Use of an observation unit by a pediatric emergency department for common pediatric illnesses.Pediatr Emerg Care.2001;17(5):321–323.
- ,,.The pediatric hybrid observation unit: an analysis of 6477 consecutive patient encounters.Pediatrics.2005;115(5):e535–e542.
- ACEP. Emergency Department Crowding: High‐Impact Solutions. Task Force Report on Boarding.2008. Available at: http://www.acep.org/WorkArea/downloadasset.aspx?id=37960. Accessed July 21, 2010.
- ,,, et al.Children's hospitals do not acutely respond to high occupancy.Pediatrics.2010;125(5):974–981.
- ,,, et al.Differences in observation care practices in US freestanding children's hospitals: are they virtual or real?J Hosp Med.2011. Available at: http://www.cms.gov/transmittals/downloads/R770HO.pdf. Accessed January 10, 2011.
- CMS.Medicare Hospital Manual, Section 455.Department of Health and Human Services, Centers for Medicare and Medicaid Services;2001. Available at: http://www.hcup‐us.ahrq.gov/reports/methods/FinalReportonObservationStatus_v2Final.pdf. Accessed on May 3, 2007.
- HCUP.Methods Series Report #2002–3. Observation Status Related to U.S. Hospital Records. Healthcare Cost and Utilization Project.Rockville, MD:Agency for Healthcare Research and Quality;2002.
- ,.Design and operation of the National Hospital Discharge Survey: 1988 redesign.Vital Health Stat.2000;1(39):1–43.
- ,,,.Corticosteroids and mortality in children with bacterial meningitis.JAMA.2008;299(17):2048–2055.
- ,,,,.Intravenous immunoglobulin in children with streptococcal toxic shock syndrome.Clin Infect Dis.2009;49(9):1369–1376.
- ,,,.Impact of a short stay unit on asthma patients admitted to a tertiary pediatric hospital.Qual Manag Health Care.1997;6(1):14–22.
- ,,.An observation unit in a pediatric emergency department: one children's hospital's experience.J Emerg Nurs.2002;28(5):407–413.
- ,,,.Developing a diagnosis‐based severity classification system for use in emergency medical systems for children. Pediatric Academic Societies' Annual Meeting, Platform Presentation; Toronto, Canada;2007.
- ,,,,.A new diagnosis grouping system for child emergency department visits.Acad Emerg Med.2010;17(2):204–213.
- .Observation medicine: the healthcare system's tincture of time. In: Graff LG, ed.Principles of Observation Medicine.American College of Emergency Physicians;2010. Available at: http://www. acep.org/content.aspx?id=46142. Accessed February 18, 2011.
- ,,,,.High turnover stays for pediatric asthma in the United States: analysis of the 2006 Kids' Inpatient Database.Med Care.2010;48(9):827–833.
- ,,,,.Pediatric observation units in the United States: a systematic review.J Hosp Med.2010;5(3):172–182.
- ,.Observation unit in childrens hospital—adjunct to delivery and teaching of ambulatory pediatric care.N Y State J Med.1980;80(11):1684–1686.
- ,,.Short stay in an outpatient department. An alternative to hospitalization.Am J Dis Child.1972;123(2):128–132.
- ACEP.Practice Management Committee, American College of Emergency Physicians. Management of Observation Units.Irving, TX:American College of Emergency Physicians;1994.
- ,,,,.Return visits to a pediatric emergency department.Pediatr Emerg Care.2004;20(3):166–171.
- ,.Postreduction management of intussusception in a children's hospital emergency department.Pediatrics.2003;112(6 pt 1):1302–1307.
- ,,,,.Pediatric closed head injuries treated in an observation unit.Pediatr Emerg Care.2005;21(10):639–644.
- ,,,.Use of pediatric observation unit for treatment of children with dehydration caused by gastroenteritis.Pediatr Emerg Care.2006;22(1):1–6.
- ,,,.Children with asthma admitted to a pediatric observation unit.Pediatr Emerg Care.2005;21(10):645–649.
- ,,, et al.How well can hospital readmission be predicted in a cohort of hospitalized children? A retrospective, multicenter study.Pediatrics.2009;123(1):286–293.
In recent decades, hospital lengths of stay have decreased and there has been a shift toward outpatient management for many pediatric conditions. In 2003, one‐third of all children admitted to US hospitals experienced 1‐day inpatient stays, an increase from 19% in 1993.1 Some hospitals have developed dedicated observation units for the care of children, with select diagnoses, who are expected to respond to less than 24 hours of treatment.26 Expansion of observation services has been suggested as an approach to lessen emergency department (ED) crowding7 and alleviate high‐capacity conditions within hospital inpatient units.8
In contrast to care delivered in a dedicated observation unit, observation status is an administrative label applied to patients who do not meet inpatient criteria as defined by third parties such as InterQual. While the decision to admit a patient is ultimately at the discretion of the ordering physician, many hospitals use predetermined criteria to assign observation status to patients admitted to observation and inpatient units.9 Treatment provided under observation status is designated by hospitals and payers as outpatient care, even when delivered in an inpatient bed.10 As outpatient‐designated care, observation cases do not enter publicly available administrative datasets of hospital discharges that have traditionally been used to understand hospital resource utilization, including the National Hospital Discharge Survey and the Kid's Inpatient Database.11, 12
We hypothesize that there has been an increase in observation status care delivered to children in recent years, and that the majority of children under observation were discharged home without converting to inpatient status. To determine trends in pediatric observation status care, we conducted the first longitudinal, multicenter evaluation of observation status code utilization following ED treatment in a sample of US freestanding children's hospitals. In addition, we focused on the most recent year of data among top ranking diagnoses to assess the current state of observation status stay outcomes (including conversion to inpatient status and return visits).
METHODS
Data Source
Data for this multicenter retrospective cohort study were obtained from the Pediatric Health Information System (PHIS). Freestanding children's hospital's participating in PHIS account for approximately 20% of all US tertiary care children's hospitals. The PHIS hospitals provide resource utilization data including patient demographics, International Classification of Diseases, Ninth Revision (ICD‐9) diagnosis and procedure codes, and charges applied to each stay, including room and nursing charges. Data were de‐identified prior to inclusion in the database, however encrypted identification numbers allowed for tracking individual patients across admissions. Data quality and reliability were assured through a joint effort between the Child Health Corporation of America (CHCA; Shawnee Mission, KS) and participating hospitals as described previously.13, 14 In accordance with the Common Rule (45 CFR 46.102(f)) and the policies of The Children's Hospital of Philadelphia Institutional Review Board, this research, using a de‐identified dataset, was considered exempt from review.
Hospital Selection
Each year from 2004 to 2009, there were 18 hospitals participating in PHIS that reported data from both inpatient discharges and outpatient visits (including observation status discharges). To assess data quality for observation status stays, we evaluated observation status discharges for the presence of associated observation billing codes applied to charge records reported to PHIS including: 1) observation per hour, 2) ED observation time, or 3) other codes mentioning observation in the hospital charge master description document. The 16 hospitals with observation charges assigned to at least 90% of observation status discharges in each study year were selected for analysis.
Visit Identification
Within the 16 study hospitals, we identified all visits between January 1, 2004 and December 31, 2009 with ED facility charges. From these ED visits, we included any stays designated by the hospital as observation or inpatient status, excluding transfers and ED discharges.
Variable Definitions
Hospitals submitting records to PHIS assigned a single patient type to the episode of care. The Observation patient type was assigned to patients discharged from observation status. Although the duration of observation is often less than 24 hours, hospitals may allow a patient to remain under observation for longer durations.15, 16 Duration of stay is not defined precisely enough within PHIS to determine hours of inpatient care. Therefore, length of stay (LOS) was not used to determine observation status stays.
The Inpatient patient type was assigned to patients who were discharged from inpatient status, including those patients admitted to inpatient care from the ED and also those who converted to inpatient status from observation. Patients who converted from observation status to inpatient status during the episode of care could be identified through the presence of observation charge codes as described above.
Given the potential for differences in the application of observation status, we also identified 1‐Day Stays where discharge occurred on the day of, or the day following, an inpatient status admission. These 1‐Day Stays represent hospitalizations that may, by their duration, be suitable for care in an observation unit. We considered discharges in the Observation and 1‐Day Stay categories to be Short‐Stays.
DATA ANALYSIS
For each of the 6 years of study, we calculated the following proportions to determine trends over time: 1) the number of Observation Status admissions from the ED as a proportion of the total number of ED visits resulting in Observation or Inpatient admission, and 2) the number of 1‐Day Stays admitted from the ED as a proportion of the total number of ED visits resulting in Observation or Inpatient admissions. Trends were analyzed using linear regression. Trends were also calculated for the total volume of admissions from the ED and the case‐mix index (CMI). CMI was assessed to evaluate for changes in the severity of illness for children admitted from the ED over the study period. Each hospital's CMI was calculated as an average of their Observation and Inpatient Status discharges' charge weights during the study period. Charge weights were calculated at the All Patient Refined Diagnosis Related Groups (APR‐DRG)/severity of illness level (3M Health Information Systems, St Paul, MN) and were normalized national average charges derived by Thomson‐Reuters from their Pediatric Projected National Database. Weights were then assigned to each discharge based on the discharge's APR‐DRG and severity level assignment.
To assess the current outcomes for observation, we analyzed stays with associated observation billing codes from the most recent year of available data (2009). Stays with Observation patient type were considered to have been discharged from observation, while those with an Inpatient Status patient type were considered to have converted to an inpatient admission during the observation period.
Using the 2009 data, we calculated descriptive statistics for patient characteristics (eg, age, gender, payer) comparing Observation Stays, 1‐Day Stays, and longer‐duration Inpatient admissions using chi‐square statistics. Age was categorized using the American Academy of Pediatrics groupings: <30 days, 30 days1 year, 12 years, 34 years, 512 years, 1317 years, >18 years. Designated payer was categorized into government, private, and other, including self‐pay and uninsured groups.
We used the Severity Classification Systems (SCS) developed for pediatric emergency care to estimate severity of illness for the visit.17 In this 5‐level system, each ICD‐9 diagnosis code is associated with a score related to the intensity of ED resources needed to care for a child with that diagnosis. In our analyses, each case was assigned the maximal SCS category based on the highest severity ICD‐9 code associated with the stay. Within the SCS, a score of 1 indicates minor illness (eg, diaper dermatitis) and 5 indicates major illness (eg, septic shock). The proportions of visits within categorical SCS scores were compared for Observation Stays, 1‐Day Stays, and longer‐duration Inpatient admissions using chi‐square statistics.
We determined the top 10 ranking diagnoses for which children were admitted from the ED in 2009 using the Diagnosis Grouping System (DGS).18 The DGS was designed specifically to categorize pediatric ED visits into clinically meaningful groups. The ICD‐9 code for the principal discharge diagnosis was used to assign records to 1 of the 77 DGS subgroups. Within each of the top ranking DGS subgroups, we determined the proportion of Observation Stays, 1‐Day Stays, and longer‐duration Inpatient admissions.
To provide clinically relevant outcomes of Observation Stays for common conditions, we selected stays with observation charges from within the top 10 ranking observation stay DGS subgroups in 2009. Outcomes for observation included: 1) immediate outcome of the observation stay (ie, discharge or conversion to inpatient status), 2) return visits to the ED in the 3 days following observation, and 3) readmissions to the hospital in the 3 and 30 days following observation. Bivariate comparisons of return visits and readmissions for Observation versus 1‐Day Stays within DGS subgroups were analyzed using chi‐square tests. Multivariate analyses of return visits and readmissions were conducted using Generalized Estimating Equations adjusting for severity of illness by SCS score and clustering by hospital. To account for local practice patterns, we also adjusted for a grouped treatment variable that included the site level proportion of children admitted to Observation Status, 1‐Day‐Stays, and longer Inpatient admissions. All statistical analyses were performed using SAS (version 9.2, SAS Institute, Inc, Cary, NC); P values <0.05 were considered statistically significant.
RESULTS
Trends in Short‐Stays
An increase in proportion of Observation Stays was mirrored by a decrease in proportion of 1‐Day Stays over the study period (Figure 1). In 2009, there were 1.4 times more Observation Stays than 1‐Day Stays (25,653 vs 18,425) compared with 14,242 and 20,747, respectively, in 2004. This shift toward more Observation Stays occurred as hospitals faced a 16% increase in the total number of admissions from the ED (91,318 to 108,217) and change in CMI from 1.48 to 1.51. Over the study period, roughly 40% of all admissions from the ED were Short‐Stays (Observation and 1‐Day Stays). Median LOS for Observation Status stays was 1 day (interquartile range [IQR]: 11).
Patient Characteristics in 2009
Table 1 presents comparisons between Observation, 1‐Day Stays, and longer‐duration Inpatient admissions. Of potential clinical significance, children under Observation Status were slightly younger (median, 4.0 years; IQR: 1.310.0) when compared with children admitted for 1‐Day Stays (median, 5.0 years; IQR: 1.411.4; P < 0.001) and longer‐duration Inpatient stays (median, 4.7 years; IQR: 0.912.2; P < 0.001). Nearly two‐thirds of Observation Status stays had SCS scores of 3 or lower compared with less than half of 1‐Day Stays and longer‐duration Inpatient admissions.
| Short‐Stays | LOS >1 Day | |||||
|---|---|---|---|---|---|---|
| Observation | 1‐Day Stay | Longer Admission | ||||
| N = 25,653* (24%) | N = 18,425* (17%) | P Value Comparing Observation to 1‐Day Stay | N = 64,139* (59%) | P Value Comparing Short‐Stays to LOS >1 Day | ||
| ||||||
| Sex | Male | 14,586 (57) | 10,474 (57) | P = 0.663 | 34,696 (54) | P < 0.001 |
| Female | 11,000 (43) | 7,940 (43) | 29,403 (46) | |||
| Payer | Government | 13,247 (58) | 8,944 (55) | P < 0.001 | 35,475 (61) | P < 0.001 |
| Private | 7,123 (31) | 5,105 (32) | 16,507 (28) | |||
| Other | 2,443 (11) | 2,087 (13) | 6,157 (11) | |||
| Age | <30 days | 793 (3) | 687 (4) | P < 0.001 | 3,932 (6) | P < 0.001 |
| 30 days1 yr | 4,499 (17) | 2,930 (16) | 13,139 (21) | |||
| 12 yr | 5,793 (23) | 3,566 (19) | 10,229 (16) | |||
| 34 yr | 3,040 (12) | 2,056 (11) | 5,551 (9) | |||
| 512 yr | 7,427 (29) | 5,570 (30) | 17,057 (27) | |||
| 1317 yr | 3,560 (14) | 3,136 (17) | 11,860 (18) | |||
| >17 yr | 541 (2) | 480 (3) | 2,371 (4) | |||
| Race | White | 17,249 (70) | 12,123 (70) | P < 0.001 | 40,779 (67) | P <0.001 |
| Black | 6,298 (25) | 4,216 (25) | 16,855 (28) | |||
| Asian | 277 (1) | 295 (2) | 995 (2) | |||
| Other | 885 (4) | 589 (3) | 2,011 (3) | |||
| SCS | 1 Minor illness | 64 (<1) | 37 (<1) | P < 0.001 | 84 (<1) | P < 0.001 |
| 2 | 1,190 (5) | 658 (4) | 1,461 (2) | |||
| 3 | 14,553 (57) | 7,617 (42) | 20,760 (33) | |||
| 4 | 8,994 (36) | 9,317 (51) | 35,632 (56) | |||
| 5 Major illness | 490 (2) | 579 (3) | 5,689 (9) | |||
In 2009, the top 10 DGS subgroups accounted for half of all admissions from the ED. The majority of admissions for extremity fractures, head trauma, dehydration, and asthma were Short‐Stays, as were roughly 50% of admissions for seizures, appendicitis, and gastroenteritis (Table 2). Respiratory infections and asthma were the top 1 and 2 ranking DGS subgroups for Observation Stays, 1‐Day Stays, and longer‐duration Inpatient admissions. While rank order differed, 9 of the 10 top ranking Observation Stay DGS subgroups were also top ranking DGS subgroups for 1‐Day Stays. Gastroenteritis ranked 10th among Observation Stays and 11th among 1‐Day Stays. Diabetes mellitus ranked 26th among Observation Stays compared with 8th among 1‐Day Stays.
| Short‐Stays | LOS >1 Day | ||
|---|---|---|---|
| % Observation | % 1‐Day Stay | % Longer Admission | |
| |||
| All admissions from the ED | 23.7 | 17.0 | 59.3 |
| n = 108,217 | |||
| Respiratory infections | 22.3 | 15.3 | 62.4 |
| n = 14,455 (13%) | |||
| Asthma | 32.0 | 23.8 | 44.2 |
| n = 8,853 (8%) | |||
| Other GI diseases | 24.1 | 16.2 | 59.7 |
| n = 6,519 (6%) | |||
| Appendicitis | 21.0 | 29.5 | 49.5 |
| n = 4,480 (4%) | |||
| Skin infections | 20.7 | 14.3 | 65.0 |
| n = 4,743 (4%) | |||
| Seizures | 29.5 | 22 | 48.5 |
| n = 4,088 (4%) | |||
| Extremity fractures | 49.4 | 20.5 | 30.1 |
| n = 3,681 (3%) | |||
| Dehydration | 37.8 | 19.0 | 43.2 |
| n = 2,773 (3%) | |||
| Gastroenteritis | 30.3 | 18.7 | 50.9 |
| n = 2,603 (2%) | |||
| Head trauma | 44.1 | 43.9 | 32.0 |
| n = 2,153 (2%) | |||
Average maximum SCS scores were clinically comparable for Observation and 1‐Day Stays and generally lower than for longer‐duration Inpatient admissions within the top 10 most common DGS subgroups. Average maximum SCS scores were statistically lower for Observation Stays compared with 1‐Day Stays for respiratory infections (3.2 vs 3.4), asthma (3.4 vs 3.6), diabetes (3.5 vs 3.8), gastroenteritis (3.0 vs 3.1), other gastrointestinal diseases (3.2 vs 3.4), head trauma (3.3 vs 3.5), and extremity fractures (3.2 vs 3.4) (P < 0.01). There were no differences in SCS scores for skin infections (SCS = 3.0) and appendicitis (SCS = 4.0) when comparing Observation and 1‐Day Stays.
Outcomes for Observation Stays in 2009
Within 6 of the top 10 DGS subgroups for Observation Stays, >75% of patients were discharged home from Observation Status (Table 3). Mean LOS for stays that converted from Observation to Inpatient Status ranged from 2.85 days for extremity fractures to 4.66 days for appendicitis.
| Return to ED in 3 Days n = 421 (1.6%) | Hospital Readmissions in 3 Days n = 247 (1.0%) | Hospital Readmissions in 30 Days n = 819 (3.2%) | ||
|---|---|---|---|---|
| DGS subgroup | % Discharged From Observation | Adjusted* Odds Ratio (95% CI) | Adjusted* Odds Ratio (95% CI) | Adjusted* Odds Ratio (95% CI) |
| ||||
| Respiratory infections | 72 | 1.1 (0.71.8) | 0.8 (0.51.3) | 0.9 (0.71.3) |
| Asthma | 80 | 1.3 (0.63.0) | 1.0 (0.61.8) | 0.5 (0.31.0) |
| Other GI diseases | 74 | 0.8 (0.51.3) | 2.2 (1.33.8) | 1.0 (0.71.5) |
| Appendicitis | 82 | NE | NE | NE |
| Skin infections | 68 | 1.8 (0.84.4) | 1.4 (0.45.3) | 0.9 (0.61.6) |
| Seizures | 79 | 0.8 (0.41.6) | 0.8 (0.31.8) | 0.7 (0.51.0) |
| Extremity fractures | 92 | 0.9 (0.42.1) | 0.2 (01.3) | 1.2 (0.53.2) |
| Dehydration | 81 | 0.9 (0.61.4) | 0.8 (0.31.9) | 0.7 (0.41.1) |
| Gastroenteritis | 74 | 0.9 (0.42.0) | 0.6 (0.41.2) | 0.6 (0.41) |
| Head trauma | 92 | 0.6 (0.21.7) | 0.3 (02.1) | 1.0 (0.42.8) |
Among children with Observation Stays for 1 of the top 10 DGS subgroups, adjusted return ED visit rates were <3% and readmission rates were <1.6% within 3 days following the index stay. Thirty‐day readmission rates were highest following observation for other GI illnesses and seizures. In unadjusted analysis, Observation Stays for asthma, respiratory infections, and skin infections were associated with greater proportions of return ED visits when compared with 1‐Day Stays. Differences were no longer statistically significant after adjusting for SCS score, clustering by hospital, and the grouped treatment variable. Adjusted odds of readmission were significantly higher at 3 days following observation for other GI illnesses and lower at 30 days following observation for seizures when compared with 1‐Day Stays (Table 3).
DISCUSSION
In this first, multicenter longitudinal study of pediatric observation following an ED visit, we found that Observation Status code utilization has increased steadily over the past 6 years and, in 2007, the proportion of children admitted to observation status surpassed the proportion of children experiencing a 1‐day inpatient admission. Taken together, Short‐Stays made up more than 40% of the hospital‐based care delivered to children admitted from an ED. Stable trends in CMI over time suggest that observation status may be replacing inpatient status designated care for pediatric Short‐Stays in these hospitals. Our findings suggest the lines between outpatient observation and short‐stay inpatient care are becoming increasingly blurred. These trends have occurred in the setting of changing policies for hospital reimbursement, requirements for patients to meet criteria to qualify for inpatient admissions, and efforts to avoid stays deemed unnecessary or inappropriate by their brief duration.19 Therefore there is a growing need to understand the impact of children under observation on the structure, delivery, and financing of acute hospital care for children.
Our results also have implications for pediatric health services research that relies on hospital administrative databases that do not contain observation stays. Currently, observation stays are systematically excluded from many inpatient administrative datasets.11, 12 Analyses of datasets that do not account for observation stays likely result in underestimation of hospitalization rates and hospital resource utilization for children. This may be particularly important for high‐volume conditions, such as asthma and acute infections, for which children commonly require brief periods of hospital‐based care beyond an ED encounter. Data from pediatric observation status admissions should be consistently included in hospital administrative datasets to allow for more comprehensive analyses of hospital resource utilization among children.
Prior research has shown that the diagnoses commonly treated in pediatric observation units overlap with the diagnoses for which children experience 1‐Day Stays.1, 20 We found a similar pattern of conditions for which children were under Observation Status and 1‐Day Stays with comparable severity of illness between the groups in terms of SCS scores. Our findings imply a need to determine how and why hospitals differentiate Observation Status from 1‐Day‐Stay groups in order to improve the assignment of observation status. Assuming continued pressures from payers to provide more care in outpatient or observation settings, there is potential for expansion of dedicated observation services for children in the US. Without designated observation units or processes to group patients with lower severity conditions, there may be limited opportunities to realize more efficient hospital care simply through the application of the label of observation status.
For more than 30 years, observation services have been provided to children who require a period of monitoring to determine their response to therapy and the need for acute inpatient admission from the ED.21While we were not able to determine the location of care for observation status patients in this study, we know that few children's hospitals have dedicated observation units and, even when an observation unit is present, not all observation status patients are cared for in dedicated observation units.9 This, in essence, means that most children under observation status are cared for in virtual observation by inpatient teams using inpatient beds. If observation patients are treated in inpatient beds and consume the same resources as inpatients, then cost‐savings based on reimbursement contracts with payers may not reflect an actual reduction in services. Pediatric institutions will need to closely monitor the financial implications of observation status given the historical differences in payment for observation and inpatient care.
With more than 70% of children being discharged home following observation, our results are comparable to the published literature2, 5, 6, 22, 23 and guidelines for observation unit operations.24 Similar to prior studies,4, 15, 2530 our results also indicate that return visits and readmissions following observation are uncommon events. Our findings can serve as initial benchmarks for condition‐specific outcomes for pediatric observation care. Studies are needed both to identify the clinical characteristics predictive of successful discharge home from observation and to explore the hospital‐to‐hospital variability in outcomes for observation. Such studies are necessary to identify the most successful healthcare delivery models for pediatric observation stays.
LIMITATIONS
The primary limitation to our results is that data from a subset of freestanding children's hospitals may not reflect observation stays at other children's hospitals or the community hospitals that care for children across the US. Only 18 of 42 current PHIS member hospitals have provided both outpatient visit and inpatient stay data for each year of the study period and were considered eligible. In an effort to ensure the quality of observation stay data, we included the 16 hospitals that assigned observation charges to at least 90% of their observation status stays in the PHIS database. The exclusion of the 2 hospitals where <90% of observation status patients were assigned observation charges likely resulted in an underestimation of the utilization of observation status.
Second, there is potential for misclassification of patient type given institutional variations in the assignment of patient status. The PHIS database does not contain information about the factors that were considered in the assignment of observation status. At the time of admission from the ED, observation or inpatient status is assigned. While this decision is clearly reserved for the admitting physician, the process is not standardized across hospitals.9 Some institutions have Utilization Managers on site to help guide decision‐making, while others allow the assignment to be made by physicians without specific guidance. As a result, some patients may be assigned to observation status at admission and reassigned to inpatient status following Utilization Review, which may bias our results toward overestimation of the number of observation stays that converted to inpatient status.
The third limitation to our results relates to return visits. An accurate assessment of return visits is subject to the patient returning to the same hospital. If children do not return to the same hospital, our results would underestimate return visits and readmissions. In addition, we did not assess the reason for return visit as there was no way to verify if the return visit was truly related to the index visit without detailed chart review. Assuming children return to the same hospital for different reasons, our results would overestimate return visits associated with observation stays. We suspect that many 3‐day return visits result from the progression of acute illness or failure to respond to initial treatment, and 30‐day readmissions reflect recurrent hospital care needs related to chronic illnesses.
Lastly, severity classification is difficult when analyzing administrative datasets without physiologic patient data, and the SCS may not provide enough detail to reveal clinically important differences between patient groups.
CONCLUSIONS
Short‐stay hospitalizations following ED visits are common among children, and the majority of pediatric short‐stays are under observation status. Analyses of inpatient administrative databases that exclude observation stays likely result in an underestimation of hospital resource utilization for children. Efforts are needed to ensure that patients under observation status are accounted for in hospital administrative datasets used for pediatric health services research, and healthcare resource allocation, as it relates to hospital‐based care. While the clinical outcomes for observation patients appear favorable in terms of conversion to inpatient admissions and return visits, the financial implications of observation status care within children's hospitals are currently unknown.
- ,,,,,.Trends in high‐turnover stays among children hospitalized in the United States, 1993–2003.Pediatrics.2009;123(3):996–1002.
- ,,,,.Utilization and unexpected hospitalization rates of a pediatric emergency department 23‐hour observation unit.Pediatr Emerg Care.2008;24(9):589–594.
- ,,.When the patient requires observation not hospitalization.J Nurs Admin.1988;18(10):20–23.
- ,,,.Pediatric observation status beds on an inpatient unit: an integrated care model.Pediatr Emerg Care.2004;20(1):17–21.
- ,,.Use of an observation unit by a pediatric emergency department for common pediatric illnesses.Pediatr Emerg Care.2001;17(5):321–323.
- ,,.The pediatric hybrid observation unit: an analysis of 6477 consecutive patient encounters.Pediatrics.2005;115(5):e535–e542.
- ACEP. Emergency Department Crowding: High‐Impact Solutions. Task Force Report on Boarding.2008. Available at: http://www.acep.org/WorkArea/downloadasset.aspx?id=37960. Accessed July 21, 2010.
- ,,, et al.Children's hospitals do not acutely respond to high occupancy.Pediatrics.2010;125(5):974–981.
- ,,, et al.Differences in observation care practices in US freestanding children's hospitals: are they virtual or real?J Hosp Med.2011. Available at: http://www.cms.gov/transmittals/downloads/R770HO.pdf. Accessed January 10, 2011.
- CMS.Medicare Hospital Manual, Section 455.Department of Health and Human Services, Centers for Medicare and Medicaid Services;2001. Available at: http://www.hcup‐us.ahrq.gov/reports/methods/FinalReportonObservationStatus_v2Final.pdf. Accessed on May 3, 2007.
- HCUP.Methods Series Report #2002–3. Observation Status Related to U.S. Hospital Records. Healthcare Cost and Utilization Project.Rockville, MD:Agency for Healthcare Research and Quality;2002.
- ,.Design and operation of the National Hospital Discharge Survey: 1988 redesign.Vital Health Stat.2000;1(39):1–43.
- ,,,.Corticosteroids and mortality in children with bacterial meningitis.JAMA.2008;299(17):2048–2055.
- ,,,,.Intravenous immunoglobulin in children with streptococcal toxic shock syndrome.Clin Infect Dis.2009;49(9):1369–1376.
- ,,,.Impact of a short stay unit on asthma patients admitted to a tertiary pediatric hospital.Qual Manag Health Care.1997;6(1):14–22.
- ,,.An observation unit in a pediatric emergency department: one children's hospital's experience.J Emerg Nurs.2002;28(5):407–413.
- ,,,.Developing a diagnosis‐based severity classification system for use in emergency medical systems for children. Pediatric Academic Societies' Annual Meeting, Platform Presentation; Toronto, Canada;2007.
- ,,,,.A new diagnosis grouping system for child emergency department visits.Acad Emerg Med.2010;17(2):204–213.
- .Observation medicine: the healthcare system's tincture of time. In: Graff LG, ed.Principles of Observation Medicine.American College of Emergency Physicians;2010. Available at: http://www. acep.org/content.aspx?id=46142. Accessed February 18, 2011.
- ,,,,.High turnover stays for pediatric asthma in the United States: analysis of the 2006 Kids' Inpatient Database.Med Care.2010;48(9):827–833.
- ,,,,.Pediatric observation units in the United States: a systematic review.J Hosp Med.2010;5(3):172–182.
- ,.Observation unit in childrens hospital—adjunct to delivery and teaching of ambulatory pediatric care.N Y State J Med.1980;80(11):1684–1686.
- ,,.Short stay in an outpatient department. An alternative to hospitalization.Am J Dis Child.1972;123(2):128–132.
- ACEP.Practice Management Committee, American College of Emergency Physicians. Management of Observation Units.Irving, TX:American College of Emergency Physicians;1994.
- ,,,,.Return visits to a pediatric emergency department.Pediatr Emerg Care.2004;20(3):166–171.
- ,.Postreduction management of intussusception in a children's hospital emergency department.Pediatrics.2003;112(6 pt 1):1302–1307.
- ,,,,.Pediatric closed head injuries treated in an observation unit.Pediatr Emerg Care.2005;21(10):639–644.
- ,,,.Use of pediatric observation unit for treatment of children with dehydration caused by gastroenteritis.Pediatr Emerg Care.2006;22(1):1–6.
- ,,,.Children with asthma admitted to a pediatric observation unit.Pediatr Emerg Care.2005;21(10):645–649.
- ,,, et al.How well can hospital readmission be predicted in a cohort of hospitalized children? A retrospective, multicenter study.Pediatrics.2009;123(1):286–293.
Copyright © 2012 Society of Hospital Medicine
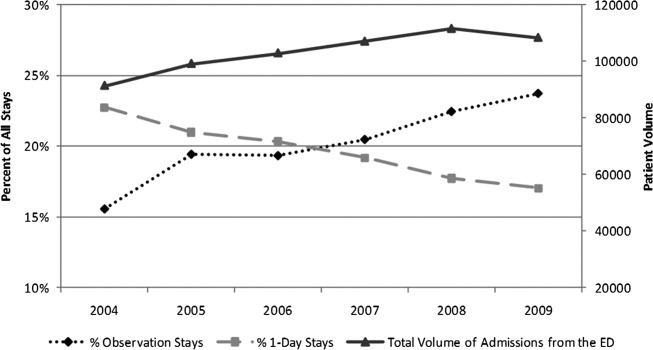
Observation Care in Children's Hospitals
Observation medicine has grown in recent decades out of changes in policies for hospital reimbursement, requirements for patients to meet admission criteria to qualify for inpatient admission, and efforts to avoid unnecessary or inappropriate admissions.1 Emergency physicians are frequently faced with patients who are too sick to be discharged home, but do not clearly meet criteria for an inpatient status admission. These patients often receive extended outpatient services (typically extending 24 to 48 hours) under the designation of observation status, in order to determine their response to treatment and need for hospitalization.
Observation care delivered to adult patients has increased substantially in recent years, and the confusion around the designation of observation versus inpatient care has received increasing attention in the lay press.27 According to the Centers for Medicare and Medicaid Services (CMS)8:
Observation care is a well‐defined set of specific, clinically appropriate services, which include ongoing short term treatment, assessment, and reassessment before a decision can be made regarding whether patients will require further treatment as hospital inpatients. Observation services are commonly ordered for patients who present to the emergency department and who then require a significant period of treatment or monitoring in order to make a decision concerning their admission or discharge.
Observation status is an administrative label that is applied to patients who do not meet inpatient level of care criteria, as defined by third parties such as InterQual. These criteria usually include a combination of the patient's clinical diagnoses, severity of illness, and expected needs for monitoring and interventions, in order to determine the admission status to which the patient may be assigned (eg, observation, inpatient, or intensive care). Observation services can be provided, in a variety of settings, to those patients who do not meet inpatient level of care but require a period of observation. Some hospitals provide observation care in discrete units in the emergency department (ED) or specific inpatient unit, and others have no designated unit but scatter observation patients throughout the institution, termed virtual observation units.9
For more than 30 years, observation unit (OU) admission has offered an alternative to traditional inpatient hospitalization for children with a variety of acute conditions.10, 11 Historically, the published literature on observation care for children in the United States has been largely based in dedicated emergency department OUs.12 Yet, in a 2001 survey of 21 pediatric EDs, just 6 reported the presence of a 23‐hour unit.13 There are single‐site examples of observation care delivered in other settings.14, 15 In 2 national surveys of US General Hospitals, 25% provided observation services in beds adjacent to the ED, and the remainder provided observation services in hospital inpatient units.16, 17 However, we are not aware of any previous multi‐institution studies exploring hospital‐wide practices related to observation care for children.
Recognizing that observation status can be designated using various standards, and that observation care can be delivered in locations outside of dedicated OUs,9 we developed 2 web‐based surveys to examine the current models of pediatric observation medicine in US children's hospitals. We hypothesized that observation care is most commonly applied as a billing designation and does not necessarily represent care delivered in a structurally or functionally distinct OU, nor does it represent a difference in care provided to those patients with inpatient designation.
METHODS
Study Design
Two web‐based surveys were distributed, in April 2010, to the 42 freestanding, tertiary care children's hospitals affiliated with the Child Health Corporation of America (CHCA; Shawnee Mission, KS) which contribute data to the Pediatric Health Information System (PHIS) database. The PHIS is a national administrative database that contains resource utilization data from participating hospitals located in noncompeting markets of 27 states plus the District of Columbia. These hospitals account for 20% of all tertiary care children's hospitals in the United States.
Survey Content
Survey 1
A survey of hospital observation status practices has been developed by CHCA as a part of the PHIS data quality initiative (see Supporting Appendix: Survey 1 in the online version of this article). Hospitals that did not provide observation patient data to PHIS were excluded after an initial screening question. This survey obtained information regarding the designation of observation status within each hospital. Hospitals provided free‐text responses to questions related to the criteria used to define observation, and to admit patients into observation status. Fixed‐choice response questions were used to determine specific observation status utilization criteria and clinical guidelines (eg, InterQual and Milliman) used by hospitals for the designation of observation status to patients.
Survey 2
We developed a detailed follow‐up survey in order to characterize the structures and processes of care associated with observation status (see Supporting Appendix: Survey 2 in the online version of this article). Within the follow‐up survey, an initial screening question was used to determine all types of patients to which observation status is assigned within the responding hospitals. All other questions in Survey 2 were focused specifically on those patients who required additional care following ED evaluation and treatment. Fixed‐choice response questions were used to explore differences in care for patients under observation and those admitted as inpatients. We also inquired of hospital practices related to boarding of patients in the ED while awaiting admission to an inpatient bed.
Survey Distribution
Two web‐based surveys were distributed to all 42 CHCA hospitals that contribute data to PHIS. During the month of April 2010, each hospital's designated PHIS operational contact received e‐mail correspondence requesting their participation in each survey. Within hospitals participating in PHIS, Operational Contacts have been assigned to serve as the day‐to‐day PHIS contact person based upon their experience working with the PHIS data. The Operational Contacts are CHCA's primary contact for issues related to the hospital's data quality and reporting to PHIS. Non‐responders were contacted by e‐mail for additional requests to complete the surveys. Each e‐mail provided an introduction to the topic of the survey and a link to complete the survey. The e‐mail requesting participation in Survey 1 was distributed the first week of April 2010, and the survey was open for responses during the first 3 weeks of the month. The e‐mail requesting participation in Survey 2 was sent the third week of April 2010, and the survey was open for responses during the subsequent 2 weeks.
DATA ANALYSIS
Survey responses were collected and are presented as a descriptive summary of results. Hospital characteristics were summarized with medians and interquartile ranges for continuous variables, and with percents for categorical variables. Characteristics were compared between hospitals that responded and those that did not respond to Survey 2 using Wilcoxon rank‐sum tests and chi‐square tests as appropriate. All analyses were performed using SAS v.9.2 (SAS Institute, Cary, NC), and a P value <0.05 was considered statistically significant. The study was reviewed by the University of Michigan Institutional Review Board and considered exempt.
RESULTS
Responses to Survey 1 were available from 37 of 42 (88%) of PHIS hospitals (Figure 1). For Survey 2, we received responses from 20 of 42 (48%) of PHIS hospitals. Based on information available from Survey 1, we know that 20 of the 31 (65%) PHIS hospitals that report observation status patient data to PHIS responded to Survey 2. Characteristics of the hospitals responding and not responding to Survey 2 are presented in Table 1. Respondents provided hospital identifying information which allowed for the linkage of data, from Survey 1, to 17 of the 20 hospitals responding to Survey 2. We did not have information available to link responses from 3 hospitals.
| Respondent N = 20 | Non‐Respondent N = 22 | P Value | |
|---|---|---|---|
| |||
| No. of inpatient beds Median [IQR] (excluding Obstetrics) | 245 [219283] | 282 [250381] | 0.076 |
| Annual admissions Median [IQR] (excluding births) | 11,658 [8,64213,213] | 13,522 [9,83018,705] | 0.106 |
| ED volume Median [IQR] | 60,528 [47,85082,955] | 64,486 [47,38684,450] | 0.640 |
| Percent government payer Median [IQR] | 53% [4662] | 49% [4158] | 0.528 |
| Region | |||
| Northeast | 37% | 0% | 0.021 |
| Midwest | 21% | 33% | |
| South | 21% | 50% | |
| West | 21% | 17% | |
| Reports observation status patients to PHIS | 85% | 90% | 0.555 |
Based on responses to the surveys and our knowledge of data reported to PHIS, our current understanding of patient flow from ED through observation to discharge home, and the application of observation status to the encounter, is presented in Figure 2. According to free‐text responses to Survey 1, various methods were applied to designate observation status (gray shaded boxes in Figure 2). Fixed‐choice responses to Survey 2 revealed that observation status patients were cared for in a variety of locations within hospitals, including ED beds, designated observation units, and inpatient beds (dashed boxes in Figure 2). Not every facility utilized all of the listed locations for observation care. Space constraints could dictate the location of care, regardless of patient status (eg, observation vs inpatient), in hospitals with more than one location of care available to observation patients. While patient status could change during a visit, only the final patient status at discharge enters the administrative record submitted to PHIS (black boxes in Figure 2). Facility charges for observation remained a part of the visit record and were reported to PHIS. Hospitals may or may not bill for all assigned charges depending on patient status, length of stay, or other specific criteria determined by contracts with individual payers.
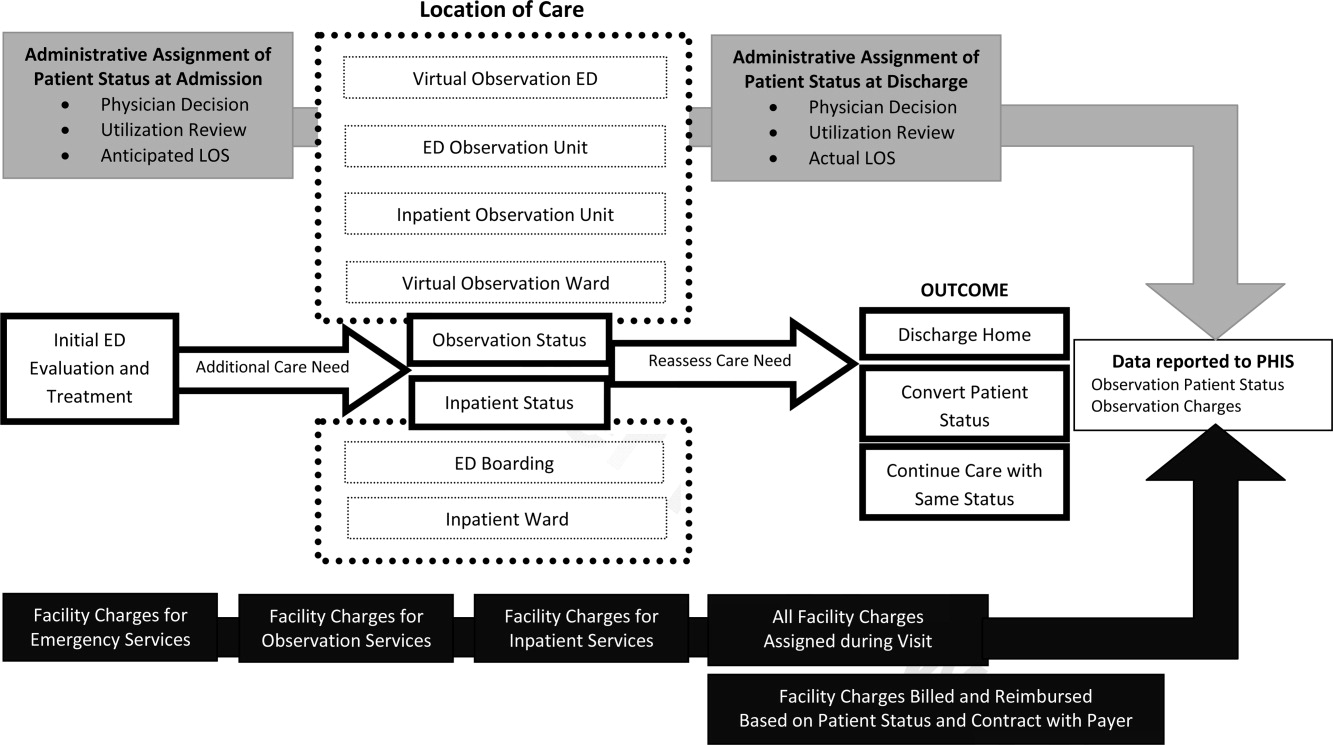
Survey 1: Classification of Observation Patients and Presence of Observation Units in PHIS Hospitals
According to responses to Survey 1, designated OUs were not widespread, present in only 12 of the 31 hospitals. No hospital reported treating all observation status patients exclusively in a designated OU. Observation status was defined by both duration of treatment and either level of care criteria or clinical care guidelines in 21 of the 31 hospitals responding to Survey 1. Of the remaining 10 hospitals, 1 reported that treatment duration alone defines observation status, and the others relied on prespecified observation criteria. When considering duration of treatment, hospitals variably indicated that anticipated or actual lengths of stay were used to determine observation status. Regarding the maximum hours a patient can be observed, 12 hospitals limited observation to 24 hours or fewer, 12 hospitals observed patients for no more than 36 to 48 hours, and the remaining 7 hospitals allowed observation periods of 72 hours or longer.
When admitting patients to observation status, 30 of 31 hospitals specified the criteria that were used to determine observation admissions. InterQual criteria, the most common response, were used by 23 of the 30 hospitals reporting specified criteria; the remaining 7 hospitals had developed hospital‐specific criteria or modified existing criteria, such as InterQual or Milliman, to determine observation status admissions. In addition to these criteria, 11 hospitals required a physician order for admission to observation status. Twenty‐four hospitals indicated that policies were in place to change patient status from observation to inpatient, or inpatient to observation, typically through processes of utilization review and application of criteria listed above.
Most hospitals indicated that they faced substantial variation in the standards used from one payer to another when considering reimbursement for care delivered under observation status. Hospitals noted that duration‐of‐carebased reimbursement practices included hourly rates, per diem, and reimbursement for only the first 24 or 48 hours of observation care. Hospitals identified that payers variably determined reimbursement for observation based on InterQual level of care criteria and Milliman care guidelines. One hospital reported that it was not their practice to bill for the observation bed.
Survey 2: Understanding Observation Patient Type Administrative Data Following ED Care Within PHIS Hospitals
Of the 20 hospitals responding to Survey 2, there were 2 hospitals that did not apply observation status to patients after ED care and 2 hospitals that did not provide complete responses. The remaining 16 hospitals provided information regarding observation status as applied to patients after receiving treatment in the ED. The settings available for observation care and patient groups treated within each area are presented in Table 2. In addition to the patient groups listed in Table 2, there were 4 hospitals where patients could be admitted to observation status directly from an outpatient clinic. All responding hospitals provided virtual observation care (ie, observation status is assigned but the patient is cared for in the existing ED or inpatient ward). Nine hospitals also provided observation care within a dedicated ED or ward‐based OU (ie, a separate clinical area in which observation patients are treated).
| Hospital No. | Available Observation Settings | Patient Groups Under Observation in Each Setting | UR to Assign Obs Status | When Obs Status Is Assigned | ||
|---|---|---|---|---|---|---|
| ED | Post‐Op | Test/Treat | ||||
| ||||||
| 1 | Virtual inpatient | X | X | X | Yes | Discharge |
| Ward‐based OU | X | X | No | |||
| 2 | Virtual inpatient | X | X | Yes | Admission | |
| Ward‐based OU | X | X | X | No | ||
| 3 | Virtual inpatient | X | X | X | Yes | Discharge |
| Ward‐based OU | X | X | X | Yes | ||
| ED OU | X | Yes | ||||
| Virtual ED | X | Yes | ||||
| 4 | Virtual inpatient | X | X | X | Yes | Discharge |
| ED OU | X | No | ||||
| Virtual ED | X | No | ||||
| 5 | Virtual inpatient | X | X | X | N/A | Discharge |
| 6 | Virtual inpatient | X | X | X | Yes | Discharge |
| 7 | Virtual inpatient | X | X | Yes | No response | |
| Ward‐based OU | X | Yes | ||||
| Virtual ED | X | Yes | ||||
| 8 | Virtual inpatient | X | X | X | Yes | Admission |
| 9 | Virtual inpatient | X | X | Yes | Discharge | |
| ED OU | X | Yes | ||||
| Virtual ED | X | Yes | ||||
| 10 | Virtual inpatient | X | X | X | Yes | Admission |
| ED OU | X | Yes | ||||
| 11 | Virtual inpatient | X | X | Yes | Discharge | |
| Ward‐based OU | X | X | Yes | |||
| ED OU | X | Yes | ||||
| Virtual ED | X | Yes | ||||
| 12 | Virtual inpatient | X | X | X | Yes | Admission |
| 13 | Virtual inpatient | X | X | N/A | Discharge | |
| Virtual ED | X | N/A | ||||
| 14 | Virtual inpatient | X | X | X | Yes | Both |
| 15 | Virtual inpatient | X | X | Yes | Admission | |
| Ward‐based OU | X | X | Yes | |||
| 16 | Virtual inpatient | X | Yes | Admission | ||
When asked to identify differences between clinical care delivered to patients admitted under virtual observation and those admitted under inpatient status, 14 of 16 hospitals selected the option There are no differences in the care delivery of these patients. The differences identified by 2 hospitals included patient care orders, treatment protocols, and physician documentation. Within the hospitals that reported utilization of virtual ED observation, 2 reported differences in care compared with other ED patients, including patient care orders, physician rounds, documentation, and discharge process. When admitted patients were boarded in the ED while awaiting an inpatient bed, 11 of 16 hospitals allowed for observation or inpatient level of care to be provided in the ED. Fourteen hospitals allow an admitted patient to be discharged home from boarding in the ED without ever receiving care in an inpatient bed. The discharge decision was made by ED providers in 7 hospitals, and inpatient providers in the other 7 hospitals.
Responses to questions providing detailed information on the process of utilization review were provided by 12 hospitals. Among this subset of hospitals, utilization review was consistently used to assign virtual inpatient observation status and was applied at admission (n = 6) or discharge (n = 8), depending on the hospital. One hospital applied observation status at both admission and discharge; 1 hospital did not provide a response. Responses to questions regarding utilization review are presented in Table 3.
| Survey Question | Yes N (%) | No N (%) |
|---|---|---|
| Preadmission utilization review is conducted at my hospital. | 3 (25) | 9 (75) |
| Utilization review occurs daily at my hospital. | 10 (83) | 2 (17) |
| A nonclinician can initiate an order for observation status. | 4 (33) | 8 (67) |
| Status can be changed after the patient has been discharged. | 10 (83) | 2 (17) |
| Inpatient status would always be assigned to a patient who receives less than 24 hours of care and meets inpatient criteria. | 9 (75) | 3 (25) |
| The same status would be assigned to different patients who received the same treatment of the same duration but have different payers. | 6 (50) | 6 (50) |
DISCUSSION
This is the largest descriptive study of pediatric observation status practices in US freestanding children's hospitals and, to our knowledge, the first to include information about both the ED and inpatient treatment environments. There are two important findings of this study. First, designated OUs were uncommon among the group of freestanding children's hospitals that reported observation patient data to PHIS in 2010. Second, despite the fact that hospitals reported observation care was delivered in a variety of settings, virtual inpatient observation status was nearly ubiquitous. Among the subset of hospitals that provided information about the clinical care delivered to patients admitted under virtual inpatient observation, hospitals frequently reported there were no differences in the care delivered to observation patients when compared with other inpatients.
The results of our survey indicate that designated OUs are not a commonly available model of observation care in the study hospitals. In fact, the vast majority of the hospitals used virtual inpatient observation care, which did not differ from the care delivered to a child admitted as an inpatient. ED‐based OUs, which often provide operationally and physically distinct care to observation patients, have been touted as cost‐effective alternatives to inpatient care,1820 resulting in fewer admissions and reductions in length of stay19, 20 without a resultant increase in return ED‐visits or readmissions.2123 Research is needed to determine the patient‐level outcomes for short‐stay patients in the variety of available treatment settings (eg, physically or operationally distinct OUs and virtual observation), and to evaluate these outcomes in comparison to results published from designated OUs. The operationally and physically distinct features of a designated OU may be required to realize the benefits of observation attributed to individual patients.
While observation care has been historically provided by emergency physicians, there is increasing interest in the role of inpatient providers in observation care.9 According to our survey, children were admitted to observation status directly from clinics, following surgical procedures, scheduled tests and treatment, or after evaluation and treatment in the ED. As many of these children undergo virtual observation in inpatient areas, the role of inpatient providers, such as pediatric hospitalists, in observation care may be an important area for future study, education, and professional development. Novel models of care, with hospitalists collaborating with emergency physicians, may be of benefit to the children who require observation following initial stabilization and treatment in the ED.24, 25
We identified variation between hospitals in the methods used to assign observation status to an episode of care, including a wide range of length of stay criteria and different approaches to utilization review. In addition, the criteria payers use to reimburse for observation varied between payers, even within individual hospitals. The results of our survey may be driven by issues of reimbursement and not based on a model of optimizing patient care outcomes using designated OUs. Variations in reimbursement may limit hospital efforts to refine models of observation care for children. Designated OUs have been suggested as a method for improving ED patient flow,26 increasing inpatient capacity,27 and reducing costs of care.28 Standardization of observation status criteria and consistent reimbursement for observation services may be necessary for hospitals to develop operationally and physically distinct OUs, which may be essential to achieving the proposed benefits of observation medicine on costs of care, patient flow, and hospital capacity.
LIMITATIONS
Our study results should be interpreted with the following limitations in mind. First, the surveys were distributed only to freestanding children's hospitals who participate in PHIS. As a result, our findings may not be generalizable to the experiences of other children's hospitals or general hospitals caring for children. Questions in Survey 2 were focused on understanding observation care, delivered to patients following ED care, which may differ from observation practices related to a direct admission or following scheduled procedures, tests, or treatments. It is important to note that, hospitals that do not report observation status patient data to PHIS are still providing care to children with acute conditions that respond to brief periods of hospital treatment, even though it is not labeled observation. However, it was beyond the scope of this study to characterize the care delivered to all patients who experience a short stay.
The second main limitation of our study is the lower response rate to Survey 2. In addition, several surveys contained incomplete responses which further limits our sample size for some questions, specifically those related to utilization review. The lower response to Survey 2 could be related to the timing of the distribution of the 2 surveys, or to the information contained in the introductory e‐mail describing Survey 2. Hospitals with designated observation units, or where observation status care has been receiving attention, may have been more likely to respond to our survey, which may bias our results to reflect the experiences of hospitals experiencing particular successes or challenges with observation status care. A comparison of known hospital characteristics revealed no differences between hospitals that did and did not provide responses to Survey 2, but other unmeasured differences may exist.
CONCLUSION
Observation status is assigned using duration of treatment, clinical care guidelines, and level of care criteria, and is defined differently by individual hospitals and payers. Currently, the most widely available setting for pediatric observation status is within a virtual inpatient unit. Our results suggest that the care delivered to observation patients in virtual inpatient units is consistent with care provided to other inpatients. As such, observation status is largely an administrative/billing designation, which does not appear to reflect differences in clinical care. A consistent approach to the assignment of patients to observation status, and treatment of patients under observation among hospitals and payers, may be necessary to compare quality outcomes. Studies of the clinical care delivery and processes of care for short‐stay patients are needed to optimize models of pediatric observation care.
- .Observation medicine: the healthcare system's tincture of time. In: Graff LG, ed.Principles of Observation Medicine.Dallas, TX:American College of Emergency Physicians;2010. Available at: http://www.acep.org/content.aspx?id=46142. Accessed February 18,year="2011"2011.
- .Hospital ‘observation’ status a matter of billing.The Columbus Dispatch. February 14,2011.
- .Hospital payments downgraded.Philadelphia Business Journal. February 18,2011.
- .Medicare rules give full hospital benefits only to those with ‘inpatient’ status.The Washington Post. September 7,2010.
- .Hospitals caught between a rock and a hard place over observation.Health Leaders Media. September 15,2010.
- .AHA: observation status fears on the rise.Health Leaders Media. October 29,2010.
- .Put your hospital bill under a microscope.The New York Times. September 13,2010.
- Medicare Hospital Manual Section 455.Washington, DC:Department of Health and Human Services, Centers for Medicare and Medicaid Services;2001.
- ,,,,.The Observation Unit: An Operational Overview for the Hospitalist. Society of Hospital Medicine White Paper. May 21, 2009. Available at: http://www.hospitalmedicine.org/Content/NavigationMenu/Publications/White Papers/White_Papers.htm. Accessed May 21,2009.
- ,,,,.Utilization and unexpected hospitalization rates of a pediatric emergency department 23‐hour observation unit.Pediatr Emerg Care.2008;24(9):589–594.
- ,,.The pediatric hybrid observation unit: an analysis of 6477 consecutive patient encounters.Pediatrics.2005;115(5):e535–e542.
- ,,,,.Pediatric observation units in the United States: a systematic review.J Hosp Med.2010;5(3):172–182.
- ,,.Pediatric emergency department directors' benchmarking survey: fiscal year 2001.Pediatr Emerg Care.2003;19(3):143–147.
- ,,,.Pediatric observation status beds on an inpatient unit: an integrated care model.Pediatr Emerg Care.2004;20(1):17–21.
- ,,,.Impact of a short stay unit on asthma patients admitted to a tertiary pediatric hospital.Qual Manag Health Care.1997;6(1):14–22.
- ,,,.A national survey of observation units in the United States.Am J Emerg Med.2003;21(7):529–533.
- ,,,.A survey of observation units in the United States.Am J Emerg Med.1989;7(6):576–580.
- ,,.When the patient requires observation not hospitalization.J Nurs Admin.1988;18(10):20–23.
- ,,.A reduction in hospitalization, length of stay, and hospital charges for croup with the institution of a pediatric observation unit.Am J Emerg Med.2006;24(7):818–821.
- ,,.Outpatient oral rehydration in the United States.Am J Dis Child.1986;140(3):211–215.
- ,,,,.Pediatric closed head injuries treated in an observation unit.Pediatr Emerg Care.2005;21(10):639–644.
- ,,,.Use of pediatric observation unit for treatment of children with dehydration caused by gastroenteritis.Pediatr Emerg Care.2006;22(1):1–6.
- ,,,.Children with asthma admitted to a pediatric observation unit.Pediatr Emerg Care.2005;21(10):645–649.
- ,,,.Redefining the community pediatric hospitalist: the combined pediatric ED/inpatient unit.Pediatr Emerg Care.2007;23(1):33–37.
- ,,,.Program description: a hospitalist‐run, medical short‐stay unit in a teaching hospital.Can Med Assoc J.2000;163(11):1477–1480.
- ,.Impact of an observation unit and an emergency department‐admitted patient transfer mandate in decreasing overcrowding in a pediatric emergency department: a discrete event simulation exercise.Pediatr Emerg Care.2009;25(3):160–163.
- ,,, et al.Children's hospitals do not acutely respond to high occupancy.Pediatrics.125(5):974–981.
- ,,,,,.Trends in high‐turnover stays among children hospitalized in the United States, 1993‐2003.Pediatrics.2009;123(3):996–1002.
Observation medicine has grown in recent decades out of changes in policies for hospital reimbursement, requirements for patients to meet admission criteria to qualify for inpatient admission, and efforts to avoid unnecessary or inappropriate admissions.1 Emergency physicians are frequently faced with patients who are too sick to be discharged home, but do not clearly meet criteria for an inpatient status admission. These patients often receive extended outpatient services (typically extending 24 to 48 hours) under the designation of observation status, in order to determine their response to treatment and need for hospitalization.
Observation care delivered to adult patients has increased substantially in recent years, and the confusion around the designation of observation versus inpatient care has received increasing attention in the lay press.27 According to the Centers for Medicare and Medicaid Services (CMS)8:
Observation care is a well‐defined set of specific, clinically appropriate services, which include ongoing short term treatment, assessment, and reassessment before a decision can be made regarding whether patients will require further treatment as hospital inpatients. Observation services are commonly ordered for patients who present to the emergency department and who then require a significant period of treatment or monitoring in order to make a decision concerning their admission or discharge.
Observation status is an administrative label that is applied to patients who do not meet inpatient level of care criteria, as defined by third parties such as InterQual. These criteria usually include a combination of the patient's clinical diagnoses, severity of illness, and expected needs for monitoring and interventions, in order to determine the admission status to which the patient may be assigned (eg, observation, inpatient, or intensive care). Observation services can be provided, in a variety of settings, to those patients who do not meet inpatient level of care but require a period of observation. Some hospitals provide observation care in discrete units in the emergency department (ED) or specific inpatient unit, and others have no designated unit but scatter observation patients throughout the institution, termed virtual observation units.9
For more than 30 years, observation unit (OU) admission has offered an alternative to traditional inpatient hospitalization for children with a variety of acute conditions.10, 11 Historically, the published literature on observation care for children in the United States has been largely based in dedicated emergency department OUs.12 Yet, in a 2001 survey of 21 pediatric EDs, just 6 reported the presence of a 23‐hour unit.13 There are single‐site examples of observation care delivered in other settings.14, 15 In 2 national surveys of US General Hospitals, 25% provided observation services in beds adjacent to the ED, and the remainder provided observation services in hospital inpatient units.16, 17 However, we are not aware of any previous multi‐institution studies exploring hospital‐wide practices related to observation care for children.
Recognizing that observation status can be designated using various standards, and that observation care can be delivered in locations outside of dedicated OUs,9 we developed 2 web‐based surveys to examine the current models of pediatric observation medicine in US children's hospitals. We hypothesized that observation care is most commonly applied as a billing designation and does not necessarily represent care delivered in a structurally or functionally distinct OU, nor does it represent a difference in care provided to those patients with inpatient designation.
METHODS
Study Design
Two web‐based surveys were distributed, in April 2010, to the 42 freestanding, tertiary care children's hospitals affiliated with the Child Health Corporation of America (CHCA; Shawnee Mission, KS) which contribute data to the Pediatric Health Information System (PHIS) database. The PHIS is a national administrative database that contains resource utilization data from participating hospitals located in noncompeting markets of 27 states plus the District of Columbia. These hospitals account for 20% of all tertiary care children's hospitals in the United States.
Survey Content
Survey 1
A survey of hospital observation status practices has been developed by CHCA as a part of the PHIS data quality initiative (see Supporting Appendix: Survey 1 in the online version of this article). Hospitals that did not provide observation patient data to PHIS were excluded after an initial screening question. This survey obtained information regarding the designation of observation status within each hospital. Hospitals provided free‐text responses to questions related to the criteria used to define observation, and to admit patients into observation status. Fixed‐choice response questions were used to determine specific observation status utilization criteria and clinical guidelines (eg, InterQual and Milliman) used by hospitals for the designation of observation status to patients.
Survey 2
We developed a detailed follow‐up survey in order to characterize the structures and processes of care associated with observation status (see Supporting Appendix: Survey 2 in the online version of this article). Within the follow‐up survey, an initial screening question was used to determine all types of patients to which observation status is assigned within the responding hospitals. All other questions in Survey 2 were focused specifically on those patients who required additional care following ED evaluation and treatment. Fixed‐choice response questions were used to explore differences in care for patients under observation and those admitted as inpatients. We also inquired of hospital practices related to boarding of patients in the ED while awaiting admission to an inpatient bed.
Survey Distribution
Two web‐based surveys were distributed to all 42 CHCA hospitals that contribute data to PHIS. During the month of April 2010, each hospital's designated PHIS operational contact received e‐mail correspondence requesting their participation in each survey. Within hospitals participating in PHIS, Operational Contacts have been assigned to serve as the day‐to‐day PHIS contact person based upon their experience working with the PHIS data. The Operational Contacts are CHCA's primary contact for issues related to the hospital's data quality and reporting to PHIS. Non‐responders were contacted by e‐mail for additional requests to complete the surveys. Each e‐mail provided an introduction to the topic of the survey and a link to complete the survey. The e‐mail requesting participation in Survey 1 was distributed the first week of April 2010, and the survey was open for responses during the first 3 weeks of the month. The e‐mail requesting participation in Survey 2 was sent the third week of April 2010, and the survey was open for responses during the subsequent 2 weeks.
DATA ANALYSIS
Survey responses were collected and are presented as a descriptive summary of results. Hospital characteristics were summarized with medians and interquartile ranges for continuous variables, and with percents for categorical variables. Characteristics were compared between hospitals that responded and those that did not respond to Survey 2 using Wilcoxon rank‐sum tests and chi‐square tests as appropriate. All analyses were performed using SAS v.9.2 (SAS Institute, Cary, NC), and a P value <0.05 was considered statistically significant. The study was reviewed by the University of Michigan Institutional Review Board and considered exempt.
RESULTS
Responses to Survey 1 were available from 37 of 42 (88%) of PHIS hospitals (Figure 1). For Survey 2, we received responses from 20 of 42 (48%) of PHIS hospitals. Based on information available from Survey 1, we know that 20 of the 31 (65%) PHIS hospitals that report observation status patient data to PHIS responded to Survey 2. Characteristics of the hospitals responding and not responding to Survey 2 are presented in Table 1. Respondents provided hospital identifying information which allowed for the linkage of data, from Survey 1, to 17 of the 20 hospitals responding to Survey 2. We did not have information available to link responses from 3 hospitals.
| Respondent N = 20 | Non‐Respondent N = 22 | P Value | |
|---|---|---|---|
| |||
| No. of inpatient beds Median [IQR] (excluding Obstetrics) | 245 [219283] | 282 [250381] | 0.076 |
| Annual admissions Median [IQR] (excluding births) | 11,658 [8,64213,213] | 13,522 [9,83018,705] | 0.106 |
| ED volume Median [IQR] | 60,528 [47,85082,955] | 64,486 [47,38684,450] | 0.640 |
| Percent government payer Median [IQR] | 53% [4662] | 49% [4158] | 0.528 |
| Region | |||
| Northeast | 37% | 0% | 0.021 |
| Midwest | 21% | 33% | |
| South | 21% | 50% | |
| West | 21% | 17% | |
| Reports observation status patients to PHIS | 85% | 90% | 0.555 |
Based on responses to the surveys and our knowledge of data reported to PHIS, our current understanding of patient flow from ED through observation to discharge home, and the application of observation status to the encounter, is presented in Figure 2. According to free‐text responses to Survey 1, various methods were applied to designate observation status (gray shaded boxes in Figure 2). Fixed‐choice responses to Survey 2 revealed that observation status patients were cared for in a variety of locations within hospitals, including ED beds, designated observation units, and inpatient beds (dashed boxes in Figure 2). Not every facility utilized all of the listed locations for observation care. Space constraints could dictate the location of care, regardless of patient status (eg, observation vs inpatient), in hospitals with more than one location of care available to observation patients. While patient status could change during a visit, only the final patient status at discharge enters the administrative record submitted to PHIS (black boxes in Figure 2). Facility charges for observation remained a part of the visit record and were reported to PHIS. Hospitals may or may not bill for all assigned charges depending on patient status, length of stay, or other specific criteria determined by contracts with individual payers.
Survey 1: Classification of Observation Patients and Presence of Observation Units in PHIS Hospitals
According to responses to Survey 1, designated OUs were not widespread, present in only 12 of the 31 hospitals. No hospital reported treating all observation status patients exclusively in a designated OU. Observation status was defined by both duration of treatment and either level of care criteria or clinical care guidelines in 21 of the 31 hospitals responding to Survey 1. Of the remaining 10 hospitals, 1 reported that treatment duration alone defines observation status, and the others relied on prespecified observation criteria. When considering duration of treatment, hospitals variably indicated that anticipated or actual lengths of stay were used to determine observation status. Regarding the maximum hours a patient can be observed, 12 hospitals limited observation to 24 hours or fewer, 12 hospitals observed patients for no more than 36 to 48 hours, and the remaining 7 hospitals allowed observation periods of 72 hours or longer.
When admitting patients to observation status, 30 of 31 hospitals specified the criteria that were used to determine observation admissions. InterQual criteria, the most common response, were used by 23 of the 30 hospitals reporting specified criteria; the remaining 7 hospitals had developed hospital‐specific criteria or modified existing criteria, such as InterQual or Milliman, to determine observation status admissions. In addition to these criteria, 11 hospitals required a physician order for admission to observation status. Twenty‐four hospitals indicated that policies were in place to change patient status from observation to inpatient, or inpatient to observation, typically through processes of utilization review and application of criteria listed above.
Most hospitals indicated that they faced substantial variation in the standards used from one payer to another when considering reimbursement for care delivered under observation status. Hospitals noted that duration‐of‐carebased reimbursement practices included hourly rates, per diem, and reimbursement for only the first 24 or 48 hours of observation care. Hospitals identified that payers variably determined reimbursement for observation based on InterQual level of care criteria and Milliman care guidelines. One hospital reported that it was not their practice to bill for the observation bed.
Survey 2: Understanding Observation Patient Type Administrative Data Following ED Care Within PHIS Hospitals
Of the 20 hospitals responding to Survey 2, there were 2 hospitals that did not apply observation status to patients after ED care and 2 hospitals that did not provide complete responses. The remaining 16 hospitals provided information regarding observation status as applied to patients after receiving treatment in the ED. The settings available for observation care and patient groups treated within each area are presented in Table 2. In addition to the patient groups listed in Table 2, there were 4 hospitals where patients could be admitted to observation status directly from an outpatient clinic. All responding hospitals provided virtual observation care (ie, observation status is assigned but the patient is cared for in the existing ED or inpatient ward). Nine hospitals also provided observation care within a dedicated ED or ward‐based OU (ie, a separate clinical area in which observation patients are treated).
| Hospital No. | Available Observation Settings | Patient Groups Under Observation in Each Setting | UR to Assign Obs Status | When Obs Status Is Assigned | ||
|---|---|---|---|---|---|---|
| ED | Post‐Op | Test/Treat | ||||
| ||||||
| 1 | Virtual inpatient | X | X | X | Yes | Discharge |
| Ward‐based OU | X | X | No | |||
| 2 | Virtual inpatient | X | X | Yes | Admission | |
| Ward‐based OU | X | X | X | No | ||
| 3 | Virtual inpatient | X | X | X | Yes | Discharge |
| Ward‐based OU | X | X | X | Yes | ||
| ED OU | X | Yes | ||||
| Virtual ED | X | Yes | ||||
| 4 | Virtual inpatient | X | X | X | Yes | Discharge |
| ED OU | X | No | ||||
| Virtual ED | X | No | ||||
| 5 | Virtual inpatient | X | X | X | N/A | Discharge |
| 6 | Virtual inpatient | X | X | X | Yes | Discharge |
| 7 | Virtual inpatient | X | X | Yes | No response | |
| Ward‐based OU | X | Yes | ||||
| Virtual ED | X | Yes | ||||
| 8 | Virtual inpatient | X | X | X | Yes | Admission |
| 9 | Virtual inpatient | X | X | Yes | Discharge | |
| ED OU | X | Yes | ||||
| Virtual ED | X | Yes | ||||
| 10 | Virtual inpatient | X | X | X | Yes | Admission |
| ED OU | X | Yes | ||||
| 11 | Virtual inpatient | X | X | Yes | Discharge | |
| Ward‐based OU | X | X | Yes | |||
| ED OU | X | Yes | ||||
| Virtual ED | X | Yes | ||||
| 12 | Virtual inpatient | X | X | X | Yes | Admission |
| 13 | Virtual inpatient | X | X | N/A | Discharge | |
| Virtual ED | X | N/A | ||||
| 14 | Virtual inpatient | X | X | X | Yes | Both |
| 15 | Virtual inpatient | X | X | Yes | Admission | |
| Ward‐based OU | X | X | Yes | |||
| 16 | Virtual inpatient | X | Yes | Admission | ||
When asked to identify differences between clinical care delivered to patients admitted under virtual observation and those admitted under inpatient status, 14 of 16 hospitals selected the option There are no differences in the care delivery of these patients. The differences identified by 2 hospitals included patient care orders, treatment protocols, and physician documentation. Within the hospitals that reported utilization of virtual ED observation, 2 reported differences in care compared with other ED patients, including patient care orders, physician rounds, documentation, and discharge process. When admitted patients were boarded in the ED while awaiting an inpatient bed, 11 of 16 hospitals allowed for observation or inpatient level of care to be provided in the ED. Fourteen hospitals allow an admitted patient to be discharged home from boarding in the ED without ever receiving care in an inpatient bed. The discharge decision was made by ED providers in 7 hospitals, and inpatient providers in the other 7 hospitals.
Responses to questions providing detailed information on the process of utilization review were provided by 12 hospitals. Among this subset of hospitals, utilization review was consistently used to assign virtual inpatient observation status and was applied at admission (n = 6) or discharge (n = 8), depending on the hospital. One hospital applied observation status at both admission and discharge; 1 hospital did not provide a response. Responses to questions regarding utilization review are presented in Table 3.
| Survey Question | Yes N (%) | No N (%) |
|---|---|---|
| Preadmission utilization review is conducted at my hospital. | 3 (25) | 9 (75) |
| Utilization review occurs daily at my hospital. | 10 (83) | 2 (17) |
| A nonclinician can initiate an order for observation status. | 4 (33) | 8 (67) |
| Status can be changed after the patient has been discharged. | 10 (83) | 2 (17) |
| Inpatient status would always be assigned to a patient who receives less than 24 hours of care and meets inpatient criteria. | 9 (75) | 3 (25) |
| The same status would be assigned to different patients who received the same treatment of the same duration but have different payers. | 6 (50) | 6 (50) |
DISCUSSION
This is the largest descriptive study of pediatric observation status practices in US freestanding children's hospitals and, to our knowledge, the first to include information about both the ED and inpatient treatment environments. There are two important findings of this study. First, designated OUs were uncommon among the group of freestanding children's hospitals that reported observation patient data to PHIS in 2010. Second, despite the fact that hospitals reported observation care was delivered in a variety of settings, virtual inpatient observation status was nearly ubiquitous. Among the subset of hospitals that provided information about the clinical care delivered to patients admitted under virtual inpatient observation, hospitals frequently reported there were no differences in the care delivered to observation patients when compared with other inpatients.
The results of our survey indicate that designated OUs are not a commonly available model of observation care in the study hospitals. In fact, the vast majority of the hospitals used virtual inpatient observation care, which did not differ from the care delivered to a child admitted as an inpatient. ED‐based OUs, which often provide operationally and physically distinct care to observation patients, have been touted as cost‐effective alternatives to inpatient care,1820 resulting in fewer admissions and reductions in length of stay19, 20 without a resultant increase in return ED‐visits or readmissions.2123 Research is needed to determine the patient‐level outcomes for short‐stay patients in the variety of available treatment settings (eg, physically or operationally distinct OUs and virtual observation), and to evaluate these outcomes in comparison to results published from designated OUs. The operationally and physically distinct features of a designated OU may be required to realize the benefits of observation attributed to individual patients.
While observation care has been historically provided by emergency physicians, there is increasing interest in the role of inpatient providers in observation care.9 According to our survey, children were admitted to observation status directly from clinics, following surgical procedures, scheduled tests and treatment, or after evaluation and treatment in the ED. As many of these children undergo virtual observation in inpatient areas, the role of inpatient providers, such as pediatric hospitalists, in observation care may be an important area for future study, education, and professional development. Novel models of care, with hospitalists collaborating with emergency physicians, may be of benefit to the children who require observation following initial stabilization and treatment in the ED.24, 25
We identified variation between hospitals in the methods used to assign observation status to an episode of care, including a wide range of length of stay criteria and different approaches to utilization review. In addition, the criteria payers use to reimburse for observation varied between payers, even within individual hospitals. The results of our survey may be driven by issues of reimbursement and not based on a model of optimizing patient care outcomes using designated OUs. Variations in reimbursement may limit hospital efforts to refine models of observation care for children. Designated OUs have been suggested as a method for improving ED patient flow,26 increasing inpatient capacity,27 and reducing costs of care.28 Standardization of observation status criteria and consistent reimbursement for observation services may be necessary for hospitals to develop operationally and physically distinct OUs, which may be essential to achieving the proposed benefits of observation medicine on costs of care, patient flow, and hospital capacity.
LIMITATIONS
Our study results should be interpreted with the following limitations in mind. First, the surveys were distributed only to freestanding children's hospitals who participate in PHIS. As a result, our findings may not be generalizable to the experiences of other children's hospitals or general hospitals caring for children. Questions in Survey 2 were focused on understanding observation care, delivered to patients following ED care, which may differ from observation practices related to a direct admission or following scheduled procedures, tests, or treatments. It is important to note that, hospitals that do not report observation status patient data to PHIS are still providing care to children with acute conditions that respond to brief periods of hospital treatment, even though it is not labeled observation. However, it was beyond the scope of this study to characterize the care delivered to all patients who experience a short stay.
The second main limitation of our study is the lower response rate to Survey 2. In addition, several surveys contained incomplete responses which further limits our sample size for some questions, specifically those related to utilization review. The lower response to Survey 2 could be related to the timing of the distribution of the 2 surveys, or to the information contained in the introductory e‐mail describing Survey 2. Hospitals with designated observation units, or where observation status care has been receiving attention, may have been more likely to respond to our survey, which may bias our results to reflect the experiences of hospitals experiencing particular successes or challenges with observation status care. A comparison of known hospital characteristics revealed no differences between hospitals that did and did not provide responses to Survey 2, but other unmeasured differences may exist.
CONCLUSION
Observation status is assigned using duration of treatment, clinical care guidelines, and level of care criteria, and is defined differently by individual hospitals and payers. Currently, the most widely available setting for pediatric observation status is within a virtual inpatient unit. Our results suggest that the care delivered to observation patients in virtual inpatient units is consistent with care provided to other inpatients. As such, observation status is largely an administrative/billing designation, which does not appear to reflect differences in clinical care. A consistent approach to the assignment of patients to observation status, and treatment of patients under observation among hospitals and payers, may be necessary to compare quality outcomes. Studies of the clinical care delivery and processes of care for short‐stay patients are needed to optimize models of pediatric observation care.
- .Observation medicine: the healthcare system's tincture of time. In: Graff LG, ed.Principles of Observation Medicine.Dallas, TX:American College of Emergency Physicians;2010. Available at: http://www.acep.org/content.aspx?id=46142. Accessed February 18,year="2011"2011.
- .Hospital ‘observation’ status a matter of billing.The Columbus Dispatch. February 14,2011.
- .Hospital payments downgraded.Philadelphia Business Journal. February 18,2011.
- .Medicare rules give full hospital benefits only to those with ‘inpatient’ status.The Washington Post. September 7,2010.
- .Hospitals caught between a rock and a hard place over observation.Health Leaders Media. September 15,2010.
- .AHA: observation status fears on the rise.Health Leaders Media. October 29,2010.
- .Put your hospital bill under a microscope.The New York Times. September 13,2010.
- Medicare Hospital Manual Section 455.Washington, DC:Department of Health and Human Services, Centers for Medicare and Medicaid Services;2001.
- ,,,,.The Observation Unit: An Operational Overview for the Hospitalist. Society of Hospital Medicine White Paper. May 21, 2009. Available at: http://www.hospitalmedicine.org/Content/NavigationMenu/Publications/White Papers/White_Papers.htm. Accessed May 21,2009.
- ,,,,.Utilization and unexpected hospitalization rates of a pediatric emergency department 23‐hour observation unit.Pediatr Emerg Care.2008;24(9):589–594.
- ,,.The pediatric hybrid observation unit: an analysis of 6477 consecutive patient encounters.Pediatrics.2005;115(5):e535–e542.
- ,,,,.Pediatric observation units in the United States: a systematic review.J Hosp Med.2010;5(3):172–182.
- ,,.Pediatric emergency department directors' benchmarking survey: fiscal year 2001.Pediatr Emerg Care.2003;19(3):143–147.
- ,,,.Pediatric observation status beds on an inpatient unit: an integrated care model.Pediatr Emerg Care.2004;20(1):17–21.
- ,,,.Impact of a short stay unit on asthma patients admitted to a tertiary pediatric hospital.Qual Manag Health Care.1997;6(1):14–22.
- ,,,.A national survey of observation units in the United States.Am J Emerg Med.2003;21(7):529–533.
- ,,,.A survey of observation units in the United States.Am J Emerg Med.1989;7(6):576–580.
- ,,.When the patient requires observation not hospitalization.J Nurs Admin.1988;18(10):20–23.
- ,,.A reduction in hospitalization, length of stay, and hospital charges for croup with the institution of a pediatric observation unit.Am J Emerg Med.2006;24(7):818–821.
- ,,.Outpatient oral rehydration in the United States.Am J Dis Child.1986;140(3):211–215.
- ,,,,.Pediatric closed head injuries treated in an observation unit.Pediatr Emerg Care.2005;21(10):639–644.
- ,,,.Use of pediatric observation unit for treatment of children with dehydration caused by gastroenteritis.Pediatr Emerg Care.2006;22(1):1–6.
- ,,,.Children with asthma admitted to a pediatric observation unit.Pediatr Emerg Care.2005;21(10):645–649.
- ,,,.Redefining the community pediatric hospitalist: the combined pediatric ED/inpatient unit.Pediatr Emerg Care.2007;23(1):33–37.
- ,,,.Program description: a hospitalist‐run, medical short‐stay unit in a teaching hospital.Can Med Assoc J.2000;163(11):1477–1480.
- ,.Impact of an observation unit and an emergency department‐admitted patient transfer mandate in decreasing overcrowding in a pediatric emergency department: a discrete event simulation exercise.Pediatr Emerg Care.2009;25(3):160–163.
- ,,, et al.Children's hospitals do not acutely respond to high occupancy.Pediatrics.125(5):974–981.
- ,,,,,.Trends in high‐turnover stays among children hospitalized in the United States, 1993‐2003.Pediatrics.2009;123(3):996–1002.
Copyright © 2011 Society of Hospital Medicine
