User login
On Decreasing Utilization: Models of Care for Frequently Hospitalized Patients and Their Effect on Outcomes
In this month’s edition of the Journal of Hospital Medicine, Goodwin and colleagues report their findings from their systematic review of models of care for frequently hospitalized patients. The authors reviewed the literature for interventions to reduce hospital admissions in frequently hospitalized patients with the goal of assessing the success of the interventions. This report contributes to the literature base of interventions to reduce healthcare utilization, particularly in the area of inpatient hospitalization.1
Goodwin et al. report that only nine studies met their criteria for review after a thorough search of the published literature. Of these nine studies, only four were determined to be high-quality studies. Interestingly, the low-quality studies found positive results in reducing hospital utilization, whereas the high-quality studies found decreases that were mirrored by their control groups. Impressive heterogeneity was found in the range of definitions, interventions, and outcome measures in the studies. These studies highlight the issue of “regression to the mean” for sicker individuals; however, they may not address readmission rates of specific medical systems or procedures that are also cost drivers, even if the patients are not considered critically ill. They also show where research partnerships can assist in increasing the number of members included in the studies for robust analyses.
From the perspective of a health plan, we applaud all efforts to improve patient outcomes and reduce cost. This report states that efforts to reduce chronic hospitalizations have not been unqualified successes. We must reflect upon how reducing utilization and improving outcomes align with our overall goals as a society. Recently, Federal Reserve Chairman Jay Powell summed up our nation’s particular issue, stating, “It is widely understood that the United States is on an unsustainable fiscal path, largely due to the interaction between an aging population and a healthcare system that delivers pretty average healthcare at a cost that is much higher than that of any other advanced economy.”2
A recent Kaiser Family Foundation analysis showed that 1% of patients accounted for 23% of all medical spending in the United States, and 97% of medical spending is attributed to the top 50% of patients.3 Pharmaceutical costs also play a role in this trend. Blue Cross and Blue Shield of Texas (BCBSTX) found that 2.5% of our population accounted for just under 50% of total medical spending. Conversely, when looking at patients with very high costs, only 0.4% had over $100,000 in spending exclusive of pharmacy. When including pharmacy, that number rises to 0.5%. As we consider annual medical and pharmacy trends year over year, we find that pharmacy spending may outpace hospital expenses in the near future.
Our internal data are also consistent with published reports that fewer than half of high-cost patients in one year continue to be high-cost cases the following year. Niall Brennan et al. reported that only 39% of the top 5% of spenders in a given year are also high spenders the following year.4 This finding not only coincides with the author’s statement around regression to the mean for the high admission utilizers, but it may be instructive to those looking to a Pareto method of attacking cost. If more than half of targeted patients will move out of the high cost category on their own, then demonstrating the effectiveness of interventions becomes challenging. Moreover, this regression finding speaks to the need to create effective programs to manage population health on a broad basis, which can address quality to all members and streamline costs for a large group that covers well more than 50% of medical spending.
BCBSTX emphasizes the creation of systems that let providers become responsible and accountable to outcomes and cost. Accountable Care Organizations (ACOs) and Intensive Medical Homes (IMHs) have played important roles in this journey, but physicians need to continue to invent and prioritize interventions that may achieve both goals. In particular, hospitalists have an important role to play. As ACOs flourish, hospitalists will need to join under the value-based umbrella and continue to intervene in patient care, policies, and procedures to reduce avoidable hospitalizations.
The development of value-based arrangements offers the healthcare system a unique opportunity to bring much-needed change. In our medical partnerships, direct communication with providers regarding their member experience and sharing of vital information about their patients’ health status have helped improve patient outcomes and decrease cost. Our IMH partnerships show a savings of up to $45,000 per member per year driven by decreases in admissions and ER visits, and in some cases, expensive medications. The hard work in these successes lies within the subtleties of fostering the relationship between payers and providers. Each pillar within the ecosystem plays a key role offering strengths, but the upside toward change comes in how we support each other’s weaknesses. This support is manifested in two ways: collaboration through communication and transparency through data sharing.
The road to change is one less traveled but not unpaved; advances in technology allow us to take experiences and build from them. At its core, technology has enhanced our collaboration and data capabilities. The ability to stay in touch with providers allows for almost real-time addressing of issues, promoting efficiency. The connection we have with providers has evolved from being solely paper contracts to a multichannel, multifunctional system. The ability to take claims experience, insert clinical acumen, and perform data analysis brings actionable solutions to be executed by our providers.
Those in the healthcare system will need to come together to continue to create interventions that improve quality while decreasing costs. The second part may require even more work than the first. The Health Care Cost Institute recently published data showing that inpatient utilization over a five-year period fell 12.9% in the commercially insured.5 However, over that same period, hospital prices for inpatient care rose 24.3%. The fundamental reason for the excess amount of money spent in US healthcare is that the prices are incredibly high.6 Currently, when diligence is exercised in reducing utilization, hospitals simply raise prices as a response to compensate for the lost income. Likewise, although prescription drug utilization only increased 1.8% during that period, the prices increased by 24.9%.
For the United States healthcare system to improve its quality and reduce its cost, we will need inventive partnerships to continue to create new systems to interact with patients in the most efficient and effective way possible. Readmissions and hospital utilization will be a large part of that improvement. Hospitals and hospitalists should ensure that they continue to focus on making healthcare more affordable by improving efficiency and outcomes and by resisting the tendencies of hospitals and pharmaceutical companies to raise prices in reaction to the improved efficiency.
Disclosures
The authors have nothing to disclose.
1. Goodwin A, Henschen BL, O’Dwyer LC, Nichols N, O’Leary KJ. Interventions for Frequently Hospitalized Patients and their Effect on Outcomes: A Systematic Review. J Hosp Med. 2018; 13(12):853-859. doi: 10.12788/jhm.3089. PubMed
2. Marketplace. Fed Chair Jay Powel. https://www.marketplace.org/2018/07/12/economy/powell-transcript. Accessed August 3, 2018.
3. Health System Tracker. https://www.healthsystemtracker.org/chart-collection/health-expenditures-vary-across-population/#item-start%2012/01/2017. Accessed August 3, 2018.
4. NEJM Catalyst. Consistently High Turnover in the Group of Top Health Care Spenders. https://catalyst.nejm.org/high-turnover-top-health-care-spenders/. Accessed August 3, 2018.
5. Health Care Cost Institute. 2016 Health Care Cost and Utilization Report. http://www.healthcostinstitute.org/report/2016-health-care-cost-utilization-report/. Accessed August 3, 2018.
6. Anderson GF, Reinhardt UE, Hussey PS, Peterosyan V. It’s the prices, stupid: why the United States is so different from other countries. Health Aff (Millwood). 2003;22(3):89-105. doi: 10.1377/hlthaff.22.3.89. PubMed
In this month’s edition of the Journal of Hospital Medicine, Goodwin and colleagues report their findings from their systematic review of models of care for frequently hospitalized patients. The authors reviewed the literature for interventions to reduce hospital admissions in frequently hospitalized patients with the goal of assessing the success of the interventions. This report contributes to the literature base of interventions to reduce healthcare utilization, particularly in the area of inpatient hospitalization.1
Goodwin et al. report that only nine studies met their criteria for review after a thorough search of the published literature. Of these nine studies, only four were determined to be high-quality studies. Interestingly, the low-quality studies found positive results in reducing hospital utilization, whereas the high-quality studies found decreases that were mirrored by their control groups. Impressive heterogeneity was found in the range of definitions, interventions, and outcome measures in the studies. These studies highlight the issue of “regression to the mean” for sicker individuals; however, they may not address readmission rates of specific medical systems or procedures that are also cost drivers, even if the patients are not considered critically ill. They also show where research partnerships can assist in increasing the number of members included in the studies for robust analyses.
From the perspective of a health plan, we applaud all efforts to improve patient outcomes and reduce cost. This report states that efforts to reduce chronic hospitalizations have not been unqualified successes. We must reflect upon how reducing utilization and improving outcomes align with our overall goals as a society. Recently, Federal Reserve Chairman Jay Powell summed up our nation’s particular issue, stating, “It is widely understood that the United States is on an unsustainable fiscal path, largely due to the interaction between an aging population and a healthcare system that delivers pretty average healthcare at a cost that is much higher than that of any other advanced economy.”2
A recent Kaiser Family Foundation analysis showed that 1% of patients accounted for 23% of all medical spending in the United States, and 97% of medical spending is attributed to the top 50% of patients.3 Pharmaceutical costs also play a role in this trend. Blue Cross and Blue Shield of Texas (BCBSTX) found that 2.5% of our population accounted for just under 50% of total medical spending. Conversely, when looking at patients with very high costs, only 0.4% had over $100,000 in spending exclusive of pharmacy. When including pharmacy, that number rises to 0.5%. As we consider annual medical and pharmacy trends year over year, we find that pharmacy spending may outpace hospital expenses in the near future.
Our internal data are also consistent with published reports that fewer than half of high-cost patients in one year continue to be high-cost cases the following year. Niall Brennan et al. reported that only 39% of the top 5% of spenders in a given year are also high spenders the following year.4 This finding not only coincides with the author’s statement around regression to the mean for the high admission utilizers, but it may be instructive to those looking to a Pareto method of attacking cost. If more than half of targeted patients will move out of the high cost category on their own, then demonstrating the effectiveness of interventions becomes challenging. Moreover, this regression finding speaks to the need to create effective programs to manage population health on a broad basis, which can address quality to all members and streamline costs for a large group that covers well more than 50% of medical spending.
BCBSTX emphasizes the creation of systems that let providers become responsible and accountable to outcomes and cost. Accountable Care Organizations (ACOs) and Intensive Medical Homes (IMHs) have played important roles in this journey, but physicians need to continue to invent and prioritize interventions that may achieve both goals. In particular, hospitalists have an important role to play. As ACOs flourish, hospitalists will need to join under the value-based umbrella and continue to intervene in patient care, policies, and procedures to reduce avoidable hospitalizations.
The development of value-based arrangements offers the healthcare system a unique opportunity to bring much-needed change. In our medical partnerships, direct communication with providers regarding their member experience and sharing of vital information about their patients’ health status have helped improve patient outcomes and decrease cost. Our IMH partnerships show a savings of up to $45,000 per member per year driven by decreases in admissions and ER visits, and in some cases, expensive medications. The hard work in these successes lies within the subtleties of fostering the relationship between payers and providers. Each pillar within the ecosystem plays a key role offering strengths, but the upside toward change comes in how we support each other’s weaknesses. This support is manifested in two ways: collaboration through communication and transparency through data sharing.
The road to change is one less traveled but not unpaved; advances in technology allow us to take experiences and build from them. At its core, technology has enhanced our collaboration and data capabilities. The ability to stay in touch with providers allows for almost real-time addressing of issues, promoting efficiency. The connection we have with providers has evolved from being solely paper contracts to a multichannel, multifunctional system. The ability to take claims experience, insert clinical acumen, and perform data analysis brings actionable solutions to be executed by our providers.
Those in the healthcare system will need to come together to continue to create interventions that improve quality while decreasing costs. The second part may require even more work than the first. The Health Care Cost Institute recently published data showing that inpatient utilization over a five-year period fell 12.9% in the commercially insured.5 However, over that same period, hospital prices for inpatient care rose 24.3%. The fundamental reason for the excess amount of money spent in US healthcare is that the prices are incredibly high.6 Currently, when diligence is exercised in reducing utilization, hospitals simply raise prices as a response to compensate for the lost income. Likewise, although prescription drug utilization only increased 1.8% during that period, the prices increased by 24.9%.
For the United States healthcare system to improve its quality and reduce its cost, we will need inventive partnerships to continue to create new systems to interact with patients in the most efficient and effective way possible. Readmissions and hospital utilization will be a large part of that improvement. Hospitals and hospitalists should ensure that they continue to focus on making healthcare more affordable by improving efficiency and outcomes and by resisting the tendencies of hospitals and pharmaceutical companies to raise prices in reaction to the improved efficiency.
Disclosures
The authors have nothing to disclose.
1. Goodwin A, Henschen BL, O’Dwyer LC, Nichols N, O’Leary KJ. Interventions for Frequently Hospitalized Patients and their Effect on Outcomes: A Systematic Review. J Hosp Med. 2018; 13(12):853-859. doi: 10.12788/jhm.3089. PubMed
2. Marketplace. Fed Chair Jay Powel. https://www.marketplace.org/2018/07/12/economy/powell-transcript. Accessed August 3, 2018.
3. Health System Tracker. https://www.healthsystemtracker.org/chart-collection/health-expenditures-vary-across-population/#item-start%2012/01/2017. Accessed August 3, 2018.
4. NEJM Catalyst. Consistently High Turnover in the Group of Top Health Care Spenders. https://catalyst.nejm.org/high-turnover-top-health-care-spenders/. Accessed August 3, 2018.
5. Health Care Cost Institute. 2016 Health Care Cost and Utilization Report. http://www.healthcostinstitute.org/report/2016-health-care-cost-utilization-report/. Accessed August 3, 2018.
6. Anderson GF, Reinhardt UE, Hussey PS, Peterosyan V. It’s the prices, stupid: why the United States is so different from other countries. Health Aff (Millwood). 2003;22(3):89-105. doi: 10.1377/hlthaff.22.3.89. PubMed
© 2018 Society of Hospital Medicine
OUs and Patient Outcomes
Many pediatric hospitalizations are of short duration, and more than half of short‐stay hospitalizations are designated as observation status.[1, 2] Observation status is an administrative label assigned to patients who do not meet hospital or payer criteria for inpatient‐status care. Short‐stay observation‐status patients do not fit in traditional models of emergency department (ED) or inpatient care. EDs often focus on discharging or admitting patients within a matter of hours, whereas inpatient units tend to measure length of stay (LOS) in terms of days[3] and may not have systems in place to facilitate rapid discharge of short‐stay patients.[4] Observation units (OUs) have been established in some hospitals to address the unique care needs of short‐stay patients.[5, 6, 7]
Single‐site reports from children's hospitals with successful OUs have demonstrated shorter LOS and lower costs compared with inpatient settings.[6, 8, 9, 10, 11, 12, 13, 14] No prior study has examined hospital‐level effects of an OU on observation‐status patient outcomes. The Pediatric Health Information System (PHIS) database provides a unique opportunity to explore this question, because unlike other national hospital administrative databases,[15, 16] the PHIS dataset contains information about children under observation status. In addition, we know which PHIS hospitals had a dedicated OU in 2011.7
We hypothesized that overall observation‐status stays in hospitals with a dedicated OU would be of shorter duration with earlier discharges at lower cost than observation‐status stays in hospitals without a dedicated OU. We compared hospitals with and without a dedicated OU on secondary outcomes including rates of conversion to inpatient status and return care for any reason.
METHODS
We conducted a cross‐sectional analysis of hospital administrative data using the 2011 PHIS databasea national administrative database that contains resource utilization data from 43 participating hospitals located in 26 states plus the District of Columbia. These hospitals account for approximately 20% of pediatric hospitalizations in the United States.
For each hospital encounter, PHIS includes patient demographics, up to 41 International Classification of Diseases, Ninth Revision, Clinical Modification (ICD‐9‐CM) diagnoses, up to 41 ICD‐9‐CM procedures, and hospital charges for services. Data are deidentified prior to inclusion, but unique identifiers allow for determination of return visits and readmissions following an index visit for an individual patient. Data quality and reliability are assured jointly by the Children's Hospital Association (formerly Child Health Corporation of America, Overland Park, KS), participating hospitals, and Truven Health Analytics (New York, NY). This study, using administrative data, was not considered human subjects research by the policies of the Cincinnati Children's Hospital Medical Center Institutional Review Board.
Hospital Selection and Hospital Characteristics
The study sample was drawn from the 31 hospitals that reported observation‐status patient data to PHIS in 2011. Analyses were conducted in 2013, at which time 2011 was the most recent year of data. We categorized 14 hospitals as having a dedicated OU during 2011 based on information collected in 2013.7 To summarize briefly, we interviewed by telephone representatives of hospitals responding to an email query as to the presence of a geographically distinct OU for the care of unscheduled patients from the ED. Three of the 14 representatives reported their hospital had 2 OUs, 1 of which was a separate surgical OU. Ten OUs cared for both ED patients and patients with scheduled procedures; 8 units received patients from non‐ED sources. Hospitalists provided staffing in more than half of the OUs.
We attempted to identify administrative data that would signal care delivered in a dedicated OU using hospital charge codes reported to PHIS, but learned this was not possible due to between‐hospital variation in the specificity of the charge codes. Therefore, we were unable to determine if patient care was delivered in a dedicated OU or another setting, such as a general inpatient unit or the ED. Other hospital characteristics available from the PHIS dataset included the number of inpatient beds, ED visits, inpatient admissions, observation‐status stays, and payer mix. We calculated the percentage of ED visits resulting in admission by dividing the number of ED visits with associated inpatient or observation status by the total number of ED visits and the percentage of admissions under observation status by dividing the number of observation‐status stays by the total number of admissions under observation or inpatient status.
Visit Selection and Patient Characteristics
All observation‐status stays regardless of the point of entry into the hospital were eligible for this study. We excluded stays that were birth‐related, included intensive care, or resulted in transfer or death. Patient demographic characteristics used to describe the cohort included age, gender, race/ethnicity, and primary payer. Stays that began in the ED were identified by an emergency room charge within PHIS. Eligible stays were categorized using All Patient Refined Diagnosis Related Groups (APR‐DRGs) version 24 using the ICD‐9‐CM code‐based proprietary 3M software (3M Health Information Systems, St. Paul, MN). We determined the 15 top‐ranking APR‐DRGs among observation‐status stays in hospitals with a dedicated OU and hospitals without. Procedural stays were identified based on procedural APR‐DRGs (eg, tonsil and adenoid procedures) or the presence of an ICD‐9‐CM procedure code (eg, 331 spinal tap).
Measured Outcomes
Outcomes of observation‐status stays were determined within 4 categories: (1) LOS, (2) standardized costs, (3) conversion to inpatient status, and (4) return visits and readmissions. LOS was calculated in terms of nights spent in hospital for all stays by subtracting the discharge date from the admission date and in terms of hours for stays in the 28 hospitals that report admission and discharge hour to the PHIS database. Discharge timing was examined in 4, 6‐hour blocks starting at midnight. Standardized costs were derived from a charge master index that was created by taking the median costs from all PHIS hospitals for each charged service.[17] Standardized costs represent the estimated cost of providing any particular clinical activity but are not the cost to patients, nor do they represent the actual cost to any given hospital. This approach allows for cost comparisons across hospitals, without biases arising from using charges or from deriving costs using hospitals' ratios of costs to charges.[18] Conversion from observation to inpatient status was calculated by dividing the number of inpatient‐status stays with observation codes by the number of observation‐statusonly stays plus the number of inpatient‐status stays with observation codes. All‐cause 3‐day ED return visits and 30‐day readmissions to the same hospital were assessed using patient‐specific identifiers that allowed for tracking of ED return visits and readmissions following the index observation stay.
Data Analysis
Descriptive statistics were calculated for hospital and patient characteristics using medians and interquartile ranges (IQRs) for continuous factors and frequencies with percentages for categorical factors. Comparisons of these factors between hospitals with dedicated OUs and without were made using [2] and Wilcoxon rank sum tests as appropriate. Multivariable regression was performed using generalized linear mixed models treating hospital as a random effect and used patient age, the case‐mix index based on the APR‐DRG severity of illness, ED visit, and procedures associated with the index observation‐status stay. For continuous outcomes, we performed a log transformation on the outcome, confirmed the normality assumption, and back transformed the results. Sensitivity analyses were conducted to compare LOS, standardized costs, and conversation rates by hospital type for 10 of the 15 top‐ranking APR‐DRGs commonly cared for by pediatric hospitalists and to compare hospitals that reported the presence of an OU that was consistently open (24 hours per day, 7 days per week) and operating during the entire 2011 calendar year, and those without. Based on information gathered from the telephone interviews, hospitals with partially open OUs were similar to hospitals with continuously open OUs, such that they were included in our main analyses. All statistical analyses were performed using SAS version 9.3 (SAS Institute, Cary, NC). P values <0.05 were considered statistically significant.
RESULTS
Hospital Characteristics
Dedicated OUs were present in 14 of the 31 hospitals that reported observation‐status patient data to PHIS (Figure 1). Three of these hospitals had OUs that were open for 5 months or less in 2011; 1 unit opened, 1 unit closed, and 1 hospital operated a seasonal unit. The remaining 17 hospitals reported no OU that admitted unscheduled patients from the ED during 2011. Hospitals with a dedicated OU had more inpatient beds and higher median number of inpatient admissions than those without (Table 1). Hospitals were statistically similar in terms of total volume of ED visits, percentage of ED visits resulting in admission, total number of observation‐status stays, percentage of admissions under observation status, and payer mix.

| Overall, Median (IQR) | Hospitals With a Dedicated Observation Unit, Median (IQR) | Hospitals Without a Dedicated Observation Unit, Median (IQR) | P Value | |
|---|---|---|---|---|
| ||||
| No. of hospitals | 31 | 14 | 17 | |
| Total no. of inpatient beds | 273 (213311) | 304 (269425) | 246 (175293) | 0.006 |
| Total no. ED visits | 62971 (47,50497,723) | 87,892 (55,102117,119) | 53,151 (4750470,882) | 0.21 |
| ED visits resulting in admission, % | 13.1 (9.715.0) | 13.8 (10.5, 19.1) | 12.5 (9.714.5) | 0.31 |
| Total no. of inpatient admissions | 11,537 (9,26814,568) | 13,206 (11,32517,869) | 10,207 (8,64013,363) | 0.04 |
| Admissions under observation status, % | 25.7 (19.733.8) | 25.5 (21.431.4) | 26.0 (16.935.1) | 0.98 |
| Total no. of observation stays | 3,820 (27935672) | 4,850 (3,309 6,196) | 3,141 (2,3654,616) | 0.07 |
| Government payer, % | 60.2 (53.371.2) | 62.1 (54.9, 65.9) | 59.2 (53.373.7) | 0.89 |
Observation‐Status Patients by Hospital Type
In 2011, there were a total of 136,239 observation‐status stays69,983 (51.4%) within the 14 hospitals with a dedicated OU and 66,256 (48.6%) within the 17 hospitals without. Patient care originated in the ED for 57.8% observation‐status stays in hospitals with an OU compared with 53.0% of observation‐status stays in hospitals without (P<0.001). Compared with hospitals with a dedicated OU, those without a dedicated OU had higher percentages of observation‐status patients older than 12 years and non‐Hispanic and a higher percentage of observation‐status patients with private payer type (Table 2). The 15 top‐ranking APR‐DRGs accounted for roughly half of all observation‐status stays and were relatively consistent between hospitals with and without a dedicated OU (Table 3). Procedural care was frequently associated with observation‐status stays.
| Overall, No. (%) | Hospitals With a Dedicated Observation Unit, No. (%)* | Hospitals Without a Dedicated Observation Unit, No. (%) | P Value | |
|---|---|---|---|---|
| ||||
| Age | ||||
| <1 year | 23,845 (17.5) | 12,101 (17.3) | 11,744 (17.7) | <0.001 |
| 15 years | 53,405 (38.5) | 28,052 (40.1) | 24,353 (36.8) | |
| 612 years | 33,674 (24.7) | 17,215 (24.6) | 16,459 (24.8) | |
| 1318 years | 23,607 (17.3) | 11,472 (16.4) | 12,135 (18.3) | |
| >18 years | 2,708 (2) | 1,143 (1.6) | 1,565 (2.4) | |
| Gender | ||||
| Male | 76,142 (55.9) | 39,178 (56) | 36,964 (55.8) | 0.43 |
| Female | 60,025 (44.1) | 30,756 (44) | 29,269 (44.2) | |
| Race/ethnicity | ||||
| Non‐Hispanic white | 72,183 (53.0) | 30,653 (43.8) | 41,530 (62.7) | <0.001 |
| Non‐Hispanic black | 30,995 (22.8) | 16,314 (23.3) | 14,681 (22.2) | |
| Hispanic | 21,255 (15.6) | 16,583 (23.7) | 4,672 (7.1) | |
| Asian | 2,075 (1.5) | 1,313 (1.9) | 762 (1.2) | |
| Non‐Hispanic other | 9,731 (7.1) | 5,120 (7.3) | 4,611 (7.0) | |
| Payer | ||||
| Government | 68,725 (50.4) | 36,967 (52.8) | 31,758 (47.9) | <0.001 |
| Private | 48,416 (35.5) | 21,112 (30.2) | 27,304 (41.2) | |
| Other | 19,098 (14.0) | 11,904 (17) | 7,194 (10.9) | |
| Observation‐Status Patients in Hospitals With a Dedicated Observation Unit* | Observation‐Status Patients in Hospitals Without a Dedicated Observation Unit | ||||||||
|---|---|---|---|---|---|---|---|---|---|
| Rank | APR‐DRG | No. | % of All Observation Status Stays | % Began in ED | Rank | APR‐DRG | No. | % of All Observation Status Stays | % Began in ED |
| |||||||||
| 1 | Tonsil and adenoid procedures | 4,621 | 6.6 | 1.3 | 1 | Tonsil and adenoid procedures | 3,806 | 5.7 | 1.6 |
| 2 | Asthma | 4,246 | 6.1 | 85.3 | 2 | Asthma | 3,756 | 5.7 | 79.0 |
| 3 | Seizure | 3,516 | 5.0 | 52.0 | 3 | Seizure | 2,846 | 4.3 | 54.9 |
| 4 | Nonbacterial gastroenteritis | 3,286 | 4.7 | 85.8 | 4 | Upper respiratory infections | 2,733 | 4.1 | 69.6 |
| 5 | Bronchiolitis, RSV pneumonia | 3,093 | 4.4 | 78.5 | 5 | Nonbacterial gastroenteritis | 2,682 | 4.0 | 74.5 |
| 6 | Upper respiratory infections | 2,923 | 4.2 | 80.0 | 6 | Other digestive system diagnoses | 2,545 | 3.8 | 66.3 |
| 7 | Other digestive system diagnoses | 2,064 | 2.9 | 74.0 | 7 | Bronchiolitis, RSV pneumonia | 2,544 | 3.8 | 69.2 |
| 8 | Respiratory signs, symptoms, diagnoses | 2,052 | 2.9 | 81.6 | 8 | Shoulder and arm procedures | 1,862 | 2.8 | 72.6 |
| 9 | Other ENT/cranial/facial diagnoses | 1,684 | 2.4 | 43.6 | 9 | Appendectomy | 1,785 | 2.7 | 79.2 |
| 10 | Shoulder and arm procedures | 1,624 | 2.3 | 79.1 | 10 | Other ENT/cranial/facial diagnoses | 1,624 | 2.5 | 29.9 |
| 11 | Abdominal pain | 1,612 | 2.3 | 86.2 | 11 | Abdominal pain | 1,461 | 2.2 | 82.3 |
| 12 | Fever | 1,494 | 2.1 | 85.1 | 12 | Other factors influencing health status | 1,461 | 2.2 | 66.3 |
| 13 | Appendectomy | 1,465 | 2.1 | 66.4 | 13 | Cellulitis/other bacterial skin infections | 1,383 | 2.1 | 84.2 |
| 14 | Cellulitis/other bacterial skin infections | 1,393 | 2.0 | 86.4 | 14 | Respiratory signs, symptoms, diagnoses | 1,308 | 2.0 | 39.1 |
| 15 | Pneumonia NEC | 1,356 | 1.9 | 79.1 | 15 | Pneumonia NEC | 1,245 | 1.9 | 73.1 |
| Total | 36,429 | 52.0 | 57.8 | Total | 33,041 | 49.87 | 53.0 | ||
Outcomes of Observation‐Status Stays
A greater percentage of observation‐status stays in hospitals with a dedicated OU experienced a same‐day discharge (Table 4). In addition, a higher percentage of discharges occurred between midnight and 11 am in hospitals with a dedicated OU. However, overall risk‐adjusted LOS in hours (12.8 vs 12.2 hours, P=0.90) and risk‐adjusted total standardized costs ($2551 vs $2433, P=0.75) were similar between hospital types. These findings were consistent within the 1 APR‐DRGs commonly cared for by pediatric hospitalists (see Supporting Information, Appendix 1, in the online version of this article). Overall, conversion from observation to inpatient status was significantly higher in hospitals with a dedicated OU compared with hospitals without; however, this pattern was not consistent across the 10 APR‐DRGs commonly cared for by pediatric hospitalists (see Supporting Information, Appendix 1, in the online version of this article). Adjusted odds of 3‐day ED return visits and 30‐day readmissions were comparable between hospital groups.
| Observation‐Status Patients in Hospitals With a Dedicated Observation Unit | Observation‐Status Patients in Hospitals Without a Dedicated Observation Unit | P Value | |
|---|---|---|---|
| |||
| No. of hospitals | 14 | 17 | |
| Length of stay, h, median (IQR) | 12.8 (6.923.7) | 12.2 (721.3) | 0.90 |
| 0 midnights, no. (%) | 16,678 (23.8) | 14,648 (22.1) | <.001 |
| 1 midnight, no. (%) | 46,144 (65.9) | 44,559 (67.3) | |
| 2 midnights or more, no. (%) | 7,161 (10.2) | 7,049 (10.6) | |
| Discharge timing, no. (%) | |||
| Midnight5 am | 1,223 (1.9) | 408 (0.7) | <0.001 |
| 6 am11 am | 18,916 (29.3) | 15,914 (27.1) | |
| Noon5 pm | 32,699 (50.7) | 31,619 (53.9) | |
| 6 pm11 pm | 11,718 (18.2) | 10,718 (18.3) | |
| Total standardized costs, $, median (IQR) | 2,551.3 (2,053.93,169.1) | 2,433.4 (1,998.42,963) | 0.75 |
| Conversion to inpatient status | 11.06% | 9.63% | <0.01 |
| Return care, AOR (95% CI) | |||
| 3‐day ED return visit | 0.93 (0.77‐1.12) | Referent | 0.46 |
| 30‐day readmission | 0.88 (0.67‐1.15) | Referent | 0.36 |
We found similar results in sensitivity analyses comparing observation‐status stays in hospitals with a continuously open OU (open 24 hours per day, 7 days per week, for all of 2011 [n=10 hospitals]) to those without(see Supporting Information, Appendix 2, in the online version of this article). However, there were, on average, more observation‐status stays in hospitals with a continuously open OU (median 5605, IQR 42077089) than hospitals without (median 3309, IQR 26784616) (P=0.04). In contrast to our main results, conversion to inpatient status was lower in hospitals with a continuously open OU compared with hospitals without (8.52% vs 11.57%, P<0.01).
DISCUSSION
Counter to our hypothesis, we did not find hospital‐level differences in length of stay or costs for observation‐status patients cared for in hospitals with and without a dedicated OU, though hospitals with dedicated OUs did have more same‐day discharges and more morning discharges. The lack of observed differences in LOS and costs may reflect the fact that many children under observation status are treated throughout the hospital, even in facilities with a dedicated OU. Access to a dedicated OU is limited by factors including small numbers of OU beds and specific low acuity/low complexity OU admission criteria.[7] The inclusion of all children admitted under observation status in our analyses may have diluted any effect of dedicated OUs at the hospital level, but was necessary due to the inability to identify location of care for children admitted under observation status. Location of care is an important variable that should be incorporated into administrative databases to allow for comparative effectiveness research designs. Until such data are available, chart review at individual hospitals would be necessary to determine which patients received care in an OU.
We did find that discharges for observation‐status patients occurred earlier in the day in hospitals with a dedicated OU when compared with observation‐status patients in hospitals without a dedicated OU. In addition, the percentage of same‐day discharges was higher among observation‐status patients treated in hospitals with a dedicated OU. These differences may stem from policies and procedures that encourage rapid discharge in dedicated OUs, and those practices may affect other care areas. For example, OUs may enforce policies requiring family presence at the bedside or utilize staffing models where doctors and nurses are in frequent communication, both of which would facilitate discharge as soon as a patient no longer required hospital‐based care.[7] A retrospective chart review study design could be used to identify discharge processes and other key characteristics of highly performing OUs.
We found conflicting results in our main and sensitivity analyses related to conversion to inpatient status. Lower percentages of observation‐status patients converting to inpatient status indicates greater success in the delivery of observation care based on established performance metrics.[19] Lower rates of conversion to inpatient status may be the result of stricter admission criteria for some diagnosis and in hospitals with a continuously open dedicate OU, more refined processes for utilization review that allow for patients to be placed into the correct status (observation vs inpatient) at the time of admission, or efforts to educate providers about the designation of observation status.[7] It is also possible that fewer observation‐status patients convert to inpatient status in hospitals with a continuously open dedicated OU because such a change would require movement of the patient to an inpatient bed.
These analyses were more comprehensive than our prior studies[2, 20] in that we included both patients who were treated first in the ED and those who were not. In addition to the APR‐DRGs representative of conditions that have been successfully treated in ED‐based pediatric OUs (eg, asthma, seizures, gastroenteritis, cellulitis),[8, 9, 21, 22] we found observation‐status was commonly associated with procedural care. This population of patients may be relevant to hospitalists who staff OUs that provide both unscheduled and postprocedural care. The colocation of medical and postprocedural patients has been described by others[8, 23] and was reported to occur in over half of the OUs included in this study.[7] The extent to which postprocedure observation care is provided in general OUs staffed by hospitalists represents another opportunity for further study.
Hospitals face many considerations when determining if and how they will provide observation services to patients expected to experience short stays.[7] Some hospitals may be unable to justify an OU for all or part of the year based on the volume of admissions or the costs to staff an OU.[24, 25] Other hospitals may open an OU to promote patient flow and reduce ED crowding.[26] Hospitals may also be influenced by reimbursement policies related to observation‐status stays. Although we did not observe differences in overall payer mix, we did find higher percentages of observation‐status patients in hospitals with dedicated OUs to have public insurance. Although hospital contracts with payers around observation status patients are complex and beyond the scope of this analysis, it is possible that hospitals have established OUs because of increasingly stringent rules or criteria to meet inpatient status or experiences with high volumes of observation‐status patients covered by a particular payer. Nevertheless, the brief nature of many pediatric hospitalizations and the scarcity of pediatric OU beds must be considered in policy changes that result from national discussions about the appropriateness of inpatient stays shorter than 2 nights in duration.[27]
Limitations
The primary limitation to our analyses is the lack of ability to identify patients who were treated in a dedicated OU because few hospitals provided data to PHIS that allowed for the identification of the unit or location of care. Second, it is possible that some hospitals were misclassified as not having a dedicated OU based on our survey, which initially inquired about OUs that provided care to patients first treated in the ED. Therefore, OUs that exclusively care for postoperative patients or patients with scheduled treatments may be present in hospitals that we have labeled as not having a dedicated OU. This potential misclassification would bias our results toward finding no differences. Third, in any study of administrative data there is potential that diagnosis codes are incomplete or inaccurately capture the underlying reason for the episode of care. Fourth, the experiences of the free‐standing children's hospitals that contribute data to PHIS may not be generalizable to other hospitals that provide observation care to children. Finally, return care may be underestimated, as children could receive treatment at another hospital following discharge from a PHIS hospital. Care outside of PHIS hospitals would not be captured, but we do not expect this to differ for hospitals with and without dedicated OUs. It is possible that health information exchanges will permit more comprehensive analyses of care across different hospitals in the future.
CONCLUSION
Observation status patients are similar in hospitals with and without dedicated observation units that admit children from the ED. The presence of a dedicated OU appears to have an influence on same‐day and morning discharges across all observation‐status stays without impacting other hospital‐level outcomes. Inclusion of location of care (eg, geographically distinct dedicated OU vs general inpatient unit vs ED) in hospital administrative datasets would allow for meaningful comparisons of different models of care for short‐stay observation‐status patients.
Acknowledgements
The authors thank John P. Harding, MBA, FACHE, Children's Hospital of the King's Daughters, Norfolk, Virginia for his input on the study design.
Disclosures: Dr. Hall had full access to the data and takes responsibility for the integrity of the data and the accuracy of the data analysis. Internal funds from the Children's Hospital Association supported the conduct of this work. The authors have no financial relationships or conflicts of interest to disclose.
Many pediatric hospitalizations are of short duration, and more than half of short‐stay hospitalizations are designated as observation status.[1, 2] Observation status is an administrative label assigned to patients who do not meet hospital or payer criteria for inpatient‐status care. Short‐stay observation‐status patients do not fit in traditional models of emergency department (ED) or inpatient care. EDs often focus on discharging or admitting patients within a matter of hours, whereas inpatient units tend to measure length of stay (LOS) in terms of days[3] and may not have systems in place to facilitate rapid discharge of short‐stay patients.[4] Observation units (OUs) have been established in some hospitals to address the unique care needs of short‐stay patients.[5, 6, 7]
Single‐site reports from children's hospitals with successful OUs have demonstrated shorter LOS and lower costs compared with inpatient settings.[6, 8, 9, 10, 11, 12, 13, 14] No prior study has examined hospital‐level effects of an OU on observation‐status patient outcomes. The Pediatric Health Information System (PHIS) database provides a unique opportunity to explore this question, because unlike other national hospital administrative databases,[15, 16] the PHIS dataset contains information about children under observation status. In addition, we know which PHIS hospitals had a dedicated OU in 2011.7
We hypothesized that overall observation‐status stays in hospitals with a dedicated OU would be of shorter duration with earlier discharges at lower cost than observation‐status stays in hospitals without a dedicated OU. We compared hospitals with and without a dedicated OU on secondary outcomes including rates of conversion to inpatient status and return care for any reason.
METHODS
We conducted a cross‐sectional analysis of hospital administrative data using the 2011 PHIS databasea national administrative database that contains resource utilization data from 43 participating hospitals located in 26 states plus the District of Columbia. These hospitals account for approximately 20% of pediatric hospitalizations in the United States.
For each hospital encounter, PHIS includes patient demographics, up to 41 International Classification of Diseases, Ninth Revision, Clinical Modification (ICD‐9‐CM) diagnoses, up to 41 ICD‐9‐CM procedures, and hospital charges for services. Data are deidentified prior to inclusion, but unique identifiers allow for determination of return visits and readmissions following an index visit for an individual patient. Data quality and reliability are assured jointly by the Children's Hospital Association (formerly Child Health Corporation of America, Overland Park, KS), participating hospitals, and Truven Health Analytics (New York, NY). This study, using administrative data, was not considered human subjects research by the policies of the Cincinnati Children's Hospital Medical Center Institutional Review Board.
Hospital Selection and Hospital Characteristics
The study sample was drawn from the 31 hospitals that reported observation‐status patient data to PHIS in 2011. Analyses were conducted in 2013, at which time 2011 was the most recent year of data. We categorized 14 hospitals as having a dedicated OU during 2011 based on information collected in 2013.7 To summarize briefly, we interviewed by telephone representatives of hospitals responding to an email query as to the presence of a geographically distinct OU for the care of unscheduled patients from the ED. Three of the 14 representatives reported their hospital had 2 OUs, 1 of which was a separate surgical OU. Ten OUs cared for both ED patients and patients with scheduled procedures; 8 units received patients from non‐ED sources. Hospitalists provided staffing in more than half of the OUs.
We attempted to identify administrative data that would signal care delivered in a dedicated OU using hospital charge codes reported to PHIS, but learned this was not possible due to between‐hospital variation in the specificity of the charge codes. Therefore, we were unable to determine if patient care was delivered in a dedicated OU or another setting, such as a general inpatient unit or the ED. Other hospital characteristics available from the PHIS dataset included the number of inpatient beds, ED visits, inpatient admissions, observation‐status stays, and payer mix. We calculated the percentage of ED visits resulting in admission by dividing the number of ED visits with associated inpatient or observation status by the total number of ED visits and the percentage of admissions under observation status by dividing the number of observation‐status stays by the total number of admissions under observation or inpatient status.
Visit Selection and Patient Characteristics
All observation‐status stays regardless of the point of entry into the hospital were eligible for this study. We excluded stays that were birth‐related, included intensive care, or resulted in transfer or death. Patient demographic characteristics used to describe the cohort included age, gender, race/ethnicity, and primary payer. Stays that began in the ED were identified by an emergency room charge within PHIS. Eligible stays were categorized using All Patient Refined Diagnosis Related Groups (APR‐DRGs) version 24 using the ICD‐9‐CM code‐based proprietary 3M software (3M Health Information Systems, St. Paul, MN). We determined the 15 top‐ranking APR‐DRGs among observation‐status stays in hospitals with a dedicated OU and hospitals without. Procedural stays were identified based on procedural APR‐DRGs (eg, tonsil and adenoid procedures) or the presence of an ICD‐9‐CM procedure code (eg, 331 spinal tap).
Measured Outcomes
Outcomes of observation‐status stays were determined within 4 categories: (1) LOS, (2) standardized costs, (3) conversion to inpatient status, and (4) return visits and readmissions. LOS was calculated in terms of nights spent in hospital for all stays by subtracting the discharge date from the admission date and in terms of hours for stays in the 28 hospitals that report admission and discharge hour to the PHIS database. Discharge timing was examined in 4, 6‐hour blocks starting at midnight. Standardized costs were derived from a charge master index that was created by taking the median costs from all PHIS hospitals for each charged service.[17] Standardized costs represent the estimated cost of providing any particular clinical activity but are not the cost to patients, nor do they represent the actual cost to any given hospital. This approach allows for cost comparisons across hospitals, without biases arising from using charges or from deriving costs using hospitals' ratios of costs to charges.[18] Conversion from observation to inpatient status was calculated by dividing the number of inpatient‐status stays with observation codes by the number of observation‐statusonly stays plus the number of inpatient‐status stays with observation codes. All‐cause 3‐day ED return visits and 30‐day readmissions to the same hospital were assessed using patient‐specific identifiers that allowed for tracking of ED return visits and readmissions following the index observation stay.
Data Analysis
Descriptive statistics were calculated for hospital and patient characteristics using medians and interquartile ranges (IQRs) for continuous factors and frequencies with percentages for categorical factors. Comparisons of these factors between hospitals with dedicated OUs and without were made using [2] and Wilcoxon rank sum tests as appropriate. Multivariable regression was performed using generalized linear mixed models treating hospital as a random effect and used patient age, the case‐mix index based on the APR‐DRG severity of illness, ED visit, and procedures associated with the index observation‐status stay. For continuous outcomes, we performed a log transformation on the outcome, confirmed the normality assumption, and back transformed the results. Sensitivity analyses were conducted to compare LOS, standardized costs, and conversation rates by hospital type for 10 of the 15 top‐ranking APR‐DRGs commonly cared for by pediatric hospitalists and to compare hospitals that reported the presence of an OU that was consistently open (24 hours per day, 7 days per week) and operating during the entire 2011 calendar year, and those without. Based on information gathered from the telephone interviews, hospitals with partially open OUs were similar to hospitals with continuously open OUs, such that they were included in our main analyses. All statistical analyses were performed using SAS version 9.3 (SAS Institute, Cary, NC). P values <0.05 were considered statistically significant.
RESULTS
Hospital Characteristics
Dedicated OUs were present in 14 of the 31 hospitals that reported observation‐status patient data to PHIS (Figure 1). Three of these hospitals had OUs that were open for 5 months or less in 2011; 1 unit opened, 1 unit closed, and 1 hospital operated a seasonal unit. The remaining 17 hospitals reported no OU that admitted unscheduled patients from the ED during 2011. Hospitals with a dedicated OU had more inpatient beds and higher median number of inpatient admissions than those without (Table 1). Hospitals were statistically similar in terms of total volume of ED visits, percentage of ED visits resulting in admission, total number of observation‐status stays, percentage of admissions under observation status, and payer mix.
| Overall, Median (IQR) | Hospitals With a Dedicated Observation Unit, Median (IQR) | Hospitals Without a Dedicated Observation Unit, Median (IQR) | P Value | |
|---|---|---|---|---|
| ||||
| No. of hospitals | 31 | 14 | 17 | |
| Total no. of inpatient beds | 273 (213311) | 304 (269425) | 246 (175293) | 0.006 |
| Total no. ED visits | 62971 (47,50497,723) | 87,892 (55,102117,119) | 53,151 (4750470,882) | 0.21 |
| ED visits resulting in admission, % | 13.1 (9.715.0) | 13.8 (10.5, 19.1) | 12.5 (9.714.5) | 0.31 |
| Total no. of inpatient admissions | 11,537 (9,26814,568) | 13,206 (11,32517,869) | 10,207 (8,64013,363) | 0.04 |
| Admissions under observation status, % | 25.7 (19.733.8) | 25.5 (21.431.4) | 26.0 (16.935.1) | 0.98 |
| Total no. of observation stays | 3,820 (27935672) | 4,850 (3,309 6,196) | 3,141 (2,3654,616) | 0.07 |
| Government payer, % | 60.2 (53.371.2) | 62.1 (54.9, 65.9) | 59.2 (53.373.7) | 0.89 |
Observation‐Status Patients by Hospital Type
In 2011, there were a total of 136,239 observation‐status stays69,983 (51.4%) within the 14 hospitals with a dedicated OU and 66,256 (48.6%) within the 17 hospitals without. Patient care originated in the ED for 57.8% observation‐status stays in hospitals with an OU compared with 53.0% of observation‐status stays in hospitals without (P<0.001). Compared with hospitals with a dedicated OU, those without a dedicated OU had higher percentages of observation‐status patients older than 12 years and non‐Hispanic and a higher percentage of observation‐status patients with private payer type (Table 2). The 15 top‐ranking APR‐DRGs accounted for roughly half of all observation‐status stays and were relatively consistent between hospitals with and without a dedicated OU (Table 3). Procedural care was frequently associated with observation‐status stays.
| Overall, No. (%) | Hospitals With a Dedicated Observation Unit, No. (%)* | Hospitals Without a Dedicated Observation Unit, No. (%) | P Value | |
|---|---|---|---|---|
| ||||
| Age | ||||
| <1 year | 23,845 (17.5) | 12,101 (17.3) | 11,744 (17.7) | <0.001 |
| 15 years | 53,405 (38.5) | 28,052 (40.1) | 24,353 (36.8) | |
| 612 years | 33,674 (24.7) | 17,215 (24.6) | 16,459 (24.8) | |
| 1318 years | 23,607 (17.3) | 11,472 (16.4) | 12,135 (18.3) | |
| >18 years | 2,708 (2) | 1,143 (1.6) | 1,565 (2.4) | |
| Gender | ||||
| Male | 76,142 (55.9) | 39,178 (56) | 36,964 (55.8) | 0.43 |
| Female | 60,025 (44.1) | 30,756 (44) | 29,269 (44.2) | |
| Race/ethnicity | ||||
| Non‐Hispanic white | 72,183 (53.0) | 30,653 (43.8) | 41,530 (62.7) | <0.001 |
| Non‐Hispanic black | 30,995 (22.8) | 16,314 (23.3) | 14,681 (22.2) | |
| Hispanic | 21,255 (15.6) | 16,583 (23.7) | 4,672 (7.1) | |
| Asian | 2,075 (1.5) | 1,313 (1.9) | 762 (1.2) | |
| Non‐Hispanic other | 9,731 (7.1) | 5,120 (7.3) | 4,611 (7.0) | |
| Payer | ||||
| Government | 68,725 (50.4) | 36,967 (52.8) | 31,758 (47.9) | <0.001 |
| Private | 48,416 (35.5) | 21,112 (30.2) | 27,304 (41.2) | |
| Other | 19,098 (14.0) | 11,904 (17) | 7,194 (10.9) | |
| Observation‐Status Patients in Hospitals With a Dedicated Observation Unit* | Observation‐Status Patients in Hospitals Without a Dedicated Observation Unit | ||||||||
|---|---|---|---|---|---|---|---|---|---|
| Rank | APR‐DRG | No. | % of All Observation Status Stays | % Began in ED | Rank | APR‐DRG | No. | % of All Observation Status Stays | % Began in ED |
| |||||||||
| 1 | Tonsil and adenoid procedures | 4,621 | 6.6 | 1.3 | 1 | Tonsil and adenoid procedures | 3,806 | 5.7 | 1.6 |
| 2 | Asthma | 4,246 | 6.1 | 85.3 | 2 | Asthma | 3,756 | 5.7 | 79.0 |
| 3 | Seizure | 3,516 | 5.0 | 52.0 | 3 | Seizure | 2,846 | 4.3 | 54.9 |
| 4 | Nonbacterial gastroenteritis | 3,286 | 4.7 | 85.8 | 4 | Upper respiratory infections | 2,733 | 4.1 | 69.6 |
| 5 | Bronchiolitis, RSV pneumonia | 3,093 | 4.4 | 78.5 | 5 | Nonbacterial gastroenteritis | 2,682 | 4.0 | 74.5 |
| 6 | Upper respiratory infections | 2,923 | 4.2 | 80.0 | 6 | Other digestive system diagnoses | 2,545 | 3.8 | 66.3 |
| 7 | Other digestive system diagnoses | 2,064 | 2.9 | 74.0 | 7 | Bronchiolitis, RSV pneumonia | 2,544 | 3.8 | 69.2 |
| 8 | Respiratory signs, symptoms, diagnoses | 2,052 | 2.9 | 81.6 | 8 | Shoulder and arm procedures | 1,862 | 2.8 | 72.6 |
| 9 | Other ENT/cranial/facial diagnoses | 1,684 | 2.4 | 43.6 | 9 | Appendectomy | 1,785 | 2.7 | 79.2 |
| 10 | Shoulder and arm procedures | 1,624 | 2.3 | 79.1 | 10 | Other ENT/cranial/facial diagnoses | 1,624 | 2.5 | 29.9 |
| 11 | Abdominal pain | 1,612 | 2.3 | 86.2 | 11 | Abdominal pain | 1,461 | 2.2 | 82.3 |
| 12 | Fever | 1,494 | 2.1 | 85.1 | 12 | Other factors influencing health status | 1,461 | 2.2 | 66.3 |
| 13 | Appendectomy | 1,465 | 2.1 | 66.4 | 13 | Cellulitis/other bacterial skin infections | 1,383 | 2.1 | 84.2 |
| 14 | Cellulitis/other bacterial skin infections | 1,393 | 2.0 | 86.4 | 14 | Respiratory signs, symptoms, diagnoses | 1,308 | 2.0 | 39.1 |
| 15 | Pneumonia NEC | 1,356 | 1.9 | 79.1 | 15 | Pneumonia NEC | 1,245 | 1.9 | 73.1 |
| Total | 36,429 | 52.0 | 57.8 | Total | 33,041 | 49.87 | 53.0 | ||
Outcomes of Observation‐Status Stays
A greater percentage of observation‐status stays in hospitals with a dedicated OU experienced a same‐day discharge (Table 4). In addition, a higher percentage of discharges occurred between midnight and 11 am in hospitals with a dedicated OU. However, overall risk‐adjusted LOS in hours (12.8 vs 12.2 hours, P=0.90) and risk‐adjusted total standardized costs ($2551 vs $2433, P=0.75) were similar between hospital types. These findings were consistent within the 1 APR‐DRGs commonly cared for by pediatric hospitalists (see Supporting Information, Appendix 1, in the online version of this article). Overall, conversion from observation to inpatient status was significantly higher in hospitals with a dedicated OU compared with hospitals without; however, this pattern was not consistent across the 10 APR‐DRGs commonly cared for by pediatric hospitalists (see Supporting Information, Appendix 1, in the online version of this article). Adjusted odds of 3‐day ED return visits and 30‐day readmissions were comparable between hospital groups.
| Observation‐Status Patients in Hospitals With a Dedicated Observation Unit | Observation‐Status Patients in Hospitals Without a Dedicated Observation Unit | P Value | |
|---|---|---|---|
| |||
| No. of hospitals | 14 | 17 | |
| Length of stay, h, median (IQR) | 12.8 (6.923.7) | 12.2 (721.3) | 0.90 |
| 0 midnights, no. (%) | 16,678 (23.8) | 14,648 (22.1) | <.001 |
| 1 midnight, no. (%) | 46,144 (65.9) | 44,559 (67.3) | |
| 2 midnights or more, no. (%) | 7,161 (10.2) | 7,049 (10.6) | |
| Discharge timing, no. (%) | |||
| Midnight5 am | 1,223 (1.9) | 408 (0.7) | <0.001 |
| 6 am11 am | 18,916 (29.3) | 15,914 (27.1) | |
| Noon5 pm | 32,699 (50.7) | 31,619 (53.9) | |
| 6 pm11 pm | 11,718 (18.2) | 10,718 (18.3) | |
| Total standardized costs, $, median (IQR) | 2,551.3 (2,053.93,169.1) | 2,433.4 (1,998.42,963) | 0.75 |
| Conversion to inpatient status | 11.06% | 9.63% | <0.01 |
| Return care, AOR (95% CI) | |||
| 3‐day ED return visit | 0.93 (0.77‐1.12) | Referent | 0.46 |
| 30‐day readmission | 0.88 (0.67‐1.15) | Referent | 0.36 |
We found similar results in sensitivity analyses comparing observation‐status stays in hospitals with a continuously open OU (open 24 hours per day, 7 days per week, for all of 2011 [n=10 hospitals]) to those without(see Supporting Information, Appendix 2, in the online version of this article). However, there were, on average, more observation‐status stays in hospitals with a continuously open OU (median 5605, IQR 42077089) than hospitals without (median 3309, IQR 26784616) (P=0.04). In contrast to our main results, conversion to inpatient status was lower in hospitals with a continuously open OU compared with hospitals without (8.52% vs 11.57%, P<0.01).
DISCUSSION
Counter to our hypothesis, we did not find hospital‐level differences in length of stay or costs for observation‐status patients cared for in hospitals with and without a dedicated OU, though hospitals with dedicated OUs did have more same‐day discharges and more morning discharges. The lack of observed differences in LOS and costs may reflect the fact that many children under observation status are treated throughout the hospital, even in facilities with a dedicated OU. Access to a dedicated OU is limited by factors including small numbers of OU beds and specific low acuity/low complexity OU admission criteria.[7] The inclusion of all children admitted under observation status in our analyses may have diluted any effect of dedicated OUs at the hospital level, but was necessary due to the inability to identify location of care for children admitted under observation status. Location of care is an important variable that should be incorporated into administrative databases to allow for comparative effectiveness research designs. Until such data are available, chart review at individual hospitals would be necessary to determine which patients received care in an OU.
We did find that discharges for observation‐status patients occurred earlier in the day in hospitals with a dedicated OU when compared with observation‐status patients in hospitals without a dedicated OU. In addition, the percentage of same‐day discharges was higher among observation‐status patients treated in hospitals with a dedicated OU. These differences may stem from policies and procedures that encourage rapid discharge in dedicated OUs, and those practices may affect other care areas. For example, OUs may enforce policies requiring family presence at the bedside or utilize staffing models where doctors and nurses are in frequent communication, both of which would facilitate discharge as soon as a patient no longer required hospital‐based care.[7] A retrospective chart review study design could be used to identify discharge processes and other key characteristics of highly performing OUs.
We found conflicting results in our main and sensitivity analyses related to conversion to inpatient status. Lower percentages of observation‐status patients converting to inpatient status indicates greater success in the delivery of observation care based on established performance metrics.[19] Lower rates of conversion to inpatient status may be the result of stricter admission criteria for some diagnosis and in hospitals with a continuously open dedicate OU, more refined processes for utilization review that allow for patients to be placed into the correct status (observation vs inpatient) at the time of admission, or efforts to educate providers about the designation of observation status.[7] It is also possible that fewer observation‐status patients convert to inpatient status in hospitals with a continuously open dedicated OU because such a change would require movement of the patient to an inpatient bed.
These analyses were more comprehensive than our prior studies[2, 20] in that we included both patients who were treated first in the ED and those who were not. In addition to the APR‐DRGs representative of conditions that have been successfully treated in ED‐based pediatric OUs (eg, asthma, seizures, gastroenteritis, cellulitis),[8, 9, 21, 22] we found observation‐status was commonly associated with procedural care. This population of patients may be relevant to hospitalists who staff OUs that provide both unscheduled and postprocedural care. The colocation of medical and postprocedural patients has been described by others[8, 23] and was reported to occur in over half of the OUs included in this study.[7] The extent to which postprocedure observation care is provided in general OUs staffed by hospitalists represents another opportunity for further study.
Hospitals face many considerations when determining if and how they will provide observation services to patients expected to experience short stays.[7] Some hospitals may be unable to justify an OU for all or part of the year based on the volume of admissions or the costs to staff an OU.[24, 25] Other hospitals may open an OU to promote patient flow and reduce ED crowding.[26] Hospitals may also be influenced by reimbursement policies related to observation‐status stays. Although we did not observe differences in overall payer mix, we did find higher percentages of observation‐status patients in hospitals with dedicated OUs to have public insurance. Although hospital contracts with payers around observation status patients are complex and beyond the scope of this analysis, it is possible that hospitals have established OUs because of increasingly stringent rules or criteria to meet inpatient status or experiences with high volumes of observation‐status patients covered by a particular payer. Nevertheless, the brief nature of many pediatric hospitalizations and the scarcity of pediatric OU beds must be considered in policy changes that result from national discussions about the appropriateness of inpatient stays shorter than 2 nights in duration.[27]
Limitations
The primary limitation to our analyses is the lack of ability to identify patients who were treated in a dedicated OU because few hospitals provided data to PHIS that allowed for the identification of the unit or location of care. Second, it is possible that some hospitals were misclassified as not having a dedicated OU based on our survey, which initially inquired about OUs that provided care to patients first treated in the ED. Therefore, OUs that exclusively care for postoperative patients or patients with scheduled treatments may be present in hospitals that we have labeled as not having a dedicated OU. This potential misclassification would bias our results toward finding no differences. Third, in any study of administrative data there is potential that diagnosis codes are incomplete or inaccurately capture the underlying reason for the episode of care. Fourth, the experiences of the free‐standing children's hospitals that contribute data to PHIS may not be generalizable to other hospitals that provide observation care to children. Finally, return care may be underestimated, as children could receive treatment at another hospital following discharge from a PHIS hospital. Care outside of PHIS hospitals would not be captured, but we do not expect this to differ for hospitals with and without dedicated OUs. It is possible that health information exchanges will permit more comprehensive analyses of care across different hospitals in the future.
CONCLUSION
Observation status patients are similar in hospitals with and without dedicated observation units that admit children from the ED. The presence of a dedicated OU appears to have an influence on same‐day and morning discharges across all observation‐status stays without impacting other hospital‐level outcomes. Inclusion of location of care (eg, geographically distinct dedicated OU vs general inpatient unit vs ED) in hospital administrative datasets would allow for meaningful comparisons of different models of care for short‐stay observation‐status patients.
Acknowledgements
The authors thank John P. Harding, MBA, FACHE, Children's Hospital of the King's Daughters, Norfolk, Virginia for his input on the study design.
Disclosures: Dr. Hall had full access to the data and takes responsibility for the integrity of the data and the accuracy of the data analysis. Internal funds from the Children's Hospital Association supported the conduct of this work. The authors have no financial relationships or conflicts of interest to disclose.
© 2015 Society of Hospital Medicine
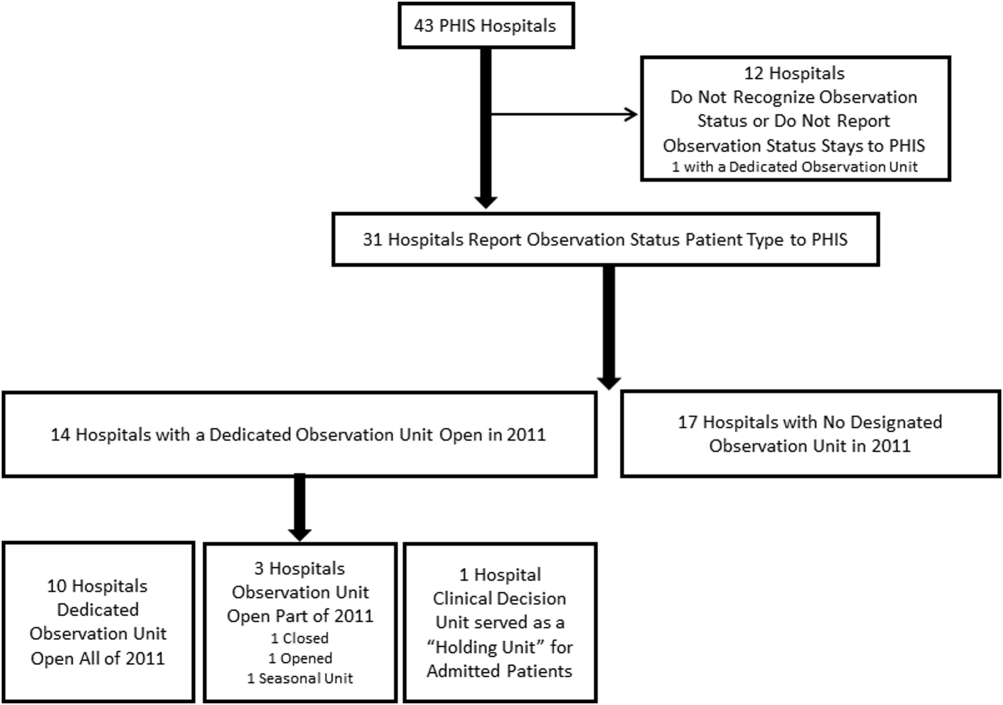
Discordant Antibiotics in Pediatric UTI
Urinary tract infections (UTIs) are one of the most common reasons for pediatric hospitalizations.1 Bacterial infections require prompt treatment with appropriate antimicrobial agents. Results from culture and susceptibility testing, however, are often unavailable until 48 hours after initial presentation. Therefore, the clinician must select antimicrobials empirically, basing decisions on likely pathogens and local resistance patterns.2 This decision is challenging because the effect of treatment delay on clinical outcomes is difficult to determine and resistance among uropathogens is increasing. Resistance rates have doubled over the past several years.3, 4 For common first‐line antibiotics, such as ampicillin and trimethoprim‐sulfamethoxazole, resistance rates for Escherichia coli, the most common uropathogen, exceed 25%.4, 5 While resistance to third‐generation cephalosporins remains low, rates in the United States have increased from <1% in 1999 to 4% in 2010. International data shows much higher resistance rates for cephalosporins in general.6, 7 This high prevalence of resistance may prompt the use of broad‐spectrum antibiotics for patients with UTI. For example, the use of third‐generation cephalosporins for UTI has doubled in recent years.3 Untreated, UTIs can lead to serious illness, but the consequences of inadequate initial antibiotic coverage are unknown.8, 9
Discordant antibiotic therapy, initial antibiotic therapy to which the causative bacterium is not susceptible, occurs in up to 9% of children hospitalized for UTI.10 However, there is reason to believe that discordant therapy may matter less for UTIs than for infections at other sites. First, in adults hospitalized with UTIs, discordant initial therapy did not affect the time to resolution of symptoms.11, 12 Second, most antibiotics used to treat UTIs are renally excreted and, thus, antibiotic concentrations at the site of infection are higher than can be achieved in the serum or cerebrospinal fluid.13 The Clinical and Laboratory Standard Institute has acknowledged that traditional susceptibility breakpoints may be too conservative for some non‐central nervous system infections; such as non‐central nervous system infections caused by Streptococcus pneumoniae.14
As resistance rates increase, more patients are likely to be treated with discordant therapy. Therefore, we sought to identify the clinical consequences of discordant antimicrobial therapy for patients hospitalized with a UTI.
METHODS
Design and Setting
We conducted a multicenter, retrospective cohort study. Data for this study were originally collected for a study that determined the accuracy of individual and combined International Classification of Diseases, Ninth Revision (ICD‐9) discharge diagnosis codes for children with laboratory tests for a UTI, in order to develop national quality measures for children hospitalized with UTIs.15 The institutional review board for each hospital (Seattle Children's Hospital, Seattle, WA; Monroe Carell Jr Children's Hospital at Vanderbilt, Nashville, TN; Cincinnati Children's Hospital Medical Center, Cincinnati, OH; Children's Mercy Hospital, Kansas City, MO; Children's Hospital of Philadelphia, Philadelphia, PA) approved the study.
Data Sources
Data were obtained from the Pediatric Health Information System (PHIS) and medical records for patients at the 5 participating hospitals. PHIS contains clinical and billing data from hospitalized children at 43 freestanding children's hospitals. Data quality and coding reliability are assured through a joint effort between the Children's Hospital Association (Shawnee Mission, KS) and participating hospitals.16 PHIS was used to identify participants based on presence of discharge diagnosis code and laboratory tests indicating possible UTI, patient demographics, antibiotic administration date, and utilization of hospital resources (length of stay [LOS], laboratory testing).
Medical records for each participant were reviewed to obtain laboratory and clinical information such as past medical history (including vesicoureteral reflux [VUR], abnormal genitourinary [GU] anatomy, use of prophylactic antibiotic), culture data, and fever data. Data were entered into a secured centrally housed web‐based data collection system. To assure consistency of chart review, all investigators responsible for data collection underwent training. In addition, 2 pilot medical record reviews were performed, followed by group discussion, to reach consensus on questions, preselected answers, interpretation of medical record data, and parameters for free text data entry.
Subjects
The initial cohort included 460 hospitalized patients, aged 3 days to 18 years of age, discharged from participating hospitals between July 1, 2008 and June 30, 2009 with a positive urine culture at any time during hospitalization.15 We excluded patients under 3 days of age because patients this young are more likely to have been transferred from the birthing hospital for a complication related to birth or a congenital anomaly. For this secondary analysis of patients from a prior study, our target population included patients admitted for management of UTI.15 We excluded patients with a negative initial urine culture (n = 59) or if their initial urine culture did not meet definition of laboratory‐confirmed UTI, defined as urine culture with >50,000 colony‐forming units (CFU) with an abnormal urinalysis (UA) (n = 77).1, 1719 An abnormal UA was defined by presence of white blood cells, leukocyte esterase, bacteria, and/or nitrites. For our cohort, all cultures with >50,000 CFU also had an abnormal urinalysis. We excluded 19 patients with cultures classified as 10,000100,000 CFU because we could not confirm that the CFU was >50,000. We excluded 30 patients with urine cultures classified as normal or mixed flora, positive for a mixture of organisms not further identified, or if results were unavailable. Additionally, coagulase‐negative Staphylococcus species (n = 8) were excluded, as these are typically considered contaminants in the setting of urine cultures.2 Patients likely to have received antibiotics prior to admission, or develop a UTI after admission, were identified and removed from the cohort if they had a urine culture performed more than 1 day before, or 2 days after, admission (n = 35). Cultures without resistance testing to the initial antibiotic selection were also excluded (n = 16).
Main Outcome Measures
The primary outcome measure was hospital LOS. Time to fever resolution was a secondary outcome measure. Fever was defined as temperature 38C. Fever duration was defined as number of hours until resolution of fever; only patients with fever at admission were included in this subanalysis.
Main Exposure
The main exposure was initial antibiotic therapy. Patients were classified into 3 groups according to initial antibiotic selection: those receiving 1) concordant; 2) discordant; or 3) delayed initial therapy. Concordance was defined as in vitro susceptibility to the initial antibiotic or class of antibiotic. If the uropathogen was sensitive to a narrow‐spectrum antibiotic (eg, first‐generation cephalosporin), but was not tested against a more broad‐spectrum antibiotic of the same class (eg, third‐generation cephalosporin), concordance was based on the sensitivity to the narrow‐spectrum antibiotic. If the uropathogen was sensitive to a broad‐spectrum antibiotic (eg, third‐generation cephalosporin), concordance to a more narrow‐spectrum antibiotic was not assumed. Discordance was defined as laboratory confirmation of in vitro resistance, or intermediate sensitivity of the pathogen to the initial antibiotic or class of antibiotics. Patients were considered to have a delay in antibiotic therapy if they did not receive antibiotics on the day of, or day after, collection of UA and culture. Patients with more than 1 uropathogen identified in a single culture were classified as discordant if any of the organisms was discordant to the initial antibiotic; they were classified as concordant if all organisms were concordant to the initial antibiotic. Antibiotic susceptibility was not tested in some cases (n = 16).
Initial antibiotic was defined as the antibiotic(s) billed on the same day or day after the UA was billed. If the patient had the UA completed on the day prior to admission, we used the antibiotic administered on the day of admission as the initial antibiotic.
Covariates
Covariates were selected a priori to include patient characteristics likely to affect patient outcomes; all were included in the final analysis. These were age, race, sex, insurance, disposition, prophylactic antibiotic use for any reason (VUR, oncologic process, etc), presence of a chronic care condition, and presence of VUR or GU anatomic abnormality. Age, race, sex, and insurance were obtained from PHIS. Medical record review was used to determine prophylactic antibiotic use, and presence of VUR or GU abnormalities (eg, posterior urethral valves). Chronic care conditions were defined using a previously reported method.20
Data Analysis
Continuous variables were described using median and interquartile range (IQR). Categorical variables were described using frequencies. Multivariable analyses were used to determine the independent association of discordant antibiotic therapy and the outcomes of interest. Poisson regression was used to fit the skewed LOS distribution. The effect of antibiotic concordance or discordance on LOS was determined for all patients in our sample, as well as for those with a urine culture positive for a single identified organism. We used the KruskalWallis test statistic to determine the association between duration of fever and discordant antibiotic therapy, given that duration of fever is a continuous variable. Generalized estimating equations accounted for clustering by hospital and the variability that exists between hospitals.
RESULTS
Of the initial 460 cases with positive urine culture growth at any time during admission, 216 met inclusion criteria for a laboratory‐confirmed UTI from urine culture completed at admission. The median age was 2.46 years (IQR: 0.27,8.89). In the study population, 25.0% were male, 31.0% were receiving prophylactic antibiotics, 13.0% had any grade of VUR, and 16.7% had abnormal GU anatomy (Table 1). A total of 82.4% of patients were treated with concordant initial therapy, 10.2% with discordant initial therapy, and 7.4% received delayed initial antibiotic therapy. There were no significant differences between the groups for any of the covariates. Discordant antibiotic cases ranged from 4.9% to 21.7% across hospitals.
| Overall | Concordant* | Discordant | Delayed Antibiotics | P Value | |
|---|---|---|---|---|---|
| |||||
| N | 216 | 178 (82.4) | 22 (10.2) | 16 (7.4) | |
| Gender | |||||
| Male | 54 (25.0) | 40 (22.5) | 8 (36.4) | 6 (37.5) | 0.18 |
| Female | 162 (75.0) | 138 (77.5) | 14 (63.64) | 10 (62.5) | |
| Race | |||||
| Non‐Hispanic white | 136 (63.9) | 110 (62.5) | 15 (71.4) | 11 (68.8) | 0.83 |
| Non‐Hispanic black | 28 (13.2) | 24 (13.6) | 2 (9.5) | 2 (12.5) | |
| Hispanic | 20 (9.4) | 16 (9.1) | 3 (14.3) | 1 (6.3) | |
| Asian | 10 (4.7) | 9 (5.1) | 1 (4.7) | ||
| Other | 19 (8.9) | 17 (9.7) | 2 (12.5) | ||
| Payor | |||||
| Government | 97 (44.9) | 80 (44.9) | 11 (50.0) | 6 (37.5) | 0.58 |
| Private | 70 (32.4) | 56 (31.5) | 6 (27.3) | 8 (50.0) | |
| Other | 49 (22.7) | 42 (23.6) | 5 (22.7) | 2 (12.5) | |
| Disposition | |||||
| Home | 204 (94.4) | 168 (94.4) | 21 (95.5) | 15 (93.8) | 0.99 |
| Died | 1 (0.5) | 1 (0.6) | |||
| Other | 11 (5.1) | 9 (5.1) | 1 (4.6) | 1 (6.3) | |
| Age | |||||
| 3 d60 d | 40 (18.5) | 35 (19.7) | 3 (13.6) | 2 (12.5) | 0.53 |
| 61 d2 y | 62 (28.7) | 54 (30.3) | 4 (18.2) | 4 (25.0) | |
| 3 y12 y | 75 (34.7) | 61 (34.3) | 8 (36.4) | 6 (37.5) | |
| 13 y18 y | 39 (18.1) | 28 (15.7) | 7 (31.8) | 4 (25.0) | |
| Length of stay | |||||
| 1 d5 d | 171 (79.2) | 147 (82.6) | 12 (54.6) | 12 (75.0) | 0.03 |
| 6 d10 d | 24 (11.1) | 17 (9.6) | 5 (22.7) | 2 (12.5) | |
| 11 d15 d | 10 (4.6) | 5 (2.8) | 3 (13.6) | 2 (12.5) | |
| 16 d+ | 11 (5.1) | 9 (5.1) | 2 (9.1) | 0 | |
| Complex chronic conditions | |||||
| Any CCC | 94 (43.5) | 77 (43.3) | 12 (54.6) | 5 (31.3) | 0.35 |
| Cardiovascular | 20 (9.3) | 19 (10.7) | 1 (6.3) | 0.24 | |
| Neuromuscular | 34 (15.7) | 26 (14.6) | 7 (31.8) | 1 (6.3) | 0.06 |
| Respiratory | 6 (2.8) | 6 (3.4) | 0.52 | ||
| Renal | 26 (12.0) | 21 (11.8) | 4 (18.2) | 1 (6.3) | 0.52 |
| Gastrointestinal | 3 (1.4) | 3 (1.7) | 0.72 | ||
| Hematologic/ immunologic | 1 (0.5) | 1 (4.6) | 0.01 | ||
| Metabolic | 8 (3.7) | 6 (3.4) | 1 (4.6) | 1 (6.3) | 0.82 |
| Congenital or genetic | 15 (6.9) | 11 (6.2) | 3 (13.6) | 1 (6.3) | 0.43 |
| Malignancy | 5 (2.3) | 3 (1.7) | 2 (9.1) | 0.08 | |
| VUR | 28 (13.0) | 23 (12.9) | 3 (13.6) | 2 (12.5) | 0.99 |
| Abnormal GU | 36 (16.7) | 31 (17.4) | 4 (18.2) | 1 (6.3) | 0.51 |
| Prophylactic antibiotics | 67 (31.0) | 53 (29.8) | 10 (45.5) | 4 (25.0) | 0.28 |
The most common causative organisms were E. coli (65.7%) and Klebsiella spp (9.7%) (Table 2). The most common initial antibiotics were a third‐generation cephalosporin (39.1%), combination of ampicillin and a third‐ or fourth‐generation cephalosporin (16.7%), and combination of ampicillin with gentamicin (11.1%). A third‐generation cephalosporin was the initial antibiotic for 46.1% of the E. coli and 56.9% of Klebsiella spp UTIs. Resistance to third‐generation cephalosporins but carbapenem susceptibility was noted for 4.5% of E. coli and 7.7% of Klebsiella spp isolates. Patients with UTIs caused by Klebsiella spp, mixed organisms, and Enterobacter spp were more likely to receive discordant antibiotic therapy. Patients with Enterobacter spp and mixed‐organism UTIs were more likely to have delayed antibiotic therapy. Nineteen patients (8.8%) had positive blood cultures. Fifteen (6.9%) required intensive care unit (ICU) admission during hospitalization.
| Organism | Cases | Concordant* No. (%) | Discordant No. (%) | Delayed Antibiotics No. (%) |
|---|---|---|---|---|
| ||||
| E. coli | 142 | 129 (90.8) | 3 (2.1) | 10 (7.0) |
| Klebsiella spp | 21 | 14 (66.7) | 7 (33.3) | 0 (0) |
| Enterococcus spp | 12 | 9 (75.0) | 3 (25.0) | 0 (0) |
| Enterobacter spp | 10 | 5 (50.0) | 3 (30.0) | 2 (20.0) |
| Pseudomonas spp | 10 | 9 (90.0) | 1 (10.0) | 0 (0) |
| Other single organisms | 6 | 5 (83.3) | 0 (0) | 1 (16.7) |
| Other identified multiple organisms | 15 | 7 (46.7) | 5 (33.3) | 3 (20.0) |
Unadjusted results are shown in Supporting Appendix 1, in the online version of this article. In the adjusted analysis, discordant antibiotic therapy was associated with a significantly longer LOS, compared with concordant therapy for all UTIs and for all UTIs caused by a single organism (Table 3). In adjusted analysis, discordant therapy was also associated with a 3.1 day (IQR: 2.0, 4.7) longer length of stay compared with concordant therapy for all E. coli UTIs.
| Bacteria | Difference in LOS (95% CI)* | P Value |
|---|---|---|
| ||
| All organisms | ||
| Concordant vs discordant | 1.8 (2.1, 1.5) | <0.0001 |
| Concordant vs delayed antibiotics | 1.4 (1.7, 1.1) | 0.01 |
| Single organisms | ||
| Concordant vs discordant | 1.9 (2.4, 1.5) | <0.0001 |
| Concordant vs delayed antibiotics | 1.2 (1.6, 1.2) | 0.37 |
Time to fever resolution was analyzed for patients with a documented fever at presentation for each treatment subgroup. One hundred thirty‐six patients were febrile at admission and 122 were febrile beyond the first recorded vital signs. Fever was present at admission in 60% of the concordant group and 55% of the discordant group (P = 0.6). The median duration of fever was 48 hours for the concordant group (n = 107; IQR: 24, 240) and 78 hours for the discordant group (n = 12; IQR: 48, 132). All patients were afebrile at discharge. Differences in fever duration between treatment groups were not statistically significant (P = 0.7).
DISCUSSION
Across 5 children's hospitals, 1 out of every 10 children hospitalized for UTI received discordant initial antibiotic therapy. Children receiving discordant antibiotic therapy had a 1.8 day longer LOS when compared with those on concordant therapy. However, there was no significant difference in time to fever resolution between the groups, suggesting that the increase in LOS was not explained by increased fever duration.
The overall rate of discordant therapy in this study is consistent with prior studies, as was the more common association of discordant therapy with non‐E. coli UTIs.10 According to the Kids' Inpatient Database 2009, there are 48,100 annual admissions for patients less than 20 years of age with a discharge diagnosis code of UTI in the United States.1 This suggests that nearly 4800 children with UTI could be affected by discordant therapy annually.
Children treated with discordant antibiotic therapy had a significantly longer LOS compared to those treated with concordant therapy. However, differences in time to fever resolution between the groups were not statistically significant. While resolution of fever may suggest clinical improvement and adequate empiric therapy, the lack of association with antibiotic concordance was not unexpected, since the relationship between fever resolution, clinical improvement, and LOS is complex and thus challenging to measure.21 These results support the notion that fever resolution alone may not be an adequate measure of clinical response.
It is possible that variability in discharge decision‐making may contribute to increased length of stay. Some clinicians may delay a patient's discharge until complete resolution of symptoms or knowledge of susceptibilities, while others may discharge patients that are still febrile and/or still receiving empiric antibiotics. Evidence‐based guidelines that address the appropriate time to discharge a patient with UTI are lacking. The American Academy of Pediatrics provides recommendations for use of parenteral antibiotics and hospital admission for patients with UTI, but does not address discharge decision‐making or patient management in the setting of discordant antibiotic therapy.2, 21
This study must be interpreted in the context of several limitations. First, our primary and secondary outcomes, LOS and fever duration, were surrogate measures for clinical response. We were not able to measure all clinical factors that may contribute to LOS, such as the patient's ability to tolerate oral fluids and antibiotics. Also, there may have been too few patients to detect a clinically important difference in fever duration between the concordant and discordant groups, especially for individual organisms. Although we did find a significant difference in LOS between patients treated with concordant compared with discordant therapy, there may be residual confounding from unobserved differences. This confounding, in conjunction with the small sample size, may cause us to underestimate the magnitude of the difference in LOS resulting from discordant therapy. Second, short‐term outcomes such as ICU admission were not investigated in this study; however, the proportion of patients admitted to the ICU in our population was quite small, precluding its use as a meaningful outcome measure. Third, the potential benefits to patients who were not exposed to unnecessary antibiotics, or harm to those that were exposed, could not be measured. Finally, our study was obtained using data from 5 free‐standing tertiary care pediatric facilities, thereby limiting its generalizability to other settings. Still, our rates of prophylactic antibiotic use, VUR, and GU abnormalities are similar to others reported in tertiary care children's hospitals, and we accounted for these covariates in our model.2225
As the frequency of infections caused by resistant bacteria increase, so will the number of patients receiving discordant antibiotics for UTI, compounding the challenge of empiric antimicrobial selection. Further research is needed to better understand how discordant initial antibiotic therapy contributes to LOS and whether it is associated with adverse short‐ and long‐term clinical outcomes. Such research could also aid in weighing the risk of broader‐spectrum prescribing on antimicrobial resistance patterns. While we identified an association between discordant initial antibiotic therapy and LOS, we were unable to determine the ideal empiric antibiotic therapy for patients hospitalized with UTI. Further investigation is needed to inform local and national practice guidelines for empiric antibiotic selection in patients with UTIs. This may also be an opportunity to decrease discordant empiric antibiotic selection, perhaps through use of antibiograms that stratify patients based on known factors, to lead to more specific initial therapy.
CONCLUSIONS
This study demonstrates that discordant antibiotic selection for UTI at admission is associated with longer hospital stay, but not fever duration. The full clinical consequences of discordant therapy, and the effects on length of stay, need to be better understood. Our findings, taken in combination with careful consideration of patient characteristics and prior history, may provide an opportunity to improve the hospital care for patients with UTIs.
Acknowledgements
Disclosure: Nothing to report.
- HCUP Kids' Inpatient Database (KID). Healthcare Cost and Utilization Project (HCUP). Rockville, MD: Agency for Healthcare Research and Quality; 2006 and 2009. Available at: http://www.hcup‐us.ahrq.gov/kidoverview.jsp.
- Subcommitee on Urinary Tract Infection, Steering Committee on Quality Improvement and Management. Urinary tract infection: clinical practice guideline for the diagnosis and management of the initial UTI in febrile infants and children 2 to 24 months. Pediatrics. 2011;128(3)595–610. doi: 10.1542/peds.2011–1330. Available at: http://pediatrics.aappublications.org/content/128/3/595.full.html.
- , , . National ambulatory antibiotic prescribing patterns for pediatric urinary tract infection, 1998–2007. Pediatrics. 2011;127(6):1027–1033.
- , , , , . Previous antimicrobial exposure is associated with drug‐resistant urinary tract infections in children. Pediatrics. 2010;125(4):664–672.
- CDC. National Antimicrobial Resistance Monitoring System for Enteric Bacteria (NARMS): Human Isolates Final Report. Atlanta, GA: US Department of Health and Human Services, CDC; 2009.
- , , , , . Increasing antibiotic resistance among uropathogens isolated during years 2006–2009: impact on the empirical management. Int Braz J Urol. 2012;38(1):25–32.
- . 3rd Generation Cephalosporin‐Resistant Escherichia coli. 2010. Available at: http://www.cddep.org/ResistanceMap/bug‐drug/EC‐CS. Accessed May 14, 2012.
- , , , . Risk of renal scarring in children with a first urinary tract infection: a systematic review. Pediatrics. 2010;126(6):1084–1091.
- , . Treatment of urinary tract infections. Pediatr Infect Dis J. 1999;18(11):1020–1021.
- , , , , . Non‐Escherichia coli versus Escherichia coli community‐acquired urinary tract infections in children hospitalized in a tertiary center: relative frequency, risk factors, antimicrobial resistance and outcome. Pediatr Infect Dis J. 2005;24(7):581–585.
- , , , , , . Prognosis of urinary tract infections with discordant antibiotic treatment [in Spanish]. Rev Clin Esp. 2010;210(11):545–549.
- , , , et al. Appropriateness of empiric antibiotic therapy in urinary tract infection in emergency room [in Spanish]. Rev Clin Esp. 2010;210(1):11–16.
- , , . Principles and Practice of Pediatric Infectious Diseases. 3rd ed. New York, NY: Churchill Livingstone/Elsevier; 2009.
- National Committee for Clinical Laboratory Standards. Performance Standards for Antimicrobial Susceptibility Testing; Twelfth Informational Supplement.Vol M100‐S12. Wayne, PA: NCCLS; 2002.
- , , , et al. Accuracy of administrative billing codes to detect urinary tract infection hospitalizations. Pediatrics. 2011;128(2):323–330.
- , , , . Corticosteroids and mortality in children with bacterial meningitis. JAMA. 2008;299(17):2048–2055.
- , , , , . Enhanced urinalysis as a screening test for urinary tract infection. Pediatrics. 1993;91(6):1196–1199.
- , , , , . Pyuria and bacteriuria in urine specimens obtained by catheter from young children with fever. J Pediatr. 1994;124(4):513–519.
- , , , et al. Clinical and demographic factors associated with urinary tract infection in young febrile infants. Pediatrics. 2005;116(3):644–648.
- , , , , , . Deaths attributed to pediatric complex chronic conditions: national trends and implications for supportive care services. Pediatrics. 2001;107(6):E99.
- Committee on Quality Improvement. Subcommittee on Urinary Tract Infection. Practice parameter: the diagnosis, treatment, and evaluation of the initial urinary tract infection in febrile infants and young children. Pediatrics. 1999;103:843–852.
- , . Antibiotics or surgery for vesicoureteric reflux in children. Lancet. 2004;364(9446):1720–1722.
- , , , et al. Randomized intervention for children with vesicoureteral reflux (RIVUR): background commentary of RIVUR investigators. Pediatrics. 2008;122(suppl 5):S233–S239.
- , , . Length of intravenous antibiotic therapy and treatment failure in infants with urinary tract infections. Pediatrics. 2010;126(2):196–203.
- , , , , , . Vesicoureteral reflux in children with suspected and proven urinary tract infection. Pediatr Nephrol. 2010;25(8):1463–1469.
Urinary tract infections (UTIs) are one of the most common reasons for pediatric hospitalizations.1 Bacterial infections require prompt treatment with appropriate antimicrobial agents. Results from culture and susceptibility testing, however, are often unavailable until 48 hours after initial presentation. Therefore, the clinician must select antimicrobials empirically, basing decisions on likely pathogens and local resistance patterns.2 This decision is challenging because the effect of treatment delay on clinical outcomes is difficult to determine and resistance among uropathogens is increasing. Resistance rates have doubled over the past several years.3, 4 For common first‐line antibiotics, such as ampicillin and trimethoprim‐sulfamethoxazole, resistance rates for Escherichia coli, the most common uropathogen, exceed 25%.4, 5 While resistance to third‐generation cephalosporins remains low, rates in the United States have increased from <1% in 1999 to 4% in 2010. International data shows much higher resistance rates for cephalosporins in general.6, 7 This high prevalence of resistance may prompt the use of broad‐spectrum antibiotics for patients with UTI. For example, the use of third‐generation cephalosporins for UTI has doubled in recent years.3 Untreated, UTIs can lead to serious illness, but the consequences of inadequate initial antibiotic coverage are unknown.8, 9
Discordant antibiotic therapy, initial antibiotic therapy to which the causative bacterium is not susceptible, occurs in up to 9% of children hospitalized for UTI.10 However, there is reason to believe that discordant therapy may matter less for UTIs than for infections at other sites. First, in adults hospitalized with UTIs, discordant initial therapy did not affect the time to resolution of symptoms.11, 12 Second, most antibiotics used to treat UTIs are renally excreted and, thus, antibiotic concentrations at the site of infection are higher than can be achieved in the serum or cerebrospinal fluid.13 The Clinical and Laboratory Standard Institute has acknowledged that traditional susceptibility breakpoints may be too conservative for some non‐central nervous system infections; such as non‐central nervous system infections caused by Streptococcus pneumoniae.14
As resistance rates increase, more patients are likely to be treated with discordant therapy. Therefore, we sought to identify the clinical consequences of discordant antimicrobial therapy for patients hospitalized with a UTI.
METHODS
Design and Setting
We conducted a multicenter, retrospective cohort study. Data for this study were originally collected for a study that determined the accuracy of individual and combined International Classification of Diseases, Ninth Revision (ICD‐9) discharge diagnosis codes for children with laboratory tests for a UTI, in order to develop national quality measures for children hospitalized with UTIs.15 The institutional review board for each hospital (Seattle Children's Hospital, Seattle, WA; Monroe Carell Jr Children's Hospital at Vanderbilt, Nashville, TN; Cincinnati Children's Hospital Medical Center, Cincinnati, OH; Children's Mercy Hospital, Kansas City, MO; Children's Hospital of Philadelphia, Philadelphia, PA) approved the study.
Data Sources
Data were obtained from the Pediatric Health Information System (PHIS) and medical records for patients at the 5 participating hospitals. PHIS contains clinical and billing data from hospitalized children at 43 freestanding children's hospitals. Data quality and coding reliability are assured through a joint effort between the Children's Hospital Association (Shawnee Mission, KS) and participating hospitals.16 PHIS was used to identify participants based on presence of discharge diagnosis code and laboratory tests indicating possible UTI, patient demographics, antibiotic administration date, and utilization of hospital resources (length of stay [LOS], laboratory testing).
Medical records for each participant were reviewed to obtain laboratory and clinical information such as past medical history (including vesicoureteral reflux [VUR], abnormal genitourinary [GU] anatomy, use of prophylactic antibiotic), culture data, and fever data. Data were entered into a secured centrally housed web‐based data collection system. To assure consistency of chart review, all investigators responsible for data collection underwent training. In addition, 2 pilot medical record reviews were performed, followed by group discussion, to reach consensus on questions, preselected answers, interpretation of medical record data, and parameters for free text data entry.
Subjects
The initial cohort included 460 hospitalized patients, aged 3 days to 18 years of age, discharged from participating hospitals between July 1, 2008 and June 30, 2009 with a positive urine culture at any time during hospitalization.15 We excluded patients under 3 days of age because patients this young are more likely to have been transferred from the birthing hospital for a complication related to birth or a congenital anomaly. For this secondary analysis of patients from a prior study, our target population included patients admitted for management of UTI.15 We excluded patients with a negative initial urine culture (n = 59) or if their initial urine culture did not meet definition of laboratory‐confirmed UTI, defined as urine culture with >50,000 colony‐forming units (CFU) with an abnormal urinalysis (UA) (n = 77).1, 1719 An abnormal UA was defined by presence of white blood cells, leukocyte esterase, bacteria, and/or nitrites. For our cohort, all cultures with >50,000 CFU also had an abnormal urinalysis. We excluded 19 patients with cultures classified as 10,000100,000 CFU because we could not confirm that the CFU was >50,000. We excluded 30 patients with urine cultures classified as normal or mixed flora, positive for a mixture of organisms not further identified, or if results were unavailable. Additionally, coagulase‐negative Staphylococcus species (n = 8) were excluded, as these are typically considered contaminants in the setting of urine cultures.2 Patients likely to have received antibiotics prior to admission, or develop a UTI after admission, were identified and removed from the cohort if they had a urine culture performed more than 1 day before, or 2 days after, admission (n = 35). Cultures without resistance testing to the initial antibiotic selection were also excluded (n = 16).
Main Outcome Measures
The primary outcome measure was hospital LOS. Time to fever resolution was a secondary outcome measure. Fever was defined as temperature 38C. Fever duration was defined as number of hours until resolution of fever; only patients with fever at admission were included in this subanalysis.
Main Exposure
The main exposure was initial antibiotic therapy. Patients were classified into 3 groups according to initial antibiotic selection: those receiving 1) concordant; 2) discordant; or 3) delayed initial therapy. Concordance was defined as in vitro susceptibility to the initial antibiotic or class of antibiotic. If the uropathogen was sensitive to a narrow‐spectrum antibiotic (eg, first‐generation cephalosporin), but was not tested against a more broad‐spectrum antibiotic of the same class (eg, third‐generation cephalosporin), concordance was based on the sensitivity to the narrow‐spectrum antibiotic. If the uropathogen was sensitive to a broad‐spectrum antibiotic (eg, third‐generation cephalosporin), concordance to a more narrow‐spectrum antibiotic was not assumed. Discordance was defined as laboratory confirmation of in vitro resistance, or intermediate sensitivity of the pathogen to the initial antibiotic or class of antibiotics. Patients were considered to have a delay in antibiotic therapy if they did not receive antibiotics on the day of, or day after, collection of UA and culture. Patients with more than 1 uropathogen identified in a single culture were classified as discordant if any of the organisms was discordant to the initial antibiotic; they were classified as concordant if all organisms were concordant to the initial antibiotic. Antibiotic susceptibility was not tested in some cases (n = 16).
Initial antibiotic was defined as the antibiotic(s) billed on the same day or day after the UA was billed. If the patient had the UA completed on the day prior to admission, we used the antibiotic administered on the day of admission as the initial antibiotic.
Covariates
Covariates were selected a priori to include patient characteristics likely to affect patient outcomes; all were included in the final analysis. These were age, race, sex, insurance, disposition, prophylactic antibiotic use for any reason (VUR, oncologic process, etc), presence of a chronic care condition, and presence of VUR or GU anatomic abnormality. Age, race, sex, and insurance were obtained from PHIS. Medical record review was used to determine prophylactic antibiotic use, and presence of VUR or GU abnormalities (eg, posterior urethral valves). Chronic care conditions were defined using a previously reported method.20
Data Analysis
Continuous variables were described using median and interquartile range (IQR). Categorical variables were described using frequencies. Multivariable analyses were used to determine the independent association of discordant antibiotic therapy and the outcomes of interest. Poisson regression was used to fit the skewed LOS distribution. The effect of antibiotic concordance or discordance on LOS was determined for all patients in our sample, as well as for those with a urine culture positive for a single identified organism. We used the KruskalWallis test statistic to determine the association between duration of fever and discordant antibiotic therapy, given that duration of fever is a continuous variable. Generalized estimating equations accounted for clustering by hospital and the variability that exists between hospitals.
RESULTS
Of the initial 460 cases with positive urine culture growth at any time during admission, 216 met inclusion criteria for a laboratory‐confirmed UTI from urine culture completed at admission. The median age was 2.46 years (IQR: 0.27,8.89). In the study population, 25.0% were male, 31.0% were receiving prophylactic antibiotics, 13.0% had any grade of VUR, and 16.7% had abnormal GU anatomy (Table 1). A total of 82.4% of patients were treated with concordant initial therapy, 10.2% with discordant initial therapy, and 7.4% received delayed initial antibiotic therapy. There were no significant differences between the groups for any of the covariates. Discordant antibiotic cases ranged from 4.9% to 21.7% across hospitals.
| Overall | Concordant* | Discordant | Delayed Antibiotics | P Value | |
|---|---|---|---|---|---|
| |||||
| N | 216 | 178 (82.4) | 22 (10.2) | 16 (7.4) | |
| Gender | |||||
| Male | 54 (25.0) | 40 (22.5) | 8 (36.4) | 6 (37.5) | 0.18 |
| Female | 162 (75.0) | 138 (77.5) | 14 (63.64) | 10 (62.5) | |
| Race | |||||
| Non‐Hispanic white | 136 (63.9) | 110 (62.5) | 15 (71.4) | 11 (68.8) | 0.83 |
| Non‐Hispanic black | 28 (13.2) | 24 (13.6) | 2 (9.5) | 2 (12.5) | |
| Hispanic | 20 (9.4) | 16 (9.1) | 3 (14.3) | 1 (6.3) | |
| Asian | 10 (4.7) | 9 (5.1) | 1 (4.7) | ||
| Other | 19 (8.9) | 17 (9.7) | 2 (12.5) | ||
| Payor | |||||
| Government | 97 (44.9) | 80 (44.9) | 11 (50.0) | 6 (37.5) | 0.58 |
| Private | 70 (32.4) | 56 (31.5) | 6 (27.3) | 8 (50.0) | |
| Other | 49 (22.7) | 42 (23.6) | 5 (22.7) | 2 (12.5) | |
| Disposition | |||||
| Home | 204 (94.4) | 168 (94.4) | 21 (95.5) | 15 (93.8) | 0.99 |
| Died | 1 (0.5) | 1 (0.6) | |||
| Other | 11 (5.1) | 9 (5.1) | 1 (4.6) | 1 (6.3) | |
| Age | |||||
| 3 d60 d | 40 (18.5) | 35 (19.7) | 3 (13.6) | 2 (12.5) | 0.53 |
| 61 d2 y | 62 (28.7) | 54 (30.3) | 4 (18.2) | 4 (25.0) | |
| 3 y12 y | 75 (34.7) | 61 (34.3) | 8 (36.4) | 6 (37.5) | |
| 13 y18 y | 39 (18.1) | 28 (15.7) | 7 (31.8) | 4 (25.0) | |
| Length of stay | |||||
| 1 d5 d | 171 (79.2) | 147 (82.6) | 12 (54.6) | 12 (75.0) | 0.03 |
| 6 d10 d | 24 (11.1) | 17 (9.6) | 5 (22.7) | 2 (12.5) | |
| 11 d15 d | 10 (4.6) | 5 (2.8) | 3 (13.6) | 2 (12.5) | |
| 16 d+ | 11 (5.1) | 9 (5.1) | 2 (9.1) | 0 | |
| Complex chronic conditions | |||||
| Any CCC | 94 (43.5) | 77 (43.3) | 12 (54.6) | 5 (31.3) | 0.35 |
| Cardiovascular | 20 (9.3) | 19 (10.7) | 1 (6.3) | 0.24 | |
| Neuromuscular | 34 (15.7) | 26 (14.6) | 7 (31.8) | 1 (6.3) | 0.06 |
| Respiratory | 6 (2.8) | 6 (3.4) | 0.52 | ||
| Renal | 26 (12.0) | 21 (11.8) | 4 (18.2) | 1 (6.3) | 0.52 |
| Gastrointestinal | 3 (1.4) | 3 (1.7) | 0.72 | ||
| Hematologic/ immunologic | 1 (0.5) | 1 (4.6) | 0.01 | ||
| Metabolic | 8 (3.7) | 6 (3.4) | 1 (4.6) | 1 (6.3) | 0.82 |
| Congenital or genetic | 15 (6.9) | 11 (6.2) | 3 (13.6) | 1 (6.3) | 0.43 |
| Malignancy | 5 (2.3) | 3 (1.7) | 2 (9.1) | 0.08 | |
| VUR | 28 (13.0) | 23 (12.9) | 3 (13.6) | 2 (12.5) | 0.99 |
| Abnormal GU | 36 (16.7) | 31 (17.4) | 4 (18.2) | 1 (6.3) | 0.51 |
| Prophylactic antibiotics | 67 (31.0) | 53 (29.8) | 10 (45.5) | 4 (25.0) | 0.28 |
The most common causative organisms were E. coli (65.7%) and Klebsiella spp (9.7%) (Table 2). The most common initial antibiotics were a third‐generation cephalosporin (39.1%), combination of ampicillin and a third‐ or fourth‐generation cephalosporin (16.7%), and combination of ampicillin with gentamicin (11.1%). A third‐generation cephalosporin was the initial antibiotic for 46.1% of the E. coli and 56.9% of Klebsiella spp UTIs. Resistance to third‐generation cephalosporins but carbapenem susceptibility was noted for 4.5% of E. coli and 7.7% of Klebsiella spp isolates. Patients with UTIs caused by Klebsiella spp, mixed organisms, and Enterobacter spp were more likely to receive discordant antibiotic therapy. Patients with Enterobacter spp and mixed‐organism UTIs were more likely to have delayed antibiotic therapy. Nineteen patients (8.8%) had positive blood cultures. Fifteen (6.9%) required intensive care unit (ICU) admission during hospitalization.
| Organism | Cases | Concordant* No. (%) | Discordant No. (%) | Delayed Antibiotics No. (%) |
|---|---|---|---|---|
| ||||
| E. coli | 142 | 129 (90.8) | 3 (2.1) | 10 (7.0) |
| Klebsiella spp | 21 | 14 (66.7) | 7 (33.3) | 0 (0) |
| Enterococcus spp | 12 | 9 (75.0) | 3 (25.0) | 0 (0) |
| Enterobacter spp | 10 | 5 (50.0) | 3 (30.0) | 2 (20.0) |
| Pseudomonas spp | 10 | 9 (90.0) | 1 (10.0) | 0 (0) |
| Other single organisms | 6 | 5 (83.3) | 0 (0) | 1 (16.7) |
| Other identified multiple organisms | 15 | 7 (46.7) | 5 (33.3) | 3 (20.0) |
Unadjusted results are shown in Supporting Appendix 1, in the online version of this article. In the adjusted analysis, discordant antibiotic therapy was associated with a significantly longer LOS, compared with concordant therapy for all UTIs and for all UTIs caused by a single organism (Table 3). In adjusted analysis, discordant therapy was also associated with a 3.1 day (IQR: 2.0, 4.7) longer length of stay compared with concordant therapy for all E. coli UTIs.
| Bacteria | Difference in LOS (95% CI)* | P Value |
|---|---|---|
| ||
| All organisms | ||
| Concordant vs discordant | 1.8 (2.1, 1.5) | <0.0001 |
| Concordant vs delayed antibiotics | 1.4 (1.7, 1.1) | 0.01 |
| Single organisms | ||
| Concordant vs discordant | 1.9 (2.4, 1.5) | <0.0001 |
| Concordant vs delayed antibiotics | 1.2 (1.6, 1.2) | 0.37 |
Time to fever resolution was analyzed for patients with a documented fever at presentation for each treatment subgroup. One hundred thirty‐six patients were febrile at admission and 122 were febrile beyond the first recorded vital signs. Fever was present at admission in 60% of the concordant group and 55% of the discordant group (P = 0.6). The median duration of fever was 48 hours for the concordant group (n = 107; IQR: 24, 240) and 78 hours for the discordant group (n = 12; IQR: 48, 132). All patients were afebrile at discharge. Differences in fever duration between treatment groups were not statistically significant (P = 0.7).
DISCUSSION
Across 5 children's hospitals, 1 out of every 10 children hospitalized for UTI received discordant initial antibiotic therapy. Children receiving discordant antibiotic therapy had a 1.8 day longer LOS when compared with those on concordant therapy. However, there was no significant difference in time to fever resolution between the groups, suggesting that the increase in LOS was not explained by increased fever duration.
The overall rate of discordant therapy in this study is consistent with prior studies, as was the more common association of discordant therapy with non‐E. coli UTIs.10 According to the Kids' Inpatient Database 2009, there are 48,100 annual admissions for patients less than 20 years of age with a discharge diagnosis code of UTI in the United States.1 This suggests that nearly 4800 children with UTI could be affected by discordant therapy annually.
Children treated with discordant antibiotic therapy had a significantly longer LOS compared to those treated with concordant therapy. However, differences in time to fever resolution between the groups were not statistically significant. While resolution of fever may suggest clinical improvement and adequate empiric therapy, the lack of association with antibiotic concordance was not unexpected, since the relationship between fever resolution, clinical improvement, and LOS is complex and thus challenging to measure.21 These results support the notion that fever resolution alone may not be an adequate measure of clinical response.
It is possible that variability in discharge decision‐making may contribute to increased length of stay. Some clinicians may delay a patient's discharge until complete resolution of symptoms or knowledge of susceptibilities, while others may discharge patients that are still febrile and/or still receiving empiric antibiotics. Evidence‐based guidelines that address the appropriate time to discharge a patient with UTI are lacking. The American Academy of Pediatrics provides recommendations for use of parenteral antibiotics and hospital admission for patients with UTI, but does not address discharge decision‐making or patient management in the setting of discordant antibiotic therapy.2, 21
This study must be interpreted in the context of several limitations. First, our primary and secondary outcomes, LOS and fever duration, were surrogate measures for clinical response. We were not able to measure all clinical factors that may contribute to LOS, such as the patient's ability to tolerate oral fluids and antibiotics. Also, there may have been too few patients to detect a clinically important difference in fever duration between the concordant and discordant groups, especially for individual organisms. Although we did find a significant difference in LOS between patients treated with concordant compared with discordant therapy, there may be residual confounding from unobserved differences. This confounding, in conjunction with the small sample size, may cause us to underestimate the magnitude of the difference in LOS resulting from discordant therapy. Second, short‐term outcomes such as ICU admission were not investigated in this study; however, the proportion of patients admitted to the ICU in our population was quite small, precluding its use as a meaningful outcome measure. Third, the potential benefits to patients who were not exposed to unnecessary antibiotics, or harm to those that were exposed, could not be measured. Finally, our study was obtained using data from 5 free‐standing tertiary care pediatric facilities, thereby limiting its generalizability to other settings. Still, our rates of prophylactic antibiotic use, VUR, and GU abnormalities are similar to others reported in tertiary care children's hospitals, and we accounted for these covariates in our model.2225
As the frequency of infections caused by resistant bacteria increase, so will the number of patients receiving discordant antibiotics for UTI, compounding the challenge of empiric antimicrobial selection. Further research is needed to better understand how discordant initial antibiotic therapy contributes to LOS and whether it is associated with adverse short‐ and long‐term clinical outcomes. Such research could also aid in weighing the risk of broader‐spectrum prescribing on antimicrobial resistance patterns. While we identified an association between discordant initial antibiotic therapy and LOS, we were unable to determine the ideal empiric antibiotic therapy for patients hospitalized with UTI. Further investigation is needed to inform local and national practice guidelines for empiric antibiotic selection in patients with UTIs. This may also be an opportunity to decrease discordant empiric antibiotic selection, perhaps through use of antibiograms that stratify patients based on known factors, to lead to more specific initial therapy.
CONCLUSIONS
This study demonstrates that discordant antibiotic selection for UTI at admission is associated with longer hospital stay, but not fever duration. The full clinical consequences of discordant therapy, and the effects on length of stay, need to be better understood. Our findings, taken in combination with careful consideration of patient characteristics and prior history, may provide an opportunity to improve the hospital care for patients with UTIs.
Acknowledgements
Disclosure: Nothing to report.
- HCUP Kids' Inpatient Database (KID). Healthcare Cost and Utilization Project (HCUP). Rockville, MD: Agency for Healthcare Research and Quality; 2006 and 2009. Available at: http://www.hcup‐us.ahrq.gov/kidoverview.jsp.
- Subcommitee on Urinary Tract Infection, Steering Committee on Quality Improvement and Management. Urinary tract infection: clinical practice guideline for the diagnosis and management of the initial UTI in febrile infants and children 2 to 24 months. Pediatrics. 2011;128(3)595–610. doi: 10.1542/peds.2011–1330. Available at: http://pediatrics.aappublications.org/content/128/3/595.full.html.
- , , . National ambulatory antibiotic prescribing patterns for pediatric urinary tract infection, 1998–2007. Pediatrics. 2011;127(6):1027–1033.
- , , , , . Previous antimicrobial exposure is associated with drug‐resistant urinary tract infections in children. Pediatrics. 2010;125(4):664–672.
- CDC. National Antimicrobial Resistance Monitoring System for Enteric Bacteria (NARMS): Human Isolates Final Report. Atlanta, GA: US Department of Health and Human Services, CDC; 2009.
- , , , , . Increasing antibiotic resistance among uropathogens isolated during years 2006–2009: impact on the empirical management. Int Braz J Urol. 2012;38(1):25–32.
- . 3rd Generation Cephalosporin‐Resistant Escherichia coli. 2010. Available at: http://www.cddep.org/ResistanceMap/bug‐drug/EC‐CS. Accessed May 14, 2012.
- , , , . Risk of renal scarring in children with a first urinary tract infection: a systematic review. Pediatrics. 2010;126(6):1084–1091.
- , . Treatment of urinary tract infections. Pediatr Infect Dis J. 1999;18(11):1020–1021.
- , , , , . Non‐Escherichia coli versus Escherichia coli community‐acquired urinary tract infections in children hospitalized in a tertiary center: relative frequency, risk factors, antimicrobial resistance and outcome. Pediatr Infect Dis J. 2005;24(7):581–585.
- , , , , , . Prognosis of urinary tract infections with discordant antibiotic treatment [in Spanish]. Rev Clin Esp. 2010;210(11):545–549.
- , , , et al. Appropriateness of empiric antibiotic therapy in urinary tract infection in emergency room [in Spanish]. Rev Clin Esp. 2010;210(1):11–16.
- , , . Principles and Practice of Pediatric Infectious Diseases. 3rd ed. New York, NY: Churchill Livingstone/Elsevier; 2009.
- National Committee for Clinical Laboratory Standards. Performance Standards for Antimicrobial Susceptibility Testing; Twelfth Informational Supplement.Vol M100‐S12. Wayne, PA: NCCLS; 2002.
- , , , et al. Accuracy of administrative billing codes to detect urinary tract infection hospitalizations. Pediatrics. 2011;128(2):323–330.
- , , , . Corticosteroids and mortality in children with bacterial meningitis. JAMA. 2008;299(17):2048–2055.
- , , , , . Enhanced urinalysis as a screening test for urinary tract infection. Pediatrics. 1993;91(6):1196–1199.
- , , , , . Pyuria and bacteriuria in urine specimens obtained by catheter from young children with fever. J Pediatr. 1994;124(4):513–519.
- , , , et al. Clinical and demographic factors associated with urinary tract infection in young febrile infants. Pediatrics. 2005;116(3):644–648.
- , , , , , . Deaths attributed to pediatric complex chronic conditions: national trends and implications for supportive care services. Pediatrics. 2001;107(6):E99.
- Committee on Quality Improvement. Subcommittee on Urinary Tract Infection. Practice parameter: the diagnosis, treatment, and evaluation of the initial urinary tract infection in febrile infants and young children. Pediatrics. 1999;103:843–852.
- , . Antibiotics or surgery for vesicoureteric reflux in children. Lancet. 2004;364(9446):1720–1722.
- , , , et al. Randomized intervention for children with vesicoureteral reflux (RIVUR): background commentary of RIVUR investigators. Pediatrics. 2008;122(suppl 5):S233–S239.
- , , . Length of intravenous antibiotic therapy and treatment failure in infants with urinary tract infections. Pediatrics. 2010;126(2):196–203.
- , , , , , . Vesicoureteral reflux in children with suspected and proven urinary tract infection. Pediatr Nephrol. 2010;25(8):1463–1469.
Copyright © 2012 Society of Hospital Medicine
Pediatric Observation Status Stays
In recent decades, hospital lengths of stay have decreased and there has been a shift toward outpatient management for many pediatric conditions. In 2003, one‐third of all children admitted to US hospitals experienced 1‐day inpatient stays, an increase from 19% in 1993.1 Some hospitals have developed dedicated observation units for the care of children, with select diagnoses, who are expected to respond to less than 24 hours of treatment.26 Expansion of observation services has been suggested as an approach to lessen emergency department (ED) crowding7 and alleviate high‐capacity conditions within hospital inpatient units.8
In contrast to care delivered in a dedicated observation unit, observation status is an administrative label applied to patients who do not meet inpatient criteria as defined by third parties such as InterQual. While the decision to admit a patient is ultimately at the discretion of the ordering physician, many hospitals use predetermined criteria to assign observation status to patients admitted to observation and inpatient units.9 Treatment provided under observation status is designated by hospitals and payers as outpatient care, even when delivered in an inpatient bed.10 As outpatient‐designated care, observation cases do not enter publicly available administrative datasets of hospital discharges that have traditionally been used to understand hospital resource utilization, including the National Hospital Discharge Survey and the Kid's Inpatient Database.11, 12
We hypothesize that there has been an increase in observation status care delivered to children in recent years, and that the majority of children under observation were discharged home without converting to inpatient status. To determine trends in pediatric observation status care, we conducted the first longitudinal, multicenter evaluation of observation status code utilization following ED treatment in a sample of US freestanding children's hospitals. In addition, we focused on the most recent year of data among top ranking diagnoses to assess the current state of observation status stay outcomes (including conversion to inpatient status and return visits).
METHODS
Data Source
Data for this multicenter retrospective cohort study were obtained from the Pediatric Health Information System (PHIS). Freestanding children's hospital's participating in PHIS account for approximately 20% of all US tertiary care children's hospitals. The PHIS hospitals provide resource utilization data including patient demographics, International Classification of Diseases, Ninth Revision (ICD‐9) diagnosis and procedure codes, and charges applied to each stay, including room and nursing charges. Data were de‐identified prior to inclusion in the database, however encrypted identification numbers allowed for tracking individual patients across admissions. Data quality and reliability were assured through a joint effort between the Child Health Corporation of America (CHCA; Shawnee Mission, KS) and participating hospitals as described previously.13, 14 In accordance with the Common Rule (45 CFR 46.102(f)) and the policies of The Children's Hospital of Philadelphia Institutional Review Board, this research, using a de‐identified dataset, was considered exempt from review.
Hospital Selection
Each year from 2004 to 2009, there were 18 hospitals participating in PHIS that reported data from both inpatient discharges and outpatient visits (including observation status discharges). To assess data quality for observation status stays, we evaluated observation status discharges for the presence of associated observation billing codes applied to charge records reported to PHIS including: 1) observation per hour, 2) ED observation time, or 3) other codes mentioning observation in the hospital charge master description document. The 16 hospitals with observation charges assigned to at least 90% of observation status discharges in each study year were selected for analysis.
Visit Identification
Within the 16 study hospitals, we identified all visits between January 1, 2004 and December 31, 2009 with ED facility charges. From these ED visits, we included any stays designated by the hospital as observation or inpatient status, excluding transfers and ED discharges.
Variable Definitions
Hospitals submitting records to PHIS assigned a single patient type to the episode of care. The Observation patient type was assigned to patients discharged from observation status. Although the duration of observation is often less than 24 hours, hospitals may allow a patient to remain under observation for longer durations.15, 16 Duration of stay is not defined precisely enough within PHIS to determine hours of inpatient care. Therefore, length of stay (LOS) was not used to determine observation status stays.
The Inpatient patient type was assigned to patients who were discharged from inpatient status, including those patients admitted to inpatient care from the ED and also those who converted to inpatient status from observation. Patients who converted from observation status to inpatient status during the episode of care could be identified through the presence of observation charge codes as described above.
Given the potential for differences in the application of observation status, we also identified 1‐Day Stays where discharge occurred on the day of, or the day following, an inpatient status admission. These 1‐Day Stays represent hospitalizations that may, by their duration, be suitable for care in an observation unit. We considered discharges in the Observation and 1‐Day Stay categories to be Short‐Stays.
DATA ANALYSIS
For each of the 6 years of study, we calculated the following proportions to determine trends over time: 1) the number of Observation Status admissions from the ED as a proportion of the total number of ED visits resulting in Observation or Inpatient admission, and 2) the number of 1‐Day Stays admitted from the ED as a proportion of the total number of ED visits resulting in Observation or Inpatient admissions. Trends were analyzed using linear regression. Trends were also calculated for the total volume of admissions from the ED and the case‐mix index (CMI). CMI was assessed to evaluate for changes in the severity of illness for children admitted from the ED over the study period. Each hospital's CMI was calculated as an average of their Observation and Inpatient Status discharges' charge weights during the study period. Charge weights were calculated at the All Patient Refined Diagnosis Related Groups (APR‐DRG)/severity of illness level (3M Health Information Systems, St Paul, MN) and were normalized national average charges derived by Thomson‐Reuters from their Pediatric Projected National Database. Weights were then assigned to each discharge based on the discharge's APR‐DRG and severity level assignment.
To assess the current outcomes for observation, we analyzed stays with associated observation billing codes from the most recent year of available data (2009). Stays with Observation patient type were considered to have been discharged from observation, while those with an Inpatient Status patient type were considered to have converted to an inpatient admission during the observation period.
Using the 2009 data, we calculated descriptive statistics for patient characteristics (eg, age, gender, payer) comparing Observation Stays, 1‐Day Stays, and longer‐duration Inpatient admissions using chi‐square statistics. Age was categorized using the American Academy of Pediatrics groupings: <30 days, 30 days1 year, 12 years, 34 years, 512 years, 1317 years, >18 years. Designated payer was categorized into government, private, and other, including self‐pay and uninsured groups.
We used the Severity Classification Systems (SCS) developed for pediatric emergency care to estimate severity of illness for the visit.17 In this 5‐level system, each ICD‐9 diagnosis code is associated with a score related to the intensity of ED resources needed to care for a child with that diagnosis. In our analyses, each case was assigned the maximal SCS category based on the highest severity ICD‐9 code associated with the stay. Within the SCS, a score of 1 indicates minor illness (eg, diaper dermatitis) and 5 indicates major illness (eg, septic shock). The proportions of visits within categorical SCS scores were compared for Observation Stays, 1‐Day Stays, and longer‐duration Inpatient admissions using chi‐square statistics.
We determined the top 10 ranking diagnoses for which children were admitted from the ED in 2009 using the Diagnosis Grouping System (DGS).18 The DGS was designed specifically to categorize pediatric ED visits into clinically meaningful groups. The ICD‐9 code for the principal discharge diagnosis was used to assign records to 1 of the 77 DGS subgroups. Within each of the top ranking DGS subgroups, we determined the proportion of Observation Stays, 1‐Day Stays, and longer‐duration Inpatient admissions.
To provide clinically relevant outcomes of Observation Stays for common conditions, we selected stays with observation charges from within the top 10 ranking observation stay DGS subgroups in 2009. Outcomes for observation included: 1) immediate outcome of the observation stay (ie, discharge or conversion to inpatient status), 2) return visits to the ED in the 3 days following observation, and 3) readmissions to the hospital in the 3 and 30 days following observation. Bivariate comparisons of return visits and readmissions for Observation versus 1‐Day Stays within DGS subgroups were analyzed using chi‐square tests. Multivariate analyses of return visits and readmissions were conducted using Generalized Estimating Equations adjusting for severity of illness by SCS score and clustering by hospital. To account for local practice patterns, we also adjusted for a grouped treatment variable that included the site level proportion of children admitted to Observation Status, 1‐Day‐Stays, and longer Inpatient admissions. All statistical analyses were performed using SAS (version 9.2, SAS Institute, Inc, Cary, NC); P values <0.05 were considered statistically significant.
RESULTS
Trends in Short‐Stays
An increase in proportion of Observation Stays was mirrored by a decrease in proportion of 1‐Day Stays over the study period (Figure 1). In 2009, there were 1.4 times more Observation Stays than 1‐Day Stays (25,653 vs 18,425) compared with 14,242 and 20,747, respectively, in 2004. This shift toward more Observation Stays occurred as hospitals faced a 16% increase in the total number of admissions from the ED (91,318 to 108,217) and change in CMI from 1.48 to 1.51. Over the study period, roughly 40% of all admissions from the ED were Short‐Stays (Observation and 1‐Day Stays). Median LOS for Observation Status stays was 1 day (interquartile range [IQR]: 11).

Patient Characteristics in 2009
Table 1 presents comparisons between Observation, 1‐Day Stays, and longer‐duration Inpatient admissions. Of potential clinical significance, children under Observation Status were slightly younger (median, 4.0 years; IQR: 1.310.0) when compared with children admitted for 1‐Day Stays (median, 5.0 years; IQR: 1.411.4; P < 0.001) and longer‐duration Inpatient stays (median, 4.7 years; IQR: 0.912.2; P < 0.001). Nearly two‐thirds of Observation Status stays had SCS scores of 3 or lower compared with less than half of 1‐Day Stays and longer‐duration Inpatient admissions.
| Short‐Stays | LOS >1 Day | |||||
|---|---|---|---|---|---|---|
| Observation | 1‐Day Stay | Longer Admission | ||||
| N = 25,653* (24%) | N = 18,425* (17%) | P Value Comparing Observation to 1‐Day Stay | N = 64,139* (59%) | P Value Comparing Short‐Stays to LOS >1 Day | ||
| ||||||
| Sex | Male | 14,586 (57) | 10,474 (57) | P = 0.663 | 34,696 (54) | P < 0.001 |
| Female | 11,000 (43) | 7,940 (43) | 29,403 (46) | |||
| Payer | Government | 13,247 (58) | 8,944 (55) | P < 0.001 | 35,475 (61) | P < 0.001 |
| Private | 7,123 (31) | 5,105 (32) | 16,507 (28) | |||
| Other | 2,443 (11) | 2,087 (13) | 6,157 (11) | |||
| Age | <30 days | 793 (3) | 687 (4) | P < 0.001 | 3,932 (6) | P < 0.001 |
| 30 days1 yr | 4,499 (17) | 2,930 (16) | 13,139 (21) | |||
| 12 yr | 5,793 (23) | 3,566 (19) | 10,229 (16) | |||
| 34 yr | 3,040 (12) | 2,056 (11) | 5,551 (9) | |||
| 512 yr | 7,427 (29) | 5,570 (30) | 17,057 (27) | |||
| 1317 yr | 3,560 (14) | 3,136 (17) | 11,860 (18) | |||
| >17 yr | 541 (2) | 480 (3) | 2,371 (4) | |||
| Race | White | 17,249 (70) | 12,123 (70) | P < 0.001 | 40,779 (67) | P <0.001 |
| Black | 6,298 (25) | 4,216 (25) | 16,855 (28) | |||
| Asian | 277 (1) | 295 (2) | 995 (2) | |||
| Other | 885 (4) | 589 (3) | 2,011 (3) | |||
| SCS | 1 Minor illness | 64 (<1) | 37 (<1) | P < 0.001 | 84 (<1) | P < 0.001 |
| 2 | 1,190 (5) | 658 (4) | 1,461 (2) | |||
| 3 | 14,553 (57) | 7,617 (42) | 20,760 (33) | |||
| 4 | 8,994 (36) | 9,317 (51) | 35,632 (56) | |||
| 5 Major illness | 490 (2) | 579 (3) | 5,689 (9) | |||
In 2009, the top 10 DGS subgroups accounted for half of all admissions from the ED. The majority of admissions for extremity fractures, head trauma, dehydration, and asthma were Short‐Stays, as were roughly 50% of admissions for seizures, appendicitis, and gastroenteritis (Table 2). Respiratory infections and asthma were the top 1 and 2 ranking DGS subgroups for Observation Stays, 1‐Day Stays, and longer‐duration Inpatient admissions. While rank order differed, 9 of the 10 top ranking Observation Stay DGS subgroups were also top ranking DGS subgroups for 1‐Day Stays. Gastroenteritis ranked 10th among Observation Stays and 11th among 1‐Day Stays. Diabetes mellitus ranked 26th among Observation Stays compared with 8th among 1‐Day Stays.
| Short‐Stays | LOS >1 Day | ||
|---|---|---|---|
| % Observation | % 1‐Day Stay | % Longer Admission | |
| |||
| All admissions from the ED | 23.7 | 17.0 | 59.3 |
| n = 108,217 | |||
| Respiratory infections | 22.3 | 15.3 | 62.4 |
| n = 14,455 (13%) | |||
| Asthma | 32.0 | 23.8 | 44.2 |
| n = 8,853 (8%) | |||
| Other GI diseases | 24.1 | 16.2 | 59.7 |
| n = 6,519 (6%) | |||
| Appendicitis | 21.0 | 29.5 | 49.5 |
| n = 4,480 (4%) | |||
| Skin infections | 20.7 | 14.3 | 65.0 |
| n = 4,743 (4%) | |||
| Seizures | 29.5 | 22 | 48.5 |
| n = 4,088 (4%) | |||
| Extremity fractures | 49.4 | 20.5 | 30.1 |
| n = 3,681 (3%) | |||
| Dehydration | 37.8 | 19.0 | 43.2 |
| n = 2,773 (3%) | |||
| Gastroenteritis | 30.3 | 18.7 | 50.9 |
| n = 2,603 (2%) | |||
| Head trauma | 44.1 | 43.9 | 32.0 |
| n = 2,153 (2%) | |||
Average maximum SCS scores were clinically comparable for Observation and 1‐Day Stays and generally lower than for longer‐duration Inpatient admissions within the top 10 most common DGS subgroups. Average maximum SCS scores were statistically lower for Observation Stays compared with 1‐Day Stays for respiratory infections (3.2 vs 3.4), asthma (3.4 vs 3.6), diabetes (3.5 vs 3.8), gastroenteritis (3.0 vs 3.1), other gastrointestinal diseases (3.2 vs 3.4), head trauma (3.3 vs 3.5), and extremity fractures (3.2 vs 3.4) (P < 0.01). There were no differences in SCS scores for skin infections (SCS = 3.0) and appendicitis (SCS = 4.0) when comparing Observation and 1‐Day Stays.
Outcomes for Observation Stays in 2009
Within 6 of the top 10 DGS subgroups for Observation Stays, >75% of patients were discharged home from Observation Status (Table 3). Mean LOS for stays that converted from Observation to Inpatient Status ranged from 2.85 days for extremity fractures to 4.66 days for appendicitis.
| Return to ED in 3 Days n = 421 (1.6%) | Hospital Readmissions in 3 Days n = 247 (1.0%) | Hospital Readmissions in 30 Days n = 819 (3.2%) | ||
|---|---|---|---|---|
| DGS subgroup | % Discharged From Observation | Adjusted* Odds Ratio (95% CI) | Adjusted* Odds Ratio (95% CI) | Adjusted* Odds Ratio (95% CI) |
| ||||
| Respiratory infections | 72 | 1.1 (0.71.8) | 0.8 (0.51.3) | 0.9 (0.71.3) |
| Asthma | 80 | 1.3 (0.63.0) | 1.0 (0.61.8) | 0.5 (0.31.0) |
| Other GI diseases | 74 | 0.8 (0.51.3) | 2.2 (1.33.8) | 1.0 (0.71.5) |
| Appendicitis | 82 | NE | NE | NE |
| Skin infections | 68 | 1.8 (0.84.4) | 1.4 (0.45.3) | 0.9 (0.61.6) |
| Seizures | 79 | 0.8 (0.41.6) | 0.8 (0.31.8) | 0.7 (0.51.0) |
| Extremity fractures | 92 | 0.9 (0.42.1) | 0.2 (01.3) | 1.2 (0.53.2) |
| Dehydration | 81 | 0.9 (0.61.4) | 0.8 (0.31.9) | 0.7 (0.41.1) |
| Gastroenteritis | 74 | 0.9 (0.42.0) | 0.6 (0.41.2) | 0.6 (0.41) |
| Head trauma | 92 | 0.6 (0.21.7) | 0.3 (02.1) | 1.0 (0.42.8) |
Among children with Observation Stays for 1 of the top 10 DGS subgroups, adjusted return ED visit rates were <3% and readmission rates were <1.6% within 3 days following the index stay. Thirty‐day readmission rates were highest following observation for other GI illnesses and seizures. In unadjusted analysis, Observation Stays for asthma, respiratory infections, and skin infections were associated with greater proportions of return ED visits when compared with 1‐Day Stays. Differences were no longer statistically significant after adjusting for SCS score, clustering by hospital, and the grouped treatment variable. Adjusted odds of readmission were significantly higher at 3 days following observation for other GI illnesses and lower at 30 days following observation for seizures when compared with 1‐Day Stays (Table 3).
DISCUSSION
In this first, multicenter longitudinal study of pediatric observation following an ED visit, we found that Observation Status code utilization has increased steadily over the past 6 years and, in 2007, the proportion of children admitted to observation status surpassed the proportion of children experiencing a 1‐day inpatient admission. Taken together, Short‐Stays made up more than 40% of the hospital‐based care delivered to children admitted from an ED. Stable trends in CMI over time suggest that observation status may be replacing inpatient status designated care for pediatric Short‐Stays in these hospitals. Our findings suggest the lines between outpatient observation and short‐stay inpatient care are becoming increasingly blurred. These trends have occurred in the setting of changing policies for hospital reimbursement, requirements for patients to meet criteria to qualify for inpatient admissions, and efforts to avoid stays deemed unnecessary or inappropriate by their brief duration.19 Therefore there is a growing need to understand the impact of children under observation on the structure, delivery, and financing of acute hospital care for children.
Our results also have implications for pediatric health services research that relies on hospital administrative databases that do not contain observation stays. Currently, observation stays are systematically excluded from many inpatient administrative datasets.11, 12 Analyses of datasets that do not account for observation stays likely result in underestimation of hospitalization rates and hospital resource utilization for children. This may be particularly important for high‐volume conditions, such as asthma and acute infections, for which children commonly require brief periods of hospital‐based care beyond an ED encounter. Data from pediatric observation status admissions should be consistently included in hospital administrative datasets to allow for more comprehensive analyses of hospital resource utilization among children.
Prior research has shown that the diagnoses commonly treated in pediatric observation units overlap with the diagnoses for which children experience 1‐Day Stays.1, 20 We found a similar pattern of conditions for which children were under Observation Status and 1‐Day Stays with comparable severity of illness between the groups in terms of SCS scores. Our findings imply a need to determine how and why hospitals differentiate Observation Status from 1‐Day‐Stay groups in order to improve the assignment of observation status. Assuming continued pressures from payers to provide more care in outpatient or observation settings, there is potential for expansion of dedicated observation services for children in the US. Without designated observation units or processes to group patients with lower severity conditions, there may be limited opportunities to realize more efficient hospital care simply through the application of the label of observation status.
For more than 30 years, observation services have been provided to children who require a period of monitoring to determine their response to therapy and the need for acute inpatient admission from the ED.21While we were not able to determine the location of care for observation status patients in this study, we know that few children's hospitals have dedicated observation units and, even when an observation unit is present, not all observation status patients are cared for in dedicated observation units.9 This, in essence, means that most children under observation status are cared for in virtual observation by inpatient teams using inpatient beds. If observation patients are treated in inpatient beds and consume the same resources as inpatients, then cost‐savings based on reimbursement contracts with payers may not reflect an actual reduction in services. Pediatric institutions will need to closely monitor the financial implications of observation status given the historical differences in payment for observation and inpatient care.
With more than 70% of children being discharged home following observation, our results are comparable to the published literature2, 5, 6, 22, 23 and guidelines for observation unit operations.24 Similar to prior studies,4, 15, 2530 our results also indicate that return visits and readmissions following observation are uncommon events. Our findings can serve as initial benchmarks for condition‐specific outcomes for pediatric observation care. Studies are needed both to identify the clinical characteristics predictive of successful discharge home from observation and to explore the hospital‐to‐hospital variability in outcomes for observation. Such studies are necessary to identify the most successful healthcare delivery models for pediatric observation stays.
LIMITATIONS
The primary limitation to our results is that data from a subset of freestanding children's hospitals may not reflect observation stays at other children's hospitals or the community hospitals that care for children across the US. Only 18 of 42 current PHIS member hospitals have provided both outpatient visit and inpatient stay data for each year of the study period and were considered eligible. In an effort to ensure the quality of observation stay data, we included the 16 hospitals that assigned observation charges to at least 90% of their observation status stays in the PHIS database. The exclusion of the 2 hospitals where <90% of observation status patients were assigned observation charges likely resulted in an underestimation of the utilization of observation status.
Second, there is potential for misclassification of patient type given institutional variations in the assignment of patient status. The PHIS database does not contain information about the factors that were considered in the assignment of observation status. At the time of admission from the ED, observation or inpatient status is assigned. While this decision is clearly reserved for the admitting physician, the process is not standardized across hospitals.9 Some institutions have Utilization Managers on site to help guide decision‐making, while others allow the assignment to be made by physicians without specific guidance. As a result, some patients may be assigned to observation status at admission and reassigned to inpatient status following Utilization Review, which may bias our results toward overestimation of the number of observation stays that converted to inpatient status.
The third limitation to our results relates to return visits. An accurate assessment of return visits is subject to the patient returning to the same hospital. If children do not return to the same hospital, our results would underestimate return visits and readmissions. In addition, we did not assess the reason for return visit as there was no way to verify if the return visit was truly related to the index visit without detailed chart review. Assuming children return to the same hospital for different reasons, our results would overestimate return visits associated with observation stays. We suspect that many 3‐day return visits result from the progression of acute illness or failure to respond to initial treatment, and 30‐day readmissions reflect recurrent hospital care needs related to chronic illnesses.
Lastly, severity classification is difficult when analyzing administrative datasets without physiologic patient data, and the SCS may not provide enough detail to reveal clinically important differences between patient groups.
CONCLUSIONS
Short‐stay hospitalizations following ED visits are common among children, and the majority of pediatric short‐stays are under observation status. Analyses of inpatient administrative databases that exclude observation stays likely result in an underestimation of hospital resource utilization for children. Efforts are needed to ensure that patients under observation status are accounted for in hospital administrative datasets used for pediatric health services research, and healthcare resource allocation, as it relates to hospital‐based care. While the clinical outcomes for observation patients appear favorable in terms of conversion to inpatient admissions and return visits, the financial implications of observation status care within children's hospitals are currently unknown.
- ,,,,,.Trends in high‐turnover stays among children hospitalized in the United States, 1993–2003.Pediatrics.2009;123(3):996–1002.
- ,,,,.Utilization and unexpected hospitalization rates of a pediatric emergency department 23‐hour observation unit.Pediatr Emerg Care.2008;24(9):589–594.
- ,,.When the patient requires observation not hospitalization.J Nurs Admin.1988;18(10):20–23.
- ,,,.Pediatric observation status beds on an inpatient unit: an integrated care model.Pediatr Emerg Care.2004;20(1):17–21.
- ,,.Use of an observation unit by a pediatric emergency department for common pediatric illnesses.Pediatr Emerg Care.2001;17(5):321–323.
- ,,.The pediatric hybrid observation unit: an analysis of 6477 consecutive patient encounters.Pediatrics.2005;115(5):e535–e542.
- ACEP. Emergency Department Crowding: High‐Impact Solutions. Task Force Report on Boarding.2008. Available at: http://www.acep.org/WorkArea/downloadasset.aspx?id=37960. Accessed July 21, 2010.
- ,,, et al.Children's hospitals do not acutely respond to high occupancy.Pediatrics.2010;125(5):974–981.
- ,,, et al.Differences in observation care practices in US freestanding children's hospitals: are they virtual or real?J Hosp Med.2011. Available at: http://www.cms.gov/transmittals/downloads/R770HO.pdf. Accessed January 10, 2011.
- CMS.Medicare Hospital Manual, Section 455.Department of Health and Human Services, Centers for Medicare and Medicaid Services;2001. Available at: http://www.hcup‐us.ahrq.gov/reports/methods/FinalReportonObservationStatus_v2Final.pdf. Accessed on May 3, 2007.
- HCUP.Methods Series Report #2002–3. Observation Status Related to U.S. Hospital Records. Healthcare Cost and Utilization Project.Rockville, MD:Agency for Healthcare Research and Quality;2002.
- ,.Design and operation of the National Hospital Discharge Survey: 1988 redesign.Vital Health Stat.2000;1(39):1–43.
- ,,,.Corticosteroids and mortality in children with bacterial meningitis.JAMA.2008;299(17):2048–2055.
- ,,,,.Intravenous immunoglobulin in children with streptococcal toxic shock syndrome.Clin Infect Dis.2009;49(9):1369–1376.
- ,,,.Impact of a short stay unit on asthma patients admitted to a tertiary pediatric hospital.Qual Manag Health Care.1997;6(1):14–22.
- ,,.An observation unit in a pediatric emergency department: one children's hospital's experience.J Emerg Nurs.2002;28(5):407–413.
- ,,,.Developing a diagnosis‐based severity classification system for use in emergency medical systems for children. Pediatric Academic Societies' Annual Meeting, Platform Presentation; Toronto, Canada;2007.
- ,,,,.A new diagnosis grouping system for child emergency department visits.Acad Emerg Med.2010;17(2):204–213.
- .Observation medicine: the healthcare system's tincture of time. In: Graff LG, ed.Principles of Observation Medicine.American College of Emergency Physicians;2010. Available at: http://www. acep.org/content.aspx?id=46142. Accessed February 18, 2011.
- ,,,,.High turnover stays for pediatric asthma in the United States: analysis of the 2006 Kids' Inpatient Database.Med Care.2010;48(9):827–833.
- ,,,,.Pediatric observation units in the United States: a systematic review.J Hosp Med.2010;5(3):172–182.
- ,.Observation unit in childrens hospital—adjunct to delivery and teaching of ambulatory pediatric care.N Y State J Med.1980;80(11):1684–1686.
- ,,.Short stay in an outpatient department. An alternative to hospitalization.Am J Dis Child.1972;123(2):128–132.
- ACEP.Practice Management Committee, American College of Emergency Physicians. Management of Observation Units.Irving, TX:American College of Emergency Physicians;1994.
- ,,,,.Return visits to a pediatric emergency department.Pediatr Emerg Care.2004;20(3):166–171.
- ,.Postreduction management of intussusception in a children's hospital emergency department.Pediatrics.2003;112(6 pt 1):1302–1307.
- ,,,,.Pediatric closed head injuries treated in an observation unit.Pediatr Emerg Care.2005;21(10):639–644.
- ,,,.Use of pediatric observation unit for treatment of children with dehydration caused by gastroenteritis.Pediatr Emerg Care.2006;22(1):1–6.
- ,,,.Children with asthma admitted to a pediatric observation unit.Pediatr Emerg Care.2005;21(10):645–649.
- ,,, et al.How well can hospital readmission be predicted in a cohort of hospitalized children? A retrospective, multicenter study.Pediatrics.2009;123(1):286–293.
In recent decades, hospital lengths of stay have decreased and there has been a shift toward outpatient management for many pediatric conditions. In 2003, one‐third of all children admitted to US hospitals experienced 1‐day inpatient stays, an increase from 19% in 1993.1 Some hospitals have developed dedicated observation units for the care of children, with select diagnoses, who are expected to respond to less than 24 hours of treatment.26 Expansion of observation services has been suggested as an approach to lessen emergency department (ED) crowding7 and alleviate high‐capacity conditions within hospital inpatient units.8
In contrast to care delivered in a dedicated observation unit, observation status is an administrative label applied to patients who do not meet inpatient criteria as defined by third parties such as InterQual. While the decision to admit a patient is ultimately at the discretion of the ordering physician, many hospitals use predetermined criteria to assign observation status to patients admitted to observation and inpatient units.9 Treatment provided under observation status is designated by hospitals and payers as outpatient care, even when delivered in an inpatient bed.10 As outpatient‐designated care, observation cases do not enter publicly available administrative datasets of hospital discharges that have traditionally been used to understand hospital resource utilization, including the National Hospital Discharge Survey and the Kid's Inpatient Database.11, 12
We hypothesize that there has been an increase in observation status care delivered to children in recent years, and that the majority of children under observation were discharged home without converting to inpatient status. To determine trends in pediatric observation status care, we conducted the first longitudinal, multicenter evaluation of observation status code utilization following ED treatment in a sample of US freestanding children's hospitals. In addition, we focused on the most recent year of data among top ranking diagnoses to assess the current state of observation status stay outcomes (including conversion to inpatient status and return visits).
METHODS
Data Source
Data for this multicenter retrospective cohort study were obtained from the Pediatric Health Information System (PHIS). Freestanding children's hospital's participating in PHIS account for approximately 20% of all US tertiary care children's hospitals. The PHIS hospitals provide resource utilization data including patient demographics, International Classification of Diseases, Ninth Revision (ICD‐9) diagnosis and procedure codes, and charges applied to each stay, including room and nursing charges. Data were de‐identified prior to inclusion in the database, however encrypted identification numbers allowed for tracking individual patients across admissions. Data quality and reliability were assured through a joint effort between the Child Health Corporation of America (CHCA; Shawnee Mission, KS) and participating hospitals as described previously.13, 14 In accordance with the Common Rule (45 CFR 46.102(f)) and the policies of The Children's Hospital of Philadelphia Institutional Review Board, this research, using a de‐identified dataset, was considered exempt from review.
Hospital Selection
Each year from 2004 to 2009, there were 18 hospitals participating in PHIS that reported data from both inpatient discharges and outpatient visits (including observation status discharges). To assess data quality for observation status stays, we evaluated observation status discharges for the presence of associated observation billing codes applied to charge records reported to PHIS including: 1) observation per hour, 2) ED observation time, or 3) other codes mentioning observation in the hospital charge master description document. The 16 hospitals with observation charges assigned to at least 90% of observation status discharges in each study year were selected for analysis.
Visit Identification
Within the 16 study hospitals, we identified all visits between January 1, 2004 and December 31, 2009 with ED facility charges. From these ED visits, we included any stays designated by the hospital as observation or inpatient status, excluding transfers and ED discharges.
Variable Definitions
Hospitals submitting records to PHIS assigned a single patient type to the episode of care. The Observation patient type was assigned to patients discharged from observation status. Although the duration of observation is often less than 24 hours, hospitals may allow a patient to remain under observation for longer durations.15, 16 Duration of stay is not defined precisely enough within PHIS to determine hours of inpatient care. Therefore, length of stay (LOS) was not used to determine observation status stays.
The Inpatient patient type was assigned to patients who were discharged from inpatient status, including those patients admitted to inpatient care from the ED and also those who converted to inpatient status from observation. Patients who converted from observation status to inpatient status during the episode of care could be identified through the presence of observation charge codes as described above.
Given the potential for differences in the application of observation status, we also identified 1‐Day Stays where discharge occurred on the day of, or the day following, an inpatient status admission. These 1‐Day Stays represent hospitalizations that may, by their duration, be suitable for care in an observation unit. We considered discharges in the Observation and 1‐Day Stay categories to be Short‐Stays.
DATA ANALYSIS
For each of the 6 years of study, we calculated the following proportions to determine trends over time: 1) the number of Observation Status admissions from the ED as a proportion of the total number of ED visits resulting in Observation or Inpatient admission, and 2) the number of 1‐Day Stays admitted from the ED as a proportion of the total number of ED visits resulting in Observation or Inpatient admissions. Trends were analyzed using linear regression. Trends were also calculated for the total volume of admissions from the ED and the case‐mix index (CMI). CMI was assessed to evaluate for changes in the severity of illness for children admitted from the ED over the study period. Each hospital's CMI was calculated as an average of their Observation and Inpatient Status discharges' charge weights during the study period. Charge weights were calculated at the All Patient Refined Diagnosis Related Groups (APR‐DRG)/severity of illness level (3M Health Information Systems, St Paul, MN) and were normalized national average charges derived by Thomson‐Reuters from their Pediatric Projected National Database. Weights were then assigned to each discharge based on the discharge's APR‐DRG and severity level assignment.
To assess the current outcomes for observation, we analyzed stays with associated observation billing codes from the most recent year of available data (2009). Stays with Observation patient type were considered to have been discharged from observation, while those with an Inpatient Status patient type were considered to have converted to an inpatient admission during the observation period.
Using the 2009 data, we calculated descriptive statistics for patient characteristics (eg, age, gender, payer) comparing Observation Stays, 1‐Day Stays, and longer‐duration Inpatient admissions using chi‐square statistics. Age was categorized using the American Academy of Pediatrics groupings: <30 days, 30 days1 year, 12 years, 34 years, 512 years, 1317 years, >18 years. Designated payer was categorized into government, private, and other, including self‐pay and uninsured groups.
We used the Severity Classification Systems (SCS) developed for pediatric emergency care to estimate severity of illness for the visit.17 In this 5‐level system, each ICD‐9 diagnosis code is associated with a score related to the intensity of ED resources needed to care for a child with that diagnosis. In our analyses, each case was assigned the maximal SCS category based on the highest severity ICD‐9 code associated with the stay. Within the SCS, a score of 1 indicates minor illness (eg, diaper dermatitis) and 5 indicates major illness (eg, septic shock). The proportions of visits within categorical SCS scores were compared for Observation Stays, 1‐Day Stays, and longer‐duration Inpatient admissions using chi‐square statistics.
We determined the top 10 ranking diagnoses for which children were admitted from the ED in 2009 using the Diagnosis Grouping System (DGS).18 The DGS was designed specifically to categorize pediatric ED visits into clinically meaningful groups. The ICD‐9 code for the principal discharge diagnosis was used to assign records to 1 of the 77 DGS subgroups. Within each of the top ranking DGS subgroups, we determined the proportion of Observation Stays, 1‐Day Stays, and longer‐duration Inpatient admissions.
To provide clinically relevant outcomes of Observation Stays for common conditions, we selected stays with observation charges from within the top 10 ranking observation stay DGS subgroups in 2009. Outcomes for observation included: 1) immediate outcome of the observation stay (ie, discharge or conversion to inpatient status), 2) return visits to the ED in the 3 days following observation, and 3) readmissions to the hospital in the 3 and 30 days following observation. Bivariate comparisons of return visits and readmissions for Observation versus 1‐Day Stays within DGS subgroups were analyzed using chi‐square tests. Multivariate analyses of return visits and readmissions were conducted using Generalized Estimating Equations adjusting for severity of illness by SCS score and clustering by hospital. To account for local practice patterns, we also adjusted for a grouped treatment variable that included the site level proportion of children admitted to Observation Status, 1‐Day‐Stays, and longer Inpatient admissions. All statistical analyses were performed using SAS (version 9.2, SAS Institute, Inc, Cary, NC); P values <0.05 were considered statistically significant.
RESULTS
Trends in Short‐Stays
An increase in proportion of Observation Stays was mirrored by a decrease in proportion of 1‐Day Stays over the study period (Figure 1). In 2009, there were 1.4 times more Observation Stays than 1‐Day Stays (25,653 vs 18,425) compared with 14,242 and 20,747, respectively, in 2004. This shift toward more Observation Stays occurred as hospitals faced a 16% increase in the total number of admissions from the ED (91,318 to 108,217) and change in CMI from 1.48 to 1.51. Over the study period, roughly 40% of all admissions from the ED were Short‐Stays (Observation and 1‐Day Stays). Median LOS for Observation Status stays was 1 day (interquartile range [IQR]: 11).
Patient Characteristics in 2009
Table 1 presents comparisons between Observation, 1‐Day Stays, and longer‐duration Inpatient admissions. Of potential clinical significance, children under Observation Status were slightly younger (median, 4.0 years; IQR: 1.310.0) when compared with children admitted for 1‐Day Stays (median, 5.0 years; IQR: 1.411.4; P < 0.001) and longer‐duration Inpatient stays (median, 4.7 years; IQR: 0.912.2; P < 0.001). Nearly two‐thirds of Observation Status stays had SCS scores of 3 or lower compared with less than half of 1‐Day Stays and longer‐duration Inpatient admissions.
| Short‐Stays | LOS >1 Day | |||||
|---|---|---|---|---|---|---|
| Observation | 1‐Day Stay | Longer Admission | ||||
| N = 25,653* (24%) | N = 18,425* (17%) | P Value Comparing Observation to 1‐Day Stay | N = 64,139* (59%) | P Value Comparing Short‐Stays to LOS >1 Day | ||
| ||||||
| Sex | Male | 14,586 (57) | 10,474 (57) | P = 0.663 | 34,696 (54) | P < 0.001 |
| Female | 11,000 (43) | 7,940 (43) | 29,403 (46) | |||
| Payer | Government | 13,247 (58) | 8,944 (55) | P < 0.001 | 35,475 (61) | P < 0.001 |
| Private | 7,123 (31) | 5,105 (32) | 16,507 (28) | |||
| Other | 2,443 (11) | 2,087 (13) | 6,157 (11) | |||
| Age | <30 days | 793 (3) | 687 (4) | P < 0.001 | 3,932 (6) | P < 0.001 |
| 30 days1 yr | 4,499 (17) | 2,930 (16) | 13,139 (21) | |||
| 12 yr | 5,793 (23) | 3,566 (19) | 10,229 (16) | |||
| 34 yr | 3,040 (12) | 2,056 (11) | 5,551 (9) | |||
| 512 yr | 7,427 (29) | 5,570 (30) | 17,057 (27) | |||
| 1317 yr | 3,560 (14) | 3,136 (17) | 11,860 (18) | |||
| >17 yr | 541 (2) | 480 (3) | 2,371 (4) | |||
| Race | White | 17,249 (70) | 12,123 (70) | P < 0.001 | 40,779 (67) | P <0.001 |
| Black | 6,298 (25) | 4,216 (25) | 16,855 (28) | |||
| Asian | 277 (1) | 295 (2) | 995 (2) | |||
| Other | 885 (4) | 589 (3) | 2,011 (3) | |||
| SCS | 1 Minor illness | 64 (<1) | 37 (<1) | P < 0.001 | 84 (<1) | P < 0.001 |
| 2 | 1,190 (5) | 658 (4) | 1,461 (2) | |||
| 3 | 14,553 (57) | 7,617 (42) | 20,760 (33) | |||
| 4 | 8,994 (36) | 9,317 (51) | 35,632 (56) | |||
| 5 Major illness | 490 (2) | 579 (3) | 5,689 (9) | |||
In 2009, the top 10 DGS subgroups accounted for half of all admissions from the ED. The majority of admissions for extremity fractures, head trauma, dehydration, and asthma were Short‐Stays, as were roughly 50% of admissions for seizures, appendicitis, and gastroenteritis (Table 2). Respiratory infections and asthma were the top 1 and 2 ranking DGS subgroups for Observation Stays, 1‐Day Stays, and longer‐duration Inpatient admissions. While rank order differed, 9 of the 10 top ranking Observation Stay DGS subgroups were also top ranking DGS subgroups for 1‐Day Stays. Gastroenteritis ranked 10th among Observation Stays and 11th among 1‐Day Stays. Diabetes mellitus ranked 26th among Observation Stays compared with 8th among 1‐Day Stays.
| Short‐Stays | LOS >1 Day | ||
|---|---|---|---|
| % Observation | % 1‐Day Stay | % Longer Admission | |
| |||
| All admissions from the ED | 23.7 | 17.0 | 59.3 |
| n = 108,217 | |||
| Respiratory infections | 22.3 | 15.3 | 62.4 |
| n = 14,455 (13%) | |||
| Asthma | 32.0 | 23.8 | 44.2 |
| n = 8,853 (8%) | |||
| Other GI diseases | 24.1 | 16.2 | 59.7 |
| n = 6,519 (6%) | |||
| Appendicitis | 21.0 | 29.5 | 49.5 |
| n = 4,480 (4%) | |||
| Skin infections | 20.7 | 14.3 | 65.0 |
| n = 4,743 (4%) | |||
| Seizures | 29.5 | 22 | 48.5 |
| n = 4,088 (4%) | |||
| Extremity fractures | 49.4 | 20.5 | 30.1 |
| n = 3,681 (3%) | |||
| Dehydration | 37.8 | 19.0 | 43.2 |
| n = 2,773 (3%) | |||
| Gastroenteritis | 30.3 | 18.7 | 50.9 |
| n = 2,603 (2%) | |||
| Head trauma | 44.1 | 43.9 | 32.0 |
| n = 2,153 (2%) | |||
Average maximum SCS scores were clinically comparable for Observation and 1‐Day Stays and generally lower than for longer‐duration Inpatient admissions within the top 10 most common DGS subgroups. Average maximum SCS scores were statistically lower for Observation Stays compared with 1‐Day Stays for respiratory infections (3.2 vs 3.4), asthma (3.4 vs 3.6), diabetes (3.5 vs 3.8), gastroenteritis (3.0 vs 3.1), other gastrointestinal diseases (3.2 vs 3.4), head trauma (3.3 vs 3.5), and extremity fractures (3.2 vs 3.4) (P < 0.01). There were no differences in SCS scores for skin infections (SCS = 3.0) and appendicitis (SCS = 4.0) when comparing Observation and 1‐Day Stays.
Outcomes for Observation Stays in 2009
Within 6 of the top 10 DGS subgroups for Observation Stays, >75% of patients were discharged home from Observation Status (Table 3). Mean LOS for stays that converted from Observation to Inpatient Status ranged from 2.85 days for extremity fractures to 4.66 days for appendicitis.
| Return to ED in 3 Days n = 421 (1.6%) | Hospital Readmissions in 3 Days n = 247 (1.0%) | Hospital Readmissions in 30 Days n = 819 (3.2%) | ||
|---|---|---|---|---|
| DGS subgroup | % Discharged From Observation | Adjusted* Odds Ratio (95% CI) | Adjusted* Odds Ratio (95% CI) | Adjusted* Odds Ratio (95% CI) |
| ||||
| Respiratory infections | 72 | 1.1 (0.71.8) | 0.8 (0.51.3) | 0.9 (0.71.3) |
| Asthma | 80 | 1.3 (0.63.0) | 1.0 (0.61.8) | 0.5 (0.31.0) |
| Other GI diseases | 74 | 0.8 (0.51.3) | 2.2 (1.33.8) | 1.0 (0.71.5) |
| Appendicitis | 82 | NE | NE | NE |
| Skin infections | 68 | 1.8 (0.84.4) | 1.4 (0.45.3) | 0.9 (0.61.6) |
| Seizures | 79 | 0.8 (0.41.6) | 0.8 (0.31.8) | 0.7 (0.51.0) |
| Extremity fractures | 92 | 0.9 (0.42.1) | 0.2 (01.3) | 1.2 (0.53.2) |
| Dehydration | 81 | 0.9 (0.61.4) | 0.8 (0.31.9) | 0.7 (0.41.1) |
| Gastroenteritis | 74 | 0.9 (0.42.0) | 0.6 (0.41.2) | 0.6 (0.41) |
| Head trauma | 92 | 0.6 (0.21.7) | 0.3 (02.1) | 1.0 (0.42.8) |
Among children with Observation Stays for 1 of the top 10 DGS subgroups, adjusted return ED visit rates were <3% and readmission rates were <1.6% within 3 days following the index stay. Thirty‐day readmission rates were highest following observation for other GI illnesses and seizures. In unadjusted analysis, Observation Stays for asthma, respiratory infections, and skin infections were associated with greater proportions of return ED visits when compared with 1‐Day Stays. Differences were no longer statistically significant after adjusting for SCS score, clustering by hospital, and the grouped treatment variable. Adjusted odds of readmission were significantly higher at 3 days following observation for other GI illnesses and lower at 30 days following observation for seizures when compared with 1‐Day Stays (Table 3).
DISCUSSION
In this first, multicenter longitudinal study of pediatric observation following an ED visit, we found that Observation Status code utilization has increased steadily over the past 6 years and, in 2007, the proportion of children admitted to observation status surpassed the proportion of children experiencing a 1‐day inpatient admission. Taken together, Short‐Stays made up more than 40% of the hospital‐based care delivered to children admitted from an ED. Stable trends in CMI over time suggest that observation status may be replacing inpatient status designated care for pediatric Short‐Stays in these hospitals. Our findings suggest the lines between outpatient observation and short‐stay inpatient care are becoming increasingly blurred. These trends have occurred in the setting of changing policies for hospital reimbursement, requirements for patients to meet criteria to qualify for inpatient admissions, and efforts to avoid stays deemed unnecessary or inappropriate by their brief duration.19 Therefore there is a growing need to understand the impact of children under observation on the structure, delivery, and financing of acute hospital care for children.
Our results also have implications for pediatric health services research that relies on hospital administrative databases that do not contain observation stays. Currently, observation stays are systematically excluded from many inpatient administrative datasets.11, 12 Analyses of datasets that do not account for observation stays likely result in underestimation of hospitalization rates and hospital resource utilization for children. This may be particularly important for high‐volume conditions, such as asthma and acute infections, for which children commonly require brief periods of hospital‐based care beyond an ED encounter. Data from pediatric observation status admissions should be consistently included in hospital administrative datasets to allow for more comprehensive analyses of hospital resource utilization among children.
Prior research has shown that the diagnoses commonly treated in pediatric observation units overlap with the diagnoses for which children experience 1‐Day Stays.1, 20 We found a similar pattern of conditions for which children were under Observation Status and 1‐Day Stays with comparable severity of illness between the groups in terms of SCS scores. Our findings imply a need to determine how and why hospitals differentiate Observation Status from 1‐Day‐Stay groups in order to improve the assignment of observation status. Assuming continued pressures from payers to provide more care in outpatient or observation settings, there is potential for expansion of dedicated observation services for children in the US. Without designated observation units or processes to group patients with lower severity conditions, there may be limited opportunities to realize more efficient hospital care simply through the application of the label of observation status.
For more than 30 years, observation services have been provided to children who require a period of monitoring to determine their response to therapy and the need for acute inpatient admission from the ED.21While we were not able to determine the location of care for observation status patients in this study, we know that few children's hospitals have dedicated observation units and, even when an observation unit is present, not all observation status patients are cared for in dedicated observation units.9 This, in essence, means that most children under observation status are cared for in virtual observation by inpatient teams using inpatient beds. If observation patients are treated in inpatient beds and consume the same resources as inpatients, then cost‐savings based on reimbursement contracts with payers may not reflect an actual reduction in services. Pediatric institutions will need to closely monitor the financial implications of observation status given the historical differences in payment for observation and inpatient care.
With more than 70% of children being discharged home following observation, our results are comparable to the published literature2, 5, 6, 22, 23 and guidelines for observation unit operations.24 Similar to prior studies,4, 15, 2530 our results also indicate that return visits and readmissions following observation are uncommon events. Our findings can serve as initial benchmarks for condition‐specific outcomes for pediatric observation care. Studies are needed both to identify the clinical characteristics predictive of successful discharge home from observation and to explore the hospital‐to‐hospital variability in outcomes for observation. Such studies are necessary to identify the most successful healthcare delivery models for pediatric observation stays.
LIMITATIONS
The primary limitation to our results is that data from a subset of freestanding children's hospitals may not reflect observation stays at other children's hospitals or the community hospitals that care for children across the US. Only 18 of 42 current PHIS member hospitals have provided both outpatient visit and inpatient stay data for each year of the study period and were considered eligible. In an effort to ensure the quality of observation stay data, we included the 16 hospitals that assigned observation charges to at least 90% of their observation status stays in the PHIS database. The exclusion of the 2 hospitals where <90% of observation status patients were assigned observation charges likely resulted in an underestimation of the utilization of observation status.
Second, there is potential for misclassification of patient type given institutional variations in the assignment of patient status. The PHIS database does not contain information about the factors that were considered in the assignment of observation status. At the time of admission from the ED, observation or inpatient status is assigned. While this decision is clearly reserved for the admitting physician, the process is not standardized across hospitals.9 Some institutions have Utilization Managers on site to help guide decision‐making, while others allow the assignment to be made by physicians without specific guidance. As a result, some patients may be assigned to observation status at admission and reassigned to inpatient status following Utilization Review, which may bias our results toward overestimation of the number of observation stays that converted to inpatient status.
The third limitation to our results relates to return visits. An accurate assessment of return visits is subject to the patient returning to the same hospital. If children do not return to the same hospital, our results would underestimate return visits and readmissions. In addition, we did not assess the reason for return visit as there was no way to verify if the return visit was truly related to the index visit without detailed chart review. Assuming children return to the same hospital for different reasons, our results would overestimate return visits associated with observation stays. We suspect that many 3‐day return visits result from the progression of acute illness or failure to respond to initial treatment, and 30‐day readmissions reflect recurrent hospital care needs related to chronic illnesses.
Lastly, severity classification is difficult when analyzing administrative datasets without physiologic patient data, and the SCS may not provide enough detail to reveal clinically important differences between patient groups.
CONCLUSIONS
Short‐stay hospitalizations following ED visits are common among children, and the majority of pediatric short‐stays are under observation status. Analyses of inpatient administrative databases that exclude observation stays likely result in an underestimation of hospital resource utilization for children. Efforts are needed to ensure that patients under observation status are accounted for in hospital administrative datasets used for pediatric health services research, and healthcare resource allocation, as it relates to hospital‐based care. While the clinical outcomes for observation patients appear favorable in terms of conversion to inpatient admissions and return visits, the financial implications of observation status care within children's hospitals are currently unknown.
- ,,,,,.Trends in high‐turnover stays among children hospitalized in the United States, 1993–2003.Pediatrics.2009;123(3):996–1002.
- ,,,,.Utilization and unexpected hospitalization rates of a pediatric emergency department 23‐hour observation unit.Pediatr Emerg Care.2008;24(9):589–594.
- ,,.When the patient requires observation not hospitalization.J Nurs Admin.1988;18(10):20–23.
- ,,,.Pediatric observation status beds on an inpatient unit: an integrated care model.Pediatr Emerg Care.2004;20(1):17–21.
- ,,.Use of an observation unit by a pediatric emergency department for common pediatric illnesses.Pediatr Emerg Care.2001;17(5):321–323.
- ,,.The pediatric hybrid observation unit: an analysis of 6477 consecutive patient encounters.Pediatrics.2005;115(5):e535–e542.
- ACEP. Emergency Department Crowding: High‐Impact Solutions. Task Force Report on Boarding.2008. Available at: http://www.acep.org/WorkArea/downloadasset.aspx?id=37960. Accessed July 21, 2010.
- ,,, et al.Children's hospitals do not acutely respond to high occupancy.Pediatrics.2010;125(5):974–981.
- ,,, et al.Differences in observation care practices in US freestanding children's hospitals: are they virtual or real?J Hosp Med.2011. Available at: http://www.cms.gov/transmittals/downloads/R770HO.pdf. Accessed January 10, 2011.
- CMS.Medicare Hospital Manual, Section 455.Department of Health and Human Services, Centers for Medicare and Medicaid Services;2001. Available at: http://www.hcup‐us.ahrq.gov/reports/methods/FinalReportonObservationStatus_v2Final.pdf. Accessed on May 3, 2007.
- HCUP.Methods Series Report #2002–3. Observation Status Related to U.S. Hospital Records. Healthcare Cost and Utilization Project.Rockville, MD:Agency for Healthcare Research and Quality;2002.
- ,.Design and operation of the National Hospital Discharge Survey: 1988 redesign.Vital Health Stat.2000;1(39):1–43.
- ,,,.Corticosteroids and mortality in children with bacterial meningitis.JAMA.2008;299(17):2048–2055.
- ,,,,.Intravenous immunoglobulin in children with streptococcal toxic shock syndrome.Clin Infect Dis.2009;49(9):1369–1376.
- ,,,.Impact of a short stay unit on asthma patients admitted to a tertiary pediatric hospital.Qual Manag Health Care.1997;6(1):14–22.
- ,,.An observation unit in a pediatric emergency department: one children's hospital's experience.J Emerg Nurs.2002;28(5):407–413.
- ,,,.Developing a diagnosis‐based severity classification system for use in emergency medical systems for children. Pediatric Academic Societies' Annual Meeting, Platform Presentation; Toronto, Canada;2007.
- ,,,,.A new diagnosis grouping system for child emergency department visits.Acad Emerg Med.2010;17(2):204–213.
- .Observation medicine: the healthcare system's tincture of time. In: Graff LG, ed.Principles of Observation Medicine.American College of Emergency Physicians;2010. Available at: http://www. acep.org/content.aspx?id=46142. Accessed February 18, 2011.
- ,,,,.High turnover stays for pediatric asthma in the United States: analysis of the 2006 Kids' Inpatient Database.Med Care.2010;48(9):827–833.
- ,,,,.Pediatric observation units in the United States: a systematic review.J Hosp Med.2010;5(3):172–182.
- ,.Observation unit in childrens hospital—adjunct to delivery and teaching of ambulatory pediatric care.N Y State J Med.1980;80(11):1684–1686.
- ,,.Short stay in an outpatient department. An alternative to hospitalization.Am J Dis Child.1972;123(2):128–132.
- ACEP.Practice Management Committee, American College of Emergency Physicians. Management of Observation Units.Irving, TX:American College of Emergency Physicians;1994.
- ,,,,.Return visits to a pediatric emergency department.Pediatr Emerg Care.2004;20(3):166–171.
- ,.Postreduction management of intussusception in a children's hospital emergency department.Pediatrics.2003;112(6 pt 1):1302–1307.
- ,,,,.Pediatric closed head injuries treated in an observation unit.Pediatr Emerg Care.2005;21(10):639–644.
- ,,,.Use of pediatric observation unit for treatment of children with dehydration caused by gastroenteritis.Pediatr Emerg Care.2006;22(1):1–6.
- ,,,.Children with asthma admitted to a pediatric observation unit.Pediatr Emerg Care.2005;21(10):645–649.
- ,,, et al.How well can hospital readmission be predicted in a cohort of hospitalized children? A retrospective, multicenter study.Pediatrics.2009;123(1):286–293.
Copyright © 2012 Society of Hospital Medicine
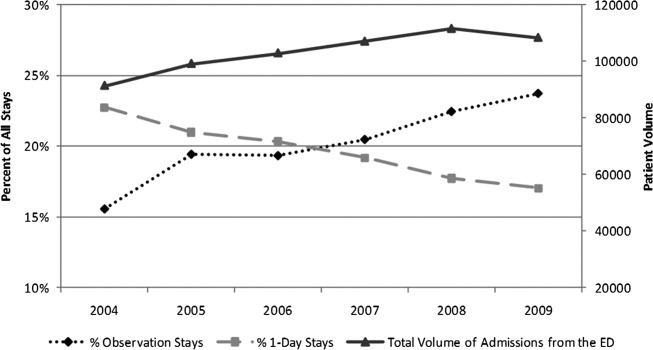
Observation Care in Children's Hospitals
Observation medicine has grown in recent decades out of changes in policies for hospital reimbursement, requirements for patients to meet admission criteria to qualify for inpatient admission, and efforts to avoid unnecessary or inappropriate admissions.1 Emergency physicians are frequently faced with patients who are too sick to be discharged home, but do not clearly meet criteria for an inpatient status admission. These patients often receive extended outpatient services (typically extending 24 to 48 hours) under the designation of observation status, in order to determine their response to treatment and need for hospitalization.
Observation care delivered to adult patients has increased substantially in recent years, and the confusion around the designation of observation versus inpatient care has received increasing attention in the lay press.27 According to the Centers for Medicare and Medicaid Services (CMS)8:
Observation care is a well‐defined set of specific, clinically appropriate services, which include ongoing short term treatment, assessment, and reassessment before a decision can be made regarding whether patients will require further treatment as hospital inpatients. Observation services are commonly ordered for patients who present to the emergency department and who then require a significant period of treatment or monitoring in order to make a decision concerning their admission or discharge.
Observation status is an administrative label that is applied to patients who do not meet inpatient level of care criteria, as defined by third parties such as InterQual. These criteria usually include a combination of the patient's clinical diagnoses, severity of illness, and expected needs for monitoring and interventions, in order to determine the admission status to which the patient may be assigned (eg, observation, inpatient, or intensive care). Observation services can be provided, in a variety of settings, to those patients who do not meet inpatient level of care but require a period of observation. Some hospitals provide observation care in discrete units in the emergency department (ED) or specific inpatient unit, and others have no designated unit but scatter observation patients throughout the institution, termed virtual observation units.9
For more than 30 years, observation unit (OU) admission has offered an alternative to traditional inpatient hospitalization for children with a variety of acute conditions.10, 11 Historically, the published literature on observation care for children in the United States has been largely based in dedicated emergency department OUs.12 Yet, in a 2001 survey of 21 pediatric EDs, just 6 reported the presence of a 23‐hour unit.13 There are single‐site examples of observation care delivered in other settings.14, 15 In 2 national surveys of US General Hospitals, 25% provided observation services in beds adjacent to the ED, and the remainder provided observation services in hospital inpatient units.16, 17 However, we are not aware of any previous multi‐institution studies exploring hospital‐wide practices related to observation care for children.
Recognizing that observation status can be designated using various standards, and that observation care can be delivered in locations outside of dedicated OUs,9 we developed 2 web‐based surveys to examine the current models of pediatric observation medicine in US children's hospitals. We hypothesized that observation care is most commonly applied as a billing designation and does not necessarily represent care delivered in a structurally or functionally distinct OU, nor does it represent a difference in care provided to those patients with inpatient designation.
METHODS
Study Design
Two web‐based surveys were distributed, in April 2010, to the 42 freestanding, tertiary care children's hospitals affiliated with the Child Health Corporation of America (CHCA; Shawnee Mission, KS) which contribute data to the Pediatric Health Information System (PHIS) database. The PHIS is a national administrative database that contains resource utilization data from participating hospitals located in noncompeting markets of 27 states plus the District of Columbia. These hospitals account for 20% of all tertiary care children's hospitals in the United States.
Survey Content
Survey 1
A survey of hospital observation status practices has been developed by CHCA as a part of the PHIS data quality initiative (see Supporting Appendix: Survey 1 in the online version of this article). Hospitals that did not provide observation patient data to PHIS were excluded after an initial screening question. This survey obtained information regarding the designation of observation status within each hospital. Hospitals provided free‐text responses to questions related to the criteria used to define observation, and to admit patients into observation status. Fixed‐choice response questions were used to determine specific observation status utilization criteria and clinical guidelines (eg, InterQual and Milliman) used by hospitals for the designation of observation status to patients.
Survey 2
We developed a detailed follow‐up survey in order to characterize the structures and processes of care associated with observation status (see Supporting Appendix: Survey 2 in the online version of this article). Within the follow‐up survey, an initial screening question was used to determine all types of patients to which observation status is assigned within the responding hospitals. All other questions in Survey 2 were focused specifically on those patients who required additional care following ED evaluation and treatment. Fixed‐choice response questions were used to explore differences in care for patients under observation and those admitted as inpatients. We also inquired of hospital practices related to boarding of patients in the ED while awaiting admission to an inpatient bed.
Survey Distribution
Two web‐based surveys were distributed to all 42 CHCA hospitals that contribute data to PHIS. During the month of April 2010, each hospital's designated PHIS operational contact received e‐mail correspondence requesting their participation in each survey. Within hospitals participating in PHIS, Operational Contacts have been assigned to serve as the day‐to‐day PHIS contact person based upon their experience working with the PHIS data. The Operational Contacts are CHCA's primary contact for issues related to the hospital's data quality and reporting to PHIS. Non‐responders were contacted by e‐mail for additional requests to complete the surveys. Each e‐mail provided an introduction to the topic of the survey and a link to complete the survey. The e‐mail requesting participation in Survey 1 was distributed the first week of April 2010, and the survey was open for responses during the first 3 weeks of the month. The e‐mail requesting participation in Survey 2 was sent the third week of April 2010, and the survey was open for responses during the subsequent 2 weeks.
DATA ANALYSIS
Survey responses were collected and are presented as a descriptive summary of results. Hospital characteristics were summarized with medians and interquartile ranges for continuous variables, and with percents for categorical variables. Characteristics were compared between hospitals that responded and those that did not respond to Survey 2 using Wilcoxon rank‐sum tests and chi‐square tests as appropriate. All analyses were performed using SAS v.9.2 (SAS Institute, Cary, NC), and a P value <0.05 was considered statistically significant. The study was reviewed by the University of Michigan Institutional Review Board and considered exempt.
RESULTS
Responses to Survey 1 were available from 37 of 42 (88%) of PHIS hospitals (Figure 1). For Survey 2, we received responses from 20 of 42 (48%) of PHIS hospitals. Based on information available from Survey 1, we know that 20 of the 31 (65%) PHIS hospitals that report observation status patient data to PHIS responded to Survey 2. Characteristics of the hospitals responding and not responding to Survey 2 are presented in Table 1. Respondents provided hospital identifying information which allowed for the linkage of data, from Survey 1, to 17 of the 20 hospitals responding to Survey 2. We did not have information available to link responses from 3 hospitals.
| Respondent N = 20 | Non‐Respondent N = 22 | P Value | |
|---|---|---|---|
| |||
| No. of inpatient beds Median [IQR] (excluding Obstetrics) | 245 [219283] | 282 [250381] | 0.076 |
| Annual admissions Median [IQR] (excluding births) | 11,658 [8,64213,213] | 13,522 [9,83018,705] | 0.106 |
| ED volume Median [IQR] | 60,528 [47,85082,955] | 64,486 [47,38684,450] | 0.640 |
| Percent government payer Median [IQR] | 53% [4662] | 49% [4158] | 0.528 |
| Region | |||
| Northeast | 37% | 0% | 0.021 |
| Midwest | 21% | 33% | |
| South | 21% | 50% | |
| West | 21% | 17% | |
| Reports observation status patients to PHIS | 85% | 90% | 0.555 |
Based on responses to the surveys and our knowledge of data reported to PHIS, our current understanding of patient flow from ED through observation to discharge home, and the application of observation status to the encounter, is presented in Figure 2. According to free‐text responses to Survey 1, various methods were applied to designate observation status (gray shaded boxes in Figure 2). Fixed‐choice responses to Survey 2 revealed that observation status patients were cared for in a variety of locations within hospitals, including ED beds, designated observation units, and inpatient beds (dashed boxes in Figure 2). Not every facility utilized all of the listed locations for observation care. Space constraints could dictate the location of care, regardless of patient status (eg, observation vs inpatient), in hospitals with more than one location of care available to observation patients. While patient status could change during a visit, only the final patient status at discharge enters the administrative record submitted to PHIS (black boxes in Figure 2). Facility charges for observation remained a part of the visit record and were reported to PHIS. Hospitals may or may not bill for all assigned charges depending on patient status, length of stay, or other specific criteria determined by contracts with individual payers.
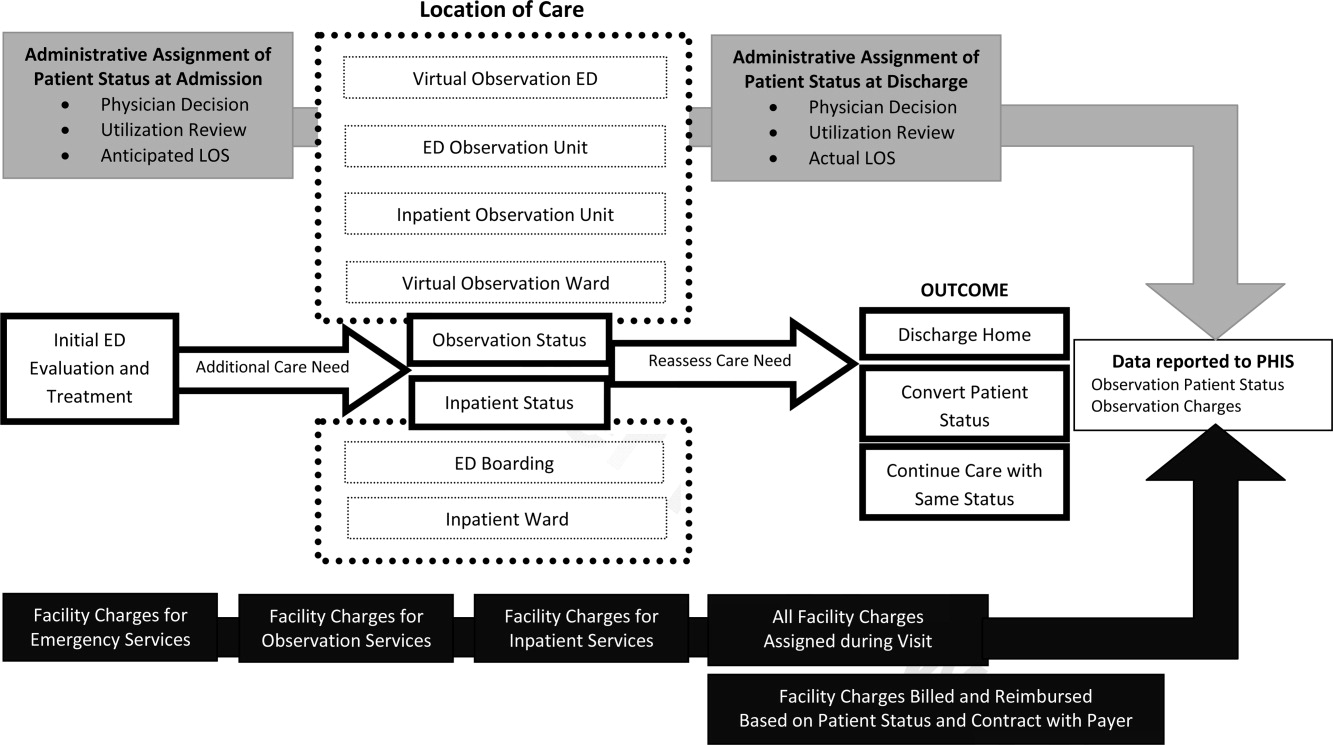
Survey 1: Classification of Observation Patients and Presence of Observation Units in PHIS Hospitals
According to responses to Survey 1, designated OUs were not widespread, present in only 12 of the 31 hospitals. No hospital reported treating all observation status patients exclusively in a designated OU. Observation status was defined by both duration of treatment and either level of care criteria or clinical care guidelines in 21 of the 31 hospitals responding to Survey 1. Of the remaining 10 hospitals, 1 reported that treatment duration alone defines observation status, and the others relied on prespecified observation criteria. When considering duration of treatment, hospitals variably indicated that anticipated or actual lengths of stay were used to determine observation status. Regarding the maximum hours a patient can be observed, 12 hospitals limited observation to 24 hours or fewer, 12 hospitals observed patients for no more than 36 to 48 hours, and the remaining 7 hospitals allowed observation periods of 72 hours or longer.
When admitting patients to observation status, 30 of 31 hospitals specified the criteria that were used to determine observation admissions. InterQual criteria, the most common response, were used by 23 of the 30 hospitals reporting specified criteria; the remaining 7 hospitals had developed hospital‐specific criteria or modified existing criteria, such as InterQual or Milliman, to determine observation status admissions. In addition to these criteria, 11 hospitals required a physician order for admission to observation status. Twenty‐four hospitals indicated that policies were in place to change patient status from observation to inpatient, or inpatient to observation, typically through processes of utilization review and application of criteria listed above.
Most hospitals indicated that they faced substantial variation in the standards used from one payer to another when considering reimbursement for care delivered under observation status. Hospitals noted that duration‐of‐carebased reimbursement practices included hourly rates, per diem, and reimbursement for only the first 24 or 48 hours of observation care. Hospitals identified that payers variably determined reimbursement for observation based on InterQual level of care criteria and Milliman care guidelines. One hospital reported that it was not their practice to bill for the observation bed.
Survey 2: Understanding Observation Patient Type Administrative Data Following ED Care Within PHIS Hospitals
Of the 20 hospitals responding to Survey 2, there were 2 hospitals that did not apply observation status to patients after ED care and 2 hospitals that did not provide complete responses. The remaining 16 hospitals provided information regarding observation status as applied to patients after receiving treatment in the ED. The settings available for observation care and patient groups treated within each area are presented in Table 2. In addition to the patient groups listed in Table 2, there were 4 hospitals where patients could be admitted to observation status directly from an outpatient clinic. All responding hospitals provided virtual observation care (ie, observation status is assigned but the patient is cared for in the existing ED or inpatient ward). Nine hospitals also provided observation care within a dedicated ED or ward‐based OU (ie, a separate clinical area in which observation patients are treated).
| Hospital No. | Available Observation Settings | Patient Groups Under Observation in Each Setting | UR to Assign Obs Status | When Obs Status Is Assigned | ||
|---|---|---|---|---|---|---|
| ED | Post‐Op | Test/Treat | ||||
| ||||||
| 1 | Virtual inpatient | X | X | X | Yes | Discharge |
| Ward‐based OU | X | X | No | |||
| 2 | Virtual inpatient | X | X | Yes | Admission | |
| Ward‐based OU | X | X | X | No | ||
| 3 | Virtual inpatient | X | X | X | Yes | Discharge |
| Ward‐based OU | X | X | X | Yes | ||
| ED OU | X | Yes | ||||
| Virtual ED | X | Yes | ||||
| 4 | Virtual inpatient | X | X | X | Yes | Discharge |
| ED OU | X | No | ||||
| Virtual ED | X | No | ||||
| 5 | Virtual inpatient | X | X | X | N/A | Discharge |
| 6 | Virtual inpatient | X | X | X | Yes | Discharge |
| 7 | Virtual inpatient | X | X | Yes | No response | |
| Ward‐based OU | X | Yes | ||||
| Virtual ED | X | Yes | ||||
| 8 | Virtual inpatient | X | X | X | Yes | Admission |
| 9 | Virtual inpatient | X | X | Yes | Discharge | |
| ED OU | X | Yes | ||||
| Virtual ED | X | Yes | ||||
| 10 | Virtual inpatient | X | X | X | Yes | Admission |
| ED OU | X | Yes | ||||
| 11 | Virtual inpatient | X | X | Yes | Discharge | |
| Ward‐based OU | X | X | Yes | |||
| ED OU | X | Yes | ||||
| Virtual ED | X | Yes | ||||
| 12 | Virtual inpatient | X | X | X | Yes | Admission |
| 13 | Virtual inpatient | X | X | N/A | Discharge | |
| Virtual ED | X | N/A | ||||
| 14 | Virtual inpatient | X | X | X | Yes | Both |
| 15 | Virtual inpatient | X | X | Yes | Admission | |
| Ward‐based OU | X | X | Yes | |||
| 16 | Virtual inpatient | X | Yes | Admission | ||
When asked to identify differences between clinical care delivered to patients admitted under virtual observation and those admitted under inpatient status, 14 of 16 hospitals selected the option There are no differences in the care delivery of these patients. The differences identified by 2 hospitals included patient care orders, treatment protocols, and physician documentation. Within the hospitals that reported utilization of virtual ED observation, 2 reported differences in care compared with other ED patients, including patient care orders, physician rounds, documentation, and discharge process. When admitted patients were boarded in the ED while awaiting an inpatient bed, 11 of 16 hospitals allowed for observation or inpatient level of care to be provided in the ED. Fourteen hospitals allow an admitted patient to be discharged home from boarding in the ED without ever receiving care in an inpatient bed. The discharge decision was made by ED providers in 7 hospitals, and inpatient providers in the other 7 hospitals.
Responses to questions providing detailed information on the process of utilization review were provided by 12 hospitals. Among this subset of hospitals, utilization review was consistently used to assign virtual inpatient observation status and was applied at admission (n = 6) or discharge (n = 8), depending on the hospital. One hospital applied observation status at both admission and discharge; 1 hospital did not provide a response. Responses to questions regarding utilization review are presented in Table 3.
| Survey Question | Yes N (%) | No N (%) |
|---|---|---|
| Preadmission utilization review is conducted at my hospital. | 3 (25) | 9 (75) |
| Utilization review occurs daily at my hospital. | 10 (83) | 2 (17) |
| A nonclinician can initiate an order for observation status. | 4 (33) | 8 (67) |
| Status can be changed after the patient has been discharged. | 10 (83) | 2 (17) |
| Inpatient status would always be assigned to a patient who receives less than 24 hours of care and meets inpatient criteria. | 9 (75) | 3 (25) |
| The same status would be assigned to different patients who received the same treatment of the same duration but have different payers. | 6 (50) | 6 (50) |
DISCUSSION
This is the largest descriptive study of pediatric observation status practices in US freestanding children's hospitals and, to our knowledge, the first to include information about both the ED and inpatient treatment environments. There are two important findings of this study. First, designated OUs were uncommon among the group of freestanding children's hospitals that reported observation patient data to PHIS in 2010. Second, despite the fact that hospitals reported observation care was delivered in a variety of settings, virtual inpatient observation status was nearly ubiquitous. Among the subset of hospitals that provided information about the clinical care delivered to patients admitted under virtual inpatient observation, hospitals frequently reported there were no differences in the care delivered to observation patients when compared with other inpatients.
The results of our survey indicate that designated OUs are not a commonly available model of observation care in the study hospitals. In fact, the vast majority of the hospitals used virtual inpatient observation care, which did not differ from the care delivered to a child admitted as an inpatient. ED‐based OUs, which often provide operationally and physically distinct care to observation patients, have been touted as cost‐effective alternatives to inpatient care,1820 resulting in fewer admissions and reductions in length of stay19, 20 without a resultant increase in return ED‐visits or readmissions.2123 Research is needed to determine the patient‐level outcomes for short‐stay patients in the variety of available treatment settings (eg, physically or operationally distinct OUs and virtual observation), and to evaluate these outcomes in comparison to results published from designated OUs. The operationally and physically distinct features of a designated OU may be required to realize the benefits of observation attributed to individual patients.
While observation care has been historically provided by emergency physicians, there is increasing interest in the role of inpatient providers in observation care.9 According to our survey, children were admitted to observation status directly from clinics, following surgical procedures, scheduled tests and treatment, or after evaluation and treatment in the ED. As many of these children undergo virtual observation in inpatient areas, the role of inpatient providers, such as pediatric hospitalists, in observation care may be an important area for future study, education, and professional development. Novel models of care, with hospitalists collaborating with emergency physicians, may be of benefit to the children who require observation following initial stabilization and treatment in the ED.24, 25
We identified variation between hospitals in the methods used to assign observation status to an episode of care, including a wide range of length of stay criteria and different approaches to utilization review. In addition, the criteria payers use to reimburse for observation varied between payers, even within individual hospitals. The results of our survey may be driven by issues of reimbursement and not based on a model of optimizing patient care outcomes using designated OUs. Variations in reimbursement may limit hospital efforts to refine models of observation care for children. Designated OUs have been suggested as a method for improving ED patient flow,26 increasing inpatient capacity,27 and reducing costs of care.28 Standardization of observation status criteria and consistent reimbursement for observation services may be necessary for hospitals to develop operationally and physically distinct OUs, which may be essential to achieving the proposed benefits of observation medicine on costs of care, patient flow, and hospital capacity.
LIMITATIONS
Our study results should be interpreted with the following limitations in mind. First, the surveys were distributed only to freestanding children's hospitals who participate in PHIS. As a result, our findings may not be generalizable to the experiences of other children's hospitals or general hospitals caring for children. Questions in Survey 2 were focused on understanding observation care, delivered to patients following ED care, which may differ from observation practices related to a direct admission or following scheduled procedures, tests, or treatments. It is important to note that, hospitals that do not report observation status patient data to PHIS are still providing care to children with acute conditions that respond to brief periods of hospital treatment, even though it is not labeled observation. However, it was beyond the scope of this study to characterize the care delivered to all patients who experience a short stay.
The second main limitation of our study is the lower response rate to Survey 2. In addition, several surveys contained incomplete responses which further limits our sample size for some questions, specifically those related to utilization review. The lower response to Survey 2 could be related to the timing of the distribution of the 2 surveys, or to the information contained in the introductory e‐mail describing Survey 2. Hospitals with designated observation units, or where observation status care has been receiving attention, may have been more likely to respond to our survey, which may bias our results to reflect the experiences of hospitals experiencing particular successes or challenges with observation status care. A comparison of known hospital characteristics revealed no differences between hospitals that did and did not provide responses to Survey 2, but other unmeasured differences may exist.
CONCLUSION
Observation status is assigned using duration of treatment, clinical care guidelines, and level of care criteria, and is defined differently by individual hospitals and payers. Currently, the most widely available setting for pediatric observation status is within a virtual inpatient unit. Our results suggest that the care delivered to observation patients in virtual inpatient units is consistent with care provided to other inpatients. As such, observation status is largely an administrative/billing designation, which does not appear to reflect differences in clinical care. A consistent approach to the assignment of patients to observation status, and treatment of patients under observation among hospitals and payers, may be necessary to compare quality outcomes. Studies of the clinical care delivery and processes of care for short‐stay patients are needed to optimize models of pediatric observation care.
- .Observation medicine: the healthcare system's tincture of time. In: Graff LG, ed.Principles of Observation Medicine.Dallas, TX:American College of Emergency Physicians;2010. Available at: http://www.acep.org/content.aspx?id=46142. Accessed February 18,year="2011"2011.
- .Hospital ‘observation’ status a matter of billing.The Columbus Dispatch. February 14,2011.
- .Hospital payments downgraded.Philadelphia Business Journal. February 18,2011.
- .Medicare rules give full hospital benefits only to those with ‘inpatient’ status.The Washington Post. September 7,2010.
- .Hospitals caught between a rock and a hard place over observation.Health Leaders Media. September 15,2010.
- .AHA: observation status fears on the rise.Health Leaders Media. October 29,2010.
- .Put your hospital bill under a microscope.The New York Times. September 13,2010.
- Medicare Hospital Manual Section 455.Washington, DC:Department of Health and Human Services, Centers for Medicare and Medicaid Services;2001.
- ,,,,.The Observation Unit: An Operational Overview for the Hospitalist. Society of Hospital Medicine White Paper. May 21, 2009. Available at: http://www.hospitalmedicine.org/Content/NavigationMenu/Publications/White Papers/White_Papers.htm. Accessed May 21,2009.
- ,,,,.Utilization and unexpected hospitalization rates of a pediatric emergency department 23‐hour observation unit.Pediatr Emerg Care.2008;24(9):589–594.
- ,,.The pediatric hybrid observation unit: an analysis of 6477 consecutive patient encounters.Pediatrics.2005;115(5):e535–e542.
- ,,,,.Pediatric observation units in the United States: a systematic review.J Hosp Med.2010;5(3):172–182.
- ,,.Pediatric emergency department directors' benchmarking survey: fiscal year 2001.Pediatr Emerg Care.2003;19(3):143–147.
- ,,,.Pediatric observation status beds on an inpatient unit: an integrated care model.Pediatr Emerg Care.2004;20(1):17–21.
- ,,,.Impact of a short stay unit on asthma patients admitted to a tertiary pediatric hospital.Qual Manag Health Care.1997;6(1):14–22.
- ,,,.A national survey of observation units in the United States.Am J Emerg Med.2003;21(7):529–533.
- ,,,.A survey of observation units in the United States.Am J Emerg Med.1989;7(6):576–580.
- ,,.When the patient requires observation not hospitalization.J Nurs Admin.1988;18(10):20–23.
- ,,.A reduction in hospitalization, length of stay, and hospital charges for croup with the institution of a pediatric observation unit.Am J Emerg Med.2006;24(7):818–821.
- ,,.Outpatient oral rehydration in the United States.Am J Dis Child.1986;140(3):211–215.
- ,,,,.Pediatric closed head injuries treated in an observation unit.Pediatr Emerg Care.2005;21(10):639–644.
- ,,,.Use of pediatric observation unit for treatment of children with dehydration caused by gastroenteritis.Pediatr Emerg Care.2006;22(1):1–6.
- ,,,.Children with asthma admitted to a pediatric observation unit.Pediatr Emerg Care.2005;21(10):645–649.
- ,,,.Redefining the community pediatric hospitalist: the combined pediatric ED/inpatient unit.Pediatr Emerg Care.2007;23(1):33–37.
- ,,,.Program description: a hospitalist‐run, medical short‐stay unit in a teaching hospital.Can Med Assoc J.2000;163(11):1477–1480.
- ,.Impact of an observation unit and an emergency department‐admitted patient transfer mandate in decreasing overcrowding in a pediatric emergency department: a discrete event simulation exercise.Pediatr Emerg Care.2009;25(3):160–163.
- ,,, et al.Children's hospitals do not acutely respond to high occupancy.Pediatrics.125(5):974–981.
- ,,,,,.Trends in high‐turnover stays among children hospitalized in the United States, 1993‐2003.Pediatrics.2009;123(3):996–1002.
Observation medicine has grown in recent decades out of changes in policies for hospital reimbursement, requirements for patients to meet admission criteria to qualify for inpatient admission, and efforts to avoid unnecessary or inappropriate admissions.1 Emergency physicians are frequently faced with patients who are too sick to be discharged home, but do not clearly meet criteria for an inpatient status admission. These patients often receive extended outpatient services (typically extending 24 to 48 hours) under the designation of observation status, in order to determine their response to treatment and need for hospitalization.
Observation care delivered to adult patients has increased substantially in recent years, and the confusion around the designation of observation versus inpatient care has received increasing attention in the lay press.27 According to the Centers for Medicare and Medicaid Services (CMS)8:
Observation care is a well‐defined set of specific, clinically appropriate services, which include ongoing short term treatment, assessment, and reassessment before a decision can be made regarding whether patients will require further treatment as hospital inpatients. Observation services are commonly ordered for patients who present to the emergency department and who then require a significant period of treatment or monitoring in order to make a decision concerning their admission or discharge.
Observation status is an administrative label that is applied to patients who do not meet inpatient level of care criteria, as defined by third parties such as InterQual. These criteria usually include a combination of the patient's clinical diagnoses, severity of illness, and expected needs for monitoring and interventions, in order to determine the admission status to which the patient may be assigned (eg, observation, inpatient, or intensive care). Observation services can be provided, in a variety of settings, to those patients who do not meet inpatient level of care but require a period of observation. Some hospitals provide observation care in discrete units in the emergency department (ED) or specific inpatient unit, and others have no designated unit but scatter observation patients throughout the institution, termed virtual observation units.9
For more than 30 years, observation unit (OU) admission has offered an alternative to traditional inpatient hospitalization for children with a variety of acute conditions.10, 11 Historically, the published literature on observation care for children in the United States has been largely based in dedicated emergency department OUs.12 Yet, in a 2001 survey of 21 pediatric EDs, just 6 reported the presence of a 23‐hour unit.13 There are single‐site examples of observation care delivered in other settings.14, 15 In 2 national surveys of US General Hospitals, 25% provided observation services in beds adjacent to the ED, and the remainder provided observation services in hospital inpatient units.16, 17 However, we are not aware of any previous multi‐institution studies exploring hospital‐wide practices related to observation care for children.
Recognizing that observation status can be designated using various standards, and that observation care can be delivered in locations outside of dedicated OUs,9 we developed 2 web‐based surveys to examine the current models of pediatric observation medicine in US children's hospitals. We hypothesized that observation care is most commonly applied as a billing designation and does not necessarily represent care delivered in a structurally or functionally distinct OU, nor does it represent a difference in care provided to those patients with inpatient designation.
METHODS
Study Design
Two web‐based surveys were distributed, in April 2010, to the 42 freestanding, tertiary care children's hospitals affiliated with the Child Health Corporation of America (CHCA; Shawnee Mission, KS) which contribute data to the Pediatric Health Information System (PHIS) database. The PHIS is a national administrative database that contains resource utilization data from participating hospitals located in noncompeting markets of 27 states plus the District of Columbia. These hospitals account for 20% of all tertiary care children's hospitals in the United States.
Survey Content
Survey 1
A survey of hospital observation status practices has been developed by CHCA as a part of the PHIS data quality initiative (see Supporting Appendix: Survey 1 in the online version of this article). Hospitals that did not provide observation patient data to PHIS were excluded after an initial screening question. This survey obtained information regarding the designation of observation status within each hospital. Hospitals provided free‐text responses to questions related to the criteria used to define observation, and to admit patients into observation status. Fixed‐choice response questions were used to determine specific observation status utilization criteria and clinical guidelines (eg, InterQual and Milliman) used by hospitals for the designation of observation status to patients.
Survey 2
We developed a detailed follow‐up survey in order to characterize the structures and processes of care associated with observation status (see Supporting Appendix: Survey 2 in the online version of this article). Within the follow‐up survey, an initial screening question was used to determine all types of patients to which observation status is assigned within the responding hospitals. All other questions in Survey 2 were focused specifically on those patients who required additional care following ED evaluation and treatment. Fixed‐choice response questions were used to explore differences in care for patients under observation and those admitted as inpatients. We also inquired of hospital practices related to boarding of patients in the ED while awaiting admission to an inpatient bed.
Survey Distribution
Two web‐based surveys were distributed to all 42 CHCA hospitals that contribute data to PHIS. During the month of April 2010, each hospital's designated PHIS operational contact received e‐mail correspondence requesting their participation in each survey. Within hospitals participating in PHIS, Operational Contacts have been assigned to serve as the day‐to‐day PHIS contact person based upon their experience working with the PHIS data. The Operational Contacts are CHCA's primary contact for issues related to the hospital's data quality and reporting to PHIS. Non‐responders were contacted by e‐mail for additional requests to complete the surveys. Each e‐mail provided an introduction to the topic of the survey and a link to complete the survey. The e‐mail requesting participation in Survey 1 was distributed the first week of April 2010, and the survey was open for responses during the first 3 weeks of the month. The e‐mail requesting participation in Survey 2 was sent the third week of April 2010, and the survey was open for responses during the subsequent 2 weeks.
DATA ANALYSIS
Survey responses were collected and are presented as a descriptive summary of results. Hospital characteristics were summarized with medians and interquartile ranges for continuous variables, and with percents for categorical variables. Characteristics were compared between hospitals that responded and those that did not respond to Survey 2 using Wilcoxon rank‐sum tests and chi‐square tests as appropriate. All analyses were performed using SAS v.9.2 (SAS Institute, Cary, NC), and a P value <0.05 was considered statistically significant. The study was reviewed by the University of Michigan Institutional Review Board and considered exempt.
RESULTS
Responses to Survey 1 were available from 37 of 42 (88%) of PHIS hospitals (Figure 1). For Survey 2, we received responses from 20 of 42 (48%) of PHIS hospitals. Based on information available from Survey 1, we know that 20 of the 31 (65%) PHIS hospitals that report observation status patient data to PHIS responded to Survey 2. Characteristics of the hospitals responding and not responding to Survey 2 are presented in Table 1. Respondents provided hospital identifying information which allowed for the linkage of data, from Survey 1, to 17 of the 20 hospitals responding to Survey 2. We did not have information available to link responses from 3 hospitals.
| Respondent N = 20 | Non‐Respondent N = 22 | P Value | |
|---|---|---|---|
| |||
| No. of inpatient beds Median [IQR] (excluding Obstetrics) | 245 [219283] | 282 [250381] | 0.076 |
| Annual admissions Median [IQR] (excluding births) | 11,658 [8,64213,213] | 13,522 [9,83018,705] | 0.106 |
| ED volume Median [IQR] | 60,528 [47,85082,955] | 64,486 [47,38684,450] | 0.640 |
| Percent government payer Median [IQR] | 53% [4662] | 49% [4158] | 0.528 |
| Region | |||
| Northeast | 37% | 0% | 0.021 |
| Midwest | 21% | 33% | |
| South | 21% | 50% | |
| West | 21% | 17% | |
| Reports observation status patients to PHIS | 85% | 90% | 0.555 |
Based on responses to the surveys and our knowledge of data reported to PHIS, our current understanding of patient flow from ED through observation to discharge home, and the application of observation status to the encounter, is presented in Figure 2. According to free‐text responses to Survey 1, various methods were applied to designate observation status (gray shaded boxes in Figure 2). Fixed‐choice responses to Survey 2 revealed that observation status patients were cared for in a variety of locations within hospitals, including ED beds, designated observation units, and inpatient beds (dashed boxes in Figure 2). Not every facility utilized all of the listed locations for observation care. Space constraints could dictate the location of care, regardless of patient status (eg, observation vs inpatient), in hospitals with more than one location of care available to observation patients. While patient status could change during a visit, only the final patient status at discharge enters the administrative record submitted to PHIS (black boxes in Figure 2). Facility charges for observation remained a part of the visit record and were reported to PHIS. Hospitals may or may not bill for all assigned charges depending on patient status, length of stay, or other specific criteria determined by contracts with individual payers.
Survey 1: Classification of Observation Patients and Presence of Observation Units in PHIS Hospitals
According to responses to Survey 1, designated OUs were not widespread, present in only 12 of the 31 hospitals. No hospital reported treating all observation status patients exclusively in a designated OU. Observation status was defined by both duration of treatment and either level of care criteria or clinical care guidelines in 21 of the 31 hospitals responding to Survey 1. Of the remaining 10 hospitals, 1 reported that treatment duration alone defines observation status, and the others relied on prespecified observation criteria. When considering duration of treatment, hospitals variably indicated that anticipated or actual lengths of stay were used to determine observation status. Regarding the maximum hours a patient can be observed, 12 hospitals limited observation to 24 hours or fewer, 12 hospitals observed patients for no more than 36 to 48 hours, and the remaining 7 hospitals allowed observation periods of 72 hours or longer.
When admitting patients to observation status, 30 of 31 hospitals specified the criteria that were used to determine observation admissions. InterQual criteria, the most common response, were used by 23 of the 30 hospitals reporting specified criteria; the remaining 7 hospitals had developed hospital‐specific criteria or modified existing criteria, such as InterQual or Milliman, to determine observation status admissions. In addition to these criteria, 11 hospitals required a physician order for admission to observation status. Twenty‐four hospitals indicated that policies were in place to change patient status from observation to inpatient, or inpatient to observation, typically through processes of utilization review and application of criteria listed above.
Most hospitals indicated that they faced substantial variation in the standards used from one payer to another when considering reimbursement for care delivered under observation status. Hospitals noted that duration‐of‐carebased reimbursement practices included hourly rates, per diem, and reimbursement for only the first 24 or 48 hours of observation care. Hospitals identified that payers variably determined reimbursement for observation based on InterQual level of care criteria and Milliman care guidelines. One hospital reported that it was not their practice to bill for the observation bed.
Survey 2: Understanding Observation Patient Type Administrative Data Following ED Care Within PHIS Hospitals
Of the 20 hospitals responding to Survey 2, there were 2 hospitals that did not apply observation status to patients after ED care and 2 hospitals that did not provide complete responses. The remaining 16 hospitals provided information regarding observation status as applied to patients after receiving treatment in the ED. The settings available for observation care and patient groups treated within each area are presented in Table 2. In addition to the patient groups listed in Table 2, there were 4 hospitals where patients could be admitted to observation status directly from an outpatient clinic. All responding hospitals provided virtual observation care (ie, observation status is assigned but the patient is cared for in the existing ED or inpatient ward). Nine hospitals also provided observation care within a dedicated ED or ward‐based OU (ie, a separate clinical area in which observation patients are treated).
| Hospital No. | Available Observation Settings | Patient Groups Under Observation in Each Setting | UR to Assign Obs Status | When Obs Status Is Assigned | ||
|---|---|---|---|---|---|---|
| ED | Post‐Op | Test/Treat | ||||
| ||||||
| 1 | Virtual inpatient | X | X | X | Yes | Discharge |
| Ward‐based OU | X | X | No | |||
| 2 | Virtual inpatient | X | X | Yes | Admission | |
| Ward‐based OU | X | X | X | No | ||
| 3 | Virtual inpatient | X | X | X | Yes | Discharge |
| Ward‐based OU | X | X | X | Yes | ||
| ED OU | X | Yes | ||||
| Virtual ED | X | Yes | ||||
| 4 | Virtual inpatient | X | X | X | Yes | Discharge |
| ED OU | X | No | ||||
| Virtual ED | X | No | ||||
| 5 | Virtual inpatient | X | X | X | N/A | Discharge |
| 6 | Virtual inpatient | X | X | X | Yes | Discharge |
| 7 | Virtual inpatient | X | X | Yes | No response | |
| Ward‐based OU | X | Yes | ||||
| Virtual ED | X | Yes | ||||
| 8 | Virtual inpatient | X | X | X | Yes | Admission |
| 9 | Virtual inpatient | X | X | Yes | Discharge | |
| ED OU | X | Yes | ||||
| Virtual ED | X | Yes | ||||
| 10 | Virtual inpatient | X | X | X | Yes | Admission |
| ED OU | X | Yes | ||||
| 11 | Virtual inpatient | X | X | Yes | Discharge | |
| Ward‐based OU | X | X | Yes | |||
| ED OU | X | Yes | ||||
| Virtual ED | X | Yes | ||||
| 12 | Virtual inpatient | X | X | X | Yes | Admission |
| 13 | Virtual inpatient | X | X | N/A | Discharge | |
| Virtual ED | X | N/A | ||||
| 14 | Virtual inpatient | X | X | X | Yes | Both |
| 15 | Virtual inpatient | X | X | Yes | Admission | |
| Ward‐based OU | X | X | Yes | |||
| 16 | Virtual inpatient | X | Yes | Admission | ||
When asked to identify differences between clinical care delivered to patients admitted under virtual observation and those admitted under inpatient status, 14 of 16 hospitals selected the option There are no differences in the care delivery of these patients. The differences identified by 2 hospitals included patient care orders, treatment protocols, and physician documentation. Within the hospitals that reported utilization of virtual ED observation, 2 reported differences in care compared with other ED patients, including patient care orders, physician rounds, documentation, and discharge process. When admitted patients were boarded in the ED while awaiting an inpatient bed, 11 of 16 hospitals allowed for observation or inpatient level of care to be provided in the ED. Fourteen hospitals allow an admitted patient to be discharged home from boarding in the ED without ever receiving care in an inpatient bed. The discharge decision was made by ED providers in 7 hospitals, and inpatient providers in the other 7 hospitals.
Responses to questions providing detailed information on the process of utilization review were provided by 12 hospitals. Among this subset of hospitals, utilization review was consistently used to assign virtual inpatient observation status and was applied at admission (n = 6) or discharge (n = 8), depending on the hospital. One hospital applied observation status at both admission and discharge; 1 hospital did not provide a response. Responses to questions regarding utilization review are presented in Table 3.
| Survey Question | Yes N (%) | No N (%) |
|---|---|---|
| Preadmission utilization review is conducted at my hospital. | 3 (25) | 9 (75) |
| Utilization review occurs daily at my hospital. | 10 (83) | 2 (17) |
| A nonclinician can initiate an order for observation status. | 4 (33) | 8 (67) |
| Status can be changed after the patient has been discharged. | 10 (83) | 2 (17) |
| Inpatient status would always be assigned to a patient who receives less than 24 hours of care and meets inpatient criteria. | 9 (75) | 3 (25) |
| The same status would be assigned to different patients who received the same treatment of the same duration but have different payers. | 6 (50) | 6 (50) |
DISCUSSION
This is the largest descriptive study of pediatric observation status practices in US freestanding children's hospitals and, to our knowledge, the first to include information about both the ED and inpatient treatment environments. There are two important findings of this study. First, designated OUs were uncommon among the group of freestanding children's hospitals that reported observation patient data to PHIS in 2010. Second, despite the fact that hospitals reported observation care was delivered in a variety of settings, virtual inpatient observation status was nearly ubiquitous. Among the subset of hospitals that provided information about the clinical care delivered to patients admitted under virtual inpatient observation, hospitals frequently reported there were no differences in the care delivered to observation patients when compared with other inpatients.
The results of our survey indicate that designated OUs are not a commonly available model of observation care in the study hospitals. In fact, the vast majority of the hospitals used virtual inpatient observation care, which did not differ from the care delivered to a child admitted as an inpatient. ED‐based OUs, which often provide operationally and physically distinct care to observation patients, have been touted as cost‐effective alternatives to inpatient care,1820 resulting in fewer admissions and reductions in length of stay19, 20 without a resultant increase in return ED‐visits or readmissions.2123 Research is needed to determine the patient‐level outcomes for short‐stay patients in the variety of available treatment settings (eg, physically or operationally distinct OUs and virtual observation), and to evaluate these outcomes in comparison to results published from designated OUs. The operationally and physically distinct features of a designated OU may be required to realize the benefits of observation attributed to individual patients.
While observation care has been historically provided by emergency physicians, there is increasing interest in the role of inpatient providers in observation care.9 According to our survey, children were admitted to observation status directly from clinics, following surgical procedures, scheduled tests and treatment, or after evaluation and treatment in the ED. As many of these children undergo virtual observation in inpatient areas, the role of inpatient providers, such as pediatric hospitalists, in observation care may be an important area for future study, education, and professional development. Novel models of care, with hospitalists collaborating with emergency physicians, may be of benefit to the children who require observation following initial stabilization and treatment in the ED.24, 25
We identified variation between hospitals in the methods used to assign observation status to an episode of care, including a wide range of length of stay criteria and different approaches to utilization review. In addition, the criteria payers use to reimburse for observation varied between payers, even within individual hospitals. The results of our survey may be driven by issues of reimbursement and not based on a model of optimizing patient care outcomes using designated OUs. Variations in reimbursement may limit hospital efforts to refine models of observation care for children. Designated OUs have been suggested as a method for improving ED patient flow,26 increasing inpatient capacity,27 and reducing costs of care.28 Standardization of observation status criteria and consistent reimbursement for observation services may be necessary for hospitals to develop operationally and physically distinct OUs, which may be essential to achieving the proposed benefits of observation medicine on costs of care, patient flow, and hospital capacity.
LIMITATIONS
Our study results should be interpreted with the following limitations in mind. First, the surveys were distributed only to freestanding children's hospitals who participate in PHIS. As a result, our findings may not be generalizable to the experiences of other children's hospitals or general hospitals caring for children. Questions in Survey 2 were focused on understanding observation care, delivered to patients following ED care, which may differ from observation practices related to a direct admission or following scheduled procedures, tests, or treatments. It is important to note that, hospitals that do not report observation status patient data to PHIS are still providing care to children with acute conditions that respond to brief periods of hospital treatment, even though it is not labeled observation. However, it was beyond the scope of this study to characterize the care delivered to all patients who experience a short stay.
The second main limitation of our study is the lower response rate to Survey 2. In addition, several surveys contained incomplete responses which further limits our sample size for some questions, specifically those related to utilization review. The lower response to Survey 2 could be related to the timing of the distribution of the 2 surveys, or to the information contained in the introductory e‐mail describing Survey 2. Hospitals with designated observation units, or where observation status care has been receiving attention, may have been more likely to respond to our survey, which may bias our results to reflect the experiences of hospitals experiencing particular successes or challenges with observation status care. A comparison of known hospital characteristics revealed no differences between hospitals that did and did not provide responses to Survey 2, but other unmeasured differences may exist.
CONCLUSION
Observation status is assigned using duration of treatment, clinical care guidelines, and level of care criteria, and is defined differently by individual hospitals and payers. Currently, the most widely available setting for pediatric observation status is within a virtual inpatient unit. Our results suggest that the care delivered to observation patients in virtual inpatient units is consistent with care provided to other inpatients. As such, observation status is largely an administrative/billing designation, which does not appear to reflect differences in clinical care. A consistent approach to the assignment of patients to observation status, and treatment of patients under observation among hospitals and payers, may be necessary to compare quality outcomes. Studies of the clinical care delivery and processes of care for short‐stay patients are needed to optimize models of pediatric observation care.
- .Observation medicine: the healthcare system's tincture of time. In: Graff LG, ed.Principles of Observation Medicine.Dallas, TX:American College of Emergency Physicians;2010. Available at: http://www.acep.org/content.aspx?id=46142. Accessed February 18,year="2011"2011.
- .Hospital ‘observation’ status a matter of billing.The Columbus Dispatch. February 14,2011.
- .Hospital payments downgraded.Philadelphia Business Journal. February 18,2011.
- .Medicare rules give full hospital benefits only to those with ‘inpatient’ status.The Washington Post. September 7,2010.
- .Hospitals caught between a rock and a hard place over observation.Health Leaders Media. September 15,2010.
- .AHA: observation status fears on the rise.Health Leaders Media. October 29,2010.
- .Put your hospital bill under a microscope.The New York Times. September 13,2010.
- Medicare Hospital Manual Section 455.Washington, DC:Department of Health and Human Services, Centers for Medicare and Medicaid Services;2001.
- ,,,,.The Observation Unit: An Operational Overview for the Hospitalist. Society of Hospital Medicine White Paper. May 21, 2009. Available at: http://www.hospitalmedicine.org/Content/NavigationMenu/Publications/White Papers/White_Papers.htm. Accessed May 21,2009.
- ,,,,.Utilization and unexpected hospitalization rates of a pediatric emergency department 23‐hour observation unit.Pediatr Emerg Care.2008;24(9):589–594.
- ,,.The pediatric hybrid observation unit: an analysis of 6477 consecutive patient encounters.Pediatrics.2005;115(5):e535–e542.
- ,,,,.Pediatric observation units in the United States: a systematic review.J Hosp Med.2010;5(3):172–182.
- ,,.Pediatric emergency department directors' benchmarking survey: fiscal year 2001.Pediatr Emerg Care.2003;19(3):143–147.
- ,,,.Pediatric observation status beds on an inpatient unit: an integrated care model.Pediatr Emerg Care.2004;20(1):17–21.
- ,,,.Impact of a short stay unit on asthma patients admitted to a tertiary pediatric hospital.Qual Manag Health Care.1997;6(1):14–22.
- ,,,.A national survey of observation units in the United States.Am J Emerg Med.2003;21(7):529–533.
- ,,,.A survey of observation units in the United States.Am J Emerg Med.1989;7(6):576–580.
- ,,.When the patient requires observation not hospitalization.J Nurs Admin.1988;18(10):20–23.
- ,,.A reduction in hospitalization, length of stay, and hospital charges for croup with the institution of a pediatric observation unit.Am J Emerg Med.2006;24(7):818–821.
- ,,.Outpatient oral rehydration in the United States.Am J Dis Child.1986;140(3):211–215.
- ,,,,.Pediatric closed head injuries treated in an observation unit.Pediatr Emerg Care.2005;21(10):639–644.
- ,,,.Use of pediatric observation unit for treatment of children with dehydration caused by gastroenteritis.Pediatr Emerg Care.2006;22(1):1–6.
- ,,,.Children with asthma admitted to a pediatric observation unit.Pediatr Emerg Care.2005;21(10):645–649.
- ,,,.Redefining the community pediatric hospitalist: the combined pediatric ED/inpatient unit.Pediatr Emerg Care.2007;23(1):33–37.
- ,,,.Program description: a hospitalist‐run, medical short‐stay unit in a teaching hospital.Can Med Assoc J.2000;163(11):1477–1480.
- ,.Impact of an observation unit and an emergency department‐admitted patient transfer mandate in decreasing overcrowding in a pediatric emergency department: a discrete event simulation exercise.Pediatr Emerg Care.2009;25(3):160–163.
- ,,, et al.Children's hospitals do not acutely respond to high occupancy.Pediatrics.125(5):974–981.
- ,,,,,.Trends in high‐turnover stays among children hospitalized in the United States, 1993‐2003.Pediatrics.2009;123(3):996–1002.
Copyright © 2011 Society of Hospital Medicine

Addressing Inpatient Crowding
High levels of hospital occupancy are associated with compromises to quality of care and access (often referred to as crowding), 18 while low occupancy may be inefficient and also impact quality. 9, 10 Despite this, hospitals typically have uneven occupancy. Although some demand for services is driven by factors beyond the control of a hospital (eg, seasonal variation in viral illness), approximately 15%30% of admissions to children's hospitals are scheduled from days to months in advance, with usual arrivals on weekdays. 1114 For example, of the 3.4 million elective admissions in the 2006 Healthcare Cost and Utilization Project Kids Inpatient Database (HCUP KID), only 13% were admitted on weekends. 14 Combined with short length of stay (LOS) for such patients, this leads to higher midweek and lower weekend occupancy. 12
Hospitals respond to crowding in a number of ways, but often focus on reducing LOS to make room for new patients. 11, 15, 16 For hospitals that are relatively efficient in terms of LOS, efforts to reduce it may not increase functional capacity adequately. In children's hospitals, median lengths of stay are 2 to 3 days, and one‐third of hospitalizations are 1 day or less. 17 Thus, even 10%20% reductions in LOS trims hours, not days, from typical stays. Practical barriers (eg, reluctance to discharge in the middle of the night, or family preferences and work schedules) and undesired outcomes (eg, increased hospital re‐visits) are additional pitfalls encountered by relying on throughput enhancement alone.
Managing scheduled admissions through smoothing is an alternative strategy to reduce variability and high occupancy. 6, 12, 1820 The concept is to proactively control the entry of patients, when possible, to achieve more even levels of occupancy, instead of the peaks and troughs commonly encountered. Nonetheless, it is not a widely used approach. 18, 20, 21 We hypothesized that children's hospitals had substantial unused capacity that could be used to smooth occupancy, which would reduce weekday crowding. While it is obvious that smoothing will reduce peaks to average levels (and also raise troughs), we sought to quantify just how large this difference wasand thereby quantify the potential of smoothing to reduce inpatient crowding (or, conversely, expose more patients to high levels of occupancy). Is there enough variation to justify smoothing, and, if a hospital does smooth, what is the expected result? If the number of patients removed from exposure to high occupancy is not substantial, other means to address inpatient crowding might be of more value. Our aims were to quantify the difference in weekday versus weekend occupancy, report on mathematical feasibility of such an approach, and determine the difference in number of patients exposed to various levels of high occupancy.
Methods
Data Source
This retrospective study was conducted with resource‐utilization data from 39 freestanding, tertiary‐care children's hospitals in the Pediatric Health Information System (PHIS). Participating hospitals are located in noncompeting markets of 23 states, plus the District of Columbia, and affiliated with the Child Health Corporation of America (CHCA, Shawnee Mission, KS). They account for 80% of freestanding, and 20% of all general, tertiary‐care children's hospitals. Data quality and reliability are assured through joint ongoing, systematic monitoring. The Children's Hospital of Philadelphia Committees for the Protection of Human Subjects approved the protocol with a waiver of informed consent.
Patients
Patients admitted January 1December 31, 2007 were eligible for inclusion. Due to variation in the presence of birthing, neonatal intensive care, and behavioral health units across hospitals, these beds and associated patients were excluded. Inpatients enter hospitals either as scheduled (often referred to as elective) or unscheduled (emergent or urgent) admissions. Because PHIS does not include these data, KID was used to standardize the PHIS data for proportion of scheduled admissions. 22 (KID is a healthcare database of 23 million pediatric inpatient discharges developed through federalstateindustry partnership, and sponsored by the Agency for Healthcare Research and Quality [AHRQ].) Each encounter in KID includes a principal International Classification of Diseases, 9th revision (ICD‐9) discharge diagnosis code, and is designated by the hospital as elective (ranging from chemotherapy to tonsillectomy) or not elective. Because admissions, rather than diagnoses, are scheduled, a proportion of patients with each primary diagnosis in KID are scheduled (eg, 28% of patients with a primary diagnosis of esophageal reflux). Proportions in KID were matched to principal diagnoses in PHIS.
Definitions
The census was the number of patients registered as inpatients (including those physically in the emergency department [ED] from time of ED arrival)whether observation or inpatient statusat midnight, the conclusion of the day. Hospital capacity was set using CHCA data (and confirmed by each hospital's administrative personnel) as the number of licensed in‐service beds available for patients in 2007; we assumed beds were staffed and capacity fixed for the year. Occupancy was calculated by dividing census by capacity. Maximum occupancy in a week referred to the highest occupancy level achieved in a seven‐day period (MondaySunday). We analyzed a set of thresholds for high‐occupancy (85%, 90%, 95%, and 100%), because there is no consistent definition for when hospitals are at high occupancy or when crowding occurs, though crowding has been described as starting at 85% occupancy. 2325
Analysis
The hospital was the unit of analysis. We report hospital characteristics, including capacity, number of discharges, and census region, and annual standardized length of stay ratio (SLOSR) as observed‐to‐expected LOS.
Smoothing Technique
A retrospective smoothing algorithm set each hospital's daily occupancy during a week to that hospital's mean occupancy for the week; effectively spreading the week's volume of patients evenly across the days of the week. While inter‐week and inter‐month smoothing were considered, intra‐week smoothing was deemed more practical for the largest number of patients, as it would not mean delaying care by more than one week. In the case of a planned treatment course (eg, chemotherapy), only intra‐week smoothing would maintain the necessary scheduled intervals of treatment.
Mathematical Feasibility
To approximate the number of patient admissions that would require different scheduling during a particular week to achieve smoothed weekly occupancy, we determined the total number of patient‐days in the week that required different scheduling and divided by the average LOS for the week. We then divided the number of admissions‐to‐move by total weekly admissions to compute the percentage at each hospital across 52 weeks of the year.
Measuring the Impact of Smoothing
We focused on the frequency and severity of high occupancy and the number of patients exposed to it. This framework led to 4 measures that assess the opportunity and effect of smoothing:
Difference in hospital weekdayweekend occupancy: Equal to 12‐month median of difference between mean weekday occupancy and mean weekend occupancy for each hospital‐week.
Difference in hospital maximummean occupancy: Equal to median of difference between maximum one‐day occupancy and weekly mean (smoothed) occupancy for each hospital‐week. A regression line was derived from the data for the 39 hospitals to report expected reduction in peak occupancy based on the magnitude of the difference between weekday and weekend occupancy.
Difference in number of hospitals exposed to above‐threshold occupancy: Equal to difference, pre‐ and post‐smoothing, in number of hospitals facing high‐occupancy conditions on an average of at least one weekday midnight per week during the year at different occupancy thresholds.
Difference in number of patients exposed to above‐threshold occupancy: Equal to difference, pre‐ and post‐smoothing, in number of patients exposed to hospital midnight occupancy at the thresholds. We utilized patient‐days for the calculation to avoid double‐counting, and divided this by average LOS, in order to determine the number of patients who would no longer be exposed to over‐threshold occupancy after smoothing, while also adjusting for patients newly exposed to over‐threshold occupancy levels.
All analyses were performed separately for each hospital for the entire year and then for winter (DecemberMarch), the period during which most crowding occurred. Analyses were performed using SAS (version 9.2, SAS Institute, Inc, Cary, NC); P values <0.05 were considered statistically significant.
Results
The characteristics of the 39 hospitals are provided in Table 1. Based on standardization with KID, 23.6% of PHIS admissions were scheduled (range: 18.1%35.8%) or a median of 81.5 scheduled admissions per week per hospital; 26.6% of weekday admissions were scheduled versus 16.1% for weekends. Overall, 12.4% of scheduled admissions entered on weekends. For all patients, median LOS was three days (interquartile range [IQR]: twofive days), but median LOS for scheduled admissions was two days (IQR: onefour days). The median LOS and IQR were the same by day of admission for all days of the week. Most hospitals had an overall SLOSR close to one (median: 0.9, IQR: 0.91.1). Overall, hospital mean midnight occupancy ranged from 70.9% to 108.1% on weekdays and 65.7% to 94.9% on weekends. Uniformly, weekday occupancy exceeded weekend occupancy, with a median difference of 8.2% points (IQR: 7.2%9.5% points). There was a wide range of median hospital weekdayweekend occupancy differences across hospitals (Figure 1). The overall difference was less in winter (median difference: 7.7% points; IQR: 6.3%8.8% points) than in summer (median difference: 8.6% points; IQR: 7.4%9.8% points (Wilcoxon Sign Rank test, P < 0.001). Thirty‐five hospitals (89.7%) exceeded the 85% occupancy threshold and 29 (74.4%) exceeded the 95% occupancy threshold on at least 20% of weekdays (Table 2). Across all the hospitals, the median difference in weekly maximum and weekly mean occupancy was 6.6% points (IQR: 6.2%7.4% points) (Figure 2).
| Characteristics | No. (%) |
|---|---|
| |
| Licensed in‐service beds | n = 39 hospitals |
| <200 beds | 6 (15.4) |
| 200249 beds | 10 (25.6) |
| 250300 beds | 14 (35.9) |
| >300 beds | 9 (23.1) |
| No. of discharges | |
| <10,000 | 5 (12.8) |
| 10,00013,999 | 14 (35.9) |
| 14,00017,999 | 11 (28.2) |
| >18,000 | 9 (23.1) |
| Census region | |
| West | 9 (23.1) |
| Midwest | 11 (28.2) |
| Northeast | 6 (15.4) |
| South | 13 (33.3) |
| Admissions | n = 590,352 admissions |
| Medical scheduled admissions* | 79,683 |
| Surgical scheduled admissions* | 59,640 |
| Total scheduled admissions* (% of all admissions) | 139,323 (23.6) |
| Weekend medical scheduled admissions* (% of all medical scheduled admissions) | 13,546 (17.0) |
| Weekend surgical scheduled admissions* (% of all surgical scheduled admissions) | 3,757 (6.3) |
| Weekend total scheduled admissions* (% of total scheduled admissions) | 17,276 (12.4) |

| Entire Year | >85% | Occupancy Threshold | >95% | >100% |
|---|---|---|---|---|
| >90% | ||||
| ||||
| No. of hospitals (n = 39) with mean weekday occupancy above threshold | ||||
| Before smoothing (current state) | 33 | 25 | 14 | 6 |
| After smoothing | 32 | 22 | 10 | 1 |
| No. of hospitals (n = 39) above threshold 20% of weekdays | ||||
| Before smoothing (current state) | 35 | 34 | 29 | 14 |
| After smoothing | 35 | 32 | 21 | 9 |
| Median (IQR) no. of patient‐days per hospital not exposed to occupancy above threshold by smoothing | 3,071 | 281 | 3236 | 3281 |
| (5,552, 919) | (5,288, 3,103) | (0, 7,083) | (962, 8,517) | |
| Median (IQR) no. of patients per hospital not exposed to occupancy above threshold by smoothing | 596 | 50 | 630 | 804 |
| (1,190, 226) | (916, 752) | (0, 1,492) | (231, 2,195) | |
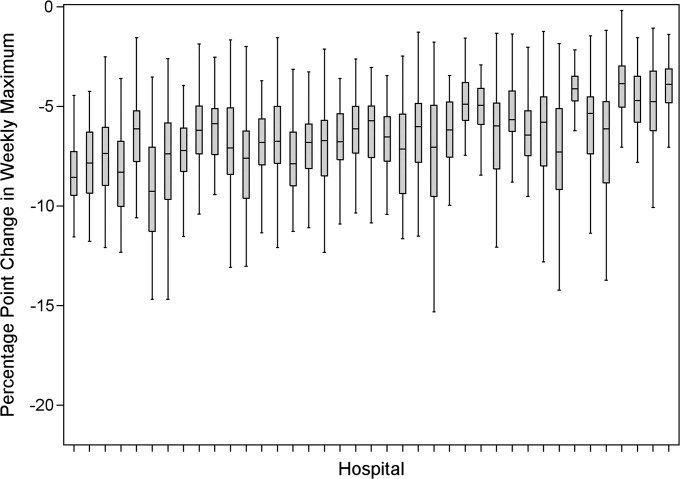
Smoothing reduced the number of hospitals at each occupancy threshold, except 85% (Table 2). As a linear relationship, the reduction in weekday peak occupancy (y) based on a hospital's median difference in weekly maximum and weekly mean occupancy (x) was y = 2.69 + 0.48x. Thus, a hospital with a 10% point difference between weekday and weekend occupancy could reduce weekday peak by 7.5% points.
Smoothing increased the number of patients exposed to the lower thresholds (85% and 90%), but decreased the number of patients exposed to >95% occupancy (Table 2). For example, smoothing at the 95% threshold resulted in 630 fewer patients per hospital exposed to that threshold. If all 39 hospitals had within‐week smoothing, a net of 39,607 patients would have been protected from exposure to >95% occupancy and a net of 50,079 patients from 100% occupancy.
To demonstrate the varied effects of smoothing, Table 3 and Figure 3 present representative categories of response to smoothing depending on pre‐smoothing patterns. While not all hospitals decreased occupancy to below thresholds after smoothing (Types B and D), the overall occupancy was reduced and fewer patients were exposed to extreme levels of high occupancy (eg, >100%).
| Category | Before Smoothing Hospital Description | After Smoothing Hospital Description | No. of Hospitals at 85% Threshold (n = 39) | No. of Hospitals at 95% Threshold (n = 39) |
|---|---|---|---|---|
| ||||
| Type A | Weekdays above threshold | All days below threshold, resulting in net decrease in patients exposed to occupancies above threshold | 3 | 1 |
| Weekends below threshold | ||||
| Type B | Weekdays above threshold | All days above threshold, resulting in net increase in patients exposed to occupancies above threshold | 12 | 18 |
| Weekends below threshold | ||||
| Type C | All days of week below threshold | All days of week below threshold | 6 | 19 |
| Type D | All days of week above threshold | All days of week above threshold, resulting in net decrease in patients exposed to extreme high occupancy | 18 | 1 |
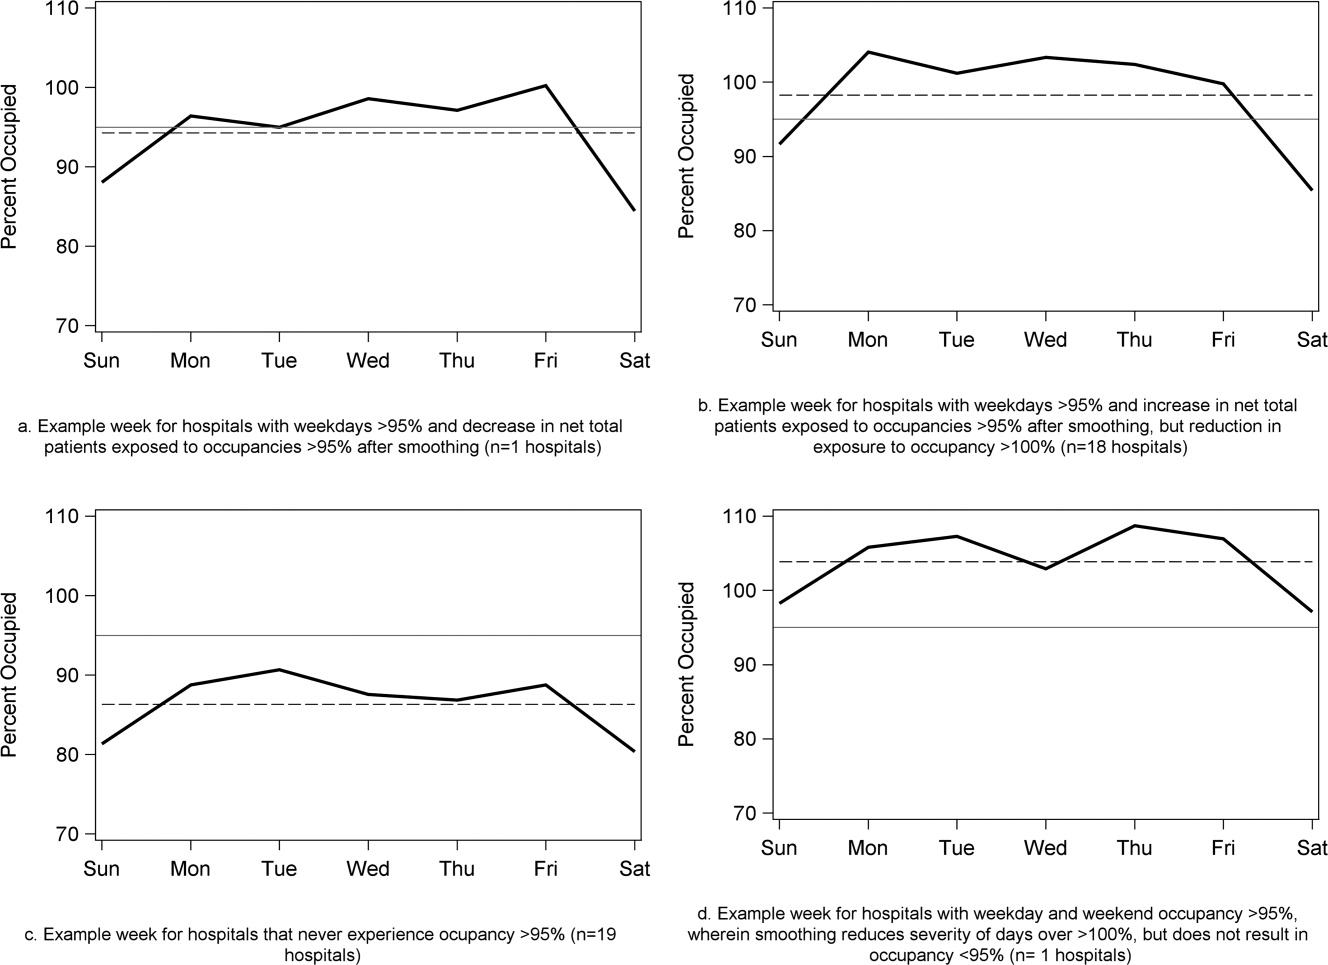
To achieve within‐week smoothing, a median of 7.4 patient‐admissions per week (range: 2.314.4) would have to be scheduled on a different day of the week. This equates to a median of 2.6% (IQR: 2.25%, 2.99%; range: 0.02%9.2%) of all admissionsor 9% of a typical hospital‐week's scheduled admissions.
Discussion
This analysis of 39 children's hospitals found high levels of occupancy and weekend occupancy lower than weekday occupancy (median difference: 8.2% points). Only 12.4% of scheduled admissions entered on weekends. Thus, weekend capacity is available to offset high weekday occupancy. Hospitals at the higher end of the occupancy thresholds (95%, 100%) would reduce the number of days operating at very high occupancy and the number of patients exposed to such levels by smoothing. This change is mathematically feasible, as a median of 7.4 patients would have to be proactively scheduled differently each week, just under one‐tenth of scheduled admissions. Since LOS by day of admission was the same (median: two days), the opportunity to affect occupancy by shifting patients should be relatively similar for all days of the week. In addition, these admissions were short, conferring greater flexibility. Implementing smoothing over the course of the week does not necessarily require admitting patients on weekends. For example, Monday admissions with an anticipated three‐day LOS could enter on Friday with anticipated discharge on Monday to alleviate midweek crowding and take advantage of unoccupied weekend beds. 26
At the highest levels of occupancy, smoothing reduces the frequency of reaching these maximum levels, but can have the effect of actually exposing more patient‐days to a higher occupancy. For example, for nine hospitals in our analysis with >20% of days over 100%, smoothing decreased days over 100%, but exposed weekend patients to higher levels of occupancy (Figure 3). Since most admissions are short and most scheduled admissions currently occur on weekdays, the number of individual patients (not patient‐days) newly exposed to such high occupancy may not increase much after smoothing at these facilities. Regardless, hospitals with such a pattern may not be able to rely solely on smoothing to avoid weekday crowding, and, if they are operating efficiently in terms of SLOSR, might be justified in building more capacity.
Consistent with our findings, the Institute for Healthcare Improvement, the Institute for Healthcare Optimization, and the American Hospital Association Quality Center stress that addressing artificial variability of scheduled admissions is a critical first step to improving patient flow and quality of care while reducing costs. 18, 21, 27 Our study suggests that small numbers of patients need to be proactively scheduled differently to decrease midweek peak occupancy, so only a small proportion of families would need to find this desirable to make it attractive for hospitals and patients. This type of proactive smoothing decreases peak occupancy on weekdays, reducing the safety risks associated with high occupancy, improving acute access for emergent patients, shortening wait‐times and loss of scheduled patients to another facility, and increasing procedure volume (3%74% in one study). 28 Smoothing may also increase quality and safety on weekends, as emergent patients admitted on weekends experience more delays in necessary treatment and have worse outcomes. 2932 In addition, increasing scheduled admissions to span weekends may appeal to some families wishing to avoid absence from work to be with their hospitalized child, to parents concerned about school performanceand may also appeal to staff members seeking flexible schedules. Increasing weekend hospital capacity is safe, feasible, and economical, even when considering the increased wages for weekend work. 33, 34 Finally, smoothing over the whole week allows fixed costs (eg, surgical suites, imaging equipment) to be allocated over 7 days rather than 5, and allows for better matching of revenue to the fixed expenses.
Rather than a prescriptive approach, our work suggests hospitals need to identify only a small number of patients to proactively shift, providing them opportunities to adapt the approach to local circumstances. The particular patients to move around may also depend on the costs and benefits of services (eg, radiologic, laboratory, operative) and the hospital's existing patterns of staffing. A number of hospitals that have engaged in similar work have achieved sustainable results, such as Seattle Children's Hospital, Boston Medical Center, St. John's Regional Health Center, and New York University Langone Medical Center. 19, 26, 3537 In these cases, proactive smoothing took advantage of unused capacity and decreased crowding on days that had been traditionally very full. Hospitals that rarely or never have high‐occupancy days, and that do not expect growth in volume, may not need to employ smoothing, whereas others that have crowding issues primarily in the winter may wish to implement smoothing techniques seasonally.
Aside from attempting to reduce high‐occupancy through modification of admission patterns, other proactive approaches include optimizing staffing and processes around care, improving efficiency of care, and building additional beds. 16, 25, 38, 39 However, the expense of construction and the scarcity of capital often preclude this last option. Among children's hospitals, with SLOSR close to one, implementing strategies to reduce the LOS during periods of high occupancy may not result in meaningful reductions in LOS, as such approaches would only decrease the typical child's hospitalization by hours, not days. In addition to proactive strategies, hospitals also rely on reactive approaches, such as ED boarding, placing patients in hallways on units, diverting ambulances or transfers, or canceling scheduled admissions at the last moment, to decrease crowding. 16, 39, 40
This study has several limitations. First, use of administrative data precluded modeling all responses. For example, some hospitals may be better able to accommodate fluctuations in census or high occupancy without compromising quality or access. Second, we only considered intra‐week smoothing, but hospitals may benefit from smoothing over longer periods of time, especially since children's hospitals are busier in winter months, but incoming scheduled volume is often not reduced. 11 Hospitals with large occupancy variations across months may want to consider broadening the time horizon for smoothing, and weigh the costs and benefits over that period of time, including parental and clinician concerns and preferences for not delaying treatment. At the individual hospital level, discrete‐event simulation would likely be useful to consider the trade‐offs of smoothing to different levels and over different periods of time. Third, we assumed a fixed number of beds for the year, an approach that may not accurately reflect actual available beds on specific days. This limitation was minimized by counting all beds for each hospital as available for all the days of the year, so that hospitals with a high census when all available beds are included would have an even higher percent occupancy if some of those beds were not actually open. In a related way, then, we also do not consider how staffing may need to be altered or augmented to care for additional patients on certain days. Fourth, midnight census, the only universally available measure, was used to determine occupancy rather than peak census. Midnight census provides a standard snapshot, but is lower than mid‐day peak census. 41 In order to account for these limitations, we considered several different thresholds of high occupancy. Fifth, we smoothed at the hospital level, but differential effects may exist at the unit level. Sixth, to determine proportion of scheduled admissions, we used HCUP KID proportions on PHIS admissions. Overall, this approach likely overestimated scheduled medical admissions on weekends, thus biasing our result towards the null hypothesis. Finally, only freestanding children's hospitals were included in this study. While this may limit generalizability, the general concept of smoothing occupancy should apply in any setting with substantial and consistent variation.
In summary, our study revealed that children's hospitals often face high midweek occupancy, but also have substantial unused weekend capacity. Hospitals facing challenges with high weekday occupancy could proactively use a smoothing approach to decrease the frequency and severity of high occupancy. Further qualitative evaluation is also warranted around child, family, and staff preferences concerning scheduled admissions, school, and work.
- , , , . A comparison of in‐hospital mortality risk conferred by high hospital occupancy, differences in nurse staffing levels, weekend admission, and seasonal influenza. Medical Care. 2010;48(3):224–232.
- , , , et al. Hospital workload and adverse events. Med Care. 2007;45(5):448–455.
- , , , , . Impact of admission‐day crowding on the length of stay of pediatric hospitalizations. Pediatrics. 2008;121(4):e718–e730.
- , , , . The effect of hospital bed occupancy on throughput in the pediatric emergency department. Ann Emerg Med. 2009;53(6):767–776.
- . The tipping point: the relationship between volume and patient harm. Am J Med Qual. 2008;23(5):336–341.
- , , , , , . Managing unnecessary variability in patient demand to reduce nursing stress and improve patient safety. Jt Comm J Qual Patient Saf. 2005;31(6):330–338.
- Hospital‐Based Emergency Care: At the Breaking Point. Washington, DC: Institute of Medicine Committee on the Future of Emergency Care in the United States Health System; 2006.
- , , , , . The effect of hospital occupancy on emergency department length of stay and patient disposition. Acad Emerg Med. 2003;10(2):127–133.
- . Interpreting the Volume‐Outcome Relationship in the Context of Health Care Quality: Workshop Summary. Washington, DC: National Academies Press; 2000.
- , , , , . Has recognition of the relationship between mortality rates and hospital volume for major cancer surgery in California made a difference? A follow‐up analysis of another decade. Ann Surg. 2009;250(3):472–483.
- , , , et al. Children's hospitals do not acutely respond to high occupancy. Pediatrics. 2010;125:974–981.
- , , , , , . Scheduled admissions and high occupancy at a children's hospital. J Hosp Med. 2011;6(2):81–87.
- , , . Characteristics of weekday and weekend hospital admissions. HCUP Statistical Brief. 2010;87.
- Agency for Healthcare Research and Quality. HCUP databases, Healthcare Cost and Utilization Project (HCUP); 2008. Available at: http://www.hcup‐us.ahrq.gov/kidoverview.jsp. Accessed July 15, 2009.
- , et al. Managing capacity to reduce emergency department overcrowding and ambulance diversions. J Qual Patient Saf. 2006;32(5):239–245.
- Institute for Healthcare Improvement. Flow initiatives; 2008. Available at: http://www.ihi.org/IHI/Topics/Flow. Accessed February 20, 2008.
- , , , , , . Trends in high‐turnover stays among children hospitalized in the United States, 1993–2003. Pediatrics. 2009;123(3):996–1002.
- Institute for Healthcare Improvement. Smoothing elective surgical admissions. Available at: http://www.ihi.org/IHI/Topics/Flow/PatientFlow/EmergingContent/SmoothingElectiveSurgicalAdmissions.htm. Accessed October 24, 2008.
- Boston hospital sees big impact from smoothing elective schedule. OR Manager. 2004;20:12.
- . Managing Variability in Patient Flow Is the Key to Improving Access to Care, Nursing Staffing, Quality of Care, and Reducing Its Cost. Paper presented at Institute of Medicine, Washington, DC; June 24, 2004.
- American Hospital Association Quality Center. Available at: http://www.ahaqualitycenter.org/ahaqualitycenter/. Accessed October 14, 2008.
- Healthcare Cost and Utilization Project (HCUP). Kids' Inpatient Database (KID); July 2008. Available at: http://www.hcup‐us.ahrq.gov/kidoverview.jsp. Accessed September 10, 2008.
- , , . Using a queuing model to help plan bed allocation in a department of geriatric medicine. Health Care Manag Sci. 2002;5(4):307–313.
- . How many hospital beds? Inquiry. 2002;39(4):400–412.
- . Institute for Healthcare Improvement. Patient flow comments. Available at: http://www.ihi.org/IHI/Topics/Flow. Accessed September 10, 2008.
- . Factory efficiency comes to the hospital. New York Times. July 9, 2010.
- Institute for Healthcare Improvement. Re‐engineering the operating room. Available at: http://www.ihi.org/IHI/Programs/ConferencesAndSeminars/ReengineeringtheOperatingRoomSept08.htm. Accessed November 8, 2008.
- , . Enhanced weekend service: an affordable means to increased hospital procedure volume. CMAJ. 2005;172(4):503–504.
- , . Mortality among patients admitted to hospitals on weekends as compared with weekdays. N Engl J Med. 2001;345:663–668.
- , , , , , . Weekend versus weekday admission and mortality from myocardial infarction. N Engl J Med. 2007;356:1099–1109.
- , . Waiting for urgent procedures on the weekend among emergently hospitalized patients. Am J Med. 2004;117:175–181.
- . Do hospitals provide lower quality care on weekends? Health Serv Res. 2007;42:1589–1612.
- . Hospital saves by working weekends. Mod Healthc. 1996;26:82–99.
- , , , , . Weekend and holiday exercise testing in patients with chest pain. J Gen Intern Med. 1999;14:10–14.
- . Boston Medical Center Case Study: Institute of Healthcare Optimization; 2006. Available at: http://www.ihoptimize.org/8f16e142‐eeaa‐4898–9e62–660218f19ffb/download.htm. Accessed October 3, 2010.
- , , , . The impact of IMPACT on St John's Regional Health Center. Mo Med. 2003;100:590–592.
- NYU Langone Medical Center Extends Access to Non‐Emergent Care as Part of Commitment to Patient‐Centered Care (June 23, 2010). Available at: http://communications.med.nyu.edu/news/2010/nyu‐langone‐medical‐center‐extends‐access‐non‐emergent‐care‐part‐commitment‐patient‐center. Accessed October 3, 2010.
- Carondelet St. Mary's Hospital. A pragmatic approach to improving patient efficiency throughput. Improvement Report 2005. Available at: http://www.ihi.org/IHI/Topics/Flow/PatientFlow/ImprovementStories/APragmaticApproachtoImprovingPatientEfficiencyThroughput.htm. Accessed October 3, 2010.
- AHA Solutions. Patient Flow Challenges Assessment 2009. Chicago, IL; 2009.
- , , , , , . A conceptual model of emergency department crowding. Ann Emerg Med. 2003;42(2):173–180.
- . Annual bed statistics give a misleading picture of hospital surge capacity. Ann Emerg Med. 2006;48(4):384–388.
High levels of hospital occupancy are associated with compromises to quality of care and access (often referred to as crowding), 18 while low occupancy may be inefficient and also impact quality. 9, 10 Despite this, hospitals typically have uneven occupancy. Although some demand for services is driven by factors beyond the control of a hospital (eg, seasonal variation in viral illness), approximately 15%30% of admissions to children's hospitals are scheduled from days to months in advance, with usual arrivals on weekdays. 1114 For example, of the 3.4 million elective admissions in the 2006 Healthcare Cost and Utilization Project Kids Inpatient Database (HCUP KID), only 13% were admitted on weekends. 14 Combined with short length of stay (LOS) for such patients, this leads to higher midweek and lower weekend occupancy. 12
Hospitals respond to crowding in a number of ways, but often focus on reducing LOS to make room for new patients. 11, 15, 16 For hospitals that are relatively efficient in terms of LOS, efforts to reduce it may not increase functional capacity adequately. In children's hospitals, median lengths of stay are 2 to 3 days, and one‐third of hospitalizations are 1 day or less. 17 Thus, even 10%20% reductions in LOS trims hours, not days, from typical stays. Practical barriers (eg, reluctance to discharge in the middle of the night, or family preferences and work schedules) and undesired outcomes (eg, increased hospital re‐visits) are additional pitfalls encountered by relying on throughput enhancement alone.
Managing scheduled admissions through smoothing is an alternative strategy to reduce variability and high occupancy. 6, 12, 1820 The concept is to proactively control the entry of patients, when possible, to achieve more even levels of occupancy, instead of the peaks and troughs commonly encountered. Nonetheless, it is not a widely used approach. 18, 20, 21 We hypothesized that children's hospitals had substantial unused capacity that could be used to smooth occupancy, which would reduce weekday crowding. While it is obvious that smoothing will reduce peaks to average levels (and also raise troughs), we sought to quantify just how large this difference wasand thereby quantify the potential of smoothing to reduce inpatient crowding (or, conversely, expose more patients to high levels of occupancy). Is there enough variation to justify smoothing, and, if a hospital does smooth, what is the expected result? If the number of patients removed from exposure to high occupancy is not substantial, other means to address inpatient crowding might be of more value. Our aims were to quantify the difference in weekday versus weekend occupancy, report on mathematical feasibility of such an approach, and determine the difference in number of patients exposed to various levels of high occupancy.
Methods
Data Source
This retrospective study was conducted with resource‐utilization data from 39 freestanding, tertiary‐care children's hospitals in the Pediatric Health Information System (PHIS). Participating hospitals are located in noncompeting markets of 23 states, plus the District of Columbia, and affiliated with the Child Health Corporation of America (CHCA, Shawnee Mission, KS). They account for 80% of freestanding, and 20% of all general, tertiary‐care children's hospitals. Data quality and reliability are assured through joint ongoing, systematic monitoring. The Children's Hospital of Philadelphia Committees for the Protection of Human Subjects approved the protocol with a waiver of informed consent.
Patients
Patients admitted January 1December 31, 2007 were eligible for inclusion. Due to variation in the presence of birthing, neonatal intensive care, and behavioral health units across hospitals, these beds and associated patients were excluded. Inpatients enter hospitals either as scheduled (often referred to as elective) or unscheduled (emergent or urgent) admissions. Because PHIS does not include these data, KID was used to standardize the PHIS data for proportion of scheduled admissions. 22 (KID is a healthcare database of 23 million pediatric inpatient discharges developed through federalstateindustry partnership, and sponsored by the Agency for Healthcare Research and Quality [AHRQ].) Each encounter in KID includes a principal International Classification of Diseases, 9th revision (ICD‐9) discharge diagnosis code, and is designated by the hospital as elective (ranging from chemotherapy to tonsillectomy) or not elective. Because admissions, rather than diagnoses, are scheduled, a proportion of patients with each primary diagnosis in KID are scheduled (eg, 28% of patients with a primary diagnosis of esophageal reflux). Proportions in KID were matched to principal diagnoses in PHIS.
Definitions
The census was the number of patients registered as inpatients (including those physically in the emergency department [ED] from time of ED arrival)whether observation or inpatient statusat midnight, the conclusion of the day. Hospital capacity was set using CHCA data (and confirmed by each hospital's administrative personnel) as the number of licensed in‐service beds available for patients in 2007; we assumed beds were staffed and capacity fixed for the year. Occupancy was calculated by dividing census by capacity. Maximum occupancy in a week referred to the highest occupancy level achieved in a seven‐day period (MondaySunday). We analyzed a set of thresholds for high‐occupancy (85%, 90%, 95%, and 100%), because there is no consistent definition for when hospitals are at high occupancy or when crowding occurs, though crowding has been described as starting at 85% occupancy. 2325
Analysis
The hospital was the unit of analysis. We report hospital characteristics, including capacity, number of discharges, and census region, and annual standardized length of stay ratio (SLOSR) as observed‐to‐expected LOS.
Smoothing Technique
A retrospective smoothing algorithm set each hospital's daily occupancy during a week to that hospital's mean occupancy for the week; effectively spreading the week's volume of patients evenly across the days of the week. While inter‐week and inter‐month smoothing were considered, intra‐week smoothing was deemed more practical for the largest number of patients, as it would not mean delaying care by more than one week. In the case of a planned treatment course (eg, chemotherapy), only intra‐week smoothing would maintain the necessary scheduled intervals of treatment.
Mathematical Feasibility
To approximate the number of patient admissions that would require different scheduling during a particular week to achieve smoothed weekly occupancy, we determined the total number of patient‐days in the week that required different scheduling and divided by the average LOS for the week. We then divided the number of admissions‐to‐move by total weekly admissions to compute the percentage at each hospital across 52 weeks of the year.
Measuring the Impact of Smoothing
We focused on the frequency and severity of high occupancy and the number of patients exposed to it. This framework led to 4 measures that assess the opportunity and effect of smoothing:
Difference in hospital weekdayweekend occupancy: Equal to 12‐month median of difference between mean weekday occupancy and mean weekend occupancy for each hospital‐week.
Difference in hospital maximummean occupancy: Equal to median of difference between maximum one‐day occupancy and weekly mean (smoothed) occupancy for each hospital‐week. A regression line was derived from the data for the 39 hospitals to report expected reduction in peak occupancy based on the magnitude of the difference between weekday and weekend occupancy.
Difference in number of hospitals exposed to above‐threshold occupancy: Equal to difference, pre‐ and post‐smoothing, in number of hospitals facing high‐occupancy conditions on an average of at least one weekday midnight per week during the year at different occupancy thresholds.
Difference in number of patients exposed to above‐threshold occupancy: Equal to difference, pre‐ and post‐smoothing, in number of patients exposed to hospital midnight occupancy at the thresholds. We utilized patient‐days for the calculation to avoid double‐counting, and divided this by average LOS, in order to determine the number of patients who would no longer be exposed to over‐threshold occupancy after smoothing, while also adjusting for patients newly exposed to over‐threshold occupancy levels.
All analyses were performed separately for each hospital for the entire year and then for winter (DecemberMarch), the period during which most crowding occurred. Analyses were performed using SAS (version 9.2, SAS Institute, Inc, Cary, NC); P values <0.05 were considered statistically significant.
Results
The characteristics of the 39 hospitals are provided in Table 1. Based on standardization with KID, 23.6% of PHIS admissions were scheduled (range: 18.1%35.8%) or a median of 81.5 scheduled admissions per week per hospital; 26.6% of weekday admissions were scheduled versus 16.1% for weekends. Overall, 12.4% of scheduled admissions entered on weekends. For all patients, median LOS was three days (interquartile range [IQR]: twofive days), but median LOS for scheduled admissions was two days (IQR: onefour days). The median LOS and IQR were the same by day of admission for all days of the week. Most hospitals had an overall SLOSR close to one (median: 0.9, IQR: 0.91.1). Overall, hospital mean midnight occupancy ranged from 70.9% to 108.1% on weekdays and 65.7% to 94.9% on weekends. Uniformly, weekday occupancy exceeded weekend occupancy, with a median difference of 8.2% points (IQR: 7.2%9.5% points). There was a wide range of median hospital weekdayweekend occupancy differences across hospitals (Figure 1). The overall difference was less in winter (median difference: 7.7% points; IQR: 6.3%8.8% points) than in summer (median difference: 8.6% points; IQR: 7.4%9.8% points (Wilcoxon Sign Rank test, P < 0.001). Thirty‐five hospitals (89.7%) exceeded the 85% occupancy threshold and 29 (74.4%) exceeded the 95% occupancy threshold on at least 20% of weekdays (Table 2). Across all the hospitals, the median difference in weekly maximum and weekly mean occupancy was 6.6% points (IQR: 6.2%7.4% points) (Figure 2).
| Characteristics | No. (%) |
|---|---|
| |
| Licensed in‐service beds | n = 39 hospitals |
| <200 beds | 6 (15.4) |
| 200249 beds | 10 (25.6) |
| 250300 beds | 14 (35.9) |
| >300 beds | 9 (23.1) |
| No. of discharges | |
| <10,000 | 5 (12.8) |
| 10,00013,999 | 14 (35.9) |
| 14,00017,999 | 11 (28.2) |
| >18,000 | 9 (23.1) |
| Census region | |
| West | 9 (23.1) |
| Midwest | 11 (28.2) |
| Northeast | 6 (15.4) |
| South | 13 (33.3) |
| Admissions | n = 590,352 admissions |
| Medical scheduled admissions* | 79,683 |
| Surgical scheduled admissions* | 59,640 |
| Total scheduled admissions* (% of all admissions) | 139,323 (23.6) |
| Weekend medical scheduled admissions* (% of all medical scheduled admissions) | 13,546 (17.0) |
| Weekend surgical scheduled admissions* (% of all surgical scheduled admissions) | 3,757 (6.3) |
| Weekend total scheduled admissions* (% of total scheduled admissions) | 17,276 (12.4) |
| Entire Year | >85% | Occupancy Threshold | >95% | >100% |
|---|---|---|---|---|
| >90% | ||||
| ||||
| No. of hospitals (n = 39) with mean weekday occupancy above threshold | ||||
| Before smoothing (current state) | 33 | 25 | 14 | 6 |
| After smoothing | 32 | 22 | 10 | 1 |
| No. of hospitals (n = 39) above threshold 20% of weekdays | ||||
| Before smoothing (current state) | 35 | 34 | 29 | 14 |
| After smoothing | 35 | 32 | 21 | 9 |
| Median (IQR) no. of patient‐days per hospital not exposed to occupancy above threshold by smoothing | 3,071 | 281 | 3236 | 3281 |
| (5,552, 919) | (5,288, 3,103) | (0, 7,083) | (962, 8,517) | |
| Median (IQR) no. of patients per hospital not exposed to occupancy above threshold by smoothing | 596 | 50 | 630 | 804 |
| (1,190, 226) | (916, 752) | (0, 1,492) | (231, 2,195) | |
Smoothing reduced the number of hospitals at each occupancy threshold, except 85% (Table 2). As a linear relationship, the reduction in weekday peak occupancy (y) based on a hospital's median difference in weekly maximum and weekly mean occupancy (x) was y = 2.69 + 0.48x. Thus, a hospital with a 10% point difference between weekday and weekend occupancy could reduce weekday peak by 7.5% points.
Smoothing increased the number of patients exposed to the lower thresholds (85% and 90%), but decreased the number of patients exposed to >95% occupancy (Table 2). For example, smoothing at the 95% threshold resulted in 630 fewer patients per hospital exposed to that threshold. If all 39 hospitals had within‐week smoothing, a net of 39,607 patients would have been protected from exposure to >95% occupancy and a net of 50,079 patients from 100% occupancy.
To demonstrate the varied effects of smoothing, Table 3 and Figure 3 present representative categories of response to smoothing depending on pre‐smoothing patterns. While not all hospitals decreased occupancy to below thresholds after smoothing (Types B and D), the overall occupancy was reduced and fewer patients were exposed to extreme levels of high occupancy (eg, >100%).
| Category | Before Smoothing Hospital Description | After Smoothing Hospital Description | No. of Hospitals at 85% Threshold (n = 39) | No. of Hospitals at 95% Threshold (n = 39) |
|---|---|---|---|---|
| ||||
| Type A | Weekdays above threshold | All days below threshold, resulting in net decrease in patients exposed to occupancies above threshold | 3 | 1 |
| Weekends below threshold | ||||
| Type B | Weekdays above threshold | All days above threshold, resulting in net increase in patients exposed to occupancies above threshold | 12 | 18 |
| Weekends below threshold | ||||
| Type C | All days of week below threshold | All days of week below threshold | 6 | 19 |
| Type D | All days of week above threshold | All days of week above threshold, resulting in net decrease in patients exposed to extreme high occupancy | 18 | 1 |
To achieve within‐week smoothing, a median of 7.4 patient‐admissions per week (range: 2.314.4) would have to be scheduled on a different day of the week. This equates to a median of 2.6% (IQR: 2.25%, 2.99%; range: 0.02%9.2%) of all admissionsor 9% of a typical hospital‐week's scheduled admissions.
Discussion
This analysis of 39 children's hospitals found high levels of occupancy and weekend occupancy lower than weekday occupancy (median difference: 8.2% points). Only 12.4% of scheduled admissions entered on weekends. Thus, weekend capacity is available to offset high weekday occupancy. Hospitals at the higher end of the occupancy thresholds (95%, 100%) would reduce the number of days operating at very high occupancy and the number of patients exposed to such levels by smoothing. This change is mathematically feasible, as a median of 7.4 patients would have to be proactively scheduled differently each week, just under one‐tenth of scheduled admissions. Since LOS by day of admission was the same (median: two days), the opportunity to affect occupancy by shifting patients should be relatively similar for all days of the week. In addition, these admissions were short, conferring greater flexibility. Implementing smoothing over the course of the week does not necessarily require admitting patients on weekends. For example, Monday admissions with an anticipated three‐day LOS could enter on Friday with anticipated discharge on Monday to alleviate midweek crowding and take advantage of unoccupied weekend beds. 26
At the highest levels of occupancy, smoothing reduces the frequency of reaching these maximum levels, but can have the effect of actually exposing more patient‐days to a higher occupancy. For example, for nine hospitals in our analysis with >20% of days over 100%, smoothing decreased days over 100%, but exposed weekend patients to higher levels of occupancy (Figure 3). Since most admissions are short and most scheduled admissions currently occur on weekdays, the number of individual patients (not patient‐days) newly exposed to such high occupancy may not increase much after smoothing at these facilities. Regardless, hospitals with such a pattern may not be able to rely solely on smoothing to avoid weekday crowding, and, if they are operating efficiently in terms of SLOSR, might be justified in building more capacity.
Consistent with our findings, the Institute for Healthcare Improvement, the Institute for Healthcare Optimization, and the American Hospital Association Quality Center stress that addressing artificial variability of scheduled admissions is a critical first step to improving patient flow and quality of care while reducing costs. 18, 21, 27 Our study suggests that small numbers of patients need to be proactively scheduled differently to decrease midweek peak occupancy, so only a small proportion of families would need to find this desirable to make it attractive for hospitals and patients. This type of proactive smoothing decreases peak occupancy on weekdays, reducing the safety risks associated with high occupancy, improving acute access for emergent patients, shortening wait‐times and loss of scheduled patients to another facility, and increasing procedure volume (3%74% in one study). 28 Smoothing may also increase quality and safety on weekends, as emergent patients admitted on weekends experience more delays in necessary treatment and have worse outcomes. 2932 In addition, increasing scheduled admissions to span weekends may appeal to some families wishing to avoid absence from work to be with their hospitalized child, to parents concerned about school performanceand may also appeal to staff members seeking flexible schedules. Increasing weekend hospital capacity is safe, feasible, and economical, even when considering the increased wages for weekend work. 33, 34 Finally, smoothing over the whole week allows fixed costs (eg, surgical suites, imaging equipment) to be allocated over 7 days rather than 5, and allows for better matching of revenue to the fixed expenses.
Rather than a prescriptive approach, our work suggests hospitals need to identify only a small number of patients to proactively shift, providing them opportunities to adapt the approach to local circumstances. The particular patients to move around may also depend on the costs and benefits of services (eg, radiologic, laboratory, operative) and the hospital's existing patterns of staffing. A number of hospitals that have engaged in similar work have achieved sustainable results, such as Seattle Children's Hospital, Boston Medical Center, St. John's Regional Health Center, and New York University Langone Medical Center. 19, 26, 3537 In these cases, proactive smoothing took advantage of unused capacity and decreased crowding on days that had been traditionally very full. Hospitals that rarely or never have high‐occupancy days, and that do not expect growth in volume, may not need to employ smoothing, whereas others that have crowding issues primarily in the winter may wish to implement smoothing techniques seasonally.
Aside from attempting to reduce high‐occupancy through modification of admission patterns, other proactive approaches include optimizing staffing and processes around care, improving efficiency of care, and building additional beds. 16, 25, 38, 39 However, the expense of construction and the scarcity of capital often preclude this last option. Among children's hospitals, with SLOSR close to one, implementing strategies to reduce the LOS during periods of high occupancy may not result in meaningful reductions in LOS, as such approaches would only decrease the typical child's hospitalization by hours, not days. In addition to proactive strategies, hospitals also rely on reactive approaches, such as ED boarding, placing patients in hallways on units, diverting ambulances or transfers, or canceling scheduled admissions at the last moment, to decrease crowding. 16, 39, 40
This study has several limitations. First, use of administrative data precluded modeling all responses. For example, some hospitals may be better able to accommodate fluctuations in census or high occupancy without compromising quality or access. Second, we only considered intra‐week smoothing, but hospitals may benefit from smoothing over longer periods of time, especially since children's hospitals are busier in winter months, but incoming scheduled volume is often not reduced. 11 Hospitals with large occupancy variations across months may want to consider broadening the time horizon for smoothing, and weigh the costs and benefits over that period of time, including parental and clinician concerns and preferences for not delaying treatment. At the individual hospital level, discrete‐event simulation would likely be useful to consider the trade‐offs of smoothing to different levels and over different periods of time. Third, we assumed a fixed number of beds for the year, an approach that may not accurately reflect actual available beds on specific days. This limitation was minimized by counting all beds for each hospital as available for all the days of the year, so that hospitals with a high census when all available beds are included would have an even higher percent occupancy if some of those beds were not actually open. In a related way, then, we also do not consider how staffing may need to be altered or augmented to care for additional patients on certain days. Fourth, midnight census, the only universally available measure, was used to determine occupancy rather than peak census. Midnight census provides a standard snapshot, but is lower than mid‐day peak census. 41 In order to account for these limitations, we considered several different thresholds of high occupancy. Fifth, we smoothed at the hospital level, but differential effects may exist at the unit level. Sixth, to determine proportion of scheduled admissions, we used HCUP KID proportions on PHIS admissions. Overall, this approach likely overestimated scheduled medical admissions on weekends, thus biasing our result towards the null hypothesis. Finally, only freestanding children's hospitals were included in this study. While this may limit generalizability, the general concept of smoothing occupancy should apply in any setting with substantial and consistent variation.
In summary, our study revealed that children's hospitals often face high midweek occupancy, but also have substantial unused weekend capacity. Hospitals facing challenges with high weekday occupancy could proactively use a smoothing approach to decrease the frequency and severity of high occupancy. Further qualitative evaluation is also warranted around child, family, and staff preferences concerning scheduled admissions, school, and work.
- , , , . A comparison of in‐hospital mortality risk conferred by high hospital occupancy, differences in nurse staffing levels, weekend admission, and seasonal influenza. Medical Care. 2010;48(3):224–232.
- , , , et al. Hospital workload and adverse events. Med Care. 2007;45(5):448–455.
- , , , , . Impact of admission‐day crowding on the length of stay of pediatric hospitalizations. Pediatrics. 2008;121(4):e718–e730.
- , , , . The effect of hospital bed occupancy on throughput in the pediatric emergency department. Ann Emerg Med. 2009;53(6):767–776.
- . The tipping point: the relationship between volume and patient harm. Am J Med Qual. 2008;23(5):336–341.
- , , , , , . Managing unnecessary variability in patient demand to reduce nursing stress and improve patient safety. Jt Comm J Qual Patient Saf. 2005;31(6):330–338.
- Hospital‐Based Emergency Care: At the Breaking Point. Washington, DC: Institute of Medicine Committee on the Future of Emergency Care in the United States Health System; 2006.
- , , , , . The effect of hospital occupancy on emergency department length of stay and patient disposition. Acad Emerg Med. 2003;10(2):127–133.
- . Interpreting the Volume‐Outcome Relationship in the Context of Health Care Quality: Workshop Summary. Washington, DC: National Academies Press; 2000.
- , , , , . Has recognition of the relationship between mortality rates and hospital volume for major cancer surgery in California made a difference? A follow‐up analysis of another decade. Ann Surg. 2009;250(3):472–483.
- , , , et al. Children's hospitals do not acutely respond to high occupancy. Pediatrics. 2010;125:974–981.
- , , , , , . Scheduled admissions and high occupancy at a children's hospital. J Hosp Med. 2011;6(2):81–87.
- , , . Characteristics of weekday and weekend hospital admissions. HCUP Statistical Brief. 2010;87.
- Agency for Healthcare Research and Quality. HCUP databases, Healthcare Cost and Utilization Project (HCUP); 2008. Available at: http://www.hcup‐us.ahrq.gov/kidoverview.jsp. Accessed July 15, 2009.
- , et al. Managing capacity to reduce emergency department overcrowding and ambulance diversions. J Qual Patient Saf. 2006;32(5):239–245.
- Institute for Healthcare Improvement. Flow initiatives; 2008. Available at: http://www.ihi.org/IHI/Topics/Flow. Accessed February 20, 2008.
- , , , , , . Trends in high‐turnover stays among children hospitalized in the United States, 1993–2003. Pediatrics. 2009;123(3):996–1002.
- Institute for Healthcare Improvement. Smoothing elective surgical admissions. Available at: http://www.ihi.org/IHI/Topics/Flow/PatientFlow/EmergingContent/SmoothingElectiveSurgicalAdmissions.htm. Accessed October 24, 2008.
- Boston hospital sees big impact from smoothing elective schedule. OR Manager. 2004;20:12.
- . Managing Variability in Patient Flow Is the Key to Improving Access to Care, Nursing Staffing, Quality of Care, and Reducing Its Cost. Paper presented at Institute of Medicine, Washington, DC; June 24, 2004.
- American Hospital Association Quality Center. Available at: http://www.ahaqualitycenter.org/ahaqualitycenter/. Accessed October 14, 2008.
- Healthcare Cost and Utilization Project (HCUP). Kids' Inpatient Database (KID); July 2008. Available at: http://www.hcup‐us.ahrq.gov/kidoverview.jsp. Accessed September 10, 2008.
- , , . Using a queuing model to help plan bed allocation in a department of geriatric medicine. Health Care Manag Sci. 2002;5(4):307–313.
- . How many hospital beds? Inquiry. 2002;39(4):400–412.
- . Institute for Healthcare Improvement. Patient flow comments. Available at: http://www.ihi.org/IHI/Topics/Flow. Accessed September 10, 2008.
- . Factory efficiency comes to the hospital. New York Times. July 9, 2010.
- Institute for Healthcare Improvement. Re‐engineering the operating room. Available at: http://www.ihi.org/IHI/Programs/ConferencesAndSeminars/ReengineeringtheOperatingRoomSept08.htm. Accessed November 8, 2008.
- , . Enhanced weekend service: an affordable means to increased hospital procedure volume. CMAJ. 2005;172(4):503–504.
- , . Mortality among patients admitted to hospitals on weekends as compared with weekdays. N Engl J Med. 2001;345:663–668.
- , , , , , . Weekend versus weekday admission and mortality from myocardial infarction. N Engl J Med. 2007;356:1099–1109.
- , . Waiting for urgent procedures on the weekend among emergently hospitalized patients. Am J Med. 2004;117:175–181.
- . Do hospitals provide lower quality care on weekends? Health Serv Res. 2007;42:1589–1612.
- . Hospital saves by working weekends. Mod Healthc. 1996;26:82–99.
- , , , , . Weekend and holiday exercise testing in patients with chest pain. J Gen Intern Med. 1999;14:10–14.
- . Boston Medical Center Case Study: Institute of Healthcare Optimization; 2006. Available at: http://www.ihoptimize.org/8f16e142‐eeaa‐4898–9e62–660218f19ffb/download.htm. Accessed October 3, 2010.
- , , , . The impact of IMPACT on St John's Regional Health Center. Mo Med. 2003;100:590–592.
- NYU Langone Medical Center Extends Access to Non‐Emergent Care as Part of Commitment to Patient‐Centered Care (June 23, 2010). Available at: http://communications.med.nyu.edu/news/2010/nyu‐langone‐medical‐center‐extends‐access‐non‐emergent‐care‐part‐commitment‐patient‐center. Accessed October 3, 2010.
- Carondelet St. Mary's Hospital. A pragmatic approach to improving patient efficiency throughput. Improvement Report 2005. Available at: http://www.ihi.org/IHI/Topics/Flow/PatientFlow/ImprovementStories/APragmaticApproachtoImprovingPatientEfficiencyThroughput.htm. Accessed October 3, 2010.
- AHA Solutions. Patient Flow Challenges Assessment 2009. Chicago, IL; 2009.
- , , , , , . A conceptual model of emergency department crowding. Ann Emerg Med. 2003;42(2):173–180.
- . Annual bed statistics give a misleading picture of hospital surge capacity. Ann Emerg Med. 2006;48(4):384–388.
Copyright © 2011 Society of Hospital Medicine