User login
Hospital-level factors associated with pediatric emergency department return visits
Return visit (RV) rate is a quality measure commonly used in the emergency department (ED) setting. This metric may represent suboptimal care at the index ED visit.1-5 Although patient- and visit-level factors affecting ED RVs have been evaluated,1,3,4,6-9 hospital-level factors and factors of a hospital’s patient population that may play roles in ED RV rates have not been examined. Identifying the factors associated with increased RVs may allow resources to be designated to areas that improve emergent care for children.10
Hospital readmission rates are a closely followed quality measure and are linked to reimbursement by the federal government, but a recent study found the influence a hospital can have on this marker may be mitigated by the impact of the social determinates of health (SDHs) of the hospital’s patient population.11 That study and others have prompted an ongoing debate about adjusting quality measures for SDHs.12,13 A clearer understanding of these interactions may permit us to focus on factors that can truly lead to improvement in care instead of penalizing practitioners or hospitals that provide care to those most in need.
Prior work has identified several SDHs associated with higher ED RV rates in patient- or visit-level analyses.3,11,14 We conducted a study of hospital-level characteristics and characteristics of a hospital’s patient population to identify potentially mutable factors associated with increased ED RV rates that, once recognized, may allow for improvement in this quality measure.
PATIENTS AND METHODS
This study was not considered human subjects research in accordance with Common Rule 45 CFR§46.104(f) and was evaluated by the Ann and Robert H. Lurie Children’s Hospital and Northwestern University Feinberg School of Medicine Institutional Review Boards and deemed exempt from review.
Study Population and Protocol
Our study had 2 data sources (to be described in detail): the Pediatric Health Information System (PHIS) and a survey of ED medical directors of the hospitals represented within PHIS. Hospitals were eligible for inclusion in the study if their data (1) met PHIS quality control standards for ED patient visits as determined by internal data assurance processes incorporated in PHIS,3,14,15 (2) included data only from an identifiable single main ED, and (3) completed the ED medical director’s survey.
PHIS Database
PHIS, an administrative database managed by Truven Health Analytics, includes data from ED, ambulatory surgery, observation, and inpatient encounters across Children’s Hospital Association member children’s hospitals in North America. Data are subjected to validity checks before being included in the database.16 PHIS assigns unique patient identifiers to track individual patient visits within participating institutions over time.
Hospitals were described by percentages of ED patients in several groups: age (<1, 1-4, 5-9, 10-14, and 15-18 years)17; sex; race/ethnicity; insurance type (commercial, government, other); ED International Classification of Diseases, Ninth Edition (ICD-9) diagnosis code–based severity classification system score (1-2, low severity; 3-5, high severity)18; complex
ED Medical Director Survey
A web-based survey was constructed in an iterative process based on literature review and expert opinion to assess hospital-level factors that may impact ED RV rates.3,7,24-26 The survey was piloted at 3 institutions to refine its structure and content.
The survey included 15 close-ended or multiple-choice questions on ED environment and operations and 2 open-ended questions, “What is the largest barrier to reducing the number of return visits within 72 hours of discharge from a previous ED visit?” and “In your opinion, what is the best way of reducing the number of the return visits within 72 hours of previous ED visit ?” (questionnaire in Supplemental material). Hospital characteristics from the survey included total clinical time allotment, or full-time equivalent (FTE), among all physicians, pediatric emergency medicine (PEM) fellowship-trained physicians, and all other (non-PEM) physicians. The data were standardized across sites by calculating FTE-per-10,000-visits values for each hospital; median duration of ED visit for admitted and discharged patients; median time from arrival to ED physician evaluation; rate of leaving without being seen; discharge educational material authorship and age specificity; follow-up visit scheduling procedure; and percentage of ED patients for whom English was a second language.
Responses to the 2 open-ended questions were independently categorized by Drs. Pittsenbarger and Alpern. Responses could be placed in more than 1 category if multiple answers to the question were included in the response. Categorizations were compared for consistency, and any inconsistencies were resolved by the consensus of the study investigators.
Outcome Measures From PHIS Database
All ED visits within a 12-month period (July 1, 2013–June 30, 2014) by patients younger than 18 years at time of index ED visit were eligible for inclusion in the study. An index visit was defined as any ED visit without another ED visit within the preceding 72 hours. The 72-hour time frame was used because it is the most widely studied time frame for ED RVs.5 Index ED visits that led to admission, observation status, death, or transfer were excluded.
The 2 primary outcomes of interest were (1) RVs within 72 hours of index ED visit discharge and (2) RVs within 72 hours that resulted in hospital admission or observation status at the next ED visit (RVA).7,9,27-30 For patients with multiple ED revisits within 72 hours, only the first was assessed. There was a 72-hour minimum between index visits for the same patient.
Statistical Analyses
To determine hospital groups based on RV and RVA rates, we adjusted RV and RVA rates using generalized linear mixed-effects models, controlling for clustering and allowing for correlated data (within hospitals), nonconstant variability (across hospitals), and non-normally distributed data, as we did in a study of patient-level factors associated with ED RV and RVA.3 For each calculated rate (RV, RVA), the hospitals were then classified into 3 groups based on whether the hospital’s adjusted RV and RVA rates were outside 2 SDs from the mean, below the 5th or above the 95th percentile, or within that range. These groups were labeled lowest outliers, highest outliers, and average-performing hospitals.
After the groups of hospitals were determined, we returned to using unadjusted data to statistically analyze them. We summarized continuous variables using minimum and maximum values, medians, and interquartile ranges (IQRs). We present categorical variables using counts and percentages. To identify hospital characteristics with the most potential to gain from improvement, we also analyzed associations using 2 collapsed groups: hospitals with RV (or RVA) rates included in the average-performing and lowest outlier groups and hospitals within the highest outlier group. Hospital characteristics and hospital’s patient population characteristics from the surveys are summarized based on RV and RVA rate groups. Differences in distributions among continuous variables were assessed by Kruskal-Wallis 1-way analysis of variance. Chi-square tests were used to evaluate differences in proportions among categorical variables. All statistical analyses were performed with SAS Version 9.4 (SAS Institute); 2-sided P < 0.05 was considered statistically significant.
RESULTS
Return Visit Rates and Hospital ED Site Population Characteristics
Twenty-four of 35 (68%) eligible hospitals that met PHIS quality control standards for ED patient visits responded to the ED medical director survey. The included hospitals that both met quality control standards and completed the survey had a total of 1,456,377 patient visits during the study period. Individual sites had annual volumes ranging from 26,627 to 96,637 ED encounters. The mean RV rate across the institutions was 3.7% (range, 3.0%-4.8%), and the mean RVA rate across the hospitals was 0.7% (range, 0.5%-1.1%) (Figure).

There were 5 hospitals with RV rates less than 2 SDs of the mean rate, placing them in the lowest outlier group for RV; 13 hospitals with RV rates within 2 SDs of the mean RV rate, placing them in the average-performing group; and 6 hospitals with RV rates above 2 SDs of the mean, placing them in the highest outlier group. Table 1 lists the hospital ED site population characteristics among the 3 RV rate groups. Hospitals in the highest outlier group served populations with higher proportions of patients with insurance from a government payer, lower proportions of patients covered by a commercial insurance plan, and higher proportion of patients with lower median household incomes.

In the RVA analysis, there were 6 hospitals with RVA rates less than 2 SDs of the mean RVA rate (lowest outliers); 14 hospitals with RVA rates within 2 SDs of the mean RVA rate (average performers); and 4 hospitals with RVA rates above 2 SDs of the mean RVA rate (highest outliers). When using these groups based on RVA rate, there were no statistically significant differences in hospital ED site population characteristics (Supplemental Table 1).
RV Rates and Hospital-Level Factors Survey Characteristics
Table 2 lists the ED medical director survey hospital-level data among the 3 RV rate groups. There were fewer FTEs by PEM fellowship-trained physicians per 10,000 patient visits at sites with higher RV rates (Table 2). Hospital-level characteristics assessed by the survey were not associated with RVA rates (Supplemental Table 2).
 and Return Visit Rates")
Evaluating characteristics of hospitals with the most potential to gain from improvement, hospitals with the highest RV rates (highest outlier group), compared with hospitals in the lowest outlier and average-performing groups collapsed together, persisted in having fewer PEM fellowship-trained physician FTEs per patient visit (Table 3). A similar collapsed analysis of RVA rates demonstrated that hospitals in the highest outlier group had longer-wait-to-physician time (81 minutes; IQR, 51-105 minutes) compared with hospitals in the other 2 groups (30 minutes; IQR, 19-42.5 minutes) (Table 3).
In response to the first qualitative question on the ED medial director survey, “In your opinion, what is the largest barrier to reducing the number of return visits within 72 hours of discharge from a previous ED visit?”, 15 directors (62.5%) reported limited access to primary care, 4 (16.6%) reported inadequate discharge instructions and/or education provided, and 3 (12.5%) reported lack of access to specialist care. To the second question, “In your opinion, what is the best way of reducing the number of the return visits within 72 hours of previous ED visit for the same condition?”, they responded that RVs could be reduced by innovations in scheduling primary care or specialty follow-up visits (19, 79%), improving discharge education and instructions (6, 25%), and identifying more case management or care coordination (4, 16.6%).
DISCUSSION
Other studies have identified patient- and visit-level characteristics associated with higher ED RV and RVA rates.3,8,9,31 However, as our goal was to identify possible modifiable institutional features, our study examined factors at hospital and population-served levels (instead of patient or visit level) that may impact ED RV and RVA rates. Interestingly, our sample of tertiary-care pediatric center EDs provided evidence of variability in RV and RVA rates. We identified factors associated with RV rates related to the SDHs of the populations served by the ED, which suggests these factors are not modifiable at an institution level. In addition, we found that the increased availability of PEM providers per patient visit correlated with fewer ED RVs.
Hospitals serving ED populations with more government-insured and fewer commercially insured patients had higher rates of return to the ED. Similarly, hospitals with larger proportions of patients from areas with lower median household incomes had higher RV rates. These factors may indicate that patients with limited resources may have more frequent ED RVs,3,6,32,33 and hospitals that serve them have higher ED RV rates. Our findings complement those of a recent study by Sills et al.,11 who evaluated hospital readmissions and proposed risk adjustment for performance reimbursement. This study found that hospital population-level race, ethnicity, insurance status, and household income were predictors of hospital readmission after discharge.
Of note, our data did not identify similar site-level attributes related to the population served that correlated with RVA rates. We postulate that the need for admission on RV may indicate an inherent clinical urgency or medical need associated with the return to the ED, whereas RV without admission may be related more to patient- or population-level sociodemographic factors than to quality of care and clinical course, which influence ED utilization.1,3,30 EDs treating higher proportions of patients of minority race or ethnicity, those with fewer financial resources, and those in more need of government health insurance are at higher risk for ED revisits.
We observed that increased PEM fellowship-trained physician staffing was associated with decreased RV rates. The availability of specialty-trained physicians in PEM may allow a larger proportion of patients treated by physicians with honed clinical skills for the patient population. Data from a single pediatric center showed PEM fellowship-trained physicians had admission rates lower than those of their counterparts without subspecialty fellowship training.34 The lower RV rate for this group in our study is especially interesting in light of previously reported lower admission rates at index visit in PEM trained physicians. With lower index admission rates, it may have been assumed that visits associated with PEM trained physician care would have an increased (rather than decreased) chance of RV. In addition, we noted the increased RVA rates were associated with longer waits to see a physician. These measures may indicate the effect of institutional access to robust resources (the ability to hire and support more specialty-trained physicians). These novel findings warrant further evaluation, particularly as our sample included only pediatric centers.
Our survey data demonstrated the impact that access to care has on ED RV rates. The ED medical directors indicated that limited access to outpatient appointments with PCPs and specialists was an important factor increasing ED RVs and a potential avenue for interventions. As the 2 open-ended questions addressed barriers and potential solutions, it is interesting that the respondents cited access to care and discharge instructions as the largest barriers and identified innovations in access to care and discharge education as important potential remedies.
This study demonstrated that, at the hospital level, ED RV quality measures are influenced by complex and varied SDHs that primarily reflect the characteristics of the patient populations served. Prior work has similarly highlighted the importance of gaining a rigorous understanding of other quality measures before widespread use, reporting, and dissemination of results.11,35-38 With this in mind, as quality measures are developed and implemented, care should be taken to ensure they accurately and appropriately reflect the quality of care provided to the patient and are not more representative of other factors not directly within institutional control. These findings call into question the usefulness of ED RVs as a quality measure for comparing institutions.
Study Limitations
This study had several limitations. The PHIS dataset tracks only patients within each institution and does not include RVs to other EDs, which may account for a proportion of RVs.39 Our survey response rate was 68% among medical directors, excluding 11 hospitals from analysis, which decreased the study’s power to detect differences that may be present between groups. In addition, the generalizability of our findings may be limited to tertiary-care children’s hospitals, as the PHIS dataset included only these types of healthcare facilities. We also included data only from the sites’ main EDs, and therefore cannot know if our results are applicable to satellite EDs. ED staffing of PEM physicians was analyzed using FTEs. However, number of clinical hours in 1 FTE may vary among sites, leading to imprecision in this hospital characteristic.
CONCLUSION
Hospitals with the highest RV rates served populations with a larger proportion of patients with government insurance and lower household income, and these hospitals had fewer PEM trained physicians. Variation in RV rates among hospitals may be indicative of the SDHs of their unique patient populations. ED revisit rates should be used cautiously in determining the quality of care of hospitals providing care to differing populations.
Disclosure
Nothing to report.
1. Goldman RD, Kapoor A, Mehta S. Children admitted to the hospital after returning to the emergency department within 72 hours. Pediatr Emerg Care. 2011;27(9):808-811. PubMed
2. Cho CS, Shapiro DJ, Cabana MD, Maselli JH, Hersh AL. A national depiction of children with return visits to the emergency department within 72 hours, 2001–2007. Pediatr Emerg Care. 2012;28(7):606-610. PubMed
3. Akenroye AT, Thurm CW, Neuman MI, et al. Prevalence and predictors of return visits to pediatric emergency departments. J Hosp Med. 2014;9(12):779-787. PubMed
4. Gallagher RA, Porter S, Monuteaux MC, Stack AM. Unscheduled return visits to the emergency department: the impact of language. Pediatr Emerg Care. 2013;29(5):579-583. PubMed
5. Sørup CM, Jacobsen P, Forberg JL. Evaluation of emergency department performance—a systematic review on recommended performance and quality-in-care measures. Scand J Trauma Resusc Emerg Med. 2013;21:62. PubMed
6. Gabayan GZ, Asch SM, Hsia RY, et al. Factors associated with short-term bounce-back admissions after emergency department discharge. Ann Emerg Med. 2013;62(2):136-144.e1. PubMed
7. Ali AB, Place R, Howell J, Malubay SM. Early pediatric emergency department return visits: a prospective patient-centric assessment. Clin Pediatr (Phila). 2012;51(7):651-658. PubMed
8. Alessandrini EA, Lavelle JM, Grenfell SM, Jacobstein CR, Shaw KN. Return visits to a pediatric emergency department. Pediatr Emerg Care. 2004;20(3):166-171. PubMed
9. Goldman RD, Ong M, Macpherson A. Unscheduled return visits to the pediatric emergency department—one-year experience. Pediatr Emerg Care. 2006;22(8):545-549. PubMed
10. Berry JG, Toomey SL, Zaslavsky AM, et al. Pediatric readmission prevalence and variability across hospitals. JAMA. 2013;309(4):372-380. PubMed
11. Sills MR, Hall M, Colvin JD, et al. Association of social determinants with children’s hospitals’ preventable readmissions performance. JAMA Pediatr. 2016;170(4):350-358. PubMed
12. Fiscella K, Burstin HR, Nerenz DR. Quality measures and sociodemographic risk factors: to adjust or not to adjust. JAMA. 2014;312(24):2615-2616. PubMed
13. Lipstein SH, Dunagan WC. The risks of not adjusting performance measures for sociodemographic factors. Ann Intern Med. 2014;161(8):594-596. PubMed
14. Berry JG, Hall DE, Kuo DZ, et al. Hospital utilization and characteristics of patients experiencing recurrent readmissions within children’s hospitals. JAMA. 2011;305(7):682-690. PubMed
15. Bourgeois FT, Monuteaux MC, Stack AM, Neuman MI. Variation in emergency department admission rates in US children’s hospitals. Pediatrics. 2014;134(3):539-545. PubMed
16. Fletcher DM. Achieving data quality. How data from a pediatric health information system earns the trust of its users. J AHIMA. 2004;75(10):22-26. PubMed
17. US Census Bureau. US Census current estimates data. 2014. https://www.census.gov/programs-surveys/popest/data/data-sets.2014.html. Accessed June 2015.
18. Alessandrini EA, Alpern ER, Chamberlain JM, Shea JA, Gorelick MH. A new diagnosis grouping system for child emergency department visits. Acad Emerg Med. 2010;17(2):204-213. PubMed
19. Feudtner C, Levin JE, Srivastava R, et al. How well can hospital readmission be predicted in a cohort of hospitalized children? A retrospective, multicenter study. Pediatrics. 2009;123(1):286-293. PubMed
20. Feinstein JA, Feudtner C, Kempe A. Adverse drug event–related emergency department visits associated with complex chronic conditions. Pediatrics. 2014;133(6):e1575-e1585. PubMed
21. Simon TD, Berry J, Feudtner C, et al. Children with complex chronic conditions in inpatient hospital settings in the United States. Pediatrics. 2010;126(4):647-655. PubMed
22. Dartmouth Medical School, Center for Evaluative Clinical Sciences. The Dartmouth Atlas of Health Care. Chicago, IL: American Hospital Publishing; 2015.
23. Kansagara D, Englander H, Salanitro A, et al. Risk prediction models for hospital readmission: a systematic review. JAMA. 2011;306(15):1688-1698. PubMed
24. Lawrence LM, Jenkins CA, Zhou C, Givens TG. The effect of diagnosis-specific computerized discharge instructions on 72-hour return visits to the pediatric emergency department. Pediatr Emerg Care. 2009;25(11):733-738. PubMed
25. National Quality Forum. National Quality Forum issue brief: strengthening pediatric quality measurement and reporting. J Healthc Qual. 2008;30(3):51-55. PubMed
26. Rising KL, Victor TW, Hollander JE, Carr BG. Patient returns to the emergency department: the time-to-return curve. Acad Emerg Med. 2014;21(8):864-871. PubMed
27. Cho CS, Shapiro DJ, Cabana MD, Maselli JH, Hersh AL. A national depiction of children with return visits to the emergency department within 72 hours, 2001–2007. Pediatr Emerg Care. 2012;28(7):606-610. PubMed
28. Adekoya N. Patients seen in emergency departments who had a prior visit within the previous 72 h—National Hospital Ambulatory Medical Care Survey, 2002. Public Health. 2005;119(10):914-918. PubMed
29. Mittal MK, Zorc JJ, Garcia-Espana JF, Shaw KN. An assessment of clinical performance measures for pediatric emergency physicians. Am J Med Qual. 2013;28(1):33-39. PubMed
30. Depiero AD, Ochsenschlager DW, Chamberlain JM. Analysis of pediatric hospitalizations after emergency department release as a quality improvement tool. Ann Emerg Med. 2002;39(2):159-163. PubMed
31. Sung SF, Liu KE, Chen SC, Lo CL, Lin KC, Hu YH. Predicting factors and risk stratification for return visits to the emergency department within 72 hours in pediatric patients. Pediatr Emerg Care. 2015;31(12):819-824. PubMed
32. Jacobstein CR, Alessandrini EA, Lavelle JM, Shaw KN. Unscheduled revisits to a pediatric emergency department: risk factors for children with fever or infection-related complaints. Pediatr Emerg Care. 2005;21(12):816-821. PubMed
33. Barnett ML, Hsu J, McWilliams J. Patient characteristics and differences in hospital readmission rates. JAMA Intern Med. 2015;175(11):1803-1812. PubMed
34. Gaucher N, Bailey B, Gravel J. Impact of physicians’ characteristics on the admission risk among children visiting a pediatric emergency department. Pediatr Emerg Care. 2012;28(2):120-124. PubMed
35. McHugh M, Neimeyer J, Powell E, Khare RK, Adams JG. An early look at performance on the emergency care measures included in Medicare’s hospital inpatient Value-Based Purchasing Program. Ann Emerg Med. 2013;61(6):616-623.e2. PubMed
36. Axon RN, Williams MV. Hospital readmission as an accountability measure. JAMA. 2011;305(5):504-505. PubMed
37. Adams JG. Ensuring the quality of quality metrics for emergency care. JAMA. 2016;315(7):659-660. PubMed
38. Payne NR, Flood A. Preventing pediatric readmissions: which ones and how? J Pediatr. 2015;166(3):519-520. PubMed
39. Khan A, Nakamura MM, Zaslavsky AM, et al. Same-hospital readmission rates as a measure of pediatric quality of care. JAMA Pediatr. 2015;169(10):905-912. PubMed
Return visit (RV) rate is a quality measure commonly used in the emergency department (ED) setting. This metric may represent suboptimal care at the index ED visit.1-5 Although patient- and visit-level factors affecting ED RVs have been evaluated,1,3,4,6-9 hospital-level factors and factors of a hospital’s patient population that may play roles in ED RV rates have not been examined. Identifying the factors associated with increased RVs may allow resources to be designated to areas that improve emergent care for children.10
Hospital readmission rates are a closely followed quality measure and are linked to reimbursement by the federal government, but a recent study found the influence a hospital can have on this marker may be mitigated by the impact of the social determinates of health (SDHs) of the hospital’s patient population.11 That study and others have prompted an ongoing debate about adjusting quality measures for SDHs.12,13 A clearer understanding of these interactions may permit us to focus on factors that can truly lead to improvement in care instead of penalizing practitioners or hospitals that provide care to those most in need.
Prior work has identified several SDHs associated with higher ED RV rates in patient- or visit-level analyses.3,11,14 We conducted a study of hospital-level characteristics and characteristics of a hospital’s patient population to identify potentially mutable factors associated with increased ED RV rates that, once recognized, may allow for improvement in this quality measure.
PATIENTS AND METHODS
This study was not considered human subjects research in accordance with Common Rule 45 CFR§46.104(f) and was evaluated by the Ann and Robert H. Lurie Children’s Hospital and Northwestern University Feinberg School of Medicine Institutional Review Boards and deemed exempt from review.
Study Population and Protocol
Our study had 2 data sources (to be described in detail): the Pediatric Health Information System (PHIS) and a survey of ED medical directors of the hospitals represented within PHIS. Hospitals were eligible for inclusion in the study if their data (1) met PHIS quality control standards for ED patient visits as determined by internal data assurance processes incorporated in PHIS,3,14,15 (2) included data only from an identifiable single main ED, and (3) completed the ED medical director’s survey.
PHIS Database
PHIS, an administrative database managed by Truven Health Analytics, includes data from ED, ambulatory surgery, observation, and inpatient encounters across Children’s Hospital Association member children’s hospitals in North America. Data are subjected to validity checks before being included in the database.16 PHIS assigns unique patient identifiers to track individual patient visits within participating institutions over time.
Hospitals were described by percentages of ED patients in several groups: age (<1, 1-4, 5-9, 10-14, and 15-18 years)17; sex; race/ethnicity; insurance type (commercial, government, other); ED International Classification of Diseases, Ninth Edition (ICD-9) diagnosis code–based severity classification system score (1-2, low severity; 3-5, high severity)18; complex
ED Medical Director Survey
A web-based survey was constructed in an iterative process based on literature review and expert opinion to assess hospital-level factors that may impact ED RV rates.3,7,24-26 The survey was piloted at 3 institutions to refine its structure and content.
The survey included 15 close-ended or multiple-choice questions on ED environment and operations and 2 open-ended questions, “What is the largest barrier to reducing the number of return visits within 72 hours of discharge from a previous ED visit?” and “In your opinion, what is the best way of reducing the number of the return visits within 72 hours of previous ED visit ?” (questionnaire in Supplemental material). Hospital characteristics from the survey included total clinical time allotment, or full-time equivalent (FTE), among all physicians, pediatric emergency medicine (PEM) fellowship-trained physicians, and all other (non-PEM) physicians. The data were standardized across sites by calculating FTE-per-10,000-visits values for each hospital; median duration of ED visit for admitted and discharged patients; median time from arrival to ED physician evaluation; rate of leaving without being seen; discharge educational material authorship and age specificity; follow-up visit scheduling procedure; and percentage of ED patients for whom English was a second language.
Responses to the 2 open-ended questions were independently categorized by Drs. Pittsenbarger and Alpern. Responses could be placed in more than 1 category if multiple answers to the question were included in the response. Categorizations were compared for consistency, and any inconsistencies were resolved by the consensus of the study investigators.
Outcome Measures From PHIS Database
All ED visits within a 12-month period (July 1, 2013–June 30, 2014) by patients younger than 18 years at time of index ED visit were eligible for inclusion in the study. An index visit was defined as any ED visit without another ED visit within the preceding 72 hours. The 72-hour time frame was used because it is the most widely studied time frame for ED RVs.5 Index ED visits that led to admission, observation status, death, or transfer were excluded.
The 2 primary outcomes of interest were (1) RVs within 72 hours of index ED visit discharge and (2) RVs within 72 hours that resulted in hospital admission or observation status at the next ED visit (RVA).7,9,27-30 For patients with multiple ED revisits within 72 hours, only the first was assessed. There was a 72-hour minimum between index visits for the same patient.
Statistical Analyses
To determine hospital groups based on RV and RVA rates, we adjusted RV and RVA rates using generalized linear mixed-effects models, controlling for clustering and allowing for correlated data (within hospitals), nonconstant variability (across hospitals), and non-normally distributed data, as we did in a study of patient-level factors associated with ED RV and RVA.3 For each calculated rate (RV, RVA), the hospitals were then classified into 3 groups based on whether the hospital’s adjusted RV and RVA rates were outside 2 SDs from the mean, below the 5th or above the 95th percentile, or within that range. These groups were labeled lowest outliers, highest outliers, and average-performing hospitals.
After the groups of hospitals were determined, we returned to using unadjusted data to statistically analyze them. We summarized continuous variables using minimum and maximum values, medians, and interquartile ranges (IQRs). We present categorical variables using counts and percentages. To identify hospital characteristics with the most potential to gain from improvement, we also analyzed associations using 2 collapsed groups: hospitals with RV (or RVA) rates included in the average-performing and lowest outlier groups and hospitals within the highest outlier group. Hospital characteristics and hospital’s patient population characteristics from the surveys are summarized based on RV and RVA rate groups. Differences in distributions among continuous variables were assessed by Kruskal-Wallis 1-way analysis of variance. Chi-square tests were used to evaluate differences in proportions among categorical variables. All statistical analyses were performed with SAS Version 9.4 (SAS Institute); 2-sided P < 0.05 was considered statistically significant.
RESULTS
Return Visit Rates and Hospital ED Site Population Characteristics
Twenty-four of 35 (68%) eligible hospitals that met PHIS quality control standards for ED patient visits responded to the ED medical director survey. The included hospitals that both met quality control standards and completed the survey had a total of 1,456,377 patient visits during the study period. Individual sites had annual volumes ranging from 26,627 to 96,637 ED encounters. The mean RV rate across the institutions was 3.7% (range, 3.0%-4.8%), and the mean RVA rate across the hospitals was 0.7% (range, 0.5%-1.1%) (Figure).
There were 5 hospitals with RV rates less than 2 SDs of the mean rate, placing them in the lowest outlier group for RV; 13 hospitals with RV rates within 2 SDs of the mean RV rate, placing them in the average-performing group; and 6 hospitals with RV rates above 2 SDs of the mean, placing them in the highest outlier group. Table 1 lists the hospital ED site population characteristics among the 3 RV rate groups. Hospitals in the highest outlier group served populations with higher proportions of patients with insurance from a government payer, lower proportions of patients covered by a commercial insurance plan, and higher proportion of patients with lower median household incomes.
In the RVA analysis, there were 6 hospitals with RVA rates less than 2 SDs of the mean RVA rate (lowest outliers); 14 hospitals with RVA rates within 2 SDs of the mean RVA rate (average performers); and 4 hospitals with RVA rates above 2 SDs of the mean RVA rate (highest outliers). When using these groups based on RVA rate, there were no statistically significant differences in hospital ED site population characteristics (Supplemental Table 1).
RV Rates and Hospital-Level Factors Survey Characteristics
Table 2 lists the ED medical director survey hospital-level data among the 3 RV rate groups. There were fewer FTEs by PEM fellowship-trained physicians per 10,000 patient visits at sites with higher RV rates (Table 2). Hospital-level characteristics assessed by the survey were not associated with RVA rates (Supplemental Table 2).
Evaluating characteristics of hospitals with the most potential to gain from improvement, hospitals with the highest RV rates (highest outlier group), compared with hospitals in the lowest outlier and average-performing groups collapsed together, persisted in having fewer PEM fellowship-trained physician FTEs per patient visit (Table 3). A similar collapsed analysis of RVA rates demonstrated that hospitals in the highest outlier group had longer-wait-to-physician time (81 minutes; IQR, 51-105 minutes) compared with hospitals in the other 2 groups (30 minutes; IQR, 19-42.5 minutes) (Table 3).
In response to the first qualitative question on the ED medial director survey, “In your opinion, what is the largest barrier to reducing the number of return visits within 72 hours of discharge from a previous ED visit?”, 15 directors (62.5%) reported limited access to primary care, 4 (16.6%) reported inadequate discharge instructions and/or education provided, and 3 (12.5%) reported lack of access to specialist care. To the second question, “In your opinion, what is the best way of reducing the number of the return visits within 72 hours of previous ED visit for the same condition?”, they responded that RVs could be reduced by innovations in scheduling primary care or specialty follow-up visits (19, 79%), improving discharge education and instructions (6, 25%), and identifying more case management or care coordination (4, 16.6%).
DISCUSSION
Other studies have identified patient- and visit-level characteristics associated with higher ED RV and RVA rates.3,8,9,31 However, as our goal was to identify possible modifiable institutional features, our study examined factors at hospital and population-served levels (instead of patient or visit level) that may impact ED RV and RVA rates. Interestingly, our sample of tertiary-care pediatric center EDs provided evidence of variability in RV and RVA rates. We identified factors associated with RV rates related to the SDHs of the populations served by the ED, which suggests these factors are not modifiable at an institution level. In addition, we found that the increased availability of PEM providers per patient visit correlated with fewer ED RVs.
Hospitals serving ED populations with more government-insured and fewer commercially insured patients had higher rates of return to the ED. Similarly, hospitals with larger proportions of patients from areas with lower median household incomes had higher RV rates. These factors may indicate that patients with limited resources may have more frequent ED RVs,3,6,32,33 and hospitals that serve them have higher ED RV rates. Our findings complement those of a recent study by Sills et al.,11 who evaluated hospital readmissions and proposed risk adjustment for performance reimbursement. This study found that hospital population-level race, ethnicity, insurance status, and household income were predictors of hospital readmission after discharge.
Of note, our data did not identify similar site-level attributes related to the population served that correlated with RVA rates. We postulate that the need for admission on RV may indicate an inherent clinical urgency or medical need associated with the return to the ED, whereas RV without admission may be related more to patient- or population-level sociodemographic factors than to quality of care and clinical course, which influence ED utilization.1,3,30 EDs treating higher proportions of patients of minority race or ethnicity, those with fewer financial resources, and those in more need of government health insurance are at higher risk for ED revisits.
We observed that increased PEM fellowship-trained physician staffing was associated with decreased RV rates. The availability of specialty-trained physicians in PEM may allow a larger proportion of patients treated by physicians with honed clinical skills for the patient population. Data from a single pediatric center showed PEM fellowship-trained physicians had admission rates lower than those of their counterparts without subspecialty fellowship training.34 The lower RV rate for this group in our study is especially interesting in light of previously reported lower admission rates at index visit in PEM trained physicians. With lower index admission rates, it may have been assumed that visits associated with PEM trained physician care would have an increased (rather than decreased) chance of RV. In addition, we noted the increased RVA rates were associated with longer waits to see a physician. These measures may indicate the effect of institutional access to robust resources (the ability to hire and support more specialty-trained physicians). These novel findings warrant further evaluation, particularly as our sample included only pediatric centers.
Our survey data demonstrated the impact that access to care has on ED RV rates. The ED medical directors indicated that limited access to outpatient appointments with PCPs and specialists was an important factor increasing ED RVs and a potential avenue for interventions. As the 2 open-ended questions addressed barriers and potential solutions, it is interesting that the respondents cited access to care and discharge instructions as the largest barriers and identified innovations in access to care and discharge education as important potential remedies.
This study demonstrated that, at the hospital level, ED RV quality measures are influenced by complex and varied SDHs that primarily reflect the characteristics of the patient populations served. Prior work has similarly highlighted the importance of gaining a rigorous understanding of other quality measures before widespread use, reporting, and dissemination of results.11,35-38 With this in mind, as quality measures are developed and implemented, care should be taken to ensure they accurately and appropriately reflect the quality of care provided to the patient and are not more representative of other factors not directly within institutional control. These findings call into question the usefulness of ED RVs as a quality measure for comparing institutions.
Study Limitations
This study had several limitations. The PHIS dataset tracks only patients within each institution and does not include RVs to other EDs, which may account for a proportion of RVs.39 Our survey response rate was 68% among medical directors, excluding 11 hospitals from analysis, which decreased the study’s power to detect differences that may be present between groups. In addition, the generalizability of our findings may be limited to tertiary-care children’s hospitals, as the PHIS dataset included only these types of healthcare facilities. We also included data only from the sites’ main EDs, and therefore cannot know if our results are applicable to satellite EDs. ED staffing of PEM physicians was analyzed using FTEs. However, number of clinical hours in 1 FTE may vary among sites, leading to imprecision in this hospital characteristic.
CONCLUSION
Hospitals with the highest RV rates served populations with a larger proportion of patients with government insurance and lower household income, and these hospitals had fewer PEM trained physicians. Variation in RV rates among hospitals may be indicative of the SDHs of their unique patient populations. ED revisit rates should be used cautiously in determining the quality of care of hospitals providing care to differing populations.
Disclosure
Nothing to report.
1. Goldman RD, Kapoor A, Mehta S. Children admitted to the hospital after returning to the emergency department within 72 hours. Pediatr Emerg Care. 2011;27(9):808-811. PubMed
2. Cho CS, Shapiro DJ, Cabana MD, Maselli JH, Hersh AL. A national depiction of children with return visits to the emergency department within 72 hours, 2001–2007. Pediatr Emerg Care. 2012;28(7):606-610. PubMed
3. Akenroye AT, Thurm CW, Neuman MI, et al. Prevalence and predictors of return visits to pediatric emergency departments. J Hosp Med. 2014;9(12):779-787. PubMed
4. Gallagher RA, Porter S, Monuteaux MC, Stack AM. Unscheduled return visits to the emergency department: the impact of language. Pediatr Emerg Care. 2013;29(5):579-583. PubMed
5. Sørup CM, Jacobsen P, Forberg JL. Evaluation of emergency department performance—a systematic review on recommended performance and quality-in-care measures. Scand J Trauma Resusc Emerg Med. 2013;21:62. PubMed
6. Gabayan GZ, Asch SM, Hsia RY, et al. Factors associated with short-term bounce-back admissions after emergency department discharge. Ann Emerg Med. 2013;62(2):136-144.e1. PubMed
7. Ali AB, Place R, Howell J, Malubay SM. Early pediatric emergency department return visits: a prospective patient-centric assessment. Clin Pediatr (Phila). 2012;51(7):651-658. PubMed
8. Alessandrini EA, Lavelle JM, Grenfell SM, Jacobstein CR, Shaw KN. Return visits to a pediatric emergency department. Pediatr Emerg Care. 2004;20(3):166-171. PubMed
9. Goldman RD, Ong M, Macpherson A. Unscheduled return visits to the pediatric emergency department—one-year experience. Pediatr Emerg Care. 2006;22(8):545-549. PubMed
10. Berry JG, Toomey SL, Zaslavsky AM, et al. Pediatric readmission prevalence and variability across hospitals. JAMA. 2013;309(4):372-380. PubMed
11. Sills MR, Hall M, Colvin JD, et al. Association of social determinants with children’s hospitals’ preventable readmissions performance. JAMA Pediatr. 2016;170(4):350-358. PubMed
12. Fiscella K, Burstin HR, Nerenz DR. Quality measures and sociodemographic risk factors: to adjust or not to adjust. JAMA. 2014;312(24):2615-2616. PubMed
13. Lipstein SH, Dunagan WC. The risks of not adjusting performance measures for sociodemographic factors. Ann Intern Med. 2014;161(8):594-596. PubMed
14. Berry JG, Hall DE, Kuo DZ, et al. Hospital utilization and characteristics of patients experiencing recurrent readmissions within children’s hospitals. JAMA. 2011;305(7):682-690. PubMed
15. Bourgeois FT, Monuteaux MC, Stack AM, Neuman MI. Variation in emergency department admission rates in US children’s hospitals. Pediatrics. 2014;134(3):539-545. PubMed
16. Fletcher DM. Achieving data quality. How data from a pediatric health information system earns the trust of its users. J AHIMA. 2004;75(10):22-26. PubMed
17. US Census Bureau. US Census current estimates data. 2014. https://www.census.gov/programs-surveys/popest/data/data-sets.2014.html. Accessed June 2015.
18. Alessandrini EA, Alpern ER, Chamberlain JM, Shea JA, Gorelick MH. A new diagnosis grouping system for child emergency department visits. Acad Emerg Med. 2010;17(2):204-213. PubMed
19. Feudtner C, Levin JE, Srivastava R, et al. How well can hospital readmission be predicted in a cohort of hospitalized children? A retrospective, multicenter study. Pediatrics. 2009;123(1):286-293. PubMed
20. Feinstein JA, Feudtner C, Kempe A. Adverse drug event–related emergency department visits associated with complex chronic conditions. Pediatrics. 2014;133(6):e1575-e1585. PubMed
21. Simon TD, Berry J, Feudtner C, et al. Children with complex chronic conditions in inpatient hospital settings in the United States. Pediatrics. 2010;126(4):647-655. PubMed
22. Dartmouth Medical School, Center for Evaluative Clinical Sciences. The Dartmouth Atlas of Health Care. Chicago, IL: American Hospital Publishing; 2015.
23. Kansagara D, Englander H, Salanitro A, et al. Risk prediction models for hospital readmission: a systematic review. JAMA. 2011;306(15):1688-1698. PubMed
24. Lawrence LM, Jenkins CA, Zhou C, Givens TG. The effect of diagnosis-specific computerized discharge instructions on 72-hour return visits to the pediatric emergency department. Pediatr Emerg Care. 2009;25(11):733-738. PubMed
25. National Quality Forum. National Quality Forum issue brief: strengthening pediatric quality measurement and reporting. J Healthc Qual. 2008;30(3):51-55. PubMed
26. Rising KL, Victor TW, Hollander JE, Carr BG. Patient returns to the emergency department: the time-to-return curve. Acad Emerg Med. 2014;21(8):864-871. PubMed
27. Cho CS, Shapiro DJ, Cabana MD, Maselli JH, Hersh AL. A national depiction of children with return visits to the emergency department within 72 hours, 2001–2007. Pediatr Emerg Care. 2012;28(7):606-610. PubMed
28. Adekoya N. Patients seen in emergency departments who had a prior visit within the previous 72 h—National Hospital Ambulatory Medical Care Survey, 2002. Public Health. 2005;119(10):914-918. PubMed
29. Mittal MK, Zorc JJ, Garcia-Espana JF, Shaw KN. An assessment of clinical performance measures for pediatric emergency physicians. Am J Med Qual. 2013;28(1):33-39. PubMed
30. Depiero AD, Ochsenschlager DW, Chamberlain JM. Analysis of pediatric hospitalizations after emergency department release as a quality improvement tool. Ann Emerg Med. 2002;39(2):159-163. PubMed
31. Sung SF, Liu KE, Chen SC, Lo CL, Lin KC, Hu YH. Predicting factors and risk stratification for return visits to the emergency department within 72 hours in pediatric patients. Pediatr Emerg Care. 2015;31(12):819-824. PubMed
32. Jacobstein CR, Alessandrini EA, Lavelle JM, Shaw KN. Unscheduled revisits to a pediatric emergency department: risk factors for children with fever or infection-related complaints. Pediatr Emerg Care. 2005;21(12):816-821. PubMed
33. Barnett ML, Hsu J, McWilliams J. Patient characteristics and differences in hospital readmission rates. JAMA Intern Med. 2015;175(11):1803-1812. PubMed
34. Gaucher N, Bailey B, Gravel J. Impact of physicians’ characteristics on the admission risk among children visiting a pediatric emergency department. Pediatr Emerg Care. 2012;28(2):120-124. PubMed
35. McHugh M, Neimeyer J, Powell E, Khare RK, Adams JG. An early look at performance on the emergency care measures included in Medicare’s hospital inpatient Value-Based Purchasing Program. Ann Emerg Med. 2013;61(6):616-623.e2. PubMed
36. Axon RN, Williams MV. Hospital readmission as an accountability measure. JAMA. 2011;305(5):504-505. PubMed
37. Adams JG. Ensuring the quality of quality metrics for emergency care. JAMA. 2016;315(7):659-660. PubMed
38. Payne NR, Flood A. Preventing pediatric readmissions: which ones and how? J Pediatr. 2015;166(3):519-520. PubMed
39. Khan A, Nakamura MM, Zaslavsky AM, et al. Same-hospital readmission rates as a measure of pediatric quality of care. JAMA Pediatr. 2015;169(10):905-912. PubMed
© 2017 Society of Hospital Medicine
Impact of Pneumonia Guidelines
Overutilization of resources is a significant, yet underappreciated, problem in medicine. Many interventions target underutilization (eg, immunizations) or misuse (eg, antibiotic prescribing for viral pharyngitis), yet overutilization remains as a significant contributor to healthcare waste.[1] In an effort to reduce waste, the Choosing Wisely campaign created a work group to highlight areas of overutilization, specifically noting both diagnostic tests and therapies for common pediatric conditions with no proven benefit and possible harm to the patient.[2] Respiratory illnesses have been a target of many quality‐improvement efforts, and pneumonia represents a common diagnosis in pediatrics.[3] The use of diagnostic testing for pneumonia is an area where care can be optimized and aligned with evidence.
Laboratory testing and diagnostic imaging are routinely used for the management of children with community‐acquired pneumonia (CAP). Several studies have documented substantial variability in the use of these resources for pneumonia management, with higher resource use associated with a higher chance of hospitalization after emergency department (ED) evaluation and a longer length of stay among those requiring hospitalization.[4, 5] This variation in diagnostic resource utilization has been attributed, at least in part, to a lack of consensus on the management of pneumonia. There is wide variability in diagnostic testing, and due to potential consequences for patients presenting with pneumonia, efforts to standardize care offer an opportunity to improve healthcare value.
In August 2011, the first national, evidence‐based consensus guidelines for the management of childhood CAP were published jointly by the Pediatric Infectious Diseases Society (PIDS) and the Infectious Diseases Society of America (IDSA).[6] A primary focus of these guidelines was the recommendation for the use of narrow spectrum antibiotics for the management of uncomplicated pneumonia. Previous studies have assessed the impact of the publication of the PIDS/IDSA guidelines on empiric antibiotic selection for the management of pneumonia.[7, 8] In addition, the guidelines provided recommendations regarding diagnostic test utilization, in particular discouraging blood tests (eg, complete blood counts) and radiologic studies for nontoxic, fully immunized children treated as outpatients, as well as repeat testing for children hospitalized with CAP who are improving.
Although single centers have demonstrated changes in utilization patterns based on clinical practice guidelines,[9, 10, 11, 12] whether these guidelines have impacted diagnostic test utilization among US children with CAP in a larger scale remains unknown. Therefore, we sought to determine the impact of the PIDS/IDSA guidelines on the use of diagnostic testing among children with CAP using a national sample of US children's hospitals. Because the guidelines discourage repeat diagnostic testing in patients who are improving, we also evaluated the association between repeat diagnostic studies and severity of illness.
METHODS
This retrospective cohort study used data from the Pediatric Health Information System (PHIS) (Children's Hospital Association, Overland Park, KS). The PHIS database contains deidentified administrative data, detailing demographic, diagnostic, procedure, and billing data from 47 freestanding, tertiary care children's hospitals. This database accounts for approximately 20% of all annual pediatric hospitalizations in the United States. Data quality is ensured through a joint effort between the Children's Hospital Association and participating hospitals.
Patient Population
Data from 32 (of the 47) hospitals included in PHIS with complete inpatient and ED data were used to evaluate hospital‐level resource utilization for children 1 to 18 years of age discharged January 1, 2008 to June 30, 2014 with a diagnosis of pneumonia (International Classification of Diseases, 9th Revision [ICD‐9] codes 480.x‐486.x, 487.0).[13] Our goal was to identify previously healthy children with uncomplicated pneumonia, so we excluded patients with complex chronic conditions,[14] billing charges for intensive care management and/or pleural drainage procedure (IDC‐9 codes 510.0, 510.9, 511.0, 511.1, 511.8, 511.9, 513.x) on day of admission or the next day, or prior pneumonia admission in the last 30 days. We studied 2 mutually exclusive populations: children with pneumonia treated in the ED (ie, patients who were evaluated in the ED and discharged to home), and children hospitalized with pneumonia, including those admitted through the ED.
Guideline Publication and Study Periods
For an exploratory before and after comparison, patients were grouped into 2 cohorts based on a guideline online publication date of August 1, 2011: preguideline (January 1, 2008 to July 31, 2011) and postguideline (August 1, 2011 to June 30, 2014).
Study Outcomes
The measured outcomes were the monthly proportion of pneumonia patients for whom specific diagnostic tests were performed, as determined from billing data. The diagnostic tests evaluated were complete blood count (CBC), blood culture, C‐reactive protein (CRP), and chest radiograph (CXR). Standardized costs were also calculated from PHIS charges as previously described to standardize the cost of the individual tests and remove interhospital cost variation.[3]
Relationship of Repeat Testing and Severity of Illness
Because higher illness severity and clinical deterioration may warrant repeat testing, we also explored the association of repeat diagnostic testing for inpatients with severity of illness by using the following variables as measures of severity: length of stay (LOS), transfer to intensive care unit (ICU), or pleural drainage procedure after admission (>2 calendar days after admission). Repeat diagnostic testing was stratified by number of tests.
Statistical Analysis
The categorical demographic characteristics of the pre‐ and postguideline populations were summarized using frequencies and percentages, and compared using 2 tests. Continuous demographics were summarized with medians and interquartile ranges (IQRs) and compared with the Wilcoxon rank sum test. Segmented regression, clustered by hospital, was used to assess trends in monthly resource utilization as well as associated standardized costs before and after guidelines publication. To estimate the impact of the guidelines overall, we compared the observed diagnostic resource use at the end of the study period with expected use projected from trends in the preguidelines period (ie, if there were no new guidelines). Individual interrupted time series were also built for each hospital. From these models, we assessed which hospitals had a significant difference between the rate observed at the end of the study and that estimated from their preguideline trajectory. To assess the relationship between the number of positive improvements at a hospital and hospital characteristics, we used Spearman's correlation and Kruskal‐Wallis tests. All analyses were performed with SAS version 9.3 (SAS Institute, Inc., Cary, NC), and P values <0.05 were considered statistically significant. In accordance with the policies of the Cincinnati Children's Hospital Medical Center Institutional Review Board, this research, using a deidentified dataset, was not considered human subjects research.
RESULTS
There were 275,288 hospital admissions meeting study inclusion criteria of 1 to 18 years of age with a diagnosis of pneumonia from 2008 to 2014. Of these, 54,749 met exclusion criteria (1874 had pleural drainage procedure on day 0 or 1, 51,306 had complex chronic conditions, 1569 were hospitalized with pneumonia in the last 30 days). Characteristics of the remaining 220,539 patients in the final sample are shown in Table 1. The median age was 4 years (IQR, 27 years); a majority of the children were male (53%) and had public insurance (58%). There were 128,855 patients in the preguideline period (January 1, 2008 to July 31, 2011) and 91,684 in the post guideline period (August 1, 2011June 30, 2014).
| Overall | Preguideline | Postguideline | P | |
|---|---|---|---|---|
| ||||
| No. of discharges | 220,539 | 128,855 | 91,684 | |
| Type of encounter | ||||
| ED only | 150,215 (68.1) | 88,790 (68.9) | 61,425 (67) | <0.001 |
| Inpatient | 70,324 (31.9) | 40,065 (31.1) | 30,259 (33) | |
| Age | ||||
| 14 years | 129,360 (58.7) | 77,802 (60.4) | 51,558 (56.2) | <0.001 |
| 59 years | 58,609 (26.6) | 32,708 (25.4) | 25,901 (28.3) | |
| 1018 years | 32,570 (14.8) | 18,345 (14.2) | 14,225 (15.5) | |
| Median [IQR] | 4 [27] | 3 [27] | 4 [27] | <0.001 |
| Gender | ||||
| Male | 116,718 (52.9) | 68,319 (53) | 48,399 (52.8) | 00.285 |
| Female | 103,813 (47.1) | 60,532 (47) | 43,281 (47.2) | |
| Race | ||||
| Non‐Hispanic white | 84,423 (38.3) | 47,327 (36.7) | 37,096 (40.5) | <0.001 |
| Non‐Hispanic black | 60,062 (27.2) | 35,870 (27.8) | 24,192 (26.4) | |
| Hispanic | 51,184 (23.2) | 31,167 (24.2) | 20,017 (21.8) | |
| Asian | 6,444 (2.9) | 3,691 (2.9) | 2,753 (3) | |
| Other | 18,426 (8.4) | 10,800 (8.4) | 7,626 (8.3) | |
| Payer | ||||
| Government | 128,047 (58.1) | 70,742 (54.9) | 57,305 (62.5) | <0.001 |
| Private | 73,338 (33.3) | 44,410 (34.5) | 28,928 (31.6) | |
| Other | 19,154 (8.7) | 13,703 (10.6) | 5,451 (5.9) | |
| Disposition | ||||
| HHS | 684 (0.3) | 411 (0.3) | 273 (0.3) | <0.001 |
| Home | 209,710 (95.1) | 123,236 (95.6) | 86,474 (94.3) | |
| Other | 9,749 (4.4) | 4,962 (3.9) | 4,787 (5.2) | |
| SNF | 396 (0.2) | 246 (0.2) | 150 (0.2) | |
| Season | ||||
| Spring | 60,171 (27.3) | 36,709 (28.5) | 23,462 (25.6) | <0.001 |
| Summer | 29,891 (13.6) | 17,748 (13.8) | 12,143 (13.2) | |
| Fall | 52,161 (23.7) | 28,332 (22) | 23,829 (26) | |
| Winter | 78,316 (35.5) | 46,066 (35.8) | 32,250 (35.2) | |
| LOS | ||||
| 13 days | 204,812 (92.9) | 119,497 (92.7) | 85,315 (93.1) | <0.001 |
| 46 days | 10,454 (4.7) | 6,148 (4.8) | 4,306 (4.7) | |
| 7+ days | 5,273 (2.4) | 3,210 (2.5) | 2,063 (2.3) | |
| Median [IQR] | 1 [11] | 1 [11] | 1 [11] | 0.144 |
| Admitted patients, median [IQR] | 2 [13] | 2 [13] | 2 [13] | <0.001 |
Discharged From the ED
Throughout the study, utilization of CBC, blood cultures, and CRP was <20%, whereas CXR use was >75%. In segmented regression analysis, CRP utilization was relatively stable before the guidelines publication. However, by the end of the study period, the projected estimate of CRP utilization without guidelines (expected) was 2.9% compared with 4.8% with the guidelines (observed) (P < 0.05) (Figure 1). A similar pattern of higher rates of diagnostic utilization after the guidelines compared with projected estimates without the guidelines was also seen in the ED utilization of CBC, blood cultures, and CXR (Figure 1); however, these trends did not achieve statistical significance. Table 2 provides specific values. Using a standard cost of $19.52 for CRP testing, annual costs across all hospitals increased $11,783 for ED evaluation of CAP.
Baseline (%) | Preguideline Trend | Level Change at Guideline | Change in Trend After Guideline | Estimates at End of Study* | |||
|---|---|---|---|---|---|---|---|
Without Guideline (%) | With Guideline (%) | P | |||||
| |||||||
| ED‐only encounters | |||||||
| Blood culture | 14.6 | 0.1 | 0.8 | 0.1 | 5.5 | 8.6 | NS |
| CBC | 19.2 | 0.1 | 0.4 | 0.1 | 10.7 | 14.0 | NS |
| CRP | 5.4 | 0.0 | 0.6 | 0.1 | 2.9 | 4.8 | <0.05 |
| Chest x‐ray | 85.4 | 0.1 | 0.1 | 0.0 | 80.9 | 81.1 | NS |
| Inpatient encounters | |||||||
| Blood culture | 50.6 | 0.0 | 1.7 | 0.2 | 49.2 | 41.4 | <0.05 |
| Repeat blood culture | 6.5 | 0.0 | 1.0 | 0.1 | 8.9 | 5.8 | NS |
| CBC | 65.2 | 0.0 | 3.1 | 0.0 | 65.0 | 62.2 | NS |
| Repeat CBC | 23.4 | 0.0 | 4.2 | 0.0 | 20.8 | 16.0 | NS |
| CRP | 25.7 | 0.0 | 1.1 | 0.0 | 23.8 | 23.5 | NS |
| Repeat CRP | 12.5 | 0.1 | 2.2 | 0.1 | 7.1 | 7.3 | NS |
| Chest x‐ray | 89.4 | 0.1 | 0.7 | 0.0 | 85.4 | 83.9 | NS |
| Repeat chest x‐ray | 25.5 | 0.0 | 2.0 | 0.1 | 24.1 | 17.7 | <0.05 |
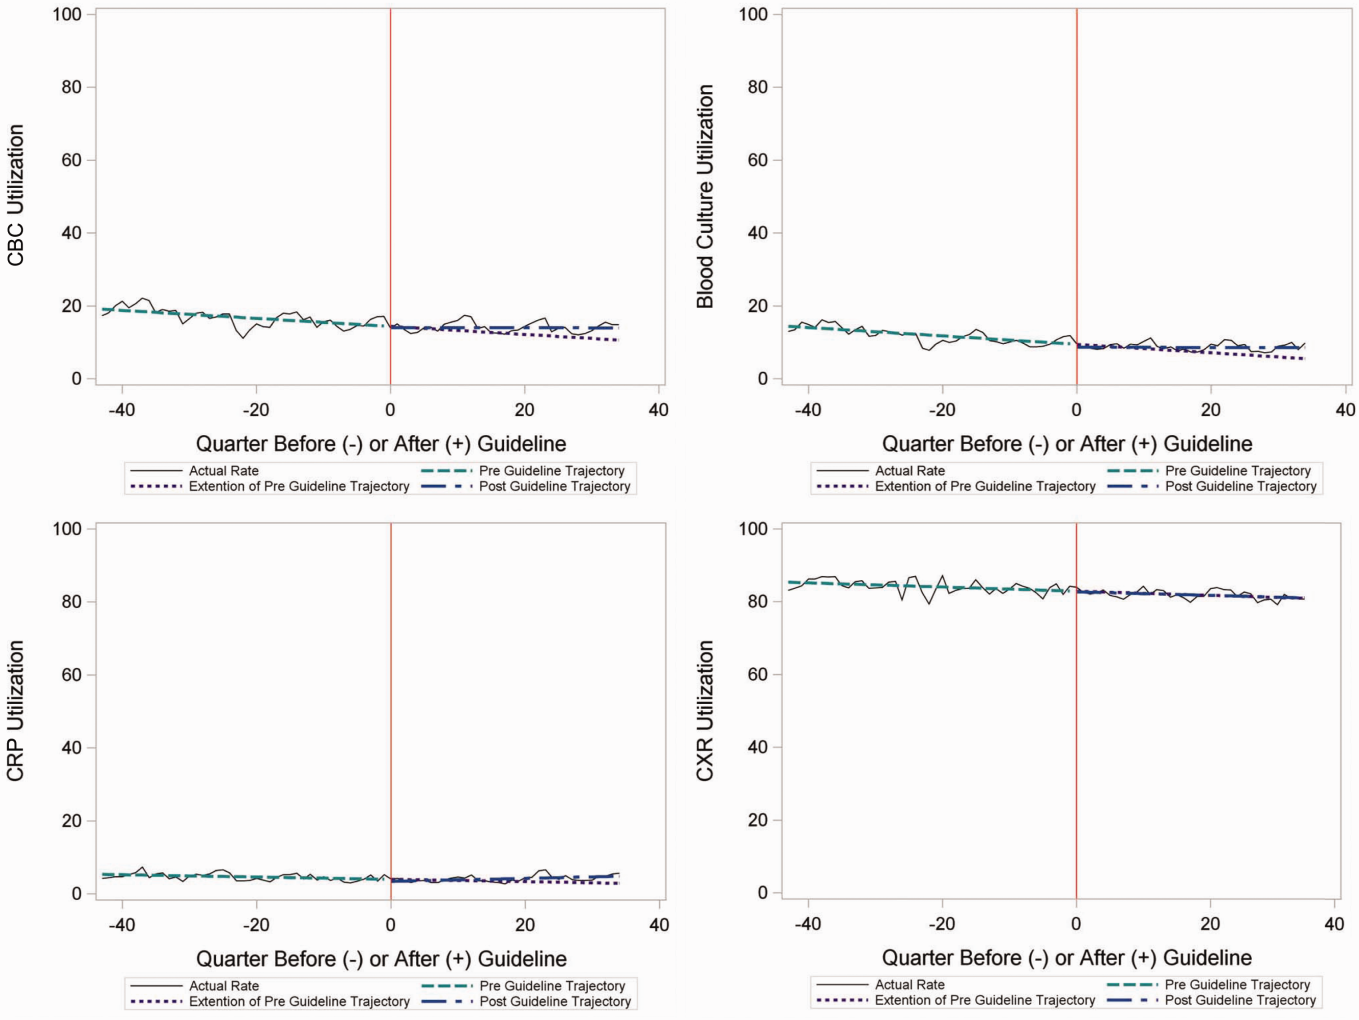
Inpatient Encounters
In the segmented regression analysis of children hospitalized with CAP, guideline publication was associated with changes in the monthly use of some diagnostic tests. For example, by the end of the study period, the use of blood culture was 41.4% (observed), whereas the projected estimated use in the absence of the guidelines was 49.2% (expected) (P < 0.05) (Figure 2). Table 2 includes the data for the other tests, CBC, CRP, and CXR, in which similar patterns are noted with lower utilization rates after the guidelines, compared with expected utilization rates without the guidelines; however, these trends did not achieve statistical significance. Evaluating the utilization of repeat testing for inpatients, only repeat CXR achieved statistical significance (P < 0.05), with utilization rates of 17.7% with the guidelines (actual) compared with 24.1% without the guidelines (predicted).
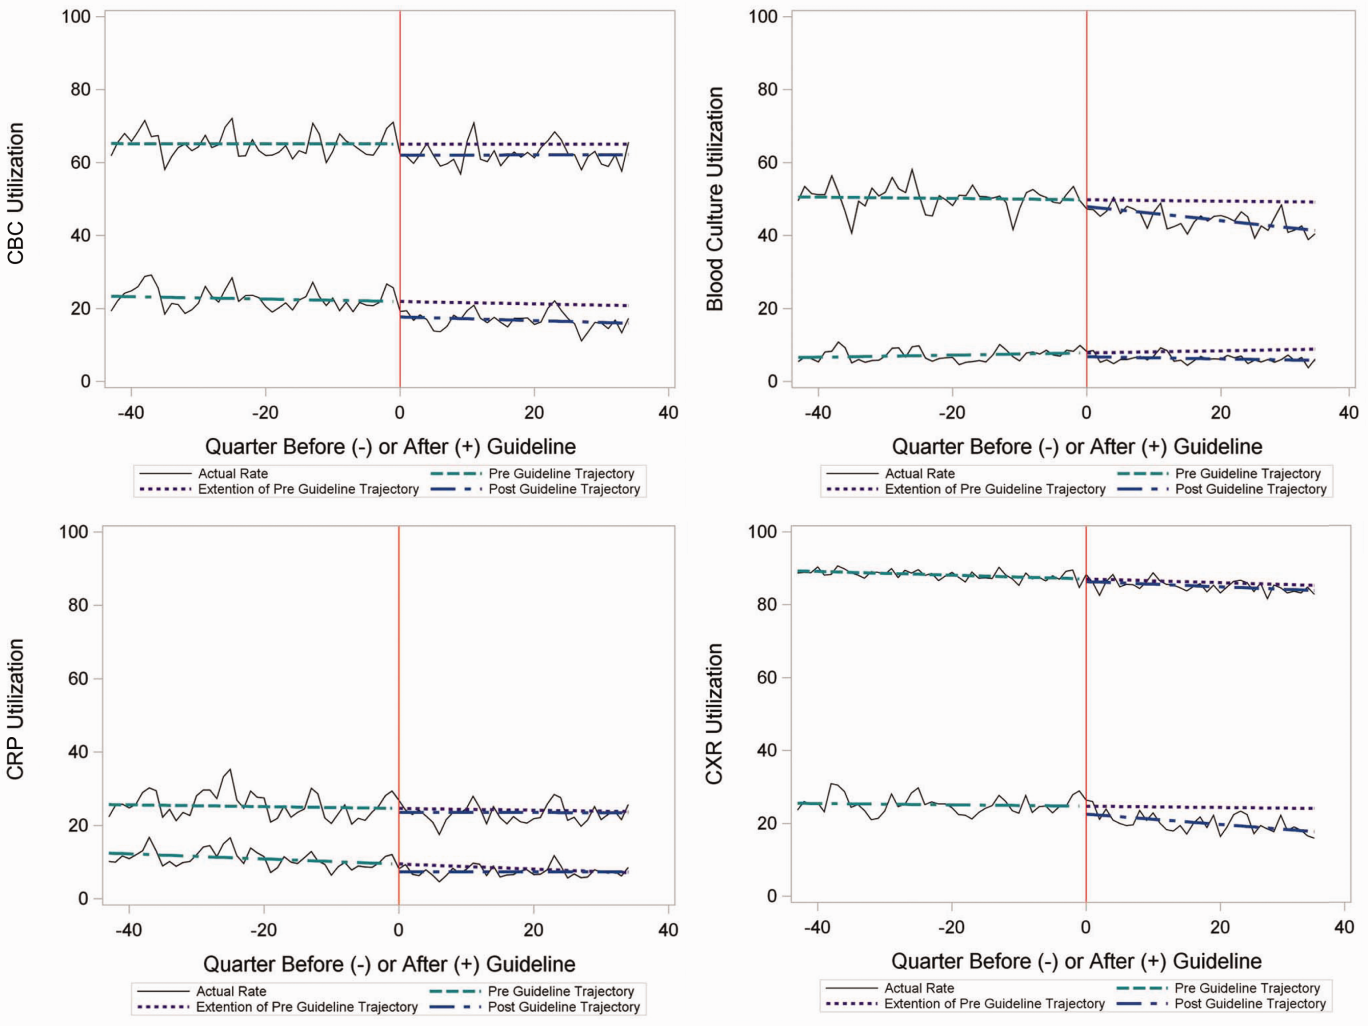
To better understand the use of repeat testing, a comparison of severity outcomesLOS, ICU transfer, and pleural drainage procedureswas performed between patients with no repeat testing (70%) and patients with 1 or more repeat tests (30%). Patients with repeat testing had longer LOS (no repeat testing LOS 1 [IQR, 12]) versus 1 repeat test LOS 3 ([IQR, 24] vs 2+ repeat tests LOS 5 [IQR, 38]), higher rate of ICU transfer (no repeat testing 4.6% vs 1 repeat test 14.6% vs 2+ repeat test 35.6%), and higher rate of pleural drainage (no repeat testing 0% vs 1 repeat test 0.1% vs 2+ repeat test 5.9%] (all P < 0.001).
Using standard costs of $37.57 for blood cultures and $73.28 for CXR, annual costs for children with CAP across all hospitals decreased by $91,512 due to decreased utilization of blood cultures, and by $146,840 due to decreased utilization of CXR.
Hospital‐Level Variation in the Impact of the National Guideline
Figure 3 is a visual representation (heat map) of the impact of the guidelines at the hospital level at the end of the study from the individual interrupted time series. Based on this heat map (Figure 3), there was wide variability between hospitals in the impact of the guideline on each test in different settings (ED or inpatient). By diagnostic testing, 7 hospitals significantly decreased utilization of blood cultures for inpatients, and 5 hospitals significantly decreased utilization for repeat blood cultures and repeat CXR. Correlation between the number of positive improvements at a hospital and region (P = 0.974), number of CAP cases (P = 0.731), or percentage of public insurance (P = 0.241) were all nonsignificant.
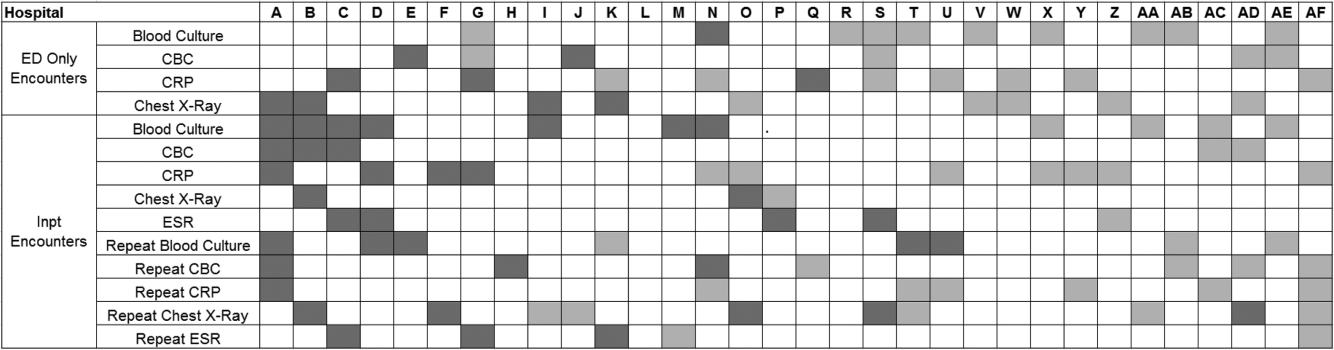
DISCUSSION
This study complements previous assessments by evaluating the impact of the 2011 IDSA/PIDS consensus guidelines on the management of children with CAP cared for at US children's hospitals. Prior studies have shown increased use of narrow‐spectrum antibiotics for children with CAP after the publication of these guidelines.[7] The current study focused on diagnostic testing for CAP before and after the publication of the 2011 guidelines. In the ED setting, use of some diagnostic tests (blood culture, CBC, CXR, CRP) was declining prior to guideline publication, but appeared to plateau and/or increase after 2011. Among children admitted with CAP, use of diagnostic testing was relatively stable prior to 2011, and use of these tests (blood culture, CBC, CXR, CRP) declined after guideline publication. Overall, changes in diagnostic resource utilization 3 years after publication were modest, with few changes achieving statistical significance. There was a large variability in the impact of guidelines on test use between hospitals.
For outpatients, including those managed in the ED, the PIDS/IDSA guidelines recommend limited laboratory testing in nontoxic, fully immunized patients. The guidelines discourage the use of diagnostic testing among outpatients because of their low yield (eg, blood culture), and because test results may not impact management (eg, CBC).[6] In the years prior to guideline publication, there was already a declining trend in testing rates, including blood cultures, CBC, and CRP, for patients in the ED. After guideline publication, the rate of blood cultures, CBC, and CRP increased, but only the increase in CRP utilization achieved statistical significance. We would not expect utilization for common diagnostic tests (eg, CBC for outpatients with CAP) to be at or close to 0% because of the complexity of clinical decision making regarding admission that factors in aspects of patient history, exam findings, and underlying risk.[15] ED utilization of blood cultures was <10%, CBC <15%, and CRP <5% after guideline publication, which may represent the lowest testing limit that could be achieved.
CXRs obtained in the ED did not decrease over the entire study period. The rates of CXR use (close to 80%) seen in our study are similar to prior ED studies.[5, 16] Management of children with CAP in the ED might be different than outpatient primary care management because (1) unlike primary care providers, ED providers do not have an established relationship with their patients and do not have the opportunity for follow‐up and serial exams, making them less likely to tolerate diagnostic uncertainty; and (2) ED providers may see sicker patients. However, use of CXR in the ED does represent an opportunity for further study to understand if decreased utilization is feasible without adversely impacting clinical outcomes.
The CAP guidelines provide a strong recommendation to obtain blood culture in moderate to severe pneumonia. Despite this, blood culture utilization declined after guideline publication. Less than 10% of children hospitalized with uncomplicated CAP have positive blood cultures, which calls into question the utility of blood cultures for all admitted patients.[17, 18, 19] The recent EPIC (Epidemiology of Pneumonia in the Community) study showed that a majority of children hospitalized with pneumonia do not have growth of bacteria in culture, but there may be a role for blood cultures in patients with a strong suspicion of complicated CAP or in the patient with moderate to severe disease.[20] In addition to blood cultures, the guidelines also recommend CBC and CXR in moderate to severely ill children. This observed decline in testing in CBC and CXR may be related to individual physician assessments of which patients are moderately to severely ill, as the guidelines do not recommend testing for children with less severe disease. Our exclusion of patients requiring intensive care management or pleural drainage on admission might have selected children with a milder course of illness, although still requiring admission.
The guidelines discourage repeat diagnostic testing among children hospitalized with CAP who are improving. In this study, repeat CXR and CBC occurred in approximately 20% of patients, but repeat blood culture and CRP was much lower. As with initial diagnostic testing for inpatients with CAP, the rates of some repeat testing decreased with the guidelines. However, those with repeat testing had longer LOS and were more likely to require ICU transfer or a pleural drainage procedure compared to children without repeat testing. This suggests that repeat testing is used more often in children with a severe presentation or a worsening clinical course, and not done routinely on hospitalized patients.
The financial impact of decreased testing is modest, because the tests themselves are relatively inexpensive. However, the lack of substantial cost savings should not preclude efforts to continue to improve adherence to the guidelines. Not only is increased testing associated with higher hospitalization rates,[5] potentially yielding higher costs and family stress, increased testing may also lead to patient discomfort and possibly increased radiation exposure through chest radiography.
Many of the diagnostic testing recommendations in the CAP guidelines are based on weak evidence, which may contribute to the lack of substantial adoption. Nevertheless, adherence to guideline recommendations requires sustained effort on the part of individual physicians that should be encouraged through institutional support.[21] Continuous education and clinical decision support, as well as reminders in the electronic medical record, would make guideline recommendations more visible and may help overcome the inertia of previous practice.[15] The hospital‐level heat map (Figure 3) included in this study demonstrates that the impact of the guidelines was variable across sites. Although a few sites had decreased diagnostic testing in many areas with no increased testing in any category, there were several sites that had no improvement in any diagnostic testing category. In addition, hospital‐level factors like size, geography, and insurance status were not associated with number of improvements. To better understand drivers of change at individual hospitals, future studies should evaluate specific strategies utilized by the rapid guideline adopters.
This study is subject to several limitations. The use of ICD‐9 codes to identify patients with CAP may not capture all patients with this diagnosis; however, these codes have been previously validated.[13] Additionally, because patients were identified using ICD‐9 coding assigned at the time of discharge, testing performed in the ED setting may not reflect care for a child with known pneumonia, but rather may reflect testing for a child with fever or other signs of infection. PHIS collects data from freestanding children's hospitals, which care for a majority of children with CAP in the US, but our findings may not be generalizable to other hospitals. In addition, we did not examine drivers of trends within individual institutions. We did not have detailed information to examine whether the PHIS hospitals in our study had actively worked to adopt the CAP guidelines. We were also unable to assess physician's familiarity with guidelines or the level of disagreement with the recommendations. Furthermore, the PHIS database does not permit detailed correlation of diagnostic testing with clinical parameters. In contrast to the diagnostic testing evaluated in this study, which is primarily discouraged by the IDSA/PIDS guidelines, respiratory viral testing for children with CAP is recommended but could not be evaluated, as data on such testing are not readily available in PHIS.
CONCLUSION
Publication of the IDSA/PIDS evidence‐based guidelines for the management of CAP was associated with modest, variable changes in use of diagnostic testing. Further adoption of the CAP guidelines should reduce variation in care and decrease unnecessary resource utilization in the management of CAP. Our study demonstrates that efforts to promote decreased resource utilization should target specific situations (eg, repeat testing for inpatients who are improving). Adherence to guidelines may be improved by the adoption of local practices that integrate and improve daily workflow, like order sets and clinical decision support tools.
Disclosure: Nothing to report.
- , . Eliminating waste in US health care. JAMA. 2012;307(14):1513–1516.
- , , , et al. Choosing wisely in pediatric hospital medicine: five opportunities for improved healthcare value. J Hosp Med. 2013;8(9):479–485.
- , , , et al.; Pediatric Research in Inpatient Settings (PRIS) Network. Prioritization of comparative effectiveness research topics in hospital pediatrics. Arch Pediatr Adolesc Med. 2012;166(12):1155–1164.
- , , , et al. Variability in processes of care and outcomes among children hospitalized with community‐acquired pneumonia. Pediatr Infect Dis J. 2012;31(10):1036–1041.
- , , , , . Variation in emergency department diagnostic testing and disposition outcomes in pneumonia. Pediatrics. 2013;132(2):237–244.
- , , , et al.; Pediatric Infectious Diseases Society and the Infectious Diseases Society of America. The management of community‐acquired pneumonia in infants and children older than 3 months of age: clinical practice guidelines by the Pediatric Infectious Diseases Society and the Infectious Diseases Society of America. Clin Infect Dis. 2011;53(7):e25–e76.
- , , , et al., Impact of Infectious Diseases Society of America/Pediatric Infectious Diseases Society guidelines on treatment of community‐acquired pneumonia in hospitalized children. Clin Infect Dis. 2014;58(6):834–838.
- , , , et al. Antibiotic choice for children hospitalized with pneumonia and adherence to national guidelines. Pediatrics. 2015;136(1):44–52.
- , , , et al. Quality improvement methods increase appropriate antibiotic prescribing for childhood pneumonia. Pediatrics. 2013;131(5):e1623–e1631.
- , , , et al. Improvement methodology increases guideline recommended blood cultures in children with pneumonia. Pediatrics. 2015;135(4):e1052–e1059.
- , , , , , . Impact of a guideline on management of children hospitalized with community‐acquired pneumonia. Pediatrics. 2012;129(3):e597–e604.
- , , , . Effectiveness of antimicrobial guidelines for community‐acquired pneumonia in children. Pediatrics. 2012;129(5):e1326–e1333.
- , , , et al. Identifying pediatric community‐acquired pneumonia hospitalizations: accuracy of administrative billing codes. JAMA Pediatr. 2013;167(9):851–858.
- , , , , . Pediatric complex chronic conditions classification system version 2: updated for ICD‐10 and complex medical technology dependence and transplantation. BMC Pediatr. 2014;14:199.
- , . Establishing superior benchmarks of care in clinical practice: a proposal to drive achievable health care value. JAMA Pediatr. 2015;169(4):301–302.
- , , , . Emergency department management of childhood pneumonia in the United States prior to publication of national guidelines. Acad Emerg Med. 2013;20(3):240–246.
- , , , et al. Prevalence of bacteremia in hospitalized pediatric patients with community‐acquired pneumonia. Pediatr Infect Dis J. 2013;32(7):736–740.
- , , , , . The prevalence of bacteremia in pediatric patients with community‐acquired pneumonia: guidelines to reduce the frequency of obtaining blood cultures. Hosp Pediatr. 2013;3(2):92–96.
- . Do all children hospitalized with community‐acquired pneumonia require blood cultures? Hosp Pediatr. 2013;3(2):177–179.
- , , , et al.; CDC EPIC Study Team. Community‐acquired pneumonia requiring hospitalization among U.S. children. N Engl J Med. 2015;372(9):835–845.
- , , , et al. Influence of hospital guidelines on management of children hospitalized with pneumonia. Pediatrics. 2012;130(5):e823–e830.
Overutilization of resources is a significant, yet underappreciated, problem in medicine. Many interventions target underutilization (eg, immunizations) or misuse (eg, antibiotic prescribing for viral pharyngitis), yet overutilization remains as a significant contributor to healthcare waste.[1] In an effort to reduce waste, the Choosing Wisely campaign created a work group to highlight areas of overutilization, specifically noting both diagnostic tests and therapies for common pediatric conditions with no proven benefit and possible harm to the patient.[2] Respiratory illnesses have been a target of many quality‐improvement efforts, and pneumonia represents a common diagnosis in pediatrics.[3] The use of diagnostic testing for pneumonia is an area where care can be optimized and aligned with evidence.
Laboratory testing and diagnostic imaging are routinely used for the management of children with community‐acquired pneumonia (CAP). Several studies have documented substantial variability in the use of these resources for pneumonia management, with higher resource use associated with a higher chance of hospitalization after emergency department (ED) evaluation and a longer length of stay among those requiring hospitalization.[4, 5] This variation in diagnostic resource utilization has been attributed, at least in part, to a lack of consensus on the management of pneumonia. There is wide variability in diagnostic testing, and due to potential consequences for patients presenting with pneumonia, efforts to standardize care offer an opportunity to improve healthcare value.
In August 2011, the first national, evidence‐based consensus guidelines for the management of childhood CAP were published jointly by the Pediatric Infectious Diseases Society (PIDS) and the Infectious Diseases Society of America (IDSA).[6] A primary focus of these guidelines was the recommendation for the use of narrow spectrum antibiotics for the management of uncomplicated pneumonia. Previous studies have assessed the impact of the publication of the PIDS/IDSA guidelines on empiric antibiotic selection for the management of pneumonia.[7, 8] In addition, the guidelines provided recommendations regarding diagnostic test utilization, in particular discouraging blood tests (eg, complete blood counts) and radiologic studies for nontoxic, fully immunized children treated as outpatients, as well as repeat testing for children hospitalized with CAP who are improving.
Although single centers have demonstrated changes in utilization patterns based on clinical practice guidelines,[9, 10, 11, 12] whether these guidelines have impacted diagnostic test utilization among US children with CAP in a larger scale remains unknown. Therefore, we sought to determine the impact of the PIDS/IDSA guidelines on the use of diagnostic testing among children with CAP using a national sample of US children's hospitals. Because the guidelines discourage repeat diagnostic testing in patients who are improving, we also evaluated the association between repeat diagnostic studies and severity of illness.
METHODS
This retrospective cohort study used data from the Pediatric Health Information System (PHIS) (Children's Hospital Association, Overland Park, KS). The PHIS database contains deidentified administrative data, detailing demographic, diagnostic, procedure, and billing data from 47 freestanding, tertiary care children's hospitals. This database accounts for approximately 20% of all annual pediatric hospitalizations in the United States. Data quality is ensured through a joint effort between the Children's Hospital Association and participating hospitals.
Patient Population
Data from 32 (of the 47) hospitals included in PHIS with complete inpatient and ED data were used to evaluate hospital‐level resource utilization for children 1 to 18 years of age discharged January 1, 2008 to June 30, 2014 with a diagnosis of pneumonia (International Classification of Diseases, 9th Revision [ICD‐9] codes 480.x‐486.x, 487.0).[13] Our goal was to identify previously healthy children with uncomplicated pneumonia, so we excluded patients with complex chronic conditions,[14] billing charges for intensive care management and/or pleural drainage procedure (IDC‐9 codes 510.0, 510.9, 511.0, 511.1, 511.8, 511.9, 513.x) on day of admission or the next day, or prior pneumonia admission in the last 30 days. We studied 2 mutually exclusive populations: children with pneumonia treated in the ED (ie, patients who were evaluated in the ED and discharged to home), and children hospitalized with pneumonia, including those admitted through the ED.
Guideline Publication and Study Periods
For an exploratory before and after comparison, patients were grouped into 2 cohorts based on a guideline online publication date of August 1, 2011: preguideline (January 1, 2008 to July 31, 2011) and postguideline (August 1, 2011 to June 30, 2014).
Study Outcomes
The measured outcomes were the monthly proportion of pneumonia patients for whom specific diagnostic tests were performed, as determined from billing data. The diagnostic tests evaluated were complete blood count (CBC), blood culture, C‐reactive protein (CRP), and chest radiograph (CXR). Standardized costs were also calculated from PHIS charges as previously described to standardize the cost of the individual tests and remove interhospital cost variation.[3]
Relationship of Repeat Testing and Severity of Illness
Because higher illness severity and clinical deterioration may warrant repeat testing, we also explored the association of repeat diagnostic testing for inpatients with severity of illness by using the following variables as measures of severity: length of stay (LOS), transfer to intensive care unit (ICU), or pleural drainage procedure after admission (>2 calendar days after admission). Repeat diagnostic testing was stratified by number of tests.
Statistical Analysis
The categorical demographic characteristics of the pre‐ and postguideline populations were summarized using frequencies and percentages, and compared using 2 tests. Continuous demographics were summarized with medians and interquartile ranges (IQRs) and compared with the Wilcoxon rank sum test. Segmented regression, clustered by hospital, was used to assess trends in monthly resource utilization as well as associated standardized costs before and after guidelines publication. To estimate the impact of the guidelines overall, we compared the observed diagnostic resource use at the end of the study period with expected use projected from trends in the preguidelines period (ie, if there were no new guidelines). Individual interrupted time series were also built for each hospital. From these models, we assessed which hospitals had a significant difference between the rate observed at the end of the study and that estimated from their preguideline trajectory. To assess the relationship between the number of positive improvements at a hospital and hospital characteristics, we used Spearman's correlation and Kruskal‐Wallis tests. All analyses were performed with SAS version 9.3 (SAS Institute, Inc., Cary, NC), and P values <0.05 were considered statistically significant. In accordance with the policies of the Cincinnati Children's Hospital Medical Center Institutional Review Board, this research, using a deidentified dataset, was not considered human subjects research.
RESULTS
There were 275,288 hospital admissions meeting study inclusion criteria of 1 to 18 years of age with a diagnosis of pneumonia from 2008 to 2014. Of these, 54,749 met exclusion criteria (1874 had pleural drainage procedure on day 0 or 1, 51,306 had complex chronic conditions, 1569 were hospitalized with pneumonia in the last 30 days). Characteristics of the remaining 220,539 patients in the final sample are shown in Table 1. The median age was 4 years (IQR, 27 years); a majority of the children were male (53%) and had public insurance (58%). There were 128,855 patients in the preguideline period (January 1, 2008 to July 31, 2011) and 91,684 in the post guideline period (August 1, 2011June 30, 2014).
| Overall | Preguideline | Postguideline | P | |
|---|---|---|---|---|
| ||||
| No. of discharges | 220,539 | 128,855 | 91,684 | |
| Type of encounter | ||||
| ED only | 150,215 (68.1) | 88,790 (68.9) | 61,425 (67) | <0.001 |
| Inpatient | 70,324 (31.9) | 40,065 (31.1) | 30,259 (33) | |
| Age | ||||
| 14 years | 129,360 (58.7) | 77,802 (60.4) | 51,558 (56.2) | <0.001 |
| 59 years | 58,609 (26.6) | 32,708 (25.4) | 25,901 (28.3) | |
| 1018 years | 32,570 (14.8) | 18,345 (14.2) | 14,225 (15.5) | |
| Median [IQR] | 4 [27] | 3 [27] | 4 [27] | <0.001 |
| Gender | ||||
| Male | 116,718 (52.9) | 68,319 (53) | 48,399 (52.8) | 00.285 |
| Female | 103,813 (47.1) | 60,532 (47) | 43,281 (47.2) | |
| Race | ||||
| Non‐Hispanic white | 84,423 (38.3) | 47,327 (36.7) | 37,096 (40.5) | <0.001 |
| Non‐Hispanic black | 60,062 (27.2) | 35,870 (27.8) | 24,192 (26.4) | |
| Hispanic | 51,184 (23.2) | 31,167 (24.2) | 20,017 (21.8) | |
| Asian | 6,444 (2.9) | 3,691 (2.9) | 2,753 (3) | |
| Other | 18,426 (8.4) | 10,800 (8.4) | 7,626 (8.3) | |
| Payer | ||||
| Government | 128,047 (58.1) | 70,742 (54.9) | 57,305 (62.5) | <0.001 |
| Private | 73,338 (33.3) | 44,410 (34.5) | 28,928 (31.6) | |
| Other | 19,154 (8.7) | 13,703 (10.6) | 5,451 (5.9) | |
| Disposition | ||||
| HHS | 684 (0.3) | 411 (0.3) | 273 (0.3) | <0.001 |
| Home | 209,710 (95.1) | 123,236 (95.6) | 86,474 (94.3) | |
| Other | 9,749 (4.4) | 4,962 (3.9) | 4,787 (5.2) | |
| SNF | 396 (0.2) | 246 (0.2) | 150 (0.2) | |
| Season | ||||
| Spring | 60,171 (27.3) | 36,709 (28.5) | 23,462 (25.6) | <0.001 |
| Summer | 29,891 (13.6) | 17,748 (13.8) | 12,143 (13.2) | |
| Fall | 52,161 (23.7) | 28,332 (22) | 23,829 (26) | |
| Winter | 78,316 (35.5) | 46,066 (35.8) | 32,250 (35.2) | |
| LOS | ||||
| 13 days | 204,812 (92.9) | 119,497 (92.7) | 85,315 (93.1) | <0.001 |
| 46 days | 10,454 (4.7) | 6,148 (4.8) | 4,306 (4.7) | |
| 7+ days | 5,273 (2.4) | 3,210 (2.5) | 2,063 (2.3) | |
| Median [IQR] | 1 [11] | 1 [11] | 1 [11] | 0.144 |
| Admitted patients, median [IQR] | 2 [13] | 2 [13] | 2 [13] | <0.001 |
Discharged From the ED
Throughout the study, utilization of CBC, blood cultures, and CRP was <20%, whereas CXR use was >75%. In segmented regression analysis, CRP utilization was relatively stable before the guidelines publication. However, by the end of the study period, the projected estimate of CRP utilization without guidelines (expected) was 2.9% compared with 4.8% with the guidelines (observed) (P < 0.05) (Figure 1). A similar pattern of higher rates of diagnostic utilization after the guidelines compared with projected estimates without the guidelines was also seen in the ED utilization of CBC, blood cultures, and CXR (Figure 1); however, these trends did not achieve statistical significance. Table 2 provides specific values. Using a standard cost of $19.52 for CRP testing, annual costs across all hospitals increased $11,783 for ED evaluation of CAP.
Baseline (%) | Preguideline Trend | Level Change at Guideline | Change in Trend After Guideline | Estimates at End of Study* | |||
|---|---|---|---|---|---|---|---|
Without Guideline (%) | With Guideline (%) | P | |||||
| |||||||
| ED‐only encounters | |||||||
| Blood culture | 14.6 | 0.1 | 0.8 | 0.1 | 5.5 | 8.6 | NS |
| CBC | 19.2 | 0.1 | 0.4 | 0.1 | 10.7 | 14.0 | NS |
| CRP | 5.4 | 0.0 | 0.6 | 0.1 | 2.9 | 4.8 | <0.05 |
| Chest x‐ray | 85.4 | 0.1 | 0.1 | 0.0 | 80.9 | 81.1 | NS |
| Inpatient encounters | |||||||
| Blood culture | 50.6 | 0.0 | 1.7 | 0.2 | 49.2 | 41.4 | <0.05 |
| Repeat blood culture | 6.5 | 0.0 | 1.0 | 0.1 | 8.9 | 5.8 | NS |
| CBC | 65.2 | 0.0 | 3.1 | 0.0 | 65.0 | 62.2 | NS |
| Repeat CBC | 23.4 | 0.0 | 4.2 | 0.0 | 20.8 | 16.0 | NS |
| CRP | 25.7 | 0.0 | 1.1 | 0.0 | 23.8 | 23.5 | NS |
| Repeat CRP | 12.5 | 0.1 | 2.2 | 0.1 | 7.1 | 7.3 | NS |
| Chest x‐ray | 89.4 | 0.1 | 0.7 | 0.0 | 85.4 | 83.9 | NS |
| Repeat chest x‐ray | 25.5 | 0.0 | 2.0 | 0.1 | 24.1 | 17.7 | <0.05 |
Inpatient Encounters
In the segmented regression analysis of children hospitalized with CAP, guideline publication was associated with changes in the monthly use of some diagnostic tests. For example, by the end of the study period, the use of blood culture was 41.4% (observed), whereas the projected estimated use in the absence of the guidelines was 49.2% (expected) (P < 0.05) (Figure 2). Table 2 includes the data for the other tests, CBC, CRP, and CXR, in which similar patterns are noted with lower utilization rates after the guidelines, compared with expected utilization rates without the guidelines; however, these trends did not achieve statistical significance. Evaluating the utilization of repeat testing for inpatients, only repeat CXR achieved statistical significance (P < 0.05), with utilization rates of 17.7% with the guidelines (actual) compared with 24.1% without the guidelines (predicted).
To better understand the use of repeat testing, a comparison of severity outcomesLOS, ICU transfer, and pleural drainage procedureswas performed between patients with no repeat testing (70%) and patients with 1 or more repeat tests (30%). Patients with repeat testing had longer LOS (no repeat testing LOS 1 [IQR, 12]) versus 1 repeat test LOS 3 ([IQR, 24] vs 2+ repeat tests LOS 5 [IQR, 38]), higher rate of ICU transfer (no repeat testing 4.6% vs 1 repeat test 14.6% vs 2+ repeat test 35.6%), and higher rate of pleural drainage (no repeat testing 0% vs 1 repeat test 0.1% vs 2+ repeat test 5.9%] (all P < 0.001).
Using standard costs of $37.57 for blood cultures and $73.28 for CXR, annual costs for children with CAP across all hospitals decreased by $91,512 due to decreased utilization of blood cultures, and by $146,840 due to decreased utilization of CXR.
Hospital‐Level Variation in the Impact of the National Guideline
Figure 3 is a visual representation (heat map) of the impact of the guidelines at the hospital level at the end of the study from the individual interrupted time series. Based on this heat map (Figure 3), there was wide variability between hospitals in the impact of the guideline on each test in different settings (ED or inpatient). By diagnostic testing, 7 hospitals significantly decreased utilization of blood cultures for inpatients, and 5 hospitals significantly decreased utilization for repeat blood cultures and repeat CXR. Correlation between the number of positive improvements at a hospital and region (P = 0.974), number of CAP cases (P = 0.731), or percentage of public insurance (P = 0.241) were all nonsignificant.
DISCUSSION
This study complements previous assessments by evaluating the impact of the 2011 IDSA/PIDS consensus guidelines on the management of children with CAP cared for at US children's hospitals. Prior studies have shown increased use of narrow‐spectrum antibiotics for children with CAP after the publication of these guidelines.[7] The current study focused on diagnostic testing for CAP before and after the publication of the 2011 guidelines. In the ED setting, use of some diagnostic tests (blood culture, CBC, CXR, CRP) was declining prior to guideline publication, but appeared to plateau and/or increase after 2011. Among children admitted with CAP, use of diagnostic testing was relatively stable prior to 2011, and use of these tests (blood culture, CBC, CXR, CRP) declined after guideline publication. Overall, changes in diagnostic resource utilization 3 years after publication were modest, with few changes achieving statistical significance. There was a large variability in the impact of guidelines on test use between hospitals.
For outpatients, including those managed in the ED, the PIDS/IDSA guidelines recommend limited laboratory testing in nontoxic, fully immunized patients. The guidelines discourage the use of diagnostic testing among outpatients because of their low yield (eg, blood culture), and because test results may not impact management (eg, CBC).[6] In the years prior to guideline publication, there was already a declining trend in testing rates, including blood cultures, CBC, and CRP, for patients in the ED. After guideline publication, the rate of blood cultures, CBC, and CRP increased, but only the increase in CRP utilization achieved statistical significance. We would not expect utilization for common diagnostic tests (eg, CBC for outpatients with CAP) to be at or close to 0% because of the complexity of clinical decision making regarding admission that factors in aspects of patient history, exam findings, and underlying risk.[15] ED utilization of blood cultures was <10%, CBC <15%, and CRP <5% after guideline publication, which may represent the lowest testing limit that could be achieved.
CXRs obtained in the ED did not decrease over the entire study period. The rates of CXR use (close to 80%) seen in our study are similar to prior ED studies.[5, 16] Management of children with CAP in the ED might be different than outpatient primary care management because (1) unlike primary care providers, ED providers do not have an established relationship with their patients and do not have the opportunity for follow‐up and serial exams, making them less likely to tolerate diagnostic uncertainty; and (2) ED providers may see sicker patients. However, use of CXR in the ED does represent an opportunity for further study to understand if decreased utilization is feasible without adversely impacting clinical outcomes.
The CAP guidelines provide a strong recommendation to obtain blood culture in moderate to severe pneumonia. Despite this, blood culture utilization declined after guideline publication. Less than 10% of children hospitalized with uncomplicated CAP have positive blood cultures, which calls into question the utility of blood cultures for all admitted patients.[17, 18, 19] The recent EPIC (Epidemiology of Pneumonia in the Community) study showed that a majority of children hospitalized with pneumonia do not have growth of bacteria in culture, but there may be a role for blood cultures in patients with a strong suspicion of complicated CAP or in the patient with moderate to severe disease.[20] In addition to blood cultures, the guidelines also recommend CBC and CXR in moderate to severely ill children. This observed decline in testing in CBC and CXR may be related to individual physician assessments of which patients are moderately to severely ill, as the guidelines do not recommend testing for children with less severe disease. Our exclusion of patients requiring intensive care management or pleural drainage on admission might have selected children with a milder course of illness, although still requiring admission.
The guidelines discourage repeat diagnostic testing among children hospitalized with CAP who are improving. In this study, repeat CXR and CBC occurred in approximately 20% of patients, but repeat blood culture and CRP was much lower. As with initial diagnostic testing for inpatients with CAP, the rates of some repeat testing decreased with the guidelines. However, those with repeat testing had longer LOS and were more likely to require ICU transfer or a pleural drainage procedure compared to children without repeat testing. This suggests that repeat testing is used more often in children with a severe presentation or a worsening clinical course, and not done routinely on hospitalized patients.
The financial impact of decreased testing is modest, because the tests themselves are relatively inexpensive. However, the lack of substantial cost savings should not preclude efforts to continue to improve adherence to the guidelines. Not only is increased testing associated with higher hospitalization rates,[5] potentially yielding higher costs and family stress, increased testing may also lead to patient discomfort and possibly increased radiation exposure through chest radiography.
Many of the diagnostic testing recommendations in the CAP guidelines are based on weak evidence, which may contribute to the lack of substantial adoption. Nevertheless, adherence to guideline recommendations requires sustained effort on the part of individual physicians that should be encouraged through institutional support.[21] Continuous education and clinical decision support, as well as reminders in the electronic medical record, would make guideline recommendations more visible and may help overcome the inertia of previous practice.[15] The hospital‐level heat map (Figure 3) included in this study demonstrates that the impact of the guidelines was variable across sites. Although a few sites had decreased diagnostic testing in many areas with no increased testing in any category, there were several sites that had no improvement in any diagnostic testing category. In addition, hospital‐level factors like size, geography, and insurance status were not associated with number of improvements. To better understand drivers of change at individual hospitals, future studies should evaluate specific strategies utilized by the rapid guideline adopters.
This study is subject to several limitations. The use of ICD‐9 codes to identify patients with CAP may not capture all patients with this diagnosis; however, these codes have been previously validated.[13] Additionally, because patients were identified using ICD‐9 coding assigned at the time of discharge, testing performed in the ED setting may not reflect care for a child with known pneumonia, but rather may reflect testing for a child with fever or other signs of infection. PHIS collects data from freestanding children's hospitals, which care for a majority of children with CAP in the US, but our findings may not be generalizable to other hospitals. In addition, we did not examine drivers of trends within individual institutions. We did not have detailed information to examine whether the PHIS hospitals in our study had actively worked to adopt the CAP guidelines. We were also unable to assess physician's familiarity with guidelines or the level of disagreement with the recommendations. Furthermore, the PHIS database does not permit detailed correlation of diagnostic testing with clinical parameters. In contrast to the diagnostic testing evaluated in this study, which is primarily discouraged by the IDSA/PIDS guidelines, respiratory viral testing for children with CAP is recommended but could not be evaluated, as data on such testing are not readily available in PHIS.
CONCLUSION
Publication of the IDSA/PIDS evidence‐based guidelines for the management of CAP was associated with modest, variable changes in use of diagnostic testing. Further adoption of the CAP guidelines should reduce variation in care and decrease unnecessary resource utilization in the management of CAP. Our study demonstrates that efforts to promote decreased resource utilization should target specific situations (eg, repeat testing for inpatients who are improving). Adherence to guidelines may be improved by the adoption of local practices that integrate and improve daily workflow, like order sets and clinical decision support tools.
Disclosure: Nothing to report.
- , . Eliminating waste in US health care. JAMA. 2012;307(14):1513–1516.
- , , , et al. Choosing wisely in pediatric hospital medicine: five opportunities for improved healthcare value. J Hosp Med. 2013;8(9):479–485.
- , , , et al.; Pediatric Research in Inpatient Settings (PRIS) Network. Prioritization of comparative effectiveness research topics in hospital pediatrics. Arch Pediatr Adolesc Med. 2012;166(12):1155–1164.
- , , , et al. Variability in processes of care and outcomes among children hospitalized with community‐acquired pneumonia. Pediatr Infect Dis J. 2012;31(10):1036–1041.
- , , , , . Variation in emergency department diagnostic testing and disposition outcomes in pneumonia. Pediatrics. 2013;132(2):237–244.
- , , , et al.; Pediatric Infectious Diseases Society and the Infectious Diseases Society of America. The management of community‐acquired pneumonia in infants and children older than 3 months of age: clinical practice guidelines by the Pediatric Infectious Diseases Society and the Infectious Diseases Society of America. Clin Infect Dis. 2011;53(7):e25–e76.
- , , , et al., Impact of Infectious Diseases Society of America/Pediatric Infectious Diseases Society guidelines on treatment of community‐acquired pneumonia in hospitalized children. Clin Infect Dis. 2014;58(6):834–838.
- , , , et al. Antibiotic choice for children hospitalized with pneumonia and adherence to national guidelines. Pediatrics. 2015;136(1):44–52.
- , , , et al. Quality improvement methods increase appropriate antibiotic prescribing for childhood pneumonia. Pediatrics. 2013;131(5):e1623–e1631.
- , , , et al. Improvement methodology increases guideline recommended blood cultures in children with pneumonia. Pediatrics. 2015;135(4):e1052–e1059.
- , , , , , . Impact of a guideline on management of children hospitalized with community‐acquired pneumonia. Pediatrics. 2012;129(3):e597–e604.
- , , , . Effectiveness of antimicrobial guidelines for community‐acquired pneumonia in children. Pediatrics. 2012;129(5):e1326–e1333.
- , , , et al. Identifying pediatric community‐acquired pneumonia hospitalizations: accuracy of administrative billing codes. JAMA Pediatr. 2013;167(9):851–858.
- , , , , . Pediatric complex chronic conditions classification system version 2: updated for ICD‐10 and complex medical technology dependence and transplantation. BMC Pediatr. 2014;14:199.
- , . Establishing superior benchmarks of care in clinical practice: a proposal to drive achievable health care value. JAMA Pediatr. 2015;169(4):301–302.
- , , , . Emergency department management of childhood pneumonia in the United States prior to publication of national guidelines. Acad Emerg Med. 2013;20(3):240–246.
- , , , et al. Prevalence of bacteremia in hospitalized pediatric patients with community‐acquired pneumonia. Pediatr Infect Dis J. 2013;32(7):736–740.
- , , , , . The prevalence of bacteremia in pediatric patients with community‐acquired pneumonia: guidelines to reduce the frequency of obtaining blood cultures. Hosp Pediatr. 2013;3(2):92–96.
- . Do all children hospitalized with community‐acquired pneumonia require blood cultures? Hosp Pediatr. 2013;3(2):177–179.
- , , , et al.; CDC EPIC Study Team. Community‐acquired pneumonia requiring hospitalization among U.S. children. N Engl J Med. 2015;372(9):835–845.
- , , , et al. Influence of hospital guidelines on management of children hospitalized with pneumonia. Pediatrics. 2012;130(5):e823–e830.
© 2015 Society of Hospital Medicine

Febrile Infant Diagnosis Code Accuracy
Fever is one of the most common reasons for emergency department (ED) evaluation of infants under 90 days of age.[1] Up to 10% to 20% of febrile young infants will have a serious bacterial infection (SBI),[2, 3, 4] but infants with SBI are difficult to distinguish from those without SBI based upon symptoms and physical examination findings alone.[5] Previously developed clinical prediction algorithms can help to identify febrile infants at low risk for SBI, but differ in age range as well as recommendations for testing and empiric treatment.[6, 7, 8] Consequently, there is widespread variation in management of febrile young infants at US children's hospitals,[9, 10, 11] and defining optimal management strategies remains an important issue in pediatric healthcare.[12] Administrative datasets are convenient and inexpensive, and can be used to evaluate practice variation, trends, and outcomes of a large, diverse group of patients within and across institutions.[9, 10] Accurately identifying febrile infants evaluated for suspected SBI in administrative databases would facilitate comparative effectiveness research, quality improvement initiatives, and institutional benchmarking.
Prior studies have validated the accuracy of administrative billing codes for identification of other common childhood illnesses, including urinary tract infection (UTI)[13] and pneumonia.[14] The accuracy of International Classification of Diseases, Ninth Revision (ICD‐9) diagnosis codes in identifying febrile young infants evaluated for SBI is not known. Reliance on administrative ICD‐9 diagnosis codes for patient identification can lead to misclassification of patients due to variable database quality, the validity of the diagnosis codes being utilized, and hospital coding practices.[15] Additionally, fever is a symptom and not a specific diagnosis. If a particular bacterial or viral diagnosis is established (eg, enterovirus meningitis), a discharge diagnosis of fever may not be attributed to the patient encounter. Thus, evaluating the performance characteristics and capture of clinical outcomes of different combinations of ICD‐9 diagnosis codes for identifying febrile infants is necessary for both the conduct and interpretation of studies that utilize administrative databases. The primary objective of this investigation was to identify the most accurate ICD‐9 coding strategies for the identification of febrile infants aged <90 days using administrative data. We also sought to evaluate capture of clinically important outcomes across identification strategies.
METHODS
Study Design and Setting
For this multicenter retrospective study, we used the Pediatric Health Information System (PHIS) database to identify infants <90 days of age[16] who presented between July 1, 2012 and June 30, 2013 to 1 of 8 EDs. We assessed performance characteristics of ICD‐9 diagnosis code case‐identification algorithms by comparing ICD‐9 code combinations to a fever reference standard determined by medical record review. The institutional review board at each participating site approved the study protocol.
Data Source
Data were obtained from 2 sources: the PHIS database and medical record review. We used the PHIS database to identify eligible patients by ICD‐9 diagnosis codes; patient encounters were randomly selected using a random number generator. The PHIS database contains demographic, diagnosis, and billing data from 44 hospitals affiliated with the Children's Hospital Association (Overland Park, Kansas) and represents 85% of freestanding children's hospitals in the United States.[17] Data are deidentified; encrypted unique patient identifiers permit tracking of patients across visits within a site.[18] The Children's Hospital Association and participating hospitals jointly assure the quality and integrity of the data.[19]
For each patient encounter identified in the PHIS database, detailed medical record review was performed by trained investigators at each of the 8 study sites (see Supporting Information, Appendix, in the online version of this article). A standardized data collection instrument was pilot tested by all investigators prior to use. Data were collected and managed using the Research Electronic Data Capture (REDCap) tool hosted at Boston Children's Hospital.[20]
Exclusions
Using PHIS data, prior to medical record review we excluded infants with a complex chronic condition as defined previously[21] and those transferred from another institution, as these infants may warrant a nonstandard evaluation and/or may have incomplete data.
ICD‐9 Diagnosis Code Groups
In the PHIS database, all patients discharged from the hospital (including hospitalized patients as well as patients discharged from the ED) receive 1 or more ICD‐9 discharge diagnosis codes. These diagnosis codes are ascribed after discharge from the hospital, or for ED patients, after ED discharge. Additionally, patients may receive an admission diagnosis, which reflects the diagnosis ascribed at the time of ED discharge or transfer to the inpatient unit.
We reviewed medical records of infants selected from the following ICD‐9 diagnosis code groups (Figure 1): (1) discharge diagnosis code of fever (780.6 [fever and other physiologic disturbances of temperature regulation], 778.4 [other disturbances of temperature regulation of newborn], 780.60 [fever, unspecified], or 780.61 [fever presenting with conditions classified elsewhere])[9, 10] regardless of the presence of admission diagnosis of fever or diagnosis of serious infection, (2) admission diagnosis code of fever without associated discharge diagnosis code of fever,[10] (3) discharge diagnosis code of serious infection determined a priori (see Supporting Information, Appendix, in the online version of this article) without discharge or admission diagnosis code of fever, and (4) infants without any diagnosis code of fever or serious infection.

Medical records reviewed in each of the 4 ICD‐9 diagnosis code groups were randomly selected from the overall set of ED encounters in the population of infants <90 days of age evaluated during the study period. Twenty‐five percent population sampling was used for 3 of the ICD‐9 diagnosis code groups, whereas 5% sampling was used for the no fever/no serious infection code group. The number of medical records reviewed in each ICD‐9 diagnosis code group was proportional to the distribution of ICD‐9 codes across the entire population of infants <90 days of age. These records were distributed equally across sites (228 records per site), except for 1 site that does not assign admission diagnoses (201 records).
Investigators were blinded to ICD‐9 diagnosis code groups during medical record review. Infants with multiple visits during the study period were eligible to be included more than once if the visits occurred more than 3 days apart. For infants with more than 1 ED visit on a particular calendar day, investigators were instructed to review the initial visit.
For each encounter, we also abstracted demographic characteristics (gender, race/ethnicity), insurance status, hospital region (using US Census categories[22]), and season from the PHIS database.
Reference Standard
The presence of fever was determined by medical record review. We defined fever as any documented temperature 100.4F (38.0C) at home or in the ED.[16]
ICD‐9 Code Case‐Identification Algorithms
Using the aforementioned ICD‐9 diagnosis code groups individually and in combination, the following 4 case‐identification algorithms, determined from prior study or group consensus, were compared to the reference standard: (1) ICD‐9 discharge diagnosis code of fever,[9] (2) ICD‐9 admission or discharge diagnosis code of fever,[10, 11] (3) ICD‐9 discharge diagnosis code of fever or serious infection, and (4) ICD‐9 discharge or admission diagnosis code of fever or serious infection. Algorithms were compared overall, separately for discharged and hospitalized infants, and across 3 distinct age groups (28 days, 2956 days, and 5789 days).
Patient‐Level Outcomes
To compare differences in outcomes by case‐identification algorithm, from the PHIS database we abstracted hospitalization rates, rates of UTI/pyelonephritis,[13] bacteremia/sepsis, and bacterial meningitis.[19] Severe outcomes were defined as intensive care unit admission, mechanical ventilation, central line placement, receipt of extracorporeal membrane oxygenation, or death. We assessed hospital length of stay for admitted infants and 3‐day revisits,[23, 24] and revisits resulting in hospitalization for infants discharged from the ED at the index visit. Patients billed for observation care were classified as being hospitalized.[25, 26]
Data Analysis
Accuracy of the 4 case‐identification algorithms (compared with the reference standard) was calculated using sensitivity, specificity, negative predictive value (NPV), and positive predictive value (PPV), along with 95% confidence interval (CI). Prior to analysis, a 5‐fold weighting factor was applied to the no fever/no serious infection group to account for the differential sampling used for this group (5% vs 25% for the other 3 ICD‐9 diagnosis code groups). This weighting was done to approximate the true prevalence of each ICD‐9 code group within the larger population, so that an accurate rate of false negatives (infants with fever who had neither a diagnosis of fever nor serious infection) could be calculated.
We described continuous variables using median and interquartile range or range values and categorical variables using frequencies with 95% CIs. We compared categorical variables using a 2 test. We determined statistical significance as a 2‐tailed P value <0.05. Statistical analyses were performed using SAS version 9.3 (SAS Institute, Cary, NC).
RESULTS
Study Patients
During the 1‐year study period, 23,753 ED encounters for infants <90 days of age were identified in the PHIS database at the 8 participating sites. Of these infant encounters, 2166 (9.2%) were excluded (1658 infants who had a complex chronic condition and 508 transferred into the ED), leaving 21,587 infants available for selection. After applying our sampling strategy, we identified 1797 encounters for medical record review. Seven encounters from 3 hospitals with missing medical records were excluded, resulting in a final cohort of 1790 encounters (Figure 1). Among included infants, 552 (30.8%) were 28 days, 743 (41.5%) were 29 to 56 days, and 495 (27.8%) were 57 to 89 days of age; 737 (41.2%) infants were hospitalized. Patients differed in age, race, payer, and season across ICD‐9 diagnosis code groups (see Supporting Information, Table 1, in the online version of this article).
| ICD‐9 Diagnosis Code Algorithm | Overall | |||
|---|---|---|---|---|
| Sensitivity, % (95% CI) | Specificity, % (95% CI) | Negative Predictive Value, % (95% CI) | Positive Predictive Value, % (95% CI) | |
| ||||
| Discharge diagnosis of fever | 53.2 (50.056.4) | 98.2 (97.898.6) | 90.8 (90.091.6) | 86.1 (83.388.9) |
| Hospitalized | 47.3 (43.151.5) | 97.7 (96.998.5) | 80.6 (78.682.6) | 90.2 (86.893.6) |
| Discharged from ED | 61.4 (56.666.2) | 98.4 (98.098.8) | 95.4 (94.796.1) | 82.1 (77.786.5) |
| Discharge or admission diagnosis of Fever | 71.1 (68.274.0) | 97.7 (97.398.1) | 94.1 (93.494.8) | 86.9 (84.589.3) |
| Hospitalized | 72.5 (68.876.2) | 97.1 (96.298.0) | 88.8 (87.190.5) | 91.7 (89.194.3) |
| Discharged from ED | 69.2 (64.773.7) | 98.0 (97.598.5) | 96.3 (95.796.9) | 80.8 (76.685.0) |
| Discharge diagnosis of fever or serious infection | 63.7 (60.666.8) | 96.5 (96.097.0) | 92.6 (91.893.4) | 79.6 (76.782.5) |
| Hospitalized | 63.9 (59.967.9) | 92.5 (91.094.0) | 85.1 (83.287.0) | 79.1 (75.382.9) |
| Discharged from ED | 63.4 (58.768.1) | 98.1 (97.698.6) | 95.6 (94.996.3) | 80.2 (75.884.6) |
| Discharge or admission diagnosis of fever or serious infection | 76.6 (73.979.3) | 96.2 (95.696.8) | 95.1 (94.595.7) | 81.0 (78.483.6) |
| Hospitalized | 80.8 (77.584.1) | 92.1 (90.693.6) | 91.5 (89.993.1) | 82.1 (78.985.3) |
| Discharged from ED | 71.0 (66.575.5) | 97.7 (97.298.2) | 96.5 (95.997.1) | 79.4 (75.283.6) |
Among the 1790 patient encounters reviewed, a total of 766 infants (42.8%) met the reference standard definition for fever in the cohort. An additional 47 infants had abnormal temperature reported (documentation of tactile fever, history of fever without a specific temperature described, or hypothermia) but were classified as having no fever by the reference standard.
ICD‐9 Code Case‐Identification Algorithm Performance
Compared with the reference standard, the 4 case‐identification algorithms demonstrated specificity of 96.2% to 98.2% but lower sensitivity overall (Figure 2). Discharge diagnosis of fever alone demonstrated the lowest sensitivity. The algorithm of discharge or admission diagnosis of fever resulted in increased sensitivity and the highest PPV of all 4 algorithms (86.9%, 95% CI: 84.5‐89.3). Addition of serious infection codes to this algorithm resulted in a marginal increase in sensitivity and a similar decrease in PPV (Table 1). When limited to hospitalized infants, specificity was highest for the case‐identification algorithm of discharge diagnosis of fever and similarly high for discharge or admission diagnosis of fever; sensitivity was highest for the algorithm of discharge or admission diagnosis of fever or diagnosis of serious infection. For infants discharged from the ED, algorithm specificity was 97.7% to 98.4%, with lower sensitivity for all 4 algorithms (Table 1). Inclusion of the 47 infants with abnormal temperature as fever did not materially change algorithm performance (data not shown).
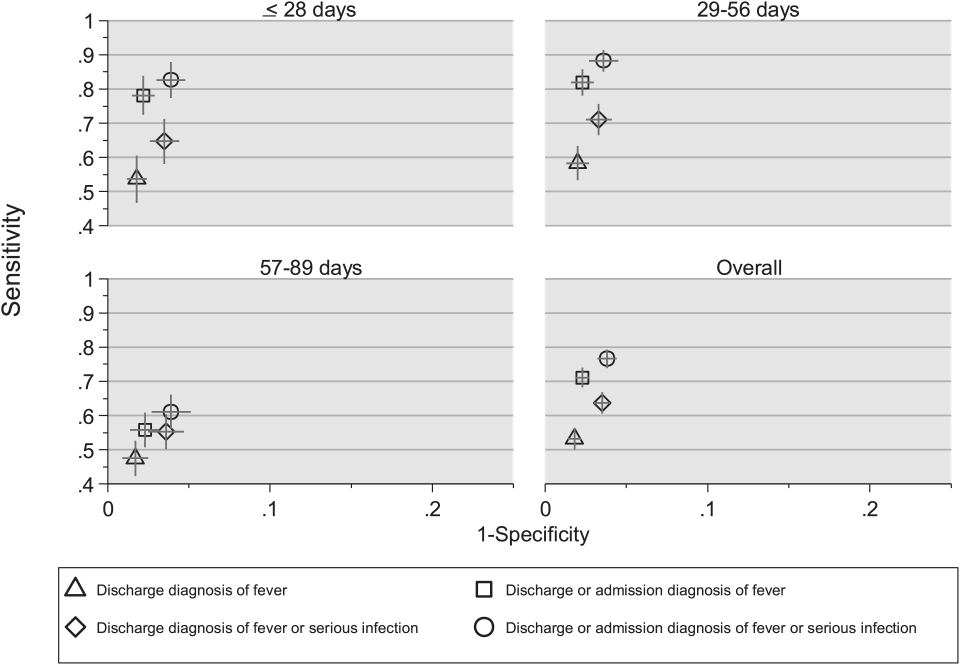
Across all 3 age groups (28 days, 2956 days, and 5789 days), the 4 case‐identification algorithms demonstrated specificity >96%, whereas algorithm sensitivity was highest in the 29‐ to 56‐days‐old age group and lowest among infants 57 to 89 days old across all 4 algorithms (Figure 2). Similar to the overall cohort, an algorithm of discharge or admission diagnosis of fever demonstrated specificity of nearly 98% in all age groups; addition of serious infection codes to this algorithm increased sensitivity, highest in the 29‐ to 56‐days‐old age group (Figure 2; see also Supporting Information, Table 2, in the online version of this article).
| ICD‐9 Diagnosis Code Algorithm | Sensitivity, Median % (Range) | Specificity, Median % (Range) | Negative Predictive Value, Median % (Range) | Positive Predictive Value, Median % (Range) |
|---|---|---|---|---|
| ||||
| Discharge diagnosis of fever | 56.2 (34.681.0) | 98.3 (96.499.1) | 92.1 (83.297.4) | 87.7 (74.093.2) |
| Discharge or Admission diagnosis of Fever | 76.7 (51.385.0) | 97.8 (96.298.7) | 95.6 (86.997.4) | 87.4 (80.092.9) |
| Discharge diagnosis of fever or serious infection | 68.3 (44.287.3) | 96.5 (95.498.0) | 93.6 (85.298.2) | 78.3 (74.289.0) |
| Discharge or admission diagnosis of fever or serious infection | 83.1 (58.390.7) | 95.8 (95.498.0) | 96.5 (88.598.2) | 79.1 (77.490.4) |
Across the 8 study sites, median specificity was 95.8% to 98.3% for the 4 algorithms, with little interhospital variability; however, algorithm sensitivity varied widely by site. Median PPV was highest for discharge diagnosis of fever alone at 87.7% but ranged from 74.0% to 93.2% across sites. Median PPV for an algorithm of discharge or admission diagnosis of fever was similar (87.4%) but with less variation by site (range 80.0%92.9%) (Table 2).
Outcomes by ICD‐9 Diagnosis Code Group and Case‐Identification Algorithm
When compared with discharge diagnosis of fever, adding admission diagnosis of fever captured a higher proportion of hospitalized infants with SBIs (UTI/pyelonephritis, bacteremia/sepsis, or bacterial meningitis). However, median hospital length of stay, severe outcomes, and 3‐day revisits and revisits with hospitalization did not materially differ when including infants with admission diagnosis of fever in addition to discharge diagnosis of fever. Addition of infants with a diagnosis code for serious infection substantially increased the number of infants with SBIs and severe outcomes but did not capture additional 3‐day revisits (Table 3). There were no additional cases of SBI in the no fever/no serious illness diagnosis code group.
| ICD‐9 Diagnosis Code Algorithm | Outcome | 3‐Day Revisit, % (95% CI) | 3‐Day Revisit With Hospitalization, % (95% CI) | |||
|---|---|---|---|---|---|---|
| Hospitalized, % (95% CI) | UTI/Pyelonephritis, Bacteremia/Sepsis, or Bacterial Meningitis, % (95% CI) | Severe Outcome, % (95% CI)* | Length of Stay in Days, Median (IQR) | |||
| ||||||
| Discharge diagnosis of fever | 44.3 (40.348.4) | 3.3 (1.84.7) | 1.4 (0.42.3) | 3 (23) | 11.7 (8.215.2) | 5.9 (3.38.4) |
| Discharge or admission diagnosis of fever | 52.4 (48.955.9) | 6.1 (4.47.8) | 1.9 (1.02.9) | 3 (23) | 10.9 (7.714.1) | 5.4 (3.17.8) |
| Discharge diagnosis of fever or serious infection | 54.0 (50.457.5) | 15.3 (12.717.8) | 3.8 (2.55.2) | 3 (24) | 11.0 (7.714.2) | 5.5 (3.17.9) |
| Discharge or admission diagnosis of fever or serious infection | 56.5 (53.259.7) | 12.9 (10.715.1) | 3.6 (2.44.8) | 3 (24) | 10.3 (7.313.3) | 5.2 (3.07.4) |
Among infants who met the reference standard for fever but did not have a discharge or admission diagnosis of fever (false negatives), 11.8% had a diagnosis of SBI. Overall, 43.2% of febrile infants (and 84.4% of hospitalized infants) with SBI did not have an ICD‐9 discharge or admission diagnosis of fever. Addition of ICD‐9 diagnosis codes of serious infection to the algorithm of discharge or admission diagnosis of fever captured all additional SBIs, and no false negativeinfants missed with this algorithm had an SBI.
DISCUSSION
We described the performance of 4 ICD‐9 diagnosis code case‐identification algorithms for the identification of febrile young infants <90 days of age at US children's hospitals. Although the specificity was high across algorithms and institutions, the sensitivity was relatively low, particularly for discharge diagnosis of fever, and varied by institution. Given the high specificity, ICD‐9 diagnosis code case‐identification algorithms for fever reliably identify febrile infants using administrative data with low rates of inclusion of infants without fever. However, underidentification of patients, particularly those more prone to SBIs and severe outcomes depending on the algorithm utilized, can impact interpretation of comparative effectiveness studies or the quality of care delivered by an institution.
ICD‐9 discharge diagnosis codes are frequently used to identify pediatric patients across a variety of administrative databases, diseases, and symptoms.[19, 27, 28, 29, 30, 31] Although discharge diagnosis of fever is highly specific, sensitivity is substantially lower than other case‐identification algorithms we studied, particularly for hospitalized infants. This may be due to a fever code sometimes being omitted in favor of a more specific diagnosis (eg, bacteremia) prior to hospital discharge. Therefore, case identification relying only on ICD‐9 discharge diagnosis codes for fever may under‐report clinically important SBI or severe outcomes as demonstrated in our study. This is in contrast to ICD‐9 diagnosis code identification strategies for childhood UTI and pneumonia, which largely have higher sensitivity but lower specificity than fever codes.[13, 14]
Admission diagnosis of fever is important for febrile infants as they may not have an explicit diagnosis at the time of disposition from the ED. Addition of admission diagnosis of fever to an algorithm relying on discharge diagnosis code alone increased sensitivity without a demonstrable reduction in specificity and PPV, likely due to capture of infants with a fever diagnosis at presentation before a specific infection was identified. Although using an algorithm of discharge or admission diagnosis of fever captured a higher percentage of hospitalized febrile infants with SBIs, sensitivity was only 71% overall with this algorithm, and 43% of febrile infants with SBI would still have been missed. Importantly, though, addition of various ICD‐9 codes for serious infection to this algorithm resulted in capture of all febrile infants with SBI and should be used as a sensitivity analysis.
The test characteristics of diagnosis codes were highest in the 29‐ to 56‐days‐old age group. Given the differing low‐risk criteria[6, 7, 8] and lack of best practice guidelines[16] in this age group, the use of administrative data may allow for the comparison of testing and treatment strategies across a large cohort of febrile infants aged 29 to 56 days. However, individual hospital coding practices may affect algorithm performance, in particular sensitivity, which varied substantially by hospital. This variation in algorithm sensitivity may impact comparisons of outcomes across institutions. Therefore, when conducting studies of febrile infants using administrative data, sensitivity analyses or use of chart review should be considered to augment the use of ICD‐9 code‐based identification strategies, particularly for comparative benchmarking and outcomes studies. These additional analyses are particularly important for studies of febrile infants >56 days of age, in whom the sensitivity of diagnosis codes is particularly low. We speculate that the lower sensitivity in older febrile infants may relate to a lack of consensus on the clinical significance of fever in this age group and the varying management strategies employed.[10]
Strengths of this study include the assessment of ICD‐9 code algorithms across multiple institutions for identification of fever in young infants, and the patterns of our findings remained robust when comparing median performance characteristics of the algorithms across hospitals to our overall findings. We were also able to accurately estimate PPV and NPV using a case‐identification strategy weighted to the actual population sizes. Although sensitivity and specificity are the primary measures of test performance, predictive values are highly informative for investigators using administrative data. Additionally, our findings may inform public health efforts including disease surveillance, assessment of seasonal variation, and identification and monitoring of healthcare‐associated infections among febrile infants.
Our study has limitations. We did not review all identified records, which raises the possibility that our evaluated cohort may not be representative of the entire febrile infant population. We attempted to mitigate this possibility by using a random sampling strategy for our population selection that was weighted to the actual population sizes. Second, we identified serious infections using ICD‐9 diagnosis codes determined by group consensus, which may not capture all serious infection codes that identify febrile infants whose fever code was omitted. Third, 47 infants had abnormal temperature that did not meet our reference standard criteria for fever and were included in the no fever group. Although there may be disagreement regarding what constitutes a fever, we used a widely accepted reference standard to define fever.[16] Further, inclusion of these 47 infants as fever did not materially change algorithm performance. Last, our study was conducted at 8 large tertiary‐care children's hospitals, and our results may not be generalizable to other children's hospitals and community‐based hospitals.
CONCLUSIONS
Studies of febrile young infants that rely on ICD‐9 discharge diagnosis code of fever for case ascertainment have high specificity but low sensitivity for the identification of febrile infants, particularly among hospitalized patients. A case‐identification strategy that includes discharge or admission diagnosis of fever demonstrated higher sensitivity, and should be considered for studies of febrile infants using administrative data. However, additional strategies such as incorporation of ICD‐9 codes for serious infection should be used when comparing outcomes across institutions.
Acknowledgements
The Febrile Young Infant Research Collaborative includes the following additional collaborators who are acknowledged for their work on this study: Erica DiLeo, MA, Department of Medical Education and Research, Danbury Hospital, Danbury, Connecticut; Janet Flores, BS, Division of Emergency Medicine, Ann and Robert H. Lurie Children's Hospital of Chicago, Chicago, Illinois.
Disclosures: This project funded in part by The Gerber Foundation Novice Researcher Award, (Ref No. 1827‐3835). Dr. Fran Balamuth received career development support from the National Institutes of Health (NHLBI K12‐HL109009). Funders were not involved in the design or conduct of the study; collection, management, analysis, or interpretation of the data; or preparation, review, or approval of the manuscript. The authors have no conflicts of interest relevant to this article to disclose.
- . The prevalence of serious bacterial infections by age in febrile infants during the first 3 months of life. Pediatr Ann. 1993;22:462–466.
- , , . Performance of low‐risk criteria in the evaluation of young infants with fever: review of the literature. Pediatrics. 2010;125:228–233.
- , , , , , . A week‐by‐week analysis of the low‐risk criteria for serious bacterial infection in febrile neonates. Arch Dis Child. 2009;94:287–292.
- , , , et al. Is 15 days an appropriate cut‐off age for considering serious bacterial infection in the management of febrile infants? Pediatr Infect Dis J. 2012;31:455–458.
- , , . Failure of infant observation scales in detecting serious illness in febrile, 4‐ to 8‐week‐old infants. Pediatrics. 1990;85:1040–1043.
- , , . Outpatient management without antibiotics of fever in selected infants. N Engl J Med. 1993;329:1437–1441.
- , , . Identifying febrile infants at risk for a serious bacterial infection. J Pediatr. 1993;123:489–490.
- , , , et al. Febrile infants at low risk for serious bacterial infection—an appraisal of the Rochester criteria and implications for management. Febrile Infant Collaborative Study Group. Pediatrics. 1994;94:390–396.
- , , , et al. Management of febrile neonates in US pediatric emergency departments. Pediatrics. 2014;133:187–195.
- , , , et al. Variation in care of the febrile young infant <90 days in US pediatric emergency departments. Pediatrics. 2014;134:667–677.
- , , , et al. Association of clinical practice guidelines with emergency department management of febrile infants ≤56 days of age. J Hosp Med. 2015;10:358–365.
- , , , et al. Diagnosis and management of febrile infants (0‐3 months). Evid Rep Technol Assess (Full Rep). 2012;(205):1–297.
- , , , et al. Accuracy of administrative billing codes to detect urinary tract infection hospitalizations. Pediatrics. 2011;128:323–330.
- , , , et al. Identifying pediatric community‐acquired pneumonia hospitalizations: accuracy of administrative billing codes. JAMA Pediatr. 2013;167:851–858.
- , , , , , . Development and use of reporting guidelines for assessing the quality of validation studies of health administrative data. J Clin Epidemiol. 2011;64:821–829.
- American College of Emergency Physicians Clinical Policies Committee; American College of Emergency Physicians Clinical Policies Subcommittee on Pediatric Fever. Clinical policy for children younger than three years presenting to the emergency department with fever. Ann Emerg Med. 2003;42:530–545.
- , , , , , . Variation in occult injury screening for children with suspected abuse in selected US children's hospitals. Pediatrics. 2012;130:853–860.
- . Achieving data quality. How data from a pediatric health information system earns the trust of its users. J AHIMA. 2004;75:22–26.
- , , , . Corticosteroids and mortality in children with bacterial meningitis. JAMA. 2008;299:2048–2055.
- , , , , , . Research electronic data capture (REDCap)—a metadata‐driven methodology and workflow process for providing translational research informatics support. J Biomed Inform. 2009;42:377–381.
- , , , , , . Deaths attributed to pediatric complex chronic conditions: national trends and implications for supportive care services. Pediatrics. 2001;107:E99.
- US Census Bureau. Geographic terms and concepts—census divisions and census regions. Available at: https://www.census.gov/geo/reference/gtc/gtc_census_divreg.html. Accessed October 20, 2014.
- , , , . Initial emergency department diagnosis and return visits: risk versus perception. Ann Emerg Med. 1998;32:569–573.
- , , , , . A national depiction of children with return visits to the emergency department within 72 hours, 2001–2007. Pediatr Emerg Care. 2012;28:606–610.
- , , , et al. Pediatric observation status: are we overlooking a growing population in children's hospitals? J Hosp Med. 2012;7:530–536.
- , , , et al. Differences in designations of observation care in US freestanding children's hospitals: are they virtual or real? J Hosp Med. 2012;7:287–293.
- , , , , . Trends in the management of viral meningitis at United States children's hospitals. Pediatrics. 2013;131:670–676.
- , , , et al. Impact of increasing ondansetron use on clinical outcomes in children with gastroenteritis. JAMA Pediatr. 2014;168:321–329.
- , , , , . Race, otitis media, and antibiotic selection. Pediatrics. 2014;134:1059–1066.
- , , , et al. Establishing benchmarks for the hospitalized care of children with asthma, bronchiolitis, and pneumonia. Pediatrics. 2014;134:555–562.
- , , , , . Diagnostic testing and treatment of pediatric headache in the emergency department. J Pediatr. 2013;163:1634–1637.
Fever is one of the most common reasons for emergency department (ED) evaluation of infants under 90 days of age.[1] Up to 10% to 20% of febrile young infants will have a serious bacterial infection (SBI),[2, 3, 4] but infants with SBI are difficult to distinguish from those without SBI based upon symptoms and physical examination findings alone.[5] Previously developed clinical prediction algorithms can help to identify febrile infants at low risk for SBI, but differ in age range as well as recommendations for testing and empiric treatment.[6, 7, 8] Consequently, there is widespread variation in management of febrile young infants at US children's hospitals,[9, 10, 11] and defining optimal management strategies remains an important issue in pediatric healthcare.[12] Administrative datasets are convenient and inexpensive, and can be used to evaluate practice variation, trends, and outcomes of a large, diverse group of patients within and across institutions.[9, 10] Accurately identifying febrile infants evaluated for suspected SBI in administrative databases would facilitate comparative effectiveness research, quality improvement initiatives, and institutional benchmarking.
Prior studies have validated the accuracy of administrative billing codes for identification of other common childhood illnesses, including urinary tract infection (UTI)[13] and pneumonia.[14] The accuracy of International Classification of Diseases, Ninth Revision (ICD‐9) diagnosis codes in identifying febrile young infants evaluated for SBI is not known. Reliance on administrative ICD‐9 diagnosis codes for patient identification can lead to misclassification of patients due to variable database quality, the validity of the diagnosis codes being utilized, and hospital coding practices.[15] Additionally, fever is a symptom and not a specific diagnosis. If a particular bacterial or viral diagnosis is established (eg, enterovirus meningitis), a discharge diagnosis of fever may not be attributed to the patient encounter. Thus, evaluating the performance characteristics and capture of clinical outcomes of different combinations of ICD‐9 diagnosis codes for identifying febrile infants is necessary for both the conduct and interpretation of studies that utilize administrative databases. The primary objective of this investigation was to identify the most accurate ICD‐9 coding strategies for the identification of febrile infants aged <90 days using administrative data. We also sought to evaluate capture of clinically important outcomes across identification strategies.
METHODS
Study Design and Setting
For this multicenter retrospective study, we used the Pediatric Health Information System (PHIS) database to identify infants <90 days of age[16] who presented between July 1, 2012 and June 30, 2013 to 1 of 8 EDs. We assessed performance characteristics of ICD‐9 diagnosis code case‐identification algorithms by comparing ICD‐9 code combinations to a fever reference standard determined by medical record review. The institutional review board at each participating site approved the study protocol.
Data Source
Data were obtained from 2 sources: the PHIS database and medical record review. We used the PHIS database to identify eligible patients by ICD‐9 diagnosis codes; patient encounters were randomly selected using a random number generator. The PHIS database contains demographic, diagnosis, and billing data from 44 hospitals affiliated with the Children's Hospital Association (Overland Park, Kansas) and represents 85% of freestanding children's hospitals in the United States.[17] Data are deidentified; encrypted unique patient identifiers permit tracking of patients across visits within a site.[18] The Children's Hospital Association and participating hospitals jointly assure the quality and integrity of the data.[19]
For each patient encounter identified in the PHIS database, detailed medical record review was performed by trained investigators at each of the 8 study sites (see Supporting Information, Appendix, in the online version of this article). A standardized data collection instrument was pilot tested by all investigators prior to use. Data were collected and managed using the Research Electronic Data Capture (REDCap) tool hosted at Boston Children's Hospital.[20]
Exclusions
Using PHIS data, prior to medical record review we excluded infants with a complex chronic condition as defined previously[21] and those transferred from another institution, as these infants may warrant a nonstandard evaluation and/or may have incomplete data.
ICD‐9 Diagnosis Code Groups
In the PHIS database, all patients discharged from the hospital (including hospitalized patients as well as patients discharged from the ED) receive 1 or more ICD‐9 discharge diagnosis codes. These diagnosis codes are ascribed after discharge from the hospital, or for ED patients, after ED discharge. Additionally, patients may receive an admission diagnosis, which reflects the diagnosis ascribed at the time of ED discharge or transfer to the inpatient unit.
We reviewed medical records of infants selected from the following ICD‐9 diagnosis code groups (Figure 1): (1) discharge diagnosis code of fever (780.6 [fever and other physiologic disturbances of temperature regulation], 778.4 [other disturbances of temperature regulation of newborn], 780.60 [fever, unspecified], or 780.61 [fever presenting with conditions classified elsewhere])[9, 10] regardless of the presence of admission diagnosis of fever or diagnosis of serious infection, (2) admission diagnosis code of fever without associated discharge diagnosis code of fever,[10] (3) discharge diagnosis code of serious infection determined a priori (see Supporting Information, Appendix, in the online version of this article) without discharge or admission diagnosis code of fever, and (4) infants without any diagnosis code of fever or serious infection.
Medical records reviewed in each of the 4 ICD‐9 diagnosis code groups were randomly selected from the overall set of ED encounters in the population of infants <90 days of age evaluated during the study period. Twenty‐five percent population sampling was used for 3 of the ICD‐9 diagnosis code groups, whereas 5% sampling was used for the no fever/no serious infection code group. The number of medical records reviewed in each ICD‐9 diagnosis code group was proportional to the distribution of ICD‐9 codes across the entire population of infants <90 days of age. These records were distributed equally across sites (228 records per site), except for 1 site that does not assign admission diagnoses (201 records).
Investigators were blinded to ICD‐9 diagnosis code groups during medical record review. Infants with multiple visits during the study period were eligible to be included more than once if the visits occurred more than 3 days apart. For infants with more than 1 ED visit on a particular calendar day, investigators were instructed to review the initial visit.
For each encounter, we also abstracted demographic characteristics (gender, race/ethnicity), insurance status, hospital region (using US Census categories[22]), and season from the PHIS database.
Reference Standard
The presence of fever was determined by medical record review. We defined fever as any documented temperature 100.4F (38.0C) at home or in the ED.[16]
ICD‐9 Code Case‐Identification Algorithms
Using the aforementioned ICD‐9 diagnosis code groups individually and in combination, the following 4 case‐identification algorithms, determined from prior study or group consensus, were compared to the reference standard: (1) ICD‐9 discharge diagnosis code of fever,[9] (2) ICD‐9 admission or discharge diagnosis code of fever,[10, 11] (3) ICD‐9 discharge diagnosis code of fever or serious infection, and (4) ICD‐9 discharge or admission diagnosis code of fever or serious infection. Algorithms were compared overall, separately for discharged and hospitalized infants, and across 3 distinct age groups (28 days, 2956 days, and 5789 days).
Patient‐Level Outcomes
To compare differences in outcomes by case‐identification algorithm, from the PHIS database we abstracted hospitalization rates, rates of UTI/pyelonephritis,[13] bacteremia/sepsis, and bacterial meningitis.[19] Severe outcomes were defined as intensive care unit admission, mechanical ventilation, central line placement, receipt of extracorporeal membrane oxygenation, or death. We assessed hospital length of stay for admitted infants and 3‐day revisits,[23, 24] and revisits resulting in hospitalization for infants discharged from the ED at the index visit. Patients billed for observation care were classified as being hospitalized.[25, 26]
Data Analysis
Accuracy of the 4 case‐identification algorithms (compared with the reference standard) was calculated using sensitivity, specificity, negative predictive value (NPV), and positive predictive value (PPV), along with 95% confidence interval (CI). Prior to analysis, a 5‐fold weighting factor was applied to the no fever/no serious infection group to account for the differential sampling used for this group (5% vs 25% for the other 3 ICD‐9 diagnosis code groups). This weighting was done to approximate the true prevalence of each ICD‐9 code group within the larger population, so that an accurate rate of false negatives (infants with fever who had neither a diagnosis of fever nor serious infection) could be calculated.
We described continuous variables using median and interquartile range or range values and categorical variables using frequencies with 95% CIs. We compared categorical variables using a 2 test. We determined statistical significance as a 2‐tailed P value <0.05. Statistical analyses were performed using SAS version 9.3 (SAS Institute, Cary, NC).
RESULTS
Study Patients
During the 1‐year study period, 23,753 ED encounters for infants <90 days of age were identified in the PHIS database at the 8 participating sites. Of these infant encounters, 2166 (9.2%) were excluded (1658 infants who had a complex chronic condition and 508 transferred into the ED), leaving 21,587 infants available for selection. After applying our sampling strategy, we identified 1797 encounters for medical record review. Seven encounters from 3 hospitals with missing medical records were excluded, resulting in a final cohort of 1790 encounters (Figure 1). Among included infants, 552 (30.8%) were 28 days, 743 (41.5%) were 29 to 56 days, and 495 (27.8%) were 57 to 89 days of age; 737 (41.2%) infants were hospitalized. Patients differed in age, race, payer, and season across ICD‐9 diagnosis code groups (see Supporting Information, Table 1, in the online version of this article).
| ICD‐9 Diagnosis Code Algorithm | Overall | |||
|---|---|---|---|---|
| Sensitivity, % (95% CI) | Specificity, % (95% CI) | Negative Predictive Value, % (95% CI) | Positive Predictive Value, % (95% CI) | |
| ||||
| Discharge diagnosis of fever | 53.2 (50.056.4) | 98.2 (97.898.6) | 90.8 (90.091.6) | 86.1 (83.388.9) |
| Hospitalized | 47.3 (43.151.5) | 97.7 (96.998.5) | 80.6 (78.682.6) | 90.2 (86.893.6) |
| Discharged from ED | 61.4 (56.666.2) | 98.4 (98.098.8) | 95.4 (94.796.1) | 82.1 (77.786.5) |
| Discharge or admission diagnosis of Fever | 71.1 (68.274.0) | 97.7 (97.398.1) | 94.1 (93.494.8) | 86.9 (84.589.3) |
| Hospitalized | 72.5 (68.876.2) | 97.1 (96.298.0) | 88.8 (87.190.5) | 91.7 (89.194.3) |
| Discharged from ED | 69.2 (64.773.7) | 98.0 (97.598.5) | 96.3 (95.796.9) | 80.8 (76.685.0) |
| Discharge diagnosis of fever or serious infection | 63.7 (60.666.8) | 96.5 (96.097.0) | 92.6 (91.893.4) | 79.6 (76.782.5) |
| Hospitalized | 63.9 (59.967.9) | 92.5 (91.094.0) | 85.1 (83.287.0) | 79.1 (75.382.9) |
| Discharged from ED | 63.4 (58.768.1) | 98.1 (97.698.6) | 95.6 (94.996.3) | 80.2 (75.884.6) |
| Discharge or admission diagnosis of fever or serious infection | 76.6 (73.979.3) | 96.2 (95.696.8) | 95.1 (94.595.7) | 81.0 (78.483.6) |
| Hospitalized | 80.8 (77.584.1) | 92.1 (90.693.6) | 91.5 (89.993.1) | 82.1 (78.985.3) |
| Discharged from ED | 71.0 (66.575.5) | 97.7 (97.298.2) | 96.5 (95.997.1) | 79.4 (75.283.6) |
Among the 1790 patient encounters reviewed, a total of 766 infants (42.8%) met the reference standard definition for fever in the cohort. An additional 47 infants had abnormal temperature reported (documentation of tactile fever, history of fever without a specific temperature described, or hypothermia) but were classified as having no fever by the reference standard.
ICD‐9 Code Case‐Identification Algorithm Performance
Compared with the reference standard, the 4 case‐identification algorithms demonstrated specificity of 96.2% to 98.2% but lower sensitivity overall (Figure 2). Discharge diagnosis of fever alone demonstrated the lowest sensitivity. The algorithm of discharge or admission diagnosis of fever resulted in increased sensitivity and the highest PPV of all 4 algorithms (86.9%, 95% CI: 84.5‐89.3). Addition of serious infection codes to this algorithm resulted in a marginal increase in sensitivity and a similar decrease in PPV (Table 1). When limited to hospitalized infants, specificity was highest for the case‐identification algorithm of discharge diagnosis of fever and similarly high for discharge or admission diagnosis of fever; sensitivity was highest for the algorithm of discharge or admission diagnosis of fever or diagnosis of serious infection. For infants discharged from the ED, algorithm specificity was 97.7% to 98.4%, with lower sensitivity for all 4 algorithms (Table 1). Inclusion of the 47 infants with abnormal temperature as fever did not materially change algorithm performance (data not shown).
Across all 3 age groups (28 days, 2956 days, and 5789 days), the 4 case‐identification algorithms demonstrated specificity >96%, whereas algorithm sensitivity was highest in the 29‐ to 56‐days‐old age group and lowest among infants 57 to 89 days old across all 4 algorithms (Figure 2). Similar to the overall cohort, an algorithm of discharge or admission diagnosis of fever demonstrated specificity of nearly 98% in all age groups; addition of serious infection codes to this algorithm increased sensitivity, highest in the 29‐ to 56‐days‐old age group (Figure 2; see also Supporting Information, Table 2, in the online version of this article).
| ICD‐9 Diagnosis Code Algorithm | Sensitivity, Median % (Range) | Specificity, Median % (Range) | Negative Predictive Value, Median % (Range) | Positive Predictive Value, Median % (Range) |
|---|---|---|---|---|
| ||||
| Discharge diagnosis of fever | 56.2 (34.681.0) | 98.3 (96.499.1) | 92.1 (83.297.4) | 87.7 (74.093.2) |
| Discharge or Admission diagnosis of Fever | 76.7 (51.385.0) | 97.8 (96.298.7) | 95.6 (86.997.4) | 87.4 (80.092.9) |
| Discharge diagnosis of fever or serious infection | 68.3 (44.287.3) | 96.5 (95.498.0) | 93.6 (85.298.2) | 78.3 (74.289.0) |
| Discharge or admission diagnosis of fever or serious infection | 83.1 (58.390.7) | 95.8 (95.498.0) | 96.5 (88.598.2) | 79.1 (77.490.4) |
Across the 8 study sites, median specificity was 95.8% to 98.3% for the 4 algorithms, with little interhospital variability; however, algorithm sensitivity varied widely by site. Median PPV was highest for discharge diagnosis of fever alone at 87.7% but ranged from 74.0% to 93.2% across sites. Median PPV for an algorithm of discharge or admission diagnosis of fever was similar (87.4%) but with less variation by site (range 80.0%92.9%) (Table 2).
Outcomes by ICD‐9 Diagnosis Code Group and Case‐Identification Algorithm
When compared with discharge diagnosis of fever, adding admission diagnosis of fever captured a higher proportion of hospitalized infants with SBIs (UTI/pyelonephritis, bacteremia/sepsis, or bacterial meningitis). However, median hospital length of stay, severe outcomes, and 3‐day revisits and revisits with hospitalization did not materially differ when including infants with admission diagnosis of fever in addition to discharge diagnosis of fever. Addition of infants with a diagnosis code for serious infection substantially increased the number of infants with SBIs and severe outcomes but did not capture additional 3‐day revisits (Table 3). There were no additional cases of SBI in the no fever/no serious illness diagnosis code group.
| ICD‐9 Diagnosis Code Algorithm | Outcome | 3‐Day Revisit, % (95% CI) | 3‐Day Revisit With Hospitalization, % (95% CI) | |||
|---|---|---|---|---|---|---|
| Hospitalized, % (95% CI) | UTI/Pyelonephritis, Bacteremia/Sepsis, or Bacterial Meningitis, % (95% CI) | Severe Outcome, % (95% CI)* | Length of Stay in Days, Median (IQR) | |||
| ||||||
| Discharge diagnosis of fever | 44.3 (40.348.4) | 3.3 (1.84.7) | 1.4 (0.42.3) | 3 (23) | 11.7 (8.215.2) | 5.9 (3.38.4) |
| Discharge or admission diagnosis of fever | 52.4 (48.955.9) | 6.1 (4.47.8) | 1.9 (1.02.9) | 3 (23) | 10.9 (7.714.1) | 5.4 (3.17.8) |
| Discharge diagnosis of fever or serious infection | 54.0 (50.457.5) | 15.3 (12.717.8) | 3.8 (2.55.2) | 3 (24) | 11.0 (7.714.2) | 5.5 (3.17.9) |
| Discharge or admission diagnosis of fever or serious infection | 56.5 (53.259.7) | 12.9 (10.715.1) | 3.6 (2.44.8) | 3 (24) | 10.3 (7.313.3) | 5.2 (3.07.4) |
Among infants who met the reference standard for fever but did not have a discharge or admission diagnosis of fever (false negatives), 11.8% had a diagnosis of SBI. Overall, 43.2% of febrile infants (and 84.4% of hospitalized infants) with SBI did not have an ICD‐9 discharge or admission diagnosis of fever. Addition of ICD‐9 diagnosis codes of serious infection to the algorithm of discharge or admission diagnosis of fever captured all additional SBIs, and no false negativeinfants missed with this algorithm had an SBI.
DISCUSSION
We described the performance of 4 ICD‐9 diagnosis code case‐identification algorithms for the identification of febrile young infants <90 days of age at US children's hospitals. Although the specificity was high across algorithms and institutions, the sensitivity was relatively low, particularly for discharge diagnosis of fever, and varied by institution. Given the high specificity, ICD‐9 diagnosis code case‐identification algorithms for fever reliably identify febrile infants using administrative data with low rates of inclusion of infants without fever. However, underidentification of patients, particularly those more prone to SBIs and severe outcomes depending on the algorithm utilized, can impact interpretation of comparative effectiveness studies or the quality of care delivered by an institution.
ICD‐9 discharge diagnosis codes are frequently used to identify pediatric patients across a variety of administrative databases, diseases, and symptoms.[19, 27, 28, 29, 30, 31] Although discharge diagnosis of fever is highly specific, sensitivity is substantially lower than other case‐identification algorithms we studied, particularly for hospitalized infants. This may be due to a fever code sometimes being omitted in favor of a more specific diagnosis (eg, bacteremia) prior to hospital discharge. Therefore, case identification relying only on ICD‐9 discharge diagnosis codes for fever may under‐report clinically important SBI or severe outcomes as demonstrated in our study. This is in contrast to ICD‐9 diagnosis code identification strategies for childhood UTI and pneumonia, which largely have higher sensitivity but lower specificity than fever codes.[13, 14]
Admission diagnosis of fever is important for febrile infants as they may not have an explicit diagnosis at the time of disposition from the ED. Addition of admission diagnosis of fever to an algorithm relying on discharge diagnosis code alone increased sensitivity without a demonstrable reduction in specificity and PPV, likely due to capture of infants with a fever diagnosis at presentation before a specific infection was identified. Although using an algorithm of discharge or admission diagnosis of fever captured a higher percentage of hospitalized febrile infants with SBIs, sensitivity was only 71% overall with this algorithm, and 43% of febrile infants with SBI would still have been missed. Importantly, though, addition of various ICD‐9 codes for serious infection to this algorithm resulted in capture of all febrile infants with SBI and should be used as a sensitivity analysis.
The test characteristics of diagnosis codes were highest in the 29‐ to 56‐days‐old age group. Given the differing low‐risk criteria[6, 7, 8] and lack of best practice guidelines[16] in this age group, the use of administrative data may allow for the comparison of testing and treatment strategies across a large cohort of febrile infants aged 29 to 56 days. However, individual hospital coding practices may affect algorithm performance, in particular sensitivity, which varied substantially by hospital. This variation in algorithm sensitivity may impact comparisons of outcomes across institutions. Therefore, when conducting studies of febrile infants using administrative data, sensitivity analyses or use of chart review should be considered to augment the use of ICD‐9 code‐based identification strategies, particularly for comparative benchmarking and outcomes studies. These additional analyses are particularly important for studies of febrile infants >56 days of age, in whom the sensitivity of diagnosis codes is particularly low. We speculate that the lower sensitivity in older febrile infants may relate to a lack of consensus on the clinical significance of fever in this age group and the varying management strategies employed.[10]
Strengths of this study include the assessment of ICD‐9 code algorithms across multiple institutions for identification of fever in young infants, and the patterns of our findings remained robust when comparing median performance characteristics of the algorithms across hospitals to our overall findings. We were also able to accurately estimate PPV and NPV using a case‐identification strategy weighted to the actual population sizes. Although sensitivity and specificity are the primary measures of test performance, predictive values are highly informative for investigators using administrative data. Additionally, our findings may inform public health efforts including disease surveillance, assessment of seasonal variation, and identification and monitoring of healthcare‐associated infections among febrile infants.
Our study has limitations. We did not review all identified records, which raises the possibility that our evaluated cohort may not be representative of the entire febrile infant population. We attempted to mitigate this possibility by using a random sampling strategy for our population selection that was weighted to the actual population sizes. Second, we identified serious infections using ICD‐9 diagnosis codes determined by group consensus, which may not capture all serious infection codes that identify febrile infants whose fever code was omitted. Third, 47 infants had abnormal temperature that did not meet our reference standard criteria for fever and were included in the no fever group. Although there may be disagreement regarding what constitutes a fever, we used a widely accepted reference standard to define fever.[16] Further, inclusion of these 47 infants as fever did not materially change algorithm performance. Last, our study was conducted at 8 large tertiary‐care children's hospitals, and our results may not be generalizable to other children's hospitals and community‐based hospitals.
CONCLUSIONS
Studies of febrile young infants that rely on ICD‐9 discharge diagnosis code of fever for case ascertainment have high specificity but low sensitivity for the identification of febrile infants, particularly among hospitalized patients. A case‐identification strategy that includes discharge or admission diagnosis of fever demonstrated higher sensitivity, and should be considered for studies of febrile infants using administrative data. However, additional strategies such as incorporation of ICD‐9 codes for serious infection should be used when comparing outcomes across institutions.
Acknowledgements
The Febrile Young Infant Research Collaborative includes the following additional collaborators who are acknowledged for their work on this study: Erica DiLeo, MA, Department of Medical Education and Research, Danbury Hospital, Danbury, Connecticut; Janet Flores, BS, Division of Emergency Medicine, Ann and Robert H. Lurie Children's Hospital of Chicago, Chicago, Illinois.
Disclosures: This project funded in part by The Gerber Foundation Novice Researcher Award, (Ref No. 1827‐3835). Dr. Fran Balamuth received career development support from the National Institutes of Health (NHLBI K12‐HL109009). Funders were not involved in the design or conduct of the study; collection, management, analysis, or interpretation of the data; or preparation, review, or approval of the manuscript. The authors have no conflicts of interest relevant to this article to disclose.
- . The prevalence of serious bacterial infections by age in febrile infants during the first 3 months of life. Pediatr Ann. 1993;22:462–466.
- , , . Performance of low‐risk criteria in the evaluation of young infants with fever: review of the literature. Pediatrics. 2010;125:228–233.
- , , , , , . A week‐by‐week analysis of the low‐risk criteria for serious bacterial infection in febrile neonates. Arch Dis Child. 2009;94:287–292.
- , , , et al. Is 15 days an appropriate cut‐off age for considering serious bacterial infection in the management of febrile infants? Pediatr Infect Dis J. 2012;31:455–458.
- , , . Failure of infant observation scales in detecting serious illness in febrile, 4‐ to 8‐week‐old infants. Pediatrics. 1990;85:1040–1043.
- , , . Outpatient management without antibiotics of fever in selected infants. N Engl J Med. 1993;329:1437–1441.
- , , . Identifying febrile infants at risk for a serious bacterial infection. J Pediatr. 1993;123:489–490.
- , , , et al. Febrile infants at low risk for serious bacterial infection—an appraisal of the Rochester criteria and implications for management. Febrile Infant Collaborative Study Group. Pediatrics. 1994;94:390–396.
- , , , et al. Management of febrile neonates in US pediatric emergency departments. Pediatrics. 2014;133:187–195.
- , , , et al. Variation in care of the febrile young infant <90 days in US pediatric emergency departments. Pediatrics. 2014;134:667–677.
- , , , et al. Association of clinical practice guidelines with emergency department management of febrile infants ≤56 days of age. J Hosp Med. 2015;10:358–365.
- , , , et al. Diagnosis and management of febrile infants (0‐3 months). Evid Rep Technol Assess (Full Rep). 2012;(205):1–297.
- , , , et al. Accuracy of administrative billing codes to detect urinary tract infection hospitalizations. Pediatrics. 2011;128:323–330.
- , , , et al. Identifying pediatric community‐acquired pneumonia hospitalizations: accuracy of administrative billing codes. JAMA Pediatr. 2013;167:851–858.
- , , , , , . Development and use of reporting guidelines for assessing the quality of validation studies of health administrative data. J Clin Epidemiol. 2011;64:821–829.
- American College of Emergency Physicians Clinical Policies Committee; American College of Emergency Physicians Clinical Policies Subcommittee on Pediatric Fever. Clinical policy for children younger than three years presenting to the emergency department with fever. Ann Emerg Med. 2003;42:530–545.
- , , , , , . Variation in occult injury screening for children with suspected abuse in selected US children's hospitals. Pediatrics. 2012;130:853–860.
- . Achieving data quality. How data from a pediatric health information system earns the trust of its users. J AHIMA. 2004;75:22–26.
- , , , . Corticosteroids and mortality in children with bacterial meningitis. JAMA. 2008;299:2048–2055.
- , , , , , . Research electronic data capture (REDCap)—a metadata‐driven methodology and workflow process for providing translational research informatics support. J Biomed Inform. 2009;42:377–381.
- , , , , , . Deaths attributed to pediatric complex chronic conditions: national trends and implications for supportive care services. Pediatrics. 2001;107:E99.
- US Census Bureau. Geographic terms and concepts—census divisions and census regions. Available at: https://www.census.gov/geo/reference/gtc/gtc_census_divreg.html. Accessed October 20, 2014.
- , , , . Initial emergency department diagnosis and return visits: risk versus perception. Ann Emerg Med. 1998;32:569–573.
- , , , , . A national depiction of children with return visits to the emergency department within 72 hours, 2001–2007. Pediatr Emerg Care. 2012;28:606–610.
- , , , et al. Pediatric observation status: are we overlooking a growing population in children's hospitals? J Hosp Med. 2012;7:530–536.
- , , , et al. Differences in designations of observation care in US freestanding children's hospitals: are they virtual or real? J Hosp Med. 2012;7:287–293.
- , , , , . Trends in the management of viral meningitis at United States children's hospitals. Pediatrics. 2013;131:670–676.
- , , , et al. Impact of increasing ondansetron use on clinical outcomes in children with gastroenteritis. JAMA Pediatr. 2014;168:321–329.
- , , , , . Race, otitis media, and antibiotic selection. Pediatrics. 2014;134:1059–1066.
- , , , et al. Establishing benchmarks for the hospitalized care of children with asthma, bronchiolitis, and pneumonia. Pediatrics. 2014;134:555–562.
- , , , , . Diagnostic testing and treatment of pediatric headache in the emergency department. J Pediatr. 2013;163:1634–1637.
© 2015 Society of Hospital Medicine
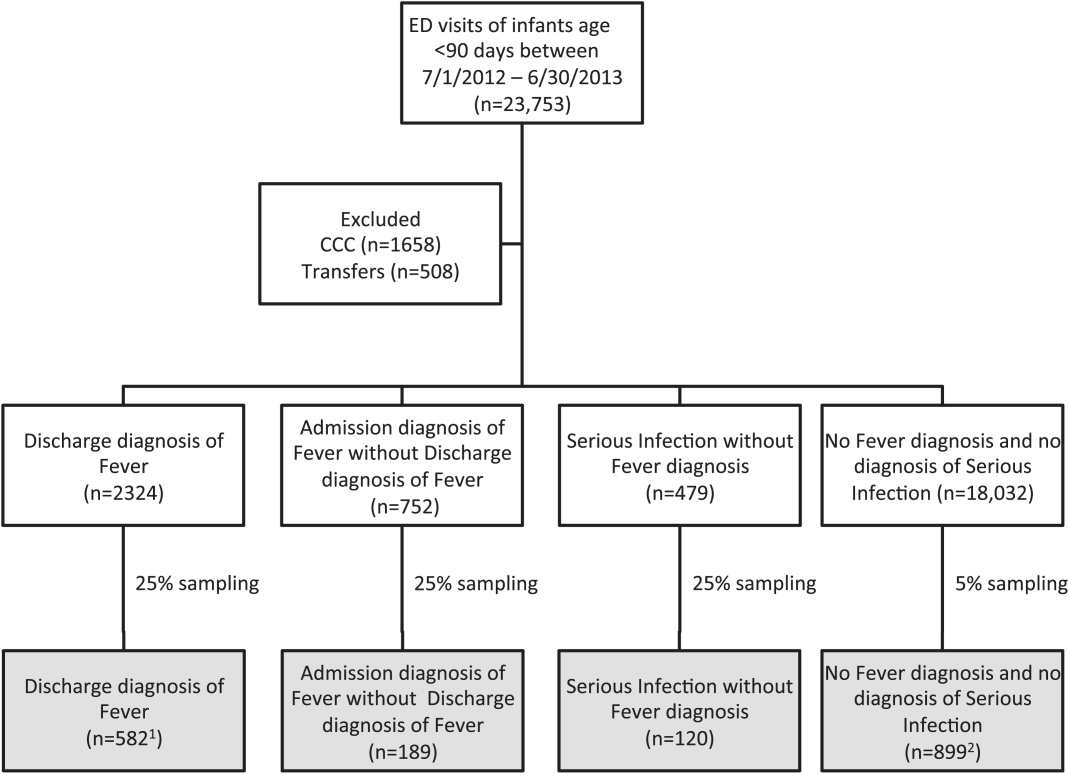
Febrile Infant CPGs
Febrile young infants are at high risk for serious bacterial infection (SBI) with reported rates of 8.5% to 12%, even higher in neonates 28 days of age.[1, 2, 3] As a result, febrile infants often undergo extensive diagnostic evaluation consisting of a combination of urine, blood, and cerebrospinal fluid (CSF) testing.[4, 5, 6] Several clinical prediction algorithms use this diagnostic testing to identify febrile infants at low risk for SBI, but they differ with respect to age range, recommended testing, antibiotic administration, and threshold for hospitalization.[4, 5, 6] Additionally, the optimal management strategy for this population has not been defined.[7] Consequently, laboratory testing, antibiotic use, and hospitalization for febrile young infants vary widely among hospitals.[8, 9, 10]
Clinical practice guidelines (CPGs) are designed to implement evidence‐based care and reduce practice variability, with the goal of improving quality of care and optimizing costs.[11] Implementation of a CPG for management of febrile young infants in the Intermountain Healthcare System was associated with greater adherence to evidence‐based care and lower costs.[12] However, when strong evidence is lacking, different interpretations of febrile infant risk classification incorporated into local CPGs may be a major driver of the across‐hospital practice variation observed in prior studies.[8, 9] Understanding sources of variability as well as determining the association of CPGs with clinicians' practice patterns can help identify quality improvement opportunities, either through national benchmarking or local efforts.
Our primary objectives were to compare (1) recommendations of pediatric emergency departmentbased institutional CPGs for febrile young infants and (2) rates of urine, blood, CSF testing, hospitalization, and ceftriaxone use at emergency department (ED) discharge based upon CPG presence and the specific CPG recommendations. Our secondary objectives were to describe the association of CPGs with healthcare costs and return visits for SBI.
METHODS
Study Design
We used the Pediatric Health Information System (PHIS) to identify febrile infants 56 days of age who presented to the ED between January 1, 2013 and December 31, 2013. We also surveyed ED providers at participating PHIS hospitals. Informed consent was obtained from survey respondents. The institutional review board at Boston Children's Hospital approved the study protocol.
Clinical Practice Guideline Survey
We sent an electronic survey to medical directors or division directors at 37 pediatric EDs to determine whether their ED utilized a CPG for the management of the febrile young infant in 2013. If no response was received after the second attempt, we queried ED fellowship directors or other ED attending physicians at nonresponding hospitals. Survey items included the presence of a febrile young infant CPG, and if present, the year of implementation, ages targeted, and CPG content. As applicable, respondents were asked to share their CPG and/or provide the specific CPG recommendations.
We collected and managed survey data using the Research Electronic Data Capture (REDCap) electronic data capture tools hosted at Boston Children's Hospital. REDCap is a secure, Web‐based application designed to support data capture for research studies.[13]
Data Source
The PHIS database contains administrative data from 44 US children's hospitals. These hospitals, affiliated with the Children's Hospital Association, represent 85% of freestanding US children's hospitals.[14] Encrypted patient identifiers permit tracking of patients across encounters.[15] Data quality and integrity are assured jointly by the Children's Hospital Association and participating hospitals.[16] For this study, 7 hospitals were excluded due to incomplete ED data or known data‐quality issues.[17]
Patients
We identified study infants using the following International Classification of Diseases, 9th Revision (ICD‐9) admission or discharge diagnosis codes for fever as defined previously[8, 9]: 780.6, 778.4, 780.60, or 780.61. We excluded infants with a complex chronic condition[18] and those transferred from another institution, as these infants may warrant a nonstandard evaluation and/or may have incomplete data. For infants with >1 ED visit for fever during the study period, repeat visits within 3 days of an index visit were considered a revisit for the same episode of illness; visits >3 days following an index visit were considered as a new index visit.
Study Definitions
From the PHIS database, we abstracted demographic characteristics (gender, race/ethnicity), insurance status, and region where the hospital was located (using US Census categories[19]). Billing codes were used to assess whether urine, blood, and CSF testing (as defined previously[9]) were performed during the ED evaluation. To account for ED visits that spanned the midnight hour, for hospitalized patients we considered any testing or treatment occurring on the initial or second hospital day to be performed in the ED; billing code data in PHIS are based upon calendar day and do not distinguish testing performed in the ED versus inpatient setting.[8, 9] Patients billed for observation care were classified as being hospitalized.[20, 21]
We identified the presence of an SBI using ICD‐9 diagnosis codes for the following infections as described previously[9]: urinary tract infection or pyelonephritis,[22] bacteremia or sepsis, bacterial meningitis,[16] pneumonia,[23] or bacterial enteritis. To assess return visits for SBI that required inpatient management, we defined an ED revisit for an SBI as a return visit within 3 days of ED discharge[24, 25] that resulted in hospitalization with an associated ICD‐9 discharge diagnosis code for an SBI.
Hospitals charges in PHIS database were adjusted for hospital location by using the Centers for Medicare and Medicaid Services price/wage index. Costs were estimated by applying hospital‐level cost‐to‐charge ratios to charge data.[26]
Measured Exposures
The primary exposure was the presence of an ED‐based CPG for management of the febrile young infant aged 28 days and 29 to 56 days; 56 days was used as the upper age limit as all of the CPGs included infants up to this age or beyond. Six institutions utilized CPGs with different thresholds to define the age categories (eg, dichotomized at 27 or 30 days); these CPGs were classified into the aforementioned age groups to permit comparisons across standardized age groups. We classified institutions based on the presence of a CPG. To assess differences in the application of low‐risk criteria, the CPGs were further classified a priori based upon specific recommendations around laboratory testing and hospitalization, as well as ceftriaxone use for infants aged 29 to 56 days discharged from the ED. CPGs were categorized based upon whether testing, hospitalization, and ceftriaxone use were: (1) recommended for all patients, (2) recommended only if patients were classified as high risk (absence of low‐risk criteria), (3) recommended against, or (4) recommended to consider at clinician discretion.
Outcome Measures
Measured outcomes were performance of urine, blood, CSF testing, and hospitalization rate, as well as rate of ceftriaxone use for discharged infants aged 29 to 56 days, 3‐day revisits for SBI, and costs per visit, which included hospitalization costs for admitted patients.
Data Analysis
We described continuous variables using median and interquartile range or range values and categorical variables using frequencies. We compared medians using Wilcoxon rank sum and categorical variables using a [2] test. We compared rates of testing, hospitalization, ceftriaxone use, and 3‐day revisits for SBI based on the presence of a CPG, and when present, the specific CPG recommendations. Costs per visit were compared between institutions with and without CPGs and assessed separately for admitted and discharged patients. To adjust for potential confounders and clustering of patients within hospitals, we used generalized estimating equations with logistic regression to generate adjusted odd ratios (aORs) and 95% confidence intervals (CIs). Models were adjusted for geographic region, payer, race, and gender. Statistical analyses were performed by using SAS version 9.3 (SAS Institute, Cary, NC). We determined statistical significance as a 2‐tailed P value <0.05.
Febrile infants with bronchiolitis or a history of prematurity may be managed differently from full‐term febrile young infants without bronchiolitis.[6, 27] Therefore, we performed a subgroup analysis after exclusion of infants with an ICD‐9 discharge diagnosis code for bronchiolitis (466.11 and 466.19)[28] or prematurity (765).
Because our study included ED encounters in 2013, we repeated our analyses after exclusion of hospitals with CPGs implemented during the 2013 calendar year.
RESULTS
CPG by Institution
Thirty‐three (89.2%) of the 37 EDs surveyed completed the questionnaire. Overall, 21 (63.6%) of the 33 EDs had a CPG; 15 (45.5%) had a CPG for all infants 56 days of age, 5 (15.2%) had a CPG for infants 28 days only, and 1 (3.0%) had a CPG for infants 29 to 56 days but not 28 days of age (Figure 1). Seventeen EDs had an established CPG prior to 2013, and 4 hospitals implemented a CPG during the 2013 calendar year, 2 with CPGs for neonates 28 days and 2 with CPGs for both 28 days and 29 to 56 days of age. Hospitals with CPGs were more likely to be located in the Northeast and West regions of the United States and provide care to a higher proportion of non‐Hispanic white patients, as well as those with commercial insurance (Table 1).
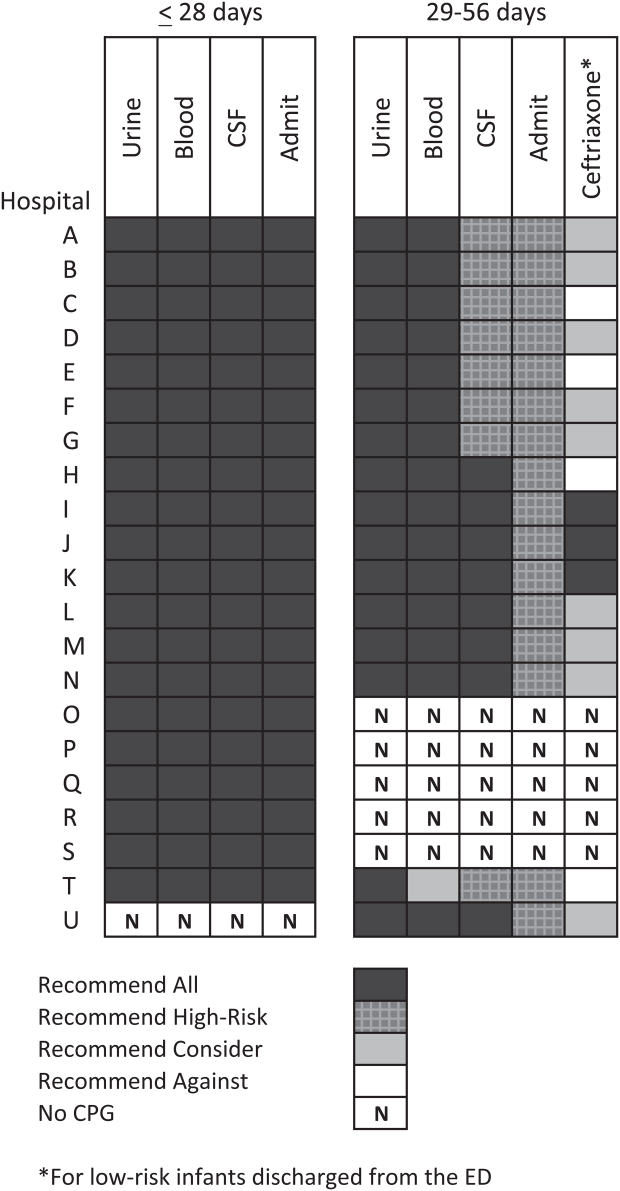
| Characteristic | 28 Days | 2956 Days | ||||
|---|---|---|---|---|---|---|
| No CPG, n=996, N (%) | CPG, n=2,149, N (%) | P Value | No CPG, n=2,460, N (%) | CPG, n=3,772, N (%) | P Value | |
| ||||||
| Race | ||||||
| Non‐Hispanic white | 325 (32.6) | 996 (46.3) | 867 (35.2) | 1,728 (45.8) | ||
| Non‐Hispanic black | 248 (24.9) | 381 (17.7) | 593 (24.1) | 670 (17.8) | ||
| Hispanic | 243 (24.4) | 531 (24.7) | 655 (26.6) | 986 (26.1) | ||
| Asian | 28 (2.8) | 78 (3.6) | 40 (1.6) | 122 (3.2) | ||
| Other Race | 152 (15.3) | 163 (7.6) | <0.001 | 305 (12.4) | 266 (7.1) | <0.001 |
| Gender | ||||||
| Female | 435 (43.7) | 926 (43.1) | 0.76 | 1,067 (43.4) | 1,714 (45.4) | 0.22 |
| Payer | ||||||
| Commercial | 243 (24.4) | 738 (34.3) | 554 (22.5) | 1,202 (31.9) | ||
| Government | 664 (66.7) | 1,269 (59.1) | 1,798 (73.1) | 2,342 (62.1) | ||
| Other payer | 89 (8.9) | 142 (6.6) | <0.001 | 108 (4.4) | 228 (6.0) | <0.001 |
| Region | ||||||
| Northeast | 39 (3.9) | 245 (11.4) | 77 (3.1) | 572 (15.2) | ||
| South | 648 (65.1) | 915 (42.6) | 1,662 (67.6) | 1,462 (38.8) | ||
| Midwest | 271 (27.2) | 462 (21.5) | 506 (20.6) | 851 (22.6) | ||
| West | 38 (3.8) | 527 (24.5) | <0.001 | 215 (8.7) | 887 (23.5) | <0.001 |
| Serious bacterial infection | ||||||
| Overall* | 131 (13.2) | 242 (11.3) | 0.14 | 191 (7.8) | 237 (6.3) | 0.03 |
| UTI/pyelonephritis | 73 (7.3) | 153 (7.1) | 103 (4.2) | 154 (4.1) | ||
| Bacteremia/sepsis | 56 (5.6) | 91 (4.2) | 78 (3.2) | 61 (1.6) | ||
| Bacterial meningitis | 15 (1.5) | 15 (0.7) | 4 (0.2) | 14 (0.4) | ||
| Age, d, median (IQR) | 18 (11, 24) | 18 (11, 23) | 0.67 | 46 (37, 53) | 45 (37, 53) | 0.11 |
All 20 CPGs for the febrile young infant 28 days of age recommended urine, blood, CSF testing, and hospitalization for all infants (Figure 1). Of the 16 hospitals with CPGs for febrile infants aged 29 to 56 days, all recommended urine and blood testing for all patients, except for 1 CPG, which recommended consideration of blood testing but not to obtain routinely. Hospitals varied in recommendations for CSF testing among infants aged 29 to 56 days: 8 (50%) recommended CSF testing in all patients and 8 (50%) recommended CSF testing only if the patient was high risk per defined criteria (based on history, physical examination, urine, and blood testing). In all 16 CPGs, hospitalization was recommended only for high‐risk infants. For low‐risk infants aged 2956 days being discharged from the ED, 3 hospitals recommended ceftriaxone for all, 9 recommended consideration of ceftriaxone, and 4 recommended against antibiotics (Figure 1).
Study Patients
During the study period, there were 10,415 infants 56 days old with a diagnosis of fever at the 33 participating hospitals. After exclusion of 635 (6.1%) infants with a complex chronic condition and 445 (4.3%) transferred from another institution (including 42 with a complex chronic condition), 9377 infants remained in our study cohort. Approximately one‐third of the cohort was 28 days of age and two‐thirds aged 29 to 56 days. The overall SBI rate was 8.5% but varied by age (11.9% in infants 28 days and 6.9% in infants 29 to 56 days of age) (Table 1).
CPGs and Use of Diagnostic Testing, Hospitalization Rates, Ceftriaxone Use, and Revisits for SBI
For infants 28 days of age, the presence of a CPG was not associated with urine, blood, CSF testing, or hospitalization after multivariable adjustment (Table 2). Among infants aged 29 to 56 days, urine testing did not differ based on the presence of a CPG, whereas blood testing was performed less often at the 1 hospital whose CPG recommended to consider, but not routinely obtain, testing (aOR: 0.4, 95% CI: 0.3‐0.7, P=0.001). Compared to hospitals without a CPG, CSF testing was performed less often at hospitals with CPG recommendations to only obtain CSF if high risk (aOR: 0.5, 95% CI: 0.3‐0.8, P=0.002). However, the odds of hospitalization did not differ at institutions with and without a febrile infant CPG (aOR: 0.7, 95% CI: 0.5‐1.1, P=0.10). For infants aged 29 to 56 days discharged from the ED, ceftriaxone was administered more often at hospitals with CPGs that recommended ceftriaxone for all discharged patients (aOR: 4.6, 95% CI: 2.39.3, P<0.001) and less often at hospitals whose CPGs recommended against antibiotics (aOR: 0.3, 95% CI: 0.1‐0.9, P=0.03) (Table 3). Our findings were similar in the subgroup of infants without bronchiolitis or prematurity (see Supporting Tables 1 and 2 in the online version of this article). After exclusion of hospitals with a CPG implemented during the 2013 calendar year (4 hospitals excluded in the 28 days age group and 2 hospitals excluded in the 29 to 56 days age group), infants aged 29 to 56 days cared for at a hospital with a CPG experienced a lower odds of hospitalization (aOR: 0.7, 95% CI: 0.4‐0.98, P=0.04). Otherwise, our findings in both age groups did not materially differ from the main analyses.
| Testing/Hospitalization | No. of Hospitals | No. of Patients | % Received* | aOR (95% CI) | P Value |
|---|---|---|---|---|---|
| |||||
| Laboratory testing | |||||
| Urine testing | |||||
| No CPG | 13 | 996 | 75.6 | Ref | |
| CPG: recommend for all | 20 | 2,149 | 80.7 | 1.2 (0.9‐1.7) | 0.22 |
| Blood testing | |||||
| No CPG | 13 | 996 | 76.9 | Ref | |
| CPG: recommend for all | 20 | 2,149 | 81.8 | 1.2 (0.9‐1.7) | 0.25 |
| CSF testing‖ | |||||
| No CPG | 13 | 996 | 71.0 | Ref | |
| CPG: recommend for all | 20 | 2,149 | 77.5 | 1.3 (1.01.7) | 0.08 |
| Disposition | |||||
| Hospitalization | |||||
| No CPG | 13 | 996 | 75.4 | Ref | |
| CPG: recommend for all | 20 | 2,149 | 81.6 | 1.2 (0.9‐1.8) | 0.26 |
| Testing/Hospitalization | No. of Hospitals | No. of Patients | % Received* | aOR (95% CI) | P Value |
|---|---|---|---|---|---|
| |||||
| Laboratory resting | |||||
| Urine testing | |||||
| No CPG | 17 | 2,460 | 81.1 | Ref | |
| CPG: recommend for all | 16 | 3,772 | 82.1 | 0.9 (0.7‐1.4) | 0.76 |
| Blood testing | |||||
| No CPG | 17 | 2,460 | 79.4 | Ref | |
| CPG: recommend for all | 15 | 3,628 | 82.6 | 1.1 (0.7‐1.6) | 0.70 |
| CPG: recommend consider | 1 | 144 | 62.5 | 0.4 (0.3‐0.7) | 0.001 |
| CSF testing‖ | |||||
| No CPG | 17 | 2,460 | 46.3 | Ref | |
| CPG: recommend for all | 8 | 1,517 | 70.3 | 1.3 (0.9‐1.9) | 0.11 |
| CPG: recommend if high‐risk | 8 | 2,255 | 39.9 | 0.5 (0.3‐0.8) | 0.002 |
| Disposition | |||||
| Hospitalization | |||||
| No CPG | 17 | 2,460 | 47.0 | Ref | |
| CPG: recommend if high‐risk | 16 | 3,772 | 42.0 | 0.7 (0.5‐1.1) | 0.10 |
| Ceftriaxone if discharged | |||||
| No CPG | 17 | 1,304 | 11.7 | Ref | |
| CPG: recommend against | 4 | 313 | 10.9 | 0.3 (0.1‐0.9) | 0.03 |
| CPG: recommend consider | 9 | 1,567 | 14.4 | 1.5 (0.9‐2.4) | 0.09 |
| CPG: recommend for all | 3 | 306 | 64.1 | 4.6 (2.39.3) | < 0.001 |
Three‐day revisits for SBI were similarly low at hospitals with and without CPGs among infants 28 days (1.5% vs 0.8%, P=0.44) and 29 to 56 days of age (1.4% vs 1.1%, P=0.44) and did not differ after exclusion of hospitals with a CPG implemented in 2013.
CPGs and Costs
Among infants 28 days of age, costs per visit did not differ for admitted and discharged patients based on CPG presence. The presence of an ED febrile infant CPG was associated with higher costs for both admitted and discharged infants 29 to 56 days of age (Table 4). The cost analysis did not significantly differ after exclusion of hospitals with CPGs implemented in 2013.
| 28 Days, Cost, Median (IQR) | 29 to 56 Days, Cost, Median (IQR) | |||||
|---|---|---|---|---|---|---|
| No CPG | CPG | P Value | No CPG | CPG | P Value | |
| ||||||
| Admitted | $4,979 ($3,408$6,607) [n=751] | $4,715 ($3,472$6,526) [n=1,753] | 0.79 | $3,756 ($2,725$5,041) [n=1,156] | $3,923 ($3,077$5,243) [n=1,586] | <0.001 |
| Discharged | $298 ($166$510) [n=245] | $231 ($160$464) [n=396] | 0.10 | $681($398$982) [n=1,304)] | $764 ($412$1,100) [n=2,186] | <0.001 |
DISCUSSION
We described the content and association of CPGs with management of the febrile infant 56 days of age across a large sample of children's hospitals. Nearly two‐thirds of included pediatric EDs have a CPG for the management of young febrile infants. Management of febrile infants 28 days was uniform, with a majority hospitalized after urine, blood, and CSF testing regardless of the presence of a CPG. In contrast, CPGs for infants 29 to 56 days of age varied in their recommendations for CSF testing as well as ceftriaxone use for infants discharged from the ED. Consequently, we observed considerable hospital variability in CSF testing and ceftriaxone use for discharged infants, which correlates with variation in the presence and content of CPGs. Institutional CPGs may be a source of the across‐hospital variation in care of febrile young infants observed in prior study.[9]
Febrile infants 28 days of age are at particularly high risk for SBI, with a prevalence of nearly 20% or higher.[2, 3, 29] The high prevalence of SBI, combined with the inherent difficulty in distinguishing neonates with and without SBI,[2, 30] has resulted in uniform CPG recommendations to perform the full‐sepsis workup in this young age group. Similar to prior studies,[8, 9] we observed that most febrile infants 28 days undergo the full sepsis evaluation, including CSF testing, and are hospitalized regardless of the presence of a CPG.
However, given the conflicting recommendations for febrile infants 29 to 56 days of age,[4, 5, 6] the optimal management strategy is less certain.[7] The Rochester, Philadelphia, and Boston criteria, 3 published models to identify infants at low risk for SBI, primarily differ in their recommendations for CSF testing and ceftriaxone use in this age group.[4, 5, 6] Half of the CPGs recommended CSF testing for all febrile infants, and half recommended CSF testing only if the infant was high risk. Institutional guidelines that recommended selective CSF testing for febrile infants aged 29 to 56 days were associated with lower rates of CSF testing. Furthermore, ceftriaxone use varied based on CPG recommendations for low‐risk infants discharged from the ED. Therefore, the influence of febrile infant CPGs mainly relates to the limiting of CSF testing and targeted ceftriaxone use in low‐risk infants. As the rate of return visits for SBI is low across hospitals, future study should assess outcomes at hospitals with CPGs recommending selective CSF testing. Of note, infants 29 to 56 days of age were less likely to be hospitalized when cared for at a hospital with an established CPG prior to 2013 without increase in 3‐day revisits for SBI. This finding may indicate that longer duration of CPG implementation is associated with lower rates of hospitalization for low‐risk infants; this finding merits further study.
The presence of a CPG was not associated with lower costs for febrile infants in either age group. Although individual healthcare systems have achieved lower costs with CPG implementation,[12] the mere presence of a CPG is not associated with lower costs when assessed across institutions. Higher costs for admitted and discharged infants 29 to 56 days of age in the presence of a CPG likely reflects the higher rate of CSF testing at hospitals whose CPGs recommend testing for all febrile infants, as well as inpatient management strategies for hospitalized infants not captured in our study. Future investigation should include an assessment of the cost‐effectiveness of the various testing and treatment strategies employed for the febrile young infant.
Our study has several limitations. First, the validity of ICD‐9 diagnosis codes for identifying young infants with fever is not well established, and thus our study is subject to misclassification bias. To minimize missed patients, we included infants with either an ICD‐9 admission or discharge diagnosis of fever; however, utilization of diagnosis codes for patient identification may have resulted in undercapture of infants with a measured temperature of 38.0C. It is also possible that some patients who did not undergo testing were misclassified as having a fever or had temperatures below standard thresholds to prompt diagnostic testing. This is a potential reason that testing was not performed in 100% of infants, even at hospitals with CPGs that recommended testing for all patients. Additionally, some febrile infants diagnosed with SBI may not have an associated ICD‐9 diagnosis code for fever. Although the overall SBI rate observed in our study was similar to prior studies,[4, 31] the rate in neonates 28 days of age was lower than reported in recent investigations,[2, 3] which may indicate inclusion of a higher proportion of low‐risk febrile infants. With the exception of bronchiolitis, we also did not assess diagnostic testing in the presence of other identified sources of infection such as herpes simplex virus.
Second, we were unable to assess the presence or absence of a CPG at the 4 excluded EDs that did not respond to the survey or the institutions excluded for data‐quality issues. However, included and excluded hospitals did not differ in region or annual ED volume (data not shown).
Third, although we classified hospitals based upon the presence and content of CPGs, we were unable to fully evaluate adherence to the CPG at each site.
Last, though PHIS hospitals represent 85% of freestanding children's hospitals, many febrile infants are hospitalized at non‐PHIS institutions; our results may not be generalizable to care provided at nonchildren's hospitals.
CONCLUSIONS
Management of febrile neonates 28 days of age does not vary based on CPG presence. However, CPGs for the febrile infant aged 29 to 56 days vary in recommendations for CSF testing as well as ceftriaxone use for low‐risk patients, which significantly contributes to practice variation and healthcare costs across institutions.
Acknowledgements
The Febrile Young Infant Research Collaborative includes the following additional investigators who are acknowledged for their work on this study: Kao‐Ping Chua, MD, Harvard PhD Program in Health Policy, Harvard University, Cambridge, Massachusetts, and Division of Emergency Medicine, Department of Pediatrics, Boston Children's Hospital, Boston, Massachusetts; Elana A. Feldman, BA, University of Washington School of Medicine, Seattle, Washington; and Katie L. Hayes, BS, Division of Emergency Medicine, Department of Pediatrics, The Children's Hospital of Philadelphia, Philadelphia, Pennsylvania.
Disclosures
This project was funded in part by The Gerber Foundation Novice Researcher Award (Ref #18273835). Dr. Fran Balamuth received career development support from the National Institutes of Health (NHLBI K12‐HL109009). Funders were not involved in design or conduct of the study; collection, management, analysis, or interpretation of the data; preparation, review, or approval of the manuscript. The authors have no financial relationships relevant to this article to disclose. No payment was received for the production of this article. The authors have no conflicts of interest relevant to this article to disclose.
- , , . Performance of low‐risk criteria in the evaluation of young infants with fever: review of the literature. Pediatrics. 2010;125:228–233.
- , , , , , . A week‐by‐week analysis of the low‐risk criteria for serious bacterial infection in febrile neonates. Arch Dis Child. 2009;94:287–292.
- , , , et al. Is 15 days an appropriate cut‐off age for considering serious bacterial infection in the management of febrile infants? Pediatr Infect Dis J. 2012;31:455–458.
- , , . Outpatient management without antibiotics of fever in selected infants. N Engl J Med. 1993;329:1437–1441.
- , , . Identifying febrile infants at risk for a serious bacterial infection. J Pediatr. 1993;123:489–490.
- , , , et al. Febrile infants at low risk for serious bacterial infection—an appraisal of the Rochester criteria and implications for management. Febrile Infant Collaborative Study Group. Pediatrics. 1994;94:390–396.
- American College of Emergency Physicians Clinical Policies Committee; American College of Emergency Physicians Clinical Policies Subcommittee on Pediatric Fever. Clinical policy for children younger than three years presenting to the emergency department with fever. Ann Emerg Med. 2003;42:530–545.
- , , , et al. Management of febrile neonates in US pediatric emergency departments. Pediatrics. 2014;133:187–195.
- , , , et al. Variation in care of the febrile young infant <90 days in US pediatric emergency departments. Pediatrics. 2014;134:667–677.
- , , , , . Fever survey highlights significant variations in how infants aged ≤60 days are evaluated and underline the need for guidelines. Acta Paediatr. 2014;103:379–385.
- . Evidence‐based guidelines and critical pathways for quality improvement. Pediatrics. 1999;103:225–232.
- , , , et al. Costs and infant outcomes after implementation of a care process model for febrile infants. Pediatrics. 2012;130:e16–e24.
- , , , , , . Research electronic data capture (REDCap)—a metadata‐driven methodology and workflow process for providing translational research informatics support. J Biomed Inform. 2009;42:377–381.
- , , , , , . Variation in occult injury screening for children with suspected abuse in selected US children's hospitals. Pediatrics. 2012;130:853–860.
- . Achieving data quality. How data from a pediatric health information system earns the trust of its users. J AHIMA. 2004;75:22–26.
- , , , . Corticosteroids and mortality in children with bacterial meningitis. JAMA. 2008;299:2048–2055.
- , , , et al. Variation in resource utilization across a national sample of pediatric emergency departments. J Pediatr. 2013;163:230–236.
- , , , , , . Deaths attributed to pediatric complex chronic conditions: national trends and implications for supportive care services. Pediatrics. 2001;107:E99.
- US Census Bureau. Geographic terms and concepts—census divisions and census regions. Available at: https://www.census.gov/geo/reference/gtc/gtc_census_divreg.html. Accessed September 10, 2014.
- , , , et al. Pediatric observation status: are we overlooking a growing population in children's hospitals? J Hosp Med. 2012;7:530–536.
- , , , et al. Differences in designations of observation care in US freestanding children's hospitals: are they virtual or real? J Hosp Med. 2012;7:287–293.
- , , , et al. Accuracy of administrative billing codes to detect urinary tract infection hospitalizations. Pediatrics. 2011;128:323–330.
- , , , et al. Identifying pediatric community‐acquired pneumonia hospitalizations: accuracy of administrative billing codes. JAMA Pediatr. 2013;167:851–858.
- , , , . Initial emergency department diagnosis and return visits: risk versus perception. Ann Emerg Med. 1998;32:569–573.
- , , , , . A national depiction of children with return visits to the emergency department within 72 hours, 2001–2007. Pediatr Emerg Care. 2012;28:606–610.
- Healthcare Cost and Utilization Project. Cost‐to‐charge ratio files. Available at: http://www.hcup‐us.ahrq.gov/db/state/costtocharge.jsp. Accessed September 11, 2014.
- , , , et al. Risk of serious bacterial infection in young febrile infants with respiratory syncytial virus infections. Pediatrics. 2004;113:1728–1734.
- , , , et al. Establishing benchmarks for the hospitalized care of children with asthma, bronchiolitis, and pneumonia. Pediatrics. 2014;134:555–562.
- , , , , , . Well appearing young infants with fever without known source in the emergency department: are lumbar punctures always necessary? Eur J Emerg Med. 2010;17:167–169.
- , . Unpredictability of serious bacterial illness in febrile infants from birth to 1 month of age. Arch Pediatr Adolesc Med. 1999;153:508–511.
- , , , et al. Management and outcomes of care of fever in early infancy. JAMA. 2004;291:1203–1212.
Febrile young infants are at high risk for serious bacterial infection (SBI) with reported rates of 8.5% to 12%, even higher in neonates 28 days of age.[1, 2, 3] As a result, febrile infants often undergo extensive diagnostic evaluation consisting of a combination of urine, blood, and cerebrospinal fluid (CSF) testing.[4, 5, 6] Several clinical prediction algorithms use this diagnostic testing to identify febrile infants at low risk for SBI, but they differ with respect to age range, recommended testing, antibiotic administration, and threshold for hospitalization.[4, 5, 6] Additionally, the optimal management strategy for this population has not been defined.[7] Consequently, laboratory testing, antibiotic use, and hospitalization for febrile young infants vary widely among hospitals.[8, 9, 10]
Clinical practice guidelines (CPGs) are designed to implement evidence‐based care and reduce practice variability, with the goal of improving quality of care and optimizing costs.[11] Implementation of a CPG for management of febrile young infants in the Intermountain Healthcare System was associated with greater adherence to evidence‐based care and lower costs.[12] However, when strong evidence is lacking, different interpretations of febrile infant risk classification incorporated into local CPGs may be a major driver of the across‐hospital practice variation observed in prior studies.[8, 9] Understanding sources of variability as well as determining the association of CPGs with clinicians' practice patterns can help identify quality improvement opportunities, either through national benchmarking or local efforts.
Our primary objectives were to compare (1) recommendations of pediatric emergency departmentbased institutional CPGs for febrile young infants and (2) rates of urine, blood, CSF testing, hospitalization, and ceftriaxone use at emergency department (ED) discharge based upon CPG presence and the specific CPG recommendations. Our secondary objectives were to describe the association of CPGs with healthcare costs and return visits for SBI.
METHODS
Study Design
We used the Pediatric Health Information System (PHIS) to identify febrile infants 56 days of age who presented to the ED between January 1, 2013 and December 31, 2013. We also surveyed ED providers at participating PHIS hospitals. Informed consent was obtained from survey respondents. The institutional review board at Boston Children's Hospital approved the study protocol.
Clinical Practice Guideline Survey
We sent an electronic survey to medical directors or division directors at 37 pediatric EDs to determine whether their ED utilized a CPG for the management of the febrile young infant in 2013. If no response was received after the second attempt, we queried ED fellowship directors or other ED attending physicians at nonresponding hospitals. Survey items included the presence of a febrile young infant CPG, and if present, the year of implementation, ages targeted, and CPG content. As applicable, respondents were asked to share their CPG and/or provide the specific CPG recommendations.
We collected and managed survey data using the Research Electronic Data Capture (REDCap) electronic data capture tools hosted at Boston Children's Hospital. REDCap is a secure, Web‐based application designed to support data capture for research studies.[13]
Data Source
The PHIS database contains administrative data from 44 US children's hospitals. These hospitals, affiliated with the Children's Hospital Association, represent 85% of freestanding US children's hospitals.[14] Encrypted patient identifiers permit tracking of patients across encounters.[15] Data quality and integrity are assured jointly by the Children's Hospital Association and participating hospitals.[16] For this study, 7 hospitals were excluded due to incomplete ED data or known data‐quality issues.[17]
Patients
We identified study infants using the following International Classification of Diseases, 9th Revision (ICD‐9) admission or discharge diagnosis codes for fever as defined previously[8, 9]: 780.6, 778.4, 780.60, or 780.61. We excluded infants with a complex chronic condition[18] and those transferred from another institution, as these infants may warrant a nonstandard evaluation and/or may have incomplete data. For infants with >1 ED visit for fever during the study period, repeat visits within 3 days of an index visit were considered a revisit for the same episode of illness; visits >3 days following an index visit were considered as a new index visit.
Study Definitions
From the PHIS database, we abstracted demographic characteristics (gender, race/ethnicity), insurance status, and region where the hospital was located (using US Census categories[19]). Billing codes were used to assess whether urine, blood, and CSF testing (as defined previously[9]) were performed during the ED evaluation. To account for ED visits that spanned the midnight hour, for hospitalized patients we considered any testing or treatment occurring on the initial or second hospital day to be performed in the ED; billing code data in PHIS are based upon calendar day and do not distinguish testing performed in the ED versus inpatient setting.[8, 9] Patients billed for observation care were classified as being hospitalized.[20, 21]
We identified the presence of an SBI using ICD‐9 diagnosis codes for the following infections as described previously[9]: urinary tract infection or pyelonephritis,[22] bacteremia or sepsis, bacterial meningitis,[16] pneumonia,[23] or bacterial enteritis. To assess return visits for SBI that required inpatient management, we defined an ED revisit for an SBI as a return visit within 3 days of ED discharge[24, 25] that resulted in hospitalization with an associated ICD‐9 discharge diagnosis code for an SBI.
Hospitals charges in PHIS database were adjusted for hospital location by using the Centers for Medicare and Medicaid Services price/wage index. Costs were estimated by applying hospital‐level cost‐to‐charge ratios to charge data.[26]
Measured Exposures
The primary exposure was the presence of an ED‐based CPG for management of the febrile young infant aged 28 days and 29 to 56 days; 56 days was used as the upper age limit as all of the CPGs included infants up to this age or beyond. Six institutions utilized CPGs with different thresholds to define the age categories (eg, dichotomized at 27 or 30 days); these CPGs were classified into the aforementioned age groups to permit comparisons across standardized age groups. We classified institutions based on the presence of a CPG. To assess differences in the application of low‐risk criteria, the CPGs were further classified a priori based upon specific recommendations around laboratory testing and hospitalization, as well as ceftriaxone use for infants aged 29 to 56 days discharged from the ED. CPGs were categorized based upon whether testing, hospitalization, and ceftriaxone use were: (1) recommended for all patients, (2) recommended only if patients were classified as high risk (absence of low‐risk criteria), (3) recommended against, or (4) recommended to consider at clinician discretion.
Outcome Measures
Measured outcomes were performance of urine, blood, CSF testing, and hospitalization rate, as well as rate of ceftriaxone use for discharged infants aged 29 to 56 days, 3‐day revisits for SBI, and costs per visit, which included hospitalization costs for admitted patients.
Data Analysis
We described continuous variables using median and interquartile range or range values and categorical variables using frequencies. We compared medians using Wilcoxon rank sum and categorical variables using a [2] test. We compared rates of testing, hospitalization, ceftriaxone use, and 3‐day revisits for SBI based on the presence of a CPG, and when present, the specific CPG recommendations. Costs per visit were compared between institutions with and without CPGs and assessed separately for admitted and discharged patients. To adjust for potential confounders and clustering of patients within hospitals, we used generalized estimating equations with logistic regression to generate adjusted odd ratios (aORs) and 95% confidence intervals (CIs). Models were adjusted for geographic region, payer, race, and gender. Statistical analyses were performed by using SAS version 9.3 (SAS Institute, Cary, NC). We determined statistical significance as a 2‐tailed P value <0.05.
Febrile infants with bronchiolitis or a history of prematurity may be managed differently from full‐term febrile young infants without bronchiolitis.[6, 27] Therefore, we performed a subgroup analysis after exclusion of infants with an ICD‐9 discharge diagnosis code for bronchiolitis (466.11 and 466.19)[28] or prematurity (765).
Because our study included ED encounters in 2013, we repeated our analyses after exclusion of hospitals with CPGs implemented during the 2013 calendar year.
RESULTS
CPG by Institution
Thirty‐three (89.2%) of the 37 EDs surveyed completed the questionnaire. Overall, 21 (63.6%) of the 33 EDs had a CPG; 15 (45.5%) had a CPG for all infants 56 days of age, 5 (15.2%) had a CPG for infants 28 days only, and 1 (3.0%) had a CPG for infants 29 to 56 days but not 28 days of age (Figure 1). Seventeen EDs had an established CPG prior to 2013, and 4 hospitals implemented a CPG during the 2013 calendar year, 2 with CPGs for neonates 28 days and 2 with CPGs for both 28 days and 29 to 56 days of age. Hospitals with CPGs were more likely to be located in the Northeast and West regions of the United States and provide care to a higher proportion of non‐Hispanic white patients, as well as those with commercial insurance (Table 1).
| Characteristic | 28 Days | 2956 Days | ||||
|---|---|---|---|---|---|---|
| No CPG, n=996, N (%) | CPG, n=2,149, N (%) | P Value | No CPG, n=2,460, N (%) | CPG, n=3,772, N (%) | P Value | |
| ||||||
| Race | ||||||
| Non‐Hispanic white | 325 (32.6) | 996 (46.3) | 867 (35.2) | 1,728 (45.8) | ||
| Non‐Hispanic black | 248 (24.9) | 381 (17.7) | 593 (24.1) | 670 (17.8) | ||
| Hispanic | 243 (24.4) | 531 (24.7) | 655 (26.6) | 986 (26.1) | ||
| Asian | 28 (2.8) | 78 (3.6) | 40 (1.6) | 122 (3.2) | ||
| Other Race | 152 (15.3) | 163 (7.6) | <0.001 | 305 (12.4) | 266 (7.1) | <0.001 |
| Gender | ||||||
| Female | 435 (43.7) | 926 (43.1) | 0.76 | 1,067 (43.4) | 1,714 (45.4) | 0.22 |
| Payer | ||||||
| Commercial | 243 (24.4) | 738 (34.3) | 554 (22.5) | 1,202 (31.9) | ||
| Government | 664 (66.7) | 1,269 (59.1) | 1,798 (73.1) | 2,342 (62.1) | ||
| Other payer | 89 (8.9) | 142 (6.6) | <0.001 | 108 (4.4) | 228 (6.0) | <0.001 |
| Region | ||||||
| Northeast | 39 (3.9) | 245 (11.4) | 77 (3.1) | 572 (15.2) | ||
| South | 648 (65.1) | 915 (42.6) | 1,662 (67.6) | 1,462 (38.8) | ||
| Midwest | 271 (27.2) | 462 (21.5) | 506 (20.6) | 851 (22.6) | ||
| West | 38 (3.8) | 527 (24.5) | <0.001 | 215 (8.7) | 887 (23.5) | <0.001 |
| Serious bacterial infection | ||||||
| Overall* | 131 (13.2) | 242 (11.3) | 0.14 | 191 (7.8) | 237 (6.3) | 0.03 |
| UTI/pyelonephritis | 73 (7.3) | 153 (7.1) | 103 (4.2) | 154 (4.1) | ||
| Bacteremia/sepsis | 56 (5.6) | 91 (4.2) | 78 (3.2) | 61 (1.6) | ||
| Bacterial meningitis | 15 (1.5) | 15 (0.7) | 4 (0.2) | 14 (0.4) | ||
| Age, d, median (IQR) | 18 (11, 24) | 18 (11, 23) | 0.67 | 46 (37, 53) | 45 (37, 53) | 0.11 |
All 20 CPGs for the febrile young infant 28 days of age recommended urine, blood, CSF testing, and hospitalization for all infants (Figure 1). Of the 16 hospitals with CPGs for febrile infants aged 29 to 56 days, all recommended urine and blood testing for all patients, except for 1 CPG, which recommended consideration of blood testing but not to obtain routinely. Hospitals varied in recommendations for CSF testing among infants aged 29 to 56 days: 8 (50%) recommended CSF testing in all patients and 8 (50%) recommended CSF testing only if the patient was high risk per defined criteria (based on history, physical examination, urine, and blood testing). In all 16 CPGs, hospitalization was recommended only for high‐risk infants. For low‐risk infants aged 2956 days being discharged from the ED, 3 hospitals recommended ceftriaxone for all, 9 recommended consideration of ceftriaxone, and 4 recommended against antibiotics (Figure 1).
Study Patients
During the study period, there were 10,415 infants 56 days old with a diagnosis of fever at the 33 participating hospitals. After exclusion of 635 (6.1%) infants with a complex chronic condition and 445 (4.3%) transferred from another institution (including 42 with a complex chronic condition), 9377 infants remained in our study cohort. Approximately one‐third of the cohort was 28 days of age and two‐thirds aged 29 to 56 days. The overall SBI rate was 8.5% but varied by age (11.9% in infants 28 days and 6.9% in infants 29 to 56 days of age) (Table 1).
CPGs and Use of Diagnostic Testing, Hospitalization Rates, Ceftriaxone Use, and Revisits for SBI
For infants 28 days of age, the presence of a CPG was not associated with urine, blood, CSF testing, or hospitalization after multivariable adjustment (Table 2). Among infants aged 29 to 56 days, urine testing did not differ based on the presence of a CPG, whereas blood testing was performed less often at the 1 hospital whose CPG recommended to consider, but not routinely obtain, testing (aOR: 0.4, 95% CI: 0.3‐0.7, P=0.001). Compared to hospitals without a CPG, CSF testing was performed less often at hospitals with CPG recommendations to only obtain CSF if high risk (aOR: 0.5, 95% CI: 0.3‐0.8, P=0.002). However, the odds of hospitalization did not differ at institutions with and without a febrile infant CPG (aOR: 0.7, 95% CI: 0.5‐1.1, P=0.10). For infants aged 29 to 56 days discharged from the ED, ceftriaxone was administered more often at hospitals with CPGs that recommended ceftriaxone for all discharged patients (aOR: 4.6, 95% CI: 2.39.3, P<0.001) and less often at hospitals whose CPGs recommended against antibiotics (aOR: 0.3, 95% CI: 0.1‐0.9, P=0.03) (Table 3). Our findings were similar in the subgroup of infants without bronchiolitis or prematurity (see Supporting Tables 1 and 2 in the online version of this article). After exclusion of hospitals with a CPG implemented during the 2013 calendar year (4 hospitals excluded in the 28 days age group and 2 hospitals excluded in the 29 to 56 days age group), infants aged 29 to 56 days cared for at a hospital with a CPG experienced a lower odds of hospitalization (aOR: 0.7, 95% CI: 0.4‐0.98, P=0.04). Otherwise, our findings in both age groups did not materially differ from the main analyses.
| Testing/Hospitalization | No. of Hospitals | No. of Patients | % Received* | aOR (95% CI) | P Value |
|---|---|---|---|---|---|
| |||||
| Laboratory testing | |||||
| Urine testing | |||||
| No CPG | 13 | 996 | 75.6 | Ref | |
| CPG: recommend for all | 20 | 2,149 | 80.7 | 1.2 (0.9‐1.7) | 0.22 |
| Blood testing | |||||
| No CPG | 13 | 996 | 76.9 | Ref | |
| CPG: recommend for all | 20 | 2,149 | 81.8 | 1.2 (0.9‐1.7) | 0.25 |
| CSF testing‖ | |||||
| No CPG | 13 | 996 | 71.0 | Ref | |
| CPG: recommend for all | 20 | 2,149 | 77.5 | 1.3 (1.01.7) | 0.08 |
| Disposition | |||||
| Hospitalization | |||||
| No CPG | 13 | 996 | 75.4 | Ref | |
| CPG: recommend for all | 20 | 2,149 | 81.6 | 1.2 (0.9‐1.8) | 0.26 |
| Testing/Hospitalization | No. of Hospitals | No. of Patients | % Received* | aOR (95% CI) | P Value |
|---|---|---|---|---|---|
| |||||
| Laboratory resting | |||||
| Urine testing | |||||
| No CPG | 17 | 2,460 | 81.1 | Ref | |
| CPG: recommend for all | 16 | 3,772 | 82.1 | 0.9 (0.7‐1.4) | 0.76 |
| Blood testing | |||||
| No CPG | 17 | 2,460 | 79.4 | Ref | |
| CPG: recommend for all | 15 | 3,628 | 82.6 | 1.1 (0.7‐1.6) | 0.70 |
| CPG: recommend consider | 1 | 144 | 62.5 | 0.4 (0.3‐0.7) | 0.001 |
| CSF testing‖ | |||||
| No CPG | 17 | 2,460 | 46.3 | Ref | |
| CPG: recommend for all | 8 | 1,517 | 70.3 | 1.3 (0.9‐1.9) | 0.11 |
| CPG: recommend if high‐risk | 8 | 2,255 | 39.9 | 0.5 (0.3‐0.8) | 0.002 |
| Disposition | |||||
| Hospitalization | |||||
| No CPG | 17 | 2,460 | 47.0 | Ref | |
| CPG: recommend if high‐risk | 16 | 3,772 | 42.0 | 0.7 (0.5‐1.1) | 0.10 |
| Ceftriaxone if discharged | |||||
| No CPG | 17 | 1,304 | 11.7 | Ref | |
| CPG: recommend against | 4 | 313 | 10.9 | 0.3 (0.1‐0.9) | 0.03 |
| CPG: recommend consider | 9 | 1,567 | 14.4 | 1.5 (0.9‐2.4) | 0.09 |
| CPG: recommend for all | 3 | 306 | 64.1 | 4.6 (2.39.3) | < 0.001 |
Three‐day revisits for SBI were similarly low at hospitals with and without CPGs among infants 28 days (1.5% vs 0.8%, P=0.44) and 29 to 56 days of age (1.4% vs 1.1%, P=0.44) and did not differ after exclusion of hospitals with a CPG implemented in 2013.
CPGs and Costs
Among infants 28 days of age, costs per visit did not differ for admitted and discharged patients based on CPG presence. The presence of an ED febrile infant CPG was associated with higher costs for both admitted and discharged infants 29 to 56 days of age (Table 4). The cost analysis did not significantly differ after exclusion of hospitals with CPGs implemented in 2013.
| 28 Days, Cost, Median (IQR) | 29 to 56 Days, Cost, Median (IQR) | |||||
|---|---|---|---|---|---|---|
| No CPG | CPG | P Value | No CPG | CPG | P Value | |
| ||||||
| Admitted | $4,979 ($3,408$6,607) [n=751] | $4,715 ($3,472$6,526) [n=1,753] | 0.79 | $3,756 ($2,725$5,041) [n=1,156] | $3,923 ($3,077$5,243) [n=1,586] | <0.001 |
| Discharged | $298 ($166$510) [n=245] | $231 ($160$464) [n=396] | 0.10 | $681($398$982) [n=1,304)] | $764 ($412$1,100) [n=2,186] | <0.001 |
DISCUSSION
We described the content and association of CPGs with management of the febrile infant 56 days of age across a large sample of children's hospitals. Nearly two‐thirds of included pediatric EDs have a CPG for the management of young febrile infants. Management of febrile infants 28 days was uniform, with a majority hospitalized after urine, blood, and CSF testing regardless of the presence of a CPG. In contrast, CPGs for infants 29 to 56 days of age varied in their recommendations for CSF testing as well as ceftriaxone use for infants discharged from the ED. Consequently, we observed considerable hospital variability in CSF testing and ceftriaxone use for discharged infants, which correlates with variation in the presence and content of CPGs. Institutional CPGs may be a source of the across‐hospital variation in care of febrile young infants observed in prior study.[9]
Febrile infants 28 days of age are at particularly high risk for SBI, with a prevalence of nearly 20% or higher.[2, 3, 29] The high prevalence of SBI, combined with the inherent difficulty in distinguishing neonates with and without SBI,[2, 30] has resulted in uniform CPG recommendations to perform the full‐sepsis workup in this young age group. Similar to prior studies,[8, 9] we observed that most febrile infants 28 days undergo the full sepsis evaluation, including CSF testing, and are hospitalized regardless of the presence of a CPG.
However, given the conflicting recommendations for febrile infants 29 to 56 days of age,[4, 5, 6] the optimal management strategy is less certain.[7] The Rochester, Philadelphia, and Boston criteria, 3 published models to identify infants at low risk for SBI, primarily differ in their recommendations for CSF testing and ceftriaxone use in this age group.[4, 5, 6] Half of the CPGs recommended CSF testing for all febrile infants, and half recommended CSF testing only if the infant was high risk. Institutional guidelines that recommended selective CSF testing for febrile infants aged 29 to 56 days were associated with lower rates of CSF testing. Furthermore, ceftriaxone use varied based on CPG recommendations for low‐risk infants discharged from the ED. Therefore, the influence of febrile infant CPGs mainly relates to the limiting of CSF testing and targeted ceftriaxone use in low‐risk infants. As the rate of return visits for SBI is low across hospitals, future study should assess outcomes at hospitals with CPGs recommending selective CSF testing. Of note, infants 29 to 56 days of age were less likely to be hospitalized when cared for at a hospital with an established CPG prior to 2013 without increase in 3‐day revisits for SBI. This finding may indicate that longer duration of CPG implementation is associated with lower rates of hospitalization for low‐risk infants; this finding merits further study.
The presence of a CPG was not associated with lower costs for febrile infants in either age group. Although individual healthcare systems have achieved lower costs with CPG implementation,[12] the mere presence of a CPG is not associated with lower costs when assessed across institutions. Higher costs for admitted and discharged infants 29 to 56 days of age in the presence of a CPG likely reflects the higher rate of CSF testing at hospitals whose CPGs recommend testing for all febrile infants, as well as inpatient management strategies for hospitalized infants not captured in our study. Future investigation should include an assessment of the cost‐effectiveness of the various testing and treatment strategies employed for the febrile young infant.
Our study has several limitations. First, the validity of ICD‐9 diagnosis codes for identifying young infants with fever is not well established, and thus our study is subject to misclassification bias. To minimize missed patients, we included infants with either an ICD‐9 admission or discharge diagnosis of fever; however, utilization of diagnosis codes for patient identification may have resulted in undercapture of infants with a measured temperature of 38.0C. It is also possible that some patients who did not undergo testing were misclassified as having a fever or had temperatures below standard thresholds to prompt diagnostic testing. This is a potential reason that testing was not performed in 100% of infants, even at hospitals with CPGs that recommended testing for all patients. Additionally, some febrile infants diagnosed with SBI may not have an associated ICD‐9 diagnosis code for fever. Although the overall SBI rate observed in our study was similar to prior studies,[4, 31] the rate in neonates 28 days of age was lower than reported in recent investigations,[2, 3] which may indicate inclusion of a higher proportion of low‐risk febrile infants. With the exception of bronchiolitis, we also did not assess diagnostic testing in the presence of other identified sources of infection such as herpes simplex virus.
Second, we were unable to assess the presence or absence of a CPG at the 4 excluded EDs that did not respond to the survey or the institutions excluded for data‐quality issues. However, included and excluded hospitals did not differ in region or annual ED volume (data not shown).
Third, although we classified hospitals based upon the presence and content of CPGs, we were unable to fully evaluate adherence to the CPG at each site.
Last, though PHIS hospitals represent 85% of freestanding children's hospitals, many febrile infants are hospitalized at non‐PHIS institutions; our results may not be generalizable to care provided at nonchildren's hospitals.
CONCLUSIONS
Management of febrile neonates 28 days of age does not vary based on CPG presence. However, CPGs for the febrile infant aged 29 to 56 days vary in recommendations for CSF testing as well as ceftriaxone use for low‐risk patients, which significantly contributes to practice variation and healthcare costs across institutions.
Acknowledgements
The Febrile Young Infant Research Collaborative includes the following additional investigators who are acknowledged for their work on this study: Kao‐Ping Chua, MD, Harvard PhD Program in Health Policy, Harvard University, Cambridge, Massachusetts, and Division of Emergency Medicine, Department of Pediatrics, Boston Children's Hospital, Boston, Massachusetts; Elana A. Feldman, BA, University of Washington School of Medicine, Seattle, Washington; and Katie L. Hayes, BS, Division of Emergency Medicine, Department of Pediatrics, The Children's Hospital of Philadelphia, Philadelphia, Pennsylvania.
Disclosures
This project was funded in part by The Gerber Foundation Novice Researcher Award (Ref #18273835). Dr. Fran Balamuth received career development support from the National Institutes of Health (NHLBI K12‐HL109009). Funders were not involved in design or conduct of the study; collection, management, analysis, or interpretation of the data; preparation, review, or approval of the manuscript. The authors have no financial relationships relevant to this article to disclose. No payment was received for the production of this article. The authors have no conflicts of interest relevant to this article to disclose.
- , , . Performance of low‐risk criteria in the evaluation of young infants with fever: review of the literature. Pediatrics. 2010;125:228–233.
- , , , , , . A week‐by‐week analysis of the low‐risk criteria for serious bacterial infection in febrile neonates. Arch Dis Child. 2009;94:287–292.
- , , , et al. Is 15 days an appropriate cut‐off age for considering serious bacterial infection in the management of febrile infants? Pediatr Infect Dis J. 2012;31:455–458.
- , , . Outpatient management without antibiotics of fever in selected infants. N Engl J Med. 1993;329:1437–1441.
- , , . Identifying febrile infants at risk for a serious bacterial infection. J Pediatr. 1993;123:489–490.
- , , , et al. Febrile infants at low risk for serious bacterial infection—an appraisal of the Rochester criteria and implications for management. Febrile Infant Collaborative Study Group. Pediatrics. 1994;94:390–396.
- American College of Emergency Physicians Clinical Policies Committee; American College of Emergency Physicians Clinical Policies Subcommittee on Pediatric Fever. Clinical policy for children younger than three years presenting to the emergency department with fever. Ann Emerg Med. 2003;42:530–545.
- , , , et al. Management of febrile neonates in US pediatric emergency departments. Pediatrics. 2014;133:187–195.
- , , , et al. Variation in care of the febrile young infant <90 days in US pediatric emergency departments. Pediatrics. 2014;134:667–677.
- , , , , . Fever survey highlights significant variations in how infants aged ≤60 days are evaluated and underline the need for guidelines. Acta Paediatr. 2014;103:379–385.
- . Evidence‐based guidelines and critical pathways for quality improvement. Pediatrics. 1999;103:225–232.
- , , , et al. Costs and infant outcomes after implementation of a care process model for febrile infants. Pediatrics. 2012;130:e16–e24.
- , , , , , . Research electronic data capture (REDCap)—a metadata‐driven methodology and workflow process for providing translational research informatics support. J Biomed Inform. 2009;42:377–381.
- , , , , , . Variation in occult injury screening for children with suspected abuse in selected US children's hospitals. Pediatrics. 2012;130:853–860.
- . Achieving data quality. How data from a pediatric health information system earns the trust of its users. J AHIMA. 2004;75:22–26.
- , , , . Corticosteroids and mortality in children with bacterial meningitis. JAMA. 2008;299:2048–2055.
- , , , et al. Variation in resource utilization across a national sample of pediatric emergency departments. J Pediatr. 2013;163:230–236.
- , , , , , . Deaths attributed to pediatric complex chronic conditions: national trends and implications for supportive care services. Pediatrics. 2001;107:E99.
- US Census Bureau. Geographic terms and concepts—census divisions and census regions. Available at: https://www.census.gov/geo/reference/gtc/gtc_census_divreg.html. Accessed September 10, 2014.
- , , , et al. Pediatric observation status: are we overlooking a growing population in children's hospitals? J Hosp Med. 2012;7:530–536.
- , , , et al. Differences in designations of observation care in US freestanding children's hospitals: are they virtual or real? J Hosp Med. 2012;7:287–293.
- , , , et al. Accuracy of administrative billing codes to detect urinary tract infection hospitalizations. Pediatrics. 2011;128:323–330.
- , , , et al. Identifying pediatric community‐acquired pneumonia hospitalizations: accuracy of administrative billing codes. JAMA Pediatr. 2013;167:851–858.
- , , , . Initial emergency department diagnosis and return visits: risk versus perception. Ann Emerg Med. 1998;32:569–573.
- , , , , . A national depiction of children with return visits to the emergency department within 72 hours, 2001–2007. Pediatr Emerg Care. 2012;28:606–610.
- Healthcare Cost and Utilization Project. Cost‐to‐charge ratio files. Available at: http://www.hcup‐us.ahrq.gov/db/state/costtocharge.jsp. Accessed September 11, 2014.
- , , , et al. Risk of serious bacterial infection in young febrile infants with respiratory syncytial virus infections. Pediatrics. 2004;113:1728–1734.
- , , , et al. Establishing benchmarks for the hospitalized care of children with asthma, bronchiolitis, and pneumonia. Pediatrics. 2014;134:555–562.
- , , , , , . Well appearing young infants with fever without known source in the emergency department: are lumbar punctures always necessary? Eur J Emerg Med. 2010;17:167–169.
- , . Unpredictability of serious bacterial illness in febrile infants from birth to 1 month of age. Arch Pediatr Adolesc Med. 1999;153:508–511.
- , , , et al. Management and outcomes of care of fever in early infancy. JAMA. 2004;291:1203–1212.
© 2015 Society of Hospital Medicine

Return Visits to Pediatric EDs
Returns to the hospital following recent encounters, such as an admission to the inpatient unit or evaluation in an emergency department (ED), may reflect the natural progression of a disease, the quality of care received during the initial admission or visit, or the quality of the underlying healthcare system.[1, 2, 3, 4, 5, 6, 7, 8, 9, 10] Although national attention has focused on hospital readmissions,[3, 4, 5, 6, 7, 11, 12] ED revisits are a source of concern to emergency physicians.[8, 9] Some ED revisits are medically necessary, but revisits that may be managed in the primary care setting contribute to ED crowding, can be stressful to patients and providers, and increase healthcare costs.[10, 11, 12] Approximately 27 million annual ED visits are made by children, accounting for over one‐quarter of all ED visits in the United States, with a reported ED revisit rate of 2.5% to 5.2%.[2, 13, 14, 15, 16, 17, 18, 19, 20] Improved understanding of the patient‐level or visit‐level factors associated with ED revisits may provide an opportunity to enhance disposition decision making at the index visit and optimize site of and communication around follow‐up care.
Previous studies on ED revisits have largely been conducted in single centers and have used variable visit intervals ranging between 48 hours and 30 days.[2, 13, 16, 18, 21, 22, 23, 24, 25] Two national studies used the National Hospital Ambulatory Medical Care Survey, which includes data from both general and pediatric EDs.[13, 14] Factors identified to be associated with increased odds of returning were: young age, higher acuity, chronic conditions, and public insurance. One national study identified some diagnoses associated with higher likelihood of returning,[13] whereas the other focused primarily on infectious diseaserelated diagnoses.[14]
The purpose of this study was to describe the prevalence of return visits specifically to pediatric EDs and to investigate patient‐level, visit‐level, and healthcare systemrelated factors that may be associated with return visits and hospitalization at return.
METHODS
Study Design and Data Source
This retrospective cohort study used data from the Pediatric Health Information System (PHIS), an administrative database with data from 44 tertiary care pediatric hospitals in 27 US states and the District of Columbia. This database contains patient demographics, diagnoses, and procedures as well as medications, diagnostic imaging, laboratory, and supply charges for each patient. Data are deidentified prior to inclusion; encrypted medical record numbers allow for the identification of individual patients across all ED visits and hospitalizations to the same hospital. The Children's Hospital Association (Overland Park, KS) and participating hospitals jointly assure the quality and integrity of the data. This study was approved by the institutional review board at Boston Children's Hospital with a waiver for informed consent granted.
Study Population and Protocol
To standardize comparisons across the hospitals, we included data from 23 of the 44 hospitals in PHIS; 7 were excluded for not including ED‐specific data. For institutions that collect information from multiple hospitals within their healthcare system, we included only records from the main campus or children's hospital when possible, leading to the exclusion of 9 hospitals where the data were not able to be segregated. As an additional level of data validation, we compared the hospital‐level ED volume and admission rates as reported in the PHIS to those reported to a separate database (the Pediatric Analysis and Comparison Tool). We further excluded 5 hospitals whose volume differed by >10% between these 2 data sources.
Patients <18 years of age who were discharged from these EDs following their index visit in 2012 formed the eligible cohort.
Key Outcome Measures
The primary outcomes were return visits within 72 hours of discharge from the ED, and return visits resulting in hospitalization, including observation status. We defined an ED revisit as a return within 72 hours of ED discharge regardless of whether the patient was subsequently discharged from the ED on the return visit or hospitalized. We assessed revisits within 72 hours of an index ED discharge, because return visits within this time frame are likely to be related to the index visit.[2, 13, 16, 21, 22, 24, 25, 26]
Factors Associated With ED Revisits
A priori, we chose to adjust for the following patient‐level factors: age (<30 days, 30 days<1 year, 14 years, 511 years, 1217 years), gender, and socioeconomic status (SES) measured as the zip codebased median household income, obtained from the 2010 US Census, with respect to the federal poverty level (FPL) (<1.5 FPL, 1.52 FPL, 23 FPL, and >3 FPL).[27] We also adjusted for insurance type (commercial, government, or other), proximity of patient's home zip code to hospital (modeled as the natural log of the geographical distance to patient's home address from the hospital), ED diagnosis‐based severity classification system score (1=low severity, 5=high severity),[28] presence of a complex chronic condition at the index or prior visits using a validated classification scheme,[15, 29, 30, 31] and primary care physician (PCP) density per 100,000 in the patient's residential area (modeled as quartiles: very low, <57.2; low, 57.267.9; medium, 68.078.7; high, >78.8). PCP density, defined by the Dartmouth Atlas of Health Care,[32, 33, 34] is the number of primary care physicians per 100,000 residents (PCP count) in federal health service areas (HSA). Patients were assigned to a corresponding HSA based on their home zip code.
Visit‐level factors included arrival time of index visit (8:01 am 4:00 pm, 4:01 pm12:00 am, 12:01 am8 am representing day, evening, and overnight arrival, respectively), day of the week, season, length of stay (LOS) in the ED during the index visit, and ED crowding (calculated as the average daily LOS/yearly average LOS for the individual ED).[35] We categorized the ED primary diagnosis for each visit using the major diagnosis groupings of a previously described pediatric ED‐specific classification scheme.[36] Using International Classification of Diseases, Ninth Revision (ICD‐9) codes, we identified the conditions with the highest ED revisit rates.
Statistical Analyses
Categorical variables describing the study cohort were summarized using frequencies and percentages. Continuous variables were summarized using mean, median, and interquartile range values, where appropriate. We used 2 different hierarchical logistic regression models to assess revisit rates by patient‐ and visit‐level characteristics. The initial model included all patients discharged from the ED following the index visit and assessed for the outcome of a revisit within 72 hours. The second model considered only patients who returned within 72 hours of an index visit and assessed for hospitalization on that return visit. We used generalized linear mixed effects models, with hospital as a random effect to account for the presence of correlated data (within hospitals), nonconstant variability (across hospitals), and binary responses. Adjusted odds ratios with 95% confidence intervals were used as summary measures of the effect of the individual adjusters. Adjusters were missing in fewer than 5% of patients across participating hospitals. Statistical analyses were performed using SAS version 9.3 (SAS Institute Inc., Cary, NC); 2‐sided P values <0.004 were considered statistically significant to account for multiple comparisons (Bonferroni‐adjusted level of significance=0.0038).
RESULTS
Patients
A total of 1,610,201 patients <18 years of age evaluated across the 23 PHIS EDs in 2012 were included in the study. Twenty‐one of the 23 EDs have academic affiliations; 10 are located in the South, 6 in the Midwest, 5 in the West, and 2 in the Northeast region of the United States. The annual ED volume for these EDs ranged from 25,090 to 136,160 (median, 65,075; interquartile range, 45,28085,206). Of the total patients, 1,415,721 (87.9%) were discharged following the index visit and comprised our study cohort. Of these patients, 47,294 (revisit rate: 3.3%) had an ED revisit within 72 hours. There were 4015 patients (0.3%) who returned more than once within 72 hours, and the largest proportion of these returned with infection‐related conditions. Of those returning, 37,999 (80.3%) were discharged again, whereas 9295 (19.7%) were admitted to the hospital (Figure 1). The demographic and clinical characteristics of study participants are displayed in Table 1.
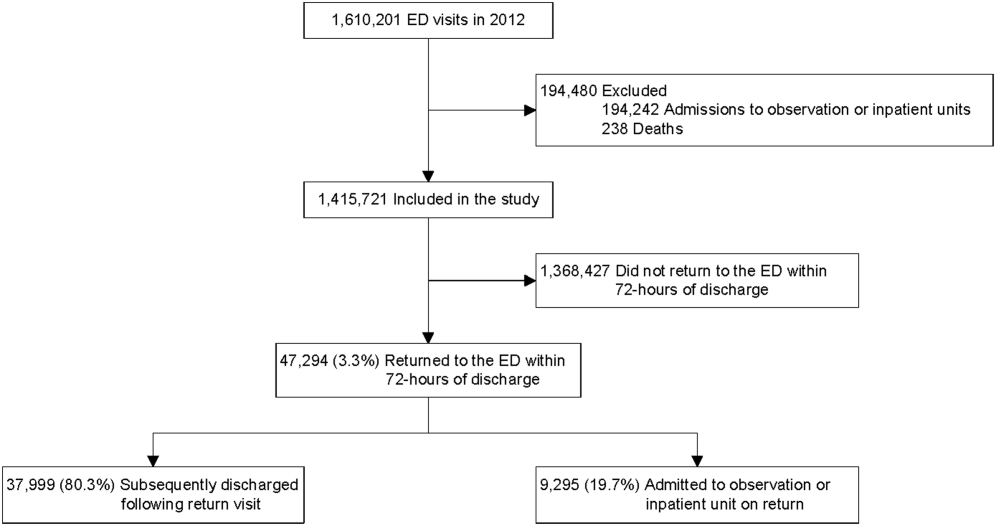
| Index Visit, n=1,415,721, n (%) | Return Visits Within 72 Hours of Discharge, n=47,294, 3.3% | ||
|---|---|---|---|
| Return to Discharge, n (%) | Return to Admission, n (%) | ||
| |||
| Gender, female | 659,417 (46.6) | 17,665 (46.5) | 4,304 (46.3) |
| Payor | |||
| Commercial | 379,403 (26.8) | 8,388 (22.1) | 3,214 (34.6) |
| Government | 925,147 (65.4) | 26,880 (70.7) | 5,786 (62.3) |
| Other | 111,171 (7.9) | 2,731 (7.2) | 295 (3.2) |
| Age | |||
| <30 days | 19,217 (1.4) | 488 (1.3) | 253 (2.7) |
| 30 days to <1 year | 216,967 (15.3) | 8,280 (21.8) | 2,372 (25.5) |
| 1 year to 4 years | 547,083 (38.6) | 15,542 (40.9) | 3,187 (34.3) |
| 5 years to 11 years | 409,463 (28.9) | 8,906 (23.4) | 1,964 (21.1) |
| 12 years to 17 years | 222,991 (15.8) | 4,783 (12.6) | 1,519 (16.3) |
| Socioeconomic statusa | |||
| <1.5 times FPL | 493,770 (34.9) | 13,851 (36.5) | 2,879 (31.0) |
| 1.5 to 2 times FPL | 455,490 (32.2) | 12,364 (32.5) | 2,904 (31.2) |
| 2 to 3 times FPL | 367,557 (26.0) | 9,560 (25.2) | 2,714 (29.2) |
| >3 times FPL | 98,904 (7.0) | 2,224 (5.9) | 798 (8.6) |
| Primary care physician density per 100,000 patients | |||
| Very low | 351,798 (24.9) | 8,727 (23.0) | 2,628 (28.3) |
| Low | 357,099 (25.2) | 9,810 (25.8) | 2,067 (22.2) |
| Medium | 347,995 (24.6) | 10,186 (26.8) | 2,035 (21.9) |
| High | 358,829 (25.4) | 9,276 (24.4) | 2,565 (27.6) |
| CCC present, yes | 125,774 (8.9) | 4,446 (11.7) | 2,825 (30.4) |
| Severity score | |||
| Low severity (0,1,2) | 721,061 (50.9) | 17,310 (45.6) | 2,955 (31.8) |
| High severity (3,4,5) | 694,660 (49.1) | 20,689 (54.5) | 6,340 (68.2) |
| Time of arrival | |||
| Day | 533,328 (37.7) | 13,449 (35.4) | 3,396 (36.5) |
| Evening | 684,873 (48.4) | 18,417 (48.5) | 4,378 (47.1) |
| Overnight | 197,520 (14.0) | 6,133 (16.1) | 1,521 (16.4) |
| Season | |||
| Winter | 384,957 (27.2) | 10,603 (27.9) | 2,844 (30.6) |
| Spring | 367,434 (26.0) | 9,923 (26.1) | 2,311 (24.9) |
| Summer | 303,872 (21.5) | 8,308 (21.9) | 1,875 (20.2) |
| Fall | 359,458 (25.4) | 9,165 (24.1) | 2,265 (24.4) |
| Weekday/weekend | |||
| Monday | 217,774 (15.4) | 5,646 (14.9) | 1,394 (15) |
| Tuesday | 198,220 (14.0) | 5,054 (13.3) | 1,316 (14.2) |
| Wednesday | 194,295 (13.7) | 4,985 (13.1) | 1,333 (14.3) |
| Thursday | 191,950 (13.6) | 5,123 (13.5) | 1,234 (13.3) |
| Friday | 190,022 (13.4) | 5,449 (14.3) | 1,228 (13.2) |
| Saturday | 202,247 (14.3) | 5,766 (15.2) | 1,364 (14.7) |
| Sunday | 221,213 (15.6) | 5,976 (15.7) | 1,426 (15.3) |
| Distance from hospital in miles, median (IQR) | 8.3 (4.614.9) | 9.2 (4.917.4) | 8.3 (4.614.9) |
| ED crowding score at index visit, median (IQR) | 1.0 (0.91.1) | 1.0 (0.91.1) | 1.0 (0.91.1) |
| ED LOS in hours at index visit, median (IQR) | 2.0 (1.03.0) | 3.0 (2.05.0) | 2.0 (1.03.0) |
ED Revisit Rates and Revisits Resulting in Admission
In multivariate analyses, compared to patients who did not return to the ED, patients who returned within 72 hours of discharge had higher odds of revisit if they had the following characteristics: a chronic condition, were <1 year old, a higher severity score, and public insurance. Visit‐level factors associated with higher odds of revisits included arrival for the index visit during the evening or overnight shift or on a Friday or Saturday, index visit during times of lower ED crowding, and living closer to the hospital. On return, patients were more likely to be hospitalized if they had a higher severity score, a chronic condition, private insurance, or were <30 days old. Visit‐level factors associated with higher odds of hospitalization at revisit included an index visit during the evening and overnight shift and living further from the hospital. Although the median SES and PCP density of a patient's area of residence were not associated with greater likelihood of returning, when they returned, patients residing in an area with a lower SES and higher PCP densities (>78.8 PCPs/100,000) had lower odds of being admitted to the hospital. Patients whose index visit was on a Sunday also had lower odds of being hospitalized upon return (Table 2).
| Characteristic | Adjusted OR of 72‐Hour Revisit (95% CI), n=1,380,723 | P Value | Adjusted OR of 72‐Hour Revisit Admissions (95% CI), n=46,364 | P Value |
|---|---|---|---|---|
| ||||
| Gender | ||||
| Male | 0.99 (0.971.01) | 0.2809 | 1.02 (0.971.07) | 0.5179 |
| Female | Reference | Reference | ||
| Payor | ||||
| Government | 1.14 (1.111.17) | <0.0001 | 0.68 (0.640.72) | <0.0001 |
| Other | 0.97 (0.921.01) | 0.1148 | 0.33 (0.280.39) | <0.0001 |
| Private | Reference | Reference | ||
| Age group | ||||
| 30 days to <1 year | 1.32 (1.221.42) | <0.0001 | 0.58 (0.490.69) | <0.0001 |
| 1 year to 5 years | 0.89 (0.830.96) | 0.003 | 0.41 (0.340.48) | <0.0001 |
| 5 years to 11 years | 0.69 (0.640.74) | <0.0001 | 0.40 (0.330.48) | <0.0001 |
| 12 years to 17 years | 0.72 (0.660.77) | <0.0001 | 0.50 (0.420.60) | <0.0001 |
| <30 days | Reference | Reference | ||
| Socioeconomic statusa | ||||
| % <1.5 times FPL | 0.96 (0.921.01) | 0.0992 | 0.82 (0.740.92) | 0.0005 |
| % 1.5 to 2 times FPL | 0.98 (0.941.02) | 0.2992 | 0.83 (0.750.92) | 0.0005 |
| % 2 to 3 times FPL | 1.02 (0.981.07) | 0.292 | 0.88 (0.790.97) | 0.01 |
| % >3 times FPL | Reference | Reference | ||
| Severity score | ||||
| High severity, 4, 5, 6 | 1.43 (1.401.45) | <0.0001 | 3.42 (3.233.62) | <0.0001 |
| Low severity, 1, 2, 3 | Reference | Reference | ||
| Presence of any CCC | ||||
| Yes | 1.90 (1.861.96) | <0.0001 | 2.92 (2.753.10) | <0.0001 |
| No | Reference | Reference | ||
| Time of arrival | ||||
| Evening | 1.05 (1.031.08) | <0.0001 | 1.37 (1.291.44) | <0.0001 |
| Overnight | 1.19 (1.151.22) | <0.0001 | 1.84 (1.711.97) | <0.0001 |
| Day | Reference | Reference | ||
| Season | ||||
| Winter | 1.09 (1.061.11) | <0.0001 | 1.06 (0.991.14) | 0.0722 |
| Spring | 1.07 (1.041.10) | <0.0001 | 0.98 (0.911.046) | 0.4763 |
| Summer | 1.05 (1.021.08) | 0.0011 | 0.93 (0.871.01) | 0.0729 |
| Fall | Reference | Reference | ||
| Weekday/weekend | ||||
| Thursday | 1.02 (0.9821.055) | 0.3297 | 0.983 (0.8971.078) | 0.7185 |
| Friday | 1.08 (1.041.11) | <0.0001 | 1.03 (0.941.13) | 0.5832 |
| Saturday | 1.08 (1.041.12) | <0.0001 | 0.89 (0.810.97) | 0.0112 |
| Sunday | 1.02 (0.991.06) | 0.2054 | 0.81 (0.740.89) | <0.0001 |
| Monday | 1.00 (0.961.03) | 0.8928 | 0.98 (0.901.07) | 0.6647 |
| Tuesday | 0.99 (0.951.03) | 0.5342 | 0.93 (0.851.02) | 0.1417 |
| Wednesday | Reference | Reference | ||
| PCP ratio per 100,000 patients | ||||
| 57.267.9 | 1.00 (0.961.04) | 0.8844 | 0.93 (0.841.03) | 0.1669 |
| 68.078.7 | 1.00 (0.951.04) | 0.8156 | 0.86 (0.770.96) | 0.0066 |
| >78.8 | 1.00 (0.951.04) | 0.6883 | 0.82 (0.730.92) | 0.001 |
| <57.2 | Reference | Reference | ||
| ED crowding score at index visitb | ||||
| 2 | 0.92 (0.900.95) | <0.0001 | 0.96 (0.881.05) | 0.3435 |
| 1 | Reference | Reference | ||
| Distance from hospitalc | ||||
| 3.168, 23.6 miles | 0.95 (0.940.96) | <0.0001 | 1.16 (1.121.19) | <0.0001 |
| 2.168, 8.7 miles | Reference | Reference | ||
| ED LOS at index visitb | ||||
| 3.7 hours | 1.003 (1.0011.005) | 0.0052 | NA | |
| 2.7 hours | Reference | |||
Diagnoses Associated With Return Visits
Patients with index visit diagnoses of sickle cell disease and leukemia had the highest proportion of return visits (10.7% and 7.3%, respectively). Other conditions with high revisit rates included infectious diseases such as cellulitis, bronchiolitis, and gastroenteritis. Patients with other chronic diseases such as diabetes and with devices, such as gastrostomy tubes, also had high rates of return visits. At return, the rate of hospitalization for these conditions ranged from a 1‐in‐6 chance of hospitalization for the diagnoses of a fever to a 1‐in‐2 chance of hospitalization for patients with sickle cell anemia (Table 3).
| Major Diagnostic Subgroup | No. of Index ED Visit Dischargesa | 72‐Hour Revisit, % (95% CI) | Admitted on Return, % (95% CI) |
|---|---|---|---|
| |||
| Sickle cell anemia | 2,531 | 10.7 (9.511.9) | 49.6 (43.755.6) |
| Neoplastic diseases, cancer | 536 | 7.3 (5.19.5) | 36 (2151) |
| Infectious gastrointestinal diseases | 802 | 7.2 (5.49.0) | 21 (1031) |
| Devices and complications of the circulatory systemb | 1,033 | 6.9 (5.38.4) | 45 (3457) |
| Other hematologic diseasesb | 1,538 | 6.1 (4.97.3) | 33 (2443) |
| Fever | 80,626 | 5.9 (5.76.0) | 16.3 (15.217.3) |
| Dehydration | 7,362 | 5.4 (5.25.5) | 34.6 (30.139) |
| Infectious respiratory diseases | 72,652 | 5.4 (5.25.5) | 28.6 (27.230) |
| Seizures | 17,637 | 5.3 (4.95.6) | 33.3 (30.336.4) |
| Other devices and complicationsb | 1,896 | 5.3 (4.36.3) | 39.0 (29.448.6) |
| Infectious skin, dermatologic and soft tissue diseases | 40,272 | 4.7 (4.55) | 20.0 (18.221.8) |
| Devices and complications of the gastrointestinal systemb | 4,692 | 4.6 (4.05.2) | 24.7 (18.930.4) |
| Vomiting | 44,730 | 4.4 (4.24.6) | 23.7 (21.825.6) |
| Infectious urinary tract diseases | 17,020 | 4.4 (4.14.7) | 25.9 (22.729) |
| Headache | 19,016 | 4.3 (4.14.6) | 28.2 (25.131.3) |
| Diabetes mellitus | 1,531 | 4.5 (3.35.3) | 29 (1840) |
| Abdominal pain | 39,594 | 4.2 (44.4) | 24.8 (22.726.8) |
| Other infectious diseasesb | 647 | 4.2 (2.65.7) | 33 (1651) |
| Gastroenteritis | 55,613 | 4.0 (3.84.1) | 20.6 (18.922.3) |
DISCUSSION
In this nationally representative sample of free‐standing children's hospitals, 3.3% of patients discharged from the ED returned to the same ED within 72 hours. This rate is similar to rates previously published in studies of general EDs.[11, 15] Of the returning children, over 80% were discharged again, and 19.7% were hospitalized, which is two‐thirds more than the admission rate at index visit (12%). In accordance with previous studies,[14, 16, 25] we found higher disease severity, presence of a chronic condition, and younger age were strongly associated with both the odds of patients returning to the ED and of being hospitalized at return. Patients who were hospitalized lived further away from the hospital and were of a higher SES. In this study, we show that visit‐level and access‐related factors are also associated with increased risk of return, although to a lesser degree. Patients seen on a weekend (Friday or Saturday) were found to have higher odds of returning, whereas those seen initially on a Sunday had lower odds of hospitalization at return. In this study, we also found that patients seen on the evening or night shifts at the index presentation had a significant association with return visits and hospitalization at return. Additionally, we found that although PCP density was not associated with the odds of returning to the ED, patients from areas with a higher PCP density were less likely to be admitted at return. In addition, by evaluating the diagnoses of patients who returned, we found that many infectious conditions commonly seen in the ED also had high return rates.
As previously shown,[23] we found that patients with complex and chronic diseases were at risk for ED revisits, especially patients with sickle cell anemia and cancer (mainly acute leukemia). In addition, patients with a chronic condition were 3 times more likely to be hospitalized when they returned. These findings may indicate an opportunity for improved discharge planning and coordination of care with subspecialty care providers for particularly at‐risk populations, or stronger consideration of admission at the index visit. However, admission for these patients at revisit may be unavoidable.
Excluding patients with chronic and complex conditions, the majority of conditions with high revisit rates were acute infectious conditions. One national study showed that >70% of ED revisits by patients with infectious conditions had planned ED follow‐up.[13] Although this study was unable to assess the reasons for return or admission at return, children with infectious diseases often worsen over time (eg, those with bronchiolitis). The relatively low admission rates at return for these conditions, despite evidence that providers may have a lower threshold for admission when a patient returns to the ED shortly after discharge,[24] may reflect the potential for improving follow‐up at the PCP office. However, although some revisits may be prevented,[37, 38] we recognize that an ED visit could be appropriate and necessary for some of these children, especially those without primary care.
Access to primary care and insurance status influence ED utilization.[14, 39, 40, 41] A fragmented healthcare system with poor access to primary care is strongly associated with utilization of the ED for nonurgent care. A high ED revisit rate might be indicative of poor coordination between ED and outpatient services.[9, 39, 42, 43, 44, 45, 46] Our study's finding of increased risk of return visit if the index visit occurred on a Friday or Saturday, and a decreased likelihood of subsequent admission when a patient returns on a Sunday, may suggest limited or perceived limited access to the PCP over a weekend. Although insured patients tend to use the ED less often for nonemergent cases, even when patients have PCPs, they might still choose to return to the ED out of convenience.[47, 48] This may be reflected in our finding that, when adjusted for insurance status and PCP density, patients who lived closer to the hospital were more likely to return, but less likely to be admitted, thereby suggesting proximity as a factor in the decision to return. It is also possible that patients residing further away returned to another institution. Although PCP density did not seem to be associated with revisits, patients who lived in areas with higher PCP density were less likely to be admitted when they returned. In this study, there was a stepwise gradient in the effect of PCP density on the odds of being hospitalized on return with those patients in areas with fewer PCPs being admitted at higher rates on return. Guttmann et al.,[40] in a recent study conducted in Canada where there is universal health insurance, showed that children residing in areas with higher PCP densities had higher rates of PCP visits but lower rates of ED visits compared to children residing in areas with lower PCP densities. It is possible that emergency physicians have more confidence that patients will have dedicated follow‐up when a PCP can be identified. These findings suggest that the development of PCP networks with expanded access, such as alignment of office hours with parent need and patient/parent education about PCP availability, may reduce ED revisits. Alternatively, creation of centralized hospital‐based urgent care centers for evening, night, and weekend visits may benefit both the patient and the PCP and avoid ED revisits and associated costs.
Targeting and eliminating disparities in care might also play a role in reducing ED revisits. Prior studies have shown that publicly insured individuals, in particular, frequently use the ED as their usual source of care and are more likely to return to the ED within 72 hours of an initial visit.[23, 39, 44, 49, 50] Likewise, we found that patients with public insurance were more likely to return but less likely to be admitted on revisit. After controlling for disease severity and other demographic variables, patients with public insurance and of lower socioeconomic status still had lower odds of being hospitalized following a revisit. This might also signify an increase of avoidable hospitalizations among patients of higher SES or with private insurance. Further investigation is needed to explore the reasons for these differences and to identify effective interventions to eliminate disparities.
Our findings have implications for emergency care, ambulatory care, and the larger healthcare system. First, ED revisits are costly and contribute to already overburdened EDs.[10, 11] The average ED visit incurs charges that are 2 to 5 times more than an outpatient office visit.[49, 50] Careful coordination of ambulatory and ED services could not only ensure optimal care for patients, but could save the US healthcare system billions of dollars in potentially avoidable healthcare expenditures.[49, 50] Second, prior studies have demonstrated a consistent relationship between poor access to primary care and increased use of the ED for nonurgent conditions.[42] Publicly insured patients have been shown to have disproportionately increased difficulty acquiring and accessing primary care.[41, 42, 47, 51] Furthermore, conditions with high ED revisit rates are similar to conditions reported by Berry et al.4 as having the highest hospital readmission rates such as cancer, sickle cell anemia, seizure, pneumonia, asthma, and gastroenteritis. This might suggest a close relationship between 72‐hour ED revisits and 30‐day hospital readmissions. In light of the recent expansion of health insurance coverage to an additional 30 million individuals, the need for better coordination of services throughout the entire continuum of care, including primary care, ED, and inpatient services, has never been more important.[52] Future improvements could explore condition‐specific revisit or readmission rates to identify the most effective interventions to reduce the possibly preventable returns.
This study has several limitations. First, as an administrative database, PHIS has limited clinical data, and reasons for return visits could not be assessed. Variations between hospitals in diagnostic coding might also lead to misclassification bias. Second, we were unable to assess return visits to a different ED. Thus, we may have underestimated revisit frequency. However, because children are generally more likely to seek repeat care in the same hospital,[3] we believe our estimate of return visit rate approximates the actual return visit rate; our findings are also similar to previously reported rates. Third, for the PCP density factor, we were unable to account for types of insurance each physician accepted and influence on return rates. Fourth, return visits in our sample could have been for conditions unrelated to the diagnosis at index visit, though the short timeframe considered for revisits makes this less likely. In addition, the crowding index does not include the proportion of occupied beds at the precise moment of the index visit. Finally, this cohort includes only children seen in the EDs of pediatric hospitals, and our findings may not be generalizable to all EDs who provide care for ill and injured children.
We have shown that, in addition to previously identified patient level factors, there are visit‐level and access‐related factors associated with pediatric ED return visits. Eighty percent are discharged again, and almost one‐fifth of returning patients are admitted to the hospital. Admitted patients tend to be younger, sicker, chronically ill, and live farther from the hospital. By being aware of patients' comorbidities, PCP access, as well as certain diagnoses associated with high rates of return, physicians may better target interventions to optimize care. This may include having a lower threshold for hospitalization at the initial visit for children at high risk of return, and communication with the PCP at the time of discharge to ensure close follow‐up. Our study helps to provide benchmarks around ED revisit rates, and may serve as a starting point to better understand variation in care. Future efforts should aim to find creative solutions at individual institutions, with the goal of disseminating and replicating successes more broadly. For example, investigators in Boston have shown that the use of a comprehensive home‐based asthma management program has been successful in decreasing emergency department visits and hospitalization rates.[53] It is possible that this approach could be spread to other institutions to decrease revisits for patients with asthma. As a next step, the authors have undertaken an investigation to identify hospital‐level characteristics that may be associated with rates of return visits.
Acknowledgements
The authors thank the following members of the PHIS ED Return Visits Research Group for their contributions to the data analysis plan and interpretation of results of this study: Rustin Morse, MD, Children's Medical Center of Dallas; Catherine Perron, MD, Boston Children's Hospital; John Cheng, MD, Children's Healthcare of Atlanta; Shabnam Jain, MD, MPH, Children's Healthcare of Atlanta; and Amanda Montalbano, MD, MPH, Children's Mercy Hospitals and Clinics. These contributors did not receive compensation for their help with this work.
Disclosures
A.T.A. and A.M.S. conceived the study and developed the initial study design. All authors were involved in the development of the final study design and data analysis plan. C.W.T. collected and analyzed the data. A.T.A. and C.W.T. had full access to all of the data and take responsibility for the integrity of the data and the accuracy of the data analysis. All authors were involved in the interpretation of the data. A.T.A. drafted the article, and all authors made critical revisions to the initial draft and subsequent versions. A.T.A. and A.M.S. take full responsibility for the article as a whole. The authors report no conflicts of interest.
- Joint policy statement—guidelines for care of children in the emergency department. Pediatrics. 2009;124:1233–1243.
- , , , , . Return visits to a pediatric emergency department. Pediatr Emerg Care. 2004;20:166–171.
- , . Hospital readmission as an accountability measure. JAMA. 2011;305:504–505.
- , , , et al. Hospital utilization and characteristics of patients experiencing recurrent readmissions within children's hospitals. JAMA. 2011;305:682–690.
- , , , et al. Pediatric readmission prevalence and variability across hospitals. JAMA. 2013;309:372–380.
- . Farewell, and don't come back. Health reform gives hospitals a big incentive to send patients home for good. US News World Rep. 2010;147:20, 22–23.
- . CMS' stealth health reform. Plan to reduce readmissions and boost the continuum of care. Hosp Health Netw. 2008;82:24.
- , . Return visits to the emergency department. J Emerg Med. 1987;5:359–362.
- , , , . Emergency department visits after hospital discharge: a missing part of the equation. Ann Emerg Med. 2013;62:145–150.
- , , , , . Quality indicators for high acuity pediatric conditions. Pediatrics. 2013;132:752–762.
- , . Revisiting hospital readmissions. JAMA. 2013;309:398–400.
- , , . Thirty‐day readmissions: the clock is ticking. JAMA. 2013;309:345–346.
- . Patients seen in emergency departments who had a prior visit within the previous 72 h‐National Hospital Ambulatory Medical Care Survey, 2002. Public Health. 2005;119:914–918.
- , , , , . A national depiction of children with return visits to the emergency department within 72 hours, 2001–2007. Pediatr Emerg Care. 2012;28:606–610.
- , , , et al. How well can hospital readmission be predicted in a cohort of hospitalized children? A retrospective, multicenter study. Pediatrics. 2009;123:286–293.
- , , . Unscheduled return visits to the pediatric emergency department‐one‐year experience. Pediatr Emerg Care. 2006;22:545–549.
- , . Return visits to the emergency department among febrile children 3 to 36 months of age. Pediatr Emerg Care. 2011;27:1126–1129.
- , , , . Pediatric emergency department recidivism: demographic characteristics and diagnostic predictors. J Emerg Nurs. 2006;32:131–138.
- Healthcare Cost and Utilization Project. Pediatric emergency department visits in community hospitals from selected states, 2005. Statistical brief #52. Available at: http://www.ncbi.nlm.nih.gov/books/NBK56039. Accessed October 3, 2013.
- , , , , , . Factors influencing infant visits to emergency departments. Pediatrics. 2000;106:1031–1039.
- , , , . Early pediatric emergency department return visits: a prospective patient‐centric assessment. Clin Pediatr (Phila). 2012;51:651–658.
- , , , , . Unscheduled return visits with and without admission post emergency department discharge. J Emerg Med. 2012;43:1110–1118.
- , , , . Unscheduled revisits to a pediatric emergency department: risk factors for children with fever or infection‐related complaints. Pediatr Emerg Care. 2005;21:816–821.
- , , , , . Unscheduled return visits to the emergency department: consequences for triage. Acad Emerg Med. 2013;20:33–39.
- , , , et al. Repeat pediatric visits to a general emergency department. Ann Emerg Med. 1996;28:467–473.
- , , , , . Emergency department revisits. Ann Emerg Med. 1989;18:964–968.
- US Department of Health 19:70–78.
- , , . Pediatric deaths attributable to complex chronic conditions: a population‐based study of Washington State, 1980–1997. Pediatrics. 2000;106:205–209.
- , , , , , . Deaths attributed to pediatric complex chronic conditions: national trends and implications for supportive care services. Pediatrics. 2001;107:E99.
- , , . Where do children with complex chronic conditions die? Patterns in Washington State, 1980–1998. Pediatrics. 2002;109:656–660.
- Dartmouth Atlas of Health Care. Hospital and physician capacity, 2006. Available at: http://www.dartmouthatlas.org/data/topic/topic.aspx?cat=24. Accessed October 7, 2013.
- Dartmouth Atlas of Health Care. Research methods. What is an HSA/HRR? Available at: http://www.dartmouthatlas.org/tools/faq/researchmethods.aspx. Accessed October 7, 2013,.
- Dartmouth Atlas of Health Care. Appendix on the geography of health care in the United States. Available at: http://www.dartmouthatlas.org/downloads/methods/geogappdx.pdf. Accessed October 7, 2013.
- , , . Emergency department crowding: prioritising quantified crowding measures using a Delphi study. Emerg Med J. 2012;29:868–871.
- , , , , . A new diagnosis grouping system for child emergency department visits. Acad Emerg Med. 2010;17:204–213.
- , , , et al. Effectiveness of emergency department asthma management strategies on return visits in children: a population‐based study. Pediatrics. 2007;120:e1402–e1410.
- , , , . Emergency department patients with diabetes have better glycemic control when they have identifiable primary care providers. Acad Emerg Med. 2012;19:650–655.
- , , , , , Newman L. Impact of socioeconomic status on hospital use in New York City. Health Aff (Millwood). 1993;12:162–173.
- , , , , . Primary care physician supply and children's health care use, access, and outcomes: findings from Canada. Pediatrics. 2010;125:1119–1126.
- , , , et al. Insurance status and access to urgent ambulatory care follow‐up appointments. JAMA. 2005;294:1248–1254.
- , . Emergency departments, Medicaid costs, and access to primary care—understanding the link. N Engl J Med. 2012;366:2141–2143.
- Committee on the Future of Emergency Care in the United States Health System. Emergency Care for Children: Growing Pains. Washington, DC: The National Academies Press; 2007.
- Committee on the Future of Emergency Care in the United States Health System. Hospital‐Based Emergency Care: At the Breaking Point. Washington, DC: The National Academies Press; 2007.
- , . Geographic variation in access to care—the relationship with quality. N Engl J Med. 2012;367:3–6.
- , , , , . Trends and characteristics of US emergency department visits, 1997–2007. JAMA. 2010;304:664–670.
- , , , , . Ambulatory visits to hospital emergency departments. Patterns and reasons for use. 24 Hours in the ED Study Group. JAMA. 1996;276:460–465.
- , , , , . Emergency department workload increase: dependence on primary care? J Emerg Med. 2010;38:279–285.
- Network for Excellence in Health Innovation. Leading healthcare research organizations to examine emergency department overuse. New England Research Institute, 2008. Available at: http://www.nehi.net/news/310‐leading‐health‐care‐research‐organizations‐to‐examine‐emergency‐department‐overuse/view. Accessed October 4, 2013.
- Robert Wood Johnson Foundation. Quality field notes: reducing inappropriate emergency department use. Available at: http://www.rwjf.org/en/research‐publications/find‐rwjf‐research/2013/09/quality‐field‐notes–reducing‐inappropriate‐emergency‐department.html.
- Access of Medicaid recipients to outpatient care. N Engl J Med. 1994;330:1426–1430.
- Medicaid policy statement. Pediatrics. 2013;131:e1697–e1706.
- , , , et al. Community asthma initiative: evaluation of a quality improvement program for comprehensive asthma care. Pediatrics. 2012;129:465–472.
Returns to the hospital following recent encounters, such as an admission to the inpatient unit or evaluation in an emergency department (ED), may reflect the natural progression of a disease, the quality of care received during the initial admission or visit, or the quality of the underlying healthcare system.[1, 2, 3, 4, 5, 6, 7, 8, 9, 10] Although national attention has focused on hospital readmissions,[3, 4, 5, 6, 7, 11, 12] ED revisits are a source of concern to emergency physicians.[8, 9] Some ED revisits are medically necessary, but revisits that may be managed in the primary care setting contribute to ED crowding, can be stressful to patients and providers, and increase healthcare costs.[10, 11, 12] Approximately 27 million annual ED visits are made by children, accounting for over one‐quarter of all ED visits in the United States, with a reported ED revisit rate of 2.5% to 5.2%.[2, 13, 14, 15, 16, 17, 18, 19, 20] Improved understanding of the patient‐level or visit‐level factors associated with ED revisits may provide an opportunity to enhance disposition decision making at the index visit and optimize site of and communication around follow‐up care.
Previous studies on ED revisits have largely been conducted in single centers and have used variable visit intervals ranging between 48 hours and 30 days.[2, 13, 16, 18, 21, 22, 23, 24, 25] Two national studies used the National Hospital Ambulatory Medical Care Survey, which includes data from both general and pediatric EDs.[13, 14] Factors identified to be associated with increased odds of returning were: young age, higher acuity, chronic conditions, and public insurance. One national study identified some diagnoses associated with higher likelihood of returning,[13] whereas the other focused primarily on infectious diseaserelated diagnoses.[14]
The purpose of this study was to describe the prevalence of return visits specifically to pediatric EDs and to investigate patient‐level, visit‐level, and healthcare systemrelated factors that may be associated with return visits and hospitalization at return.
METHODS
Study Design and Data Source
This retrospective cohort study used data from the Pediatric Health Information System (PHIS), an administrative database with data from 44 tertiary care pediatric hospitals in 27 US states and the District of Columbia. This database contains patient demographics, diagnoses, and procedures as well as medications, diagnostic imaging, laboratory, and supply charges for each patient. Data are deidentified prior to inclusion; encrypted medical record numbers allow for the identification of individual patients across all ED visits and hospitalizations to the same hospital. The Children's Hospital Association (Overland Park, KS) and participating hospitals jointly assure the quality and integrity of the data. This study was approved by the institutional review board at Boston Children's Hospital with a waiver for informed consent granted.
Study Population and Protocol
To standardize comparisons across the hospitals, we included data from 23 of the 44 hospitals in PHIS; 7 were excluded for not including ED‐specific data. For institutions that collect information from multiple hospitals within their healthcare system, we included only records from the main campus or children's hospital when possible, leading to the exclusion of 9 hospitals where the data were not able to be segregated. As an additional level of data validation, we compared the hospital‐level ED volume and admission rates as reported in the PHIS to those reported to a separate database (the Pediatric Analysis and Comparison Tool). We further excluded 5 hospitals whose volume differed by >10% between these 2 data sources.
Patients <18 years of age who were discharged from these EDs following their index visit in 2012 formed the eligible cohort.
Key Outcome Measures
The primary outcomes were return visits within 72 hours of discharge from the ED, and return visits resulting in hospitalization, including observation status. We defined an ED revisit as a return within 72 hours of ED discharge regardless of whether the patient was subsequently discharged from the ED on the return visit or hospitalized. We assessed revisits within 72 hours of an index ED discharge, because return visits within this time frame are likely to be related to the index visit.[2, 13, 16, 21, 22, 24, 25, 26]
Factors Associated With ED Revisits
A priori, we chose to adjust for the following patient‐level factors: age (<30 days, 30 days<1 year, 14 years, 511 years, 1217 years), gender, and socioeconomic status (SES) measured as the zip codebased median household income, obtained from the 2010 US Census, with respect to the federal poverty level (FPL) (<1.5 FPL, 1.52 FPL, 23 FPL, and >3 FPL).[27] We also adjusted for insurance type (commercial, government, or other), proximity of patient's home zip code to hospital (modeled as the natural log of the geographical distance to patient's home address from the hospital), ED diagnosis‐based severity classification system score (1=low severity, 5=high severity),[28] presence of a complex chronic condition at the index or prior visits using a validated classification scheme,[15, 29, 30, 31] and primary care physician (PCP) density per 100,000 in the patient's residential area (modeled as quartiles: very low, <57.2; low, 57.267.9; medium, 68.078.7; high, >78.8). PCP density, defined by the Dartmouth Atlas of Health Care,[32, 33, 34] is the number of primary care physicians per 100,000 residents (PCP count) in federal health service areas (HSA). Patients were assigned to a corresponding HSA based on their home zip code.
Visit‐level factors included arrival time of index visit (8:01 am 4:00 pm, 4:01 pm12:00 am, 12:01 am8 am representing day, evening, and overnight arrival, respectively), day of the week, season, length of stay (LOS) in the ED during the index visit, and ED crowding (calculated as the average daily LOS/yearly average LOS for the individual ED).[35] We categorized the ED primary diagnosis for each visit using the major diagnosis groupings of a previously described pediatric ED‐specific classification scheme.[36] Using International Classification of Diseases, Ninth Revision (ICD‐9) codes, we identified the conditions with the highest ED revisit rates.
Statistical Analyses
Categorical variables describing the study cohort were summarized using frequencies and percentages. Continuous variables were summarized using mean, median, and interquartile range values, where appropriate. We used 2 different hierarchical logistic regression models to assess revisit rates by patient‐ and visit‐level characteristics. The initial model included all patients discharged from the ED following the index visit and assessed for the outcome of a revisit within 72 hours. The second model considered only patients who returned within 72 hours of an index visit and assessed for hospitalization on that return visit. We used generalized linear mixed effects models, with hospital as a random effect to account for the presence of correlated data (within hospitals), nonconstant variability (across hospitals), and binary responses. Adjusted odds ratios with 95% confidence intervals were used as summary measures of the effect of the individual adjusters. Adjusters were missing in fewer than 5% of patients across participating hospitals. Statistical analyses were performed using SAS version 9.3 (SAS Institute Inc., Cary, NC); 2‐sided P values <0.004 were considered statistically significant to account for multiple comparisons (Bonferroni‐adjusted level of significance=0.0038).
RESULTS
Patients
A total of 1,610,201 patients <18 years of age evaluated across the 23 PHIS EDs in 2012 were included in the study. Twenty‐one of the 23 EDs have academic affiliations; 10 are located in the South, 6 in the Midwest, 5 in the West, and 2 in the Northeast region of the United States. The annual ED volume for these EDs ranged from 25,090 to 136,160 (median, 65,075; interquartile range, 45,28085,206). Of the total patients, 1,415,721 (87.9%) were discharged following the index visit and comprised our study cohort. Of these patients, 47,294 (revisit rate: 3.3%) had an ED revisit within 72 hours. There were 4015 patients (0.3%) who returned more than once within 72 hours, and the largest proportion of these returned with infection‐related conditions. Of those returning, 37,999 (80.3%) were discharged again, whereas 9295 (19.7%) were admitted to the hospital (Figure 1). The demographic and clinical characteristics of study participants are displayed in Table 1.
| Index Visit, n=1,415,721, n (%) | Return Visits Within 72 Hours of Discharge, n=47,294, 3.3% | ||
|---|---|---|---|
| Return to Discharge, n (%) | Return to Admission, n (%) | ||
| |||
| Gender, female | 659,417 (46.6) | 17,665 (46.5) | 4,304 (46.3) |
| Payor | |||
| Commercial | 379,403 (26.8) | 8,388 (22.1) | 3,214 (34.6) |
| Government | 925,147 (65.4) | 26,880 (70.7) | 5,786 (62.3) |
| Other | 111,171 (7.9) | 2,731 (7.2) | 295 (3.2) |
| Age | |||
| <30 days | 19,217 (1.4) | 488 (1.3) | 253 (2.7) |
| 30 days to <1 year | 216,967 (15.3) | 8,280 (21.8) | 2,372 (25.5) |
| 1 year to 4 years | 547,083 (38.6) | 15,542 (40.9) | 3,187 (34.3) |
| 5 years to 11 years | 409,463 (28.9) | 8,906 (23.4) | 1,964 (21.1) |
| 12 years to 17 years | 222,991 (15.8) | 4,783 (12.6) | 1,519 (16.3) |
| Socioeconomic statusa | |||
| <1.5 times FPL | 493,770 (34.9) | 13,851 (36.5) | 2,879 (31.0) |
| 1.5 to 2 times FPL | 455,490 (32.2) | 12,364 (32.5) | 2,904 (31.2) |
| 2 to 3 times FPL | 367,557 (26.0) | 9,560 (25.2) | 2,714 (29.2) |
| >3 times FPL | 98,904 (7.0) | 2,224 (5.9) | 798 (8.6) |
| Primary care physician density per 100,000 patients | |||
| Very low | 351,798 (24.9) | 8,727 (23.0) | 2,628 (28.3) |
| Low | 357,099 (25.2) | 9,810 (25.8) | 2,067 (22.2) |
| Medium | 347,995 (24.6) | 10,186 (26.8) | 2,035 (21.9) |
| High | 358,829 (25.4) | 9,276 (24.4) | 2,565 (27.6) |
| CCC present, yes | 125,774 (8.9) | 4,446 (11.7) | 2,825 (30.4) |
| Severity score | |||
| Low severity (0,1,2) | 721,061 (50.9) | 17,310 (45.6) | 2,955 (31.8) |
| High severity (3,4,5) | 694,660 (49.1) | 20,689 (54.5) | 6,340 (68.2) |
| Time of arrival | |||
| Day | 533,328 (37.7) | 13,449 (35.4) | 3,396 (36.5) |
| Evening | 684,873 (48.4) | 18,417 (48.5) | 4,378 (47.1) |
| Overnight | 197,520 (14.0) | 6,133 (16.1) | 1,521 (16.4) |
| Season | |||
| Winter | 384,957 (27.2) | 10,603 (27.9) | 2,844 (30.6) |
| Spring | 367,434 (26.0) | 9,923 (26.1) | 2,311 (24.9) |
| Summer | 303,872 (21.5) | 8,308 (21.9) | 1,875 (20.2) |
| Fall | 359,458 (25.4) | 9,165 (24.1) | 2,265 (24.4) |
| Weekday/weekend | |||
| Monday | 217,774 (15.4) | 5,646 (14.9) | 1,394 (15) |
| Tuesday | 198,220 (14.0) | 5,054 (13.3) | 1,316 (14.2) |
| Wednesday | 194,295 (13.7) | 4,985 (13.1) | 1,333 (14.3) |
| Thursday | 191,950 (13.6) | 5,123 (13.5) | 1,234 (13.3) |
| Friday | 190,022 (13.4) | 5,449 (14.3) | 1,228 (13.2) |
| Saturday | 202,247 (14.3) | 5,766 (15.2) | 1,364 (14.7) |
| Sunday | 221,213 (15.6) | 5,976 (15.7) | 1,426 (15.3) |
| Distance from hospital in miles, median (IQR) | 8.3 (4.614.9) | 9.2 (4.917.4) | 8.3 (4.614.9) |
| ED crowding score at index visit, median (IQR) | 1.0 (0.91.1) | 1.0 (0.91.1) | 1.0 (0.91.1) |
| ED LOS in hours at index visit, median (IQR) | 2.0 (1.03.0) | 3.0 (2.05.0) | 2.0 (1.03.0) |
ED Revisit Rates and Revisits Resulting in Admission
In multivariate analyses, compared to patients who did not return to the ED, patients who returned within 72 hours of discharge had higher odds of revisit if they had the following characteristics: a chronic condition, were <1 year old, a higher severity score, and public insurance. Visit‐level factors associated with higher odds of revisits included arrival for the index visit during the evening or overnight shift or on a Friday or Saturday, index visit during times of lower ED crowding, and living closer to the hospital. On return, patients were more likely to be hospitalized if they had a higher severity score, a chronic condition, private insurance, or were <30 days old. Visit‐level factors associated with higher odds of hospitalization at revisit included an index visit during the evening and overnight shift and living further from the hospital. Although the median SES and PCP density of a patient's area of residence were not associated with greater likelihood of returning, when they returned, patients residing in an area with a lower SES and higher PCP densities (>78.8 PCPs/100,000) had lower odds of being admitted to the hospital. Patients whose index visit was on a Sunday also had lower odds of being hospitalized upon return (Table 2).
| Characteristic | Adjusted OR of 72‐Hour Revisit (95% CI), n=1,380,723 | P Value | Adjusted OR of 72‐Hour Revisit Admissions (95% CI), n=46,364 | P Value |
|---|---|---|---|---|
| ||||
| Gender | ||||
| Male | 0.99 (0.971.01) | 0.2809 | 1.02 (0.971.07) | 0.5179 |
| Female | Reference | Reference | ||
| Payor | ||||
| Government | 1.14 (1.111.17) | <0.0001 | 0.68 (0.640.72) | <0.0001 |
| Other | 0.97 (0.921.01) | 0.1148 | 0.33 (0.280.39) | <0.0001 |
| Private | Reference | Reference | ||
| Age group | ||||
| 30 days to <1 year | 1.32 (1.221.42) | <0.0001 | 0.58 (0.490.69) | <0.0001 |
| 1 year to 5 years | 0.89 (0.830.96) | 0.003 | 0.41 (0.340.48) | <0.0001 |
| 5 years to 11 years | 0.69 (0.640.74) | <0.0001 | 0.40 (0.330.48) | <0.0001 |
| 12 years to 17 years | 0.72 (0.660.77) | <0.0001 | 0.50 (0.420.60) | <0.0001 |
| <30 days | Reference | Reference | ||
| Socioeconomic statusa | ||||
| % <1.5 times FPL | 0.96 (0.921.01) | 0.0992 | 0.82 (0.740.92) | 0.0005 |
| % 1.5 to 2 times FPL | 0.98 (0.941.02) | 0.2992 | 0.83 (0.750.92) | 0.0005 |
| % 2 to 3 times FPL | 1.02 (0.981.07) | 0.292 | 0.88 (0.790.97) | 0.01 |
| % >3 times FPL | Reference | Reference | ||
| Severity score | ||||
| High severity, 4, 5, 6 | 1.43 (1.401.45) | <0.0001 | 3.42 (3.233.62) | <0.0001 |
| Low severity, 1, 2, 3 | Reference | Reference | ||
| Presence of any CCC | ||||
| Yes | 1.90 (1.861.96) | <0.0001 | 2.92 (2.753.10) | <0.0001 |
| No | Reference | Reference | ||
| Time of arrival | ||||
| Evening | 1.05 (1.031.08) | <0.0001 | 1.37 (1.291.44) | <0.0001 |
| Overnight | 1.19 (1.151.22) | <0.0001 | 1.84 (1.711.97) | <0.0001 |
| Day | Reference | Reference | ||
| Season | ||||
| Winter | 1.09 (1.061.11) | <0.0001 | 1.06 (0.991.14) | 0.0722 |
| Spring | 1.07 (1.041.10) | <0.0001 | 0.98 (0.911.046) | 0.4763 |
| Summer | 1.05 (1.021.08) | 0.0011 | 0.93 (0.871.01) | 0.0729 |
| Fall | Reference | Reference | ||
| Weekday/weekend | ||||
| Thursday | 1.02 (0.9821.055) | 0.3297 | 0.983 (0.8971.078) | 0.7185 |
| Friday | 1.08 (1.041.11) | <0.0001 | 1.03 (0.941.13) | 0.5832 |
| Saturday | 1.08 (1.041.12) | <0.0001 | 0.89 (0.810.97) | 0.0112 |
| Sunday | 1.02 (0.991.06) | 0.2054 | 0.81 (0.740.89) | <0.0001 |
| Monday | 1.00 (0.961.03) | 0.8928 | 0.98 (0.901.07) | 0.6647 |
| Tuesday | 0.99 (0.951.03) | 0.5342 | 0.93 (0.851.02) | 0.1417 |
| Wednesday | Reference | Reference | ||
| PCP ratio per 100,000 patients | ||||
| 57.267.9 | 1.00 (0.961.04) | 0.8844 | 0.93 (0.841.03) | 0.1669 |
| 68.078.7 | 1.00 (0.951.04) | 0.8156 | 0.86 (0.770.96) | 0.0066 |
| >78.8 | 1.00 (0.951.04) | 0.6883 | 0.82 (0.730.92) | 0.001 |
| <57.2 | Reference | Reference | ||
| ED crowding score at index visitb | ||||
| 2 | 0.92 (0.900.95) | <0.0001 | 0.96 (0.881.05) | 0.3435 |
| 1 | Reference | Reference | ||
| Distance from hospitalc | ||||
| 3.168, 23.6 miles | 0.95 (0.940.96) | <0.0001 | 1.16 (1.121.19) | <0.0001 |
| 2.168, 8.7 miles | Reference | Reference | ||
| ED LOS at index visitb | ||||
| 3.7 hours | 1.003 (1.0011.005) | 0.0052 | NA | |
| 2.7 hours | Reference | |||
Diagnoses Associated With Return Visits
Patients with index visit diagnoses of sickle cell disease and leukemia had the highest proportion of return visits (10.7% and 7.3%, respectively). Other conditions with high revisit rates included infectious diseases such as cellulitis, bronchiolitis, and gastroenteritis. Patients with other chronic diseases such as diabetes and with devices, such as gastrostomy tubes, also had high rates of return visits. At return, the rate of hospitalization for these conditions ranged from a 1‐in‐6 chance of hospitalization for the diagnoses of a fever to a 1‐in‐2 chance of hospitalization for patients with sickle cell anemia (Table 3).
| Major Diagnostic Subgroup | No. of Index ED Visit Dischargesa | 72‐Hour Revisit, % (95% CI) | Admitted on Return, % (95% CI) |
|---|---|---|---|
| |||
| Sickle cell anemia | 2,531 | 10.7 (9.511.9) | 49.6 (43.755.6) |
| Neoplastic diseases, cancer | 536 | 7.3 (5.19.5) | 36 (2151) |
| Infectious gastrointestinal diseases | 802 | 7.2 (5.49.0) | 21 (1031) |
| Devices and complications of the circulatory systemb | 1,033 | 6.9 (5.38.4) | 45 (3457) |
| Other hematologic diseasesb | 1,538 | 6.1 (4.97.3) | 33 (2443) |
| Fever | 80,626 | 5.9 (5.76.0) | 16.3 (15.217.3) |
| Dehydration | 7,362 | 5.4 (5.25.5) | 34.6 (30.139) |
| Infectious respiratory diseases | 72,652 | 5.4 (5.25.5) | 28.6 (27.230) |
| Seizures | 17,637 | 5.3 (4.95.6) | 33.3 (30.336.4) |
| Other devices and complicationsb | 1,896 | 5.3 (4.36.3) | 39.0 (29.448.6) |
| Infectious skin, dermatologic and soft tissue diseases | 40,272 | 4.7 (4.55) | 20.0 (18.221.8) |
| Devices and complications of the gastrointestinal systemb | 4,692 | 4.6 (4.05.2) | 24.7 (18.930.4) |
| Vomiting | 44,730 | 4.4 (4.24.6) | 23.7 (21.825.6) |
| Infectious urinary tract diseases | 17,020 | 4.4 (4.14.7) | 25.9 (22.729) |
| Headache | 19,016 | 4.3 (4.14.6) | 28.2 (25.131.3) |
| Diabetes mellitus | 1,531 | 4.5 (3.35.3) | 29 (1840) |
| Abdominal pain | 39,594 | 4.2 (44.4) | 24.8 (22.726.8) |
| Other infectious diseasesb | 647 | 4.2 (2.65.7) | 33 (1651) |
| Gastroenteritis | 55,613 | 4.0 (3.84.1) | 20.6 (18.922.3) |
DISCUSSION
In this nationally representative sample of free‐standing children's hospitals, 3.3% of patients discharged from the ED returned to the same ED within 72 hours. This rate is similar to rates previously published in studies of general EDs.[11, 15] Of the returning children, over 80% were discharged again, and 19.7% were hospitalized, which is two‐thirds more than the admission rate at index visit (12%). In accordance with previous studies,[14, 16, 25] we found higher disease severity, presence of a chronic condition, and younger age were strongly associated with both the odds of patients returning to the ED and of being hospitalized at return. Patients who were hospitalized lived further away from the hospital and were of a higher SES. In this study, we show that visit‐level and access‐related factors are also associated with increased risk of return, although to a lesser degree. Patients seen on a weekend (Friday or Saturday) were found to have higher odds of returning, whereas those seen initially on a Sunday had lower odds of hospitalization at return. In this study, we also found that patients seen on the evening or night shifts at the index presentation had a significant association with return visits and hospitalization at return. Additionally, we found that although PCP density was not associated with the odds of returning to the ED, patients from areas with a higher PCP density were less likely to be admitted at return. In addition, by evaluating the diagnoses of patients who returned, we found that many infectious conditions commonly seen in the ED also had high return rates.
As previously shown,[23] we found that patients with complex and chronic diseases were at risk for ED revisits, especially patients with sickle cell anemia and cancer (mainly acute leukemia). In addition, patients with a chronic condition were 3 times more likely to be hospitalized when they returned. These findings may indicate an opportunity for improved discharge planning and coordination of care with subspecialty care providers for particularly at‐risk populations, or stronger consideration of admission at the index visit. However, admission for these patients at revisit may be unavoidable.
Excluding patients with chronic and complex conditions, the majority of conditions with high revisit rates were acute infectious conditions. One national study showed that >70% of ED revisits by patients with infectious conditions had planned ED follow‐up.[13] Although this study was unable to assess the reasons for return or admission at return, children with infectious diseases often worsen over time (eg, those with bronchiolitis). The relatively low admission rates at return for these conditions, despite evidence that providers may have a lower threshold for admission when a patient returns to the ED shortly after discharge,[24] may reflect the potential for improving follow‐up at the PCP office. However, although some revisits may be prevented,[37, 38] we recognize that an ED visit could be appropriate and necessary for some of these children, especially those without primary care.
Access to primary care and insurance status influence ED utilization.[14, 39, 40, 41] A fragmented healthcare system with poor access to primary care is strongly associated with utilization of the ED for nonurgent care. A high ED revisit rate might be indicative of poor coordination between ED and outpatient services.[9, 39, 42, 43, 44, 45, 46] Our study's finding of increased risk of return visit if the index visit occurred on a Friday or Saturday, and a decreased likelihood of subsequent admission when a patient returns on a Sunday, may suggest limited or perceived limited access to the PCP over a weekend. Although insured patients tend to use the ED less often for nonemergent cases, even when patients have PCPs, they might still choose to return to the ED out of convenience.[47, 48] This may be reflected in our finding that, when adjusted for insurance status and PCP density, patients who lived closer to the hospital were more likely to return, but less likely to be admitted, thereby suggesting proximity as a factor in the decision to return. It is also possible that patients residing further away returned to another institution. Although PCP density did not seem to be associated with revisits, patients who lived in areas with higher PCP density were less likely to be admitted when they returned. In this study, there was a stepwise gradient in the effect of PCP density on the odds of being hospitalized on return with those patients in areas with fewer PCPs being admitted at higher rates on return. Guttmann et al.,[40] in a recent study conducted in Canada where there is universal health insurance, showed that children residing in areas with higher PCP densities had higher rates of PCP visits but lower rates of ED visits compared to children residing in areas with lower PCP densities. It is possible that emergency physicians have more confidence that patients will have dedicated follow‐up when a PCP can be identified. These findings suggest that the development of PCP networks with expanded access, such as alignment of office hours with parent need and patient/parent education about PCP availability, may reduce ED revisits. Alternatively, creation of centralized hospital‐based urgent care centers for evening, night, and weekend visits may benefit both the patient and the PCP and avoid ED revisits and associated costs.
Targeting and eliminating disparities in care might also play a role in reducing ED revisits. Prior studies have shown that publicly insured individuals, in particular, frequently use the ED as their usual source of care and are more likely to return to the ED within 72 hours of an initial visit.[23, 39, 44, 49, 50] Likewise, we found that patients with public insurance were more likely to return but less likely to be admitted on revisit. After controlling for disease severity and other demographic variables, patients with public insurance and of lower socioeconomic status still had lower odds of being hospitalized following a revisit. This might also signify an increase of avoidable hospitalizations among patients of higher SES or with private insurance. Further investigation is needed to explore the reasons for these differences and to identify effective interventions to eliminate disparities.
Our findings have implications for emergency care, ambulatory care, and the larger healthcare system. First, ED revisits are costly and contribute to already overburdened EDs.[10, 11] The average ED visit incurs charges that are 2 to 5 times more than an outpatient office visit.[49, 50] Careful coordination of ambulatory and ED services could not only ensure optimal care for patients, but could save the US healthcare system billions of dollars in potentially avoidable healthcare expenditures.[49, 50] Second, prior studies have demonstrated a consistent relationship between poor access to primary care and increased use of the ED for nonurgent conditions.[42] Publicly insured patients have been shown to have disproportionately increased difficulty acquiring and accessing primary care.[41, 42, 47, 51] Furthermore, conditions with high ED revisit rates are similar to conditions reported by Berry et al.4 as having the highest hospital readmission rates such as cancer, sickle cell anemia, seizure, pneumonia, asthma, and gastroenteritis. This might suggest a close relationship between 72‐hour ED revisits and 30‐day hospital readmissions. In light of the recent expansion of health insurance coverage to an additional 30 million individuals, the need for better coordination of services throughout the entire continuum of care, including primary care, ED, and inpatient services, has never been more important.[52] Future improvements could explore condition‐specific revisit or readmission rates to identify the most effective interventions to reduce the possibly preventable returns.
This study has several limitations. First, as an administrative database, PHIS has limited clinical data, and reasons for return visits could not be assessed. Variations between hospitals in diagnostic coding might also lead to misclassification bias. Second, we were unable to assess return visits to a different ED. Thus, we may have underestimated revisit frequency. However, because children are generally more likely to seek repeat care in the same hospital,[3] we believe our estimate of return visit rate approximates the actual return visit rate; our findings are also similar to previously reported rates. Third, for the PCP density factor, we were unable to account for types of insurance each physician accepted and influence on return rates. Fourth, return visits in our sample could have been for conditions unrelated to the diagnosis at index visit, though the short timeframe considered for revisits makes this less likely. In addition, the crowding index does not include the proportion of occupied beds at the precise moment of the index visit. Finally, this cohort includes only children seen in the EDs of pediatric hospitals, and our findings may not be generalizable to all EDs who provide care for ill and injured children.
We have shown that, in addition to previously identified patient level factors, there are visit‐level and access‐related factors associated with pediatric ED return visits. Eighty percent are discharged again, and almost one‐fifth of returning patients are admitted to the hospital. Admitted patients tend to be younger, sicker, chronically ill, and live farther from the hospital. By being aware of patients' comorbidities, PCP access, as well as certain diagnoses associated with high rates of return, physicians may better target interventions to optimize care. This may include having a lower threshold for hospitalization at the initial visit for children at high risk of return, and communication with the PCP at the time of discharge to ensure close follow‐up. Our study helps to provide benchmarks around ED revisit rates, and may serve as a starting point to better understand variation in care. Future efforts should aim to find creative solutions at individual institutions, with the goal of disseminating and replicating successes more broadly. For example, investigators in Boston have shown that the use of a comprehensive home‐based asthma management program has been successful in decreasing emergency department visits and hospitalization rates.[53] It is possible that this approach could be spread to other institutions to decrease revisits for patients with asthma. As a next step, the authors have undertaken an investigation to identify hospital‐level characteristics that may be associated with rates of return visits.
Acknowledgements
The authors thank the following members of the PHIS ED Return Visits Research Group for their contributions to the data analysis plan and interpretation of results of this study: Rustin Morse, MD, Children's Medical Center of Dallas; Catherine Perron, MD, Boston Children's Hospital; John Cheng, MD, Children's Healthcare of Atlanta; Shabnam Jain, MD, MPH, Children's Healthcare of Atlanta; and Amanda Montalbano, MD, MPH, Children's Mercy Hospitals and Clinics. These contributors did not receive compensation for their help with this work.
Disclosures
A.T.A. and A.M.S. conceived the study and developed the initial study design. All authors were involved in the development of the final study design and data analysis plan. C.W.T. collected and analyzed the data. A.T.A. and C.W.T. had full access to all of the data and take responsibility for the integrity of the data and the accuracy of the data analysis. All authors were involved in the interpretation of the data. A.T.A. drafted the article, and all authors made critical revisions to the initial draft and subsequent versions. A.T.A. and A.M.S. take full responsibility for the article as a whole. The authors report no conflicts of interest.
- Joint policy statement—guidelines for care of children in the emergency department. Pediatrics. 2009;124:1233–1243.
- , , , , . Return visits to a pediatric emergency department. Pediatr Emerg Care. 2004;20:166–171.
- , . Hospital readmission as an accountability measure. JAMA. 2011;305:504–505.
- , , , et al. Hospital utilization and characteristics of patients experiencing recurrent readmissions within children's hospitals. JAMA. 2011;305:682–690.
- , , , et al. Pediatric readmission prevalence and variability across hospitals. JAMA. 2013;309:372–380.
- . Farewell, and don't come back. Health reform gives hospitals a big incentive to send patients home for good. US News World Rep. 2010;147:20, 22–23.
- . CMS' stealth health reform. Plan to reduce readmissions and boost the continuum of care. Hosp Health Netw. 2008;82:24.
- , . Return visits to the emergency department. J Emerg Med. 1987;5:359–362.
- , , , . Emergency department visits after hospital discharge: a missing part of the equation. Ann Emerg Med. 2013;62:145–150.
- , , , , . Quality indicators for high acuity pediatric conditions. Pediatrics. 2013;132:752–762.
- , . Revisiting hospital readmissions. JAMA. 2013;309:398–400.
- , , . Thirty‐day readmissions: the clock is ticking. JAMA. 2013;309:345–346.
- . Patients seen in emergency departments who had a prior visit within the previous 72 h‐National Hospital Ambulatory Medical Care Survey, 2002. Public Health. 2005;119:914–918.
- , , , , . A national depiction of children with return visits to the emergency department within 72 hours, 2001–2007. Pediatr Emerg Care. 2012;28:606–610.
- , , , et al. How well can hospital readmission be predicted in a cohort of hospitalized children? A retrospective, multicenter study. Pediatrics. 2009;123:286–293.
- , , . Unscheduled return visits to the pediatric emergency department‐one‐year experience. Pediatr Emerg Care. 2006;22:545–549.
- , . Return visits to the emergency department among febrile children 3 to 36 months of age. Pediatr Emerg Care. 2011;27:1126–1129.
- , , , . Pediatric emergency department recidivism: demographic characteristics and diagnostic predictors. J Emerg Nurs. 2006;32:131–138.
- Healthcare Cost and Utilization Project. Pediatric emergency department visits in community hospitals from selected states, 2005. Statistical brief #52. Available at: http://www.ncbi.nlm.nih.gov/books/NBK56039. Accessed October 3, 2013.
- , , , , , . Factors influencing infant visits to emergency departments. Pediatrics. 2000;106:1031–1039.
- , , , . Early pediatric emergency department return visits: a prospective patient‐centric assessment. Clin Pediatr (Phila). 2012;51:651–658.
- , , , , . Unscheduled return visits with and without admission post emergency department discharge. J Emerg Med. 2012;43:1110–1118.
- , , , . Unscheduled revisits to a pediatric emergency department: risk factors for children with fever or infection‐related complaints. Pediatr Emerg Care. 2005;21:816–821.
- , , , , . Unscheduled return visits to the emergency department: consequences for triage. Acad Emerg Med. 2013;20:33–39.
- , , , et al. Repeat pediatric visits to a general emergency department. Ann Emerg Med. 1996;28:467–473.
- , , , , . Emergency department revisits. Ann Emerg Med. 1989;18:964–968.
- US Department of Health 19:70–78.
- , , . Pediatric deaths attributable to complex chronic conditions: a population‐based study of Washington State, 1980–1997. Pediatrics. 2000;106:205–209.
- , , , , , . Deaths attributed to pediatric complex chronic conditions: national trends and implications for supportive care services. Pediatrics. 2001;107:E99.
- , , . Where do children with complex chronic conditions die? Patterns in Washington State, 1980–1998. Pediatrics. 2002;109:656–660.
- Dartmouth Atlas of Health Care. Hospital and physician capacity, 2006. Available at: http://www.dartmouthatlas.org/data/topic/topic.aspx?cat=24. Accessed October 7, 2013.
- Dartmouth Atlas of Health Care. Research methods. What is an HSA/HRR? Available at: http://www.dartmouthatlas.org/tools/faq/researchmethods.aspx. Accessed October 7, 2013,.
- Dartmouth Atlas of Health Care. Appendix on the geography of health care in the United States. Available at: http://www.dartmouthatlas.org/downloads/methods/geogappdx.pdf. Accessed October 7, 2013.
- , , . Emergency department crowding: prioritising quantified crowding measures using a Delphi study. Emerg Med J. 2012;29:868–871.
- , , , , . A new diagnosis grouping system for child emergency department visits. Acad Emerg Med. 2010;17:204–213.
- , , , et al. Effectiveness of emergency department asthma management strategies on return visits in children: a population‐based study. Pediatrics. 2007;120:e1402–e1410.
- , , , . Emergency department patients with diabetes have better glycemic control when they have identifiable primary care providers. Acad Emerg Med. 2012;19:650–655.
- , , , , , Newman L. Impact of socioeconomic status on hospital use in New York City. Health Aff (Millwood). 1993;12:162–173.
- , , , , . Primary care physician supply and children's health care use, access, and outcomes: findings from Canada. Pediatrics. 2010;125:1119–1126.
- , , , et al. Insurance status and access to urgent ambulatory care follow‐up appointments. JAMA. 2005;294:1248–1254.
- , . Emergency departments, Medicaid costs, and access to primary care—understanding the link. N Engl J Med. 2012;366:2141–2143.
- Committee on the Future of Emergency Care in the United States Health System. Emergency Care for Children: Growing Pains. Washington, DC: The National Academies Press; 2007.
- Committee on the Future of Emergency Care in the United States Health System. Hospital‐Based Emergency Care: At the Breaking Point. Washington, DC: The National Academies Press; 2007.
- , . Geographic variation in access to care—the relationship with quality. N Engl J Med. 2012;367:3–6.
- , , , , . Trends and characteristics of US emergency department visits, 1997–2007. JAMA. 2010;304:664–670.
- , , , , . Ambulatory visits to hospital emergency departments. Patterns and reasons for use. 24 Hours in the ED Study Group. JAMA. 1996;276:460–465.
- , , , , . Emergency department workload increase: dependence on primary care? J Emerg Med. 2010;38:279–285.
- Network for Excellence in Health Innovation. Leading healthcare research organizations to examine emergency department overuse. New England Research Institute, 2008. Available at: http://www.nehi.net/news/310‐leading‐health‐care‐research‐organizations‐to‐examine‐emergency‐department‐overuse/view. Accessed October 4, 2013.
- Robert Wood Johnson Foundation. Quality field notes: reducing inappropriate emergency department use. Available at: http://www.rwjf.org/en/research‐publications/find‐rwjf‐research/2013/09/quality‐field‐notes–reducing‐inappropriate‐emergency‐department.html.
- Access of Medicaid recipients to outpatient care. N Engl J Med. 1994;330:1426–1430.
- Medicaid policy statement. Pediatrics. 2013;131:e1697–e1706.
- , , , et al. Community asthma initiative: evaluation of a quality improvement program for comprehensive asthma care. Pediatrics. 2012;129:465–472.
© 2014 Society of Hospital Medicine

Chest Radiograph Interpretation
The inclusion of clinical information in diagnostic testing may influence the interpretation of the clinical findings. Historical and clinical findings may focus the reader's attention to the relevant details, thereby improving the accuracy of the interpretation. However, such information may cause the reader to have preconceived notions about the results, biasing the overall interpretation.
The impact of clinical information on the interpretation of radiographic studies remains an issue of debate. Previous studies have found that clinical information improves the accuracy of radiographic interpretation for a broad range of diagnoses,[1, 2, 3, 4] whereas others do not show improvement.[5, 6, 7] Additionally, clinical information may serve as a distraction that leads to more false‐positive interpretations.[8] For this reason, many radiologists prefer to review radiographs without knowledge of the clinical scenario prompting the study to avoid focusing on the expected findings and potentially missing other important abnormalities.[9]
The chest radiograph (CXR) is the most commonly used diagnostic imaging modality. Nevertheless, poor agreement exists among radiologists in the interpretation of chest radiographs for the diagnosis of pneumonia in both adults and children.[10, 11, 12, 13, 14, 15] Recent studies have found a high degree of agreement among pediatric radiologists with implementation of the World Health Organization (WHO) criteria for standardized CXR interpretation for diagnosis of bacterial pneumonia in children.[16, 17, 18] In these studies, participants were blinded to the clinical presentation. Data investigating the impact of clinical history on CXR interpretation in the pediatric population are limited.[19]
We conducted this prospective case‐based study to evaluate the impact of clinical information on the reliability of radiographic diagnosis of pneumonia among children presenting to a pediatric emergency department (ED) with clinical suspicion of pneumonia.
METHODS
Study Subjects
Six board‐certified radiologists at 2 academic children's hospitals (Children's Hospital of Philadelphia [n = 3] and Boston Children's Hospital [n = 3]) interpreted the same 110 chest radiographs (100 original and 10 duplicates) on 2 separate occasions. Clinical information was withheld during the first interpretation. The inter‐ and inter‐rater reliability for the interpretation of these 110 radiographs without clinical information have been previously reported.[18] After a period of 6 months, the radiologists reviewed the radiographs with access to clinical information provided by the physician ordering the CXR. This clinical information included age, sex, clinical indication for obtaining the radiograph, relevant history, and physical examination findings. The radiologists did not have access to the patients' medical records. The radiologists varied with respect to the number of years practicing pediatric radiology (median, 8 years; range, 336 years).
Radiographs were selected from children who presented to the ED at Boston Children's Hospital with concern of pneumonia. We selected radiographs with a spectrum of respiratory disease processes encountered in a pediatric population. The final radiographs included 50 radiographs with a final reading in the medical record without suspicion for pneumonia and 50 radiographs with suspicion of pneumonia. In the latter group, 25 radiographs had a final reading suggestive of an alveolar infiltrate, and 25 radiographs had a final reading suggestive of an interstitial infiltrate. Ten duplicate radiographs were included.
Radiograph Interpretation
The radiologists interpreted both anterior‐posterior and lateral views for each subject. Digital Imaging and Communications in Medicine images were downloaded from a registry at Boston Children's Hospital, and were copied to DVDs that were provided to each radiologist. Standardized radiographic imaging software (eFilm Lite; Merge Healthcare, Chicago, Illinois) was used by each radiologist.
Each radiologist completed a study questionnaire for each radiograph (see Supporting Information, Appendix 1, in the online version of this article). The questionnaire utilized radiographic descriptors of primary endpoint pneumonia described by the WHO to standardize the radiographic diagnosis of pneumonia.[20, 21] No additional training was provided to the radiologists. The main outcome of interest was the presence or absence of an infiltrate. Among radiographs in which an infiltrate was identified, radiologists selected whether there was an alveolar infiltrate, interstitial infiltrate, or both. Alveolar infiltrate and interstitial infiltrate are defined on the study questionnaire (Appendix 1). A radiograph classified as having either an alveolar infiltrate or interstitial infiltrate (not atelectasis) was considered to have any infiltrate. Additional findings including air bronchograms, hilar adenopathy, pleural effusion, and location of abnormalities were also recorded.
Statistical Analysis
Inter‐rater reliability was assessed using the kappa statistic to determine the overall agreement among the 6 radiologists for each outcome (eg, presence or absence of alveolar infiltrate). The kappa statistic for more than 2 raters utilizes an analysis of variance approach.[22] To calculate 95% confidence intervals (CI) for kappa statistics with more than 2 raters, we employed a bootstrapping method with 1000 replications of samples equal in size to the study sample. Intra‐rater reliability was evaluated by examining the agreement within each radiologist upon review of 10 duplicate radiographs. We used the following benchmarks to classify the strength of agreement: poor (<0.0), slight (00.20), fair (0.210.40), moderate (0.410.60), substantial (0.610.80), almost perfect (0.811.0).[23] Negative kappa values represent agreement less than would be predicted by chance alone.[24, 25] To calculate the kappa, a value must be recorded in 3 of 4 of the following categories: negative to positive, positive to negative, concordant negative, and concordant positive reporting of pneumonia. If raters did not fulfill 3 categories, the kappa could not be calculated.
The inter‐rater concordance for identification of an alveolar infiltrate was calculated for each radiologist by comparing their reporting of alveolar infiltrate with and without clinical history for each of the 100 radiographs. Radiographs that were identified by an individual rater as no alveolar infiltrate when read without clinical history, but those subsequently identified as alveolar infiltrate with clinical history were categorized as negative to positive reporting of pneumonia with clinical history. Those that were identified as alveolar infiltrate but subsequently identified as no alveolar infiltrate were categorized as positive to negative reporting of pneumonia with clinical history. Those radiographs in which there was no change in identification of alveolar infiltrate with clinical information were categorized as concordant reporting of pneumonia.
The study was approved by the institutional review boards at both children's hospitals.
RESULTS
Patient Sample
The radiographs were from patients ranging in age from 1 week to 19 years (median, 3.5 years; interquartile range, 1.66.0 years). Fifty (50%) patients were male.
Inter‐rater Reliability
The kappa coefficients of inter‐rater reliability between the radiologists across the 6 clinical measures of interest with and without access to clinical history are plotted in Figure 1. Reliability improved from fair (k = 0.32, 95% CI: 0.24 to 0.42) to moderate (k = 0.53, 95% CI: 0.43 to 0.64) for identification of air bronchograms with the addition of clinical history. Although there was an increase in kappa values for identification of any infiltrate, alveolar infiltrate, interstitial infiltrate, and pleural effusion, and a decrease in the kappa value for identification of hilar adenopathy with the addition of clinical information, there was substantial overlap of the 95% CIs, suggesting that inclusion of clinical history did not result in a statistically significant change in the reliability of these findings.
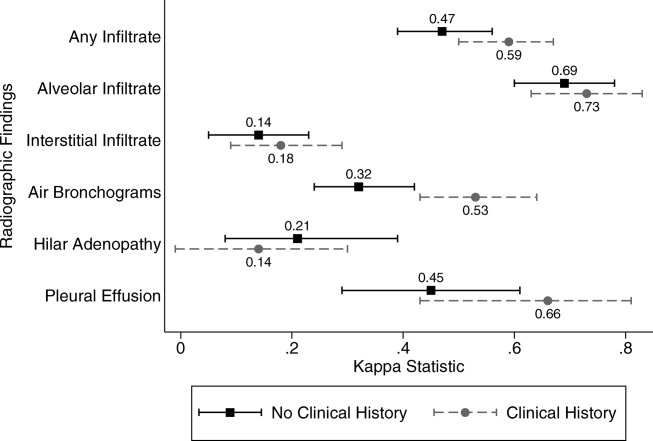
Intra‐rater Reliability
The estimates of inter‐rater reliability for the interpretation of the 10 duplicate images with and without clinical history are shown in Table 1. The inter‐rater reliability in the identification of alveolar infiltrate remained substantial to almost perfect for each rater with and without access to clinical history. Rater 1 had a decrease in inter‐rater reliability from almost perfect (k = 1.0, 95% CI: 1.0 to 1.0) to fair (k = 0.21, 95% CI: 0.43 to 0.85) in the identification of interstitial infiltrate with the addition of clinical history. This rater also had a decrease in agreement from almost perfect (k = 1.0, 95% CI: 1.0 to 1.0) to fair (k = 0.4, 95% CI: 0.16 to 0.96) in the identification of any infiltrate.
| Phase 1No Clinical History | Phase 2Access to Clinical History | |||
|---|---|---|---|---|
| Kappa | 95% Confidence Interval | Kappa | 95% Confidence Interval | |
| ||||
| Any infiltrate | ||||
| Rater 1 | 1.00 | 1.00 to 1.00 | 0.40 | 0.16 to 0.96 |
| Rater 2 | 0.60 | 0.10 to 1.00 | 0.58 | 0.07 to 1.00 |
| Rater 3 | 0.80 | 0.44 to 1.00 | 0.80 | 0.44 to 1.00 |
| Rater 4 | 1.00 | 1.00 to 1.00 | 0.78 | 0.39 to 1.00 |
| Rater 5 | N/Aa | 0.11 | 0.36 to 0.14 | |
| Rater 6 | 1.00 | 1.00 to 1.00 | 1.00 | 1.00 to 1.00 |
| Alveolar infiltrate | ||||
| Rater 1 | 1.00 | 1.00 to 1.00 | 1.00 | 1.00 to 1.00 |
| Rater 2 | 1.00 | 1.00 to 1.00 | 1.00 | 1.00 to 1.00 |
| Rater 3 | 1.00 | 1.00 to 1.00 | 1.00 | 1.00 to 1.00 |
| Rater 4 | 1.00 | 1.00 to 1.00 | 0.78 | 0.39 to 1.00 |
| Rater 5 | 0.78 | 0.39 to 1.00 | 1.00 | 1.00 to 1.00 |
| Rater 6 | 0.74 | 0.27 to 1.00 | 0.78 | 0.39 to 1.00 |
| Interstitial infiltrate | ||||
| Rater 1 | 1.00 | 1.00 to 1.00 | 0.21 | 0.43 to 0.85 |
| Rater 2 | 0.21 | 0.43 to 0.85 | 0.11 | 0.36 to 0.14 |
| Rater 3 | 0.74 | 0.27 to 1.00 | 0.78 | 0.39 to 1.00 |
| Rater 4 | N/A | N/A | ||
| Rater 5 | 0.58 | 0.07 to 1.00 | 0.52 | 0.05 to 1.00 |
| Rater 6 | 0.62 | 0.5 to 1.00 | N/Aa | |
Intra‐rater Concordance
The inter‐rater concordance of the radiologists for the identification of alveolar infiltrate during the interpretation of the 100 chest radiographs with and without access to clinical history is shown in Figure 2. The availability of clinical information impacted physicians differently in the evaluation of alveolar infiltrates. Raters 1, 4, and 6 appeared more likely to identify an alveolar infiltrate with access to the clinical information, whereas raters 3 and 5 appeared less likely to identify an alveolar infiltrate. Of the 100 films that were interpreted with and without clinical information, the mean number of discordant interpretations per rater was 10, with values ranging from 6 to 19 for the individual raters. Radiographs in which more than 3 raters changed their interpretation regarding the presence of an alveolar infiltrate are shown in Figure 3. For Figure 3D, 4 radiologists changed their interpretation from no alveolar infiltrate to alveolar infiltrate, and 1 radiologist changed from alveolar infiltrate to no alveolar infiltrate with the addition of clinical history.
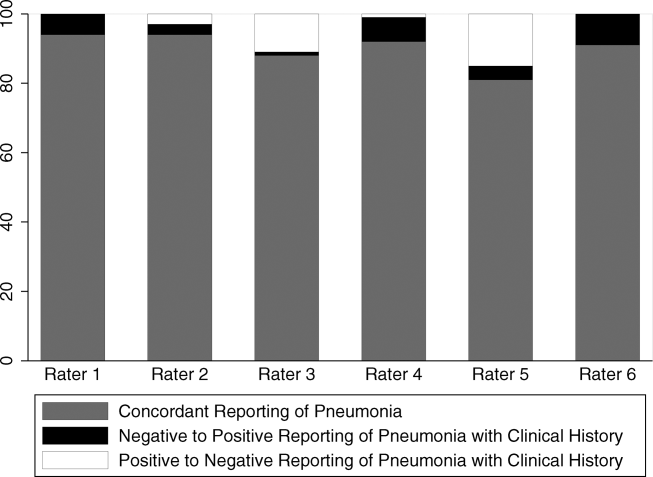
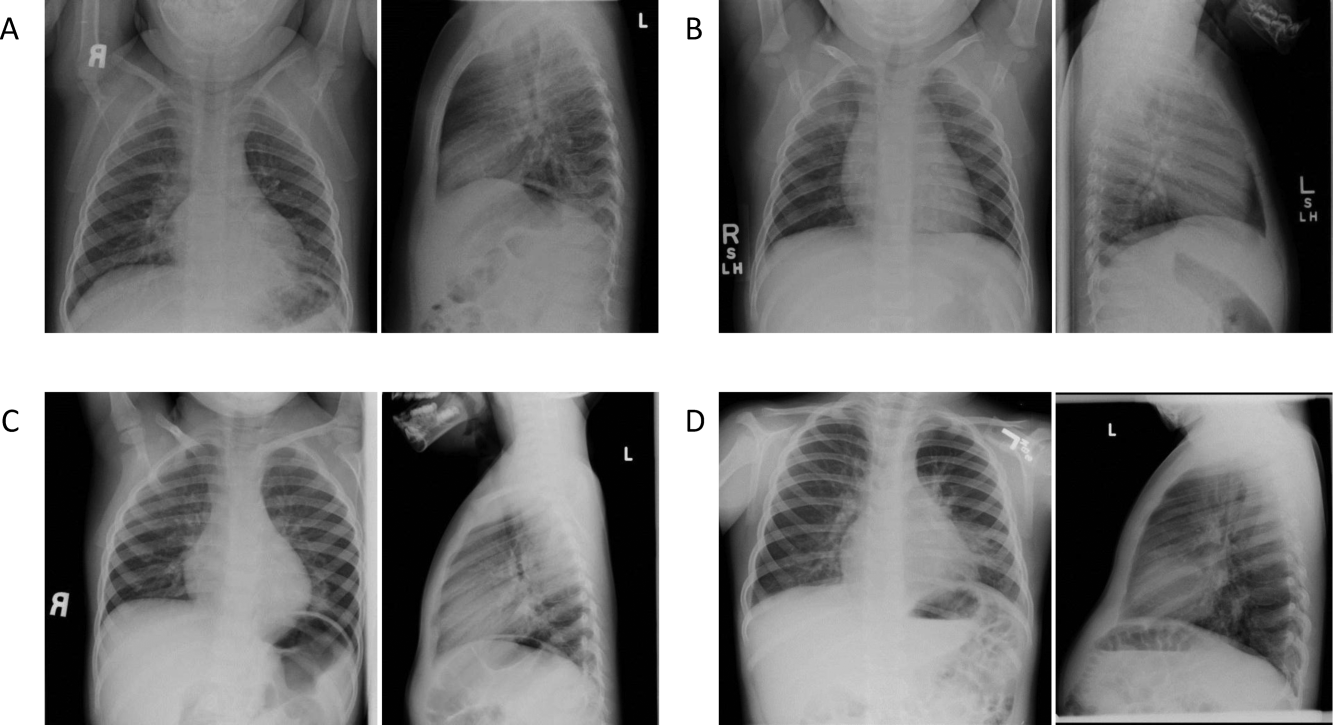
Comment
We investigated the impact of the availability of clinical information on the reliability of chest radiographic interpretation in the diagnosis of pneumonia. There was improved inter‐rater reliability in the identification of air bronchograms with the addition of clinical information; however, clinical history did not have a substantial impact on the inter‐rater reliability of other findings. The addition of clinical information did not alter the inter‐rater reliability in the identification of alveolar infiltrate. Clinical history affected individual raters differently in their interpretation of alveolar infiltrate, with 3 raters more likely to identify an alveolar infiltrate and 2 raters less likely to identify an alveolar infiltrate.
Most studies addressing the impact of clinical history on radiographic interpretation evaluated accuracy. In many of these studies, accuracy was defined as the raters' agreement with the final interpretation of each film as documented in the medical record or their agreement with the interpretation of the radiologists selecting the cases.[1, 2, 3, 5, 6, 7] Given the known inter‐rater variability in radiographic interpretation,[10, 11, 12, 13, 14, 15] accuracy of a radiologist's interpretation cannot be appropriately assessed through agreement with their peers. Because a true measure of accuracy in the radiographic diagnosis of pneumonia can only be determined through invasive testing, such as lung biopsy, reliability serves as a more appropriate measure of performance. Inclusion of clinical information in chest radiograph interpretation has been shown to improve reliability in the radiographic diagnosis of a broad range of conditions.[15]
The primary outcome in this study was the identification of an infiltrate. Previous studies have noted consistent identification of the radiographic features that are most suggestive of bacterial pneumonia, such as alveolar infiltrate, and less consistent identification of other radiographic findings, including interstitial infiltrate.[18, 26, 27] Among the radiologists in this study, the addition of clinical information did not have a meaningful impact on the reliability of either of these findings, as there was substantial inter‐rater agreement for the identification of alveolar infiltrate and only slight agreement for the identification of interstitial infiltrate, both with and without clinical history. Additionally, inter‐rater reliability for the identification of alveolar infiltrate remained substantial to almost perfect for all 6 raters with the addition of clinical information.
Clinical information impacted the raters differently in their pattern of alveolar infiltrate identification, suggesting that radiologists may differ in their approach to incorporating clinical history in the interpretation of chest radiographs. The inclusion of clinical information may impact a radiologist's perception, leading to improved identification of abnormalities; however, it may also guide their decision making about the relevance of previously identified abnormalities.[28] Some radiologists may use clinical information to support or suggest possible radiographic findings, whereas others may use the information to challenge potential findings. This study did not address the manner in which the individual raters utilized the clinical history. There were also several radiographs in which the clinical information resulted in a change in the identification of an alveolar infiltrate by 3 or more raters, with as many as 5 of 6 raters changing their interpretation for 1 particular radiograph. These changes in identification of an infiltrate suggest that unidentified aspects of a history may be likely to influence a rater's interpretation of a radiograph. Nevertheless, these changes did not result in improved reliability and it is not possible to determine if these changes resulted in improved accuracy in interpretation.
This study had several limitations. First, radiographs were purposefully selected to encompass a broad spectrum of radiographic findings. Thus, the prevalence of pneumonia and other abnormal findings was artificially higher than typically observed among a cohort of children for whom pneumonia is considered. Second, the radiologists recruited for this study all practice in an academic children's hospital setting. These factors may limit the generalizability of our findings. However, we would expect these results to be generalizable to pediatric radiologists from other academic institutions. Third, this study does not meet the criteria of a balanced study design as defined by Loy and Irwig.[19] A study was characterized as balanced if half of the radiographs were read with and half without clinical information in each of the 2 reading sessions. The proposed benefit of such a design is to control for possible changes in ability or reporting practices of the raters that may have occurred between study periods. The use of a standardized reporting tool likely minimized changes in reporting practices. Also, it is unlikely that the ability or reporting practices of an experienced radiologist would change over the study period. Fourth, the radiologists interpreted the films outside of their standard workflow and utilized a standardized reporting tool that focused on the presence or absence of pneumonia indicators. These factors may have increased the radiologists' suspicion for pneumonia even in the absence of clinical information. This may have biased the results toward finding no difference in the identification of pneumonia with the addition of detailed clinical history. Thus, the inclusion of clinical information in radiograph interpretation in clinical practice may have greater impact on the identification of these pneumonia indicators than was found in this study.[29] Finally, reliability does not imply accuracy, and it is unknown if changes in the identification of pneumonia indicators led to more accurate interpretation with respect to the clinical or pathologic diagnosis of pneumonia.
In conclusion, we observed high intra‐ and inter‐rater reliability among radiologists in the identification of an alveolar infiltrate, the radiographic finding most suggestive of bacterial pneumonia.[16, 17, 18, 30] The addition of clinical information did not have a substantial impact on the reliability of its identification.
- , , , et al. Tentative diagnoses facilitate the detection of diverse lesions in chest radiographs. Invest Radiol. 1986;21(7):532–539.
- , , , . Influence of clinical history upon detection of nodules and other lesions. Invest Radiol. 1988;23(1):48–55.
- , , , . Influence of clinical history on perception of abnormalities in pediatric radiographs. Acad Radiol. 1994;1(3):217–223.
- , , , et al. Impact of clinical history on film interpretation. Yonsei Med J. 1992;33(2):168–172.
- , , , et al. The effect of clinical history on chest radiograph interpretations in a PACS environment. Invest Radiol. 1990;25(6):670–674.
- , , , et al. Does knowledge of the clinical history affect the accuracy of chest radiograph interpretation?AJR Am J Roentgenol. 1990;154(4):709–712.
- , , , . Detection of lung cancer on the chest radiograph: impact of previous films, clinical information, double reading, and dual reading. J Clin Epidemiol. 2001;54(11):1146–1150.
- , , , . The effect of clinical bias on the interpretation of myelography and spinal computed tomography. Radiology. 1982;145(1):85–89.
- . A suggestion: look at the images first, before you read the history. Radiology. 2002;223(1):9–10.
- , , , et al. Interobserver reliability of the chest radiograph in community‐acquired pneumonia. PORT Investigators. Chest. 1996;110(2):343–350.
- , , , , . Inter‐ and intra‐observer variability in the assessment of atelectasis and consolidation in neonatal chest radiographs. Pediatr Radiol. 1999;29(6):459–462.
- , , , , . Chest radiographs in the emergency department: is the radiologist really necessary?Postgrad Med J. 2003;79(930):214–217.
- , , , . Inter‐observer variation in the interpretation of chest radiographs for pneumonia in community‐acquired lower respiratory tract infections. Clin Radiol. 2004;59(8):743–752.
- , , , , , . Disagreement in the interpretation of chest radiographs among specialists and clinical outcomes of patients hospitalized with suspected pneumonia. Eur J Intern Med. 2006;17(1):43–47.
- , , . An assessment of inter‐observer agreement and accuracy when reporting plain radiographs. Clin Radiol. 1997;52(3):235–238.
- , , , et al. Evaluation of the World Health Organization criteria for chest radiographs for pneumonia diagnosis in children. Eur J Pediatr. 2011;171(2):369–374.
- , , , et al. Standardized interpretation of paediatric chest radiographs for the diagnosis of pneumonia in epidemiological studies. Bull World Health Organ. 2005;83(5):353–359.
- , , , et al. Variability in the interpretation of chest radiographs for the diagnosis of pneumonia in children. J Hosp Med. 2012;7(4):294–298.
- , . Accuracy of diagnostic tests read with and without clinical information: a systematic review. JAMA. 2004;292(13):1602–1609.
- Standardization of interpretation of chest radiographs for the diagnosis of pneumonia in children. In:World Health Organization: Pneumonia Vaccine Trial Investigators' Group.Geneva: Department of Vaccine and Biologics;2001.
- , , , et al. Effectiveness of heptavalent pneumococcal conjugate vaccine in children younger than 5 years of age for prevention of pneumonia: updated analysis using World Health Organization standardized interpretation of chest radiographs. Pediatr Infect Dis J. 2006;25(9):779–781.
- , . A one‐way components of variance model for categorical data. Biometrics. 1977;33:671–679.
- , . The measurement of observer agreement for categorical data. Biometrics. 1977;33(1):159–174.
- , . Kappa statistic. CMAJ. 2005;173(1):16.
- , . Clinical biostatistics. LIV. The biostatistics of concordance. Clin Pharmacol Ther. 1981;29(1):111–123.
- , , , , , . Practice guidelines for the management of community‐acquired pneumonia in adults. Infectious Diseases Society of America. Clin Infect Dis. 2000;31(2):347–382.
- , , , et al. Guidelines for the management of adults with community‐acquired pneumonia. Diagnosis, assessment of severity, antimicrobial therapy, and prevention. Am J Respir Crit Care Med. 2001;163(7):1730–1754.
- , . Commentary does clinical history affect perception?Acad Radiol. 2006;13(3):402–403.
- , . The effect of clinical history on chest radiograph interpretations in a PACS environment. Invest Radiol. 1991;26(5):512–514.
- , , , . Comparison of radiological findings and microbial aetiology of childhood pneumonia. Acta Paediatr. 1993;82(4):360–363.
The inclusion of clinical information in diagnostic testing may influence the interpretation of the clinical findings. Historical and clinical findings may focus the reader's attention to the relevant details, thereby improving the accuracy of the interpretation. However, such information may cause the reader to have preconceived notions about the results, biasing the overall interpretation.
The impact of clinical information on the interpretation of radiographic studies remains an issue of debate. Previous studies have found that clinical information improves the accuracy of radiographic interpretation for a broad range of diagnoses,[1, 2, 3, 4] whereas others do not show improvement.[5, 6, 7] Additionally, clinical information may serve as a distraction that leads to more false‐positive interpretations.[8] For this reason, many radiologists prefer to review radiographs without knowledge of the clinical scenario prompting the study to avoid focusing on the expected findings and potentially missing other important abnormalities.[9]
The chest radiograph (CXR) is the most commonly used diagnostic imaging modality. Nevertheless, poor agreement exists among radiologists in the interpretation of chest radiographs for the diagnosis of pneumonia in both adults and children.[10, 11, 12, 13, 14, 15] Recent studies have found a high degree of agreement among pediatric radiologists with implementation of the World Health Organization (WHO) criteria for standardized CXR interpretation for diagnosis of bacterial pneumonia in children.[16, 17, 18] In these studies, participants were blinded to the clinical presentation. Data investigating the impact of clinical history on CXR interpretation in the pediatric population are limited.[19]
We conducted this prospective case‐based study to evaluate the impact of clinical information on the reliability of radiographic diagnosis of pneumonia among children presenting to a pediatric emergency department (ED) with clinical suspicion of pneumonia.
METHODS
Study Subjects
Six board‐certified radiologists at 2 academic children's hospitals (Children's Hospital of Philadelphia [n = 3] and Boston Children's Hospital [n = 3]) interpreted the same 110 chest radiographs (100 original and 10 duplicates) on 2 separate occasions. Clinical information was withheld during the first interpretation. The inter‐ and inter‐rater reliability for the interpretation of these 110 radiographs without clinical information have been previously reported.[18] After a period of 6 months, the radiologists reviewed the radiographs with access to clinical information provided by the physician ordering the CXR. This clinical information included age, sex, clinical indication for obtaining the radiograph, relevant history, and physical examination findings. The radiologists did not have access to the patients' medical records. The radiologists varied with respect to the number of years practicing pediatric radiology (median, 8 years; range, 336 years).
Radiographs were selected from children who presented to the ED at Boston Children's Hospital with concern of pneumonia. We selected radiographs with a spectrum of respiratory disease processes encountered in a pediatric population. The final radiographs included 50 radiographs with a final reading in the medical record without suspicion for pneumonia and 50 radiographs with suspicion of pneumonia. In the latter group, 25 radiographs had a final reading suggestive of an alveolar infiltrate, and 25 radiographs had a final reading suggestive of an interstitial infiltrate. Ten duplicate radiographs were included.
Radiograph Interpretation
The radiologists interpreted both anterior‐posterior and lateral views for each subject. Digital Imaging and Communications in Medicine images were downloaded from a registry at Boston Children's Hospital, and were copied to DVDs that were provided to each radiologist. Standardized radiographic imaging software (eFilm Lite; Merge Healthcare, Chicago, Illinois) was used by each radiologist.
Each radiologist completed a study questionnaire for each radiograph (see Supporting Information, Appendix 1, in the online version of this article). The questionnaire utilized radiographic descriptors of primary endpoint pneumonia described by the WHO to standardize the radiographic diagnosis of pneumonia.[20, 21] No additional training was provided to the radiologists. The main outcome of interest was the presence or absence of an infiltrate. Among radiographs in which an infiltrate was identified, radiologists selected whether there was an alveolar infiltrate, interstitial infiltrate, or both. Alveolar infiltrate and interstitial infiltrate are defined on the study questionnaire (Appendix 1). A radiograph classified as having either an alveolar infiltrate or interstitial infiltrate (not atelectasis) was considered to have any infiltrate. Additional findings including air bronchograms, hilar adenopathy, pleural effusion, and location of abnormalities were also recorded.
Statistical Analysis
Inter‐rater reliability was assessed using the kappa statistic to determine the overall agreement among the 6 radiologists for each outcome (eg, presence or absence of alveolar infiltrate). The kappa statistic for more than 2 raters utilizes an analysis of variance approach.[22] To calculate 95% confidence intervals (CI) for kappa statistics with more than 2 raters, we employed a bootstrapping method with 1000 replications of samples equal in size to the study sample. Intra‐rater reliability was evaluated by examining the agreement within each radiologist upon review of 10 duplicate radiographs. We used the following benchmarks to classify the strength of agreement: poor (<0.0), slight (00.20), fair (0.210.40), moderate (0.410.60), substantial (0.610.80), almost perfect (0.811.0).[23] Negative kappa values represent agreement less than would be predicted by chance alone.[24, 25] To calculate the kappa, a value must be recorded in 3 of 4 of the following categories: negative to positive, positive to negative, concordant negative, and concordant positive reporting of pneumonia. If raters did not fulfill 3 categories, the kappa could not be calculated.
The inter‐rater concordance for identification of an alveolar infiltrate was calculated for each radiologist by comparing their reporting of alveolar infiltrate with and without clinical history for each of the 100 radiographs. Radiographs that were identified by an individual rater as no alveolar infiltrate when read without clinical history, but those subsequently identified as alveolar infiltrate with clinical history were categorized as negative to positive reporting of pneumonia with clinical history. Those that were identified as alveolar infiltrate but subsequently identified as no alveolar infiltrate were categorized as positive to negative reporting of pneumonia with clinical history. Those radiographs in which there was no change in identification of alveolar infiltrate with clinical information were categorized as concordant reporting of pneumonia.
The study was approved by the institutional review boards at both children's hospitals.
RESULTS
Patient Sample
The radiographs were from patients ranging in age from 1 week to 19 years (median, 3.5 years; interquartile range, 1.66.0 years). Fifty (50%) patients were male.
Inter‐rater Reliability
The kappa coefficients of inter‐rater reliability between the radiologists across the 6 clinical measures of interest with and without access to clinical history are plotted in Figure 1. Reliability improved from fair (k = 0.32, 95% CI: 0.24 to 0.42) to moderate (k = 0.53, 95% CI: 0.43 to 0.64) for identification of air bronchograms with the addition of clinical history. Although there was an increase in kappa values for identification of any infiltrate, alveolar infiltrate, interstitial infiltrate, and pleural effusion, and a decrease in the kappa value for identification of hilar adenopathy with the addition of clinical information, there was substantial overlap of the 95% CIs, suggesting that inclusion of clinical history did not result in a statistically significant change in the reliability of these findings.
Intra‐rater Reliability
The estimates of inter‐rater reliability for the interpretation of the 10 duplicate images with and without clinical history are shown in Table 1. The inter‐rater reliability in the identification of alveolar infiltrate remained substantial to almost perfect for each rater with and without access to clinical history. Rater 1 had a decrease in inter‐rater reliability from almost perfect (k = 1.0, 95% CI: 1.0 to 1.0) to fair (k = 0.21, 95% CI: 0.43 to 0.85) in the identification of interstitial infiltrate with the addition of clinical history. This rater also had a decrease in agreement from almost perfect (k = 1.0, 95% CI: 1.0 to 1.0) to fair (k = 0.4, 95% CI: 0.16 to 0.96) in the identification of any infiltrate.
| Phase 1No Clinical History | Phase 2Access to Clinical History | |||
|---|---|---|---|---|
| Kappa | 95% Confidence Interval | Kappa | 95% Confidence Interval | |
| ||||
| Any infiltrate | ||||
| Rater 1 | 1.00 | 1.00 to 1.00 | 0.40 | 0.16 to 0.96 |
| Rater 2 | 0.60 | 0.10 to 1.00 | 0.58 | 0.07 to 1.00 |
| Rater 3 | 0.80 | 0.44 to 1.00 | 0.80 | 0.44 to 1.00 |
| Rater 4 | 1.00 | 1.00 to 1.00 | 0.78 | 0.39 to 1.00 |
| Rater 5 | N/Aa | 0.11 | 0.36 to 0.14 | |
| Rater 6 | 1.00 | 1.00 to 1.00 | 1.00 | 1.00 to 1.00 |
| Alveolar infiltrate | ||||
| Rater 1 | 1.00 | 1.00 to 1.00 | 1.00 | 1.00 to 1.00 |
| Rater 2 | 1.00 | 1.00 to 1.00 | 1.00 | 1.00 to 1.00 |
| Rater 3 | 1.00 | 1.00 to 1.00 | 1.00 | 1.00 to 1.00 |
| Rater 4 | 1.00 | 1.00 to 1.00 | 0.78 | 0.39 to 1.00 |
| Rater 5 | 0.78 | 0.39 to 1.00 | 1.00 | 1.00 to 1.00 |
| Rater 6 | 0.74 | 0.27 to 1.00 | 0.78 | 0.39 to 1.00 |
| Interstitial infiltrate | ||||
| Rater 1 | 1.00 | 1.00 to 1.00 | 0.21 | 0.43 to 0.85 |
| Rater 2 | 0.21 | 0.43 to 0.85 | 0.11 | 0.36 to 0.14 |
| Rater 3 | 0.74 | 0.27 to 1.00 | 0.78 | 0.39 to 1.00 |
| Rater 4 | N/A | N/A | ||
| Rater 5 | 0.58 | 0.07 to 1.00 | 0.52 | 0.05 to 1.00 |
| Rater 6 | 0.62 | 0.5 to 1.00 | N/Aa | |
Intra‐rater Concordance
The inter‐rater concordance of the radiologists for the identification of alveolar infiltrate during the interpretation of the 100 chest radiographs with and without access to clinical history is shown in Figure 2. The availability of clinical information impacted physicians differently in the evaluation of alveolar infiltrates. Raters 1, 4, and 6 appeared more likely to identify an alveolar infiltrate with access to the clinical information, whereas raters 3 and 5 appeared less likely to identify an alveolar infiltrate. Of the 100 films that were interpreted with and without clinical information, the mean number of discordant interpretations per rater was 10, with values ranging from 6 to 19 for the individual raters. Radiographs in which more than 3 raters changed their interpretation regarding the presence of an alveolar infiltrate are shown in Figure 3. For Figure 3D, 4 radiologists changed their interpretation from no alveolar infiltrate to alveolar infiltrate, and 1 radiologist changed from alveolar infiltrate to no alveolar infiltrate with the addition of clinical history.
Comment
We investigated the impact of the availability of clinical information on the reliability of chest radiographic interpretation in the diagnosis of pneumonia. There was improved inter‐rater reliability in the identification of air bronchograms with the addition of clinical information; however, clinical history did not have a substantial impact on the inter‐rater reliability of other findings. The addition of clinical information did not alter the inter‐rater reliability in the identification of alveolar infiltrate. Clinical history affected individual raters differently in their interpretation of alveolar infiltrate, with 3 raters more likely to identify an alveolar infiltrate and 2 raters less likely to identify an alveolar infiltrate.
Most studies addressing the impact of clinical history on radiographic interpretation evaluated accuracy. In many of these studies, accuracy was defined as the raters' agreement with the final interpretation of each film as documented in the medical record or their agreement with the interpretation of the radiologists selecting the cases.[1, 2, 3, 5, 6, 7] Given the known inter‐rater variability in radiographic interpretation,[10, 11, 12, 13, 14, 15] accuracy of a radiologist's interpretation cannot be appropriately assessed through agreement with their peers. Because a true measure of accuracy in the radiographic diagnosis of pneumonia can only be determined through invasive testing, such as lung biopsy, reliability serves as a more appropriate measure of performance. Inclusion of clinical information in chest radiograph interpretation has been shown to improve reliability in the radiographic diagnosis of a broad range of conditions.[15]
The primary outcome in this study was the identification of an infiltrate. Previous studies have noted consistent identification of the radiographic features that are most suggestive of bacterial pneumonia, such as alveolar infiltrate, and less consistent identification of other radiographic findings, including interstitial infiltrate.[18, 26, 27] Among the radiologists in this study, the addition of clinical information did not have a meaningful impact on the reliability of either of these findings, as there was substantial inter‐rater agreement for the identification of alveolar infiltrate and only slight agreement for the identification of interstitial infiltrate, both with and without clinical history. Additionally, inter‐rater reliability for the identification of alveolar infiltrate remained substantial to almost perfect for all 6 raters with the addition of clinical information.
Clinical information impacted the raters differently in their pattern of alveolar infiltrate identification, suggesting that radiologists may differ in their approach to incorporating clinical history in the interpretation of chest radiographs. The inclusion of clinical information may impact a radiologist's perception, leading to improved identification of abnormalities; however, it may also guide their decision making about the relevance of previously identified abnormalities.[28] Some radiologists may use clinical information to support or suggest possible radiographic findings, whereas others may use the information to challenge potential findings. This study did not address the manner in which the individual raters utilized the clinical history. There were also several radiographs in which the clinical information resulted in a change in the identification of an alveolar infiltrate by 3 or more raters, with as many as 5 of 6 raters changing their interpretation for 1 particular radiograph. These changes in identification of an infiltrate suggest that unidentified aspects of a history may be likely to influence a rater's interpretation of a radiograph. Nevertheless, these changes did not result in improved reliability and it is not possible to determine if these changes resulted in improved accuracy in interpretation.
This study had several limitations. First, radiographs were purposefully selected to encompass a broad spectrum of radiographic findings. Thus, the prevalence of pneumonia and other abnormal findings was artificially higher than typically observed among a cohort of children for whom pneumonia is considered. Second, the radiologists recruited for this study all practice in an academic children's hospital setting. These factors may limit the generalizability of our findings. However, we would expect these results to be generalizable to pediatric radiologists from other academic institutions. Third, this study does not meet the criteria of a balanced study design as defined by Loy and Irwig.[19] A study was characterized as balanced if half of the radiographs were read with and half without clinical information in each of the 2 reading sessions. The proposed benefit of such a design is to control for possible changes in ability or reporting practices of the raters that may have occurred between study periods. The use of a standardized reporting tool likely minimized changes in reporting practices. Also, it is unlikely that the ability or reporting practices of an experienced radiologist would change over the study period. Fourth, the radiologists interpreted the films outside of their standard workflow and utilized a standardized reporting tool that focused on the presence or absence of pneumonia indicators. These factors may have increased the radiologists' suspicion for pneumonia even in the absence of clinical information. This may have biased the results toward finding no difference in the identification of pneumonia with the addition of detailed clinical history. Thus, the inclusion of clinical information in radiograph interpretation in clinical practice may have greater impact on the identification of these pneumonia indicators than was found in this study.[29] Finally, reliability does not imply accuracy, and it is unknown if changes in the identification of pneumonia indicators led to more accurate interpretation with respect to the clinical or pathologic diagnosis of pneumonia.
In conclusion, we observed high intra‐ and inter‐rater reliability among radiologists in the identification of an alveolar infiltrate, the radiographic finding most suggestive of bacterial pneumonia.[16, 17, 18, 30] The addition of clinical information did not have a substantial impact on the reliability of its identification.
- , , , et al. Tentative diagnoses facilitate the detection of diverse lesions in chest radiographs. Invest Radiol. 1986;21(7):532–539.
- , , , . Influence of clinical history upon detection of nodules and other lesions. Invest Radiol. 1988;23(1):48–55.
- , , , . Influence of clinical history on perception of abnormalities in pediatric radiographs. Acad Radiol. 1994;1(3):217–223.
- , , , et al. Impact of clinical history on film interpretation. Yonsei Med J. 1992;33(2):168–172.
- , , , et al. The effect of clinical history on chest radiograph interpretations in a PACS environment. Invest Radiol. 1990;25(6):670–674.
- , , , et al. Does knowledge of the clinical history affect the accuracy of chest radiograph interpretation?AJR Am J Roentgenol. 1990;154(4):709–712.
- , , , . Detection of lung cancer on the chest radiograph: impact of previous films, clinical information, double reading, and dual reading. J Clin Epidemiol. 2001;54(11):1146–1150.
- , , , . The effect of clinical bias on the interpretation of myelography and spinal computed tomography. Radiology. 1982;145(1):85–89.
- . A suggestion: look at the images first, before you read the history. Radiology. 2002;223(1):9–10.
- , , , et al. Interobserver reliability of the chest radiograph in community‐acquired pneumonia. PORT Investigators. Chest. 1996;110(2):343–350.
- , , , , . Inter‐ and intra‐observer variability in the assessment of atelectasis and consolidation in neonatal chest radiographs. Pediatr Radiol. 1999;29(6):459–462.
- , , , , . Chest radiographs in the emergency department: is the radiologist really necessary?Postgrad Med J. 2003;79(930):214–217.
- , , , . Inter‐observer variation in the interpretation of chest radiographs for pneumonia in community‐acquired lower respiratory tract infections. Clin Radiol. 2004;59(8):743–752.
- , , , , , . Disagreement in the interpretation of chest radiographs among specialists and clinical outcomes of patients hospitalized with suspected pneumonia. Eur J Intern Med. 2006;17(1):43–47.
- , , . An assessment of inter‐observer agreement and accuracy when reporting plain radiographs. Clin Radiol. 1997;52(3):235–238.
- , , , et al. Evaluation of the World Health Organization criteria for chest radiographs for pneumonia diagnosis in children. Eur J Pediatr. 2011;171(2):369–374.
- , , , et al. Standardized interpretation of paediatric chest radiographs for the diagnosis of pneumonia in epidemiological studies. Bull World Health Organ. 2005;83(5):353–359.
- , , , et al. Variability in the interpretation of chest radiographs for the diagnosis of pneumonia in children. J Hosp Med. 2012;7(4):294–298.
- , . Accuracy of diagnostic tests read with and without clinical information: a systematic review. JAMA. 2004;292(13):1602–1609.
- Standardization of interpretation of chest radiographs for the diagnosis of pneumonia in children. In:World Health Organization: Pneumonia Vaccine Trial Investigators' Group.Geneva: Department of Vaccine and Biologics;2001.
- , , , et al. Effectiveness of heptavalent pneumococcal conjugate vaccine in children younger than 5 years of age for prevention of pneumonia: updated analysis using World Health Organization standardized interpretation of chest radiographs. Pediatr Infect Dis J. 2006;25(9):779–781.
- , . A one‐way components of variance model for categorical data. Biometrics. 1977;33:671–679.
- , . The measurement of observer agreement for categorical data. Biometrics. 1977;33(1):159–174.
- , . Kappa statistic. CMAJ. 2005;173(1):16.
- , . Clinical biostatistics. LIV. The biostatistics of concordance. Clin Pharmacol Ther. 1981;29(1):111–123.
- , , , , , . Practice guidelines for the management of community‐acquired pneumonia in adults. Infectious Diseases Society of America. Clin Infect Dis. 2000;31(2):347–382.
- , , , et al. Guidelines for the management of adults with community‐acquired pneumonia. Diagnosis, assessment of severity, antimicrobial therapy, and prevention. Am J Respir Crit Care Med. 2001;163(7):1730–1754.
- , . Commentary does clinical history affect perception?Acad Radiol. 2006;13(3):402–403.
- , . The effect of clinical history on chest radiograph interpretations in a PACS environment. Invest Radiol. 1991;26(5):512–514.
- , , , . Comparison of radiological findings and microbial aetiology of childhood pneumonia. Acta Paediatr. 1993;82(4):360–363.
© 2012 Society of Hospital Medicine

Correction of CSF Protein
Traumatic lumbar puncture (LP) occurs when peripheral blood is introduced into the cerebrospinal fluid (CSF) as a result of needle trauma, which causes bleeding into the subarachnoid space. Traumatic LPs occur in up to 30% of LPs performed in children.1, 2 In addition to affecting the CSF white blood cell count, the presence of CSF red blood cells (RBCs) is associated with higher CSF protein concentrations due to the higher protein concentration in plasma compared with CSF and to the release of protein from lysed red blood cells. CSF protein concentration has been used in clinical decision rules for the prediction of bacterial meningitis in children.3 Elevated protein levels are difficult to interpret in cases of traumatic LP, and a diagnosis of bacterial meningitis may be more difficult to exclude on the basis of CSF test results.4
The interpretation of CSF protein levels is further complicated in the youngest infants due to both the changing composition of the CSF as well as the higher rates of traumatic LPs.5 Therefore, studies establishing a correction factor, adjusting observed CSF protein levels for the presence of CSF RBCs, that included predominantly older children may not be generalizable to neonates and young infants.6 We sought to determine the relationship between CSF RBC count and CSF protein in infants 56 days of age who underwent LP in the emergency department (ED).
METHODS
Study Design, Setting, and Participants
This cross‐sectional study was performed at The Children's Hospital of Philadelphia (Philadelphia, PA), an urban, tertiary care children's hospital. The Committees for the Protection of Human Subjects approved this study with a waiver of informed consent.
Infants 56 days of age and younger were eligible for inclusion if they had an LP performed as part of their ED evaluation between January 1, 2005 and July 31, 2009. At The Children's Hospital of Philadelphia, infants 56 days and younger routinely receive LPs for evaluation of fever.79 Patients undergoing LP in the ED were identified using computerized order entry records as previously described.5, 10
We excluded patients with conditions known to elevate CSF protein, including: serious bacterial infection (bacterial meningitis, urinary tract infection, bacteremia, pneumonia, septic arthritis, and bacterial gastroenteritis),11 presence of a ventricular shunt, aseptic meningitis (positive CSF enteroviral polymerase chain reaction or CSF herpes simplex virus polymerase chain reaction), congenital infections (eg, syphilis), seizure prior to presentation, and elevated bilirubin (if serum bilirubin was obtained). Due to the fact that grossly bloody CSF samples are difficult to interpret, we excluded those with a CSF RBC count >150,000 cells/mm3, a cutoff representing the 99th percentile of CSF RBC values in the cohort after applying other exclusion criteria.
Study Definitions
Bacterial meningitis was defined as either the isolation of a known bacterial pathogen from the CSF or, in patients who received antibiotics prior to evaluation, the combination of CSF pleocytosis and bacteria reported on CSF Gram stain. Bacteremia was defined as the isolation of a known bacterial pathogen from blood cultures excluding commensal skin flora. Urinary tract infection was defined as growth of a single known pathogen meeting 1 of 3 criteria: (1) 1000 colony‐forming units per mL for urine cultures obtained by suprapubic aspiration, (2) 50,000 colony‐forming units per mL from a catheterized specimen, or (3) 10,000 colony‐forming units per mL from a catheterized specimen in association with a positive urinalysis.1214
Statistical Analysis
Data analysis was performed using STATA version 12 (Stata Corp, College Station, TX). Linear regression was used to determine the association between CSF RBC and CSF protein. We analyzed the following groups of children: 1) all eligible patients; 2) children 28 days versus children >28 days; 3) vaginal versus cesarean delivery; and 4) patients without CSF pleocytosis. In the primary subanalysis, CSF pleocytosis was defined as CSF white blood cells (WBCs) >19 cells/mm3 for infants 28 days of age and CSF WBCs >9 cells/mm3 for infants 29 days of age, using reference values established by Kestenbaum et al.10 Alternate definitions of CSF pleocytosis were also examined using reference values proposed by Byington et al15 (age 28 days, >18 cells/mm3; age >29 days, >8.5 cells/mm3) and Chadwick et al16(age 0‐7 days, >26 cells/mm3; age 8‐28 days, >9 cells/mm3; age 29‐49 days, >8 cells/mm3; and age 50‐56 days, >7 cells/mm3). We did not correct CSF WBCs for the RBC count because prior studies suggest that such correction factors do not provide any advantage over uncorrected values.17 Finally, linear regression analysis was repeated while including subjects with >150,000 RBC/mm3 to determine the effect of including those patients on the association of CSF RBC count and protein concentrations. Subjects with grossly bloody CSF specimens, defined a priori as a CSF RBC >1,000,000/mm3, were excluded from this subanalysis.
RESULTS
There were 1986 infants, 56 days of age or younger, who underwent LP in the ED during the study period. Patients were excluded for the following reasons: missing medical record number (n = 16); missing CSF WBC, CSF RBC, or CSF protein values (n = 290); conditions known to elevate CSF protein concentrations (n = 426, as follows: presence of a ventricular shunt device [n = 48], serious bacterial infection [n = 149], congenital infection [n = 2], positive CSF polymerase chain reaction [PCR] test for either enterovirus or herpes simplex virus [n = 97], seizure prior to presentation [n = 98], or elevated serum bilirubin [n = 32]). An additional 13 patients with a CSF RBC count >150,000 cells/mm3 were also excluded.
For the remaining 1241 study infants, the median age was 34 days (interquartile range: 19 days‐46 days) and 554 patients (45%) were male. The median CSF RBC count was 40 cells/mm3 (interquartile range: 2‐1080 cells/mm3); 11.8% of patients had a CSF RBC count >10,000 cells/mm3.
CSF protein increased linearly with increasing CSF RBCs (Figure 1). The increase in the CSF protein concentration of 1.9 mg/dL per 1000 CSF RBCs for all patients was similar between different age groups and delivery types (Table 1). Restricting analysis to those patients without pleocytosis also yielded comparable results; applying 2 other definitions of pleocytosis did not change the magnitude of the association (Table 1).
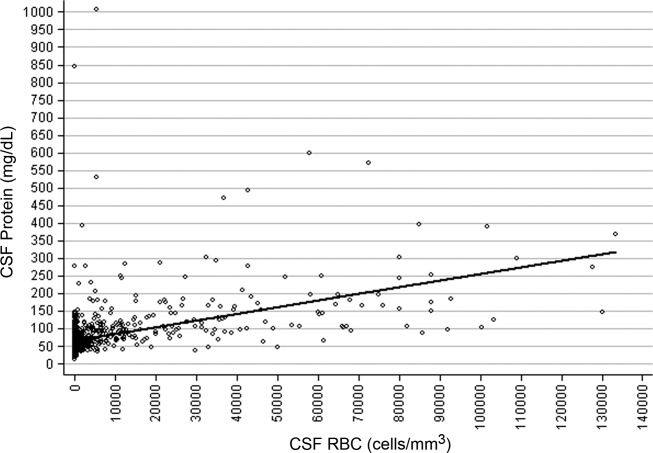
| Patient Group | No. of Patients | Change in CSF protein (mg/dL) per 1000 RBCs (95% CI) |
|---|---|---|
| ||
| All eligible | 1241 | 1.9 (1.7‐2.1) |
| No CSF pleocytosis* | 1085 | 2.0 (1.7‐2.4) |
| Age | ||
| Age 28 days | 481 | 1.9 (1.5‐2.3) |
| Age >28 days | 760 | 1.9 (1.7‐2.1) |
| Mode of delivery | ||
| Vaginal | 741 | 1.9 (1.7‐2.2) |
| Cesarean | 366 | 1.7 (1.4‐2.0) |
In a subanalysis, we then included subjects with a CSF RBC count >150,000/mm3; one extreme outlier with a CSF RBC equal to 3,160,000/mm3 remained excluded. Inclusion of more traumatic samples lessened the overall correction factor. The CSF protein increased by 1.22 mg/dL (95% confidence interval: 1.14‐1.29 mg/dL) per 1000 RBC/mm3 increase in the CSF. In the subset without CSF pleocytosis, the CSF protein increased by 1.44 mg/dL (95% confidence interval: 1.33‐1.57 mg/dL) per 1000 RBC/mm3.
Three children had high CSF protein values (>500 mg/dL) despite the relative paucity of CSF RBCs. Two of these infants had respiratory syncytial virus bronchiolitis; neither infant had signs or symptoms of neurological illness. While details of the labor and delivery were not available, the CSF sample for one of these infants was reported to have xanthochromia, and the other infant was reported to have had a traumatic LP with a CSF sample that subsequently cleared. The third infant had fever without a specific source identified, but had a birth history of vaginal delivery and prolonged labor. The CSF sample from LP for this patient was reported as grossly bloody by the performing clinicians and by the Clinical Microbiology Laboratory, despite a CSF red blood cell count of only 5500 cells/mm3.
DISCUSSION
In a large cohort of infants 56 days of age, CSF protein increased by approximately 2 mg/dL for every 1000 cell/mm3 increase in CSF RBCs. This correction factor is higher than previously reported correction factors from studies including older infants and children.6, 18 Some of this difference may be explained by the presence of old blood related to the trauma of labor and delivery. Previous work has demonstrated that the presence of xanthochromia, another RBC breakdown product, in the CSF of young infants was associated with maternal labor and elevated CSF protein.19 Consistent with this hypothesis, the correction factor was nominally higher in those infants born by vaginal delivery compared with those born by cesarean section.
Several infants in our study had high CSF protein levels despite a paucity of CSF RBCs. By convention at our institution, the protein and glucose values are determined from the second tube, and the WBCs and RBCs are determined from the third tube. However, we could not determine the order in which the specimens for protein and RBCs were collected for individual specimens. Additionally, it is possible that delayed clearance of blood from a traumatic LP would cause the CSF protein level to be high, as measured in the second tube, but lead to few RBCs in the third tube. These circumstances could explain the discrepancy between CSF protein and CSF RBCs counts for some patients.
The CSF protein adjustment factor for infants 56 days of age in our study was almost twice the correction of 1.1 mg/dL for every 1000 RBC increase reported by Nigrovic et al among infants 90 days of age.6 There are differences in the design of the 2 studies. We excluded subjects with exceedingly large numbers of CSF RBCs and restricted inclusion to those 56 days of age or younger. When subjects with >150,000 RBCs/mm3 were included, the correction decreased to a value comparable to that reported by Nigrovic et al.6 Therefore, it is possible that inclusion of subjects with grossly bloody specimens in prior studies skewed the association between CSF protein and CSF RBCs. The number of subjects in our cohort with >150,000 CSF RBCs was too small to calculate a relevant correction factor for infants with exceedingly high CSF RBC counts.
The results of this study should be considered in the context of several limitations. Details regarding labor and delivery were not available. We suspect that old blood related to the trauma of birth provides partial explanation for the higher correction factor in neonates and young infants compared with older children. However, differences in CSF blood‐brain barrier permeability may also contribute to these differences, independent of the CSF RBC count. Additionally, though the study population included a large number of neonates and young infants, a relatively small proportion of subjects had high CSF RBC counts. Therefore, our results may not be generalizable to those with exceedingly high CSF RBCs. Finally, available clinical prediction rules to identify patients with CSF pleocytosis, who are at very low risk for bacterial meningitis, include CSF protein as a predictor.3, 20, 21 Although CSF protein in children with traumatic LPs may need adjustment prior to application of the clinical prediction rule, further study is needed before implementing this approach.
In conclusion, we found that CSF protein concentrations increased by approximately 2 mg/dL for every 1000 CSF RBCs. Correction of CSF protein for those with extremely high CSF RBCs may not be appropriate, as conventional linear models do not apply. These data may assist clinicians in interpreting CSF protein concentrations in infants 56 days of age and younger in the context of traumatic LPs.
- ,,,,,.Local anesthetic and stylet styles: factors associated with resident lumbar puncture success.Pediatrics.2006;117:876–881.
- ,,.Risk factors for traumatic or unsuccessful lumbar punctures in children.Ann Emerg Med.2007;49:762–771.
- ,,, et al.Clinical prediction rule for identifying children with cerebrospinal fluid pleocytosis at very low risk of bacterial meningitis.JAMA.2007;297:52–60.
- ,,.Interpretation of traumatic lumbar punctures: who can go home?Pediatrics.2003;111:525–528.
- ,,,,.Age‐specific reference values for cerebrospinal fluid protein concentration in neonates and young infants.J Hosp Med.2011;6:22–27.
- ,,.Correction of cerebrospinal fluid protein for the presence of red blood cells in children with a traumatic lumbar puncture.J Pediatr.2011;159:158–159.
- ,,.Failure of infant observation scales in detecting serious illness in febrile, 4‐ to 8‐week‐old infants.Pediatrics.1990;85:1040–1043.
- ,.Unpredictability of serious bacterial illness in febrile infants from birth to 1 month of age.Arch Pediatr Adolesc Med.1999;153:508–511.
- ,,.Outpatient management without antibiotics of fever in selected infants.N Engl J Med.1993;329:1437–1441.
- ,,,,.Defining cerebrospinal fluid white blood cell count reference values in neonates and young infants.Pediatrics.2010;125:257–264.
- ,,,,.Sterile cerebrospinal fluid pleocytosis in young infants with urinary tract infections.J Pediatr.2008;153:290–292.
- ,,, et al.Clinical and demographic factors associated with urinary tract infection in young febrile infants.Pediatrics.2005;116:644–648.
- ,,,,.Prevalence of urinary tract infection in febrile young children in the emergency department.Pediatrics.1998;102:e16.
- ,,,,,.Prevalence of urinary tract infection in febrile infants.J Pediatr.1993;123:17–23.
- ,,.Normative cerebrospinal fluid profiles in febrile infants.J Pediatr.2011;158:130–134.
- ,,,.Cerebrospinal fluid characteristics of infants who present to the emergency department with fever: establishing normal values by week of age.Pediatr Infect Dis J.2011;30:e63–e67.
- ,.Corrections for leukocytes and percent of neutrophils do not match observations in blood‐contaminated cerebrospinal fluid and have no value over uncorrected cells for diagnosis.Pediatr Infect Dis J.2006;25:8–11.
- ,,,,.Distinguishing cerebrospinal fluid abnormalities in children with bacterial meningitis and traumatic lumbar puncture.J Infect Dis.1990;162:251–254.
- ,,,.Cerebrospinal fluid xanthochromia in newborns is related to maternal labor before delivery.Pediatrics.2007;120:e1212–e1216.
- ,.Accuracy and test characteristics of ancillary tests of cerebrospinal fluid for predicting acute bacterial meningitis in children with low white blood cell counts in cerebrospinal fluid.Acad Emerg Med.2005;12:303–309.
- ,,,.A decision rule for predicting bacterial meningitis in children with cerebrospinal fluid pleocytosis when gram stain is negative or unavailable.Acad Emerg Med.2008;15:437–444.
Traumatic lumbar puncture (LP) occurs when peripheral blood is introduced into the cerebrospinal fluid (CSF) as a result of needle trauma, which causes bleeding into the subarachnoid space. Traumatic LPs occur in up to 30% of LPs performed in children.1, 2 In addition to affecting the CSF white blood cell count, the presence of CSF red blood cells (RBCs) is associated with higher CSF protein concentrations due to the higher protein concentration in plasma compared with CSF and to the release of protein from lysed red blood cells. CSF protein concentration has been used in clinical decision rules for the prediction of bacterial meningitis in children.3 Elevated protein levels are difficult to interpret in cases of traumatic LP, and a diagnosis of bacterial meningitis may be more difficult to exclude on the basis of CSF test results.4
The interpretation of CSF protein levels is further complicated in the youngest infants due to both the changing composition of the CSF as well as the higher rates of traumatic LPs.5 Therefore, studies establishing a correction factor, adjusting observed CSF protein levels for the presence of CSF RBCs, that included predominantly older children may not be generalizable to neonates and young infants.6 We sought to determine the relationship between CSF RBC count and CSF protein in infants 56 days of age who underwent LP in the emergency department (ED).
METHODS
Study Design, Setting, and Participants
This cross‐sectional study was performed at The Children's Hospital of Philadelphia (Philadelphia, PA), an urban, tertiary care children's hospital. The Committees for the Protection of Human Subjects approved this study with a waiver of informed consent.
Infants 56 days of age and younger were eligible for inclusion if they had an LP performed as part of their ED evaluation between January 1, 2005 and July 31, 2009. At The Children's Hospital of Philadelphia, infants 56 days and younger routinely receive LPs for evaluation of fever.79 Patients undergoing LP in the ED were identified using computerized order entry records as previously described.5, 10
We excluded patients with conditions known to elevate CSF protein, including: serious bacterial infection (bacterial meningitis, urinary tract infection, bacteremia, pneumonia, septic arthritis, and bacterial gastroenteritis),11 presence of a ventricular shunt, aseptic meningitis (positive CSF enteroviral polymerase chain reaction or CSF herpes simplex virus polymerase chain reaction), congenital infections (eg, syphilis), seizure prior to presentation, and elevated bilirubin (if serum bilirubin was obtained). Due to the fact that grossly bloody CSF samples are difficult to interpret, we excluded those with a CSF RBC count >150,000 cells/mm3, a cutoff representing the 99th percentile of CSF RBC values in the cohort after applying other exclusion criteria.
Study Definitions
Bacterial meningitis was defined as either the isolation of a known bacterial pathogen from the CSF or, in patients who received antibiotics prior to evaluation, the combination of CSF pleocytosis and bacteria reported on CSF Gram stain. Bacteremia was defined as the isolation of a known bacterial pathogen from blood cultures excluding commensal skin flora. Urinary tract infection was defined as growth of a single known pathogen meeting 1 of 3 criteria: (1) 1000 colony‐forming units per mL for urine cultures obtained by suprapubic aspiration, (2) 50,000 colony‐forming units per mL from a catheterized specimen, or (3) 10,000 colony‐forming units per mL from a catheterized specimen in association with a positive urinalysis.1214
Statistical Analysis
Data analysis was performed using STATA version 12 (Stata Corp, College Station, TX). Linear regression was used to determine the association between CSF RBC and CSF protein. We analyzed the following groups of children: 1) all eligible patients; 2) children 28 days versus children >28 days; 3) vaginal versus cesarean delivery; and 4) patients without CSF pleocytosis. In the primary subanalysis, CSF pleocytosis was defined as CSF white blood cells (WBCs) >19 cells/mm3 for infants 28 days of age and CSF WBCs >9 cells/mm3 for infants 29 days of age, using reference values established by Kestenbaum et al.10 Alternate definitions of CSF pleocytosis were also examined using reference values proposed by Byington et al15 (age 28 days, >18 cells/mm3; age >29 days, >8.5 cells/mm3) and Chadwick et al16(age 0‐7 days, >26 cells/mm3; age 8‐28 days, >9 cells/mm3; age 29‐49 days, >8 cells/mm3; and age 50‐56 days, >7 cells/mm3). We did not correct CSF WBCs for the RBC count because prior studies suggest that such correction factors do not provide any advantage over uncorrected values.17 Finally, linear regression analysis was repeated while including subjects with >150,000 RBC/mm3 to determine the effect of including those patients on the association of CSF RBC count and protein concentrations. Subjects with grossly bloody CSF specimens, defined a priori as a CSF RBC >1,000,000/mm3, were excluded from this subanalysis.
RESULTS
There were 1986 infants, 56 days of age or younger, who underwent LP in the ED during the study period. Patients were excluded for the following reasons: missing medical record number (n = 16); missing CSF WBC, CSF RBC, or CSF protein values (n = 290); conditions known to elevate CSF protein concentrations (n = 426, as follows: presence of a ventricular shunt device [n = 48], serious bacterial infection [n = 149], congenital infection [n = 2], positive CSF polymerase chain reaction [PCR] test for either enterovirus or herpes simplex virus [n = 97], seizure prior to presentation [n = 98], or elevated serum bilirubin [n = 32]). An additional 13 patients with a CSF RBC count >150,000 cells/mm3 were also excluded.
For the remaining 1241 study infants, the median age was 34 days (interquartile range: 19 days‐46 days) and 554 patients (45%) were male. The median CSF RBC count was 40 cells/mm3 (interquartile range: 2‐1080 cells/mm3); 11.8% of patients had a CSF RBC count >10,000 cells/mm3.
CSF protein increased linearly with increasing CSF RBCs (Figure 1). The increase in the CSF protein concentration of 1.9 mg/dL per 1000 CSF RBCs for all patients was similar between different age groups and delivery types (Table 1). Restricting analysis to those patients without pleocytosis also yielded comparable results; applying 2 other definitions of pleocytosis did not change the magnitude of the association (Table 1).
| Patient Group | No. of Patients | Change in CSF protein (mg/dL) per 1000 RBCs (95% CI) |
|---|---|---|
| ||
| All eligible | 1241 | 1.9 (1.7‐2.1) |
| No CSF pleocytosis* | 1085 | 2.0 (1.7‐2.4) |
| Age | ||
| Age 28 days | 481 | 1.9 (1.5‐2.3) |
| Age >28 days | 760 | 1.9 (1.7‐2.1) |
| Mode of delivery | ||
| Vaginal | 741 | 1.9 (1.7‐2.2) |
| Cesarean | 366 | 1.7 (1.4‐2.0) |
In a subanalysis, we then included subjects with a CSF RBC count >150,000/mm3; one extreme outlier with a CSF RBC equal to 3,160,000/mm3 remained excluded. Inclusion of more traumatic samples lessened the overall correction factor. The CSF protein increased by 1.22 mg/dL (95% confidence interval: 1.14‐1.29 mg/dL) per 1000 RBC/mm3 increase in the CSF. In the subset without CSF pleocytosis, the CSF protein increased by 1.44 mg/dL (95% confidence interval: 1.33‐1.57 mg/dL) per 1000 RBC/mm3.
Three children had high CSF protein values (>500 mg/dL) despite the relative paucity of CSF RBCs. Two of these infants had respiratory syncytial virus bronchiolitis; neither infant had signs or symptoms of neurological illness. While details of the labor and delivery were not available, the CSF sample for one of these infants was reported to have xanthochromia, and the other infant was reported to have had a traumatic LP with a CSF sample that subsequently cleared. The third infant had fever without a specific source identified, but had a birth history of vaginal delivery and prolonged labor. The CSF sample from LP for this patient was reported as grossly bloody by the performing clinicians and by the Clinical Microbiology Laboratory, despite a CSF red blood cell count of only 5500 cells/mm3.
DISCUSSION
In a large cohort of infants 56 days of age, CSF protein increased by approximately 2 mg/dL for every 1000 cell/mm3 increase in CSF RBCs. This correction factor is higher than previously reported correction factors from studies including older infants and children.6, 18 Some of this difference may be explained by the presence of old blood related to the trauma of labor and delivery. Previous work has demonstrated that the presence of xanthochromia, another RBC breakdown product, in the CSF of young infants was associated with maternal labor and elevated CSF protein.19 Consistent with this hypothesis, the correction factor was nominally higher in those infants born by vaginal delivery compared with those born by cesarean section.
Several infants in our study had high CSF protein levels despite a paucity of CSF RBCs. By convention at our institution, the protein and glucose values are determined from the second tube, and the WBCs and RBCs are determined from the third tube. However, we could not determine the order in which the specimens for protein and RBCs were collected for individual specimens. Additionally, it is possible that delayed clearance of blood from a traumatic LP would cause the CSF protein level to be high, as measured in the second tube, but lead to few RBCs in the third tube. These circumstances could explain the discrepancy between CSF protein and CSF RBCs counts for some patients.
The CSF protein adjustment factor for infants 56 days of age in our study was almost twice the correction of 1.1 mg/dL for every 1000 RBC increase reported by Nigrovic et al among infants 90 days of age.6 There are differences in the design of the 2 studies. We excluded subjects with exceedingly large numbers of CSF RBCs and restricted inclusion to those 56 days of age or younger. When subjects with >150,000 RBCs/mm3 were included, the correction decreased to a value comparable to that reported by Nigrovic et al.6 Therefore, it is possible that inclusion of subjects with grossly bloody specimens in prior studies skewed the association between CSF protein and CSF RBCs. The number of subjects in our cohort with >150,000 CSF RBCs was too small to calculate a relevant correction factor for infants with exceedingly high CSF RBC counts.
The results of this study should be considered in the context of several limitations. Details regarding labor and delivery were not available. We suspect that old blood related to the trauma of birth provides partial explanation for the higher correction factor in neonates and young infants compared with older children. However, differences in CSF blood‐brain barrier permeability may also contribute to these differences, independent of the CSF RBC count. Additionally, though the study population included a large number of neonates and young infants, a relatively small proportion of subjects had high CSF RBC counts. Therefore, our results may not be generalizable to those with exceedingly high CSF RBCs. Finally, available clinical prediction rules to identify patients with CSF pleocytosis, who are at very low risk for bacterial meningitis, include CSF protein as a predictor.3, 20, 21 Although CSF protein in children with traumatic LPs may need adjustment prior to application of the clinical prediction rule, further study is needed before implementing this approach.
In conclusion, we found that CSF protein concentrations increased by approximately 2 mg/dL for every 1000 CSF RBCs. Correction of CSF protein for those with extremely high CSF RBCs may not be appropriate, as conventional linear models do not apply. These data may assist clinicians in interpreting CSF protein concentrations in infants 56 days of age and younger in the context of traumatic LPs.
- ,,,,,.Local anesthetic and stylet styles: factors associated with resident lumbar puncture success.Pediatrics.2006;117:876–881.
- ,,.Risk factors for traumatic or unsuccessful lumbar punctures in children.Ann Emerg Med.2007;49:762–771.
- ,,, et al.Clinical prediction rule for identifying children with cerebrospinal fluid pleocytosis at very low risk of bacterial meningitis.JAMA.2007;297:52–60.
- ,,.Interpretation of traumatic lumbar punctures: who can go home?Pediatrics.2003;111:525–528.
- ,,,,.Age‐specific reference values for cerebrospinal fluid protein concentration in neonates and young infants.J Hosp Med.2011;6:22–27.
- ,,.Correction of cerebrospinal fluid protein for the presence of red blood cells in children with a traumatic lumbar puncture.J Pediatr.2011;159:158–159.
- ,,.Failure of infant observation scales in detecting serious illness in febrile, 4‐ to 8‐week‐old infants.Pediatrics.1990;85:1040–1043.
- ,.Unpredictability of serious bacterial illness in febrile infants from birth to 1 month of age.Arch Pediatr Adolesc Med.1999;153:508–511.
- ,,.Outpatient management without antibiotics of fever in selected infants.N Engl J Med.1993;329:1437–1441.
- ,,,,.Defining cerebrospinal fluid white blood cell count reference values in neonates and young infants.Pediatrics.2010;125:257–264.
- ,,,,.Sterile cerebrospinal fluid pleocytosis in young infants with urinary tract infections.J Pediatr.2008;153:290–292.
- ,,, et al.Clinical and demographic factors associated with urinary tract infection in young febrile infants.Pediatrics.2005;116:644–648.
- ,,,,.Prevalence of urinary tract infection in febrile young children in the emergency department.Pediatrics.1998;102:e16.
- ,,,,,.Prevalence of urinary tract infection in febrile infants.J Pediatr.1993;123:17–23.
- ,,.Normative cerebrospinal fluid profiles in febrile infants.J Pediatr.2011;158:130–134.
- ,,,.Cerebrospinal fluid characteristics of infants who present to the emergency department with fever: establishing normal values by week of age.Pediatr Infect Dis J.2011;30:e63–e67.
- ,.Corrections for leukocytes and percent of neutrophils do not match observations in blood‐contaminated cerebrospinal fluid and have no value over uncorrected cells for diagnosis.Pediatr Infect Dis J.2006;25:8–11.
- ,,,,.Distinguishing cerebrospinal fluid abnormalities in children with bacterial meningitis and traumatic lumbar puncture.J Infect Dis.1990;162:251–254.
- ,,,.Cerebrospinal fluid xanthochromia in newborns is related to maternal labor before delivery.Pediatrics.2007;120:e1212–e1216.
- ,.Accuracy and test characteristics of ancillary tests of cerebrospinal fluid for predicting acute bacterial meningitis in children with low white blood cell counts in cerebrospinal fluid.Acad Emerg Med.2005;12:303–309.
- ,,,.A decision rule for predicting bacterial meningitis in children with cerebrospinal fluid pleocytosis when gram stain is negative or unavailable.Acad Emerg Med.2008;15:437–444.
Copyright © 2012 Society of Hospital Medicine

Reliability of CXR for Pneumonia
The chest radiograph (CXR) is the most commonly used diagnostic imaging modality in children, and is considered to be the gold standard for the diagnosis of pneumonia. As such, physicians in developed countries rely on chest radiography to establish the diagnosis of pneumonia.13 However, there are limited data investigating the reliability of this test for the diagnosis of pneumonia in children.2, 46
Prior investigations have noted poor overall agreement by emergency medicine, infectious diseases, and pulmonary medicine physicians, and even radiologists, in their interpretation of chest radiographs for the diagnosis of pneumonia.2, 5, 710 The World Health Organization (WHO) developed criteria to standardize CXR interpretation for the diagnosis of pneumonia in children for use in epidemiologic studies.11 These standardized definitions of pneumonia have been formally evaluated by the WHO6 and utilized in epidemiologic studies of vaccine efficacy,12 but the overall reliability of these radiographic criteria have not been studied outside of these forums.
We conducted this prospective case‐based study to evaluate the reliability of the radiographic diagnosis of pneumonia among children presenting to a pediatric emergency department with clinical suspicion of pneumonia. We were primarily interested in assessing the overall reliability in CXR interpretation for the diagnosis of pneumonia, and identifying which radiographic features of pneumonia were consistently identified by radiologists.
MATERIALS AND METHODS
Study Subjects
We evaluated the reliability of CXR interpretation with respect to the diagnosis of pneumonia among radiologists. Six board‐certified radiologists at 2 academic children's hospitals (Children's Hospital of Philadelphia, Philadelphia, PA [n = 3] and Children's Hospital, Boston, Boston, MA [n = 3]) interpreted the same 110 chest radiographs in a blinded fashion. The radiologists varied with respect to the number of years practicing pediatric radiology (median 8 years, range 3‐36 years). Clinical information such as age, gender, clinical indication for obtaining the radiograph, history, and physical examination findings were not provided. Aside from the study form which stated the WHO classification scheme for radiographic pneumonia, no other information or training was provided to the radiologists as part of this study.
Radiographs were selected among a population of children presenting to the emergency department at Children's Hospital, Boston, who had a radiograph obtained for concern of pneumonia. From this cohort, we selected children who had radiographs which encompassed the spectrum of respiratory disease processes encountered in a pediatric population. The radiographs selected for review included 50 radiographs with a final reading in the medical record without suspicion for pneumonia, and 50 radiographs in which the diagnosis of pneumonia could not be excluded. In the latter group, 25 radiographs had a final reading suggestive of an alveolar infiltrate, and 25 radiographs had a final reading suggestive of an interstitial infiltrate. Ten duplicate radiographs were included to permit assessment of intra‐rater reliability.
Radiograph Interpretation
Radiologists at both sites interpreted the identical 110 radiographs (both anteroposterior [AP] and lateral views for each subject). Digital Imaging and Communications in Medicine (DICOM) images were downloaded from a registry at Children's Hospital, Boston, and were copied to DVDs which were provided to each radiologist. Standardized radiographic imaging software (eFilm Lite [Mississauga, Canada]) was used by each radiologist to view and interpret the radiographs.
Each radiologist completed a study questionnaire for each radiograph interpreted (see Supporting Appendix A in the online version of this article). The questionnaire utilized radiographic descriptors of primary end‐point pneumonia described by the WHO which were procured to standardize the radiographic diagnosis of pneumonia.11, 12 The main outcome of interest was the presence or absence of an infiltrate. Among radiographs in which an infiltrate was identified, radiologists selected whether there was an alveolar infiltrate, interstitial infiltrate, or both. An alveolar infiltrate was defined as a dense or fluffy opacity that occupies a portion or whole of a lobe, or of the entire lung, that may or may not contain air bronchograms.11, 12 An interstitial infiltrate was defined by a lacy pattern involving both lungs, featuring peribronchial thickening and multiple areas of atelectasis.11, 12 It also included minor patchy infiltrates that were not of sufficient magnitude to constitute consolidation, and small areas of atelectasis that in children may be difficult to distinguish from consolidation. Among interstitial infiltrates, radiologists were asked to distinguish infiltrate from atelectasis. A radiograph classified as having either an alveolar infiltrate or interstitial infiltrate (not atelectasis) was considered to have any infiltrate. Additional findings including air bronchograms, hilar adenopathy, pleural effusion, and location of abnormalities were also recorded.
Statistical Analysis
Inter‐rater reliability was assessed using the kappa statistic to determine the overall agreement between the 6 radiologists for each binary outcome (ie, presence or absence of alveolar infiltrate). To calculate 95% confidence intervals (CI) for kappa statistics with more than 2 raters, we employed a bootstrapping method with 1000 replications of samples equal in size to the study sample, using the kapci program as implemented by STATA software (version 10.1, STATA Corp, College Station, TX). Also, intra‐rater reliability was evaluated by examining the agreement within each radiologist upon review of 10 duplicate radiographs that had been randomly inserted into the case‐mix. We used the benchmarks proposed by Landis and Koch to classify the strength of agreement measured by the kappa statistic, as follows: poor (<0.0); slight (0‐0.20); fair (0.21‐0.40); moderate (0.41‐0.60); substantial (0.61‐0.80); almost perfect (0.81‐1.0).13
The study was approved by the institutional review boards at Children's Hospital, Boston and Children's Hospital of Philadelphia.
RESULTS
Patient Sample
The sample of 110 radiographs was obtained from 100 children presenting to the emergency department at Children's Hospital, Boston, with concern of pneumonia. These patients ranged in age from 1 week to 19 years (median, 3.5 years; interquartile range [IQR], 1.6‐6.0 years). Fifty (50%) of these patients were male. As stated above, the sample comprised 50 radiographs with a final reading in the medical record without suspicion for pneumonia, and 50 radiographs in which the diagnosis of pneumonia could not be excluded. The 10 duplicate radiographs encompassed a similar spectrum of findings.
Inter‐Rater Reliability
The kappa coefficients of inter‐rater reliability between the radiologists across the 6 clinical measures of interest are displayed in Table 1. As shown, the most reliable measure was that of alveolar infiltrate (Figure 1), which attained a substantial degree of agreement between the radiologists. Two other measures, any infiltrate and pleural effusion, attained moderate reliability, while bronchograms and hilar adenopathy were each classified as having fair reliability. However, interstitial infiltrate (Figure 2) was found to have the lowest kappa estimate, with a slight degree of reliability. When examining inter‐rater reliability among the radiologists separately from each institution, the pattern of results was similar.
| All Radiologists (n = 6) | Kappa | 95% Confidence Interval |
|---|---|---|
| ||
| Any infiltrate | 0.47 | 0.39, 0.56 |
| Alveolar infiltrate | 0.69 | 0.60, 0.78 |
| Interstitial infiltrate | 0.14 | 0.05, 0.23 |
| Air bronchograms | 0.32 | 0.24, 0.42 |
| Hilar adenopathy | 0.21 | 0.08, 0.39 |
| Pleural effusion | 0.45 | 0.29, 0.61 |
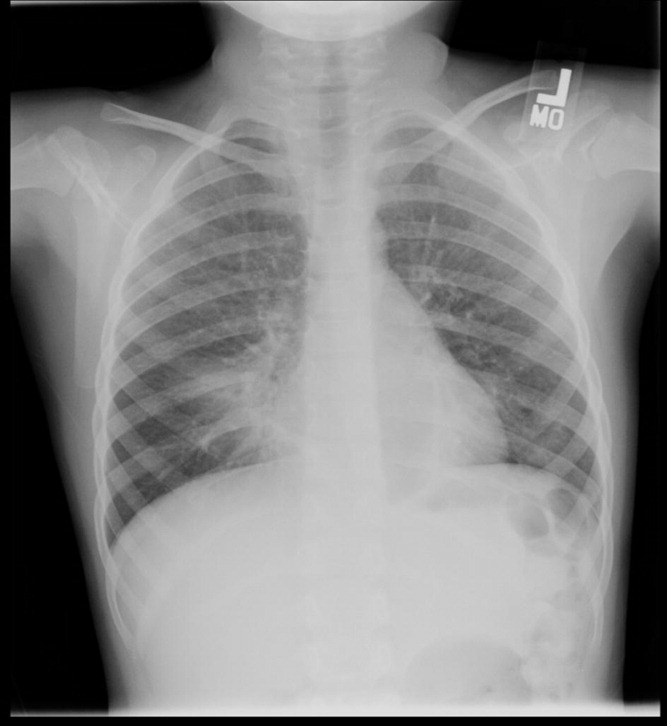
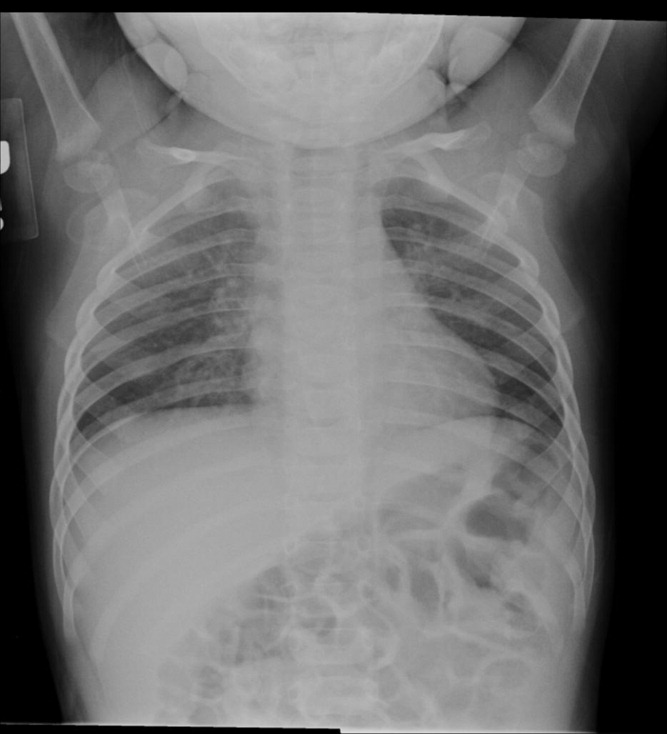
At least 4 of the 6 radiologists agreed on the presence or absence of an alveolar infiltrate for 95 of the 100 unique CXRs; all 6 radiologists agreed regarding the presence or absence of an alveolar infiltrate in 72 of the 100 unique CXRs. At least 4 of the 6 radiologists agreed on the presence or absence of any infiltrate and interstitial infiltrate 96% and 90% of the time, respectively. All 6 of the radiologists agreed on the presence or absence of any infiltrate and interstitial infiltrate 35% and 27% of the time, respectively.
Intra‐Rater Reliability
Estimates of intra‐rater reliability on the primary clinical outcomes (alveolar infiltrate, interstitial infiltrate, and any infiltrate) are found in Table 2. Across the 6 raters, the kappa estimates for alveolar infiltrate were all classified as substantial or almost perfect. The kappa estimates for interstitial infiltrate varied widely, ranging from fair to almost perfect, while for any infiltrate, reliability ranged from moderate to almost perfect.
| Kappa | 95% Confidence Interval | |
|---|---|---|
| ||
| Any infiltrate | ||
| Rater 1 | 1.00 | 1.00, 1.00 |
| Rater 2 | 0.60 | 0.10, 1.00 |
| Rater 3 | 0.80 | 0.44, 1.00 |
| Rater 4 | 1.00 | 1.00, 1.00 |
| Rater 5 | n/a* | |
| Rater 6 | 1.00 | 1.00, 1.00 |
| Alveolar infiltrate | ||
| Rater 1 | 1.00 | 1.00, 1.00 |
| Rater 2 | 1.00 | 1.00, 1.00 |
| Rater 3 | 1.00 | 1.00, 1.00 |
| Rater 4 | 1.00 | 1.00, 1.00 |
| Rater 5 | 0.78 | 0.39, 1.00 |
| Rater 6 | 0.74 | 0.27, 1.00 |
| Interstitial infiltrate | ||
| Rater 1 | 1.00 | 1.00, 1.00 |
| Rater 2 | 0.21 | 0.43, 0.85 |
| Rater 3 | 0.74 | 0.27, 1.00 |
| Rater 4 | n/a | |
| Rater 5 | 0.58 | 0.07, 1.00 |
| Rater 6 | 0.62 | 0.5, 1.00 |
DISCUSSION
The chest radiograph serves as an integral component of the reference standard for the diagnosis of childhood pneumonia. Few prior studies have assessed the reliability of chest radiograph findings in children.3, 5, 12, 14, 15 We found a high degree of agreement among radiologists for radiologic findings consistent with bacterial pneumonia when standardized interpretation criteria were applied. In this study, we identified radiographic features of pneumonia, such as alveolar infiltrate and pleural effusion, that were consistently identified by different radiologists reviewing the same radiograph and by the same radiologist reviewing the same radiograph. These data support the notion that radiographic features most suggestive of bacterial pneumonia are consistently identified by radiologists.16, 17 There was less consistency in the identification of other radiographic findings, such as interstitial infiltrates, air bronchograms, and hilar lymphadenopathy.
Prior studies have found high levels of disagreement among radiologists in the interpretation of chest radiographs.2, 3, 15, 18 Many of these prior studies emphasized variation in detection of radiographic findings that would not typically alter clinical management. We observed high intra‐rater, and inter‐rater reliability among radiologists for the findings of alveolar infiltrate and pleural effusion. These are the radiographic findings most consistent with a bacterial etiologic agent for pneumonia.19 Other studies have also found that the presence of an alveolar infiltrate is a reliable radiographic finding in children18 and adults.7, 9, 10 These findings support the use of the WHO definition of primary endpoint pneumonia for use in epidemiologic studies.4, 6, 11
This study also confirms a previous report by Cherian et al. that findings of many children with asthma, reactive airways disease, bronchiolitis, and viral infections interstitial infiltrates are less reliable.6 This is not surprising considering the fact that these patients often have radiographic findings due to small airway disease and atelectasis.19, 20 The differentiation between atelectasis and interstitial infiltrate is difficult, particularly in young children. A prior study conducted among neonates observed wide variability in the interpretation of chest radiographs, and that the differentiation of pneumonia from atelectasis was difficult for this patient population.5 The decisions around antimicrobial treatment of children with radiographic findings of interstitial infiltrates should be made in the context of the clinical history and physical examination findings, and clinicians should realize that these radiographic features demonstrate poor reliability for the diagnosis of pneumonia.
Overall reliability for the presence of any infiltrate, and its converse, no infiltrate was considered moderate. This is driven by the low reliability and variability around the radiographic diagnosis of interstitial infiltrates. Our findings are similar to those observed in adults with lower respiratory tract infections.9 The low reliability in identification of interstitial infiltrates may explain why prior studies have demonstrated that the CXR results rarely change management in children who have radiographs performed for suspicion of pneumonia.1, 21 Our study highlights the importance of quantifying CXR findings to include specific comments regarding the presence or absence of alveolar infiltrates, rather than the presence or absence of any infiltrate.
The WHO has procured definitions the radiographic diagnosis of pneumonia, and this definition has been utilized to help standardize the interpretation of chest radiographs for the conduct of epidemiological studies.6, 11 Specifically, the definitions utilized not only define the presence or absence of pneumonia, but also attempt to differentiate a primarily bacterial infection (consolidation or pleural effusion), from a viral or atypical presentation (interstitial pattern). Even under the best of circumstances, the differentiation of viral versus bacterial pneumonia is not always possible, and again, is often made by the treating physician by incorporating the clinical setting within which the radiograph was obtained.
This study had several limitations. Firstly, the included radiographs did not reflect the frequency with which certain radiographic findings would be identified in children evaluated for pneumonia in a pediatric emergency department setting. Radiographs were purposefully selected to encompass a broad spectrum of radiologic findings, including less common findings such as hilar lymphadenopathy and pleural effusions. Thus, the prevalence of pneumonia and other abnormal findings in this study was artificially higher than typically observed among a cohort of children for whom pneumonia is considered, a factor that may limit the generalizability of our results. Secondly, the clinical history was not provided to the radiologists to avoid bias by indication. For this study, we notified the radiologists that all radiographs were performed for clinical suspicion of pneumonia without providing details about the subjects' signs and symptoms. The absence of clinical history, however, does not mirror the real world scenario in which the interpretation of the chest radiograph is frequently made in the context of the clinical history. The relevance of this latter issue is unclear, as Tudor et al. found a nonstatistically significant improvement in the overall accuracy in chest radiograph interpretation when radiologists were provided clinical details.10 The radiologists recruited for this study all practice in an academic children's hospital setting, and thus, the generalizability of our findings may be limited to this type of practice setting. Finally, reproducibility does not imply accuracy, and reliability in identifying specific findings does not necessarily lead to improved or different management. Thus, while the reliability of radiographic findings of alveolar infiltrate and pleural effusion is reassuringly high, the validity of these radiographic features for bacterial pneumonia is not known. Ascertainment of validity can only be assessed through the use of invasive testing such as lung biopsy, as the yield from bacterial testing such as blood cultures is low, and the results of other studies such as viral testing of nasopharyngeal washings do not prove an etiologic cause of pneumonia.
CONCLUSIONS
Radiographic findings of alveolar infiltrates and pleural effusions are highly reliable among radiologists. Radiographic interpretation of interstitial infiltrates appears to be less reliable.
- ,,, et al.Usefulness of chest radiographs in children with acute lower respiratory tract disease.J Pediatr.1987;111:187–193.
- ,,, et al.Disagreement in the interpretation of chest radiographs among specialists and clinical outcomes of patients hospitalized with suspected pneumonia.Eur J Intern Med.2006;17:43–47.
- ,,.Problems in the clinical and roentgenographic diagnosis of pneumonia in young children.Clin Pediatr (Phila).1984;23:398–399.
- WHO guidelines on detecting pneumonia in children.Lancet.1991;338:1453–1454.
- ,,, et al.Inter‐ and intra‐observer variability in the assessment of atelectasis and consolidation in neonatal chest radiographs.Pediatr Radiol.1999;29:459–462.
- ,,, et al.Standardized interpretation of paediatric chest radiographs for the diagnosis of pneumonia in epidemiological studies.Bull World Health Organ.2005;83:353–359.
- ,,, et al.Interobserver reliability of the chest radiograph in community‐acquired pneumonia. PORT Investigators.Chest.1996;110:343–350.
- ,,, et al.Chest radiographs in the emergency department: is the radiologist really necessary?Postgrad Med J.2003;79:214–217.
- ,,, et al.Inter‐observer variation in the interpretation of chest radiographs for pneumonia in community‐acquired lower respiratory tract infections.Clin Radiol.2004;59:743–752.
- ,,.An assessment of inter‐observer agreement and accuracy when reporting plain radiographs.Clin Radiol.1997;52:235–238.
- Standardization of interpretation of chest radiographs for the diagnosis of pneumonia in children. In:World Health Organization: Pneumonia Vaccine Trial Investigators' Group.Geneva:Department of Vaccine and Biologics;2001.
- ,,, et al.Effectiveness of heptavalent pneumococcal conjugate vaccine in children younger than 5 years of age for prevention of pneumonia: updated analysis using World Health Organization standardized interpretation of chest radiographs.Pediatr Infect Dis J.2006;25:779–781.
- ,.The measurement of observer agreement for categorical data.Biometrics.1977;33:159–174.
- ,.Clinical, laboratory, and radiological information in the diagnosis of pneumonia in children.Ann Emerg Med.1988;17:43–46.
- ,.Intraobserver and interobserver agreement of the interpretation of pediatric chest radiographs.Emerg Radiol.17:285–290.
- ,,, et al.Practice guidelines for the management of community‐acquired pneumonia in adults. Infectious Diseases Society of America.Clin Infect Dis.2000;31:347–382.
- ,,, et al.Guidelines for the management of adults with community‐acquired pneumonia. Diagnosis, assessment of severity, antimicrobial therapy, and prevention.Am J Respir Crit Care Med.2001;163:1730–1754.
- ,,, et al.Comparison of radiological findings and microbial aetiology of childhood pneumonia.Acta Paediatr.1993;82:360–363.
- Kuhn JP, Slovis TL, Haller JO, eds.Caffey's Pediatric Diagnostic Imaging.10th ed.Philadelphia, PA:Mosby;2004.
- ,,, et al.Clinical predictors of pneumonia among children with wheezing.Pediatrics.2009;124:e29–e36.
- ,,, et al.The clinical impact of the radiology report in wheezing and nonwheezing febrile children: a survey of clinicians.Pediatr Radiol.2009;39:348–353.
The chest radiograph (CXR) is the most commonly used diagnostic imaging modality in children, and is considered to be the gold standard for the diagnosis of pneumonia. As such, physicians in developed countries rely on chest radiography to establish the diagnosis of pneumonia.13 However, there are limited data investigating the reliability of this test for the diagnosis of pneumonia in children.2, 46
Prior investigations have noted poor overall agreement by emergency medicine, infectious diseases, and pulmonary medicine physicians, and even radiologists, in their interpretation of chest radiographs for the diagnosis of pneumonia.2, 5, 710 The World Health Organization (WHO) developed criteria to standardize CXR interpretation for the diagnosis of pneumonia in children for use in epidemiologic studies.11 These standardized definitions of pneumonia have been formally evaluated by the WHO6 and utilized in epidemiologic studies of vaccine efficacy,12 but the overall reliability of these radiographic criteria have not been studied outside of these forums.
We conducted this prospective case‐based study to evaluate the reliability of the radiographic diagnosis of pneumonia among children presenting to a pediatric emergency department with clinical suspicion of pneumonia. We were primarily interested in assessing the overall reliability in CXR interpretation for the diagnosis of pneumonia, and identifying which radiographic features of pneumonia were consistently identified by radiologists.
MATERIALS AND METHODS
Study Subjects
We evaluated the reliability of CXR interpretation with respect to the diagnosis of pneumonia among radiologists. Six board‐certified radiologists at 2 academic children's hospitals (Children's Hospital of Philadelphia, Philadelphia, PA [n = 3] and Children's Hospital, Boston, Boston, MA [n = 3]) interpreted the same 110 chest radiographs in a blinded fashion. The radiologists varied with respect to the number of years practicing pediatric radiology (median 8 years, range 3‐36 years). Clinical information such as age, gender, clinical indication for obtaining the radiograph, history, and physical examination findings were not provided. Aside from the study form which stated the WHO classification scheme for radiographic pneumonia, no other information or training was provided to the radiologists as part of this study.
Radiographs were selected among a population of children presenting to the emergency department at Children's Hospital, Boston, who had a radiograph obtained for concern of pneumonia. From this cohort, we selected children who had radiographs which encompassed the spectrum of respiratory disease processes encountered in a pediatric population. The radiographs selected for review included 50 radiographs with a final reading in the medical record without suspicion for pneumonia, and 50 radiographs in which the diagnosis of pneumonia could not be excluded. In the latter group, 25 radiographs had a final reading suggestive of an alveolar infiltrate, and 25 radiographs had a final reading suggestive of an interstitial infiltrate. Ten duplicate radiographs were included to permit assessment of intra‐rater reliability.
Radiograph Interpretation
Radiologists at both sites interpreted the identical 110 radiographs (both anteroposterior [AP] and lateral views for each subject). Digital Imaging and Communications in Medicine (DICOM) images were downloaded from a registry at Children's Hospital, Boston, and were copied to DVDs which were provided to each radiologist. Standardized radiographic imaging software (eFilm Lite [Mississauga, Canada]) was used by each radiologist to view and interpret the radiographs.
Each radiologist completed a study questionnaire for each radiograph interpreted (see Supporting Appendix A in the online version of this article). The questionnaire utilized radiographic descriptors of primary end‐point pneumonia described by the WHO which were procured to standardize the radiographic diagnosis of pneumonia.11, 12 The main outcome of interest was the presence or absence of an infiltrate. Among radiographs in which an infiltrate was identified, radiologists selected whether there was an alveolar infiltrate, interstitial infiltrate, or both. An alveolar infiltrate was defined as a dense or fluffy opacity that occupies a portion or whole of a lobe, or of the entire lung, that may or may not contain air bronchograms.11, 12 An interstitial infiltrate was defined by a lacy pattern involving both lungs, featuring peribronchial thickening and multiple areas of atelectasis.11, 12 It also included minor patchy infiltrates that were not of sufficient magnitude to constitute consolidation, and small areas of atelectasis that in children may be difficult to distinguish from consolidation. Among interstitial infiltrates, radiologists were asked to distinguish infiltrate from atelectasis. A radiograph classified as having either an alveolar infiltrate or interstitial infiltrate (not atelectasis) was considered to have any infiltrate. Additional findings including air bronchograms, hilar adenopathy, pleural effusion, and location of abnormalities were also recorded.
Statistical Analysis
Inter‐rater reliability was assessed using the kappa statistic to determine the overall agreement between the 6 radiologists for each binary outcome (ie, presence or absence of alveolar infiltrate). To calculate 95% confidence intervals (CI) for kappa statistics with more than 2 raters, we employed a bootstrapping method with 1000 replications of samples equal in size to the study sample, using the kapci program as implemented by STATA software (version 10.1, STATA Corp, College Station, TX). Also, intra‐rater reliability was evaluated by examining the agreement within each radiologist upon review of 10 duplicate radiographs that had been randomly inserted into the case‐mix. We used the benchmarks proposed by Landis and Koch to classify the strength of agreement measured by the kappa statistic, as follows: poor (<0.0); slight (0‐0.20); fair (0.21‐0.40); moderate (0.41‐0.60); substantial (0.61‐0.80); almost perfect (0.81‐1.0).13
The study was approved by the institutional review boards at Children's Hospital, Boston and Children's Hospital of Philadelphia.
RESULTS
Patient Sample
The sample of 110 radiographs was obtained from 100 children presenting to the emergency department at Children's Hospital, Boston, with concern of pneumonia. These patients ranged in age from 1 week to 19 years (median, 3.5 years; interquartile range [IQR], 1.6‐6.0 years). Fifty (50%) of these patients were male. As stated above, the sample comprised 50 radiographs with a final reading in the medical record without suspicion for pneumonia, and 50 radiographs in which the diagnosis of pneumonia could not be excluded. The 10 duplicate radiographs encompassed a similar spectrum of findings.
Inter‐Rater Reliability
The kappa coefficients of inter‐rater reliability between the radiologists across the 6 clinical measures of interest are displayed in Table 1. As shown, the most reliable measure was that of alveolar infiltrate (Figure 1), which attained a substantial degree of agreement between the radiologists. Two other measures, any infiltrate and pleural effusion, attained moderate reliability, while bronchograms and hilar adenopathy were each classified as having fair reliability. However, interstitial infiltrate (Figure 2) was found to have the lowest kappa estimate, with a slight degree of reliability. When examining inter‐rater reliability among the radiologists separately from each institution, the pattern of results was similar.
| All Radiologists (n = 6) | Kappa | 95% Confidence Interval |
|---|---|---|
| ||
| Any infiltrate | 0.47 | 0.39, 0.56 |
| Alveolar infiltrate | 0.69 | 0.60, 0.78 |
| Interstitial infiltrate | 0.14 | 0.05, 0.23 |
| Air bronchograms | 0.32 | 0.24, 0.42 |
| Hilar adenopathy | 0.21 | 0.08, 0.39 |
| Pleural effusion | 0.45 | 0.29, 0.61 |
At least 4 of the 6 radiologists agreed on the presence or absence of an alveolar infiltrate for 95 of the 100 unique CXRs; all 6 radiologists agreed regarding the presence or absence of an alveolar infiltrate in 72 of the 100 unique CXRs. At least 4 of the 6 radiologists agreed on the presence or absence of any infiltrate and interstitial infiltrate 96% and 90% of the time, respectively. All 6 of the radiologists agreed on the presence or absence of any infiltrate and interstitial infiltrate 35% and 27% of the time, respectively.
Intra‐Rater Reliability
Estimates of intra‐rater reliability on the primary clinical outcomes (alveolar infiltrate, interstitial infiltrate, and any infiltrate) are found in Table 2. Across the 6 raters, the kappa estimates for alveolar infiltrate were all classified as substantial or almost perfect. The kappa estimates for interstitial infiltrate varied widely, ranging from fair to almost perfect, while for any infiltrate, reliability ranged from moderate to almost perfect.
| Kappa | 95% Confidence Interval | |
|---|---|---|
| ||
| Any infiltrate | ||
| Rater 1 | 1.00 | 1.00, 1.00 |
| Rater 2 | 0.60 | 0.10, 1.00 |
| Rater 3 | 0.80 | 0.44, 1.00 |
| Rater 4 | 1.00 | 1.00, 1.00 |
| Rater 5 | n/a* | |
| Rater 6 | 1.00 | 1.00, 1.00 |
| Alveolar infiltrate | ||
| Rater 1 | 1.00 | 1.00, 1.00 |
| Rater 2 | 1.00 | 1.00, 1.00 |
| Rater 3 | 1.00 | 1.00, 1.00 |
| Rater 4 | 1.00 | 1.00, 1.00 |
| Rater 5 | 0.78 | 0.39, 1.00 |
| Rater 6 | 0.74 | 0.27, 1.00 |
| Interstitial infiltrate | ||
| Rater 1 | 1.00 | 1.00, 1.00 |
| Rater 2 | 0.21 | 0.43, 0.85 |
| Rater 3 | 0.74 | 0.27, 1.00 |
| Rater 4 | n/a | |
| Rater 5 | 0.58 | 0.07, 1.00 |
| Rater 6 | 0.62 | 0.5, 1.00 |
DISCUSSION
The chest radiograph serves as an integral component of the reference standard for the diagnosis of childhood pneumonia. Few prior studies have assessed the reliability of chest radiograph findings in children.3, 5, 12, 14, 15 We found a high degree of agreement among radiologists for radiologic findings consistent with bacterial pneumonia when standardized interpretation criteria were applied. In this study, we identified radiographic features of pneumonia, such as alveolar infiltrate and pleural effusion, that were consistently identified by different radiologists reviewing the same radiograph and by the same radiologist reviewing the same radiograph. These data support the notion that radiographic features most suggestive of bacterial pneumonia are consistently identified by radiologists.16, 17 There was less consistency in the identification of other radiographic findings, such as interstitial infiltrates, air bronchograms, and hilar lymphadenopathy.
Prior studies have found high levels of disagreement among radiologists in the interpretation of chest radiographs.2, 3, 15, 18 Many of these prior studies emphasized variation in detection of radiographic findings that would not typically alter clinical management. We observed high intra‐rater, and inter‐rater reliability among radiologists for the findings of alveolar infiltrate and pleural effusion. These are the radiographic findings most consistent with a bacterial etiologic agent for pneumonia.19 Other studies have also found that the presence of an alveolar infiltrate is a reliable radiographic finding in children18 and adults.7, 9, 10 These findings support the use of the WHO definition of primary endpoint pneumonia for use in epidemiologic studies.4, 6, 11
This study also confirms a previous report by Cherian et al. that findings of many children with asthma, reactive airways disease, bronchiolitis, and viral infections interstitial infiltrates are less reliable.6 This is not surprising considering the fact that these patients often have radiographic findings due to small airway disease and atelectasis.19, 20 The differentiation between atelectasis and interstitial infiltrate is difficult, particularly in young children. A prior study conducted among neonates observed wide variability in the interpretation of chest radiographs, and that the differentiation of pneumonia from atelectasis was difficult for this patient population.5 The decisions around antimicrobial treatment of children with radiographic findings of interstitial infiltrates should be made in the context of the clinical history and physical examination findings, and clinicians should realize that these radiographic features demonstrate poor reliability for the diagnosis of pneumonia.
Overall reliability for the presence of any infiltrate, and its converse, no infiltrate was considered moderate. This is driven by the low reliability and variability around the radiographic diagnosis of interstitial infiltrates. Our findings are similar to those observed in adults with lower respiratory tract infections.9 The low reliability in identification of interstitial infiltrates may explain why prior studies have demonstrated that the CXR results rarely change management in children who have radiographs performed for suspicion of pneumonia.1, 21 Our study highlights the importance of quantifying CXR findings to include specific comments regarding the presence or absence of alveolar infiltrates, rather than the presence or absence of any infiltrate.
The WHO has procured definitions the radiographic diagnosis of pneumonia, and this definition has been utilized to help standardize the interpretation of chest radiographs for the conduct of epidemiological studies.6, 11 Specifically, the definitions utilized not only define the presence or absence of pneumonia, but also attempt to differentiate a primarily bacterial infection (consolidation or pleural effusion), from a viral or atypical presentation (interstitial pattern). Even under the best of circumstances, the differentiation of viral versus bacterial pneumonia is not always possible, and again, is often made by the treating physician by incorporating the clinical setting within which the radiograph was obtained.
This study had several limitations. Firstly, the included radiographs did not reflect the frequency with which certain radiographic findings would be identified in children evaluated for pneumonia in a pediatric emergency department setting. Radiographs were purposefully selected to encompass a broad spectrum of radiologic findings, including less common findings such as hilar lymphadenopathy and pleural effusions. Thus, the prevalence of pneumonia and other abnormal findings in this study was artificially higher than typically observed among a cohort of children for whom pneumonia is considered, a factor that may limit the generalizability of our results. Secondly, the clinical history was not provided to the radiologists to avoid bias by indication. For this study, we notified the radiologists that all radiographs were performed for clinical suspicion of pneumonia without providing details about the subjects' signs and symptoms. The absence of clinical history, however, does not mirror the real world scenario in which the interpretation of the chest radiograph is frequently made in the context of the clinical history. The relevance of this latter issue is unclear, as Tudor et al. found a nonstatistically significant improvement in the overall accuracy in chest radiograph interpretation when radiologists were provided clinical details.10 The radiologists recruited for this study all practice in an academic children's hospital setting, and thus, the generalizability of our findings may be limited to this type of practice setting. Finally, reproducibility does not imply accuracy, and reliability in identifying specific findings does not necessarily lead to improved or different management. Thus, while the reliability of radiographic findings of alveolar infiltrate and pleural effusion is reassuringly high, the validity of these radiographic features for bacterial pneumonia is not known. Ascertainment of validity can only be assessed through the use of invasive testing such as lung biopsy, as the yield from bacterial testing such as blood cultures is low, and the results of other studies such as viral testing of nasopharyngeal washings do not prove an etiologic cause of pneumonia.
CONCLUSIONS
Radiographic findings of alveolar infiltrates and pleural effusions are highly reliable among radiologists. Radiographic interpretation of interstitial infiltrates appears to be less reliable.
- ,,, et al.Usefulness of chest radiographs in children with acute lower respiratory tract disease.J Pediatr.1987;111:187–193.
- ,,, et al.Disagreement in the interpretation of chest radiographs among specialists and clinical outcomes of patients hospitalized with suspected pneumonia.Eur J Intern Med.2006;17:43–47.
- ,,.Problems in the clinical and roentgenographic diagnosis of pneumonia in young children.Clin Pediatr (Phila).1984;23:398–399.
- WHO guidelines on detecting pneumonia in children.Lancet.1991;338:1453–1454.
- ,,, et al.Inter‐ and intra‐observer variability in the assessment of atelectasis and consolidation in neonatal chest radiographs.Pediatr Radiol.1999;29:459–462.
- ,,, et al.Standardized interpretation of paediatric chest radiographs for the diagnosis of pneumonia in epidemiological studies.Bull World Health Organ.2005;83:353–359.
- ,,, et al.Interobserver reliability of the chest radiograph in community‐acquired pneumonia. PORT Investigators.Chest.1996;110:343–350.
- ,,, et al.Chest radiographs in the emergency department: is the radiologist really necessary?Postgrad Med J.2003;79:214–217.
- ,,, et al.Inter‐observer variation in the interpretation of chest radiographs for pneumonia in community‐acquired lower respiratory tract infections.Clin Radiol.2004;59:743–752.
- ,,.An assessment of inter‐observer agreement and accuracy when reporting plain radiographs.Clin Radiol.1997;52:235–238.
- Standardization of interpretation of chest radiographs for the diagnosis of pneumonia in children. In:World Health Organization: Pneumonia Vaccine Trial Investigators' Group.Geneva:Department of Vaccine and Biologics;2001.
- ,,, et al.Effectiveness of heptavalent pneumococcal conjugate vaccine in children younger than 5 years of age for prevention of pneumonia: updated analysis using World Health Organization standardized interpretation of chest radiographs.Pediatr Infect Dis J.2006;25:779–781.
- ,.The measurement of observer agreement for categorical data.Biometrics.1977;33:159–174.
- ,.Clinical, laboratory, and radiological information in the diagnosis of pneumonia in children.Ann Emerg Med.1988;17:43–46.
- ,.Intraobserver and interobserver agreement of the interpretation of pediatric chest radiographs.Emerg Radiol.17:285–290.
- ,,, et al.Practice guidelines for the management of community‐acquired pneumonia in adults. Infectious Diseases Society of America.Clin Infect Dis.2000;31:347–382.
- ,,, et al.Guidelines for the management of adults with community‐acquired pneumonia. Diagnosis, assessment of severity, antimicrobial therapy, and prevention.Am J Respir Crit Care Med.2001;163:1730–1754.
- ,,, et al.Comparison of radiological findings and microbial aetiology of childhood pneumonia.Acta Paediatr.1993;82:360–363.
- Kuhn JP, Slovis TL, Haller JO, eds.Caffey's Pediatric Diagnostic Imaging.10th ed.Philadelphia, PA:Mosby;2004.
- ,,, et al.Clinical predictors of pneumonia among children with wheezing.Pediatrics.2009;124:e29–e36.
- ,,, et al.The clinical impact of the radiology report in wheezing and nonwheezing febrile children: a survey of clinicians.Pediatr Radiol.2009;39:348–353.
Copyright © 2011 Society of Hospital Medicine
