User login
Buccal Fat Pad Reduction With Intraoperative Fat Transfer to the Temple
The buccal fat pad (Bichat fat pad) is a tubular-shaped collection of adipose tissue that occupies a prominent position in the midface. The buccal fat pad has been described as having 3 lobes: an anterior lobe, which is anterior to the masseter muscle; an intermediate lobe between the masseter and buccinator muscles; and a posterior lobe between the temporal masticatory space.1 There are 4 extensions from the body of the buccal fat pad: the buccal, the sublevator, the melolabial, and the pterygoid. It is the buccal extension and main body that are removed intraorally to achieve midfacial and lower facial contouring, as these support the contours of the cheeks. The deep fat pad within the temporal fossa is a true extension of the buccal fat pad (Figure).2 It has a complex relationship to the facial structures, with known variability in the positions of the buccal branch of the facial nerve and the parotid duct.3 The parotid duct travels over, superior to, or through the buccal extension 42%, 32%, and 26% of the time, respectively. The duct travels along the surface of the masseter, then pierces the buccinator to drain into the vestibule of the mouth at the second superior molar tooth. The buccal branch of the facial nerve travels on the surface of the buccal fat pad 73% of the time, whereas 27% of the time it travels deeper through the buccal extension.4 A study that used ultrasonography to map the surface anatomy path of the parotid duct in 50 healthy patients showed that the duct was within 1.5 cm of the middle half of a line between the lower border of the tragus and the oral commissure in 93% of individuals.5 We describe a technique in which part of the buccal fat pad is removed and the fat is transferred to the temple to achieve aesthetically pleasing facial contouring. We used a vertical line from the lateral canthus as a surface anatomy landmark to determine when the duct emerges from the gland and is most susceptible to injury.

Operative Technique
Correct instrumentation is important to obtain appropriate anatomic exposure for this procedure. The surgical tray should include 4-0 poliglecaprone 25 suture, bite guards, a needle driver, a hemostat, surgical scissors, toothed forceps, a Beaver surgical handle with #15 blade, a protected diathermy needle, cotton tip applicators, and gauze.
Fat Harvest—With the patient supine, bite blocks are placed, and the buccal fat pad incision line is marked with a surgical marker. A 1-cm line is drawn approximately 4 cm posterior to the oral commissure by the buccal bite marks. The location is verified by balloting externally on the buccal fat pad on the cheek. The incision line is then anesthetized transorally with lidocaine and epinephrine-containing solution. The cheek is retracted laterally with Caldwell-Luc retractors, and a 1-cm incision is made and carried through the mucosa and superficial muscle using the Colorado needle. Scissors are then used to spread the deeper muscle fibers to expose the deeper fascia and fat pads. Metzenbaum scissors are used to gently spread the fat while the surgeon places pressure on the external cheek, manipulating the fat into the wound. Without excess traction, the walnut-sized portion of the fat pad that protrudes is grasped with Debakey forceps, gently teased into the field, clamped at its base with a curved hemostat, and excised. The stump is electrocoagulated with an extendable protected Colorado needle, with care to prevent inadvertent cauterization of the lips. The wound is closed with a single 4-0 poliglecaprone-25 suture.
A 5-cc Luer lock syringe is preloaded with 2 cc of normal saline and attached to another 5-cc Luer lock syringe via a female-female attachment. The excised fat is then placed in a 5-cc Luer lock syringe by removing the plunger. The plunger is then reinstalled, and the fat is injected back and forth approximately 30 times. The fat is centrifuged at 3500 rpm for 3 minutes. The purified fat is then transferred to a 1-cc Luer lock syringe attached to an 18-gauge needle.
Fat Injection—The authors use an 18-gauge needle to perform depot injections into the temporal fossae above the periosteum. This is a relatively safe area of the face to inject, but care must be taken to avoid injury to the superficial temporal artery. Between 1.5 and 3 cc of high-quality fat usually are administered to each temple.
Aftercare Instructions—The patient is instructed to have a soft diet for 24 to 48 hours and can return to work the next day. The patient also is given prophylactic antibiotics with Gram-negative coverage for 7 days (amoxicillin-clavulanate 875 mg/125 mg orally twice daily for 7 days).
Candidates for Buccal Fat Pad Reduction
Buccal fat pad reduction has become an increasingly popular technique for midface and lower face shaping to decrease the appearance of a round face. To achieve an aesthetically pleasing midface, surgeons should consider enhancing zygomatic eminences while emphasizing the border between the zygomatic prominence and cheek hollow.6 Selection criteria for buccal fat pad reduction are not well established. One study recommended avoiding the procedure in pregnant or lactating patients, patients with chronic illnesses, patients on blood-thinning agents, and patients younger than 18 years. In addition, this study suggested ensuring the malar fullness is in the anteromedial portion of the face, as posterolateral fullness may be due to masseter hypertrophy.6
Complications From Buccal Fat Pad Reduction
Complications associated with buccal fat pad reduction include inadvertent damage to surrounding structures, including the buccal branch of the facial nerve and parotid duct. Because the location of the facial nerve in relation to the parotid duct is highly variable, surgeons must be aware of its anatomy to avoid unintentional damage. Hwang et al7 reported that the parotid duct and buccal branches of the facial nerves passed through the buccal extension in 26.3% of cadavers. The transbuccal approach is preferred over the sub–superficial muscular aponeurotic system approach largely because it avoids these structures. In addition, blunt dissection may further decrease chances of injury. Although the long-term effects are unknown, there is a potential risk for facial hollowing.3 The use of preprocedure ultrasonography to quantify the buccal fat pad may avoid overresection and enhanced potential for facial hollowing.6
Avoidance of Temporal Hollowing
Because the buccal fat pad extends into the temporal space, buccal fat pad reduction may lead to further temporal hollowing, contributing to an aged appearance. The authors’ technique addresses both midface and upper face contouring in one minimally invasive procedure. Temporal hollowing commonly has been corrected with autologous fat grafting from the thigh or abdomen, which leads to an additional scar at the donor site. Our technique relies on autologous adjacent fat transfer from previously removed buccal fat. In addition, compared with the use of hyaluronic acid fillers for temple reflation, fat transfer largely is safe and biocompatible. Major complications of autologous fat transfer to the temples include nodularity or fat clumping, fat necrosis, sensory or motor nerve damage, and edema or ecchymosis.4 Also, with time there will be ongoing hollowing of the temples as part of the aging process with soft tissue and bone resorption. Therefore, further volume restoration procedures may be required in the future to address these dynamic changes.
Conclusion
The buccal fat pad has been extensively used to reconstruct oral defects, including oroantral and cranial base defects, owing to its high vascularity.6 However, there also is great potential to utilize buccal fat for autologous fat transfer to improve temporal wasting. Further studies are needed to determine optimal technique as well as longer-term safety and efficacy of this procedure.
- Zhang HM, Yan YP, Qi KM, et al. Anatomical structure of the buccal fat pad and its clinical adaptations. Plast Reconstr Surg. 2002;109:2509-2518.
- Yousuf S, Tubbs RS, Wartmann CT, et al. A review of the gross anatomy, functions, pathology, and clinical uses of the buccal fat pad. Surg Radiol Anat. 2010;32:427-436.
- Benjamin M, Reish RG. Buccal fat pad excision: proceed with caution. Plast Reconstr Surg Glob Open. 2018;6:E1970.
- Tzikas TL. Fat grafting volume restoration to the brow and temporal regions. Facial Plast Surg. 2018;34:164-172.
- Stringer MD, Mirjalili SA, Meredith SJ, et al. Redefining the surface anatomy of the parotid duct: an in vivo ultrasound study. Plast Reconstr Surg. 2012;130:1032-1037.
- Sezgin B, Tatar S, Boge M, et al. The excision of the buccal fat pad for cheek refinement: volumetric considerations. Aesthet Surg J. 2019;39:585-592.
- Hwang K, Cho HJ, Battuvshin D, et al. Interrelated buccal fat pad with facial buccal branches and parotid duct. J Craniofac Surg. 2005;16:658-660.
The buccal fat pad (Bichat fat pad) is a tubular-shaped collection of adipose tissue that occupies a prominent position in the midface. The buccal fat pad has been described as having 3 lobes: an anterior lobe, which is anterior to the masseter muscle; an intermediate lobe between the masseter and buccinator muscles; and a posterior lobe between the temporal masticatory space.1 There are 4 extensions from the body of the buccal fat pad: the buccal, the sublevator, the melolabial, and the pterygoid. It is the buccal extension and main body that are removed intraorally to achieve midfacial and lower facial contouring, as these support the contours of the cheeks. The deep fat pad within the temporal fossa is a true extension of the buccal fat pad (Figure).2 It has a complex relationship to the facial structures, with known variability in the positions of the buccal branch of the facial nerve and the parotid duct.3 The parotid duct travels over, superior to, or through the buccal extension 42%, 32%, and 26% of the time, respectively. The duct travels along the surface of the masseter, then pierces the buccinator to drain into the vestibule of the mouth at the second superior molar tooth. The buccal branch of the facial nerve travels on the surface of the buccal fat pad 73% of the time, whereas 27% of the time it travels deeper through the buccal extension.4 A study that used ultrasonography to map the surface anatomy path of the parotid duct in 50 healthy patients showed that the duct was within 1.5 cm of the middle half of a line between the lower border of the tragus and the oral commissure in 93% of individuals.5 We describe a technique in which part of the buccal fat pad is removed and the fat is transferred to the temple to achieve aesthetically pleasing facial contouring. We used a vertical line from the lateral canthus as a surface anatomy landmark to determine when the duct emerges from the gland and is most susceptible to injury.
Operative Technique
Correct instrumentation is important to obtain appropriate anatomic exposure for this procedure. The surgical tray should include 4-0 poliglecaprone 25 suture, bite guards, a needle driver, a hemostat, surgical scissors, toothed forceps, a Beaver surgical handle with #15 blade, a protected diathermy needle, cotton tip applicators, and gauze.
Fat Harvest—With the patient supine, bite blocks are placed, and the buccal fat pad incision line is marked with a surgical marker. A 1-cm line is drawn approximately 4 cm posterior to the oral commissure by the buccal bite marks. The location is verified by balloting externally on the buccal fat pad on the cheek. The incision line is then anesthetized transorally with lidocaine and epinephrine-containing solution. The cheek is retracted laterally with Caldwell-Luc retractors, and a 1-cm incision is made and carried through the mucosa and superficial muscle using the Colorado needle. Scissors are then used to spread the deeper muscle fibers to expose the deeper fascia and fat pads. Metzenbaum scissors are used to gently spread the fat while the surgeon places pressure on the external cheek, manipulating the fat into the wound. Without excess traction, the walnut-sized portion of the fat pad that protrudes is grasped with Debakey forceps, gently teased into the field, clamped at its base with a curved hemostat, and excised. The stump is electrocoagulated with an extendable protected Colorado needle, with care to prevent inadvertent cauterization of the lips. The wound is closed with a single 4-0 poliglecaprone-25 suture.
A 5-cc Luer lock syringe is preloaded with 2 cc of normal saline and attached to another 5-cc Luer lock syringe via a female-female attachment. The excised fat is then placed in a 5-cc Luer lock syringe by removing the plunger. The plunger is then reinstalled, and the fat is injected back and forth approximately 30 times. The fat is centrifuged at 3500 rpm for 3 minutes. The purified fat is then transferred to a 1-cc Luer lock syringe attached to an 18-gauge needle.
Fat Injection—The authors use an 18-gauge needle to perform depot injections into the temporal fossae above the periosteum. This is a relatively safe area of the face to inject, but care must be taken to avoid injury to the superficial temporal artery. Between 1.5 and 3 cc of high-quality fat usually are administered to each temple.
Aftercare Instructions—The patient is instructed to have a soft diet for 24 to 48 hours and can return to work the next day. The patient also is given prophylactic antibiotics with Gram-negative coverage for 7 days (amoxicillin-clavulanate 875 mg/125 mg orally twice daily for 7 days).
Candidates for Buccal Fat Pad Reduction
Buccal fat pad reduction has become an increasingly popular technique for midface and lower face shaping to decrease the appearance of a round face. To achieve an aesthetically pleasing midface, surgeons should consider enhancing zygomatic eminences while emphasizing the border between the zygomatic prominence and cheek hollow.6 Selection criteria for buccal fat pad reduction are not well established. One study recommended avoiding the procedure in pregnant or lactating patients, patients with chronic illnesses, patients on blood-thinning agents, and patients younger than 18 years. In addition, this study suggested ensuring the malar fullness is in the anteromedial portion of the face, as posterolateral fullness may be due to masseter hypertrophy.6
Complications From Buccal Fat Pad Reduction
Complications associated with buccal fat pad reduction include inadvertent damage to surrounding structures, including the buccal branch of the facial nerve and parotid duct. Because the location of the facial nerve in relation to the parotid duct is highly variable, surgeons must be aware of its anatomy to avoid unintentional damage. Hwang et al7 reported that the parotid duct and buccal branches of the facial nerves passed through the buccal extension in 26.3% of cadavers. The transbuccal approach is preferred over the sub–superficial muscular aponeurotic system approach largely because it avoids these structures. In addition, blunt dissection may further decrease chances of injury. Although the long-term effects are unknown, there is a potential risk for facial hollowing.3 The use of preprocedure ultrasonography to quantify the buccal fat pad may avoid overresection and enhanced potential for facial hollowing.6
Avoidance of Temporal Hollowing
Because the buccal fat pad extends into the temporal space, buccal fat pad reduction may lead to further temporal hollowing, contributing to an aged appearance. The authors’ technique addresses both midface and upper face contouring in one minimally invasive procedure. Temporal hollowing commonly has been corrected with autologous fat grafting from the thigh or abdomen, which leads to an additional scar at the donor site. Our technique relies on autologous adjacent fat transfer from previously removed buccal fat. In addition, compared with the use of hyaluronic acid fillers for temple reflation, fat transfer largely is safe and biocompatible. Major complications of autologous fat transfer to the temples include nodularity or fat clumping, fat necrosis, sensory or motor nerve damage, and edema or ecchymosis.4 Also, with time there will be ongoing hollowing of the temples as part of the aging process with soft tissue and bone resorption. Therefore, further volume restoration procedures may be required in the future to address these dynamic changes.
Conclusion
The buccal fat pad has been extensively used to reconstruct oral defects, including oroantral and cranial base defects, owing to its high vascularity.6 However, there also is great potential to utilize buccal fat for autologous fat transfer to improve temporal wasting. Further studies are needed to determine optimal technique as well as longer-term safety and efficacy of this procedure.
- Zhang HM, Yan YP, Qi KM, et al. Anatomical structure of the buccal fat pad and its clinical adaptations. Plast Reconstr Surg. 2002;109:2509-2518.
- Yousuf S, Tubbs RS, Wartmann CT, et al. A review of the gross anatomy, functions, pathology, and clinical uses of the buccal fat pad. Surg Radiol Anat. 2010;32:427-436.
- Benjamin M, Reish RG. Buccal fat pad excision: proceed with caution. Plast Reconstr Surg Glob Open. 2018;6:E1970.
- Tzikas TL. Fat grafting volume restoration to the brow and temporal regions. Facial Plast Surg. 2018;34:164-172.
- Stringer MD, Mirjalili SA, Meredith SJ, et al. Redefining the surface anatomy of the parotid duct: an in vivo ultrasound study. Plast Reconstr Surg. 2012;130:1032-1037.
- Sezgin B, Tatar S, Boge M, et al. The excision of the buccal fat pad for cheek refinement: volumetric considerations. Aesthet Surg J. 2019;39:585-592.
- Hwang K, Cho HJ, Battuvshin D, et al. Interrelated buccal fat pad with facial buccal branches and parotid duct. J Craniofac Surg. 2005;16:658-660.
Practice Points
- Buccal fat pad reduction is an increasingly popular procedure for facial shaping.
- Buccal fat pad reduction in addition to natural aging can result in volume depletion of the temporal fossae.
- Removed buccal fat can be transferred to the temples for increased volume.

Gender Disparities in Income Among Board-Certified Dermatologists
Although the number of female graduates from US medical schools has steadily increased,1 several studies since the 1970s indicate that a disparity exists in salary, academic rank, and promotion among female and male physicians across multiple specialties.2-8 Proposed explanations include women working fewer hours, having lower productivity rates, undernegotiating compensation, and underbilling for the same services. However, when controlling for variables such as time, experience, specialty, rank, and research activities, this gap unequivocally persists. There are limited data on this topic in dermatology, a field in which women comprise more than half of the working population.6,7 Most analyses of gender disparities in dermatology are based on data primarily from academic dermatologists, which may not be representative of the larger population of dermatologists.8,9 The purpose of this study is to determine if an income disparity exists between male and female physicians in dermatology, including those in private practice and those who are specialty trained.
Methods
Population—We performed a cross-sectional self-reported survey to examine compensation of male and female board-certified dermatologists (MDs/DOs). Several populations of dermatologists were surveyed in August and September 2018. Approximately 20% of the members of the American Academy of Dermatology were randomly selected and sent a link to the survey. Additionally, a survey link was emailed to members of the Association of Professors of Dermatology, American College of Mohs Surgery, and American Society for Dermatologic Surgery. A link to the survey also was published on “The Board Certified Dermatologists” Facebook group.
Statistical Analysis—Descriptive statistics were used to summarize the distribution of variables overall and within gender (male or female). Not all respondents completed every section, and duplicates and incomplete responses were removed. Variables were compared between genders using t tests (continuous), the Pearson χ2 test (nominal), or the Cochran-Mantel-Haenszel test (ordinal). For categorical variables with small cell counts, an exact χ2 test for small samples was used. For continuous variables, t test P values were calculated using either pooled or Satterthwaithe approximation.
To analyze the effect of different variables on total income using multivariate and univariate linear regression, the income variable was transformed into a continuous variable by using midpoints of the categories. Univariate linear regression was used to assess the effect and significance of each variable on total annual income. Variables that were found to have a P value of less than .05 (α=.05) were deemed as significant predictors of total annual income. These variables were added to a multivariate linear regression model to determine their effect on income when adjusting for other significant (and approaching significance) factors. In addition, variables that were found to have a P value of less than .2 (α=.05) were added to the multivariate linear regression model to assess significance of these specific variables when adjusting for other factors. In this way, we tested and accounted for a multitude of variables as potential sources of confounding.
Results
Demographics—Our survey was emailed to 3079 members of the American Academy of Dermatology, and 277 responses were received. Approximately 144 additional responses were obtained collectively from links sent to the directories of the Association of Professors of Dermatology, American College of Mohs Surgery, and American Society for Dermatologic Surgery and from social media. Of these respondents, 53.65% (213/397) were female and 46.35% (184/397) were male. When stratifying by race/ethnicity, 77.33% identified as White; 13.85% identified as Asian; 6.3% identified as Black or African American, Hispanic/Latino, and Native American; and 2.52% chose not to respond. Although most male and female respondents were White, a significantly higher proportion of female respondents identified as Asian or Black/African American/Hispanic/Latino/Native American (P=.0006). We found that race/ethnicity did not significantly impact income (P=.2736). All US Census regions were represented in this study, and geographic distribution as well as population density of practice location (ie, rural, suburban, urban setting) did not differ significantly between males and females (P=.5982 and P=.1007, respectively) and did not significantly impact income (P=.3225 and P=.10663, respectively).

Income—Total annual income was defined as the aggregate sum of all types of financial compensation received in 1 calendar year (eg, salary, bonuses, benefits) and was elicited as an ordinal variable in income brackets of US $100,000. Overall, χ2 analysis showed a statistically significant difference in annual total income between male and female dermatologists (P<.0001), with a higher proportion of males in the highest pay bracket (Figure). Gender remained a statistically significant predictor of income on both univariate and multivariate linear regression analyses (P=.0002 and P<.0001, respectively), indicating that gender has a significant impact on compensation, even after controlling for other variables (eTable). Of note, males in this sample were on average older and in practice longer than females (approximately 6 years, P<.0001). However, when univariate linear regression was performed, both age (P=.8281) and number of years since residency or fellowship completion (P=.8743) were not significant predictors of income.
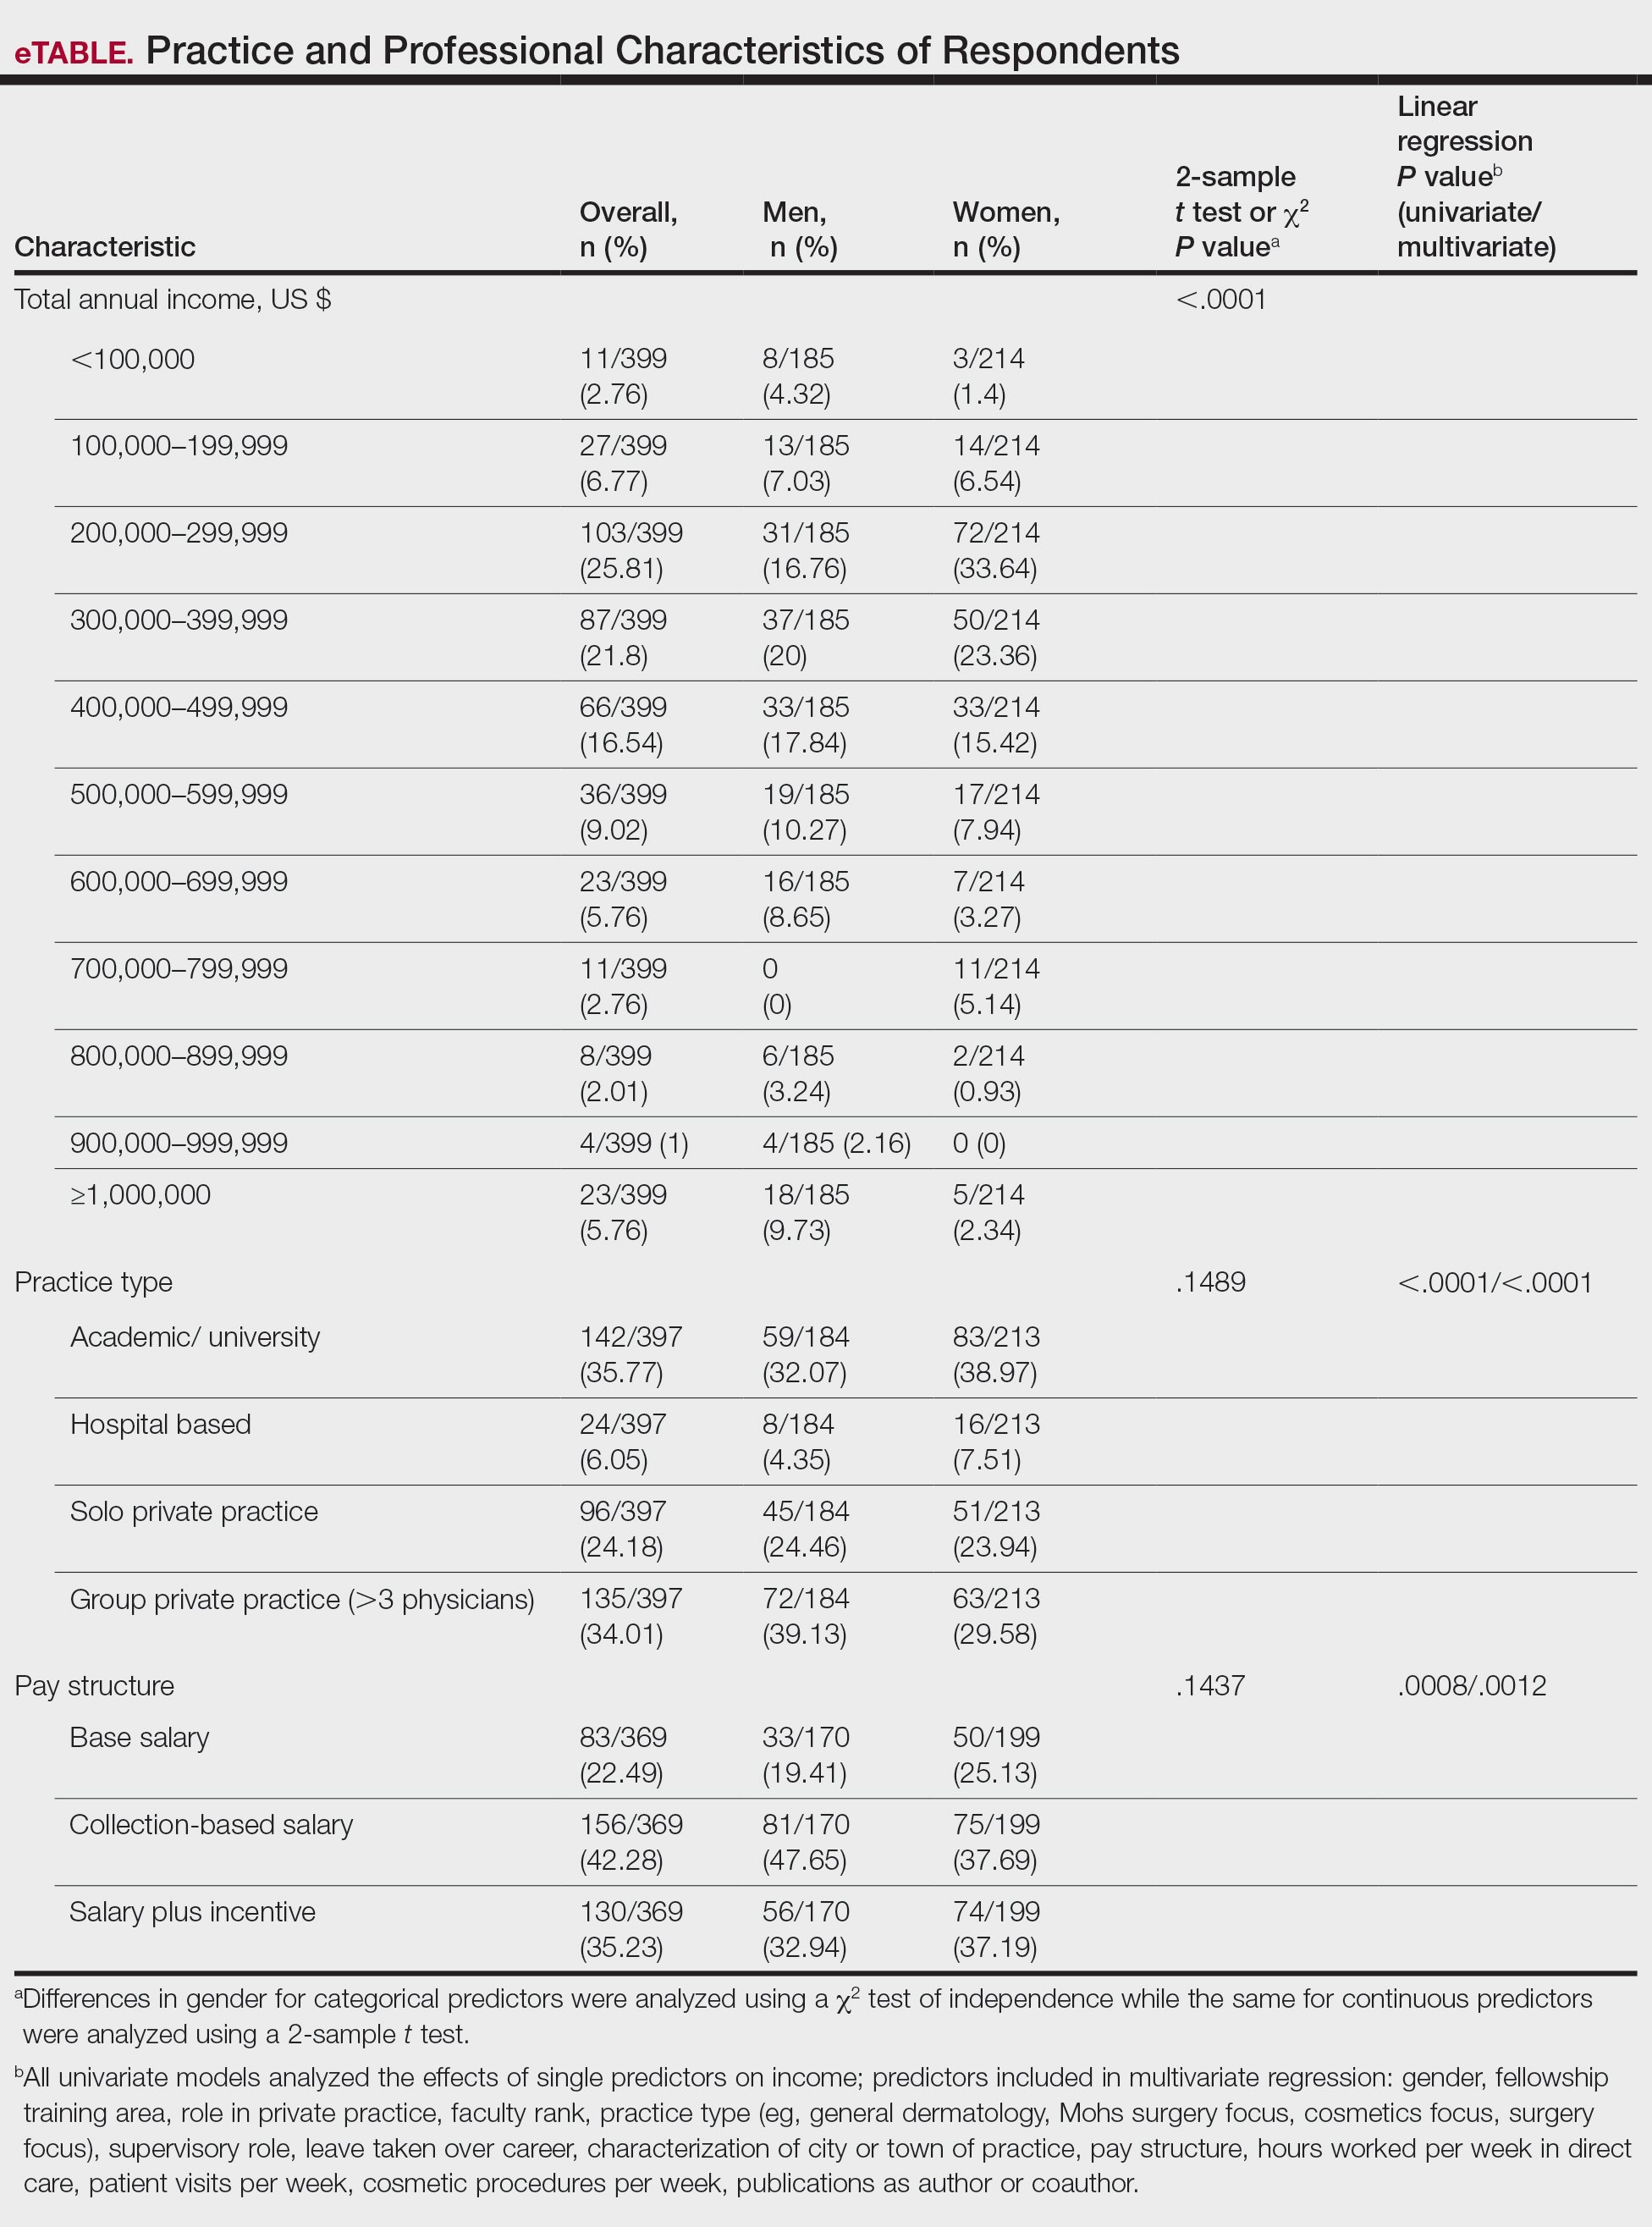
Practice Type—There were no statistically significant differences between men and women in practice type (P=.1489), including academic/university, hospital based, and solo and group private practice; pay structure (P=.1437), including base salary, collection-based salary, or salary plus incentive; holding a supervisory role (P=.0846); or having ownership of a practice (P=.3565)(eTable). Most respondents were in solo or group private practice (58.2%) and had a component of productivity-based compensation (77.5%). In addition, 62% of private practice dermatologists (133/212) had an ownership interest in their practice. As expected, univariate and multivariate regression analyses showed that practice type, pay structure, supervisory roles, and employee vs ownership roles were significant predictors of income (P<.05)(eTable).
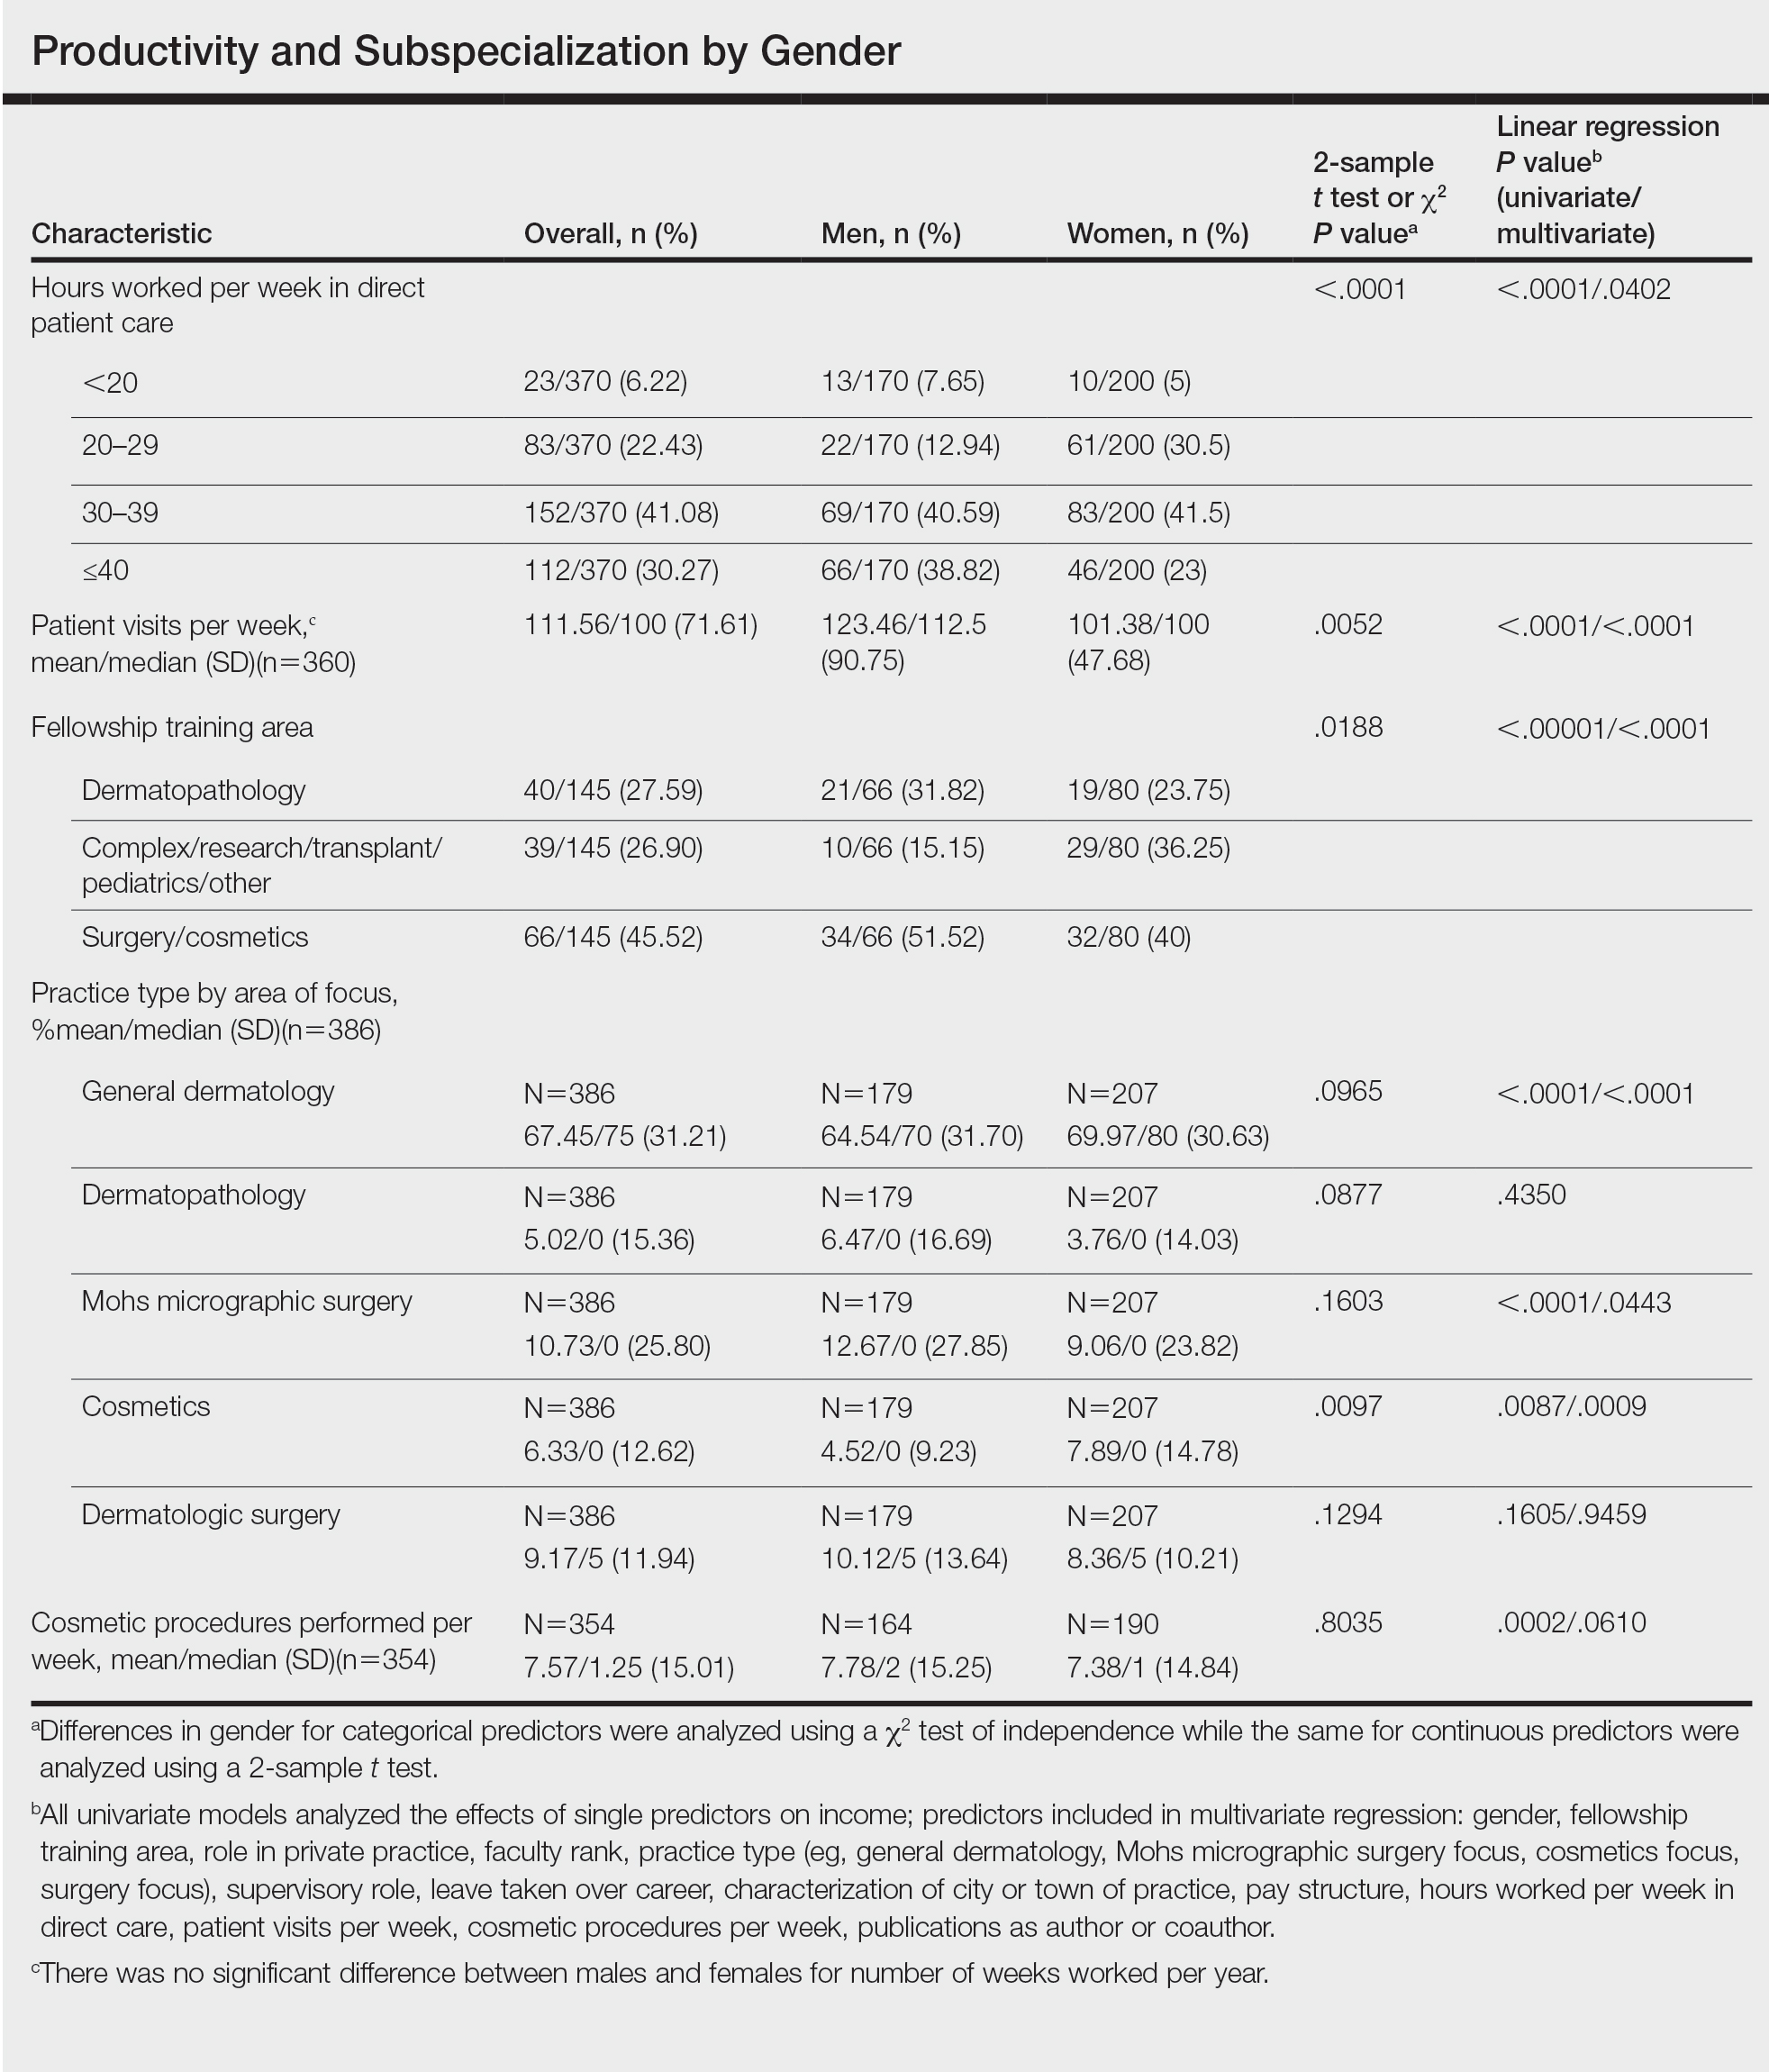
Work Productivity—Statistically significant differences were found between men and women in hours worked per week in direct patient care (P<.0001) and in patient visits per week (P=.0052), with a higher percentage of men working more than 40 hours per week and men seeing an average of approximately 22 more patients per week than women. In the subgroup of all dermatologists working more than 40 hours per week, a statistically significant difference in income persisted between males and females (P=.0001). Hours worked per week and patient visits per week were statistically significant predictors of income on both univariate and multivariate regression analyses (P<.05)(Table).
Education and Fellowship Training—No significant difference existed between males and females in type of undergraduate school attended, namely public or private institutions (P=.1090), but a significant difference existed within type of medical school education, with a higher percentage of females attending private medical schools (53.03%) compared to males (38.24%)(P=.0045). However, type of undergraduate or medical school attended had no impact on income (P=.9103). A higher percentage of males (27.32%) completed additional advanced degrees, such as a master of business administration or a master of public health, compared to females (16.9%)(P=.0122). However, the completion of additional advanced degrees had no significant impact on income (P=.2379). No statistical significance existed between males and females in number of residencies completed (P=.3236), and residencies completed had no significant impact on income (P=.4584).
Of 397 respondents, approximately one-third of respondents completed fellowship training (36.5%). Fellowships included dermatopathology, surgery/cosmetics, and other (encompassing complex medical, research, transplant, and pediatric dermatology). Although similar percentages of men and women completed fellowship training, men and women differed significantly by type of fellowship completed (P=.0188). There were similar rates of dermatopathology and surgical fellowship completion between genders but almost 3 times the number of females who completed other fellowships. Type of fellowship training was a statistically significant predictor of income on both univariate and multivariate regression analyses (P<.00001 and P<.0001, respectively).
Work Activity—Respondents were asked to estimate the amount of time devoted to general dermatology, dermatopathology, Mohs micrographic surgery, cosmetics, and dermatologic surgery in their practices (Table). Women devoted a significantly higher average percentage of time to cosmetics (7.89%) compared to men (4.52%)(P=.0097). The number of cosmetic procedures performed per week was not statistically significantly different between men and women (P=.8035) but was a significant factor for income on univariate regression analysis (P=.0002). Time spent performing dermatologic surgery, general dermatology, or Mohs micrographic surgery did not significantly differ between men and women but was found to significantly influence income.
Academic Dermatology—Among the respondents working in academic settings, χ2 analysis identified a significant difference in the faculty rank between males and females, with a tendency for lower academic rank in females (P=.0508). Assistant professorship was comprised of 35% of men vs 51% of women, whereas full professorship consisted of 26% of men but only 13% of women. Academic rank was found to be a significant predictor of income, with higher rank associated with higher income (P<.0001 on univariate regression analysis). However, when adjusting for other factors, academic rank was no longer a significant predictor of income (P=.0840 on multivariate regression analysis). No significant difference existed between men and women in funding received from the National Institutes of Health, conduction of clinical trials, or authorship of scientific publications, and these factors were not found to have a significant impact on income.
Work Leave—Male and female dermatologists showed a statistically significant difference in maternity or Family and Medical Leave Act (FMLA) leave taken over their careers, with 56.03% of females reporting leave taken compared to 6.78% of males (P<.0001). Women reported a significantly higher average number of weeks of maternity or FMLA leave taken over their careers (12.92 weeks) compared to men (2.42 weeks) (P<.0001). However, upon univariate regression analysis, whether or not maternity or FMLA leave was taken over their careers (P=.2005), the number of times that maternity or FMLA leave was taken (P=.4350), and weeks of maternity or FMLA leave taken (P=.4057) were all not significant predictors of income.
Comment
This study sought to investigate the relationship between income and gender in dermatology, and our results demonstrated that statistically significant differences in total annual income exist between male and female dermatologists, with male dermatologists earning a significantly higher income, approximately an additional $80,000. Our results are consistent with other studies of US physician income, which have found a gender gap ranging from $13,399 to $82,000 that persists even when controlling for factors such as specialty choice, practice setting, rank and role in practice, work hours, vacation/leave taken, and others.2-7,10-15
There was a significant difference in rank of male and female academic dermatologists, with fewer females at higher academic ranks. These results are consistent with numerous studies in academic dermatology that show underrepresentation of women at higher academic ranks and leadership positions.8,9,16-18 Poor negotiation may contribute to differences in both rank and income.19,20 There are conflicting data on research productivity of academic dermatologists and length of career, first and senior authorship, and quality and academic impact, all of which add complexity to this topic.8,9,12,16-18,20-23Male and female dermatologists reported significant differences in productivity, with male dermatologists working more hours and seeing more patients per week than female dermatologists. These results are consistent with other studies of dermatologists4,24 and other physicians.12 Regardless, gender was still found to have a significant impact on income even when controlling for differences in productivity and FMLA leave taken. These results are consistent with numerous studies of US physicians that found a gender gap in income even when controlling for hours worked.12,23 Although fellowship training as a whole was found to significantly impact income, our results do not characterize whether the impact on income was positive or negative for each type of fellowship. Fellowship training in specialties such as internal medicine or general surgery likewise has variable effects on income.24,25
A comprehensive survey design and significant data elicited from dermatologists working in private practice for the first time served as the main strengths of this study. Limitations included self-reported design, categorical ranges, and limited sample size in subgroups. Future directions include deeper analysis of subgroups, including fellowship-trained dermatologists, dermatologists working more than 40 hours per week, and female dermatologists by race/ethnicity.
Conclusion
We have demonstrated that self-reported discrepancies in salary between male and female dermatologists exist, with male dermatologists earning a significantly higher annual salary than their female counterparts. This study identified and stratified several career factors that comprise the broad field and practice of dermatology. Even when controlling for these variations, we have demonstrated that gender alone remains a significant predictor of income, indicating that an unexplained income gap between the 2 genders exists in dermatology.
- Association of American Medical Colleges. Table B-2.2: Total Graduates by U.S. Medical School and Sex, 2015-2016 through 2019-2020. December 3, 2020. Accessed October 12, 2021. https://www.aamc.org/download/321532/data/factstableb2-2.pdf
- Willett LL, Halvorsen AJ, McDonald FS, et al. Gender differences in salary of internal medicine residency directors: a national survey. Am J Med. 2015;128:659-665.
- Weeks WB, Wallace AE, Mackenzie TA. Gender differences in anesthesiologists’ annual incomes. Anesthesiology. 2007;106:806-811.
- Weeks WB, Wallace AE. Gender differences in ophthalmologists’ annual incomes. Ophthalmology. 2007;114:1696-1701.
- Singh A, Burke CA, Larive B, et al. Do gender disparities persist in gastroenterology after 10 years of practice? Am J Gastroenterol. 2008;103:1589-1595.
- Desai T, Ali S, Fang X, et al. Equal work for unequal pay: the gender reimbursement gap for healthcare providers in the United States. Postgrad Med J. 2016;92:571-575.
- Jena AB, Olenski AR, Blumenthal DM. Sex differences in physician salary in US public medical schools. JAMA Intern Med. 2016;176:1294-1304.
- John AM, Gupta AB, John ES, et al. A gender-based comparison of promotion and research productivity in academic dermatology. Dermatol Online J. 2016;22:13030/qt1hx610pf.
- Sadeghpour M, Bernstein I, Ko C, et al. Role of sex in academic dermatology: results from a national survey. Arch Dermatol. 2012;148:809-814.
- Gilbert SB, Allshouse A, Skaznik-Wikiel ME. Gender inequality in salaries among reproductive endocrinology and infertility subspecialists in the United States. Fertil Steril. 2019;111:1194-1200.
- Jagsi R, Griffith KA, Stewart A, et al. Gender differences in the salaries of physician researchers. JAMA. 2012;307:2410-2417. doi:10.1001/jama.2012.6183
- Apaydin EA, Chen PGC, Friedberg MW, et al. Differences in physician income by gender in a multiregion survey. J Gen Intern Med. 2018;33:1574-1581.
- Read S, Butkus R, Weissman A, et al. Compensation disparities by gender in internal medicine. Ann Intern Med. 2018;169:658-661.
- Guss ZD, Chen Q, Hu C, et al. Differences in physician compensation between men and women at United States public academic radiation oncology departments. Int J Radiat Oncol Biol Phys. 2019;103:314-319.
- Lo Sasso AT, Richards MR, Chou CF, et al. The $16,819 pay gap for newly trained physicians: the unexplained trend of men earning more than women. Health Aff (Millwood). 2011;30:193-201.
- Shah A, Jalal S, Khosa F. Influences for gender disparity in dermatology in North America. Int J Dermatol. 2018;57:171-176.
- Shi CR, Olbricht S, Vleugels RA, et al. Sex and leadership in academic dermatology: a nationwide survey. J Am Acad Dermatol. 2017;77:782-784.
- Shih AF, Sun W, Yick C, et al. Trends in scholarly productivity of dermatology faculty by academic status and gender. J Am Acad Dermatol. 2019;80:1774-1776.
- Sarfaty S, Kolb D, Barnett R, et al. Negotiation in academic medicine: a necessary career skill. J Womens Health (Larchmt). 2007;16:235-244.
- Jacobson CC, Nguyen JC, Kimball AB. Gender and parenting significantly affect work hours of recent dermatology program graduates. Arch Dermatol. 2004;140:191-196.
- Feramisco JD, Leitenberger JJ, Redfern SI, et al. A gender gap in the dermatology literature? Cross-sectional analysis of manuscript authorship trends in dermatology journals during 3 decades. J Am Acad Dermatol. 2009;60:63-69.
- Bendels MHK, Dietz MC, Brüggmann D, et al. Gender disparities in high-quality dermatology research: a descriptive bibliometric study on scientific authorships. BMJ Open. 2018;8:e020089.
- Seabury SA, Chandra A, Jena AB. Trends in the earnings of male and female health care professionals in the United States, 1987 to 2010. JAMA Intern Med. 2013;173:1748-1750.
- Baimas-George M, Fleischer B, Slakey D, et al. Is it all about the money? Not all surgical subspecialization leads to higher lifetime revenue when compared to general surgery. J Surg Educ. 2017;74:E62-E66.
- Leigh JP, Tancredi D, Jerant A, et al. Lifetime earnings for physicians across specialties. Med Care. 2012;50:1093-1101.
Although the number of female graduates from US medical schools has steadily increased,1 several studies since the 1970s indicate that a disparity exists in salary, academic rank, and promotion among female and male physicians across multiple specialties.2-8 Proposed explanations include women working fewer hours, having lower productivity rates, undernegotiating compensation, and underbilling for the same services. However, when controlling for variables such as time, experience, specialty, rank, and research activities, this gap unequivocally persists. There are limited data on this topic in dermatology, a field in which women comprise more than half of the working population.6,7 Most analyses of gender disparities in dermatology are based on data primarily from academic dermatologists, which may not be representative of the larger population of dermatologists.8,9 The purpose of this study is to determine if an income disparity exists between male and female physicians in dermatology, including those in private practice and those who are specialty trained.
Methods
Population—We performed a cross-sectional self-reported survey to examine compensation of male and female board-certified dermatologists (MDs/DOs). Several populations of dermatologists were surveyed in August and September 2018. Approximately 20% of the members of the American Academy of Dermatology were randomly selected and sent a link to the survey. Additionally, a survey link was emailed to members of the Association of Professors of Dermatology, American College of Mohs Surgery, and American Society for Dermatologic Surgery. A link to the survey also was published on “The Board Certified Dermatologists” Facebook group.
Statistical Analysis—Descriptive statistics were used to summarize the distribution of variables overall and within gender (male or female). Not all respondents completed every section, and duplicates and incomplete responses were removed. Variables were compared between genders using t tests (continuous), the Pearson χ2 test (nominal), or the Cochran-Mantel-Haenszel test (ordinal). For categorical variables with small cell counts, an exact χ2 test for small samples was used. For continuous variables, t test P values were calculated using either pooled or Satterthwaithe approximation.
To analyze the effect of different variables on total income using multivariate and univariate linear regression, the income variable was transformed into a continuous variable by using midpoints of the categories. Univariate linear regression was used to assess the effect and significance of each variable on total annual income. Variables that were found to have a P value of less than .05 (α=.05) were deemed as significant predictors of total annual income. These variables were added to a multivariate linear regression model to determine their effect on income when adjusting for other significant (and approaching significance) factors. In addition, variables that were found to have a P value of less than .2 (α=.05) were added to the multivariate linear regression model to assess significance of these specific variables when adjusting for other factors. In this way, we tested and accounted for a multitude of variables as potential sources of confounding.
Results
Demographics—Our survey was emailed to 3079 members of the American Academy of Dermatology, and 277 responses were received. Approximately 144 additional responses were obtained collectively from links sent to the directories of the Association of Professors of Dermatology, American College of Mohs Surgery, and American Society for Dermatologic Surgery and from social media. Of these respondents, 53.65% (213/397) were female and 46.35% (184/397) were male. When stratifying by race/ethnicity, 77.33% identified as White; 13.85% identified as Asian; 6.3% identified as Black or African American, Hispanic/Latino, and Native American; and 2.52% chose not to respond. Although most male and female respondents were White, a significantly higher proportion of female respondents identified as Asian or Black/African American/Hispanic/Latino/Native American (P=.0006). We found that race/ethnicity did not significantly impact income (P=.2736). All US Census regions were represented in this study, and geographic distribution as well as population density of practice location (ie, rural, suburban, urban setting) did not differ significantly between males and females (P=.5982 and P=.1007, respectively) and did not significantly impact income (P=.3225 and P=.10663, respectively).
Income—Total annual income was defined as the aggregate sum of all types of financial compensation received in 1 calendar year (eg, salary, bonuses, benefits) and was elicited as an ordinal variable in income brackets of US $100,000. Overall, χ2 analysis showed a statistically significant difference in annual total income between male and female dermatologists (P<.0001), with a higher proportion of males in the highest pay bracket (Figure). Gender remained a statistically significant predictor of income on both univariate and multivariate linear regression analyses (P=.0002 and P<.0001, respectively), indicating that gender has a significant impact on compensation, even after controlling for other variables (eTable). Of note, males in this sample were on average older and in practice longer than females (approximately 6 years, P<.0001). However, when univariate linear regression was performed, both age (P=.8281) and number of years since residency or fellowship completion (P=.8743) were not significant predictors of income.
Practice Type—There were no statistically significant differences between men and women in practice type (P=.1489), including academic/university, hospital based, and solo and group private practice; pay structure (P=.1437), including base salary, collection-based salary, or salary plus incentive; holding a supervisory role (P=.0846); or having ownership of a practice (P=.3565)(eTable). Most respondents were in solo or group private practice (58.2%) and had a component of productivity-based compensation (77.5%). In addition, 62% of private practice dermatologists (133/212) had an ownership interest in their practice. As expected, univariate and multivariate regression analyses showed that practice type, pay structure, supervisory roles, and employee vs ownership roles were significant predictors of income (P<.05)(eTable).
Work Productivity—Statistically significant differences were found between men and women in hours worked per week in direct patient care (P<.0001) and in patient visits per week (P=.0052), with a higher percentage of men working more than 40 hours per week and men seeing an average of approximately 22 more patients per week than women. In the subgroup of all dermatologists working more than 40 hours per week, a statistically significant difference in income persisted between males and females (P=.0001). Hours worked per week and patient visits per week were statistically significant predictors of income on both univariate and multivariate regression analyses (P<.05)(Table).
Education and Fellowship Training—No significant difference existed between males and females in type of undergraduate school attended, namely public or private institutions (P=.1090), but a significant difference existed within type of medical school education, with a higher percentage of females attending private medical schools (53.03%) compared to males (38.24%)(P=.0045). However, type of undergraduate or medical school attended had no impact on income (P=.9103). A higher percentage of males (27.32%) completed additional advanced degrees, such as a master of business administration or a master of public health, compared to females (16.9%)(P=.0122). However, the completion of additional advanced degrees had no significant impact on income (P=.2379). No statistical significance existed between males and females in number of residencies completed (P=.3236), and residencies completed had no significant impact on income (P=.4584).
Of 397 respondents, approximately one-third of respondents completed fellowship training (36.5%). Fellowships included dermatopathology, surgery/cosmetics, and other (encompassing complex medical, research, transplant, and pediatric dermatology). Although similar percentages of men and women completed fellowship training, men and women differed significantly by type of fellowship completed (P=.0188). There were similar rates of dermatopathology and surgical fellowship completion between genders but almost 3 times the number of females who completed other fellowships. Type of fellowship training was a statistically significant predictor of income on both univariate and multivariate regression analyses (P<.00001 and P<.0001, respectively).
Work Activity—Respondents were asked to estimate the amount of time devoted to general dermatology, dermatopathology, Mohs micrographic surgery, cosmetics, and dermatologic surgery in their practices (Table). Women devoted a significantly higher average percentage of time to cosmetics (7.89%) compared to men (4.52%)(P=.0097). The number of cosmetic procedures performed per week was not statistically significantly different between men and women (P=.8035) but was a significant factor for income on univariate regression analysis (P=.0002). Time spent performing dermatologic surgery, general dermatology, or Mohs micrographic surgery did not significantly differ between men and women but was found to significantly influence income.
Academic Dermatology—Among the respondents working in academic settings, χ2 analysis identified a significant difference in the faculty rank between males and females, with a tendency for lower academic rank in females (P=.0508). Assistant professorship was comprised of 35% of men vs 51% of women, whereas full professorship consisted of 26% of men but only 13% of women. Academic rank was found to be a significant predictor of income, with higher rank associated with higher income (P<.0001 on univariate regression analysis). However, when adjusting for other factors, academic rank was no longer a significant predictor of income (P=.0840 on multivariate regression analysis). No significant difference existed between men and women in funding received from the National Institutes of Health, conduction of clinical trials, or authorship of scientific publications, and these factors were not found to have a significant impact on income.
Work Leave—Male and female dermatologists showed a statistically significant difference in maternity or Family and Medical Leave Act (FMLA) leave taken over their careers, with 56.03% of females reporting leave taken compared to 6.78% of males (P<.0001). Women reported a significantly higher average number of weeks of maternity or FMLA leave taken over their careers (12.92 weeks) compared to men (2.42 weeks) (P<.0001). However, upon univariate regression analysis, whether or not maternity or FMLA leave was taken over their careers (P=.2005), the number of times that maternity or FMLA leave was taken (P=.4350), and weeks of maternity or FMLA leave taken (P=.4057) were all not significant predictors of income.
Comment
This study sought to investigate the relationship between income and gender in dermatology, and our results demonstrated that statistically significant differences in total annual income exist between male and female dermatologists, with male dermatologists earning a significantly higher income, approximately an additional $80,000. Our results are consistent with other studies of US physician income, which have found a gender gap ranging from $13,399 to $82,000 that persists even when controlling for factors such as specialty choice, practice setting, rank and role in practice, work hours, vacation/leave taken, and others.2-7,10-15
There was a significant difference in rank of male and female academic dermatologists, with fewer females at higher academic ranks. These results are consistent with numerous studies in academic dermatology that show underrepresentation of women at higher academic ranks and leadership positions.8,9,16-18 Poor negotiation may contribute to differences in both rank and income.19,20 There are conflicting data on research productivity of academic dermatologists and length of career, first and senior authorship, and quality and academic impact, all of which add complexity to this topic.8,9,12,16-18,20-23Male and female dermatologists reported significant differences in productivity, with male dermatologists working more hours and seeing more patients per week than female dermatologists. These results are consistent with other studies of dermatologists4,24 and other physicians.12 Regardless, gender was still found to have a significant impact on income even when controlling for differences in productivity and FMLA leave taken. These results are consistent with numerous studies of US physicians that found a gender gap in income even when controlling for hours worked.12,23 Although fellowship training as a whole was found to significantly impact income, our results do not characterize whether the impact on income was positive or negative for each type of fellowship. Fellowship training in specialties such as internal medicine or general surgery likewise has variable effects on income.24,25
A comprehensive survey design and significant data elicited from dermatologists working in private practice for the first time served as the main strengths of this study. Limitations included self-reported design, categorical ranges, and limited sample size in subgroups. Future directions include deeper analysis of subgroups, including fellowship-trained dermatologists, dermatologists working more than 40 hours per week, and female dermatologists by race/ethnicity.
Conclusion
We have demonstrated that self-reported discrepancies in salary between male and female dermatologists exist, with male dermatologists earning a significantly higher annual salary than their female counterparts. This study identified and stratified several career factors that comprise the broad field and practice of dermatology. Even when controlling for these variations, we have demonstrated that gender alone remains a significant predictor of income, indicating that an unexplained income gap between the 2 genders exists in dermatology.
- Association of American Medical Colleges. Table B-2.2: Total Graduates by U.S. Medical School and Sex, 2015-2016 through 2019-2020. December 3, 2020. Accessed October 12, 2021. https://www.aamc.org/download/321532/data/factstableb2-2.pdf
- Willett LL, Halvorsen AJ, McDonald FS, et al. Gender differences in salary of internal medicine residency directors: a national survey. Am J Med. 2015;128:659-665.
- Weeks WB, Wallace AE, Mackenzie TA. Gender differences in anesthesiologists’ annual incomes. Anesthesiology. 2007;106:806-811.
- Weeks WB, Wallace AE. Gender differences in ophthalmologists’ annual incomes. Ophthalmology. 2007;114:1696-1701.
- Singh A, Burke CA, Larive B, et al. Do gender disparities persist in gastroenterology after 10 years of practice? Am J Gastroenterol. 2008;103:1589-1595.
- Desai T, Ali S, Fang X, et al. Equal work for unequal pay: the gender reimbursement gap for healthcare providers in the United States. Postgrad Med J. 2016;92:571-575.
- Jena AB, Olenski AR, Blumenthal DM. Sex differences in physician salary in US public medical schools. JAMA Intern Med. 2016;176:1294-1304.
- John AM, Gupta AB, John ES, et al. A gender-based comparison of promotion and research productivity in academic dermatology. Dermatol Online J. 2016;22:13030/qt1hx610pf.
- Sadeghpour M, Bernstein I, Ko C, et al. Role of sex in academic dermatology: results from a national survey. Arch Dermatol. 2012;148:809-814.
- Gilbert SB, Allshouse A, Skaznik-Wikiel ME. Gender inequality in salaries among reproductive endocrinology and infertility subspecialists in the United States. Fertil Steril. 2019;111:1194-1200.
- Jagsi R, Griffith KA, Stewart A, et al. Gender differences in the salaries of physician researchers. JAMA. 2012;307:2410-2417. doi:10.1001/jama.2012.6183
- Apaydin EA, Chen PGC, Friedberg MW, et al. Differences in physician income by gender in a multiregion survey. J Gen Intern Med. 2018;33:1574-1581.
- Read S, Butkus R, Weissman A, et al. Compensation disparities by gender in internal medicine. Ann Intern Med. 2018;169:658-661.
- Guss ZD, Chen Q, Hu C, et al. Differences in physician compensation between men and women at United States public academic radiation oncology departments. Int J Radiat Oncol Biol Phys. 2019;103:314-319.
- Lo Sasso AT, Richards MR, Chou CF, et al. The $16,819 pay gap for newly trained physicians: the unexplained trend of men earning more than women. Health Aff (Millwood). 2011;30:193-201.
- Shah A, Jalal S, Khosa F. Influences for gender disparity in dermatology in North America. Int J Dermatol. 2018;57:171-176.
- Shi CR, Olbricht S, Vleugels RA, et al. Sex and leadership in academic dermatology: a nationwide survey. J Am Acad Dermatol. 2017;77:782-784.
- Shih AF, Sun W, Yick C, et al. Trends in scholarly productivity of dermatology faculty by academic status and gender. J Am Acad Dermatol. 2019;80:1774-1776.
- Sarfaty S, Kolb D, Barnett R, et al. Negotiation in academic medicine: a necessary career skill. J Womens Health (Larchmt). 2007;16:235-244.
- Jacobson CC, Nguyen JC, Kimball AB. Gender and parenting significantly affect work hours of recent dermatology program graduates. Arch Dermatol. 2004;140:191-196.
- Feramisco JD, Leitenberger JJ, Redfern SI, et al. A gender gap in the dermatology literature? Cross-sectional analysis of manuscript authorship trends in dermatology journals during 3 decades. J Am Acad Dermatol. 2009;60:63-69.
- Bendels MHK, Dietz MC, Brüggmann D, et al. Gender disparities in high-quality dermatology research: a descriptive bibliometric study on scientific authorships. BMJ Open. 2018;8:e020089.
- Seabury SA, Chandra A, Jena AB. Trends in the earnings of male and female health care professionals in the United States, 1987 to 2010. JAMA Intern Med. 2013;173:1748-1750.
- Baimas-George M, Fleischer B, Slakey D, et al. Is it all about the money? Not all surgical subspecialization leads to higher lifetime revenue when compared to general surgery. J Surg Educ. 2017;74:E62-E66.
- Leigh JP, Tancredi D, Jerant A, et al. Lifetime earnings for physicians across specialties. Med Care. 2012;50:1093-1101.
Practice Points
- In this survey-based cross-sectional study, a statistically significant income disparity between male and female dermatologists was found.
- Although several differences were identified between male and female dermatologists that contribute to income, gender remained a statistically significant predictor of income, and this disparity could not be explained by other factors.
Treatment Delay in Melanoma: A Risk Factor Analysis of an Impending Crisis
Melanoma is the most lethal skin cancer and is the second most common cancer in adolescents and young adults.1 It is the fifth most common cancer in the United States based on incidence, which has steadily risen for the last 2 decades.2,3 For melanoma management, delayed initial diagnosis has been associated with more advanced lesions at presentation and poorer outcomes.4 However, the prognostic implications of delaying melanoma management after diagnosis merits further scrutiny.
This study investigates the associations between melanoma treatment delay (MTD) and patient and tumor characteristics. Although most cases undergo surgical treatment first, more advanced stages may require initiating chemotherapy, radiation therapy, or immunotherapy. In addition, patients who are poor surgical candidates may opt for topical field therapy, such as imiquimod for superficial lesions, prior to more definitive treatment.5 In the Medicaid population, patients who are older than 85 years, married, and previously diagnosed with another melanoma and who also have an increased comorbidity burden have a higher likelihood of MTD.6 For nonmelanoma skin cancers, patient denial is the most common patient-specific factor accounting for treatment delay.7 For this study, our aim was to further evaluate the independent risk factors associated with MTD.
Methods
Case Selection
The National Cancer Database (NCDB) was queried for all cutaneous melanoma cases from 2004 to 2015 (N=525,271). The NCDB is an oncology database sourced from more than 1500 accredited cancer facilities in the United States and Puerto Rico. It receives cases from academic hospitals, Veterans Health Administration hospitals, and community centers.8 Annually, the database collects approximately 70% of cancer diagnoses and 48% of melanoma diagnoses in the United States.9,10 Per institutional guidelines, this analysis was determined to be exempt from institutional review board approval due to the deidentified nature of the dataset.
The selection scheme is illustrated in Table 1. International Statistical Classification of Diseases and Related Health Problems histology codes 8720/3 through 8780/3 combined with the site and morphology primary codes C44.0 through C44.9 identified all patients with a diagnosis of cutaneous melanoma. Primary site was established with the histology codes in the following manner: C44.0 through C44.4 for head/neck primary, C44.5 for trunk primary, C44.6 through C44.7 for extremity primary, and C44.8 through C44.9 for not otherwise specified. Because the NCDB does not specify cause of death, any cases in which the melanoma diagnosis was not the patient’s primary (or first) cancer diagnosis were excluded because of potential ambiguity. Cases lacking histologic confirmation of the diagnosis after primary site biopsy or cases diagnosed from autopsy reports also were excluded. Reports missing staging data or undergoing palliative management were removed. In total, 104,118 cases met the inclusion criteria.

Variables of Interest
The NCDB database codes for a variable “Treatment Started, Days from Dx” are defined as the number of days between the date of diagnosis and the date on which treatment—surgery, radiation, systemic, or other therapy—of the patient began at any facility.11 Treatment delays were classified as more than 45 days or more than 90 days. These thresholds were chosen based on previous studies citing a 45-day recommendation as the timeframe in which primary site excision of melanoma should occur for improved outcomes.1,6,12 Additionally, the postponement cutoffs were aligned with prior studies on surgical delay in melanoma for the Medicaid population.6 Delays of 45 days were labeled as moderate MTD (mMTD), whereas postponements more than 90 days were designated as severe MTD (sMTD).
Patient and tumor characteristics were analyzed for associations with MTD (Table 2). Covariates included age, sex, race (white vs nonwhite), Hispanic ethnicity, insurance status (private; Medicare, Medicaid or other government insurance; and no insurance), median annual income of the patient’s residential zip code (based on 2008-2012 census data), percentage of the population of the patient’s residential zip code without a high school degree (based on 2008-2012 census data), Charlson-Deyo (CD) comorbidity score (a weighted score derived from the sum scores for comorbid conditions), geographic location (rural, urban, and metropolitan), and treatment facility (academic vs nonacademic). Tumor characteristics included primary site (head/neck, trunk, and extremities), stage, and Breslow depth of invasion. Tumor stage was determined using the American Joint Committee on Cancer 6th and 7th editions, depending on the patient’s year of diagnosis.
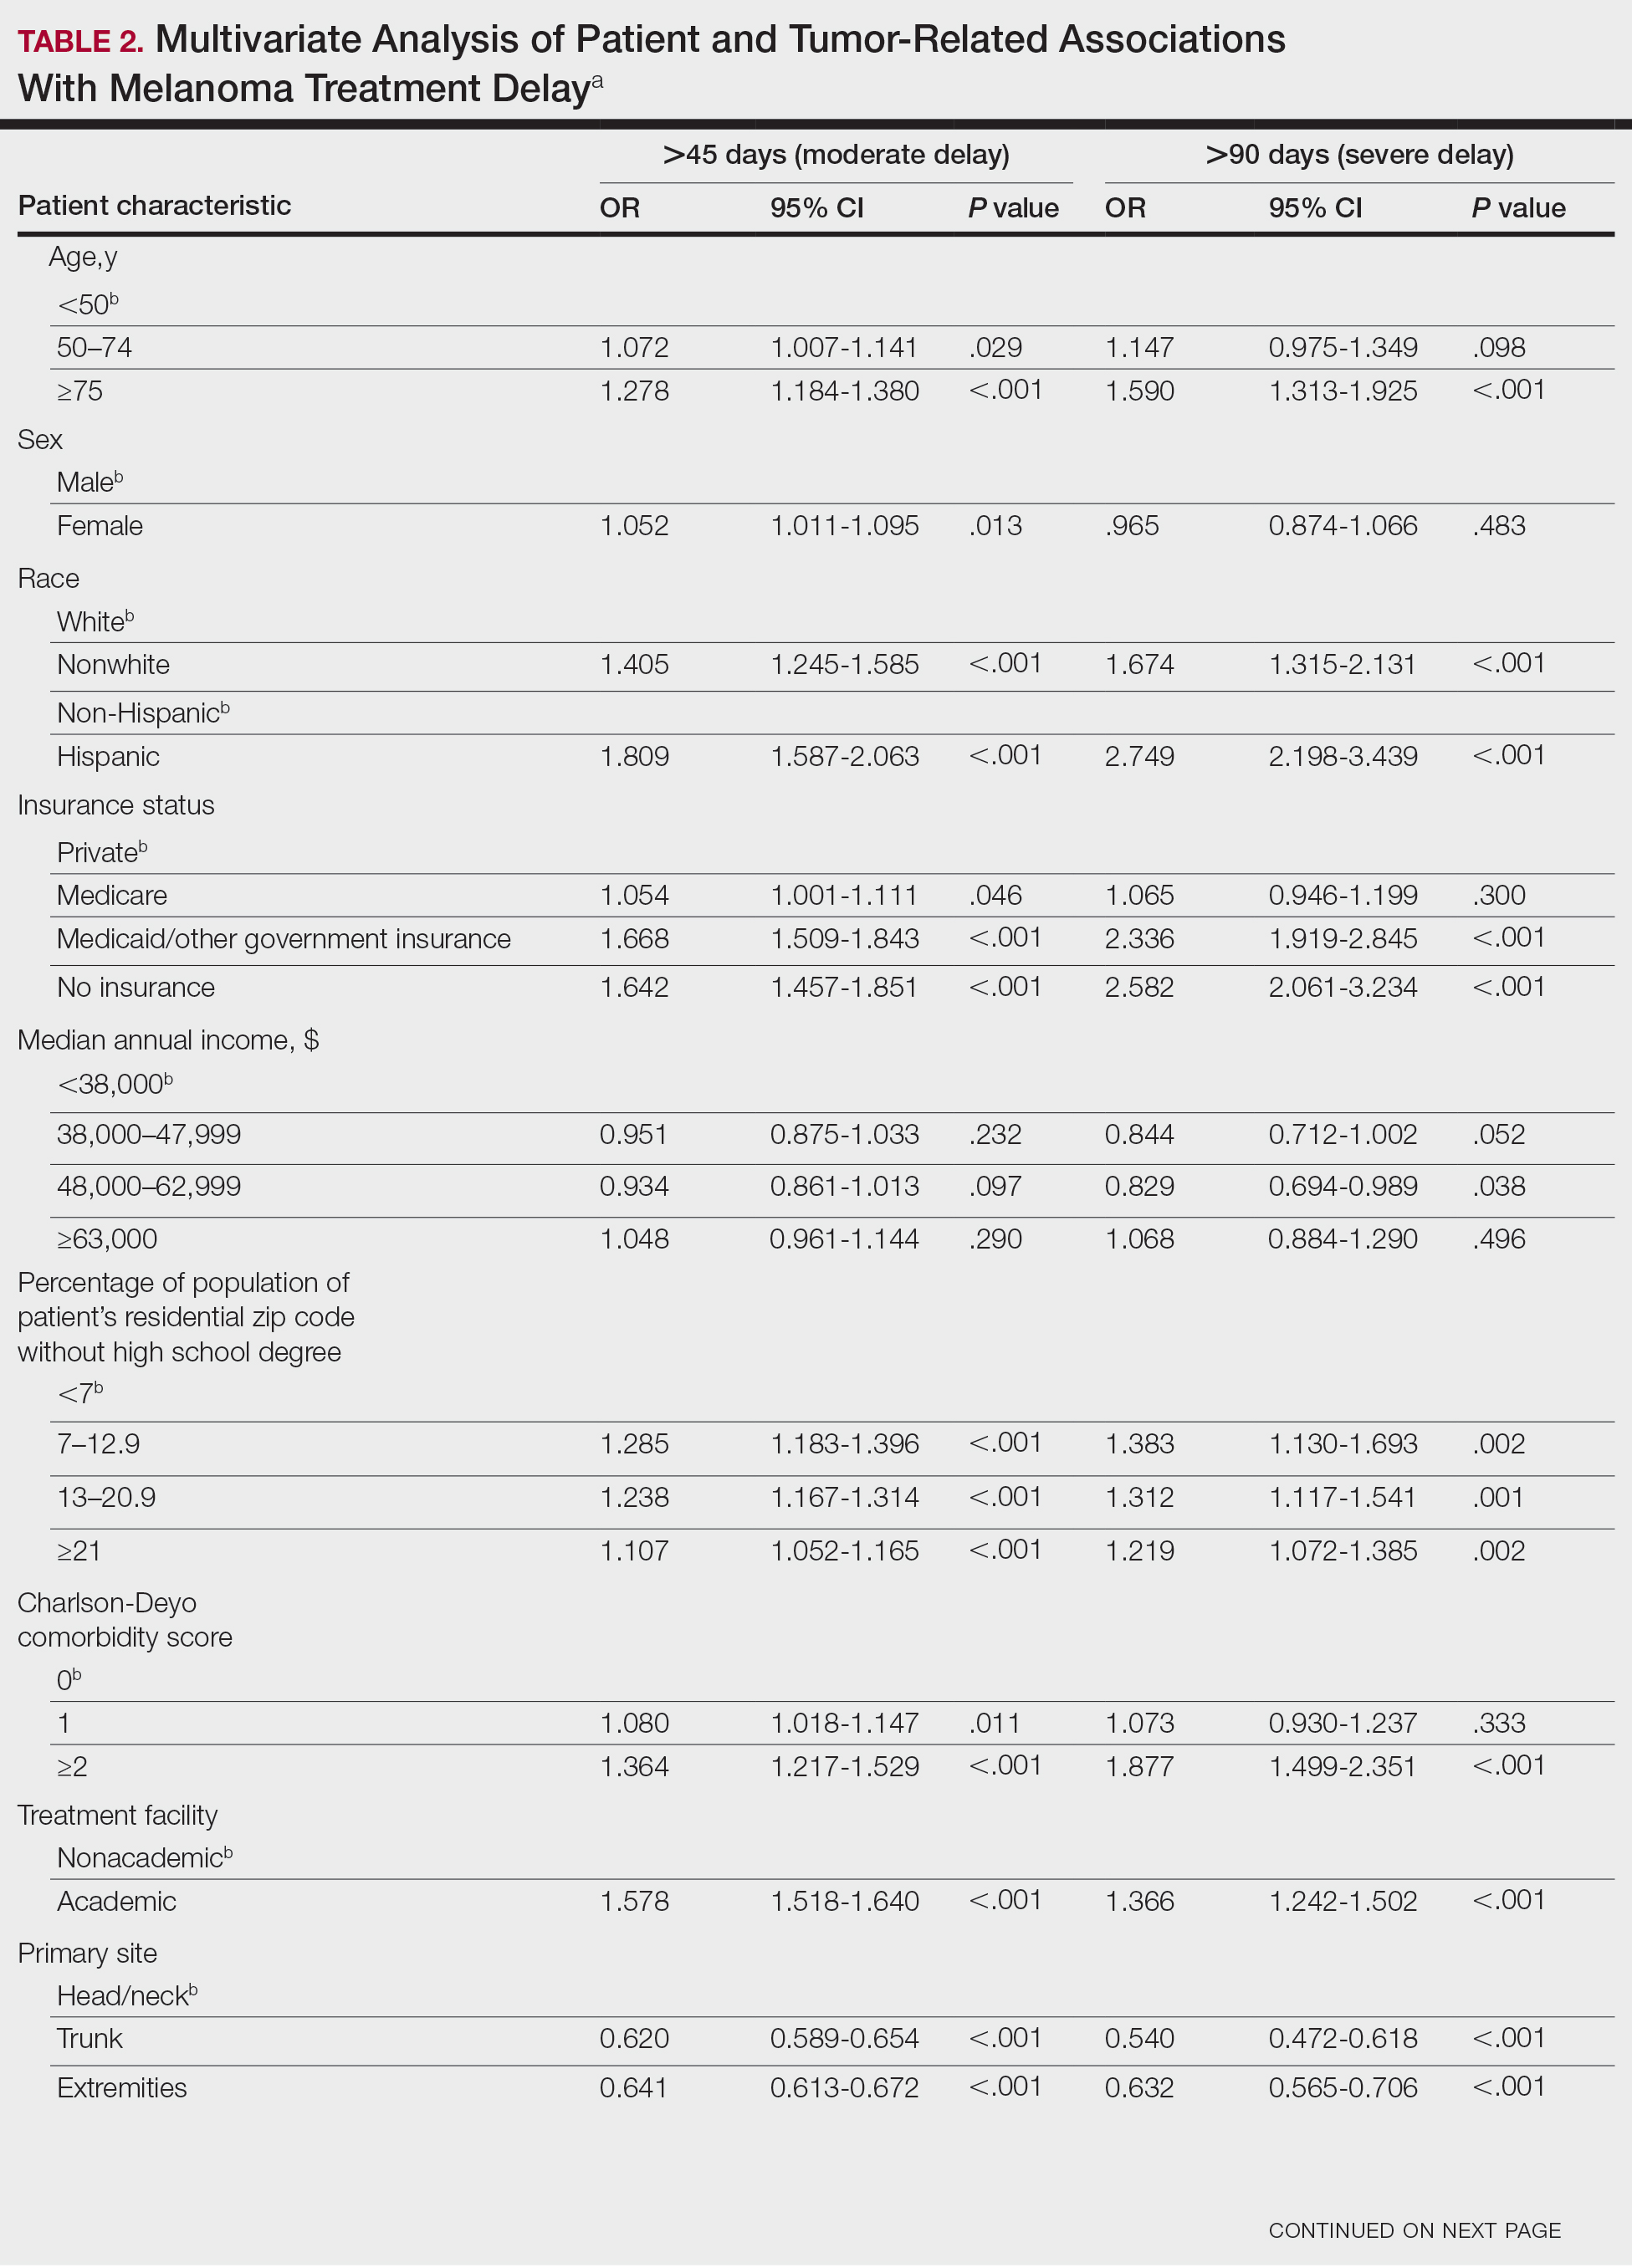

Statistical Methods
χ2 and Fisher exact tests were used to analyze categorical variables involving patient demographics and tumor characteristics by bivariate analysis (Tables 3 and 4). Multivariate analysis determined the relative impact on MTD by including variables that significantly differed on bivariate χ2 analysis (Table 2). Multivariate modeling determined odds ratio (OR) and corresponding 95% CI for the risk-adjusted associations of the variables with MTD. All statistical analyses were performed using SPSS Statistics version 23 (IBM). P<.05 was considered statistically significant, and all statistical tests were 2-tailed. Line graph figures by year of diagnosis were modeled by SPSS using the mean days of delay per year. Independent sample t tests assessed for differences in mean values.
Results
The final study population included 104,118 patients, most of whom were male (56.4%), white (96.6%), and aged 50 to 74 years (54.4%). Most patients were privately insured (52.6%), had no CD comorbidities (87.5%), and lived in metropolitan cities (80.4%)(Table 3). A large majority (95,473 [91.7%]) of patients received surgery as the first means of treatment, with a smaller portion (863 [0.8%]) having unspecified systemic therapy first. The remaining cases were first treated with chemotherapy (1738 [1.7%]), immunotherapy (382 [0.4%]), or radiation (490 [0.5%]), and the rest did not specify treatment sequence. The tumors were most commonly located on the extremities (40.7%), were stage I (41.2%), and had a Breslow depth of less than 1 mm (41.6%).
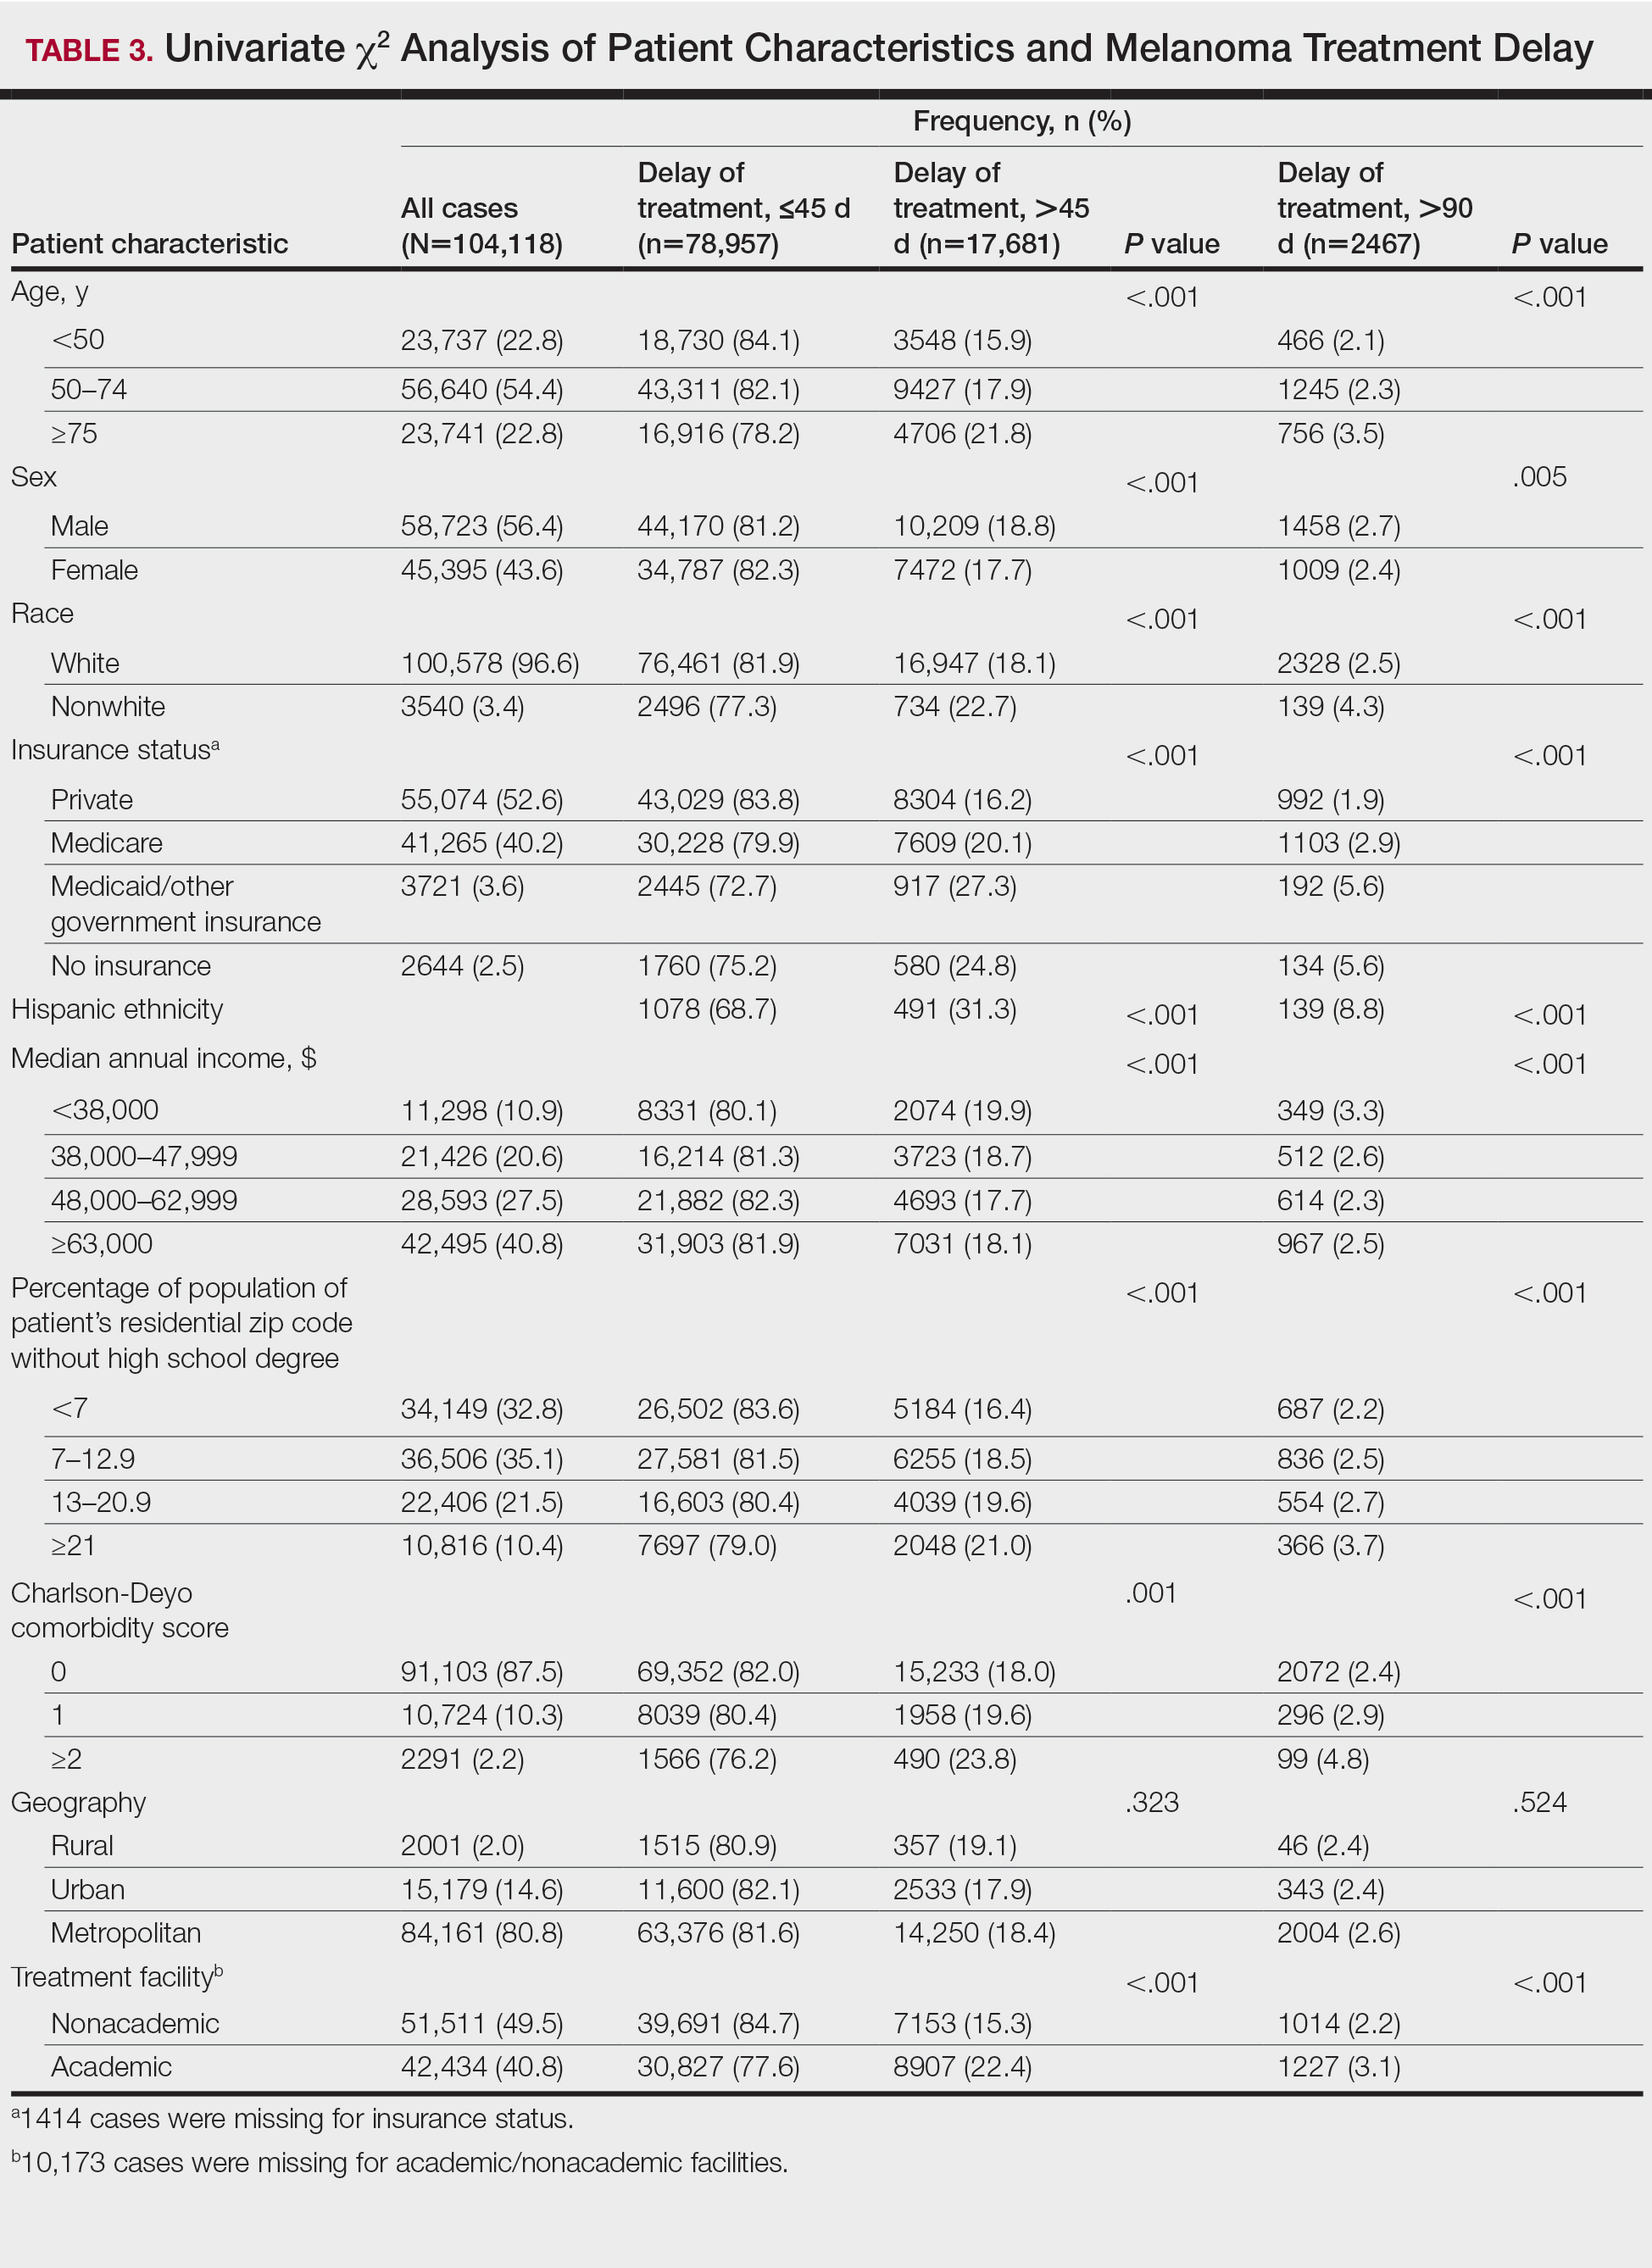
Treatment delay averaged 31.55 days, with a median of 27 days. Overall mean MTD increased significantly from 29.74 days in 2004 to 32.55 days in 2015 (2-tailed t test; P<.001)(Figure). A total of 78,957 cases (75.8%) received treatment within 45 days, whereas 2467 cases (2.5%) were postponed past 90 days. On bivariate analysis, age, sex, race, insurance status, Hispanic ethnicity, median annual income of residential zip code, percentage of the population of the patient’s residential zip code with high school degrees, CD score, and academic treatment facility held significant associations with mMTD and sMTD (P<.05)(Table 3). Analyzing bivariate associations with pertinent tumor characteristics—primary site, stage, and Breslow depth—also held significant associations with mMTD and sMTD (P<.001)(Table 4).
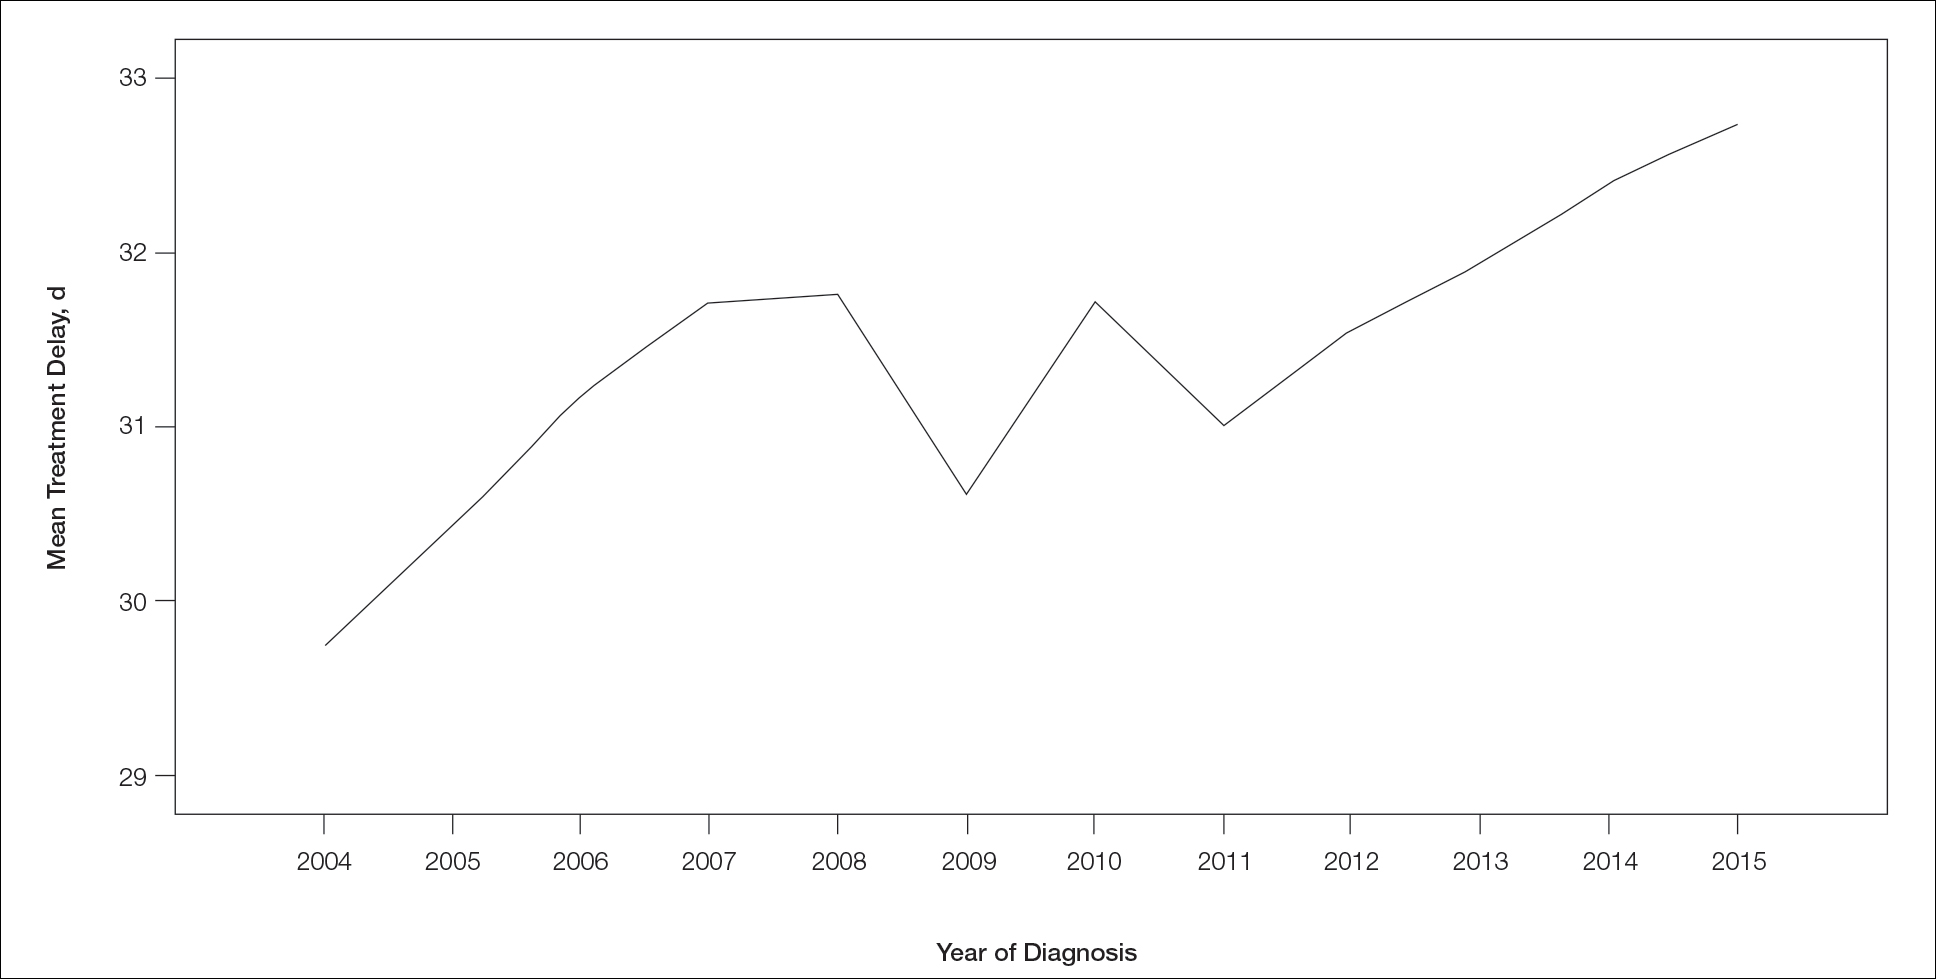
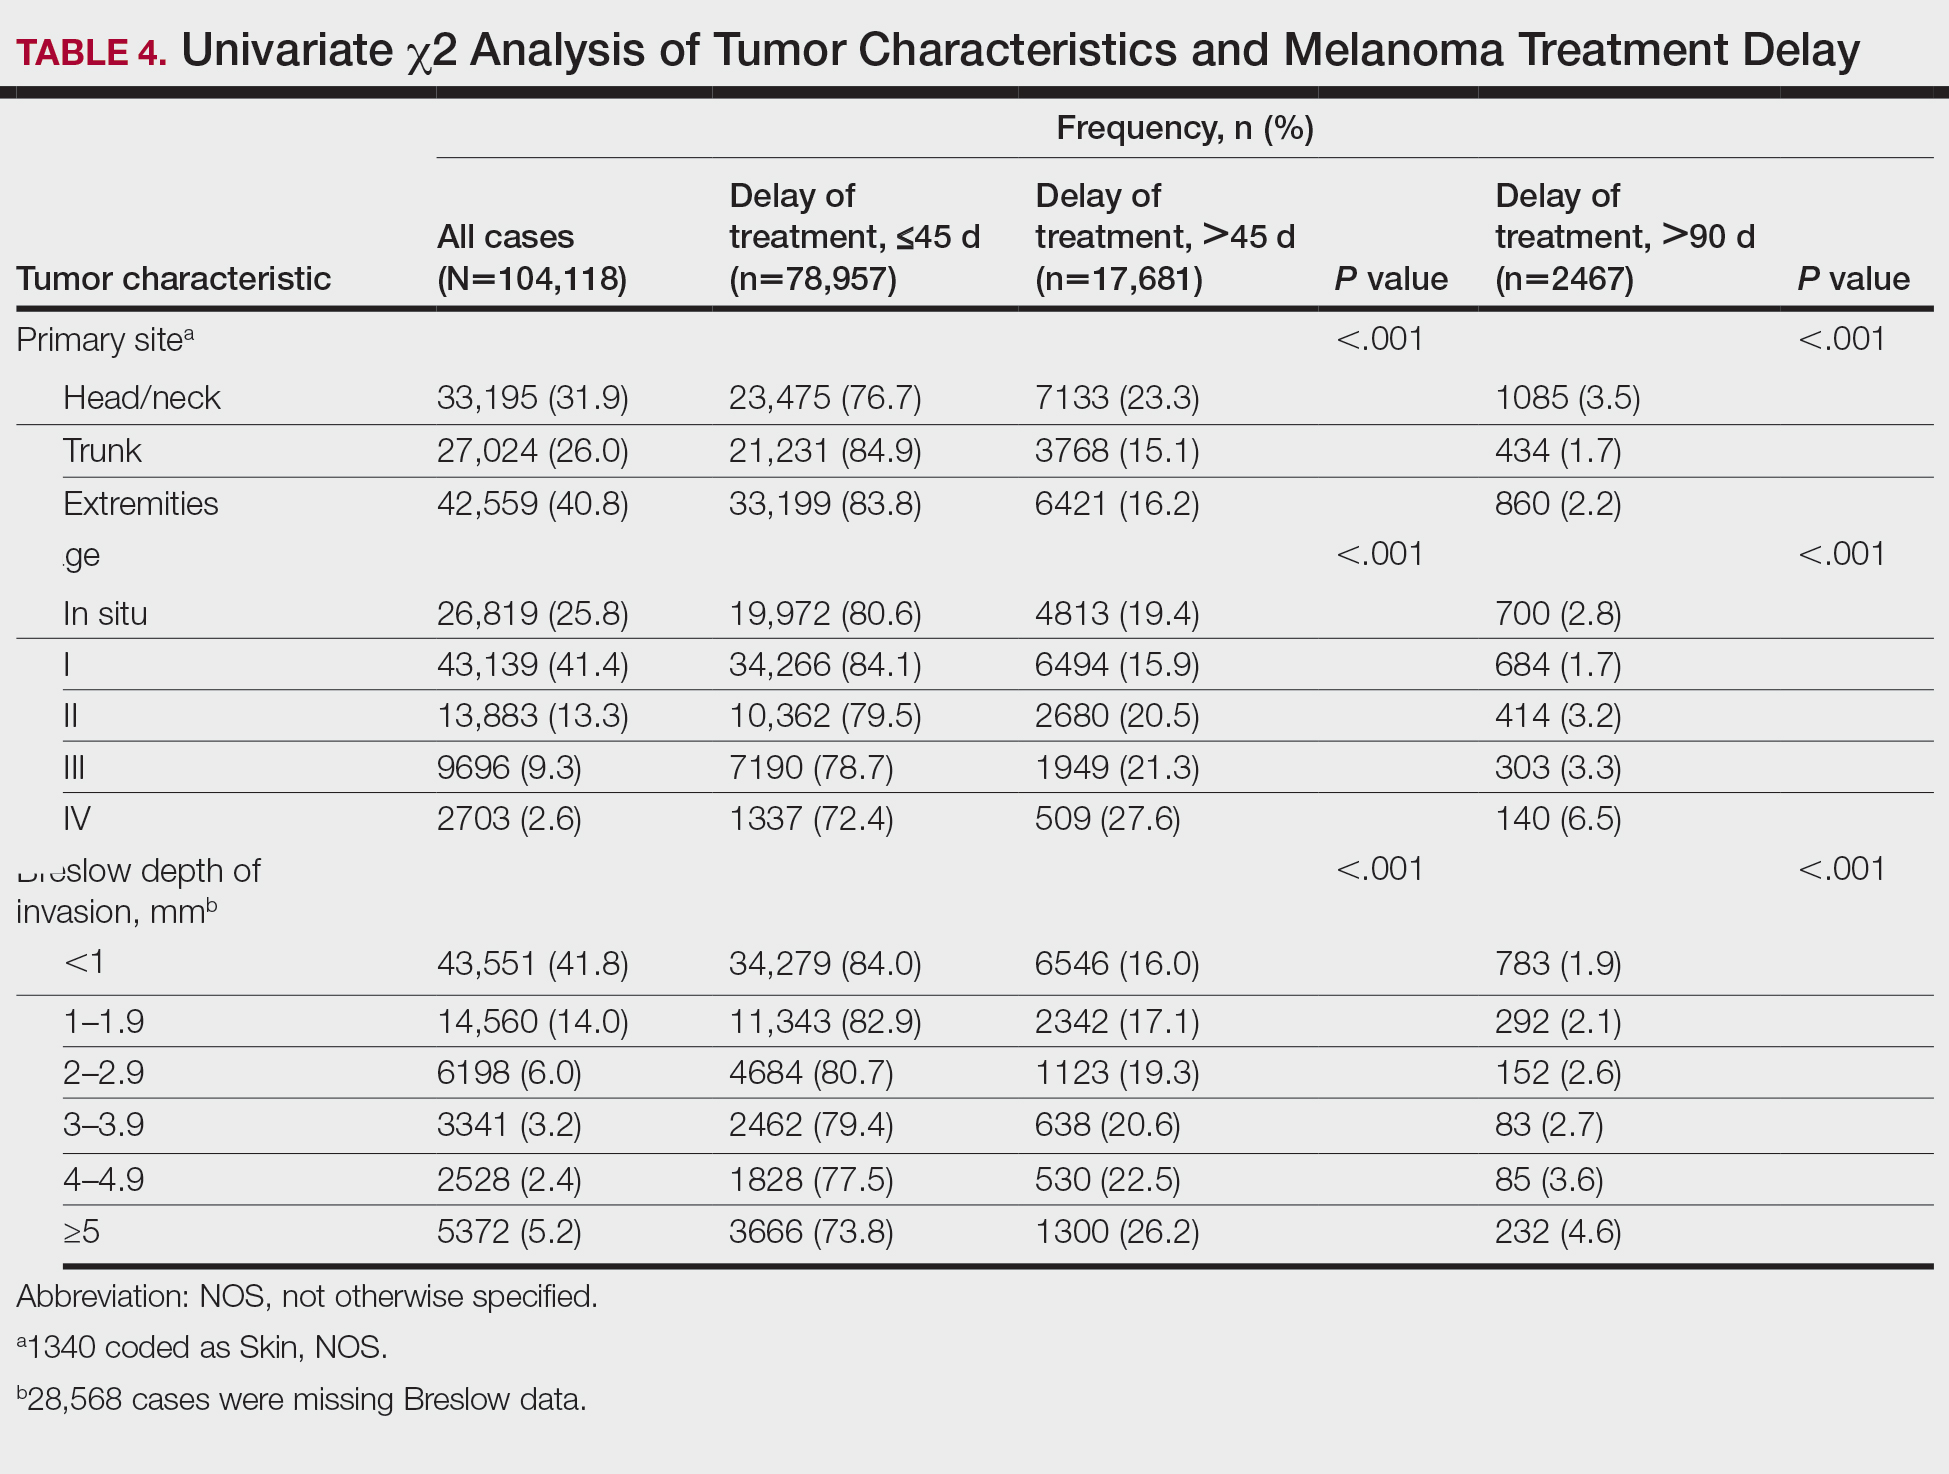
On multivariate analysis, controlling for the variables significant on bivariate analysis, multiple factors showed independent associations with MTD (Table 2). Patients aged 50 to 74 years were more likely to have mMTD (reference: <50 years; P=.029; OR=1.072). Patients 75 years and older showed greater rates of mMTD (reference: <50 years; P<.001; OR=1.278) and sMTD (P<.001; OR=1.590). Women had more mMTD (P=.013; OR=1.052). Nonwhite patients had greater rates of both mMTD (reference: white; P<.001; OR=1.405) and sMTD (P<.001; OR=1.674). Hispanic patients also had greater mMTD (reference: non-Hispanic: P<.001; OR=1.809) and sMTD (P<.001; OR=2.749). Compared to patients with private insurance, those with Medicare were more likely to have mMTD (P=.046; OR=1.054). Patients with no insurance or Medicaid/other government insurance showed more mMTD (no insurance: P<.001, OR=1.642; Medicaid/other: P<.001, OR=1.668) and sMTD (no insurance: P<.001, OR=2.582; Medicaid/other: P<.001, OR=2.336).
With respect to the median annual income of the patient’s residential zip code, patients residing in areas with a median income of $48,000 to $62,999 were less likely to have an sMTD (reference: <$38,000; P=.038; OR=0.829). Compared with patients residing in zip codes where a high percentage of the population had high school degrees, areas with higher nongraduate rates had greater overall rates of MTD (P<.001). Patients with more CD comorbidities also held an association with mMTD (CD1 with reference: CD0; P=.011; OR=1.080)(CD2 with reference: CD0; P<.001; OR=1.364) and sMTD (CD2 with reference: CD0; P<.001; OR=1.877). Academic facilities had greater rates of mMTD (reference: nonacademic facilities; P<.001; OR=1.578) and sMTD (P<.001; OR=1.366). In reference to head/neck primaries, primary sites on the trunk and extremities showed fewer mMTD (trunk: P<.001, OR=0.620; extremities: P<.001, OR=0.641) and sMTD (trunk: P<.001, OR=0.540; extremities: P<.001, OR=0.632). Compared with in situ disease, stage I melanomas were less likely to have treatment delay (mMTD: P<.001, OR=0.902; sMTD: P<.001, OR=0.690), whereas stages II (mMTD: P<.001, OR=1.130), III (mMTD: P<.001, OR=1.196; sMTD: P=.023, OR=1.204), and IV (mMTD: P<.001, OR=1.690; sMTD: P<.001, OR=2.240) were more highly associated with treatments delays.
Comment
The path to successful melanoma management involves 2 timeframes. One is time to diagnosis and the other is time to treatment. With 24.2% of patients receiving treatment later than 45 days after diagnosis, MTD is common and, according to our results, has increased on average from 2004 to 2015. This delay may be partially explained by a shortage of dermatologists, leading to longer wait times and follow-up.13,14 Melanoma treatment delay also varied based on insurance status. Unsurprisingly, those with private insurance showed the lowest rates of MTD. Those with no insurance, Medicare, or Medicaid/other government insurance likely faced greater socioeconomic barriers to health care, such as coverage issues.15 Transportation, low health literacy, and limited work schedule flexibility have been described as additional hurdles to health care that could contribute to this finding.16,17 Similarly, nonwhite patients, Hispanic patients, and those from zip codes with low high school graduation rates had more MTD. Although these findings may be explained by socioeconomic barriers and heightened distrust of the health care system, it also is important to consider physician accessibility.18,19
Considering the 2011 Affordable Care Act along with the 2014 Medicaid expansion, our study holds implications on the impact of these legislations on melanoma treatment. Studies have supported expected rises in Medicaid coverage.20,21 The overall uninsured rate in the United States declined from 16% in 2010 to 9.1% in 2015.22 In our study, the uninsured population showed the highest average MTD rates, though those with Medicaid also had significant MTD. Another treacherous hurdle for patients is the coordination of care among dermatologists, oncologists, general surgeons, plastic surgeons, and Mohs surgeons as a multidisciplinary team. Lott et al6 found that patients who received both biopsy and excision from a dermatologist had the shortest treatment delays, whereas those who had a dermatologist biopsy the site and a different surgeon—including Mohs surgeons—excise it experienced significantly greater MTDs (probablility of MTD >45 days was 31% [95% CI, 24%-37%]. This discordant care and referrals could explain the surprising finding that treatment at an academic facility was independently associated with more MTD, possibly due to the care transitions and referrals that disproportionately affect academic centers and multidisciplinary teams, as mentioned above, regarding the transition of care to other physicians (eg, plastic surgeon). A total of 70.1% of our cases treated at academic facilities reported a prior diagnosis at another facility. These results should not dissuade the pursuit of multidisciplinary treatment teams but should raise caution to untimely referrals.
Age, sex, and race were all associated with more MTD. Patients older than 50 years likely face more complex decisions regarding treatment burden, quality of life, and functional outcomes of more aggressive treatments. High rates of surgical refusal for a number of malignancies have been documented in the elderly population,23-25 which is of particular concern for the high surgery burden of head and neck melanomas,26 as further supported by the findings of more MTD for head and neck primaries. As with elderly patients, patients with higher comorbidity scores and more advanced tumors face similar family–patient care discussions to guide treatment. Additionally, women were more likely to experience MTD, which may be connected to a greater concern for cosmesis27 and necessitate more complex management options, such as Mohs micrographic surgery (a procedure that has gained some support for melanoma excision with the help of immunostaining).28
There are several limitations to this study. Accurate data rely on precise record keeping, reporting, and coding by the contributing institutions. The NCDB case diagnosis is derived from data entry without a centralized review process by experienced dermatopathologists. We could not assess the effects of tumor diameter, as these data were inadequately recorded within the dataset. The NCDB also does not provide details on specific immunotherapy or chemotherapy agents. The NCDB also is a facility-based data source, potentially biasing the melanoma data toward thicker advanced tumors more readily managed at such institutions. Lastly, it is impossible to distinguish between patient-related (ie, difficult decision-making) and health care–related (ie, health care accessibility) delays. Nonetheless, we maintain that minimizing MTD is important for survival outcomes and for limiting the progression of melanomas, regardless of the underlying rationale. We believe that our study expands on conclusions previously limited to a Medicare population.
Conclusion
According to the NCDB, mean MTD has increased significantly from 2004 to 2015. Our results suggest that MTD is relatively common in the United States, thereby increasing the risk for metastases. Higher MTD rates are independently associated with being older than 50 years, female, nonwhite, not privately insured, Hispanic, and treated at an academic facility; having a positive comorbidity history and stage II to IV tumors; and residing in a zip code with a low high school graduation rate. Stage I tumors, primaries not located on the head or neck, and residing in a zip code with a higher median income are associated with lower MTD rates. Policymakers, patients, and dermatologists should better recognize these risk factors to facilitate patient guidance and health equity.
- Huff LS, Chang CA, Thomas JF, et al. Defining an acceptable period of time from melanoma biopsy to excision. Dermatol Reports. 2012;4:E2.
- Matthews NH, Li WQ, Qureshi AA, et al. Epidemiology of Melanoma. Cutaneous Melanoma: Etiology and Therapy. Codon Publications; 2017.
- Siegel RL, Miller KD, Jemal A. Cancer statistics, 2017. CA Cancer J Clin. 2017;67:7-30.
- Nelson BR, Hamlet KR, Gillard M, et al. Sebaceous carcinoma. J Am Acad Dermatol. 1995;33:1-15.
- Fan Q, Cohen S, John B, et al. Melanoma in situ treated with topical imiquimod for management of persistently positive margins: a review of treatment methods. Ochsner J. 2015;15:443-447.
- Lott JP, Narayan D, Soulos PR, et al. Delay of surgery for melanoma among Medicare beneficiaries. JAMA Dermatol. 2015;151:731-741.
- Renzi C, Mastroeni S, Mannooranparampil TJ, et al. Delay in diagnosis and treatment of squamous cell carcinoma of the skin. Acta Derm Venereol. 2010;90:595-601.
- Winchester DP, Stewart AK, Phillips JL, et al. The National Cancer Database: past, present, and future. Ann Surg Oncol. 2010;17:4-7.
- Raval MV, Bilimoria KY, Stewart AK, et al. Using the NCDB for cancer care improvement: an introduction to available quality assessment tools. J Surg Oncol. 2009;99:488-490.
- Turkeltaub AE, Pezzi TA, Pezzi CM, et al. Characteristics, treatment, and survival of invasive malignant melanoma (MM) in giant pigmented nevi (GPN) in adults: 976 cases from the National Cancer Data Base (NCDB). J Am Acad Dermatol. 2016;74:1128-1134.
- Boffa DJ, Rosen JE, Mallin K, et al. Using the National Cancer Database for outcomes research: a review. JAMA Oncol. 2017;3:1722-1728.
- Riker AI, Glass F, Perez I, et al. Cutaneous melanoma: methods of biopsy and definitive surgical excision. Dermatol Ther. 2005;18:387-393.
- Kimball AB, Resneck JS Jr. The US dermatology workforce: a specialty remains in shortage. J Am Acad Dermatol. 2008;59:741-745.
- Glazer AM, Farberg AS, Winkelmann RR, et al. Analysis of trends in geographic distribution and density of US dermatologists. JAMA Dermatol. 2017;153:322-325.
- Okoro CA, Zhao G, Dhingra SS, et al. Peer reviewed: lack of health insurance among adults aged 18 to 64 years: findings from the 2013 Behavioral Risk Factor Surveillance System. Prev Chronic Dis. 2015;12:E231.
- Syed ST, Gerber BS, Sharp LK. Traveling towards disease: transportation barriers to health care access. J Community Health. 2013;38:976-993.
- Valerio M, Cabana MD, White DF, et al. Understanding of asthma management: Medicaid parents’ perspectives. Chest. 2006;129:594-601.
- Kaplan CP, Nápoles A, Davis S, et al. Latinos and cancer information: perspectives of patients, health professionals and telephone cancer information specialists. J Health Dispar Res Pract. 2016;9:154-167.
- Armstrong K, Ravenell KL, McMurphy S, et al. Racial/ethnic differences in physician distrust in the United States. Am J Public Health. 2007;97:1283-1289.
- Moss HA, Havrilesky LJ, Chino J. Insurance coverage among women diagnosed with a gynecologic malignancy before and after implementation of the Affordable Care Act. Gynecol Oncol. 2017;146:457-464.
- Moss HA, Havrilesky LJ, Zafar SY, et al. Trends in insurance status among patients diagnosed with cancer before and after implementation of the Affordable Care Act. J Oncol Pract. 2018;14:E92-E102.
- Obama B. United States health care reform: progress to date and next steps. JAMA. 2016;316:525-532.
- Crippen MM, Brady JS, Mozeika AM, et al. Impact of body mass index on operative outcomes in head and neck free flap surgery. Otolaryngol Head Neck Surg. 2018;159:817-823.
- Verkooijen HM, Fioretta GM, Rapiti E, et al. Patients’ refusal of surgery strongly impairs breast cancer survival. Ann Surg. 2005;242:276-280.
- Wang J, Wang FW. Refusal of cancer-directed surgery strongly impairs survival of patients with localized hepatocellular carcinoma. Int J Surg Oncol. 2010;2010:381795.
- Zito PM, Scharf R. Cancer, melanoma, head and neck. StatPearls. StatPearls Publishing; 2018.
- Al-Dujaili Z, Henry M, Dorizas A, et al. Skin cancer concerns particular to women. Int J Womens Dermatol. 2017;3:S49-S51.
- Etzkorn JR, Jew OS, Shin TM, et al. Mohs micrographic surgery with melanoma antigen recognized by T cells 1 (MART-1) immunostaining for atypical intraepidermal melanocytic proliferation. J Am Acad Dermatol. 2018;79:1109-1116.e1
Melanoma is the most lethal skin cancer and is the second most common cancer in adolescents and young adults.1 It is the fifth most common cancer in the United States based on incidence, which has steadily risen for the last 2 decades.2,3 For melanoma management, delayed initial diagnosis has been associated with more advanced lesions at presentation and poorer outcomes.4 However, the prognostic implications of delaying melanoma management after diagnosis merits further scrutiny.
This study investigates the associations between melanoma treatment delay (MTD) and patient and tumor characteristics. Although most cases undergo surgical treatment first, more advanced stages may require initiating chemotherapy, radiation therapy, or immunotherapy. In addition, patients who are poor surgical candidates may opt for topical field therapy, such as imiquimod for superficial lesions, prior to more definitive treatment.5 In the Medicaid population, patients who are older than 85 years, married, and previously diagnosed with another melanoma and who also have an increased comorbidity burden have a higher likelihood of MTD.6 For nonmelanoma skin cancers, patient denial is the most common patient-specific factor accounting for treatment delay.7 For this study, our aim was to further evaluate the independent risk factors associated with MTD.
Methods
Case Selection
The National Cancer Database (NCDB) was queried for all cutaneous melanoma cases from 2004 to 2015 (N=525,271). The NCDB is an oncology database sourced from more than 1500 accredited cancer facilities in the United States and Puerto Rico. It receives cases from academic hospitals, Veterans Health Administration hospitals, and community centers.8 Annually, the database collects approximately 70% of cancer diagnoses and 48% of melanoma diagnoses in the United States.9,10 Per institutional guidelines, this analysis was determined to be exempt from institutional review board approval due to the deidentified nature of the dataset.
The selection scheme is illustrated in Table 1. International Statistical Classification of Diseases and Related Health Problems histology codes 8720/3 through 8780/3 combined with the site and morphology primary codes C44.0 through C44.9 identified all patients with a diagnosis of cutaneous melanoma. Primary site was established with the histology codes in the following manner: C44.0 through C44.4 for head/neck primary, C44.5 for trunk primary, C44.6 through C44.7 for extremity primary, and C44.8 through C44.9 for not otherwise specified. Because the NCDB does not specify cause of death, any cases in which the melanoma diagnosis was not the patient’s primary (or first) cancer diagnosis were excluded because of potential ambiguity. Cases lacking histologic confirmation of the diagnosis after primary site biopsy or cases diagnosed from autopsy reports also were excluded. Reports missing staging data or undergoing palliative management were removed. In total, 104,118 cases met the inclusion criteria.
Variables of Interest
The NCDB database codes for a variable “Treatment Started, Days from Dx” are defined as the number of days between the date of diagnosis and the date on which treatment—surgery, radiation, systemic, or other therapy—of the patient began at any facility.11 Treatment delays were classified as more than 45 days or more than 90 days. These thresholds were chosen based on previous studies citing a 45-day recommendation as the timeframe in which primary site excision of melanoma should occur for improved outcomes.1,6,12 Additionally, the postponement cutoffs were aligned with prior studies on surgical delay in melanoma for the Medicaid population.6 Delays of 45 days were labeled as moderate MTD (mMTD), whereas postponements more than 90 days were designated as severe MTD (sMTD).
Patient and tumor characteristics were analyzed for associations with MTD (Table 2). Covariates included age, sex, race (white vs nonwhite), Hispanic ethnicity, insurance status (private; Medicare, Medicaid or other government insurance; and no insurance), median annual income of the patient’s residential zip code (based on 2008-2012 census data), percentage of the population of the patient’s residential zip code without a high school degree (based on 2008-2012 census data), Charlson-Deyo (CD) comorbidity score (a weighted score derived from the sum scores for comorbid conditions), geographic location (rural, urban, and metropolitan), and treatment facility (academic vs nonacademic). Tumor characteristics included primary site (head/neck, trunk, and extremities), stage, and Breslow depth of invasion. Tumor stage was determined using the American Joint Committee on Cancer 6th and 7th editions, depending on the patient’s year of diagnosis.
Statistical Methods
χ2 and Fisher exact tests were used to analyze categorical variables involving patient demographics and tumor characteristics by bivariate analysis (Tables 3 and 4). Multivariate analysis determined the relative impact on MTD by including variables that significantly differed on bivariate χ2 analysis (Table 2). Multivariate modeling determined odds ratio (OR) and corresponding 95% CI for the risk-adjusted associations of the variables with MTD. All statistical analyses were performed using SPSS Statistics version 23 (IBM). P<.05 was considered statistically significant, and all statistical tests were 2-tailed. Line graph figures by year of diagnosis were modeled by SPSS using the mean days of delay per year. Independent sample t tests assessed for differences in mean values.
Results
The final study population included 104,118 patients, most of whom were male (56.4%), white (96.6%), and aged 50 to 74 years (54.4%). Most patients were privately insured (52.6%), had no CD comorbidities (87.5%), and lived in metropolitan cities (80.4%)(Table 3). A large majority (95,473 [91.7%]) of patients received surgery as the first means of treatment, with a smaller portion (863 [0.8%]) having unspecified systemic therapy first. The remaining cases were first treated with chemotherapy (1738 [1.7%]), immunotherapy (382 [0.4%]), or radiation (490 [0.5%]), and the rest did not specify treatment sequence. The tumors were most commonly located on the extremities (40.7%), were stage I (41.2%), and had a Breslow depth of less than 1 mm (41.6%).
Treatment delay averaged 31.55 days, with a median of 27 days. Overall mean MTD increased significantly from 29.74 days in 2004 to 32.55 days in 2015 (2-tailed t test; P<.001)(Figure). A total of 78,957 cases (75.8%) received treatment within 45 days, whereas 2467 cases (2.5%) were postponed past 90 days. On bivariate analysis, age, sex, race, insurance status, Hispanic ethnicity, median annual income of residential zip code, percentage of the population of the patient’s residential zip code with high school degrees, CD score, and academic treatment facility held significant associations with mMTD and sMTD (P<.05)(Table 3). Analyzing bivariate associations with pertinent tumor characteristics—primary site, stage, and Breslow depth—also held significant associations with mMTD and sMTD (P<.001)(Table 4).
On multivariate analysis, controlling for the variables significant on bivariate analysis, multiple factors showed independent associations with MTD (Table 2). Patients aged 50 to 74 years were more likely to have mMTD (reference: <50 years; P=.029; OR=1.072). Patients 75 years and older showed greater rates of mMTD (reference: <50 years; P<.001; OR=1.278) and sMTD (P<.001; OR=1.590). Women had more mMTD (P=.013; OR=1.052). Nonwhite patients had greater rates of both mMTD (reference: white; P<.001; OR=1.405) and sMTD (P<.001; OR=1.674). Hispanic patients also had greater mMTD (reference: non-Hispanic: P<.001; OR=1.809) and sMTD (P<.001; OR=2.749). Compared to patients with private insurance, those with Medicare were more likely to have mMTD (P=.046; OR=1.054). Patients with no insurance or Medicaid/other government insurance showed more mMTD (no insurance: P<.001, OR=1.642; Medicaid/other: P<.001, OR=1.668) and sMTD (no insurance: P<.001, OR=2.582; Medicaid/other: P<.001, OR=2.336).
With respect to the median annual income of the patient’s residential zip code, patients residing in areas with a median income of $48,000 to $62,999 were less likely to have an sMTD (reference: <$38,000; P=.038; OR=0.829). Compared with patients residing in zip codes where a high percentage of the population had high school degrees, areas with higher nongraduate rates had greater overall rates of MTD (P<.001). Patients with more CD comorbidities also held an association with mMTD (CD1 with reference: CD0; P=.011; OR=1.080)(CD2 with reference: CD0; P<.001; OR=1.364) and sMTD (CD2 with reference: CD0; P<.001; OR=1.877). Academic facilities had greater rates of mMTD (reference: nonacademic facilities; P<.001; OR=1.578) and sMTD (P<.001; OR=1.366). In reference to head/neck primaries, primary sites on the trunk and extremities showed fewer mMTD (trunk: P<.001, OR=0.620; extremities: P<.001, OR=0.641) and sMTD (trunk: P<.001, OR=0.540; extremities: P<.001, OR=0.632). Compared with in situ disease, stage I melanomas were less likely to have treatment delay (mMTD: P<.001, OR=0.902; sMTD: P<.001, OR=0.690), whereas stages II (mMTD: P<.001, OR=1.130), III (mMTD: P<.001, OR=1.196; sMTD: P=.023, OR=1.204), and IV (mMTD: P<.001, OR=1.690; sMTD: P<.001, OR=2.240) were more highly associated with treatments delays.
Comment
The path to successful melanoma management involves 2 timeframes. One is time to diagnosis and the other is time to treatment. With 24.2% of patients receiving treatment later than 45 days after diagnosis, MTD is common and, according to our results, has increased on average from 2004 to 2015. This delay may be partially explained by a shortage of dermatologists, leading to longer wait times and follow-up.13,14 Melanoma treatment delay also varied based on insurance status. Unsurprisingly, those with private insurance showed the lowest rates of MTD. Those with no insurance, Medicare, or Medicaid/other government insurance likely faced greater socioeconomic barriers to health care, such as coverage issues.15 Transportation, low health literacy, and limited work schedule flexibility have been described as additional hurdles to health care that could contribute to this finding.16,17 Similarly, nonwhite patients, Hispanic patients, and those from zip codes with low high school graduation rates had more MTD. Although these findings may be explained by socioeconomic barriers and heightened distrust of the health care system, it also is important to consider physician accessibility.18,19
Considering the 2011 Affordable Care Act along with the 2014 Medicaid expansion, our study holds implications on the impact of these legislations on melanoma treatment. Studies have supported expected rises in Medicaid coverage.20,21 The overall uninsured rate in the United States declined from 16% in 2010 to 9.1% in 2015.22 In our study, the uninsured population showed the highest average MTD rates, though those with Medicaid also had significant MTD. Another treacherous hurdle for patients is the coordination of care among dermatologists, oncologists, general surgeons, plastic surgeons, and Mohs surgeons as a multidisciplinary team. Lott et al6 found that patients who received both biopsy and excision from a dermatologist had the shortest treatment delays, whereas those who had a dermatologist biopsy the site and a different surgeon—including Mohs surgeons—excise it experienced significantly greater MTDs (probablility of MTD >45 days was 31% [95% CI, 24%-37%]. This discordant care and referrals could explain the surprising finding that treatment at an academic facility was independently associated with more MTD, possibly due to the care transitions and referrals that disproportionately affect academic centers and multidisciplinary teams, as mentioned above, regarding the transition of care to other physicians (eg, plastic surgeon). A total of 70.1% of our cases treated at academic facilities reported a prior diagnosis at another facility. These results should not dissuade the pursuit of multidisciplinary treatment teams but should raise caution to untimely referrals.
Age, sex, and race were all associated with more MTD. Patients older than 50 years likely face more complex decisions regarding treatment burden, quality of life, and functional outcomes of more aggressive treatments. High rates of surgical refusal for a number of malignancies have been documented in the elderly population,23-25 which is of particular concern for the high surgery burden of head and neck melanomas,26 as further supported by the findings of more MTD for head and neck primaries. As with elderly patients, patients with higher comorbidity scores and more advanced tumors face similar family–patient care discussions to guide treatment. Additionally, women were more likely to experience MTD, which may be connected to a greater concern for cosmesis27 and necessitate more complex management options, such as Mohs micrographic surgery (a procedure that has gained some support for melanoma excision with the help of immunostaining).28
There are several limitations to this study. Accurate data rely on precise record keeping, reporting, and coding by the contributing institutions. The NCDB case diagnosis is derived from data entry without a centralized review process by experienced dermatopathologists. We could not assess the effects of tumor diameter, as these data were inadequately recorded within the dataset. The NCDB also does not provide details on specific immunotherapy or chemotherapy agents. The NCDB also is a facility-based data source, potentially biasing the melanoma data toward thicker advanced tumors more readily managed at such institutions. Lastly, it is impossible to distinguish between patient-related (ie, difficult decision-making) and health care–related (ie, health care accessibility) delays. Nonetheless, we maintain that minimizing MTD is important for survival outcomes and for limiting the progression of melanomas, regardless of the underlying rationale. We believe that our study expands on conclusions previously limited to a Medicare population.
Conclusion
According to the NCDB, mean MTD has increased significantly from 2004 to 2015. Our results suggest that MTD is relatively common in the United States, thereby increasing the risk for metastases. Higher MTD rates are independently associated with being older than 50 years, female, nonwhite, not privately insured, Hispanic, and treated at an academic facility; having a positive comorbidity history and stage II to IV tumors; and residing in a zip code with a low high school graduation rate. Stage I tumors, primaries not located on the head or neck, and residing in a zip code with a higher median income are associated with lower MTD rates. Policymakers, patients, and dermatologists should better recognize these risk factors to facilitate patient guidance and health equity.
- Huff LS, Chang CA, Thomas JF, et al. Defining an acceptable period of time from melanoma biopsy to excision. Dermatol Reports. 2012;4:E2.
- Matthews NH, Li WQ, Qureshi AA, et al. Epidemiology of Melanoma. Cutaneous Melanoma: Etiology and Therapy. Codon Publications; 2017.
- Siegel RL, Miller KD, Jemal A. Cancer statistics, 2017. CA Cancer J Clin. 2017;67:7-30.
- Nelson BR, Hamlet KR, Gillard M, et al. Sebaceous carcinoma. J Am Acad Dermatol. 1995;33:1-15.
- Fan Q, Cohen S, John B, et al. Melanoma in situ treated with topical imiquimod for management of persistently positive margins: a review of treatment methods. Ochsner J. 2015;15:443-447.
- Lott JP, Narayan D, Soulos PR, et al. Delay of surgery for melanoma among Medicare beneficiaries. JAMA Dermatol. 2015;151:731-741.
- Renzi C, Mastroeni S, Mannooranparampil TJ, et al. Delay in diagnosis and treatment of squamous cell carcinoma of the skin. Acta Derm Venereol. 2010;90:595-601.
- Winchester DP, Stewart AK, Phillips JL, et al. The National Cancer Database: past, present, and future. Ann Surg Oncol. 2010;17:4-7.
- Raval MV, Bilimoria KY, Stewart AK, et al. Using the NCDB for cancer care improvement: an introduction to available quality assessment tools. J Surg Oncol. 2009;99:488-490.
- Turkeltaub AE, Pezzi TA, Pezzi CM, et al. Characteristics, treatment, and survival of invasive malignant melanoma (MM) in giant pigmented nevi (GPN) in adults: 976 cases from the National Cancer Data Base (NCDB). J Am Acad Dermatol. 2016;74:1128-1134.
- Boffa DJ, Rosen JE, Mallin K, et al. Using the National Cancer Database for outcomes research: a review. JAMA Oncol. 2017;3:1722-1728.
- Riker AI, Glass F, Perez I, et al. Cutaneous melanoma: methods of biopsy and definitive surgical excision. Dermatol Ther. 2005;18:387-393.
- Kimball AB, Resneck JS Jr. The US dermatology workforce: a specialty remains in shortage. J Am Acad Dermatol. 2008;59:741-745.
- Glazer AM, Farberg AS, Winkelmann RR, et al. Analysis of trends in geographic distribution and density of US dermatologists. JAMA Dermatol. 2017;153:322-325.
- Okoro CA, Zhao G, Dhingra SS, et al. Peer reviewed: lack of health insurance among adults aged 18 to 64 years: findings from the 2013 Behavioral Risk Factor Surveillance System. Prev Chronic Dis. 2015;12:E231.
- Syed ST, Gerber BS, Sharp LK. Traveling towards disease: transportation barriers to health care access. J Community Health. 2013;38:976-993.
- Valerio M, Cabana MD, White DF, et al. Understanding of asthma management: Medicaid parents’ perspectives. Chest. 2006;129:594-601.
- Kaplan CP, Nápoles A, Davis S, et al. Latinos and cancer information: perspectives of patients, health professionals and telephone cancer information specialists. J Health Dispar Res Pract. 2016;9:154-167.
- Armstrong K, Ravenell KL, McMurphy S, et al. Racial/ethnic differences in physician distrust in the United States. Am J Public Health. 2007;97:1283-1289.
- Moss HA, Havrilesky LJ, Chino J. Insurance coverage among women diagnosed with a gynecologic malignancy before and after implementation of the Affordable Care Act. Gynecol Oncol. 2017;146:457-464.
- Moss HA, Havrilesky LJ, Zafar SY, et al. Trends in insurance status among patients diagnosed with cancer before and after implementation of the Affordable Care Act. J Oncol Pract. 2018;14:E92-E102.
- Obama B. United States health care reform: progress to date and next steps. JAMA. 2016;316:525-532.
- Crippen MM, Brady JS, Mozeika AM, et al. Impact of body mass index on operative outcomes in head and neck free flap surgery. Otolaryngol Head Neck Surg. 2018;159:817-823.
- Verkooijen HM, Fioretta GM, Rapiti E, et al. Patients’ refusal of surgery strongly impairs breast cancer survival. Ann Surg. 2005;242:276-280.
- Wang J, Wang FW. Refusal of cancer-directed surgery strongly impairs survival of patients with localized hepatocellular carcinoma. Int J Surg Oncol. 2010;2010:381795.
- Zito PM, Scharf R. Cancer, melanoma, head and neck. StatPearls. StatPearls Publishing; 2018.
- Al-Dujaili Z, Henry M, Dorizas A, et al. Skin cancer concerns particular to women. Int J Womens Dermatol. 2017;3:S49-S51.
- Etzkorn JR, Jew OS, Shin TM, et al. Mohs micrographic surgery with melanoma antigen recognized by T cells 1 (MART-1) immunostaining for atypical intraepidermal melanocytic proliferation. J Am Acad Dermatol. 2018;79:1109-1116.e1
Practice Points
- Melanoma treatment delays (MTDs) have been linked to poor outcomes.
- Based on the National Cancer Database, the mean MTD has increased significantly from 2004 to 2015 (P11<.001).
- More delays are seen in patients who are older than 50 years, female, nonwhite, not privately insured, and treated at an academic facility and who have more advanced tumor stage and head/neck primaries.
Sniffing Out Malignant Melanoma: A Case of Canine Olfactory Detection
To the Editor:
A 43-year-old woman presented with a mole on the central back that had been present since childhood and had changed and grown over the last few years. The patient reported that her 2-year-old rescue dog frequently sniffed the mole and would subsequently get agitated and try to scratch and bite the lesion. This behavior prompted the patient to visit a dermatologist.
She reported no personal history of melanoma or nonmelanoma skin cancer, tanning booth exposure, blistering sunburns, or use of immunosuppressant medications. Her family history was remarkable for basal cell carcinoma in her father but no family history of melanoma. Physical examination revealed a 1.2×1.5-cm brown patch along with a 1×1-cm ulcerated nodule on the lower aspect of the lesion (Figure 1). Dermoscopy showed a blue-white veil and an irregular vascular pattern (Figure 2). No cervical, axillary, or inguinal lymphadenopathy was appreciated on physical examination. Reflectance confocal microscopy showed pagetoid spread of atypical round melanocytes as well as melanocytes in the stratum corneum (Figure 3).
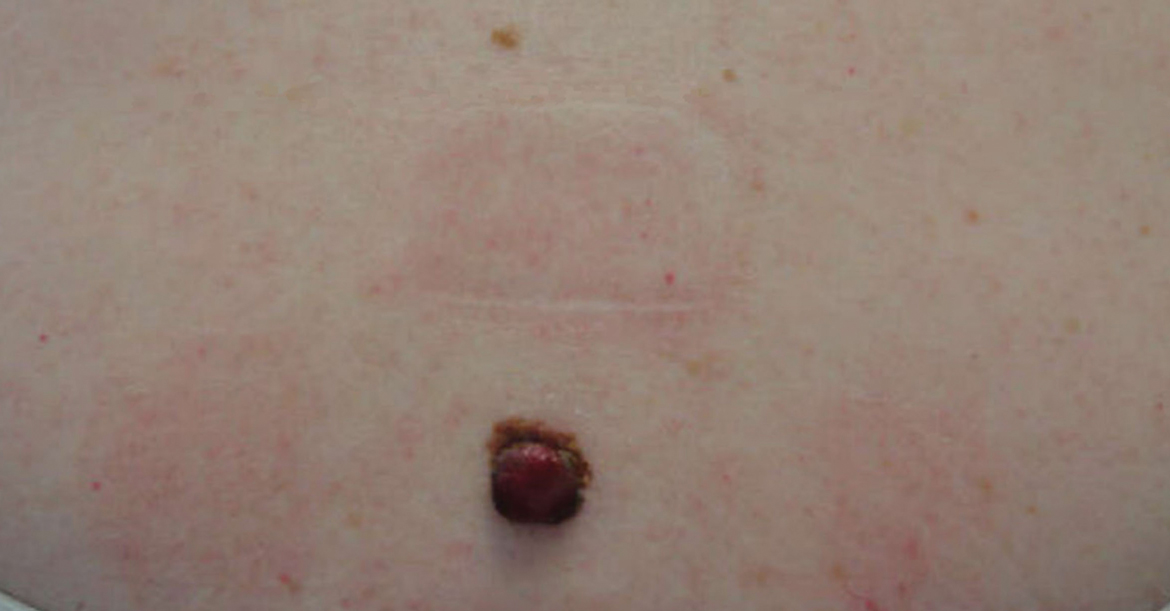
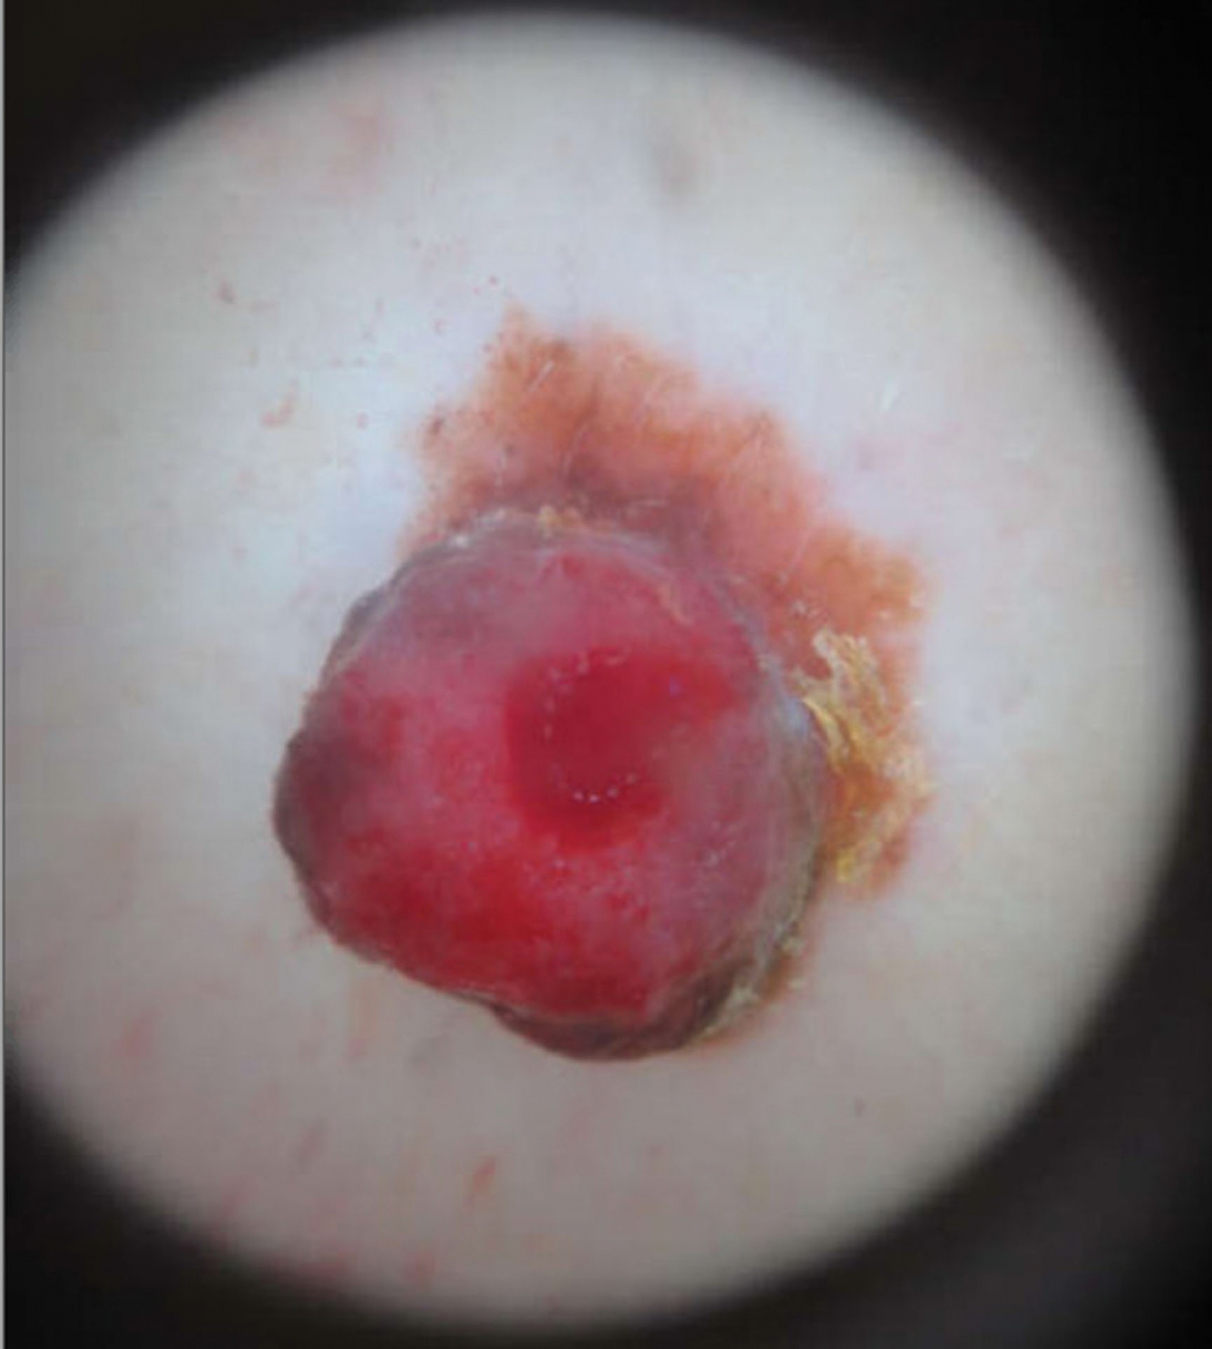
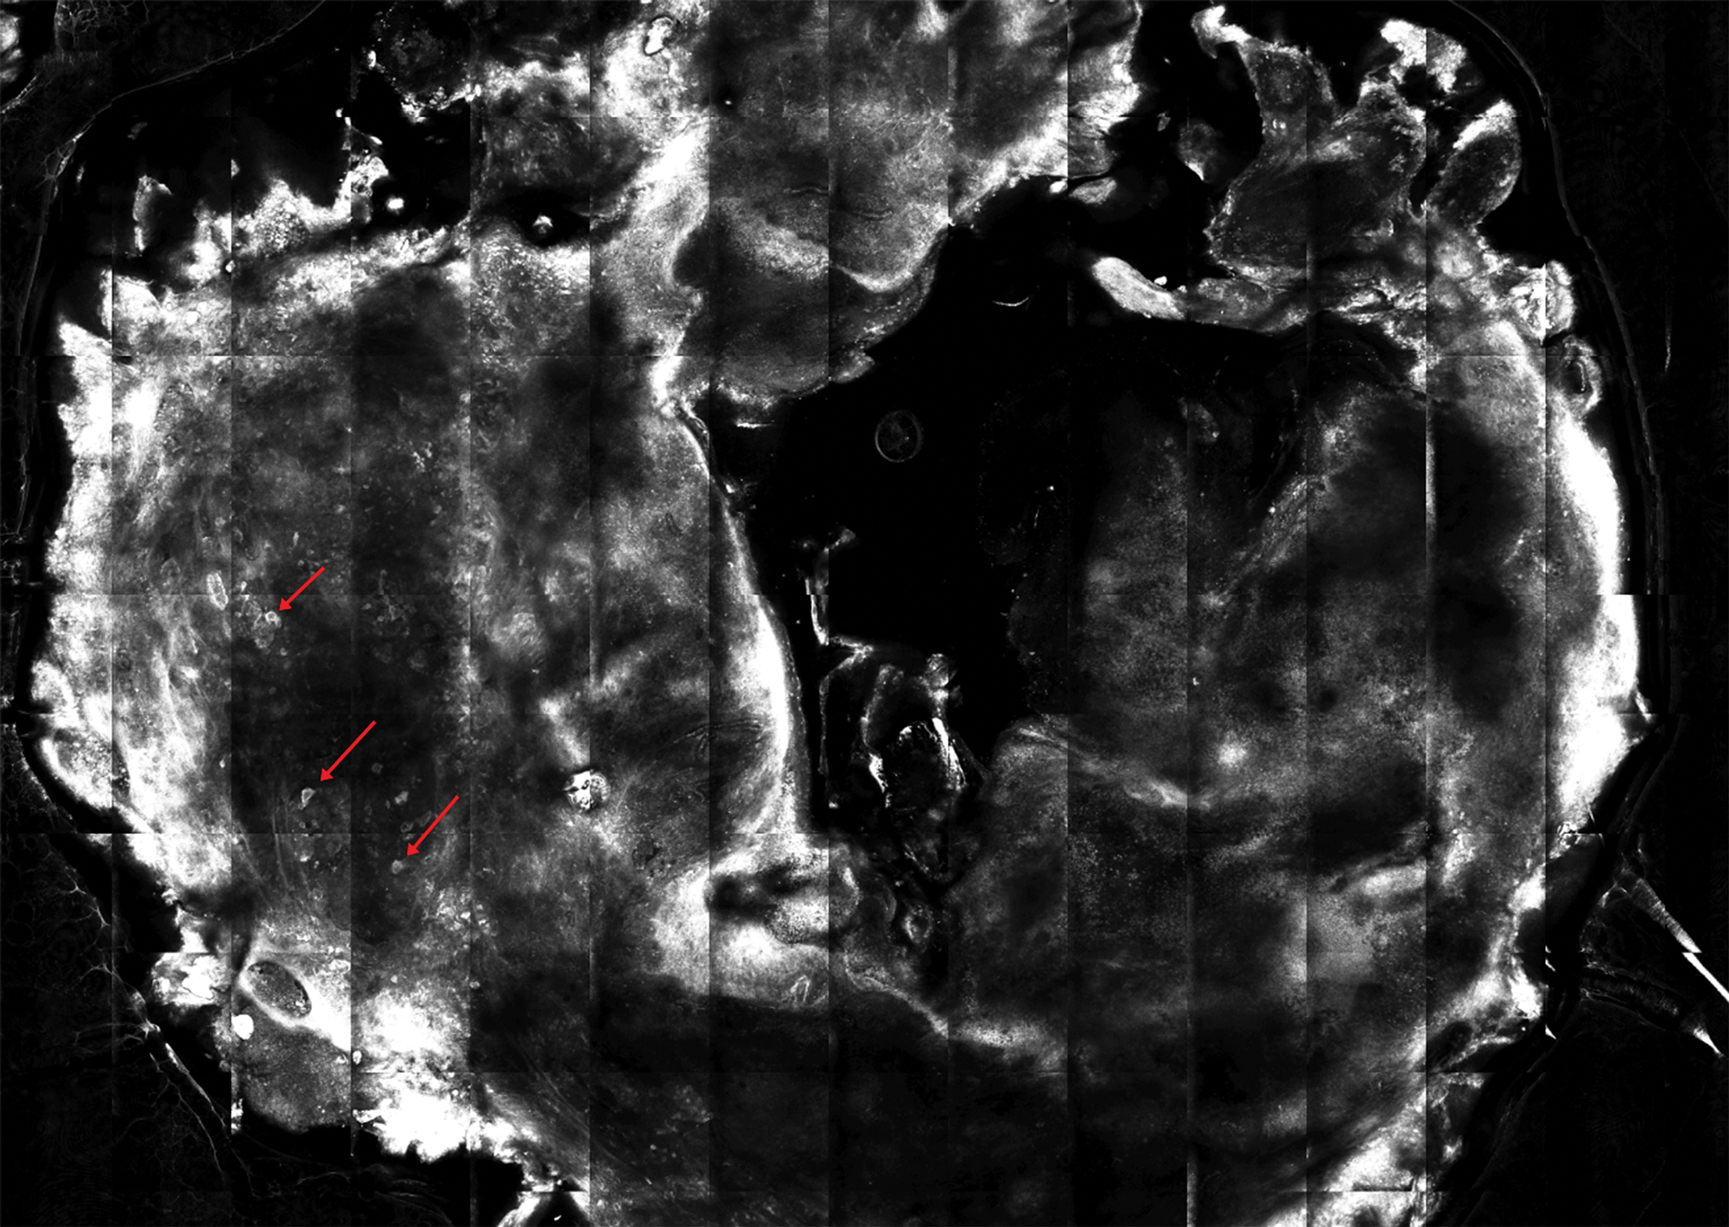
The patient was referred to a surgical oncologist for wide local excision and sentinel lymph node biopsy. Pathology showed a 4-mm-thick melanoma with numerous positive lymph nodes (Figure 4). The patient subsequently underwent a right axillary lymphadenectomy and was diagnosed with stage IIIB malignant melanoma. After surgery, the patient reported that her dog would now sniff her back and calmly rest his head in her lap.
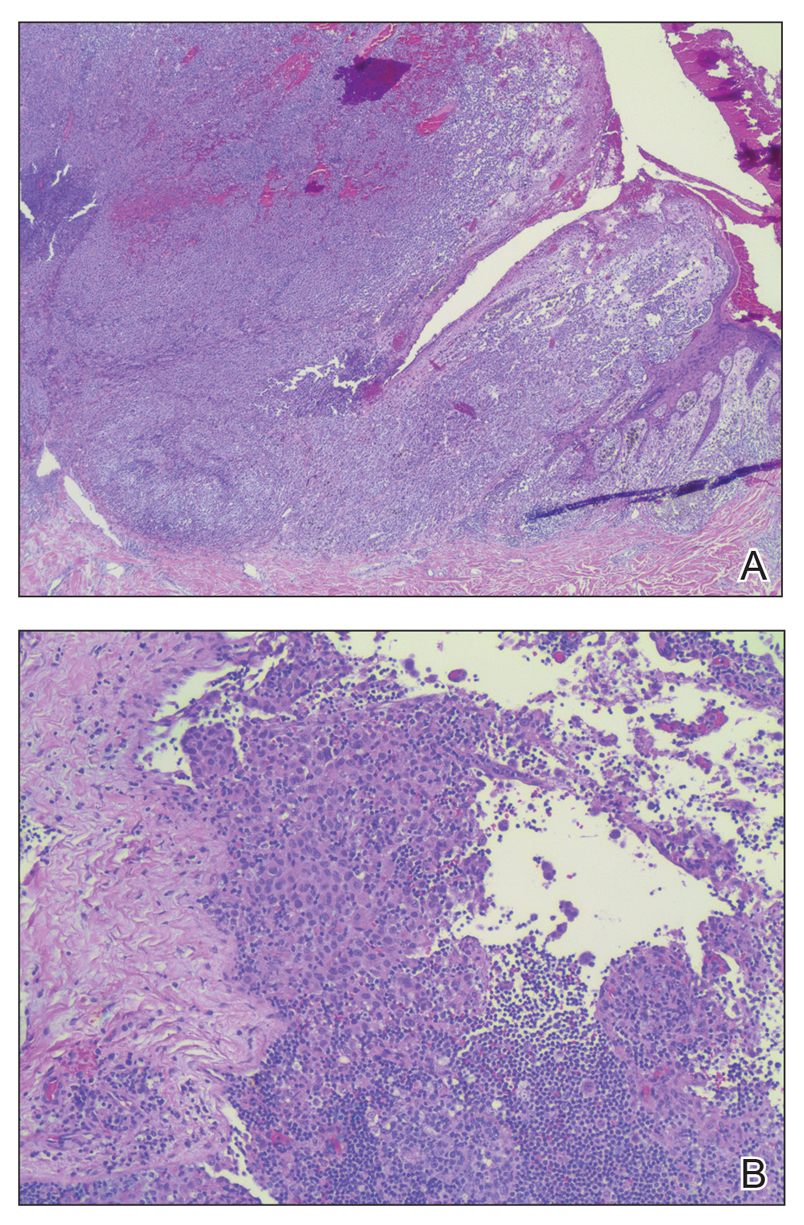
She was treated with ipilimumab but subsequently developed panhypopituitarism, so she was taken off the ipilimumab. Currently, the patient is doing well. She follows up annually for full-body skin examinations and has not had any recurrence in the last 7 years. The patient credits her dog for prompting her to see a dermatologist and saving her life.
Both anecdotal and systematic evidence have emerged on the role of canine olfaction in the detection of lung, breast, colorectal, ovarian, prostate, and skin cancers, including malignant melanoma.1-6 A 1989 case report described a woman who was prompted to seek dermatologic evaluation of a pigmented lesion because her dog consistently targeted the lesion. Excision and subsequent histopathologic examination of the lesion revealed that it was malignant melanoma.5 Another case report described a patient whose dog, which was not trained to detect cancers in humans, persistently licked a lesion behind the patient’s ear that eventually was found to be malignant melanoma.6 These reports have inspired considerable research interest regarding canine olfaction as a potential method to noninvasively screen for and even diagnose malignant melanomas in humans.
Both physiologic and pathologic metabolic processes result in the production of volatile organic compounds (VOCs), or small odorant molecules that evaporate at normal temperatures and pressures.1 Individual cells release VOCs in extremely low concentrations into the blood, urine, feces, and breath, as well as onto the skin’s surface, but there are methods for detecting these VOCs, including gas chromatography–mass spectrometry and canine olfaction.7,8 Pathologic processes, such as infection and malignancy, result in irregular protein synthesis and metabolism, producing new VOCs or differing concentrations of VOCs as compared to normal processes.1
Dimethyl disulfide and dimethyl trisulfide compounds have been identified in malignant melanoma, and these compounds are not produced by normal melanocytes.7 Furthermore, malignant melanoma produces differing quantities of these compounds as compared to normal melanocytes, including isovaleric acid, 2-methylbutyric acid, isoamyl alcohol (3-methyl-1-butanol), and 2-methyl-1-butanol, resulting in a distinct odorant profile that previously has been detected via canine olfaction.7 Canine olfaction can identify odorant molecules at up to 1 part per trillion (a magnitude more sensitive than the currently available gas chromatography–mass spectrometry technologies) and can detect the production of new VOCs or altered VOC ratios due to pathologic processes.1 Systematic studies with dogs that are trained to detect cancers in humans have shown that canine olfaction correctly identified malignant melanomas against healthy skin, benign nevi, and even basal cell carcinomas at higher rates than what would have been expected by chance alone.2,3
Canine olfaction can identify new or altered ratios of odorant VOCs associated with pathologic metabolic processes, and canines can be trained to target odor profiles associated with specific diseases.1 Canine olfaction for melanoma screening and diagnosis may seem appealing, as it provides an easily transportable, real-time, low-cost method compared to other techniques such as gas chromatography–mass spectrometry.1 Although preliminary results have shown that canine olfaction detects melanoma at higher rates than would be expected by chance alone, these findings have not approached clinical utility for the widespread use of canine olfaction as a screening method for melanoma.2,3,9 Further studies are needed to understand the role of canine olfaction in melanoma screening and diagnosis as well as to explore methods to optimize sensitivity and specificity. Until then, patients and dermatologists should not ignore the behavior of dogs toward skin lesions. Dogs may be beneficial in the detection of melanoma and help save lives, as was seen in our case.
- Angle C, Waggoner LP, Ferrando A, et al. Canine detection of the volatilome: a review of implications for pathogen and disease detection. Front Vet Sci. 2016;3:47.
- Pickel D, Mauncy GP, Walker DB, et al. Evidence for canine olfactory detection of melanoma. Applied Animal Behaviour Science. 2004;89:107-116.
- Willis CM, Britton LE, Swindells MA, et al. Invasive melanoma in vivo can be distinguished from basal cell carcinoma, benign naevi and healthy skin by canine olfaction: a proof‐of‐principle study of differential volatile organic compound emission. Br J Dermatol. 2016;175:1020-1029.
- Jezierski T, Walczak M, Ligor T, et al. Study of the art: canine olfaction used for cancer detection on the basis of breath odour. perspectives and limitations. J Breath Res. 2015;9:027001.
- Williams H, Pembroke A. Sniffer dogs in the melanoma clinic? Lancet. 1989;1:734.
- Campbell LF, Farmery L, George SM, et al. Canine olfactory detection of malignant melanoma. BMJ Case Rep. 2013. doi:10.1136/bcr-2013-008566.
- Kwak J, Gallagher M, Ozdener MH, et al. Volatile biomarkers from human melanoma cells. J Chromotogr B Analyt Technol Biomed Life Sci. 2013;931:90-96.
- D’Amico A, Bono R, Pennazza G, et al. Identification of melanoma with a gas sensor array. Skin Res Technol. 2008;14:226-236.
- Elliker KR, Williams HC. Detection of skin cancer odours using dogs: a step forward in melanoma detection training and research methodologies. Br J Dermatol. 2016;175:851-852.
To the Editor:
A 43-year-old woman presented with a mole on the central back that had been present since childhood and had changed and grown over the last few years. The patient reported that her 2-year-old rescue dog frequently sniffed the mole and would subsequently get agitated and try to scratch and bite the lesion. This behavior prompted the patient to visit a dermatologist.
She reported no personal history of melanoma or nonmelanoma skin cancer, tanning booth exposure, blistering sunburns, or use of immunosuppressant medications. Her family history was remarkable for basal cell carcinoma in her father but no family history of melanoma. Physical examination revealed a 1.2×1.5-cm brown patch along with a 1×1-cm ulcerated nodule on the lower aspect of the lesion (Figure 1). Dermoscopy showed a blue-white veil and an irregular vascular pattern (Figure 2). No cervical, axillary, or inguinal lymphadenopathy was appreciated on physical examination. Reflectance confocal microscopy showed pagetoid spread of atypical round melanocytes as well as melanocytes in the stratum corneum (Figure 3).
The patient was referred to a surgical oncologist for wide local excision and sentinel lymph node biopsy. Pathology showed a 4-mm-thick melanoma with numerous positive lymph nodes (Figure 4). The patient subsequently underwent a right axillary lymphadenectomy and was diagnosed with stage IIIB malignant melanoma. After surgery, the patient reported that her dog would now sniff her back and calmly rest his head in her lap.
She was treated with ipilimumab but subsequently developed panhypopituitarism, so she was taken off the ipilimumab. Currently, the patient is doing well. She follows up annually for full-body skin examinations and has not had any recurrence in the last 7 years. The patient credits her dog for prompting her to see a dermatologist and saving her life.
Both anecdotal and systematic evidence have emerged on the role of canine olfaction in the detection of lung, breast, colorectal, ovarian, prostate, and skin cancers, including malignant melanoma.1-6 A 1989 case report described a woman who was prompted to seek dermatologic evaluation of a pigmented lesion because her dog consistently targeted the lesion. Excision and subsequent histopathologic examination of the lesion revealed that it was malignant melanoma.5 Another case report described a patient whose dog, which was not trained to detect cancers in humans, persistently licked a lesion behind the patient’s ear that eventually was found to be malignant melanoma.6 These reports have inspired considerable research interest regarding canine olfaction as a potential method to noninvasively screen for and even diagnose malignant melanomas in humans.
Both physiologic and pathologic metabolic processes result in the production of volatile organic compounds (VOCs), or small odorant molecules that evaporate at normal temperatures and pressures.1 Individual cells release VOCs in extremely low concentrations into the blood, urine, feces, and breath, as well as onto the skin’s surface, but there are methods for detecting these VOCs, including gas chromatography–mass spectrometry and canine olfaction.7,8 Pathologic processes, such as infection and malignancy, result in irregular protein synthesis and metabolism, producing new VOCs or differing concentrations of VOCs as compared to normal processes.1
Dimethyl disulfide and dimethyl trisulfide compounds have been identified in malignant melanoma, and these compounds are not produced by normal melanocytes.7 Furthermore, malignant melanoma produces differing quantities of these compounds as compared to normal melanocytes, including isovaleric acid, 2-methylbutyric acid, isoamyl alcohol (3-methyl-1-butanol), and 2-methyl-1-butanol, resulting in a distinct odorant profile that previously has been detected via canine olfaction.7 Canine olfaction can identify odorant molecules at up to 1 part per trillion (a magnitude more sensitive than the currently available gas chromatography–mass spectrometry technologies) and can detect the production of new VOCs or altered VOC ratios due to pathologic processes.1 Systematic studies with dogs that are trained to detect cancers in humans have shown that canine olfaction correctly identified malignant melanomas against healthy skin, benign nevi, and even basal cell carcinomas at higher rates than what would have been expected by chance alone.2,3
Canine olfaction can identify new or altered ratios of odorant VOCs associated with pathologic metabolic processes, and canines can be trained to target odor profiles associated with specific diseases.1 Canine olfaction for melanoma screening and diagnosis may seem appealing, as it provides an easily transportable, real-time, low-cost method compared to other techniques such as gas chromatography–mass spectrometry.1 Although preliminary results have shown that canine olfaction detects melanoma at higher rates than would be expected by chance alone, these findings have not approached clinical utility for the widespread use of canine olfaction as a screening method for melanoma.2,3,9 Further studies are needed to understand the role of canine olfaction in melanoma screening and diagnosis as well as to explore methods to optimize sensitivity and specificity. Until then, patients and dermatologists should not ignore the behavior of dogs toward skin lesions. Dogs may be beneficial in the detection of melanoma and help save lives, as was seen in our case.
- Angle C, Waggoner LP, Ferrando A, et al. Canine detection of the volatilome: a review of implications for pathogen and disease detection. Front Vet Sci. 2016;3:47.
- Pickel D, Mauncy GP, Walker DB, et al. Evidence for canine olfactory detection of melanoma. Applied Animal Behaviour Science. 2004;89:107-116.
- Willis CM, Britton LE, Swindells MA, et al. Invasive melanoma in vivo can be distinguished from basal cell carcinoma, benign naevi and healthy skin by canine olfaction: a proof‐of‐principle study of differential volatile organic compound emission. Br J Dermatol. 2016;175:1020-1029.
- Jezierski T, Walczak M, Ligor T, et al. Study of the art: canine olfaction used for cancer detection on the basis of breath odour. perspectives and limitations. J Breath Res. 2015;9:027001.
- Williams H, Pembroke A. Sniffer dogs in the melanoma clinic? Lancet. 1989;1:734.
- Campbell LF, Farmery L, George SM, et al. Canine olfactory detection of malignant melanoma. BMJ Case Rep. 2013. doi:10.1136/bcr-2013-008566.
- Kwak J, Gallagher M, Ozdener MH, et al. Volatile biomarkers from human melanoma cells. J Chromotogr B Analyt Technol Biomed Life Sci. 2013;931:90-96.
- D’Amico A, Bono R, Pennazza G, et al. Identification of melanoma with a gas sensor array. Skin Res Technol. 2008;14:226-236.
- Elliker KR, Williams HC. Detection of skin cancer odours using dogs: a step forward in melanoma detection training and research methodologies. Br J Dermatol. 2016;175:851-852.
Practice Points
- Physiologic and pathologic processes produce volatile organic compounds in the skin and other tissues.
- Malignant melanocytes release unique volatile organic compounds (VOCs) as well as differing combinations and quantities of VOCs as compared to normal melanocytes.
- Volatile organic compounds released at the skin’s surface can be detected by various methods, including canine olfaction; therefore, unusual canine behavior toward skin lesions should not be ignored.
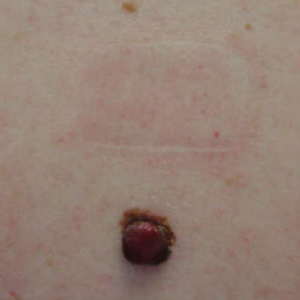
The Impact of Fellowship Training on Scholarly Productivity in Academic Dermatology
The percentage of dermatology residents pursuing fellowship training is steadily increasing. A report from the American Board of Dermatology described an increase in the percentage of residents entering fellowships approved by the American Board of Dermatology and Accreditation Council for Graduate Medical Education from 10% in 2006 to 24% in 2010.1 The American Medical Association Residency & Fellowship Database FREIDA Online showed that 30% of dermatology residents or fellows pursued further fellowship training in 2013.2 The number of dermatology fellowship positions offered also is steadily increasing. Data from SF Match showed that the number of participating applicants in Mohs micrographic surgery (MMS) fellowships increased from 64 in 2002 to 86 in 2014, and the number of programs increased from 48 to 56, respectively.3 Similarly, in pediatric dermatology the SF Match reported an increase from 14 to 22 in participating applicants and an increase in available programs from 14 to 20 in 2009 and 2012, respectively.4 Reports on dermatopathology programs also have suggested either a stable or increased percentage of residents pursuing fellowships in this specialty.5,6
There are several reported factors that influence the pursuit of dermatology fellowships. Fellows often hope to gain further exposure to a dermatology subspecialty,7 which is especially applicable to procedural dermatology, as the prevailing opinion among dermatologists is that residency training should emphasize medical dermatology much more than surgery.8,9 Increased financial compensation, responsibility to provide for a family, and increased levels of educational debt do not notably influence the desire to pursue a fellowship, though these factors often play a role in the decision to pursue a career in academia.6,10-12 Additionally, it has been reported that fellowship-trained dermatologists are more likely to teach students, residents, and fellows and are up to 8 times more likely to participate in research than non–fellowship-trained dermatologists.6,8,11 Research activity also correlates with the decision to pursue an academic career. As such, fellowship training may present physicians with opportunities to improve clinical care, garner more research opportunities, and advance in academic rank.13
Scholarly productivity, measured by contribution to research, is a heavily weighted factor when hiring and promoting within academic medicine.14-17 Despite the importance of scholarly productivity, it is difficult to accurately quantify the measure. Commonly used metrics include number of publications, number of citations, amount of National Institutes of Health funding, number of research presentations, and number of lectures.18,19 However, taken individually, none of these measures entirely represents an individual’s research contribution. For example, a physician may have a large number of relatively low-quality publications. Additionally, if considering the number of citations, one of an author’s publications may have many citations, while the remaining publications do not.
The h-index, introduced in 2005 by Hirsch,20,21 is a measure of academic productivity that takes into account both the quantity and impact of research measured by recording the number of published articles and the number of citations in peer-reviewed journals. A high h-index indicates a high number of significant publications. For example, if a physician has 10 published articles cited 10 times each, his/her h-index is 10. Another physician with an h-index of 10 may have published 50 articles, which indicates that the remaining 40 articles were cited fewer than 10 times. Prior studies on the use of the h-index in fields as diverse as otolaryngology, radiology, anesthesiology, neurosurgery, ophthalmology, and urology indicate a strong association between the h-index and academic rank.22-28 Other studies indicate that fellowship-trained individuals tend to have a higher h-index than their non–fellowship-trained counterparts.29,30 One study demonstrated that fellowship-trained dermatologic surgeons had significantly increased academic productivity (P=.001), as measured by the number of publications in PubMed, compared to non–fellowship-trained dermatologic surgeons.11
The goal of this study was to determine whether dermatology fellowship training impacts scholarly productivity and academic promotion. Additionally, the scholarly productivity of procedural dermatology/MMS, dermatopathology, and pediatric dermatology fellows is compared to determine if type of subspecialty affects research productivity.
Methods
A list of academic dermatology departments was accessed using FREIDA Online. Individual departmental websites were visited to compile a list of academic faculty members. Additional recorded data included academic rank, gender, and fellowship training. Academic rank was classified as assistant professor, associate professor, professor, and chair. Physicians listed as chairs were not listed as professors to avoid duplication of these individuals. Voluntary, nonclinical, and nonacademic faculty members were excluded from the analysis. Departments that did not list the academic rank of faculty members also were excluded. Faculty members were organized by fellowship type: procedural dermatology/MMS, dermatopathology, pediatric dermatology, other fellowship, and no fellowship. Individuals with multiple fellowships were counted in multiple categories.
Faculty members were subsequently searched on the Scopus database to determine the h-index and publication range in years. Correct author identity was ensured by confirming correct departmental affiliations and publications related to dermatology. (Results collected from the Scopus database have been shown to correlate well with those ofISI Web of Knowledge.23)
Kruskal-Wallis tests were used to compare continuous variables, and the Pearson χ2 test was used to compare categorical variables. Statistical significance was set at P<.05. All statistical analyses were performed using SAS software. This study qualified as nonhuman subject research per the institutional review board of Rutgers New Jersey Medical School (Newark, New Jersey).
Results
The analysis included 1043 faculty members from 103 academic departments. There were 144 dermatologists (13.8%) with procedural dermatology/MMS fellowships, 162 (15.5%) with dermatopathology fellowships, 71 (6.8%) with pediatric dermatology fellowships, 124 (11.9%) with other fellowships, and 542 (52.0%) with no fellowships (Figure 1). Fellowships classified as other included immunodermatology, dermatology-rheumatology, clinical education, dermatoepidemiology, cutaneous oncology, dermatopharmacology, and photobiology. Fellowship-trained dermatologists had a higher mean h-index than dermatologists without fellowships (13.2 vs 11.7; P<.001)(Figure 2).
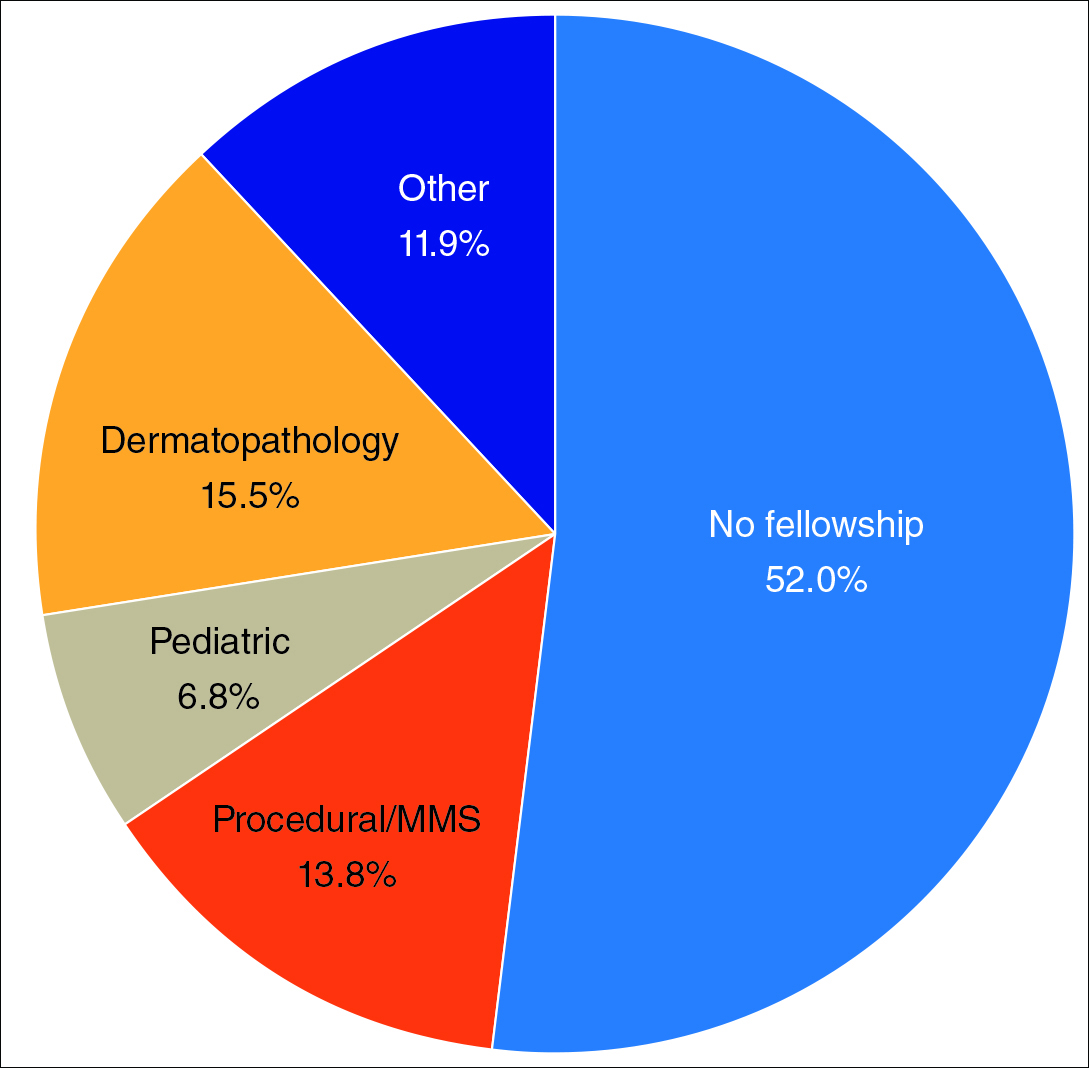
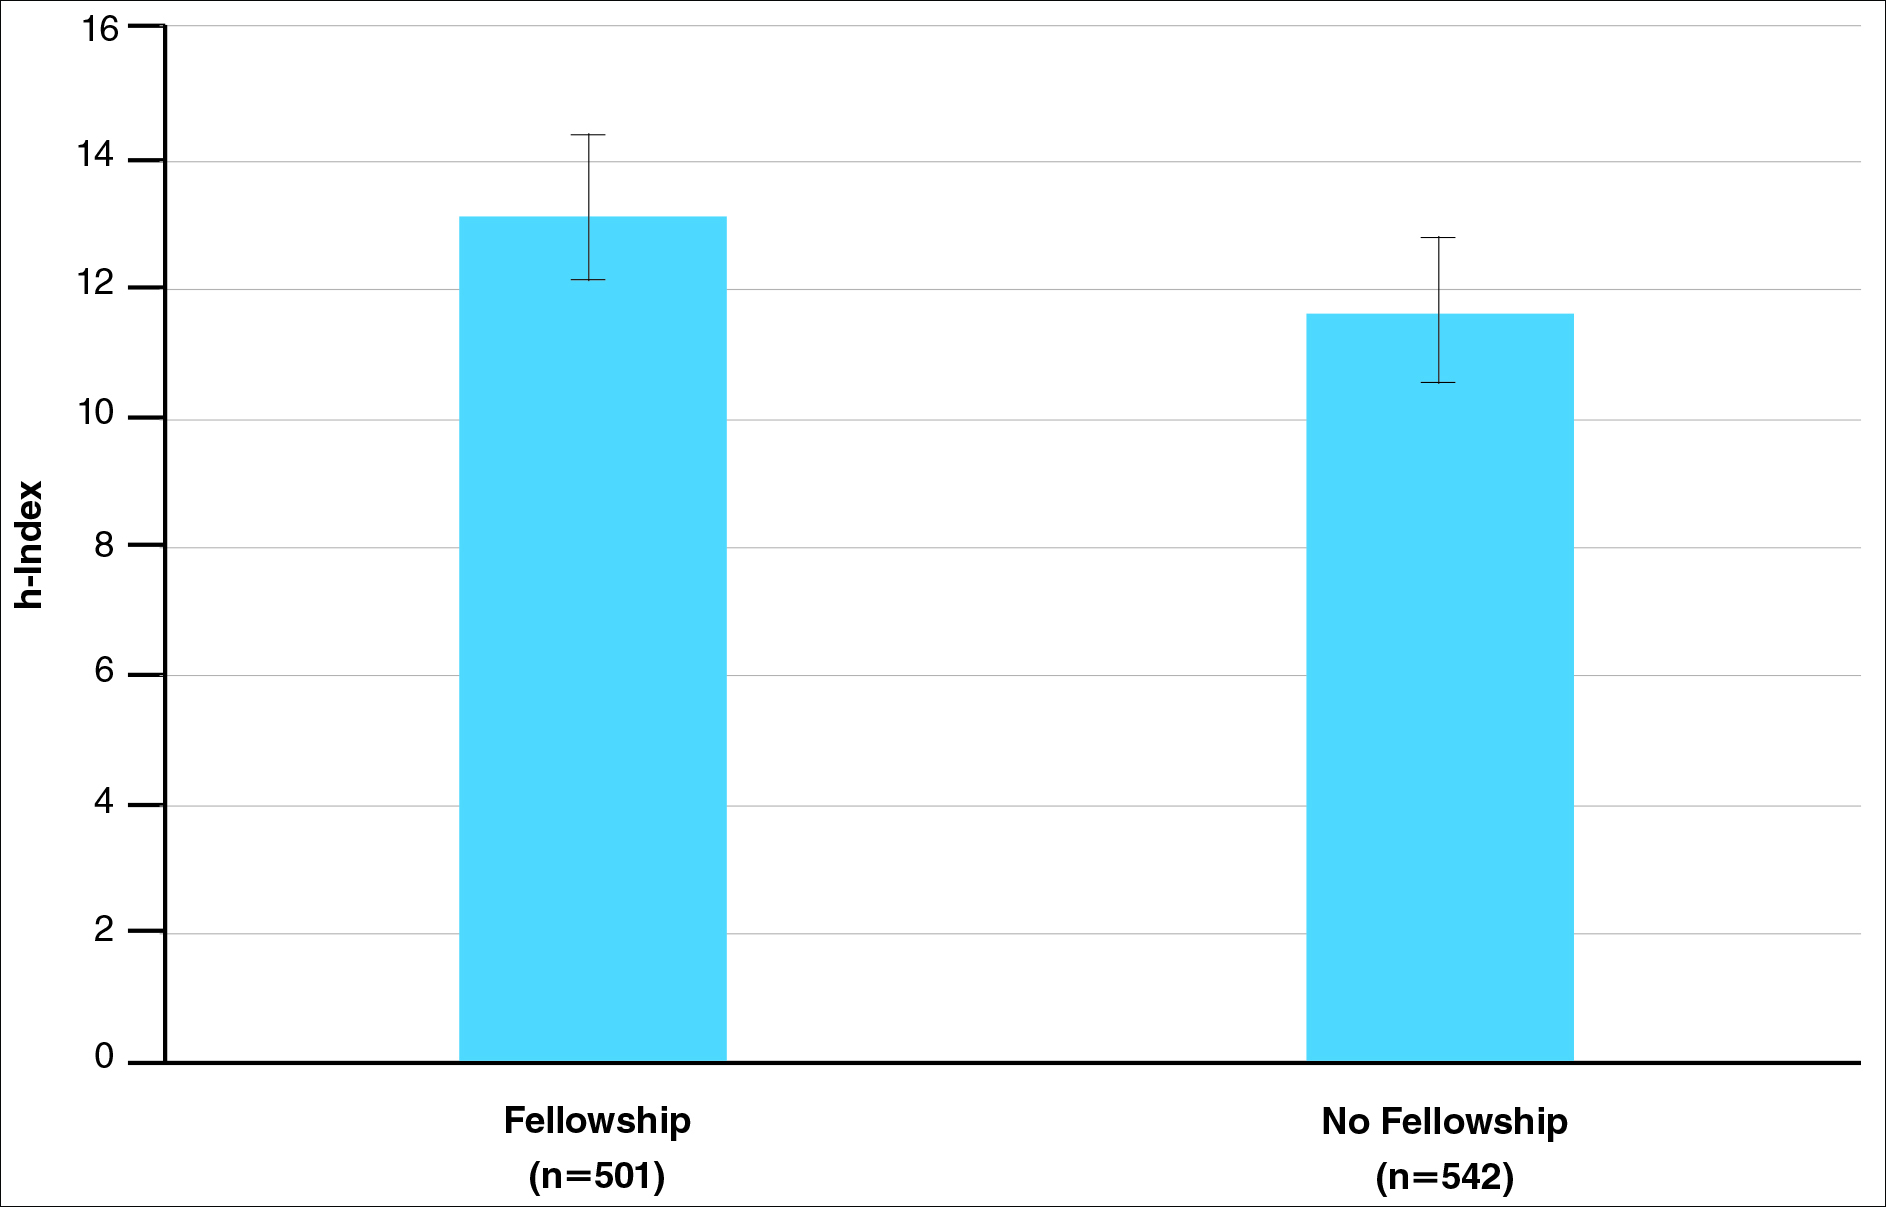
There were significant statistical differences among the fellowships examined (Kruskal-Wallis analysis of variance, P<.05). Academic dermatologists who completed dermatopathology or other fellowships had higher scholarly productivity than those who completed pediatric dermatology and procedural dermatology/MMS fellowships (P<.05)(Figure 3). Those who did not complete a fellowship had a higher mean h-index than those who completed pediatric dermatology and procedural dermatology/MMS fellowships; however, the difference was not statistically significant.
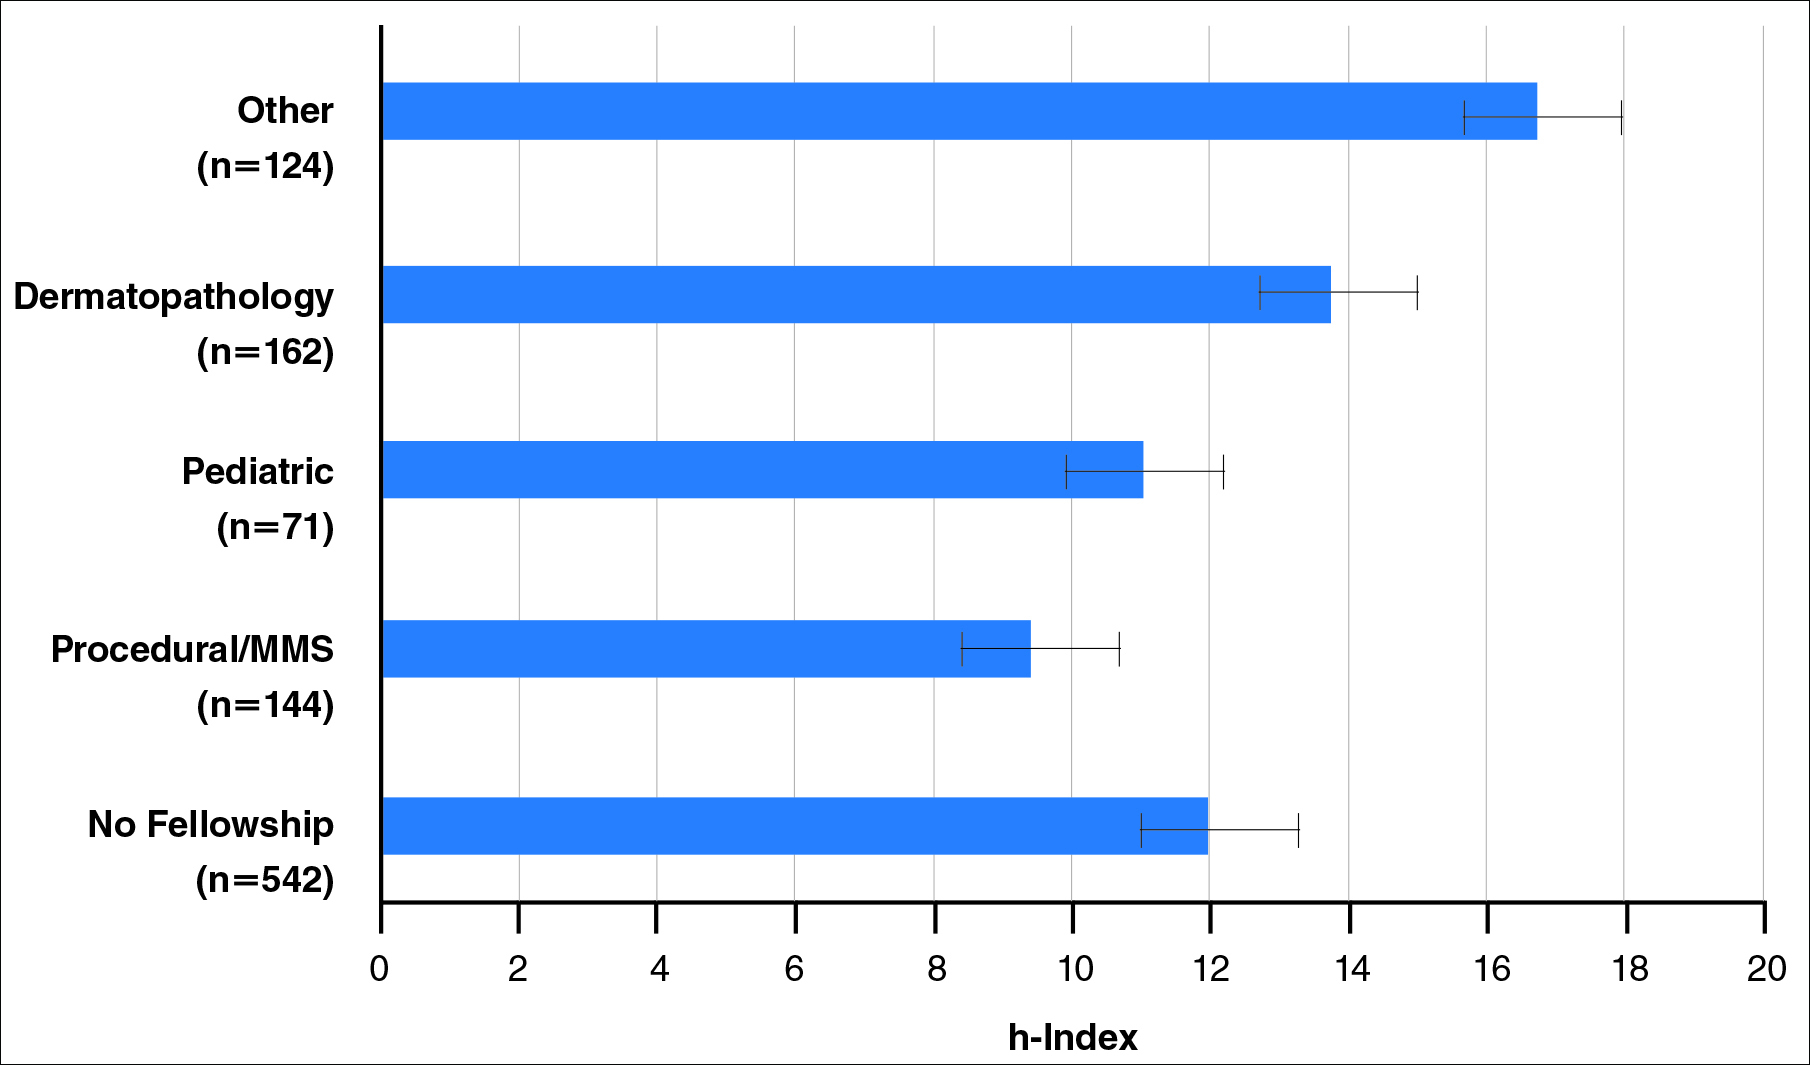
Regarding academic rank, there was a significant increase in scholarly productivity (as measured by the h-index) from assistant professor to professor (P<.05). There was no statistical difference in scholarly productivity between professors and chairs. When controlling for academic rank, there were no statistically significant differences in h-index between fellowship-trained versus non–fellowship-trained dermatologists, except at the level of associate professor. However, fellowship-trained dermatologists consistently had a higher mean h-index compared to non–fellowship-trained dermatologists in each rank (Figure 4). Fellowship-trained dermatologists made up 48.2% (222/461) of assistant professors, 45.2% (103/228) of associate professors, 47.3% (125/264) of professors, and 56.7% (51/90) of chairs.
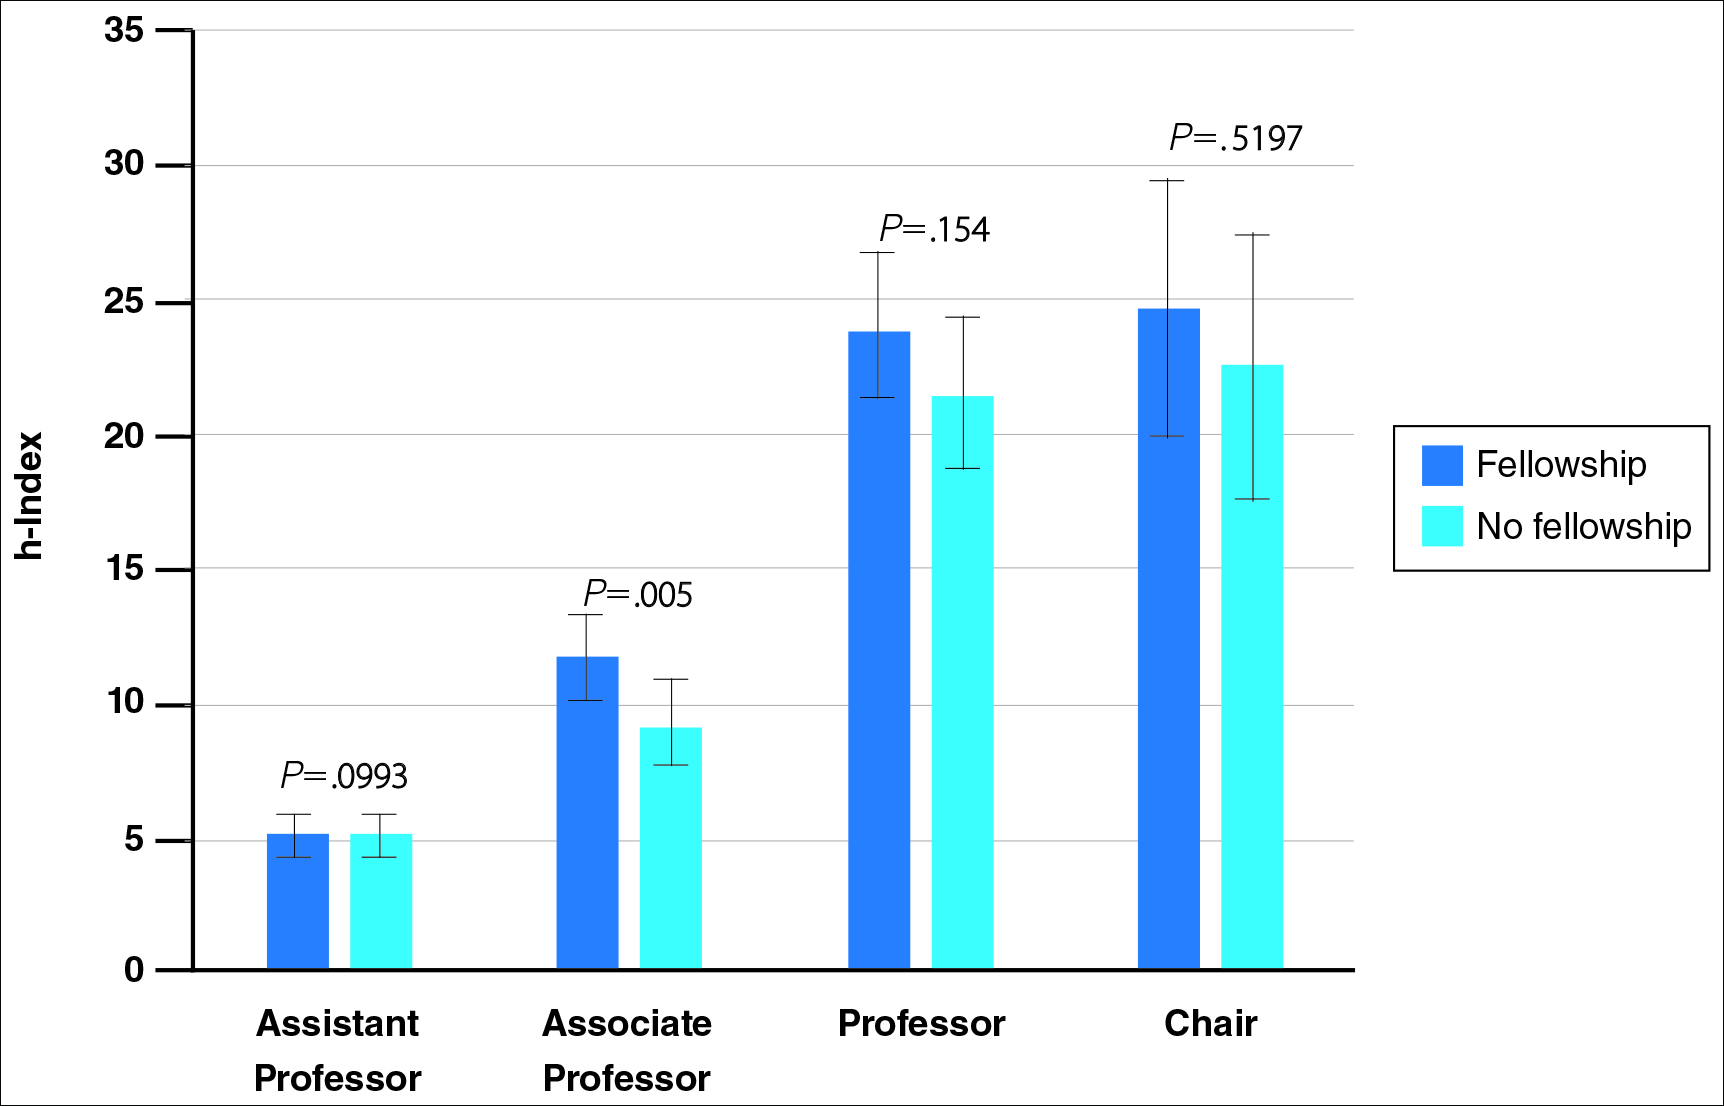
When controlling for the number of active publication years, no statistically significant differences were found between scholarly productivity in fellowship-trained versus non–fellowship-trained dermatologists. However, fellowship-trained academic dermatologists consistently had a higher mean h-index than non–fellowship-trained dermatologists within each 10-year range, except for the 31- to 40-year range (Figure 5).
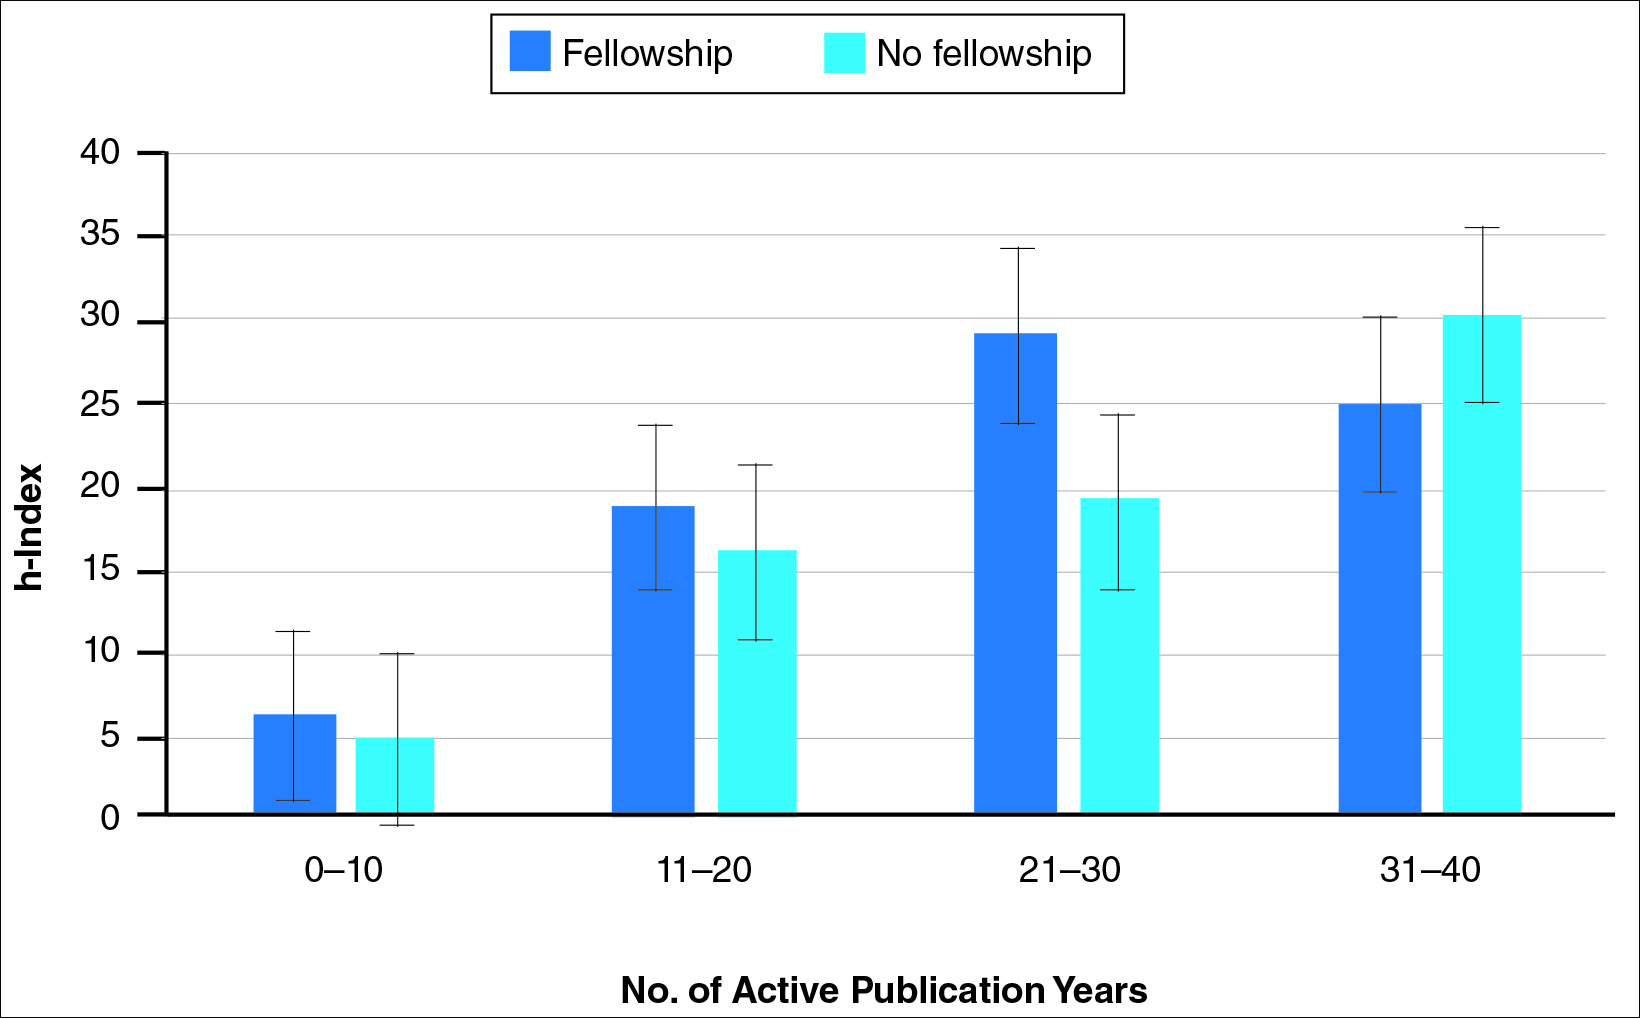
Comment
The proportion of dermatology residents who pursue fellowship training has been steadily increasing, according to data from the American Medical Association and American Board of Dermatology.1,2 Fellowship training allows graduating residents to have greater exposure to a dermatology subspecialty and often provides a narrower focus for future clinical activities. In our study, we found that fellowship-trained dermatologists had significantly higher research productivity, as measured by the h-index, than academic dermatologists without fellowship, which is likely because fellowship training offers an opportunity to hone teaching skills and pursue more research activity.13 For instance, several fellowship programs allow focused research time during training.11 Additionally, residents pursuing fellowships may be more likely to engage in research activities.
Greater scholarly productivity is especially important for academic physicians, as it plays an important role in hiring and promoting.14,15,19,31 Additionally, increased research productivity has been found to be associated with improved teaching and clinical activity.19 Research productivity of faculty members also influences the reputation and prestige of the department and the institution’s subsequent ability to attract higher-quality residents and faculty members.28
There were significant differences in mean h-index between dermatology subspecialties. Academic dermatologists who completed procedural dermatology/MMS fellowships had the lowest mean h-index, while those who completed dermatopathology or other fellowships had the highest mean h-index. These findings suggest that an emphasis on research productivity may be greater in dermatopathology. Additionally, dermatologists who completed other fellowships, such as immunodermatology or dermatopharmacology, may have received such fellowships prior to dermatology training. It would be interesting to determine the amount of time allocated for research within each subspecialty fellowship training.
A greater amount of clinical responsibility also may influence the difference in measures of scholarly productivity within each subspecialty. For instance, there is a known shortage of pediatric dermatologists,32 which may translate as a decreased amount of time that can be dedicated to research activity because of higher clinical volume per physician. Dermatologists with no fellowship had a higher mean h-index than those with pediatric and procedural dermatology/MMS fellowships, which may reflect the smaller number of subspecialists compared to non–fellowship-trained dermatologists (13.8% procedural dermatology/MMS; 6.8% pediatric dermatology; 52.0% no fellowship). As such, the research of subspecialists is targeted to a narrower audience and will garner fewer citations than non–fellowship-trained dermatologists. However, the lower number of subspecialists is not the only factor impacting scholarly productivity, as dermato-pathologists had higher scholarly impact than non–fellowship-trained individuals despite comprising only 15.5% of the cohort.
In corroboration with prior studies of academic medicine, the h-index increased with increasing rank from assistant professor to professor and chair.29,30,33 This increase confirms that research productivity is associated with academic rank. When stratifying the 2 cohorts of fellowship-trained and non–fellowship-trained academic dermatologists by academic rank, there was no significant difference in the h-index for both groups at each rank, except for associate professor. In addition, there was a relatively equal distribution within each rank of fellowship-trained and non–fellowship-trained individuals. This lack of statistical difference also was demonstrated when stratifying for years of active publication experience. Academic dermatologists have been shown to be more interested in pursuing research activity, and research is pivotal to pursuing a dermatology residency.11 Future studies may extend the comparison of scholarly productivity to nonacademic dermatologists.
It is important to acknowledge certain limitations in the data collection process and use of the h-index. Many of the dermatology department websites do not provide information about whether individual faculty members are pursuing a tenure track or nontenure track. This distinction may have bearing on the h-index, as research is more heavily emphasized in the tenure track. Moreover, the h-index does not take into account the type of research (ie, clinical vs basic science research). Therefore, while basic science research often is more time intensive than clinical research, a publication is weighed solely by its number of citations. As such, the h-index may not capture the true amount of time dedicated to research activities. In addition, the h-index cannot account for self-citation, which may increase this measure.34 However, to greatly influence the h-index, many self-citations of each work would be necessary, making it less concerning. Another limitation of this study is that it does not take into account time dedicated to the education of residents and medical students, an act that is necessary for preservation of the field. Although education portfolios that detail an individual’s contribution to teaching are starting to become more popular, there currently is no measure for educational activities.18,35 Finally, dermatology department websites are not frequently updated; as such, data gathered from websites regarding academic rank may not always be recent.
Conclusion
Scholarly productivity, as measured by the h-index, is a major contributory factor to hiring, promoting, and developing reputations in academic medicine. Our findings demonstrate that there is greater scholarly productivity among fellowship-trained dermatologists compared to non–fellowship-trained dermatologists. However, when controlling for academic rank and publication range, this difference is minimized. As such, fellowships may provide more opportunity for structured research experiences but may not be necessary for successful academic careers. In addition, individuals who wish to dedicate a substantial portion of time to research may find that fellowships in dermatopathology, immunodermatology, dermatology-rheumatology, clinical education, dermatoepidemiology, cutaneous oncology, dermatopharmacology, and photobiology are more conducive to performing research. We also recommend that other activities, including clinical and teaching activities, serve as supplemental measures to scholarly productivity when evaluating a physician’s contribution.
- Trends in postgraduate fellowships. American Board of Dermatology website. https://www.abderm.org/media/42577/prog-dir-ite_newsletter_july_2011.pdf. Accessed February 3, 2016.
- American Medical Association. FREIDA Online. https://freida.ama-assn.org/Freida/user/specStatistics Search.do?method=viewGraduates&pageNumber=3&spcCd=080. Accessed February 3, 2016.
- Micrographic surgery and dermatologic oncology fellowship. SF Match website. https://www.sfmatch.org/SpecialtyInsideAll.aspx?id=10&typ=1&name=Micrographic%20Surgery%20and%20Dermatologic%20Oncology#. Accessed February 3, 2016.
- Pediatric dermatology fellowship. SF Match website. https://www.sfmatch.org/SpecialtyInsideAll.aspx?id=16&typ=1&name=Pediatric%20Dermatology#. Accessed February 3, 2016.
- Javorsky E, Kostecki J, Kimball AB. The relative popularity of nonprocedural dermatology fellowships. J Am Acad Dermatol. 2012;66:693-694.
- Suwattee P, Cham PM, Abdollahi M, et al. Dermatopathology workforce in the United States: a survey. J Am Acad Dermatol. 2011;65:1180-1185.
- Park KK. Fellowships after dermatology residency: the traditional and beyond. Cutis. 2015;95:E31-E34.
- Tierney EP, Hanke CW, Kimball AB. Recent changes in the workforce and practice of dermatologic surgery. Dermatol Surg. 2009;35:413-419.
- Wu JJ, Markus RF, Orengo IF. The increased competitiveness of Mohs micrographic surgery training. Dermatol Online J. 2002;8:24.
- Salter SA, Kimball AB. Rising educational debt levels in recent dermatology trainees and effects on career choices. J Am Acad Dermatol. 2006;54:329-331.
- Tierney EP, Hanke CW, Kimball AB. Academic productivity and affiliation of dermatologic surgeons. Dermatol Surg. 2009;35:1886-1892.
- Nguyen JC, Jacobson CC, Rehmus W, et al. Workforce characteristics of Mohs surgery fellows. Dermatol Surg. 2004;30(2, pt 1):136-138.
- Goldenberg G, Patel MJ, Sangueza OP, et al. US dermatopathology fellows career survey: 2004-2005. J Cutan Pathol. 2007;34:487-489.
- Atasoylu AA, Wright SM, Beasley BW, et al. Promotion criteria for clinician-educators. J Gen Intern Med. 2003;18:711-716.
- Beasley BW, Wright SM, Cofrancesco J Jr, et al. Promotion criteria for clinician-educators in the United States and Canada. a survey of promotion committee chairpersons. JAMA. 1997;278:723-728.
- Dixon AK. Publishing and academic promotion. Singapore Med J. 2009;50:847-850.
- Todisco A, Souza RF, Gores GJ. Trains, tracks, and promotion in an academic medical center. Gastroenterology. 2011;141:1545-1548.
- Baldwin C, Chandran L, Gusic M. Guidelines for evaluating the educational performance of medical school faculty: priming a national conversation. Teach Learn Med. 2011;23:285-297.
- Akl EA, Meerpohl JJ, Raad D, et al. Effects of assessing the productivity of faculty in academic medical centres: a systematic review. CMAJ. 2012;184:E602-E612.
- Hirsch JE. An index to quantify an individual’s scientific research output. Proc Natl Acad Sci U S A. 2005;102:16569-16572.
- Hirsch JE. Does the h-index have predictive power? Proc Natl Acad Sci U S A. 2007;104:19193-19198.
- Benway BM, Kalidas P, Cabello JM, et al. Does citation analysis reveal association between h-index and academic rank in urology? Urology. 2009;74:30-33.
- Lee J, Kraus KL, Couldwell WT. Use of the h-index in neurosurgery. clinical article. J Neurosurg. 2009;111:387-392.
- Kasabwala K, Morton CM, Svider PF, et al. Factors influencing scholarly impact: does urology fellowship training affect research output? J Surg Educ. 2014;71:345-352.
- Pagel PS, Hudetz JA. H-index is a sensitive indicator of academic activity in highly productive anaesthesiologists: results of a bibliometric analysis. Acta Anaesthesiol Scand. 2011;55:1085-1089.
- Rad AE, Brinjikji W, Cloft HJ, et al. The h-index in academic radiology. Acad Radiol. 2010;17:817-821.
- Svider PF, Choudhry ZA, Choudhry OJ, et al. The use of the h-index in academic otolaryngology. Laryngoscope. 2013;123:103-106.
- Svider PF, Lopez SA, Husain Q, et al. The association between scholarly impact and National Institutes of Health funding in ophthalmology. Ophthalmology. 2014;121:423-428.
- Eloy JA, Svider PF, Mauro KM, et al. Impact of fellowship training on research productivity in academic otolaryngology. Laryngoscope. 2012;122:2690-2694.
- Huang G, Fang CH, Lopez SA, et al. Impact of fellowship training on research productivity in academic ophthalmology. J Surg Educ. 2015;72:410-417.
- Ball P. Achievement index climbs the ranks. Nature. 2007;448:737.
- Dinulos JG. Pediatric dermatology: past, present and future. Curr Opin Pediatr. 2007;19:417-419.
- Agarwal N, Clark S, Svider PF, et al. Impact of fellowship training on research productivity in academic neurological surgery. World Neurosurg. 2013;80:738-744.
- Engqvist L, Frommen JG. The h-index and self-citations. Trends Ecol Evol. 2008;23:250-252.
- Lamki N, Marchand M. The medical educator teaching portfolio: its compilation and potential utility. Sultan Qaboos Univ Med J. 2006;6:7-12.
The percentage of dermatology residents pursuing fellowship training is steadily increasing. A report from the American Board of Dermatology described an increase in the percentage of residents entering fellowships approved by the American Board of Dermatology and Accreditation Council for Graduate Medical Education from 10% in 2006 to 24% in 2010.1 The American Medical Association Residency & Fellowship Database FREIDA Online showed that 30% of dermatology residents or fellows pursued further fellowship training in 2013.2 The number of dermatology fellowship positions offered also is steadily increasing. Data from SF Match showed that the number of participating applicants in Mohs micrographic surgery (MMS) fellowships increased from 64 in 2002 to 86 in 2014, and the number of programs increased from 48 to 56, respectively.3 Similarly, in pediatric dermatology the SF Match reported an increase from 14 to 22 in participating applicants and an increase in available programs from 14 to 20 in 2009 and 2012, respectively.4 Reports on dermatopathology programs also have suggested either a stable or increased percentage of residents pursuing fellowships in this specialty.5,6
There are several reported factors that influence the pursuit of dermatology fellowships. Fellows often hope to gain further exposure to a dermatology subspecialty,7 which is especially applicable to procedural dermatology, as the prevailing opinion among dermatologists is that residency training should emphasize medical dermatology much more than surgery.8,9 Increased financial compensation, responsibility to provide for a family, and increased levels of educational debt do not notably influence the desire to pursue a fellowship, though these factors often play a role in the decision to pursue a career in academia.6,10-12 Additionally, it has been reported that fellowship-trained dermatologists are more likely to teach students, residents, and fellows and are up to 8 times more likely to participate in research than non–fellowship-trained dermatologists.6,8,11 Research activity also correlates with the decision to pursue an academic career. As such, fellowship training may present physicians with opportunities to improve clinical care, garner more research opportunities, and advance in academic rank.13
Scholarly productivity, measured by contribution to research, is a heavily weighted factor when hiring and promoting within academic medicine.14-17 Despite the importance of scholarly productivity, it is difficult to accurately quantify the measure. Commonly used metrics include number of publications, number of citations, amount of National Institutes of Health funding, number of research presentations, and number of lectures.18,19 However, taken individually, none of these measures entirely represents an individual’s research contribution. For example, a physician may have a large number of relatively low-quality publications. Additionally, if considering the number of citations, one of an author’s publications may have many citations, while the remaining publications do not.
The h-index, introduced in 2005 by Hirsch,20,21 is a measure of academic productivity that takes into account both the quantity and impact of research measured by recording the number of published articles and the number of citations in peer-reviewed journals. A high h-index indicates a high number of significant publications. For example, if a physician has 10 published articles cited 10 times each, his/her h-index is 10. Another physician with an h-index of 10 may have published 50 articles, which indicates that the remaining 40 articles were cited fewer than 10 times. Prior studies on the use of the h-index in fields as diverse as otolaryngology, radiology, anesthesiology, neurosurgery, ophthalmology, and urology indicate a strong association between the h-index and academic rank.22-28 Other studies indicate that fellowship-trained individuals tend to have a higher h-index than their non–fellowship-trained counterparts.29,30 One study demonstrated that fellowship-trained dermatologic surgeons had significantly increased academic productivity (P=.001), as measured by the number of publications in PubMed, compared to non–fellowship-trained dermatologic surgeons.11
The goal of this study was to determine whether dermatology fellowship training impacts scholarly productivity and academic promotion. Additionally, the scholarly productivity of procedural dermatology/MMS, dermatopathology, and pediatric dermatology fellows is compared to determine if type of subspecialty affects research productivity.
Methods
A list of academic dermatology departments was accessed using FREIDA Online. Individual departmental websites were visited to compile a list of academic faculty members. Additional recorded data included academic rank, gender, and fellowship training. Academic rank was classified as assistant professor, associate professor, professor, and chair. Physicians listed as chairs were not listed as professors to avoid duplication of these individuals. Voluntary, nonclinical, and nonacademic faculty members were excluded from the analysis. Departments that did not list the academic rank of faculty members also were excluded. Faculty members were organized by fellowship type: procedural dermatology/MMS, dermatopathology, pediatric dermatology, other fellowship, and no fellowship. Individuals with multiple fellowships were counted in multiple categories.
Faculty members were subsequently searched on the Scopus database to determine the h-index and publication range in years. Correct author identity was ensured by confirming correct departmental affiliations and publications related to dermatology. (Results collected from the Scopus database have been shown to correlate well with those ofISI Web of Knowledge.23)
Kruskal-Wallis tests were used to compare continuous variables, and the Pearson χ2 test was used to compare categorical variables. Statistical significance was set at P<.05. All statistical analyses were performed using SAS software. This study qualified as nonhuman subject research per the institutional review board of Rutgers New Jersey Medical School (Newark, New Jersey).
Results
The analysis included 1043 faculty members from 103 academic departments. There were 144 dermatologists (13.8%) with procedural dermatology/MMS fellowships, 162 (15.5%) with dermatopathology fellowships, 71 (6.8%) with pediatric dermatology fellowships, 124 (11.9%) with other fellowships, and 542 (52.0%) with no fellowships (Figure 1). Fellowships classified as other included immunodermatology, dermatology-rheumatology, clinical education, dermatoepidemiology, cutaneous oncology, dermatopharmacology, and photobiology. Fellowship-trained dermatologists had a higher mean h-index than dermatologists without fellowships (13.2 vs 11.7; P<.001)(Figure 2).
There were significant statistical differences among the fellowships examined (Kruskal-Wallis analysis of variance, P<.05). Academic dermatologists who completed dermatopathology or other fellowships had higher scholarly productivity than those who completed pediatric dermatology and procedural dermatology/MMS fellowships (P<.05)(Figure 3). Those who did not complete a fellowship had a higher mean h-index than those who completed pediatric dermatology and procedural dermatology/MMS fellowships; however, the difference was not statistically significant.
Regarding academic rank, there was a significant increase in scholarly productivity (as measured by the h-index) from assistant professor to professor (P<.05). There was no statistical difference in scholarly productivity between professors and chairs. When controlling for academic rank, there were no statistically significant differences in h-index between fellowship-trained versus non–fellowship-trained dermatologists, except at the level of associate professor. However, fellowship-trained dermatologists consistently had a higher mean h-index compared to non–fellowship-trained dermatologists in each rank (Figure 4). Fellowship-trained dermatologists made up 48.2% (222/461) of assistant professors, 45.2% (103/228) of associate professors, 47.3% (125/264) of professors, and 56.7% (51/90) of chairs.
When controlling for the number of active publication years, no statistically significant differences were found between scholarly productivity in fellowship-trained versus non–fellowship-trained dermatologists. However, fellowship-trained academic dermatologists consistently had a higher mean h-index than non–fellowship-trained dermatologists within each 10-year range, except for the 31- to 40-year range (Figure 5).
Comment
The proportion of dermatology residents who pursue fellowship training has been steadily increasing, according to data from the American Medical Association and American Board of Dermatology.1,2 Fellowship training allows graduating residents to have greater exposure to a dermatology subspecialty and often provides a narrower focus for future clinical activities. In our study, we found that fellowship-trained dermatologists had significantly higher research productivity, as measured by the h-index, than academic dermatologists without fellowship, which is likely because fellowship training offers an opportunity to hone teaching skills and pursue more research activity.13 For instance, several fellowship programs allow focused research time during training.11 Additionally, residents pursuing fellowships may be more likely to engage in research activities.
Greater scholarly productivity is especially important for academic physicians, as it plays an important role in hiring and promoting.14,15,19,31 Additionally, increased research productivity has been found to be associated with improved teaching and clinical activity.19 Research productivity of faculty members also influences the reputation and prestige of the department and the institution’s subsequent ability to attract higher-quality residents and faculty members.28
There were significant differences in mean h-index between dermatology subspecialties. Academic dermatologists who completed procedural dermatology/MMS fellowships had the lowest mean h-index, while those who completed dermatopathology or other fellowships had the highest mean h-index. These findings suggest that an emphasis on research productivity may be greater in dermatopathology. Additionally, dermatologists who completed other fellowships, such as immunodermatology or dermatopharmacology, may have received such fellowships prior to dermatology training. It would be interesting to determine the amount of time allocated for research within each subspecialty fellowship training.
A greater amount of clinical responsibility also may influence the difference in measures of scholarly productivity within each subspecialty. For instance, there is a known shortage of pediatric dermatologists,32 which may translate as a decreased amount of time that can be dedicated to research activity because of higher clinical volume per physician. Dermatologists with no fellowship had a higher mean h-index than those with pediatric and procedural dermatology/MMS fellowships, which may reflect the smaller number of subspecialists compared to non–fellowship-trained dermatologists (13.8% procedural dermatology/MMS; 6.8% pediatric dermatology; 52.0% no fellowship). As such, the research of subspecialists is targeted to a narrower audience and will garner fewer citations than non–fellowship-trained dermatologists. However, the lower number of subspecialists is not the only factor impacting scholarly productivity, as dermato-pathologists had higher scholarly impact than non–fellowship-trained individuals despite comprising only 15.5% of the cohort.
In corroboration with prior studies of academic medicine, the h-index increased with increasing rank from assistant professor to professor and chair.29,30,33 This increase confirms that research productivity is associated with academic rank. When stratifying the 2 cohorts of fellowship-trained and non–fellowship-trained academic dermatologists by academic rank, there was no significant difference in the h-index for both groups at each rank, except for associate professor. In addition, there was a relatively equal distribution within each rank of fellowship-trained and non–fellowship-trained individuals. This lack of statistical difference also was demonstrated when stratifying for years of active publication experience. Academic dermatologists have been shown to be more interested in pursuing research activity, and research is pivotal to pursuing a dermatology residency.11 Future studies may extend the comparison of scholarly productivity to nonacademic dermatologists.
It is important to acknowledge certain limitations in the data collection process and use of the h-index. Many of the dermatology department websites do not provide information about whether individual faculty members are pursuing a tenure track or nontenure track. This distinction may have bearing on the h-index, as research is more heavily emphasized in the tenure track. Moreover, the h-index does not take into account the type of research (ie, clinical vs basic science research). Therefore, while basic science research often is more time intensive than clinical research, a publication is weighed solely by its number of citations. As such, the h-index may not capture the true amount of time dedicated to research activities. In addition, the h-index cannot account for self-citation, which may increase this measure.34 However, to greatly influence the h-index, many self-citations of each work would be necessary, making it less concerning. Another limitation of this study is that it does not take into account time dedicated to the education of residents and medical students, an act that is necessary for preservation of the field. Although education portfolios that detail an individual’s contribution to teaching are starting to become more popular, there currently is no measure for educational activities.18,35 Finally, dermatology department websites are not frequently updated; as such, data gathered from websites regarding academic rank may not always be recent.
Conclusion
Scholarly productivity, as measured by the h-index, is a major contributory factor to hiring, promoting, and developing reputations in academic medicine. Our findings demonstrate that there is greater scholarly productivity among fellowship-trained dermatologists compared to non–fellowship-trained dermatologists. However, when controlling for academic rank and publication range, this difference is minimized. As such, fellowships may provide more opportunity for structured research experiences but may not be necessary for successful academic careers. In addition, individuals who wish to dedicate a substantial portion of time to research may find that fellowships in dermatopathology, immunodermatology, dermatology-rheumatology, clinical education, dermatoepidemiology, cutaneous oncology, dermatopharmacology, and photobiology are more conducive to performing research. We also recommend that other activities, including clinical and teaching activities, serve as supplemental measures to scholarly productivity when evaluating a physician’s contribution.
- Trends in postgraduate fellowships. American Board of Dermatology website. https://www.abderm.org/media/42577/prog-dir-ite_newsletter_july_2011.pdf. Accessed February 3, 2016.
- American Medical Association. FREIDA Online. https://freida.ama-assn.org/Freida/user/specStatistics Search.do?method=viewGraduates&pageNumber=3&spcCd=080. Accessed February 3, 2016.
- Micrographic surgery and dermatologic oncology fellowship. SF Match website. https://www.sfmatch.org/SpecialtyInsideAll.aspx?id=10&typ=1&name=Micrographic%20Surgery%20and%20Dermatologic%20Oncology#. Accessed February 3, 2016.
- Pediatric dermatology fellowship. SF Match website. https://www.sfmatch.org/SpecialtyInsideAll.aspx?id=16&typ=1&name=Pediatric%20Dermatology#. Accessed February 3, 2016.
- Javorsky E, Kostecki J, Kimball AB. The relative popularity of nonprocedural dermatology fellowships. J Am Acad Dermatol. 2012;66:693-694.
- Suwattee P, Cham PM, Abdollahi M, et al. Dermatopathology workforce in the United States: a survey. J Am Acad Dermatol. 2011;65:1180-1185.
- Park KK. Fellowships after dermatology residency: the traditional and beyond. Cutis. 2015;95:E31-E34.
- Tierney EP, Hanke CW, Kimball AB. Recent changes in the workforce and practice of dermatologic surgery. Dermatol Surg. 2009;35:413-419.
- Wu JJ, Markus RF, Orengo IF. The increased competitiveness of Mohs micrographic surgery training. Dermatol Online J. 2002;8:24.
- Salter SA, Kimball AB. Rising educational debt levels in recent dermatology trainees and effects on career choices. J Am Acad Dermatol. 2006;54:329-331.
- Tierney EP, Hanke CW, Kimball AB. Academic productivity and affiliation of dermatologic surgeons. Dermatol Surg. 2009;35:1886-1892.
- Nguyen JC, Jacobson CC, Rehmus W, et al. Workforce characteristics of Mohs surgery fellows. Dermatol Surg. 2004;30(2, pt 1):136-138.
- Goldenberg G, Patel MJ, Sangueza OP, et al. US dermatopathology fellows career survey: 2004-2005. J Cutan Pathol. 2007;34:487-489.
- Atasoylu AA, Wright SM, Beasley BW, et al. Promotion criteria for clinician-educators. J Gen Intern Med. 2003;18:711-716.
- Beasley BW, Wright SM, Cofrancesco J Jr, et al. Promotion criteria for clinician-educators in the United States and Canada. a survey of promotion committee chairpersons. JAMA. 1997;278:723-728.
- Dixon AK. Publishing and academic promotion. Singapore Med J. 2009;50:847-850.
- Todisco A, Souza RF, Gores GJ. Trains, tracks, and promotion in an academic medical center. Gastroenterology. 2011;141:1545-1548.
- Baldwin C, Chandran L, Gusic M. Guidelines for evaluating the educational performance of medical school faculty: priming a national conversation. Teach Learn Med. 2011;23:285-297.
- Akl EA, Meerpohl JJ, Raad D, et al. Effects of assessing the productivity of faculty in academic medical centres: a systematic review. CMAJ. 2012;184:E602-E612.
- Hirsch JE. An index to quantify an individual’s scientific research output. Proc Natl Acad Sci U S A. 2005;102:16569-16572.
- Hirsch JE. Does the h-index have predictive power? Proc Natl Acad Sci U S A. 2007;104:19193-19198.
- Benway BM, Kalidas P, Cabello JM, et al. Does citation analysis reveal association between h-index and academic rank in urology? Urology. 2009;74:30-33.
- Lee J, Kraus KL, Couldwell WT. Use of the h-index in neurosurgery. clinical article. J Neurosurg. 2009;111:387-392.
- Kasabwala K, Morton CM, Svider PF, et al. Factors influencing scholarly impact: does urology fellowship training affect research output? J Surg Educ. 2014;71:345-352.
- Pagel PS, Hudetz JA. H-index is a sensitive indicator of academic activity in highly productive anaesthesiologists: results of a bibliometric analysis. Acta Anaesthesiol Scand. 2011;55:1085-1089.
- Rad AE, Brinjikji W, Cloft HJ, et al. The h-index in academic radiology. Acad Radiol. 2010;17:817-821.
- Svider PF, Choudhry ZA, Choudhry OJ, et al. The use of the h-index in academic otolaryngology. Laryngoscope. 2013;123:103-106.
- Svider PF, Lopez SA, Husain Q, et al. The association between scholarly impact and National Institutes of Health funding in ophthalmology. Ophthalmology. 2014;121:423-428.
- Eloy JA, Svider PF, Mauro KM, et al. Impact of fellowship training on research productivity in academic otolaryngology. Laryngoscope. 2012;122:2690-2694.
- Huang G, Fang CH, Lopez SA, et al. Impact of fellowship training on research productivity in academic ophthalmology. J Surg Educ. 2015;72:410-417.
- Ball P. Achievement index climbs the ranks. Nature. 2007;448:737.
- Dinulos JG. Pediatric dermatology: past, present and future. Curr Opin Pediatr. 2007;19:417-419.
- Agarwal N, Clark S, Svider PF, et al. Impact of fellowship training on research productivity in academic neurological surgery. World Neurosurg. 2013;80:738-744.
- Engqvist L, Frommen JG. The h-index and self-citations. Trends Ecol Evol. 2008;23:250-252.
- Lamki N, Marchand M. The medical educator teaching portfolio: its compilation and potential utility. Sultan Qaboos Univ Med J. 2006;6:7-12.
Practice Points
- As residents decide whether to pursue fellowship training, it is important to consider the importance of fellowship completion for academic promotion and productivity.
- Although there is greater scholarly productivity among fellowship-trained dermatologists compared to non–fellowship-trained dermatologists, this difference is minimized when controlling for academic rank and publication range.
- Fellowships may provide more opportunity for structured research experiences but may not be necessary for successful careers in academic dermatology.