User login
Reorganizing a Hospital Ward
In 2001, the Institute of Medicine called for a major redesign of the US healthcare system, describing the chasm between the quality of care Americans receive and the quality of healthcare they deserve.[1] The healthcare community recognizes its ongoing quality and value gaps, but progress has been limited by outdated care models, fragmented organizational structures, and insufficient advances in system design.[2] Many healthcare organizations are searching for new care delivery models capable of producing greater value.
A major constraint in hospitals is the persistence of underperforming frontline clinical care teams.[3] Physicians typically travel from 1 unit or patient to the next in unpredictable patterns, resulting in missed opportunities to share perspectives and coordinate care with nurses, discharge planning personnel, pharmacists, therapists, and patients. This geographic fragmentation almost certainly contributes to interprofessional silos and hierarchies, nonspecific care plans, and failure to initiate or intensify therapy when indicated.[4] Modern hospital units could benefit from having a standard care model that synchronizes frontline professionals into teams routinely coordinating and progressing a shared plan of care.
EFFECTIVE CLINICAL MICROSYSTEMS REFLECTED IN THE DESIGN OF THE ACCOUNTABLE CARE UNIT
High‐value healthcare organizations deliberately design clinical microsystems.[5] An effective clinical microsystem combines several traits: (1) a small group of people who work together in a defined setting on a regular basis to provide care, (2) linked care processes and a shared information environment that includes individuals who receive that care, (3) performance outcomes, and (4) set service and care aims.[6] For the accountable care unit (ACU) to reflect the traits of an effective clinical microsystem, we designed it with analogous features: (1) unit‐based teams, (2) structured interdisciplinary bedside rounds (SIBR), (3) unit‐level performance reporting, and (4) unit‐level nurse and physician coleadership. We launched the ACU on September 1, 2010 in a high‐acuity 24‐bed medical unit at Emory University Hospital, a 579‐bed tertiary academic medical center. Herein we provide a brief report of our experience implementing and refining the ACU over a 4‐year period to help others gauge feasibility and sustainability.
FEATURES OF AN ACU
Unit‐Based Teams
Design
Geographic alignment fosters mutual respect, cohesiveness, communication, timeliness, and face‐to‐face problem solving,[7, 8] and has been linked to improved patient satisfaction, decreased length of stay, and reductions in morbidity and mortality.[9, 10, 11] At our hospital, though, patients newly admitted or transferred to the hospital medicine service traditionally had been distributed to physician teams without regard to geography, typically based on physician call schedules or traditions of balancing patient volumes across colleagues. These traditional practices geographically dispersed our teams. Physicians would be forced regularly to travel to 5 to 8 different units each day to see 10 to 18 patients. Nurses might perceive this as a parade of different physician teams coming and going off the unit at unpredictable times. To temporally and spatially align physicians with unit‐based staff, specific physician teams were assigned to the ACU.
Implementation
The first step in implementing unit‐based teams was to identify the smallest number of physician teams that could be assigned to the ACU. Two internal medicine resident teams are assigned to care for all medical patients in the unit. Each resident team consists of 1 hospital medicine attending physician, 1 internal medicine resident, 3 interns (2 covering the day shift and 1 overnight every other night), and up to 2 medical students. The 2 teams alternate a 24‐hour call cycle where the on‐call team admits every patient arriving to the unit. For patients arriving to the unit from 6 pm to 7 am, the on‐call overnight intern admits the patients and hands over care to the team in the morning. The on‐call team becomes aware of an incoming patient once the patient has been assigned a bed in the home unit. Several patients per day may arrive on the unit as transfers from a medical or surgical intensive care unit, but most patients arrive as emergency room or direct admissions. On any given day it is acceptable and typical for a team to have several patients off the ACU. No specific changes were made to nurse staffing, with the unit continuing to have 1 nurse unit manager, 1 charge nurse per shift, and a nurse‐to‐patient ratio of 1 to 4.
Results
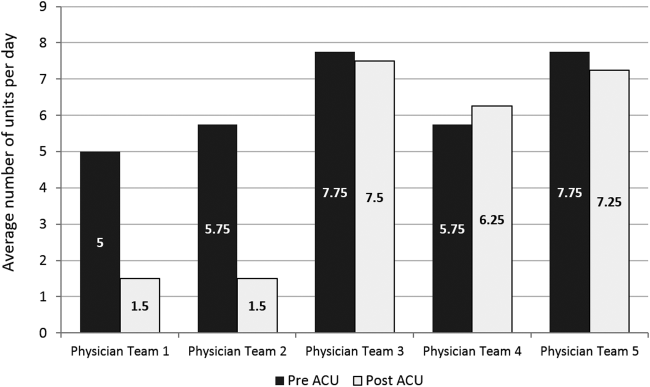
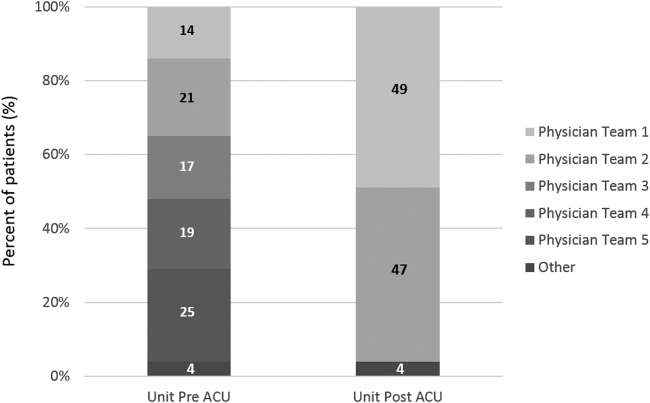
Geographic patient assignment has been successful (Figure 1). Prior to implementing the ACU, more than 5 different hospital medicine physician teams cared for patients on the unit, with no single team caring for more than 25% of them. In the ACU, all medical patients are assigned to 1 of the 2 unit‐based physician teams (physician teams 1 and 2), which regularly represents more than 95% of all patients on the unit. Over the 4 years, these 2 ACU teams have had an average of 12.9 total patient encounters per day (compared to 11.8 in the year before the ACU when these teams were not unit based). The 2 unit‐based teams have over 90% of their patients on the ACU daily. In contrast, 3 attending‐only hospital medicine teams (physician teams 3, 4, and 5) are still dispersed over 6 to 8 units every day (Figure 2), primarily due to high hospital occupancy and a relative scarcity of units eligible to become dedicated hospital medicine units.

Effects of the Change
Through unit‐based teams, the ACU achieves the first trait of an effective clinical microsystem. Although an evaluation of the cultural gains are beyond the scope of this article, the logistical advantages are self‐evident; having the fewest necessary physician teams overseeing care for nearly all patients in 1 unit and where those physician teams simultaneously have nearly all of their patients on that 1 unit, makes it possible to schedule interdisciplinary teamwork activities, such as SIBR, not otherwise feasible.
Structured Interdisciplinary Bedside Rounds
Design
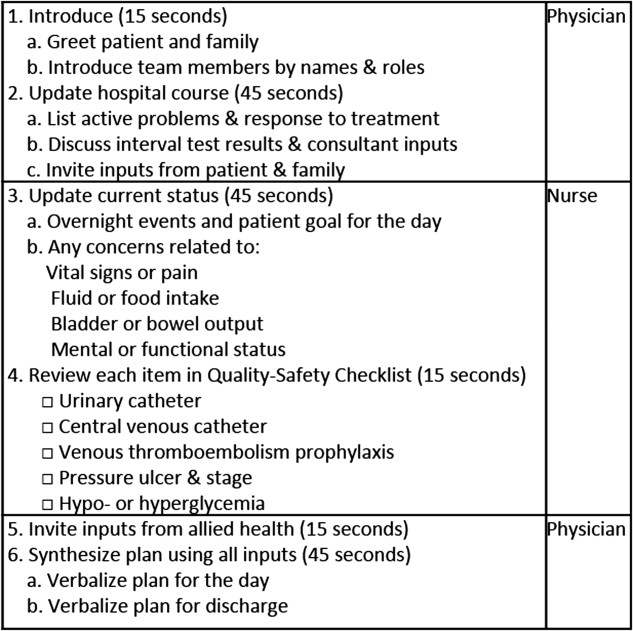
To reflect the second trait of an effective clinical microsystem, a hospital unit should routinely combine best practices for communication, including daily goals sheets,[12] safety checklists,[13] and multidisciplinary rounds.[14, 15] ACU design achieves this through SIBR, a patient‐ and family‐centered, team‐based approach to rounds that brings the nurse, physician, and available allied health professionals to the patient's bedside every day to exchange perspectives using a standard format to cross‐check information with the patient, family, and one another, and articulate a clear plan for the day. Before the SIBR hour starts, physicians and nurses have already performed independent patient assessments through usual activities such as handover, chart review, patient interviews, and physical examinations. Participants in SIBR are expected to give or receive inputs according to the standard SIBR communication protocol (Figure 3), review a quality‐safety checklist together, and ensure the plan of care is verbalized. Including the patient and family allows all parties to hear and be heard, cross‐check information for accuracy, and hold each person accountable for contributions.[16, 17]
Implementation
Each ACU staff member receives orientation to the SIBR communication protocol and is expected to be prepared and punctual for the midmorning start times. The charge nurse serves as the SIBR rounds manager, ensuring physicians waste no time searching for the next nurse and each team's eligible patients are seen in the SIBR hour. For each patient, SIBR begins when the nurse and physician are both present at the bedside. The intern begins SIBR by introducing team members before reviewing the patient's active problem list, response to treatment, and interval test results or consultant inputs. The nurse then relays the patient's goal for the day, overnight events, nursing concerns, and reviews the quality‐safety checklist. The intern then invites allied health professionals to share inputs that might impact medical decision making or discharge planning, before synthesizing all inputs into a shared plan for the day.
Throughout SIBR, the patient and family are encouraged to ask questions or correct misinformation. Although newcomers to SIBR often imagine that inviting patient inputs will disrupt efficiency, we have found teams readily learn to manage this risk, for instance discerning the core question among multiple seemingly disparate ones, or volunteering to return after the SIBR hour to explore a complex issue.
Results
Since the launch of the ACU on September 1, 2010, SIBR has been embedded as a routine on the unit with both physician teams and the nursing staff conducting it every day. Patients not considered eligible for SIBR are those whom the entire physician team has not yet evaluated, typically patients who arrived to the unit overnight. For patients who opt out due to personal preference, or for patients away from the unit for a procedure or a test, SIBR occurs without the patient so the rest of the team can still exchange inputs and formulate a plan of care. A visitor to the unit sees SIBR start punctually at 9 am and 10 am for successive teams, with each completing SIBR on eligible patients in under 60 minutes.
Effects of the Change
The second trait of an effective clinical microsystem is achieved through SIBR's routine forum for staff to share information with each other and the patient. By practicing SIBR every workday, staff are presented with multiple routine opportunities to experience an environment reflective of high‐performing frontline units.[18] We found that SIBR resembled other competencies, with a bell curve of performance. For this reason, by the start of the third year we added a SIBR certification program, a SIBR skills training program where permanent and rotating staff are evaluated through an in vivo observed structured clinical exam, typically with a charge nurse or physician as preceptor. When a nurse, medical student, intern, or resident demonstrates an ability to perform a series of specific high performance SIBR behaviors in 5 of 6 consecutive patients, they can achieve SIBR certification. In the first 2 years of this voluntary certification program, all daytime nursing staff and rotating interns have achieved this demonstration of interdisciplinary teamwork competence.
Unit‐Level Performance Reporting
Design
Hospital outcomes are determined on the clinical frontline. To be effective at managing unit outcomes, performance reports must be made available to unit leadership and staff.[5, 16] However, many hospitals still report performance at the level of the facility or service line. This limits the relevance of reports for the people who directly determine outcomes.
Implementation
For the first year, a data analyst was available to prepare and distribute unit‐level performance reports to unit leaders quarterly, including rates of in‐hospital mortality, blood stream infections, patient satisfaction, length of stay, and 30‐day readmissions. Preparation of these reports was labor intensive, requiring the analyst to acquire raw data from multiple data sources and to build the reports manually.
Results
In an analysis comparing outcomes for every patient spending at least 1 night on the unit in the year before and year after implementation, we observed reductions in in‐hospital mortality and length of stay. Unadjusted in‐hospital mortality decreased from 2.3% to 1.1% (P=0.004), with no change in referrals to hospice (5.4% to 4.5%) (P=0.176), and length‐of‐stay decreased from 5.0 to 4.5 days (P=0.001).[19] A complete report of these findings, including an analysis of concurrent control groups is beyond the scope of this article, but here we highlight an effect we observed on ACU leadership and staff from the reduction in in‐hospital mortality.
Effects of the Change
Noting the apparent mortality reduction, ACU leadership encouraged permanent staff and rotating trainees to consider an unexpected death as a never event. Although perhaps self‐evident, before the ACU we had never been organized to reflect on that concept or to use routines to do something about it. The unit considered an unexpected death one where the patient was not actively receiving comfort measures. At the monthly meet and greet, where ACU leadership bring the permanent staff and new rotating trainees together to introduce themselves by first name, the coleaders proposed that unexpected deaths in the month ahead could represent failures to recognize or respond to deterioration, to consider an alternative or under‐treated process, to transfer the patient to a higher level of care, or to deliver more timely and appropriate end‐of‐life care. It is our impression that this introspection was extraordinarily meaningful and would not have occurred without unit‐based teams, unit‐level performance data, and ACU leadership learning to utilize this rhetoric.
Unit‐Level Nurse and Physician Coleadership
Design
Effective leadership is a major driver of successful clinical microsystems.[20] The ACU is designed to be co‐led by a nurse unit manager and physician medical director. The leadership pair was charged simply with developing patient‐centered teams and ensuring the staff felt connected to the values of the organization and accountable to each other and the outcomes of the unit.
Implementation
Nursing leadership and hospital executives influenced the selection of the physician medical director, which was a way for them to demonstrate support for the care model. Over the first 4 years, the physician medical director position has been afforded a 10% to 20% reduction in clinical duties to fulfill the charge. The leadership pair sets expectations for the ACU's code of conduct, standard operating procedures (eg, SIBR), and best‐practice protocols.
Results
The leadership pair tries explicitly to role model the behaviors enumerated in the ACU's relational covenant, itself the product of a facilitated exercise they commissioned in the first year in which the entire staff drafted and signed a document listing behaviors they wished to see from each other (see Supporting Information, Appendix 1, in the online version of this article). The physician medical director, along with charge nurses, coach staff and trainees wishing to achieve SIBR certification. Over the 4 years, the pair has introduced best‐practice protocols for glycemic control, venous thromboembolism prophylaxis, removal of idle venous and bladder catheters, and bedside goals‐of‐care conversations.
Effects of the Change
Where there had previously been no explicit code of conduct, standard operating procedures such as SIBR, or focused efforts to optimize unit outcomes, the coleadership pair fills a management gap. These coleaders play an essential role in building momentum for the structure and processes of the ACU. The leadership pair has also become a primary resource for intraorganizational spread of the ACU model to medical and surgical wards, as well as geriatric, long‐term acute, and intensive care units.
CHALLENGES
Challenges with implementing the ACU fell into 3 primary categories: (1) performing change management required for a successful launch, (2) solving logistics of maintaining unit‐based physician teams, and (3) training physicians and nurses to perform SIBR at a high level.
For change management, the leadership pair was able to explain the rationale of the model to all staff in sufficient detail to launch the ACU. To build momentum for ACU routines and relationships, the physician leader and the nurse unit manager were both present on the unit daily for the first 100 days. As ACU operations became routine and competencies formed among clinicians, the amount of time spent by these leaders was de‐escalated.
Creating and maintaining unit‐based physician teams required shared understanding and coordination between on‐call hospital medicine physicians and the bed control office so that new admissions or transfers could be consistently assigned to unit‐based teams without adversely affecting patient flow. We found this challenge to be manageable once stakeholders accepted the rationale for the care mode and figured out how to support it.
The challenge of building high‐performance SIBR across the unit, including competence of rotating trainees new to the model, requires individualized assessment and feedback necessary for SIBR certification. We addressed this challenge by creating a SIBR train‐the‐trainer programa list of observable high‐performance SIBR behaviors coupled with a short course about giving effective feedback to learnersand found that once the ACU had several nurse and physician SIBR trainers in the staffing mix every day, the required amount of SIBR coaching expertise was available when needed.
CONCLUSION
Improving value and reliability in hospital care may require new models of care. The ACU is a hospital care model specifically designed to organize physicians, nurses, and allied health professionals into high‐functioning, unit‐based teams. It converges standard workflow, patient‐centered communication, quality‐safety checklists, best‐practice protocols, performance measurement, and progressive leadership. Our experience with the ACU suggests that hospital units can be reorganized as effective clinical microsystems where consistent unit professionals can share time and space, a sense of purpose, code of conduct, shared mental model for teamwork, an interprofessional management structure, and an important level of accountability to each other and their patients.
Disclosures: Jason Stein, MD: grant support from the US Health & Resources Services Administration to support organizational implementation of the care model described; recipient of consulting fees and royalties for licensed intellectual property to support implementation of the care model described; founder and president of nonprofit Centripital, provider of consulting services to hospital systems implementing the care model described. The terms of this arrangement have been reviewed and approved by Emory University in accordance with its conflict of interest policies. Liam Chadwick, PhD, and Diaz Clark, MS, RN: recipients of consulting fees through Centripital to support implementation of the care model described. Bryan W. Castle, MBA, RN: grant support from the US Health & Resources Services Administration to support organizational implementation of the care model described; recipient of consulting fees through Centripital to support implementation of the care model described. The authors report no other conflicts of interest.
- Institute of Medicine. Committee on Quality of Health Care in America. Crossing the Quality Chasm: A New Health System for the 21st Century. Washington, DC: National Academies Press; 2001.
- , , . The triple aim: care, health, and cost. Health Aff (Millwood). 2008;27(3):759–769.
- . The end of the beginning: patient safety five years after “to err is human”. Health Aff (Millwood). 2004;Suppl Web Exclusives:W4‐534–545.
- , , , et al. Clinical inertia. Ann Intern Med. 2001;135(9):825–834.
- . The four habits of high‐value health care organizations. N Engl J Med. 2011;365(22):2045–2047.
- , , , . Using a Malcolm Baldrige framework to understand high‐performing clinical microsystems. Qual Saf Health Care. 2007;16(5):334–341.
- , , , . Relational coordination among nurses and other providers: impact on the quality of patient care. J Nurs Manag. 2010;18(8):926–937.
- , , , et al. Unit‐based care teams and the frequency and quality of physician‐nurse communications. Arch Pediatr Adolesc Med. 2011;165(5):424–428.
- , , , et al. Reducing cardiac arrests in the acute admissions unit: a quality improvement journey. BMJ Qual Saf. 2013;22(12):1025–1031.
- , , , et al. Evolving practice of hospital medicine and its impact on hospital throughput and efficiencies. J Hosp Med. 2012;7(8):649–654.
- , . Improvement projects led by unit‐based teams of nurse, physician, and quality leaders reduce infections, lower costs, improve patient satisfaction, and nurse‐physician communication. AHRQ Health Care Innovations Exchange. Available at: https://innovations.ahrq.gov/profiles/improvement‐projects‐led‐unit‐based‐teams‐nurse‐physician‐and‐quality‐leaders‐reduce. Accessed May 4, 2014.
- , , , , . The daily goals communication sheet: a simple and novel tool for improved communication and care. Jt Comm J Qual Patient Saf. 2008;34(10):608–613, 561.
- , , , et al. Implementation of a mandatory checklist of protocols and objectives improves compliance with a wide range of evidence‐based intensive care unit practices. Crit Care Med. 2009;37(10):2775–2781.
- , , , et al. Structured interdisciplinary rounds in a medical teaching unit: improving patient safety. Arch Intern Med. 2011;171(7):678–684.
- , , , , , . Improving teamwork: impact of structured interdisciplinary rounds on a hospitalist unit. J Hosp Med. 2011;6(2):88–93.
- , , . Integrating patient safety into the clinical microsystem. Qual Saf Health Care. 2004;13(suppl 2):ii34–ii38.
- , , , . Collaborative‐cross checking to enhance resilience. Cogn Tech Work. 2007;9:155–162.
- , , , et al. Microsystems in health care: Part 1. Learning from high‐performing front‐line clinical units. Jt Comm J Qual Improv. 2002;28(9):472–493.
- , , . Mortality reduction associated with structure process, and management redesign of a hospital medicine unit. J Hosp Med. 2012;7(suppl 2):115.
- , , , et al. Microsystems in health care: part 5. How leaders are leading. Jt Comm J Qual Saf. 2003;29(6):297–308.
In 2001, the Institute of Medicine called for a major redesign of the US healthcare system, describing the chasm between the quality of care Americans receive and the quality of healthcare they deserve.[1] The healthcare community recognizes its ongoing quality and value gaps, but progress has been limited by outdated care models, fragmented organizational structures, and insufficient advances in system design.[2] Many healthcare organizations are searching for new care delivery models capable of producing greater value.
A major constraint in hospitals is the persistence of underperforming frontline clinical care teams.[3] Physicians typically travel from 1 unit or patient to the next in unpredictable patterns, resulting in missed opportunities to share perspectives and coordinate care with nurses, discharge planning personnel, pharmacists, therapists, and patients. This geographic fragmentation almost certainly contributes to interprofessional silos and hierarchies, nonspecific care plans, and failure to initiate or intensify therapy when indicated.[4] Modern hospital units could benefit from having a standard care model that synchronizes frontline professionals into teams routinely coordinating and progressing a shared plan of care.
EFFECTIVE CLINICAL MICROSYSTEMS REFLECTED IN THE DESIGN OF THE ACCOUNTABLE CARE UNIT
High‐value healthcare organizations deliberately design clinical microsystems.[5] An effective clinical microsystem combines several traits: (1) a small group of people who work together in a defined setting on a regular basis to provide care, (2) linked care processes and a shared information environment that includes individuals who receive that care, (3) performance outcomes, and (4) set service and care aims.[6] For the accountable care unit (ACU) to reflect the traits of an effective clinical microsystem, we designed it with analogous features: (1) unit‐based teams, (2) structured interdisciplinary bedside rounds (SIBR), (3) unit‐level performance reporting, and (4) unit‐level nurse and physician coleadership. We launched the ACU on September 1, 2010 in a high‐acuity 24‐bed medical unit at Emory University Hospital, a 579‐bed tertiary academic medical center. Herein we provide a brief report of our experience implementing and refining the ACU over a 4‐year period to help others gauge feasibility and sustainability.
FEATURES OF AN ACU
Unit‐Based Teams
Design
Geographic alignment fosters mutual respect, cohesiveness, communication, timeliness, and face‐to‐face problem solving,[7, 8] and has been linked to improved patient satisfaction, decreased length of stay, and reductions in morbidity and mortality.[9, 10, 11] At our hospital, though, patients newly admitted or transferred to the hospital medicine service traditionally had been distributed to physician teams without regard to geography, typically based on physician call schedules or traditions of balancing patient volumes across colleagues. These traditional practices geographically dispersed our teams. Physicians would be forced regularly to travel to 5 to 8 different units each day to see 10 to 18 patients. Nurses might perceive this as a parade of different physician teams coming and going off the unit at unpredictable times. To temporally and spatially align physicians with unit‐based staff, specific physician teams were assigned to the ACU.
Implementation
The first step in implementing unit‐based teams was to identify the smallest number of physician teams that could be assigned to the ACU. Two internal medicine resident teams are assigned to care for all medical patients in the unit. Each resident team consists of 1 hospital medicine attending physician, 1 internal medicine resident, 3 interns (2 covering the day shift and 1 overnight every other night), and up to 2 medical students. The 2 teams alternate a 24‐hour call cycle where the on‐call team admits every patient arriving to the unit. For patients arriving to the unit from 6 pm to 7 am, the on‐call overnight intern admits the patients and hands over care to the team in the morning. The on‐call team becomes aware of an incoming patient once the patient has been assigned a bed in the home unit. Several patients per day may arrive on the unit as transfers from a medical or surgical intensive care unit, but most patients arrive as emergency room or direct admissions. On any given day it is acceptable and typical for a team to have several patients off the ACU. No specific changes were made to nurse staffing, with the unit continuing to have 1 nurse unit manager, 1 charge nurse per shift, and a nurse‐to‐patient ratio of 1 to 4.
Results
Geographic patient assignment has been successful (Figure 1). Prior to implementing the ACU, more than 5 different hospital medicine physician teams cared for patients on the unit, with no single team caring for more than 25% of them. In the ACU, all medical patients are assigned to 1 of the 2 unit‐based physician teams (physician teams 1 and 2), which regularly represents more than 95% of all patients on the unit. Over the 4 years, these 2 ACU teams have had an average of 12.9 total patient encounters per day (compared to 11.8 in the year before the ACU when these teams were not unit based). The 2 unit‐based teams have over 90% of their patients on the ACU daily. In contrast, 3 attending‐only hospital medicine teams (physician teams 3, 4, and 5) are still dispersed over 6 to 8 units every day (Figure 2), primarily due to high hospital occupancy and a relative scarcity of units eligible to become dedicated hospital medicine units.
Effects of the Change
Through unit‐based teams, the ACU achieves the first trait of an effective clinical microsystem. Although an evaluation of the cultural gains are beyond the scope of this article, the logistical advantages are self‐evident; having the fewest necessary physician teams overseeing care for nearly all patients in 1 unit and where those physician teams simultaneously have nearly all of their patients on that 1 unit, makes it possible to schedule interdisciplinary teamwork activities, such as SIBR, not otherwise feasible.
Structured Interdisciplinary Bedside Rounds
Design
To reflect the second trait of an effective clinical microsystem, a hospital unit should routinely combine best practices for communication, including daily goals sheets,[12] safety checklists,[13] and multidisciplinary rounds.[14, 15] ACU design achieves this through SIBR, a patient‐ and family‐centered, team‐based approach to rounds that brings the nurse, physician, and available allied health professionals to the patient's bedside every day to exchange perspectives using a standard format to cross‐check information with the patient, family, and one another, and articulate a clear plan for the day. Before the SIBR hour starts, physicians and nurses have already performed independent patient assessments through usual activities such as handover, chart review, patient interviews, and physical examinations. Participants in SIBR are expected to give or receive inputs according to the standard SIBR communication protocol (Figure 3), review a quality‐safety checklist together, and ensure the plan of care is verbalized. Including the patient and family allows all parties to hear and be heard, cross‐check information for accuracy, and hold each person accountable for contributions.[16, 17]
Implementation
Each ACU staff member receives orientation to the SIBR communication protocol and is expected to be prepared and punctual for the midmorning start times. The charge nurse serves as the SIBR rounds manager, ensuring physicians waste no time searching for the next nurse and each team's eligible patients are seen in the SIBR hour. For each patient, SIBR begins when the nurse and physician are both present at the bedside. The intern begins SIBR by introducing team members before reviewing the patient's active problem list, response to treatment, and interval test results or consultant inputs. The nurse then relays the patient's goal for the day, overnight events, nursing concerns, and reviews the quality‐safety checklist. The intern then invites allied health professionals to share inputs that might impact medical decision making or discharge planning, before synthesizing all inputs into a shared plan for the day.
Throughout SIBR, the patient and family are encouraged to ask questions or correct misinformation. Although newcomers to SIBR often imagine that inviting patient inputs will disrupt efficiency, we have found teams readily learn to manage this risk, for instance discerning the core question among multiple seemingly disparate ones, or volunteering to return after the SIBR hour to explore a complex issue.
Results
Since the launch of the ACU on September 1, 2010, SIBR has been embedded as a routine on the unit with both physician teams and the nursing staff conducting it every day. Patients not considered eligible for SIBR are those whom the entire physician team has not yet evaluated, typically patients who arrived to the unit overnight. For patients who opt out due to personal preference, or for patients away from the unit for a procedure or a test, SIBR occurs without the patient so the rest of the team can still exchange inputs and formulate a plan of care. A visitor to the unit sees SIBR start punctually at 9 am and 10 am for successive teams, with each completing SIBR on eligible patients in under 60 minutes.
Effects of the Change
The second trait of an effective clinical microsystem is achieved through SIBR's routine forum for staff to share information with each other and the patient. By practicing SIBR every workday, staff are presented with multiple routine opportunities to experience an environment reflective of high‐performing frontline units.[18] We found that SIBR resembled other competencies, with a bell curve of performance. For this reason, by the start of the third year we added a SIBR certification program, a SIBR skills training program where permanent and rotating staff are evaluated through an in vivo observed structured clinical exam, typically with a charge nurse or physician as preceptor. When a nurse, medical student, intern, or resident demonstrates an ability to perform a series of specific high performance SIBR behaviors in 5 of 6 consecutive patients, they can achieve SIBR certification. In the first 2 years of this voluntary certification program, all daytime nursing staff and rotating interns have achieved this demonstration of interdisciplinary teamwork competence.
Unit‐Level Performance Reporting
Design
Hospital outcomes are determined on the clinical frontline. To be effective at managing unit outcomes, performance reports must be made available to unit leadership and staff.[5, 16] However, many hospitals still report performance at the level of the facility or service line. This limits the relevance of reports for the people who directly determine outcomes.
Implementation
For the first year, a data analyst was available to prepare and distribute unit‐level performance reports to unit leaders quarterly, including rates of in‐hospital mortality, blood stream infections, patient satisfaction, length of stay, and 30‐day readmissions. Preparation of these reports was labor intensive, requiring the analyst to acquire raw data from multiple data sources and to build the reports manually.
Results
In an analysis comparing outcomes for every patient spending at least 1 night on the unit in the year before and year after implementation, we observed reductions in in‐hospital mortality and length of stay. Unadjusted in‐hospital mortality decreased from 2.3% to 1.1% (P=0.004), with no change in referrals to hospice (5.4% to 4.5%) (P=0.176), and length‐of‐stay decreased from 5.0 to 4.5 days (P=0.001).[19] A complete report of these findings, including an analysis of concurrent control groups is beyond the scope of this article, but here we highlight an effect we observed on ACU leadership and staff from the reduction in in‐hospital mortality.
Effects of the Change
Noting the apparent mortality reduction, ACU leadership encouraged permanent staff and rotating trainees to consider an unexpected death as a never event. Although perhaps self‐evident, before the ACU we had never been organized to reflect on that concept or to use routines to do something about it. The unit considered an unexpected death one where the patient was not actively receiving comfort measures. At the monthly meet and greet, where ACU leadership bring the permanent staff and new rotating trainees together to introduce themselves by first name, the coleaders proposed that unexpected deaths in the month ahead could represent failures to recognize or respond to deterioration, to consider an alternative or under‐treated process, to transfer the patient to a higher level of care, or to deliver more timely and appropriate end‐of‐life care. It is our impression that this introspection was extraordinarily meaningful and would not have occurred without unit‐based teams, unit‐level performance data, and ACU leadership learning to utilize this rhetoric.
Unit‐Level Nurse and Physician Coleadership
Design
Effective leadership is a major driver of successful clinical microsystems.[20] The ACU is designed to be co‐led by a nurse unit manager and physician medical director. The leadership pair was charged simply with developing patient‐centered teams and ensuring the staff felt connected to the values of the organization and accountable to each other and the outcomes of the unit.
Implementation
Nursing leadership and hospital executives influenced the selection of the physician medical director, which was a way for them to demonstrate support for the care model. Over the first 4 years, the physician medical director position has been afforded a 10% to 20% reduction in clinical duties to fulfill the charge. The leadership pair sets expectations for the ACU's code of conduct, standard operating procedures (eg, SIBR), and best‐practice protocols.
Results
The leadership pair tries explicitly to role model the behaviors enumerated in the ACU's relational covenant, itself the product of a facilitated exercise they commissioned in the first year in which the entire staff drafted and signed a document listing behaviors they wished to see from each other (see Supporting Information, Appendix 1, in the online version of this article). The physician medical director, along with charge nurses, coach staff and trainees wishing to achieve SIBR certification. Over the 4 years, the pair has introduced best‐practice protocols for glycemic control, venous thromboembolism prophylaxis, removal of idle venous and bladder catheters, and bedside goals‐of‐care conversations.
Effects of the Change
Where there had previously been no explicit code of conduct, standard operating procedures such as SIBR, or focused efforts to optimize unit outcomes, the coleadership pair fills a management gap. These coleaders play an essential role in building momentum for the structure and processes of the ACU. The leadership pair has also become a primary resource for intraorganizational spread of the ACU model to medical and surgical wards, as well as geriatric, long‐term acute, and intensive care units.
CHALLENGES
Challenges with implementing the ACU fell into 3 primary categories: (1) performing change management required for a successful launch, (2) solving logistics of maintaining unit‐based physician teams, and (3) training physicians and nurses to perform SIBR at a high level.
For change management, the leadership pair was able to explain the rationale of the model to all staff in sufficient detail to launch the ACU. To build momentum for ACU routines and relationships, the physician leader and the nurse unit manager were both present on the unit daily for the first 100 days. As ACU operations became routine and competencies formed among clinicians, the amount of time spent by these leaders was de‐escalated.
Creating and maintaining unit‐based physician teams required shared understanding and coordination between on‐call hospital medicine physicians and the bed control office so that new admissions or transfers could be consistently assigned to unit‐based teams without adversely affecting patient flow. We found this challenge to be manageable once stakeholders accepted the rationale for the care mode and figured out how to support it.
The challenge of building high‐performance SIBR across the unit, including competence of rotating trainees new to the model, requires individualized assessment and feedback necessary for SIBR certification. We addressed this challenge by creating a SIBR train‐the‐trainer programa list of observable high‐performance SIBR behaviors coupled with a short course about giving effective feedback to learnersand found that once the ACU had several nurse and physician SIBR trainers in the staffing mix every day, the required amount of SIBR coaching expertise was available when needed.
CONCLUSION
Improving value and reliability in hospital care may require new models of care. The ACU is a hospital care model specifically designed to organize physicians, nurses, and allied health professionals into high‐functioning, unit‐based teams. It converges standard workflow, patient‐centered communication, quality‐safety checklists, best‐practice protocols, performance measurement, and progressive leadership. Our experience with the ACU suggests that hospital units can be reorganized as effective clinical microsystems where consistent unit professionals can share time and space, a sense of purpose, code of conduct, shared mental model for teamwork, an interprofessional management structure, and an important level of accountability to each other and their patients.
Disclosures: Jason Stein, MD: grant support from the US Health & Resources Services Administration to support organizational implementation of the care model described; recipient of consulting fees and royalties for licensed intellectual property to support implementation of the care model described; founder and president of nonprofit Centripital, provider of consulting services to hospital systems implementing the care model described. The terms of this arrangement have been reviewed and approved by Emory University in accordance with its conflict of interest policies. Liam Chadwick, PhD, and Diaz Clark, MS, RN: recipients of consulting fees through Centripital to support implementation of the care model described. Bryan W. Castle, MBA, RN: grant support from the US Health & Resources Services Administration to support organizational implementation of the care model described; recipient of consulting fees through Centripital to support implementation of the care model described. The authors report no other conflicts of interest.
- Institute of Medicine. Committee on Quality of Health Care in America. Crossing the Quality Chasm: A New Health System for the 21st Century. Washington, DC: National Academies Press; 2001.
- , , . The triple aim: care, health, and cost. Health Aff (Millwood). 2008;27(3):759–769.
- . The end of the beginning: patient safety five years after “to err is human”. Health Aff (Millwood). 2004;Suppl Web Exclusives:W4‐534–545.
- , , , et al. Clinical inertia. Ann Intern Med. 2001;135(9):825–834.
- . The four habits of high‐value health care organizations. N Engl J Med. 2011;365(22):2045–2047.
- , , , . Using a Malcolm Baldrige framework to understand high‐performing clinical microsystems. Qual Saf Health Care. 2007;16(5):334–341.
- , , , . Relational coordination among nurses and other providers: impact on the quality of patient care. J Nurs Manag. 2010;18(8):926–937.
- , , , et al. Unit‐based care teams and the frequency and quality of physician‐nurse communications. Arch Pediatr Adolesc Med. 2011;165(5):424–428.
- , , , et al. Reducing cardiac arrests in the acute admissions unit: a quality improvement journey. BMJ Qual Saf. 2013;22(12):1025–1031.
- , , , et al. Evolving practice of hospital medicine and its impact on hospital throughput and efficiencies. J Hosp Med. 2012;7(8):649–654.
- , . Improvement projects led by unit‐based teams of nurse, physician, and quality leaders reduce infections, lower costs, improve patient satisfaction, and nurse‐physician communication. AHRQ Health Care Innovations Exchange. Available at: https://innovations.ahrq.gov/profiles/improvement‐projects‐led‐unit‐based‐teams‐nurse‐physician‐and‐quality‐leaders‐reduce. Accessed May 4, 2014.
- , , , , . The daily goals communication sheet: a simple and novel tool for improved communication and care. Jt Comm J Qual Patient Saf. 2008;34(10):608–613, 561.
- , , , et al. Implementation of a mandatory checklist of protocols and objectives improves compliance with a wide range of evidence‐based intensive care unit practices. Crit Care Med. 2009;37(10):2775–2781.
- , , , et al. Structured interdisciplinary rounds in a medical teaching unit: improving patient safety. Arch Intern Med. 2011;171(7):678–684.
- , , , , , . Improving teamwork: impact of structured interdisciplinary rounds on a hospitalist unit. J Hosp Med. 2011;6(2):88–93.
- , , . Integrating patient safety into the clinical microsystem. Qual Saf Health Care. 2004;13(suppl 2):ii34–ii38.
- , , , . Collaborative‐cross checking to enhance resilience. Cogn Tech Work. 2007;9:155–162.
- , , , et al. Microsystems in health care: Part 1. Learning from high‐performing front‐line clinical units. Jt Comm J Qual Improv. 2002;28(9):472–493.
- , , . Mortality reduction associated with structure process, and management redesign of a hospital medicine unit. J Hosp Med. 2012;7(suppl 2):115.
- , , , et al. Microsystems in health care: part 5. How leaders are leading. Jt Comm J Qual Saf. 2003;29(6):297–308.
Hospital High‐Value Care Program
With a United States medical system that spends as much as $750 billion each year on care that does not result in improved health outcomes,[1] many policy initiatives, including the Centers for Medicare and Medicaid Services' Value‐Based Purchasing program, seek to realign hospitals' financial incentives from a focus on production to one on value (quality divided by cost).[2, 3] Professional organizations have now deemed resource stewardship an ethical responsibility for professionalism,[4, 5] and campaigns such as the American Board of Internal Medicine (ABIM) Foundation's Choosing Wisely effort and the American College of Physicians' High‐Value Care platform are calling on frontline clinicians to address unnecessary and wasteful services.[6, 7]
Despite these pressures and initiatives, most physicians lack the knowledge and tools necessary to prioritize the delivery of their own healthcare services according to value.[8, 9, 10] Hospital medicine physicians are unaware of the costs associated with the interventions they order,[10] and the majority of medical training programs lack curricula focused on healthcare costs,[11] creating a large gap between physicians' perceived, desired, and actual knowledge related to costs.[12] Novel frameworks and frontline physician engagement are required if clinicians are to improve the value of the care they deliver.
We describe 1 of our first steps at the University of California, San Francisco (UCSF) to promote high‐value care (HVC) delivery: the creation of a HVC program led by clinicians and administrators focused on identifying and addressing wasteful practices within our hospitalist group. The program aims to (1) use financial and clinical data to identify areas with clear evidence of waste in the hospital, (2) promote evidence‐based interventions that improve both quality of care and value, and (3) pair interventions with evidence‐based cost awareness education to drive culture change. Our experience and inaugural projects provide a model of the key features, inherent challenges, and lessons learned, which may help inform similar efforts.
METHODS
In March 2012, we launched an HVC program within our Division of Hospital Medicine at UCSF Medical Center, a 600‐bed academic medical center in an urban setting. During the 2013 academic year, our division included 45 physicians. The medicine service, comprised of 8 teaching medical ward teams (1 attending, 1 resident, 2 interns, and variable number of medical students), and 1 nonteaching medical ward team (1 attending), admitted 4700 patients that year.
Organizational Framework
The HVC program is co‐led by a UCSF hospitalist (C.M.) and the administrator of the Division of Hospital Medicine (M.N.). Team members include hospitalists, hospital medicine fellows, resident physicians, pharmacists, project coordinators, and other administrators. The team meets in person for 1 hour every month. Project teams and ad hoc subcommittee groups often convene between meetings.
Our HVC program was placed within the infrastructure, and under the leadership, of our already established quality improvement (QI) program at UCSF. Our Division of Hospital Medicine Director of Quality and Safety (M.M.) thus oversees the QI, patient safety, patient experience, and high‐value care efforts.
The HVC program funding is largely in personnel costs. The physician leader (15% effort) is funded by the Division of Hospital Medicine, whereas the administrator is cofunded by both the division and by the medical center (largely through her roles as both division administrator and service line director). An administrative assistant within the division is also assigned to help with administrative tasks. Some additional data gathering and project support comes from existing medical center QI infrastructure, the decision support services unit, and through UCSF's new Center for Healthcare Value. Other ancillary costs for our projects have included publicity, data analytics, and information technology infrastructure. We estimate that the costs of this program are approximately $50,000 to $75,000 annually.
Framework for Identifying Target Projects
Robust Analysis of Costs
We created a framework for identifying, designing, and promoting projects specifically aimed at improving healthcare value (Figure 1). Financial data were used to identify areas with clear evidence of waste in the hospital, areas of high cost with no benefit in health outcomes. We focused particularly on obtaining cost and billing data for our medical service, which provided important insight into potential targets for improvements in value. For example, in 2011, the Division of Hospital Medicine spent more than $1 million annually in direct costs for the administration of nebulized bronchodilator therapies (nebs) to nonintensive care unit patients on the medical service.[13] These high costs, exposed by billing data, were believed to represent potential unnecessary testing and/or procedures. Not every area of high cost was deemed a target for intervention. For example, the use of recombinant factor VIII appeared a necessary expenditure (over $1 million per year) for our patients with hemophilia. Although our efforts focused on reducing waste, it is worth noting that healthcare value can also be increased by improving the delivery of high‐value services.

Recognized Benefits in Quality of Care
The program also evaluated the impact of cost reduction efforts on the quality of care, based on a high standard of current evidence. Though value can be improved by interventions that decrease costs while being quality neutral, our group chose to focus first on projects that would simultaneously improve quality while decreasing costs. We felt that this win‐win strategy would help obtain buy‐in from clinicians weary of prior cost‐cutting programs. For example, we pursued interventions aimed at reducing inappropriate gastric stress ulcer prophylaxis, which had the potential to both cut costs and minimize risks of hospital‐acquired pneumonia and Clostridium difficile infections.[14, 15] All proposed HVC targets were vetted through a review of the literature and published guidelines. In general, our initial projects had to be strongly supported by evidence, with high‐quality studies, preferably meta‐analyses or systematic reviews, that displayed the safety of our recommended changes. We reviewed the literature with experts. For example, we met with faculty pulmonologists to discuss the evidence supporting the use of inhalers instead of nebulizers in adults with obstructive pulmonary disease. The goals of our projects were chosen by our HVC committee, based on an analysis of our baseline data and the perceived potential effects of our proposed interventions.
Educational Intervention
Last, we paired interventions with evidence‐based cost awareness education to drive culture change. At UCSF we have an ongoing longitudinal cost‐awareness curriculum for residents, which has previously been described.[16] We took advantage of this educational forum to address gaps in clinician knowledge related to the targeted areas. When launching the initiative to decrease unnecessary inpatient nebulizer usage and improve transitions to inhalers, we utilized the chronic obstructive pulmonary disease case in the cost‐awareness series. Doing so allowed us to both review the evidence behind the effectiveness of inhalers, and introduce our Nebs No More After 24 campaign, which sought to transition adult inpatients with obstructive pulmonary symptoms from nebs to inhalers within 24 hours of admission.[13]
Intervention Strategy
Our general approach has been to design and implement multifaceted interventions, adapted from previous QI literature (Figure 1).[17] Given the importance of frontline clinician engagement to successful project implementation,[18, 19, 20] our interventions are physician‐driven and are vetted by a large group of clinicians prior to launch. The HVC program also explicitly seeks stakeholder input, perspective, and buy‐in prior to implementation. For example, we involved respiratory therapists (RTs) in the design of the Nebs No More After 24 project, thus ensuring that the interventions fit within their workflow and align with their care‐delivery goals.
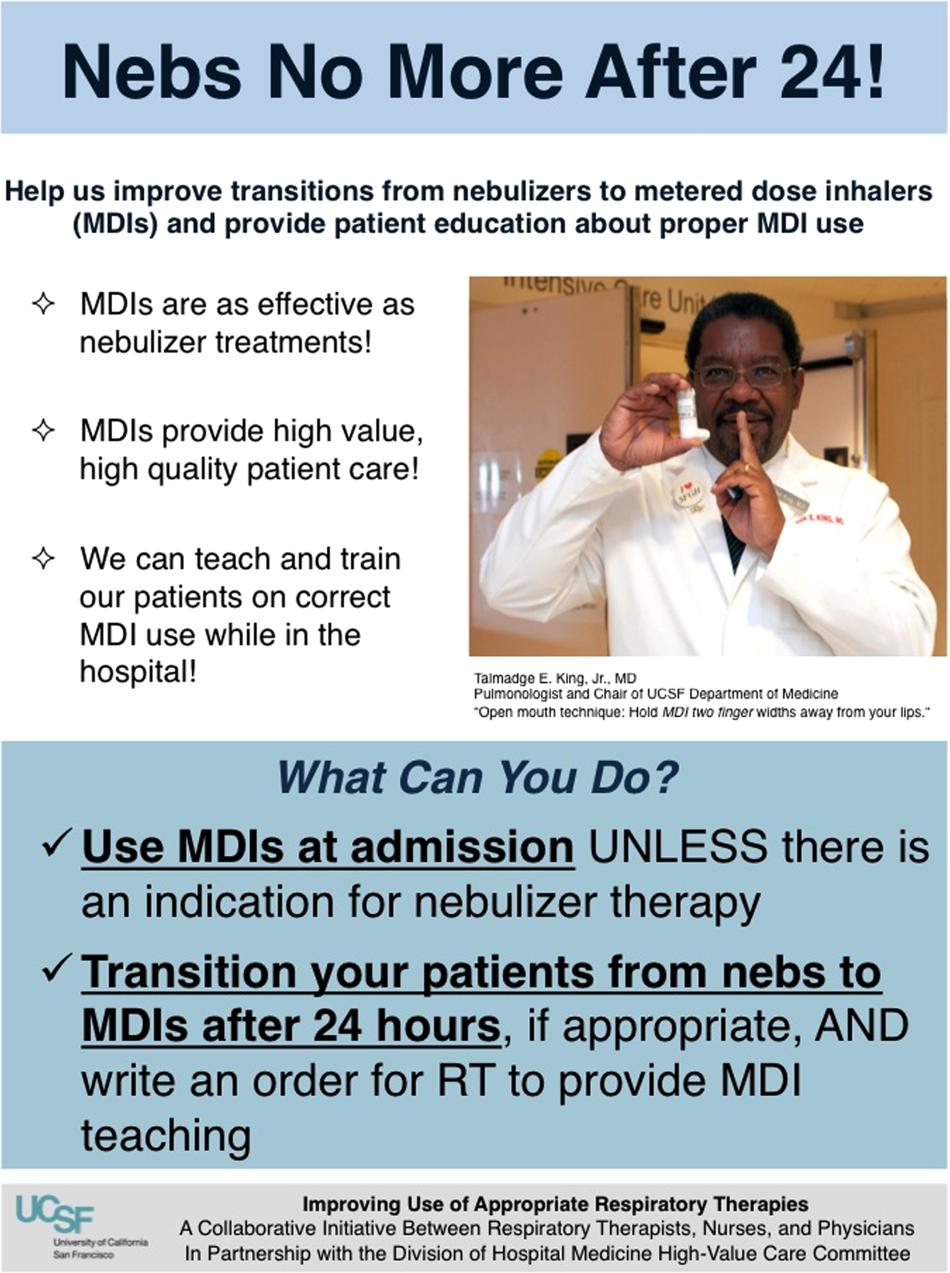
Local publicity campaigns provide education and reminders for clinicians. Posters, such as the Nebs No More After 24 poster (Figure 2), were hung in physician, nursing, and RT work areas. Pens featuring the catchphrase Nebs No More After 24 were distributed to clinicians.
In addition to presentations to residents through the UCSF cost awareness curriculum, educational presentations were also delivered to attending physicians and to other allied members of the healthcare team (eg, nurses, RTs) during regularly scheduled staff meetings.
The metrics for each of the projects were regularly monitored, and targeted feedback was provided to clinicians. For the Nebs No More After 24 campaign, data for the number of nebs delivered on the target floor were provided to resident physicians during the cost awareness conference each month, and the data were presented to attending hospitalists in the monthly QI newsletter. This academic year, transfusion and telemetry data are presented via the same strategy.
Stakeholder recruitment, education, and promotional campaigns are important to program launches, but to sustain projects over the long‐term, system changes may be necessary. We have pursued changes in the computerized provider order entry (CPOE) system, such as removing nebs from the admission order set or putting a default duration for certain telemetry orders. Systems‐level interventions, although more difficult to achieve, play an important role in creating enduring changes when paired with educational interventions.
RESULTS
During our first 2 years we have initiated ongoing projects directed at 6 major targets (Table 1). Our flagship project, Nebs No More After 24, resulted in a decrease of nebulizer rates by more than 50% on a high‐acuity medical floor, as previously published.[13] We created a financial model that primarily accounted for RT time and pharmaceutical costs, and estimated a savings of approximately $250,000 annually on this single medical ward (see Supporting Information, Table 1, in the online version of this article).[13]
| High‐Value Care Projects | Relevant Baseline Data | Goals of Project | Strategies |
|---|---|---|---|
| |||
| Nebs No More After 24: Improving appropriate use of respiratory services | The medicine service spent $1 million in direct costs on approximately 25,000 nebs for non‐ICU inpatients. | Reduce unnecessary nebs >15% over 9 months. | Removed nebs from admit order set. |
| Improve transitions from nebs to MDIs. | Enlisted RTs and RNs to help with MDI teaching for patients. | ||
| Improve patient self‐administration of MDIs. | Implemented an educational program for medicine physicians. | ||
| Created local publicity: posters, flyers, and pens. | |||
| Provided data feedback to providers. | |||
| Next step: Introduce a CPOE‐linked intervention. | |||
| Improving use of stress ulcer prophylaxis | 77% of ICU patients on acid suppressive therapy; 31% of these patients did not meet criteria for appropriate prophylaxis. | Reduce overuse and inappropriate use of SUP. | A team of pharmacists, nurses, and physicians developed targeted and evidence‐based UCSF guidelines on use of SUP. |
| Developed and implemented a pharmacist‐led intervention to reduce inappropriate SUP in the ICUs that included the following: | |||
| Reminders on admission and discharge from ICU | |||
| Education and awareness initiative for prescribers | |||
| ICU and service champions | |||
| Culture change | |||
| Next step: Incorporate indications in CPOE and work with ICU to incorporate appropriate GI prophylaxis as part of the standard ICU care bundle. | |||
| Blood utilization stewardship | 30% of transfusions on the hospital medicine service are provided to patients with a hemoglobin >8 g/dL. | Decrease units of blood transfused for a hemoglobin >8.0 g/dL by 25%. | Launched an educational campaign for attending and resident physicians. |
| Monthly feedback to residents and attending physicians. | |||
| Next step: Introduce a decision support system in the CPOE for blood transfusion orders in patients with most recent hemoglobin level >8. | |||
| Improving telemetry utilization | 44% of monitored inpatients on the medical service (with length of stay >48 hours) remain on telemetry until discharge. | Decrease by 15% the number of patients (with length of stay >48 hours) who remain on telemetry until discharge. | Implemented an educational campaign for nursing groups and the medicine and cardiology housestaff. |
| Launched a messaging campaign consisting of posters and pocket cards on appropriate telemetry use. | |||
| Designed a feedback campaign with monthly e‐mail to housestaff on their ward team's telemetry use stats. | |||
| Next step: Build a CPOE intervention that asks users to specify an approved indication for telemetry when they order monitoring. The indication then dictates how long the order is active (24, 48, 72 hours or ongoing), and the MD must renew the order after the elapsed time. | |||
| iReduce iCal: ordering ionized calcium only when needed | The medicine service spent $167,000 in direct costs on iCal labs over a year (40% of all calcium lab orders; 42% occurred in non‐ICU patients). | Reduce number of iCal labs drawn on the medicine service by >25% over the course of 6 months. | With the introduction of CPOE, iCal was removed from traditional daily lab order sets. |
| Discussed with lab, renal, and ICU stakeholders. | |||
| Implemented an educational campaign for physicians and nurses. | |||
| Created local publicity: posters and candies. | |||
| Provided data feedback to providers. | |||
| Repeat inpatient echocardiograms | 25% of TTEs are performed within 6 months of a prior; one‐third of these are for inappropriate indications. | Decrease inappropriate repeat TTEs by 25%. | Implemented an educational campaign. |
| Next step: provide the most recent TTE results in the CPOE at time of order, and provide auditing and decision support for repeat TTEs. | |||
The HVC program also provided an arena for collaborating with and supporting value‐based projects launched by other groups, such as the UCSF Medication Outcomes Center's inappropriate gastric stress ulcer prophylaxis program.[21] Our group helped support the development and implementation of evidence‐based clinical practice guidelines, and we assisted educational interventions targeting clinicians. This program resulted in a decrease in inappropriate stress ulcer prophylaxis in intensive care unit patients from 19% to 6.6% within 1 month following implementation.[21]
DISCUSSION
Physicians are increasingly being asked to embrace and lead efforts to improve healthcare value and reduce costs. Our program provides a framework to guide physician‐led initiatives to identify and address areas of healthcare waste.
Challenges and Lessons Learned
Overcoming the Hurdle of More Care as Better Care
Improving the quality of care has traditionally stressed the underuse of beneficial testing and treatments, for example the use of angiotensin‐converting enzyme inhibitors in systolic heart failure. We found that improving quality by curbing overuse was a new idea for many physicians. Traditionally, physicians have struggled with cost reduction programs, feeling that efforts to reduce costs are indifferent to quality of care, and worse, may actually lead to inferior care.[22] The historical separation of most QI and cost reduction programs has likely furthered this sentiment. Our first projects married cost reduction and QI efforts by demonstrating how reducing overuse could provide an opportunity to increase quality and reduce harms from treatments. For example, transitioning from nebs to metered‐dose inhalers offered the chance to provide inpatient inhaler teaching, whereas decreasing proton pump inhibitor use can reduce the incidence of C difficile. By framing these projects as addressing both numerator and denominator of the value equation, we were able to align our cost‐reduction efforts with physicians' traditional notions of QI.
Cost Transparency
If physicians are to play a larger role in cost‐reduction efforts, they need at least a working understanding of fixed and variable costs in healthcare and of institutional prices.[23, 24] Utilization and clear information about costs were used to guide our interventions and ensured that the efforts spent to eliminate waste would result in cost savings. As an example, we learned that decreasing nebulizer use without a corresponding decrease in daily RT staffing would lead to minimal cost savings. These analyses require the support of business, financial, and resource managers in addition to physicians, nurses, project coordinators, and administrators. At many institutions the lack of price and utilization transparency presents a major barrier to the accurate analysis of cost‐reduction efforts.
The Diplomacy of Cost‐Reduction
Because the bulk of healthcare costs go to labor, efforts to reduce cost may lead to reductions in the resources available to certain departments or even to individuals' wages. For example, initiatives aimed at reducing inappropriate diagnostic imaging will affect the radiology department, which is partially paid based on the volume of studies performed.[25] Key stakeholders must be identified early, and project leaders should seek understanding, engagement, and buy‐in from involved parties prior to implementation. There will often be times that support from senior leaders will be needed to negotiate these tricky situations.
Although we benefited from a largely supportive hospital medicine faculty and resident physicians, not all of our proposed projects made it to implementation. Sometimes stakeholder recruitment proved to be difficult. For instance, a proposed project to change the protocol from routine to clinically indicated peripheral intravenous catheter replacement for adult inpatients was met with some resistance by some members of nursing management. We reviewed the literature together and discussed in length the proposal, but ultimately decided that our institution was not ready for this change at this time.
Limitations and Next Steps
Our goal is to provide guidance on exporting the approach of our HVC program to other institutions, but there may be several limitations. First, our strategy relied on several contributing factors that may be unique to our institution. We had engaged frontline physician champions, who may not be available or have the necessary support at other academic or community organizations. Our UCSF cost awareness curriculum provided an educational foundation and framework for our projects. We also had institutional commitment in the form of our medical center division administrator.
Second, there are up‐front costs to running our committee, which are primarily related to personnel funding as described in the Methods. Over the next year we aim to calculate cost‐effectiveness ratios for our projects and overall return on investment for each of our projects, as we have done for the Nebs No More After 24 project (see Supporting Information, Table 1, in the online version of this article). Based on this analysis, the modest upfront costs appear to be easily recouped over the course of the year.
We have anecdotally noted a culture change in the way that our physicians discuss and consider testing. For example, it is common now to hear ward teams on morning rounds consider the costs of testing or discuss the need for prophylactic proton pump inhibitors. An important next step for our HVC program is the building of better data infrastructures for our own electronic health record system to allow us to more quickly, accurately, and comprehensively identify new targets and monitor the progress and sustainability of our projects. The Institute of Medicine has noted that the adoption of technology is a key strategy to creating a continuously learning healthcare system.[1] It is our hope that through consistent audit and feedback of resource utilization we can translate our early gains into sustainable changes in practice.
Furthermore, we hope to target and enact additional organizational changes, including creating CPOE‐linked interventions to help reinforce and further our objectives. We believe that creating systems that make it easier to do the right thing will help the cause of embedding HVC practices throughout our medical center. We have begun to scale some of our projects, such as the Nebs No More After 24 campaign, medical center wide, and ultimately we hope to disseminate successful projects and models beyond our medical center to contribute to the national movement to provide the best care at lower costs.
As discussed above, our interventions are targeted at simultaneous improvements in quality with decreased costs. However, the goal is not to hide our cost interventions behind the banner of quality. We believe that there is a shifting culture that is increasingly ready to accept cost alone as a meaningful patient harm, worthy of interventions on its own merits, assuming that quality and safety remain stable.[26, 27]
CONCLUSIONS
Our HVC program has been successful in promoting improved healthcare value and engaging clinicians in this effort. The program is guided by the use of financial data to identify areas with clear evidence of waste in the hospital, the creation of evidence‐based interventions that improve quality of care while cutting costs, and the pairing of interventions with evidence‐based cost awareness education to drive culture change.
Acknowledgements
The authors acknowledge the following members of the UCSF Division of Hospital Medicine High‐Value Care Committee who have led some of the initiatives mentioned in this article and have directly contributed to Table 1: Dr. Stephanie Rennke, Dr. Alvin Rajkomar, Dr. Nader Najafi, Dr. Steven Ludwin, and Dr. Elizabeth Stewart. Dr. Russ Cucina particularly contributed to the designs and implementation of electronic medical record interventions.
Disclosures: Dr. Moriates received funding from the UCSF Center for Healthcare Value, the Agency for Healthcare Research and Quality (as editor for AHRQ Patient Safety Net), and the ABIM Foundation. Mrs. Novelero received funding from the UCSF Center for Healthcare Value. Dr. Wachter reports serving as the immediate past‐chair of the American Board of Internal Medicine (for which he received a stipend) and is a current member of the ABIM Foundation board; receiving a contract to UCSF from the Agency for Healthcare Research and Quality for editing 2 patient‐safety websites; receiving compensation from John Wiley & Sons for writing a blog; receiving compensation from QuantiaMD for editing and presenting patient safety educational modules; receiving royalties from Lippincott Williams & Wilkins and McGraw‐Hill for writing/editing several books; receiving a stipend and stock/options for serving on the Board of Directors of IPC‐The Hospitalist Company; serving on the scientific advisory boards for PatientSafe Solutions, CRISI, SmartDose, and EarlySense (for which he receives stock options); and holding the Benioff endowed chair in hospital medicine from Marc and Lynne Benioff. He is also a member of the Board of Directors of Salem Hospital, Salem, Oregon, for which he receives travel reimbursement but no compensation. Mr. John Hillman, Mr. Aseem Bharti, and Ms. Claudia Hermann from UCSF Decision Support Services provided financial data support and analyses, and the UCSF Center for Healthcare Value provided resource and financial support.
- Institute of Medicine. Committee on the Learning Health Care System in America. Best Care at Lower Cost: The Path to Continuously Learning Health Care in America. Washington, DC: National Academies Press; 2012.
- , . Value‐based purchasing—national programs to move from volume to value. N Engl J Med. 2012;367(4):292–295.
- . Making good on ACOs' promise—the final rule for the Medicare Shared Savings Program. N Engl J Med. 2011;365(19):1753–1756.
- . American College of Physicians ethics manual: sixth edition. Ann Intern Med. 2012;156(1 pt 2):73–104.
- ABIM Foundation, American College of Physicians‐American Society of Internal Medicine, European Federation of Internal Medicine. Medical professionalism in the new millennium: a physician charter. Ann Intern Med. 2002;136(3):243–246.
- , . Choosing Wisely: helping physicians and patients make smart decisions about their care. JAMA. 2012;307(17):1801.
- , , , . High‐value, cost‐conscious health care: concepts for clinicians to evaluate the benefits, harms, and costs of medical interventions. Ann Intern Med. 2011;154(3):174–180.
- , . Waste not, want not: promoting efficient use of health care resources. Ann Intern Med. 2013;158(1):67–68.
- , , . General pediatric attending physicians' and residents' knowledge of inpatient hospital finances. Pediatrics. 2013;131(6):1072–1080.
- , , . Hospitalists' awareness of patient charges associated with inpatient care. J Hosp Med. 2010;5(5):295–297.
- , , , , . Teaching residents to provide cost‐conscious care: A national survey of residency program directors. JAMA Intern Med. 2014;174(3):470–472.
- , , . Perceived, actual, and desired knowledge regarding medicare billing and reimbursement. J Gen Intern Med. 2006;21(5):466–470.
- , , , , . “Nebs No More After 24”: a pilot program to improve the use of appropriate respiratory therapies. JAMA Intern Med. 2013;173(17):1647–1648.
- , , , . Acid‐suppressive medication use and the risk for hospital‐acquired pneumonia. JAMA. 2009;301(20):2120–2128.
- , , , et al. Iatrogenic gastric acid suppression and the risk of nosocomial Clostridium difficile infection. Arch Intern Med. 2010;170(9):784–790.
- , , , . The value in the evidence: teaching residents to “choose wisely.” JAMA Intern Med.2013;173(4):308–310.
- , . Evidence‐based quality improvement: the state of the science. Health Aff. 2005;24(1):138–150.
- , , , . The role of physician engagement on the impact of the hospital‐based practice improvement module (PIM). J Hosp Med. 2009;4(8):466–470.
- , . Finding common cause in quality: confronting the physician engagement challenge. Physician Exec. 2008;34(2):26–28, 30–31.
- , . Engaging physicians and leveraging professionalism: a key to success for quality measurement and improvement. JAMA. 2012;308(10):979–980.
- , , et al. The development and implementation of a bundled quality improvement initiative to reduce inappropriate stress ulcer prophylaxis. ICU Dir. 2013;4(6):322–325.
- . Lost in translation: physicians' struggle with cost‐reduction programs. Ann Intern Med. 2011;154(6):430–433.
- , . How to solve the cost crisis in health care. Harv Bus Rev. 2011;89(9):46–52, 54, 56–61 passim.
- , , , . The savings illusion—why clinical quality improvement fails to deliver bottom‐line results. N Engl J Med. 2011;365(26):e48.
- , , , , . Reducing radiology use on an inpatient medical service: choosing wisely. Arch Intern Med. 2012;172(20):1606–1608.
- , , . First, do no (financial) harm. JAMA. 2013;310(6):577–578.
- , , . Full disclosure—out‐of‐pocket costs as side effects. N Engl J Med. 2013;369(16):1484–1486.
With a United States medical system that spends as much as $750 billion each year on care that does not result in improved health outcomes,[1] many policy initiatives, including the Centers for Medicare and Medicaid Services' Value‐Based Purchasing program, seek to realign hospitals' financial incentives from a focus on production to one on value (quality divided by cost).[2, 3] Professional organizations have now deemed resource stewardship an ethical responsibility for professionalism,[4, 5] and campaigns such as the American Board of Internal Medicine (ABIM) Foundation's Choosing Wisely effort and the American College of Physicians' High‐Value Care platform are calling on frontline clinicians to address unnecessary and wasteful services.[6, 7]
Despite these pressures and initiatives, most physicians lack the knowledge and tools necessary to prioritize the delivery of their own healthcare services according to value.[8, 9, 10] Hospital medicine physicians are unaware of the costs associated with the interventions they order,[10] and the majority of medical training programs lack curricula focused on healthcare costs,[11] creating a large gap between physicians' perceived, desired, and actual knowledge related to costs.[12] Novel frameworks and frontline physician engagement are required if clinicians are to improve the value of the care they deliver.
We describe 1 of our first steps at the University of California, San Francisco (UCSF) to promote high‐value care (HVC) delivery: the creation of a HVC program led by clinicians and administrators focused on identifying and addressing wasteful practices within our hospitalist group. The program aims to (1) use financial and clinical data to identify areas with clear evidence of waste in the hospital, (2) promote evidence‐based interventions that improve both quality of care and value, and (3) pair interventions with evidence‐based cost awareness education to drive culture change. Our experience and inaugural projects provide a model of the key features, inherent challenges, and lessons learned, which may help inform similar efforts.
METHODS
In March 2012, we launched an HVC program within our Division of Hospital Medicine at UCSF Medical Center, a 600‐bed academic medical center in an urban setting. During the 2013 academic year, our division included 45 physicians. The medicine service, comprised of 8 teaching medical ward teams (1 attending, 1 resident, 2 interns, and variable number of medical students), and 1 nonteaching medical ward team (1 attending), admitted 4700 patients that year.
Organizational Framework
The HVC program is co‐led by a UCSF hospitalist (C.M.) and the administrator of the Division of Hospital Medicine (M.N.). Team members include hospitalists, hospital medicine fellows, resident physicians, pharmacists, project coordinators, and other administrators. The team meets in person for 1 hour every month. Project teams and ad hoc subcommittee groups often convene between meetings.
Our HVC program was placed within the infrastructure, and under the leadership, of our already established quality improvement (QI) program at UCSF. Our Division of Hospital Medicine Director of Quality and Safety (M.M.) thus oversees the QI, patient safety, patient experience, and high‐value care efforts.
The HVC program funding is largely in personnel costs. The physician leader (15% effort) is funded by the Division of Hospital Medicine, whereas the administrator is cofunded by both the division and by the medical center (largely through her roles as both division administrator and service line director). An administrative assistant within the division is also assigned to help with administrative tasks. Some additional data gathering and project support comes from existing medical center QI infrastructure, the decision support services unit, and through UCSF's new Center for Healthcare Value. Other ancillary costs for our projects have included publicity, data analytics, and information technology infrastructure. We estimate that the costs of this program are approximately $50,000 to $75,000 annually.
Framework for Identifying Target Projects
Robust Analysis of Costs
We created a framework for identifying, designing, and promoting projects specifically aimed at improving healthcare value (Figure 1). Financial data were used to identify areas with clear evidence of waste in the hospital, areas of high cost with no benefit in health outcomes. We focused particularly on obtaining cost and billing data for our medical service, which provided important insight into potential targets for improvements in value. For example, in 2011, the Division of Hospital Medicine spent more than $1 million annually in direct costs for the administration of nebulized bronchodilator therapies (nebs) to nonintensive care unit patients on the medical service.[13] These high costs, exposed by billing data, were believed to represent potential unnecessary testing and/or procedures. Not every area of high cost was deemed a target for intervention. For example, the use of recombinant factor VIII appeared a necessary expenditure (over $1 million per year) for our patients with hemophilia. Although our efforts focused on reducing waste, it is worth noting that healthcare value can also be increased by improving the delivery of high‐value services.
Recognized Benefits in Quality of Care
The program also evaluated the impact of cost reduction efforts on the quality of care, based on a high standard of current evidence. Though value can be improved by interventions that decrease costs while being quality neutral, our group chose to focus first on projects that would simultaneously improve quality while decreasing costs. We felt that this win‐win strategy would help obtain buy‐in from clinicians weary of prior cost‐cutting programs. For example, we pursued interventions aimed at reducing inappropriate gastric stress ulcer prophylaxis, which had the potential to both cut costs and minimize risks of hospital‐acquired pneumonia and Clostridium difficile infections.[14, 15] All proposed HVC targets were vetted through a review of the literature and published guidelines. In general, our initial projects had to be strongly supported by evidence, with high‐quality studies, preferably meta‐analyses or systematic reviews, that displayed the safety of our recommended changes. We reviewed the literature with experts. For example, we met with faculty pulmonologists to discuss the evidence supporting the use of inhalers instead of nebulizers in adults with obstructive pulmonary disease. The goals of our projects were chosen by our HVC committee, based on an analysis of our baseline data and the perceived potential effects of our proposed interventions.
Educational Intervention
Last, we paired interventions with evidence‐based cost awareness education to drive culture change. At UCSF we have an ongoing longitudinal cost‐awareness curriculum for residents, which has previously been described.[16] We took advantage of this educational forum to address gaps in clinician knowledge related to the targeted areas. When launching the initiative to decrease unnecessary inpatient nebulizer usage and improve transitions to inhalers, we utilized the chronic obstructive pulmonary disease case in the cost‐awareness series. Doing so allowed us to both review the evidence behind the effectiveness of inhalers, and introduce our Nebs No More After 24 campaign, which sought to transition adult inpatients with obstructive pulmonary symptoms from nebs to inhalers within 24 hours of admission.[13]
Intervention Strategy
Our general approach has been to design and implement multifaceted interventions, adapted from previous QI literature (Figure 1).[17] Given the importance of frontline clinician engagement to successful project implementation,[18, 19, 20] our interventions are physician‐driven and are vetted by a large group of clinicians prior to launch. The HVC program also explicitly seeks stakeholder input, perspective, and buy‐in prior to implementation. For example, we involved respiratory therapists (RTs) in the design of the Nebs No More After 24 project, thus ensuring that the interventions fit within their workflow and align with their care‐delivery goals.
Local publicity campaigns provide education and reminders for clinicians. Posters, such as the Nebs No More After 24 poster (Figure 2), were hung in physician, nursing, and RT work areas. Pens featuring the catchphrase Nebs No More After 24 were distributed to clinicians.
In addition to presentations to residents through the UCSF cost awareness curriculum, educational presentations were also delivered to attending physicians and to other allied members of the healthcare team (eg, nurses, RTs) during regularly scheduled staff meetings.
The metrics for each of the projects were regularly monitored, and targeted feedback was provided to clinicians. For the Nebs No More After 24 campaign, data for the number of nebs delivered on the target floor were provided to resident physicians during the cost awareness conference each month, and the data were presented to attending hospitalists in the monthly QI newsletter. This academic year, transfusion and telemetry data are presented via the same strategy.
Stakeholder recruitment, education, and promotional campaigns are important to program launches, but to sustain projects over the long‐term, system changes may be necessary. We have pursued changes in the computerized provider order entry (CPOE) system, such as removing nebs from the admission order set or putting a default duration for certain telemetry orders. Systems‐level interventions, although more difficult to achieve, play an important role in creating enduring changes when paired with educational interventions.
RESULTS
During our first 2 years we have initiated ongoing projects directed at 6 major targets (Table 1). Our flagship project, Nebs No More After 24, resulted in a decrease of nebulizer rates by more than 50% on a high‐acuity medical floor, as previously published.[13] We created a financial model that primarily accounted for RT time and pharmaceutical costs, and estimated a savings of approximately $250,000 annually on this single medical ward (see Supporting Information, Table 1, in the online version of this article).[13]
| High‐Value Care Projects | Relevant Baseline Data | Goals of Project | Strategies |
|---|---|---|---|
| |||
| Nebs No More After 24: Improving appropriate use of respiratory services | The medicine service spent $1 million in direct costs on approximately 25,000 nebs for non‐ICU inpatients. | Reduce unnecessary nebs >15% over 9 months. | Removed nebs from admit order set. |
| Improve transitions from nebs to MDIs. | Enlisted RTs and RNs to help with MDI teaching for patients. | ||
| Improve patient self‐administration of MDIs. | Implemented an educational program for medicine physicians. | ||
| Created local publicity: posters, flyers, and pens. | |||
| Provided data feedback to providers. | |||
| Next step: Introduce a CPOE‐linked intervention. | |||
| Improving use of stress ulcer prophylaxis | 77% of ICU patients on acid suppressive therapy; 31% of these patients did not meet criteria for appropriate prophylaxis. | Reduce overuse and inappropriate use of SUP. | A team of pharmacists, nurses, and physicians developed targeted and evidence‐based UCSF guidelines on use of SUP. |
| Developed and implemented a pharmacist‐led intervention to reduce inappropriate SUP in the ICUs that included the following: | |||
| Reminders on admission and discharge from ICU | |||
| Education and awareness initiative for prescribers | |||
| ICU and service champions | |||
| Culture change | |||
| Next step: Incorporate indications in CPOE and work with ICU to incorporate appropriate GI prophylaxis as part of the standard ICU care bundle. | |||
| Blood utilization stewardship | 30% of transfusions on the hospital medicine service are provided to patients with a hemoglobin >8 g/dL. | Decrease units of blood transfused for a hemoglobin >8.0 g/dL by 25%. | Launched an educational campaign for attending and resident physicians. |
| Monthly feedback to residents and attending physicians. | |||
| Next step: Introduce a decision support system in the CPOE for blood transfusion orders in patients with most recent hemoglobin level >8. | |||
| Improving telemetry utilization | 44% of monitored inpatients on the medical service (with length of stay >48 hours) remain on telemetry until discharge. | Decrease by 15% the number of patients (with length of stay >48 hours) who remain on telemetry until discharge. | Implemented an educational campaign for nursing groups and the medicine and cardiology housestaff. |
| Launched a messaging campaign consisting of posters and pocket cards on appropriate telemetry use. | |||
| Designed a feedback campaign with monthly e‐mail to housestaff on their ward team's telemetry use stats. | |||
| Next step: Build a CPOE intervention that asks users to specify an approved indication for telemetry when they order monitoring. The indication then dictates how long the order is active (24, 48, 72 hours or ongoing), and the MD must renew the order after the elapsed time. | |||
| iReduce iCal: ordering ionized calcium only when needed | The medicine service spent $167,000 in direct costs on iCal labs over a year (40% of all calcium lab orders; 42% occurred in non‐ICU patients). | Reduce number of iCal labs drawn on the medicine service by >25% over the course of 6 months. | With the introduction of CPOE, iCal was removed from traditional daily lab order sets. |
| Discussed with lab, renal, and ICU stakeholders. | |||
| Implemented an educational campaign for physicians and nurses. | |||
| Created local publicity: posters and candies. | |||
| Provided data feedback to providers. | |||
| Repeat inpatient echocardiograms | 25% of TTEs are performed within 6 months of a prior; one‐third of these are for inappropriate indications. | Decrease inappropriate repeat TTEs by 25%. | Implemented an educational campaign. |
| Next step: provide the most recent TTE results in the CPOE at time of order, and provide auditing and decision support for repeat TTEs. | |||
The HVC program also provided an arena for collaborating with and supporting value‐based projects launched by other groups, such as the UCSF Medication Outcomes Center's inappropriate gastric stress ulcer prophylaxis program.[21] Our group helped support the development and implementation of evidence‐based clinical practice guidelines, and we assisted educational interventions targeting clinicians. This program resulted in a decrease in inappropriate stress ulcer prophylaxis in intensive care unit patients from 19% to 6.6% within 1 month following implementation.[21]
DISCUSSION
Physicians are increasingly being asked to embrace and lead efforts to improve healthcare value and reduce costs. Our program provides a framework to guide physician‐led initiatives to identify and address areas of healthcare waste.
Challenges and Lessons Learned
Overcoming the Hurdle of More Care as Better Care
Improving the quality of care has traditionally stressed the underuse of beneficial testing and treatments, for example the use of angiotensin‐converting enzyme inhibitors in systolic heart failure. We found that improving quality by curbing overuse was a new idea for many physicians. Traditionally, physicians have struggled with cost reduction programs, feeling that efforts to reduce costs are indifferent to quality of care, and worse, may actually lead to inferior care.[22] The historical separation of most QI and cost reduction programs has likely furthered this sentiment. Our first projects married cost reduction and QI efforts by demonstrating how reducing overuse could provide an opportunity to increase quality and reduce harms from treatments. For example, transitioning from nebs to metered‐dose inhalers offered the chance to provide inpatient inhaler teaching, whereas decreasing proton pump inhibitor use can reduce the incidence of C difficile. By framing these projects as addressing both numerator and denominator of the value equation, we were able to align our cost‐reduction efforts with physicians' traditional notions of QI.
Cost Transparency
If physicians are to play a larger role in cost‐reduction efforts, they need at least a working understanding of fixed and variable costs in healthcare and of institutional prices.[23, 24] Utilization and clear information about costs were used to guide our interventions and ensured that the efforts spent to eliminate waste would result in cost savings. As an example, we learned that decreasing nebulizer use without a corresponding decrease in daily RT staffing would lead to minimal cost savings. These analyses require the support of business, financial, and resource managers in addition to physicians, nurses, project coordinators, and administrators. At many institutions the lack of price and utilization transparency presents a major barrier to the accurate analysis of cost‐reduction efforts.
The Diplomacy of Cost‐Reduction
Because the bulk of healthcare costs go to labor, efforts to reduce cost may lead to reductions in the resources available to certain departments or even to individuals' wages. For example, initiatives aimed at reducing inappropriate diagnostic imaging will affect the radiology department, which is partially paid based on the volume of studies performed.[25] Key stakeholders must be identified early, and project leaders should seek understanding, engagement, and buy‐in from involved parties prior to implementation. There will often be times that support from senior leaders will be needed to negotiate these tricky situations.
Although we benefited from a largely supportive hospital medicine faculty and resident physicians, not all of our proposed projects made it to implementation. Sometimes stakeholder recruitment proved to be difficult. For instance, a proposed project to change the protocol from routine to clinically indicated peripheral intravenous catheter replacement for adult inpatients was met with some resistance by some members of nursing management. We reviewed the literature together and discussed in length the proposal, but ultimately decided that our institution was not ready for this change at this time.
Limitations and Next Steps
Our goal is to provide guidance on exporting the approach of our HVC program to other institutions, but there may be several limitations. First, our strategy relied on several contributing factors that may be unique to our institution. We had engaged frontline physician champions, who may not be available or have the necessary support at other academic or community organizations. Our UCSF cost awareness curriculum provided an educational foundation and framework for our projects. We also had institutional commitment in the form of our medical center division administrator.
Second, there are up‐front costs to running our committee, which are primarily related to personnel funding as described in the Methods. Over the next year we aim to calculate cost‐effectiveness ratios for our projects and overall return on investment for each of our projects, as we have done for the Nebs No More After 24 project (see Supporting Information, Table 1, in the online version of this article). Based on this analysis, the modest upfront costs appear to be easily recouped over the course of the year.
We have anecdotally noted a culture change in the way that our physicians discuss and consider testing. For example, it is common now to hear ward teams on morning rounds consider the costs of testing or discuss the need for prophylactic proton pump inhibitors. An important next step for our HVC program is the building of better data infrastructures for our own electronic health record system to allow us to more quickly, accurately, and comprehensively identify new targets and monitor the progress and sustainability of our projects. The Institute of Medicine has noted that the adoption of technology is a key strategy to creating a continuously learning healthcare system.[1] It is our hope that through consistent audit and feedback of resource utilization we can translate our early gains into sustainable changes in practice.
Furthermore, we hope to target and enact additional organizational changes, including creating CPOE‐linked interventions to help reinforce and further our objectives. We believe that creating systems that make it easier to do the right thing will help the cause of embedding HVC practices throughout our medical center. We have begun to scale some of our projects, such as the Nebs No More After 24 campaign, medical center wide, and ultimately we hope to disseminate successful projects and models beyond our medical center to contribute to the national movement to provide the best care at lower costs.
As discussed above, our interventions are targeted at simultaneous improvements in quality with decreased costs. However, the goal is not to hide our cost interventions behind the banner of quality. We believe that there is a shifting culture that is increasingly ready to accept cost alone as a meaningful patient harm, worthy of interventions on its own merits, assuming that quality and safety remain stable.[26, 27]
CONCLUSIONS
Our HVC program has been successful in promoting improved healthcare value and engaging clinicians in this effort. The program is guided by the use of financial data to identify areas with clear evidence of waste in the hospital, the creation of evidence‐based interventions that improve quality of care while cutting costs, and the pairing of interventions with evidence‐based cost awareness education to drive culture change.
Acknowledgements
The authors acknowledge the following members of the UCSF Division of Hospital Medicine High‐Value Care Committee who have led some of the initiatives mentioned in this article and have directly contributed to Table 1: Dr. Stephanie Rennke, Dr. Alvin Rajkomar, Dr. Nader Najafi, Dr. Steven Ludwin, and Dr. Elizabeth Stewart. Dr. Russ Cucina particularly contributed to the designs and implementation of electronic medical record interventions.
Disclosures: Dr. Moriates received funding from the UCSF Center for Healthcare Value, the Agency for Healthcare Research and Quality (as editor for AHRQ Patient Safety Net), and the ABIM Foundation. Mrs. Novelero received funding from the UCSF Center for Healthcare Value. Dr. Wachter reports serving as the immediate past‐chair of the American Board of Internal Medicine (for which he received a stipend) and is a current member of the ABIM Foundation board; receiving a contract to UCSF from the Agency for Healthcare Research and Quality for editing 2 patient‐safety websites; receiving compensation from John Wiley & Sons for writing a blog; receiving compensation from QuantiaMD for editing and presenting patient safety educational modules; receiving royalties from Lippincott Williams & Wilkins and McGraw‐Hill for writing/editing several books; receiving a stipend and stock/options for serving on the Board of Directors of IPC‐The Hospitalist Company; serving on the scientific advisory boards for PatientSafe Solutions, CRISI, SmartDose, and EarlySense (for which he receives stock options); and holding the Benioff endowed chair in hospital medicine from Marc and Lynne Benioff. He is also a member of the Board of Directors of Salem Hospital, Salem, Oregon, for which he receives travel reimbursement but no compensation. Mr. John Hillman, Mr. Aseem Bharti, and Ms. Claudia Hermann from UCSF Decision Support Services provided financial data support and analyses, and the UCSF Center for Healthcare Value provided resource and financial support.
- Institute of Medicine. Committee on the Learning Health Care System in America. Best Care at Lower Cost: The Path to Continuously Learning Health Care in America. Washington, DC: National Academies Press; 2012.
- , . Value‐based purchasing—national programs to move from volume to value. N Engl J Med. 2012;367(4):292–295.
- . Making good on ACOs' promise—the final rule for the Medicare Shared Savings Program. N Engl J Med. 2011;365(19):1753–1756.
- . American College of Physicians ethics manual: sixth edition. Ann Intern Med. 2012;156(1 pt 2):73–104.
- ABIM Foundation, American College of Physicians‐American Society of Internal Medicine, European Federation of Internal Medicine. Medical professionalism in the new millennium: a physician charter. Ann Intern Med. 2002;136(3):243–246.
- , . Choosing Wisely: helping physicians and patients make smart decisions about their care. JAMA. 2012;307(17):1801.
- , , , . High‐value, cost‐conscious health care: concepts for clinicians to evaluate the benefits, harms, and costs of medical interventions. Ann Intern Med. 2011;154(3):174–180.
- , . Waste not, want not: promoting efficient use of health care resources. Ann Intern Med. 2013;158(1):67–68.
- , , . General pediatric attending physicians' and residents' knowledge of inpatient hospital finances. Pediatrics. 2013;131(6):1072–1080.
- , , . Hospitalists' awareness of patient charges associated with inpatient care. J Hosp Med. 2010;5(5):295–297.
- , , , , . Teaching residents to provide cost‐conscious care: A national survey of residency program directors. JAMA Intern Med. 2014;174(3):470–472.
- , , . Perceived, actual, and desired knowledge regarding medicare billing and reimbursement. J Gen Intern Med. 2006;21(5):466–470.
- , , , , . “Nebs No More After 24”: a pilot program to improve the use of appropriate respiratory therapies. JAMA Intern Med. 2013;173(17):1647–1648.
- , , , . Acid‐suppressive medication use and the risk for hospital‐acquired pneumonia. JAMA. 2009;301(20):2120–2128.
- , , , et al. Iatrogenic gastric acid suppression and the risk of nosocomial Clostridium difficile infection. Arch Intern Med. 2010;170(9):784–790.
- , , , . The value in the evidence: teaching residents to “choose wisely.” JAMA Intern Med.2013;173(4):308–310.
- , . Evidence‐based quality improvement: the state of the science. Health Aff. 2005;24(1):138–150.
- , , , . The role of physician engagement on the impact of the hospital‐based practice improvement module (PIM). J Hosp Med. 2009;4(8):466–470.
- , . Finding common cause in quality: confronting the physician engagement challenge. Physician Exec. 2008;34(2):26–28, 30–31.
- , . Engaging physicians and leveraging professionalism: a key to success for quality measurement and improvement. JAMA. 2012;308(10):979–980.
- , , et al. The development and implementation of a bundled quality improvement initiative to reduce inappropriate stress ulcer prophylaxis. ICU Dir. 2013;4(6):322–325.
- . Lost in translation: physicians' struggle with cost‐reduction programs. Ann Intern Med. 2011;154(6):430–433.
- , . How to solve the cost crisis in health care. Harv Bus Rev. 2011;89(9):46–52, 54, 56–61 passim.
- , , , . The savings illusion—why clinical quality improvement fails to deliver bottom‐line results. N Engl J Med. 2011;365(26):e48.
- , , , , . Reducing radiology use on an inpatient medical service: choosing wisely. Arch Intern Med. 2012;172(20):1606–1608.
- , , . First, do no (financial) harm. JAMA. 2013;310(6):577–578.
- , , . Full disclosure—out‐of‐pocket costs as side effects. N Engl J Med. 2013;369(16):1484–1486.
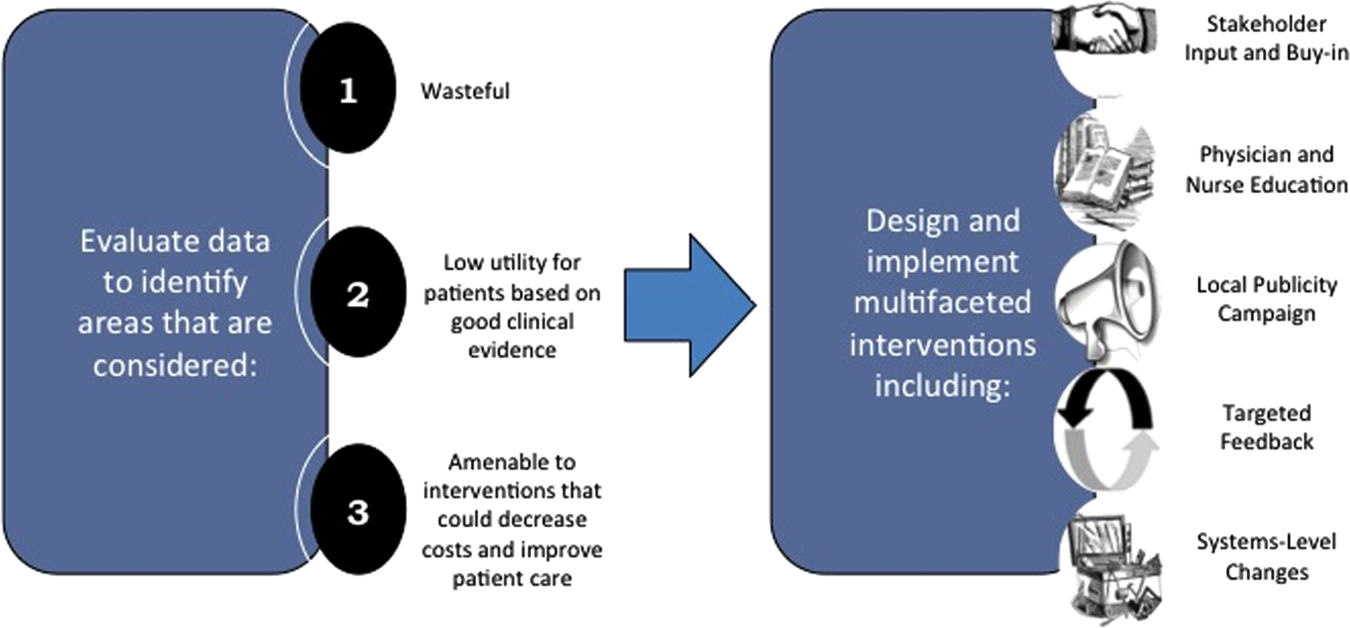
A3 to Improve STAT
STAT is an abbreviation of the Latin word statim, meaning immediately,[1] and has been a part of healthcare's lexicon for almost as long as there have been hospitals. STAT conveys a sense of urgency, compelling those who hear STAT to act quickly. Unfortunately, given the lack of a consistent understanding of STAT, the term in reality often has an alternate use: to hurry up or to complete sooner than routine, and is sometimes used to circumvent a system that is perceived to be too slow to accomplish a routine task in a timely manner.
As part of a larger systems redesign effort to improve patient safety and quality of care, an institutional review board (IRB)‐approved qualitative study was conducted on 2 medical‐surgical units in a US Department of Veterans Affairs (VA) hospital to explore communication patterns between physicians and nurses.[2] The study revealed wide variation in understanding between physicians and nurses on the ordering and administration of STAT medication. Physicians were unaware that when they placed a STAT order into the computerized patient record system (CPRS), nurses were not automatically alerted about the order. At this facility, nurses did not carry pagers. Although each unit had a supply of wireless telephones, they were often unreliable and therefore not used consistently. Nurses were required by policy to check the CPRS for new orders every 2 hours. This was an inefficient and possibly dangerous process,[3] because if a nurse was not expecting a STAT order, 2 hours could elapse before she or he saw the order in the CPRS and began to look for the medication. A follow‐up survey completed by physicians, nurses, pharmacists, and pharmacy technicians demonstrated stark differences on the definition of STAT and overlap with similar terms such as NOW and ASAP. Interviews with ordering providers indicated that 36% of the time a STAT was ordered it was not clinically urgent, but instead ordered STAT to speed up the process.
The STAT medication process was clearly in need of improvement, but previous quality improvement projects in our organization had varying degrees of success. For example, we used Lean methodology in an attempt to improve our discharge process. We conducted a modified rapid process discharge improvement workshop[4] structured in phases over 4 weeks. During the workshops, a strong emphasis remained on the solutions to the problem, and we were unable to help the team move from a mindset of fix it to create it. This limited the buy‐in of team members, the creativity of their ideas for improvement, and ultimately the momentum to improve the process.
In this article we describe our adaptation of A3 Thinking,[5, 6] a structure for guiding quality improvement based in Lean methodology, to improve the STAT medication process. We chose A3 Thinking for several reasons. A3 Thinking focuses on process improvement and thus aligned well with our interest in improving the STAT medication process. A3 Thinking also reveals otherwise hidden nonvalue‐added activities that should be eliminated.[7] Finally A3 Thinking reinforces a deeper understanding of the way the work is currently being done, providing critical information needed before making a change. This provides a tremendous opportunity to look at work differently and see opportunities for improvement.[8] Given these strengths as well as the lack of congruence between what the STAT process should consist of and how the STAT process was actually being used in our organization, A3 Thinking offered the best fit between an improvement process and the problem to be solved.
METHODS
A search of healthcare literature yielded very few studies on the STAT process.[9, 10] Only 1 intervention to improve the process was found, and this focused on a specific procedure.[10] An informal survey of local VA and non‐VA hospitals regarding their experiences with the STAT medication process revealed insufficient information to aid our efforts. We next searched the business and manufacturing literature and found examples of how the Lean methodology was successfully applied to other problems in healthcare, including improving pediatric surgery workflow and decreasing ventilator‐associated pneumonia.[11, 12]
Therefore, the STAT project was structured to adapt a problem‐solving process commonly used in Lean organizationsA3 Thinkingwhich challenges team members to work through a discovery phase to develop a shared understanding of the process, an envisioning phase to conceptualize an ideal process experience, and finally an experimentation phase to identify and trial possible solutions through prioritization, iterative testing, structured reflection, and adjustment on resulting changes. Our application of the term experimentation in this context is distinct from that of controlled experimentation in clinical research; the term is intended to convey iterative learning as changes are tested, evaluated, and modified during this quality improvement project. Figure 1 displays a conceptual model of our adaptation of A3 Thinking. As this was a quality‐improvement project, it was exempt from IRB review.

DISCOVERY
To begin the discovery phase, a workgroup consisting of representatives of all groups that had a role in the STAT process (ie, physician, pharmacist, nurse, pharmacy technician, clerk) gathered to identify the opportunity we are looking to address and learn from each other's individual experiences with the STAT medication process. The group was facilitated by an industrial engineer familiar with the A3 Thinking process. The team completed a mapping exercise to lay out, step‐by‐step, the current STAT medication process. This activity allowed the team to build shared empathy with others' experiences and to appreciate the challenges experienced by others through their individual responsibilities in the process. The current process was found to consist of 4 overarching components: a provider entered the STAT order into the CPRS; the order was verified by a pharmacist; a pharmacy technician delivered the medication to the unit (or a nurse retrieved the medication from the Omnicell (Omnicell Inc., Mountain View, CA), a proprietary automated medication dispensing system); and finally the nurse administered the medication to a patient.
A large, color‐coded flow map of the STAT medication process was constructed over several meetings to capture all perspectives and allow team members to gather feedback from their peers. To further our understanding of the current process, the team participated in a modified Go to the Gemba (ie, go to where the work is done)[13] on a real‐time STAT order. Once all workgroup members were satisfied that the flow map represented the current state of the STAT medication process, we came to a consensus on the goals needed to meet our main objective.
We agreed that our main objective was that STAT medication orders should be recognized, verified, and administered to patients in a timely and appropriate manner to ensure quality care. We identified 3 goals to meet this objective: (1) STAT should be consistently defined and understood by everyone; (2) an easy, intuitive STAT process should be available for all stakeholders; and (3) the STAT process should be transparent and ideally visual so that everyone involved can understand at which point in the process a specific STAT order is currently situated. We also identified additional information we would need to reach the goals.
Shortly after the process‐mapping sessions, 2 workgroup members conducted real‐time STAT order time studies to track medications from order to administration. Three time periods in the STAT process were identified for observation and measurement: the time from physician order entry in the CPRS to the time a pharmacist verified the medication, the time from verification to when the medication arrived on the nursing unit, and the time from arrival on the nursing unit to when that medication was administered. Using a data‐collection template, each time period was recorded, and 28 time studies were collected over 1 month. To monitor the progress of our initiatives, the time study was repeated 3 months into the project.
ENVISIONING
Following the discovery phase, the team was better equipped to identify the specific changes needed to achieve an improved process. The envisioning phase allowed the team freedom to imagine an ideal process barring any preconceived notion of constraints within the current process.
In 2 meetings we brainstormed as many improvement ideas as possible. To prioritize and focus our ideas, we developed a matrix (see Supporting Information, Appendix A, in the online version of this article), placing our ideas in 1 of 4 quadrants based on the anticipated effort to implement the change (x‐axis) and impact of making the change (y‐axis). The matrix helped us see that some ideas would be relatively simple to implement (eg, color‐coded bags for STAT medication delivery), whereas others would require more sophisticated efforts and involvement of other people (eg, monthly education sessions to resident physicians).
EXPERIMENTING
Experiments were conducted to meet each of the 3 goals identified above. The team used the outcomes of the prioritization exercise to identify initial experiments to test. To build momentum by showing progress and improvement with a few quick wins, the team began with low‐effort/high‐impact opportunities. Each experiment followed a standard Plan‐Do‐Study‐Act (PDSA) cycle to encourage reflection, learning, adaptation, and adjustment as a result of the experiential learning process.[5]
Goal 1: STAT Should Be Consistently Defined and Understood by Everyone
To address the first goal, a subgroup collected policies and procedures related to the STAT medication administration process. The policy defined a STAT medication as a medication that has the potential to significantly and negatively impact a patient's clinical condition if not given within 30 minutes. The group found that the policy requiring a 30‐minute time to administration was clinically appropriate, reinforcing our goals to create a practice congruent with the policy.
A subgroup led by the pharmacy department collected data related to STAT medications on the 3 medical‐surgical units. Within 1 month, 550 STAT medications were ordered, consisting of medications ranging from furosemide to nicotine lozenges, the latter being a medication clearly outside of the policy definition of STAT. The workgroup reviewed the information and realized education would be required to align practice with policy. According to our matrix, education was a high‐impact/high‐effort activity, so efforts were focused on the high‐impact/low‐effort activities initially. We addressed educational opportunities in later PDSA cycles.
Goal 2: An Easy, Intuitive STAT Process for All Stakeholders
The CPRS contains prefabricated templates that conform to regulatory requirements and ensure completeness. However, the CPRS does not intuitively enable ordering providers to choose the time for the first dose of a new routine medication. This often creates a situation where a provider orders the medication STAT, so that the medication can be given earlier than the CPRS would otherwise allow. Although there is a check box, Give additional dose now, it was not being used because it was visually obscure in the interface. The CPRS restricted our ability to change the template for ordering medications to include a specific time for first‐dose administration before defaulting to the routine order; thus, complementary countermeasures were trialed first. These are outlined in Table 1.
| Countermeasure | Intended Outcome |
|---|---|
| Remove duplicate dosing frequencies from medication order template | Reduce list of dosing frequencies to sort through to find desired selection |
| Develop 1‐page job aid for ordering providers to utilize | Assist in the correct methods of ordering STAT, NOW, and routine medications |
| Added STAT ONCE as a dosing frequency selection | Clarify the medication, if ordered STAT, will only be a 1‐time administration to avoid the recurrence of a STAT order should the orders be transferred to a new unit with the patient |
| Modify existing policies to add STAT ONCE option | Ensure documentation is congruent with new expectations |
| Educate interns and residents with the job aid and a hands‐on how to ordering exercise | Inform ordering physicians on the available references for ordering and educate according to desired practice |
| Provide interns and residents with a visual job aid at their workstation and a hands‐on how to ordering exercise | In addition to providing information and educating according to desired practice, provide a just‐in‐time reference resource |
Goal 3: The STAT Process Should Be Transparent and Ideally Visual
During the time studies, the time period from when the medication arrived on the unit to the time it was administered to the patient averaged 34 minutes. Of 28 STAT orders followed through the entire process, 5 pharmacy technicians (26%) were not informed of 19 STAT medication orders requiring delivery, and 12 nurses (63%) were not notified of the delivery of those 19 medications. The remaining 9 STAT medications were stocked in the Omnicell. Informal interviews with nurses and pharmacy technicians, as well as input from the nurses and pharmacy technicians in our workgroup, revealed several explanations for these findings.
First, the delivering technicians could not always find the patient's nurse, and because the delivery procedure was not standardized, there was no consistency between technicians in where medications were delivered. Second, each unit had a different medication inventory stored in the Omnicell, and the inventory was frequently changed (eg, due to unit‐specific needs, backorders), which made it difficult for nurses to keep track of what was available in Omnicell at any given time. Finally, the STAT medication was not consistently labeled with a visual STAT notation, so even if a nurse saw that new medications had been delivered, he or she would not be able to easily identify which was STAT. The team made several low‐tech process changes to improve the visibility of a STAT medication and ensure reliable communication upon delivery. A subgroup of pharmacists, technicians, and nurses developed and implemented the countermeasures described in Table 2.
| Countermeasure | Intended Outcome |
|---|---|
| Designate delivery preferences with the patient's nurse as the first preference and a set location in the med room as the only alternative preference | Attempt to deliver medications directly to the patient's nurse as frequently as possible to eliminate any unnecessary delays and avoid miscommunication |
| Identify a location in each unit's med room to place a red bin to deliver the STAT medications that are unable to be delivered to the patient's nurse directly | Provide 1 alternate location to retrieve STAT medications if the technician is unable to locate the patient's nurse to deliver the medication directly |
| Utilize a plastic bag with a red STAT indication for transportation of STAT medications to the units | Provide a visual to assist in pharmacy technicians prioritizing their deliveries to the inpatient units |
| Utilize red STAT magnets on the patient's door frame to signal nurses a medication had been delivered to the med room | Provide a visual to assist in timely recognition of a STAT medication delivery given the technician was unable to find the nurse to hand it off directly |
RESULTS
At the start of our project, the average time from STAT order to medication administration was 1 hour and 7 minutes (range, 6 minutes 2 hours and 22 minutes). As a result of the 2 sets of countermeasures outlined in Tables 1 and 2, the average total time from STAT order entry to administration decreased by 21% to an average of 53 minutes. The total time from medication delivery to administration decreased by 26% from 34 minutes to 25 minutes postimplementation. On average, 391 STAT medications were ordered per month during the project period, which represents a decrease of 9.5% from the 432 orders per month for the same time period the previous year. After implementing the countermeasures in Table 2, we followed another 26 STAT medications through the process to evaluate our efforts. Of 15 STAT medications requiring delivery, only 1 nurse (7%) was not notified of the delivery of a STAT medication, and 1 pharmacy technician (7%) was not informed the medication was STAT. The 151% increase in notification of nurses to delivery of a STAT medication suggests that use of the STAT bags, STAT magnets on patient doors, and whenever possible direct delivery of STAT medications to the nurse has improved communication between the technicians and nurses. Similarly, the 27% increase in technician awareness of a STAT designation suggests STAT is being better communicated to them. The improvement in awareness and notification of a STAT medication is summarized in Figure 2.
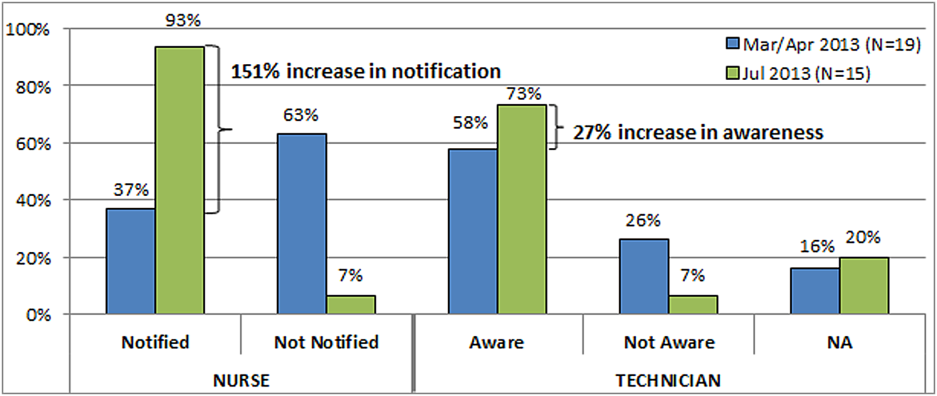
Due to time and financial constraints, the following limitations may have affected our findings. First, resident physicians were not directly represented in our discussions. Attending medicine hospitalists provided the physician perspective, which provides a biased view given their intimate knowledge of the CPRS and additional years of experience. Similarly, nurse perspectives were limited to staff and clinical nurse leaders. Last, our low‐cost approach was mandated by limited resources; a more resource‐rich environment may have devised alternative approaches.
CONCLUSIONS
Adapting A3 Thinking for process improvement was a low‐cost/low‐tech option for a VA facility. Having buy‐in from all levels was crucial to the success of the project. The size and diversity of the group was also very important, as different opinions and aspects of the process were represented. Cross‐discipline relationships and respect were formed, which will be valuable for collaboration in future projects. Although we focused on the STAT medication process, other quality‐improvement projects could also benefit from A3 Thinking. Moreover, there were enough people to serve as ambassadors, taking the project back to their work areas to share with their peers, gather consensus, and elicit additional feedback. The collaboration led to comprehensive understanding of the process, the nature of the problems within the process, and the complexity of solving the problem. For example, although the number of STAT orders did not decrease dramatically, we have learned from these experiments that we may need to change how we approach structuring additional experiments. Future work will focus on increasing communication between physicians and nurses when placing STAT medication orders, enhancing resident education to ensure appropriate use of the STAT designation, and continuing our efforts to improve the delivery process of STAT medications.
Other quality‐improvement methodologies we could have used include: total quality management (TQM), continuous quality improvement (CQI), business process redesign, Lean, Six Sigma, and others.[14] Differences between these can be broadly classified as putting an emphasis on people (eg, inclusion of front line staff in CQI or leadership in TQM) or on process (eg, understanding process function to reduce waste in Lean or statistical process control in Six Sigma).[14] Using A3 Thinking methodology was more useful than these others for the STAT medication process for some very important reasons. The A3 process not only led to a better understanding of the meaning of STAT across disciplines, increasing the intuitive nature, transparency and visual aspects of the whole process, but also promoted a collaborative, multidisciplinary, integrative culture, in which other hospital‐wide problems may be addressed in the future.
Acknowledgements
This work could not have been done without the contribution of all members of the STAT Improvement Workgroup, including Charles Alday; Allison Brenner, PharmD; Paula Carroll; Garry Davis; Michele Delaney, RN, MSN, CWCN; Mary East, MD; Stacy Frick, MSN, RN, CNL; Corry Gessner, CPhT; Kenya Harbin, MSN, RN, CNL; Crystal Heath, MS, RN‐BC; Tom Kerr, MPH; Diane Klemer, RPh; Diane Kohmescher, PharmD, BCPS; Sara Oberdick; Antanita Pickett; Ana Preda, CPhT; Joseph Pugh, RPh, MS; Gloria Salazar, CPhT; Samar Sheth, MD; Andrea Starnes, RN; Christine Wagner, PharmD; Leo Wallace; Roderick Williams; and Marilyn Woodruff.
Disclosures: This work was funded by a US Department of Veterans Affairs, Office of Systems Redesign Improvement Capability Grant and the Veterans in Partnership (VISN11) Healthcare Network. The findings and conclusions in this report are those of the authors and do not necessarily represent the position or policy of the US Department of Veterans Affairs. The authors have no other disclosures or conflicts to report.
- The American Heritage Medical Dictionary of the English Language website. 2011. Available at: http://ahdictionary.com/word/search.html?q=STAT. Accessed December 22, 2013.
- , , , , , . The use of multiple qualitative methods to characterize communication events between physicians and nurses [published online ahead of print January 31, 2014]. Health Commun. doi: 10.1080/10410236.2013.835894.
- , , . Fifteen best practice recommendations for bar‐code medication administration in the Veterans Health Administration. Jt Comm J Qual Saf. 2004;30(7):355–365.
- , , , , . Going lean in health care. Cambridge, MA: Institute for Healthcare Improvement; 2005. Available at: http://www.ihi.org. Accessed March 19, 2014.
- , . Understanding A3 Thinking: A Critical Component of Toyota's PDCA Management System. New York, NY: Productivity Press, Taylor 2008.
- . Managing to Learn: Using the A3 Management Process to Solve Problems, Gain Agreement, Mentor and Lead. Cambridge, MA: Lean Enterprise Institute; 2008.
- , , . Basics of quality improvement in health care. Mayo Clin Proc. 2007;82(6):735–739.
- , . A3 problem solving: unique features of the A3 problem solving method. Available at: http://leanhealthcarewest.com/Page/A3‐Problem‐Solving. Accessed March 27, 2014.
- , , . Evaluation of stat orders in a teaching hospital: a chart review. Clin Drug Investig. 2011;31(4):231–235.
- . Using STAT properly. Radiol Manage. 2006;28(1):26–30; quiz 31–33.
- , . The promise of Lean in health care. Mayo Clin Proc. 2013;88(1):74–82.
- , , , . Lean health care: what can hospitals learn from a world‐class automaker? J Hosp Med. 2006;1(3):191–199.
- . Gemba Kaizen: A Commonsense Approach to a Continuous Improvement Strategy. 2nd ed. New York, NY: McGraw‐Hill; 2012.
- . Pseudoinnovation: the development and spread of healthcare quality improvement methodologies. Int J Qual Health Care. 2009;21(3):153–159.
STAT is an abbreviation of the Latin word statim, meaning immediately,[1] and has been a part of healthcare's lexicon for almost as long as there have been hospitals. STAT conveys a sense of urgency, compelling those who hear STAT to act quickly. Unfortunately, given the lack of a consistent understanding of STAT, the term in reality often has an alternate use: to hurry up or to complete sooner than routine, and is sometimes used to circumvent a system that is perceived to be too slow to accomplish a routine task in a timely manner.
As part of a larger systems redesign effort to improve patient safety and quality of care, an institutional review board (IRB)‐approved qualitative study was conducted on 2 medical‐surgical units in a US Department of Veterans Affairs (VA) hospital to explore communication patterns between physicians and nurses.[2] The study revealed wide variation in understanding between physicians and nurses on the ordering and administration of STAT medication. Physicians were unaware that when they placed a STAT order into the computerized patient record system (CPRS), nurses were not automatically alerted about the order. At this facility, nurses did not carry pagers. Although each unit had a supply of wireless telephones, they were often unreliable and therefore not used consistently. Nurses were required by policy to check the CPRS for new orders every 2 hours. This was an inefficient and possibly dangerous process,[3] because if a nurse was not expecting a STAT order, 2 hours could elapse before she or he saw the order in the CPRS and began to look for the medication. A follow‐up survey completed by physicians, nurses, pharmacists, and pharmacy technicians demonstrated stark differences on the definition of STAT and overlap with similar terms such as NOW and ASAP. Interviews with ordering providers indicated that 36% of the time a STAT was ordered it was not clinically urgent, but instead ordered STAT to speed up the process.
The STAT medication process was clearly in need of improvement, but previous quality improvement projects in our organization had varying degrees of success. For example, we used Lean methodology in an attempt to improve our discharge process. We conducted a modified rapid process discharge improvement workshop[4] structured in phases over 4 weeks. During the workshops, a strong emphasis remained on the solutions to the problem, and we were unable to help the team move from a mindset of fix it to create it. This limited the buy‐in of team members, the creativity of their ideas for improvement, and ultimately the momentum to improve the process.
In this article we describe our adaptation of A3 Thinking,[5, 6] a structure for guiding quality improvement based in Lean methodology, to improve the STAT medication process. We chose A3 Thinking for several reasons. A3 Thinking focuses on process improvement and thus aligned well with our interest in improving the STAT medication process. A3 Thinking also reveals otherwise hidden nonvalue‐added activities that should be eliminated.[7] Finally A3 Thinking reinforces a deeper understanding of the way the work is currently being done, providing critical information needed before making a change. This provides a tremendous opportunity to look at work differently and see opportunities for improvement.[8] Given these strengths as well as the lack of congruence between what the STAT process should consist of and how the STAT process was actually being used in our organization, A3 Thinking offered the best fit between an improvement process and the problem to be solved.
METHODS
A search of healthcare literature yielded very few studies on the STAT process.[9, 10] Only 1 intervention to improve the process was found, and this focused on a specific procedure.[10] An informal survey of local VA and non‐VA hospitals regarding their experiences with the STAT medication process revealed insufficient information to aid our efforts. We next searched the business and manufacturing literature and found examples of how the Lean methodology was successfully applied to other problems in healthcare, including improving pediatric surgery workflow and decreasing ventilator‐associated pneumonia.[11, 12]
Therefore, the STAT project was structured to adapt a problem‐solving process commonly used in Lean organizationsA3 Thinkingwhich challenges team members to work through a discovery phase to develop a shared understanding of the process, an envisioning phase to conceptualize an ideal process experience, and finally an experimentation phase to identify and trial possible solutions through prioritization, iterative testing, structured reflection, and adjustment on resulting changes. Our application of the term experimentation in this context is distinct from that of controlled experimentation in clinical research; the term is intended to convey iterative learning as changes are tested, evaluated, and modified during this quality improvement project. Figure 1 displays a conceptual model of our adaptation of A3 Thinking. As this was a quality‐improvement project, it was exempt from IRB review.
DISCOVERY
To begin the discovery phase, a workgroup consisting of representatives of all groups that had a role in the STAT process (ie, physician, pharmacist, nurse, pharmacy technician, clerk) gathered to identify the opportunity we are looking to address and learn from each other's individual experiences with the STAT medication process. The group was facilitated by an industrial engineer familiar with the A3 Thinking process. The team completed a mapping exercise to lay out, step‐by‐step, the current STAT medication process. This activity allowed the team to build shared empathy with others' experiences and to appreciate the challenges experienced by others through their individual responsibilities in the process. The current process was found to consist of 4 overarching components: a provider entered the STAT order into the CPRS; the order was verified by a pharmacist; a pharmacy technician delivered the medication to the unit (or a nurse retrieved the medication from the Omnicell (Omnicell Inc., Mountain View, CA), a proprietary automated medication dispensing system); and finally the nurse administered the medication to a patient.
A large, color‐coded flow map of the STAT medication process was constructed over several meetings to capture all perspectives and allow team members to gather feedback from their peers. To further our understanding of the current process, the team participated in a modified Go to the Gemba (ie, go to where the work is done)[13] on a real‐time STAT order. Once all workgroup members were satisfied that the flow map represented the current state of the STAT medication process, we came to a consensus on the goals needed to meet our main objective.
We agreed that our main objective was that STAT medication orders should be recognized, verified, and administered to patients in a timely and appropriate manner to ensure quality care. We identified 3 goals to meet this objective: (1) STAT should be consistently defined and understood by everyone; (2) an easy, intuitive STAT process should be available for all stakeholders; and (3) the STAT process should be transparent and ideally visual so that everyone involved can understand at which point in the process a specific STAT order is currently situated. We also identified additional information we would need to reach the goals.
Shortly after the process‐mapping sessions, 2 workgroup members conducted real‐time STAT order time studies to track medications from order to administration. Three time periods in the STAT process were identified for observation and measurement: the time from physician order entry in the CPRS to the time a pharmacist verified the medication, the time from verification to when the medication arrived on the nursing unit, and the time from arrival on the nursing unit to when that medication was administered. Using a data‐collection template, each time period was recorded, and 28 time studies were collected over 1 month. To monitor the progress of our initiatives, the time study was repeated 3 months into the project.
ENVISIONING
Following the discovery phase, the team was better equipped to identify the specific changes needed to achieve an improved process. The envisioning phase allowed the team freedom to imagine an ideal process barring any preconceived notion of constraints within the current process.
In 2 meetings we brainstormed as many improvement ideas as possible. To prioritize and focus our ideas, we developed a matrix (see Supporting Information, Appendix A, in the online version of this article), placing our ideas in 1 of 4 quadrants based on the anticipated effort to implement the change (x‐axis) and impact of making the change (y‐axis). The matrix helped us see that some ideas would be relatively simple to implement (eg, color‐coded bags for STAT medication delivery), whereas others would require more sophisticated efforts and involvement of other people (eg, monthly education sessions to resident physicians).
EXPERIMENTING
Experiments were conducted to meet each of the 3 goals identified above. The team used the outcomes of the prioritization exercise to identify initial experiments to test. To build momentum by showing progress and improvement with a few quick wins, the team began with low‐effort/high‐impact opportunities. Each experiment followed a standard Plan‐Do‐Study‐Act (PDSA) cycle to encourage reflection, learning, adaptation, and adjustment as a result of the experiential learning process.[5]
Goal 1: STAT Should Be Consistently Defined and Understood by Everyone
To address the first goal, a subgroup collected policies and procedures related to the STAT medication administration process. The policy defined a STAT medication as a medication that has the potential to significantly and negatively impact a patient's clinical condition if not given within 30 minutes. The group found that the policy requiring a 30‐minute time to administration was clinically appropriate, reinforcing our goals to create a practice congruent with the policy.
A subgroup led by the pharmacy department collected data related to STAT medications on the 3 medical‐surgical units. Within 1 month, 550 STAT medications were ordered, consisting of medications ranging from furosemide to nicotine lozenges, the latter being a medication clearly outside of the policy definition of STAT. The workgroup reviewed the information and realized education would be required to align practice with policy. According to our matrix, education was a high‐impact/high‐effort activity, so efforts were focused on the high‐impact/low‐effort activities initially. We addressed educational opportunities in later PDSA cycles.
Goal 2: An Easy, Intuitive STAT Process for All Stakeholders
The CPRS contains prefabricated templates that conform to regulatory requirements and ensure completeness. However, the CPRS does not intuitively enable ordering providers to choose the time for the first dose of a new routine medication. This often creates a situation where a provider orders the medication STAT, so that the medication can be given earlier than the CPRS would otherwise allow. Although there is a check box, Give additional dose now, it was not being used because it was visually obscure in the interface. The CPRS restricted our ability to change the template for ordering medications to include a specific time for first‐dose administration before defaulting to the routine order; thus, complementary countermeasures were trialed first. These are outlined in Table 1.
| Countermeasure | Intended Outcome |
|---|---|
| Remove duplicate dosing frequencies from medication order template | Reduce list of dosing frequencies to sort through to find desired selection |
| Develop 1‐page job aid for ordering providers to utilize | Assist in the correct methods of ordering STAT, NOW, and routine medications |
| Added STAT ONCE as a dosing frequency selection | Clarify the medication, if ordered STAT, will only be a 1‐time administration to avoid the recurrence of a STAT order should the orders be transferred to a new unit with the patient |
| Modify existing policies to add STAT ONCE option | Ensure documentation is congruent with new expectations |
| Educate interns and residents with the job aid and a hands‐on how to ordering exercise | Inform ordering physicians on the available references for ordering and educate according to desired practice |
| Provide interns and residents with a visual job aid at their workstation and a hands‐on how to ordering exercise | In addition to providing information and educating according to desired practice, provide a just‐in‐time reference resource |
Goal 3: The STAT Process Should Be Transparent and Ideally Visual
During the time studies, the time period from when the medication arrived on the unit to the time it was administered to the patient averaged 34 minutes. Of 28 STAT orders followed through the entire process, 5 pharmacy technicians (26%) were not informed of 19 STAT medication orders requiring delivery, and 12 nurses (63%) were not notified of the delivery of those 19 medications. The remaining 9 STAT medications were stocked in the Omnicell. Informal interviews with nurses and pharmacy technicians, as well as input from the nurses and pharmacy technicians in our workgroup, revealed several explanations for these findings.
First, the delivering technicians could not always find the patient's nurse, and because the delivery procedure was not standardized, there was no consistency between technicians in where medications were delivered. Second, each unit had a different medication inventory stored in the Omnicell, and the inventory was frequently changed (eg, due to unit‐specific needs, backorders), which made it difficult for nurses to keep track of what was available in Omnicell at any given time. Finally, the STAT medication was not consistently labeled with a visual STAT notation, so even if a nurse saw that new medications had been delivered, he or she would not be able to easily identify which was STAT. The team made several low‐tech process changes to improve the visibility of a STAT medication and ensure reliable communication upon delivery. A subgroup of pharmacists, technicians, and nurses developed and implemented the countermeasures described in Table 2.
| Countermeasure | Intended Outcome |
|---|---|
| Designate delivery preferences with the patient's nurse as the first preference and a set location in the med room as the only alternative preference | Attempt to deliver medications directly to the patient's nurse as frequently as possible to eliminate any unnecessary delays and avoid miscommunication |
| Identify a location in each unit's med room to place a red bin to deliver the STAT medications that are unable to be delivered to the patient's nurse directly | Provide 1 alternate location to retrieve STAT medications if the technician is unable to locate the patient's nurse to deliver the medication directly |
| Utilize a plastic bag with a red STAT indication for transportation of STAT medications to the units | Provide a visual to assist in pharmacy technicians prioritizing their deliveries to the inpatient units |
| Utilize red STAT magnets on the patient's door frame to signal nurses a medication had been delivered to the med room | Provide a visual to assist in timely recognition of a STAT medication delivery given the technician was unable to find the nurse to hand it off directly |
RESULTS
At the start of our project, the average time from STAT order to medication administration was 1 hour and 7 minutes (range, 6 minutes 2 hours and 22 minutes). As a result of the 2 sets of countermeasures outlined in Tables 1 and 2, the average total time from STAT order entry to administration decreased by 21% to an average of 53 minutes. The total time from medication delivery to administration decreased by 26% from 34 minutes to 25 minutes postimplementation. On average, 391 STAT medications were ordered per month during the project period, which represents a decrease of 9.5% from the 432 orders per month for the same time period the previous year. After implementing the countermeasures in Table 2, we followed another 26 STAT medications through the process to evaluate our efforts. Of 15 STAT medications requiring delivery, only 1 nurse (7%) was not notified of the delivery of a STAT medication, and 1 pharmacy technician (7%) was not informed the medication was STAT. The 151% increase in notification of nurses to delivery of a STAT medication suggests that use of the STAT bags, STAT magnets on patient doors, and whenever possible direct delivery of STAT medications to the nurse has improved communication between the technicians and nurses. Similarly, the 27% increase in technician awareness of a STAT designation suggests STAT is being better communicated to them. The improvement in awareness and notification of a STAT medication is summarized in Figure 2.
Due to time and financial constraints, the following limitations may have affected our findings. First, resident physicians were not directly represented in our discussions. Attending medicine hospitalists provided the physician perspective, which provides a biased view given their intimate knowledge of the CPRS and additional years of experience. Similarly, nurse perspectives were limited to staff and clinical nurse leaders. Last, our low‐cost approach was mandated by limited resources; a more resource‐rich environment may have devised alternative approaches.
CONCLUSIONS
Adapting A3 Thinking for process improvement was a low‐cost/low‐tech option for a VA facility. Having buy‐in from all levels was crucial to the success of the project. The size and diversity of the group was also very important, as different opinions and aspects of the process were represented. Cross‐discipline relationships and respect were formed, which will be valuable for collaboration in future projects. Although we focused on the STAT medication process, other quality‐improvement projects could also benefit from A3 Thinking. Moreover, there were enough people to serve as ambassadors, taking the project back to their work areas to share with their peers, gather consensus, and elicit additional feedback. The collaboration led to comprehensive understanding of the process, the nature of the problems within the process, and the complexity of solving the problem. For example, although the number of STAT orders did not decrease dramatically, we have learned from these experiments that we may need to change how we approach structuring additional experiments. Future work will focus on increasing communication between physicians and nurses when placing STAT medication orders, enhancing resident education to ensure appropriate use of the STAT designation, and continuing our efforts to improve the delivery process of STAT medications.
Other quality‐improvement methodologies we could have used include: total quality management (TQM), continuous quality improvement (CQI), business process redesign, Lean, Six Sigma, and others.[14] Differences between these can be broadly classified as putting an emphasis on people (eg, inclusion of front line staff in CQI or leadership in TQM) or on process (eg, understanding process function to reduce waste in Lean or statistical process control in Six Sigma).[14] Using A3 Thinking methodology was more useful than these others for the STAT medication process for some very important reasons. The A3 process not only led to a better understanding of the meaning of STAT across disciplines, increasing the intuitive nature, transparency and visual aspects of the whole process, but also promoted a collaborative, multidisciplinary, integrative culture, in which other hospital‐wide problems may be addressed in the future.
Acknowledgements
This work could not have been done without the contribution of all members of the STAT Improvement Workgroup, including Charles Alday; Allison Brenner, PharmD; Paula Carroll; Garry Davis; Michele Delaney, RN, MSN, CWCN; Mary East, MD; Stacy Frick, MSN, RN, CNL; Corry Gessner, CPhT; Kenya Harbin, MSN, RN, CNL; Crystal Heath, MS, RN‐BC; Tom Kerr, MPH; Diane Klemer, RPh; Diane Kohmescher, PharmD, BCPS; Sara Oberdick; Antanita Pickett; Ana Preda, CPhT; Joseph Pugh, RPh, MS; Gloria Salazar, CPhT; Samar Sheth, MD; Andrea Starnes, RN; Christine Wagner, PharmD; Leo Wallace; Roderick Williams; and Marilyn Woodruff.
Disclosures: This work was funded by a US Department of Veterans Affairs, Office of Systems Redesign Improvement Capability Grant and the Veterans in Partnership (VISN11) Healthcare Network. The findings and conclusions in this report are those of the authors and do not necessarily represent the position or policy of the US Department of Veterans Affairs. The authors have no other disclosures or conflicts to report.
- The American Heritage Medical Dictionary of the English Language website. 2011. Available at: http://ahdictionary.com/word/search.html?q=STAT. Accessed December 22, 2013.
- , , , , , . The use of multiple qualitative methods to characterize communication events between physicians and nurses [published online ahead of print January 31, 2014]. Health Commun. doi: 10.1080/10410236.2013.835894.
- , , . Fifteen best practice recommendations for bar‐code medication administration in the Veterans Health Administration. Jt Comm J Qual Saf. 2004;30(7):355–365.
- , , , , . Going lean in health care. Cambridge, MA: Institute for Healthcare Improvement; 2005. Available at: http://www.ihi.org. Accessed March 19, 2014.
- , . Understanding A3 Thinking: A Critical Component of Toyota's PDCA Management System. New York, NY: Productivity Press, Taylor 2008.
- . Managing to Learn: Using the A3 Management Process to Solve Problems, Gain Agreement, Mentor and Lead. Cambridge, MA: Lean Enterprise Institute; 2008.
- , , . Basics of quality improvement in health care. Mayo Clin Proc. 2007;82(6):735–739.
- , . A3 problem solving: unique features of the A3 problem solving method. Available at: http://leanhealthcarewest.com/Page/A3‐Problem‐Solving. Accessed March 27, 2014.
- , , . Evaluation of stat orders in a teaching hospital: a chart review. Clin Drug Investig. 2011;31(4):231–235.
- . Using STAT properly. Radiol Manage. 2006;28(1):26–30; quiz 31–33.
- , . The promise of Lean in health care. Mayo Clin Proc. 2013;88(1):74–82.
- , , , . Lean health care: what can hospitals learn from a world‐class automaker? J Hosp Med. 2006;1(3):191–199.
- . Gemba Kaizen: A Commonsense Approach to a Continuous Improvement Strategy. 2nd ed. New York, NY: McGraw‐Hill; 2012.
- . Pseudoinnovation: the development and spread of healthcare quality improvement methodologies. Int J Qual Health Care. 2009;21(3):153–159.

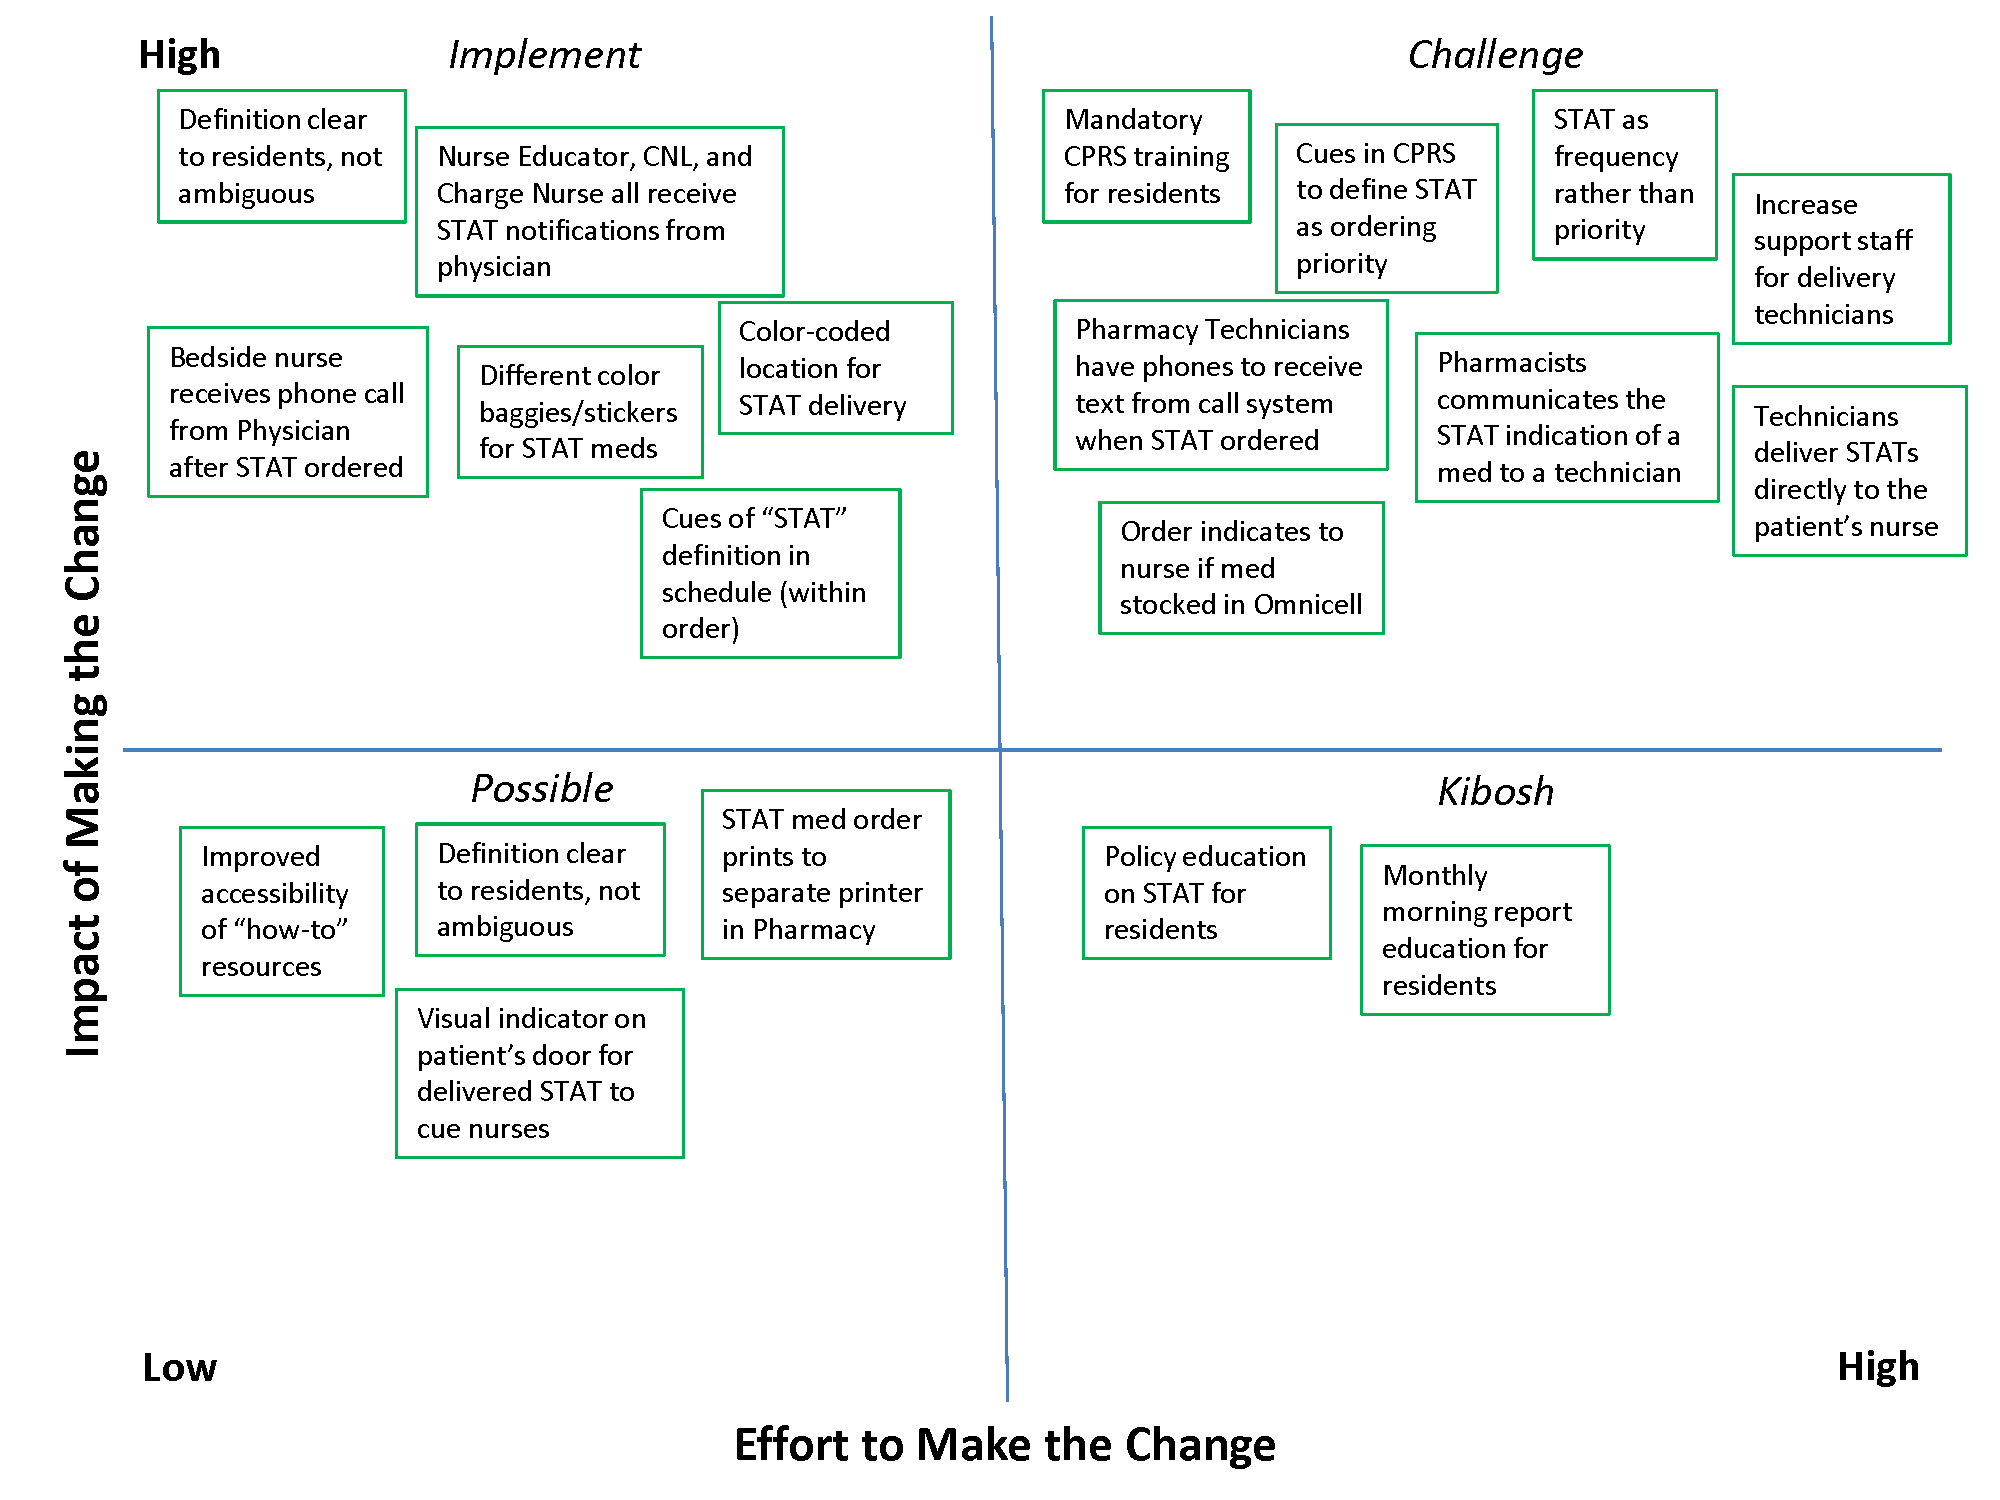
An Inpatient Clinical Decision Algorithm
Decision‐making capacity is a dynamic, integrative cognitive function necessary for informed consent. Capacity is assessed relative to a specific choice about medical care (eg, Does this patient with mild Alzheimer's disease have the capacity to decide whether to undergo valvuloplasty for severe aortic stenosis?), Capacity may be impaired by acute illnesses (eg, toxidromes and withdrawal states, medical illness‐related delirium, decompensated psychiatric episodes), as well as chronic conditions (eg, dementia, developmental disability, traumatic brain injuries, central nervous system (CNS) degenerative disorders). Given the proper training, clinicians from any specialty can assess a patient's decision‐making capacity.[1] A patient must satisfy 4 principles to have the capacity for a given decision: understanding of the condition, ability to communicate a choice, conception of the risks and benefits of the decision, and a rational approach to decision making.[2, 3, 4] Management of incapacitated persons may require consideration of the individual's stated or demonstrated preferences, medical ethics principles (eg, to consider the balance between autonomy, beneficence, and nonmaleficence during shared decision making), and institutional and situational norms and standards. Management may include immediate or long‐term medical and safety planning, and the selection of a surrogate decision maker or public guardian.[1, 2, 3, 4, 5, 6, 7, 8] A related term, competency, describes a legal judgment regarding a person's ability to make decisions, and persons deemed incompetent require an appointed guardian to make 1 or more types of decision (eg, medical, financial, and long‐term care planning).[1, 8]
Over one‐quarter of general medical inpatients display impaired decision‐making capacity based on a recent review of multiple studies.[2] Nursing home residents, persons with Alzheimer's dementia, and persons with developmental disabilitygroups commonly encountered in the inpatient settingdemonstrate impaired capacity in greater than 40% to 60% of cases.[2] Capacity impairment is present in three‐quarters of inpatients with life‐threatening illnesses.[5] The frequency of capacity impairment is complicated by the fact that physicians fail to recognize impaired capacity in as much as 60% of cases.[1, 2] Misunderstanding of the laws and medical and ethical principles related to capacity is common, even among specialists who commonly care for incapacitated patients, such as consult liaison psychiatrists, geriatricians, and psychologists.[1]
Loss of decision‐making capacity may be associated with negative consequences to the patient and to the provider‐patient dyad. Patients with capacity impairment have been shown to have an increased risk of mortality in a community setting.[6] Potential ethical pitfalls between provider and incapacitated patient have been described.[5] The high cost of long‐term management of subsets of incapacitated patients has also been noted.[7]
Improved identification and management of incapacitated patients has potential benefit to medical outcomes, patient safety, and cost containment.[6, 7, 9] The importance of education in this regard, especially to early career clinicians and to providers in specialties other than mental health, has been noted.[9] This article describes a clinical quality improvement project at San Francisco General Hospital and Trauma Center (SFGH) to improve provider identification and management of patients with impaired decision‐making capacity via a clinical decision algorithm.
METHODS
In 2012, the Department of Risk Management at SFGH created a multidisciplinary workgroup, including attending physicians, nurses, administrators, and hospital safety officers to improve the institutional process for identification and management of inpatients with impaired decision‐making capacity. The workgroup reviewed prior experience with incapacitated patients and data from multiple sources, including unusual occurrence reports, hospital root cause analyses, and hospital policies regarding patients with cognitive impairment. Expert opinion was solicited from attending psychiatry and neuropsychology providers.
SFGHan urban, academic, safety‐net hospitalcares for a diverse, underserved, and medically vulnerable patient population with high rates of cognitive and capacity impairment. A publication currently under review from SFGH shows that among a cohort of roughly 700 general medical inpatients 50 years and older, greater than 54% have mild or greater degrees of cognitive impairment based on the Telephone Interview for Cognitive Status test (unpublished data).[10] Among SFGH medical inpatients with extended lengths of stay, roughly one‐third have impaired capacity, require a family surrogate decision maker, or have an established public guardian (unpublished data). Among incapacitated patients, a particularly challenging subset have impaired decision making but significant physical capacity, creating risk of harm to self or others (eg, during the 18 months preintervention, an average of 9 incapacitated but physically capable inpatients per month attempted to leave SFGH prior to discharge) (unpublished data).
The majority of incapacitated patients at SFGH are cared for by 5 inpatient medical services staffed by resident and attending physicians from the University of California San Francisco: cardiology, family medicine, internal medicine, neurology, and psychiatry (unpublished data). Despite the commonality of capacity impairment on these services, education about capacity impairment and management was consistently reviewed only in the Department of Psychiatry.
Challenges common to prior experience with incapacitated patients were considered, including inefficient navigation of a complex, multistep identification and management process; difficulty addressing the high‐risk subset of incapacitated, able‐bodied patients who may pose an immediate safety risk; and incomplete understanding of the timing and indications for consultants (including psychiatry, neuropsychology, and medical ethics). To improve clinical outcome and patient safety through clinician identification and management, the workgroup created a clinical decision algorithm in a visual process map format for ease of use at the point of care.
Using MEDLINE and PubMed, the workgroup conducted a brief review of existing tools for incapacitated patients with relevant search terms and Medical Subjects Headings, including capacity, inpatient, shared decision making, mental competency, guideline, and algorithm. Publications reviewed included tools for capacity assessment (Addenbrooke's Cognitive Examination, MacArthur Competence Assessment Tool for Treatment)[2, 3, 4, 11] delineation of the basic process of capacity evaluation and subsequent management,[12, 13, 14, 15, 16] and explanation of the role of specialty consultation.[3, 9, 17] Specific attention was given to finding published visual algorithms; here, search results tended to focus on specialty consultation (eg, neuropsychology testing),[17] highly specific clinical situations (eg, sexual assault),[18] or to systems outside the United States.[19, 20, 21, 22] Byatt et al.'s work (2006) contains a useful visual algorithm about management of incapacitated patients, but it operates from the perspective of consult liaison psychiatrists, and the algorithm does not include principles of capacity assessment.[23] Derse ([16]) provides a text‐based algorithm relevant to primary inpatient providers, but does not have a visual illustration.[16] In our review, we were unable to find a visual algorithm that consolidates the process of identification, evaluation, and management of hospital inpatients with impaired decision‐making capacity.
Based on the described needs assessment, the workgroup created a draft algorithm for review by the SFGH medical executive committee, nursing quality council, and ethics committee.
RESULTS
The Clinical Decision Algorithm for Hospital Inpatients With Impaired Decision‐Making Capacity (adapted version, Figure 1) consolidates identification and management into a 1‐page visual process map, emphasizes safety planning for high‐risk patients, and explains indication and timing for multidisciplinary consultation, thereby addressing the 3 most prominent challenges based on our data and case review. Following hospital executive approval, the algorithm and a set of illustrative cases were disseminated to clinicians via email from service leadership, laminated copies were posted in housestaff workrooms, an electronic copy was posted on the website of the SFGH Department of Risk Management, and the algorithm was incorporated into hospital policy. Workgroup members conducted trainings with housestaff from the services identified as most frequently caring for incapacitated inpatients.
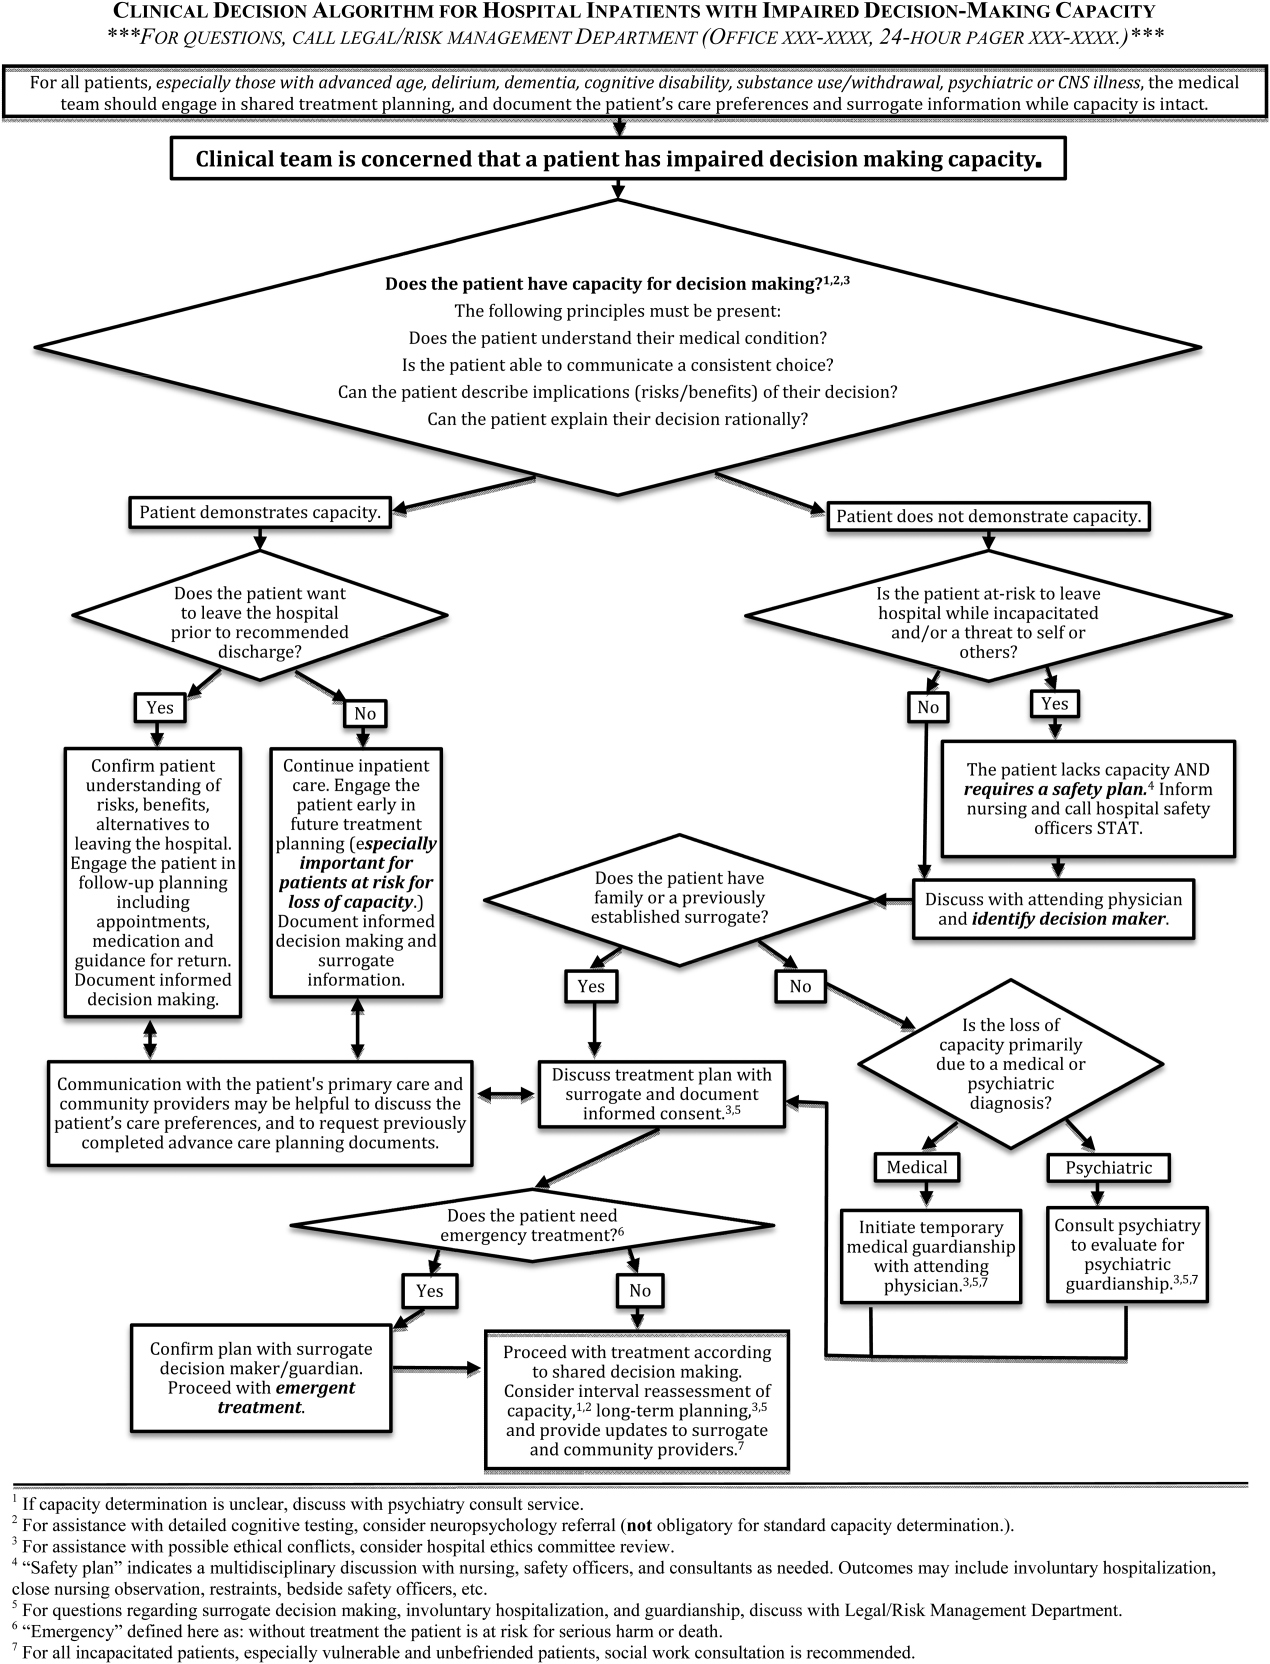
During trainings, housestaff participants expressed an improved sense of understanding and decreased anxiety about identification and management of incapacitated patients. During subsequent discussions, inpatient housestaff noted improvement in teamwork with safety officers, including cases involving agitated or threatening patients prior to capacity assessment.
An unexpected benefit of the algorithm was recognition of the need for associated resources, including a surrogate decision‐maker documentation form, off‐hours attending physician oversight for medical inpatients with capacity‐related emergencies, and a formal agreement with hospital safety officers regarding the care of high‐risk incapacitated patients not previously on a legal hold or surrogate guardianship. These were created in parallel with the algorithm and have become an integral part of management of incapacitated patients.
CLINICAL DECISION ALGORITHM APPLICATION TO PATIENT SCENARIOS
The following 3 scenarios exemplify common challenges in caring for inpatients with compromised decision‐making capacity. Assessment and multidisciplinary management are explained in relation to the clinical decision algorithm (Figure 1.)
Case 1
An 87‐year‐old woman with mild cognitive impairment presents to the emergency department with community‐acquired pneumonia. The patient is widowed, lives alone in a senior community, and has an established relationship with a primary care physician in the area. On initial examination, the patient is febrile and dyspneic, but still alert and able to give a coherent history. She is able to close the loop and teach‐back regarding the diagnosis of pneumonia and agrees with the treatment plan as explained. Should consideration be given to this patient's decision‐making capacity at this time? What capacity‐related information would be helpful to review with the patient and to document in the record?
Inpatient teams should prospectively identify patients at‐risk for loss of capacity and create a shared treatment plan with the patient while capacity is intact (as noted in the top box in Figure 1). When the inpatient team first meets this patient, she retains decision‐making capacity with regard to hospitalization for pneumonia (left branch after first diamond, Figure 1); however she is at risk for delirium based on her age, mild cognitive impairment, and pneumonia.25 She is willing to stay in the hospital for treatment (right branch after second diamond, Figure 1). For this patient at risk for loss of capacity, it is especially important that the inpatient team explore the patient's care preferences regarding predictable crisis points in the care plan (eg, need for invasive respiratory support or intensive care unit admission.) Her surrogate decision maker's name and contact information should be confirmed. Communication with the patient's primary care provider is advised to review knowledge about the patient's care preferences and request previously completed advance‐care planning documents.
Case 2
A 37‐year‐old man is admitted to the hospital for alcohol withdrawal. On hospital day 1, he develops hyperactive delirium and attempts to leave the hospital. The patient becomes agitated and physically aggressive when the nurse and physician inform him that it is not safe to leave the hospital. He denies having any health problems, he is unable to explain potential risks if his alcohol withdrawal is left untreated, and he cannot articulate a plan to care for himself. The patient attempts to strike a staff member and runs out of the inpatient unit. The patient's family members live in the area, and they can be reached by phone. What are the next appropriate management steps?
This patient has alcohol withdrawal delirium, an emergent medical condition requiring inpatient treatment. The patient demonstrates impaired decision‐making capacity related to treatment because he does not understand his medical condition, he is unable to describe the consequences of the proposed action to leave the hospital, and he is not explaining his decision in rational terms (right hand branch of the algorithm after first diamond, Figure 1). The situation is made more urgent by the patient's aggressive behavior and flight from the inpatient unit, and he poses a risk of harm to self, to staff, and the public (right branch after second diamond, Figure 1). This patient requires a safety plan, and hospital safety officers should be notified immediately. The attending physician and surrogate decision maker should be contacted to create a safe management plan. In this case, a family member is available (left branch after third diamond, Figure 1). The patient requires emergent treatment of his alcohol withdrawal (left branch after fourth diamond, Figure 1). The team should proceed with this emergent treatment with documentation of the assessment, plan, and informed consent of the surrogate. As the patient recovers from acute alcohol withdrawal, the team should reassess his decision‐making capacity and continue to involve the surrogate decision maker until the patient regains capacity to make his own decisions.
Case 3
A 74‐year‐old woman is brought to the hospital by ambulance after being found by her neighbors wandering the hallways of her apartment building. She is disoriented, and her neighbors report a progressive functional decline over the past several months with worsening forgetfulness and occasional falls. She recently started a small fire in her toaster, which a neighbor extinguished after hearing the fire alarm. She is admitted and ultimately diagnosed her with Alzheimer's dementia (Functional Assessment Staging Test (FAST) Tool stage 6a). She is chronically disoriented, happy to be cared for by the hospital staff, and unable to get out of bed independently. She is deemed unsafe to be discharged to home, but she declines to be transferred to a location other than her apartment and declines in‐home care. She has no family or friends. What is the most appropriate course of action to establish a safe long‐term plan for the patient? What medicolegal principles inform the team's responsibility and authority? What consultations may be helpful to the primary medical team?
This patient is incapacitated with regard to long‐term care planning due to dementia. She does not understand her medical condition and cannot articulate the risks and benefits of returning to her apartment (right branch of algorithm after first diamond, Figure 1). The patient is physically unable leave the hospital and does not pose an immediate threat to self or others, thus safety officer assistance is not immediately indicated (left branch at second diamond, Figure 1). Without an available surrogate, this patient might be classified as unbefriended or unrepresented.[7] She will likely require a physician to assist with immediate medical decisions (bottom right corner of algorithm, Figure 1). Emergent treatment is not needed (right branch after fourth diamond,) but long term planning for this vulnerable patient should begin early in the hospital course. Discussion between inpatient and community‐based providers, especially primary care, is recommended to understand the patient's prior care preferences and investigate if she has completed advance care planning documents (two‐headed arrow connecting to square at left side of algorithm.) Involvement of the hospital risk management/legal department may assist with the legal proceedings needed to establish long‐term guardianship (algorithm footnote 5, Figure 1). Ethics consultation may be helpful to consider the balance between the patient's demonstrated values, her autonomy, and the role of substituted judgment in long‐term care planning[7] (algorithm footnote 3, Figure 1). Psychiatric or neuropsychology consultation during her inpatient admission may be useful in preparation for a competency hearing (algorithm footnotes 1 and 2, Figure 1). Social work consultation to provide advocacy for this vulnerable patient would be advisable (algorithm footnote 7).
DISCUSSION
Impaired decision‐making capacity is a common and challenging condition among hospitalized patients, including at our institution. Prior studies show that physicians frequently fail to recognize capacity impairment, and also demonstrate common misunderstandings about the medicolegal framework that governs capacity determination and subsequent care. Patients with impaired decision‐making capacity are vulnerable to adverse outcomes, and there is potential for negative effects on healthcare systems. The management of patients with impaired capacity may involve multiple disciplines and a complex intersection of medical, legal, ethical, and neuropsychological principles.
To promote safety of this vulnerable population at SFGH, our workgroup created a visual algorithm to guide clinicians. The algorithm may improve on existing tools by consolidating the steps from identification through management into a 1‐page visual tool, by emphasizing safety planning for high‐risk incapacitated patients and by elucidating roles and timing for other members of the multidisciplinary management team. Creation of the algorithm facilitated intervention for other practical issues, including institutional and departmental agreements and documentation regarding surrogate decision makers for incapacitated patients.
Although based on a multispecialty institutional review and previously published tools, there are potential limitations to this tool. It seems reasonable to assume that a tool to organize a complex process, such as identification and management of incapacitated patients, should improve patient care versus a non‐standardized process. Although the algorithm is posted in resident workrooms, on the hospital's risk management website, and incorporated as part of hospital policy, we have not yet had the opportunity to study the frequency of its use and impact in patient care. Patient safety and clinical outcome of patients managed with this algorithm could be assessed; however, the impact of the algorithm at SFGH may be confounded by a separate intervention addressing nursing and safety officers that was initiated shortly after the algorithm was produced.
To assess health‐system effects of incapacitated patients, future studies might compare patients with capacity impairment versus those with intact decision making relative to demographic background and payer mix, rates of adverse events during inpatient stay (eg, hospital‐acquired injury), rates of morbidity and mortality, rate of provider identification and documentation of surrogates, patient and surrogate satisfaction data, length of stay and cost of hospitalization, and rates of successful discharge to a community‐based setting. We present this algorithm as an example for diverse settings to address the common challenge of caring for acutely ill patients with impaired decision‐making capacity.
Acknowledgements
The authors thank Lee Rawitscher, MD, for his contribution of capacity assessment handout and review of this manuscript, and to Jeff Critchfield, MD; Robyn Schanzenbach, JD; and Troy Williams, RN, MSN for review of this manuscript. The San Francisco General Hospital Workgroup on Patient Capacity and Medical Decision Making includes Richard Brooks, MD; Beth Brumell, RN; Andy Brunner, JD; Jack Chase, MD; Jeff Critchfield, MD; Leslie Dubbin, RN, MSN, PhD(c); Larry Haber, MD; Lee Rawitscher, MD; and Troy Williams, RN, MSN.
Disclosures
Nothing to report.
- Ten myths about decision making capacity: a report by the National Ethics Committee of the Veterans Health Administration. Department of Veterans Affairs; September 2002. Available at: http://www.ethics.va.gov/docs/necrpts/nec_report_20020201_ten_myths_about_dmc.pdf. Accessed August 13, 2013.
- , , . Does this patient have decision making capacity? JAMA. 2011;306(4):420–427.
- , . Assessing patients' capacities to consent for treatment. N Engl J Med. 1988;319:1635–1638.
- . Assessment of patients' competence to consent to treatment. N Engl J Med. 2007;357:1834–1840.
- , . Can we improve treatment decision‐making for incapacitated patients? Hastings Cent Rep. 2010;40(5):36–45.
- , , , , . Poor decision making is associated with an increased risk of mortality among community‐dwelling older persons without dementia. Neuroepidemiology. 2013;40(4):247–252.
- . Making medical decisions for patients without surrogates. N Engl J Med. 2013;369:1976–1978.
- American Bar Association Commission on Law and Aging and American Psychological Association. Assessment of Older Adults With Diminished Capacity: A Handbook for Lawyers. Washington, DC: American Bar Association and American Psychological Association; 2005.
- , , . Psychiatric evaluation of mental capacity in the general hospital: a significant teaching opportunity. Psychosomatics. 2009;50:468–473.
- , , , , , . Telephone‐based identification of mild cognitive impairment and dementia in a multicultural cohort. Arch Neurol. 2011;68(5):607–614.
- , , , et al. Assessment of patient capacity to consent to treatment. J Gen Intern Med. 1999;14(1):27–34.
- . Competency and the capacity to make treatment decisions: a primer for primary care physicians. Prim Care Companion J Clin Psychiatry. 1999;1(5):131–141.
- . Can the patient decide? Evaluating patient capacity in practice. Am Fam Physician. 2001;64(2):299–308.
- , . Capacity decisions in the general hospital: when can you refuse to follow a person's wishes? Prim Care Companion J Clin Psychiatry. 2003;5(4):177–181.
- , . Assessing capacity. Emerg Med Clin North Am. 2000;18(2):233–242, viii.
- . What part of “no” don't you understand? Patient refusal of recommended treatment in the emergency department. Mt Sinai J Med. 2005;72(4):221–227.
- , , . Neuropsychological evaluation in primary care. Am Fam Physician. 2010;82(5):495–502.
- , , . Determining competency in the sexually assaulted patient: a decision algorithm. J Forensic Leg Med. 2010;17:275–279.
- , . A practical guide to capacity assessment and patient consent in Hong Kong. Hong Kong Med J. 2003;9:284–289.
- Alberta (Canada) Health Services. Algorithm range of capacity and decision making options. Available at: http://www.albertahealthservices.ca/hp/if‐hp‐phys‐consent‐capacity‐decision‐algorithm.pdf. Accessed August 13, 2013.
- , . The Mental Capacity Act 2007 and capacity assessments: a guide for the non‐psychiatrist. Clin Med. 2008;8(1):65–69.
- NICE clinical guideline 16: self harm. The short‐term physical and psychological management and secondary prevention of self‐harm in primary and secondary care. London, UK: National Institute for Clinical Excellence (NICE); July 2004. Available at: http://guidance.nice.org.uk/CG16, accessed on August 13, 2013.
- , , . Involuntary hospitalization of medical patients who lack decisional capacity: an unresolved issue. Psychosomatics. 2006;47(5):443–448.
- , , , et al. The AWOL tool: derivation and validation of a delirium prediction rule. J Hosp Med. 2013;8:493–499.
Decision‐making capacity is a dynamic, integrative cognitive function necessary for informed consent. Capacity is assessed relative to a specific choice about medical care (eg, Does this patient with mild Alzheimer's disease have the capacity to decide whether to undergo valvuloplasty for severe aortic stenosis?), Capacity may be impaired by acute illnesses (eg, toxidromes and withdrawal states, medical illness‐related delirium, decompensated psychiatric episodes), as well as chronic conditions (eg, dementia, developmental disability, traumatic brain injuries, central nervous system (CNS) degenerative disorders). Given the proper training, clinicians from any specialty can assess a patient's decision‐making capacity.[1] A patient must satisfy 4 principles to have the capacity for a given decision: understanding of the condition, ability to communicate a choice, conception of the risks and benefits of the decision, and a rational approach to decision making.[2, 3, 4] Management of incapacitated persons may require consideration of the individual's stated or demonstrated preferences, medical ethics principles (eg, to consider the balance between autonomy, beneficence, and nonmaleficence during shared decision making), and institutional and situational norms and standards. Management may include immediate or long‐term medical and safety planning, and the selection of a surrogate decision maker or public guardian.[1, 2, 3, 4, 5, 6, 7, 8] A related term, competency, describes a legal judgment regarding a person's ability to make decisions, and persons deemed incompetent require an appointed guardian to make 1 or more types of decision (eg, medical, financial, and long‐term care planning).[1, 8]
Over one‐quarter of general medical inpatients display impaired decision‐making capacity based on a recent review of multiple studies.[2] Nursing home residents, persons with Alzheimer's dementia, and persons with developmental disabilitygroups commonly encountered in the inpatient settingdemonstrate impaired capacity in greater than 40% to 60% of cases.[2] Capacity impairment is present in three‐quarters of inpatients with life‐threatening illnesses.[5] The frequency of capacity impairment is complicated by the fact that physicians fail to recognize impaired capacity in as much as 60% of cases.[1, 2] Misunderstanding of the laws and medical and ethical principles related to capacity is common, even among specialists who commonly care for incapacitated patients, such as consult liaison psychiatrists, geriatricians, and psychologists.[1]
Loss of decision‐making capacity may be associated with negative consequences to the patient and to the provider‐patient dyad. Patients with capacity impairment have been shown to have an increased risk of mortality in a community setting.[6] Potential ethical pitfalls between provider and incapacitated patient have been described.[5] The high cost of long‐term management of subsets of incapacitated patients has also been noted.[7]
Improved identification and management of incapacitated patients has potential benefit to medical outcomes, patient safety, and cost containment.[6, 7, 9] The importance of education in this regard, especially to early career clinicians and to providers in specialties other than mental health, has been noted.[9] This article describes a clinical quality improvement project at San Francisco General Hospital and Trauma Center (SFGH) to improve provider identification and management of patients with impaired decision‐making capacity via a clinical decision algorithm.
METHODS
In 2012, the Department of Risk Management at SFGH created a multidisciplinary workgroup, including attending physicians, nurses, administrators, and hospital safety officers to improve the institutional process for identification and management of inpatients with impaired decision‐making capacity. The workgroup reviewed prior experience with incapacitated patients and data from multiple sources, including unusual occurrence reports, hospital root cause analyses, and hospital policies regarding patients with cognitive impairment. Expert opinion was solicited from attending psychiatry and neuropsychology providers.
SFGHan urban, academic, safety‐net hospitalcares for a diverse, underserved, and medically vulnerable patient population with high rates of cognitive and capacity impairment. A publication currently under review from SFGH shows that among a cohort of roughly 700 general medical inpatients 50 years and older, greater than 54% have mild or greater degrees of cognitive impairment based on the Telephone Interview for Cognitive Status test (unpublished data).[10] Among SFGH medical inpatients with extended lengths of stay, roughly one‐third have impaired capacity, require a family surrogate decision maker, or have an established public guardian (unpublished data). Among incapacitated patients, a particularly challenging subset have impaired decision making but significant physical capacity, creating risk of harm to self or others (eg, during the 18 months preintervention, an average of 9 incapacitated but physically capable inpatients per month attempted to leave SFGH prior to discharge) (unpublished data).
The majority of incapacitated patients at SFGH are cared for by 5 inpatient medical services staffed by resident and attending physicians from the University of California San Francisco: cardiology, family medicine, internal medicine, neurology, and psychiatry (unpublished data). Despite the commonality of capacity impairment on these services, education about capacity impairment and management was consistently reviewed only in the Department of Psychiatry.
Challenges common to prior experience with incapacitated patients were considered, including inefficient navigation of a complex, multistep identification and management process; difficulty addressing the high‐risk subset of incapacitated, able‐bodied patients who may pose an immediate safety risk; and incomplete understanding of the timing and indications for consultants (including psychiatry, neuropsychology, and medical ethics). To improve clinical outcome and patient safety through clinician identification and management, the workgroup created a clinical decision algorithm in a visual process map format for ease of use at the point of care.
Using MEDLINE and PubMed, the workgroup conducted a brief review of existing tools for incapacitated patients with relevant search terms and Medical Subjects Headings, including capacity, inpatient, shared decision making, mental competency, guideline, and algorithm. Publications reviewed included tools for capacity assessment (Addenbrooke's Cognitive Examination, MacArthur Competence Assessment Tool for Treatment)[2, 3, 4, 11] delineation of the basic process of capacity evaluation and subsequent management,[12, 13, 14, 15, 16] and explanation of the role of specialty consultation.[3, 9, 17] Specific attention was given to finding published visual algorithms; here, search results tended to focus on specialty consultation (eg, neuropsychology testing),[17] highly specific clinical situations (eg, sexual assault),[18] or to systems outside the United States.[19, 20, 21, 22] Byatt et al.'s work (2006) contains a useful visual algorithm about management of incapacitated patients, but it operates from the perspective of consult liaison psychiatrists, and the algorithm does not include principles of capacity assessment.[23] Derse ([16]) provides a text‐based algorithm relevant to primary inpatient providers, but does not have a visual illustration.[16] In our review, we were unable to find a visual algorithm that consolidates the process of identification, evaluation, and management of hospital inpatients with impaired decision‐making capacity.
Based on the described needs assessment, the workgroup created a draft algorithm for review by the SFGH medical executive committee, nursing quality council, and ethics committee.
RESULTS
The Clinical Decision Algorithm for Hospital Inpatients With Impaired Decision‐Making Capacity (adapted version, Figure 1) consolidates identification and management into a 1‐page visual process map, emphasizes safety planning for high‐risk patients, and explains indication and timing for multidisciplinary consultation, thereby addressing the 3 most prominent challenges based on our data and case review. Following hospital executive approval, the algorithm and a set of illustrative cases were disseminated to clinicians via email from service leadership, laminated copies were posted in housestaff workrooms, an electronic copy was posted on the website of the SFGH Department of Risk Management, and the algorithm was incorporated into hospital policy. Workgroup members conducted trainings with housestaff from the services identified as most frequently caring for incapacitated inpatients.
During trainings, housestaff participants expressed an improved sense of understanding and decreased anxiety about identification and management of incapacitated patients. During subsequent discussions, inpatient housestaff noted improvement in teamwork with safety officers, including cases involving agitated or threatening patients prior to capacity assessment.
An unexpected benefit of the algorithm was recognition of the need for associated resources, including a surrogate decision‐maker documentation form, off‐hours attending physician oversight for medical inpatients with capacity‐related emergencies, and a formal agreement with hospital safety officers regarding the care of high‐risk incapacitated patients not previously on a legal hold or surrogate guardianship. These were created in parallel with the algorithm and have become an integral part of management of incapacitated patients.
CLINICAL DECISION ALGORITHM APPLICATION TO PATIENT SCENARIOS
The following 3 scenarios exemplify common challenges in caring for inpatients with compromised decision‐making capacity. Assessment and multidisciplinary management are explained in relation to the clinical decision algorithm (Figure 1.)
Case 1
An 87‐year‐old woman with mild cognitive impairment presents to the emergency department with community‐acquired pneumonia. The patient is widowed, lives alone in a senior community, and has an established relationship with a primary care physician in the area. On initial examination, the patient is febrile and dyspneic, but still alert and able to give a coherent history. She is able to close the loop and teach‐back regarding the diagnosis of pneumonia and agrees with the treatment plan as explained. Should consideration be given to this patient's decision‐making capacity at this time? What capacity‐related information would be helpful to review with the patient and to document in the record?
Inpatient teams should prospectively identify patients at‐risk for loss of capacity and create a shared treatment plan with the patient while capacity is intact (as noted in the top box in Figure 1). When the inpatient team first meets this patient, she retains decision‐making capacity with regard to hospitalization for pneumonia (left branch after first diamond, Figure 1); however she is at risk for delirium based on her age, mild cognitive impairment, and pneumonia.25 She is willing to stay in the hospital for treatment (right branch after second diamond, Figure 1). For this patient at risk for loss of capacity, it is especially important that the inpatient team explore the patient's care preferences regarding predictable crisis points in the care plan (eg, need for invasive respiratory support or intensive care unit admission.) Her surrogate decision maker's name and contact information should be confirmed. Communication with the patient's primary care provider is advised to review knowledge about the patient's care preferences and request previously completed advance‐care planning documents.
Case 2
A 37‐year‐old man is admitted to the hospital for alcohol withdrawal. On hospital day 1, he develops hyperactive delirium and attempts to leave the hospital. The patient becomes agitated and physically aggressive when the nurse and physician inform him that it is not safe to leave the hospital. He denies having any health problems, he is unable to explain potential risks if his alcohol withdrawal is left untreated, and he cannot articulate a plan to care for himself. The patient attempts to strike a staff member and runs out of the inpatient unit. The patient's family members live in the area, and they can be reached by phone. What are the next appropriate management steps?
This patient has alcohol withdrawal delirium, an emergent medical condition requiring inpatient treatment. The patient demonstrates impaired decision‐making capacity related to treatment because he does not understand his medical condition, he is unable to describe the consequences of the proposed action to leave the hospital, and he is not explaining his decision in rational terms (right hand branch of the algorithm after first diamond, Figure 1). The situation is made more urgent by the patient's aggressive behavior and flight from the inpatient unit, and he poses a risk of harm to self, to staff, and the public (right branch after second diamond, Figure 1). This patient requires a safety plan, and hospital safety officers should be notified immediately. The attending physician and surrogate decision maker should be contacted to create a safe management plan. In this case, a family member is available (left branch after third diamond, Figure 1). The patient requires emergent treatment of his alcohol withdrawal (left branch after fourth diamond, Figure 1). The team should proceed with this emergent treatment with documentation of the assessment, plan, and informed consent of the surrogate. As the patient recovers from acute alcohol withdrawal, the team should reassess his decision‐making capacity and continue to involve the surrogate decision maker until the patient regains capacity to make his own decisions.
Case 3
A 74‐year‐old woman is brought to the hospital by ambulance after being found by her neighbors wandering the hallways of her apartment building. She is disoriented, and her neighbors report a progressive functional decline over the past several months with worsening forgetfulness and occasional falls. She recently started a small fire in her toaster, which a neighbor extinguished after hearing the fire alarm. She is admitted and ultimately diagnosed her with Alzheimer's dementia (Functional Assessment Staging Test (FAST) Tool stage 6a). She is chronically disoriented, happy to be cared for by the hospital staff, and unable to get out of bed independently. She is deemed unsafe to be discharged to home, but she declines to be transferred to a location other than her apartment and declines in‐home care. She has no family or friends. What is the most appropriate course of action to establish a safe long‐term plan for the patient? What medicolegal principles inform the team's responsibility and authority? What consultations may be helpful to the primary medical team?
This patient is incapacitated with regard to long‐term care planning due to dementia. She does not understand her medical condition and cannot articulate the risks and benefits of returning to her apartment (right branch of algorithm after first diamond, Figure 1). The patient is physically unable leave the hospital and does not pose an immediate threat to self or others, thus safety officer assistance is not immediately indicated (left branch at second diamond, Figure 1). Without an available surrogate, this patient might be classified as unbefriended or unrepresented.[7] She will likely require a physician to assist with immediate medical decisions (bottom right corner of algorithm, Figure 1). Emergent treatment is not needed (right branch after fourth diamond,) but long term planning for this vulnerable patient should begin early in the hospital course. Discussion between inpatient and community‐based providers, especially primary care, is recommended to understand the patient's prior care preferences and investigate if she has completed advance care planning documents (two‐headed arrow connecting to square at left side of algorithm.) Involvement of the hospital risk management/legal department may assist with the legal proceedings needed to establish long‐term guardianship (algorithm footnote 5, Figure 1). Ethics consultation may be helpful to consider the balance between the patient's demonstrated values, her autonomy, and the role of substituted judgment in long‐term care planning[7] (algorithm footnote 3, Figure 1). Psychiatric or neuropsychology consultation during her inpatient admission may be useful in preparation for a competency hearing (algorithm footnotes 1 and 2, Figure 1). Social work consultation to provide advocacy for this vulnerable patient would be advisable (algorithm footnote 7).
DISCUSSION
Impaired decision‐making capacity is a common and challenging condition among hospitalized patients, including at our institution. Prior studies show that physicians frequently fail to recognize capacity impairment, and also demonstrate common misunderstandings about the medicolegal framework that governs capacity determination and subsequent care. Patients with impaired decision‐making capacity are vulnerable to adverse outcomes, and there is potential for negative effects on healthcare systems. The management of patients with impaired capacity may involve multiple disciplines and a complex intersection of medical, legal, ethical, and neuropsychological principles.
To promote safety of this vulnerable population at SFGH, our workgroup created a visual algorithm to guide clinicians. The algorithm may improve on existing tools by consolidating the steps from identification through management into a 1‐page visual tool, by emphasizing safety planning for high‐risk incapacitated patients and by elucidating roles and timing for other members of the multidisciplinary management team. Creation of the algorithm facilitated intervention for other practical issues, including institutional and departmental agreements and documentation regarding surrogate decision makers for incapacitated patients.
Although based on a multispecialty institutional review and previously published tools, there are potential limitations to this tool. It seems reasonable to assume that a tool to organize a complex process, such as identification and management of incapacitated patients, should improve patient care versus a non‐standardized process. Although the algorithm is posted in resident workrooms, on the hospital's risk management website, and incorporated as part of hospital policy, we have not yet had the opportunity to study the frequency of its use and impact in patient care. Patient safety and clinical outcome of patients managed with this algorithm could be assessed; however, the impact of the algorithm at SFGH may be confounded by a separate intervention addressing nursing and safety officers that was initiated shortly after the algorithm was produced.
To assess health‐system effects of incapacitated patients, future studies might compare patients with capacity impairment versus those with intact decision making relative to demographic background and payer mix, rates of adverse events during inpatient stay (eg, hospital‐acquired injury), rates of morbidity and mortality, rate of provider identification and documentation of surrogates, patient and surrogate satisfaction data, length of stay and cost of hospitalization, and rates of successful discharge to a community‐based setting. We present this algorithm as an example for diverse settings to address the common challenge of caring for acutely ill patients with impaired decision‐making capacity.
Acknowledgements
The authors thank Lee Rawitscher, MD, for his contribution of capacity assessment handout and review of this manuscript, and to Jeff Critchfield, MD; Robyn Schanzenbach, JD; and Troy Williams, RN, MSN for review of this manuscript. The San Francisco General Hospital Workgroup on Patient Capacity and Medical Decision Making includes Richard Brooks, MD; Beth Brumell, RN; Andy Brunner, JD; Jack Chase, MD; Jeff Critchfield, MD; Leslie Dubbin, RN, MSN, PhD(c); Larry Haber, MD; Lee Rawitscher, MD; and Troy Williams, RN, MSN.
Disclosures
Nothing to report.
- Ten myths about decision making capacity: a report by the National Ethics Committee of the Veterans Health Administration. Department of Veterans Affairs; September 2002. Available at: http://www.ethics.va.gov/docs/necrpts/nec_report_20020201_ten_myths_about_dmc.pdf. Accessed August 13, 2013.
- , , . Does this patient have decision making capacity? JAMA. 2011;306(4):420–427.
- , . Assessing patients' capacities to consent for treatment. N Engl J Med. 1988;319:1635–1638.
- . Assessment of patients' competence to consent to treatment. N Engl J Med. 2007;357:1834–1840.
- , . Can we improve treatment decision‐making for incapacitated patients? Hastings Cent Rep. 2010;40(5):36–45.
- , , , , . Poor decision making is associated with an increased risk of mortality among community‐dwelling older persons without dementia. Neuroepidemiology. 2013;40(4):247–252.
- . Making medical decisions for patients without surrogates. N Engl J Med. 2013;369:1976–1978.
- American Bar Association Commission on Law and Aging and American Psychological Association. Assessment of Older Adults With Diminished Capacity: A Handbook for Lawyers. Washington, DC: American Bar Association and American Psychological Association; 2005.
- , , . Psychiatric evaluation of mental capacity in the general hospital: a significant teaching opportunity. Psychosomatics. 2009;50:468–473.
- , , , , , . Telephone‐based identification of mild cognitive impairment and dementia in a multicultural cohort. Arch Neurol. 2011;68(5):607–614.
- , , , et al. Assessment of patient capacity to consent to treatment. J Gen Intern Med. 1999;14(1):27–34.
- . Competency and the capacity to make treatment decisions: a primer for primary care physicians. Prim Care Companion J Clin Psychiatry. 1999;1(5):131–141.
- . Can the patient decide? Evaluating patient capacity in practice. Am Fam Physician. 2001;64(2):299–308.
- , . Capacity decisions in the general hospital: when can you refuse to follow a person's wishes? Prim Care Companion J Clin Psychiatry. 2003;5(4):177–181.
- , . Assessing capacity. Emerg Med Clin North Am. 2000;18(2):233–242, viii.
- . What part of “no” don't you understand? Patient refusal of recommended treatment in the emergency department. Mt Sinai J Med. 2005;72(4):221–227.
- , , . Neuropsychological evaluation in primary care. Am Fam Physician. 2010;82(5):495–502.
- , , . Determining competency in the sexually assaulted patient: a decision algorithm. J Forensic Leg Med. 2010;17:275–279.
- , . A practical guide to capacity assessment and patient consent in Hong Kong. Hong Kong Med J. 2003;9:284–289.
- Alberta (Canada) Health Services. Algorithm range of capacity and decision making options. Available at: http://www.albertahealthservices.ca/hp/if‐hp‐phys‐consent‐capacity‐decision‐algorithm.pdf. Accessed August 13, 2013.
- , . The Mental Capacity Act 2007 and capacity assessments: a guide for the non‐psychiatrist. Clin Med. 2008;8(1):65–69.
- NICE clinical guideline 16: self harm. The short‐term physical and psychological management and secondary prevention of self‐harm in primary and secondary care. London, UK: National Institute for Clinical Excellence (NICE); July 2004. Available at: http://guidance.nice.org.uk/CG16, accessed on August 13, 2013.
- , , . Involuntary hospitalization of medical patients who lack decisional capacity: an unresolved issue. Psychosomatics. 2006;47(5):443–448.
- , , , et al. The AWOL tool: derivation and validation of a delirium prediction rule. J Hosp Med. 2013;8:493–499.

Discharge Planning Tool in the EHR
According to the American Academy of Pediatrics clinical report on physicians' roles in coordinating care of hospitalized children, there are several important components of hospital discharge planning.[1] Foremost is that discharge planning should begin, and discharge criteria should be set, at the time of hospital admission. This allows for optimal engagement of parents and providers in the effort to adequately prepare patients for the transition to home.
As pediatric inpatients become increasingly complex,[2] adequately preparing families for the transition to home becomes more challenging.[3] There are a myriad of issues to address and the burden of this preparation effort falls on multiple individuals other than the bedside nurse and physician. Large multidisciplinary teams often play a significant role in the discharge of medically complex children.[4] Several challenges may hinder the team's ability to effectively navigate the discharge process such as financial or insurance‐related issues, language differences, or geographic barriers. Patient and family anxieties may also complicate the transition to home.[5]
The challenges of a multidisciplinary approach to discharge planning are further magnified by the limitations of the electronic health record (EHR). The EHR is well designed to record individual encounters, but poorly designed to coordinate longitudinal care across settings.[6] Although multidisciplinary providers may spend significant and well‐intentioned energy to facilitate hospital discharge, their efforts may go unseen or be duplicative.
We developed a discharge readiness report (DRR) for the EHR, an integrated summary of discharge‐related issues, organized into a highly visible and easily accessible report. The development of the discharge planning tool was the first step in a larger quality improvement (QI) initiative aimed at improving the efficiency, effectiveness, and safety of hospital discharge. Our team recognized that improving the flow and visibility of information between disciplines was the first step toward accomplishing this larger aim. Health information technology offers an important opportunity for the improvement of patient safety and care transitions7; therefore, we leveraged the EHR to create an integrated discharge report. We used QI methods to understand our hospital's discharge processes, examined potential pitfalls in interdisciplinary communication, determined relevant information to include in the report, and optimized ways to display the data. To our knowledge, this use of the EHR is novel. The objectives of this article were to describe our team's development and implementation strategies, as well as challenges encountered, in the design of this electronic discharge planning tool.
METHODS
Setting
Children's Hospital Colorado is a 413‐bed freestanding tertiary care teaching hospital with over 13,000 inpatient admissions annually and an average patient length of stay of 5.7 days. We were the first children's hospital to fully implement a single EHR (Epic Systems, Madison, WI) in 2006. This discharge improvement initiative emerged from our hospital's involvement in the Children's Hospital Association Discharge Collaborative between October 2011 and October 2012. We were 1 of 12 participating hospitals and developed several different projects within the framework of the initiative.
Improvement Team
Our multidisciplinary project team included hospitalist physicians, case managers, social workers, respiratory therapists, pharmacists, medical interpreters, process improvement specialists, clinical application specialists whose daily role is management of our hospital's EHR software, and resident liaisons whose daily role is working with residents to facilitate care coordination.
Ethics
The project was determined to be QI work by the Children's Hospital Colorado Organizational Research Risk and Quality Improvement Review Panel.
Understanding the Problem
To understand the perspectives of each discipline involved in discharge planning, the lead hospitalist physician and a process improvement specialist interviewed key representatives from each group. Key informant interviews were conducted with hospitalist physicians, case managers, nurses, social workers, resident liaisons, respiratory therapists, pharmacists, medical interpreters, and residents. We inquired about their informational needs, their methods for obtaining relevant information, and whether the information was currently documented in the EHR. We then used process mapping to learn each disciplines' workflow related to discharge planning. Finally, we gathered key stakeholders together for a group session where discharge planning was mapped using the example of a patient admitted with asthma. From this session, we created a detailed multidisciplinary swim lane process map, a flowchart displaying the sequence of events in the overall discharge process grouped visually by placing the events in lanes. Each lane represented a discipline involved in patient discharge, and the arrows between lanes showed how information is passed between the various disciplines. Using this diagram, the team was able to fully understand provider interdependence in discharge planning and longitudinal timing of discharge‐related tasks during the patient's hospitalization.
We learned that: (1) discharge planning is complex, and there were often multiple provider types involved in the discharge of a single patient; (2) communication and coordination between the multitude of providers was often suboptimal; and (3) many of the tasks related to discharge were left to the last minute, resulting in unnecessary delays. Underlying these problems was a clear lack of organized and visible discharge planning information within the EHR.
There were many examples of obscure and siloed discharge processes. Physicians were aware of discharge criteria, but did not document these criteria for others to see. Case management assessments of home health needs were conveyed verbally to other team members, creating the potential for omissions, mistakes, or delays in appropriate home health planning. Social workers helped families to navigate financial hurdles (eg, assistance with payments for prescription medications). However, the presence of financial or insurance problems was not readily apparent to front‐line clinicians making discharge decisions. Other factors with potential significance for discharge planning, such as English‐language proficiency or a family's geographic distance from the hospital, were buried in disparate flow sheets or reports and not available or apparent to all health team members. There were also clear examples of discharge‐related tasks occurring at the end of hospitalization that could easily have been completed earlier in the admission such as identifying a primary care provider (PCP), scheduling follow‐up appointments, and completing work/subhool excuses because of lack of care team awareness that these items were needed.
Planning the Intervention
Based on our learning, we developed a key driver diagram (Figure 1). Our aim was to create a DRR that organized important discharge‐related information into 1 easily accessible report. Key drivers that were identified as relevant to the content of the DRR included: barriers to discharge, discharge criteria, home care, postdischarge care, and last minute delays. We also identified secondary drivers related to the design of the DRR. We hypothesized that addressing the secondary drivers would be essential to end user adoption of the tool. The secondary drivers included: accessibility, relevance, ease of updating, automation, and readability.
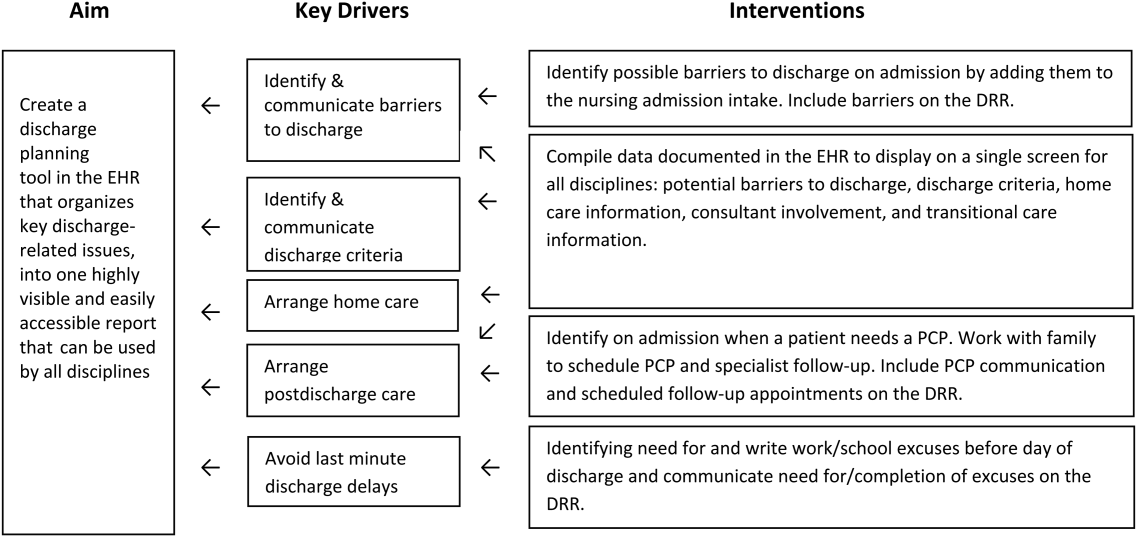
With the swim lane diagram as well as our primary and secondary drivers in mind, we created a mock DRR on paper. We conducted multiple patient discharge simulations with representatives from all disciplines, walking through each step of a patient hospitalization from registration to discharge. This allowed us to map out how preexisting, yet disparate, EHR data could be channeled into 1 report. A few changes were made to processes involving data collection and documentation to facilitate timely transfer of information to the report. For example, questions addressing potential barriers to discharge and whether a school/work excuse was needed were added to the admission nursing assessment.
We then moved the paper DRR to the electronic environment. Data elements that were pulled automatically into the report included: potential barriers to discharge collected during nursing intake, case management information on home care needs, discharge criteria entered by resident and attending physicians, PCP, home pharmacy, follow‐up appointments, school/work excuse information gathered by resident liaisons, and active patient problems drawn from the problem list section. These data were organized into 4 distinct domains within the final DRR: potential barriers, transitional care, home care, and discharge criteria (Table 1).
| Discharge Readiness Report Domain | Example Content |
|---|---|
| |
| Potential barriers to discharge | Geographic location of the family, whether patient lives in more than 1 household, primary spoken language, financial or insurance concern, and need for work/subhool excuses |
| Transitional care | PCP and home pharmacy information, follow‐up ambulatory and imaging appointments, and care team communications with the PCP |
| Home care | Planned discharge date/time and home care needs assessments such as needs for special equipment or skilled home nursing |
| Discharge criteria | Clinical, social, or other care coordination conditions for discharge |
Additional features potentially important to discharge planning were also incorporated into the report based on end user feedback. These included hyperlinks to discharge orders, home oxygen prescriptions, and the after‐visit summary for families, and the patient's home care company (if present). To facilitate discharge and transitional care related communication between the primary team and subspecialty teams, consults involved during the hospitalization were included on the report. As home care arrangements often involve care for active lines and drains, they were added to the report (Figure 2).
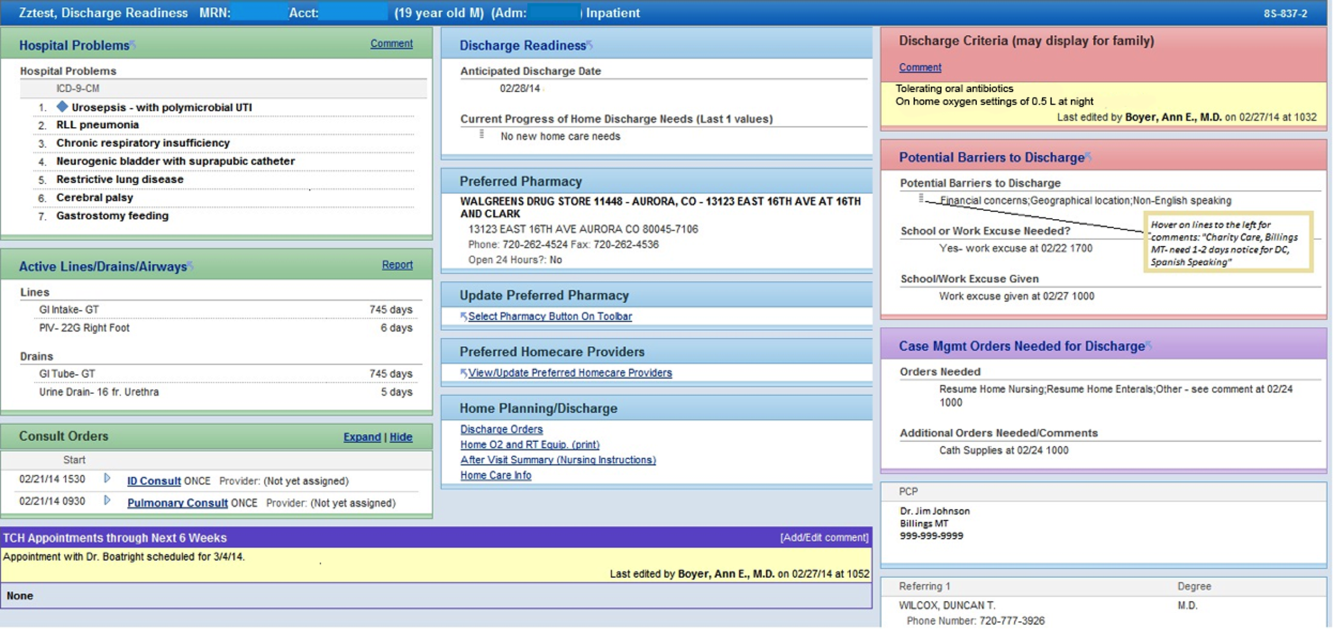
Implementation
The report was activated within the EHR in June 2012. The team focused initial promotion and education efforts on medical floors. Education was widely disseminated via email and in‐person presentations.
The DRR was incorporated into daily CCRs for medical patients in July 2012. These multidisciplinary rounds occurred after medical‐team bedside rounds, focusing on care coordination and discharge planning. For each patient discussed, the DRR was projected onto a large screen, allowing all team members to view and discuss relevant discharge information. A process improvement (PI) specialist attended CCRs daily for several months, educating participants and monitoring use of the DRR. The PI specialist solicited feedback on ways to improve the DRR, and timed rounds to measure whether use of the DRR prolonged CCRs.
In the first weeks postimplementation, the use of the DRR prolonged rounds by as much as 1 minute per patient. Based on direct observation, the team focused interventions on barriers to the efficient use of the report during CCRs including: the need to scroll through the report, which was not visible on 1 screen; the need to navigate between patients; the need to quickly update the report based on discussion; and the need to update discharge criteria (Figure 3).
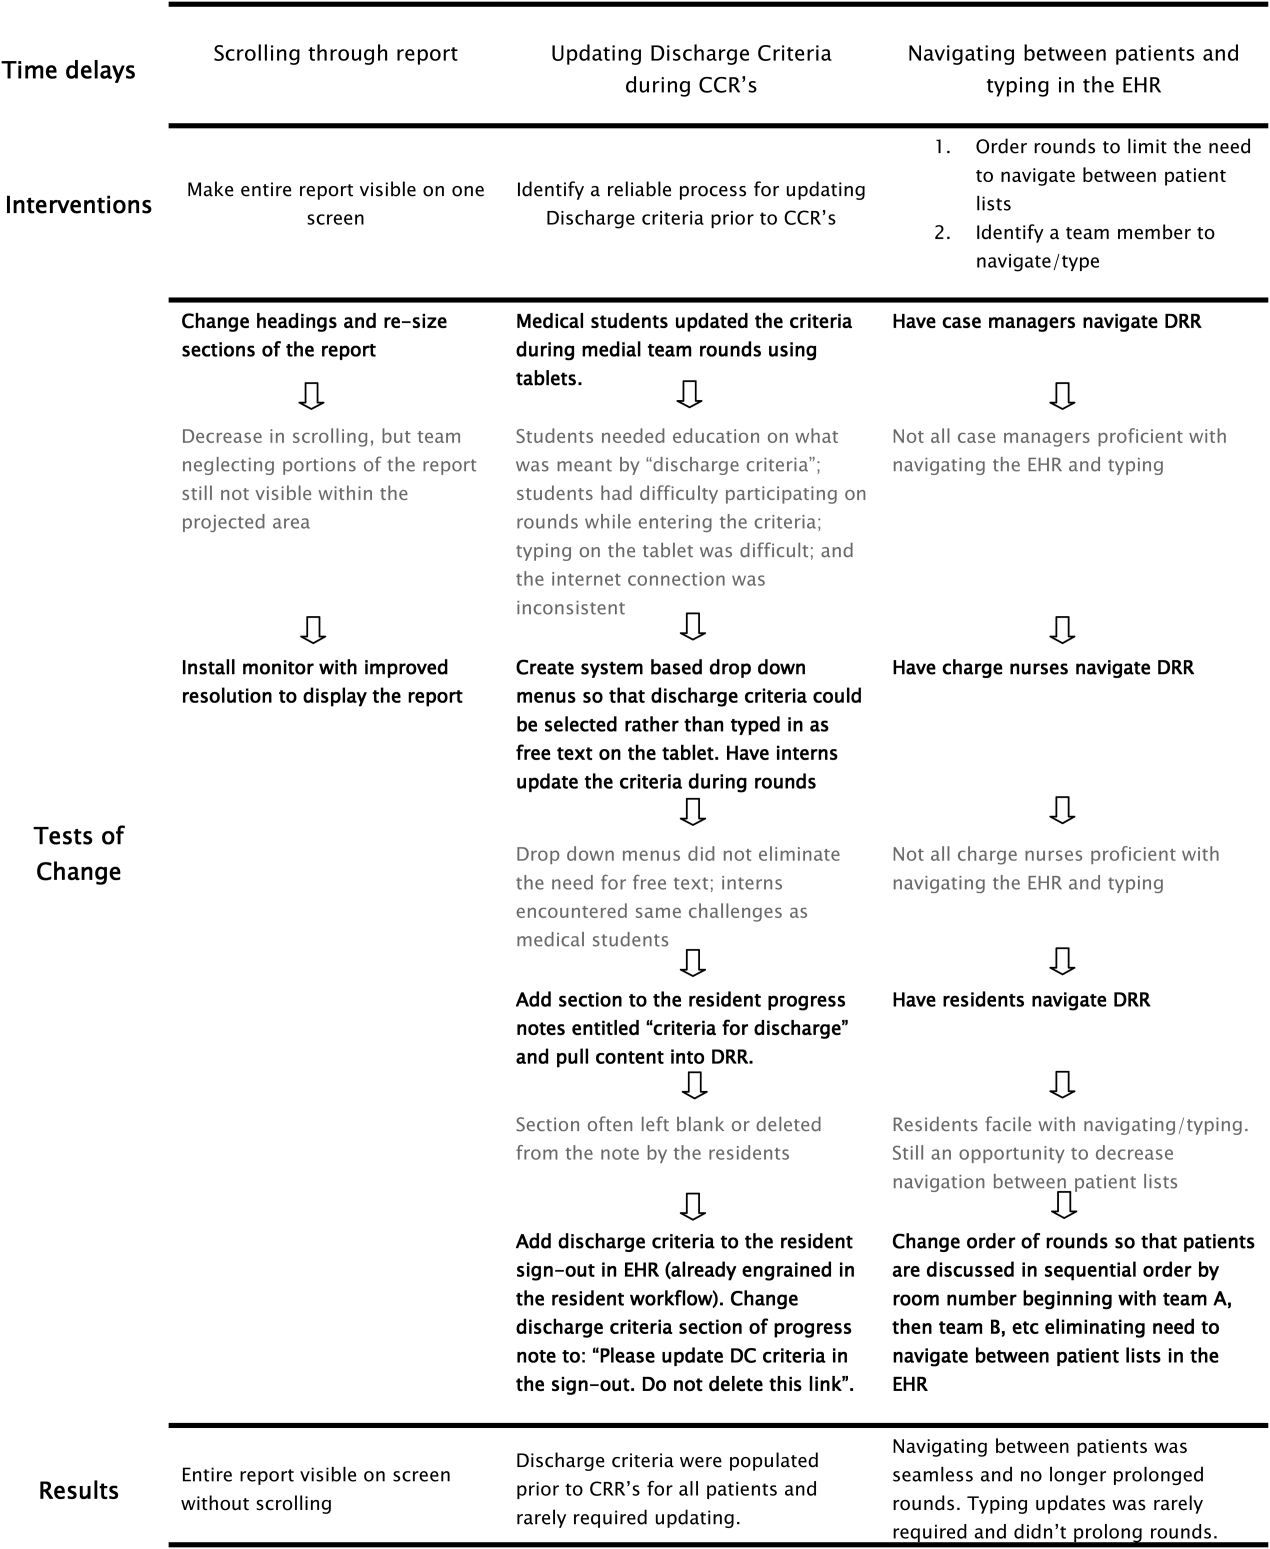
RESULTS
Creation of the final DRR required significant time and effort and was the culmination of a uniquely collaborative effort between clinicians, ancillary staff, and information technology specialists (Figure 4). The report is used consistently for all general medical and medical subspecialty patients during CCRs. After interventions were implemented to improve the efficiency of using the DRR during CCRs, the use of the DRR did not prolong CCRs. Members of the care team acknowledge that all sections of the report are populated and accurate. Though end users have commented on their use of the report outside of CCRs, we have not been able to formally measure this.
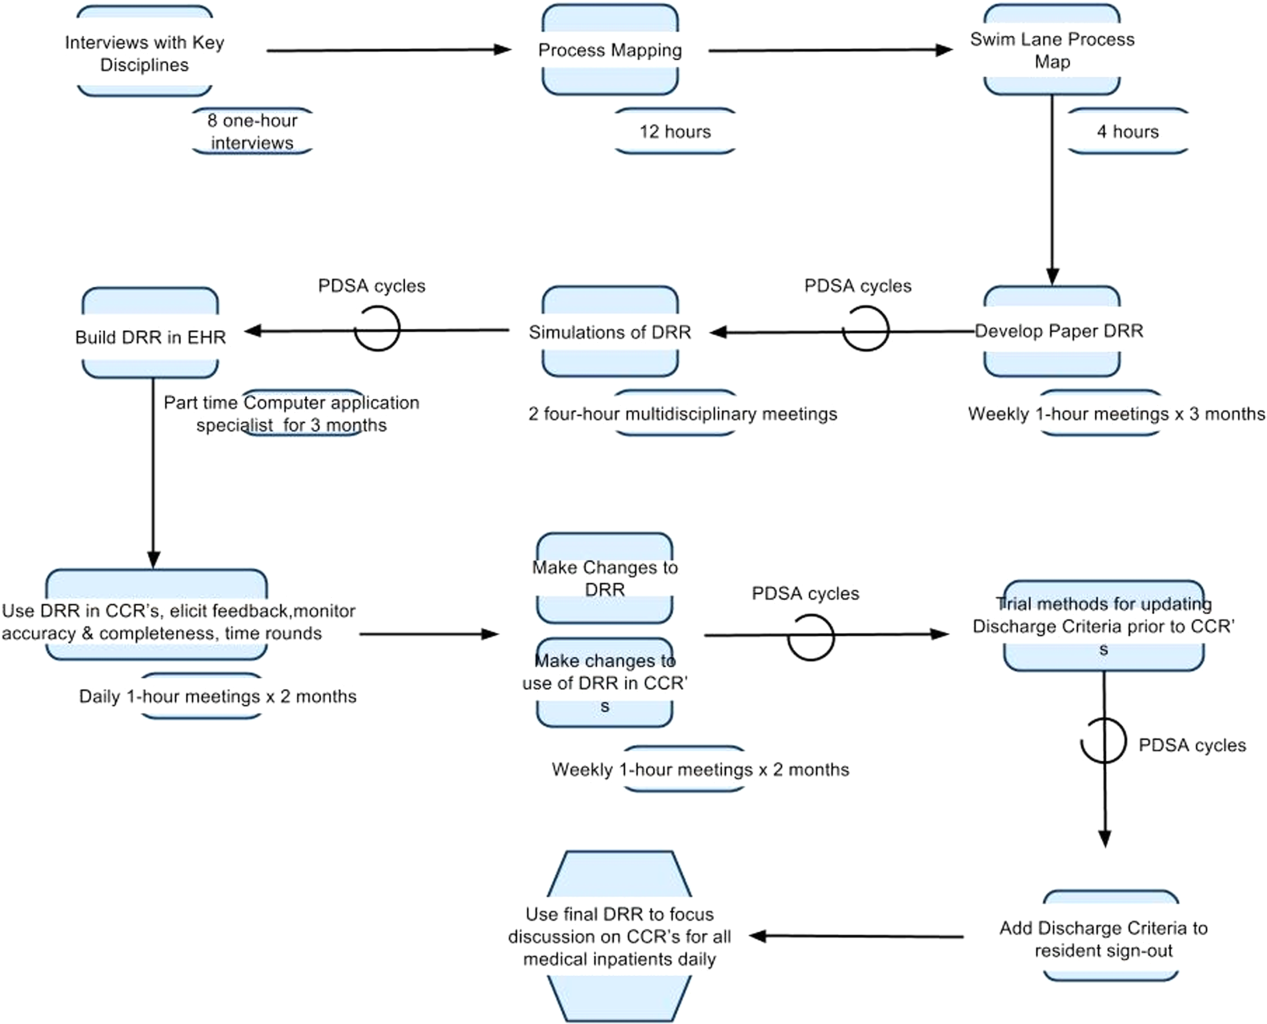
We have noticed a shift in the focus of discussion since implementation of the DRR. Prior to this initiative, care teams at our institution did not regularly discuss discharge criteria during bedside or CCRs. The phrase discharge criteria has now become part of our shared language.
Informally, the DRR appears to have reduced inefficiency and the potential for communication error. The practice of writing notes on printed patient lists to be used to sign‐out or communicate to other team members not in attendance at CCRs has largely disappeared.
The DRR has proven to be adaptable across patient units, and can be tailored to the specific transitional care needs of a given patient population. At discharge institution, the DRR has been modified for, and has taken on a prominent role in, the discharge planning of highly complex populations such as rehabilitation and ventilated patients.
DISCUSSION
Discharge planning is a multifaceted, multidisciplinary process that should begin at the time of hospital admission. Safe patient transition depends on efficient discharge processes and effective communication across settings.[8] Although not well studied in the inpatient setting, care process variability can result in inefficient patient flow and increased stress among staff.[9] Patients and families may experience confusion, coping difficulties, and increased readmission due to ineffective discharge planning.[10] These potential pitfalls highlight the need for healthcare providers to develop patient‐centered, systematic approaches to improving the discharge process.[11]
To our knowledge, this is the first description of a discharge planning tool for the EHR in the pediatric setting. Our discharge report is centralized, easily accessible by all members of the care team, and includes important patient‐specific discharge‐related information that be used to focus discussion and streamline multidisciplinary discharge planning rounds.
We anticipate that the report will allow the entire healthcare team to function more efficiently, decrease discharge‐related delays and failures based on communication roadblocks, and improve family and caregiver satisfaction with the discharge process. We are currently testing these hypotheses and evaluating several implementation strategies in an ongoing research study. Assuming positive impact, we plan to spread the use of the DRR to all inpatient care areas at our hospital, and potentially to other hospitals.
The limitations of this QI project are consistent with other initiatives to improve care. The challenges we encounter at our freestanding tertiary care teaching hospital with regard to effective discharge planning and multidisciplinary communication may not be generalizable to other nonteaching or community hospitals, and the DRR may not be useful in other settings. Though the report is now a part of our EHR, the most impactful implementation strategies remain to be determined. The report and related changes represent significant diversion from years of deeply ingrained workflows for some providers, and we encountered some resistance from staff during the early stages of implementation. The most important of which was that some team members are uncomfortable with technology and prefer to use paper. Most of this initial resistance was overcome by implementing changes to improve the ease of use of the report (Figure 3). Though input from end users and key stakeholders has been incorporated throughout this initiative, more work is needed to measure end user adoption and satisfaction with the report.
CONCLUSION
High‐quality hospital discharge planning requires an increasingly multidisciplinary approach. The EHR can be leveraged to improve transparency and interdisciplinary communication around the discharge process. An integrated summary of discharge‐related issues, organized into 1 highly visible and easily accessible report in the EHR has the potential to improve care transitions.
Disclosure
Nothing to report.
- . Clinical report—physicians' roles in coordinating care of hospitalized children. Pediatrics. 2010;126:829–832.
- , , , , , . Increasing prevalence of medically complex children in US hospitals. Pediatrics. 2010;126:638–646.
- , , . Hospitalist care of the medically complex child. Pediatr Clin North Am. 2005;52:1165–1187, x.
- , . Discharge planning and home care of the technology‐dependent infant. J Obstet Gynecol Neonatal Nurs. 1995;24:77–83.
- , , , . Pediatric discharge planning: complications, efficiency, and adequacy. Soc Work Health Care. 1995;22:1–18.
- , , , et al. The current capabilities of health information technology to support care transitions. AMIA Annu Symp Proc. 2013;2013:1231.
- , , , et al. Provider‐to‐provider electronic communication in the era of meaningful use: a review of the evidence. J Hosp Med. 2013;8:589–597.
- , , , . Promoting effective transitions of care at hospital discharge: a review of key issues for hospitalists. J Hosp Med. 2007;2:314–323.
- , , , , . A 5‐year time study analysis of emergency department patient care efficiency. Ann Emerg Med. 1999;34:326–335.
- , , , et al. Quality of discharge practices and patient understanding at an academic medical center. JAMA Intern Med. 2013;173(18):1715–1722.
- , . Addressing postdischarge adverse events: a neglected area. Jt Comm J Qual Patient Saf. 2008;34:85–97.
According to the American Academy of Pediatrics clinical report on physicians' roles in coordinating care of hospitalized children, there are several important components of hospital discharge planning.[1] Foremost is that discharge planning should begin, and discharge criteria should be set, at the time of hospital admission. This allows for optimal engagement of parents and providers in the effort to adequately prepare patients for the transition to home.
As pediatric inpatients become increasingly complex,[2] adequately preparing families for the transition to home becomes more challenging.[3] There are a myriad of issues to address and the burden of this preparation effort falls on multiple individuals other than the bedside nurse and physician. Large multidisciplinary teams often play a significant role in the discharge of medically complex children.[4] Several challenges may hinder the team's ability to effectively navigate the discharge process such as financial or insurance‐related issues, language differences, or geographic barriers. Patient and family anxieties may also complicate the transition to home.[5]
The challenges of a multidisciplinary approach to discharge planning are further magnified by the limitations of the electronic health record (EHR). The EHR is well designed to record individual encounters, but poorly designed to coordinate longitudinal care across settings.[6] Although multidisciplinary providers may spend significant and well‐intentioned energy to facilitate hospital discharge, their efforts may go unseen or be duplicative.
We developed a discharge readiness report (DRR) for the EHR, an integrated summary of discharge‐related issues, organized into a highly visible and easily accessible report. The development of the discharge planning tool was the first step in a larger quality improvement (QI) initiative aimed at improving the efficiency, effectiveness, and safety of hospital discharge. Our team recognized that improving the flow and visibility of information between disciplines was the first step toward accomplishing this larger aim. Health information technology offers an important opportunity for the improvement of patient safety and care transitions7; therefore, we leveraged the EHR to create an integrated discharge report. We used QI methods to understand our hospital's discharge processes, examined potential pitfalls in interdisciplinary communication, determined relevant information to include in the report, and optimized ways to display the data. To our knowledge, this use of the EHR is novel. The objectives of this article were to describe our team's development and implementation strategies, as well as challenges encountered, in the design of this electronic discharge planning tool.
METHODS
Setting
Children's Hospital Colorado is a 413‐bed freestanding tertiary care teaching hospital with over 13,000 inpatient admissions annually and an average patient length of stay of 5.7 days. We were the first children's hospital to fully implement a single EHR (Epic Systems, Madison, WI) in 2006. This discharge improvement initiative emerged from our hospital's involvement in the Children's Hospital Association Discharge Collaborative between October 2011 and October 2012. We were 1 of 12 participating hospitals and developed several different projects within the framework of the initiative.
Improvement Team
Our multidisciplinary project team included hospitalist physicians, case managers, social workers, respiratory therapists, pharmacists, medical interpreters, process improvement specialists, clinical application specialists whose daily role is management of our hospital's EHR software, and resident liaisons whose daily role is working with residents to facilitate care coordination.
Ethics
The project was determined to be QI work by the Children's Hospital Colorado Organizational Research Risk and Quality Improvement Review Panel.
Understanding the Problem
To understand the perspectives of each discipline involved in discharge planning, the lead hospitalist physician and a process improvement specialist interviewed key representatives from each group. Key informant interviews were conducted with hospitalist physicians, case managers, nurses, social workers, resident liaisons, respiratory therapists, pharmacists, medical interpreters, and residents. We inquired about their informational needs, their methods for obtaining relevant information, and whether the information was currently documented in the EHR. We then used process mapping to learn each disciplines' workflow related to discharge planning. Finally, we gathered key stakeholders together for a group session where discharge planning was mapped using the example of a patient admitted with asthma. From this session, we created a detailed multidisciplinary swim lane process map, a flowchart displaying the sequence of events in the overall discharge process grouped visually by placing the events in lanes. Each lane represented a discipline involved in patient discharge, and the arrows between lanes showed how information is passed between the various disciplines. Using this diagram, the team was able to fully understand provider interdependence in discharge planning and longitudinal timing of discharge‐related tasks during the patient's hospitalization.
We learned that: (1) discharge planning is complex, and there were often multiple provider types involved in the discharge of a single patient; (2) communication and coordination between the multitude of providers was often suboptimal; and (3) many of the tasks related to discharge were left to the last minute, resulting in unnecessary delays. Underlying these problems was a clear lack of organized and visible discharge planning information within the EHR.
There were many examples of obscure and siloed discharge processes. Physicians were aware of discharge criteria, but did not document these criteria for others to see. Case management assessments of home health needs were conveyed verbally to other team members, creating the potential for omissions, mistakes, or delays in appropriate home health planning. Social workers helped families to navigate financial hurdles (eg, assistance with payments for prescription medications). However, the presence of financial or insurance problems was not readily apparent to front‐line clinicians making discharge decisions. Other factors with potential significance for discharge planning, such as English‐language proficiency or a family's geographic distance from the hospital, were buried in disparate flow sheets or reports and not available or apparent to all health team members. There were also clear examples of discharge‐related tasks occurring at the end of hospitalization that could easily have been completed earlier in the admission such as identifying a primary care provider (PCP), scheduling follow‐up appointments, and completing work/subhool excuses because of lack of care team awareness that these items were needed.
Planning the Intervention
Based on our learning, we developed a key driver diagram (Figure 1). Our aim was to create a DRR that organized important discharge‐related information into 1 easily accessible report. Key drivers that were identified as relevant to the content of the DRR included: barriers to discharge, discharge criteria, home care, postdischarge care, and last minute delays. We also identified secondary drivers related to the design of the DRR. We hypothesized that addressing the secondary drivers would be essential to end user adoption of the tool. The secondary drivers included: accessibility, relevance, ease of updating, automation, and readability.
With the swim lane diagram as well as our primary and secondary drivers in mind, we created a mock DRR on paper. We conducted multiple patient discharge simulations with representatives from all disciplines, walking through each step of a patient hospitalization from registration to discharge. This allowed us to map out how preexisting, yet disparate, EHR data could be channeled into 1 report. A few changes were made to processes involving data collection and documentation to facilitate timely transfer of information to the report. For example, questions addressing potential barriers to discharge and whether a school/work excuse was needed were added to the admission nursing assessment.
We then moved the paper DRR to the electronic environment. Data elements that were pulled automatically into the report included: potential barriers to discharge collected during nursing intake, case management information on home care needs, discharge criteria entered by resident and attending physicians, PCP, home pharmacy, follow‐up appointments, school/work excuse information gathered by resident liaisons, and active patient problems drawn from the problem list section. These data were organized into 4 distinct domains within the final DRR: potential barriers, transitional care, home care, and discharge criteria (Table 1).
| Discharge Readiness Report Domain | Example Content |
|---|---|
| |
| Potential barriers to discharge | Geographic location of the family, whether patient lives in more than 1 household, primary spoken language, financial or insurance concern, and need for work/subhool excuses |
| Transitional care | PCP and home pharmacy information, follow‐up ambulatory and imaging appointments, and care team communications with the PCP |
| Home care | Planned discharge date/time and home care needs assessments such as needs for special equipment or skilled home nursing |
| Discharge criteria | Clinical, social, or other care coordination conditions for discharge |
Additional features potentially important to discharge planning were also incorporated into the report based on end user feedback. These included hyperlinks to discharge orders, home oxygen prescriptions, and the after‐visit summary for families, and the patient's home care company (if present). To facilitate discharge and transitional care related communication between the primary team and subspecialty teams, consults involved during the hospitalization were included on the report. As home care arrangements often involve care for active lines and drains, they were added to the report (Figure 2).
Implementation
The report was activated within the EHR in June 2012. The team focused initial promotion and education efforts on medical floors. Education was widely disseminated via email and in‐person presentations.
The DRR was incorporated into daily CCRs for medical patients in July 2012. These multidisciplinary rounds occurred after medical‐team bedside rounds, focusing on care coordination and discharge planning. For each patient discussed, the DRR was projected onto a large screen, allowing all team members to view and discuss relevant discharge information. A process improvement (PI) specialist attended CCRs daily for several months, educating participants and monitoring use of the DRR. The PI specialist solicited feedback on ways to improve the DRR, and timed rounds to measure whether use of the DRR prolonged CCRs.
In the first weeks postimplementation, the use of the DRR prolonged rounds by as much as 1 minute per patient. Based on direct observation, the team focused interventions on barriers to the efficient use of the report during CCRs including: the need to scroll through the report, which was not visible on 1 screen; the need to navigate between patients; the need to quickly update the report based on discussion; and the need to update discharge criteria (Figure 3).
RESULTS
Creation of the final DRR required significant time and effort and was the culmination of a uniquely collaborative effort between clinicians, ancillary staff, and information technology specialists (Figure 4). The report is used consistently for all general medical and medical subspecialty patients during CCRs. After interventions were implemented to improve the efficiency of using the DRR during CCRs, the use of the DRR did not prolong CCRs. Members of the care team acknowledge that all sections of the report are populated and accurate. Though end users have commented on their use of the report outside of CCRs, we have not been able to formally measure this.
We have noticed a shift in the focus of discussion since implementation of the DRR. Prior to this initiative, care teams at our institution did not regularly discuss discharge criteria during bedside or CCRs. The phrase discharge criteria has now become part of our shared language.
Informally, the DRR appears to have reduced inefficiency and the potential for communication error. The practice of writing notes on printed patient lists to be used to sign‐out or communicate to other team members not in attendance at CCRs has largely disappeared.
The DRR has proven to be adaptable across patient units, and can be tailored to the specific transitional care needs of a given patient population. At discharge institution, the DRR has been modified for, and has taken on a prominent role in, the discharge planning of highly complex populations such as rehabilitation and ventilated patients.
DISCUSSION
Discharge planning is a multifaceted, multidisciplinary process that should begin at the time of hospital admission. Safe patient transition depends on efficient discharge processes and effective communication across settings.[8] Although not well studied in the inpatient setting, care process variability can result in inefficient patient flow and increased stress among staff.[9] Patients and families may experience confusion, coping difficulties, and increased readmission due to ineffective discharge planning.[10] These potential pitfalls highlight the need for healthcare providers to develop patient‐centered, systematic approaches to improving the discharge process.[11]
To our knowledge, this is the first description of a discharge planning tool for the EHR in the pediatric setting. Our discharge report is centralized, easily accessible by all members of the care team, and includes important patient‐specific discharge‐related information that be used to focus discussion and streamline multidisciplinary discharge planning rounds.
We anticipate that the report will allow the entire healthcare team to function more efficiently, decrease discharge‐related delays and failures based on communication roadblocks, and improve family and caregiver satisfaction with the discharge process. We are currently testing these hypotheses and evaluating several implementation strategies in an ongoing research study. Assuming positive impact, we plan to spread the use of the DRR to all inpatient care areas at our hospital, and potentially to other hospitals.
The limitations of this QI project are consistent with other initiatives to improve care. The challenges we encounter at our freestanding tertiary care teaching hospital with regard to effective discharge planning and multidisciplinary communication may not be generalizable to other nonteaching or community hospitals, and the DRR may not be useful in other settings. Though the report is now a part of our EHR, the most impactful implementation strategies remain to be determined. The report and related changes represent significant diversion from years of deeply ingrained workflows for some providers, and we encountered some resistance from staff during the early stages of implementation. The most important of which was that some team members are uncomfortable with technology and prefer to use paper. Most of this initial resistance was overcome by implementing changes to improve the ease of use of the report (Figure 3). Though input from end users and key stakeholders has been incorporated throughout this initiative, more work is needed to measure end user adoption and satisfaction with the report.
CONCLUSION
High‐quality hospital discharge planning requires an increasingly multidisciplinary approach. The EHR can be leveraged to improve transparency and interdisciplinary communication around the discharge process. An integrated summary of discharge‐related issues, organized into 1 highly visible and easily accessible report in the EHR has the potential to improve care transitions.
Disclosure
Nothing to report.
- . Clinical report—physicians' roles in coordinating care of hospitalized children. Pediatrics. 2010;126:829–832.
- , , , , , . Increasing prevalence of medically complex children in US hospitals. Pediatrics. 2010;126:638–646.
- , , . Hospitalist care of the medically complex child. Pediatr Clin North Am. 2005;52:1165–1187, x.
- , . Discharge planning and home care of the technology‐dependent infant. J Obstet Gynecol Neonatal Nurs. 1995;24:77–83.
- , , , . Pediatric discharge planning: complications, efficiency, and adequacy. Soc Work Health Care. 1995;22:1–18.
- , , , et al. The current capabilities of health information technology to support care transitions. AMIA Annu Symp Proc. 2013;2013:1231.
- , , , et al. Provider‐to‐provider electronic communication in the era of meaningful use: a review of the evidence. J Hosp Med. 2013;8:589–597.
- , , , . Promoting effective transitions of care at hospital discharge: a review of key issues for hospitalists. J Hosp Med. 2007;2:314–323.
- , , , , . A 5‐year time study analysis of emergency department patient care efficiency. Ann Emerg Med. 1999;34:326–335.
- , , , et al. Quality of discharge practices and patient understanding at an academic medical center. JAMA Intern Med. 2013;173(18):1715–1722.
- , . Addressing postdischarge adverse events: a neglected area. Jt Comm J Qual Patient Saf. 2008;34:85–97.

Patient Flow Composite Measurement
Patient flow refers to the management and movement of patients in a healthcare facility. Healthcare institutions utilize patient flow analyses to evaluate and improve aspects of the patient experience including safety, effectiveness, efficiency, timeliness, patient centeredness, and equity.[1, 2, 3, 4, 5, 6, 7, 8] Hospitals can evaluate patient flow using specific metrics, such as time in emergency department (ED) or percent of discharges completed by a certain time of day. However, no single metric can represent the full spectrum of processes inherent to patient flow. For example, ED length of stay (LOS) is dependent on inpatient occupancy, which is dependent on discharge timeliness. Each of these activities depends on various smaller activities, such as cleaning rooms or identifying available beds.
Evaluating the quality that healthcare organizations deliver is growing in importance.[9] Composite scores are being used increasingly to assess clinical processes and outcomes for professionals and institutions.[10, 11] Where various aspects of performance coexist, composite measures can incorporate multiple metrics into a comprehensive summary.[12, 13, 14, 15, 16] They also allow organizations to track a range of metrics for more holistic, comprehensive evaluations.[9, 13]
This article describes a balanced scorecard with composite scoring used at a large urban children's hospital to evaluate patient flow and direct improvement resources where they are needed most.
METHODS
The Children's Hospital of Philadelphia identified patient flow improvement as an operating plan initiative. Previously, performance was measured with a series of independent measures including time from ED arrival to transfer to the inpatient floor, and time from discharge order to room vacancy. These metrics were dismissed as sole measures of flow because they did not reflect the complexity and interdependence of processes or improvement efforts. There were also concerns that efforts to improve a measure caused unintended consequences for others, which at best lead to little overall improvement, and at worst reduced performance elsewhere in the value chain. For example, to meet a goal time for entering discharge orders, physicians could enter orders earlier. But, if patients were not actually ready to leave, their beds were not made available any earlier. Similarly, bed management staff could rush to meet a goal for speed of unit assignment, but this could cause an increase in patients admitted to the wrong specialty floor.
To address these concerns, a group of physicians, nurses, quality improvement specialists, and researchers designed a patient flow scorecard with composite measurement. Five domains of patient flow were identified: (1) ED and ED‐to‐inpatient transition, (2) bed management, (3) discharge process, (4) room turnover and environmental services department (ESD) activities, and (5) scheduling and utilization. Component measures for each domain were selected for 1 of 3 purposes: (1) to correspond to processes of importance to flow and improvement work, (2) to act as adjusters for factors that affect performance, or (3) to act as balancing measures so that progress in a measure would not result in the degradation of another. Each domain was assigned 20 points, which were distributed across the domain's components based on a consensus of the component's relative importance to overall domain performance (Figure 1). Data from the previous year were used as guidelines for setting performance percentile goals. For example, a goal of 80% in 60 minutes for arrival to physician evaluation meant that 80% of patients should see a physician within 1 hour of arriving at the ED.
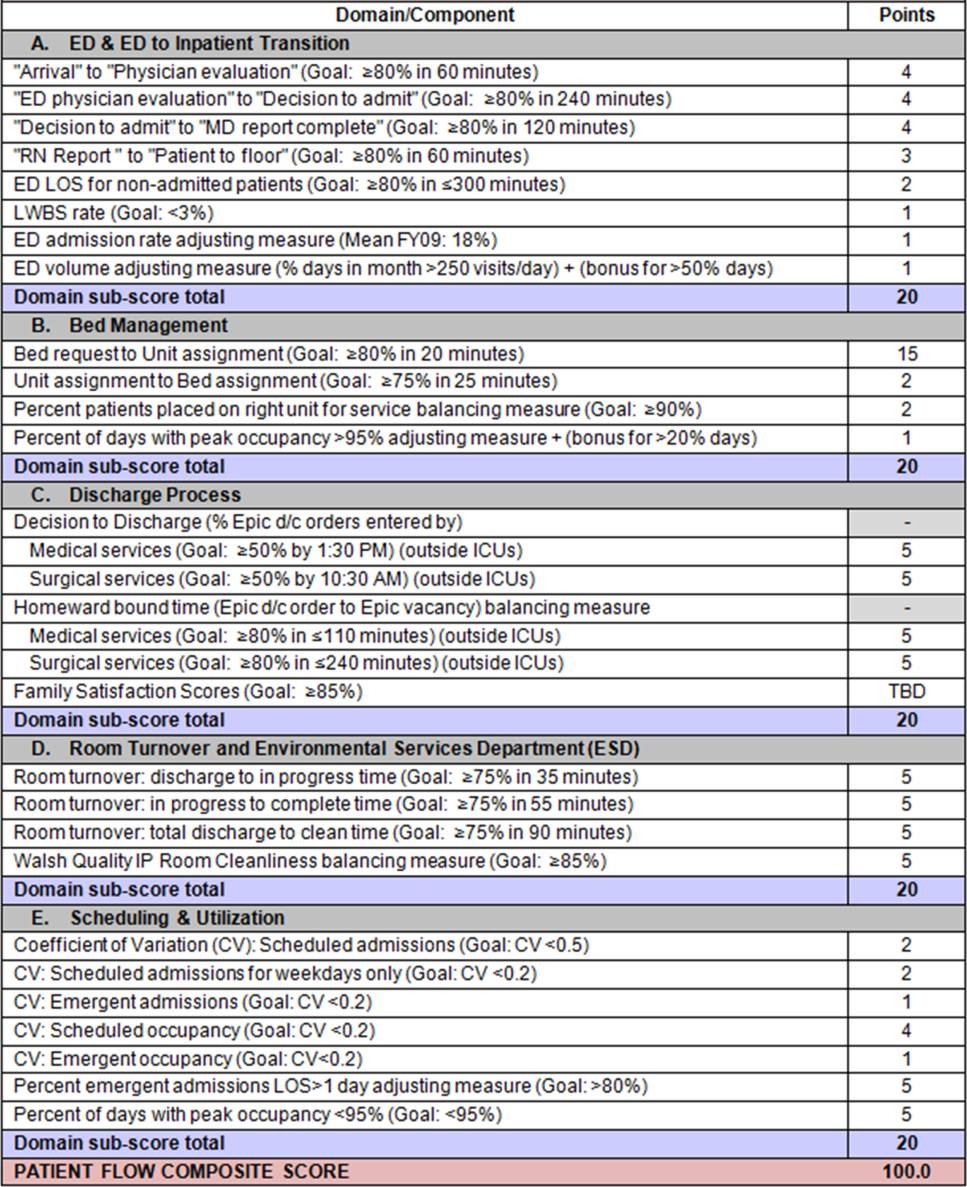
Scores were also categorized to correspond to commonly used color descriptors.[17] For each component measure, performance meeting or exceeding the goal fell into the green category. Performances <10 percentage points below the goal fell into the yellow category, and performances below that level fell into the red category. Domain‐level scores and overall composite scores were also assigned colors. Performance at or above 80% (16 on the 20‐point domain scale, or 80 on the 100‐point overall scale) were designated green, scores between 70% and 79% were yellow, and scores below 70% were red.
DOMAINS OF THE PATIENT FLOW COMPOSITE SCORE
ED and ED‐to‐Inpatient Transition
Patient progression from the ED to an inpatient unit was separated into 4 steps (Figure 1A): (1) arrival to physician evaluation, (2) ED physician evaluation to decision to admit, (3) decision to admit to medical doctor (MD) report complete, and (4) registered nurse (RN) report to patient to floor. Four additional metrics included: (5) ED LOS for nonadmitted patients, (6) leaving without being seen (LWBS) rate, (7) ED admission rate, and (8) ED volume.
Arrival to physician evaluation measures time between patient arrival in the ED and self‐assignment by the first doctor or nurse practitioner in the electronic record, with a goal of 80% of patients seen within 60 minutes. The component score is calculated as percent of patients meeting this goal (ie, seen within 60 minutes) component weight. ED physician evaluation to decision to admit measures time from the start of the physician evaluation to the decision to admit, using bed request as a proxy; the goal was 80% within 4 hours. Decision to admit to MD report complete measures time from bed request to patient sign‐out to the inpatient floor, with a goal of 80% within 2 hours. RN report to patient to floor measures time from sign‐out to the patient leaving the ED, with a goal of 80% within 1 hour. ED LOS for nonadmitted patients measures time in the ED for patients who are not admitted, and the goal was 80% in <5 hours. The domain also tracks the LWBS rate, with a goal of keeping it below 3%. Its component score is calculated as percent patients seen component weight. ED admission rate is an adjusting factor for the severity of patients visiting the ED. Its component score is calculated as (percent of patients visiting the ED who are admitted to the hospital 5) component weight. Because the average admission rate is around 20%, the percent admitted is multiplied by 5 to more effectively adjust for high‐severity patients. ED volume is an adjusting factor that accounts for high volume. Its component score is calculated as percent of days in a month with more than 250 visits (a threshold chosen by the ED team) component weight. If these days exceed 50%, that percent would be added to the component score as an additional adjustment for excessive volume.
Bed Management
The bed management domain measures how efficiently and effectively patients are assigned to units and beds using 4 metrics (Figure 1B): (1) bed request to unit assignment, (2) unit assignment to bed assignment, (3) percentage of patients placed on right unit for service, and (4) percent of days with peak occupancy >95%.
Bed request to unit assignment measures time from the ED request for a bed in the electronic system to patient being assigned to a unit, with a goal of 80% of assignments made within 20 minutes. Unit assignment to bed assignment measures time from unit assignment to bed assignment, with a goal of 75% within 25 minutes. Because this goal was set to 75% rather than 80%, this component score was multiplied by 80/75 so that all component scores could be compared on the same scale. Percentage of patients placed on right unit for service is a balancing measure for speed of assignment. Because the goal was set to 90% rather than 80%, this component score was also multiplied by an adjusting factor (80/90) so that all components could be compared on the same scale. Percent of days with peak occupancy >95% is an adjusting measure that reflects that locating an appropriate bed takes longer when the hospital is approaching full occupancy. Its component score is calculated as (percent of days with peak occupancy >95% + 1) component weight. The was added to more effectively adjust for high occupancy. If more than 20% of days had peak occupancy greater than 95%, that percent would be added to the component score as an additional adjustment for excessive capacity.
Discharge Process
The discharge process domain measures the efficiency of patient discharge using 2 metrics (Figure 1C): (1) decision to discharge and (2) homeward bound time.
Decision to discharge tracks when clinicians enter electronic discharge orders. The goal was 50% by 1:30 pm for medical services and 10:30 am for surgical services. This encourages physicians to enter discharge orders early to enable downstream discharge work to begin. The component score is calculated as percent entered by goal time component weight (80/50) to adjust the 50% goal up to 80% so all component scores could be compared on the same scale. Homeward bound time measures the time between the discharge order and room vacancy as entered by the unit clerk, with a goal of 80% of patients leaving within 110 minutes for medical services and 240 minutes for surgical services. This balancing measure captures the fact that entering discharge orders early does not facilitate flow if the patients do not actually leave the hospital.
Room Turnover and Environmental Services Department
The room turnover and ESD domain measures the quality of the room turnover processes using 4 metrics (Figure 1D): (1) discharge to in progress time, (2) in progress to complete time, (3) total discharge to clean time, and (4) room cleanliness.
Discharge to in progress time measures time from patient vacancy until ESD staff enters the room, with a goal of 75% within 35 minutes. Because the goal was set to 75% rather than 80%, this component score was multiplied by 80/75 so all component scores could be compared on the same scale. In progress to complete time measures time as entered in the electronic health record from ESD staff entering the room to the room being clean, with a goal of 75% within 55 minutes. The component score is calculated identically to the previous metric. Total discharge to clean time measures the length of the total process, with a goal of 75% within 90 minutes. This component score was also multiplied by 80/75 so that all component scores could be compared on the same scale. Although this repeats the first 2 measures, given workflow and interface issues with our electronic health record (Epic, Epic Systems Corporation, Verona Wisconsin), it is necessary to include a total end‐to‐end measure in addition to the subparts. Patient and family ratings of room cleanliness serve as balancing measures, with the component score calculated as percent satisfaction component weight (80/85) to adjust the 85% satisfaction goal to 80% so all component scores could be compared on the same scale.
Scheduling and Utilization
The scheduling and utilization domain measures hospital operations and variations in bed utilization using 7 metrics including (Figure 1E): (1) coefficient of variation (CV): scheduled admissions, (2) CV: scheduled admissions for weekdays only, (3) CV: emergent admissions, (4) CV: scheduled occupancy, (5) CV: emergent occupancy, (6) percent emergent admissions with LOS >1 day, and (7) percent of days with peak occupancy <95%.
The CV, standard deviation divided by the mean of a distribution, is a measure of dispersion. Because it is a normalized value reported as a percentage, CV can be used to compare variability when sample sizes differ. CV: scheduled admissions captures the variability in admissions coded as an elective across all days in a month. The raw CV score is the standard deviation of the elective admissions for each day divided by the mean. The component score is (1 CV) component weight. A higher CV indicates greater variability, and yields a lower component score. CV on scheduled and emergent occupancy is derived from peak daily occupancy. Percent emergent admissions with LOS >1 day captures the efficiency of bed use, because high volumes of short‐stay patients increases turnover work. Its component score is calculated as the percent of emergent admissions in a month with LOS >1 day component weight. Percent of days with peak occupancy <95% incentivizes the hospital to avoid full occupancy, because effective flow requires that some beds remain open.[18, 19] Its component score is calculated as the percent of days in the month with peak occupancy <95% component weight. Although a similar measure, percent of days with peak occupancy >95%, was an adjusting factor in the bed management domain, it is included again here, because this factor has a unique effect on both domains.
RESULTS
The balanced scorecard with composite measures provided improvement teams and administrators with a picture of patient flow (Figure 2). The overall score provided a global perspective on patient flow over time and captured trends in performance during various states of hospital occupancy. One trend that it captured was an association between high volume and poor composite scores (Figure 3). Notably, the H1N1 influenza pandemic in the fall of 2009 and the turnover of computer systems in January 2011 can be linked to dips in performance. The changes between fiscal years reflect a shift in baseline metrics.
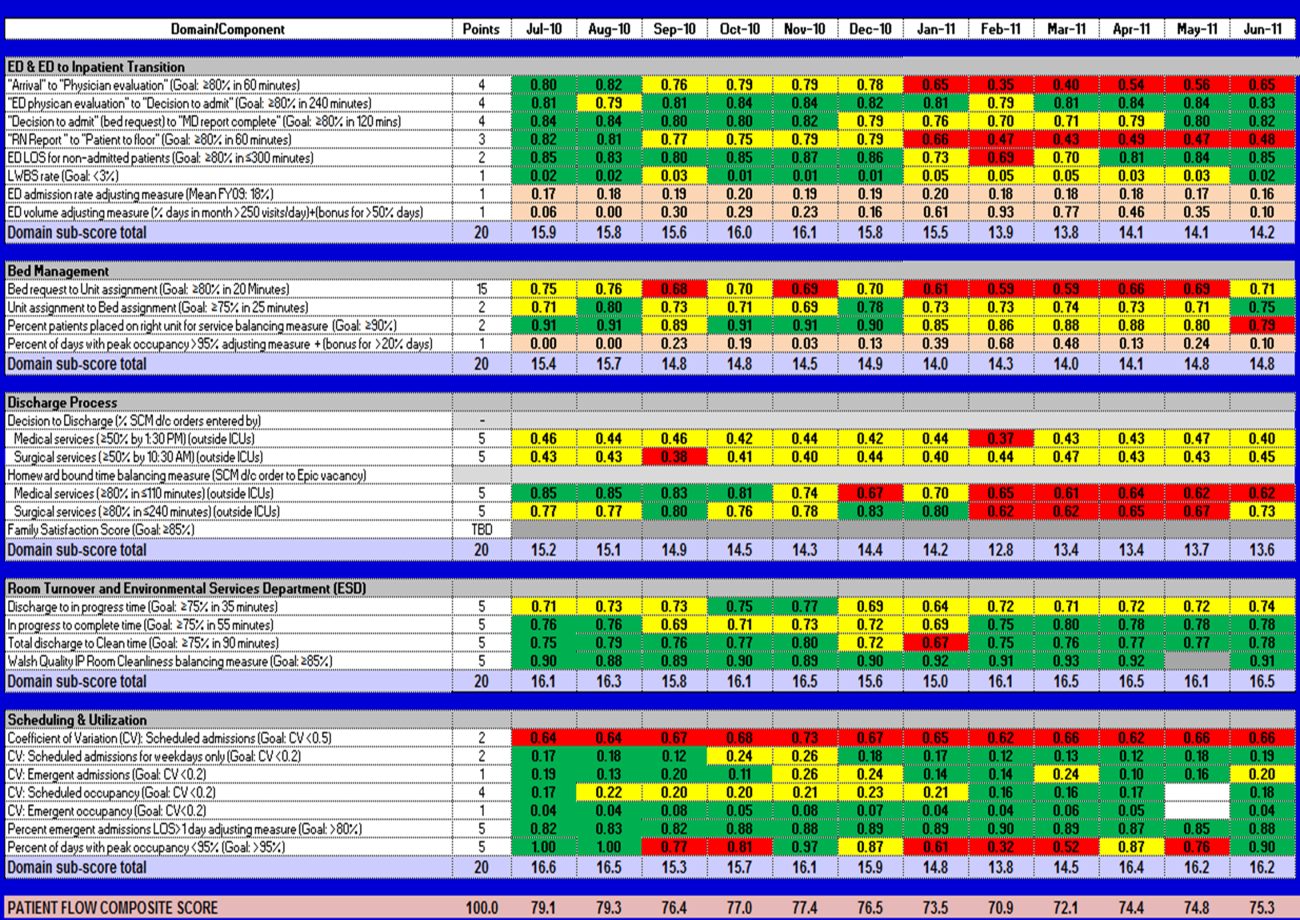
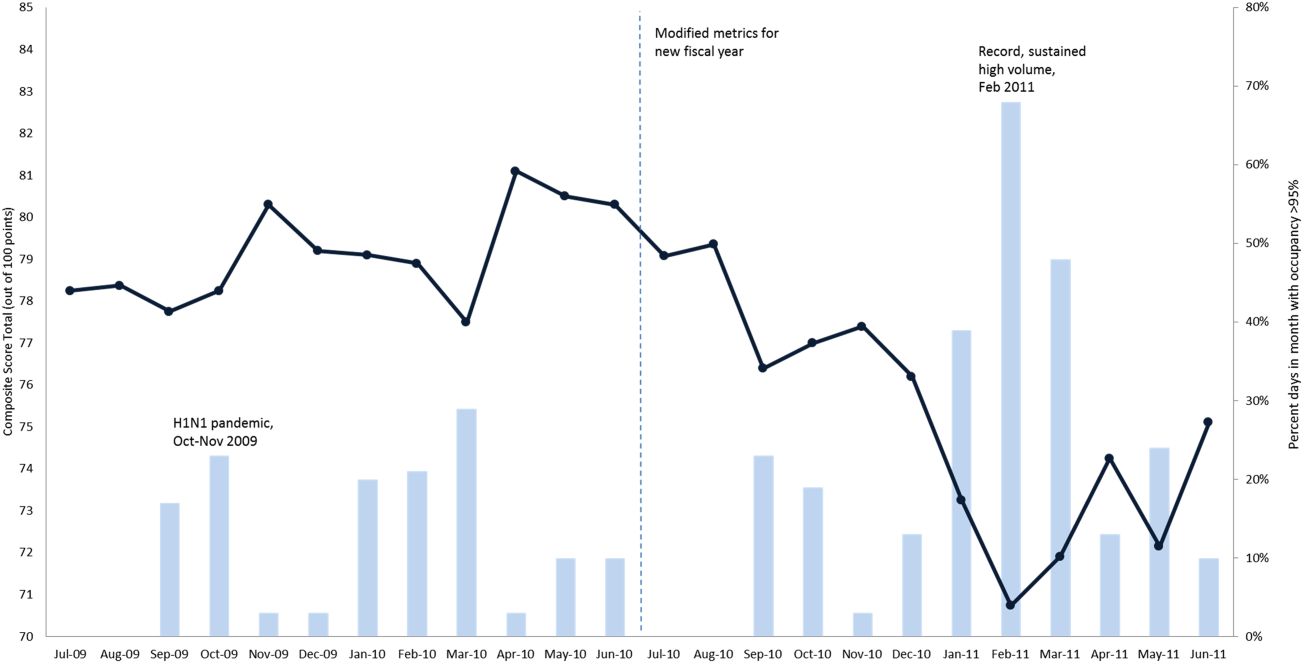
In addition to the overall composite score, the domain level and individual component scores allowed for more specific evaluation of variables affecting quality of care and enabled targeted improvement activities (Figure 4). For example, in December 2010 and January 2011, room turnover and ESD domain scores dropped, especially in the total discharge to clean time component. In response, the ESD made staffing adjustments, and starting in February 2011, component scores and the domain score improved. Feedback from the scheduling and utilization domain scores also initiated positive change. In August 2010, the CV: scheduled occupancy component score started to drop. In response, certain elective admissions were shifted to weekends to distribute hospital occupancy more evenly throughout the week. By February 2011, the component returned to its goal level. This continual evaluation of performance motivates continual improvement.
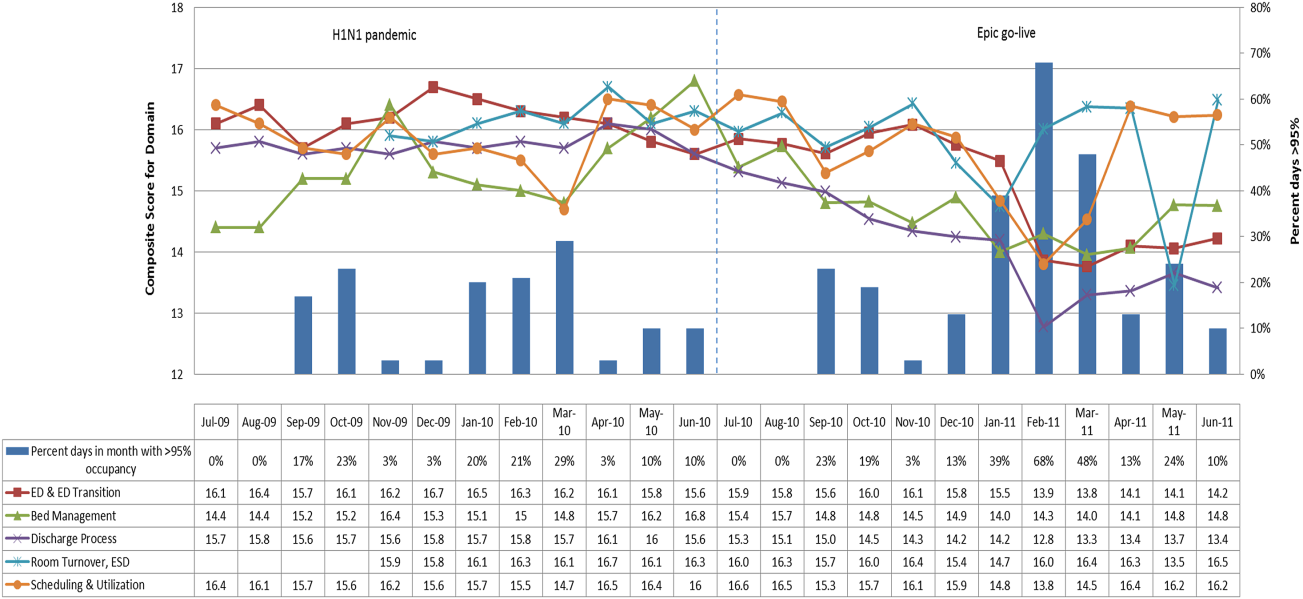
DISCUSSION
The use of a patient flow balanced scorecard with composite measurement overcomes pitfalls associated with a single or unaggregated measure. Aggregate scores alone mask important differences and relationships among components.[13] For example, 2 domains may be inversely related, or a provider with an overall average score might score above average in 1 domain but below in another. The composite scorecard, however, shows individual component and domain scores in addition to an aggregate score. The individual component and domain level scores highlight specific areas that need improvement and allow attention to be directed to those areas.
Additionally, a composite score is more likely to engage the range of staff involved in patient flow. Scaling out of 100 points and the red‐yellow‐green model are familiar for operations performance and can be easily understood.[17] Moreover, a composite score allows for dynamic performance goals while maintaining a stable measurement structure. For example, standardized LOS ratios, readmission rates, and denied hospital days can be added to the scorecard to provide more information and balancing measures.
Although balanced scorecards with composites can make holistic performance visible across multiple operational domains, they have some disadvantages. First, because there is a degree of complexity associated with a measure that incorporates multiple aspects of flow, certain elements, such as the relationship between a metric and its balancing measure, may not be readily apparent. Second, composite measures may not provide actionable information if the measure is not clearly related to a process that can be improved.[13, 14] Third, individual metrics may not be replicable between locations, so composites may need to be individualized to each setting.[10, 20]
Improving patient flow is a goal at many hospitals. Although measurement is crucial to identifying and mitigating variations, measuring the multidimensional aspects of flow and their impact on quality is difficult. Our scorecard, with composite measurement, addresses the need for an improved method to assess patient flow and improve quality by tracking care processes simultaneously.
Acknowledgements
The authors thank Bhuvaneswari Jayaraman for her contributions to the original calculations for the first version of the composite score.
Disclosures: Internal funds from The Children's Hospital of Philadelphia supported the conduct of this work. The authors report no conflicts of interest.
- AHA Solutions. Patient Flow Challenges Assessment 2009. Chicago, IL: American Hospital Association; 2009.
- , , , et al. The impact of emergency department crowding measures on time to antibiotics for patients with community‐acquired pneumonia. Ann Emerg Med. 2007;50(5):510–516.
- . Practice variation: implications for our health care system. Manag Care. 2004;13(9 suppl):3–7.
- . Managing variability in patient flow is the key to improving access to care, nursing staffing, quality of care, and reducing its cost. Paper presented at: Institute of Medicine; June 24, 2004; Washington, DC.
- , , . Developing models for patient flow and daily surge capacity research. Acad Emerg Med. 2006;13(11):1109–1113.
- , , , , . Patient flow variability and unplanned readmissions to an intensive care unit. Crit Care Med. 2009;37(11):2882–2887.
- , , , , , . Scheduled admissions and high occupancy at a children's hospital. J Hosp Med. 2011;6(2):81–87.
- , , . Frequent overcrowding in US emergency departments. Acad Emerg Med. 2001;8(2):151–155.
- Institute of Medicine. Performance measurement: accelerating improvement. Available at: http://www.iom.edu/Reports/2005/Performance‐Measurement‐Accelerating‐Improvement.aspx. Published December 1, 2005. Accessed December 5, 2012.
- , , , . Emergency department performance measures and benchmarking summit. Acad Emerg Med. 2006;13(10):1074–1080.
- . The Surgical Infection Prevention and Surgical Care Improvement Projects: promises and pitfalls. Am Surg. 2006;72(11):1010–1016; discussion 1021–1030, 1133–1048.
- , , . Patient safety quality indicators. Composite measures workgroup. Final report. Rockville, MD; Agency for Healthcare Research and Quality; 2008.
- , , , et al. ACCF/AHA 2010 position statement on composite measures for healthcare performance assessment: a report of the American College of Cardiology Foundation/American Heart Association Task Force on performance measures (Writing Committee to develop a position statement on composite measures). Circulation. 2010;121(15):1780–1791.
- , . A five‐point checklist to help performance reports incentivize improvement and effectively guide patients. Health Aff (Millwood). 2012;31(3):612–618.
- , , , , . Composite measures for profiling hospitals on surgical morbidity. Ann Surg. 2013;257(1):67–72.
- , . All‐or‐none measurement raises the bar on performance. JAMA. 2006;295(10):1168–1170.
- , , , et al. Quality improvement. Red light‐green light: from kids' game to discharge tool. Healthc Q. 2011;14:77–81.
- , , , . Myths of ideal hospital occupancy. Med J Aust. 2010;192(1):42–43.
- , . Emergency department overcrowding in the United States: an emerging threat to patient safety and public health. Emerg Med J. 2003;20(5):402–405.
- , , , . Emergency department crowding: consensus development of potential measures. Ann Emerg Med. 2003;42(6):824–834.
Patient flow refers to the management and movement of patients in a healthcare facility. Healthcare institutions utilize patient flow analyses to evaluate and improve aspects of the patient experience including safety, effectiveness, efficiency, timeliness, patient centeredness, and equity.[1, 2, 3, 4, 5, 6, 7, 8] Hospitals can evaluate patient flow using specific metrics, such as time in emergency department (ED) or percent of discharges completed by a certain time of day. However, no single metric can represent the full spectrum of processes inherent to patient flow. For example, ED length of stay (LOS) is dependent on inpatient occupancy, which is dependent on discharge timeliness. Each of these activities depends on various smaller activities, such as cleaning rooms or identifying available beds.
Evaluating the quality that healthcare organizations deliver is growing in importance.[9] Composite scores are being used increasingly to assess clinical processes and outcomes for professionals and institutions.[10, 11] Where various aspects of performance coexist, composite measures can incorporate multiple metrics into a comprehensive summary.[12, 13, 14, 15, 16] They also allow organizations to track a range of metrics for more holistic, comprehensive evaluations.[9, 13]
This article describes a balanced scorecard with composite scoring used at a large urban children's hospital to evaluate patient flow and direct improvement resources where they are needed most.
METHODS
The Children's Hospital of Philadelphia identified patient flow improvement as an operating plan initiative. Previously, performance was measured with a series of independent measures including time from ED arrival to transfer to the inpatient floor, and time from discharge order to room vacancy. These metrics were dismissed as sole measures of flow because they did not reflect the complexity and interdependence of processes or improvement efforts. There were also concerns that efforts to improve a measure caused unintended consequences for others, which at best lead to little overall improvement, and at worst reduced performance elsewhere in the value chain. For example, to meet a goal time for entering discharge orders, physicians could enter orders earlier. But, if patients were not actually ready to leave, their beds were not made available any earlier. Similarly, bed management staff could rush to meet a goal for speed of unit assignment, but this could cause an increase in patients admitted to the wrong specialty floor.
To address these concerns, a group of physicians, nurses, quality improvement specialists, and researchers designed a patient flow scorecard with composite measurement. Five domains of patient flow were identified: (1) ED and ED‐to‐inpatient transition, (2) bed management, (3) discharge process, (4) room turnover and environmental services department (ESD) activities, and (5) scheduling and utilization. Component measures for each domain were selected for 1 of 3 purposes: (1) to correspond to processes of importance to flow and improvement work, (2) to act as adjusters for factors that affect performance, or (3) to act as balancing measures so that progress in a measure would not result in the degradation of another. Each domain was assigned 20 points, which were distributed across the domain's components based on a consensus of the component's relative importance to overall domain performance (Figure 1). Data from the previous year were used as guidelines for setting performance percentile goals. For example, a goal of 80% in 60 minutes for arrival to physician evaluation meant that 80% of patients should see a physician within 1 hour of arriving at the ED.
Scores were also categorized to correspond to commonly used color descriptors.[17] For each component measure, performance meeting or exceeding the goal fell into the green category. Performances <10 percentage points below the goal fell into the yellow category, and performances below that level fell into the red category. Domain‐level scores and overall composite scores were also assigned colors. Performance at or above 80% (16 on the 20‐point domain scale, or 80 on the 100‐point overall scale) were designated green, scores between 70% and 79% were yellow, and scores below 70% were red.
DOMAINS OF THE PATIENT FLOW COMPOSITE SCORE
ED and ED‐to‐Inpatient Transition
Patient progression from the ED to an inpatient unit was separated into 4 steps (Figure 1A): (1) arrival to physician evaluation, (2) ED physician evaluation to decision to admit, (3) decision to admit to medical doctor (MD) report complete, and (4) registered nurse (RN) report to patient to floor. Four additional metrics included: (5) ED LOS for nonadmitted patients, (6) leaving without being seen (LWBS) rate, (7) ED admission rate, and (8) ED volume.
Arrival to physician evaluation measures time between patient arrival in the ED and self‐assignment by the first doctor or nurse practitioner in the electronic record, with a goal of 80% of patients seen within 60 minutes. The component score is calculated as percent of patients meeting this goal (ie, seen within 60 minutes) component weight. ED physician evaluation to decision to admit measures time from the start of the physician evaluation to the decision to admit, using bed request as a proxy; the goal was 80% within 4 hours. Decision to admit to MD report complete measures time from bed request to patient sign‐out to the inpatient floor, with a goal of 80% within 2 hours. RN report to patient to floor measures time from sign‐out to the patient leaving the ED, with a goal of 80% within 1 hour. ED LOS for nonadmitted patients measures time in the ED for patients who are not admitted, and the goal was 80% in <5 hours. The domain also tracks the LWBS rate, with a goal of keeping it below 3%. Its component score is calculated as percent patients seen component weight. ED admission rate is an adjusting factor for the severity of patients visiting the ED. Its component score is calculated as (percent of patients visiting the ED who are admitted to the hospital 5) component weight. Because the average admission rate is around 20%, the percent admitted is multiplied by 5 to more effectively adjust for high‐severity patients. ED volume is an adjusting factor that accounts for high volume. Its component score is calculated as percent of days in a month with more than 250 visits (a threshold chosen by the ED team) component weight. If these days exceed 50%, that percent would be added to the component score as an additional adjustment for excessive volume.
Bed Management
The bed management domain measures how efficiently and effectively patients are assigned to units and beds using 4 metrics (Figure 1B): (1) bed request to unit assignment, (2) unit assignment to bed assignment, (3) percentage of patients placed on right unit for service, and (4) percent of days with peak occupancy >95%.
Bed request to unit assignment measures time from the ED request for a bed in the electronic system to patient being assigned to a unit, with a goal of 80% of assignments made within 20 minutes. Unit assignment to bed assignment measures time from unit assignment to bed assignment, with a goal of 75% within 25 minutes. Because this goal was set to 75% rather than 80%, this component score was multiplied by 80/75 so that all component scores could be compared on the same scale. Percentage of patients placed on right unit for service is a balancing measure for speed of assignment. Because the goal was set to 90% rather than 80%, this component score was also multiplied by an adjusting factor (80/90) so that all components could be compared on the same scale. Percent of days with peak occupancy >95% is an adjusting measure that reflects that locating an appropriate bed takes longer when the hospital is approaching full occupancy. Its component score is calculated as (percent of days with peak occupancy >95% + 1) component weight. The was added to more effectively adjust for high occupancy. If more than 20% of days had peak occupancy greater than 95%, that percent would be added to the component score as an additional adjustment for excessive capacity.
Discharge Process
The discharge process domain measures the efficiency of patient discharge using 2 metrics (Figure 1C): (1) decision to discharge and (2) homeward bound time.
Decision to discharge tracks when clinicians enter electronic discharge orders. The goal was 50% by 1:30 pm for medical services and 10:30 am for surgical services. This encourages physicians to enter discharge orders early to enable downstream discharge work to begin. The component score is calculated as percent entered by goal time component weight (80/50) to adjust the 50% goal up to 80% so all component scores could be compared on the same scale. Homeward bound time measures the time between the discharge order and room vacancy as entered by the unit clerk, with a goal of 80% of patients leaving within 110 minutes for medical services and 240 minutes for surgical services. This balancing measure captures the fact that entering discharge orders early does not facilitate flow if the patients do not actually leave the hospital.
Room Turnover and Environmental Services Department
The room turnover and ESD domain measures the quality of the room turnover processes using 4 metrics (Figure 1D): (1) discharge to in progress time, (2) in progress to complete time, (3) total discharge to clean time, and (4) room cleanliness.
Discharge to in progress time measures time from patient vacancy until ESD staff enters the room, with a goal of 75% within 35 minutes. Because the goal was set to 75% rather than 80%, this component score was multiplied by 80/75 so all component scores could be compared on the same scale. In progress to complete time measures time as entered in the electronic health record from ESD staff entering the room to the room being clean, with a goal of 75% within 55 minutes. The component score is calculated identically to the previous metric. Total discharge to clean time measures the length of the total process, with a goal of 75% within 90 minutes. This component score was also multiplied by 80/75 so that all component scores could be compared on the same scale. Although this repeats the first 2 measures, given workflow and interface issues with our electronic health record (Epic, Epic Systems Corporation, Verona Wisconsin), it is necessary to include a total end‐to‐end measure in addition to the subparts. Patient and family ratings of room cleanliness serve as balancing measures, with the component score calculated as percent satisfaction component weight (80/85) to adjust the 85% satisfaction goal to 80% so all component scores could be compared on the same scale.
Scheduling and Utilization
The scheduling and utilization domain measures hospital operations and variations in bed utilization using 7 metrics including (Figure 1E): (1) coefficient of variation (CV): scheduled admissions, (2) CV: scheduled admissions for weekdays only, (3) CV: emergent admissions, (4) CV: scheduled occupancy, (5) CV: emergent occupancy, (6) percent emergent admissions with LOS >1 day, and (7) percent of days with peak occupancy <95%.
The CV, standard deviation divided by the mean of a distribution, is a measure of dispersion. Because it is a normalized value reported as a percentage, CV can be used to compare variability when sample sizes differ. CV: scheduled admissions captures the variability in admissions coded as an elective across all days in a month. The raw CV score is the standard deviation of the elective admissions for each day divided by the mean. The component score is (1 CV) component weight. A higher CV indicates greater variability, and yields a lower component score. CV on scheduled and emergent occupancy is derived from peak daily occupancy. Percent emergent admissions with LOS >1 day captures the efficiency of bed use, because high volumes of short‐stay patients increases turnover work. Its component score is calculated as the percent of emergent admissions in a month with LOS >1 day component weight. Percent of days with peak occupancy <95% incentivizes the hospital to avoid full occupancy, because effective flow requires that some beds remain open.[18, 19] Its component score is calculated as the percent of days in the month with peak occupancy <95% component weight. Although a similar measure, percent of days with peak occupancy >95%, was an adjusting factor in the bed management domain, it is included again here, because this factor has a unique effect on both domains.
RESULTS
The balanced scorecard with composite measures provided improvement teams and administrators with a picture of patient flow (Figure 2). The overall score provided a global perspective on patient flow over time and captured trends in performance during various states of hospital occupancy. One trend that it captured was an association between high volume and poor composite scores (Figure 3). Notably, the H1N1 influenza pandemic in the fall of 2009 and the turnover of computer systems in January 2011 can be linked to dips in performance. The changes between fiscal years reflect a shift in baseline metrics.
In addition to the overall composite score, the domain level and individual component scores allowed for more specific evaluation of variables affecting quality of care and enabled targeted improvement activities (Figure 4). For example, in December 2010 and January 2011, room turnover and ESD domain scores dropped, especially in the total discharge to clean time component. In response, the ESD made staffing adjustments, and starting in February 2011, component scores and the domain score improved. Feedback from the scheduling and utilization domain scores also initiated positive change. In August 2010, the CV: scheduled occupancy component score started to drop. In response, certain elective admissions were shifted to weekends to distribute hospital occupancy more evenly throughout the week. By February 2011, the component returned to its goal level. This continual evaluation of performance motivates continual improvement.
DISCUSSION
The use of a patient flow balanced scorecard with composite measurement overcomes pitfalls associated with a single or unaggregated measure. Aggregate scores alone mask important differences and relationships among components.[13] For example, 2 domains may be inversely related, or a provider with an overall average score might score above average in 1 domain but below in another. The composite scorecard, however, shows individual component and domain scores in addition to an aggregate score. The individual component and domain level scores highlight specific areas that need improvement and allow attention to be directed to those areas.
Additionally, a composite score is more likely to engage the range of staff involved in patient flow. Scaling out of 100 points and the red‐yellow‐green model are familiar for operations performance and can be easily understood.[17] Moreover, a composite score allows for dynamic performance goals while maintaining a stable measurement structure. For example, standardized LOS ratios, readmission rates, and denied hospital days can be added to the scorecard to provide more information and balancing measures.
Although balanced scorecards with composites can make holistic performance visible across multiple operational domains, they have some disadvantages. First, because there is a degree of complexity associated with a measure that incorporates multiple aspects of flow, certain elements, such as the relationship between a metric and its balancing measure, may not be readily apparent. Second, composite measures may not provide actionable information if the measure is not clearly related to a process that can be improved.[13, 14] Third, individual metrics may not be replicable between locations, so composites may need to be individualized to each setting.[10, 20]
Improving patient flow is a goal at many hospitals. Although measurement is crucial to identifying and mitigating variations, measuring the multidimensional aspects of flow and their impact on quality is difficult. Our scorecard, with composite measurement, addresses the need for an improved method to assess patient flow and improve quality by tracking care processes simultaneously.
Acknowledgements
The authors thank Bhuvaneswari Jayaraman for her contributions to the original calculations for the first version of the composite score.
Disclosures: Internal funds from The Children's Hospital of Philadelphia supported the conduct of this work. The authors report no conflicts of interest.
- AHA Solutions. Patient Flow Challenges Assessment 2009. Chicago, IL: American Hospital Association; 2009.
- , , , et al. The impact of emergency department crowding measures on time to antibiotics for patients with community‐acquired pneumonia. Ann Emerg Med. 2007;50(5):510–516.
- . Practice variation: implications for our health care system. Manag Care. 2004;13(9 suppl):3–7.
- . Managing variability in patient flow is the key to improving access to care, nursing staffing, quality of care, and reducing its cost. Paper presented at: Institute of Medicine; June 24, 2004; Washington, DC.
- , , . Developing models for patient flow and daily surge capacity research. Acad Emerg Med. 2006;13(11):1109–1113.
- , , , , . Patient flow variability and unplanned readmissions to an intensive care unit. Crit Care Med. 2009;37(11):2882–2887.
- , , , , , . Scheduled admissions and high occupancy at a children's hospital. J Hosp Med. 2011;6(2):81–87.
- , , . Frequent overcrowding in US emergency departments. Acad Emerg Med. 2001;8(2):151–155.
- Institute of Medicine. Performance measurement: accelerating improvement. Available at: http://www.iom.edu/Reports/2005/Performance‐Measurement‐Accelerating‐Improvement.aspx. Published December 1, 2005. Accessed December 5, 2012.
- , , , . Emergency department performance measures and benchmarking summit. Acad Emerg Med. 2006;13(10):1074–1080.
- . The Surgical Infection Prevention and Surgical Care Improvement Projects: promises and pitfalls. Am Surg. 2006;72(11):1010–1016; discussion 1021–1030, 1133–1048.
- , , . Patient safety quality indicators. Composite measures workgroup. Final report. Rockville, MD; Agency for Healthcare Research and Quality; 2008.
- , , , et al. ACCF/AHA 2010 position statement on composite measures for healthcare performance assessment: a report of the American College of Cardiology Foundation/American Heart Association Task Force on performance measures (Writing Committee to develop a position statement on composite measures). Circulation. 2010;121(15):1780–1791.
- , . A five‐point checklist to help performance reports incentivize improvement and effectively guide patients. Health Aff (Millwood). 2012;31(3):612–618.
- , , , , . Composite measures for profiling hospitals on surgical morbidity. Ann Surg. 2013;257(1):67–72.
- , . All‐or‐none measurement raises the bar on performance. JAMA. 2006;295(10):1168–1170.
- , , , et al. Quality improvement. Red light‐green light: from kids' game to discharge tool. Healthc Q. 2011;14:77–81.
- , , , . Myths of ideal hospital occupancy. Med J Aust. 2010;192(1):42–43.
- , . Emergency department overcrowding in the United States: an emerging threat to patient safety and public health. Emerg Med J. 2003;20(5):402–405.
- , , , . Emergency department crowding: consensus development of potential measures. Ann Emerg Med. 2003;42(6):824–834.

Matching Workforce to Workload
Healthcare systems face many clinical and operational challenges in optimizing the quality of patient care across the domains of safety, effectiveness, efficiency, timeliness, patient‐centeredness, and equity.[1] They must also balance staff satisfaction, and in academic settings, the education of trainees. In inpatient settings, the process of care encompasses many microsystems, and clinical outcomes are the result of a combination of endogenous patient factors, the capabilities of clinical staff, as well as the static and dynamic organizational characteristics of the systems delivering care.[2, 3, 4, 5] Static organizational characteristics include hospital type and size, whereas dynamic organizational characteristics include communications between staff, staff fatigue, interruptions in care, and other factors that impact patient care and clinical outcomes (Figure 1).[2] Two major components of healthcare microsystems are workload and workforce.
A principle in operations management describes the need to match capacity (eg, workforce) to demand (eg, workload) to optimize efficiency.[6] This is particularly relevant in healthcare settings, where an excess of workload for the available workforce may negatively impact processes and outcomes of patient care and resident learning. These problems can arise from fatigue and strain from a heavy cognitive load, or from interruptions, distractions, and ineffective communication.[7, 8, 9, 10, 11] Conversely, in addition to being inefficient, an excess of workforce is financially disadvantageous for the hospital and reduces trainees' opportunities for learning.
Workload represents patient demand for clinical resources, including staff time and effort.[5, 12] Its elements include volume, turnover, acuity, and patient variety. Patient volume is measured by census.[12] Turnover refers to the number of admissions, discharges, and transfers in a given time period.[12] Acuity reflects the intensity of patient needs,[12] and variety represents the heterogeneity of those needs. These 4 workload factors are highly variable across locations and highly dynamic, even within a fixed location. Thus, measuring workload to assemble the appropriate workforce is challenging.
Workforce is comprised of clinical and nonclinical staff members who directly or indirectly provide services to patients. In this article, clinicians who obtain histories, conduct physical exams, write admission and progress notes, enter orders, communicate with consultants, and obtain consents are referred to as front‐line ordering clinicians (FLOCs). FLOCs perform activities listed in Table 1. Historically, in teaching hospitals, FLOCs consisted primarily of residents. More recently, FLOCs include nurse practitioners, physician assistants, house physicians, and hospitalists (when providing direct care and not supervising trainees).[13] In academic settings, supervising physicians (eg, senior supervising residents, fellows, or attendings), who are usually on the floor only in a supervisory capacity, may also contribute to FLOC tasks for part of their work time.
| FLOC Responsibilities | FLOC Personnel |
|---|---|
| |
| Admission history and physical exam | Residents |
| Daily interval histories | Nurse practitioners |
| Daily physical exams | Physician assistants |
| Obtaining consents | House physicians |
| Counseling, guidance, and case management | Hospitalists (when not in supervisory role) |
| Performing minor procedures | Fellows (when not in supervisory role) |
| Ordering, performing and interpreting diagnostic tests | Attendings (when not in supervisory role) |
| Writing prescriptions | |
Though matching workforce to workload is essential for hospital efficiency, staff satisfaction, and optimizing patient outcomes, hospitals currently lack a means to measure and match dynamic workload and workforce factors. This is particularly problematic at large children's hospitals, where high volumes of admitted patients stay for short amounts of time (less than 2 or 3 days).[14] This frequent turnover contributes significantly to workload. We sought to address this issue as part of a larger effort to redefine the care model at our urban, tertiary care children's hospital. This article describes our work to develop and obtain consensus for use of a tool to dynamically match FLOC workforce to clinical workload in a variety of inpatient settings.
METHODS
We undertook an iterative, multidisciplinary approach to develop the Care Model Matrix tool (Figure 2). The process involved literature reviews,[2, 3, 4, 5, 6, 7, 8, 9, 10, 11, 12, 13, 14] discussions with clinical leadership, and repeated validation sessions. Our focus was at the level of the patient nursing units, which are the discrete areas in a hospital where patient care is delivered and physician teams are organized. We met with physicians and nurses from every clinical care area at least twice to reach consensus on how to define model inputs, decide how to quantify those inputs for specific microsystems, and to validate whether model outputs seemed consistent with clinicians' experiences on the floors. For example, if the model indicated that a floor was short 1 FLOC during the nighttime period, relevant staff confirmed that this was consistent with their experience.
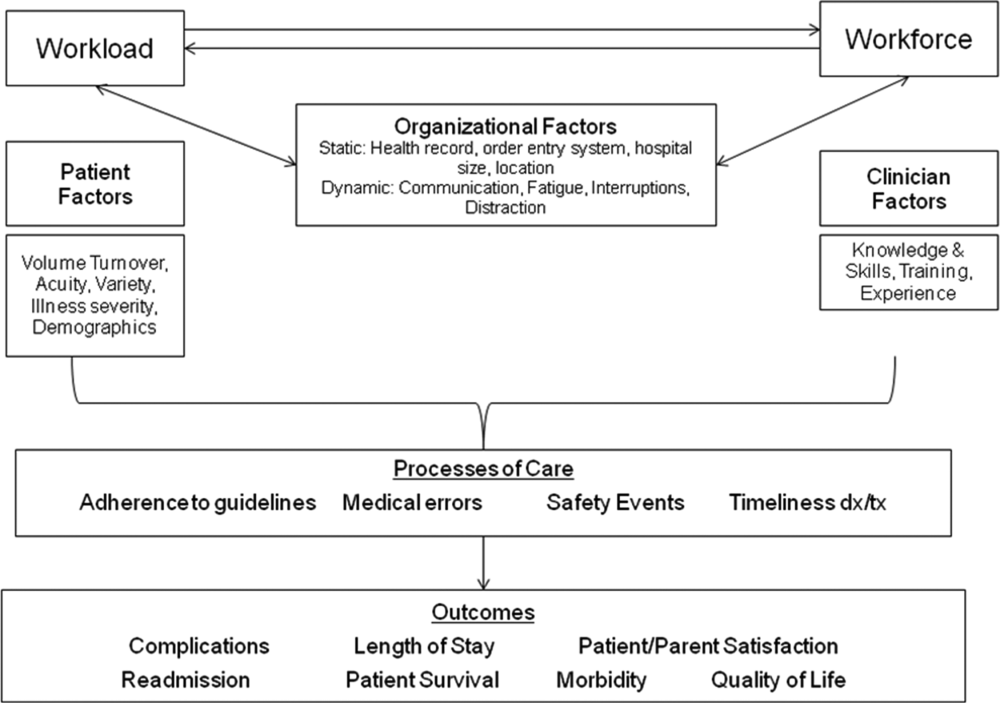
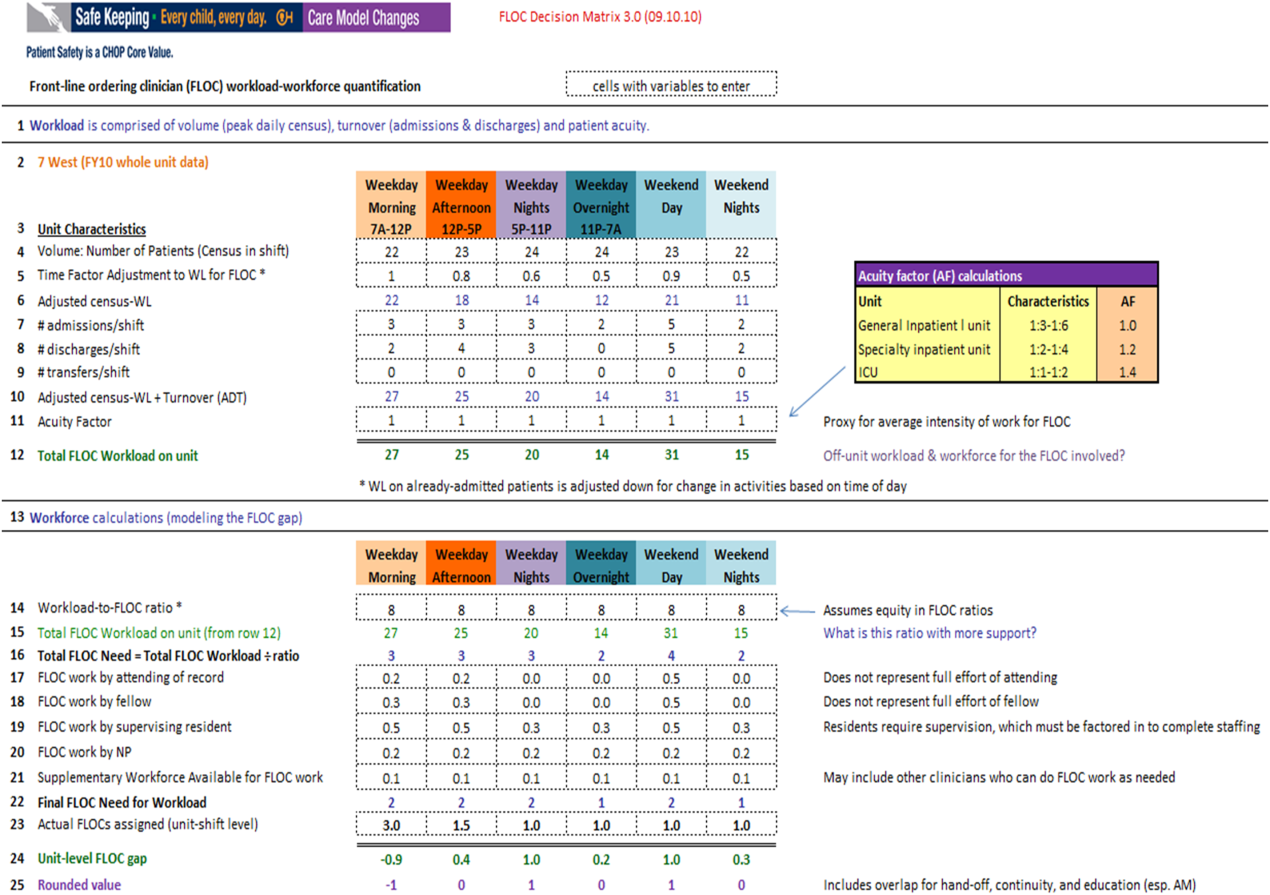
Quantifying Workload
In quantifying FLOC workload, we focused on 3 elements: volume, turnover, and acuity.[12] Volume is equal to the patient census at a moment in time for a particular floor or unit. Census data were extracted from the hospital's admission‐discharge‐transfer (ADT) system (Epic, Madison, WI). Timestamps for arrival and departure are available for each unit. These data were used to calculate census estimates for intervals of time that corresponded to activities such as rounds, conferences, or sign‐outs, and known variations in patient flow. Intervals for weekdays were: 7 am to 12 pm, 12 pm to 5 pm, 5 pm to 11 pm, and 11 pm to 7 am. Intervals for weekends were: 7 am to 7 pm (daytime), and 7 pm to 7 am (nighttime). Census data for each of the 6 intervals were averaged over 1 year.
In addition to patient volume, discussions with FLOCs highlighted the need to account for inpatients having different levels of need at different points throughout the day. For example, patients require the most attention in the morning, when FLOCs need to coordinate interval histories, conduct exams, enter orders, call consults, and interpret data. In the afternoon and overnight, patients already in beds have relatively fewer needs, especially in nonintensive care unit (ICU) settings. To adjust census data to account for time of day, a time factor was added, with 1 representing the normalized full morning workload (Figure 2, line 5). Based on clinical consensus, this time factor decreased over the course of the day, more so for non‐ICU patients than for ICU patients. For example, a time factor of 0.5 for overnight meant that patients in beds on that unit generated half as much work overnight as those same patients would in the morning when the time factor was set to 1. Multiplication of number of patients and the time factor equals adjusted census workload, which reflects what it felt like for FLOCs to care for that number of patients at that time. Specifically, if there were 20 patients at midnight with a time factor of 0.5, the patients generated a workload equal to 20 0.5=10 workload units (WU), whereas in the morning the same actual number of patients would generate a workload of 20 1=20 WU.
The ADT system was also used to track information about turnover, including number of admissions, discharges, and transfers in or out of each unit during each interval. Each turnover added to the workload count to reflect the work involved in admitting, transferring, or discharging a patient (Figure 2, lines 79). For example, a high‐turnover floor might have 20 patients in beds, with 4 admissions and 4 discharges in a given time period. Based on clinical consensus, it was determined that the work involved in managing each turnover would count as an additional workload element, yielding an adjusted census workload+turnover score of (20 1)+4+4=28 WU. Although only 20 patients would be counted in a static census during this time, the adjusted workload score was 28 WU. Like the time factor, this adjustment helps provide a feels‐like barometer.
Finally, this workload score is multiplied by an acuity factor that considers the intensity of need for patients on a unit (Figure 2, line 11). We stratified acuity based on whether the patient was in a general inpatient unit, a specialty unit, or an ICU, and assigned acuity factors based on observations of differences in intensity between those units. The acuity factor was normalized to 1 for patients on a regular inpatient floor. Specialty care areas were 20% higher (1.2), and ICUs were 40% higher (1.4). These differentials were estimated based on clinician experience and knowledge of current FLOC‐to‐patient and nurse‐to‐patient ratios.
Quantifying Workforce
To quantify workforce, we assumed that each FLOC, regardless of type, would be responsible for the same number of workload units. Limited evidence and research exist regarding ideal workload‐to‐staff ratios for FLOCs. Published literature and hospital experience suggest that the appropriate volume per trainee for non‐ICU inpatient care in medicine and pediatrics is between 6 and 10 patients (not workload units) per trainee.[13, 15, 16, 17, 18] Based on these data, we chose 8 workload units as a reasonable workload allocation per FLOC. This ratio appears in the matrix as a modifiable variable (Figure 2, line 14). We then divided total FLOC workload (Figure 2, line 15) from our workload calculations by 8 to determine total FLOC need (Figure 2, line 16). Because some of the workload captured in total FLOC need would be executed by personnel who are typically classified as non‐FLOCs, such as attendings, fellows, and supervising residents, we quantified the contributions of each of these non‐FLOCs through discussion with clinical leaders from each floor. For example, if an attending physician wrote complete notes on weekends, he or she would be contributing to FLOC work for that location on those days. A 0.2 contribution under attendings would mean that an attending contributed an amount of work equivalent to 20% of a FLOC. We subtracted contributions of non‐FLOCs from the total FLOC need to determine final FLOC need (Figure 2, line 22). Last, we subtracted the actual number of FLOCs assigned to a unit for a specific time period from the final FLOC need to determine the unit‐level FLOC gap at that time (Figure 2, line 24).
RESULTS
The Care Model Matrix compares predicted workforce need and actual workforce assignments, while considering the contributions of non‐FLOCs to FLOC work in various inpatient care settings. Figure 3 shows graphical representations of FLOC staffing models. The green line shows the traditional approach, and the red line shows the dynamic approach using the Care Model Matrix. The dynamic approach better captures variations in workload.
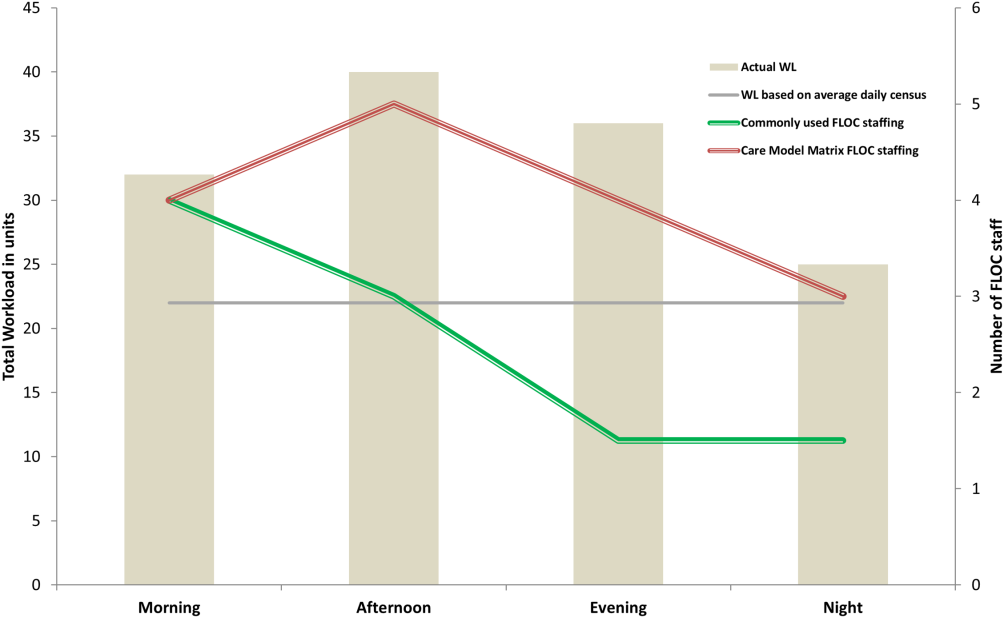
We presented the tool at over 25 meetings in 14 hospital divisions, and received widespread acceptance among physician, nursing, and administrative leadership. In addition, the hospital has used the tool to identify gaps in FLOC coverage and guide hiring and staffing decisions. Each clinical area also used the tool to review staffing for the 2012 academic year. Though a formal evaluation of the tool has not been conducted, feedback from attending physicians and FLOCs has been positive. Specifically, staffing adjustments have increased the available workforce in the afternoons and on weekends, when floors were previously perceived to be understaffed.
DISCUSSION
Hospitals depend upon a large, diverse workforce to manage and care for patients. In any system there will be a threshold at which workload exceeds the available workforce. In healthcare delivery settings, this can harm patient care and resident education.[12, 19] Conversely, a workforce that is larger than necessary is inefficient. If hospitals can define and measure relevant elements to better match workforce to workload, they can avoid under or over supplying staff, and mitigate the risks associated with an overburdened workforce or the waste of unused capacity. It also enables more flexible care models to dynamically match resources to needs.
The Care Model Matrix is a flexible, objective tool that quantifies multidimensional aspects of workload and workforce. With the tool, hospitals can use historic data on census, turnover, and acuity to predict workload and staffing needs at specific time periods. Managers can also identify discrepancies between workload and workforce, and match them more efficiently during the day.
The tool, which uses multiple modifiable variables, can be adapted to a variety of academic and community inpatient settings. Although our sample numbers in Figure 2 represent census, turnover, acuity, and workload‐to‐FLOC ratios at our hospital, other hospitals can adjust the model to reflect their numbers. The flexibility to add new factors as elements of workload or workforce enhances usability. For example, the model can be modified to capture other factors that affect staffing needs such as frequency of handoffs[11] and the staff's level of education or experience.
There are, however, numerous challenges associated with matching FLOC staffing to workload. Although there is a 24‐hour demand for FLOC coverage, unlike nursing, ideal FLOC to patients or workload ratios have not been established. Academic hospitals may experience additional challenges, because trainees have academic responsibilities in addition to clinical roles. Although trainees are included in FLOC counts, they are unavailable during certain didactic times, and their absence may affect the workload balance.
Another challenge associated with dynamically adjusting workforce to workload is that most hospitals do not have extensive flex or surge capacity. One way to address this is to have FLOCs choose days when they will be available as backup for a floor that is experiencing a heavier than expected workload. Similarly, when floors are experiencing a lighter than expected workload, additional FLOCs can be diverted to administrative tasks, to other floors in need of extra capacity, or sent home with the expectation that the day will be made up when the floor is experiencing a heavier workload.
Though the tool provides numerous advantages, there are several limitations to consider. First, the time and acuity factors used in the workload calculation, as well as the non‐FLOC contribution estimates and numbers reflecting desired workload per FLOC used in the workforce calculation, are somewhat subjective estimations based on observation and staff consensus. Thus, even though the tool's approach should be generalizable to any hospital, the specific values may not be. Therefore, other hospitals may need to change these values based on their unique situations. It is also worth noting that the flexibility of the tool presents both a virtue and potential vice. Those using the tool must agree upon a standard to define units so inconsistent definitions do not introduce unjustified discrepancies in workload. Second, the current tool does not consider the costs and benefits of different staffing approaches. Different types of FLOCs may handle workload differently, so an ideal combination of FLOC types should be considered in future studies. Third, although this work focused on matching FLOCs to workload, the appropriate matching of other workforce members is also essential to maximizing efficiency and patient care. Finally, because the tool has not yet been tested against outcomes, adhering to the tool's suggested ratios cannot necessary guarantee optimal outcomes in terms of patient care or provider satisfaction. Rather, the tool is designed to detect mismatches of workload and workforce based on desired workload levels, defined through local consensus.
CONCLUSION
We sought to develop a tool that quantifies workload and workforce to help our freestanding children's hospital predict and plan for future staffing needs. We created a tool that is objective and flexible, and can be applied to a variety of academic and community inpatient settings to identify mismatches of workload and workforce at discrete time intervals. However, given that the tool's recommendations are sensitive to model inputs that are based on local consensus, further research is necessary to test the validity and generalizability of the tool in various settings. Model inputs may need to be calibrated over time to maximize the tool's usefulness in a particular setting. Further study is also needed to determine how the tool directly impacts patient and provider satisfaction and the quality of care delivered.
Acknowledgements
The authors acknowledge the dozens of physicians and nurses for their involvement in the development of the Care Model Matrix through repeated meetings and dialog. The authors thank Sheyla Medina, Lawrence Chang, and Jennifer Jonas for their assistance in the production of this article.
Disclosures: Internal funds from The Children's Hospital of Philadelphia supported the conduct of this work. The authors have no financial interests, relationships, affiliations, or potential conflicts of interest relevant to the subject matter or materials discussed in the manuscript to disclose.
- . A user's manual for the IOM's “quality chasm” report. Health Aff. 2002;21(3):80–90.
- . Human error: models and management. BMJ. 2000;320(7237):768–770.
- , . Knowledge for Improvement: Improving Quality in the Micro‐systems of Care. in Providing Quality of Care in a Cost‐Focused Environment, Goldfield N, Nach DB (eds.), Gaithersburg, Maryland: Aspen Publishers, Inc. 1999;75–88.
- World Alliance For Patient Safety Drafting Group1, , , , et al. Towards an International Classification for Patient Safety: the conceptual framework. Int J Qual Health Care. F2009;21(1):2–8.
- , . Impact of workload on service time and patient safety: an econometric analysis of hospital operations. Manage Sci. 2009;55(9):1486–1498.
- , . Matching Supply With Demand: An Introduction to Operations Management. New York, NY: McGraw‐Hill; 2006.
- , . Operational failures and interruptions in hospital nursing. Health Serv Res. 2006;41:643–662.
- , , , , . Association of interruptions with an increased risk and severity of medication administration errors. Arch Intern Med. 2010;170(8):683–690.
- . The impact of fatigue on patient safety. Pediatr Clin North Am. 2006;53(6):1135–1153.
- , , , , . Effects of hospital care environment on patient mortality and nurse outcomes. J Nurs Adm. 2009;39(7/8):S45–S51.
- , , , , , . Perspective: beyond counting hours: the importance of supervision, professionalism, transitions of care, and workload in residency training. Acad Med. 2012;87(7):883–888.
- , , , et al. Hospital workload and adverse events. Med Care. 2007;45(5):448–455.
- , . Resident Work Hours, Hospitalist Programs, and Academic Medical Centers. The Hospitalist. Vol Jan/Feb: Society of Hospital Medicine; 2005: http://www.the‐hospitalist.org/details/article/257983/Resident_Work_Hours_Hospitalist_Programs_and_Academic_Medical_Centers.html#. Accessed on August 21, 2012.
- . Hospital stays for children, 2006. Healthcare Cost and Utilization Project. Statistical brief 56. Rockville, MD: Agency for Healthcare Research and Quality; 2008. Available at: http://www.hcup‐us.ahrq.gov/reports/statbriefs/sb56.pdf. Accessed on August 21, 2012
- , , , et al. Implications of the California nurse staffing mandate for other states. Health Serv Res. 2010;45:904–921.
- . Patient safety at ten: unmistakable progress, troubling gaps. Health Aff. 2010;29(1):165–173.
- , , , et al. Patient‐to‐nurse ratios and outcomes of moderately preterm infants. Pediatrics. 2010;125(2):320–326.
- , , , , . Nurse‐staffing levels and the quality of care in hospitals. N Engl J Med. 2002;346(22):1715–1722.
- , , , . Perceptions of educational experience and inpatient workload among pediatric residents. Hosp Pediatr. 2013;3(3):276–284.
Healthcare systems face many clinical and operational challenges in optimizing the quality of patient care across the domains of safety, effectiveness, efficiency, timeliness, patient‐centeredness, and equity.[1] They must also balance staff satisfaction, and in academic settings, the education of trainees. In inpatient settings, the process of care encompasses many microsystems, and clinical outcomes are the result of a combination of endogenous patient factors, the capabilities of clinical staff, as well as the static and dynamic organizational characteristics of the systems delivering care.[2, 3, 4, 5] Static organizational characteristics include hospital type and size, whereas dynamic organizational characteristics include communications between staff, staff fatigue, interruptions in care, and other factors that impact patient care and clinical outcomes (Figure 1).[2] Two major components of healthcare microsystems are workload and workforce.
A principle in operations management describes the need to match capacity (eg, workforce) to demand (eg, workload) to optimize efficiency.[6] This is particularly relevant in healthcare settings, where an excess of workload for the available workforce may negatively impact processes and outcomes of patient care and resident learning. These problems can arise from fatigue and strain from a heavy cognitive load, or from interruptions, distractions, and ineffective communication.[7, 8, 9, 10, 11] Conversely, in addition to being inefficient, an excess of workforce is financially disadvantageous for the hospital and reduces trainees' opportunities for learning.
Workload represents patient demand for clinical resources, including staff time and effort.[5, 12] Its elements include volume, turnover, acuity, and patient variety. Patient volume is measured by census.[12] Turnover refers to the number of admissions, discharges, and transfers in a given time period.[12] Acuity reflects the intensity of patient needs,[12] and variety represents the heterogeneity of those needs. These 4 workload factors are highly variable across locations and highly dynamic, even within a fixed location. Thus, measuring workload to assemble the appropriate workforce is challenging.
Workforce is comprised of clinical and nonclinical staff members who directly or indirectly provide services to patients. In this article, clinicians who obtain histories, conduct physical exams, write admission and progress notes, enter orders, communicate with consultants, and obtain consents are referred to as front‐line ordering clinicians (FLOCs). FLOCs perform activities listed in Table 1. Historically, in teaching hospitals, FLOCs consisted primarily of residents. More recently, FLOCs include nurse practitioners, physician assistants, house physicians, and hospitalists (when providing direct care and not supervising trainees).[13] In academic settings, supervising physicians (eg, senior supervising residents, fellows, or attendings), who are usually on the floor only in a supervisory capacity, may also contribute to FLOC tasks for part of their work time.
| FLOC Responsibilities | FLOC Personnel |
|---|---|
| |
| Admission history and physical exam | Residents |
| Daily interval histories | Nurse practitioners |
| Daily physical exams | Physician assistants |
| Obtaining consents | House physicians |
| Counseling, guidance, and case management | Hospitalists (when not in supervisory role) |
| Performing minor procedures | Fellows (when not in supervisory role) |
| Ordering, performing and interpreting diagnostic tests | Attendings (when not in supervisory role) |
| Writing prescriptions | |
Though matching workforce to workload is essential for hospital efficiency, staff satisfaction, and optimizing patient outcomes, hospitals currently lack a means to measure and match dynamic workload and workforce factors. This is particularly problematic at large children's hospitals, where high volumes of admitted patients stay for short amounts of time (less than 2 or 3 days).[14] This frequent turnover contributes significantly to workload. We sought to address this issue as part of a larger effort to redefine the care model at our urban, tertiary care children's hospital. This article describes our work to develop and obtain consensus for use of a tool to dynamically match FLOC workforce to clinical workload in a variety of inpatient settings.
METHODS
We undertook an iterative, multidisciplinary approach to develop the Care Model Matrix tool (Figure 2). The process involved literature reviews,[2, 3, 4, 5, 6, 7, 8, 9, 10, 11, 12, 13, 14] discussions with clinical leadership, and repeated validation sessions. Our focus was at the level of the patient nursing units, which are the discrete areas in a hospital where patient care is delivered and physician teams are organized. We met with physicians and nurses from every clinical care area at least twice to reach consensus on how to define model inputs, decide how to quantify those inputs for specific microsystems, and to validate whether model outputs seemed consistent with clinicians' experiences on the floors. For example, if the model indicated that a floor was short 1 FLOC during the nighttime period, relevant staff confirmed that this was consistent with their experience.
Quantifying Workload
In quantifying FLOC workload, we focused on 3 elements: volume, turnover, and acuity.[12] Volume is equal to the patient census at a moment in time for a particular floor or unit. Census data were extracted from the hospital's admission‐discharge‐transfer (ADT) system (Epic, Madison, WI). Timestamps for arrival and departure are available for each unit. These data were used to calculate census estimates for intervals of time that corresponded to activities such as rounds, conferences, or sign‐outs, and known variations in patient flow. Intervals for weekdays were: 7 am to 12 pm, 12 pm to 5 pm, 5 pm to 11 pm, and 11 pm to 7 am. Intervals for weekends were: 7 am to 7 pm (daytime), and 7 pm to 7 am (nighttime). Census data for each of the 6 intervals were averaged over 1 year.
In addition to patient volume, discussions with FLOCs highlighted the need to account for inpatients having different levels of need at different points throughout the day. For example, patients require the most attention in the morning, when FLOCs need to coordinate interval histories, conduct exams, enter orders, call consults, and interpret data. In the afternoon and overnight, patients already in beds have relatively fewer needs, especially in nonintensive care unit (ICU) settings. To adjust census data to account for time of day, a time factor was added, with 1 representing the normalized full morning workload (Figure 2, line 5). Based on clinical consensus, this time factor decreased over the course of the day, more so for non‐ICU patients than for ICU patients. For example, a time factor of 0.5 for overnight meant that patients in beds on that unit generated half as much work overnight as those same patients would in the morning when the time factor was set to 1. Multiplication of number of patients and the time factor equals adjusted census workload, which reflects what it felt like for FLOCs to care for that number of patients at that time. Specifically, if there were 20 patients at midnight with a time factor of 0.5, the patients generated a workload equal to 20 0.5=10 workload units (WU), whereas in the morning the same actual number of patients would generate a workload of 20 1=20 WU.
The ADT system was also used to track information about turnover, including number of admissions, discharges, and transfers in or out of each unit during each interval. Each turnover added to the workload count to reflect the work involved in admitting, transferring, or discharging a patient (Figure 2, lines 79). For example, a high‐turnover floor might have 20 patients in beds, with 4 admissions and 4 discharges in a given time period. Based on clinical consensus, it was determined that the work involved in managing each turnover would count as an additional workload element, yielding an adjusted census workload+turnover score of (20 1)+4+4=28 WU. Although only 20 patients would be counted in a static census during this time, the adjusted workload score was 28 WU. Like the time factor, this adjustment helps provide a feels‐like barometer.
Finally, this workload score is multiplied by an acuity factor that considers the intensity of need for patients on a unit (Figure 2, line 11). We stratified acuity based on whether the patient was in a general inpatient unit, a specialty unit, or an ICU, and assigned acuity factors based on observations of differences in intensity between those units. The acuity factor was normalized to 1 for patients on a regular inpatient floor. Specialty care areas were 20% higher (1.2), and ICUs were 40% higher (1.4). These differentials were estimated based on clinician experience and knowledge of current FLOC‐to‐patient and nurse‐to‐patient ratios.
Quantifying Workforce
To quantify workforce, we assumed that each FLOC, regardless of type, would be responsible for the same number of workload units. Limited evidence and research exist regarding ideal workload‐to‐staff ratios for FLOCs. Published literature and hospital experience suggest that the appropriate volume per trainee for non‐ICU inpatient care in medicine and pediatrics is between 6 and 10 patients (not workload units) per trainee.[13, 15, 16, 17, 18] Based on these data, we chose 8 workload units as a reasonable workload allocation per FLOC. This ratio appears in the matrix as a modifiable variable (Figure 2, line 14). We then divided total FLOC workload (Figure 2, line 15) from our workload calculations by 8 to determine total FLOC need (Figure 2, line 16). Because some of the workload captured in total FLOC need would be executed by personnel who are typically classified as non‐FLOCs, such as attendings, fellows, and supervising residents, we quantified the contributions of each of these non‐FLOCs through discussion with clinical leaders from each floor. For example, if an attending physician wrote complete notes on weekends, he or she would be contributing to FLOC work for that location on those days. A 0.2 contribution under attendings would mean that an attending contributed an amount of work equivalent to 20% of a FLOC. We subtracted contributions of non‐FLOCs from the total FLOC need to determine final FLOC need (Figure 2, line 22). Last, we subtracted the actual number of FLOCs assigned to a unit for a specific time period from the final FLOC need to determine the unit‐level FLOC gap at that time (Figure 2, line 24).
RESULTS
The Care Model Matrix compares predicted workforce need and actual workforce assignments, while considering the contributions of non‐FLOCs to FLOC work in various inpatient care settings. Figure 3 shows graphical representations of FLOC staffing models. The green line shows the traditional approach, and the red line shows the dynamic approach using the Care Model Matrix. The dynamic approach better captures variations in workload.
We presented the tool at over 25 meetings in 14 hospital divisions, and received widespread acceptance among physician, nursing, and administrative leadership. In addition, the hospital has used the tool to identify gaps in FLOC coverage and guide hiring and staffing decisions. Each clinical area also used the tool to review staffing for the 2012 academic year. Though a formal evaluation of the tool has not been conducted, feedback from attending physicians and FLOCs has been positive. Specifically, staffing adjustments have increased the available workforce in the afternoons and on weekends, when floors were previously perceived to be understaffed.
DISCUSSION
Hospitals depend upon a large, diverse workforce to manage and care for patients. In any system there will be a threshold at which workload exceeds the available workforce. In healthcare delivery settings, this can harm patient care and resident education.[12, 19] Conversely, a workforce that is larger than necessary is inefficient. If hospitals can define and measure relevant elements to better match workforce to workload, they can avoid under or over supplying staff, and mitigate the risks associated with an overburdened workforce or the waste of unused capacity. It also enables more flexible care models to dynamically match resources to needs.
The Care Model Matrix is a flexible, objective tool that quantifies multidimensional aspects of workload and workforce. With the tool, hospitals can use historic data on census, turnover, and acuity to predict workload and staffing needs at specific time periods. Managers can also identify discrepancies between workload and workforce, and match them more efficiently during the day.
The tool, which uses multiple modifiable variables, can be adapted to a variety of academic and community inpatient settings. Although our sample numbers in Figure 2 represent census, turnover, acuity, and workload‐to‐FLOC ratios at our hospital, other hospitals can adjust the model to reflect their numbers. The flexibility to add new factors as elements of workload or workforce enhances usability. For example, the model can be modified to capture other factors that affect staffing needs such as frequency of handoffs[11] and the staff's level of education or experience.
There are, however, numerous challenges associated with matching FLOC staffing to workload. Although there is a 24‐hour demand for FLOC coverage, unlike nursing, ideal FLOC to patients or workload ratios have not been established. Academic hospitals may experience additional challenges, because trainees have academic responsibilities in addition to clinical roles. Although trainees are included in FLOC counts, they are unavailable during certain didactic times, and their absence may affect the workload balance.
Another challenge associated with dynamically adjusting workforce to workload is that most hospitals do not have extensive flex or surge capacity. One way to address this is to have FLOCs choose days when they will be available as backup for a floor that is experiencing a heavier than expected workload. Similarly, when floors are experiencing a lighter than expected workload, additional FLOCs can be diverted to administrative tasks, to other floors in need of extra capacity, or sent home with the expectation that the day will be made up when the floor is experiencing a heavier workload.
Though the tool provides numerous advantages, there are several limitations to consider. First, the time and acuity factors used in the workload calculation, as well as the non‐FLOC contribution estimates and numbers reflecting desired workload per FLOC used in the workforce calculation, are somewhat subjective estimations based on observation and staff consensus. Thus, even though the tool's approach should be generalizable to any hospital, the specific values may not be. Therefore, other hospitals may need to change these values based on their unique situations. It is also worth noting that the flexibility of the tool presents both a virtue and potential vice. Those using the tool must agree upon a standard to define units so inconsistent definitions do not introduce unjustified discrepancies in workload. Second, the current tool does not consider the costs and benefits of different staffing approaches. Different types of FLOCs may handle workload differently, so an ideal combination of FLOC types should be considered in future studies. Third, although this work focused on matching FLOCs to workload, the appropriate matching of other workforce members is also essential to maximizing efficiency and patient care. Finally, because the tool has not yet been tested against outcomes, adhering to the tool's suggested ratios cannot necessary guarantee optimal outcomes in terms of patient care or provider satisfaction. Rather, the tool is designed to detect mismatches of workload and workforce based on desired workload levels, defined through local consensus.
CONCLUSION
We sought to develop a tool that quantifies workload and workforce to help our freestanding children's hospital predict and plan for future staffing needs. We created a tool that is objective and flexible, and can be applied to a variety of academic and community inpatient settings to identify mismatches of workload and workforce at discrete time intervals. However, given that the tool's recommendations are sensitive to model inputs that are based on local consensus, further research is necessary to test the validity and generalizability of the tool in various settings. Model inputs may need to be calibrated over time to maximize the tool's usefulness in a particular setting. Further study is also needed to determine how the tool directly impacts patient and provider satisfaction and the quality of care delivered.
Acknowledgements
The authors acknowledge the dozens of physicians and nurses for their involvement in the development of the Care Model Matrix through repeated meetings and dialog. The authors thank Sheyla Medina, Lawrence Chang, and Jennifer Jonas for their assistance in the production of this article.
Disclosures: Internal funds from The Children's Hospital of Philadelphia supported the conduct of this work. The authors have no financial interests, relationships, affiliations, or potential conflicts of interest relevant to the subject matter or materials discussed in the manuscript to disclose.
- . A user's manual for the IOM's “quality chasm” report. Health Aff. 2002;21(3):80–90.
- . Human error: models and management. BMJ. 2000;320(7237):768–770.
- , . Knowledge for Improvement: Improving Quality in the Micro‐systems of Care. in Providing Quality of Care in a Cost‐Focused Environment, Goldfield N, Nach DB (eds.), Gaithersburg, Maryland: Aspen Publishers, Inc. 1999;75–88.
- World Alliance For Patient Safety Drafting Group1, , , , et al. Towards an International Classification for Patient Safety: the conceptual framework. Int J Qual Health Care. F2009;21(1):2–8.
- , . Impact of workload on service time and patient safety: an econometric analysis of hospital operations. Manage Sci. 2009;55(9):1486–1498.
- , . Matching Supply With Demand: An Introduction to Operations Management. New York, NY: McGraw‐Hill; 2006.
- , . Operational failures and interruptions in hospital nursing. Health Serv Res. 2006;41:643–662.
- , , , , . Association of interruptions with an increased risk and severity of medication administration errors. Arch Intern Med. 2010;170(8):683–690.
- . The impact of fatigue on patient safety. Pediatr Clin North Am. 2006;53(6):1135–1153.
- , , , , . Effects of hospital care environment on patient mortality and nurse outcomes. J Nurs Adm. 2009;39(7/8):S45–S51.
- , , , , , . Perspective: beyond counting hours: the importance of supervision, professionalism, transitions of care, and workload in residency training. Acad Med. 2012;87(7):883–888.
- , , , et al. Hospital workload and adverse events. Med Care. 2007;45(5):448–455.
- , . Resident Work Hours, Hospitalist Programs, and Academic Medical Centers. The Hospitalist. Vol Jan/Feb: Society of Hospital Medicine; 2005: http://www.the‐hospitalist.org/details/article/257983/Resident_Work_Hours_Hospitalist_Programs_and_Academic_Medical_Centers.html#. Accessed on August 21, 2012.
- . Hospital stays for children, 2006. Healthcare Cost and Utilization Project. Statistical brief 56. Rockville, MD: Agency for Healthcare Research and Quality; 2008. Available at: http://www.hcup‐us.ahrq.gov/reports/statbriefs/sb56.pdf. Accessed on August 21, 2012
- , , , et al. Implications of the California nurse staffing mandate for other states. Health Serv Res. 2010;45:904–921.
- . Patient safety at ten: unmistakable progress, troubling gaps. Health Aff. 2010;29(1):165–173.
- , , , et al. Patient‐to‐nurse ratios and outcomes of moderately preterm infants. Pediatrics. 2010;125(2):320–326.
- , , , , . Nurse‐staffing levels and the quality of care in hospitals. N Engl J Med. 2002;346(22):1715–1722.
- , , , . Perceptions of educational experience and inpatient workload among pediatric residents. Hosp Pediatr. 2013;3(3):276–284.

CDU is Associated with Decreased LOS
Hospitalists play a crucial role in improving hospital throughput and length of stay (LOS). The clinical decision unit (CDU) or observation unit (OU) is a strategy that was developed to facilitate both aims. CDUs and OUs are units where patients can be managed in the hospital for up to 24 hours prior to a decision being made to admit or discharge. Observation care is provided to patients who require further treatment or monitoring beyond what is accomplished in the emergency department (ED), but who do not require inpatient admission. CDUs arose in the 1990s in response to a desire to decrease inpatient costs as well as changing Medicare guidelines, which recognized observation status. Initially, CDUs and OUs were located within the ED and run by emergency medicine physicians. However, at the turn of the 21st century, hospitalists became involved in observation medicine, and the Society of Hospital Medicine issued a white paper on the OU in 2007. [1] Today, up to 50% of CDUs and OUs nationally are managed by hospitalists and located physically outside of the ED.[2, 3]
Despite the fact that nearly half of all CDUs and OUs nationally are run by hospitalists, there has been little published regarding the impact of hospitalist‐driven units. This study demonstrates the effect of observation care delivered in a hospitalist‐run geographic CDU. The primary objective was to determine the impact on LOS for patients in observation status managed in a hospitalist‐run CDU compared with LOS for observation patients with the same diagnoses cared for on medicalsurgical units prior to the existence of the CDU. The secondary objective was to determine the effect on the 30‐day ED or hospital revisit rate, as well as ED LOS. This work will guide health systems, hospitalist groups, and physicians in their decision making regarding the future structure and process of CDUs.
METHODS
Study Design
The Cooper University Hospital institutional review board approved this study. The study took place at Cooper University Hospital, a large, urban, academic safety‐net hospital providing tertiary care located in Camden, New Jersey.
We performed a retrospective observational study of all adult observation encounters at the study hospital from July 2010 to January 2011, and July 2011 through January 2012. During the second time period, patients could have been managed in the CDU or on a medicalsurgical unit. We recorded the following demographic data: age, gender, race, principal diagnosis, and payer, as well as several outcomes of interest, including: LOS (defined as the time separating the admitting physician order from discharge), ED visits within 30 days of discharge, and hospital revisits (observation or inpatient) within 30 days.
Data Sources
Data were culled by the institution's performance improvement department from the electronic medical record, as well as cost accounting and claims‐based sources.
Clinical Decision Unit
The CDU at Cooper University Hospital opened in June 2011 and is a 20‐bed geographically distinct unit adjacent to the ED. During the study period, it was staffed 24 hours a day by a hospitalist and a nurse practitioner as well as dedicated nurses and critical care technicians. Patients meeting observation status in the ED were eligible for the CDU provided that they fulfilled the CDU placement guidelines including that they were more likely than not to be discharged within a period of 24 hours of CDU care, did not meet inpatient admission criteria, did not require new placement in a rehabilitation or extended‐care facility, and did not require one‐on‐one monitoring. Additional exclusion criteria included severe vital sign or laboratory abnormalities. The overall strategy of the guidelines was to facilitate a pull culture, where the majority of observation patients were brought from the ED to the CDU once it was determined that they did not require inpatient care. The CDU had order sets and protocols in place for many of the common diagnoses. All CDU patients received priority laboratory and radiologic testing as well as priority consultation from specialty services. Medication reconciliation was performed by a pharmacy technician for higher‐risk patients, identified by Project BOOST (Better Outcomes by Optimizing Safe Transitions) criteria.[4] Structured multidisciplinary rounds occurred daily including the hospitalist, nurse practitioner, registered nurses, case manager, and pharmacy technician. A discharge planner was available to schedule follow‐up appointments.
Although chest pain was the most common CDU diagnosis, the CDU was designed to care for the majority of the hospital's observation patients rather than focus specifically on chest pain. Patients with chest pain who met observation criteria were transferred from the ED to the CDU, rather than a medicalsurgical unit, provided they did not have: positive cardiac enzymes, an electrocardiogram indicative of ischemia, known coronary artery disease presenting with pain consistent with acute coronary syndrome, need for heparin or nitroglycerin continuous infusion, symptomatic or unresolved arrhythmia, congestive heart failure meeting inpatient criteria, hypertensive urgency or emergency, pacemaker malfunction, pericarditis, or toxicity from cardiac drugs. Cardiologist consultants were involved in the care of nearly all CDU patients with chest pain.
Observation Status Determination
During the study period, observation status was recommended by a case manager in the ED based on Milliman (Milliman Care Guidelines) or McKesson InterQual (McKesson Corporation) criteria, once it was determined by the ED physician that the patient had failed usual ED care and required hospitalization. Observation status was assigned by the admitting (non‐ED) physician, who placed the order for inpatient admission or observation. Other than the implementation of the CDU, there were no significant changes to the process or criteria for assigning observation status, admission order sets, or the hospital's electronic medical record during this time period.
Statistical Analysis
Continuous data are presented as mean ( standard deviation [SD]) or median (25%75% interquartile range) as specified, and differences were assessed using one‐way analysis of variance testing and Mann‐Whitney U testing. Categorical data are presented as count (percentage) and differences evaluated using [2] analysis. P values of 0.05 or less were considered statistically significant.
To account for differences in groups with regard to outcomes, we performed a multivariate regression analysis. The following variables were entered: age (years), gender, race (African American vs other), admission diagnosis (chest pain vs other), and insurance status (Medicare vs other). All variables were entered simultaneously without forcing. Statistical analyses were done using the SPSS 20.0 Software (SPSS Inc., Chicago, IL).
RESULTS
Demographics
There were a total of 3735 patients included in the study: 1650 in the pre‐CDU group, 1469 in the post‐CDU group, and 616 in the post‐CDU group on medicalsurgical units. The post‐CDU period had a total of 2085 patients. Patients in the CDU group were younger and were more likely to have chest pain as the admission diagnosis. Patient demographics are presented in Table 1.
| Variable | Pre‐CDU, n=1,650 | Post‐CDU, n=1,469 | PostNon‐CDU, n=616 | P, CDU vs Pre‐CDU | P, Non‐CDU vs Pre‐CDU | P, CDU vs Non‐CDU |
|---|---|---|---|---|---|---|
| ||||||
| Age, y [range] | 56 [4569] | 53 [4364] | 57 [44.370] | <0.001 | 0.751 | 0.001 |
| Female gender | 918 (55.6%) | 833(56.7%) | 328 (53.2%) | 0.563 | 0.319 | 0.148 |
| African American race | 574 (34.8%) | 505 (34.4%) | 174 (28.2%) | 0.821 | 0.004 | 0.007 |
| Admission diagnosis | ||||||
| Chest pain | 462 (38%) | 528 (35.9%) | 132 (21.4%) | <0.001 | 0.002 | <0.001 |
| Syncope | 93 (5.6%) | 56 (3.8%) | 15 (2.4%) | 0.018 | 0.001 | 0.145 |
| Abdominal pain | 46 (2.8%) | 49 (3.3%) | 20(3.2%) | 0.404 | 0.575 | 1.0 |
| Other | 1,049 (63.6%) | 836 (56.9%) | 449 (72.9%) | <0.001 | <0.001 | <0.001 |
| Third‐party payer | ||||||
| Medicare | 727 (44.1%) | 491 (33.4%) | 264(43.4%) | <0.001 | 0.634 | <0.001 |
| Charity care | 187 (11.3%) | 238 (16.2%) | 73 (11.9%) | <0.001 | 0.767 | 0.010 |
| Commercial | 185 (11.1%) | 214 (14.6%) | 87 (14.1%) | 0.005 | 0.059 | 0.838 |
| Medicaid | 292 (17.7%) | 280 (19.1%) | 100 (16.2%) | 0.331 | 0.454 | 0.136 |
| Other | 153 (9.3%) | 195 (13.3%) | 60 (9.9%) | <0.001 | 0.746 | 0.028 |
| Self‐pay | 106 (6.4%) | 51(3.5%) | 32 (5.2%) | <0.001 | 0.323 | 0.085 |
Outcomes of Interest
There was a statistically significant association between LOS and CDU implementation (Table 2). Observation patients cared for in the CDU had a lower LOS than observation patients cared for on the medicalsurgical units during the same time period (17.6 vs 26.1 hours, P<0.0001).
| Outcome | Pre‐CDU, n=1,650 | Post‐CDU, n=1,469 | PostNon‐CDU, n=616 | P, CDU vs Pre‐CDU | P, Non‐CDU vs Pre‐CDU | P, CDU vs Non‐CDU |
|---|---|---|---|---|---|---|
| ||||||
| All patients, n=3,735 | ||||||
| 30‐day ED or hospital revisit | 326 (19.8%) | 268 (18.2%) | 123 (17.2%) | 0.294 | 0.906 | 0.357 |
| Median LOS, h | 27.1 [17.446.4] | 17.6 [12.122.8] | 26.1 [16.941.2] | <0.001 | 0.004 | <0.001 |
| Chest‐pain patients, n=1,122 | ||||||
| 30‐day ED or hospital revisit | 69 (14.9%) | 82 (15.5%) | 23 (17.4%) | 0.859 | 0.496 | 0.596 |
| Median LOS, h | 22 [15.838.9] | 17.3 [10.922.4] | 23.2 [13.843.1] | <0.001 | 0.995 | <0.001 |
| Other diagnoses, n=2,613 | ||||||
| 30‐day ED or hospital revisit | 257 (21.6%) | 186 (19.8%) | 100 (18.4%) | 0.307 | 0.693 | 0.727 |
| Median LOS, h | 30.4 [18.649.4] | 17.8 [12.923] | 26.7 [17.231.1] | <0.001 | <0.001 | <0.001 |
In total, there were 717 total revisits including ED visits and hospital stays within 30 days of discharge (Table 2). Of all the observation encounters in the study, 19.2% were followed by a revisit within 30 days. There were no differences in the 30‐day post‐ED visit rates in between periods and between groups.
Mean ED LOS for hospitalized patients was examined for a sample of the pre‐ and post‐CDU periods, namely November 2010 to January 2011 and November 2011 to January 2012. The mean ED LOS decreased from 410 minutes (SD=61) to 393 minutes (SD=51) after implementation of the CDU (P=0.037).
To account for possible skewing of the data, we transformed LOS into ln (natural log) LOS and found the following means (SD): group 1 was 3.27 (0.94), group 2 was 2.78 (0.6), and group 3 was 3.1 (0.93). Using an independent t test, we found a significant difference between groups 1 and 2, 2 and 3, as well as 1 and 3 (P<0.001 for all).
Chest‐Pain Subgroup Analysis
We analyzed the data specifically for the 1122 patients discharged with a diagnosis of chest pain. LOS was significantly lower for patients in the CDU compared to either pre‐CDU or observation on floors (Table 2).
Multivariate Regression Analysis
We performed a linear regression analysis using the following variables: age, race, gender, diagnosis, insurance status, and study period (pre‐CDU, post‐CDU, and postnon‐CDU). We performed 3 different comparisons: pre‐CDU vs post‐CDU, postnon‐CDU vs post‐CDU, and postnon‐CDU vs pre‐CDU. After adjusting for other variables, the postnon‐CDU group was significantly associated with higher LOS (P<0.001). The pre‐CDU group was associated with higher LOS than both the post‐CDU and postnon‐CDU groups (P<0.001 for both).
DISCUSSION
In our study of a hospitalist‐run CDU for observation patients, we observed that the care in the CDU was associated with a lower median LOS, but no increase in ED or hospital revisits within 30 days.
Previous studies have reported the impact of clinical observation or clinical diagnosis units, particularly chest‐pain units.[5, 6, 7, 8, 9, 10, 11, 12, 13, 14, 15] Studies of hospitalist‐run units suggest shorter LOS in the entire hospital,[16] or in the target unit.[17] Although one study suggested a lower 30‐day readmission rate,[18] most others did not describe this effect.[16, 17] Our study differs from previous research in that our program employed a pull‐culture aimed at accepting the majority of observation status patients without focusing on a particular diagnosis. We also implemented a structured multidisciplinary team focused on expediting care and utilized BOOST‐framed transitions, including targeted medication reconciliation and tools such as teach‐back.
The CDU in our hospital produced shorter LOS even compared to our non‐CDU units, but the revisit rate did not improve despite activities to reduce revisits. During the study period, efforts to decrease readmissions were implemented in various areas of our hospital, but not a comprehensive institution‐wide readmissions strategy. Lack of impact on revisits could be viewed as a positive finding, in that shorter LOS did not result in patients being discharged home before clinically stable. Alternatively, lack of impact could be due to the uncertain effectiveness of BOOST specifically[19, 20, 21] or inpatient‐targeted transitions interventions more generally.[22]
Our study has certain limitations. Findings in our single‐center study in an urban academic medical center may not apply to CDUs in other settings. As a prepost design, our study is subject to external trends for which our analyses may be unable to account. For example, during CDU implementation, there were hospital‐wide initiatives aimed at improving inpatient LOS, including complex case rounds, increased use of active bed management, and improved case management efforts to decrease LOS. These may have been a factor in the small decrease in observation LOS seen in the medicalsurgical patients during the post period. Additionally, though we have attempted to control for possible confounders, there could have been differences in the study groups for which we were unable to account, including code status or social variables such as homelessness, which played a role in our revisit outcomes. The decrease in LOS by 35%, or 9.5 hours, in CDU patients is clinically important, as it allows low‐risk patients to spend less time in the hospital where they may have been at risk of hospital‐acquired conditions; however, this study did not include patient satisfaction data. It would be important to measure the effect on patient experience of potentially spending 1 fewer night in the hospital. Finally, our CDU was designed with specific clinical criteria for inclusion and exclusion. Patients who were higher risk or expected to need more than 24 hours of care were not placed in the CDU. We were not able to adjust our analyses for factors that were not in our data, such as severe vital sign or laboratory abnormalities or a physician's clinical impression of a patient. It is possible, therefore, that referral bias may have occurred and influenced our results. The fact that non‐CDU chest‐pain patients in the post‐CDU period did not experience any decrease in LOS, whereas other medicalsurgical observation patients did, may be an example of this bias. Patients were excluded from the CDU by virtue of being deemed higher risk as described in Methods section. We were unable to adjust for these differences.
Implementation of CDUs may be useful for health systems seeking to improve hospital throughput and improve utilization among common but low‐acuity patient groups. Although our initial results are promising, the concept of a CDU may require enhancements. For example, at our hospital we are addressing transitions of care by looking at models that address patient risk through a systematic process, and then target individuals for specific interventions to prevent revisits. Moreover, the study of CDUs should report impact on patient and referring physician satisfaction, and whether CDUs can reduce per‐case costs.
CONCLUSION
Caring for patients in a hospitalist‐run geographic CDU was associated with a 35% decrease in observation LOS for CDU patients compared with a 3.7% decrease for observation patients cared for elsewhere in the hospital. CDU patients' LOS was significantly decreased without increasing ED or hospital revisit rates.
Acknowledgments
The authors would like to thank Ken Travis for excellent data support.
- The observation unit: an operational overview for the hospitalist. Society of Hospital Medicine website. Available at: http://www.hospitalmedicine.org/AM/Template.cfm?Section=White_Papers18(12):1371–1379.
- , , , , , . Use of observation care in US emergency departments, 2001 to 2008. PLoS One. 2011;6(9):e24326.
- The Society of Hospital Medicine Project Boost (Better Outcomes by Optimizing Safe Transitions) Available at: http://www.hospitalmedicine.org/boost. Accessed on June 4, 2013.
- , , , , . An emergency department‐based protocol for rapidly ruling out myocardial ischemia reduces hospital time and expense: results of a randomized study (ROMIO). J Am Coll Cardiol. 1996;28(1):25–33.
- , , , , , . Implementation of the guidelines for the management of patients with chest pain through a critical pathway approach improves length of stay and patient satisfaction but not anxiety. Crit Pathw Cardiol. 2010;9(1):30–34.
- , , , et al. Costs of an emergency department‐based accelerated diagnostic protocol vs hospitalization in patients with chest pain: a randomized controlled trial. JAMA. 1997;278(20):1670–1676.
- , , , et al. Emergency‐department diagnosis of acute myocardial infarction and ischemia: a cost analysis of two diagnostic protocols. Acad Emerg Med. 1994;1(2):103–110.
- , , , et al. Impact on the care of the emergency department chest pain patient from the chest pain evaluation registry (CHEPER) study. Am J Cardiol. 1997;80(5):563–568.
- , , , et al. Cost‐effectiveness of a new short‐stay unit to “rule out” acute myocardial infarction in low risk patients. J Am Coll Cardiol. 1994;24(5):1249–1259.
- , , , et al. Emergency Department Observation Unit versus hospital inpatient care for a chronic asthmatic population: a randomized trial of health status outcome and cost. Med Care. 1998;36(4):599–609.
- , , , et al. A comparison between emergency diagnostic and treatment unit and inpatient care in the management of acute asthma. Arch Intern Med. 1997;157(18):2055–2062.
- , , , . Retrospective review of emergency department patients with non‐variceal upper gastrointestinal hemorrhage for potential outpatient management. Acad Emerg Med. 1999;6(3):196–201.
- , . Outpatient care of selected patients with acute non‐variceal upper gastrointestinal haemorrhage. Lancet. 1995;345(8942):108–111.
- , , , , . Patterns of use of an emergency department‐based observation unit. Am J Ther. 2002;9(6):499–502.
- , , . Implementation of a hospitalist‐run observation unit and impact on length of stay (LOS): a brief report. J Hosp Med. 2010;5(9):E2–E5.
- , , , , . Improving resource utilization in a teaching hospital: development of a nonteaching service for chest pain admissions. Acad Med. 2006;81(5):432–435.
- , , , . Program description: a hospitalist‐run, medical short‐stay unit in a teaching hospital. CMAJ. 2000;163(11):1477–1480.
- , , , et al. Project BOOST: effectiveness of a multihospital effort to reduce rehospitalization. J Hosp Med. 2013;8:421–427.
- , , , et al. BOOST: evidence needing a lift. J Hosp Med. 2013;8:468–469.
- . BOOST and readmissions: thinking beyond the walls of the hospital. J Hosp Med. 2013;8:470–471.
- , , , et al. Hospital‐initiated transitional care interventions as a patient safety strategy. Ann Int Med. 2013;158:433–440.
Hospitalists play a crucial role in improving hospital throughput and length of stay (LOS). The clinical decision unit (CDU) or observation unit (OU) is a strategy that was developed to facilitate both aims. CDUs and OUs are units where patients can be managed in the hospital for up to 24 hours prior to a decision being made to admit or discharge. Observation care is provided to patients who require further treatment or monitoring beyond what is accomplished in the emergency department (ED), but who do not require inpatient admission. CDUs arose in the 1990s in response to a desire to decrease inpatient costs as well as changing Medicare guidelines, which recognized observation status. Initially, CDUs and OUs were located within the ED and run by emergency medicine physicians. However, at the turn of the 21st century, hospitalists became involved in observation medicine, and the Society of Hospital Medicine issued a white paper on the OU in 2007. [1] Today, up to 50% of CDUs and OUs nationally are managed by hospitalists and located physically outside of the ED.[2, 3]
Despite the fact that nearly half of all CDUs and OUs nationally are run by hospitalists, there has been little published regarding the impact of hospitalist‐driven units. This study demonstrates the effect of observation care delivered in a hospitalist‐run geographic CDU. The primary objective was to determine the impact on LOS for patients in observation status managed in a hospitalist‐run CDU compared with LOS for observation patients with the same diagnoses cared for on medicalsurgical units prior to the existence of the CDU. The secondary objective was to determine the effect on the 30‐day ED or hospital revisit rate, as well as ED LOS. This work will guide health systems, hospitalist groups, and physicians in their decision making regarding the future structure and process of CDUs.
METHODS
Study Design
The Cooper University Hospital institutional review board approved this study. The study took place at Cooper University Hospital, a large, urban, academic safety‐net hospital providing tertiary care located in Camden, New Jersey.
We performed a retrospective observational study of all adult observation encounters at the study hospital from July 2010 to January 2011, and July 2011 through January 2012. During the second time period, patients could have been managed in the CDU or on a medicalsurgical unit. We recorded the following demographic data: age, gender, race, principal diagnosis, and payer, as well as several outcomes of interest, including: LOS (defined as the time separating the admitting physician order from discharge), ED visits within 30 days of discharge, and hospital revisits (observation or inpatient) within 30 days.
Data Sources
Data were culled by the institution's performance improvement department from the electronic medical record, as well as cost accounting and claims‐based sources.
Clinical Decision Unit
The CDU at Cooper University Hospital opened in June 2011 and is a 20‐bed geographically distinct unit adjacent to the ED. During the study period, it was staffed 24 hours a day by a hospitalist and a nurse practitioner as well as dedicated nurses and critical care technicians. Patients meeting observation status in the ED were eligible for the CDU provided that they fulfilled the CDU placement guidelines including that they were more likely than not to be discharged within a period of 24 hours of CDU care, did not meet inpatient admission criteria, did not require new placement in a rehabilitation or extended‐care facility, and did not require one‐on‐one monitoring. Additional exclusion criteria included severe vital sign or laboratory abnormalities. The overall strategy of the guidelines was to facilitate a pull culture, where the majority of observation patients were brought from the ED to the CDU once it was determined that they did not require inpatient care. The CDU had order sets and protocols in place for many of the common diagnoses. All CDU patients received priority laboratory and radiologic testing as well as priority consultation from specialty services. Medication reconciliation was performed by a pharmacy technician for higher‐risk patients, identified by Project BOOST (Better Outcomes by Optimizing Safe Transitions) criteria.[4] Structured multidisciplinary rounds occurred daily including the hospitalist, nurse practitioner, registered nurses, case manager, and pharmacy technician. A discharge planner was available to schedule follow‐up appointments.
Although chest pain was the most common CDU diagnosis, the CDU was designed to care for the majority of the hospital's observation patients rather than focus specifically on chest pain. Patients with chest pain who met observation criteria were transferred from the ED to the CDU, rather than a medicalsurgical unit, provided they did not have: positive cardiac enzymes, an electrocardiogram indicative of ischemia, known coronary artery disease presenting with pain consistent with acute coronary syndrome, need for heparin or nitroglycerin continuous infusion, symptomatic or unresolved arrhythmia, congestive heart failure meeting inpatient criteria, hypertensive urgency or emergency, pacemaker malfunction, pericarditis, or toxicity from cardiac drugs. Cardiologist consultants were involved in the care of nearly all CDU patients with chest pain.
Observation Status Determination
During the study period, observation status was recommended by a case manager in the ED based on Milliman (Milliman Care Guidelines) or McKesson InterQual (McKesson Corporation) criteria, once it was determined by the ED physician that the patient had failed usual ED care and required hospitalization. Observation status was assigned by the admitting (non‐ED) physician, who placed the order for inpatient admission or observation. Other than the implementation of the CDU, there were no significant changes to the process or criteria for assigning observation status, admission order sets, or the hospital's electronic medical record during this time period.
Statistical Analysis
Continuous data are presented as mean ( standard deviation [SD]) or median (25%75% interquartile range) as specified, and differences were assessed using one‐way analysis of variance testing and Mann‐Whitney U testing. Categorical data are presented as count (percentage) and differences evaluated using [2] analysis. P values of 0.05 or less were considered statistically significant.
To account for differences in groups with regard to outcomes, we performed a multivariate regression analysis. The following variables were entered: age (years), gender, race (African American vs other), admission diagnosis (chest pain vs other), and insurance status (Medicare vs other). All variables were entered simultaneously without forcing. Statistical analyses were done using the SPSS 20.0 Software (SPSS Inc., Chicago, IL).
RESULTS
Demographics
There were a total of 3735 patients included in the study: 1650 in the pre‐CDU group, 1469 in the post‐CDU group, and 616 in the post‐CDU group on medicalsurgical units. The post‐CDU period had a total of 2085 patients. Patients in the CDU group were younger and were more likely to have chest pain as the admission diagnosis. Patient demographics are presented in Table 1.
| Variable | Pre‐CDU, n=1,650 | Post‐CDU, n=1,469 | PostNon‐CDU, n=616 | P, CDU vs Pre‐CDU | P, Non‐CDU vs Pre‐CDU | P, CDU vs Non‐CDU |
|---|---|---|---|---|---|---|
| ||||||
| Age, y [range] | 56 [4569] | 53 [4364] | 57 [44.370] | <0.001 | 0.751 | 0.001 |
| Female gender | 918 (55.6%) | 833(56.7%) | 328 (53.2%) | 0.563 | 0.319 | 0.148 |
| African American race | 574 (34.8%) | 505 (34.4%) | 174 (28.2%) | 0.821 | 0.004 | 0.007 |
| Admission diagnosis | ||||||
| Chest pain | 462 (38%) | 528 (35.9%) | 132 (21.4%) | <0.001 | 0.002 | <0.001 |
| Syncope | 93 (5.6%) | 56 (3.8%) | 15 (2.4%) | 0.018 | 0.001 | 0.145 |
| Abdominal pain | 46 (2.8%) | 49 (3.3%) | 20(3.2%) | 0.404 | 0.575 | 1.0 |
| Other | 1,049 (63.6%) | 836 (56.9%) | 449 (72.9%) | <0.001 | <0.001 | <0.001 |
| Third‐party payer | ||||||
| Medicare | 727 (44.1%) | 491 (33.4%) | 264(43.4%) | <0.001 | 0.634 | <0.001 |
| Charity care | 187 (11.3%) | 238 (16.2%) | 73 (11.9%) | <0.001 | 0.767 | 0.010 |
| Commercial | 185 (11.1%) | 214 (14.6%) | 87 (14.1%) | 0.005 | 0.059 | 0.838 |
| Medicaid | 292 (17.7%) | 280 (19.1%) | 100 (16.2%) | 0.331 | 0.454 | 0.136 |
| Other | 153 (9.3%) | 195 (13.3%) | 60 (9.9%) | <0.001 | 0.746 | 0.028 |
| Self‐pay | 106 (6.4%) | 51(3.5%) | 32 (5.2%) | <0.001 | 0.323 | 0.085 |
Outcomes of Interest
There was a statistically significant association between LOS and CDU implementation (Table 2). Observation patients cared for in the CDU had a lower LOS than observation patients cared for on the medicalsurgical units during the same time period (17.6 vs 26.1 hours, P<0.0001).
| Outcome | Pre‐CDU, n=1,650 | Post‐CDU, n=1,469 | PostNon‐CDU, n=616 | P, CDU vs Pre‐CDU | P, Non‐CDU vs Pre‐CDU | P, CDU vs Non‐CDU |
|---|---|---|---|---|---|---|
| ||||||
| All patients, n=3,735 | ||||||
| 30‐day ED or hospital revisit | 326 (19.8%) | 268 (18.2%) | 123 (17.2%) | 0.294 | 0.906 | 0.357 |
| Median LOS, h | 27.1 [17.446.4] | 17.6 [12.122.8] | 26.1 [16.941.2] | <0.001 | 0.004 | <0.001 |
| Chest‐pain patients, n=1,122 | ||||||
| 30‐day ED or hospital revisit | 69 (14.9%) | 82 (15.5%) | 23 (17.4%) | 0.859 | 0.496 | 0.596 |
| Median LOS, h | 22 [15.838.9] | 17.3 [10.922.4] | 23.2 [13.843.1] | <0.001 | 0.995 | <0.001 |
| Other diagnoses, n=2,613 | ||||||
| 30‐day ED or hospital revisit | 257 (21.6%) | 186 (19.8%) | 100 (18.4%) | 0.307 | 0.693 | 0.727 |
| Median LOS, h | 30.4 [18.649.4] | 17.8 [12.923] | 26.7 [17.231.1] | <0.001 | <0.001 | <0.001 |
In total, there were 717 total revisits including ED visits and hospital stays within 30 days of discharge (Table 2). Of all the observation encounters in the study, 19.2% were followed by a revisit within 30 days. There were no differences in the 30‐day post‐ED visit rates in between periods and between groups.
Mean ED LOS for hospitalized patients was examined for a sample of the pre‐ and post‐CDU periods, namely November 2010 to January 2011 and November 2011 to January 2012. The mean ED LOS decreased from 410 minutes (SD=61) to 393 minutes (SD=51) after implementation of the CDU (P=0.037).
To account for possible skewing of the data, we transformed LOS into ln (natural log) LOS and found the following means (SD): group 1 was 3.27 (0.94), group 2 was 2.78 (0.6), and group 3 was 3.1 (0.93). Using an independent t test, we found a significant difference between groups 1 and 2, 2 and 3, as well as 1 and 3 (P<0.001 for all).
Chest‐Pain Subgroup Analysis
We analyzed the data specifically for the 1122 patients discharged with a diagnosis of chest pain. LOS was significantly lower for patients in the CDU compared to either pre‐CDU or observation on floors (Table 2).
Multivariate Regression Analysis
We performed a linear regression analysis using the following variables: age, race, gender, diagnosis, insurance status, and study period (pre‐CDU, post‐CDU, and postnon‐CDU). We performed 3 different comparisons: pre‐CDU vs post‐CDU, postnon‐CDU vs post‐CDU, and postnon‐CDU vs pre‐CDU. After adjusting for other variables, the postnon‐CDU group was significantly associated with higher LOS (P<0.001). The pre‐CDU group was associated with higher LOS than both the post‐CDU and postnon‐CDU groups (P<0.001 for both).
DISCUSSION
In our study of a hospitalist‐run CDU for observation patients, we observed that the care in the CDU was associated with a lower median LOS, but no increase in ED or hospital revisits within 30 days.
Previous studies have reported the impact of clinical observation or clinical diagnosis units, particularly chest‐pain units.[5, 6, 7, 8, 9, 10, 11, 12, 13, 14, 15] Studies of hospitalist‐run units suggest shorter LOS in the entire hospital,[16] or in the target unit.[17] Although one study suggested a lower 30‐day readmission rate,[18] most others did not describe this effect.[16, 17] Our study differs from previous research in that our program employed a pull‐culture aimed at accepting the majority of observation status patients without focusing on a particular diagnosis. We also implemented a structured multidisciplinary team focused on expediting care and utilized BOOST‐framed transitions, including targeted medication reconciliation and tools such as teach‐back.
The CDU in our hospital produced shorter LOS even compared to our non‐CDU units, but the revisit rate did not improve despite activities to reduce revisits. During the study period, efforts to decrease readmissions were implemented in various areas of our hospital, but not a comprehensive institution‐wide readmissions strategy. Lack of impact on revisits could be viewed as a positive finding, in that shorter LOS did not result in patients being discharged home before clinically stable. Alternatively, lack of impact could be due to the uncertain effectiveness of BOOST specifically[19, 20, 21] or inpatient‐targeted transitions interventions more generally.[22]
Our study has certain limitations. Findings in our single‐center study in an urban academic medical center may not apply to CDUs in other settings. As a prepost design, our study is subject to external trends for which our analyses may be unable to account. For example, during CDU implementation, there were hospital‐wide initiatives aimed at improving inpatient LOS, including complex case rounds, increased use of active bed management, and improved case management efforts to decrease LOS. These may have been a factor in the small decrease in observation LOS seen in the medicalsurgical patients during the post period. Additionally, though we have attempted to control for possible confounders, there could have been differences in the study groups for which we were unable to account, including code status or social variables such as homelessness, which played a role in our revisit outcomes. The decrease in LOS by 35%, or 9.5 hours, in CDU patients is clinically important, as it allows low‐risk patients to spend less time in the hospital where they may have been at risk of hospital‐acquired conditions; however, this study did not include patient satisfaction data. It would be important to measure the effect on patient experience of potentially spending 1 fewer night in the hospital. Finally, our CDU was designed with specific clinical criteria for inclusion and exclusion. Patients who were higher risk or expected to need more than 24 hours of care were not placed in the CDU. We were not able to adjust our analyses for factors that were not in our data, such as severe vital sign or laboratory abnormalities or a physician's clinical impression of a patient. It is possible, therefore, that referral bias may have occurred and influenced our results. The fact that non‐CDU chest‐pain patients in the post‐CDU period did not experience any decrease in LOS, whereas other medicalsurgical observation patients did, may be an example of this bias. Patients were excluded from the CDU by virtue of being deemed higher risk as described in Methods section. We were unable to adjust for these differences.
Implementation of CDUs may be useful for health systems seeking to improve hospital throughput and improve utilization among common but low‐acuity patient groups. Although our initial results are promising, the concept of a CDU may require enhancements. For example, at our hospital we are addressing transitions of care by looking at models that address patient risk through a systematic process, and then target individuals for specific interventions to prevent revisits. Moreover, the study of CDUs should report impact on patient and referring physician satisfaction, and whether CDUs can reduce per‐case costs.
CONCLUSION
Caring for patients in a hospitalist‐run geographic CDU was associated with a 35% decrease in observation LOS for CDU patients compared with a 3.7% decrease for observation patients cared for elsewhere in the hospital. CDU patients' LOS was significantly decreased without increasing ED or hospital revisit rates.
Acknowledgments
The authors would like to thank Ken Travis for excellent data support.
- The observation unit: an operational overview for the hospitalist. Society of Hospital Medicine website. Available at: http://www.hospitalmedicine.org/AM/Template.cfm?Section=White_Papers18(12):1371–1379.
- , , , , , . Use of observation care in US emergency departments, 2001 to 2008. PLoS One. 2011;6(9):e24326.
- The Society of Hospital Medicine Project Boost (Better Outcomes by Optimizing Safe Transitions) Available at: http://www.hospitalmedicine.org/boost. Accessed on June 4, 2013.
- , , , , . An emergency department‐based protocol for rapidly ruling out myocardial ischemia reduces hospital time and expense: results of a randomized study (ROMIO). J Am Coll Cardiol. 1996;28(1):25–33.
- , , , , , . Implementation of the guidelines for the management of patients with chest pain through a critical pathway approach improves length of stay and patient satisfaction but not anxiety. Crit Pathw Cardiol. 2010;9(1):30–34.
- , , , et al. Costs of an emergency department‐based accelerated diagnostic protocol vs hospitalization in patients with chest pain: a randomized controlled trial. JAMA. 1997;278(20):1670–1676.
- , , , et al. Emergency‐department diagnosis of acute myocardial infarction and ischemia: a cost analysis of two diagnostic protocols. Acad Emerg Med. 1994;1(2):103–110.
- , , , et al. Impact on the care of the emergency department chest pain patient from the chest pain evaluation registry (CHEPER) study. Am J Cardiol. 1997;80(5):563–568.
- , , , et al. Cost‐effectiveness of a new short‐stay unit to “rule out” acute myocardial infarction in low risk patients. J Am Coll Cardiol. 1994;24(5):1249–1259.
- , , , et al. Emergency Department Observation Unit versus hospital inpatient care for a chronic asthmatic population: a randomized trial of health status outcome and cost. Med Care. 1998;36(4):599–609.
- , , , et al. A comparison between emergency diagnostic and treatment unit and inpatient care in the management of acute asthma. Arch Intern Med. 1997;157(18):2055–2062.
- , , , . Retrospective review of emergency department patients with non‐variceal upper gastrointestinal hemorrhage for potential outpatient management. Acad Emerg Med. 1999;6(3):196–201.
- , . Outpatient care of selected patients with acute non‐variceal upper gastrointestinal haemorrhage. Lancet. 1995;345(8942):108–111.
- , , , , . Patterns of use of an emergency department‐based observation unit. Am J Ther. 2002;9(6):499–502.
- , , . Implementation of a hospitalist‐run observation unit and impact on length of stay (LOS): a brief report. J Hosp Med. 2010;5(9):E2–E5.
- , , , , . Improving resource utilization in a teaching hospital: development of a nonteaching service for chest pain admissions. Acad Med. 2006;81(5):432–435.
- , , , . Program description: a hospitalist‐run, medical short‐stay unit in a teaching hospital. CMAJ. 2000;163(11):1477–1480.
- , , , et al. Project BOOST: effectiveness of a multihospital effort to reduce rehospitalization. J Hosp Med. 2013;8:421–427.
- , , , et al. BOOST: evidence needing a lift. J Hosp Med. 2013;8:468–469.
- . BOOST and readmissions: thinking beyond the walls of the hospital. J Hosp Med. 2013;8:470–471.
- , , , et al. Hospital‐initiated transitional care interventions as a patient safety strategy. Ann Int Med. 2013;158:433–440.
Evolving Role of the PNP Hospitalist
The Accreditation Council for Graduate Medical Education implemented rules limiting work hours for residents in 2003 and 2011, decreasing the availability of residents as providers at teaching hospitals.[1] These restrictions have increased reliance on advance practice providers (APPs) including nurse practitioners (NPs) and physicians' assistants in providing inpatient care. The NP hospitalist role includes inpatient medical management, coordination of care, patient and staff education, and quality improvement activities.[2] The NP hospitalist role has expanded beyond a replacement for reduced resident work hours, adding value through resident teaching, development of clinical care guidelines (CCGs), continuity of care, and familiarity with inpatient management.[3] The NP hospitalist role has been shown to improve the quality, efficiency, and cost effectiveness of inpatient care.[4, 5]
Favorable quality and cost measure results have been documented for adult NP hospitalists compared to housestaff, including improved patient outcomes, increased patient and staff satisfaction, decreased length of stay (LOS) and cost of care, and improved access to care.[6] These findings are supported by NP inpatient program evaluations at several academic medical centers, which also show increased patient and family satisfaction and improved communication between physicians, nurses, and families.[6, 7, 8] One study demonstrated that collaborative care management of adult medical patients by a hospitalist physician and advanced practice nurse led to decreased LOS and improved hospital profit without changing patient readmission or mortality.[9] Although there is a growing body of evidence supporting the quality and cost effectiveness of the NP hospitalist role in adult inpatient care, there are little published data for pediatric programs.
METHODS
The pediatric nurse practitioner (PNP) hospitalist role at Children's Hospital Colorado (CHCO) was initiated in 2006 to meet the need for additional inpatient providers. Inpatient staffing challenges included decreased resident work hours as well as high inpatient volume during the winter respiratory season. The PNP hospitalist providers at CHCO independently manage care throughout hospitalization for patients within their scope of practice, and comanage more complex patients with the attending doctor of medicine (MD). The PNPs complete history and physical exams, order and interpret diagnostic tests, perform procedures, prescribe medications, and assist with discharge coordination. Patient populations within the PNP hospitalist scope of practice include uncomplicated bronchiolitis, pneumonia, and asthma.
The hospitalist section at CHCO's main campus includes 2 resident teams and 1 PNP team. The hospitalist section also provides inpatient care at several network of care (NOC) sites. These NOC sites are CHCO‐staffed facilities that are either freestanding or connected to a community hospital, with an emergency department and 6 to 8 inpatient beds. The PNP hospitalist role includes inpatient management at the CHCO main campus as well as in the NOC. The NOC sites are staffed with a PNP and MD team who work collaboratively to manage inpatient care. The Advanced Practice Hospitalist Program was implemented to improve staffing and maintain quality of patient care in a cost‐effective manner. We undertook a program evaluation with the goal of comparing quality and cost of care between the PNP team, PNP/MD team, and resident teams.
Administrative and electronic medical record data from July 1, 2009 through June 30, 2010 were reviewed retrospectively. Data were obtained from inpatient records at CHCO inpatient medical unit and inpatient satellite sites in the CHCO NOC. The 2008 versions 26 and 27 of the 3M All Patient Refined Diagnosis‐Related Groups (APR‐DRG) were used to categorize patients by diagnosis, severity of illness, and risk of mortality.[10, 11] The top 3 APR‐DRGs at CHCO, based on volume of inpatient admissions, were selected for this analysis, including bronchiolitis and RSV pneumonia (APR‐DRG 138), pneumonia NEC (APR‐DRG 139), and asthma (APR‐DRG 141) (N = 1664). These 3 diagnoses accounted for approximately 60% of all inpatient hospitalist encounters and comprised 78% of the PNP encounters, 52% of the resident encounters, and 76% of the PNP/MD encounters. APR‐DRG severity of illness categories include I, II, III, and IV (minor, moderate, major, and extreme, respectively).[12] Severity of illness levels I and II were used for this analysis. Severity III and IV levels were excluded due to lack of patients in these categories on the PNP team and in the NOC. We also included observation status patients. The PNP team accounted for approximately 20% of the inpatient encounters, with 45% on the resident teams and 35% on the PNP/MD team in the NOC (Table 1).
| Distribution of Patients | Patient Type/Severity of Illness | NP | Resident | PNP/MD |
|---|---|---|---|---|
| ||||
| Bronchiolitis | Observation | 26 (23%) | 32 (28%) | 55 (49%) |
| Severity I | 93 (29%) | 77 (24%) | 151 (47%) | |
| Severity II | 49 (24%) | 95 (47%) | 60 (29%) | |
| Asthma | Observation | 7 (14%) | 23 (45%) | 21 (41%) |
| Severity I | 48 (14%) | 191 (57%) | 97 (29%) | |
| Severity II | 19 (12%) | 106 (66%) | 35 (22%) | |
| Pneumonia | Observation | 6 (22%) | 12 (44%) | 9 (34%) |
| Severity I | 33 (17%) | 68 (35%) | 93 (48%) | |
| Severity II | 37 (14%) | 152 (59%) | 69 (27%) | |
The PNP hospitalist program was evaluated by comparing patient records from the PNP team, the PNP/MD team, and the resident teams. Evaluation measures included compliance with specific components of the bronchiolitis and asthma CCGs, LOS, and cost of care.
Outcomes Measured
Quality measures for this program evaluation included compliance with the bronchiolitis CCG recommendation to diagnose bronchiolitis based on history and exam findings while minimizing the use of chest x‐ray and respiratory viral testing.[13] Current evidence suggests that these tests add cost and exposure to radiation and do not necessarily predict severity of disease or change medical management.[14] This program evaluation also measured compliance with the asthma CCG recommendation to give every asthma patient an asthma action plan (AAP) prior to hospital discharge.[15] Of note, this evaluation was completed prior to more recent evidence that questions the utility of AAP for improving asthma clinical outcomes.[16] There were no related measures for pneumonia available because there was no CCG in place at the time of this evaluation.
Outcomes measures for this evaluation included LOS and cost of care for the top 3 inpatient diagnoses: bronchiolitis, asthma, and pneumonia. LOS for the inpatient hospitalization was measured in hours. Direct cost of care was used for this analysis, which included medical supplies, pharmacy, radiology, laboratory, and bed charges. Nursing charges were also included in the direct cost due to the proximity of nursing cost to the patient, versus more distant costs such as infrastructure or administration. Hospitalist physician and NP salaries were not included in direct cost analysis. Outcomes were compared for the PNP team, the resident teams, and the PN/MD team in the NOC.
Analysis
Patients were summarized by diagnosis‐related groups (APR‐DRG) and severity of illness using counts and percentages across the PNP team, resident teams, and the PNP/MD team in the NOC (Table 1). LOS and direct cost is skewed, therefore natural log transformations were used to meet normal assumption for statistical testing and modeling. Chi squared and t tests were performed to compare outcomes between the PNP and resident physician teams, stratified by APR‐DRG. Analysis of variance was used to analyze LOS and direct cost for the top 3 APR‐DRG admission codes while adjusting for acuity. The outcomes were also compared pairwise among the 3 teams using a linear mixed model to adjust for APR‐DRG and severity of illness, treating severity as a nested effect within the APR‐DRG. Bonferroni corrections were used to adjust for multiple comparisons; a P value <0.017 was considered statistically significant. Post hoc power analysis was completed for the analysis of bronchiolitis chest x‐ray ordering, even though the sample size was relatively large (PNP team 128, resident team 204) (Table 1). There was a 7% difference between the PNP and resident groups, and the power of detecting a significant difference was 40%. A sample size of 482 for each group would be necessary to achieve 80% power of detecting a 7% difference, while controlling for 5% type I error. All statistical analyses were performed with SAS version 9.3 (SAS Institute Inc., Cary, NC).
RESULTS
PNP adherence to CCGs was comparable to resident teams for the specific measures used in this evaluation. Based on a hospital‐wide goal of ordering diagnostic tests for less than 25% of inpatients with bronchiolitis, there was no significant difference between the PNP team and resident teams. There was no significant difference in the rate of chest x‐ray ordering between the PNP team and the resident teams (15% vs 22%, P = 0.1079). Similarly, there was no significant difference in viral testing between the PNP and physician teams (24% vs 25%, P = 0.9813) (Table 2). Post hoc power analysis indicated that a larger sample size would be required to increase the power of detecting a statistically significant difference in chest x‐ray ordering between these groups. The PNP and resident teams were also compared using compliance with the asthma CCGs, specifically related to the goal of providing an accurate AAP to every patient admitted for asthma. The PNP and resident teams had a similar rate of compliance, with PNPs achieving 81% compliance and MDs 76% (P = 0.4351) (Table 2).
| Clinical Care Guidelines | Diagnostic Test | PNP Team | Resident Teams | P Value |
|---|---|---|---|---|
| ||||
| Bronchiolitis care | Chest x‐ray | 15% | 22% | 0.1079 |
| Diagnostic testing | Viral test | 24% | 25% | 0.9813 |
| Completed asthma action plans | 81% | 76% | 0.4351 | |
LOS and direct costs were compared for the 3 teams for the top 3 APR‐DRGs and controlling for acuity. Table 3 illustrates that there were no significant differences in LOS between the PNP and resident teams or between the PNP and PNP/MD teams for these 3 APR‐DRGs (P < 0.017 considered statistically significant). There was a statistically significant difference in LOS between resident and PNP/MD teams for asthma and pneumonia (P < 0.001). The direct cost of care per patient encounter provided by the PNP team was significantly less than the PNP/MD team for all 3 APR‐DRGs (P < 0.001). The direct cost of care per patient encounter provided by the PNP team was significantly less than the resident teams for asthma (P = 0.0021) and pneumonia (P = 0.0001), although the difference was not statistically significant for bronchiolitis (P = 0.0228) for level of significance P < 0.0017 (Table 3, 4).
| PNP | Resident | PNP/MD | P Value PNP vs Resident | P Value
PNP vs PNP/MD |
P Value Resident vs PNP/MD | |
|---|---|---|---|---|---|---|
| ||||||
| Cost | ||||||
| Bronchiolitis | $2190 | $2513 | $3072 | 0.0228 | <0.0001 | 0.0002 |
| Asthma | $2089 | $2655 | $3220 | 0.0021 | <0.0001 | 0.0190 |
| Pneumonia | $2348 | $3185 | $3185 | 0.0001 | <0.0001 | 0.1142 |
| LOS, h | ||||||
| Bronchiolitis | 52 | 52 | 51 | 0.9112 | 0.1600 | 0.1728 |
| Asthma | 36 | 42 | 48 | 0.0158 | 0.3151 | <0.0001 |
| Pneumonia | 54 | 61 | 68 | 0.1136 | 0.1605 | <0.0001 |
| PNP | Resident | PNP/MD | PHIS Observation | PHIS SeverityIII | |
|---|---|---|---|---|---|
| |||||
| LOS, h | |||||
| Bronchiolitis | 52 | 52 | 51 | 43 | 70 |
| Asthma | 36 | 42 | 48 | 31 | 48 |
| Pneumonia | 54 | 61 | 68 | 46 | 64 |
Figure 1 illustrates the monthly patient census on the PNP and resident teams obtained from daily midnight census. There was a dramatic seasonal fluctuation in PNP team census, with a low census in July 2009 (22 patients) and high census in February 2010 (355 patients). The resident teams maintained a relatively stable census year round compared to the PNP team.

CONCLUSIONS/DISCUSSION
The results of this program evaluation suggest that the PNP team at CHCO provides inpatient care comparable to the resident teams at a lower cost per patient encounter for uncomplicated bronchiolitis, pneumonia, and asthma. The results of this program evaluation are consistent with previously published studies demonstrating that NPs improve outcomes such as decreased LOS and cost of care.[9]
In the setting of increasingly stringent restrictions in residency work hours, PNP hospitalists are a valuable resource for managing inpatient care. PNPs can provide additional benefits not explored in this program evaluation, such as increased access to care, increased patient and family satisfaction, improved documentation, and improved communication between nurses and physicians.[6] NP hospitalist providers can also decrease the patient care burden on housestaff, allowing teaching teams to focus on resident education.[6] This point could be made for the PNP team at CHCO, which contributed to care of inpatients during the peak respiratory season census. This strategy has allowed the resident teaching teams to maintain a more manageable patient census during the winter respiratory season, and presumably has allowed greater focus on resident education year round.[17]
Hospitals have been increasingly using evidence based CCGs as a strategy to improve patient outcomes and decrease LOS and cost.[18] CCGs provide an excellent tool for hospitalist physicians and APPs to deliver consistent inpatient care for common diagnoses such as bronchiolitis, asthma, and pneumonia. Increased reliance on CCGs has provided an opportunity to standardize evidence‐based practices and has allowed PNPs to expand their inpatient role at CHCO. The addition of a PNP inpatient team at CHCO also provided an effective strategy for management of seasonal fluctuations in inpatient census, particularly during the winter respiratory season.
Limitations
This is a single‐site program evaluation at a free standing children's hospital. Colorado law allows NPs to practice independently and obtain full prescriptive authority, although licensing and certification regulations for APPs vary from state to state. Our results may not be generalizable to other hospitals or to states where regulations differ. Patients admitted to the NOC sites and those assigned to the PNP team at the main campus are generally lower acuity and complexity compared to patients assigned to the resident teams at the main campus. Although we controlled for severity using the APR‐DRG severity classification, it is possible that our results were biased due to different patient profiles among the PNP and MD hospitalist teams. There were also potential limitations in the cost analysis, which included nursing in direct costs. Although nurse‐to‐patient ratios are comparable across hospitalist sites, the ratios may have varied due to fluctuations in patient census at each site. The CCG monitoring measures used in this evaluation also presented limitations. These measures were selected due to the availability of these data in the electronic medical record. Future studies may provide more clinically relevant information by including additional patient outcomes measures specifically related to inpatient medical management.
Despite the limitations in this program evaluation, we feel that these data add to the current knowledge in pediatrics by showing equipoise between these 2 groups. The PNP hospitalist role continues to evolve at CHCO, and the utility of this role must continue to be evaluated and reported.
Acknowledgements
Dashka Ranade provided Children's Hospital Colorado CCG comparison data for this program evaluation. David Bertoch provided LOS data from the Children's Hospital Association Pediatric Health Information System database.
Disclosures: Supported by NIH/NCATS Colorado CTSI grant number UL1 TR000154. The contents are the authors' sole responsibility and do not necessarily represent official NIH views.
- Education ACfGM. Common Program Requirements. Accreditation Council for Graduate Medical Education, 2011.
- , , , , , . Hospitalist services: an evolving opportunity. Nurse Pract. 2008;33(5):9–10.
- . APRN hospitalist: just a resident replacement? J Pediatr Health Care. 2004;18(4):208–210.
- , , , . Evaluation of the role of the pediatric nurse practitioner in an inpatient asthma program. J Pediatr Health Care. 2008;22(5):273–281.
- , . Acute care nurse practitioner as hospitalist: role description. AACN Adv Crit Care. 2009;20(2):133–136.
- , . Acute care nurse practitioners: creating and implementing a model of care for an inpatient general medical service. Am J Crit Care. 2002;11(5):448–458.
- , , , et al. Pediatric trauma nurse practitioners provide excellent care with superior patient satisfaction for injured children. J Pediatr Surg. 2006;41(1):277–281.
- , , , et al. Pediatric trauma nurse practitioners increase bedside nurses' satisfaction with pediatric trauma patient care. J Trauma Nurs. 2006;13(2):66–69.
- , , , et al. The effect of a multidisciplinary hospitalist/physician and advanced practice nurse collaboration on hospital costs. J Nurs Adm. 2006;36(2):79–85.
- , , , , . A closer look at all‐patient refined DRGs. J AHIMA. 2002;73(1):46–50.
- . Structure and performance of different DRG classification systems for neonatal medicine. Pediatrics. 1999;103(1 suppl E):302–318.
- Association CsH. Patient classification system, Children's Hospital Association. Available at: http://www.childrenshospitals.org/. Accessed January 4, 2014.
- . Children's Hospital Colorado bronchiolitis clinical care guideline, Bronchiolitis CCG Task Force 2011. Available at: http://www.childrenscolorado.org/conditions/lung/healthcare_professionals/clinical_care_guidelines.aspx. Accessed January 4, 2014.
- American Academy of Pediatrics Subcommittee on Diagnosis and Management of Bronchiolitis. Diagnosis and management of bronchiolitis. Pediatrics. 2006;118(4):1774–1793.
- .Children's Hospital Colorado asthma clinical care guideline, Asthma Task Force, 2011. Available at: http://www.childrenscolorado.org/conditions/lung/healthcare_professionals/clinical_care_guidelines.aspx. Accessed January 4, 2014.
- , , . Written action plans for asthma in children. Cochrane Database Syst Rev. 2006;(3):CD005306.
- , . Pediatric nurse practitioners as hospitalists. J Pediatr Health Care. 2010;24(5):347–350.
- , , . Health policy issues and applications for evidence‐based medicine and clinical practice guidelines. Health Policy. 1998;46(1):1–19.
The Accreditation Council for Graduate Medical Education implemented rules limiting work hours for residents in 2003 and 2011, decreasing the availability of residents as providers at teaching hospitals.[1] These restrictions have increased reliance on advance practice providers (APPs) including nurse practitioners (NPs) and physicians' assistants in providing inpatient care. The NP hospitalist role includes inpatient medical management, coordination of care, patient and staff education, and quality improvement activities.[2] The NP hospitalist role has expanded beyond a replacement for reduced resident work hours, adding value through resident teaching, development of clinical care guidelines (CCGs), continuity of care, and familiarity with inpatient management.[3] The NP hospitalist role has been shown to improve the quality, efficiency, and cost effectiveness of inpatient care.[4, 5]
Favorable quality and cost measure results have been documented for adult NP hospitalists compared to housestaff, including improved patient outcomes, increased patient and staff satisfaction, decreased length of stay (LOS) and cost of care, and improved access to care.[6] These findings are supported by NP inpatient program evaluations at several academic medical centers, which also show increased patient and family satisfaction and improved communication between physicians, nurses, and families.[6, 7, 8] One study demonstrated that collaborative care management of adult medical patients by a hospitalist physician and advanced practice nurse led to decreased LOS and improved hospital profit without changing patient readmission or mortality.[9] Although there is a growing body of evidence supporting the quality and cost effectiveness of the NP hospitalist role in adult inpatient care, there are little published data for pediatric programs.
METHODS
The pediatric nurse practitioner (PNP) hospitalist role at Children's Hospital Colorado (CHCO) was initiated in 2006 to meet the need for additional inpatient providers. Inpatient staffing challenges included decreased resident work hours as well as high inpatient volume during the winter respiratory season. The PNP hospitalist providers at CHCO independently manage care throughout hospitalization for patients within their scope of practice, and comanage more complex patients with the attending doctor of medicine (MD). The PNPs complete history and physical exams, order and interpret diagnostic tests, perform procedures, prescribe medications, and assist with discharge coordination. Patient populations within the PNP hospitalist scope of practice include uncomplicated bronchiolitis, pneumonia, and asthma.
The hospitalist section at CHCO's main campus includes 2 resident teams and 1 PNP team. The hospitalist section also provides inpatient care at several network of care (NOC) sites. These NOC sites are CHCO‐staffed facilities that are either freestanding or connected to a community hospital, with an emergency department and 6 to 8 inpatient beds. The PNP hospitalist role includes inpatient management at the CHCO main campus as well as in the NOC. The NOC sites are staffed with a PNP and MD team who work collaboratively to manage inpatient care. The Advanced Practice Hospitalist Program was implemented to improve staffing and maintain quality of patient care in a cost‐effective manner. We undertook a program evaluation with the goal of comparing quality and cost of care between the PNP team, PNP/MD team, and resident teams.
Administrative and electronic medical record data from July 1, 2009 through June 30, 2010 were reviewed retrospectively. Data were obtained from inpatient records at CHCO inpatient medical unit and inpatient satellite sites in the CHCO NOC. The 2008 versions 26 and 27 of the 3M All Patient Refined Diagnosis‐Related Groups (APR‐DRG) were used to categorize patients by diagnosis, severity of illness, and risk of mortality.[10, 11] The top 3 APR‐DRGs at CHCO, based on volume of inpatient admissions, were selected for this analysis, including bronchiolitis and RSV pneumonia (APR‐DRG 138), pneumonia NEC (APR‐DRG 139), and asthma (APR‐DRG 141) (N = 1664). These 3 diagnoses accounted for approximately 60% of all inpatient hospitalist encounters and comprised 78% of the PNP encounters, 52% of the resident encounters, and 76% of the PNP/MD encounters. APR‐DRG severity of illness categories include I, II, III, and IV (minor, moderate, major, and extreme, respectively).[12] Severity of illness levels I and II were used for this analysis. Severity III and IV levels were excluded due to lack of patients in these categories on the PNP team and in the NOC. We also included observation status patients. The PNP team accounted for approximately 20% of the inpatient encounters, with 45% on the resident teams and 35% on the PNP/MD team in the NOC (Table 1).
| Distribution of Patients | Patient Type/Severity of Illness | NP | Resident | PNP/MD |
|---|---|---|---|---|
| ||||
| Bronchiolitis | Observation | 26 (23%) | 32 (28%) | 55 (49%) |
| Severity I | 93 (29%) | 77 (24%) | 151 (47%) | |
| Severity II | 49 (24%) | 95 (47%) | 60 (29%) | |
| Asthma | Observation | 7 (14%) | 23 (45%) | 21 (41%) |
| Severity I | 48 (14%) | 191 (57%) | 97 (29%) | |
| Severity II | 19 (12%) | 106 (66%) | 35 (22%) | |
| Pneumonia | Observation | 6 (22%) | 12 (44%) | 9 (34%) |
| Severity I | 33 (17%) | 68 (35%) | 93 (48%) | |
| Severity II | 37 (14%) | 152 (59%) | 69 (27%) | |
The PNP hospitalist program was evaluated by comparing patient records from the PNP team, the PNP/MD team, and the resident teams. Evaluation measures included compliance with specific components of the bronchiolitis and asthma CCGs, LOS, and cost of care.
Outcomes Measured
Quality measures for this program evaluation included compliance with the bronchiolitis CCG recommendation to diagnose bronchiolitis based on history and exam findings while minimizing the use of chest x‐ray and respiratory viral testing.[13] Current evidence suggests that these tests add cost and exposure to radiation and do not necessarily predict severity of disease or change medical management.[14] This program evaluation also measured compliance with the asthma CCG recommendation to give every asthma patient an asthma action plan (AAP) prior to hospital discharge.[15] Of note, this evaluation was completed prior to more recent evidence that questions the utility of AAP for improving asthma clinical outcomes.[16] There were no related measures for pneumonia available because there was no CCG in place at the time of this evaluation.
Outcomes measures for this evaluation included LOS and cost of care for the top 3 inpatient diagnoses: bronchiolitis, asthma, and pneumonia. LOS for the inpatient hospitalization was measured in hours. Direct cost of care was used for this analysis, which included medical supplies, pharmacy, radiology, laboratory, and bed charges. Nursing charges were also included in the direct cost due to the proximity of nursing cost to the patient, versus more distant costs such as infrastructure or administration. Hospitalist physician and NP salaries were not included in direct cost analysis. Outcomes were compared for the PNP team, the resident teams, and the PN/MD team in the NOC.
Analysis
Patients were summarized by diagnosis‐related groups (APR‐DRG) and severity of illness using counts and percentages across the PNP team, resident teams, and the PNP/MD team in the NOC (Table 1). LOS and direct cost is skewed, therefore natural log transformations were used to meet normal assumption for statistical testing and modeling. Chi squared and t tests were performed to compare outcomes between the PNP and resident physician teams, stratified by APR‐DRG. Analysis of variance was used to analyze LOS and direct cost for the top 3 APR‐DRG admission codes while adjusting for acuity. The outcomes were also compared pairwise among the 3 teams using a linear mixed model to adjust for APR‐DRG and severity of illness, treating severity as a nested effect within the APR‐DRG. Bonferroni corrections were used to adjust for multiple comparisons; a P value <0.017 was considered statistically significant. Post hoc power analysis was completed for the analysis of bronchiolitis chest x‐ray ordering, even though the sample size was relatively large (PNP team 128, resident team 204) (Table 1). There was a 7% difference between the PNP and resident groups, and the power of detecting a significant difference was 40%. A sample size of 482 for each group would be necessary to achieve 80% power of detecting a 7% difference, while controlling for 5% type I error. All statistical analyses were performed with SAS version 9.3 (SAS Institute Inc., Cary, NC).
RESULTS
PNP adherence to CCGs was comparable to resident teams for the specific measures used in this evaluation. Based on a hospital‐wide goal of ordering diagnostic tests for less than 25% of inpatients with bronchiolitis, there was no significant difference between the PNP team and resident teams. There was no significant difference in the rate of chest x‐ray ordering between the PNP team and the resident teams (15% vs 22%, P = 0.1079). Similarly, there was no significant difference in viral testing between the PNP and physician teams (24% vs 25%, P = 0.9813) (Table 2). Post hoc power analysis indicated that a larger sample size would be required to increase the power of detecting a statistically significant difference in chest x‐ray ordering between these groups. The PNP and resident teams were also compared using compliance with the asthma CCGs, specifically related to the goal of providing an accurate AAP to every patient admitted for asthma. The PNP and resident teams had a similar rate of compliance, with PNPs achieving 81% compliance and MDs 76% (P = 0.4351) (Table 2).
| Clinical Care Guidelines | Diagnostic Test | PNP Team | Resident Teams | P Value |
|---|---|---|---|---|
| ||||
| Bronchiolitis care | Chest x‐ray | 15% | 22% | 0.1079 |
| Diagnostic testing | Viral test | 24% | 25% | 0.9813 |
| Completed asthma action plans | 81% | 76% | 0.4351 | |
LOS and direct costs were compared for the 3 teams for the top 3 APR‐DRGs and controlling for acuity. Table 3 illustrates that there were no significant differences in LOS between the PNP and resident teams or between the PNP and PNP/MD teams for these 3 APR‐DRGs (P < 0.017 considered statistically significant). There was a statistically significant difference in LOS between resident and PNP/MD teams for asthma and pneumonia (P < 0.001). The direct cost of care per patient encounter provided by the PNP team was significantly less than the PNP/MD team for all 3 APR‐DRGs (P < 0.001). The direct cost of care per patient encounter provided by the PNP team was significantly less than the resident teams for asthma (P = 0.0021) and pneumonia (P = 0.0001), although the difference was not statistically significant for bronchiolitis (P = 0.0228) for level of significance P < 0.0017 (Table 3, 4).
| PNP | Resident | PNP/MD | P Value PNP vs Resident | P Value
PNP vs PNP/MD |
P Value Resident vs PNP/MD | |
|---|---|---|---|---|---|---|
| ||||||
| Cost | ||||||
| Bronchiolitis | $2190 | $2513 | $3072 | 0.0228 | <0.0001 | 0.0002 |
| Asthma | $2089 | $2655 | $3220 | 0.0021 | <0.0001 | 0.0190 |
| Pneumonia | $2348 | $3185 | $3185 | 0.0001 | <0.0001 | 0.1142 |
| LOS, h | ||||||
| Bronchiolitis | 52 | 52 | 51 | 0.9112 | 0.1600 | 0.1728 |
| Asthma | 36 | 42 | 48 | 0.0158 | 0.3151 | <0.0001 |
| Pneumonia | 54 | 61 | 68 | 0.1136 | 0.1605 | <0.0001 |
| PNP | Resident | PNP/MD | PHIS Observation | PHIS SeverityIII | |
|---|---|---|---|---|---|
| |||||
| LOS, h | |||||
| Bronchiolitis | 52 | 52 | 51 | 43 | 70 |
| Asthma | 36 | 42 | 48 | 31 | 48 |
| Pneumonia | 54 | 61 | 68 | 46 | 64 |
Figure 1 illustrates the monthly patient census on the PNP and resident teams obtained from daily midnight census. There was a dramatic seasonal fluctuation in PNP team census, with a low census in July 2009 (22 patients) and high census in February 2010 (355 patients). The resident teams maintained a relatively stable census year round compared to the PNP team.
CONCLUSIONS/DISCUSSION
The results of this program evaluation suggest that the PNP team at CHCO provides inpatient care comparable to the resident teams at a lower cost per patient encounter for uncomplicated bronchiolitis, pneumonia, and asthma. The results of this program evaluation are consistent with previously published studies demonstrating that NPs improve outcomes such as decreased LOS and cost of care.[9]
In the setting of increasingly stringent restrictions in residency work hours, PNP hospitalists are a valuable resource for managing inpatient care. PNPs can provide additional benefits not explored in this program evaluation, such as increased access to care, increased patient and family satisfaction, improved documentation, and improved communication between nurses and physicians.[6] NP hospitalist providers can also decrease the patient care burden on housestaff, allowing teaching teams to focus on resident education.[6] This point could be made for the PNP team at CHCO, which contributed to care of inpatients during the peak respiratory season census. This strategy has allowed the resident teaching teams to maintain a more manageable patient census during the winter respiratory season, and presumably has allowed greater focus on resident education year round.[17]
Hospitals have been increasingly using evidence based CCGs as a strategy to improve patient outcomes and decrease LOS and cost.[18] CCGs provide an excellent tool for hospitalist physicians and APPs to deliver consistent inpatient care for common diagnoses such as bronchiolitis, asthma, and pneumonia. Increased reliance on CCGs has provided an opportunity to standardize evidence‐based practices and has allowed PNPs to expand their inpatient role at CHCO. The addition of a PNP inpatient team at CHCO also provided an effective strategy for management of seasonal fluctuations in inpatient census, particularly during the winter respiratory season.
Limitations
This is a single‐site program evaluation at a free standing children's hospital. Colorado law allows NPs to practice independently and obtain full prescriptive authority, although licensing and certification regulations for APPs vary from state to state. Our results may not be generalizable to other hospitals or to states where regulations differ. Patients admitted to the NOC sites and those assigned to the PNP team at the main campus are generally lower acuity and complexity compared to patients assigned to the resident teams at the main campus. Although we controlled for severity using the APR‐DRG severity classification, it is possible that our results were biased due to different patient profiles among the PNP and MD hospitalist teams. There were also potential limitations in the cost analysis, which included nursing in direct costs. Although nurse‐to‐patient ratios are comparable across hospitalist sites, the ratios may have varied due to fluctuations in patient census at each site. The CCG monitoring measures used in this evaluation also presented limitations. These measures were selected due to the availability of these data in the electronic medical record. Future studies may provide more clinically relevant information by including additional patient outcomes measures specifically related to inpatient medical management.
Despite the limitations in this program evaluation, we feel that these data add to the current knowledge in pediatrics by showing equipoise between these 2 groups. The PNP hospitalist role continues to evolve at CHCO, and the utility of this role must continue to be evaluated and reported.
Acknowledgements
Dashka Ranade provided Children's Hospital Colorado CCG comparison data for this program evaluation. David Bertoch provided LOS data from the Children's Hospital Association Pediatric Health Information System database.
Disclosures: Supported by NIH/NCATS Colorado CTSI grant number UL1 TR000154. The contents are the authors' sole responsibility and do not necessarily represent official NIH views.
- Education ACfGM. Common Program Requirements. Accreditation Council for Graduate Medical Education, 2011.
- , , , , , . Hospitalist services: an evolving opportunity. Nurse Pract. 2008;33(5):9–10.
- . APRN hospitalist: just a resident replacement? J Pediatr Health Care. 2004;18(4):208–210.
- , , , . Evaluation of the role of the pediatric nurse practitioner in an inpatient asthma program. J Pediatr Health Care. 2008;22(5):273–281.
- , . Acute care nurse practitioner as hospitalist: role description. AACN Adv Crit Care. 2009;20(2):133–136.
- , . Acute care nurse practitioners: creating and implementing a model of care for an inpatient general medical service. Am J Crit Care. 2002;11(5):448–458.
- , , , et al. Pediatric trauma nurse practitioners provide excellent care with superior patient satisfaction for injured children. J Pediatr Surg. 2006;41(1):277–281.
- , , , et al. Pediatric trauma nurse practitioners increase bedside nurses' satisfaction with pediatric trauma patient care. J Trauma Nurs. 2006;13(2):66–69.
- , , , et al. The effect of a multidisciplinary hospitalist/physician and advanced practice nurse collaboration on hospital costs. J Nurs Adm. 2006;36(2):79–85.
- , , , , . A closer look at all‐patient refined DRGs. J AHIMA. 2002;73(1):46–50.
- . Structure and performance of different DRG classification systems for neonatal medicine. Pediatrics. 1999;103(1 suppl E):302–318.
- Association CsH. Patient classification system, Children's Hospital Association. Available at: http://www.childrenshospitals.org/. Accessed January 4, 2014.
- . Children's Hospital Colorado bronchiolitis clinical care guideline, Bronchiolitis CCG Task Force 2011. Available at: http://www.childrenscolorado.org/conditions/lung/healthcare_professionals/clinical_care_guidelines.aspx. Accessed January 4, 2014.
- American Academy of Pediatrics Subcommittee on Diagnosis and Management of Bronchiolitis. Diagnosis and management of bronchiolitis. Pediatrics. 2006;118(4):1774–1793.
- .Children's Hospital Colorado asthma clinical care guideline, Asthma Task Force, 2011. Available at: http://www.childrenscolorado.org/conditions/lung/healthcare_professionals/clinical_care_guidelines.aspx. Accessed January 4, 2014.
- , , . Written action plans for asthma in children. Cochrane Database Syst Rev. 2006;(3):CD005306.
- , . Pediatric nurse practitioners as hospitalists. J Pediatr Health Care. 2010;24(5):347–350.
- , , . Health policy issues and applications for evidence‐based medicine and clinical practice guidelines. Health Policy. 1998;46(1):1–19.
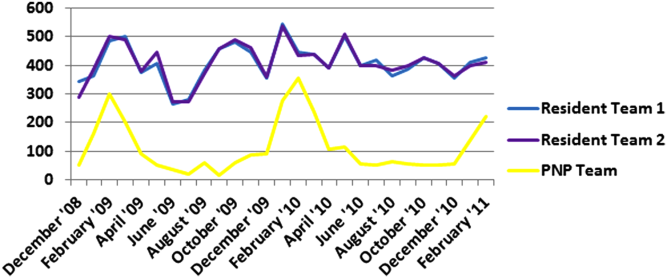
UCSF Hospitalist Mini‐College
I hear and I forget, I see and I remember, I do and I understand.
Confucius
Hospital medicine, first described in 1996,[1] is the fastest growing specialty in United States medical history, now with approximately 40,000 practitioners.[2] Although hospitalists undoubtedly learned many of their key clinical skills during residency training, there is no hospitalist‐specific residency training pathway and a limited number of largely research‐oriented fellowships.[3] Furthermore, hospitalists are often asked to care for surgical patients, those with acute neurologic disorders, and patients in intensive care units, while also contributing to quality improvement and patient safety initiatives.[4] This suggests that the vast majority of hospitalists have not had specific training in many key competencies for the field.[5]
Continuing medical education (CME) has traditionally been the mechanism to maintain, develop, or increase the knowledge, skills, and professional performance of physicians.[6] Most CME activities, including those for hospitalists, are staged as live events in hotel conference rooms or as local events in a similarly passive learning environment (eg, grand rounds and medical staff meetings). Online programs, audiotapes, and expanding electronic media provide increasing and alternate methods for hospitalists to obtain their required CME. All of these activities passively deliver content to a group of diverse and experienced learners. They fail to take advantage of adult learning principles and may have little direct impact on professional practice.[7, 8] Traditional CME is often derided as a barrier to innovative educational methods for these reasons, as adults learn best through active participation, when the information is relevant and practically applied.[9, 10]
To provide practicing hospitalists with necessary continuing education, we designed the University of California, San Francisco (UCSF) Hospitalist Mini‐College (UHMC). This 3‐day course brings adult learners to the bedside for small‐group and active learning focused on content areas relevant to today's hospitalists. We describe the development, content, outcomes, and lessons learned from UHMC's first 5 years.
METHODS
Program Development
We aimed to develop a program that focused on curricular topics that would be highly valued by practicing hospitalists delivered in an active learning small‐group environment. We first conducted an informal needs assessment of community‐based hospitalists to better understand their roles and determine their perceptions of gaps in hospitalist training compared to current requirements for practice. We then reviewed available CME events targeting hospitalists and compared these curricula to the gaps discovered from the needs assessment. We also reviewed the Society of Hospital Medicine's core competencies to further identify gaps in scope of practice.[4] Finally, we reviewed the literature to identify CME curricular innovations in the clinical setting and found no published reports.
Program Setting, Participants, and Faculty
The UHMC course was developed and offered first in 2008 as a precourse to the UCSF Management of the Hospitalized Medicine course, a traditional CME offering that occurs annually in a hotel setting.[11] The UHMC takes place on the campus of UCSF Medical Center, a 600‐bed academic medical center in San Francisco. Registered participants were required to complete limited credentialing paperwork, which allowed them to directly observe clinical care and interact with hospitalized patients. Participants were not involved in any clinical decision making for the patients they met or examined. The course was limited to a maximum of 33 participants annually to optimize active participation, small‐group bedside activities, and a personalized learning experience. UCSF faculty selected to teach in the UHMC were chosen based on exemplary clinical and teaching skills. They collaborated with course directors in the development of their session‐specific goals and curriculum.
Program Description
Figure 1 is a representative calendar view of the 3‐day UHMC course. The curricular topics were selected based on the findings from our needs assessment, our ability to deliver that curriculum using our small‐group active learning framework, and to minimize overlap with content of the larger course. Course curriculum was refined annually based on participant feedback and course director observations.
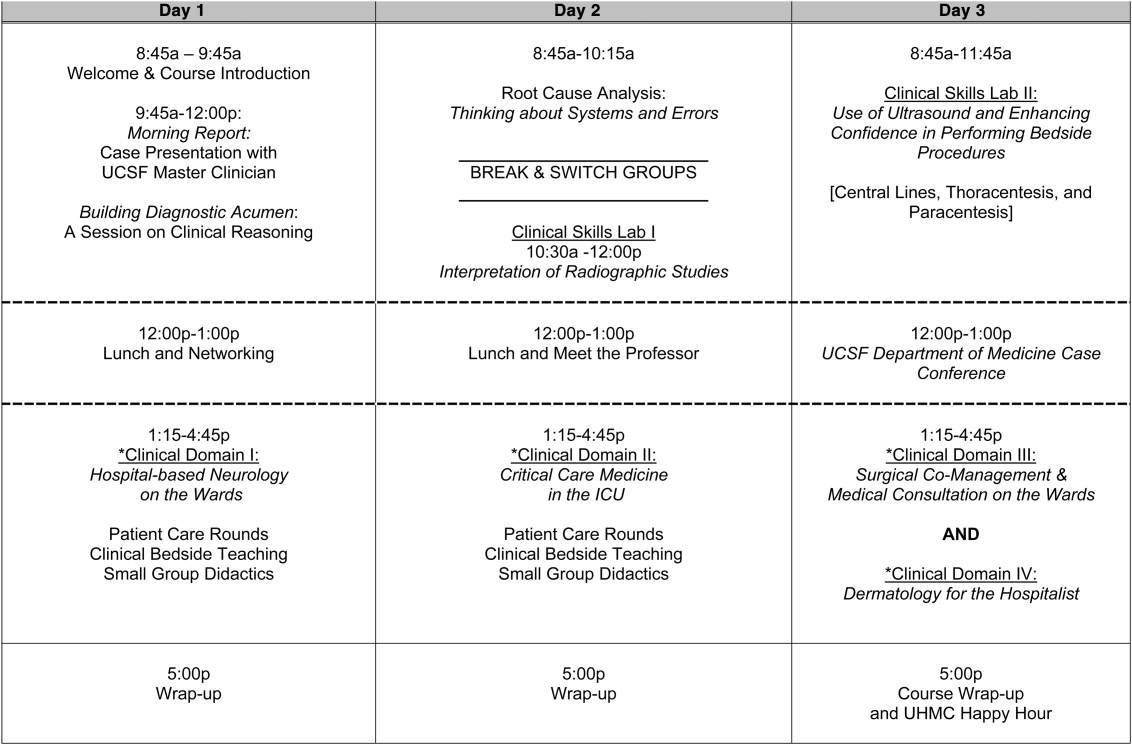
The program was built on a structure of 4 clinical domains and 2 clinical skills labs. The clinical domains included: (1) Hospital‐Based Neurology, (2) Critical Care Medicine in the Intensive Care Unit, (3) Surgical Comanagement and Medical Consultation, and (4) Hospital‐Based Dermatology. Participants were divided into 3 groups of 10 participants each and rotated through each domain in the afternoons. The clinical skills labs included: (1) Interpretation of Radiographic Studies and (2) Use of Ultrasound and Enhancing Confidence in Performing Bedside Procedures. We also developed specific sessions to teach about patient safety and to allow course attendees to participate in traditional academic learning vehicles (eg, a Morning Report and Morbidity and Mortality case conference). Below, we describe each session's format and content.
Clinical Domains
Hospital‐Based Neurology
Attendees participated in both bedside evaluation and case‐based discussions of common neurologic conditions seen in the hospital. In small groups of 5, participants were assigned patients to examine on the neurology ward. After their evaluations, they reported their findings to fellow participants and the faculty, setting the foundation for discussion of clinical management, review of neuroimaging, and exploration of current evidence to inform the patient's diagnosis and management. Participants and faculty then returned to the bedside to hone neurologic examination skills and complete the learning process. Given the unpredictability of what conditions would be represented on the ward in a given day, review of commonly seen conditions was always a focus, such as stroke, seizures, delirium, and neurologic examination pearls.
Critical Care
Attendees participated in case‐based discussions of common clinical conditions with similar review of current evidence, relevant imaging, and bedside exam pearls for the intubated patient. For this domain, attendees also participated in an advanced simulation tutorial in ventilator management, which was then applied at the bedside of intubated patients. Specific topics covered include sepsis, decompensated chronic obstructive lung disease, vasopressor selection, novel therapies in critically ill patients, and use of clinical pathways and protocols for improved quality of care.
Surgical Comanagement and Medical Consultation
Attendees participated in case‐based discussions applying current evidence to perioperative controversies and the care of the surgical patient. They also discussed the expanding role of the hospitalist in nonmedical patients.
Hospital‐Based Dermatology
Attendees participated in bedside evaluation of acute skin eruptions based on available patients admitted to the hospital. They discussed the approach to skin eruptions, key diagnoses, and when dermatologists should be consulted for their expertise. Specific topics included drug reactions, the red leg, life‐threating conditions (eg, Stevens‐Johnson syndrome), and dermatologic examination pearls. This domain was added in 2010.
Clinical Skills Labs
Radiology
In groups of 15, attendees reviewed common radiographs that hospitalists frequently order or evaluate (eg, chest x‐rays; kidney, ureter, and bladder; placement of endotracheal or feeding tube). They also reviewed the most relevant and not‐to‐miss findings on other commonly ordered studies such as abdominal or brain computerized tomography scans.
Hospital Procedures With Bedside Ultrasound
Attendees participated in a half‐day session to gain experience with the following procedures: paracentesis, lumbar puncture, thoracentesis, and central lines. They participated in an initial overview of procedural safety followed by hands‐on application sessions, in which they rotated through clinical workstations in groups of 5. At each work station, they were provided an opportunity to practice techniques, including the safe use of ultrasound on both live (standardized patients) and simulation models.
Other Sessions
Building Diagnostic Acumen and Clinical Reasoning
The opening session of the UHMC reintroduces attendees to the traditional academic morning report format, in which a case is presented and participants are asked to assess the information, develop differential diagnoses, discuss management options, and consider their own clinical reasoning skills. This provides frameworks for diagnostic reasoning, highlights common cognitive errors, and teaches attendees how to develop expertise in their own diagnostic thinking. The session also sets the stage and expectation for active learning and participation in the UHMC.
Root Cause Analysis and Systems Thinking
As the only nonclinical session in the UHMC, this session introduces participants to systems thinking and patient safety. Attendees participate in a root cause analysis role play surrounding a serious medical error and discuss the implications, their reflections, and then propose solutions through interactive table discussions. The session also emphasizes the key role hospitalists should play in improving patient safety.
Clinical Case Conference
Attendees participated in the weekly UCSF Department of Medicine Morbidity and Mortality conference. This is a traditional case conference that brings together learners, expert discussants, and an interesting or challenging case. This allows attendees to synthesize much of the course learning through active participation in the case discussion. Rather than creating a new conference for the participants, we brought the participants to the existing conference as part of their UHMC immersion experience.
Meet the Professor
Attendees participated in an informal discussion with a national leader (R.M.W.) in hospital medicine. This allowed for an interactive exchange of ideas and an understanding of the field overall.
Online Search Strategies
This interactive computer lab session allowed participants to explore the ever‐expanding number of online resources to answer clinical queries. This session was replaced in 2010 with the dermatology clinical domain based on participant feedback.
Program Evaluation
Participants completed a pre‐UHMC survey that provided demographic information and attributes about themselves, their clinical practice, and experience. Participants also completed course evaluations consistent with Accreditation Council for Continuing Medical Education standards following the program. The questions asked for each activity were rated on a 1‐to‐5 scale (1=poor, 5=excellent) and also included open‐ended questions to assess overall experiences.
RESULTS
Participant Demographics
During the first 5 years of the UHMC, 152 participants enrolled and completed the program; 91% completed the pre‐UHMC survey and 89% completed the postcourse evaluation. Table 1 describes the self‐reported participant demographics, including years in practice, number of hospitalist jobs, overall job satisfaction, and time spent doing clinical work. Overall, 68% of all participants had been self‐described hospitalists for <4 years, with 62% holding only 1 hospitalist job during that time; 77% reported being pretty or very satisfied with their jobs, and 72% reported clinical care as the attribute they love most in their job. Table 2 highlights the type of work attendees participate in within their clinical practice. More than half manage patients with neurologic disorders and care for critically ill patients, whereas virtually all perform preoperative medical evaluations and medical consultation
| Question | Response Options | 2008 (n=4) | 2009 (n=26) | 2010 (n=29) | 2011 (n=31) | 2012 (n=28) | Average (n=138) |
|---|---|---|---|---|---|---|---|
| |||||||
| How long have you been a hospitalist? | <2 years | 52% | 35% | 37% | 30% | 25% | 36% |
| 24 years | 26% | 39% | 30% | 30% | 38% | 32% | |
| 510 years | 11% | 17% | 15% | 26% | 29% | 20% | |
| >10 years | 11% | 9% | 18% | 14% | 8% | 12% | |
| How many hospitalist jobs have you had? | 1 | 63% | 61% | 62% | 62% | 58% | 62% |
| 2 to 3 | 37% | 35% | 23% | 35% | 29% | 32% | |
| >3 | 0% | 4% | 15% | 1% | 13% | 5% | |
| How satisfied are you with your current position? | Not satisfied | 1% | 4% | 4% | 4% | 0% | 4% |
| Somewhat satisfied | 11% | 13% | 39% | 17% | 17% | 19% | |
| Pretty satisfied | 59% | 52% | 35% | 57% | 38% | 48% | |
| Very satisfied | 26% | 30% | 23% | 22% | 46% | 29% | |
| What do you love most about your job? | Clinical care | 85% | 61% | 65% | 84% | 67% | 72% |
| Teaching | 1% | 17% | 12% | 1% | 4% | 7% | |
| QI or safety work | 0% | 4% | 0% | 1% | 8% | 3% | |
| Other (not specified) | 14% | 18% | 23% | 14% | 21% | 18% | |
| What percent of your time is spent doing clinical care? | 100% | 39% | 36% | 52% | 46% | 58% | 46% |
| 75%100% | 58% | 50% | 37% | 42% | 33% | 44% | |
| 5075% | 0% | 9% | 11% | 12% | 4% | 7% | |
| 25%50% | 4% | 5% | 0% | 0% | 5% | 3% | |
| <25% | 0% | 0% | 0% | 0% | 0% | 0% | |
| Question | Response Options | 2008 (n=24) | 2009 (n=26) | 2010 (n=29) | 2011 (n=31) | 2012 (n=28) | Average(n=138) |
|---|---|---|---|---|---|---|---|
| |||||||
| Do you primarily manage patients with neurologic disorders in your hospital? | Yes | 62% | 50% | 62% | 62% | 63% | 60% |
| Do you primarily manage critically ill ICU patients in your hospital? | Yes and without an intensivist | 19% | 23% | 19% | 27% | 21% | 22% |
| Yes but with an intensivist | 54% | 50% | 44% | 42% | 67% | 51% | |
| No | 27% | 27% | 37% | 31% | 13% | 27% | |
| Do you perform preoperative medical evaluations and medical consultation? | Yes | 96% | 91% | 96% | 96% | 92% | 94% |
| Which of the following describes your role in the care of surgical patients? | Traditional medical consultant | 33% | 28% | 28% | 30% | 24% | 29% |
| Comanagement (shared responsibility with surgeon) | 33% | 34% | 42% | 39% | 35% | 37% | |
| Attending of record with surgeon acting as consultant | 26% | 24% | 26% | 30% | 35% | 28% | |
| Do you have bedside ultrasound available in your daily practice? | Yes | 38% | 32% | 52% | 34% | 38% | 39% |
Participant Experience
Overall, participants rated the quality of the UHMC course highly (4.65; 15 scale). The neurology clinical domain (4.83) and clinical reasoning session (4.72) were the highest‐rated sessions. Compared to all UCSF CME course offerings between January 2010 and September 2012, the UHMC rated higher than the cumulative overall rating from those 227 courses (4.65 vs 4.44). For UCSF CME courses offered in 2011 and 2012, 78% of participants (n=11,447) reported a high or definite likelihood to change practice. For UHMC participants during the same time period (n=57), 98% reported a similar likelihood to change practice. Table 3 provides selected participant comments from their postcourse evaluations.
|
| Great pearls, broad ranging discussion of many controversial and common topics, and I loved the teaching format. |
| I thought the conception of the teaching model was really effectivehands‐on exams in small groups, each demonstrating a different part of the neurologic exam, followed by presentation and discussion, and ending in bedside rounds with the teaching faculty. |
| Excellent review of key topicswide variety of useful and practical points. Very high application value. |
| Great course. I'd take it again and again. It was a superb opportunity to review technique, equipment, and clinical decision making. |
| Overall outstanding course! Very informative and fun. Format was great. |
| Forward and clinically relevant. Like the bedside teaching and how they did it.The small size of the course and the close attention paid by the faculty teaching the course combined with the opportunity to see and examine patients in the hospital was outstanding. |
DISCUSSION
We developed an innovative CME program that brought participants to an academic health center for a participatory, hands‐on, and small‐group experience. They learned about topics relevant to today's hospitalists, rated the experience very highly, and reported a nearly unanimous likelihood to change their practice. Reflecting on our program's first 5 years, there were several lessons learned that may guide others committed to providing a similar CME experience.
First, hospital medicine is a dynamic field. Conducting a needs assessment to match clinical topics to what attendees required in their own practice was critical. Iterative changes from year to year reflected formal participant feedback as well as informal conversations with the teaching faculty. For instance, attendees were not only interested in the clinical topics but often wanted to see examples of clinical pathways, order sets, and other systems in place to improve care for patients with common conditions. Our participant presurvey also helped identify and reinforce the curricular topics that teaching faculty focused on each year. Being responsive to the changing needs of hospitalists and the environment is a crucial part of providing a relevant CME experience.
We also used an innovative approach to teaching, founded in adult and effective CME learning principles. CME activities are geared toward adult physicians, and studies of their effectiveness recommend that sessions should be interactive and utilize multiple modalities of learning.[12] When attendees actively participate and are provided an opportunity to practice skills, it may have a positive effect on patient outcomes.[13] All UHMC faculty were required to couple presentations of the latest evidence for clinical topics with small‐group and hands‐on learning modalities. This also required that we utilize a teaching faculty known for both their clinical expertise and teaching recognition. Together, the learning modalities and the teaching faculty likely accounted for the highly rated course experience and likelihood to change practice.
Finally, our course brought participants to an academic medical center and into the mix of clinical care as opposed to the more traditional hotel venue. This was necessary to deliver the curriculum as described, but also had the unexpected benefit of energizing the participants. Many had not been in a teaching setting since their residency training, and bringing them back into this milieu motivated them to learn and share their inspiration. As there are no published studies of CME experiences in the clinical environment, this observation is noteworthy and deserves to be explored and evaluated further.
What are the limitations of our approach to bringing CME to the bedside? First, the economics of an intensive 3‐day course with a maximum of 33 attendees are far different than those of a large hotel‐based offering. There are no exhibitors or outside contributions. The cost of the course to participants is $2500 (discounted if attending the larger course as well), which is 2 to 3 times higher than most traditional CME courses of the same length. Although the cost is high, the course has sold out each year with a waiting list. Part of the cost is also faculty time. The time, preparation, and need to teach on the fly to meet the differing participant educational needs is fundamentally different than delivering a single lecture in a hotel conference room. Not surprisingly, our faculty enjoy this teaching opportunity and find it equally unique and valuable; no faculty have dropped out of teaching the course, and many describe it as 1 of the teaching highlights of the year. Scalability of the UHMC is challenging for these reasons, but our model could be replicated in other teaching institutions, even as a local offering for their own providers.
In summary, we developed a hospital‐based, highly interactive, small‐group CME course that emphasizes case‐based teaching. The course has sold out each year, and evaluations suggest that it is highly valued and is meeting curricular goals better than more traditional CME courses. We hope our course description and success may motivate others to consider moving beyond the traditional CME for hospitalists and explore further innovations. With the field growing and changing at a rapid pace, innovative CME experiences will be necessary to assure that hospitalists continue to provide exemplary and safe care to their patients.
Acknowledgements
The authors thank Kapo Tam for her program management of the UHMC, and Katherine Li and Zachary Martin for their invaluable administrative support and coordination. The authors are also indebted to faculty colleagues for their time and roles in teaching within the program. They include Gupreet Dhaliwal, Andy Josephson, Vanja Douglas, Michelle Milic, Brian Daniels, Quinny Cheng, Lindy Fox, Diane Sliwka, Ralph Wang, and Thomas Urbania.
Disclosure: Nothing to report.
- , . The emerging role of “hospitalists” in the American health care system. N Engl J Med. 1996;337(7):514–517.
- Society of Hospital Medicine. Available at: http://www.hospitalmedicine.org/Content/NavigationMenu/Membership2/HospitalFocusedPractice/Hospital_Focused_Pra.htm. Accessed October 1, 2013.
- , , , . Hospital medicine fellowships: works in progress. Am J Med. 2006;119(1):72.e1–e7.
- Society of Hospital Medicine. Core competencies in hospital medicine. Available at: http://www.hospitalmedicine.org/Content/NavigationMenu/Education/CoreCurriculum/Core_Competencies.htm. Accessed October 1, 2013.
- , . The expanding role of hospitalists in the United States. Swiss Med Wkly. 2006;136(37‐38);591–596.
- Accreditation Council for Continuing Medical Education. CME content: definition and examples Available at: http://www.accme.org/requirements/accreditation‐requirements‐cme‐providers/policies‐and‐definitions/cme‐content‐definition‐and‐examples. Accessed October 1, 2013.
- , , , . Changing physician performance. A systematic review of the effect of continuing medical education strategies. JAMA. 1995;274(9):700–705.
- , . Continuing medical education and the physician as a learner: guide to the evidence. JAMA. 2002;288(9):1057–1060.
- , , , , . Barriers to innovation in continuing medical eduation. J Contin Educ Health Prof. 2008;28(3):148–156.
- . Adult learning theory for the 21st century. In: Merriam S. Thrid Update on Adult Learning Theory: New Directions for Adult and Continuing Education. San Francisco, CA: Jossey‐Bass; 2008:93–98.
- .UCSF management of the hospitalized patient CME course. Available at: http://www.ucsfcme.com/2014/MDM14P01/info.html. Accessed October 1, 2013.
- Continuing medical education effect on practice performance: effectiveness of continuing medical education: American College or Chest Physicians evidence‐based educational guidelines. Chest. 2009;135(3 suppl);42S–48S.
- Continuing medical education effect on clinical outcomes: effectiveness of continuing medical education: American College or Chest Physicians evidence‐based educational guidelines. Chest. 2009;135(3 suppl);49S–55S.
I hear and I forget, I see and I remember, I do and I understand.
Confucius
Hospital medicine, first described in 1996,[1] is the fastest growing specialty in United States medical history, now with approximately 40,000 practitioners.[2] Although hospitalists undoubtedly learned many of their key clinical skills during residency training, there is no hospitalist‐specific residency training pathway and a limited number of largely research‐oriented fellowships.[3] Furthermore, hospitalists are often asked to care for surgical patients, those with acute neurologic disorders, and patients in intensive care units, while also contributing to quality improvement and patient safety initiatives.[4] This suggests that the vast majority of hospitalists have not had specific training in many key competencies for the field.[5]
Continuing medical education (CME) has traditionally been the mechanism to maintain, develop, or increase the knowledge, skills, and professional performance of physicians.[6] Most CME activities, including those for hospitalists, are staged as live events in hotel conference rooms or as local events in a similarly passive learning environment (eg, grand rounds and medical staff meetings). Online programs, audiotapes, and expanding electronic media provide increasing and alternate methods for hospitalists to obtain their required CME. All of these activities passively deliver content to a group of diverse and experienced learners. They fail to take advantage of adult learning principles and may have little direct impact on professional practice.[7, 8] Traditional CME is often derided as a barrier to innovative educational methods for these reasons, as adults learn best through active participation, when the information is relevant and practically applied.[9, 10]
To provide practicing hospitalists with necessary continuing education, we designed the University of California, San Francisco (UCSF) Hospitalist Mini‐College (UHMC). This 3‐day course brings adult learners to the bedside for small‐group and active learning focused on content areas relevant to today's hospitalists. We describe the development, content, outcomes, and lessons learned from UHMC's first 5 years.
METHODS
Program Development
We aimed to develop a program that focused on curricular topics that would be highly valued by practicing hospitalists delivered in an active learning small‐group environment. We first conducted an informal needs assessment of community‐based hospitalists to better understand their roles and determine their perceptions of gaps in hospitalist training compared to current requirements for practice. We then reviewed available CME events targeting hospitalists and compared these curricula to the gaps discovered from the needs assessment. We also reviewed the Society of Hospital Medicine's core competencies to further identify gaps in scope of practice.[4] Finally, we reviewed the literature to identify CME curricular innovations in the clinical setting and found no published reports.
Program Setting, Participants, and Faculty
The UHMC course was developed and offered first in 2008 as a precourse to the UCSF Management of the Hospitalized Medicine course, a traditional CME offering that occurs annually in a hotel setting.[11] The UHMC takes place on the campus of UCSF Medical Center, a 600‐bed academic medical center in San Francisco. Registered participants were required to complete limited credentialing paperwork, which allowed them to directly observe clinical care and interact with hospitalized patients. Participants were not involved in any clinical decision making for the patients they met or examined. The course was limited to a maximum of 33 participants annually to optimize active participation, small‐group bedside activities, and a personalized learning experience. UCSF faculty selected to teach in the UHMC were chosen based on exemplary clinical and teaching skills. They collaborated with course directors in the development of their session‐specific goals and curriculum.
Program Description
Figure 1 is a representative calendar view of the 3‐day UHMC course. The curricular topics were selected based on the findings from our needs assessment, our ability to deliver that curriculum using our small‐group active learning framework, and to minimize overlap with content of the larger course. Course curriculum was refined annually based on participant feedback and course director observations.
The program was built on a structure of 4 clinical domains and 2 clinical skills labs. The clinical domains included: (1) Hospital‐Based Neurology, (2) Critical Care Medicine in the Intensive Care Unit, (3) Surgical Comanagement and Medical Consultation, and (4) Hospital‐Based Dermatology. Participants were divided into 3 groups of 10 participants each and rotated through each domain in the afternoons. The clinical skills labs included: (1) Interpretation of Radiographic Studies and (2) Use of Ultrasound and Enhancing Confidence in Performing Bedside Procedures. We also developed specific sessions to teach about patient safety and to allow course attendees to participate in traditional academic learning vehicles (eg, a Morning Report and Morbidity and Mortality case conference). Below, we describe each session's format and content.
Clinical Domains
Hospital‐Based Neurology
Attendees participated in both bedside evaluation and case‐based discussions of common neurologic conditions seen in the hospital. In small groups of 5, participants were assigned patients to examine on the neurology ward. After their evaluations, they reported their findings to fellow participants and the faculty, setting the foundation for discussion of clinical management, review of neuroimaging, and exploration of current evidence to inform the patient's diagnosis and management. Participants and faculty then returned to the bedside to hone neurologic examination skills and complete the learning process. Given the unpredictability of what conditions would be represented on the ward in a given day, review of commonly seen conditions was always a focus, such as stroke, seizures, delirium, and neurologic examination pearls.
Critical Care
Attendees participated in case‐based discussions of common clinical conditions with similar review of current evidence, relevant imaging, and bedside exam pearls for the intubated patient. For this domain, attendees also participated in an advanced simulation tutorial in ventilator management, which was then applied at the bedside of intubated patients. Specific topics covered include sepsis, decompensated chronic obstructive lung disease, vasopressor selection, novel therapies in critically ill patients, and use of clinical pathways and protocols for improved quality of care.
Surgical Comanagement and Medical Consultation
Attendees participated in case‐based discussions applying current evidence to perioperative controversies and the care of the surgical patient. They also discussed the expanding role of the hospitalist in nonmedical patients.
Hospital‐Based Dermatology
Attendees participated in bedside evaluation of acute skin eruptions based on available patients admitted to the hospital. They discussed the approach to skin eruptions, key diagnoses, and when dermatologists should be consulted for their expertise. Specific topics included drug reactions, the red leg, life‐threating conditions (eg, Stevens‐Johnson syndrome), and dermatologic examination pearls. This domain was added in 2010.
Clinical Skills Labs
Radiology
In groups of 15, attendees reviewed common radiographs that hospitalists frequently order or evaluate (eg, chest x‐rays; kidney, ureter, and bladder; placement of endotracheal or feeding tube). They also reviewed the most relevant and not‐to‐miss findings on other commonly ordered studies such as abdominal or brain computerized tomography scans.
Hospital Procedures With Bedside Ultrasound
Attendees participated in a half‐day session to gain experience with the following procedures: paracentesis, lumbar puncture, thoracentesis, and central lines. They participated in an initial overview of procedural safety followed by hands‐on application sessions, in which they rotated through clinical workstations in groups of 5. At each work station, they were provided an opportunity to practice techniques, including the safe use of ultrasound on both live (standardized patients) and simulation models.
Other Sessions
Building Diagnostic Acumen and Clinical Reasoning
The opening session of the UHMC reintroduces attendees to the traditional academic morning report format, in which a case is presented and participants are asked to assess the information, develop differential diagnoses, discuss management options, and consider their own clinical reasoning skills. This provides frameworks for diagnostic reasoning, highlights common cognitive errors, and teaches attendees how to develop expertise in their own diagnostic thinking. The session also sets the stage and expectation for active learning and participation in the UHMC.
Root Cause Analysis and Systems Thinking
As the only nonclinical session in the UHMC, this session introduces participants to systems thinking and patient safety. Attendees participate in a root cause analysis role play surrounding a serious medical error and discuss the implications, their reflections, and then propose solutions through interactive table discussions. The session also emphasizes the key role hospitalists should play in improving patient safety.
Clinical Case Conference
Attendees participated in the weekly UCSF Department of Medicine Morbidity and Mortality conference. This is a traditional case conference that brings together learners, expert discussants, and an interesting or challenging case. This allows attendees to synthesize much of the course learning through active participation in the case discussion. Rather than creating a new conference for the participants, we brought the participants to the existing conference as part of their UHMC immersion experience.
Meet the Professor
Attendees participated in an informal discussion with a national leader (R.M.W.) in hospital medicine. This allowed for an interactive exchange of ideas and an understanding of the field overall.
Online Search Strategies
This interactive computer lab session allowed participants to explore the ever‐expanding number of online resources to answer clinical queries. This session was replaced in 2010 with the dermatology clinical domain based on participant feedback.
Program Evaluation
Participants completed a pre‐UHMC survey that provided demographic information and attributes about themselves, their clinical practice, and experience. Participants also completed course evaluations consistent with Accreditation Council for Continuing Medical Education standards following the program. The questions asked for each activity were rated on a 1‐to‐5 scale (1=poor, 5=excellent) and also included open‐ended questions to assess overall experiences.
RESULTS
Participant Demographics
During the first 5 years of the UHMC, 152 participants enrolled and completed the program; 91% completed the pre‐UHMC survey and 89% completed the postcourse evaluation. Table 1 describes the self‐reported participant demographics, including years in practice, number of hospitalist jobs, overall job satisfaction, and time spent doing clinical work. Overall, 68% of all participants had been self‐described hospitalists for <4 years, with 62% holding only 1 hospitalist job during that time; 77% reported being pretty or very satisfied with their jobs, and 72% reported clinical care as the attribute they love most in their job. Table 2 highlights the type of work attendees participate in within their clinical practice. More than half manage patients with neurologic disorders and care for critically ill patients, whereas virtually all perform preoperative medical evaluations and medical consultation
| Question | Response Options | 2008 (n=4) | 2009 (n=26) | 2010 (n=29) | 2011 (n=31) | 2012 (n=28) | Average (n=138) |
|---|---|---|---|---|---|---|---|
| |||||||
| How long have you been a hospitalist? | <2 years | 52% | 35% | 37% | 30% | 25% | 36% |
| 24 years | 26% | 39% | 30% | 30% | 38% | 32% | |
| 510 years | 11% | 17% | 15% | 26% | 29% | 20% | |
| >10 years | 11% | 9% | 18% | 14% | 8% | 12% | |
| How many hospitalist jobs have you had? | 1 | 63% | 61% | 62% | 62% | 58% | 62% |
| 2 to 3 | 37% | 35% | 23% | 35% | 29% | 32% | |
| >3 | 0% | 4% | 15% | 1% | 13% | 5% | |
| How satisfied are you with your current position? | Not satisfied | 1% | 4% | 4% | 4% | 0% | 4% |
| Somewhat satisfied | 11% | 13% | 39% | 17% | 17% | 19% | |
| Pretty satisfied | 59% | 52% | 35% | 57% | 38% | 48% | |
| Very satisfied | 26% | 30% | 23% | 22% | 46% | 29% | |
| What do you love most about your job? | Clinical care | 85% | 61% | 65% | 84% | 67% | 72% |
| Teaching | 1% | 17% | 12% | 1% | 4% | 7% | |
| QI or safety work | 0% | 4% | 0% | 1% | 8% | 3% | |
| Other (not specified) | 14% | 18% | 23% | 14% | 21% | 18% | |
| What percent of your time is spent doing clinical care? | 100% | 39% | 36% | 52% | 46% | 58% | 46% |
| 75%100% | 58% | 50% | 37% | 42% | 33% | 44% | |
| 5075% | 0% | 9% | 11% | 12% | 4% | 7% | |
| 25%50% | 4% | 5% | 0% | 0% | 5% | 3% | |
| <25% | 0% | 0% | 0% | 0% | 0% | 0% | |
| Question | Response Options | 2008 (n=24) | 2009 (n=26) | 2010 (n=29) | 2011 (n=31) | 2012 (n=28) | Average(n=138) |
|---|---|---|---|---|---|---|---|
| |||||||
| Do you primarily manage patients with neurologic disorders in your hospital? | Yes | 62% | 50% | 62% | 62% | 63% | 60% |
| Do you primarily manage critically ill ICU patients in your hospital? | Yes and without an intensivist | 19% | 23% | 19% | 27% | 21% | 22% |
| Yes but with an intensivist | 54% | 50% | 44% | 42% | 67% | 51% | |
| No | 27% | 27% | 37% | 31% | 13% | 27% | |
| Do you perform preoperative medical evaluations and medical consultation? | Yes | 96% | 91% | 96% | 96% | 92% | 94% |
| Which of the following describes your role in the care of surgical patients? | Traditional medical consultant | 33% | 28% | 28% | 30% | 24% | 29% |
| Comanagement (shared responsibility with surgeon) | 33% | 34% | 42% | 39% | 35% | 37% | |
| Attending of record with surgeon acting as consultant | 26% | 24% | 26% | 30% | 35% | 28% | |
| Do you have bedside ultrasound available in your daily practice? | Yes | 38% | 32% | 52% | 34% | 38% | 39% |
Participant Experience
Overall, participants rated the quality of the UHMC course highly (4.65; 15 scale). The neurology clinical domain (4.83) and clinical reasoning session (4.72) were the highest‐rated sessions. Compared to all UCSF CME course offerings between January 2010 and September 2012, the UHMC rated higher than the cumulative overall rating from those 227 courses (4.65 vs 4.44). For UCSF CME courses offered in 2011 and 2012, 78% of participants (n=11,447) reported a high or definite likelihood to change practice. For UHMC participants during the same time period (n=57), 98% reported a similar likelihood to change practice. Table 3 provides selected participant comments from their postcourse evaluations.
|
| Great pearls, broad ranging discussion of many controversial and common topics, and I loved the teaching format. |
| I thought the conception of the teaching model was really effectivehands‐on exams in small groups, each demonstrating a different part of the neurologic exam, followed by presentation and discussion, and ending in bedside rounds with the teaching faculty. |
| Excellent review of key topicswide variety of useful and practical points. Very high application value. |
| Great course. I'd take it again and again. It was a superb opportunity to review technique, equipment, and clinical decision making. |
| Overall outstanding course! Very informative and fun. Format was great. |
| Forward and clinically relevant. Like the bedside teaching and how they did it.The small size of the course and the close attention paid by the faculty teaching the course combined with the opportunity to see and examine patients in the hospital was outstanding. |
DISCUSSION
We developed an innovative CME program that brought participants to an academic health center for a participatory, hands‐on, and small‐group experience. They learned about topics relevant to today's hospitalists, rated the experience very highly, and reported a nearly unanimous likelihood to change their practice. Reflecting on our program's first 5 years, there were several lessons learned that may guide others committed to providing a similar CME experience.
First, hospital medicine is a dynamic field. Conducting a needs assessment to match clinical topics to what attendees required in their own practice was critical. Iterative changes from year to year reflected formal participant feedback as well as informal conversations with the teaching faculty. For instance, attendees were not only interested in the clinical topics but often wanted to see examples of clinical pathways, order sets, and other systems in place to improve care for patients with common conditions. Our participant presurvey also helped identify and reinforce the curricular topics that teaching faculty focused on each year. Being responsive to the changing needs of hospitalists and the environment is a crucial part of providing a relevant CME experience.
We also used an innovative approach to teaching, founded in adult and effective CME learning principles. CME activities are geared toward adult physicians, and studies of their effectiveness recommend that sessions should be interactive and utilize multiple modalities of learning.[12] When attendees actively participate and are provided an opportunity to practice skills, it may have a positive effect on patient outcomes.[13] All UHMC faculty were required to couple presentations of the latest evidence for clinical topics with small‐group and hands‐on learning modalities. This also required that we utilize a teaching faculty known for both their clinical expertise and teaching recognition. Together, the learning modalities and the teaching faculty likely accounted for the highly rated course experience and likelihood to change practice.
Finally, our course brought participants to an academic medical center and into the mix of clinical care as opposed to the more traditional hotel venue. This was necessary to deliver the curriculum as described, but also had the unexpected benefit of energizing the participants. Many had not been in a teaching setting since their residency training, and bringing them back into this milieu motivated them to learn and share their inspiration. As there are no published studies of CME experiences in the clinical environment, this observation is noteworthy and deserves to be explored and evaluated further.
What are the limitations of our approach to bringing CME to the bedside? First, the economics of an intensive 3‐day course with a maximum of 33 attendees are far different than those of a large hotel‐based offering. There are no exhibitors or outside contributions. The cost of the course to participants is $2500 (discounted if attending the larger course as well), which is 2 to 3 times higher than most traditional CME courses of the same length. Although the cost is high, the course has sold out each year with a waiting list. Part of the cost is also faculty time. The time, preparation, and need to teach on the fly to meet the differing participant educational needs is fundamentally different than delivering a single lecture in a hotel conference room. Not surprisingly, our faculty enjoy this teaching opportunity and find it equally unique and valuable; no faculty have dropped out of teaching the course, and many describe it as 1 of the teaching highlights of the year. Scalability of the UHMC is challenging for these reasons, but our model could be replicated in other teaching institutions, even as a local offering for their own providers.
In summary, we developed a hospital‐based, highly interactive, small‐group CME course that emphasizes case‐based teaching. The course has sold out each year, and evaluations suggest that it is highly valued and is meeting curricular goals better than more traditional CME courses. We hope our course description and success may motivate others to consider moving beyond the traditional CME for hospitalists and explore further innovations. With the field growing and changing at a rapid pace, innovative CME experiences will be necessary to assure that hospitalists continue to provide exemplary and safe care to their patients.
Acknowledgements
The authors thank Kapo Tam for her program management of the UHMC, and Katherine Li and Zachary Martin for their invaluable administrative support and coordination. The authors are also indebted to faculty colleagues for their time and roles in teaching within the program. They include Gupreet Dhaliwal, Andy Josephson, Vanja Douglas, Michelle Milic, Brian Daniels, Quinny Cheng, Lindy Fox, Diane Sliwka, Ralph Wang, and Thomas Urbania.
Disclosure: Nothing to report.
- , . The emerging role of “hospitalists” in the American health care system. N Engl J Med. 1996;337(7):514–517.
- Society of Hospital Medicine. Available at: http://www.hospitalmedicine.org/Content/NavigationMenu/Membership2/HospitalFocusedPractice/Hospital_Focused_Pra.htm. Accessed October 1, 2013.
- , , , . Hospital medicine fellowships: works in progress. Am J Med. 2006;119(1):72.e1–e7.
- Society of Hospital Medicine. Core competencies in hospital medicine. Available at: http://www.hospitalmedicine.org/Content/NavigationMenu/Education/CoreCurriculum/Core_Competencies.htm. Accessed October 1, 2013.
- , . The expanding role of hospitalists in the United States. Swiss Med Wkly. 2006;136(37‐38);591–596.
- Accreditation Council for Continuing Medical Education. CME content: definition and examples Available at: http://www.accme.org/requirements/accreditation‐requirements‐cme‐providers/policies‐and‐definitions/cme‐content‐definition‐and‐examples. Accessed October 1, 2013.
- , , , . Changing physician performance. A systematic review of the effect of continuing medical education strategies. JAMA. 1995;274(9):700–705.
- , . Continuing medical education and the physician as a learner: guide to the evidence. JAMA. 2002;288(9):1057–1060.
- , , , , . Barriers to innovation in continuing medical eduation. J Contin Educ Health Prof. 2008;28(3):148–156.
- . Adult learning theory for the 21st century. In: Merriam S. Thrid Update on Adult Learning Theory: New Directions for Adult and Continuing Education. San Francisco, CA: Jossey‐Bass; 2008:93–98.
- .UCSF management of the hospitalized patient CME course. Available at: http://www.ucsfcme.com/2014/MDM14P01/info.html. Accessed October 1, 2013.
- Continuing medical education effect on practice performance: effectiveness of continuing medical education: American College or Chest Physicians evidence‐based educational guidelines. Chest. 2009;135(3 suppl);42S–48S.
- Continuing medical education effect on clinical outcomes: effectiveness of continuing medical education: American College or Chest Physicians evidence‐based educational guidelines. Chest. 2009;135(3 suppl);49S–55S.
